UNITED STATES
SECURITIES AND EXCHANGE COMMISSION
Washington, D.C. 20549
FORM N-CSR
CERTIFIED SHAREHOLDER REPORT OF
REGISTERED MANAGEMENT INVESTMENT COMPANIES
Investment Company Act file number 811-3327
MFS SERIES TRUST XIII
(Exact name of registrant as specified in charter)
500 Boylston Street, Boston, Massachusetts 02116
(Address of principal executive offices) (Zip code)
Susan S. Newton
Massachusetts Financial Services Company
500 Boylston Street
Boston, Massachusetts 02116
(Name and address of agents for service)
Registrant’s telephone number, including area code: (617) 954-5000
Date of fiscal year end: February 28
Date of reporting period: February 28, 2009
| ITEM 1. | REPORTS TO STOCKHOLDERS. |

MFS® Diversified Income Fund
SIPC Contact Information:
You may obtain information about the Securities Investor Protection Corporation (“SIPC”), including the SIPC Brochure, by contacting SIPC either by telephone (202-371-8300) or by accessing SIPC’s website address (www.sipc.org).
The report is prepared for the general information of shareholders. It is authorized for distribution to prospective investors only when preceded or accompanied by a current prospectus.
NOT FDIC INSURED Ÿ MAY LOSE VALUE Ÿ
NO BANK GUARANTEE
2/28/09
DIF-ANN

LETTER FROM THE CEO
Dear Shareholders:
The market downturns and economic setbacks of late probably rank among the worst financial declines most of us have experienced. Inevitably, people may be questioning their commitment to investing. Still, it is important to remember that downturns are an inescapable part of the business cycle. Such troughs have been seen before, and if we can use history as a guide, market recoveries typically have followed.
Recent events have clearly shown us the value of certain types of investments. In this environment, two of the hallmarks of mutual funds — transparency and liquidity — have become critically important. Unlike some other types of investments, the operations of mutual funds are relatively transparent to their shareholders. With their daily redemption feature, mutual funds also generally provide easy, convenient access to one’s money. Through these recent market upheavals, this level of liquidity enhanced the ability of mutual fund investors to respond and modify their investments as they and their advisors saw fit — a flexibility that those in less liquid investments simply did not have at their disposal.
At MFS® we take particular pride in how well mutual funds can serve investors because we invented the mutual fund in the United States. Established in 1924, Massachusetts Investors Trust was the nation’s first fund. Recent market events only reinforce what we have learned through 85 years — that mutual funds provide unique features that are important to investors in any type of market climate.
Respectfully,

Robert J. Manning
Chief Executive Officer and Chief Investment Officer
MFS Investment Management®
April 15, 2009
The opinions expressed in this letter are subject to change, may not be relied upon for investment advice, and no forecasts can be guaranteed.
Before investing, consider the fund’s investment objectives, risks, charges, and expenses. For a prospectus containing this and other information, contact your investment professional or view online. Read it carefully.
MFS Fund Distributors, Inc., 500 Boylston Street, Boston, MA 02116
1
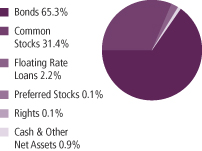
PORTFOLIO COMPOSITION
Portfolio structure (i)
| | |
| Top ten holdings | | |
| Fannie Mae, 5.5%, 30 Years | | 3.2% |
| Fannie Mae, 6.0%, 30 Years | | 1.8% |
| Exxon Mobil Corp. | | 1.7% |
| Freddie Mac, 5.5%, 30 Years | | 1.3% |
| U.S. Treasury Bonds, 3.125%, 2013 | | 1.0% |
| Financing Corp., 9.40%, 2018 | | 1.0% |
| Chevron Corp. | | 0.9% |
| Republic of Uruguay, 8.00%, 2022 | | 0.9% |
| HCA, Inc., 9.25%, 2016 | | 0.9% |
| Ginnie Mae, 5.5%, 30 Years | | 0.9% |
| | |
| Credit quality of bonds (r) | | |
| AAA | | 33.6% |
| AA | | 0.7% |
| A | | 2.9% |
| BBB | | 6.6% |
| BB | | 20.8% |
| B | | 26.7% |
| CCC | | 7.1% |
| CC | | 0.1% |
| C | | 0.1% |
| D | | 0.3% |
| Not Rated | | 1.1% |
| |
| Portfolio facts | | |
| Average Duration (d)(i) | | 4.0 |
| Average Life (i)(m) | | 6.7 yrs. |
| Average Maturity (i)(m) | | 12.8 yrs. |
| Average Credit Quality of Rated Securities (long-term) (a) | | BBB |
| Average Credit Quality of Rated Securities (short-term) (a) | | A-1 |
| (a) | The average credit quality of rated securities is based upon a market weighted average of portfolio holdings that are rated by public rating agencies. |
| (d) | Duration is a measure of how much a bond’s price is likely to fluctuate with general changes in interest rates, e.g., if rates rise 1.00%, a bond with a 5-year duration is likely to lose about 5.00% of its value. |
| (i) | For purposes of this presentation, the bond component includes accrued interest amounts and may be positively or negatively impacted by the equivalent exposure from any derivative holdings, if applicable. |
| (m) | The average maturity shown is calculated using the final stated maturity on the portfolio’s holdings without taking into account any holdings which have been pre-refunded or pre-paid to an earlier date or which have a mandatory put date prior to the stated maturity. The average life shown takes into account these earlier dates. |
| (r) | Each security is assigned a rating from Moody’s Investors Service. If not rated by Moody’s, the rating will be that assigned by Standard & Poor’s. Likewise, if not assigned a rating by Standard & Poor’s, it will be based on the rating assigned by Fitch, Inc. For those portfolios that hold a security which is not rated by any of the three agencies, the security is considered Not Rated. Holdings in U.S. Treasuries and government agency mortgage-backed securities, if any, are included in the “AAA”-rating category. Percentages are based on the total market value of investments as of 2/28/09. |
Percentages are based on net assets as of 2/28/09, unless otherwise noted.
The portfolio is actively managed and current holdings may be different.
2
MANAGEMENT REVIEW
Summary of Results
The MFS Diversified Income Fund includes investments in high yield corporate bonds, U.S. government securities, emerging markets debt, real estate investment trusts (REITs), and domestic equity securities.
For the twelve months ended February 28, 2009, Class A shares of the MFS Diversified Income Fund provided a total return of
–27.43%, at net asset value. This compares with a return of 2.06% for the fund’s benchmark, the Barclays Capital U.S. Aggregate Bond Index.
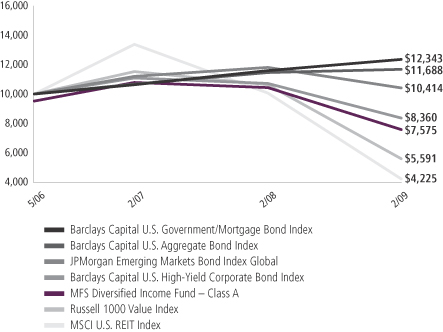
In our review of the performance of this fund, we also look to a number of different benchmarks, each reflecting the results of the various markets in which we invest. The following are returns over the same period for the fund’s other benchmarks: –11.82% for the JPMorgan Emerging Markets Bond Index Global, –22.07% for the Barclays Capital U.S. High-Yield Corporate Bond Index, –47.35% for the Russell 1000 Value Index, –58.01% for the MSCI U.S. REIT Index, and 6.49% for the Barclays Capital U.S. Government/Mortgage Bond Index.
Market Environment
The global economy and financial markets experienced substantial deterioration and extraordinary volatility over the reporting period. Strong headwinds in the U.S. included accelerated deterioration in the housing market, anemic corporate investment, a rapidly declining job market, and a much tighter credit environment. During the period, a seemingly continuous series of tumultuous financial events hammered markets, including: the distressed sale of failing Bear Stearns to JPMorgan, the conservatorship of Government Sponsored Enterprises (GSEs) Fannie Mae and Freddie Mac, the bankruptcy of investment bank Lehman Brothers, the Federal Reserve Bank’s complex intervention of insurance company American International Group (AIG), the nationalization of several large European banks, the failure of Washington Mutual, the distressed sale of Wachovia, the virtual failure of Iceland’s banking sector, and the collapse of the global auto industry. As a result of this barrage of turbulent news, global equity markets pushed significantly lower and credit markets witnessed the worst dislocation since the beginning of the credit crisis. Though credit conditions improved towards the end of the period, the state of financial and macroeconomic dislocation remained very severe.
While reasonably resilient during the first half of the period, the global economy and financial system increasingly experienced considerable negative spillovers from the U.S. slowdown. Not only did Europe and Japan show obvious signs of economic decline, the more powerful engine of global growth – emerging markets – also displayed weakening dynamics. The synchronized
3
Management Review – continued
global downturn in economic activity experienced in the fourth quarter of 2008 and the beginning of 2009 was among the most intense in the post-World War II period.
During the reporting period, the U.S. Federal Reserve Board cut interest rates aggressively and introduced a multitude of new lending facilities to alleviate ever-tightening credit markets, while the U.S. federal government designed and implemented fiscal stimulus packages. Although several other global central banks also cut rates during the first half of the reporting period, the dilemma of rising energy and food prices heightened concerns among central bankers that inflationary expectations might become unhinged despite weaker growth. Only later in the reporting period did rapidly slowing global growth result in a very precipitous decline in commodity prices, which significantly eased inflation and inflationary expectations. As inflationary concerns diminished in the face of global deleveraging, and equity and credit markets deteriorated more sharply, a coordinated rate cut marked the beginning of much more aggressive easing by the major global central banks. By the end of the period, several central banks had approached their lower bound on policy rates and were examining the implementation and ramifications of quantitative easing as a means to further loosen monetary policy to offset the continuing fall in global wealth.
Factors affecting Performance
During a period of severe economic recession in which most risky assets performed poorly, particularly in the latter half of the reporting period, the fund’s exposure to equity securities and Real Estate Investment Trusts (REITs) held back performance. Our exposure to high yield corporate bonds and emerging markets debt also detracted from performance. The impact of the tough market conditions in these asset classes was lessened by the fund’s exposure to U.S. government bonds which benefited from a flight to quality. Within the five specific asset classes in which we invest, security selection detracted from performance in one asset class, high yield corporate bonds, and contributed to performance in four other assets classes: REITs, equities, emerging markets debt, and U.S. government bonds. The fund’s cash position was also a contributor to performance. In a period when most markets declined, as measured by the fund’s benchmarks, holding cash helped performance versus the benchmarks, which have no cash positions.
4
Management Review – continued
Respectfully,
| | | | |
| John Addeo | | David Cole | | Richard Gable |
| Portfolio Manager | | Portfolio Manager | | Portfolio Manager |
| | |
| Thomas Pedulla | | Matthew Ryan | | Jonathan Sage |
| Portfolio Manager | | Portfolio Manager | | Portfolio Manager |
| | |
| Leo Saraceno | | Geoffrey Schechter | | James Swanson |
| Portfolio Manager | | Portfolio Manager | | Portfolio Manager |
The views expressed in this report are those of the portfolio managers only through the end of the period of the report as stated on the cover and do not necessarily reflect the views of MFS or any other person in the MFS organization. These views are subject to change at any time based on market or other conditions, and MFS disclaims any responsibility to update such views. These views may not be relied upon as investment advice or an indication of trading intent on behalf of any MFS portfolio. References to specific securities are not recommendations of such securities, and may not be representative of any MFS portfolio’s current or future investments.
5
PERFORMANCE SUMMARY THROUGH 2/28/09
The following chart illustrates a representative class of the fund's historical performance in comparison to its benchmark(s). Performance results include the deduction of the maximum applicable sales charge and reflect the percentage change in net asset value, including reinvestment of dividends and capital gains distributions. The performance of other share classes will be greater than or less than that of the class depicted below. Benchmark comparisons are unmanaged; do not reflect sales charges, commissions or expenses; and cannot be invested in directly. (See Notes to Performance Summary).
Performance data shown represents past performance and is no guarantee of future results. Investment return and principal value fluctuate so your shares, when sold, may be worth more or less than the original cost; current performance may be lower or higher than quoted. The performance shown does not reflect the deduction of taxes, if any, that a shareholder would pay on fund distributions or the redemption of fund shares.
Growth of a Hypothetical $10,000 Investment (t)
6
Performance Summary – continued
Total Returns through 2/28/09
Average annual without sales charge
| | | | | | | | | | |
| | | Share class | | Class inception date | | 1-yr | | Life (t) | | |
| | | A | | 5/26/06 | | (27.43)% | | (7.95)% | | |
| | | C | | 5/26/06 | | (27.88)% | | (8.59)% | | |
| | | I | | 5/26/06 | | (27.21)% | | (7.68)% | | |
| | | R1 | | 7/01/08 | | (27.98)%(y) | | (8.64)% | | |
| | | R2 | | 7/01/08 | | (27.73)%(y) | | (8.53)% | | |
| | | R3 | | 7/01/08 | | (27.41)%(y) | | (7.94)% | | |
| | | R4 | | 7/01/08 | | (27.14)%(y) | | (7.64)% | | |
Comparative benchmarks
| | | | | | | | |
| | | Barclays Capital U.S. Aggregate Bond Index (f) | | 2.06% | | 5.79% | | |
| | | Barclays Capital U.S. Government/Mortgage Bond Index (f) | | 6.49% | | 7.89% | | |
| | | Barclays Capital U.S. High-Yield Corporate Bond Index (f) | | (22.07)% | | (6.25)% | | |
| | | JPMorgan Emerging Markets Bond Index Global (f) | | (11.82)% | | 1.47% | | |
| | | MSCI U.S. REIT Index (f) | | (58.01)% | | (26.71)% | | |
| | | Russell 1000 Value Index (f) | | (47.35)% | | (18.91)% | | |
Average annual with sales charge
| | | | | | | | | | | | |
| | | A With Initial Sales Charge (4.75%) | | (30.88)% | | (9.56)% | | |
| | | C With CDSC (1% for 12 months) (x) | | (28.56)% | | (8.59)% | | |
Class I, Class R1, Class R2, Class R3, and Class R4 shares do not have a sales charge.
CDSC – Contingent Deferred Sales Charge.
| (f) | Source: FactSet Research Systems Inc. |
| (t) | For the period from the commencement of the fund’s investment operations, May 26, 2006 through the stated period end. |
| (x) | Assuming redemption at the end of the applicable period. |
| (y) | The average annual 1-yr total return is a blended return (see Notes to Performance Summary), while the total return in the Financial Highlights is calculated from inception date through current period end; thus, they may differ. |
Benchmark Definitions
Barclays Capital U.S. Aggregate Bond Index (formerly known as Lehman Brothers U.S. Aggregate Bond Index) – a market capitalization-weighted index that measures the performance of the U.S. investment-grade, fixed rate bond market, with index components for government and corporate securities, mortgage pass-through securities, and asset-backed securities with at least one year to final maturity.
Barclays Capital U.S. Government/Mortgage Bond Index (formerly known as Lehman Brothers U.S. Government/Mortgage Bond Index) – measures debt issued by the U.S. Government, and its agencies, as well as mortgage-backed pass-through
securities of Ginnie Mae (GNMA), Fannie Mae (FNMA), and Freddie Mac (FHLMC).
7
Performance Summary – continued
Barclays Capital U.S. High-Yield Corporate Bond Index (formerly known as Lehman Brothers U.S. High-Yield Corporate Bond Index) – a market capitalization-weighted index that measures the performance of non-investment grade, fixed rate debt. Eurobonds and debt issues from countries designated as emerging markets (e.g., Argentina, Brazil, Venezuela, etc.) are excluded.
JPMorgan Emerging Markets Bond Index Global – measures the performance of U.S.-dollar-denominated debt instruments issued by emerging market sovereign and quasi-sovereign entities: Brady bonds, loans, Eurobonds.
Morgan Stanley Capital International (MSCI) U.S. REIT Index – a market capitalization-weighted index that is designed to measure equity market performance for real estate investment trusts (REITs) that generate a majority of their revenue and income from real estate rental and leasing operations.
Russell 1000 Value Index – constructed to provide a comprehensive barometer for the value securities in the large-cap segment of the U.S. equity universe. Companies in this index generally have lower price-to-book ratios and lower forecasted growth values.
It is not possible to invest directly in an index.
Notes to Performance Summary
Performance for Class R3 shares includes the performance of the fund’s Class A shares for periods prior to their offering. Performance for Class R1 and Class R2 shares includes the performance of the fund’s Class C shares for periods prior to their offering. Performance for Class R4 shares includes the performance of the fund’s Class I shares for periods prior to their offering. This blended class performance has been adjusted to take into account differences in sales loads, if any, applicable to these share classes, but has not been adjusted to take into account differences in class specific operating expenses (such as Rule 12b-1 fees). Compared to performance these share classes would have experienced had they been offered for the entire period, the use of blended performance generally results in higher performance for share classes with higher operating expenses than the share class to which it is blended, and lower performance for share classes with lower operating expenses than the share class to which it is blended.
Performance results reflect any applicable expense subsidies and waivers in effect during the periods shown. Without such subsidies and waivers the fund’s performance results would be less favorable. Please see the prospectus and financial statements for complete details.
From time to time the fund may receive proceeds from litigation settlements, without which performance would be lower.
8
EXPENSE TABLE
Fund expenses borne by the shareholders during the period,
September 1, 2008 through February 28, 2009
As a shareholder of the fund, you incur two types of costs: (1) transaction costs, including sales charges (loads) on certain purchase or redemption payments, and (2) ongoing costs, including management fees; distribution and service (12b-1) fees; and other fund expenses. This example is intended to help you understand your ongoing costs (in dollars) of investing in the fund and to compare these costs with the ongoing costs of investing in other mutual funds.
The example is based on an investment of $1,000 invested at the beginning of the period and held for the entire period September 1, 2008 through February 28, 2009.
Actual Expenses
The first line for each share class in the following table provides information about actual account values and actual expenses. You may use the information in this line, together with the amount you invested, to estimate the expenses that you paid over the period. Simply divide your account value by $1,000 (for example, an $8,600 account value divided by $1,000 = 8.6), then multiply the result by the number in the first line under the heading entitled “Expenses Paid During Period” to estimate the expenses you paid on your account during this period.
Hypothetical Example for Comparison Purposes
The second line for each share class in the following table provides information about hypothetical account values and hypothetical expenses based on the fund’s actual expense ratio and an assumed rate of return of 5% per year before expenses, which is not the fund’s actual return. The hypothetical account values and expenses may not be used to estimate the actual ending account balance or expenses you paid for the period. You may use this information to compare the ongoing costs of investing in the fund and other funds. To do so, compare this 5% hypothetical example with the 5% hypothetical examples that appear in the shareholder reports of the other funds.
Please note that the expenses shown in the table are meant to highlight your ongoing costs only and do not reflect any transactional costs, such as sales charges (loads). Therefore, the second line for each share class in the table is useful in comparing ongoing costs only, and will not help you determine the relative total costs of owning different funds. In addition, if these transactional costs were included, your costs would have been higher.
9
Expense Table – continued
| | | | | | | | | | |
Share
Class | | | | Annualized
Expense
Ratio | | Beginning
Account Value
9/01/08 | | Ending
Account Value
2/28/09 | | Expenses
Paid During
Period (p)
9/01/08-2/28/09 |
| A | | Actual | | 0.95% | | $1,000.00 | | $722.83 | | $4.06 |
| | Hypothetical (h) | | 0.95% | | $1,000.00 | | $1,020.08 | | $4.76 |
| C | | Actual | | 1.65% | | $1,000.00 | | $720.17 | | $7.04 |
| | Hypothetical (h) | | 1.65% | | $1,000.00 | | $1,016.61 | | $8.25 |
| I | | Actual | | 0.65% | | $1,000.00 | | $723.21 | | $2.78 |
| | Hypothetical (h) | | 0.65% | | $1,000.00 | | $1,021.57 | | $3.26 |
| R1 | | Actual | | 1.65% | | $1,000.00 | | $719.86 | | $7.04 |
| | Hypothetical (h) | | 1.65% | | $1,000.00 | | $1,016.61 | | $8.25 |
| R2 | | Actual | | 1.15% | | $1,000.00 | | $721.76 | | $4.91 |
| | Hypothetical (h) | | 1.15% | | $1,000.00 | | $1,019.09 | | $5.76 |
| R3 | | Actual | | 0.90% | | $1,000.00 | | $723.01 | | $3.84 |
| | Hypothetical (h) | | 0.90% | | $1,000.00 | | $1,020.33 | | $4.51 |
| R4 | | Actual | | 0.65% | | $1,000.00 | | $723.96 | | $2.78 |
| | Hypothetical (h) | | 0.65% | | $1,000.00 | | $1,021.57 | | $3.26 |
| (h) | 5% class return per year before expenses. |
| (p) | Expenses paid is equal to each class’ annualized expense ratio, as shown above, multiplied by the average account value over the period, multiplied by the number of days in the period, divided by the number of days in the year. Expenses paid do not include any applicable sales charges (loads). If these transaction costs had been included, your costs would have been higher. |
10
PORTFOLIO OF INVESTMENTS
2/28/09
The Portfolio of Investments is a complete list of all securities owned by your fund. It is categorized by broad-based asset classes.
| | | | | | |
| Bonds - 62.3% | | | | | | |
| | | | | | |
| Issuer | | Shares/Par | | Value ($) |
| Aerospace - 0.3% | | | | | | |
| Bombardier, Inc., 6.3%, 2014 (n) | | $ | 160,000 | | $ | 107,200 |
| Hawker Beechcraft Acquisition Co. LLC, 8.5%, 2015 | | | 315,000 | | | 59,850 |
| TransDigm Group, Inc., 7.75%, 2014 | | | 70,000 | | | 64,400 |
| Vought Aircraft Industries, Inc., 8%, 2011 | | | 305,000 | | | 167,750 |
| | | | | | |
| | | | | | $ | 399,200 |
| Agency - Other - 2.2% | | | | | | |
| Financing Corp., 9.4%, 2018 | | $ | 965,000 | | $ | 1,342,825 |
| Financing Corp., 10.35%, 2018 | | | 715,000 | | | 1,055,336 |
| Financing Corp., STRIPS, 0%, 2017 | | | 860,000 | | | 606,240 |
| | | | | | |
| | | | | | $ | 3,004,401 |
| Airlines - 0.4% | | | | | | |
| AMR Corp., 7.858%, 2011 | | $ | 290,000 | | $ | 250,850 |
| Continental Airlines, Inc., 7.339%, 2014 | | | 390,000 | | | 249,600 |
| | | | | | |
| | | | | | $ | 500,450 |
| Asset Backed & Securitized - 0.9% | | | | | | |
| Banc of America Commercial Mortgage, Inc., 5.39%, 2045 | | $ | 70,467 | | $ | 26,611 |
| Banc of America Commercial Mortgage, Inc., 5.772%, 2051 | | | 500,000 | | | 174,247 |
| Banc of America Commercial Mortgage, Inc., FRN, 5.658%, 2049 | | | 138,143 | | | 78,866 |
| Banc of America Commercial Mortgage, Inc., FRN, 5.812%, 2051 | | | 145,867 | | | 53,453 |
| Citigroup Commercial Mortgage Trust, FRN, 5.7%, 2049 | | | 198,555 | | | 24,004 |
| Commercial Mortgage Pass-Through Certificates, 5.306%, 2046 | | | 117,556 | | | 75,865 |
| Credit Suisse Mortgage Capital Certificate, 5.343%, 2039 | | | 48,162 | | | 17,918 |
| GS Mortgage Securities Corp., “GG8”, 5.56%, 2039 | | | 240,000 | | | 158,011 |
JPMorgan Chase Commercial Mortgage Securities Corp.,
5.44%, 2045 | | | 237,347 | | | 91,202 |
JPMorgan Chase Commercial Mortgage Securities Corp.,
5.466%, 2047 | | | 189,579 | | | 67,955 |
JPMorgan Chase Commercial Mortgage Securities Corp.,
5.42%, 2049 | | | 240,000 | | | 143,837 |
JPMorgan Chase Commercial Mortgage Securities Corp.,
5.819%, 2049 | | | 124,877 | | | 73,762 |
Merrill Lynch/Countrywide Commercial Mortgage Trust,
5.204%, 2049 | | | 256,753 | | | 95,531 |
Merrill Lynch/Countrywide Commercial Mortgage Trust,
FRN, 5.749%, 2050 | | | 66,000 | | | 21,327 |
11
Portfolio of Investments – continued
| | | | | |
| Issuer | | Shares/Par | | Value ($) |
| | | | | |
| Bonds - continued | | | | | |
| Asset Backed & Securitized - continued | | | | | |
| Wachovia Bank Commercial Mortgage Trust, FRN, 5.752%, 2047 | | $ 116,771 | | $ | 11,798 |
| Wachovia Bank Commercial Mortgage Trust, FRN, 5.902%, 2051 | | 256,150 | | | 92,937 |
| | | | | |
| | | | | $ | 1,207,324 |
| Automotive - 1.3% | | | | | |
| Accuride Corp., 8.5%, 2015 | | $ 190,000 | | $ | 57,000 |
| Allison Transmission, Inc., 11%, 2015 (n) | | 655,000 | | | 317,675 |
| FCE Bank PLC, 7.125%, 2012 | | EUR 500,000 | | | 386,664 |
| Ford Motor Credit Co. LLC, 9.75%, 2010 | | $ 185,000 | | | 119,455 |
| Ford Motor Credit Co. LLC, 12%, 2015 | | 755,000 | | | 439,569 |
| Ford Motor Credit Co. LLC, 8%, 2016 | | 285,000 | | | 134,252 |
| General Motors Corp., 8.375%, 2033 | | 180,000 | | | 23,850 |
| Goodyear Tire & Rubber Co., 9%, 2015 | | 380,000 | | | 286,900 |
| | | | | |
| | | | | $ | 1,765,365 |
| Broadcasting - 1.1% | | | | | |
| Allbritton Communications Co., 7.75%, 2012 | | $ 445,000 | | $ | 200,250 |
| Bonten Media Acquisition Co., 9%, 2015 (p)(z) | | 285,000 | | | 62,700 |
| CanWest MediaWorks LP, 9.25%, 2015 (a)(n) | | 120,000 | | | 12,600 |
| Clear Channel Communications, 10.75%, 2016 (n) | | 100,000 | | | 14,500 |
| DirectTV Holdings LLC, 7.625%, 2016 | | 345,000 | | | 331,200 |
| Intelsat Jackson Holdings Ltd., 9.5%, 2016 (z) | | 100,000 | | | 92,500 |
| Lamar Media Corp., 6.625%, 2015 | | 445,000 | | | 287,025 |
| Lamar Media Corp., “C”, 6.625%, 2015 | | 140,000 | | | 87,500 |
| LBI Media, Inc., 8.5%, 2017 (z) | | 185,000 | | | 55,500 |
| LIN TV Corp., 6.5%, 2013 | | 305,000 | | | 158,600 |
| Local TV Finance LLC, 9.25%, 2015 (p)(z) | | 450,000 | | | 45,563 |
| Newport Television LLC, 13%, 2017 (n)(p) | | 495,000 | | | 19,800 |
| Nexstar Broadcasting Group, Inc., 7%, 2014 | | 325,000 | | | 114,156 |
| Univision Communications, Inc., 9.75%, 2015 (n)(p) | | 530,000 | | | 39,750 |
| Young Broadcasting, Inc., 8.75%, 2014 (d) | | 110,000 | | | 12 |
| | | | | |
| | | | | $ | 1,521,656 |
| Brokerage & Asset Managers - 0.1% | | | | | |
| Nuveen Investments, Inc., 10.5%, 2015 (n) | | $ 450,000 | | $ | 103,500 |
| | |
| Building - 0.4% | | | | | |
| Associated Materials, Inc., 9.75%, 2012 | | $ 115,000 | | $ | 94,875 |
| Associated Materials, Inc., 0% to 2009, 11.25% to 2014 | | 295,000 | | | 88,500 |
| Building Materials Corp. of America, 7.75%, 2014 | | 140,000 | | | 95,900 |
| Nortek, Inc., 10%, 2013 | | 150,000 | | | 60,000 |
| Nortek, Inc., 8.5%, 2014 | | 80,000 | | | 12,800 |
| Ply Gem Industries, Inc., 9%, 2012 (l) | | 295,000 | | | 67,850 |
12
Portfolio of Investments – continued
| | | | | | |
| Issuer | | Shares/Par | | Value ($) |
| | | | | | |
| Bonds - continued | | | | | | |
| Building - continued | | | | | | |
| Ply Gem Industries, Inc., 11.75%, 2013 | | $ | 300,000 | | $ | 138,000 |
| | | | | | |
| | | | | | $ | 557,925 |
| Business Services - 0.4% | | | | | | |
| First Data Corp., 9.875%, 2015 | | $ | 610,000 | | $ | 335,500 |
| SunGard Data Systems, Inc., 10.25%, 2015 | | | 362,000 | | | 247,970 |
| | | | | | |
| | | | | | $ | 583,470 |
| Cable TV - 1.3% | | | | | | |
| CCO Holdings LLC, 8.75%, 2013 | | $ | 470,000 | | $ | 366,600 |
| Charter Communications, Inc., 8.375%, 2014 (n) | | | 160,000 | | | 137,600 |
| Charter Communications, Inc., 10.875%, 2014 (n) | | | 80,000 | | | 74,000 |
| CSC Holdings, Inc., 6.75%, 2012 | | | 315,000 | | | 302,400 |
| CSC Holdings, Inc., 8.5%, 2014 (z) | | | 75,000 | | | 72,000 |
| CSC Holdings, Inc., 8.5%, 2015 (n) | | | 295,000 | | | 281,725 |
| Mediacom LLC, 9.5%, 2013 | | | 110,000 | | | 95,700 |
| Time Warner Cable, Inc., 8.75%, 2019 | | | 205,000 | | | 218,826 |
| Virgin Media, Inc., 9.125%, 2016 | | | 300,000 | | | 263,625 |
| | | | | | |
| | | | | | $ | 1,812,476 |
| Chemicals - 0.8% | | | | | | |
| Innophos Holdings, Inc., 8.875%, 2014 | | $ | 615,000 | | $ | 488,925 |
| Momentive Performance Materials, Inc., 11.5%, 2016 | | | 440,000 | | | 92,400 |
| Nalco Co., 7.75%, 2011 | | | 65,000 | | | 64,350 |
| Nalco Co., 8.875%, 2013 | | | 430,000 | | | 416,025 |
| | | | | | |
| | | | | | $ | 1,061,700 |
| Consumer Goods & Services - 1.0% | | | | | | |
| Corrections Corp. of America, 6.25%, 2013 | | $ | 145,000 | | $ | 138,837 |
| Jarden Corp., 7.5%, 2017 | | | 205,000 | | | 159,900 |
| KAR Holdings, Inc., 7.192%, 2014 | | | 425,000 | | | 153,000 |
| KAR Holdings, Inc., 10%, 2015 | | | 305,000 | | | 103,700 |
| Service Corp. International, 7.375%, 2014 | | | 120,000 | | | 114,600 |
| Service Corp. International, 7%, 2017 | | | 725,000 | | | 659,750 |
| Ticketmaster, 10.75%, 2016 (n) | | | 170,000 | | | 122,400 |
| | | | | | |
| | | | | | $ | 1,452,187 |
| Containers - 0.7% | | | | | | |
| Crown Americas LLC, 7.625%, 2013 | | $ | 190,000 | | $ | 190,950 |
| Graham Packaging Holdings Co., 9.875%, 2014 | | | 300,000 | | | 189,000 |
| Greif, Inc., 6.75%, 2017 | | | 570,000 | | | 498,750 |
| Owens-Brockway Glass Container, Inc., 8.25%, 2013 | | | 125,000 | | | 126,250 |
| | | | | | |
| | | | | | $ | 1,004,950 |
13
Portfolio of Investments – continued
| | | | | | |
| Issuer | | Shares/Par | | Value ($) |
| | | | | | |
| Bonds - continued | | | | | | |
| Defense Electronics - 0.2% | | | | | | |
| L-3 Communications Corp., 5.875%, 2015 | | $ | 360,000 | | $ | 332,100 |
| | |
| Electronics - 0.2% | | | | | | |
| Flextronics International Ltd., 6.25%, 2014 | | $ | 250,000 | | $ | 210,000 |
| Freescale Semiconductor, Inc., 8.875%, 2014 | | | 150,000 | | | 27,000 |
| Spansion, Inc., 11.25%, 2016 (d)(n) | | | 435,000 | | | 10,331 |
| | | | | | |
| | | | | | $ | 247,331 |
| Emerging Market Quasi-Sovereign - 3.4% | | | | | | |
| Corporación Nacional del Cobre de Chile, 4.75%, 2014 | | $ | 1,146,000 | | $ | 1,094,992 |
| Corporación Nacional del Cobre de Chile, 5.625%, 2035 | | | 623,000 | | | 439,571 |
| Gazprom International S.A., 7.201%, 2020 | | | 1,164,136 | | | 939,284 |
| Korea Development Bank, 8%, 2014 | | | 413,000 | | | 417,312 |
| NAK Naftogaz Ukrainy, 8.125%, 2009 | | | 500,000 | | | 276,250 |
| National Power Corp., 5.501%, 2011 | | | 381,000 | | | 361,859 |
| Pemex Project Funding Master Trust, 5.75%, 2018 | | | 598,000 | | | 484,004 |
| Pemex Project Funding Master Trust, 6.625%, 2035 | | | 642,000 | | | 453,192 |
| Petroleos Mexicanos, 8%, 2019 (n) | | | 319,000 | | | 313,418 |
| | | | | | |
| | | | | | $ | 4,779,882 |
| Emerging Market Sovereign - 7.1% | | | | | | |
| Federative Republic of Brazil, 8%, 2018 | | $ | 673,000 | | $ | 725,830 |
| Federative Republic of Brazil, 11%, 2040 | | | 723,000 | | | 889,290 |
| Republic of Argentina, FRN, 3.127%, 2012 | | | 442,450 | | | 237,889 |
| Republic of Colombia, 7.375%, 2017 | | | 729,000 | | | 733,009 |
| Republic of Colombia, 7.375%, 2037 | | | 348,000 | | | 318,420 |
| Republic of Columbia, 7.375%, 2019 | | | 131,000 | | | 129,690 |
| Republic of El Salvador, 7.65%, 2035 | | | 200,000 | | | 142,000 |
| Republic of Indonesia, 10.375%, 2014 (z) | | | 108,000 | | | 107,858 |
| Republic of Indonesia, 6.875%, 2018 (n) | | | 305,000 | | | 231,800 |
| Republic of Indonesia, 8.5%, 2035 | | | 770,000 | | | 585,397 |
| Republic of Panama, 9.375%, 2029 | | | 887,000 | | | 975,700 |
| Republic of Peru, 6.55%, 2037 | | | 444,000 | | | 405,150 |
| Republic of Philippines, 8%, 2016 | | | 100,000 | | | 106,000 |
| Republic of Philippines, 9.375%, 2017 | | | 651,000 | | | 743,768 |
| Republic of Philippines, 8.375%, 2019 | | | 100,000 | | | 105,875 |
| Republic of Turkey, 7.25%, 2015 | | | 657,000 | | | 625,793 |
| Republic of Turkey, 7.375%, 2025 | | | 297,000 | | | 249,480 |
| Republic of Turkey, 6.875%, 2036 | | | 372,000 | | | 278,070 |
| Republic of Uruguay, 8%, 2022 | | | 1,351,000 | | | 1,229,410 |
| Republic of Uruguay, 7.625%, 2036 | | | 700,000 | | | 575,750 |
14
Portfolio of Investments – continued
| | | | | | |
| Issuer | | Shares/Par | | Value ($) |
| | | | | | |
| Bonds - continued | | | | | | |
| Emerging Market Sovereign - continued | | | | | | |
| United Mexican States, 5.625%, 2017 | | $ | 522,000 | | $ | 503,469 |
| | | | | | |
| | | | | | $ | 9,899,648 |
| Energy - Independent - 2.3% | | | | | | |
| Chaparral Energy, Inc., 8.875%, 2017 | | $ | 375,000 | | $ | 90,000 |
| Chesapeake Energy Corp., 9.5%, 2015 | | | 90,000 | | | 83,700 |
| Chesapeake Energy Corp., 6.375%, 2015 | | | 390,000 | | | 318,825 |
| Chesapeake Energy Corp., 6.875%, 2016 | | | 515,000 | | | 423,587 |
| Delta Petroleum Corp., 7%, 2015 | | | 20,000 | | | 7,800 |
| Forest Oil Corp., 8.5%, 2014 (z) | | | 75,000 | | | 68,250 |
| Forest Oil Corp., 7.25%, 2019 (n) | | | 45,000 | | | 36,000 |
| Forest Oil Corp., 7.25%, 2019 | | | 315,000 | | | 252,000 |
| Hilcorp Energy I LP, 9%, 2016 (n) | | | 440,000 | | | 349,800 |
| Mariner Energy, Inc., 8%, 2017 | | | 350,000 | | | 232,750 |
| Mcmoran Exploration Co., 11.875%, 2014 | | | 95,000 | | | 69,113 |
| Newfield Exploration Co., 6.625%, 2016 | | | 70,000 | | | 60,900 |
| OPTI Canada, Inc., 8.25%, 2014 | | | 560,000 | | | 190,400 |
| Petrohawk Energy Corp., 10.5%, 2014 (z) | | | 135,000 | | | 132,975 |
| Plains Exploration & Production Co., 7%, 2017 | | | 405,000 | | | 345,263 |
| Quicksilver Resources, Inc., 7.125%, 2016 | | | 490,000 | | | 323,400 |
| Range Resource Corp., 7.5%, 2016 | | | 40,000 | | | 37,000 |
| SandRidge Energy, Inc., 8%, 2018 (n) | | | 270,000 | | | 210,600 |
| | | | | | |
| | | | | | $ | 3,232,363 |
| Energy - Integrated - 0.7% | | | | | | |
| Petrobras International Finance Co., 7.875%, 2019 | | $ | 462,000 | | $ | 463,155 |
| Petroleum Co. of Trinidad & Tobago Ltd., 6%, 2022 (n) | | | 746,000 | | | 517,649 |
| | | | | | |
| | | | | | $ | 980,804 |
| Entertainment - 0.2% | | | | | | |
| AMC Entertainment, Inc., 11%, 2016 | | $ | 200,000 | | $ | 180,000 |
| Marquee Holdings, Inc., 12%, 2014 | | | 120,000 | | | 80,400 |
| | | | | | |
| | | | | | $ | 260,400 |
| Financial Institutions - 0.5% | | | | | | |
| GMAC Commercial Mortgage Securities, Inc., 6.875%, 2011 (z) | | $ | 768,000 | | $ | 499,966 |
| GMAC Commercial Mortgage Securities, Inc., 7%, 2012 (z) | | | 125,000 | | | 74,514 |
| GMAC Commercial Mortgage Securities, Inc., 6.75%, 2014 (z) | | | 220,000 | | | 106,828 |
| GMAC Commercial Mortgage Securities, Inc., 8%, 2031 (z) | | | 122,000 | | | 54,768 |
| | | | | | |
| | | | | | $ | 736,076 |
| Food & Beverages - 0.6% | | | | | | |
| ARAMARK Corp., 8.5%, 2015 | | $ | 160,000 | | $ | 145,600 |
15
Portfolio of Investments – continued
| | | | | |
| Issuer | | Shares/Par | | Value ($) |
| | | | | |
| Bonds - continued | | | | | |
| Food & Beverages - continued | | | | | |
| Dean Foods Co., 7%, 2016 | | $ 450,000 | | $ | 427,500 |
| Del Monte Corp., 6.75%, 2015 | | 300,000 | | | 286,500 |
| | | | | |
| | | | | $ | 859,600 |
| Forest & Paper Products - 0.9% | | | | | |
| Buckeye Technologies, Inc., 8%, 2010 | | $ 106,000 | | $ | 103,482 |
| Buckeye Technologies, Inc., 8.5%, 2013 | | 15,000 | | | 13,369 |
| Georgia-Pacific Corp., 7.125%, 2017 (n) | | 465,000 | | | 426,638 |
| Georgia-Pacific Corp., 8%, 2024 | | 90,000 | | | 67,500 |
| Graphic Packaging International Corp., 9.5%, 2013 | | 285,000 | | | 212,325 |
| Jefferson Smurfit Corp., 8.25%, 2012 (d) | | 130,000 | | | 10,400 |
| Millar Western Forest Products Ltd., 7.75%, 2013 | | 585,000 | | | 286,650 |
| NewPage Holding Corp., 10%, 2012 | | 415,000 | | | 125,538 |
| Smurfit-Stone Container Corp., 8%, 2017 (d) | | 107,000 | | | 9,363 |
| | | | | |
| | | | | $ | 1,255,265 |
| Gaming & Lodging - 1.6% | | | | | |
| Boyd Gaming Corp., 6.75%, 2014 | | $ 245,000 | | $ | 127,400 |
| Firekeepers Development Authority, 13.875%, 2015 (z) | | 145,000 | | | 91,350 |
| Fontainebleau Las Vegas Holdings LLC, 11%, 2015 (a)(n) | | 505,000 | | | 32,825 |
| Harrah’s Operating Co., Inc., 10.75%, 2016 | | 546,000 | | | 76,440 |
| Harrah’s Operating Co., Inc., 10%, 2018 (z) | | 125,000 | | | 35,000 |
| Host Hotels & Resorts, Inc., 7.125%, 2013 | | 135,000 | | | 106,988 |
| Host Hotels & Resorts, Inc., 6.75%, 2016 | | 150,000 | | | 108,000 |
| MGM Mirage, 8.375%, 2011 | | 325,000 | | | 81,250 |
| MGM Mirage, 6.75%, 2013 | | 650,000 | | | 277,875 |
| Pinnacle Entertainment, Inc., 8.75%, 2013 | | 20,000 | | | 17,800 |
| Pinnacle Entertainment, Inc., 7.5%, 2015 | | 830,000 | | | 547,800 |
| Starwood Hotels & Resorts Worldwide, Inc., 7.875%, 2012 | | 435,000 | | | 376,275 |
| Starwood Hotels & Resorts Worldwide, Inc., 6.75%, 2018 | | 315,000 | | | 215,775 |
| Station Casinos, Inc., 6%, 2012 (d) | | 95,000 | | | 29,450 |
| Station Casinos, Inc., 6.5%, 2014 (d) | | 440,000 | | | 13,200 |
| Station Casinos, Inc., 6.875%, 2016 (d) | | 475,000 | | | 14,250 |
| Trump Entertainment Resorts, Inc., 8.5%, 2015 (d) | | 800,000 | | | 88,000 |
| | | | | |
| | | | | $ | 2,239,678 |
| Industrial - 0.2% | | | | | |
| Blount International, Inc., 8.875%, 2012 | | $ 220,000 | | $ | 221,100 |
| JohnsonDiversey, Inc., 9.625%, 2012 | | EUR 75,000 | | | 78,917 |
| | | | | |
| | | | | $ | 300,017 |
| Insurance - Property & Casualty - 0.1% | | | | | |
| USI Holdings Corp., 9.75%, 2015 (z) | | $ 205,000 | | $ | 90,713 |
16
Portfolio of Investments – continued
| | | | | | |
| Issuer | | Shares/Par | | Value ($) |
| | | | | | |
| Bonds - continued | | | | | | |
| Machinery & Tools - 0.1% | | | | | | |
| Case New Holland, Inc., 7.125%, 2014 | | $ | 240,000 | | $ | 164,400 |
| | |
| Major Banks - 0.4% | | | | | | |
| Bank of America Corp., 8% to 2018, FRN to 2059 | | $ | 560,000 | | $ | 209,110 |
| JPMorgan Chase & Co., 7.9% to 2018, FRN to 2049 | | | 435,000 | | | 300,089 |
| | | | | | |
| | | | | | $ | 509,199 |
| Medical & Health Technology & Services - 3.4% | | | | | | |
| Biomet, Inc., 10%, 2017 | | $ | 230,000 | | $ | 230,000 |
| Biomet, Inc., 11.625%, 2017 | | | 140,000 | | | 129,500 |
| Community Health Systems, Inc., 8.875%, 2015 | | | 1,115,000 | | | 1,055,069 |
| Cooper Cos., Inc., 7.125%, 2015 | | | 115,000 | | | 102,781 |
| DaVita, Inc., 6.625%, 2013 | | | 98,000 | | | 95,550 |
| DaVita, Inc., 7.25%, 2015 | | | 554,000 | | | 537,380 |
| Fresenius Medical Care AG & Co. KGaA, 9%, 2015 (z) | | | 175,000 | | | 182,000 |
| HCA, Inc., 6.375%, 2015 | | | 250,000 | | | 172,500 |
| HCA, Inc., 9.25%, 2016 | | | 1,330,000 | | | 1,216,950 |
| Psychiatric Solutions, Inc., 7.75%, 2015 | | | 155,000 | | | 136,013 |
| U.S. Oncology, Inc., 10.75%, 2014 | | | 450,000 | | | 415,125 |
| Universal Hospital Services, Inc., 8.5%, 2015 (p) | | | 205,000 | | | 178,350 |
| Universal Hospital Services, Inc., FRN, 5.943%, 2015 | | | 65,000 | | | 46,150 |
| VWR Funding, Inc., 10.25%, 2015 (p) | | | 355,000 | | | 259,150 |
| | | | | | |
| | | | | | $ | 4,756,518 |
| Metals & Mining - 1.4% | | | | | | |
| FMG Finance Ltd., 10.625%, 2016 (n) | | $ | 790,000 | | $ | 671,500 |
| Freeport-McMoRan Copper & Gold, Inc., 8.375%, 2017 | | | 590,000 | | | 508,875 |
| Freeport-McMoRan Copper & Gold, Inc., FRN, 7.084%, 2015 | | | 70,000 | | | 52,325 |
| Peabody Energy Corp., 7.375%, 2016 | | | 105,000 | | | 102,375 |
| Peabody Energy Corp., “B”, 6.875%, 2013 | | | 540,000 | | | 525,150 |
| Rio Tinto Finance USA Ltd., 5.875%, 2013 | | | 100,000 | | | 90,899 |
| | | | | | |
| | | | | | $ | 1,951,124 |
| Mortgage Backed - 15.9% | | | | | | |
| Fannie Mae, 5.503%, 2011 | | $ | 39,000 | | $ | 41,419 |
| Fannie Mae, 6.088%, 2011 | | | 62,000 | | | 66,237 |
| Fannie Mae, 4.35%, 2013 | | | 182,886 | | | 185,198 |
| Fannie Mae, 4.374%, 2013 | | | 130,628 | | | 132,712 |
| Fannie Mae, 4.518%, 2013 | | | 121,625 | | | 124,190 |
| Fannie Mae, 5.369%, 2013 | | | 96,301 | | | 99,112 |
| Fannie Mae, 4.56%, 2014 - 2015 | | | 205,751 | | | 208,001 |
| Fannie Mae, 4.76%, 2014 | | | 83,333 | | | 85,463 |
| Fannie Mae, 4.88%, 2014 | | | 102,747 | | | 105,232 |
17
Portfolio of Investments – continued
| | | | | | |
| Issuer | | Shares/Par | | Value ($) |
| | | | | | |
| Bonds - continued | | | | | | |
| Mortgage Backed - continued | | | | | | |
| Fannie Mae, 4.935%, 2014 | | $ | 166,514 | | $ | 171,469 |
| Fannie Mae, 4.6%, 2015 | | | 28,452 | | | 28,778 |
| Fannie Mae, 4.69%, 2015 | | | 198,765 | | | 201,942 |
| Fannie Mae, 4.7%, 2015 | | | 61,353 | | | 62,359 |
| Fannie Mae, 4.78%, 2015 | | | 84,407 | | | 86,121 |
| Fannie Mae, 4.79%, 2015 | | | 127,100 | | | 129,738 |
| Fannie Mae, 4.81%, 2015 | | | 189,971 | | | 194,351 |
| Fannie Mae, 4.85%, 2015 | | | 183,087 | | | 187,350 |
| Fannie Mae, 4.856%, 2015 | | | 153,798 | | | 156,307 |
| Fannie Mae, 5.022%, 2015 | | | 166,119 | | | 170,027 |
| Fannie Mae, 5.034%, 2015 | | | 66,017 | | | 68,118 |
| Fannie Mae, 4.5%, 2016 - 2028 | | | 1,130,641 | | | 1,154,302 |
| Fannie Mae, 5.09%, 2016 | | | 67,264 | | | 69,708 |
| Fannie Mae, 5.423%, 2016 | | | 33,697 | | | 35,557 |
| Fannie Mae, 5.574%, 2016 | | | 110,840 | | | 116,572 |
| Fannie Mae, 5.93%, 2016 | | | 119,886 | | | 129,977 |
| Fannie Mae, 6.039%, 2016 | | | 64,564 | | | 67,408 |
| Fannie Mae, 5.5%, 2017 - 2038 | | | 5,334,737 | | | 5,480,587 |
| Fannie Mae, 6%, 2017 - 2037 | | | 2,843,337 | | | 2,948,576 |
| Fannie Mae, 6.5%, 2017 - 2037 | | | 329,810 | | | 345,424 |
| Fannie Mae, 5%, 2019 - 2028 | | | 429,888 | | | 440,503 |
| Freddie Mac, 4.5%, 2015 - 2022 | | | 147,754 | | | 150,024 |
| Freddie Mac, 6%, 2017 - 2038 | | | 306,008 | | | 317,657 |
| Freddie Mac, 5%, 2018 - 2032 | | | 2,931,764 | | | 3,000,676 |
| Freddie Mac, 4%, 2024 | | | 122,541 | | | 123,123 |
| Freddie Mac, 5.5%, 2024 - 2035 | | | 2,584,257 | | | 2,646,942 |
| Freddie Mac, 6.5%, 2037 | | | 607,342 | | | 636,007 |
| Ginnie Mae, 5.5%, 2033 - 2038 | | | 1,290,563 | | | 1,329,729 |
| Ginnie Mae, 5.612%, 2058 | | | 344,867 | | | 348,747 |
| Ginnie Mae, 6.36%, 2058 | | | 295,176 | | | 306,580 |
| | | | | | |
| | | | | | $ | 22,152,223 |
| Municipals - 0.9% | | | | | | |
| California Educational Facilities Authority Rev. (Stanford University), “T-1”, 5%, 2039 | | $ | 585,000 | | $ | 608,260 |
| Massachusetts Bay Transportation Authority, Sales Tax Rev., “A-1”, 5.25%, 2028 | | | 270,000 | | | 286,224 |
| Massachusetts Water Pollution Abatement Trust, 5.25%, 2033 | | | 65,000 | | | 67,648 |
| Massachusetts Water Resources Authority Rev., “B”, FSA, 5.25%, 2035 | | | 345,000 | | | 351,941 |
| | | | | | |
| | | | | | $ | 1,314,073 |
18
Portfolio of Investments – continued
| | | | | | |
| Issuer | | Shares/Par | | Value ($) |
| | | | | | |
| Bonds - continued | | | | | | |
| Natural Gas - Distribution - 0.7% | | | | | | |
| AmeriGas Partners LP, 7.125%, 2016 | | $ | 290,000 | | $ | 269,700 |
| Inergy LP, 6.875%, 2014 | | | 820,000 | | | 754,400 |
| | | | | | |
| | | | | | $ | 1,024,100 |
| Natural Gas - Pipeline - 0.7% | | | | | | |
| Atlas Pipeline Partners LP, 8.75%, 2018 | | $ | 190,000 | | $ | 117,800 |
Deutsche Bank (El Paso Performance-Linked Trust, CLN),
7.75%, 2011 (n) | | | 340,000 | | | 320,880 |
| El Paso Corp., 8.25%, 2016 | | | 180,000 | | | 167,400 |
| El Paso Corp., 7.25%, 2018 | | | 190,000 | | | 167,675 |
| Williams Partners LP, 7.25%, 2017 | | | 205,000 | | | 178,350 |
| | | | | | |
| | | | | | $ | 952,105 |
| Network & Telecom - 1.6% | | | | | | |
| Cincinnati Bell, Inc., 8.375%, 2014 | | $ | 395,000 | | $ | 361,425 |
| Citizens Communications Co., 9.25%, 2011 | | | 330,000 | | | 336,600 |
| Nordic Telephone Co. Holdings, 8.875%, 2016 (n) | | | 195,000 | | | 177,450 |
| Qwest Communications International, Inc., 7.25%, 2011 | | | 985,000 | | | 938,213 |
| Qwest Corp., 7.875%, 2011 | | | 115,000 | | | 113,275 |
| Windstream Corp., 8.625%, 2016 | | | 295,000 | | | 283,200 |
| | | | | | |
| | | | | | $ | 2,210,163 |
| Oil Services - 0.1% | | | | | | |
| KazMunaiGaz Finance B.V., 8.375%, 2013 (n) | | $ | 200,000 | | $ | 140,000 |
| | |
| Other Banks & Diversified Financials - 0.4% | | | | | | |
| Export-Import Bank of Korea, 8.125%, 2014 | | $ | 321,000 | | $ | 328,560 |
| RSHB Capital S.A., 7.125%, 2014 | | | 413,000 | | | 284,598 |
| | | | | | |
| | | | | | $ | 613,158 |
| Precious Metals & Minerals - 0.2% | | | | | | |
| Alrosa Finance S.A., 8.875%, 2014 | | $ | 482,000 | | $ | 329,720 |
| | |
| Printing & Publishing - 0.5% | | | | | | |
| American Media Operations, Inc., 9%, 2013 (p)(z) | | $ | 22,262 | | $ | 13,357 |
| American Media Operations, Inc., 14%, 2013 (p)(z) | | | 229,580 | | | 114,790 |
| Dex Media West LLC, 9.875%, 2013 | | | 683,000 | | | 104,157 |
| Idearc, Inc., 8%, 2016 (a) | | | 261,000 | | | 3,915 |
| Nielsen Finance LLC, 10%, 2014 | | | 515,000 | | | 424,875 |
| Nielsen Finance LLC, 0% to 2011, 12.5% to 2016 | | | 18,000 | | | 7,020 |
| Quebecor World, Inc., 6.125%, 2013 (d) | | | 120,000 | | | 3,750 |
| Tribune Co., 5.25%, 2015 (d) | | | 170,000 | | | 4,250 |
| | | | | | |
| | | | | | $ | 676,114 |
19
Portfolio of Investments – continued
| | | | | | |
| Issuer | | Shares/Par | | Value ($) |
| | | | | | |
| Bonds - continued | | | | | | |
| Retailers - 0.2% | | | | | | |
| Couche-Tard, Inc., 7.5%, 2013 | | $ | 40,000 | | $ | 37,800 |
| Rite Aid Corp., 9.5%, 2017 | | | 105,000 | | | 25,725 |
| Sally Beauty Holdings, Inc., 10.5%, 2016 | | | 335,000 | | | 290,613 |
| | | | | | |
| | | | | | $ | 354,138 |
| Specialty Stores - 0.1% | | | | | | |
| Payless ShoeSource, Inc., 8.25%, 2013 | | $ | 170,000 | | $ | 143,650 |
| | |
| Telecommunications - Wireless - 1.3% | | | | | | |
| Alltel Corp., 7%, 2012 | | $ | 278,000 | | $ | 285,645 |
| Alltel Corp., 6.5%, 2013 | | | 95,000 | | | 95,000 |
| Crown Castle International Corp., 9%, 2015 | | | 170,000 | | | 165,750 |
| MetroPCS Wireless, Inc., 9.25%, 2014 | | | 190,000 | | | 179,550 |
| Sprint Nextel Corp., 8.375%, 2012 | | | 270,000 | | | 218,700 |
| Sprint Nextel Corp., 8.75%, 2032 | | | 85,000 | | | 51,213 |
| Sprint Nextel Corp., FRN, 1.866%, 2010 | | | 100,000 | | | 86,819 |
| Wind Acquisition Finance S.A., 10.75%, 2015 (z) | | | 750,000 | | | 751,875 |
| | | | | | |
| | | | | | $ | 1,834,552 |
| Tobacco - 0.2% | | | | | | |
| Altria Group, Inc., 9.7%, 2018 | | $ | 270,000 | | $ | 282,689 |
| | |
| Transportation - Services - 0.1% | | | | | | |
| Hertz Corp., 8.875%, 2014 | | $ | 270,000 | | $ | 132,300 |
| | |
| U.S. Government Agencies and Equivalents - 0.8% | | | | | | |
| Small Business Administration, 6.34%, 2021 | | $ | 358,805 | | $ | 385,117 |
| Small Business Administration, 6.07%, 2022 | | | 317,512 | | | 341,673 |
| Small Business Administration, 5.16%, 2028 | | | 315,930 | | | 333,213 |
| | | | | | |
| | | | | | $ | 1,060,003 |
| U.S. Treasury Obligations - 1.9% | | | | | | |
| U.S. Treasury Bonds, 9.25%, 2016 | | $ | 47,000 | | $ | 65,598 |
| U.S. Treasury Bonds, 4.75%, 2017 | | | 282,000 | | | 319,718 |
| U.S. Treasury Bonds, 5.25%, 2029 | | | 36,000 | | | 42,098 |
| U.S. Treasury Notes, 5.125%, 2011 (f) | | | 549,000 | | | 599,011 |
| U.S. Treasury Notes, 3.125%, 2013 | | | 1,313,000 | | | 1,383,471 |
| U.S. Treasury Notes, 4%, 2014 | | | 18,000 | | | 19,796 |
| U.S. Treasury Notes, 3.75%, 2018 | | | 193,000 | | | 204,505 |
| | | | | | |
| | | | | | $ | 2,634,197 |
| Utilities - Electric Power - 2.5% | | | | | | |
| AES Corp., 8%, 2017 | | $ | 415,000 | | $ | 352,750 |
20
Portfolio of Investments – continued
| | | | | | |
| Issuer | | Shares/Par | | Value ($) |
| | | | | | |
| Bonds - continued | | | | | | |
| Utilities - Electric Power - continued | | | | | | |
| Centrais Eletricas Brasileiras S.A., 7.75%, 2015 | | $ | 314,000 | | $ | 313,215 |
| Dynegy Holdings, Inc., 7.5%, 2015 | | | 220,000 | | | 136,400 |
| Dynegy Holdings, Inc., 7.75%, 2019 | | | 115,000 | | | 69,575 |
| Edison Mission Energy, 7%, 2017 | | | 290,000 | | | 245,050 |
| Mirant Americas Generation LLC, 8.3%, 2011 | | | 600,000 | | | 579,000 |
| Mirant North America LLC, 7.375%, 2013 | | | 140,000 | | | 128,100 |
| NRG Energy, Inc., 7.375%, 2016 | | | 1,035,000 | | | 954,788 |
| Reliant Energy, Inc., 7.875%, 2017 | | | 114,000 | | | 82,935 |
| Texas Competitive Electric Holdings, LLC, 10.25%, 2015 | | | 1,115,000 | | | 563,075 |
| | | | | | |
| | | | | | $ | 3,424,888 |
| Total Bonds (Identified Cost, $104,761,954) | | | | | $ | 86,847,795 |
| | |
| Common Stocks - 31.4% | | | | | | |
| Aerospace - 0.3% | | | | | | |
| Northrop Grumman Corp. | | | 9,766 | | $ | 364,858 |
| | |
| Automotive - 0.1% | | | | | | |
| Johnson Controls, Inc. | | | 8,410 | | $ | 95,706 |
| | |
| Biotechnology - 0.2% | | | | | | |
| Amgen, Inc. (a) | | | 6,987 | | $ | 341,874 |
| | |
| Broadcasting - 0.2% | | | | | | |
| Time Warner, Inc. | | | 21,100 | | $ | 160,993 |
| Walt Disney Co. | | | 10,939 | | | 183,447 |
| | | | | | |
| | | | | | $ | 344,440 |
| Brokerage & Asset Managers - 0.2% | | | | | | |
| CME Group, Inc. | | | 950 | | $ | 173,280 |
| Invesco Ltd. | | | 12,920 | | | 147,676 |
| | | | | | |
| | | | | | $ | 320,956 |
| Cable TV - 0.4% | | | | | | |
| Comcast Corp., “A” | | | 28,310 | | $ | 369,729 |
| Time Warner Cable, Inc., “A” (a) | | | 6,510 | | | 118,677 |
| | | | | | |
| | | | | | $ | 488,406 |
| Chemicals - 0.2% | | | | | | |
| Dow Chemical Co. | | | 8,294 | | $ | 59,385 |
| PPG Industries, Inc. | | | 8,330 | | | 258,730 |
| | | | | | |
| | | | | | $ | 318,115 |
21
Portfolio of Investments – continued
| | | | | |
| Issuer | | Shares/Par | | Value ($) |
| | | | | |
| Common Stocks - continued | | | | | |
| Computer Software - 0.1% | | | | | |
| Oracle Corp. (a) | | 10,150 | | $ | 157,731 |
| | |
| Construction - 0.1% | | | | | |
| Lennox International, Inc. | | 4,250 | | $ | 110,075 |
| NVR, Inc. (a) | | 210 | | | 69,882 |
| | | | | |
| | | | | $ | 179,957 |
| Consumer Goods & Services - 0.6% | | | | | |
| Fortune Brands, Inc. | | 3,320 | | $ | 78,850 |
| Kimberly-Clark Corp. | | 2,193 | | | 103,312 |
| Procter & Gamble Co. | | 13,020 | | | 627,173 |
| | | | | |
| | | | | $ | 809,335 |
| Containers - 0.2% | | | | | |
| Greif, Inc. | | 3,370 | | $ | 103,628 |
| Packaging Corp. of America | | 11,420 | | | 120,938 |
| | | | | |
| | | | | $ | 224,566 |
| Electrical Equipment - 0.4% | | | | | |
| General Electric Co. | | 70,462 | | $ | 599,632 |
| | |
| Electronics - 0.3% | | | | | |
| Intel Corp. | | 31,307 | | $ | 398,851 |
| | |
| Energy - Integrated - 3.0% | | | | | |
| Chevron Corp. | | 21,245 | | $ | 1,289,784 |
| ConocoPhillips | | 4,190 | | | 156,496 |
| Exxon Mobil Corp. | | 35,880 | | | 2,436,252 |
| Hess Corp. | | 1,900 | | | 103,911 |
| Marathon Oil Corp. | | 9,040 | | | 210,361 |
| | | | | |
| | | | | $ | 4,196,804 |
| Engineering - Construction - 0.0% | | | | | |
| Foster Wheeler AG (a) | | 4,030 | | $ | 60,611 |
| | |
| Food & Beverages - 0.5% | | | | | |
| Archer Daniels Midland Co. | | 7,840 | | $ | 209,014 |
| General Mills, Inc. | | 1,807 | | | 94,831 |
| J.M. Smucker Co. | | 2,160 | | | 80,179 |
| Pepsi Bottling Group, Inc. | | 17,050 | | | 315,425 |
| | | | | |
| | | | | $ | 699,449 |
22
Portfolio of Investments – continued
| | | | | |
| Issuer | | Shares/Par | | Value ($) |
| | | | | |
| Common Stocks - continued | | | | | |
| Food & Drug Stores - 0.4% | | | | | |
| CVS Caremark Corp. | | 11,800 | | $ | 303,732 |
| Kroger Co. | | 6,190 | | | 127,947 |
| SUPERVALU, Inc. | | 8,560 | | | 133,622 |
| | | | | |
| | | | | $ | 565,301 |
| Forest & Paper Products - 0.7% | | | | | |
| Weyerhaeuser Co. | | 38,878 | | $ | 939,292 |
| | |
| Furniture & Appliances - 0.1% | | | | | |
| Leggett & Platt, Inc. | | 11,430 | | $ | 130,645 |
| Snap-On, Inc. | | 3,060 | | | 72,185 |
| | | | | |
| | | | | $ | 202,830 |
| Gaming & Lodging - 0.2% | | | | | |
| Carnival Corp. | | 4,570 | | $ | 89,389 |
| International Game Technology | | 8,870 | | | 78,233 |
| Royal Caribbean Cruises Ltd. | | 18,751 | | | 112,506 |
| | | | | |
| | | | | $ | 280,128 |
| General Merchandise - 0.4% | | | | | |
| Family Dollar Stores, Inc. | | 4,910 | | $ | 134,730 |
| Macy’s, Inc. | | 16,895 | | | 132,964 |
| Wal-Mart Stores, Inc. | | 6,250 | | | 307,750 |
| | | | | |
| | | | | $ | 575,444 |
| Health Maintenance Organizations - 0.3% | | | | | |
| UnitedHealth Group, Inc. | | 6,640 | | $ | 130,476 |
| WellPoint, Inc. (a) | | 7,810 | | | 264,915 |
| | | | | |
| | | | | $ | 395,391 |
| Insurance - 1.2% | | | | | |
| ACE Ltd. | | 3,247 | | $ | 118,548 |
| Allstate Corp. | | 7,310 | | | 123,027 |
| Ameriprise Financial, Inc. | | 3,730 | | | 59,456 |
| Chubb Corp. | | 2,970 | | | 115,949 |
| IPC Holdings Ltd. | | 5,220 | | | 132,640 |
| Lincoln National Corp. | | 9,160 | | | 78,684 |
| MetLife, Inc. | | 11,702 | | | 216,019 |
| Protective Life Corp. | | 9,320 | | | 35,230 |
| Prudential Financial, Inc. | | 9,030 | | | 148,182 |
| Travelers Cos., Inc. | | 17,250 | | | 623,588 |
| | | | | |
| | | | | $ | 1,651,323 |
23
Portfolio of Investments – continued
| | | | | |
| Issuer | | Shares/Par | | Value ($) |
| | | | | |
| Common Stocks - continued | | | | | |
| Leisure & Toys - 0.1% | | | | | |
| Hasbro, Inc. | | 6,210 | | $ | 142,147 |
| | |
| Machinery & Tools - 0.4% | | | | | |
| Cummins, Inc. | | 4,280 | | $ | 89,024 |
| Eaton Corp. | | 7,930 | | | 286,669 |
| Pitney Bowes, Inc. | | 4,440 | | | 85,648 |
| Timken Co. | | 6,126 | | | 74,615 |
| | | | | |
| | | | | $ | 535,956 |
| Major Banks - 1.9% | | | | | |
| Bank of America Corp. | | 34,266 | | $ | 135,351 |
| Bank of New York Mellon Corp. | | 13,580 | | | 301,069 |
| Goldman Sachs Group, Inc. | | 4,420 | | | 402,574 |
| JPMorgan Chase & Co. | | 41,260 | | | 942,791 |
| PNC Financial Services Group, Inc. | | 9,740 | | | 266,292 |
| State Street Corp. | | 6,660 | | | 168,298 |
| Wells Fargo & Co. | | 36,120 | | | 437,052 |
| | | | | |
| | | | | $ | 2,653,427 |
| Medical & Health Technology & Services - 0.1% | | | | | |
| Omnicare, Inc. | | 3,000 | | $ | 77,790 |
| | |
| Medical Equipment - 0.1% | | | | | |
| Zimmer Holdings, Inc. (a) | | 2,770 | | $ | 97,005 |
| | |
| Metals & Mining - 0.2% | | | | | |
| Cliffs Natural Resources, Inc. | | 3,700 | | $ | 57,091 |
| Freeport-McMoRan Copper & Gold, Inc. | | 6,020 | | | 183,128 |
| Nucor Corp. | | 1,721 | | | 57,912 |
| | | | | |
| | | | | $ | 298,131 |
| Natural Gas - Distribution - 0.2% | | | | | |
| Questar Corp. | | 8,970 | | $ | 258,605 |
| | |
| Natural Gas - Pipeline - 0.3% | | | | | |
| El Paso Corp. | | 30,070 | | $ | 202,972 |
| Williams Cos., Inc. | | 20,959 | | | 236,837 |
| | | | | |
| | | | | $ | 439,809 |
| Oil Services - 0.1% | | | | | |
| Diamond Offshore Drilling, Inc. | | 1,460 | | $ | 91,454 |
| Nabors Industries Ltd. (a) | | 8,960 | | | 87,002 |
| | | | | |
| | | | | $ | 178,456 |
24
Portfolio of Investments – continued
| | | | | |
| Issuer | | Shares/Par | | Value ($) |
| | | | | |
| Common Stocks - continued | | | | | |
| Other Banks & Diversified Financials - 0.3% | | | | | |
| Discover Financial Services | | 10,500 | | $ | 60,165 |
| New York Community Bancorp, Inc. | | 24,750 | | | 243,788 |
| TCF Financial Corp. | | 12,370 | | | 151,656 |
| | | | | |
| | | | | $ | 455,609 |
| Personal Computers & Peripherals - 0.1% | | | | | |
| NetApp, Inc. (a) | | 9,430 | | $ | 126,739 |
| | |
| Pharmaceuticals - 2.0% | | | | | |
| Bristol-Myers Squibb Co. | | 10,706 | | $ | 197,097 |
| Eli Lilly & Co. | | 2,702 | | | 79,385 |
| Johnson & Johnson | | 16,930 | | | 846,500 |
| Merck & Co., Inc. | | 18,283 | | | 442,449 |
| Pfizer, Inc. | | 59,180 | | | 728,506 |
| Wyeth | | 11,060 | | | 451,469 |
| | | | | |
| | | | | $ | 2,745,406 |
| Printing & Publishing - 0.0% | | | | | |
| American Media, Inc. | | 4,358 | | $ | 9,326 |
| | |
| Real Estate - 11.2% | | | | | |
| Alexandria Real Estate Equities, Inc., REIT | | 12,012 | | $ | 480,000 |
| Atrium European Real Estate Ltd. (a) | | 27,743 | | | 49,240 |
| AvalonBay Communities, Inc., REIT | | 18,329 | | | 777,516 |
| British Land Co. PLC, REIT | | 52,127 | | | 339,726 |
| Brixton PLC, REIT | | 145,524 | | | 80,418 |
| CapitaLand Ltd. | | 116,410 | | | 146,819 |
| Digital Realty Trust, Inc., REIT | | 18,884 | | | 564,443 |
| Douglas Emmett, Inc., REIT | | 93,963 | | | 706,602 |
| EastGroup Properties, Inc., REIT | | 34,241 | | | 841,986 |
| Equity Residential, REIT | | 52,641 | | | 926,482 |
| Federal Realty Investment Trust, REIT | | 21,838 | | | 898,197 |
| Hammerson PLC, REIT | | 28,753 | | | 99,529 |
| HCP, Inc., REIT | | 39,345 | | | 718,833 |
| Highwoods Properties, Inc., REIT | | 30,080 | | | 568,211 |
| Kimco Realty Corp., REIT | | 72,051 | | | 637,651 |
| Lexington Corporate Properties Trust, REIT | | 185,169 | | | 596,244 |
| Medical Properties Trust, Inc., REIT | | 244,597 | | | 853,644 |
| Mitsubishi Estate Co. Ltd. | | 15,692 | | | 156,633 |
| Plum Creek Timber Co., Inc., REIT | | 36,680 | | | 962,116 |
| Public Storage, Inc., REIT | | 21,216 | | | 1,177,064 |
| Simon Property Group, Inc., REIT | | 35,909 | | | 1,188,588 |
25
Portfolio of Investments – continued
| | | | | |
| Issuer | | Shares/Par | | Value ($) |
| | | | | |
| Common Stocks - continued | | | | | |
| Real Estate - continued | | | | | |
| SL Green Realty Corp., REIT | | 52,442 | | $ | 609,376 |
| Ventas, Inc., REIT | | 48,576 | | | 1,047,784 |
| Vornado Realty Trust, REIT | | 28,160 | | | 921,677 |
| Wereldhave N.V., REIT | | 4,255 | | | 288,297 |
| | | | | |
| | | | | $ | 15,637,076 |
| Restaurants - 0.2% | | | | | |
| Darden Restaurants, Inc. | | 6,212 | | $ | 168,594 |
| SYSCO Corp. | | 3,960 | | | 85,140 |
| | | | | |
| | | | | $ | 253,734 |
| Specialty Chemicals - 0.2% | | | | | |
| Cytec Industries, Inc. | | 6,140 | | $ | 94,556 |
| Valspar Corp. | | 9,730 | | | 162,491 |
| | | | | |
| | | | | $ | 257,047 |
| Specialty Stores - 0.3% | | | | | |
| Home Depot, Inc. | | 5,040 | | $ | 105,286 |
| Lowe’s Cos., Inc. | | 10,170 | | | 161,093 |
| Nordstrom, Inc. | | 8,520 | | | 114,764 |
| | | | | |
| | | | | $ | 381,143 |
| Telephone Services - 1.6% | | | | | |
| AT&T, Inc. | | 44,610 | | $ | 1,060,380 |
| Embarq Corp. | | 5,389 | | | 188,453 |
| Frontier Communications Corp. | | 10,770 | | | 77,544 |
| Qwest Communications International, Inc. | | 29,760 | | | 100,886 |
| Verizon Communications, Inc. | | 26,280 | | | 749,768 |
| Virgin Media, Inc. | | 25,310 | | | 120,982 |
| | | | | |
| | | | | $ | 2,298,013 |
| Tobacco - 0.3% | | | | | |
| Altria Group, Inc. | | 14,220 | | $ | 219,557 |
| Philip Morris International, Inc. | | 3,580 | | | 119,823 |
| Reynolds American, Inc. | | 2,560 | | | 85,965 |
| | | | | |
| | | | | $ | 425,345 |
| Trucking - 0.2% | | | | | |
| FedEx Corp. | | 2,830 | | $ | 122,284 |
| United Parcel Service, Inc., “B” | | 3,320 | | | 136,718 |
| | | | | |
| | | | | $ | 259,002 |
26
Portfolio of Investments – continued
| | | | | | |
| Issuer | | Shares/Par | | Value ($) |
| | | | | | |
| Common Stocks - continued | | | | | | |
| Utilities - Electric Power - 1.5% | | | | | | |
| American Electric Power Co., Inc. | | | 13,121 | | $ | 368,044 |
| Duke Energy Corp. | | | 20,200 | | | 272,094 |
| Edison International | | | 16,300 | | | 443,686 |
| FirstEnergy Corp. | | | 10,040 | | | 427,302 |
| FPL Group, Inc. | | | 3,480 | | | 157,748 |
| NRG Energy, Inc. (a) | | | 3,750 | | | 70,875 |
| PG&E Corp. | | | 3,350 | | | 128,037 |
| Public Service Enterprise Group, Inc. | | | 8,280 | | | 225,961 |
| | | | | | |
| | | | | | $ | 2,093,747 |
| Total Common Stocks (Identified Cost, $71,415,476) | | | | | $ | 43,834,513 |
| | |
| Floating Rate Loans - 2.2% (g)(r) | | | | | | |
| Aerospace - 0.2% | | | | | | |
| Hawker Beechcraft Acquisition Co., Letter of Credit, 3.45%, 2014 | | $ | 21,553 | | $ | 9,902 |
| Hawker Beechcraft Acquisition Co., Term Loan B, 2.8%, 2014 | | | 466,164 | | | 214,176 |
| | | | | | |
| | | | | | $ | 224,078 |
| Automotive - 0.4% | | | | | | |
| Federal Mogul Corp., Term Loan B, 2.35%, 2015 | | $ | 227,298 | | $ | 106,830 |
| Ford Motor Co., Term Loan B, 5%, 2013 | | | 872,959 | | | 278,983 |
| General Motors Corp., Term Loan B, 4.14%, 2013 | | | 358,549 | | | 128,437 |
| Mark IV Industries, Inc., Second Lien Term Loan, 10.38%, 2011 | | | 297,043 | | | 8,911 |
| | | | | | |
| | | | | | $ | 523,161 |
| Broadcasting - 0.1% | | | | | | |
| Gray Television, Inc., Term Loan B, 2.51%, 2014 (o) | | $ | 119,922 | | $ | 60,201 |
| Young Broadcasting, Inc., Term Loan B, 4.74%, 2012 (d) | | | 157,214 | | | 58,719 |
| Young Broadcasting, Inc., Term Loan B-1, 4.74%, 2012 (d) | | | 145,505 | | | 54,346 |
| | | | | | |
| | | | | | $ | 173,266 |
| Building - 0.0% | | | | | | |
| Building Materials Corp., Term Loan B, 3.87%, 2014 | | $ | 33,242 | | $ | 22,660 |
| | |
| Business Services - 0.3% | | | | | | |
| First Data Corp., Term Loan B-1, 3.22%, 2014 | | $ | 589,169 | | $ | 386,716 |
| | |
| Cable TV - 0.1% | | | | | | |
Charter Communications Operating LLC, Term Loan B,
3.21%, 2014 (o) | | $ | 163,775 | | $ | 129,997 |
| | |
| Consumer Goods & Services - 0.1% | | | | | | |
| KAR Holdings, Inc., Term Loan, 3.25%, 2013 | | $ | 178,650 | | $ | 120,192 |
27
Portfolio of Investments – continued
| | | | | | |
| Issuer | | Shares/Par | | Value ($) |
| | | | | | |
| Floating Rate Loans (g)(r) - continued | | | | | | |
| Electronics - 0.0% | | | | | | |
| Freescale Semiconductor, Inc., Term Loan B, 3.93%, 2013 | | $ | 99,757 | | $ | 43,109 |
| | |
| Forest & Paper Products - 0.1% | | | | | | |
| Abitibi-Consolidated, Inc., Term Loan, 11.5%, 2009 | | $ | 148,613 | | $ | 108,190 |
| | |
| Gaming & Lodging - 0.0% | | | | | | |
Green Valley Ranch Gaming LLC, Second Lien Term Loan,
3.69%, 2014 | | $ | 302,859 | | $ | 15,143 |
| | |
| Industrial - 0.1% | | | | | | |
| Oshkosh Truck, Term Loan B, 2013 (o) | | $ | 134,299 | | $ | 94,010 |
| | |
| Medical & Health Technology & Services - 0.3% | | | | | | |
| Community Health Systems, Inc., Term Loan, 3.43%, 2014 | | $ | 102,256 | | $ | 86,581 |
| Community Health Systems, Inc., Term Loan B, 2.72%, 2014 | | | 5,230 | | | 4,428 |
| HCA, Inc., Term Loan B, 3.7%, 2013 | | | 418,582 | | | 352,830 |
| | | | | | |
| | | | | | $ | 443,839 |
| Printing & Publishing - 0.1% | | | | | | |
| Nielsen Co., Term Loan, 2.44%, 2013 | | $ | 178,249 | | $ | 139,851 |
| Tribune Co., Term Loan B, 2014 | | | 346,192 | | | 68,249 |
| | | | | | |
| | | | | | $ | 208,100 |
| Specialty Chemicals - 0.0% | | | | | | |
| Lyondell Basell, Term Loan B-2, 6%, 2014 | | $ | 143,186 | | $ | 29,890 |
| Lyondell Basell, Term Loan B-2, 2014 (o) | | | 111,276 | | | 20,586 |
| | | | | | |
| | | | | | $ | 50,476 |
| Specialty Stores - 0.0% | | | | | | |
| Michaels Stores, Inc., Term Loan B, 2.76%, 2013 | | $ | 70,616 | | $ | 39,486 |
| | |
| Utilities - Electric Power - 0.4% | | | | | | |
| Calpine Corp., Term Loan, 4.33%, 2014 | | $ | 214,194 | | $ | 155,367 |
| NRG Energy, Inc., Letter of Credit, 1.35%, 2013 | | | 69,362 | | | 63,692 |
| NRG Energy, Inc., Term Loan B, 2.67%, 2013 | | | 141,149 | | | 129,611 |
| TXU Corp. Term Loan B-3, 3.95%, 2014 | | | 377,952 | | | 235,748 |
| | | | | | |
| | | | | | $ | 584,418 |
| Total Floating Rate Loans (Identified Cost, $5,483,582) | | | | | $ | 3,166,841 |
| | |
| Preferred Stocks - 0.1% | | | | | | |
| Automotive - 0.0% | | | | | | |
| Preferred Blocker, Inc., 7% (z) | | | 151 | | $ | 25,783 |
28
Portfolio of Investments – continued
| | | | | |
| Issuer | | Shares/Par | | Value ($) |
| | | | | |
| Preferred Stocks - continued | | | | | |
| Major Banks - 0.1% | | | | | |
| Bank of America Corp., 8.625% | | 14,975 | | $ | 117,554 |
| Total Preferred Stocks (Identified Cost, $490,645) | | | | $ | 143,337 |
| | | | | | | | | |
| | | | |
| | | Strike Price | | First Exercise | | | | |
| Rights - 0.1% | | | | | | | | | |
| Real Estate - 0.1% | | | | | | | | | |
| CapitaLand Ltd. (1 share for 1 right) (a) | | SGD 1.30 | | 2/26/09 | | 58,205 | | $ | 22,940 |
| Hammerson PLC (1 share for 1 right) (a) | | GBP 1.50 | | 2/26/09 | | 40,254 | | | 52,729 |
| Total Rights (Identified Cost, $0) | | | | $ | 75,669 |
| | | |
| Money Market Funds (v) - 1.8% | | | | | | | |
MFS Institutional Money Market Portfolio, 0.44%,
at Cost and Net Asset Value | | 2,507,238 | | $ | 2,507,238 |
| | |
| Collateral for Securities Loaned - 0.1% | | | | | |
| Morgan Stanley Repurchase Agreement, 0.23%, dated 2/27/09, due 3/02/09, total to be received $82,152 (secured by U.S. Treasury and Federal Agency obligations and Mortgage Backed securities valued at $83,796 in a jointly traded account), at Cost and Net Asset Value | | 82,150 | | $ | 82,150 |
| Total Investments (Identified Cost, $184,741,045) | | | | $ | 136,657,543 |
| | | |
| Other Assets, Less Liabilities - 2.0% | | | | | | | 2,732,422 |
| Net Assets - 100.0% | | | | | | | | $ | 139,389,965 |
| (a) | Non-income producing security. |
| (d) | Non-income producing security – in default. |
| (f) | All or a portion of the security has been segregated as collateral for open futures contracts. |
| (g) | The rate shown represents a weighted average coupon rate on settled positions at period end, unless otherwise indicated. |
| (l) | All or a portion of this security is on loan. |
| (n) | Securities exempt from registration under Rule 144A of the Securities Act of 1933. These securities may be sold in the ordinary course of business in transactions exempt from registration, normally to qualified institutional buyers. At period end, the aggregate value of these securities was $4,669,641, representing 3.4% of net assets. |
| (o) | All or a portion of this position has not settled. Upon settlement date, interest rates for unsettled amounts will be determined. The rate shown represents the weighted average coupon rate for settled amounts. |
| (p) | Payment-in-kind security. |
| (r) | Remaining maturities of floating rate loans may be less than stated maturities shown as a result of contractual or optional prepayments by the borrower. Such prepayments cannot be predicted with certainty. These loans may be subject to restrictions on resale. Floating rate loans generally have rates of interest which are determined periodically by reference to a base lending rate plus a premium. |
| (v) | Underlying fund that is available only to investment companies managed by MFS. The rate quoted is the annualized seven-day yield of the fund at period end. |
29
Portfolio of Investments – continued
| (z) | Restricted securities are not registered under the Securities Act of 1933 and are subject to legal restrictions on resale. These securities generally may be resold in transactions exempt from registration or to the public if the securities are subsequently registered. Disposal of these securities may involve time-consuming negotiations and prompt sale at an acceptable price may be difficult. The fund holds the following restricted securities: |
| | | | | | |
| Restricted Securities | | Acquisition
Date | | Cost | | Current
Market
Value |
| American Media Operations, Inc., 14%, 2013 | | 1/30/09 | | $115,602 | | $114,790 |
| American Media Operations, Inc., 9%, 2013 | | 1/30/09 | | 13,460 | | 13,357 |
| Bonten Media Acquisition Co., 9%, 2015 | | 5/22/07-5/31/07 | | 285,564 | | 62,700 |
| CSC Holdings, Inc., 8.5%, 2014 | | 1/08/09 | | 66,816 | | 72,000 |
Firekeepers Development Authority,
13.875%, 2015 | | 4/22/08 | | 139,614 | | 91,350 |
| Forest Oil Corp., 8.5%, 2014 | | 2/11/09 | | 71,381 | | 68,250 |
Fresenius Medical Care AG & Co. KGaA,
9%, 2015 | | 1/15/09-2/03/09 | | 174,042 | | 182,000 |
| GMAC Commercial Mortgage Securities, Inc., 6.875%, 2011 | | 12/29/08-1/08/09 | | 621,355 | | 499,966 |
| GMAC Commercial Mortgage Securities, Inc., 6.75%, 2014 | | 2/09/09 | | 144,478 | | 106,828 |
| GMAC Commercial Mortgage Securities, Inc., 7%, 2012 | | 1/23/09 | | 88,973 | | 74,514 |
| GMAC Commercial Mortgage Securities, Inc., 8%, 2031 | | 12/29/09 | | 72,570 | | 54,768 |
| Harrah’s Operating Co., Inc., 10%, 2018 | | 1/30/08-10/03/08 | | 137,366 | | 35,000 |
| Intelsat Jackson Holdings Ltd., 9.5%, 2016 | | 2/27/09 | | 92,425 | | 92,500 |
| LBI Media, Inc., 8.5%, 2017 | | 7/18/07 | | 182,278 | | 55,500 |
| Local TV Finance LLC, 9.25%, 2015 | | 11/09/07-9/08/08 | | 432,557 | | 45,563 |
| Petrohawk Energy Corp., 10.5%, 2014 | | 1/22/09-2/10/09 | | 126,554 | | 132,975 |
| Preferred Blocker, Inc., 7% (Preferred Stock) | | 12/29/08 | | 116,270 | | 25,783 |
| Republic of Indonesia, 10.375%, 2014 | | 2/26/09 | | 107,411 | | 107,858 |
| USI Holdings Corp., 9.75%, 2015 | | 4/26/07-11/28/07 | | 197,796 | | 90,713 |
| Wind Acquisition Finance S.A., 10.75%, 2015 | | 9/12/06-3/19/08 | | 781,506 | | 751,875 |
| Total Restricted Securities | | | | | | $2,678,290 |
| % of Net Assets | | | | | | 1.9% |
The following abbreviations are used in this report and are defined:
| FRN | | Floating Rate Note. Interest rate resets periodically and may not be the rate reported at period end. |
| REIT | | Real Estate Investment Trust |
| STRIPS | | Separate Trading of Registered Interest and Principal of Securities |
| | |
| Insurers |
| FSA | | Financial Security Assurance Inc. |
30
Portfolio of Investments – continued
Abbreviations indicate amounts shown in currencies other than the U.S. dollar. All amounts are stated in U.S. dollars unless otherwise indicated. A list of abbreviations is shown below:
Derivative Contracts at 2/28/09
Forward Foreign Currency Exchange Contracts Outstanding at 2/28/09
| | | | | | | | | | | | |
| Type | | Currency | | Contracts to
Deliver/Receive | | Settlement
Date Range | | In Exchange
for | | Contracts
at Value | | Net
Unrealized
Appreciation
(Depreciation) |
| Appreciation | | | | | | | | | | | | |
SELL | | EUR | | 459,147 | | 5/20/09 | | $591,519 | | $581,946 | | $9,573 |
Futures contracts outstanding at 2/28/09
| | | | | | | | | |
| Description | | Contracts | | Value | | Expiration
Date | | Unrealized
Appreciation
(Depreciation) | |
| U.S. Treasury Bond (Long) | | 4 | | $493,375 | | Jun-09 | | $(13,483 | ) |
| U.S. Treasury Note 2 yr (Long) | | 10 | | 2,166,094 | | Jun-09 | | 746 | |
| U.S. Treasury Note 5 yr (Long) | | 15 | | 1,748,789 | | Jun-09 | | (4,505 | ) |
| U.S. Treasury Note 10 yr (Short) | | 16 | | 1,920,500 | | Jun-09 | | 21,069 | |
| | | | | | | | $3,827 | |
| | | | | | | | | |
At February 28, 2009, the fund had sufficient cash and/or other liquid securities to cover any commitments under these derivative contracts.
See Notes to Financial Statements
31
Financial Statements
STATEMENT OF ASSETS AND LIABILITIES
At 2/28/09
This statement represents your fund’s balance sheet, which details the assets and liabilities comprising the total value of the fund.
| | | | | |
| Assets | | | | | |
Investments- | | | | | |
Non-affiliated issuers, at value (identified cost, $182,233,807) | | $134,150,305 | | | |
Underlying funds, at cost and value | | 2,507,238 | | | |
Total investments, at value, including $72,618 of securities on loan (identified cost, $184,741,045) | | | | | $136,657,543 |
Receivable for forward foreign currency exchange contracts | | 9,573 | | | |
Receivable for investments sold | | 3,485,154 | | | |
Receivable for fund shares sold | | 73,259 | | | |
Interest and dividends receivable | | 1,929,655 | | | |
Receivable from investment adviser | | 44,248 | | | |
Other assets | | 2,954 | | | |
Total assets | | | | | $142,202,386 |
| Liabilities | | | | | |
Payable to custodian | | $148 | | | |
Distributions payable | | 164,611 | | | |
Payable for daily variation margin on open futures contracts | | 4,471 | | | |
Payable for investments purchased | | 1,321,379 | | | |
Payable for fund shares reacquired | | 1,081,382 | | | |
Collateral for securities loaned, at value | | 82,150 | | | |
Payable to affiliates | | | | | |
Management fee | | 7,532 | | | |
Shareholder servicing costs | | 45,838 | | | |
Distribution and service fees | | 6,165 | | | |
Administrative services fee | | 290 | | | |
Payable for independent trustees’ compensation | | 1,413 | | | |
Accrued expenses and other liabilities | | 97,042 | | | |
Total liabilities | | | | | $2,812,421 |
Net assets | | | | | $139,389,965 |
| Net assets consist of | | | | | |
Paid-in capital | | $229,805,416 | | | |
Unrealized appreciation (depreciation) on investments and translation of assets and liabilities in foreign currencies | | (48,070,231 | ) | | |
Accumulated net realized gain (loss) on investments and foreign currency transactions | | (42,581,967 | ) | | |
Undistributed net investment income | | 236,747 | | | |
Net assets | | | | | $139,389,965 |
Shares of beneficial interest outstanding | | | | | 20,258,802 |
32
Statement of Assets and Liabilities – continued
| | | | |
Class A shares | | | | |
Net assets | | $91,445,403 | | |
Shares outstanding | | 13,287,874 | | |
Net asset value per share | | | | $6.88 |
Offering price per share (100/95.25 × net asset value per share) | | | | $7.22 |
Class C shares | | | | |
Net assets | | $46,617,177 | | |
Shares outstanding | | 6,778,022 | | |
Net asset value and offering price per share | | | | $6.88 |
Class I shares | | | | |
Net assets | | $1,036,225 | | |
Shares outstanding | | 150,565 | | |
Net asset value, offering price, and redemption price per share | | | | $6.88 |
Class R1 shares | | | | |
Net assets | | $72,517 | | |
Shares outstanding | | 10,550 | | |
Net asset value, offering price, and redemption price per share | | | | $6.87 |
Class R2 shares | | | | |
Net assets | | $72,760 | | |
Shares outstanding | | 10,586 | | |
Net asset value, offering price, and redemption price per share | | | | $6.87 |
Class R3 shares | | | | |
Net assets | | $72,882 | | |
Shares outstanding | | 10,593 | | |
Net asset value, offering price, and redemption price per share | | | | $6.88 |
Class R4 shares | | | | |
Net assets | | $73,001 | | |
Shares outstanding | | 10,612 | | |
Net asset value, offering price, and redemption price per share | | | | $6.88 |
On sales of $50,000 or more, the offering price of Class A shares is reduced. A contingent deferred sales charge may be imposed on redemptions of Class A and Class C shares.
See Notes to Financial Statements
33
Financial Statements
STATEMENT OF OPERATIONS
Year ended 2/28/09
This statement describes how much your fund earned in investment income and accrued in expenses. It also describes any gains and/or losses generated by fund operations.
| | | | | | |
| Net investment income | | | | | | |
Income | | | | | | |
Interest | | $10,068,523 | | | | |
Dividends | | 2,703,963 | | | | |
Dividends from underlying funds | | 129,584 | | | | |
Total investment income | | | | | $12,902,070 | |
Expenses | | | | | | |
Management fee | | $1,354,158 | | | | |
Distribution and service fees | | 1,105,407 | | | | |
Shareholder servicing costs | | 223,444 | | | | |
Administrative services fee | | 40,929 | | | | |
Independent trustees’ compensation | | 11,594 | | | | |
Custodian fee | | 63,154 | | | | |
Shareholder communications | | 39,770 | | | | |
Auditing fees | | 55,707 | | | | |
Legal fees | | 6,813 | | | | |
Miscellaneous | | 137,097 | | | | |
Total expenses | | | | | $3,038,073 | |
Fees paid indirectly | | (2,036 | ) | | | |
Reduction of expenses by investment adviser | | (572,718 | ) | | | |
Net expenses | | | | | $2,463,319 | |
Net investment income | | | | | $10,438,751 | |
Realized and unrealized gain (loss) on investments
and foreign currency transactions | | | | | | |
Realized gain (loss) (identified cost basis) | | | | | | |
Investment transactions | | $(36,533,119 | ) | | | |
Futures contracts | | 101,765 | | | | |
Foreign currency transactions | | 59,264 | | | | |
Net realized gain (loss) on investments and foreign currency transactions | | | | | $(36,372,090 | ) |
Change in unrealized appreciation (depreciation) | | | | | | |
Investments | | $(34,854,925 | ) | | | |
Futures contracts | | 43,689 | | | | |
Translation of assets and liabilities in foreign currencies | | 16,049 | | | | |
Net unrealized gain (loss) on investments and foreign currency translation | | | | | $(34,795,187 | ) |
Net realized and unrealized gain (loss) on investments and foreign currency | | | | | $(71,167,277 | ) |
Change in net assets from operations | | | | | $(60,728,526 | ) |
See Notes to Financial Statements
34
Financial Statements
STATEMENTS OF CHANGES IN NET ASSETS
These statements describe the increases and/or decreases in net assets resulting from operations, any distributions, and any shareholder transactions.
| | | | | | |
| | | Year ended
2/28/09 | | | Year ended
2/29/08 | |
| Change in net assets | | | | | | |
| From operations | | | | | | |
Net investment income | | $10,438,751 | | | $11,606,470 | |
Net realized gain (loss) on investments and
foreign currency transactions | | (36,372,090 | ) | | (2,619,736 | ) |
Net unrealized gain (loss) on investments and
foreign currency translation | | (34,795,187 | ) | | (19,650,593 | ) |
Change in net assets from operations | | $(60,728,526 | ) | | $(10,663,859 | ) |
| Distributions declared to shareholders | | | | | | |
From net investment income | | | | | | |
Class A | | $(7,389,821 | ) | | $(8,674,678 | ) |
Class C | | (3,219,569 | ) | | (3,283,944 | ) |
Class I | | (75,606 | ) | | (102,874 | ) |
Class R1 (i) | | (3,045 | ) | | — | |
Class R2 (i) | | (3,344 | ) | | — | |
Class R3 (i) | | (3,496 | ) | | — | |
Class R4 (i) | | (3,642 | ) | | — | |
From net realized gain on investments | | | | | | |
Class A | | (201,107 | ) | | (1,838,588 | ) |
Class C | | (101,612 | ) | | (830,763 | ) |
Class I | | (1,840 | ) | | (19,205 | ) |
Total distributions declared to shareholders | | $(11,003,082 | ) | | $(14,750,052 | ) |
Change in net assets from fund share transactions | | $(39,417,237 | ) | | $52,730,434 | |
Total change in net assets | | $(111,148,845 | ) | | $27,316,523 | |
| Net assets | | | | | | |
At beginning of period | | 250,538,810 | | | 223,222,287 | |
At end of period (including undistributed net investment income of $236,747 and $87,912, respectively) | | $139,389,965 | | | $250,538,810 | |
| (i) | For the period from the class’ inception, July 1, 2008 (Classes R1, R2, R3, and R4), through the stated period end. |
See Notes to Financial Statements
35
Financial Statements
FINANCIAL HIGHLIGHTS
The financial highlights table is intended to help you understand the fund’s financial performance for the past 5 years (or life of a particular share class, if shorter). Certain information reflects financial results for a single fund share. The total returns in the table represent the rate by which an investor would have earned (or lost) on an investment in the fund share class (assuming reinvestment of all distributions) held for the entire period.
| | | | | | | | | |
| Class A | | Years ended 2/29, 2/28 | |
| | | 2009 | | | 2008 | | | 2007 (c) | |
Net asset value, beginning of period | | $10.04 | | | $10.95 | | | $10.00 | |
| Income (loss) from investment operations | | | | | | | | | |
Net investment income (d) | | $0.47 | | | $0.47 | | | $0.37 | |
Net realized and unrealized gain (loss) on investments
and foreign currency | | (3.13 | ) | | (0.80 | ) | | 0.93 | |
Total from investment operations | | $(2.66 | ) | | $(0.33 | ) | | $1.30 | |
| Less distributions declared to shareholders | | | | | | | | | |
From net investment income | | $(0.49 | ) | | $(0.48 | ) | | $(0.35 | ) |
From net realized gain on investments | | (0.01 | ) | | (0.10 | ) | | (0.00 | )(w) |
Total distributions declared to shareholders | | $(0.50 | ) | | $(0.58 | ) | | $(0.35 | ) |
Net asset value, end of period | | $6.88 | | | $10.04 | | | $10.95 | |
Total return (%) (r)(s)(t) | | (27.43 | ) | | (3.18 | ) | | 13.20 | (n) |
| Ratios (%) (to average net assets) and Supplemental data: | | | | | | | | | |
Expenses before expense reductions (f) | | 1.23 | | | 1.18 | | | 1.36 | (a) |
Expenses after expense reductions (f) | | 0.95 | | | 0.95 | | | 0.95 | (a) |
Net investment income | | 5.23 | | | 4.35 | | | 4.45 | (a) |
Portfolio turnover | | 80 | | | 89 | | | 46 | |
Net assets at end of period (000 Omitted) | | $91,445 | | | $166,546 | | | $156,447 | |
See Notes to Financial Statements
36
Financial Highlights – continued
| | | | | | | | | |
| Class C | | Years ended 2/29, 2/28 | |
| | | 2009 | | | 2008 | | | 2007 (c) | |
Net asset value, beginning of period | | $10.03 | | | $10.94 | | | $10.00 | |
| Income (loss) from investment operations | | | | | | | | | |
Net investment income (d) | | $0.41 | | | $0.39 | | | $0.30 | |
Net realized and unrealized gain (loss) on investments
and foreign currency | | (3.13 | ) | | (0.80 | ) | | 0.93 | |
Total from investment operations | | $(2.72 | ) | | $(0.41 | ) | | $1.23 | |
| Less distributions declared to shareholders | | | | | | | | | |
From net investment income | | $(0.42 | ) | | $(0.40 | ) | | $(0.29 | ) |
From net realized gain on investments | | (0.01 | ) | | (0.10 | ) | | (0.00 | )(w) |
Total distributions declared to shareholders | | $(0.43 | ) | | $(0.50 | ) | | $(0.29 | ) |
Net asset value, end of period | | $6.88 | | | $10.03 | | | $10.94 | |
Total return (%) (r)(s)(t) | | (27.88 | ) | | (3.87 | ) | | 12.51 | (n) |
| Ratios (%) (to average net assets) and Supplemental data: | | | | | | | | | |
Expenses before expense reductions (f) | | 1.93 | | | 1.89 | | | 2.01 | (a) |
Expenses after expense reductions (f) | | 1.65 | | | 1.65 | | | 1.65 | (a) |
Net investment income | | 4.54 | | | 3.64 | | | 3.67 | (a) |
Portfolio turnover | | 80 | | | 89 | | | 46 | |
Net assets at end of period (000 Omitted) | | $46,617 | | | $82,486 | | | $64,316 | |
| | | | | | | | | |
| Class I | | Years ended 2/29, 2/28 | |
| | | 2009 | | | 2008 | | | 2007 (c) | |
Net asset value, beginning of period | | $10.04 | | | $10.95 | | | $10.00 | |
| Income (loss) from investment operations | | | | | | | | | |
Net investment income (d) | | $0.50 | | | $0.51 | | | $0.41 | |
Net realized and unrealized gain (loss) on investments
and foreign currency | | (3.14 | ) | | (0.81 | ) | | 0.91 | |
Total from investment operations | | $(2.64 | ) | | $(0.30 | ) | | $1.32 | |
| Less distributions declared to shareholders | | | | | | | | | |
From net investment income | | $(0.51 | ) | | $(0.51 | ) | | $(0.37 | ) |
From net realized gain on investments | | (0.01 | ) | | (0.10 | ) | | (0.00 | )(w) |
Total distributions declared to shareholders | | $(0.52 | ) | | $(0.61 | ) | | $(0.37 | ) |
Net asset value, end of period | | $6.88 | | | $10.04 | | | $10.95 | |
Total return (%) (r)(s) | | (27.21 | ) | | (2.89 | ) | | 13.45 | (n) |
| Ratios (%) (to average net assets) and Supplemental data: | | | | | | | | | |
Expenses before expense reductions (f) | | 0.93 | | | 0.88 | | | 1.29 | (a) |
Expenses after expense reductions (f) | | 0.65 | | | 0.65 | | | 0.65 | (a) |
Net investment income | | 5.56 | | | 4.67 | | | 4.84 | (a) |
Portfolio turnover | | 80 | | | 89 | | | 46 | |
Net assets at end of period (000 Omitted) | | $1,036 | | | $1,507 | | | $2,459 | |
See Notes to Financial Statements
37
Financial Highlights – continued
| | | |
| Class R1 | | Year ended
2/28/09 (i) | |
Net asset value, beginning of period | | $9.83 | |
| Income (loss) from investment operations | | | |
Net investment income (d) | | $0.27 | |
Net realized and unrealized gain (loss) on investments and foreign currency | | (2.94 | ) |
Total from investment operations | | $(2.67 | ) |
| Less distributions declared to shareholders | | | |
From net investment income | | $(0.29 | ) |
Net asset value, end of period | | $6.87 | |
Total return (%) (r)(s) | | (27.52 | )(n) |
| Ratios (%) (to average net assets) and Supplemental data: | | | |
Expenses before expense reductions (f) | | 1.97 | (a) |
Expenses after expense reductions (f) | | 1.65 | (a) |
Net investment income | | 4.76 | (a) |
Portfolio turnover | | 80 | |
Net assets at end of period (000 Omitted) | | $73 | |
| | | |
| Class R2 | | Year ended
2/28/09 (i) | |
Net asset value, beginning of period | | $9.83 | |
| Income (loss) from investment operations | | | |
Net investment income (d) | | $0.29 | |
Net realized and unrealized gain (loss) on investments and foreign currency | | (2.93 | ) |
Total from investment operations | | $(2.64 | ) |
| Less distributions declared to shareholders | | | |
From net investment income | | $(0.32 | ) |
Net asset value, end of period | | $6.87 | |
Total return (%) (r)(s) | | (27.27 | )(n) |
| Ratios (%) (to average net assets) and Supplemental data: | | | |
Expenses before expense reductions (f) | | 1.48 | (a) |
Expenses after expense reductions (f) | | 1.15 | (a) |
Net investment income | | 5.26 | (a) |
Portfolio turnover | | 80 | |
Net assets at end of period (000 Omitted) | | $73 | |
See Notes to Financial Statements
38
Financial Highlights – continued
| | | |
| Class R3 | | Year ended
2/28/09 (i) | |
Net asset value, beginning of period | | $9.84 | |
| Income (loss) from investment operations | | | |
Net investment income (d) | | $0.31 | |
Net realized and unrealized gain (loss) on investments and foreign currency | | (2.93 | ) |
Total from investment operations | | $(2.62 | ) |
| Less distributions declared to shareholders | | | |
From net investment income | | $(0.34 | ) |
Net asset value, end of period | | $6.88 | |
Total return (%) (r)(s) | | (27.12 | )(n) |
| Ratios (%) (to average net assets) and Supplemental data: | | | |
Expenses before expense reductions (f) | | 1.22 | (a) |
Expenses after expense reductions (f) | | 0.90 | (a) |
Net investment income | | 5.49 | (a) |
Portfolio turnover | | 80 | |
Net assets at end of period (000 Omitted) | | $73 | |
| | | |
| Class R4 | | Year ended
2/28/09 (i) | |
Net asset value, beginning of period | | $9.84 | |
| Income (loss) from investment operations | | | |
Net investment income (d) | | $0.32 | |
Net realized and unrealized gain (loss) on investments and foreign currency | | (2.93 | ) |
Total from investment operations | | $(2.61 | ) |
| Less distributions declared to shareholders | | | |
From net investment income | | $(0.35 | ) |
Net asset value, end of period | | $6.88 | |
Total return (%) (r)(s) | | (26.99 | )(n) |
| Ratios (%) (to average net assets) and Supplemental data: | | | |
Expenses before expense reductions (f) | | 0.97 | (a) |
Expenses after expense reductions (f) | | 0.65 | (a) |
Net investment income | | 5.76 | (a) |
Portfolio turnover | | 80 | |
Net assets at end of period (000 Omitted) | | $73 | |
See Notes to Financial Statements
39
Financial Highlights – continued
| (c) | For the period from the commencement of the fund’s investment operations, May 26, 2006, through the stated period end. |
| (d) | Per share data is based on average shares outstanding. |
| (f) | Ratios do not reflect reductions from fees paid indirectly, if applicable. |
| (i) | For the period from the class’ inception, July 1, 2008 (Classes R1, R2, R3, and R4) through the stated period end. |
| (r) | Certain expenses have been reduced without which performance would have been lower. |
| (s) | From time to time the fund may receive proceeds from litigation settlements, without which performance would be lower. |
| (t) | Total returns do not include any applicable sales charges. |
| (w) | Per share amount was less than $0.01. |
See Notes to Financial Statements
40
NOTES TO FINANCIAL STATEMENTS
| (1) | | Business and Organization |
MFS Diversified Income Fund (the fund) is a series of MFS Series Trust XIII (the trust). The trust is organized as a Massachusetts business trust and is registered under the Investment Company Act of 1940, as amended, as an open-end management investment company.
| (2) | | Significant Accounting Policies |
General – The preparation of financial statements in conformity with U.S. generally accepted accounting principles requires management to make estimates and assumptions that affect the reported amounts of assets and liabilities, and disclosure of contingent assets and liabilities at the date of the financial statements and the reported amounts of revenues and expenses during the reporting period. Actual results could differ from those estimates. The fund may invest a significant portion of its assets in asset-backed and/or mortgage-backed securities. The value of these securities may depend, in part, on the issuer’s or borrower’s credit quality or ability to pay principal and interest when due and may fall if an issuer or borrower defaults on its obligation to pay principal or interest or if the instrument’s credit rating is downgraded by a credit rating agency. U.S. Government securities not supported as to the payment of principal or interest by the U.S. Treasury, such as those issued by Fannie Mae, Freddie Mac, and the Federal Home Loan Banks, are subject to greater credit risk than are U.S. Government securities supported by the U.S. Treasury, such as those issued by Ginnie Mae. The fund can invest in foreign securities, including securities of emerging market issuers. Investments in foreign securities are vulnerable to the effects of changes in the relative values of the local currency and the U.S. dollar and to the effects of changes in each country’s legal, political, and economic environment. The markets of emerging markets countries are generally more volatile than the markets of developed countries with more mature economies. All of the risks of investing in foreign securities previously described are heightened when investing in emerging markets countries.
Investment Valuations – Equity securities, including restricted equity securities, are generally valued at the last sale or official closing price as provided by a third-party pricing service on the market or exchange on which they are primarily traded. For securities for which there were no sales reported that day, equity securities are generally valued at the last quoted daily bid quotation as provided by a third-party pricing service on the market or exchange on which such securities are primarily traded. For securities held short for which there were no sales reported for that day, the position is generally valued at the last quoted daily ask quotation as provided by a
41
Notes to Financial Statements – continued
third-party pricing service on the market or exchange on which such securities are primarily traded. Debt instruments and floating rate loans (other than short-term instruments), including restricted debt instruments, are generally valued at an evaluated or composite bid as provided by a third-party pricing service. Short-term instruments with a maturity at issuance of 60 days or less generally are valued at amortized cost, which approximates market value. Exchange-traded options are generally valued at the last sale or official closing price as provided by a third-party pricing service on the exchange on which such options are primarily traded. Exchange-traded options for which there were no sales reported that day are generally valued at the last daily bid quotation as provided by a third-party pricing service on the exchange on which such options are primarily traded. Options not traded on an exchange are generally valued at a broker/dealer bid quotation. Foreign currency options are generally valued using an external pricing model that uses market data from a third-party source. Futures contracts are generally valued at last posted settlement price as provided by a third-party pricing service on the market on which they are primarily traded. Futures contracts for which there were no trades that day for a particular position are generally valued at the closing bid quotation as provided by a third-party pricing service on the market on which such futures contracts are primarily traded. Forward foreign currency contracts are generally valued at the mean of bid and asked prices for the time period interpolated from rates provided by a third-party pricing service for proximate time periods. Open-end investment companies are generally valued at net asset value per share. Securities and other assets generally valued on the basis of information from a third-party pricing service may also be valued at a broker/dealer bid quotation. Values obtained from pricing services can utilize both dealer-supplied valuations and electronic data processing techniques, which take into account factors such as institutional-size trading in similar groups of securities, yield, quality, coupon rate, maturity, type of issue, trading characteristics, and other market data. The values of foreign securities and other assets and liabilities expressed in foreign currencies are converted to U.S. dollars using the mean of bid and asked prices for rates provided by a third-party pricing service.
The Board of Trustees has delegated primary responsibility for determining or causing to be determined the value of the fund’s investments (including any fair valuation) to the adviser pursuant to valuation policies and procedures approved by the Board. If the adviser determines that reliable market quotations are not readily available, investments are valued at fair value as determined in good faith by the adviser in accordance with such procedures under the oversight of the Board of Trustees. Under the fund’s valuation policies and procedures, market quotations are not considered to be readily available for most types of debt instruments and floating rate loans and many
42
Notes to Financial Statements – continued
types of derivatives. These investments are generally valued at fair value based on information from third-party pricing services. In addition, investments may be valued at fair value if the adviser determines that an investment’s value has been materially affected by events occurring after the close of the exchange or market on which the investment is principally traded (such as foreign exchange or market) and prior to the determination of the fund’s net asset value, or after the halting of trading of a specific security where trading does not resume prior to the close of the exchange or market on which the security is principally traded. Events that occur on a frequent basis after foreign markets close (such as developments in foreign markets and significant movements in the U.S. markets) and prior to the determination of the fund’s net asset value may be deemed to have a material affect on the value of securities traded in foreign markets. Accordingly, the fund’s foreign equity securities may often be valued at fair value. The adviser generally relies on third-party pricing services or other information (such as the correlation with price movements of similar securities in the same or other markets; the type, cost and investment characteristics of the security; the business and financial condition of the issuer; and trading and other market data) to assist in determining whether to fair value and at what value to fair value an investment. The value of an investment for purposes of calculating the fund’s net asset value can differ depending on the source and method used to determine value. When fair valuation is used, the value of an investment used to determine the fund’s net asset value may differ from quoted or published prices for the same investment. There can be no assurance that the fund could obtain the fair value assigned to an investment if it were to sell the investment at the same time at which the fund determines its net asset value per share.
The fund adopted FASB Statement No. 157, Fair Value Measurements (the “Statement”). This Statement provides a single definition of fair value, a hierarchy for measuring fair value and expanded disclosures about fair value measurements.
Various inputs are used in determining the value of the fund’s assets or liabilities carried at market value. These inputs are categorized into three broad levels. Level 1 includes quoted prices in active markets for identical assets or liabilities. Level 2 includes other significant observable market-based inputs (including quoted prices for similar securities, interest rates, prepayment speed, and credit risk). Level 3 includes unobservable inputs, which may include the adviser’s own assumptions in determining the fair value of investments. Other financial instruments are derivative instruments not reflected in total investments, such as futures, forwards, swap contracts, and written options.
43
Notes to Financial Statements – continued
The following is a summary of the levels used as of February 28, 2009 in valuing the fund’s assets or liabilities carried at market value:
| | | | | | | | |
| | | Level 1 | | Level 2 | | Level 3 | | Total |
| Investments in Securities | | $45,702,523 | | $90,945,694 | | $9,326 | | $136,657,543 |
| Other Financial Instruments | | $3,827 | | $9,573 | | $— | | $13,400 |
Following is a reconciliation of Level 3 assets for which significant unobservable inputs were used to determine fair value. The table presents the activity of Level 3 securities held at the beginning and the end of the period.
| | | | |
| | | Investments in
Securities | | Other Financial
Instruments |
| Balance as of 2/29/08 | | $— | | $— |
| Accrued discounts/premiums | | — | | — |
| Realized gain (loss) | | — | | — |
| Change in unrealized appreciation (depreciation) | | — | | — |
| Net purchases (sales) | | 9,326 | | — |
| Transfers in and/or out of Level 3 | | — | | — |
| Balance as of 2/28/09 | | $9,326 | | $— |
Repurchase Agreements – The fund may enter into repurchase agreements with approved counterparties. Each repurchase agreement is recorded at cost. The fund requires that the securities collateral in a repurchase transaction be transferred to a custodian. The fund monitors, on a daily basis, the value of the collateral to ensure that its value, including accrued interest, is greater than amounts owed to the fund under each such repurchase agreement.
Foreign Currency Translation – Purchases and sales of foreign investments, income, and expenses are converted into U.S. dollars based upon currency exchange rates prevailing on the respective dates of such transactions or on the reporting date for foreign denominated receivables and payables. Gains and losses attributable to foreign currency exchange rates on sales of securities are recorded for financial statement purposes as net realized gains and losses on investments. Gains and losses attributable to foreign exchange rate movements on receivables, payables, income and expenses are recorded for financial statement purposes as foreign currency transaction gains and losses. That portion of both realized and unrealized gains and losses on investments that results from fluctuations in foreign currency exchange rates is not separately disclosed.
Derivative Risk – The fund may invest in derivatives for hedging or non-hedging purposes. While hedging can reduce or eliminate losses, it can also reduce or eliminate gains. When the fund uses derivatives as an investment to gain market exposure, or for hedging purposes, gains and losses from derivative instruments may be substantially greater than the derivative’s original cost. Cash that has been segregated on behalf of certain derivative
44
Notes to Financial Statements – continued
contracts will be reported separately on the Statement of Assets and Liabilities as restricted cash. On some over-the-counter derivatives, the fund attempts to reduce its exposure to counterparty credit risk by entering into an ISDA Master Agreement on a bilateral basis with each of the counterparties with whom it undertakes a significant volume of transactions. The ISDA Master Agreement gives the fund the right, upon an event of default by the applicable counterparty, to close out all transactions traded under such agreement and to net amounts owed under each transaction to one net amount payable by one party to the other. This right to close out and net payments across all transactions traded under the ISDA Master Agreement could result in a reduction of the fund’s credit risk to such counterparty equal to any amounts payable by the fund under the applicable transactions, if any. However, absent an event of default by the counterparty, the ISDA Master Agreement does not result in an offset of reported balance sheet assets and liabilities across transactions between the fund and the applicable counterparty. Derivative instruments include purchased options, futures contracts, and forward foreign currency exchange contracts.
In March 2008, FASB Statement No. 161, Disclosures about Derivative Instruments and Hedging Activities (the “Standard”) was issued, and is effective for financial statements issued for fiscal years and interim periods beginning after November 15, 2008. This Standard provides enhanced disclosures about the fund’s use of and accounting for derivative instruments and the effect of derivative instruments on the fund’s results of operations and financial position. Management is evaluating the application of the Standard to the fund, and has not at this time determined the impact, if any, resulting from the adoption of this Standard on the fund’s financial statements.
FASB Staff Position (FSP) 133-1 was implemented during the period. FSP 133-1 amends FAS 133 to require sellers of credit derivatives to make disclosures that will enable financial statement users to assess the potential effects of those credit derivatives on an entity’s financial position, financial performance and cash flows. There was no impact from implementing FSP 133-1 as the fund did not hold any of these credit derivatives at period end.
Purchased Options – The fund may purchase call or put options for a premium. Purchasing call options may be a hedge against an anticipated increase in the dollar cost of securities to be acquired or to increase the fund’s exposure to the underlying instrument. Purchasing put options may hedge against a decline in the value of portfolio securities. The premium paid is included as an investment in the Statement of Assets and Liabilities and is subsequently adjusted to the current value of the option. Premiums paid for purchased options which have expired are treated as realized losses on investments in the Statement of Operations. Premiums paid for purchased
45
Notes to Financial Statements – continued
options which are exercised or closed are added to the amount paid or offset against the proceeds on the underlying security or financial instrument to determine the realized gain or loss. The risk of loss associated with purchased options is limited to the premium paid.
Futures Contracts – The fund may enter into futures contracts for the delayed delivery of securities or currency, or contracts based on financial indices at a fixed price on a future date. In entering such contracts, the fund is required to deposit with the broker either in cash or securities an amount equal to a certain percentage of the contract amount. Subsequent payments are made or received by the fund each day, depending on the daily fluctuations in the value of the contract, and are recorded for financial statement purposes as unrealized gains or losses by the fund. Upon entering into such contracts, the fund bears the risk of interest or exchange rates or securities prices moving unexpectedly, in which case, the fund may not achieve the anticipated benefits of the futures contracts and may realize a loss.
Forward Foreign Currency Exchange Contracts – The fund may enter into forward foreign currency exchange contracts for the purchase or sale of a specific foreign currency at a fixed price on a future date. Risks may arise upon entering into these contracts from the potential inability of counterparties to meet the terms of their contracts and from unanticipated movements in the value of the contract. The fund may enter into forward foreign currency exchange contracts for hedging purposes as well as for non-hedging purposes. For hedging purposes, the fund may enter into contracts to deliver or receive foreign currency it will receive from or require for its normal investment activities. The fund may also use contracts in a manner intended to protect foreign currency denominated securities from declines in value due to unfavorable exchange rate movements. For non-hedging purposes, the fund may enter into contracts with the intent of changing the relative exposure of the fund’s portfolio of securities to different currencies to take advantage of anticipated changes. The forward foreign currency exchange contracts are adjusted by the daily exchange rate of the underlying currency and any gains or losses are recorded as unrealized until the contract settlement date. On contract settlement date, the gains or losses are recorded as realized gains or losses on foreign currency transactions.
Hybrid Instruments – The fund may invest in indexed or hybrid securities on which any combination of interest payments, the principal or stated amount payable at maturity is determined by reference to prices of other securities, currencies, indices, economic factors or other measures, including interest rates, currency exchange rates, or securities indices. The risks of investing in hybrid instruments reflect a combination of the risks of investing in securities, swaps, options, futures and currencies. Hybrid instruments are potentially
46
Notes to Financial Statements – continued
more volatile and carry greater market risks than traditional debt instruments. Depending on the structure of the particular hybrid instrument, changes in a benchmark, underlying assets or economic indicator may be magnified by the terms of the hybrid instrument and have an even more dramatic and substantial effect upon the value of the hybrid instrument. Also, the prices of the hybrid instrument and the benchmark, underlying asset or economic indicator may not move in the same direction or at the same time.
Security Loans – JPMorgan Chase and Co. (“Chase”), as lending agent, may loan the securities of the fund to certain qualified institutions (the “Borrowers”) approved by the fund. The loans are collateralized by cash and/or U.S. Treasury and federal agency obligations in an amount typically at least equal to the market value of the securities loaned. The market value of the loaned securities is determined at the close of business of the fund and any additional required collateral is delivered to the fund on the next business day. Security lending activity through Chase is further collateralized by an irrevocable standby letter of credit. Chase provides the fund with indemnification against Borrower default. The fund bears the risk of loss with respect to the investment of cash collateral. On loans collateralized by cash, the cash collateral is invested in short-term securities. A portion of the income generated upon investment of the collateral is remitted to the Borrowers, and the remainder is allocated between the fund and the lending agent. On loans collateralized by U.S. Treasury and/or federal agency obligations, a fee is received from the Borrower, and is allocated between the fund and the lending agent. Income from securities lending is included in interest income on the Statement of Operations. The dividend and interest income earned on the securities loaned is accounted for in the same manner as other dividend and interest income.
Loans and Other Direct Debt Instruments – The fund may invest in loans and loan participations or other receivables. These investments may include standby financing commitments, including revolving credit facilities, which obligate the fund to supply additional cash to the borrower on demand. Loan participations involve a risk of insolvency of the lending bank or other financial intermediary.
Indemnifications – Under the fund’s organizational documents, its officers and trustees may be indemnified against certain liabilities and expenses arising out of the performance of their duties to the fund. Additionally, in the normal course of business, the fund enters into agreements with service providers that may contain indemnification clauses. The fund’s maximum exposure under these agreements is unknown as this would involve future claims that may be made against the fund that have not yet occurred.
47
Notes to Financial Statements – continued
Investment Transactions and Income – Investment transactions are recorded on the trade date. Interest income is recorded on the accrual basis. All premium and discount is amortized or accreted for financial statement purposes in accordance with U.S. generally accepted accounting principles. The fund earns certain fees in connection with its floating rate loan purchasing activities. These fees are in addition to interest payments earned and may include amendment fees, commitment fees, facility fees, consent fees, and prepayment fees. Commitment fees are recorded on an accrual basis as income in the accompanying financial statements. Dividends received in cash are recorded on the ex-dividend date. Certain dividends from foreign securities will be recorded when the fund is informed of the dividend if such information is obtained subsequent to the ex-dividend date. Dividend and interest payments received in additional securities are recorded on the ex-dividend or ex-interest date in an amount equal to the value of the security on such date.
The fund may receive proceeds from litigation settlements. Any proceeds received from litigation involving portfolio holdings are reflected in the Statement of Operations in realized gain/loss if the security has been disposed of by the fund or in unrealized gain/loss if the security is still held by the fund. Any other proceeds from litigation not related to portfolio holdings are reflected as other income in the Statement of Operations.
Fees Paid Indirectly – The fund’s custody fee may be reduced according to an arrangement that measures the value of cash deposited with the custodian by the fund. This amount, for the year ended February 28, 2009, is shown as a reduction of total expenses on the Statement of Operations.
Tax Matters and Distributions – The fund intends to qualify as a regulated investment company, as defined under Subchapter M of the Internal Revenue Code, and to distribute all of its taxable income, including realized capital gains. As a result, no provision for federal income taxes is required. The fund’s federal tax returns for the prior three fiscal years remain subject to examination by the Internal Revenue Service. Foreign taxes, if any, have been accrued by the fund in the accompanying financial statements.
Distributions to shareholders are recorded on the ex-dividend date. Income and capital gain distributions are determined in accordance with income tax regulations, which may differ from U.S. generally accepted accounting principles. Certain capital accounts in the financial statements are periodically adjusted for permanent differences in order to reflect their tax character. These adjustments have no impact on net assets or net asset value per share. Temporary differences which arise from recognizing certain items of income, expense, gain or loss in different periods for financial statement and tax purposes will reverse at some time in the future. Distributions in excess of net investment income or net realized gains are temporary
48
Notes to Financial Statements – continued
overdistributions for financial statement purposes resulting from differences in the recognition or classification of income or distributions for financial statement and tax purposes.
Book/tax differences primarily relate to amortization and accretion of debt securities, distressed securities, wash sale loss deferrals, and straddle loss deferrals.
The tax character of distributions declared to shareholders for the last two fiscal years is as follows:
| | | | |
| | | 2/28/09 | | 2/29/08 |
| Ordinary income (including any short-term capital gains) | | $10,699,563 | | $13,913,734 |
| Long-term capital gain | | 303,519 | | 836,318 |
| | $11,003,082 | | $14,750,052 |
The federal tax cost and the tax basis components of distributable earnings were as follows:
| | | |
| As of 2/28/09 | | | |
| Cost of investments | | $194,374,711 | |
| Gross appreciation | | 1,301,308 | |
| Gross depreciation | | (59,018,476 | ) |
| Net unrealized appreciation (depreciation) | | $(57,717,168 | ) |
| Undistributed ordinary income | | 1,030,256 | |
| Capital loss carryforwards | | (14,203,673 | ) |
| Post-October capital loss deferral | | (18,281,715 | ) |
| Other temporary differences | | (1,243,151 | ) |
As of February 28, 2009, the fund had capital loss carryforwards available to offset future realized gains. Such losses expire as follows:
Multiple Classes of Shares of Beneficial Interest – The fund offers multiple classes of shares, which differ in their respective distribution and service fees. The fund’s income and common expenses are allocated to shareholders based on the value of settled shares outstanding of each class. The fund’s realized and unrealized gain (loss) are allocated to shareholders based on the daily net assets of each class. Dividends are declared separately for each class. Differences in per share dividend rates are generally due to differences in separate class expenses.
| (3) | | Transactions with Affiliates |
Investment Adviser – The fund has an investment advisory agreement with Massachusetts Financial Services Company (MFS) to provide overall investment management and related administrative services and facilities to the fund.
49
Notes to Financial Statements – continued
The management fee is computed daily and paid monthly at an annual rate of 0.65% of the fund’s average daily net assets. The adviser and the fund have engaged a sub-adviser for the real estate related component of the fund, Sun Capital Advisers LLC, referred to as Sun Capital or the sub-adviser. MFS pays a sub-advisory fee in an amount equal to 0.30% annually of the average daily net asset value of the fund’s assets managed by the sub-adviser.
The investment adviser has agreed in writing to pay a portion of the fund’s total annual operating expenses, exclusive of interest, taxes, extraordinary expenses, brokerage and transaction costs and investment-related expenses, such that total annual fund operating expenses do not exceed the following rates annually of the fund’s average daily net assets.
| | | | | | | | | | | | |
| Class A | | Class C | | Class I | | Class R1 | | Class R2 | | Class R3 | | Class R4 |
| 0.95% | | 1.65% | | 0.65% | | 1.65% | | 1.15% | | 0.90% | | 0.65% |
This written agreement will continue until February 28, 2009. For the year ended February 28, 2009, this reduction amounted to $571,577 and is reflected as a reduction of total expenses in the Statement of Operations.
Effective March 1, 2009, the investment adviser has agreed in writing to pay a portion of the fund’s total annual operating expenses, exclusive of interest, taxes, extraordinary expenses, brokerage and transaction costs and investment-related expenses, such that total annual fund operating expenses do not exceed the following rates annually of the fund’s average daily net assets.
| | | | | | | | | | | | |
| Class A | | Class C | | Class I | | Class R1 | | Class R2 | | Class R3 | | Class R4 |
| 0.90% | | 1.65% | | 0.65% | | 1.65% | | 1.15% | | 0.90% | | 0.65% |
This written agreement will continue until modified by the fund’s Board of Trustees, but such agreement will continue at least until June 30, 2009.
Distributor – MFS Fund Distributors, Inc. (MFD), a wholly-owned subsidiary of MFS, as distributor, received $34,821 for the year ended February 28, 2009, as its portion of the initial sales charge on sales of Class A shares of the fund.
The Board of Trustees has adopted a distribution plan for certain class shares pursuant to Rule 12b-1 of the Investment Company Act of 1940.
The fund’s distribution plan provides that the fund will pay MFD for services provided by MFD and financial intermediaries in connection with the distribution and servicing of certain share classes. One component of the plan is a distribution fee paid to MFD and another component of the plan is a service fee paid to MFD. MFD may subsequently pay all, or a portion, of the distribution and/or service fees to financial intermediaries.
50
Notes to Financial Statements – continued
Distribution Plan Fee Table:
| | | | | | | | | | |
| | | Distribution
Fee Rate | | Service
Fee Rate | | Total
Distribution
Plan (d) | | Annual
Effective
Rate (e) | | Distribution
and Service
Fee |
| Class A | | 0.10% | | 0.25% | | 0.35% | | 0.30% | | $412,885 |
| Class C | | 0.75% | | 0.25% | | 1.00% | | 1.00% | | 691,515 |
| Class R1 (i) | | 0.75% | | 0.25% | | 1.00% | | 1.00% | | 575 |
| Class R2 (i) | | 0.25% | | 0.25% | | 0.50% | | 0.50% | | 288 |
| Class R3 (i) | | — | | 0.25% | | 0.25% | | 0.25% | | 144 |
| Total Distribution and Service Fees | | | | | | $1,105,407 |
| (d) | In accordance with the distribution plan for certain classes, the fund pays distribution and/or service fees up to these annual percentage rates of each class’ average daily net assets. |
| (e) | The annual effective rates represent actual fees incurred under the distribution plan for the year ended February 28, 2009 based on each class’ average daily net assets. 0.05% of the Class A distribution fee is currently being paid by the fund; the remaining 0.05% of the Class A distribution fee is not in effect. Effective March 1, 2009, the 0.10% Class A annual distribution fee will be eliminated. |
| (i) | For the period from the class’ inception, July 1, 2008 (Classes R1, R2, and R3), through the stated period end. |
Certain Class A shares purchased prior to September 1, 2008 are subject to a contingent deferred sales charge (CDSC) in the event of a shareholder redemption within 12 months of purchase. Certain Class A shares purchased on or subsequent to September 1, 2008 are subject to a CDSC in the event of a shareholder redemption within 24 months of purchase. Class C shares are subject to a CDSC in the event of a shareholder redemption within 12 months of purchase. All contingent deferred sales charges are paid to MFD and during the year ended February 28, 2009, were as follows:
| | |
| | | Amount |
| Class A | | $842 |
| Class C | | 16,269 |
Shareholder Servicing Agent – MFS Service Center, Inc. (MFSC), a wholly-owned subsidiary of MFS, receives a fee from the fund for its services as shareholder servicing agent calculated as a percentage of the average daily net assets of the fund as determined periodically under the supervision of the fund’s Board of Trustees. For the year ended February 28, 2009, the fee was $68,768, which equated to 0.0330% annually of the fund’s average daily net assets. MFSC also receives payment from the fund for out-of-pocket expenses, sub-accounting and other shareholder servicing costs which may be paid to affiliated and unaffiliated service providers. For the year ended February 28, 2009, these out-of-pocket expenses, sub-accounting and other shareholder servicing costs amounted to $154,676.
Administrator – MFS provides certain financial, legal, shareholder communications, compliance, and other administrative services to the fund. Under an administrative services agreement, the fund partially reimburses MFS the costs incurred to provide these services. The fund is charged a fixed
51
Notes to Financial Statements – continued
amount plus a fee based on average daily net assets. The fund’s annual fixed amount is $17,500.
The administrative services fee incurred for the year ended February 28, 2009 was equivalent to an annual effective rate of 0.0196% of the fund’s average daily net assets.
Trustees’ and Officers’ Compensation – The fund pays compensation to independent trustees in the form of a retainer, attendance fees, and additional compensation to Board and Committee chairpersons. The fund does not pay compensation directly to trustees or officers of the fund who are also officers of the investment adviser, all of whom receive remuneration for their services to the fund from MFS. Certain officers and trustees of the fund are officers or directors of MFS, MFD, and MFSC.
Other – This fund and certain other MFS funds (the funds) have entered into services agreements (the Agreements) which provide for payment of fees by the funds to Tarantino LLC and Griffin Compliance LLC in return for the provision of services of an Independent Chief Compliance Officer (ICCO) and Assistant ICCO, respectively, for the funds. The ICCO and Assistant ICCO are officers of the funds and the sole members of Tarantino LLC and Griffin Compliance LLC, respectively. The funds can terminate the Agreements with Tarantino LLC and Griffin Compliance LLC at any time under the terms of the Agreements. For the year ended February 28, 2009, the aggregate fees paid by the fund to Tarantino LLC and Griffin Compliance LLC were $2,048 and are included in miscellaneous expense on the Statement of Operations. MFS has agreed to reimburse the fund for a portion of the payments made by the fund in the amount of $1,141, which is shown as a reduction of total expenses in the Statement of Operations. Additionally, MFS has agreed to bear all expenses associated with office space, other administrative support, and supplies provided to the ICCO and Assistant ICCO.
The fund may invest in a money market fund managed by MFS which seeks a high level of current income consistent with preservation of capital and liquidity. Income earned on this investment is included in dividends from underlying funds on the Statement of Operations. This money market fund does not pay a management fee to MFS.
Purchases and sales of investments, other than purchased option transactions and short-term obligations, were as follows:
| | | | |
| | | Purchases | | Sales |
| U.S. Government securities | | $31,373,087 | | $68,254,231 |
| Investments (non-U.S. Government securities) | | $128,857,143 | | $125,113,336 |
52
Notes to Financial Statements – continued
| (5) | | Shares of Beneficial Interest |
The fund’s Declaration of Trust permits the Trustees to issue an unlimited number of full and fractional shares of beneficial interest. Transactions in fund shares were as follows:
| | | | | | | | | | | | |
| | | Year ended
2/28/09 | | | Year ended
2/29/08 | |
| | | Shares | | | Amount | | | Shares | | | Amount | |
| Shares sold | | | | | | | | | | | | |
Class A | | 2,270,917 | | | $20,962,624 | | | 9,371,028 | | | $101,513,992 | |
Class C | | 1,141,244 | | | 10,335,267 | | | 4,263,522 | | | 46,159,401 | |
Class I | | 53,881 | | | 477,755 | | | 257,125 | | | 2,769,345 | |
Class R1 (i) | | 10,173 | | | 100,000 | | | — | | | — | |
Class R2 (i) | | 10,173 | | | 100,000 | | | — | | | — | |
Class R3 (i) | | 10,162 | | | 100,000 | | | — | | | — | |
Class R4 (i) | | 10,163 | | | 100,000 | | | — | | | — | |
| | 3,506,713 | | | $32,175,646 | | | 13,891,675 | | | $150,442,738 | |
| Shares issued to shareholders in reinvestment of distributions | | | | | | | | | | | | |
Class A | | 692,298 | | | $6,075,547 | | | 779,055 | | | $8,313,792 | |
Class C | | 233,961 | | | 2,048,749 | | | 235,015 | | | 2,501,528 | |
Class I | | 8,885 | | | 77,430 | | | 11,564 | | | 123,853 | |
Class R1 (i) | | 377 | | | 3,045 | | | — | | | — | |
Class R2 (i) | | 413 | | | 3,343 | | | — | | | — | |
Class R3 (i) | | 431 | | | 3,376 | | | — | | | — | |
Class R4 (i) | | 449 | | | 3,642 | | | — | | | — | |
| | 936,814 | | | $8,215,132 | | | 1,025,634 | | | $10,939,173 | |
| Shares reacquired | | | | | | | | | | | | |
Class A | | (6,264,365 | ) | | $(54,667,121 | ) | | (7,849,246 | ) | | $(82,409,994 | ) |
Class C | | (2,820,150 | ) | | (24,581,087 | ) | | (2,154,925 | ) | | (22,570,029 | ) |
Class I | | (62,262 | ) | | (559,807 | ) | | (343,161 | ) | | (3,671,454 | ) |
| | (9,146,777 | ) | | $(79,808,015 | ) | | (10,347,332 | ) | | $(108,651,477 | ) |
| Net change | | | | | | | | | | | | |
Class A | | (3,301,150 | ) | | $(27,628,950 | ) | | 2,300,837 | | | $27,417,790 | |
Class C | | (1,444,945 | ) | | (12,197,071 | ) | | 2,343,612 | | | 26,090,900 | |
Class I | | 504 | | | (4,622 | ) | | (74,472 | ) | | (778,256 | ) |
Class R1 (i) | | 10,550 | | | 103,045 | | | — | | | — | |
Class R2 (i) | | 10,586 | | | 103,343 | | | — | | | — | |
Class R3 (i) | | 10,593 | | | 103,376 | | | — | | | — | |
Class R4 (i) | | 10,612 | | | 103,642 | | | — | | | — | |
| | (4,703,250 | ) | | $(39,417,237 | ) | | 4,569,977 | | | $52,730,434 | |
| (i) | For the period from the class’ inception, July 1, 2008 (Classes R1, R2, R3, and R4), through the stated period end. |
53
Notes to Financial Statements – continued
The fund and other funds managed by MFS participate in a $1 billion unsecured committed line of credit provided by a syndication of banks under a credit agreement. In addition, the fund and other funds managed by MFS have established uncommitted borrowing arrangements with certain banks. Borrowings may be made for temporary financing needs. Interest is charged to the fund, based on its borrowings, generally at a rate equal to the Federal Reserve funds rate plus 0.30%. In addition, a commitment fee, based on the average daily, unused portion of the committed line of credit, is allocated among the participating funds at the end of each calendar quarter. For the year ended February 28, 2009, the fund’s commitment fee and interest expense were $1,196 and $0, respectively, and are included in miscellaneous expense on the Statement of Operations.
| (7) | | Transactions in Underlying Funds-Affiliated Issuers |
An affiliated issuer may be considered one in which the fund owns 5% or more of the outstanding voting securities, or a company which is under common control. For the purposes of this report, the fund assumes the following to be affiliated issuers:
| | | | | | | | | |
| Underlying Funds | | Beginning
Shares/Par
Amount | | Acquisitions
Shares/Par
Amount | | Dispositions
Shares/Par
Amount | | | Ending
Shares/Par
Amount |
MFS Institutional Money
Market Portfolio | | 6,652,415 | | 93,593,756 | | (97,738,933 | ) | | 2,507,238 |
| | | | |
| Underlying Funds | | Realized
Gain (Loss) | | Capital Gain
Distributions | | Dividend
Income | | | Ending
Value |
MFS Institutional Money
Market Portfolio | | $— | | $— | | $129,584 | | | $2,507,238 |
54
REPORT OF INDEPENDENT REGISTERED
PUBLIC ACCOUNTING FIRM
To the Trustees and Shareholders of
MFS Diversified Income Fund:
We have audited the accompanying statement of assets and liabilities of MFS Diversified Income Fund (the Fund), including the portfolio of investments, as of February 28, 2009, and the related statement of operations for the year then ended, the statements of changes in net assets for each of the two years in the period then ended, and the financial highlights for each of the periods indicated therein. These financial statements and financial highlights are the responsibility of the Fund’s management. Our responsibility is to express an opinion on these financial statements and financial highlights based on our audits.
We conducted our audits in accordance with the standards of the Public Company Accounting Oversight Board (United States). Those standards require that we plan and perform the audits to obtain reasonable assurance about whether the financial statements and financial highlights are free of material misstatement. We were not engaged to perform an audit of the Fund’s internal control over financial reporting. Our audits included consideration of internal control over financial reporting as a basis for designing audit procedures that are appropriate in the circumstances, but not for the purpose of expressing an opinion on the effectiveness of the Fund’s internal control over financial reporting. Accordingly, we express no such opinion. An audit also includes examining, on a test basis, evidence supporting the amounts and disclosures in the financial statements and financial highlights, assessing the accounting principles used and significant estimates made by management, and evaluating the overall financial statement presentation. Our procedures included confirmation of securities owned as of February 28, 2009, by correspondence with the Fund’s custodian and brokers or by other appropriate auditing procedures where replies from brokers were not received. We believe that our audits provide a reasonable basis for our opinion.
In our opinion, the financial statements and financial highlights referred to above present fairly, in all material respects, the financial position of MFS Diversified Income Fund at February 28, 2009, the results of its operations for the year then ended, the changes in its net assets for each of the two years in the period then ended, and the financial highlights for each of the periods indicated therein in conformity with U.S. generally accepted accounting principles.

Boston, Massachusetts
April 15, 2009
55
TRUSTEES AND OFFICERS —
IDENTIFICATION AND BACKGROUND
The Trustees and officers of the Trust, as of April 1, 2009, are listed below, together with their principal occupations during the past five years. (Their titles may have varied during that period.) The address of each Trustee and officer is 500 Boylston Street, Boston, Massachusetts 02116.
| | | | | | |
Name, Date of Birth | | Position(s) Held
with Fund | | Trustee/Officer
Since (h) | | Principal Occupations During
the Past Five Years & Other
Directorships (j) |
| INTERESTED TRUSTEES | | | | |
Robert J. Manning (k)
(born 10/20/63) | | Trustee | | February 2004 | | Massachusetts Financial Services Company, Chief Executive Officer, President, Chief Investment Officer and Director |
Robert C. Pozen (k)
(born 8/08/46) | | Trustee | | February 2004 | | Massachusetts Financial Services Company, Chairman (since February 2004); Harvard Business School (education), Senior Lecturer (since 2008); Bell Canada Enterprises (telecommunications), Director (until February 2009); The Bank of New York, Director (finance), (March 2004 to May 2005); Telesat (satellite communications), Director (until November 2007) |
| INDEPENDENT TRUSTEES | | | | |
David H. Gunning
(born 5/30/42) | | Trustee and Chair of Trustees | | January 2004 | | Retired; Cleveland-Cliffs Inc. (mining products and service provider), Vice Chairman/Director (until May 2007); Lincoln Electric Holdings, Inc. (welding equipment manufacturer), Director; Development Alternatives, Inc. (consulting), Director/Non Executive Chairman; Portman Limited (mining), Director (since 2005); Southwest Gas Corp. (natural gas distribution), Director (until May 2004) |
Robert E. Butler (n)
(born 11/29/41) | | Trustee | | January 2006 | | Consultant – regulatory and compliance matters (since July 2002); PricewaterhouseCoopers LLP (professional services firm), Partner (until 2002) |
56
Trustees and Officers – continued
| | | | | | |
Name, Date of Birth | | Position(s) Held
with Fund | | Trustee/Officer
Since (h) | | Principal Occupations During
the Past Five Years & Other
Directorships (j) |
Lawrence H. Cohn, M.D.
(born 3/11/37) | | Trustee | | August 1993 | | Brigham and Women’s Hospital, Senior Cardiac Surgeon (since 2005); Harvard Medical School, Professor of Cardiac Surgery; Partners HealthCare, Physician Director of Medical Device Technology (since 2006); Brigham and Women’s Hospital, Chief of Cardiac Surgery (until 2005) |
Maureen R. Goldfarb
(born 4/06/55) | | Trustee | | January 2009 | | Private investor; John Hancock Financial Services, Inc., Executive Vice President (until 2004); John Hancock Mutual Funds, Trustee and Chief Executive Officer (until 2004) |
William R. Gutow
(born 9/27/41) | | Trustee | | December 1993 | | Private investor and real estate consultant; Capital Entertainment Management Company (video franchise), Vice Chairman; Texas Donuts (donut franchise), Vice Chairman (since 2007); Atlantic Coast Tan (tanning salons), Vice Chairman (until 2007) |
Michael Hegarty
(born 12/21/44) | | Trustee | | December 2004 | | Retired; AXA Financial (financial services and insurance), Vice Chairman and Chief Operating Officer (until 2001); The Equitable Life Assurance Society (insurance), President and Chief Operating Officer (until 2001) |
J. Atwood Ives
(born 5/01/36) | | Trustee | | February 1992 | | Private investor; KeySpan Corporation (energy related services), Director until 2004; Woodstock Corporation (investment advisory firm), Director until 2003 |
John P. Kavanaugh
(born 11/04/54) | | Trustee | | January 2009 | | Private investor; The Hanover Insurance Group, Inc., Vice President and Chief Investment Officer (until 2006); Allmerica Investment Trust, Allmerica Securities Trust and Opus Investment Trust (investment companies), Chairman, President and Trustee (until 2006) |
57
Trustees and Officers – continued
| | | | | | |
Name, Date of Birth | | Position(s) Held
with Fund | | Trustee/Officer
Since (h) | | Principal Occupations During
the Past Five Years & Other
Directorships (j) |
J. Dale Sherratt
(born 9/23/38) | | Trustee | | August 1993 | | Insight Resources, Inc. (acquisition planning specialists), President; Wellfleet Investments (investor in health care companies), Managing General Partner |
Laurie J. Thomsen
(born 8/05/57) | | Trustee | | March 2005 | | New Profit, Inc. (venture philanthropy), Partner (since 2006); Private investor; Prism Venture Partners (venture capital), Co-founder and General Partner (until June 2004); The Travelers Companies (commercial property liability insurance), Director |
Robert W. Uek
(born 5/18/41) | | Trustee | | January 2006 | | Consultant to investment company industry; PricewaterhouseCoopers LLP (professional services firm), Partner (until 1999); TT International Funds (mutual fund complex), Trustee (until 2005); Hillview Investment Trust II Funds (mutual fund complex), Trustee (until 2005) |
| OFFICERS | | | | | | |
Maria F. Dwyer (k)
(born 12/01/58) | | President | | November 2005 | | Massachusetts Financial Services Company, Executive Vice President and Chief Regulatory Officer (since March 2004) Chief Compliance Officer (since December 2006); Fidelity Management & Research Company, Vice President (prior to March 2004); Fidelity Group of Funds, President and Treasurer (until March 2004) |
Christopher R. Bohane (k)
(born 1/18/74) | | Assistant Secretary and Assistant Clerk | | July 2005 | | Massachusetts Financial Services Company, Vice President and Senior Counsel |
John M. Corcoran (k)
(born 4/13/65) | | Treasurer | | October 2008 | | Massachusetts Financial Services Company, Senior Vice President (since October 2008); State Street Bank and Trust (financial services provider), Senior Vice President, (until September 2008) |
58
Trustees and Officers – continued
| | | | | | |
Name, Date of Birth | | Position(s) Held
with Fund | | Trustee/Officer
Since (h) | | Principal Occupations During
the Past Five Years & Other
Directorships (j) |
Ethan D. Corey (k)
(born 11/21/63) | | Assistant Secretary and Assistant Clerk | | July 2005 | | Massachusetts Financial Services Company, Senior Vice President and Associate General Counsel (since 2004); Dechert LLP (law firm), Counsel (prior to December 2004) |
David L. DiLorenzo (k)
(born 8/10/68) | | Assistant Treasurer | | July 2005 | | Massachusetts Financial Services Company, Vice President (since June 2005); JP Morgan Investor Services, Vice President (until June 2005) |
Timothy M. Fagan (k)
(born 7/10/68) | | Assistant Secretary and Assistant Clerk | | September 2005 | | Massachusetts Financial Services Company, Vice President and Senior Counsel (since September 2005); John Hancock Advisers, LLC, Vice President, Senior Attorney and Chief Compliance Officer (until August 2005) |
Mark D. Fischer (k)
(born 10/27/70) | | Assistant Treasurer | | July 2005 | | Massachusetts Financial Services Company, Vice President (since May 2005); JP Morgan Investment Management Company, Vice President (until May 2005) |
Robyn L. Griffin
(born 7/04/75) | | Assistant
Independent
Chief Compliance
Officer | | August 2008 | | Griffin Compliance LLC (provider of compliance services), Principal (since August 2008); State Street Corporation (financial services provider), Mutual Fund Administration Assistant Vice President (October 2006 – July 2008); Liberty Mutual Group (insurance), Personal Market Assistant Controller (April 2006 – October 2006); Deloitte & Touche LLP (professional services firm), Senior Manager (prior to April 2006) |
Brian E. Langenfeld (k)
(born 3/07/73) | | Assistant Secretary and Assistant Clerk | | June 2006 | | Massachusetts Financial Services Company, Vice President and Senior Counsel (since May 2006); John Hancock Advisers, LLC, Assistant Vice President and Counsel (until April 2006) |
Ellen Moynihan (k)
(born 11/13/57) | | Assistant Treasurer | | April 1997 | | Massachusetts Financial Services Company, Senior Vice President |
59
Trustees and Officers – continued
| | | | | | |
Name, Date of Birth | | Position(s) Held
with Fund | | Trustee/Officer
Since (h) | | Principal Occupations During
the Past Five Years & Other
Directorships (j) |
Susan S. Newton (k)
(born 3/07/50) | | Assistant Secretary and Assistant Clerk | | May 2005 | | Massachusetts Financial Services Company, Senior Vice President and Associate General Counsel (since April 2005); John Hancock Advisers, LLC, Senior Vice President, Secretary and Chief Legal Officer (until April 2005) |
Susan A. Pereira (k)
(born 11/05/70) | | Assistant Secretary and Assistant Clerk | | July 2005 | | Massachusetts Financial Services Company, Vice President and Senior Counsel (since June 2004); Bingham McCutchen LLP (law firm), Associate (until June 2004) |
Mark N. Polebaum (k)
(born 5/01/52) | | Secretary and Clerk | | January 2006 | | Massachusetts Financial Services Company, Executive Vice President, General Counsel and Secretary (since January 2006); Wilmer Cutler Pickering Hale and Dorr LLP (law firm), Partner (until January 2006) |
Frank L. Tarantino
(born 3/07/44) | | Independent Chief Compliance Officer | | June 2004 | | Tarantino LLC (provider of compliance services), Principal (since June 2004); CRA Business Strategies Group (consulting services), Executive Vice President (until June 2004) |
Richard S. Weitzel (k)
(born 7/16/70) | | Assistant Secretary and Assistant Clerk | | October 2007 | | Massachusetts Financial Services Company, Vice President and Assistant General Counsel (since 2004); Massachusetts Department of Business and Technology, General Counsel (until April 2004) |
James O. Yost (k)
(born 6/12/60) | | Assistant Treasurer | | September 1990 | | Massachusetts Financial Services Company, Senior Vice President |
| (h) | Date first appointed to serve as Trustee/officer of an MFS fund. Each Trustee has served continuously since appointment unless indicated otherwise. For the period from December 15, 2004 until February 22, 2005, Messrs. Pozen and Manning served as Advisory Trustees. For the period March 2008 until October 2008, Ms. Dwyer served as Treasurer of the Funds. |
| (j) | Directorships or trusteeships of companies required to report to the Securities and Exchange Commission (i.e., “public companies”). |
| (k) | “Interested person” of the Trust within the meaning of the Investment Company Act of 1940 (referred to as the 1940 Act), which is the principal federal law governing investment companies like the fund, as a result of position with MFS. The address of MFS is 500 Boylston Street, Boston, Massachusetts 02116. |
| (n) | In 2004 and 2005, Mr. Butler provided consulting services to the independent compliance consultant retained by MFS pursuant to its settlement with the SEC concerning market timing and related matters. The terms of that settlement required that compensation and expenses related to the independent compliance consultant be borne exclusively by MFS and, therefore, MFS paid Mr. Butler for the services he rendered to the independent compliance consultant. In 2004 and 2005, MFS paid Mr. Butler a total of $351,119.29. |
60
Trustees and Officers – continued
Each Trustee (except Messrs. Butler, Kavanaugh and Uek and Ms. Goldfarb) has been elected by shareholders and each Trustee and officer holds office until his or her successor is chosen and qualified or until his or her earlier death, resignation, retirement or removal. The Trust held a shareholders’ meeting in 2005 to elect Trustees, and will hold a shareholders’ meeting at least once every five years thereafter, to elect Trustees. Messrs. Butler, Kavanaugh, Sherratt, Uek and Ms. Thomsen are members of the Trust’s Audit Committee.
Each of the Fund’s Trustees and officers holds comparable positions with certain other funds of which MFS or a subsidiary is the investment adviser or distributor, and, in the case of the officers, with certain affiliates of MFS. As of January 1, 2009, the Trustees served as board members of 105 funds within the MFS Family of Funds.
The Statement of Additional Information for the Fund and further information about the Trustees are available without charge upon request by calling 1-800-225-2606.
| | |
| Investment Adviser | | Custodian |
Massachusetts Financial Services Company
500 Boylston Street, Boston, MA 02116-3741 | | JPMorgan Chase Bank
One Chase Manhattan Plaza New York, NY 10081 |
| Distributor | | Independent Registered Public Accounting Firm |
MFS Fund Distributors, Inc.
500 Boylston Street, Boston, MA 02116-3741 | | Ernst & Young LLP
200 Clarendon Street, Boston, MA 02116 |
| Portfolio Managers | | |
| John Addeo | | |
| David Cole | | |
| Richard Gable | | |
| Thomas Pedulla | | |
| Matthew Ryan | | |
| Jonathan Sage | | |
| Leo Saraceno | | |
| Geoffrey Schechter | | |
| James Swanson | | |
61
BOARD REVIEW OF INVESTMENT ADVISORY AGREEMENT
A discussion regarding the Board’s most recent review and renewal of the fund’s Investment Advisory Agreement with MFS is available by clicking on the fund’s name under “Mutual Funds” in the “Products and Performance” section of the MFS Web site (mfs.com).
PROXY VOTING POLICIES AND INFORMATION
A general description of the MFS funds’ proxy voting policies and procedures is available without charge, upon request, by calling
1-800-225-2606, by visiting the Proxy Voting section of mfs.com or by visiting the SEC’s Web site at http://www.sec.gov.
Information regarding how the fund voted proxies relating to portfolio securities during the most recent twelve-month period ended June 30 is available without charge by visiting the Proxy Voting section of mfs.com or by visiting the SEC’s Web site at http://www.sec.gov.
QUARTERLY PORTFOLIO DISCLOSURE
The fund will file a complete schedule of portfolio holdings with the Securities and Exchange Commission (the Commission) for the first and third quarters of each fiscal year on Form N-Q. The fund’s Form N-Q may be reviewed and copied at the:
Public Reference Room
Securities and Exchange Commission
100 F Street, NE, Room 1580
Washington, D.C. 20549
Information on the operation of the Public Reference Room may be obtained by calling the Commission at 1-800-SEC-0330. The fund’s Form N-Q is available on the EDGAR database on the Commission’s Internet Web site at http://www.sec.gov, and copies of this information may be obtained, upon payment of a duplicating fee, by electronic request at the following e-mail address: publicinfo@sec.gov or by writing the Public Reference Section at the above address.
A shareholder can also obtain the quarterly portfolio holdings report at mfs.com.
FEDERAL TAX INFORMATION (unaudited)
The fund will notify shareholders of amounts for use in preparing 2009 income tax forms in January 2010. The following information is provided pursuant to provisions of the Internal Revenue Code.
The fund designates the maximum amount allowable as qualified dividend income eligible for the 15% tax rate.
The fund designates $303,519 as capital gain dividends paid during the fiscal year.
For corporate shareholders, 12.53% of the ordinary income dividends paid during the fiscal year qualify for the corporate dividends received deduction.
62
MFS® PRIVACY NOTICE
Privacy is a concern for every investor today. At MFS Investment Management® and the MFS funds, we take this concern very seriously. We want you to understand our policies about the investment products and services that we offer, and how we protect the nonpublic personal information of investors who have a direct relationship with us and our wholly owned subsidiaries.
Throughout our business relationship, you provide us with personal information. We maintain information and records about you, your investments, and the services you use. Examples of the nonpublic personal information we maintain include
| | Ÿ | | data from investment applications and other forms |
| | Ÿ | | share balances and transactional history with us, our affiliates, or others |
| | Ÿ | | facts from a consumer reporting agency |
We do not disclose any nonpublic personal information about our customers or former customers to anyone, except as permitted by law. We may share nonpublic personal information with third parties or certain of our affiliates in connection with servicing your account or processing your transactions. We may share information with companies or financial institutions that perform marketing services on our behalf or with other financial institutions with which we have joint marketing arrangements, subject to any legal requirements.
Authorization to access your nonpublic personal information is limited to appropriate personnel who provide products, services, or information to you. We maintain physical, electronic, and procedural safeguards to help protect the personal information we collect about you.
If you have any questions about the MFS privacy policy, please call 1-800-225-2606 any business day between 8 a.m. and 8 p.m. Eastern time.
Note: If you own MFS products or receive MFS services in the name of a third party such as a bank or broker-dealer, their privacy policy may apply to you instead of ours.
63
| | |
| CONTACT US | | |
| |
| Web site | | Mailing address |
| mfs.com | | MFS Service Center, Inc. |
| | P.O. Box 55824 |
| MFS TALK | | Boston, MA 02205-5824 |
| 1-800-637-8255 | | |
| 24 hours a day | | Overnight mail |
| | MFS Service Center, Inc. |
| Account service and | | c/o Boston Financial Data Services |
| literature | | 30 Dan Road |
Shareholders | | Canton, MA 02021-2809 |
| 1-800-225-2606 | | |
| |
| Investment professionals | | |
| 1-800-343-2829 | | |
| |
| Retirement plan services | | |
| 1-800-637-1255 | | |

Save paper with eDelivery. MFS® will send you prospectuses, reports, and proxies directly via e-mail so you will get information faster with less mailbox clutter. To sign up: 1. go to mfs.com. 2. log in via MFS® Access. 3. select eDelivery. If you own your MFS fund shares through a financial institution or a retirement plan, MFS® TALK, MFS Access, and eDelivery may not be available to you.


MFS® Government Securities Fund
| | |
| CONTACT INFORMATION BACK COVER |
SIPC Contact Information:
You may obtain information about the Securities Investor Protection Corporation (“SIPC”), including the SIPC Brochure, by contacting SIPC either by telephone (202-371-8300) or by accessing SIPC’s website address (www.sipc.org).
Note to Shareholders: At the close of business on April 18, 2008, Class R shares and Class R2 shares converted into Class R3 shares. Following this conversion, Class R3, Class R4, and Class R5 shares were renamed Class R2, Class R3, and Class R4 shares, respectively.
The report is prepared for the general information of shareholders. It is authorized for distribution to prospective investors only when preceded or accompanied by a current prospectus.
NOT FDIC INSURED Ÿ MAY LOSE VALUE Ÿ NO BANK GUARANTEE
2/28/09
MFG-ANN

LETTER FROM THE CEO
Dear Shareholders:
The market downturns and economic setbacks of late probably rank among the worst financial declines most of us have experienced. Inevitably, people may be questioning their commitment to investing. Still, it is important to remember that downturns are an inescapable part of the business cycle. Such troughs have been seen before, and if we can use history as a guide, market recoveries typically have followed.
Recent events have clearly shown us the value of certain types of investments. In this environment, two of the hallmarks of mutual funds — transparency and liquidity — have become critically important. Unlike some other types of investments, the operations of mutual funds are relatively transparent to their shareholders. With their daily redemption feature, mutual funds also generally provide easy, convenient access to one’s money. Through these recent market upheavals, this level of liquidity enhanced the ability of mutual fund investors to respond and modify their investments as they and their advisors saw fit — a flexibility that those in less liquid investments simply did not have at their disposal.
At MFS® we take particular pride in how well mutual funds can serve investors because we invented the mutual fund in the United States. Established in 1924, Massachusetts Investors Trust was the nation’s first fund. Recent market events only reinforce what we have learned through 85 years — that mutual funds provide unique features that are important to investors in any type of market climate.
Respectfully,

Robert J. Manning
Chief Executive Officer and Chief Investment Officer
MFS Investment Management®
April 15, 2009
The opinions expressed in this letter are subject to change, may not be relied upon for investment advice, and no forecasts can be guaranteed.
Before investing, consider the fund’s investment objectives, risks, charges, and expenses. For a prospectus containing this and other information, contact your investment professional or view online. Read it carefully.
MFS Fund Distributors, Inc., 500 Boylston Street, Boston, MA 02116
1
PORTFOLIO COMPOSITION
Portfolio structure (i)
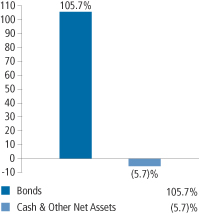
| | |
| Fixed income sectors (i) | | |
| Mortgage-Backed Securities | | 67.0% |
| U.S. Treasury Securities | | 21.2% |
U.S. Government Agencies
and Equivalents | | 12.7% |
| Municipal Bonds | | 4.1% |
| Commercial Mortgage-Backed Securities | | 0.7% |
| | |
| Credit quality of bonds (r) | | |
| AAA | | 96.7% |
| AA | | 3.0% |
| Not Rated | | 0.3% |
| |
| Portfolio facts | | |
| Average Duration (d)(i) | | 3.6 |
| Average Life (i)(m) | | 5.0 yrs. |
| Average Maturity (i)(m) | | 17.2 yrs. |
| Average Credit Quality of Rated Securities (long-term) (a) | | AAA |
| Average Credit Quality of Rated Securities (short-term) (a) | | A-1 |
| (a) | The average credit quality of rated securities is based upon a market weighted average of portfolio holdings that are rated by public rating agencies. |
| (d) | Duration is a measure of how much a bond’s price is likely to fluctuate with general changes in interest rates, e.g., if rates rise 1.00%, a bond with a 5-year duration is likely to lose about 5.00% of its value. |
| (i) | For purposes of this presentation, the bond component includes accrued interest amounts and may be positively or negatively impacted by the equivalent exposure from any derivative holdings, if applicable. |
| (m) | The average maturity shown is calculated using the final stated maturity on the portfolio’s holdings without taking into account any holdings which have been pre-refunded or pre-paid to an earlier date or which have a mandatory put date prior to the stated maturity. The average life shown takes into account these earlier dates. |
| (r) | Each security is assigned a rating from Moody’s Investors Service. If not rated by Moody’s, the rating will be that assigned by Standard & Poor’s. Likewise, if not assigned a rating by Standard & Poor’s, it will be based on the rating assigned by Fitch, Inc. For those portfolios that hold a security which is not rated by any of the three agencies, the security is considered Not Rated. Holdings in U.S. Treasuries and government agency mortgage-backed securities, if any, are included in the “AAA”-rating category. Percentages are based on the total market value of investments as of 2/28/09. |
From time to time “Cash & Other Net Assets” may be negative due to timing of cash receipts and/or equivalent exposure from any derivative holdings.
Percentages are based on net assets as of 2/28/09, unless otherwise noted.
The portfolio is actively managed and current holdings may be different.
2
MANAGEMENT REVIEW
Summary of Results
For the twelve months ended February 28, 2009, Class A shares of the MFS Government Securities Fund (the “fund”) provided a total return of 5.95%, at net asset value. This compares with a return of 6.49% for the fund’s benchmark, the Barclays Capital U.S. Government/Mortgage Bond Index.
Market Environment
The global economy and financial markets experienced substantial deterioration and extraordinary volatility over the reporting period. Strong headwinds in the U.S. included accelerated deterioration in the housing market, anemic corporate investment, a rapidly declining job market, and a much tighter credit environment. During the period, a seemingly continuous series of tumultuous financial events hammered markets, including: the distressed sale of failing Bear Stearns to JPMorgan, the conservatorship of Government Sponsored Enterprises (GSEs) Fannie Mae and Freddie Mac, the bankruptcy of investment bank Lehman Brothers, the Federal Reserve Bank’s complex intervention of insurance company American International Group (AIG), the nationalization of several large European banks, the failure of Washington Mutual, the distressed sale of Wachovia, the virtual failure of Iceland’s banking sector, and the collapse of the global auto industry. As a result of this barrage of turbulent news, global equity markets pushed significantly lower and credit markets witnessed the worst dislocation since the beginning of the credit crisis. Though credit conditions improved towards the end of the period, the state of financial and macroeconomic dislocation remained very severe.
While reasonably resilient during the first half of the period, the global economy and financial system increasingly experienced considerable negative spillovers from the U.S. slowdown. Not only did Europe and Japan show obvious signs of economic decline, the more powerful engine of global growth – emerging markets – also displayed weakening dynamics. The synchronized global downturn in economic activity experienced in fourth quarter of 2008 and the beginning of 2009 was among the most intense in the post-World War II period.
During the reporting period, the U.S. Federal Reserve Board cut interest rates aggressively and introduced a multitude of new lending facilities to alleviate ever-tightening credit markets, while the U.S. federal government designed and implemented fiscal stimulus packages. Although several other global central banks also cut rates during the first half of the reporting period, the dilemma of rising energy and food prices heightened concerns among central bankers that inflationary expectations might become unhinged despite weaker growth.
3
Management Review – continued
Only later in the reporting period did rapidly slowing global growth result in a very precipitous decline in commodity prices, which significantly eased inflation and inflationary expectations. As inflationary concerns diminished in the face of global deleveraging, and equity and credit markets deteriorated more sharply, a coordinated rate cut marked the beginning of much more aggressive easing by the major global central banks. By the end of the period, several central banks had approached their lower bound on policy rates and were examining the implementation and ramifications of quantitative easing as a means to further loosen monetary policy to offset the continuing fall in global wealth.
Detractors from Performance
Relative to the Barclays Capital U.S. Government/Mortgage Bond Index, a primary detractor from performance was the fund’s greater exposure to government agency securities, particularly to delegated underwriting and servicing (DUS) bonds. These DUS bonds, which represent pools of multifamily housing loans, dampened investment results as they lagged the returns of the benchmark.
Contributors to Performance
During the reporting period, the fund’s return from yield, which was greater than that of the benchmark, was a key contributor to performance. During the reporting period, the yield curve(y) steepened as actions by the Federal Reserve lowered short term interest rates more than the decline that occurred in longer maturities. The fund was positioned to benefit from this steepening and therefore our yield curve positioning was another positive contributor.
The fund’s underweighted exposure to U.S. treasury bonds aided relative returns as these securities underperformed the benchmark, where the mortgage component was the higher performer. Additionally, a greater relative exposure to Fannie Mae mortgage-backed securities provided positive performance as these bonds outperformed the overall benchmark over the reporting period.
Respectfully,
Geoffrey Schechter
Portfolio Manager
| (y) | A yield curve graphically depicts the yields of different maturity bonds of the same credit quality and type; a normal yield curve is upward sloping, with short-term rates lower than long-term rates. |
The views expressed in this report are those of the portfolio manager only through the end of the period of the report as stated on the cover and do not necessarily reflect the views of MFS or any other person in the MFS organization. These views are subject to change at any time based on market or other conditions, and MFS disclaims any responsibility to update such views. These views may not be relied upon as investment advice or an indication of trading intent on behalf of any MFS portfolio. References to specific securities are not recommendations of such securities, and may not be representative of any MFS portfolio’s current or future investments.
4
PERFORMANCE SUMMARY THROUGH 2/28/09
The following chart illustrates a representative class of the fund’s historical performance in comparison to its benchmark(s). Performance results include the deduction of the maximum applicable sales charge and reflect the percentage change in net asset value, including reinvestment of dividends and capital gains distributions. The performance of other share classes will be greater than or less than that of the class depicted below. Benchmark comparisons are unmanaged; do not reflect sales charges, commissions or expenses; and cannot be invested in directly. (See Notes to Performance Summary).
Performance data shown represents past performance and is no guarantee of future results. Investment return and principal value fluctuate so your shares, when sold, may be worth more or less than the original cost; current performance may be lower or higher than quoted. The performance shown does not reflect the deduction of taxes, if any, that a shareholder would pay on fund distributions or the redemption of fund shares.
Growth of a hypothetical $10,000 investment
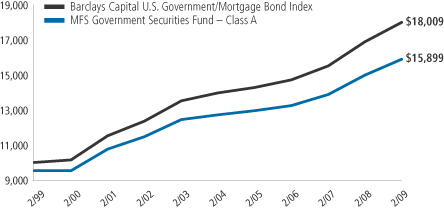
5
Performance Summary – continued
Total Returns through 2/28/09
Average annual without sales charge
| | | | | | | | | | | | |
| | | Share class | | Class inception date | | 1-yr | | 5-yr | | 10-yr | | |
| | | A | | 7/25/84 | | 5.95% | | 4.54% | | 5.26% | | |
| | | B | | 8/30/93 | | 5.16% | | 3.77% | | 4.54% | | |
| | | C | | 4/01/96 | | 5.16% | | 3.77% | | 4.54% | | |
| | | I | | 1/02/97 | | 6.21% | | 4.81% | | 5.58% | | |
| | | R1 | | 4/01/05 | | 5.16% | | 3.70% | | 4.50% | | |
| | | R2
(formerly R3) | | 10/31/03 | | 5.69% | | 4.12% | | 4.73% | | |
| | | R3
(formerly R4) | | 4/01/05 | | 5.95% | | 4.45% | | 5.21% | | |
| | | R4
(formerly R5) | | 4/01/05 | | 6.32% | | 4.70% | | 5.34% | | |
Comparative benchmark
| | | | | | | | | | | | |
| | | Barclays Capital U.S. Government/Mortgage
Bond Index (f) | | 6.49% | | 5.20% | | 6.06% | | |
Average annual with sales charge
| | | | | | | | | | | | |
| | | A With Initial Sales Charge (4.75%) | | 0.92% | | 3.52% | | 4.75% | | |
| | | B With CDSC (Declining over six years from 4% to 0%) (x) | | 1.16% | | 3.43% | | 4.54% | | |
| | | C With CDSC (1% for 12 months) (x) | | 4.16% | | 3.77% | | 4.54% | | |
Class I, R1, R2, R3 and R4 shares do not have a sales charge.
CDSC – Contingent Deferred Sales Charge.
| (f) | Source: FactSet Research Systems Inc. |
| (x) | Assuming redemption at the end of the applicable period. |
Benchmark Definition
Barclays Capital U.S. Government/Mortgage Bond Index (formerly known as Lehman Brothers U.S. Government/Mortgage Bond Index) – measures debt issued by the U.S. Government, and its agencies, as well as mortgage-backed pass-through securities of Ginnie Mae (GNMA), Fannie Mae (FNMA), and Freddie Mac (FHLMC).
It is not possible to invest directly in an index.
Notes to Performance Summary
Performance for Class R3 and Class R4 shares includes the performance of the fund’s Class A shares for periods prior to their offering. Performance for Class R1 and Class R2 shares includes the performance of the fund’s Class B shares
6
Performance Summary – continued
for periods prior to their offering. This blended class performance has been adjusted to take into account differences in sales loads, if any, applicable to these share classes, but has not been adjusted to take into account differences in class specific operating expenses (such as Rule 12b-1 fees). Compared to performance these share classes would have experienced had they been offered for the entire period, the use of blended performance generally results in higher performance for share classes with higher operating expenses than the share class to which it is blended, and lower performance for share classes with lower operating expenses than the share class to which it is blended.
Performance results reflect any applicable expense subsidies and waivers in effect during the periods shown. Without such subsidies and waivers the fund’s performance results would be less favorable. Please see the prospectus and financial statements for complete details.
From time to time the fund may receive proceeds from litigation settlements, without which performance would be lower.
7
EXPENSE TABLE
Fund expenses borne by the shareholders during the period,
September 1, 2008 through February 28, 2009
As a shareholder of the fund, you incur two types of costs: (1) transaction costs, including sales charges (loads) on certain purchase or redemption payments, and (2) ongoing costs, including management fees; distribution and service (12b-1) fees; and other fund expenses. This example is intended to help you understand your ongoing costs (in dollars) of investing in the fund and to compare these costs with the ongoing costs of investing in other mutual funds.
The example is based on an investment of $1,000 invested at the beginning of the period and held for the entire period September 1, 2008 through February 28, 2009.
Actual Expenses
The first line for each share class in the following table provides information about actual account values and actual expenses. You may use the information in this line, together with the amount you invested, to estimate the expenses that you paid over the period. Simply divide your account value by $1,000 (for example, an $8,600 account value divided by $1,000 = 8.6), then multiply the result by the number in the first line under the heading entitled “Expenses Paid During Period” to estimate the expenses you paid on your account during this period.
The actual expenses include the payment of a portion of the transfer-agent-related expenses of MFS funds that invest in the fund. For further information, please see the Notes to the Financial Statements.
Hypothetical Example for Comparison Purposes
The second line for each share class in the following table provides information about hypothetical account values and hypothetical expenses based on the fund’s actual expense ratio and an assumed rate of return of 5% per year before expenses, which is not the fund’s actual return. The hypothetical account values and expenses may not be used to estimate the actual ending account balance or expenses you paid for the period. You may use this information to compare the ongoing costs of investing in the fund and other funds. To do so, compare this 5% hypothetical example with the 5% hypothetical examples that appear in the shareholder reports of the other funds.
Please note that the expenses shown in the table are meant to highlight your ongoing costs only and do not reflect any transactional costs, such as sales charges (loads). Therefore, the second line for each share class in the table is useful in comparing ongoing costs only, and will not help you determine the relative total costs of owning different funds. In addition, if these transactional costs were included, your costs would have been higher.
8
Expense Table – continued
| | | | | | | | | | |
Share
Class | | | | Annualized
Expense
Ratio | | Beginning
Account Value
9/01/08 | | Ending
Account Value
2/28/09 | | Expenses
Paid During
Period (p)
9/01/08-2/28/09 |
| A | | Actual | | 0.81% | | $1,000.00 | | $1,052.41 | | $4.12 |
| | Hypothetical (h) | | 0.81% | | $1,000.00 | | $1,020.78 | | $4.06 |
| B | | Actual | | 1.56% | | $1,000.00 | | $1,049.60 | | $7.93 |
| | Hypothetical (h) | | 1.56% | | $1,000.00 | | $1,017.06 | | $7.80 |
| C | | Actual | | 1.55% | | $1,000.00 | | $1,049.47 | | $7.88 |
| | Hypothetical (h) | | 1.55% | | $1,000.00 | | $1,017.11 | | $7.75 |
| I | | Actual | | 0.56% | | $1,000.00 | | $1,053.72 | | $2.85 |
| | Hypothetical (h) | | 0.56% | | $1,000.00 | | $1,022.02 | | $2.81 |
| R1 | | Actual | | 1.55% | | $1,000.00 | | $1,048.50 | | $7.87 |
| | Hypothetical (h) | | 1.55% | | $1,000.00 | | $1,017.11 | | $7.75 |
| R2 (Formerly R3) | | Actual | | 1.05% | | $1,000.00 | | $1,051.12 | | $5.34 |
| | Hypothetical (h) | | 1.05% | | $1,000.00 | | $1,019.59 | | $5.26 |
| R3 (Formerly R4) | | Actual | | 0.81% | | $1,000.00 | | $1,052.40 | | $4.12 |
| | Hypothetical (h) | | 0.81% | | $1,000.00 | | $1,020.78 | | $4.06 |
| R4 (Formerly R5) | | Actual | | 0.56% | | $1,000.00 | | $1,054.78 | | $2.85 |
| | Hypothetical (h) | | 0.56% | | $1,000.00 | | $1,022.02 | | $2.81 |
| (h) | 5% class return per year before expenses. |
| (p) | Expenses paid is equal to each class’ annualized expense ratio, as shown above, multiplied by the average account value over the period, multiplied by the number of days in the period, divided by the number of days in the year. Expenses paid do not include any applicable sales charges (loads). If these transaction costs had been included, your costs would have been higher. |
9
PORTFOLIO OF INVESTMENTS
2/28/09
The Portfolio of Investments is a complete list of all securities owned by your fund. It is categorized by broad-based asset classes.
| | | | | | |
| Bonds - 100.6% | | | | | | |
| Issuer | | Shares/Par | | Value ($) |
| | | | | | |
| Agency - Other - 6.6% | | | | | | |
| Financing Corp., 10.7%, 2017 | | $ | 14,360,000 | | $ | 21,250,136 |
| Financing Corp., 9.4%, 2018 | | | 11,750,000 | | | 16,350,454 |
| Financing Corp., 9.8%, 2018 | | | 14,975,000 | | | 21,328,563 |
| Financing Corp., 10.35%, 2018 | | | 15,165,000 | | | 22,383,464 |
| Financing Corp., STRIPS, 0%, 2017 | | | 18,780,000 | | | 13,238,585 |
| | | | | | |
| | | | | | $ | 94,551,202 |
| Asset Backed & Securitized - 0.7% | | | | | | |
| Banc of America Commercial Mortgage, Inc., FRN, 5.658%, 2049 | | $ | 6,008,260 | | $ | 3,430,144 |
| Commercial Mortgage Pass-Through Certificates, 5.306%, 2046 | | | 5,127,763 | | | 3,309,194 |
JPMorgan Chase Commercial Mortgage Securities Corp.,
5.819%, 2049 | | | 5,431,290 | | | 3,208,158 |
| | | | | | |
| | | | | | $ | 9,947,496 |
| Mortgage Backed - 66.7% | | | | | | |
| Fannie Mae, 4%, 2016 | | $ | 1,900,778 | | $ | 1,916,268 |
| Fannie Mae, 4.35%, 2013 | | | 891,572 | | | 902,840 |
| Fannie Mae, 4.374%, 2013 | | | 2,481,942 | | | 2,521,525 |
| Fannie Mae, 4.5%, 2015 - 2028 | | | 48,221,881 | | | 49,228,451 |
| Fannie Mae, 4.543%, 2013 | | | 1,419,049 | | | 1,450,668 |
| Fannie Mae, 4.56%, 2015 | | | 2,302,118 | | | 2,324,706 |
| Fannie Mae, 4.589%, 2014 | | | 2,716,972 | | | 2,757,429 |
| Fannie Mae, 4.6%, 2014 | | | 1,781,064 | | | 1,807,978 |
| Fannie Mae, 4.62%, 2015 | | | 3,289,967 | | | 3,332,128 |
| Fannie Mae, 4.665%, 2015 | | | 1,554,679 | | | 1,577,725 |
| Fannie Mae, 4.666%, 2014 | | | 5,807,588 | | | 5,902,426 |
| Fannie Mae, 4.69%, 2015 | | | 1,267,008 | | | 1,287,261 |
| Fannie Mae, 4.7%, 2015 | | | 2,385,173 | | | 2,433,280 |
| Fannie Mae, 4.73%, 2012 | | | 2,717,714 | | | 2,796,646 |
| Fannie Mae, 4.74%, 2015 | | | 1,760,789 | | | 1,793,049 |
| Fannie Mae, 4.77%, 2014 | | | 1,533,145 | | | 1,562,846 |
| Fannie Mae, 4.78%, 2015 | | | 1,918,606 | | | 1,957,554 |
| Fannie Mae, 4.786%, 2012 | | | 736,558 | | | 759,136 |
| Fannie Mae, 4.79%, 2012 - 2015 | | | 13,238,228 | | | 13,593,745 |
| Fannie Mae, 4.81%, 2015 | | | 1,652,745 | | | 1,690,849 |
| Fannie Mae, 4.815%, 2015 | | | 1,968,000 | | | 2,011,199 |
| Fannie Mae, 4.82%, 2014 - 2015 | | | 6,473,914 | | | 6,617,158 |
| Fannie Mae, 4.839%, 2014 | | | 8,465,405 | | | 8,666,476 |
10
Portfolio of Investments – continued
| | | | | | |
| Issuer | | Shares/Par | | Value ($) |
| | | | | | |
| Bonds - continued | | | | | | |
| Mortgage Backed - continued | | | | | | |
| Fannie Mae, 4.845%, 2013 | | $ | 3,683,103 | | $ | 3,797,424 |
| Fannie Mae, 4.85%, 2015 | | | 1,417,983 | | | 1,450,996 |
| Fannie Mae, 4.87%, 2015 | | | 1,352,688 | | | 1,385,433 |
| Fannie Mae, 4.872%, 2014 | | | 5,569,601 | | | 5,718,303 |
| Fannie Mae, 4.88%, 2020 | | | 1,214,656 | | | 1,223,648 |
| Fannie Mae, 4.89%, 2015 | | | 1,252,386 | | | 1,284,034 |
| Fannie Mae, 4.92%, 2014 | | | 1,093,248 | | | 1,121,830 |
| Fannie Mae, 4.925%, 2015 | | | 4,735,066 | | | 4,866,044 |
| Fannie Mae, 4.935%, 2014 | | | 773,365 | | | 796,380 |
| Fannie Mae, 4.996%, 2017 | | | 4,415,727 | | | 4,520,018 |
| Fannie Mae, 5%, 2013 - 2027 | | | 60,711,541 | | | 62,316,745 |
| Fannie Mae, 5.05%, 2017 | | | 2,353,000 | | | 2,428,265 |
| Fannie Mae, 5.06%, 2013 - 2017 | | | 3,330,363 | | | 3,436,226 |
| Fannie Mae, 5.09%, 2016 | | | 600,000 | | | 620,907 |
| Fannie Mae, 5.1%, 2014 - 2015 | | | 3,230,119 | | | 3,298,226 |
| Fannie Mae, 5.19%, 2020 | | | 2,074,691 | | | 2,065,671 |
| Fannie Mae, 5.27%, 2016 | | | 650,000 | | | 679,080 |
| Fannie Mae, 5.3%, 2017 | | | 782,526 | | | 816,977 |
| Fannie Mae, 5.369%, 2013 | | | 1,926,024 | | | 1,982,246 |
| Fannie Mae, 5.37%, 2018 | | | 1,880,000 | | | 1,880,286 |
| Fannie Mae, 5.38%, 2017 | | | 2,064,879 | | | 2,165,901 |
| Fannie Mae, 5.423%, 2016 | | | 2,920,122 | | | 3,081,226 |
| Fannie Mae, 5.471%, 2015 | | | 2,364,968 | | | 2,496,579 |
| Fannie Mae, 5.5%, 2017 - 2038 | | | 246,934,693 | | | 253,899,409 |
| Fannie Mae, 5.503%, 2011 | | | 1,743,000 | | | 1,851,120 |
| Fannie Mae, 6%, 2017 - 2037 | | | 87,363,400 | | | 90,513,749 |
| Fannie Mae, 6.088%, 2011 | | | 2,736,000 | | | 2,922,971 |
| Fannie Mae, 6.5%, 2016 - 2037 | | | 26,619,075 | | | 27,965,100 |
| Fannie Mae, 7.5%, 2024 - 2031 | | | 541,425 | | | 579,546 |
| Freddie Mac, 3.75%, 2024 | | | 1,358,617 | | | 1,362,947 |
| Freddie Mac, 4%, 2024 | | | 1,878,828 | | | 1,887,226 |
| Freddie Mac, 4.375%, 2015 | | | 4,759,221 | | | 4,824,437 |
| Freddie Mac, 4.5%, 2010 - 2026 | | | 16,462,652 | | | 16,676,912 |
| Freddie Mac, 5%, 2016 - 2032 | | | 74,123,962 | | | 75,815,512 |
| Freddie Mac, 5.5%, 2021 - 2036 | | | 112,164,167 | | | 115,024,022 |
| Freddie Mac, 6%, 2017 - 2038 | | | 57,609,810 | | | 59,857,455 |
| Freddie Mac, 6.5%, 2016 - 2037 | | | 10,751,356 | | | 11,260,014 |
| Ginnie Mae, 5.5%, 2033 - 2038 | | | 48,029,294 | | | 49,445,041 |
| Ginnie Mae, 5.612%, 2058 | | | 7,718,933 | | | 7,805,771 |
| Ginnie Mae, 6.36%, 2058 | | | 6,992,558 | | | 7,262,700 |
| | | | | | |
| | | | | | $ | 961,277,720 |
11
Portfolio of Investments – continued
| | | | | | |
| Issuer | | Shares/Par | | Value ($) |
| | | | | | |
| Bonds - continued | | | | | | |
| Municipals - 4.1% | | | | | | |
| California Educational Facilities Authority Rev. (Stanford University), “T-1”, 5%, 2039 | | $ | 12,420,000 | | $ | 12,913,819 |
| Harris County, TX, “C”, FSA, 5.25%, 2027 | | | 8,275,000 | | | 8,960,253 |
| Illinois Regional Transportation Authority, “A”, FSA, 5.75%, 2034 | | | 7,665,000 | | | 8,216,650 |
| Massachusetts Bay Transportation Authority, Sales Tax Rev., “A-1”, 5.25%, 2028 | | | 7,075,000 | | | 7,500,137 |
| Massachusetts Health & Educational Facilities Authority Rev. (Boston College), 5.5%, 2027 | | | 5,080,000 | | | 5,573,725 |
| Massachusetts Water Pollution Abatement Trust, 5.25%, 2033 | | | 2,465,000 | | | 2,565,424 |
Massachusetts Water Resources Authority Rev., “B”, FSA,
5.25%, 2035 | | | 8,950,000 | | | 9,130,074 |
New York, Dormitory Authority Rev. (New York University), N,
AMBAC, 5.5%, 2040 | | | 4,050,000 | | | 4,300,979 |
| | | | | | |
| | | | | | $ | 59,161,061 |
| U.S. Government Agencies and Equivalents - 5.9% | | | |
| Aid-Egypt, 4.45%, 2015 | | $ | 7,118,000 | | $ | 7,198,362 |
| Empresa Energetica Cornito Ltd., 6.07%, 2010 | | | 3,157,000 | | | 3,243,344 |
| Farmer Mac, 5.5%, 2011 (n) | | | 11,110,000 | | | 11,895,033 |
| Freddie Mac, 5%, 2017 | | | 5,974,000 | | | 6,560,109 |
| PNC Funding Corp., 2.3%, 2012 (m) | | | 3,470,000 | | | 3,470,531 |
| Small Business Administration, 10.05%, 2009 | | | 843 | | | 849 |
| Small Business Administration, 9.05%, 2009 | | | 7,051 | | | 7,115 |
| Small Business Administration, 9.1%, 2009 | | | 1,928 | | | 1,961 |
| Small Business Administration, 9.5%, 2010 | | | 23,925 | | | 24,344 |
| Small Business Administration, 9.65%, 2010 | | | 30,159 | | | 30,821 |
| Small Business Administration, 9.25%, 2010 | | | 18,679 | | | 19,061 |
| Small Business Administration, 9.7%, 2010 | | | 17,083 | | | 17,366 |
| Small Business Administration, 9.3%, 2010 | | | 52,609 | | | 53,837 |
| Small Business Administration, 8.625%, 2011 | | | 41,733 | | | 42,974 |
| Small Business Administration, 8.8%, 2011 | | | 58,370 | | | 59,529 |
| Small Business Administration, 6.35%, 2021 | | | 2,043,712 | | | 2,191,738 |
| Small Business Administration, 6.34%, 2021 | | | 2,332,230 | | | 2,503,261 |
| Small Business Administration, 6.44%, 2021 | | | 2,090,989 | | | 2,252,939 |
| Small Business Administration, 6.625%, 2021 | | | 2,341,052 | | | 2,538,318 |
| Small Business Administration, 6.07%, 2022 | | | 2,304,229 | | | 2,479,571 |
| Small Business Administration, 4.98%, 2023 | | | 2,156,593 | | | 2,242,981 |
| Small Business Administration, 4.89%, 2023 | | | 5,221,115 | | | 5,452,405 |
| Small Business Administration, 4.77%, 2024 | | | 4,341,295 | | | 4,510,634 |
| Small Business Administration, 5.52%, 2024 | | | 3,275,997 | | | 3,579,101 |
| Small Business Administration, 4.99%, 2024 | | | 3,837,987 | | | 4,038,960 |
| Small Business Administration, 4.86%, 2024 | | | 2,945,358 | | | 3,072,235 |
12
Portfolio of Investments – continued
| | | | | | | |
| Issuer | | Shares/Par | | Value ($) | |
| | | | | | | |
| Bonds - continued | | | | | | | |
| U.S. Government Agencies and Equivalents - continued | | | | |
| Small Business Administration, 4.86%, 2025 | | $ | 4,257,140 | | $ | 4,436,699 | |
| Small Business Administration, 5.11%, 2025 | | | 3,954,208 | | | 4,181,712 | |
| U.S. Department of Housing & Urban Development, 6.36%, 2016 | | | 7,000,000 | | | 7,394,723 | |
| U.S. Department of Housing & Urban Development, 6.59%, 2016 | | | 1,970,000 | | | 1,970,124 | |
| | | | | | | |
| | | | | | $ | 85,470,637 | |
| U.S. Treasury Obligations - 16.6% | | | | | | | |
| U.S. Treasury Bonds, 11.25%, 2015 | | $ | 4,787,000 | | $ | 7,078,403 | |
| U.S. Treasury Bonds, 7.5%, 2016 | | | 3,421,000 | | | 4,415,762 | |
| U.S. Treasury Bonds, 4.75%, 2017 | | | 30,461,000 | | | 34,535,159 | |
| U.S. Treasury Bonds, 6.25%, 2023 | | | 1,445,000 | | | 1,810,088 | |
| U.S. Treasury Bonds, 6%, 2026 | | | 5,933,000 | | | 7,434,791 | |
| U.S. Treasury Bonds, 6.75%, 2026 (f) | | | 6,811,000 | | | 9,220,391 | |
| U.S. Treasury Bonds, 5.25%, 2029 | | | 14,851,000 | | | 17,366,388 | |
| U.S. Treasury Bonds, 6.25%, 2030 | | | 3,166,000 | | | 4,187,035 | |
| U.S. Treasury Notes, 4.75%, 2010 | | | 3,779,000 | | | 3,920,270 | |
| U.S. Treasury Notes, 5.125%, 2011 | | | 91,103,000 | | | 99,401,937 | |
| U.S. Treasury Notes, 4.125%, 2012 | | | 15,630,000 | | | 16,971,976 | |
| U.S. Treasury Notes, 3.625%, 2013 | | | 5,523,000 | | | 5,941,108 | |
| U.S. Treasury Notes, 3.375%, 2013 | | | 2,594,000 | | | 2,767,271 | |
| U.S. Treasury Notes, 3.125%, 2013 | | | 2,280,000 | | | 2,402,372 | |
| U.S. Treasury Notes, 4%, 2014 | | | 2,232,000 | | | 2,454,678 | |
| U.S. Treasury Notes, 3.75%, 2018 | | | 17,894,000 | | | 18,960,661 | |
| | | | | | | |
| | | | | | $ | 238,868,290 | |
| Total Bonds (Identified Cost, $1,407,662,388) | | | | | $ | 1,449,276,406 | |
| | |
| Money Market Funds (v) - 1.6% | | | | | | | |
MFS Institutional Money Market Portfolio, 0.44%,
at Cost and Net Asset Value | | | 22,278,693 | | $ | 22,278,693 | |
| Total Investments (Identified Cost, $1,429,941,081) | | | | | $ | 1,471,555,099 | |
| | |
| Other Assets, Less Liabilities - (2.2)% | | | | | | (31,063,573 | ) |
| Net Assets - 100.0% | | | | | $ | 1,440,491,526 | |
| (f) | All or a portion of the security has been segregated as collateral for open futures contracts. |
| (m) | The debt is guaranteed under the Federal Deposit Insurance Corporation’s (FDIC) Temporary Liquidity Guarantee Program and is backed by the full faith and credit of the United States. The expiration date of the FDIC’s guarantee is the earlier of the maturity date of the debt or June 30, 2012. |
| (n) | Securities exempt from registration under Rule 144A of the Securities Act of 1933. These securities may be sold in the ordinary course of business in transactions exempt from registration, normally to qualified institutional buyers. At period end, the aggregate value of these securities was $11,895,033 representing 0.8% of net assets. |
13
Portfolio of Investments – continued
| (v) | Underlying fund that is available only to investment companies managed by MFS. The rate quoted is the annualized seven-day yield of the fund at period end. |
The following abbreviations are used in this report and are defined:
| FRN | | Floating Rate Note. Interest rate resets periodically and may not be the rate reported at period end. |
| STRIPS | | Separate Trading of Registered Interest and Principal of Securities |
| | |
| Insurers |
| AMBAC | | AMBAC Indemnity Corp. |
| FSA | | Financial Security Assurance Inc. |
Derivative Contracts at 2/28/09
Futures contracts outstanding at 2/28/09
| | | | | | | | |
| Description | | Contracts | | Value | | Expiration
Date | | Unrealized
Appreciation/
(Depreciation) |
| U.S. Treasury Note 2 yr (Long) | | 400 | | $86,643,750 | | Jun-09 | | $ 29,850 |
| U.S. Treasury Note 5 yr (Short) | | 10 | | 1,165,859 | | Jun-09 | | 2,934 |
| U.S. Treasury Bond 30 yr (Short) | | 170 | | 20,968,438 | | Jun-09 | | 571,827 |
| | | | | | | | |
| | | | | | | | $604,611 |
| | | | | | | | |
At February 28, 2009, the fund had sufficient cash and/or other liquid securities to cover any commitments under these derivative contracts.
See Notes to Financial Statements
14
Financial Statements
STATEMENT OF ASSETS AND LIABILITIES
At 2/28/09
This statement represents your fund’s balance sheet, which details the assets and liabilities comprising the total value of the fund.
| | | | | |
| Assets | | | | | |
Investments- | | | | | |
Non-affiliated issuers, at value
(identified cost, $1,407,662,388) | | $1,449,276,406 | | | |
Underlying funds, at cost and value | | 22,278,693 | | | |
Total investments, at value (identified cost, $1,429,941,081) | | | | | $1,471,555,099 |
Cash | | 251,041 | | | |
Receivable for daily variation margin on open
futures contracts | | 339,063 | | | |
Receivable for investments sold | | 1,122 | | | |
Receivable for fund shares sold | | 5,258,284 | | | |
Interest and dividends receivable | | 8,813,050 | | | |
Other assets | | 20,893 | | | |
Total assets | | | | | $1,486,238,552 |
| Liabilities | | | | | |
Distributions payable | | $938,254 | | | |
Payable for investments purchased | | 18,094,980 | | | |
Payable for fund shares reacquired | | 25,987,935 | | | |
Payable to affiliates | | | | | |
Investment adviser | | 40,209 | | | |
Management fee | | 35,598 | | | |
Shareholder servicing costs | | 351,934 | | | |
Distribution and service fees | | 36,676 | | | |
Administrative services fee | | 2,387 | | | |
Payable for independent trustees’ compensation | | 99,729 | | | |
Accrued expenses and other liabilities | | 159,324 | | | |
Total liabilities | | | | | $45,747,026 |
Net assets | | | | | $1,440,491,526 |
| Net assets consist of | | | | | |
Paid-in capital | | $1,440,898,549 | | | |
Unrealized appreciation (depreciation) on investments | | 42,218,629 | | | |
Accumulated net realized gain (loss) on investments | | (43,579,630 | ) | | |
Undistributed net investment income | | 953,978 | | | |
Net assets | | | | | $1,440,491,526 |
Shares of beneficial interest outstanding | | | | | 145,149,022 |
15
Statement of Assets and Liabilities – continued
| | | | |
Class A shares | | | | |
Net assets | | $888,523,061 | | |
Shares outstanding | | 89,531,656 | | |
Net asset value per share | | | | $9.92 |
Offering price per share (100/95.25 × net asset value per share) | | | | $10.41 |
Class B shares | | | | |
Net assets | | $102,851,566 | | |
Shares outstanding | | 10,377,801 | | |
Net asset value and offering price per share | | | | $9.91 |
Class C shares | | | | |
Net assets | | $92,046,481 | | |
Shares outstanding | | 9,252,626 | | |
Net asset value and offering price per share | | | | $9.95 |
Class I shares | | | | |
Net assets | | $286,370,932 | | |
Shares outstanding | | 28,858,846 | | |
Net asset value, offering price, and redemption price per share | | | | $9.92 |
Class R1 shares | | | | |
Net assets | | $5,713,298 | | |
Shares outstanding | | 576,253 | | |
Net asset value, offering price, and redemption price per share | | | | $9.91 |
Class R2 shares (formerly Class R3 shares) | | | | |
Net assets | | $35,616,038 | | |
Shares outstanding | | 3,592,276 | | |
Net asset value, offering price, and redemption price per share | | | | $9.91 |
Class R3 shares (formerly Class R4 shares) | | | | |
Net assets | | $25,008,696 | | |
Shares outstanding | | 2,520,180 | | |
Net asset value, offering price, and redemption price per share | | | | $9.92 |
Class R4 shares (formerly Class R5 shares) | | | | |
Net assets | | $4,361,454 | | |
Shares outstanding | | 439,384 | | |
Net asset value, offering price, and redemption price per share | | | | $9.93 |
On sales of $50,000 or more, the offering price of Class A shares is reduced. A contingent deferred sales charge may be imposed on redemptions of Class A, Class B, and Class C shares.
See Notes to Financial Statements
16
Financial Statements
STATEMENT OF OPERATIONS
Year ended 2/28/09
This statement describes how much your fund earned in investment income and accrued in expenses. It also describes any gains and/or losses generated by fund operations.
| | | | | |
| Net investment income | | | | | |
Income | | | | | |
Interest | | $66,012,699 | | | |
Dividends from underlying funds | | 401,837 | | | |
Total investment income | | | | | $66,414,536 |
Expenses | | | | | |
Management fee | | $5,531,441 | | | |
Distribution and service fees | | 3,646,041 | | | |
Shareholder servicing costs | | 2,764,790 | | | |
Administrative services fee | | 233,515 | | | |
Independent trustees’ compensation | | 46,915 | | | |
Custodian fee | | 179,289 | | | |
Shareholder communications | | 80,827 | | | |
Auditing fees | | 50,789 | | | |
Legal fees | | 32,512 | | | |
Miscellaneous | | 209,667 | | | |
Total expenses | | | | | $12,775,786 |
Reduction of expenses by investment adviser | | (1,507,856 | ) | | |
Net expenses | | | | | $11,267,930 |
Net investment income | | | | | $55,146,606 |
| Realized and unrealized gain (loss) on investments | | | | | |
Realized gain (loss) (identified cost basis) | | | | | |
Investment transactions in non-affiliated issuers | | $19,156,923 | | | |
Futures contracts | | (1,030,078 | ) | | |
Net realized gain (loss) on investments | | | | | $18,126,845 |
Change in unrealized appreciation (depreciation) | | | | | |
Investments | | $8,099,863 | | | |
Futures contracts | | 604,611 | | | |
Net unrealized gain (loss) on investments | | | | | $8,704,474 |
Net realized and unrealized gain (loss) on investments | | | | | $26,831,319 |
Change in net assets from operations | | | | | $81,977,925 |
See Notes to Financial Statements
17
Financial Statements
STATEMENTS OF CHANGES IN NET ASSETS
These statements describe the increases and/or decreases in net assets resulting from operations, any distributions, and any shareholder transactions.
| | | | | | |
| | | Years ended | |
| | | 2/28/09 | | | 2/29/08 | |
| Change in net assets | | | | | | |
| From operations | | | | | | |
Net investment income | | $55,146,606 | | | $58,023,488 | |
Net realized gain (loss) on investments | | 18,126,845 | | | 6,971,845 | |
Net unrealized gain (loss) on investments | | 8,704,474 | | | 37,633,795 | |
Change in net assets from operations | | $81,977,925 | | | $102,629,128 | |
| Distributions declared to shareholders | | | | | | |
From net investment income | | | | | | |
Class A | | $(34,212,413 | ) | | $(33,087,659 | ) |
Class B | | (3,368,060 | ) | | (4,002,420 | ) |
Class C | | (1,920,789 | ) | | (1,069,855 | ) |
Class I | | (18,559,115 | ) | | (22,038,804 | ) |
Class R (b) | | (27,242 | ) | | (280,019 | ) |
Class R1 | | (168,193 | ) | | (74,800 | ) |
Former Class R2 (b) | | (7,080 | ) | | (50,680 | ) |
Class R2 (formerly Class R3) | | (1,019,497 | ) | | (305,879 | ) |
Class R3 (formerly Class R4) | | (851,472 | ) | | (519,702 | ) |
Class R4 (formerly Class R5) | | (180,030 | ) | | (94,802 | ) |
Class 529A | | — | | | (883 | ) |
Class 529B | | — | | | (695 | ) |
Class 529C | | — | | | (447 | ) |
Total distributions declared to shareholders | | $(60,313,891 | ) | | $(61,526,645 | ) |
Change in net assets from fund share transactions | | $56,939,681 | | | $(19,517,789 | ) |
Total change in net assets | | $78,603,715 | | | $21,584,694 | |
| Net assets | | | | | | |
At beginning of period | | 1,361,887,811 | | | 1,340,303,117 | |
At end of period (including undistributed net investment income of $953,978 and $1,565,004, respectively) | | $1,440,491,526 | | | $1,361,887,811 | |
| (b) | At the close of business on April 18, 2008, Class R and Class R2 shares converted into Class R3 shares. Following the conversion, Class R3 shares were renamed Class R2 shares. |
See Notes to Financial Statements
18
Financial Statements
FINANCIAL HIGHLIGHTS
The financial highlights table is intended to help you understand the fund’s financial performance for the past 5 years (or life of a particular share class, if shorter). Certain information reflects financial results for a single fund share. The total returns in the table represent the rate by which an investor would have earned (or lost) on an investment in the fund share class (assuming reinvestment of all distributions) held for the entire period.
| | | | | | | | | | | | | | | |
| Class A | | Years ended 2/29, 2/28 | |
| | | 2009 | | | 2008 | | | 2007 | | | 2006 | | | 2005 | |
Net asset value, beginning of period | | $9.78 | | | $9.48 | | | $9.47 | | | $9.65 | | | $9.84 | |
Income (loss) from
investment operations | | | | | | | | | | | | | | | |
Net investment income (d) | | $0.39 | | | $0.41 | | | $0.40 | | | $0.39 | | | $0.36 | |
Net realized and unrealized gain (loss)
on investments | | 0.17 | | | 0.33 | | | 0.04 | | | (0.17 | ) | | (0.19 | ) |
Total from investment operations | | $0.56 | | | $0.74 | | | $0.44 | | | $0.22 | | | $0.17 | |
Less distributions declared
to shareholders | | | | | | | | | | | | | | | |
From net investment income | | $(0.42 | ) | | $(0.44 | ) | | $(0.43 | ) | | $(0.40 | ) | | $(0.36 | ) |
Net asset value, end of period | | $9.92 | | | $9.78 | | | $9.48 | | | $9.47 | | | $9.65 | |
Total return (%) (r)(s)(t) | | 5.95 | | | 8.02 | | | 4.75 | | | 2.28 | | | 1.81 | |
Ratios (%) (to average net assets)
and Supplemental data: | | | | | | | | | | | | | | | |
Expenses before expense reductions (f) | | 0.91 | | | 0.84 | | | 0.88 | | | 0.90 | | | 0.93 | |
Expenses after expense reductions (f) | | 0.80 | | | 0.73 | | | 0.78 | | | 0.80 | | | 0.83 | |
Net investment income | | 3.98 | | | 4.35 | | | 4.29 | | | 4.03 | | | 3.75 | |
Portfolio turnover | | 57 | | | 55 | | | 14 | | | 73 | | | 126 | |
Net assets at end of period (000 Omitted) | | $888,523 | | | $740,620 | | | $731,126 | | | $826,001 | | | $932,879 | |
See Notes to Financial Statements
19
Financial Highlights – continued
| | | | | | | | | | | | | | | |
| Class B | | Years ended 2/29, 2/28 | |
| | | 2009 | | | 2008 | | | 2007 | | | 2006 | | | 2005 | |
Net asset value, beginning of period | | $9.77 | | | $9.47 | | | $9.46 | | | $9.64 | | | $9.83 | |
Income (loss) from
investment operations | | | | | | | | | | | | | | | |
Net investment income (d) | | $0.32 | | | $0.34 | | | $0.33 | | | $0.31 | | | $0.29 | |
Net realized and unrealized gain (loss)
on investments | | 0.17 | | | 0.33 | | | 0.04 | | | (0.16 | ) | | (0.18 | ) |
Total from investment operations | | $0.49 | | | $0.67 | | | $0.37 | | | $0.15 | | | $0.11 | |
Less distributions declared
to shareholders | | | | | | | | | | | | | | | |
From net investment income | | $(0.35 | ) | | $(0.37 | ) | | $(0.36 | ) | | $(0.33 | ) | | $(0.30 | ) |
Net asset value, end of period | | $9.91 | | | $9.77 | | | $9.47 | | | $9.46 | | | $9.64 | |
Total return (%) (r)(s)(t) | | 5.16 | | | 7.22 | | | 3.97 | | | 1.52 | | | 1.12 | |
Ratios (%) (to average net assets)
and Supplemental data: | | | | | | | | | | | | | | | |
Expenses before expense reductions (f) | | 1.66 | | | 1.59 | | | 1.64 | | | 1.65 | | | 1.62 | |
Expenses after expense reductions (f) | | 1.55 | | | 1.49 | | | 1.54 | | | 1.55 | | | 1.52 | |
Net investment income | | 3.25 | | | 3.61 | | | 3.55 | | | 3.27 | | | 3.03 | |
Portfolio turnover | | 57 | | | 55 | | | 14 | | | 73 | | | 126 | |
Net assets at end of period (000 Omitted) | | $102,852 | | | $94,206 | | | $124,277 | | | $175,207 | | | $233,734 | |
| |
| Class C | | Years ended 2/29, 2/28 | |
| | | 2009 | | | 2008 | | | 2007 | | | 2006 | | | 2005 | |
Net asset value, beginning of period | | $9.81 | | | $9.51 | | | $9.50 | | | $9.68 | | | $9.87 | |
Income (loss) from
investment operations | | | | | | | | | | | | | | | |
Net investment income (d) | | $0.31 | | | $0.34 | | | $0.33 | | | $0.32 | | | $0.29 | |
Net realized and unrealized gain (loss)
on investments | | 0.18 | | | 0.33 | | | 0.04 | | | (0.17 | ) | | (0.18 | ) |
Total from investment operations | | $0.49 | | | $0.67 | | | $0.37 | | | $0.15 | | | $0.11 | |
Less distributions declared
to shareholders | | | | | | | | | | | | | | | |
From net investment income | | $(0.35 | ) | | $(0.37 | ) | | $(0.36 | ) | | $(0.33 | ) | | $(0.30 | ) |
Net asset value, end of period | | $9.95 | | | $9.81 | | | $9.51 | | | $9.50 | | | $9.68 | |
Total return (%) (r)(s)(t) | | 5.16 | | | 7.21 | | | 3.97 | | | 1.52 | | | 1.13 | |
Ratios (%) (to average net assets)
and Supplemental data: | | | | | | | | | | | | | | | |
Expenses before expense reductions (f) | | 1.66 | | | 1.59 | | | 1.64 | | | 1.65 | | | 1.62 | |
Expenses after expense reductions (f) | | 1.55 | | | 1.49 | | | 1.54 | | | 1.55 | | | 1.52 | |
Net investment income | | 3.21 | | | 3.59 | | | 3.55 | | | 3.27 | | | 2.95 | |
Portfolio turnover | | 57 | | | 55 | | | 14 | | | 73 | | | 126 | |
Net assets at end of period (000 Omitted) | | $92,046 | | | $35,316 | | | $27,529 | | | $35,768 | | | $44,692 | |
See Notes to Financial Statements
20
Financial Highlights – continued
| | | | | | | | | | | | | | | |
| Class I | | Years ended 2/29, 2/28 | |
| | | 2009 | | | 2008 | | | 2007 | | | 2006 | | | 2005 | |
Net asset value, beginning of period | | $9.78 | | | $9.48 | | | $9.47 | | | $9.65 | | | $9.84 | |
Income (loss) from
investment operations | | | | | | | | | | | | | | | |
Net investment income (d) | | $0.41 | | | $0.44 | | | $0.42 | | | $0.41 | | | $0.39 | |
Net realized and unrealized gain (loss)
on investments | | 0.18 | | | 0.32 | | | 0.04 | | | (0.17 | ) | | (0.19 | ) |
Total from investment operations | | $0.59 | | | $0.76 | | | $0.46 | | | $0.24 | | | $0.20 | |
Less distributions declared
to shareholders | | | | | | | | | | | | | | | |
From net investment income | | $(0.45 | ) | | $(0.46 | ) | | $(0.45 | ) | | $(0.42 | ) | | $(0.39 | ) |
Net asset value, end of period | | $9.92 | | | $9.78 | | | $9.48 | | | $9.47 | | | $9.65 | |
Total return (%) (r)(s) | | 6.21 | | | 8.28 | | | 5.01 | | | 2.54 | | | 2.14 | |
Ratios (%) (to average net assets)
and Supplemental data: | | | | | | | | | | | | | | | |
Expenses before expense reductions (f) | | 0.66 | | | 0.59 | | | 0.63 | | | 0.65 | | | 0.60 | |
Expenses after expense reductions (f) | | 0.55 | | | 0.48 | | | 0.53 | | | 0.55 | | | 0.50 | |
Net investment income | | 4.26 | | | 4.61 | | | 4.54 | | | 4.34 | | | 4.09 | |
Portfolio turnover | | 57 | | | 55 | | | 14 | | | 73 | | | 126 | |
Net assets at end of period (000 Omitted) | | $286,371 | | | $449,109 | | | $432,536 | | | $359,623 | | | $279,080 | |
| | | | | | | | | | | | |
| Class R1 | | Years ended 2/29, 2/28 | |
| | | 2009 | | | 2008 | | | 2007 | | | 2006 (i) | |
Net asset value, beginning of period | | $9.77 | | | $9.48 | | | $9.46 | | | $9.57 | |
| Income (loss) from investment operations | | | | | | | | | | | | |
Net investment income (d) | | $0.32 | | | $0.33 | | | $0.32 | | | $0.29 | |
Net realized and unrealized gain (loss)
on investments | | 0.17 | | | 0.32 | | | 0.05 | | | (0.12 | )(g) |
Total from investment operations | | $0.49 | | | $0.65 | | | $0.37 | | | $0.17 | |
| Less distributions declared to shareholders | | | | | | | | | | | | |
From net investment income | | $(0.35 | ) | | $(0.36 | ) | | $(0.35 | ) | | $(0.28 | ) |
Net asset value, end of period | | $9.91 | | | $9.77 | | | $9.48 | | | $9.46 | |
Total return (%) (r)(s) | | 5.16 | | | 7.00 | | | 3.98 | | | 1.82 | (n) |
Ratios (%) (to average net assets)
and Supplemental data: | | | | | | | | | | | | |
Expenses before expense reductions (f) | | 1.66 | | | 1.68 | | | 1.82 | | | 1.85 | (a) |
Expenses after expense reductions (f) | | 1.55 | | | 1.58 | | | 1.62 | | | 1.68 | (a) |
Net investment income | | 3.24 | | | 3.45 | | | 3.45 | | | 3.25 | (a) |
Portfolio turnover | | 57 | | | 55 | | | 14 | | | 73 | |
Net assets at end of period (000 Omitted) | | $5,713 | | | $3,832 | | | $586 | | | $192 | |
See Notes to Financial Statements
21
Financial Highlights – continued
| | | | | | | | | | | | | | | |
| Class R2 (formerly Class R3) | | Years ended 2/29, 2/28 | |
| | | 2009 | | | 2008 | | | 2007 | | | 2006 | | | 2005 | |
Net asset value, beginning of period | | $9.77 | | | $9.48 | | | $9.47 | | | $9.65 | | | $9.84 | |
Income (loss) from
investment operations | | | | | | | | | | | | | | | |
Net investment income (d) | | $0.36 | | | $0.37 | | | $0.37 | | | $0.35 | | | $0.38 | |
Net realized and unrealized gain (loss)
on investments | | 0.18 | | | 0.32 | | | 0.03 | | | (0.18 | ) | | (0.25 | ) |
Total from investment operations | | $0.54 | | | $0.69 | | | $0.40 | | | $0.17 | | | $0.13 | |
Less distributions declared
to shareholders | | | | | | | | | | | | | | | |
From net investment income | | $(0.40 | ) | | $(0.40 | ) | | $(0.39 | ) | | $(0.35 | ) | | $(0.32 | ) |
Net asset value, end of period | | $9.91 | | | $9.77 | | | $9.48 | | | $9.47 | | | $9.65 | |
Total return (%) (r)(s) | | 5.69 | | | 7.51 | | | 4.34 | | | 1.82 | | | 1.38 | |
Ratios (%) (to average net assets)
and Supplemental data: | | | | | | | | | | | | | | | |
Expenses before expense reductions (f) | | 1.16 | | | 1.19 | | | 1.37 | | | 1.40 | | | 1.36 | |
Expenses after expense reductions (f) | | 1.05 | | | 1.09 | | | 1.17 | | | 1.24 | | | 1.26 | |
Net investment income | | 3.74 | | | 3.95 | | | 3.89 | | | 3.64 | | | 3.99 | |
Portfolio turnover | | 57 | | | 55 | | | 14 | | | 73 | | | 126 | |
Net assets at end of period (000 Omitted) | | $35,616 | | | $13,863 | | | $3,928 | | | $1,392 | | | $422 | |
| | | | | | | | | | | | |
| Class R3 (formerly Class R4) | | Years ended 2/29, 2/28 | |
| | | 2009 | | | 2008 | | | 2007 | | | 2006 (i) | |
Net asset value, beginning of period | | $9.78 | | | $9.48 | | | $9.48 | | | $9.58 | |
| Income (loss) from investment operations | | | | | | | | | | | | |
Net investment income (d) | | $0.39 | | | $0.40 | | | $0.39 | | | $0.36 | |
Net realized and unrealized gain (loss)
on investments | | 0.17 | | | 0.33 | | | 0.02 | | | (0.11 | )(g) |
Total from investment operations | | $0.56 | | | $0.73 | | | $0.41 | | | $0.25 | |
| Less distributions declared to shareholders | | | | | | | | | | | | |
From net investment income | | $(0.42 | ) | | $(0.43 | ) | | $(0.41 | ) | | $(0.35 | ) |
Net asset value, end of period | | $9.92 | | | $9.78 | | | $9.48 | | | $9.48 | |
Total return (%) (r)(s) | | 5.95 | | | 7.88 | | | 4.49 | | | 2.64 | (n) |
Ratios (%) (to average net assets)
and Supplemental data: | | | | | | | | | | | | |
Expenses before expense reductions (f) | | 0.91 | | | 0.95 | | | 1.02 | | | 1.05 | (a) |
Expenses after expense reductions (f) | | 0.80 | | | 0.85 | | | 0.92 | | | 0.95 | (a) |
Net investment income | | 3.98 | | | 4.21 | | | 4.15 | | | 4.02 | (a) |
Portfolio turnover | | 57 | | | 55 | | | 14 | | | 73 | |
Net assets at end of period (000 Omitted) | | $25,009 | | | $15,317 | | | $8,108 | | | $1,305 | |
See Notes to Financial Statements
22
Financial Highlights – continued
| | | | | | | | | | | | |
| Class R4 (formerly Class R5) | | Years ended 2/29, 2/28 | |
| | | 2009 | | | 2008 | | | 2007 | | | 2006 (i) | |
Net asset value, beginning of period | | $9.78 | | | $9.51 | | | $9.47 | | | $9.58 | |
| Income (loss) from investment operations | | | | | | | | | | | | |
Net investment income (d) | | $0.41 | | | $0.43 | | | $0.42 | | | $0.37 | |
Net realized and unrealized gain (loss)
on investments | | 0.19 | | | 0.29 | | | 0.06 | | | (0.10 | )(g) |
Total from investment operations | | $0.60 | | | $0.72 | | | $0.48 | | | $0.27 | |
| Less distributions declared to shareholders | | | | | | | | | | | | |
From net investment income | | $(0.45 | ) | | $(0.45 | ) | | $(0.44 | ) | | $(0.38 | ) |
Net asset value, end of period | | $9.93 | | | $9.78 | | | $9.51 | | | $9.47 | |
Total return (%) (r)(s) | | 6.32 | | | 7.85 | | | 5.24 | | | 2.81 | (n) |
Ratios (%) (to average net assets)
and Supplemental data: | | | | | | | | | | | | |
Expenses before expense reductions (f) | | 0.66 | | | 0.65 | | | 0.73 | | | 0.75 | (a) |
Expenses after expense reductions (f) | | 0.55 | | | 0.55 | | | 0.63 | | | 0.65 | (a) |
Net investment income | | 4.23 | | | 4.47 | | | 4.44 | | | 4.20 | (a) |
Portfolio turnover | | 57 | | | 55 | | | 14 | | | 73 | |
Net assets at end of period (000 Omitted) | | $4,361 | | | $3,772 | | | $54 | | | $51 | |
Any redemption fees charged by the fund during the 2005 fiscal year resulted in a per share impact of less than $0.01.
| (d) | Per share data are based on average shares outstanding. |
| (f) | Ratios do not reflect reductions from fees paid indirectly, if applicable. |
| (g) | The per share amount is not in accordance with the net realized and unrealized gain/loss for the period because of the timing of sales of fund shares and the per share amount of realized and unrealized gains and losses at such time. |
| (i) | For the period from the class’ inception, April 1, 2005 (Classes R1, R3, and R4) through the stated period end. |
| (r) | Certain expenses have been reduced without which performance would have been lower. |
| (s) | From time to time the fund may receive proceeds from litigation settlements, without which performance would be lower. |
| (t) | Total returns do not include any applicable sales charges. |
See Notes to Financial Statements
23
NOTES TO FINANCIAL STATEMENTS
| (1) | | Business and Organization |
MFS Government Securities Fund (the fund) is a series of MFS Series Trust XIII (the trust). The trust is organized as a Massachusetts business trust and is registered under the Investment Company Act of 1940, as amended, as an open-end management investment company.
| (2) | | Significant Accounting Policies |
General – The preparation of financial statements in conformity with U.S. generally accepted accounting principles requires management to make estimates and assumptions that affect the reported amounts of assets and liabilities, and disclosure of contingent assets and liabilities at the date of the financial statements and the reported amounts of revenues and expenses during the reporting period. Actual results could differ from those estimates.
The fund may invest a significant portion of its assets in asset-backed and/or mortgage-backed securities. The value of these securities may depend, in part, on the issuer’s or borrower’s credit quality or ability to pay principal and interest when due and may fall if an issuer or borrower defaults on its obligation to pay principal or interest or if the instrument’s credit rating is downgraded by a credit rating agency. U.S. Government securities not supported as to the payment of principal or interest by the U.S. Treasury, such as those issued by Fannie Mae, Freddie Mac, and the Federal Home Loan Banks, are subject to greater credit risk than are U.S. Government securities supported by the U.S. Treasury, such as those issued by Ginnie Mae.
Investment Valuations – Debt instruments and floating rate loans (other than short-term instruments), including restricted debt instruments, are generally valued at an evaluated or composite bid as provided by a third-party pricing service. Short-term instruments with a maturity at issuance of 60 days or less generally are valued at amortized cost, which approximates market value. Exchange-traded options are generally valued at the last sale or official closing price as provided by a third-party pricing service on the exchange on which such options are primarily traded. Exchange-traded options for which there were no sales reported that day are generally valued at the last daily bid quotation as provided by a third-party pricing service on the exchange on which such options are primarily traded. Options not traded on an exchange are generally valued at a broker/dealer bid quotation. Foreign currency options are generally valued using an external pricing model that uses market data from a third-party source. Futures contracts are generally valued at last posted settlement price as provided by a third-party pricing service on the market on which they are primarily traded. Futures contracts for which there were no trades that day for a particular position are generally valued at the closing bid quotation as provided by a third-party pricing service on the market on which
24
Notes to Financial Statements – continued
such futures contracts are primarily traded. Open-end investment companies are generally valued at net asset value per share. Securities and other assets generally valued on the basis of information from a third-party pricing service may also be valued at a broker/dealer bid quotation. Values obtained from pricing services can utilize both dealer-supplied valuations and electronic data processing techniques, which take into account factors such as institutional-size trading in similar groups of securities, yield, quality, coupon rate, maturity, type of issue, trading characteristics, and other market data.
The Board of Trustees has delegated primary responsibility for determining or causing to be determined the value of the fund’s investments (including any fair valuation) to the adviser pursuant to valuation policies and procedures approved by the Board. If the adviser determines that reliable market quotations are not readily available, investments are valued at fair value as determined in good faith by the adviser in accordance with such procedures under the oversight of the Board of Trustees. Under the fund’s valuation policies and procedures, market quotations are not considered to be readily available for most types of debt instruments and floating rate loans and many types of derivatives. These investments are generally valued at fair value based on information from third party pricing services. In addition, investments may be valued at fair value if the adviser determines that an investment’s value has been materially affected by events occurring after the close of the exchange or market on which the investment is principally traded (such as foreign exchange or market) and prior to the determination of the fund’s net asset value, or after the halting of trading of a specific security where trading does not resume prior to the close of the exchange or market on which the security is principally traded. The adviser may rely on third party pricing services or other information (such as the correlation with price movements of similar securities in the same or other markets; the type, cost and investment characteristics of the security; the business and financial condition of the issuer; and trading and other market data) to assist in determining whether to fair value and at what value to fair value an investment. The value of an investment for purposes of calculating the fund’s net asset value can differ depending on the source and method used to determine value. When fair valuation is used, the value of investments used to determine the fund’s net asset value may differ from quoted or published prices for the same investments. There can be no assurance that the fund could obtain the fair value assigned to an investment if it were to sell the investment at the same time at which the fund determines its net asset value per share.
The fund adopted FASB Statement No. 157, Fair Value Measurements (the “Statement”). This Statement provides a single definition of fair value, a hierarchy for measuring fair value and expanded disclosures about fair value measurements.
Various inputs are used in determining the value of the fund’s assets or liabilities carried at market value. These inputs are categorized into three
25
Notes to Financial Statements – continued
broad levels. Level 1 includes quoted prices in active markets for identical assets or liabilities. Level 2 includes other significant observable market-based inputs (including quoted prices for similar securities, interest rates, prepayment speed, and credit risk). Level 3 includes unobservable inputs, which may include the adviser’s own assumptions in determining the fair value of investments. Other financial instruments are derivative instruments not reflected in total investments, such as futures, forwards, swap contracts and written options, which are valued at the unrealized appreciation/depreciation on the instrument. The following is a summary of the levels used as of February 28, 2009 in valuing the fund’s assets or liabilities carried at market value:
| | | | | | | | |
| | | Level 1 | | Level 2 | | Level 3 | | Total |
| Investments in Securities | | $22,278,693 | | $1,449,276,406 | | $— | | $1,471,555,099 |
| Other Financial Instruments | | $604,611 | | $— | | $— | | $604,611 |
Derivative Risk – The fund may invest in derivatives for hedging or non-hedging purposes. While hedging can reduce or eliminate losses, it can also reduce or eliminate gains. When the fund uses derivatives as an investment to gain market exposure, or for hedging purposes, gains and losses from derivative instruments may be substantially greater than the derivative’s original cost. Cash that has been segregated on behalf of certain derivative contracts will be reported separately on the Statement of Assets and Liabilities as restricted cash. On some over-the-counter derivatives, the fund attempts to reduce its exposure to counterparty credit risk by entering into an ISDA Master Agreement on a bilateral basis with each of the counterparties with whom it undertakes a significant volume of transactions. The ISDA Master Agreement gives the fund the right, upon an event of default by the applicable counterparty, to close out all transactions traded under such agreement and to net amounts owed under each transaction to one net amount payable by one party to the other. This right to close out and net payments across all transactions traded under the ISDA Master Agreement could result in a reduction of the fund’s credit risk to such counterparty equal to any amounts payable by the fund under the applicable transactions, if any. However, absent an event of default by the counterparty, the ISDA Master Agreement does not result in an offset of reported balance sheet assets and liabilities across transactions between the fund and the applicable counterparty. Derivative instruments include purchased options and futures contracts.
In March 2008, FASB Statement No. 161, Disclosures about Derivative Instruments and Hedging Activities (the “Standard”) was issued, and is effective for financial statements issued for fiscal years and interim periods beginning after November 15, 2008. This Standard provides enhanced disclosures about the fund’s use of and accounting for derivative instruments and the effect of derivative instruments on the fund’s results of operations and
26
Notes to Financial Statements – continued
financial position. Management is evaluating the application of the Standard to the fund, and has not at this time determined the impact, if any, resulting from the adoption of this Standard on the fund’s financial statements.
FASB Staff Position (FSP) 133-1 was implemented during the period. FSP 133-1 amends FAS 133 to require sellers of credit derivatives to make disclosures that will enable financial statement users to assess the potential effects of those credit derivatives on an entity’s financial position, financial performance and cash flows. There was no impact from implementing FSP 133-1 as the fund did not hold any of these credit derivatives at period end.
Purchased Options – The fund may purchase call or put options for a premium. Purchasing call options may be a hedge against an anticipated increase in the dollar cost of securities to be acquired or to increase the fund’s exposure to the underlying instrument. Purchasing put options may hedge against a decline in the value of portfolio securities. The premium paid is included as an investment in the Statement of Assets and Liabilities and is subsequently adjusted to the current value of the option. Premiums paid for purchased options which have expired are treated as realized losses on investments in the Statement of Operations. Premiums paid for purchased options which are exercised or closed are added to the amount paid or offset against the proceeds on the underlying security or financial instrument to determine the realized gain or loss. The risk of loss associated with purchased options is limited to the premium paid.
Futures Contracts – The fund may enter into futures contracts for the delayed delivery of securities or currency, or contracts based on financial indices at a fixed price on a future date. In entering such contracts, the fund is required to deposit with the broker either in cash or securities an amount equal to a certain percentage of the contract amount. Subsequent payments are made or received by the fund each day, depending on the daily fluctuations in the value of the contract, and are recorded for financial statement purposes as unrealized gains or losses by the fund. Upon entering into such contracts, the fund bears the risk of interest or exchange rates or securities prices moving unexpectedly, in which case, the fund may not achieve the anticipated benefits of the futures contracts and may realize a loss.
Indemnifications – Under the fund’s organizational documents, its officers and trustees may be indemnified against certain liabilities and expenses arising out of the performance of their duties to the fund. Additionally, in the normal course of business, the fund enters into agreements with service providers that may contain indemnification clauses. The fund’s maximum exposure under these agreements is unknown as this would involve future claims that may be made against the fund that have not yet occurred.
Investment Transactions and Income – Investment transactions are recorded on the trade date. Some securities may be purchased on a “when-issued” or
27
Notes to Financial Statements – continued
“forward delivery” basis, which means that the securities will be delivered to the fund at a future date, usually beyond customary settlement time. Interest income is recorded on the accrual basis. All premium and discount is amortized or accreted for financial statement purposes in accordance with U.S. generally accepted accounting principles. Dividends received in cash are recorded on the ex-dividend date. Dividend and interest payments received in additional securities are recorded on the ex-dividend or ex-interest date in an amount equal to the value of the security on such date.
The fund may receive proceeds from litigation settlements. Any proceeds received from litigation involving portfolio holdings are reflected in the Statement of Operations in realized gain/loss if the security has been disposed of by the fund or in unrealized gain/loss if the security is still held by the fund. Any other proceeds from litigation not related to portfolio holdings are reflected as other income in the Statement of Operations.
The fund may enter into “TBA” (to be announced) purchase commitments to purchase securities for a fixed unit price at a future date. Although the unit price has been established, the principal value has not been finalized. However, the principal amount of the commitments will not fluctuate more than 0.01%. The fund holds, and maintains until settlement date, cash or high-grade debt obligations in an amount sufficient to meet the purchase price, or the fund may enter into offsetting contracts for the forward sale of other securities it owns. Income on the securities will not be earned until settlement date. TBA purchase commitments may be considered securities in themselves, and involve a risk of loss if the value of the security to be purchased declines prior to settlement date, which is in addition to the risk of decline in the value of the fund’s other assets. Unsettled TBA purchase commitments are valued at the current market value of the underlying securities.
The fund may enter into “TBA” (to be announced) sale commitments to hedge its portfolio positions or to sell mortgage-backed securities it owns under delayed delivery arrangements. Proceeds of TBA sale commitments are not received until the contractual settlement date. During the time a TBA sale commitment is outstanding, equivalent deliverable securities, or an offsetting TBA purchase commitment deliverable on or before the sale commitment date, are held as “cover” for the transaction.
Fees Paid Indirectly – The fund’s custody fee may be reduced according to an arrangement that measures the value of cash deposited with the custodian by the fund. For the year ended February 28, 2009, custody fees were not reduced.
Tax Matters and Distributions – The fund intends to qualify as a regulated investment company, as defined under Subchapter M of the Internal Revenue Code, and to distribute all of its taxable income, including realized capital gains. As a result, no provision for federal income tax is required. The fund’s
28
Notes to Financial Statements – continued
federal tax returns for the prior three fiscal years remain subject to examination by the Internal Revenue Service. Foreign taxes, if any, have been accrued by the fund in the accompanying financial statements.
Distributions to shareholders are recorded on the ex-dividend date. Income and capital gain distributions are determined in accordance with income tax regulations, which may differ from U.S. generally accepted accounting principles. Certain capital accounts in the financial statements are periodically adjusted for permanent differences in order to reflect their tax character. These adjustments have no impact on net assets or net asset value per share. Temporary differences which arise from recognizing certain items of income, expense, gain or loss in different periods for financial statement and tax purposes will reverse at some time in the future. Distributions in excess of net investment income or net realized gains are temporary overdistributions for financial statement purposes resulting from differences in the recognition or classification of income or distributions for financial statement and tax purposes.
Book/tax differences primarily relate to amortization and accretion of debt securities and straddle loss deferrals.
The tax character of distributions declared to shareholders for the last two fiscal years is as follows:
| | | | |
| | | 2/28/09 | | 2/29/08 |
| Ordinary income (including any short-term capital gains) | | $60,313,891 | | $61,526,645 |
The federal tax cost and the tax basis components of distributable earnings were as follows:
| | | |
| As of 2/28/09 | | | |
| Cost of investments | | $1,441,906,577 | |
| Gross appreciation | | 33,679,387 | |
| Gross depreciation | | (4,030,865 | ) |
| Net unrealized appreciation (depreciation) | | $29,648,522 | |
| Undistributed ordinary income | | 6,078,897 | |
| Capital loss carryforwards | | (28,733,971 | ) |
| Other temporary differences | | (7,400,471 | ) |
As of February 28, 2009, the fund had capital loss carryforwards available to offset future realized gains. Such losses expire as follows:
| | | |
| 2/29/12 | | $(3,884,031 | ) |
| 2/28/13 | | (11,095,767 | ) |
| 2/28/14 | | (6,955,037 | ) |
| 2/28/15 | | (6,799,136 | ) |
| | $(28,733,971 | ) |
29
Notes to Financial Statements – continued
The availability of a portion of the capital loss carryforwards, which were acquired on November 19, 2004, in connection with the MFS Government Mortgage Fund merger, may be limited in a given year.
Multiple Classes of Shares of Beneficial Interest – The fund offers multiple classes of shares, which differ in their respective distribution and service fees. The fund’s income and common expenses are allocated to shareholders based on the value of settled shares outstanding of each class. The fund’s realized and unrealized gain (loss) are allocated to shareholders based on the daily net assets of each class. Dividends are declared separately for each class. Differences in per share dividend rates are generally due to differences in separate class expenses. Class B shares will convert to Class A shares approximately eight years after purchase. At the close of business on April 18, 2008, Class R and Class R2 shares converted into Class R3 shares. Following this conversion, Class R3, Class R4, and Class R5 shares were renamed Class R2, Class R3, and Class R4 shares, respectively. Class 529A, Class 529B, and Class 529C shares closed on March 30, 2007.
| (3) | | Transactions with Affiliates |
Investment Adviser – The fund has an investment advisory agreement with Massachusetts Financial Services Company (MFS) to provide overall investment management and related administrative services and facilities to the fund. The management fee is computed daily and paid monthly at an annual rate of 0.40% of the fund’s average daily net assets.
As part of a settlement agreement with the New York Attorney General concerning market timing and related matters, MFS has agreed to reduce the management fee to 0.30% of the fund’s average daily net assets for the period March 1, 2004 through February 28, 2009. For the year ended February 28, 2009, this waiver amounted to $1,382,955 and is reflected as a reduction of total expenses in the Statement of Operations. The management fee incurred for the year ended February 28, 2009 was equivalent to an annual effective rate of 0.30% of the fund’s average daily net assets.
The investment adviser has agreed in writing to pay a portion of the fund’s operating expenses, exclusive of management fee, distribution and service fees, interest, taxes, extraordinary expenses, brokerage and transaction costs, and investment-related expenses, such that operating expenses do not exceed 0.25% annually of the fund’s average daily net assets. This written agreement will continue until June 30, 2009.
The investment adviser has also agreed in writing to pay a portion of the fund’s total annual operating expenses, exclusive of interest, taxes, extraordinary expenses, brokerage and transaction costs, and
30
Notes to Financial Statements – continued
investment-related expenses, such that total annual fund operating expenses do not exceed the following rates annually of the fund’s average daily net assets with respect to each class:
| | | | | | | | | | | | | | |
| Class A | | Class B | | Class C | | Class I | | Class R1 | | Class R2 | | Class R3 | | Class R4 |
| 0.80% | | 1.55% | | 1.55% | | 0.55% | | 1.55% | | 1.05% | | 0.80% | | 0.55% |
This written agreement will continue until February 28, 2009. For the year ended February 28, 2009, this reduction amounted to $117,697 and is reflected as a reduction of total expenses in the Statement of Operations.
Effective March 1, 2009 the investment adviser has agreed in writing to pay a portion of the fund’s total annual operating expenses, exclusive of interest, taxes, extraordinary expenses, brokerage and transaction costs, and investment-related expenses, such that total annual fund operating expenses do not exceed the following rates annually of the fund’s average daily net assets with respect to each class:
| | | | | | | | | | | | | | |
| Class A | | Class B | | Class C | | Class I | | Class R1 | | Class R2 | | Class R3 | | Class R4 |
| 0.90% | | 1.65% | | 1.65% | | 0.65% | | 1.65% | | 1.15% | | 0.90% | | 0.65% |
This written agreement will continue until modified by the fund’s Board of Trustees, but such agreement will continue at least until June 30, 2010.
Distributor – MFS Fund Distributors, Inc. (MFD), a wholly-owned subsidiary of MFS, as distributor, received $165,176 for the year ended February 28, 2009, as its portion of the initial sales charge on sales of Class A shares of the fund.
The Board of Trustees has adopted a distribution plan for certain class shares pursuant to Rule 12b-1 of the Investment Company Act of 1940.
The fund’s distribution plan provides that the fund will pay MFD for services provided by MFD and financial intermediaries in connection with the distribution and servicing of certain share classes. One component of the plan is a distribution fee paid to MFD and another component of the plan is a service fee paid to MFD. MFD may subsequently pay all, or a portion, of the distribution and/or service fees to financial intermediaries.
31
Notes to Financial Statements – continued
Distribution Plan Fee Table:
| | | | | | | | | | |
| | | Distribution
Fee Rate | | Service
Fee Rate | | Total
Distribution
Plan (d) | | Annual
Effective
Rate (e) | | Distribution
and Service
Fee |
| Class A | | 0.10% | | 0.25% | | 0.35% | | 0.25% | | $1,957,864 |
| Class B | | 0.75% | | 0.25% | | 1.00% | | 1.00% | | 930,075 |
| Class C | | 0.75% | | 0.25% | | 1.00% | | 1.00% | | 534,718 |
| Class R (b) | | 0.25% | | 0.25% | | 0.50% | | 0.50% | | 3,232 |
| Class R1 | | 0.75% | | 0.25% | | 1.00% | | 1.00% | | 46,542 |
| Former Class R2 (b) | | 0.25% | | 0.25% | | 0.50% | | 0.50% | | 840 |
| Class R2 (formerly Class R3) | | 0.25% | | 0.25% | | 0.50% | | 0.50% | | 124,002 |
| Class R3 (formerly Class R4) | | — | | 0.25% | | 0.25% | | 0.25% | | 48,768 |
| Total Distribution and Service Fees | | $3,646,041 |
| (b) | At the close of business on April 18, 2008, Class R and Class R2 shares converted into Class R3 shares. Following the conversion, Class R3 shares were renamed Class R2 shares. |
| (d) | In accordance with the distribution plan for certain classes, the fund pays distribution and/or service fees up to these annual percentage rates of each class’ average daily net assets. |
| (e) | The annual effective rates represent actual fees incurred under the distribution plan for the year ended February 28, 2009 based on each class’ average daily net assets. Payment of the 0.10% annual Class A distribution fee is not in effect. Effective March 1, 2009, the 0.10% Class A distribution fee was eliminated. |
Certain Class A shares purchased prior to September 1, 2008 are subject to a contingent deferred sales charge (CDSC) in the event of a shareholder redemption within 12 months of purchase. Certain Class A shares purchased on or subsequent to September 1, 2008 are subject to a CDSC in the event of a shareholder redemption within 24 months of purchase. Class C shares are subject to a CDSC in the event of a shareholder redemption within 12 months of purchase. Class B shares are subject to a CDSC in the event of a shareholder redemption within six years of purchase. All contingent deferred sales charges are paid to MFD and during the year ended February 28, 2009, were as follows:
| | |
| | | Amount |
| Class A | | $79,622 |
| Class B | | 125,935 |
| Class C | | 20,676 |
Shareholder Servicing Agent – MFS Service Center, Inc. (MFSC), a wholly-owned subsidiary of MFS, receives a fee from the fund for its services as shareholder servicing agent calculated as a percentage of the average daily net assets of the fund as determined periodically under the supervision of the fund’s Board of Trustees. For the year ended February 28, 2009, the fee was $1,044,284, which equated to 0.0753% annually of the fund’s average daily net assets. MFSC also receives payment from the fund for out-of-pocket expenses, sub-accounting and other shareholder servicing costs which may be paid to affiliated and unaffiliated service providers. For the year ended February 28, 2009, these out-of-pocket expenses, sub-accounting and other shareholder servicing costs amounted to $877,295.
32
Notes to Financial Statements – continued
Under a Special Servicing Agreement among MFS, each MFS fund which invests in other MFS funds (“MFS fund-of-funds”) and each underlying fund in which a MFS fund-of-funds invests (“underlying funds”), each underlying fund may pay a portion of each MFS fund-of-fund’s transfer agent-related expenses, including sub-accounting fees payable to financial intermediaries, to the extent such payments do not exceed the benefits realized or expected to be realized by the underlying fund from the investment in the underlying fund by the MFS fund-of-fund. For the year ended February 28, 2009, these costs for the fund amounted to $843,211 and are reflected in the shareholder servicing costs on the Statement of Operations.
Administrator – MFS provides certain financial, legal, shareholder communications, compliance, and other administrative services to the fund. Under an administrative services agreement, the fund partially reimburses MFS the costs incurred to provide these services. The fund is charged a fixed amount plus a fee based on average daily net assets. The fund’s annual fixed amount is $17,500.
The administrative services fee incurred for the year ended February 28, 2009 was equivalent to an annual effective rate of 0.0168% of the fund’s average daily net assets.
Trustees’ and Officers’ Compensation – The fund pays compensation to independent trustees in the form of a retainer, attendance fees, and additional compensation to Board and Committee chairpersons. The fund does not pay compensation directly to trustees or officers of the fund who are also officers of the investment adviser, all of whom receive remuneration for their services to the fund from MFS. Certain officers and trustees of the fund are officers or directors of MFS, MFD, and MFSC.
For certain independent trustees who retired on or before December 31, 2001, the fund has an unfunded, defined benefit plan which resulted in a pension expense of $7,014. For certain independent trustees who served on the Board as of December 31, 2001, the fund also has an unfunded retirement benefit deferral plan for certain independent trustees which resulted in an expense of $5,268. Both amounts are included in independent trustees’ compensation for the year ended February 28, 2009. The liability for deferred retirement benefits payable to certain independent trustees under both plans amounted to $95,557 at February 28, 2009, and is included in payable for independent trustees’ compensation.
Other – This fund and certain other MFS funds (the funds) have entered into services agreements (the Agreements) which provide for payment of fees by the funds to Tarantino LLC and Griffin Compliance LLC in return for the provision of services of an Independent Chief Compliance Officer (ICCO) and Assistant ICCO, respectively, for the funds. The ICCO and Assistant ICCO are officers of the funds and the sole members of Tarantino LLC and Griffin
33
Notes to Financial Statements – continued
Compliance LLC, respectively. The funds can terminate the Agreements with Tarantino LLC and Griffin Compliance LLC at any time under the terms of the Agreements. For the year ended February 28, 2009, the aggregate fees paid by the fund to Tarantino LLC and Griffin Compliance LLC were $14,669 and are included in miscellaneous expense on the Statement of Operations. MFS has agreed to reimburse the fund for a portion of the payments made by the fund in the amount of $7,204, which is shown as a reduction of total expenses in the Statement of Operations. Additionally, MFS has agreed to bear all expenses associated with office space, other administrative support, and supplies provided to the ICCO and Assistant ICCO.
The fund may invest in a money market fund managed by MFS which seeks a high level of current income consistent with preservation of capital and liquidity. Income earned on this investment is included in dividends from underlying funds on the Statement of Operations. This money market fund does not pay a management fee to MFS.
Purchases and sales of investments, other than purchased option transactions and short-term obligations, were as follows:
| | | | |
| | | Purchases | | Sales |
| U.S. Government securities | | $797,542,827 | | $701,506,192 |
| Investments (non-U.S. Government securities) | | $81,973,793 | | $82,367,188 |
| (5) | | Shares of Beneficial Interest |
The fund’s Declaration of Trust permits the Trustees to issue an unlimited number of full and fractional shares of beneficial interest. Transactions in fund shares were as follows:
| | | | | | | | |
| | | Year ended
2/28/09 | | Year ended
2/29/08 |
| | | Shares | | Amount | | Shares | | Amount |
| Shares sold | | | | | | | | |
Class A | | 36,229,732 | | $353,298,621 | | 26,720,347 | | $254,524,226 |
Class B | | 5,054,054 | | 49,209,313 | | 2,320,464 | | 22,238,537 |
Class C | | 7,530,047 | | 73,680,973 | | 1,915,432 | | 18,482,462 |
Class I | | 2,318,775 | | 22,546,276 | | 4,949,335 | | 46,692,585 |
Class R (b) | | 32,055 | | 313,147 | | 614,938 | | 5,883,559 |
Class R1 | | 410,987 | | 3,997,989 | | 410,658 | | 3,911,341 |
Former Class R2 (b) | | 10,483 | | 102,533 | | 162,540 | | 1,538,277 |
Class R2 (formerly Class R3) | | 3,309,244 | | 32,248,235 | | 1,409,413 | | 13,420,296 |
Class R3 (formerly Class R4) | | 1,790,102 | | 17,513,310 | | 1,245,047 | | 11,800,372 |
Class R4 (formerly Class R5) | | 289,133 | | 2,819,189 | | 496,376 | | 4,721,419 |
| | 56,974,612 | | $555,729,586 | | 40,244,550 | | $383,213,074 |
34
Notes to Financial Statements – continued
| | | | | | | | | | | | |
| | | Year ended
2/28/09 | | | Year ended
2/29/08 | |
| | | Shares | | | Amount | | | Shares | | | Amount | |
| Shares issued to shareholders in reinvestment of distributions | | | | | | | | | | | | |
Class A | | 2,584,508 | | | $25,149,001 | | | 2,494,731 | | | $23,661,322 | |
Class B | | 275,795 | | | 2,679,317 | | | 350,066 | | | 3,312,628 | |
Class C | | 133,289 | | | 1,303,894 | | | 84,568 | | | 804,480 | |
Class I | | 1,909,001 | | | 18,530,779 | | | 2,317,775 | | | 21,983,889 | |
Class R (b) | | 316 | | | 3,100 | | | 22,539 | | | 212,377 | |
Class R1 | | 17,260 | | | 167,779 | | | 6,776 | | | 64,570 | |
Former Class R2 (b) | | 430 | | | 4,212 | | | 5,121 | | | 48,445 | |
Class R2 (formerly Class R3) | | 87,813 | | | 854,500 | | | 28,413 | | | 270,777 | |
Class R3 (formerly Class R4) | | 87,216 | | | 848,926 | | | 50,924 | | | 484,025 | |
Class R4 (formerly Class R5) | | 4,471 | | | 43,490 | | | 3,673 | | | 34,824 | |
Class 529A (c) | | — | | | — | | | 138 | | | 883 | |
Class 529B (c) | | — | | | — | | | 107 | | | 695 | |
Class 529C (c) | | — | | | — | | | 70 | | | 447 | |
| | 5,100,099 | | | $49,584,998 | | | 5,364,901 | | | $50,879,362 | |
| Shares reacquired | | | | | | | | | | | | |
Class A | | (24,995,709 | ) | | $(243,917,251 | ) | | (30,591,183 | ) | | $(290,386,750 | ) |
Class B | | (4,597,149 | ) | | (44,734,776 | ) | | (6,148,724 | ) | | (58,253,955 | ) |
Class C | | (2,011,586 | ) | | (19,700,064 | ) | | (1,293,975 | ) | | (12,309,138 | ) |
Class I | | (21,291,303 | ) | | (208,133,292 | ) | | (6,964,969 | ) | | (66,933,076 | ) |
Class R (b) | | (512,315 | ) | | (4,971,830 | ) | | (1,212,138 | ) | | (11,430,067 | ) |
Class R1 | | (244,141 | ) | | (2,377,979 | ) | | (87,112 | ) | | (827,584 | ) |
Former Class R2 (b) | | (129,745 | ) | | (1,258,860 | ) | | (179,575 | ) | | (1,691,871 | ) |
Class R2 (formerly Class R3) | | (1,223,250 | ) | | (11,930,112 | ) | | (433,890 | ) | | (4,132,887 | ) |
Class R3 (formerly Class R4) | | (923,038 | ) | | (9,012,778 | ) | | (584,913 | ) | | (5,573,778 | ) |
Class R4 (formerly Class R5) | | (239,795 | ) | | (2,337,961 | ) | | (120,163 | ) | | (1,140,902 | ) |
Class 529A (c) | | — | | | — | | | (39,015 | ) | | (370,085 | ) |
Class 529B (c) | | — | | | — | | | (35,700 | ) | | (338,555 | ) |
Class 529C (c) | | — | | | — | | | (23,257 | ) | | (221,577 | ) |
| | (56,168,031 | ) | | $(548,374,903 | ) | | (47,714,614 | ) | | $(453,610,225 | ) |
35
Notes to Financial Statements – continued
| | | | | | | | | | | | |
| | | Year ended
2/28/09 | | | Year ended
2/29/08 | |
| | | Shares | | | Amount | | | Shares | | | Amount | |
| Net change | | | | | | | | | | | | |
Class A | | 13,818,531 | | | $134,530,371 | | | (1,376,105 | ) | | $(12,201,202 | ) |
Class B | | 732,700 | | | 7,153,854 | | | (3,478,194 | ) | | (32,702,790 | ) |
Class C | | 5,651,750 | | | 55,284,803 | | | 706,025 | | | 6,977,804 | |
Class I | | (17,063,527 | ) | | (167,056,237 | ) | | 302,141 | | | 1,743,398 | |
Class R (b) | | (479,944 | ) | | (4,655,583 | ) | | (574,661 | ) | | (5,334,131 | ) |
Class R1 | | 184,106 | | | 1,787,789 | | | 330,322 | | | 3,148,327 | |
Former Class R2 (b) | | (118,832 | ) | | (1,152,115 | ) | | (11,914 | ) | | (105,149 | ) |
Class R2 (formerly Class R3) | | 2,173,807 | | | 21,172,623 | | | 1,003,936 | | | 9,558,186 | |
Class R3 (formerly Class R4) | | 954,280 | | | 9,349,458 | | | 711,058 | | | 6,710,619 | |
Class R4 (formerly Class R5) | | 53,809 | | | 524,718 | | | 379,886 | | | 3,615,341 | |
Class 529A (c) | | — | | | — | | | (38,877 | ) | | (369,202 | ) |
Class 529B (c) | | — | | | — | | | (35,593 | ) | | (337,860 | ) |
Class 529C (c) | | — | | | — | | | (23,187 | ) | | (221,130 | ) |
| | 5,906,680 | | | $56,939,681 | | | (2,105,163 | ) | | $(19,517,789 | ) |
| (b) | At the close of business on April 18, 2008, Class R and Class R2 shares converted into Class R3 shares. Following the conversion, Class R3 shares were renamed Class R2 shares. |
| (c) | Class 529A, Class 529B, and Class 529C shares closed on March 30, 2007. |
The fund is one of several mutual funds in which the MFS funds-of-funds may invest. The MFS funds-of-funds do not invest in the underlying MFS funds for the purpose of exercising management or control. At the end of the period, the MFS Moderate Allocation Fund , MFS Growth Allocation Fund, and MFS Conservative Allocation Fund were the owners of record of approximately 10%, 5% and 4% respectively, of the value of outstanding voting shares of the fund. In addition, the MFS Lifetime Retirement Fund, the MFS Lifetime 2010 Fund, the MFS Lifetime 2020 Fund, and the MFS Lifetime 2030 Fund were each the owners of record of less than 1% of the value of outstanding voting shares of the fund.
The fund and other funds managed by MFS participate in a $1 billion unsecured committed line of credit provided by a syndication of banks under a credit agreement. In addition, the fund and other funds managed by MFS have established uncommitted borrowing arrangements with certain banks. Borrowings may be made for temporary financing needs. Interest is charged to the fund, based on its borrowings, generally at a rate equal to the Federal Reserve funds rate plus 0.30%. In addition, a commitment fee, based on the average daily, unused portion of the committed line of credit, is allocated among the participating funds at the end of each calendar quarter. For the year ended February 28, 2009, the fund’s commitment fee and interest expense were $6,884 and $0, respectively, and are included in miscellaneous expense on the Statement of Operations.
36
Notes to Financial Statements – continued
The fund’s investment adviser, MFS, was the subject of an administrative proceeding concerning market timing which resulted in the Securities and Exchange Commission (the “SEC”) entering an order approving a settlement with MFS and two of its former officers (the “Settlement Order”). Under the terms of the Settlement Order, MFS transferred $175 million in disgorgement and $50 million in penalty (the “Payments”) to the SEC, which established a Fair Fund from which settlement funds have been, or will be, distributed to eligible current and former shareholders of the fund and certain other affected MFS retail funds. The Payments, along with additional amounts from a third-party settlement, have been, or will be, distributed to eligible shareholders in accordance with a plan developed by an independent distribution consultant (the “IDC”) in consultation with MFS and the Board of Trustees of the MFS retail funds. The plan was approved in July 2007 by the SEC. Pursuant to the distribution plan, after the distributions to eligible shareholders have been made, residual amounts, if any, may be available for distribution to the fund and certain other affected MFS retail funds. Certain procedural conditions of the distribution plan have not been met to date and, as such, the ultimate timing and amount of any payment of the residual amount is not known at this time.
| (8) | | Transactions in Underlying Funds-Affiliated Issuers |
An affiliated issuer may be considered one in which the fund owns 5% or more of the outstanding voting securities, or a company which is under common control. For the purposes of this report, the fund assumes the following to be affiliated issuers:
| | | | | | | | | |
| Underlying Funds | | Beginning
Shares/Par
Amount | | Acquisitions
Shares/Par
Amount | | Dispositions
Shares/Par
Amount | | | Ending
Shares/Par
Amount |
MFS Institutional Money
Market Portfolio | | 36,523,941 | | 561,648,542 | | (575,893,790 | ) | | 22,278,693 |
| | | | |
| Underlying Funds | | Realized
Gain (Loss) | | Capital Gain
Distributions | | Dividend
Income | | | Ending
Value |
MFS Institutional Money
Market Portfolio | | $— | | $— | | $401,837 | | | $22,278,693 |
37
REPORT OF INDEPENDENT REGISTERED PUBLIC ACCOUNTING FIRM
To the Board of Trustees and the Shareholders of
MFS Government Securities Fund:
We have audited the accompanying statement of assets and liabilities, including the portfolio of investments, of MFS Government Securities Fund (the “Fund”) as of February 28, 2009, and the related statement of operations for the year then ended, the statements of changes in net assets for each of the two years in the period then ended, and the financial highlights for each of the five years in the period then ended. These financial statements and financial highlights are the responsibility of the Fund’s management. Our responsibility is to express an opinion on these financial statements and financial highlights based on our audits.
We conducted our audits in accordance with the standards of the Public Company Accounting Oversight Board (United States). Those standards require that we plan and perform the audit to obtain reasonable assurance about whether the financial statements and financial highlights are free of material misstatement. The Fund is not required to have, nor were we engaged to perform, an audit of its internal control over financial reporting. Our audits included consideration of internal control over financial reporting as a basis for designing audit procedures that are appropriate in the circumstances, but not for the purpose of expressing an opinion on the effectiveness of the Fund’s internal control over financial reporting. Accordingly, we express no such opinion. An audit also includes examining, on a test basis, evidence supporting the amounts and disclosures in the financial statements, assessing the accounting principles used and significant estimates made by management, as well as evaluating the overall financial statement presentation. Our procedures included confirmation of securities owned as of February 28, 2009, by correspondence with the custodian and brokers; where replies were not received from brokers, we performed other auditing procedures. We believe that our audits provide a reasonable basis for our opinion.
In our opinion, the financial statements and financial highlights referred to above present fairly, in all material respects, the financial position of MFS Government Securities Fund as of February 28, 2009, the results of its operations for the year then ended, the changes in its net assets for each of the two years in the period then ended, and the financial highlights for each of the five years in the period then ended, in conformity with accounting principles generally accepted in the United States of America.
DELOITTE & TOUCHE LLP
Boston, Massachusetts
April 15, 2009
38
TRUSTEES AND OFFICERS — IDENTIFICATION AND BACKGROUND
The Trustees and officers of the Trust, as of April 1, 2009, are listed below, together with their principal occupations during the past five years. (Their titles may have varied during that period.) The address of each Trustee and officer is 500 Boylston Street, Boston, Massachusetts 02116.
| | | | | | |
Name, Date of Birth | | Position(s) Held
with Fund | | Trustee/Officer
Since (h) | | Principal Occupations During
the Past Five Years & Other
Directorships (j) |
| INTERESTED TRUSTEES | | | | |
Robert J. Manning (k)
(born 10/20/63) | | Trustee | | February 2004 | | Massachusetts Financial Services Company, Chief Executive Officer, President, Chief Investment Officer and Director |
Robert C. Pozen (k)
(born 8/08/46) | | Trustee | | February 2004 | | Massachusetts Financial Services Company, Chairman (since February 2004); Harvard Business School (education), Senior Lecturer (since 2008); Bell Canada Enterprises (telecommunications), Director (until February 2009); The Bank of New York, Director (finance), (March 2004 to May 2005); Telesat (satellite communications), Director (until November 2007) |
| INDEPENDENT TRUSTEES | | | | |
David H. Gunning
(born 5/30/42) | | Trustee and Chair of Trustees | | January 2004 | | Retired; Cleveland-Cliffs Inc. (mining products and service provider), Vice Chairman/Director (until May 2007); Lincoln Electric Holdings, Inc. (welding equipment manufacturer), Director; Development Alternatives, Inc. (consulting), Director/Non Executive Chairman; Portman Limited (mining), Director (since 2005); Southwest Gas Corp. (natural gas distribution), Director (until May 2004) |
Robert E. Butler (n)
(born 11/29/41) | | Trustee | | January 2006 | | Consultant – regulatory and compliance matters (since July 2002); PricewaterhouseCoopers LLP (professional services firm), Partner (until 2002) |
39
Trustees and Officers – continued
| | | | | | |
Name, Date of Birth | | Position(s) Held
with Fund | | Trustee/Officer
Since (h) | | Principal Occupations During
the Past Five Years & Other
Directorships (j) |
Lawrence H. Cohn, M.D.
(born 3/11/37) | | Trustee | | August 1993 | | Brigham and Women’s Hospital, Senior Cardiac Surgeon (since 2005); Harvard Medical School, Professor of Cardiac Surgery; Partners HealthCare, Physician Director of Medical Device Technology (since 2006); Brigham and Women’s Hospital, Chief of Cardiac Surgery (until 2005) |
Maureen R. Goldfarb
(born 4/06/55) | | Trustee | | January 2009 | | Private investor; John Hancock Financial Services, Inc., Executive Vice President (until 2004); John Hancock Mutual Funds, Trustee and Chief Executive Officer (until 2004) |
William R. Gutow
(born 9/27/41) | | Trustee | | December 1993 | | Private investor and real estate consultant; Capital Entertainment Management Company (video franchise), Vice Chairman; Texas Donuts (donut franchise), Vice Chairman (since 2007); Atlantic Coast Tan (tanning salons), Vice Chairman (until 2007) |
Michael Hegarty
(born 12/21/44) | | Trustee | | December 2004 | | Retired; AXA Financial (financial services and insurance), Vice Chairman and Chief Operating Officer (until 2001); The Equitable Life Assurance Society (insurance), President and Chief Operating Officer (until 2001) |
J. Atwood Ives
(born 5/01/36) | | Trustee | | February 1992 | | Private investor; KeySpan Corporation (energy related services), Director until 2004; Woodstock Corporation (investment advisory firm), Director until 2003 |
John P. Kavanaugh
(born 11/04/54) | | Trustee | | January 2009 | | Private investor; The Hanover Insurance Group, Inc., Vice President and Chief Investment Officer (until 2006); Allmerica Investment Trust, Allmerica Securities Trust and Opus Investment Trust (investment companies), Chairman, President and Trustee (until 2006) |
40
Trustees and Officers – continued
| | | | | | |
Name, Date of Birth | | Position(s) Held
with Fund | | Trustee/Officer
Since (h) | | Principal Occupations During
the Past Five Years & Other
Directorships (j) |
J. Dale Sherratt
(born 9/23/38) | | Trustee | | August 1993 | | Insight Resources, Inc. (acquisition planning specialists), President; Wellfleet Investments (investor in health care companies), Managing General Partner |
Laurie J. Thomsen
(born 8/05/57) | | Trustee | | March 2005 | | New Profit, Inc. (venture philanthropy), Partner (since 2006); Private investor; Prism Venture Partners (venture capital), Co-founder and General Partner (until June 2004); The Travelers Companies (commercial property liability insurance), Director |
Robert W. Uek
(born 5/18/41) | | Trustee | | January 2006 | | Consultant to investment company industry; PricewaterhouseCoopers LLP (professional services firm), Partner (until 1999); TT International Funds (mutual fund complex), Trustee (until 2005); Hillview Investment Trust II Funds (mutual fund complex), Trustee (until 2005) |
| OFFICERS | | | | | | |
Maria F. Dwyer (k)
(born 12/01/58) | | President | | November 2005 | | Massachusetts Financial Services Company, Executive Vice President and Chief Regulatory Officer (since March 2004) Chief Compliance Officer (since December 2006); Fidelity Management & Research Company, Vice President (prior to March 2004); Fidelity Group of Funds, President and Treasurer (until March 2004) |
Christopher R. Bohane (k)
(born 1/18/74) | | Assistant Secretary and Assistant Clerk | | July 2005 | | Massachusetts Financial Services Company, Vice President and Senior Counsel |
John M. Corcoran (k)
(born 4/13/65) | | Treasurer | | October 2008 | | Massachusetts Financial Services Company, Senior Vice President (since October 2008); State Street Bank and Trust (financial services provider), Senior Vice President, (until September 2008) |
41
Trustees and Officers – continued
| | | | | | |
Name, Date of Birth | | Position(s) Held
with Fund | | Trustee/Officer
Since (h) | | Principal Occupations During
the Past Five Years & Other
Directorships (j) |
Ethan D. Corey (k)
(born 11/21/63) | | Assistant Secretary and Assistant Clerk | | July 2005 | | Massachusetts Financial Services Company, Senior Vice President and Associate General Counsel (since 2004); Dechert LLP (law firm), Counsel (prior to December 2004) |
David L. DiLorenzo (k)
(born 8/10/68) | | Assistant Treasurer | | July 2005 | | Massachusetts Financial Services Company, Vice President (since June 2005); JP Morgan Investor Services, Vice President (until June 2005) |
Timothy M. Fagan (k)
(born 7/10/68) | | Assistant Secretary and Assistant Clerk | | September 2005 | | Massachusetts Financial Services Company, Vice President and Senior Counsel (since September 2005); John Hancock Advisers, LLC, Vice President, Senior Attorney and Chief Compliance Officer (until August 2005) |
Mark D. Fischer (k)
(born 10/27/70) | | Assistant Treasurer | | July 2005 | | Massachusetts Financial Services Company, Vice President (since May 2005); JP Morgan Investment Management Company, Vice President (until May 2005) |
Robyn L. Griffin
(born 7/04/75) | | Assistant
Independent
Chief Compliance
Officer | | August 2008 | | Griffin Compliance LLC (provider of compliance services), Principal (since August 2008); State Street Corporation (financial services provider), Mutual Fund Administration Assistant Vice President (October 2006 – July 2008); Liberty Mutual Group (insurance), Personal Market Assistant Controller (April 2006 – October 2006); Deloitte & Touche LLP (professional services firm), Senior Manager (prior to April 2006) |
Brian E. Langenfeld (k)
(born 3/07/73) | | Assistant Secretary and Assistant Clerk | | June 2006 | | Massachusetts Financial Services Company, Vice President and Senior Counsel (since May 2006); John Hancock Advisers, LLC, Assistant Vice President and Counsel (until April 2006) |
Ellen Moynihan (k)
(born 11/13/57) | | Assistant Treasurer | | April 1997 | | Massachusetts Financial Services Company, Senior Vice President |
42
Trustees and Officers – continued
| | | | | | |
Name, Date of Birth | | Position(s) Held
with Fund | | Trustee/Officer
Since (h) | | Principal Occupations During
the Past Five Years & Other
Directorships (j) |
Susan S. Newton (k)
(born 3/07/50) | | Assistant Secretary and Assistant Clerk | | May 2005 | | Massachusetts Financial Services Company, Senior Vice President and Associate General Counsel (since April 2005); John Hancock Advisers, LLC, Senior Vice President, Secretary and Chief Legal Officer (until April 2005) |
Susan A. Pereira (k)
(born 11/05/70) | | Assistant Secretary and Assistant Clerk | | July 2005 | | Massachusetts Financial Services Company, Vice President and Senior Counsel (since June 2004); Bingham McCutchen LLP (law firm), Associate (until June 2004) |
Mark N. Polebaum (k)
(born 5/01/52) | | Secretary and Clerk | | January 2006 | | Massachusetts Financial Services Company, Executive Vice President, General Counsel and Secretary (since January 2006); Wilmer Cutler Pickering Hale and Dorr LLP (law firm), Partner (until January 2006) |
Frank L. Tarantino
(born 3/07/44) | | Independent Chief Compliance Officer | | June 2004 | | Tarantino LLC (provider of compliance services), Principal (since June 2004); CRA Business Strategies Group (consulting services), Executive Vice President (until June 2004) |
Richard S. Weitzel (k)
(born 7/16/70) | | Assistant Secretary and Assistant Clerk | | October 2007 | | Massachusetts Financial Services Company, Vice President and Assistant General Counsel (since 2004); Massachusetts Department of Business and Technology, General Counsel (until April 2004) |
James O. Yost (k)
(born 6/12/60) | | Assistant Treasurer | | September 1990 | | Massachusetts Financial Services Company, Senior Vice President |
| (h) | Date first appointed to serve as Trustee/officer of an MFS fund. Each Trustee has served continuously since appointment unless indicated otherwise. For the period from December 15, 2004 until February 22, 2005, Messrs. Pozen and Manning served as Advisory Trustees. For the period March 2008 until October 2008, Ms. Dwyer served as Treasurer of the Funds. |
| (j) | Directorships or trusteeships of companies required to report to the Securities and Exchange Commission (i.e., “public companies”). |
| (k) | “Interested person” of the Trust within the meaning of the Investment Company Act of 1940 (referred to as the 1940 Act), which is the principal federal law governing investment companies like the fund, as a result of position with MFS. The address of MFS is 500 Boylston Street, Boston, Massachusetts 02116. |
| (n) | In 2004 and 2005, Mr. Butler provided consulting services to the independent compliance consultant retained by MFS pursuant to its settlement with the SEC concerning market timing and related matters. The terms of that settlement required that compensation and expenses related to the independent compliance consultant be borne exclusively by MFS and, therefore, MFS paid Mr. Butler for the services he rendered to the independent compliance consultant. In 2004 and 2005, MFS paid Mr. Butler a total of $351,119.29. |
43
Trustees and Officers – continued
Each Trustee (except Messrs. Butler, Kavanaugh and Uek and Ms. Goldfarb) has been elected by shareholders and each Trustee and officer holds office until his or her successor is chosen and qualified or until his or her earlier death, resignation, retirement or removal. The Trust held a shareholders’ meeting in 2005 to elect Trustees, and will hold a shareholders’ meeting at least once every five years thereafter, to elect Trustees. Messrs. Butler, Kavanaugh, Sherratt, Uek and Ms. Thomsen are members of the Trust’s Audit Committee.
Each of the Fund’s Trustees and officers holds comparable positions with certain other funds of which MFS or a subsidiary is the investment adviser or distributor, and, in the case of the officers, with certain affiliates of MFS. As of January 1, 2009, the Trustees served as board members of 105 funds within the MFS Family of Funds.
The Statement of Additional Information for the Fund and further information about the Trustees are available without charge upon request by calling 1-800-225-2606.
| | |
| Investment Adviser | | Custodian |
Massachusetts Financial Services Company
500 Boylston Street, Boston, MA 02116-3741 | | JPMorgan Chase Bank
One Chase Manhatten Plaza New York, NY 10081 |
| Distributor | | Independent Registered Public Accounting Firm |
MFS Fund Distributors, Inc.
500 Boylston Street, Boston, MA 02116-3741 | | Deloitte & Touche LLP
200 Berkeley Street, Boston, MA 02116 |
| Portfolio Manager | | |
| Geoffrey Schechter | | |
44
BOARD REVIEW OF INVESTMENT ADVISORY AGREEMENT
A discussion regarding the Board’s most recent review and renewal of the fund’s Investment Advisory Agreement with MFS is available by clicking on the fund’s name under “Mutual Funds” in the “Products and Performance” section of the MFS Web site (mfs.com).
PROXY VOTING POLICIES AND INFORMATION
A general description of the MFS funds’ proxy voting policies and procedures is available without charge, upon request, by calling
1-800-225-2606, by visiting the Proxy Voting section of mfs.com or by visiting the SEC’s Web site at http://www.sec.gov.
Information regarding how the fund voted proxies relating to portfolio securities during the most recent twelve-month period ended June 30 is available without charge by visiting the Proxy Voting section of mfs.com or by visiting the SEC’s Web site at http://www.sec.gov.
QUARTERLY PORTFOLIO DISCLOSURE
The fund will file a complete schedule of portfolio holdings with the Securities and Exchange Commission (the Commission) for the first and third quarters of each fiscal year on Form N-Q. The fund’s Form N-Q may be reviewed and copied at the:
Public Reference Room
Securities and Exchange Commission
100 F Street, NE, Room 1580
Washington, D.C. 20549
Information on the operation of the Public Reference Room may be obtained by calling the Commission at 1-800-SEC-0330. The fund’s Form N-Q is available on the EDGAR database on the Commission’s Internet Web site at http://www.sec.gov, and copies of this information may be obtained, upon payment of a duplicating fee, by electronic request at the following e-mail address: publicinfo@sec.gov or by writing the Public Reference Section at the above address.
A shareholder can also obtain the quarterly portfolio holdings report at mfs.com.
FEDERAL TAX INFORMATION (unaudited)
The fund will notify shareholders of amounts for use in preparing 2009 income tax forms in January 2010.
45
MFS® PRIVACY NOTICE
Privacy is a concern for every investor today. At MFS Investment Management® and the MFS funds, we take this concern very seriously. We want you to understand our policies about the investment products and services that we offer, and how we protect the nonpublic personal information of investors who have a direct relationship with us and our wholly owned subsidiaries.
Throughout our business relationship, you provide us with personal information. We maintain information and records about you, your investments, and the services you use. Examples of the nonpublic personal information we maintain include
| | Ÿ | | data from investment applications and other forms |
| | Ÿ | | share balances and transactional history with us, our affiliates, or others |
| | Ÿ | | facts from a consumer reporting agency |
We do not disclose any nonpublic personal information about our customers or former customers to anyone, except as permitted by law. We may share nonpublic personal information with third parties or certain of our affiliates in connection with servicing your account or processing your transactions. We may share information with companies or financial institutions that perform marketing services on our behalf or with other financial institutions with which we have joint marketing arrangements, subject to any legal requirements.
Authorization to access your nonpublic personal information is limited to appropriate personnel who provide products, services, or information to you. We maintain physical, electronic, and procedural safeguards to help protect the personal information we collect about you.
If you have any questions about the MFS privacy policy, please call 1-800-225-2606 any business day between 8 a.m. and 8 p.m. Eastern time.
Note: If you own MFS products or receive MFS services in the name of a third party such as a bank or broker-dealer, their privacy policy may apply to you instead of ours.
46
| | |
| CONTACT US | | |
| |
| Web site | | Mailing address |
| mfs.com | | MFS Service Center, Inc. |
| | P.O. Box 55824 |
| MFS TALK | | Boston, MA |
| 1-800-637-8255 | | 02205-5824 |
| 24 hours a day | | |
| | Overnight mail |
| Account service and | | MFS Service Center, Inc. |
| literature | | c/o Boston Financial Data Services |
Shareholders | | 30 Dan Road Canton, MA 02021-2809 |
| 1-800-225-2606 | |
| 8 a.m. to 8 p.m. Eastern time | | |
| |
| Investment professionals | | |
| 1-800-343-2829 | | |
| 8 a.m. to 8 p.m. Eastern time | | |
| |
| Retirement plan services | | |
| 1-800-637-1255 | | |
| 8 a.m. to 8 p.m. Eastern time | | |
Go paperless with eDelivery: Arrange to have MFS® send prospectuses, reports, and proxies directly to your e-mail inbox. You’ll get timely information and less clutter in your mailbox (not to mention help your fund save printing and postage costs).
Sign up: If your account is registered with us, simply go to mfs.com, log in to your account via MFS® Access, and select the eDelivery sign-up options.
If you own your MFS fund shares through a financial institution or a retirement plan, MFS® TALK, MFS Access, and eDelivery may not be available to you.

The Registrant has adopted a Code of Ethics pursuant to Section 406 of the Sarbanes-Oxley Act and as defined in Form N-CSR that applies to the Registrant’s principal executive officer and principal financial and accounting officer. The Registrant has not amended any provision in its Code of Ethics (the “Code”) that relates to an element of the Code’s definitions enumerated in paragraph (b) of Item 2 of this Form N-CSR.
A copy of the Code of Ethics is filed as an exhibit to this Form N-CSR.
| ITEM 3. | AUDIT COMMITTEE FINANCIAL EXPERT. |
Messrs. Robert E. Butler, John P. Kavanaugh and Robert W. Uek and Ms. Laurie J. Thomsen, members of the Audit Committee, have been determined by the Board of Trustees in their reasonable business judgment to meet the definition of “audit committee financial expert” as such term is defined in Form N-CSR. In addition, Messrs. Butler and Uek and Ms. Thomsen are “independent” members of the Audit Committee (as such term has been defined by the Securities and Exchange Commission in regulations implementing Section 407 of the Sarbanes-Oxley Act of 2002). The Securities and Exchange Commission has stated that the designation of a person as an audit committee financial expert pursuant to this Item 3 on the Form N-CSR does not impose on such a person any duties, obligations or liability that are greater than the duties, obligations or liability imposed on such person as a member of the Audit Committee and the Board of Trustees in the absence of such designation or identification.
| ITEM 4. | PRINCIPAL ACCOUNTANT FEES AND SERVICES. |
Items 4(a) through 4(d) and 4(g):
The Board of Trustees has appointed Deloitte & Touche LLP (“Deloitte”) to serve as independent accountants to certain series of the Registrant and Ernst & Young LLP (“E&Y”) to serve in the same capacity to certain other series of the Registrant (the series referred to collectively as the “Funds” and singularly as a “Fund”). The tables below set forth the audit fees billed to the Funds as well as fees for non-audit services provided to the Funds and/or to the Funds’ investment adviser, Massachusetts Financial Services Company (“MFS”), and to various entities either controlling, controlled by, or under common control with MFS that provide ongoing services to the Funds (“MFS Related Entities”).
For the fiscal years ended February 28, 2009 and February 29, 2008, respectively, audit fees billed to the Funds by Deloitte and E&Y were as follows:
| | | | |
| | | Audit Fees |
| | | 2009 | | 2008 |
Fees billed by Deloitte: | | | | |
MFS Government Securities Fund | | 43,077 | | 44,577 |
| | | | |
| | | Audit Fees |
| | | 2009 | | 2008 |
Fees billed by E&Y: | | | | |
MFS Diversified Income Fund | | 47,071 | | 44,203 |
For the fiscal years ended February 28, 2009 and February 29, 2008, respectively, fees billed by Deloitte and E&Y for audit-related, tax and other services provided to the Funds and for audit-related, tax and other services provided to MFS and MFS Related Entities were as follows:
| | | | | | | | | | | | |
| | | Audit-Related Fees1 | | Tax Fees2 | | All Other Fees3 |
| | | 2009 | | 2008 | | 2009 | | 2008 | | 2009 | | 2008 |
Fees billed by Deloitte: | | | | | | | | | | | | |
To MFS Government Securities Fund | | 0 | | 0 | | 6,036 | | 5,846 | | 1,022 | | 1,232 |
To MFS and MFS Related Entities of MFS Government Securities Fund* | | 1,155,569 | | 1,416,440 | | 0 | | 0 | | 223,140 | | 323,714 |
| | | | |
| | | 2009 | | 2008 |
Aggregate fees for non-audit services: | | | | |
To MFS Government Securities Fund, MFS and MFS Related Entities# | | 1,435,592 | | 1,868,144 |
| | | | | | | | | | | | |
| | | Audit-Related Fees1 | | Tax Fees2 | | All Other Fees4 |
| | | 2009 | | 2008 | | 2009 | | 2008 | | 2009 | | 2008 |
Fees billed by E&Y: | | | | | | | | | | | | |
To MFS Diversified Income Fund | | 0 | | 7,500 | | 6,676 | | 6,676 | | 0 | | 0 |
To MFS and MFS Related Entities of MFS Diversified Income Fund* | | 0 | | 0 | | 0 | | 0 | | 0 | | 0 |
| | | | |
| | | 2009 | | 2008 |
Aggregate fees for non-audit services: | | | | |
To MFS Diversified Income Fund, MFS and MFS Related Entities# | | 525,390 | | 199,554 |
| * | This amount reflects the fees billed to MFS and MFS Related Entities for non-audit services relating directly to the operations and financial reporting of the Funds (portions of which services also related to the operations and financial reporting of other funds within the MFS Funds complex). |
| # | This amount reflects the aggregate fees billed by Deloitte or E&Y, as the case may be, for non-audit services rendered to the Funds and for non-audit services rendered to MFS and the MFS Related Entities. |
1 | The fees included under “Audit-Related Fees” are fees related to assurance and related services that are reasonably related to the performance of the audit or review of financial statements, but not reported under “Audit Fees,” including accounting consultations, agreed-upon procedure reports, attestation reports, comfort letters and internal control reviews. |
2 | The fees included under “Tax Fees” are fees associated with tax compliance, tax advice and tax planning, including services relating to the filing or amendment of federal, state or local income tax returns, regulated investment company qualification reviews and tax distribution and analysis. |
3 | The fees included under “All Other Fees” are fees for products and services provided by Deloitte other than those reported under “Audit Fees,” “Audit-Related Fees” and “Tax Fees,” including fees for services related to sales tax refunds, consultation on internal cost allocations, consultation on allocation of monies pursuant to an administrative proceeding regarding disclosure of brokerage allocation practices in connection with fund sales, analysis of certain portfolio holdings versus investment styles, review of internal controls and review of Rule 38a-1 compliance program. |
4 | The fees included under “All Other Fees” are fees for products and services provided by E&Y other than those reported under “Audit Fees,” “Audit-Related Fees” and “Tax Fees,” including fees for the subscription to tax treatise and for services related to analysis of fund administrative expenses, compliance program and records management projects. |
Item 4(e)(1):
Set forth below are the policies and procedures established by the Audit Committee of the Board of Trustees relating to the pre-approval of audit and non-audit related services:
To the extent required by applicable law, pre-approval by the Audit Committee of the Board is needed for all audit and permissible non-audit services rendered to the Funds and all permissible non-audit services rendered to MFS or MFS Related Entities if the services relate directly to the operations and financial reporting of the Registrant. Pre-approval is currently on an engagement-by-engagement basis. In the event pre-approval of such services is necessary between regular meetings of the Audit Committee and it is not practical to wait to seek pre-approval at the next regular meeting of the Audit Committee, pre-approval of such services may be referred to the Chair of the Audit Committee for approval; provided that the Chair may not pre-approve any individual engagement for such services exceeding $50,000 or multiple engagements for such services in the aggregate
exceeding $100,000 in each period between regular meetings of the Audit Committee. Any engagement pre-approved by the Chair between regular meetings of the Audit Committee shall be presented for ratification by the entire Audit Committee at its next regularly scheduled meeting.
Item 4(e)(2):
None, or 0%, of the services relating to the Audit-Related Fees, Tax Fees and All Other Fees paid by the Fund and MFS and MFS Related Entities relating directly to the operations and financial reporting of the Registrant disclosed above were approved by the audit committee pursuant to paragraphs (c)(7)(i)(C) of Rule 2-01 of Regulation S-X (which permits audit committee approval after the start of the engagement with respect to services other than audit, review or attest services, if certain conditions are satisfied).
Item 4(f): Not applicable.
Item 4(h): The Registrant’s Audit Committee has considered whether the provision by a Registrant’s independent registered public accounting firm of non-audit services to MFS and MFS Related Entities that were not pre-approved by the Committee (because such services did not relate directly to the operations and financial reporting of the Registrant) was compatible with maintaining the independence of the independent registered public accounting firm as the Registrant’s principal auditors.
| ITEM 5. | AUDIT COMMITTEE OF LISTED REGISTRANTS. |
Not applicable to the Registrant.
A schedule of investments of the Registrant is included as part of the report to shareholders of such series under Item 1 of this Form N-CSR.
| ITEM 7. | DISCLOSURE OF PROXY VOTING POLICIES AND PROCEDURES FOR CLOSED-END MANAGEMENT INVESTMENT COMPANIES. |
Not applicable to the Registrant.
| ITEM 8. | PORTFOLIO MANAGERS OF CLOSED-END MANAGEMENT INVESTMENT COMPANIES. |
Not applicable to the Registrant.
| ITEM 9. | PURCHASES OF EQUITY SECURITIES BY CLOSED-END MANAGEMENT INVESTMENT COMPANY AND AFFILIATED PURCHASERS. |
Not applicable to the Registrant.
| ITEM 10. | SUBMISSION OF MATTERS TO A VOTE OF SECURITY HOLDERS. |
There were no material changes to the procedures by which shareholders may send recommendations to the Board for nominees to the Registrant’s Board since the Registrant last provided disclosure as to such procedures in response to the requirements of Item 407 (c)(2)(iv) of Regulation S-K or this Item.
| ITEM 11. | CONTROLS AND PROCEDURES. |
| (a) | Based upon their evaluation of the effectiveness of the registrant’s disclosure controls and procedures (as defined in Rule 30a-3(c) under the Investment Company Act of 1940 (the “Act”)) as conducted within 90 days of the filing date of this report on Form N-CSR, the registrant’s principal financial officer and principal executive officer have concluded that those disclosure controls and procedures provide reasonable assurance that the material information required to be disclosed by the registrant on this report is recorded, processed, summarized and reported within the time periods specified in the Securities and Exchange Commission’s rules and forms. |
| (b) | There were no changes in the registrant’s internal controls over financial reporting (as defined in Rule 30a-3(d) under the Act) that occurred during the second fiscal quarter of the period covered by the report that have materially affected, or are reasonably likely to materially affect, the registrant’s internal control over financial reporting. |
| (a) | File the exhibits listed below as part of this form. Letter or number the exhibits in the sequence indicated. |
| | (1) | Any code of ethics, or amendment thereto, that is the subject of the disclosure required by Item 2, to the extent that the registrant intends to satisfy the Item 2 requirements through filing of an exhibit: Code of Ethics attached hereto. |
| | (2) | A separate certification for each principal executive officer and principal financial officer of the registrant as required by Rule 30a-2 under the Act (17 CFR 270.30a-2): Attached hereto. |
| (b) | If the report is filed under Section 13(a) or 15(d) of the Exchange Act, provide the certifications required by Rule 30a-2(b) under the Act (17 CFR 270.30a-2(b)), Rule 13a-14(b) or Rule 15d-14(b) under the Exchange Act (17 CFR 240.13a-14(b) or 240.15d-14(b)) and Section 1350 of Chapter 63 of Title 18 of the United States Code (18 U.S.C. 1350) as an exhibit. A certification furnished pursuant to this paragraph will not be deemed “filed” for the purposes of Section 18 of the Exchange Act (15 U.S.C. 78r), or otherwise subject to the liability of that section. Such certification will not be deemed to be incorporated by reference into any filing under the Securities Act of 1933 or the Exchange Act, except to the extent that the registrant specifically incorporates it by reference: Attached hereto. |
Notice
A copy of the Amended and Restated Declaration of Trust, as amended, of the Registrant is on file with the Secretary of State of The Commonwealth of Massachusetts and notice is hereby given that this instrument is executed on behalf of the Registrant by an officer of the Registrant as an officer and not individually and the obligations of or arising out of this instrument are not binding upon any of the Trustees or shareholders individually, but are binding only upon the assets and property of the respective constituent series of the Registrant.
SIGNATURES
Pursuant to the requirements of the Securities Exchange Act of 1934 and the Investment Company Act of 1940, the registrant has duly caused this report to be signed on its behalf by the undersigned, thereunto duly authorized.
(Registrant) MFS SERIES TRUST XIIII
| | |
| By (Signature and Title)* | | MARIA F. DWYER |
| | Maria F. Dwyer, President |
Date: April 20, 2009
Pursuant to the requirements of the Securities Exchange Act of 1934 and the Investment Company Act of 1940, this report has been signed below by the following persons on behalf of the registrant and in the capacities and on the dates indicated.
| | |
| By (Signature and Title)* | | MARIA F. DWYER |
| | Maria F. Dwyer, President (Principal Executive Officer) |
Date: April 20, 2009
| | |
| By (Signature and Title)* | | JOHN M. CORCORAN |
| | John M. Corcoran, Treasurer (Principal Financial Officer and Accounting Officer) |
Date: April 20, 2009
| * | Print name and title of each signing officer under his or her signature. |