UNITED STATES
SECURITIES AND EXCHANGE COMMISSION
Washington, D.C. 20549
FORM N-CSR
CERTIFIED SHAREHOLDER REPORT OF
REGISTERED MANAGEMENT INVESTMENT COMPANIES
Investment Company Act file number 811-03327
MFS SERIES TRUST XIII
(Exact name of registrant as specified in charter)
500 Boylston Street, Boston, Massachusetts 02116
(Address of principal executive offices) (Zip code)
Susan S. Newton
Massachusetts Financial Services Company
500 Boylston Street
Boston, Massachusetts 02116
(Name and address of agents for service)
Registrant’s telephone number, including area code: (617) 954-5000
Date of fiscal year end: The last day of February.
Date of reporting period: February 29, 2012
| ITEM 1. | REPORTS TO STOCKHOLDERS. |

MFS® Diversified Income Fund

ANNUAL REPORT
February 29, 2012
DIF-ANN
MFS® DIVERSIFIED INCOME FUND
SIPC Contact Information: You may obtain information about the Securities Investor Protection Corporation (“SIPC”), including the SIPC Brochure, by contacting SIPC either by telephone (1-202-371-8300) or by accessing SIPC’s web site address (www.sipc.org).
The report is prepared for the general information of shareholders. It is authorized for distribution to prospective investors only when preceded or accompanied by a current prospectus.
NOT FDIC INSURED Ÿ MAY LOSE VALUE Ÿ NO BANK GUARANTEE

LETTER FROM THE CHAIRMAN AND CEO
Dear Shareholders:
We are indeed living through some volatile times. Economic uncertainty is everywhere, as it seems no place in the world has been unmoved by crisis. Over the past year, we have seen a devastating earthquake and tsunami that have led to disruptions in the Japanese markets and supply chains. Protests have changed the face of the Middle East and left in their wake lingering tensions and questions about oil supplies. We have seen debt limits tested in Europe and the United States and policymakers grappling to craft often unpopular monetary and fiscal responses as consumers and businesses struggle with what appears to be a slowing global economy. And now, as the US economy begins to regain its footing, we see the economies of the eurozone heading toward recession as the region’s leaders continue to address sovereign debt crises.
When markets become volatile, managing risk becomes a top priority for investors and their advisors. At MFS® risk management is foremost in our minds in all market climates. Our analysts and portfolio managers keep risks firmly in mind when evaluating securities. Additionally, we have a team of quantitative analysts that measures and assesses the risk profiles of our portfolios and securities on an ongoing basis. The chief investment risk officer, who oversees the team, reports directly to the firm’s president and chief investment officer so the risk associated with each portfolio can be assessed objectively and independently.
As always, we continue to be mindful of the many economic challenges faced at the local, national, and international levels. It is in times such as these that we want to remind investors of the merits of maintaining a long-term view, adhering to basic investing principles such as asset allocation and diversification, and working closely with their advisors to research and identify appropriate investment opportunities.
Respectfully,

Robert J. Manning
Chairman and Chief Executive Officer
MFS Investment Management®
April 13, 2012
The opinions expressed in this letter are subject to change, may not be relied upon for investment advice, and no forecasts can be guaranteed.
1
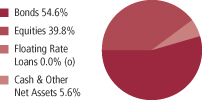
PORTFOLIO COMPOSITION
Portfolio structure (i)
| | | | |
| Top ten holdings (i) | | | | |
| Simon Property Group, Inc., REIT | | | 2.5% | |
| U.S. Treasury Note, 1.375%, 2012 | | | 2.3% | |
| U.S. Treasury Note, 1.375%, 2013 | | | 2.2% | |
| U.S. Treasury Note, 2.125%, 2015 | | | 1.9% | |
| Public Storage, Inc., REIT | | | 1.4% | |
| U.S. Treasury Note, 3.5%, 2020 | | | 1.3% | |
| Vornado Realty Trust, REIT | | | 1.0% | |
| Chevron Corp. | | | 0.9% | |
| U.S. Treasury Note, 4.5%, 2039 | | | 0.9% | |
| AvalonBay Communities, Inc., REIT | | | 0.8% | |
| |
| Fixed income sectors (i) | | | | |
| High Yield Corporates | | | 22.3% | |
| Emerging Markets Bonds | | | 14.0% | |
| U.S. Treasury Securities | | | 10.1% | |
| Mortgage-Backed Securities | | | 5.6% | |
| High Grade Corporates | | | 1.6% | |
| U.S. Government Agencies | | | 0.6% | |
| Non-U.S. Government Bonds | | | 0.3% | |
| Commercial Mortgage-Backed Securities | | | 0.1% | |
| Collateralized Debt Obligations (o) | | | 0.0% | |
| Floating Rate Loans (o) | | | 0.0% | |
| Municipal Bonds (o) | | | 0.0% | |
| | | | |
| Equity sectors (i) | | | | |
| Financial Services | | | 25.1% | |
| Utilities & Communications | | | 2.7% | |
| Health Care | | | 2.5% | |
| Energy | | | 2.0% | |
| Industrial Goods & Services | | | 1.5% | |
| Consumer Staples | | | 1.2% | |
| Technology | | | 1.2% | |
| Leisure | | | 0.9% | |
| Retailing | | | 0.9% | |
| Autos & Housing | | | 0.8% | |
| Basic Materials | | | 0.8% | |
| Transportation | | | 0.2% | |
|
| Composition including fixed income credit quality (a)(i) | |
| AAA | | | 0.1% | |
| AA | | | 0.1% | |
| A | | | 0.7% | |
| BBB | | | 10.2% | |
| BB | | | 10.0% | |
| B | | | 12.7% | |
| CCC | | | 4.2% | |
| CC | | | 0.1% | |
| C | | | 0.1% | |
| U.S. Government | | | 10.3% | |
| Federal Agencies | | | 6.2% | |
| Not Rated | | | (0.1)% | |
| Non-Fixed Income | | | 39.8% | |
| Cash & Other | | | 5.6% | |
2
Portfolio Composition – continued
| (a) | For all securities other than those specifically described below, ratings are assigned to underlying securities utilizing ratings from Moody’s, Fitch, and Standard & Poor’s rating agencies and applying the following hierarchy: If all three agencies provide a rating, the middle rating (after dropping the highest and lowest ratings) is assigned; if two of the three agencies rate a security, the lower of the two is assigned. Ratings are shown in the S&P and Fitch scale (e.g., AAA). All ratings are subject to change. U.S. Government includes securities issued by the U.S. Department of the Treasury. Federal Agencies includes rated and unrated U.S. Agency fixed-income securities, U.S. Agency mortgage-backed securities, and collateralized mortgage obligations of U.S. Agency mortgage-backed securities. Not Rated includes fixed income securities, including fixed income futures, which have not been rated by any rating agency. Non-Fixed Income includes equity securities (including convertible bonds and equity derivatives) and commodities. Cash & Other includes cash, other assets less liabilities, offsets to derivative positions, and short-term securities. The fund may not hold all of these instruments. The fund is not rated by these agencies. |
| (i) | For purposes of this presentation, the components include the market value of securities, and reflect the impact of the equivalent exposure of derivative positions, if any. These amounts may be negative from time to time. The bond component will include any accrued interest amounts. Equivalent exposure is a calculated amount that translates the derivative position into a reasonable approximation of the amount of the underlying asset that the portfolio would have to hold at a given point in time to have the same price sensitivity that results from the portfolio’s ownership of the derivative contract. When dealing with derivatives, equivalent exposure is a more representative measure of the potential impact of a position on portfolio performance than market value. Where the fund holds convertible bonds, these are treated as part of the equity portion of the portfolio. |
Percentages are based on net assets as of 2/29/12.
The portfolio is actively managed and current holdings may be different.
3
MANAGEMENT REVIEW
Summary of Results
The MFS Diversified Income Fund includes investments in high yield corporate bonds, U.S. government securities, emerging markets debt, real estate investment trusts (“REITs”), and domestic equity securities.
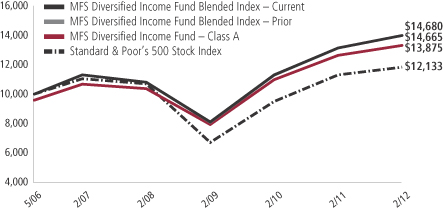
For the twelve months ended February 29, 2012, Class A shares of the MFS Diversified Income Fund provided a total return of 6.09%, at net asset value. This compares with a return of 5.12% for the fund’s benchmark, the Standard & Poor’s 500 Stock Index. The fund’s other benchmark, the MFS Diversified Income Fund Blended Index – Current (the “Blended Index”), generated a return of 7.32%. The Blended Index reflects the blended returns of various equity and fixed income market indices, with percentage allocations to each index designed to resemble the allocations of the fund. The market indices and related percentage allocations used to compile the Blended Index are set forth in the Performance Summary.
Market Environment
Prior to the beginning of the reporting period, looser U.S. monetary and fiscal policy fostered a sharp rebound in market risk sentiment. By the beginning of the period, global macroeconomic conditions had begun to weaken and renewed concerns surrounding eurozone sovereign debt arose, causing the recovery in asset valuations to plateau.
During the middle of the reporting period, worries about U.S. sovereign debt default and the long-term sustainability of the trend in U.S. fiscal policy resulted in one agency downgrading U.S. credit quality. Amidst this turmoil, global equity markets declined sharply and credit spreads widened. At the same time, global consumer and producer sentiment indicators fell precipitously and highly-rated sovereign bond yields hit multi-decade lows.
Late in the period, however, additional liquidity from the U.S. Federal Reserve (in the form of “Operation Twist”) and the European Central Bank (in the form of 3-year, Longer Term Refinancing Operations, or LTROs), coupled with improved global macroeconomic conditions, ushered in improved market dynamics.
Factors Affecting Performance
During the reporting period, bond selection within the emerging markets debt sleeve was a primary factor that detracted from relative performance since the fund’s holdings in this asset class generated lower returns than the JPMorgan Emerging Markets Bond Index Global, which is a component of the Blended Index. The fund’s allocation to U.S. government bonds also weakened relative performance. Here, it was the fund’s underweight position in the middle of the reporting period that detracted from relative performance as domestic government bonds outpaced the Blended Index.
4
Management Review – continued
Strong security selection in the U.S. large cap value equity sleeve was a primary contributor to relative returns led by the fund’s holdings in the leisure and energy sectors. Within the high yield corporate bond sleeve, bond selection was another positive factor for relative returns.
Respectfully,
| | | | | | |
| William Adams | | David Cole | | Richard Gable | | Matthew Ryan |
| Portfolio Manager | | Portfolio Manager | | Portfolio Manager | | Portfolio Manager |
| | | |
| Jonathan Sage | | Geoffrey Schechter | | James Swanson | | |
| Portfolio Manager | | Portfolio Manager | | Portfolio Manager | | |
Note to Shareholders: Effective May 1, 2011, William Adams replaced John Addeo as a co-manager of the fund. Thomas Pedulla and Leo Saraceno are no longer managers of the fund.
The views expressed in this report are those of the portfolio managers only through the end of the period of the report as stated on the cover and do not necessarily reflect the views of MFS or any other person in the MFS organization. These views are subject to change at any time based on market or other conditions, and MFS disclaims any responsibility to update such views. These views may not be relied upon as investment advice or an indication of trading intent on behalf of any MFS portfolio. References to specific securities are not recommendations of such securities, and may not be representative of any MFS portfolio’s current or future investments.
5
PERFORMANCE SUMMARY THROUGH 2/29/12
The following chart illustrates a representative class of the fund’s historical performance in comparison to its benchmark(s). Performance results include the deduction of the maximum applicable sales charge and reflect the percentage change in net asset value, including reinvestment of dividends and capital gains distributions. The performance of other share classes will be greater than or less than that of the class depicted below. Benchmarks are unmanaged and may not be invested in directly. Benchmark returns do not reflect sales charges, commissions or expenses. (See Notes to Performance Summary.)
Performance data shown represents past performance and is no guarantee of future results. Investment return and principal value fluctuate so your shares, when sold, may be worth more or less than the original cost; current performance may be lower or higher than quoted. The performance shown does not reflect the deduction of taxes, if any, that a shareholder would pay on fund distributions or the redemption of fund shares.
Growth of a Hypothetical $10,000 Investment (t)
6
Performance Summary – continued
Total Returns through 2/29/12
Average annual without sales charge
| | | | | | | | | | | | |
| | | Share class | | Class inception date | | 1-yr | | 5-yr | | Life (t) | | |
| | | A | | 5/26/06 | | 6.09% | | 5.17% | | 6.74% | | |
| | | C | | 5/26/06 | | 5.31% | | 4.41% | | 5.96% | | |
| | | I | | 5/26/06 | | 6.35% | | 5.46% | | 7.03% | | |
| | | R1 | | 7/01/08 | | 5.31% | | N/A | | 7.40% | | |
| | | R2 | | 7/01/08 | | 5.83% | | N/A | | 7.94% | | |
| | | R3 | | 7/01/08 | | 6.09% | | N/A | | 8.20% | | |
| | | R4 | | 7/01/08 | | 6.35% | | N/A | | 8.47% | | |
| Comparative benchmarks | | | | | | | | |
| | | Standard & Poor’s 500 Stock Index (f) | | 5.12% | | 1.58% | | 3.40% | | |
| | | Barclays Capital U.S. Government/Mortgage Bond Index (f) | | 7.73% | | 6.30% | | 6.55% | | |
| | | Barclays Capital U.S. High-Yield Corporate Bond Index (f)(z) | | 6.94% | | 8.15% | | 8.95% | | |
| | | Barclays Capital U.S. High-Yield Corporate Bond 2% Issuer Capped Index (f)(z) | | 6.92% | | 8.34% | | 9.01% | | |
| | | JPMorgan Emerging Markets Bond Index Global (f) | | 13.92% | | 8.79% | | 9.67% | | |
| | | MFS Diversified Income Fund Blended Index – Current (f)(u)(z) | | 7.32% | | 4.96% | | 6.86% | | |
| | | MFS Diversified Income Fund Blended Index – Prior (f)(y)(z) | | 7.33% | | 4.91% | | 6.84% | | |
| | | MSCI U.S. REIT Index (f) | | 5.90% | | (1.65)% | | 3.67% | | |
| | | Russell 1000 Value Index (f) | | 2.18% | | (1.08)% | | 1.54% | | |
| Average annual with sales charge | | | | | | | | |
| | | A
With Initial Sales Charge (4.75%) | | 1.05% | | 4.16% | | 5.85% | | |
| | | C
With CDSC (1% for 12 months) (x) | | 4.31% | | 4.41% | | 5.96% | | |
Class I, R1, R2, R3, and R4 shares do not have a sales charge.
CDSC – Contingent Deferred Sales Charge.
| (f) | Source: FactSet Research Systems Inc. |
| (t) | For the period from the class inception date through the stated period end. The comparative benchmark performance information provided for the “life” period is from the inception date of the Class A shares. (See Notes to Performance Summary.) |
| (u) | MFS Diversified Income Fund Blended Index – Current is at a point in time and allocations during the period can change. As of February 29, 2012 the blended index was comprised of 25% Barclays Capital U.S. High-Yield Corporate Bond 2% Issuer Capped Index, 20% Barclays Capital U.S. Government/Mortgage Bond Index, 20% Russell 1000 Value Index, 20% MSCI U.S. REIT Index, and 15% JPMorgan Emerging Markets Bond Index Global. |
7
Performance Summary – continued
| (x) | Assuming redemption at the end of the applicable period. |
| (y) | MFS Diversified Income Fund Blended Index – Prior is at a point in time and allocations during the period can change. As of February 29, 2012 the blended index was comprised of 25% Barclays Capital U.S. High-Yield Corporate Bond Index, 20% Barclays Capital U.S. Government/Mortgage Bond Index, 20% Russell 1000 Value Index, 20% MSCI U.S. REIT Index, and 15% JPMorgan Emerging Markets Bond Index Global. |
| (z) | Effective September 15, 2011, the Barclays Capital U.S. High-Yield Corporate Bond 2% Issuer Capped Index replaced the Barclays Capital U.S. High-Yield Corporate Bond Index as a secondary fund benchmark. Also, MFS Diversified Income Fund Blended Index – Current replaced the MFS Diversified Income Fund Blended Index – Prior as a secondary fund benchmark. The fund’s investment adviser believes the Barclays Capital High-Yield Corporate Bond 2% Issuer Capped Index and the MFS Diversified Income Fund Blended Index – Current better reflect the investment policies and strategies of the fund. |
Benchmark Definitions
Barclays Capital U.S. Government/Mortgage Bond Index – measures debt issued by the U.S. Government, and its agencies, as well as mortgage-backed pass-through securities of Ginnie Mae (GNMA), Fannie Mae (FNMA), and Freddie Mac (FHLMC).
Barclays Capital U.S. High-Yield Corporate Bond 2% Issuer Capped Index – a component of the Barclays Capital U.S. High-Yield Corporate Bond Index, which measures performance of non-investment grade, fixed rate debt. The index limits the maximum exposure to any one issuer to 2%.
Barclays Capital U.S. High-Yield Corporate Bond Index – a market capitalization-weighted index that measures the performance of non-investment grade, fixed rate debt. Eurobonds and debt issues from countries designated as emerging markets (e.g., Argentina, Brazil, Venezuela, etc.) are excluded.
JPMorgan Emerging Markets Bond Index Global – measures the performance of U.S.-dollar-denominated debt instruments issued by emerging market sovereign and quasi-sovereign entities: Brady bonds, loans, Eurobonds.
Morgan Stanley Capital International (MSCI) U.S. REIT Index – a market capitalization-weighted index that is designed to measure equity market performance for real estate investment trusts (REITs) that generate a majority of their revenue and income from real estate rental and leasing operations.
Russell 1000 Value Index – constructed to provide a comprehensive barometer for the value securities in the large-cap segment of the U.S. equity universe. Companies in this index generally have lower price-to-book ratios and lower forecasted growth values.
Standard & Poor’s 500 Stock Index – a market capitalization-weighted index of 500 widely held equity securities, designed to measure broad U.S. equity performance.
It is not possible to invest directly in an index.
8
Performance Summary – continued
Notes to Performance Summary
Average annual total return represents the average annual change in value for each share class for the periods presented. Life returns are presented where the share class has less than 10 years of performance history and represent the average annual total return from the class inception date to the stated period end date. As the fund’s share classes may have different inception dates, the life returns may represent different time periods and may not be comparable.
Performance results reflect any applicable expense subsidies and waivers in effect during the periods shown. Without such subsidies and waivers the fund’s performance results would be less favorable. Please see the prospectus and financial statements for complete details.
Performance results do not include adjustments made for financial reporting purposes in accordance with U.S. generally accepted accounting principles and may differ from amounts reported in the financial highlights.
From time to time the fund may receive proceeds from litigation settlements, without which performance would be lower.
9
EXPENSE TABLE
Fund expenses borne by the shareholders during the period,
September 1, 2011 through February 29, 2012
As a shareholder of the fund, you incur two types of costs: (1) transaction costs, including sales charges (loads) on certain purchase or redemption payments, and (2) ongoing costs, including management fees; distribution and service (12b-1) fees; and other fund expenses. This example is intended to help you understand your ongoing costs (in dollars) of investing in the fund and to compare these costs with the ongoing costs of investing in other mutual funds.
The example is based on an investment of $1,000 invested at the beginning of the period and held for the entire period September 1, 2011 through February 29, 2012.
Actual Expenses
The first line for each share class in the following table provides information about actual account values and actual expenses. You may use the information in this line, together with the amount you invested, to estimate the expenses that you paid over the period. Simply divide your account value by $1,000 (for example, an $8,600 account value divided by $1,000 = 8.6), then multiply the result by the number in the first line under the heading entitled “Expenses Paid During Period” to estimate the expenses you paid on your account during this period.
Hypothetical Example for Comparison Purposes
The second line for each share class in the following table provides information about hypothetical account values and hypothetical expenses based on the fund’s actual expense ratio and an assumed rate of return of 5% per year before expenses, which is not the fund's actual return. The hypothetical account values and expenses may not be used to estimate the actual ending account balance or expenses you paid for the period. You may use this information to compare the ongoing costs of investing in the fund and other funds. To do so, compare this 5% hypothetical example with the 5% hypothetical examples that appear in the shareholder reports of the other funds.
Please note that the expenses shown in the table are meant to highlight your ongoing costs only and do not reflect any transactional costs, such as sales charges (loads). Therefore, the second line for each share class in the table is useful in comparing ongoing costs only, and will not help you determine the relative total costs of owning different funds. In addition, if these transactional costs were included, your costs would have been higher.
10
Expense Table – continued
| | | | | | | | | | | | | | | | | | |
Share
Class | | | | Annualized
Expense Ratio | | | Beginning
Account Value
9/01/11 | | | Ending
Account Value
2/29/12 | | | Expenses Paid During
Period (p) 9/01/11-2/29/12 | |
| A | | Actual | | | 1.12% | | | | $1,000.00 | | | | $1,070.02 | | | | $5.76 | |
| | Hypothetical (h) | | | 1.12% | | | | $1,000.00 | | | | $1,019.29 | | | | $5.62 | |
| C | | Actual | | | 1.87% | | | | $1,000.00 | | | | $1,066.15 | | | | $9.61 | |
| | Hypothetical (h) | | | 1.87% | | | | $1,000.00 | | | | $1,015.56 | | | | $9.37 | |
| I | | Actual | | | 0.87% | | | | $1,000.00 | | | | $1,071.33 | | | | $4.48 | |
| | Hypothetical (h) | | | 0.87% | | | | $1,000.00 | | | | $1,020.54 | | | | $4.37 | |
| R1 | | Actual | | | 1.87% | | | | $1,000.00 | | | | $1,066.15 | | | | $9.61 | |
| | Hypothetical (h) | | | 1.87% | | | | $1,000.00 | | | | $1,015.56 | | | | $9.37 | |
| R2 | | Actual | | | 1.37% | | | | $1,000.00 | | | | $1,068.77 | | | | $7.05 | |
| | Hypothetical (h) | | | 1.37% | | | | $1,000.00 | | | | $1,018.05 | | | | $6.87 | |
| R3 | | Actual | | | 1.12% | | | | $1,000.00 | | | | $1,070.02 | | | | $5.76 | |
| | Hypothetical (h) | | | 1.12% | | | | $1,000.00 | | | | $1,019.29 | | | | $5.62 | |
| R4 | | Actual | | | 0.87% | | | | $1,000.00 | | | | $1,071.32 | | | | $4.48 | |
| | Hypothetical (h) | | | 0.87% | | | | $1,000.00 | | | | $1,020.54 | | | | $4.37 | |
| (h) | 5% class return per year before expenses. |
| (p) | Expenses paid are equal to each class’ annualized expense ratio, as shown above, multiplied by the average account value over the period, multiplied by the number of days in the period, divided by the number of days in the year. Expenses paid do not include any applicable sales charges (loads). If these transaction costs had been included, your costs would have been higher. |
11
PORTFOLIO OF INVESTMENTS
2/29/12
The Portfolio of Investments is a complete list of all securities owned by your fund. It is categorized by broad-based asset classes.
| | | | | | | | |
| Bonds - 54.0% | | | | | | | | |
| Issuer | | Shares/Par | | | Value ($) | |
| | | | | | | | |
| Aerospace - 0.6% | | | | | | | | |
| BE Aerospace, Inc., 8.5%, 2018 | | $ | 635,000 | | | $ | 705,644 | |
| Bombardier, Inc., 7.5%, 2018 (n) | | | 980,000 | | | | 1,114,750 | |
| Bombardier, Inc., 7.75%, 2020 (n) | | | 180,000 | | | | 208,800 | |
| CPI International, Inc., 8%, 2018 | | | 915,000 | | | | 793,762 | |
| Hawker Beechcraft Acquisition Co. LLC, 8.5%, 2015 | | | 309,000 | | | | 64,890 | |
| Heckler & Koch GmbH, 9.5%, 2018 (z) | | EUR | 260,000 | | | | 228,623 | |
| Huntington Ingalls Industries, Inc., 7.125%, 2021 | | $ | 1,070,000 | | | | 1,146,238 | |
| | | | | | | | |
| | | | | | | $ | 4,262,707 | |
| Agency - Other - 0.4% | | | | | | | | |
| Financing Corp., 9.4%, 2018 | | $ | 965,000 | | | $ | 1,371,905 | |
| Financing Corp., 10.35%, 2018 | | | 715,000 | | | | 1,082,373 | |
| Financing Corp., STRIPS, 0%, 2017 | | | 860,000 | | | | 781,564 | |
| | | | | | | | |
| | | | | | | $ | 3,235,842 | |
| Apparel Manufacturers - 0.3% | | | | | | | | |
| Hanesbrands, Inc., 8%, 2016 | | $ | 30,000 | | | $ | 33,375 | |
| Hanesbrands, Inc., 6.375%, 2020 | | | 735,000 | | | | 768,075 | |
| Jones Group, Inc., 6.875%, 2019 | | | 345,000 | | | | 333,356 | |
| Phillips-Van Heusen Corp., 7.375%, 2020 | | | 765,000 | | | | 849,150 | |
| | | | | | | | |
| | | | | | | $ | 1,983,956 | |
| Asset-Backed & Securitized - 0.1% | | | | | | | | |
| Citigroup Commercial Mortgage Trust, FRN, 5.697%, 2049 | | $ | 198,555 | | | $ | 56,510 | |
| Citigroup/Deutsche Bank Commercial Mortgage Trust, 5.322%, 2049 | | | 100,000 | | | | 109,750 | |
| Commercial Mortgage Pass-Through Certificates, “A4”, 5.306%, 2046 | | | 199,556 | | | | 223,505 | |
| G-Force LLC, CDO, “A2”, 4.83%, 2036 (z) | | | 164,244 | | | | 158,495 | |
| JPMorgan Chase Commercial Mortgage Securities Corp., FRN, 5.819%, 2049 | | | 124,877 | | | | 137,874 | |
| JPMorgan Chase Commercial Mortgage Securities Corp., FRN, 5.986%, 2051 | | | 105,201 | | | | 113,237 | |
| Wachovia Bank Commercial Mortgage Trust, FRN, 5.744%, 2047 | | | 116,771 | | | | 19,829 | |
| | | | | | | | |
| | | | | | | $ | 819,200 | |
| Automotive - 1.0% | | | | | | | | |
| Accuride Corp., 9.5%, 2018 | | $ | 1,140,000 | | | $ | 1,208,400 | |
12
Portfolio of Investments – continued
| | | | | | | | |
| Issuer | | Shares/Par | | | Value ($) | |
| | | | | | | | |
| Bonds - continued | | | | | | | | |
| Automotive - continued | | | | | | | | |
| Allison Transmission, Inc., 7.125%, 2019 (n) | | $ | 500,000 | | | $ | 515,000 | |
| Automotores Gildemeister S.A., 8.25%, 2021 (n) | | | 319,000 | | | | 331,760 | |
| Chrysler Group LLC/CG Co-Issuer, Inc., 8.25%, 2021 | | | 410,000 | | | | 414,100 | |
| Ford Motor Co., 7.45%, 2031 | | | 395,000 | | | | 507,081 | |
| Ford Motor Credit Co. LLC, 12%, 2015 | | | 1,825,000 | | | | 2,294,833 | |
| General Motors Financial Co., Inc., 6.75%, 2018 | | | 610,000 | | | | 658,286 | |
| Goodyear Tire & Rubber Co., 7%, 2022 | | | 250,000 | | | | 253,125 | |
| Hyundai Capital America, 4%, 2017 (n) | | | 213,000 | | | | 216,477 | |
| Jaguar Land Rover PLC, 8.125%, 2021 (n) | | | 965,000 | | | | 996,363 | |
| Lear Corp., 8.125%, 2020 | | | 535,000 | | | | 603,213 | |
| | | | | | | | |
| | | | | | | $ | 7,998,638 | |
| Basic Industry - 0.1% | | | | | | | | |
| Trimas Corp., 9.75%, 2017 | | $ | 435,000 | | | $ | 481,763 | |
| | |
| Broadcasting - 1.3% | | | | | | | | |
| Allbritton Communications Co., 8%, 2018 | | $ | 400,000 | | | $ | 423,000 | |
| AMC Networks, Inc., 7.75%, 2021 (n) | | | 274,000 | | | | 305,510 | |
| Clear Channel Communications, Inc., 9%, 2021 | | | 436,000 | | | | 401,120 | |
| Clear Channel Worldwide Holdings, Inc., 7.625%, 2020 (z) | | | 210,000 | | | | 210,000 | |
| Clear Channel Worldwide Holdings, Inc., “A”, 7.625%, 2020 (z) | | | 30,000 | | | | 30,000 | |
| Gray Television, Inc., 10.5%, 2015 | | | 70,000 | | | | 73,937 | |
| Hughes Network Systems LLC, 7.625%, 2021 | | | 460,000 | | | | 499,100 | |
| Inmarsat Finance PLC, 7.375%, 2017 (n) | | | 460,000 | | | | 492,200 | |
| Intelsat Bermuda Ltd., 11.25%, 2017 | | | 975,000 | | | | 1,005,469 | |
| Intelsat Bermuda Ltd., 11.5%, 2017 (p) | | | 810,000 | | | | 834,300 | |
| Intelsat Jackson Holdings Ltd., 11.25%, 2016 | | | 1,180,000 | | | | 1,247,850 | |
| LBI Media, Inc., 8.5%, 2017 (z) | | | 125,000 | | | | 41,250 | |
| Liberty Media Corp., 8.5%, 2029 | | | 445,000 | | | | 449,450 | |
| Liberty Media Corp., 8.25%, 2030 | | | 135,000 | | | | 136,350 | |
| LIN Television Corp., 8.375%, 2018 | | | 155,000 | | | | 163,913 | |
| Local TV Finance LLC, 9.25%, 2015 (p)(z) | | | 413,826 | | | | 421,068 | |
| Newport Television LLC, 13%, 2017 (n)(p) | | | 91,165 | | | | 85,246 | |
| Nexstar Broadcasting Group, Inc., 8.875%, 2017 | | | 185,000 | | | | 197,950 | |
| Sinclair Broadcast Group, Inc., 9.25%, 2017 (n) | | | 395,000 | | | | 441,413 | |
| Sinclair Broadcast Group, Inc., 8.375%, 2018 | | | 30,000 | | | | 32,625 | |
| SIRIUS XM Radio, Inc., 13%, 2013 (n) | | | 150,000 | | | | 170,812 | |
| SIRIUS XM Radio, Inc., 8.75%, 2015 (n) | | | 405,000 | | | | 459,675 | |
| SIRIUS XM Radio, Inc., 7.625%, 2018 (n) | | | 750,000 | | | | 821,250 | |
| Univision Communications, Inc., 6.875%, 2019 (n) | | | 1,055,000 | | | | 1,076,100 | |
| Univision Communications, Inc., 7.875%, 2020 (n) | | | 95,000 | | | | 101,175 | |
| Univision Communications, Inc., 8.5%, 2021 (n) | | | 340,000 | | | | 337,450 | |
| | | | | | | | |
| | | | | | | $ | 10,458,213 | |
13
Portfolio of Investments – continued
| | | | | | | | |
| Issuer | | Shares/Par | | | Value ($) | |
| | | | | | | | |
| Bonds - continued | | | | | | | | |
| Brokerage & Asset Managers - 0.2% | | | | | | | | |
| E*TRADE Financial Corp., 7.875%, 2015 | | $ | 135,000 | | | $ | 137,869 | |
| E*TRADE Financial Corp., 12.5%, 2017 | | | 1,390,000 | | | | 1,619,350 | |
| | | | | | | | |
| | | | | | | $ | 1,757,219 | |
| Building - 0.7% | | | | | | | | |
| Associated Materials LLC, 9.125%, 2017 | | $ | 100,000 | | | $ | 98,500 | |
| Building Materials Holding Corp., 6.875%, 2018 (n) | | | 150,000 | | | | 161,250 | |
| Building Materials Holding Corp., 7%, 2020 (n) | | | 60,000 | | | | 65,100 | |
| Building Materials Holding Corp., 6.75%, 2021 (n) | | | 645,000 | | | | 701,437 | |
| CEMEX Finance LLC, 9.5%, 2016 (n) | | | 435,000 | | | | 428,475 | |
| CEMEX S.A.B. de C.V., 9%, 2018 (n) | | | 1,064,000 | | | | 984,200 | |
| CEMEX S.A.B. de C.V., FRN, 5.579%, 2015 (n) | | | 1,155,000 | | | | 1,019,287 | |
| Masonite International Corp., 8.25%, 2021 (n) | | | 400,000 | | | | 429,000 | |
| Nortek, Inc., 10%, 2018 | | | 65,000 | | | | 68,413 | |
| Nortek, Inc., 8.5%, 2021 | | | 1,045,000 | | | | 1,011,038 | |
| Odebrecht Finance Ltd., 6%, 2023 (n) | | | 204,000 | | | | 208,590 | |
| Roofing Supply Group LLC/Roofing Supply Finance, Inc., 8.625%, 2017 (n) | | | 36,000 | | | | 38,610 | |
| | | | | | | | |
| | | | | | | $ | 5,213,900 | |
| Business Services - 0.4% | | | | | | | | |
| Ceridian Corp., 12.25%, 2015 (p) | | $ | 520,000 | | | $ | 499,850 | |
| iGate Corp., 9%, 2016 | | | 615,000 | | | | 668,813 | |
| Interactive Data Corp., 10.25%, 2018 | | | 505,000 | | | | 569,388 | |
| Iron Mountain, Inc., 8.375%, 2021 | | | 1,050,000 | | | | 1,166,813 | |
| SunGard Data Systems, Inc., 10.25%, 2015 | | | 357,000 | | | | 372,173 | |
| SunGard Data Systems, Inc., 7.375%, 2018 | | | 95,000 | | | | 102,125 | |
| | | | | | | | |
| | | | | | | $ | 3,379,162 | |
| Cable TV - 1.2% | | | | | | | | |
| Bresnan Broadband Holdings LLC, 8%, 2018 (n) | | $ | 55,000 | | | $ | 58,025 | |
| Cablevision Systems Corp., 8.625%, 2017 | | | 270,000 | | | | 304,425 | |
| CCH II LLC, 13.5%, 2016 | | | 775,000 | | | | 891,250 | |
| CCO Holdings LLC, 7.875%, 2018 | | | 705,000 | | | | 770,212 | |
| CCO Holdings LLC, 8.125%, 2020 | | | 730,000 | | | | 817,600 | |
| Cequel Communications Holdings, 8.625%, 2017 (n) | | | 305,000 | | | | 327,112 | |
| CSC Holdings LLC, 8.5%, 2014 | | | 625,000 | | | | 693,750 | |
| DISH DBS Corp., 6.75%, 2021 | | | 275,000 | | | | 305,250 | |
| EchoStar Corp., 7.125%, 2016 | | | 430,000 | | | | 475,150 | |
| Insight Communications Co., Inc., 9.375%, 2018 (n) | | | 265,000 | | | | 304,088 | |
| Mediacom LLC, 9.125%, 2019 | | | 275,000 | | | | 300,438 | |
| Myriad International Holdings B.V., 6.375%, 2017 (n) | | | 1,320,000 | | | | 1,465,200 | |
| Telenet Finance Luxembourg, 6.375%, 2020 (n) | | EUR | 100,000 | | | | 134,895 | |
14
Portfolio of Investments – continued
| | | | | | | | |
| Issuer | | Shares/Par | | | Value ($) | |
| | | | | | | | |
| Bonds - continued | | | | | | | | |
| Cable TV - continued | | | | | | | | |
| UPC Holding B.V., 9.875%, 2018 (z) | | $ | 400,000 | | | $ | 444,000 | |
| UPCB Finance III Ltd., 6.625%, 2020 (n) | | | 470,000 | | | | 484,100 | |
| Videotron Ltee, 6.875%, 2014 | | | 66,000 | | | | 66,248 | |
| Videotron Ltee, 5%, 2022 (z) | | | 155,000 | | | | 155,000 | |
| Virgin Media Finance PLC, 9.5%, 2016 | | | 400,000 | | | | 456,000 | |
| Virgin Media Finance PLC, 8.375%, 2019 | | | 100,000 | | | | 113,500 | |
| Virgin Media Finance PLC, 5.25%, 2022 | | | 600,000 | | | | 612,000 | |
| Ziggo Bond Co. B.V., 8%, 2018 (n) | | EUR | 190,000 | | | | 267,692 | |
| | | | | | | | |
| | | | | | | $ | 9,445,935 | |
| Chemicals - 1.0% | | | | | | | | |
| Braskem Finance Ltd., 5.75%, 2021 (n) | | $ | 204,000 | | | $ | 212,670 | |
| Celanese U.S. Holdings LLC, 6.625%, 2018 | | | 820,000 | | | | 897,900 | |
| Hexion U.S. Finance Corp./Hexion Nova Scotia Finance, 8.875%, 2018 | | | 1,025,000 | | | | 1,060,875 | |
| Hexion U.S. Finance Corp./Hexion Nova Scotia Finance, 9%, 2020 | | | 55,000 | | | | 53,900 | |
| Huntsman International LLC, 8.625%, 2021 | | | 410,000 | | | | 463,300 | |
| INEOS Finance PLC, 8.375%, 2019 (z) | | | 555,000 | | | | 589,688 | |
| INEOS Group Holdings PLC, 8.5%, 2016 (n) | | | 360,000 | | | | 328,500 | |
| Lyondell Chemical Co., 8%, 2017 | | | 31,000 | | | | 34,643 | |
| Lyondell Chemical Co., 11%, 2018 | | | 408,503 | | | | 447,821 | |
| LyondellBasell Industries, Inc., 6%, 2021 (n) | | | 575,000 | | | | 631,063 | |
| Momentive Performance Materials, Inc., 12.5%, 2014 | | | 854,000 | | | | 911,645 | |
| Momentive Performance Materials, Inc., 11.5%, 2016 | | | 514,000 | | | | 431,760 | |
| Polypore International, Inc., 7.5%, 2017 | | | 530,000 | | | | 555,175 | |
| Sociedad Quimica y Minera de Chile S.A., 5.5%, 2020 (n) | | | 859,000 | | | | 930,441 | |
| | | | | | | | |
| | | | | | | $ | 7,549,381 | |
| Computer Software - 0.2% | | | | | | | | |
| Lawson Software, Inc., 11.5%, 2018 (n) | | $ | 630,000 | | | $ | 658,350 | |
| Syniverse Holdings, Inc., 9.125%, 2019 | | | 740,000 | | | | 806,600 | |
| | | | | | | | |
| | | | | | | $ | 1,464,950 | |
| Computer Software - Systems - 0.3% | | | | | | | | |
| Audatex North America, Inc., 6.75%, 2018 (n) | | $ | 220,000 | | | $ | 229,075 | |
| CDW LLC/CDW Finance Corp., 12.535%, 2017 | | | 135,000 | | | | 147,150 | |
| CDW LLC/CDW Finance Corp., 8.5%, 2019 (z) | | | 140,000 | | | | 149,800 | |
| CDW LLC/CDW Finance Corp., 8.5%, 2019 | | | 1,130,000 | | | | 1,209,100 | |
| DuPont Fabros Technology, Inc., REIT, 8.5%, 2017 | | | 590,000 | | | | 651,950 | |
| | | | | | | | |
| | | | | | | $ | 2,387,075 | |
| Conglomerates - 0.4% | | | | | | | | |
| Amsted Industries, Inc., 8.125%, 2018 (n) | | $ | 610,000 | | | $ | 658,800 | |
15
Portfolio of Investments – continued
| | | | | | | | |
| Issuer | | Shares/Par | | | Value ($) | |
| | | | | | | | |
| Bonds - continued | | | | | | | | |
| Conglomerates - continued | | | | | | | | |
| Dynacast International LLC, 9.25%, 2019 (z) | | $ | 375,000 | | | $ | 390,937 | |
| Griffon Corp., 7.125%, 2018 | | | 1,055,000 | | | | 1,097,200 | |
| Tomkins LLC/Tomkins, Inc., 9%, 2018 | | | 1,170,000 | | | | 1,292,850 | |
| | | | | | | | |
| | | | | | | $ | 3,439,787 | |
| Construction - 0.0% | | | | | | | | |
| Urbi Desarrollos Urbanos S.A.B. de C.V., 9.75%, 2022 (n) | | $ | 249,000 | | | $ | 255,848 | |
| | |
| Consumer Products - 0.3% | | | | | | | | |
| Easton-Bell Sports, Inc., 9.75%, 2016 | | $ | 245,000 | | | $ | 271,950 | |
| Elizabeth Arden, Inc., 7.375%, 2021 | | | 485,000 | | | | 522,587 | |
| Jarden Corp., 7.5%, 2020 | | | 870,000 | | | | 951,563 | |
| Libbey Glass, Inc., 10%, 2015 | | | 319,000 | | | | 342,526 | |
| Prestige Brands, Inc., 8.125%, 2020 (z) | | | 50,000 | | | | 54,750 | |
| Visant Corp., 10%, 2017 | | | 350,000 | | | | 322,000 | |
| | | | | | | | |
| | | | | | | $ | 2,465,376 | |
| Consumer Services - 0.3% | | | | | | | | |
| Realogy Corp., 11.5%, 2017 | | $ | 405,000 | | | $ | 370,575 | |
| Service Corp. International, 6.75%, 2015 | | | 60,000 | | | | 66,225 | |
| Service Corp. International, 7%, 2017 | | | 1,125,000 | | | | 1,260,000 | |
| Service Corp. International, 7%, 2019 | | | 325,000 | | | | 359,125 | |
| | | | | | | | |
| | | | | | | $ | 2,055,925 | |
| Containers - 0.5% | | | | | | | | |
| Ardagh Packaging Finance PLC, 9.125%, 2020 (z) | | $ | 385,000 | | | $ | 397,512 | |
| Ball Corp., 5%, 2022 | | | 307,000 | | | | 313,907 | |
| Graham Packaging Co. LP/GPC Capital Corp., 9.875%, 2014 | | | 470,000 | | | | 479,400 | |
| Greif, Inc., 6.75%, 2017 | | | 220,000 | | | | 235,400 | |
| Greif, Inc., 7.75%, 2019 | | | 220,000 | | | | 247,500 | |
| Reynolds Group, 8.75%, 2016 (n) | | | 190,000 | | | | 202,350 | |
| Reynolds Group, 7.125%, 2019 (n) | | | 745,000 | | | | 787,838 | |
| Reynolds Group, 9.875%, 2019 (z) | | | 695,000 | | | | 718,456 | |
| Reynolds Group, 8.25%, 2021 (n) | | | 320,000 | | | | 305,600 | |
| Sealed Air Corp., 8.125%, 2019 (n) | | | 80,000 | | | | 90,400 | |
| Sealed Air Corp., 8.375%, 2021 (n) | | | 80,000 | | | | 91,600 | |
| | | | | | | | |
| | | | | | | $ | 3,869,963 | |
| Defense Electronics - 0.1% | | | | | | | | |
| ManTech International Corp., 7.25%, 2018 | | $ | 380,000 | | | $ | 396,150 | |
| | |
| Electrical Equipment - 0.0% | | | | | | | | |
| Avaya, Inc., 9.75%, 2015 | | $ | 165,000 | | | $ | 165,000 | |
16
Portfolio of Investments – continued
| | | | | | | | |
| Issuer | | Shares/Par | | | Value ($) | |
| | | | | | | | |
| Bonds - continued | | | | | | | | |
| Electronics - 0.2% | | | | | | | | |
| Freescale Semiconductor, Inc., 9.25%, 2018 (n) | | $ | 695,000 | | | $ | 764,500 | |
| Freescale Semiconductor, Inc., 8.05%, 2020 | | | 230,000 | | | | 227,700 | |
| Sensata Technologies B.V., 6.5%, 2019 (n) | | | 655,000 | | | | 692,663 | |
| | | | | | | | |
| | | | | | | $ | 1,684,863 | |
| Emerging Market Quasi-Sovereign - 4.3% | | | | | | | | |
| Abu Dhabi National Energy Co. PJSC (TAQA), 5.875%, 2021 (n) | | $ | 955,000 | | | $ | 1,000,362 | |
| Banco del Estado de Chile, 3.875%, 2022 (z) | | | 190,000 | | | | 188,575 | |
| Banco do Brasil S.A., 3.875%, 2017 | | | 1,472,000 | | | | 1,483,040 | |
| Banco do Brasil S.A., 5.875%, 2022 (n) | | | 1,535,000 | | | | 1,577,212 | |
| Banco do Estado Rio Grande do Sul S.A., 7.375%, 2022 (n) | | | 278,000 | | | | 289,820 | |
| Banco do Nordeste do Brasil (BNB), 3.625%, 2015 (n) | | | 1,236,000 | | | | 1,237,236 | |
| Banco Nacional de Desenvolvimento Economico e Social, 6.5%, 2019 | | | 509,000 | | | | 595,530 | |
| Biz Finance PLC, 8.375%, 2015 | | | 1,153,000 | | | | 1,080,937 | |
| BNDES Participacoes S.A., 6.5%, 2019 (n) | | | 248,000 | | | | 290,160 | |
| Centrais Eletricas Brasileiras S.A., 5.75%, 2021 (n) | | | 1,531,000 | | | | 1,664,962 | |
| CNPC (HK) Overseas Capital Ltd., 4.5%, 2021 (n) | | | 540,000 | | | | 574,234 | |
| CNPC (HK) Overseas Capital Ltd., 5.95%, 2041 (n) | | | 205,000 | | | | 231,889 | |
| Comision Federal de Electricidad, 5.75%, 2042 (z) | | | 1,575,000 | | | | 1,578,937 | |
| Corporacion Financiera de Desarrollo S.A., 4.75%, 2022 (z) | | | 252,000 | | | | 253,562 | |
| Corporacion Nacional del Cobre de Chile, 3.75%, 2020 (n) | | | 349,000 | | | | 357,376 | |
| Development Bank of Kazakhstan, 5.5%, 2015 (n) | | | 427,000 | | | | 448,350 | |
| Dolphin Energy Ltd., 5.5%, 2021 (z) | | | 400,000 | | | | 413,600 | |
| Ecopetrol S.A., 7.625%, 2019 | | | 772,000 | | | | 966,930 | |
| Empresa Nacional del Petroleo, 4.75%, 2021 (n) | | | 1,290,000 | | | | 1,332,960 | |
| Gaz Capital S.A., 8.125%, 2014 (n) | | | 784,000 | | | | 870,240 | |
| Gaz Capital S.A., 9.25%, 2019 | | | 535,000 | | | | 665,406 | |
| Gaz Capital S.A., 5.999%, 2021 (n) | | | 2,212,000 | | | | 2,330,895 | |
| Majapahit Holding B.V., 7.75%, 2020 | | | 1,351,000 | | | | 1,651,597 | |
| Naftogaz Ukraine, 9.5%, 2014 | | | 753,000 | | | | 736,999 | |
| OJSC Russian Agricultural Bank, FRN, 6%, 2021 (n) | | | 1,981,000 | | | | 1,961,190 | |
| Pemex Project Funding Master Trust, 6.625%, 2035 | | | 1,446,000 | | | | 1,648,440 | |
| Petrobras International Finance Co., 7.875%, 2019 | | | 566,000 | | | | 696,180 | |
| Petrobras International Finance Co., 5.375%, 2021 | | | 2,500,000 | | | | 2,687,795 | |
| Petroleos Mexicanos, 5.5%, 2021 | | | 1,465,000 | | | | 1,606,812 | |
| Petroleum Co. of Trinidad & Tobago Ltd., 6%, 2022 | | | 979,125 | | | | 998,707 | |
| PT Perusahaan Listrik Negara, 5.5%, 2021 (n) | | | 642,000 | | | | 688,545 | |
| Ras Laffan Liquefied Natural Gas Co. Ltd., 5.832%, 2016 (n) | | | 391,003 | | | | 420,328 | |
| Sberbank of Russia, 6.125%, 2022 (z) | | | 379,000 | | | | 386,012 | |
| Transnet Ltd., 4.5%, 2016 (n) | | | 202,000 | | | | 209,391 | |
| Turkiye Ihracat Kredi Bankasi A.S., 5.375%, 2016 (n) | | | 200,000 | | | | 203,000 | |
| | | | | | | | |
| | | | | | | $ | 33,327,209 | |
17
Portfolio of Investments – continued
| | | | | | | | |
| Issuer | | Shares/Par | | | Value ($) | |
| | | | | | | | |
| Bonds - continued | | | | | | | | |
| Emerging Market Sovereign - 4.6% | | | | | | | | |
| Dominican Republic, 7.5%, 2021 (n) | | $ | 723,000 | | | $ | 739,990 | |
| Republic of Argentina, 7%, 2015 | | | 1,085,000 | | | | 1,014,957 | |
| Republic of Argentina, 8.75%, 2017 | | | 1,146,000 | | | | 1,143,135 | |
| Republic of Colombia, 6.125%, 2041 | | | 562,000 | | | | 690,417 | |
| Republic of Indonesia, 6.875%, 2018 | | | 1,100,000 | | | | 1,329,625 | |
| Republic of Indonesia, 4.875%, 2021 (n) | | | 2,623,000 | | | | 2,875,464 | |
| Republic of Latvia, 5.25%, 2017 (z) | | | 237,000 | | | | 242,333 | |
| Republic of Lithuania, 6.625%, 2022 (n) | | | 1,794,000 | | | | 1,928,550 | |
| Republic of Panama, 8.875%, 2027 | | | 427,000 | | | | 654,378 | |
| Republic of Peru, 7.35%, 2025 | | | 787,000 | | | | 1,061,663 | |
| Republic of Peru, 5.625%, 2050 | | | 139,000 | | | | 152,900 | |
| Republic of Philippines, 5.5%, 2026 | | | 1,293,000 | | | | 1,485,334 | |
| Republic of Philippines, 7.75%, 2031 | | | 389,000 | | | | 544,114 | |
| Republic of Philippines, 6.375%, 2034 | | | 665,000 | | | | 832,081 | |
| Republic of Poland, 5%, 2022 | | | 236,000 | | | | 250,467 | |
| Republic of Romania, 6.75%, 2022 (n) | | | 1,816,000 | | | | 1,865,940 | |
| Republic of Serbia, 7.25%, 2021 (n) | | | 200,000 | | | | 202,000 | |
| Republic of South Africa, 5.5%, 2020 | | | 1,035,000 | | | | 1,176,019 | |
| Republic of South Africa, 4.665%, 2024 | | | 1,655,000 | | | | 1,725,338 | |
| Republic of South Africa, 6.25%, 2041 | | | 655,000 | | | | 775,356 | |
| Republic of Turkey, 5.625%, 2021 | | | 1,594,000 | | | | 1,657,760 | |
| Republic of Turkey, 6.25%, 2022 | | | 505,000 | | | | 541,613 | |
| Republic of Uruguay, 8%, 2022 | | | 319,500 | | | | 436,597 | |
| Republic of Uruguay, 7.625%, 2036 | | | 304,000 | | | | 419,824 | |
| Republic of Venezuela, 7.75%, 2019 | | | 449,000 | | | | 380,078 | |
| Republic of Venezuela, 12.75%, 2022 | | | 1,240,000 | | | | 1,326,800 | |
| Republic of Venezuela, 9.25%, 2027 | | | 1,659,000 | | | | 1,501,395 | |
| Republic of Venezuela, 7%, 2038 | | | 921,000 | | | | 663,120 | |
| Republic of Vietnam, 6.875%, 2016 | | | 994,000 | | | | 1,078,490 | |
| Russian Federation, 7.5%, 2030 | | | 1,361,885 | | | | 1,624,048 | |
| United Mexican States, 5.125%, 2020 | | | 1,672,000 | | | | 1,910,260 | |
| United Mexican States, 3.625%, 2022 | | | 3,416,000 | | | | 3,484,320 | |
| | | | | | | | |
| | | | | | | $ | 35,714,366 | |
| Energy - Independent - 2.1% | | | | | | | | |
| ATP Oil & Gas Corp., 11.875%, 2015 | | $ | 280,000 | | | $ | 182,000 | |
| Bill Barrett Corp., 9.875%, 2016 | | | 305,000 | | | | 337,025 | |
| BreitBurn Energy Partners LP, 8.625%, 2020 | | | 230,000 | | | | 249,550 | |
| BreitBurn Energy Partners LP, 7.875%, 2022 (z) | | | 280,000 | | | | 293,300 | |
| Carrizo Oil & Gas, Inc., 8.625%, 2018 | | | 440,000 | | | | 457,600 | |
| Chaparral Energy, Inc., 8.875%, 2017 | | | 740,000 | | | | 771,450 | |
| Chesapeake Energy Corp., 6.875%, 2020 | | | 265,000 | | | | 278,250 | |
18
Portfolio of Investments – continued
| | | | | | | | |
| Issuer | | Shares/Par | | | Value ($) | |
| | | | | | | | |
| Bonds - continued | | | | | | | | |
| Energy - Independent - continued | | | | | | | | |
| Concho Resources, Inc., 8.625%, 2017 | | $ | 670,000 | | | $ | 753,750 | |
| Concho Resources, Inc., 6.5%, 2022 | | | 430,000 | | | | 477,300 | |
| Connacher Oil & Gas Ltd., 8.5%, 2019 (n) | | | 215,000 | | | | 209,625 | |
| Continental Resources, Inc., 8.25%, 2019 | | | 295,000 | | | | 331,137 | |
| Denbury Resources, Inc., 8.25%, 2020 | | | 645,000 | | | | 735,300 | |
| Energy XXI Gulf Coast, Inc., 9.25%, 2017 | | | 720,000 | | | | 797,400 | |
| EXCO Resources, Inc., 7.5%, 2018 | | | 890,000 | | | | 796,550 | |
| Harvest Operations Corp., 6.875%, 2017 (n) | | | 920,000 | | | | 971,750 | |
| Hilcorp Energy I/Hilcorp Finance Co., 8%, 2020 (n) | | | 175,000 | | | | 192,500 | |
| Laredo Petroleum, Inc., 9.5%, 2019 | | | 325,000 | | | | 358,313 | |
| LINN Energy LLC, 6.5%, 2019 (n) | | | 145,000 | | | | 147,900 | |
| LINN Energy LLC, 8.625%, 2020 | | | 465,000 | | | | 516,150 | |
| LINN Energy LLC, 7.75%, 2021 | | | 385,000 | | | | 413,875 | |
| Newfield Exploration Co., 6.625%, 2016 | | | 590,000 | | | | 604,750 | |
| Newfield Exploration Co., 6.875%, 2020 | | | 490,000 | | | | 529,200 | |
| OGX Petroleo e Gas Participacoes S.A., 8.5%, 2018 (n) | | | 1,691,000 | | | | 1,762,868 | |
| Pioneer Natural Resources Co., 7.5%, 2020 | | | 850,000 | | | | 1,050,405 | |
| QEP Resources, Inc., 6.875%, 2021 | | | 590,000 | | | | 651,950 | |
| Quicksilver Resources, Inc., 9.125%, 2019 | | | 110,000 | | | | 110,825 | |
| Range Resources Corp., 8%, 2019 | | | 420,000 | | | | 468,300 | |
| SandRidge Energy, Inc., 8%, 2018 (n) | | | 820,000 | | | | 848,700 | |
| SM Energy Co., 6.5%, 2021 (n) | | | 455,000 | | | | 491,400 | |
| Swift Energy Co., 7.875%, 2022 (n) | | | 240,000 | | | | 250,800 | |
| Whiting Petroleum Corp., 6.5%, 2018 | | | 390,000 | | | | 419,737 | |
| | | | | | | | |
| | | | | | | $ | 16,459,660 | |
| Energy - Integrated - 0.5% | | | | | | | | |
| Listrindo Capital B.V., 6.95%, 2019 (z) | | $ | 200,000 | | | $ | 201,612 | |
| LUKOIL International Finance B.V., 6.125%, 2020 (n) | | | 1,631,000 | | | | 1,704,395 | |
| Pacific Rubiales Energy Corp., 7.25%, 2021 (n) | | | 1,928,000 | | | | 2,101,520 | |
| | | | | | | | |
| | | | | | | $ | 4,007,527 | |
| Engineering - Construction - 0.0% | | | | | | | | |
| B-Corp. Merger Sub, Inc., 8.25%, 2019 (n) | | $ | 280,000 | | | $ | 285,600 | |
| | |
| Entertainment - 0.2% | | | | | | | | |
| AMC Entertainment, Inc., 8.75%, 2019 | | $ | 405,000 | | | $ | 422,212 | |
| AMC Entertainment, Inc., 9.75%, 2020 | | | 870,000 | | | | 813,450 | |
| Cinemark USA, Inc., 8.625%, 2019 | | | 555,000 | | | | 617,437 | |
| | | | | | | | |
| | | | | | | $ | 1,853,099 | |
| Financial Institutions - 1.5% | | | | | | | | |
| Ally Financial, Inc., 5.5%, 2017 | | $ | 930,000 | | | $ | 941,927 | |
19
Portfolio of Investments – continued
| | | | | | | | |
| Issuer | | Shares/Par | | | Value ($) | |
| | | | | | | | |
| Bonds - continued | | | | | | | | |
| Financial Institutions - continued | | | | | | | | |
| CIT Group, Inc., 5.25%, 2014 (n) | | $ | 425,000 | | | $ | 434,562 | |
| CIT Group, Inc., 7%, 2016 | | | 497,318 | | | | 497,940 | |
| CIT Group, Inc., 7%, 2017 | | | 2,430,000 | | | | 2,430,000 | |
| CIT Group, Inc., 6.625%, 2018 (n) | | | 864,000 | | | | 930,960 | |
| CIT Group, Inc., 5.5%, 2019 (z) | | | 625,000 | | | | 638,281 | |
| Credit Acceptance Corp., 9.125%, 2017 (z) | | | 210,000 | | | | 223,125 | |
| Credit Acceptance Corp., 9.125%, 2017 | | | 385,000 | | | | 410,025 | |
| GMAC, Inc., 8%, 2031 | | | 90,000 | | | | 100,462 | |
| Icahn Enterprises LP, 8%, 2018 (z) | | | 578,000 | | | | 612,680 | |
| International Lease Finance Corp., 8.75%, 2017 | | | 610,000 | | | | 689,300 | |
| International Lease Finance Corp., 7.125%, 2018 (n) | | | 637,000 | | | | 713,440 | |
| Nationstar Mortgage LLC, 10.875%, 2015 | | | 910,000 | | | | 946,400 | |
| PHH Corp., 9.25%, 2016 | | | 345,000 | | | | 346,725 | |
| SLM Corp., 8.45%, 2018 | | | 135,000 | | | | 151,200 | |
| SLM Corp., 8%, 2020 | | | 1,335,000 | | | | 1,468,500 | |
| SLM Corp., 7.25%, 2022 | | | 120,000 | | | | 126,750 | |
| | | | | | | | |
| | | | | | | $ | 11,662,277 | |
| Food & Beverages - 0.5% | | | | | | | | |
| ARAMARK Corp., 8.5%, 2015 | | $ | 160,000 | | | $ | 164,202 | |
| B&G Foods, Inc., 7.625%, 2018 | | | 605,000 | | | | 655,669 | |
| Corporacion Jose R Lindey S.A., 6.75%, 2021 (n) | | | 630,000 | | | | 675,675 | |
| Grupo Bimbo S.A.B. de C.V., 4.5%, 2022 (n) | | | 283,000 | | | | 291,721 | |
| JBS USA LLC/JBS USA Finance, 8.25%, 2020 (z) | | | 290,000 | | | | 299,425 | |
| Pinnacle Foods Finance LLC, 9.25%, 2015 | | | 305,000 | | | | 313,388 | |
| Pinnacle Foods Finance LLC, 10.625%, 2017 | | | 355,000 | | | | 375,191 | |
| Pinnacle Foods Finance LLC, 8.25%, 2017 | | | 585,000 | | | | 633,263 | |
| Sigma Alimentos S.A., 5.625%, 2018 (n) | | | 190,000 | | | | 197,125 | |
| TreeHouse Foods, Inc., 7.75%, 2018 | | | 175,000 | | | | 191,625 | |
| | | | | | | | |
| | | | | | | $ | 3,797,284 | |
| Forest & Paper Products - 0.5% | | | | | | | | |
| Boise, Inc., 8%, 2020 | | $ | 735,000 | | | $ | 806,662 | |
| Cascades, Inc., 7.75%, 2017 | | | 350,000 | | | | 358,750 | |
| Georgia-Pacific Corp., 8%, 2024 | | | 565,000 | | | | 731,383 | |
| Graphic Packaging Holding Co., 7.875%, 2018 | | | 630,000 | | | | 693,000 | |
| Inversiones CMPC S.A., 4.75%, 2018 (n) | | | 525,000 | | | | 550,303 | |
| Smurfit Kappa Group PLC, 7.75%, 2019 (n) | | EUR | 225,000 | | | | 322,999 | |
| Tembec Industries, Inc., 11.25%, 2018 (z) | | $ | 90,000 | | | | 96,750 | |
| Tembec Industries, Inc., 11.25%, 2018 | | | 330,000 | | | | 354,750 | |
| | | | | | | | |
| | | | | | | $ | 3,914,597 | |
20
Portfolio of Investments – continued
| | | | | | | | |
| Issuer | | Shares/Par | | | Value ($) | |
| | | | | | | | |
| Bonds - continued | | | | | | | | |
| Gaming & Lodging - 1.2% | | | | | | | | |
| Boyd Gaming Corp., 7.125%, 2016 | | $ | 565,000 | | | $ | 542,400 | |
| Caesars Operating Escrow LLC, 8.5%, 2020 (z) | | | 640,000 | | | | 652,800 | |
| Firekeepers Development Authority, 13.875%, 2015 (n) | | | 180,000 | | | | 201,825 | |
| Fontainebleau Las Vegas Holdings LLC, 10.25%, 2015 (a)(d)(n) | | | 505,000 | | | | 316 | |
| GWR Operating Partnership LLP, 10.875%, 2017 | | | 145,000 | | | | 162,400 | |
| Harrah’s Operating Co., Inc., 11.25%, 2017 | | | 1,015,000 | | | | 1,111,425 | |
| Harrah’s Operating Co., Inc., 10%, 2018 | | | 522,000 | | | | 403,245 | |
| Host Hotels & Resorts, Inc., 6.75%, 2016 | | | 560,000 | | | | 578,900 | |
| MGM Mirage, 10.375%, 2014 | | | 35,000 | | | | 39,813 | |
| MGM Mirage, 6.625%, 2015 | | | 585,000 | | | | 592,313 | |
| MGM Mirage, 7.5%, 2016 | | | 90,000 | | | | 91,575 | |
| MGM Resorts International, 11.375%, 2018 | | | 650,000 | | | | 767,000 | |
| MGM Resorts International, 9%, 2020 | | | 745,000 | | | | 832,538 | |
| Penn National Gaming, Inc., 8.75%, 2019 | | | 628,000 | | | | 704,930 | |
| Pinnacle Entertainment, Inc., 8.75%, 2020 | | | 390,000 | | | | 412,425 | |
| Seven Seas Cruises S. de R.L., 9.125%, 2019 (n) | | | 580,000 | | | | 597,400 | |
| Starwood Hotels & Resorts Worldwide, Inc., 6.75%, 2018 | | | 315,000 | | | | 366,188 | |
| Wyndham Worldwide Corp., 7.375%, 2020 | | | 320,000 | | | | 391,342 | |
| Wynn Las Vegas LLC, 7.75%, 2020 | | | 480,000 | | | | 541,200 | |
| | | | | | | | |
| | | | | | | $ | 8,990,035 | |
| Industrial - 0.3% | | | | | | | | |
| Altra Holdings, Inc., 8.125%, 2016 | | $ | 230,000 | | | $ | 248,975 | |
| Dematic S.A., 8.75%, 2016 (z) | | | 855,000 | | | | 884,925 | |
| Hillman Group, Inc., 10.875%, 2018 | | | 440,000 | | | | 460,900 | |
| Hyva Global B.V., 8.625%, 2016 (n) | | | 400,000 | | | | 342,000 | |
| Mueller Water Products, Inc., 8.75%, 2020 | | | 263,000 | | | | 294,560 | |
| | | | | | | | |
| | | | | | | $ | 2,231,360 | |
| Insurance - 0.2% | | | | | | | | |
| American International Group, Inc., 8.25%, 2018 | | $ | 485,000 | | | $ | 580,914 | |
| American International Group, Inc., 8.175% to 2038, FRN to 2068 | | | 485,000 | | | | 513,494 | |
| MetLife, Inc., 9.25% to 2038, FRN to 2068 (n) | | | 300,000 | | | | 369,000 | |
| | | | | | | | |
| | | | | | | $ | 1,463,408 | |
| Insurance - Health - 0.1% | | | | | | | | |
| AMERIGROUP Corp., 7.5%, 2019 | | $ | 425,000 | | | $ | 467,500 | |
| | |
| Insurance - Property & Casualty - 0.2% | | | | | | | | |
| Liberty Mutual Group, Inc., 10.75% to 2038, FRN to 2088 (n) | | $ | 700,000 | | | $ | 913,500 | |
| USI Holdings Corp., 9.75%, 2015 (z) | | | 205,000 | | | | 205,513 | |
| XL Group PLC, 6.5% to 2017, FRN to 2049 | | | 635,000 | | | | 538,162 | |
| | | | | | | | |
| | | | | | | $ | 1,657,175 | |
21
Portfolio of Investments – continued
| | | | | | | | |
| Issuer | | Shares/Par | | | Value ($) | |
| | | | | | | | |
| Bonds - continued | | | | | | | | |
| International Market Quasi-Sovereign - 0.1% | | | | | | | | |
| Israel Electric Corp. Ltd., 6.7%, 2017 (z) | | $ | 402,000 | | | $ | 410,993 | |
| | |
| International Market Sovereign - 0.3% | | | | | | | | |
| Republic of Iceland, 4.875%, 2016 (n) | | $ | 1,933,000 | | | $ | 1,931,740 | |
| | |
| Local Authorities - 0.1% | | | | | | | | |
| Nashville & Davidson County, TN, Metropolitan Government Convention Center Authority (Build America Bonds), 6.731%, 2043 | | $ | 115,000 | | | $ | 138,128 | |
| Port Authority NY & NJ (168th Series), 4.926%, 2051 | | | 395,000 | | | | 424,886 | |
| San Francisco, CA, City & County Public Utilities Commission, Water Rev. (Build America Bonds), 6%, 2040 | | | 15,000 | | | | 17,994 | |
| State of California (Build America Bonds), 7.625%, 2040 | | | 65,000 | | | | 86,371 | |
| University of California Rev. (Build America Bonds), 5.77%, 2043 | | | 60,000 | | | | 72,475 | |
| | | | | | | | |
| | | | | | | $ | 739,854 | |
| Machinery & Tools - 0.4% | | | | | | | | |
| Case Corp., 7.25%, 2016 | | $ | 85,000 | | | $ | 93,712 | |
| Case New Holland, Inc., 7.875%, 2017 | | | 1,105,000 | | | | 1,298,375 | |
| CNH Capital LLC, 6.25%, 2016 (n) | | | 140,000 | | | | 150,500 | |
| Rental Service Corp., 9.5%, 2014 | | | 90,000 | | | | 92,925 | |
| RSC Equipment Rental, Inc., 8.25%, 2021 | | | 830,000 | | | | 879,800 | |
| UR Financing Escrow Corp., 5.75%, 2018 (z) | | | 265,000 | | | | 272,288 | |
| UR Financing Escrow Corp., 7.625%, 2022 (z) | | | 267,000 | | | | 276,345 | |
| | | | | | | | |
| | | | | | | $ | 3,063,945 | |
| Major Banks - 0.1% | | | | | | | | |
| Bank of America Corp., 5.65%, 2018 | | $ | 530,000 | | | $ | 549,868 | |
| Royal Bank of Scotland Group PLC, 6.99% to 2017, FRN to 2049 (a)(d)(n) | | | 100,000 | | | | 80,250 | |
| Royal Bank of Scotland Group PLC, 7.648% to 2031, FRN to 2049 | | | 580,000 | | | | 479,950 | |
| | | | | | | | |
| | | | | | | $ | 1,110,068 | |
| Medical & Health Technology & Services - 1.5% | | | | | | | | |
| Biomet, Inc., 10%, 2017 | | $ | 185,000 | | | $ | 200,956 | |
| Biomet, Inc., 10.375%, 2017 (p) | | | 110,000 | | | | 119,762 | |
| Biomet, Inc., 11.625%, 2017 | | | 695,000 | | | | 758,419 | |
| Davita, Inc., 6.375%, 2018 | | | 1,285,000 | | | | 1,362,100 | |
| Davita, Inc., 6.625%, 2020 | | | 455,000 | | | | 487,987 | |
| Emdeon, Inc., 11%, 2019 (n) | | | 230,000 | | | | 257,600 | |
| Fresenius Medical Care AG & Co. KGaA, 9%, 2015 (n) | | | 175,000 | | | | 202,125 | |
| Fresenius Medical Care Capital Trust III, 5.625%, 2019 (z) | | | 330,000 | | | | 351,450 | |
| HCA, Inc., 8.5%, 2019 | | | 2,010,000 | | | | 2,251,200 | |
| HCA, Inc., 7.5%, 2022 | | | 465,000 | | | | 503,362 | |
22
Portfolio of Investments – continued
| | | | | | | | |
| Issuer | | Shares/Par | | | Value ($) | |
| | | | | | | | |
| Bonds - continued | | | | | | | | |
| Medical & Health Technology & Services - continued | | | | | | | | |
| HCA, Inc., 5.875%, 2022 | | $ | 250,000 | | | $ | 256,250 | |
| HealthSouth Corp., 8.125%, 2020 | | | 900,000 | | | | 989,437 | |
| Physio-Control International, Inc., 9.875%, 2019 (z) | | | 330,000 | | | | 346,500 | |
| Teleflex, Inc., 6.875%, 2019 | | | 365,000 | | | | 393,288 | |
| Tenet Healthcare Corp., 9.25%, 2015 | | | 480,000 | | | | 532,800 | |
| United Surgical Partners International, Inc., 8.875%, 2017 | | | 845,000 | | | | 881,969 | |
| United Surgical Partners International, Inc., 10%, 2017 (p) | | | 120,000 | | | | 124,500 | |
| Universal Health Services, Inc., 7%, 2018 | | | 765,000 | | | | 818,550 | |
| Universal Hospital Services, Inc., 8.5%, 2015 (p) | | | 275,000 | | | | 283,250 | |
| Universal Hospital Services, Inc., FRN, 4.121%, 2015 | | | 65,000 | | | | 61,588 | |
| Vanguard Health Systems, Inc., 8%, 2018 | | | 290,000 | | | | 305,225 | |
| | | | | | | | |
| | | | | | | $ | 11,488,318 | |
| Metals & Mining - 1.2% | | | | | | | | |
| AK Steel Corp., 7.625%, 2020 | | $ | 345,000 | | | $ | 347,156 | |
| Cloud Peak Energy, Inc., 8.25%, 2017 | | | 845,000 | | | | 902,037 | |
| Cloud Peak Energy, Inc., 8.5%, 2019 | | | 405,000 | | | | 440,437 | |
| Consol Energy, Inc., 8%, 2017 | | | 320,000 | | | | 348,000 | |
| Consol Energy, Inc., 8.25%, 2020 | | | 70,000 | | | | 76,300 | |
| Fortescue Metals Group Ltd., 6.875%, 2018 (n) | | | 135,000 | | | | 142,425 | |
| Fortescue Metals Group Ltd., 8.25%, 2019 (n) | | | 970,000 | | | | 1,071,850 | |
| Gold Fields Orogen Holding Ltd., 4.875%, 2020 (n) | | | 1,093,000 | | | | 1,041,144 | |
| Peabody Energy Corp., 6%, 2018 (n) | | | 230,000 | | | | 240,925 | |
| Peabody Energy Corp., 6.25%, 2021 (n) | | | 230,000 | | | | 240,925 | |
| Southern Copper Corp., 6.75%, 2040 | | | 1,656,000 | | | | 1,803,985 | |
| Vale Overseas Ltd., 5.625%, 2019 | | | 1,134,000 | | | | 1,286,871 | |
| Vale Overseas Ltd., 4.375%, 2022 | | | 1,000,000 | | | | 1,036,260 | |
| Vale Overseas Ltd., 6.875%, 2039 | | | 273,000 | | | | 336,321 | |
| | | | | | | | |
| | | | | | | $ | 9,314,636 | |
| Mortgage-Backed - 5.6% | | | | | | | | |
| Fannie Mae, 4.325%, 2013 | | $ | 140,431 | | | $ | 143,563 | |
| Fannie Mae, 4.374%, 2013 | | | 121,788 | | | | 125,271 | |
| Fannie Mae, 4.518%, 2013 | | | 87,753 | | | | 89,345 | |
| Fannie Mae, 5.159%, 2013 | | | 48,060 | | | | 50,182 | |
| Fannie Mae, 5.37%, 2013 | | | 91,620 | | | | 93,903 | |
| Fannie Mae, 4.562%, 2014 | | | 74,239 | | | | 78,546 | |
| Fannie Mae, 4.61%, 2014 | | | 119,691 | | | | 126,441 | |
| Fannie Mae, 4.777%, 2014 | | | 170,790 | | | | 178,368 | |
| Fannie Mae, 4.88%, 2014 | | | 96,651 | | | | 103,592 | |
| Fannie Mae, 4.935%, 2014 | | | 156,539 | | | | 164,422 | |
| Fannie Mae, 5.1%, 2014 - 2019 | | | 332,401 | | | | 362,724 | |
| Fannie Mae, 4.56%, 2015 | | | 71,211 | | | | 76,730 | |
23
Portfolio of Investments – continued
| | | | | | | | |
| Issuer | | Shares/Par | | | Value ($) | |
| | | | | | | | |
| Bonds - continued | | | | | | | | |
| Mortgage-Backed - continued | | | | | | | | |
| Fannie Mae, 4.564%, 2015 | | $ | 263,979 | | | $ | 281,153 | |
| Fannie Mae, 4.6%, 2015 - 2019 | | | 155,876 | | | | 176,079 | |
| Fannie Mae, 4.69%, 2015 | | | 187,704 | | | | 202,295 | |
| Fannie Mae, 4.7%, 2015 | | | 140,554 | | | | 152,512 | |
| Fannie Mae, 4.78%, 2015 | | | 79,731 | | | | 86,892 | |
| Fannie Mae, 4.79%, 2015 | | | 120,886 | | | | 131,706 | |
| Fannie Mae, 4.81%, 2015 | | | 179,706 | | | | 195,873 | |
| Fannie Mae, 4.815%, 2015 | | | 107,422 | | | | 116,706 | |
| Fannie Mae, 4.85%, 2015 | | | 173,407 | | | | 187,166 | |
| Fannie Mae, 4.856%, 2015 | | | 62,835 | | | | 68,415 | |
| Fannie Mae, 4.86%, 2015 | | | 153,498 | | | | 165,314 | |
| Fannie Mae, 4.893%, 2015 | | | 255,774 | | | | 280,043 | |
| Fannie Mae, 5.034%, 2015 | | | 125,221 | | | | 138,783 | |
| Fannie Mae, 5.275%, 2015 | | | 127,599 | | | | 139,388 | |
| Fannie Mae, 5.465%, 2015 | | | 476,441 | | | | 528,220 | |
| Fannie Mae, 5.5%, 2015 - 2040 | | | 6,424,850 | | | | 7,008,454 | |
| Fannie Mae, 5.09%, 2016 | | | 64,006 | | | | 70,548 | |
| Fannie Mae, 5.152%, 2016 | | | 301,050 | | | | 336,332 | |
| Fannie Mae, 5.273%, 2016 | | | 314,763 | | | | 353,420 | |
| Fannie Mae, 5.35%, 2016 | | | 99,593 | | | | 111,494 | |
| Fannie Mae, 5.395%, 2016 | | | 105,718 | | | | 118,355 | |
| Fannie Mae, 5.423%, 2016 | | | 120,483 | | | | 136,298 | |
| Fannie Mae, 5.45%, 2016 | | | 110,000 | | | | 125,014 | |
| Fannie Mae, 5.724%, 2016 | | | 228,943 | | | | 261,306 | |
| Fannie Mae, 5.845%, 2016 | | | 41,852 | | | | 45,687 | |
| Fannie Mae, 5.93%, 2016 | | | 112,283 | | | | 126,352 | |
| Fannie Mae, 2.71%, 2017 | | | 57,717 | | | | 60,340 | |
| Fannie Mae, 3.308%, 2017 | | | 444,014 | | | | 476,873 | |
| Fannie Mae, 5.05%, 2017 - 2019 | | | 121,525 | | | | 135,944 | |
| Fannie Mae, 5.482%, 2017 | | | 222,354 | | | | 255,300 | |
| Fannie Mae, 5.506%, 2017 | | | 66,800 | | | | 75,237 | |
| Fannie Mae, 6%, 2017 - 2038 | | | 2,575,006 | | | | 2,841,700 | |
| Fannie Mae, 6.5%, 2017 - 2037 | | | 774,385 | | | | 879,277 | |
| Fannie Mae, 2.578%, 2018 | | | 900,000 | | | | 930,742 | |
| Fannie Mae, 3.8%, 2018 | | | 90,785 | | | | 99,149 | |
| Fannie Mae, 3.848%, 2018 | | | 298,395 | | | | 327,720 | |
| Fannie Mae, 3.91%, 2018 | | | 118,581 | | | | 129,933 | |
| Fannie Mae, 3.99%, 2018 | | | 150,000 | | | | 165,319 | |
| Fannie Mae, 4%, 2018 | | | 118,684 | | | | 130,704 | |
| Fannie Mae, 4.19%, 2018 | | | 108,844 | | | | 120,831 | |
| Fannie Mae, 5.16%, 2018 | | | 216,477 | | | | 240,766 | |
| Fannie Mae, 5.34%, 2018 | | | 376,962 | | | | 432,798 | |
24
Portfolio of Investments – continued
| | | | | | | | |
| Issuer | | Shares/Par | | | Value ($) | |
| | | | | | | | |
| Bonds - continued | | | | | | | | |
| Mortgage-Backed - continued | | | | | | | | |
| Fannie Mae, 4.45%, 2019 | | $ | 91,398 | | | $ | 102,740 | |
| Fannie Mae, 4.5%, 2019 - 2041 | | | 2,445,261 | | | | 2,619,536 | |
| Fannie Mae, 4.67%, 2019 | | | 28,000 | | | | 31,682 | |
| Fannie Mae, 4.83%, 2019 | | | 72,715 | | | | 82,408 | |
| Fannie Mae, 4.876%, 2019 | | | 114,172 | | | | 129,944 | |
| Fannie Mae, 5%, 2019 - 2041 | | | 4,692,864 | | | | 5,086,186 | |
| Fannie Mae, 5.08%, 2019 | | | 24,121 | | | | 27,342 | |
| Fannie Mae, 5.51%, 2019 | | | 116,202 | | | | 132,903 | |
| Fannie Mae, 3.87%, 2020 | | | 71,499 | | | | 78,173 | |
| Fannie Mae, 4.14%, 2020 | | | 43,180 | | | | 47,873 | |
| Fannie Mae, 5.19%, 2020 | | | 111,574 | | | | 126,591 | |
| Fannie Mae, 4.5%, 2025 | | | 139,277 | | | | 149,109 | |
| Fannie Mae, 3.5%, 2042 | | | 772,986 | | | | 801,340 | |
| Freddie Mac, 3.882%, 2017 | | | 335,000 | | | | 370,166 | |
| Freddie Mac, 5%, 2017 - 2040 | | | 1,102,661 | | | | 1,188,602 | |
| Freddie Mac, 6%, 2017 - 2038 | | | 1,299,949 | | | | 1,441,972 | |
| Freddie Mac, 2.412%, 2018 (n) | | | 1,000,000 | | | | 1,024,415 | |
| Freddie Mac, 2.699%, 2018 | | | 115,000 | | | | 119,883 | |
| Freddie Mac, 3.154%, 2018 | | | 478,000 | | | | 509,397 | |
| Freddie Mac, 4.186%, 2019 | | | 146,000 | | | | 162,917 | |
| Freddie Mac, 5.085%, 2019 | | | 162,000 | | | | 187,442 | |
| Freddie Mac, 2.757%, 2020 | | | 288,870 | | | | 303,083 | |
| Freddie Mac, 3.32%, 2020 | | | 261,571 | | | | 281,037 | |
| Freddie Mac, 4.224%, 2020 | | | 99,963 | | | | 111,600 | |
| Freddie Mac, 4.251%, 2020 | | | 230,000 | | | | 256,543 | |
| Freddie Mac, 4.5%, 2024 - 2041 | | | 298,340 | | | | 316,719 | |
| Freddie Mac, 5.5%, 2024 - 2038 | | | 1,518,036 | | | | 1,659,448 | |
| Freddie Mac, 4%, 2025 | | | 998,204 | | | | 1,055,801 | |
| Freddie Mac, 6.5%, 2037 - 2038 | | | 210,416 | | | | 237,022 | |
| Freddie Mac, 3.5%, 2041 - 2042 | | | 423,582 | | | | 438,445 | |
| Ginnie Mae, 4.5%, 2033 - 2041 | | | 2,097,883 | | | | 2,299,239 | |
| Ginnie Mae, 5.5%, 2033 - 2040 | | | 988,227 | | | | 1,102,070 | |
| Ginnie Mae, 3.5%, 2042 | | | 349,397 | | | | 367,099 | |
| Ginnie Mae, 5.612%, 2058 | | | 296,716 | | | | 318,357 | |
| Ginnie Mae, 6.357%, 2058 | | | 224,916 | | | | 240,511 | |
| | | | | | | | |
| | | | | | | $ | 43,847,120 | |
| Municipals - 0.0% | | | | | | | | |
| Triborough Bridge & Tunnel Authority Rev., NY, “A”, 5%, 2021 | | $ | 190,000 | | | $ | 235,712 | |
| | |
| Natural Gas - Distribution - 0.1% | | | | | | | | |
| AmeriGas Finance LLC, 6.75%, 2020 | | $ | 475,000 | | | $ | 489,250 | |
25
Portfolio of Investments – continued
| | | | | | | | |
| Issuer | | Shares/Par | | | Value ($) | |
| | | | | | | | |
| Bonds - continued | | | | | | | | |
| Natural Gas - Distribution - continued | | | | | | | | |
| Ferrellgas LP/Ferrellgas Finance Corp., 6.5%, 2021 | | $ | 270,000 | | | $ | 238,950 | |
| | | | | | | | |
| | | | | | | $ | 728,200 | |
| Natural Gas - Pipeline - 0.8% | | | | | | | | |
| Atlas Pipeline Partners LP, 8.75%, 2018 | | $ | 300,000 | | | $ | 321,000 | |
| Atlas Pipeline Partners LP/Finance Corp., 8.75%, 2018 (n) | | | 440,000 | | | | 468,600 | |
| Crosstex Energy, Inc., 8.875%, 2018 | | | 1,000,000 | | | | 1,085,000 | |
| El Paso Corp., 7%, 2017 | | | 545,000 | | | | 609,004 | |
| El Paso Corp., 7.75%, 2032 | | | 1,370,000 | | | | 1,631,256 | |
| Energy Transfer Equity LP, 7.5%, 2020 | | | 1,090,000 | | | | 1,248,050 | |
| Enterprise Products Partners LP, 8.375% to 2016, FRN to 2066 | | | 537,000 | | | | 581,308 | |
| Enterprise Products Partners LP, 7.034% to 2018, FRN to 2068 | | | 71,000 | | | | 75,970 | |
| Rockies Express Pipeline, 5.625%, 2020 (n) | | | 267,000 | | | | 240,300 | |
| | | | | | | | |
| | | | | | | $ | 6,260,488 | |
| Network & Telecom - 0.5% | | | | | | | | |
| Cincinnati Bell, Inc., 8.25%, 2017 | | $ | 260,000 | | | $ | 268,450 | |
| Cincinnati Bell, Inc., 8.75%, 2018 | | | 290,000 | | | | 276,225 | |
| Citizens Communications Co., 9%, 2031 | | | 260,000 | | | | 253,500 | |
| Eileme 2 AB, 11.625%, 2020 (n) | | | 400,000 | | | | 420,000 | |
| Frontier Communications Corp., 8.125%, 2018 | | | 795,000 | | | | 856,612 | |
| Qwest Communications International, Inc., 7.125%, 2018 (n) | | | 780,000 | | | | 834,600 | |
| Windstream Corp., 8.125%, 2018 | | | 150,000 | | | | 164,250 | |
| Windstream Corp., 7.75%, 2020 | | | 680,000 | | | | 742,900 | |
| Windstream Corp., 7.75%, 2021 | | | 130,000 | | | | 142,025 | |
| | | | | | | | |
| | | | | | | $ | 3,958,562 | |
| Oil Services - 0.4% | | | | | | | | |
| Afren PLC, 11.5%, 2016 (n) | | $ | 200,000 | | | $ | 212,000 | |
| Chesapeake Energy Corp., 6.625%, 2019 (n) | | | 175,000 | | | | 178,500 | |
| Dresser-Rand Group, Inc., 6.5%, 2021 (n) | | | 90,000 | | | | 94,275 | |
| Edgen Murray Corp., 12.25%, 2015 | | | 280,000 | | | | 285,600 | |
| Expro Finance Luxembourg, 8.5%, 2016 (n) | | | 310,000 | | | | 278,225 | |
| Pioneer Drilling Co., 9.875%, 2018 | | | 365,000 | | | | 390,550 | |
| Pioneer Drilling Co., 9.875%, 2018 (n) | | | 230,000 | | | | 246,100 | |
| QGOG Atlantic/Alaskan Rigs Ltd., 5.25%, 2018 (n) | | | 1,385,358 | | | | 1,416,528 | |
| Unit Corp., 6.625%, 2021 | | | 70,000 | | | | 71,663 | |
| | | | | | | | |
| | | | | | | $ | 3,173,441 | |
| Other Banks & Diversified Financials - 1.1% | | | | | | | | |
| Alfa Bank, 7.75%, 2021 (n) | | $ | 1,194,000 | | | $ | 1,185,045 | |
| Banco de Credito del Peru, FRN, 6.875%, 2026 (n) | | | 108,000 | | | | 116,910 | |
| Banco PanAmericano S.A., 8.5%, 2020 (n) | | | 1,233,000 | | | | 1,356,300 | |
26
Portfolio of Investments – continued
| | | | | | | | |
| Issuer | | Shares/Par | | | Value ($) | |
| | | | | | | | |
| Bonds - continued | | | | | | | | |
| Other Banks & Diversified Financials - continued | | | | | | | | |
| Bancolombia S.A., 5.95%, 2021 | | $ | 1,374,000 | | | $ | 1,425,525 | |
| BBVA Bancomer S.A. Texas, 6.5%, 2021 (n) | | | 1,078,000 | | | | 1,099,560 | |
| BBVA Continental, 5.75%, 2017 (n) | | | 500,000 | | | | 518,750 | |
| Capital One Financial Corp., 10.25%, 2039 | | | 640,000 | | | | 667,200 | |
| Groupe BPCE S.A., 12.5% to 2019, FRN to 2049 (n) | | | 130,000 | | | | 133,600 | |
| Grupo Aval Ltd., 5.25%, 2017 (n) | | | 267,000 | | | | 275,010 | |
| LBG Capital No. 1 PLC, 7.875%, 2020 (n) | | | 330,000 | | | | 282,315 | |
| Santander UK PLC, 8.963% to 2030, FRN to 2049 | | | 1,324,000 | | | | 1,322,345 | |
| | | | | | | | |
| | | | | | | $ | 8,382,560 | |
| Pharmaceuticals - 0.1% | | | | | | | | |
| Capsugel FinanceCo. SCA, 9.875%, 2019 (n) | | EUR | 325,000 | | | $ | 465,472 | |
| Valeant Pharmaceuticals International, Inc., 6.5%, 2016 (z) | | $ | 205,000 | | | | 209,100 | |
| Valeant Pharmaceuticals International, Inc., 7%, 2020 (n) | | | 345,000 | | | | 349,744 | |
| | | | | | | | |
| | | | | | | $ | 1,024,316 | |
| Pollution Control - 0.1% | | | | | | | | |
| WCA Waste Corp., 7.5%, 2019 (n) | | $ | 885,000 | | | $ | 896,062 | |
| | |
| Precious Metals & Minerals - 0.0% | | | | | | | | |
| ALROSA Finance S.A., 7.75%, 2020 (n) | | $ | 203,000 | | | $ | 215,434 | |
| | |
| Printing & Publishing - 0.1% | | | | | | | | |
| American Media, Inc., 13.5%, 2018 (z) | | $ | 26,083 | | | $ | 20,084 | |
| Nielsen Finance LLC, 11.5%, 2016 | | | 204,000 | | | | 236,130 | |
| Nielsen Finance LLC, 7.75%, 2018 | | | 385,000 | | | | 428,313 | |
| | | | | | | | |
| | | | | | | $ | 684,527 | |
| Railroad & Shipping - 0.0% | | | | | | | | |
| Kansas City Southern de Mexico S.A. de C.V., 6.125%, 2021 | | $ | 145,000 | | | $ | 156,600 | |
| | |
| Real Estate - 0.3% | | | | | | | | |
| CB Richard Ellis Group, Inc., 11.625%, 2017 | | $ | 235,000 | | | $ | 271,425 | |
| CNL Lifestyle Properties, Inc., REIT, 7.25%, 2019 | | | 140,000 | | | | 132,650 | |
| Entertainment Properties Trust, REIT, 7.75%, 2020 | | | 715,000 | | | | 763,556 | |
| Kennedy Wilson, Inc., 8.75%, 2019 | | | 210,000 | | | | 216,825 | |
| MPT Operating Partnership LP, REIT, 6.875%, 2021 | | | 940,000 | | | | 999,338 | |
| | | | | | | | |
| | | | | | | $ | 2,383,794 | |
| Retailers - 0.8% | | | | | | | | |
| Academy Ltd., 9.25%, 2019 (n) | | $ | 425,000 | | | $ | 429,250 | |
| Burlington Coat Factory Warehouse Corp., 10%, 2019 | | | 575,000 | | | | 590,094 | |
| J. Crew Group, Inc., 8.125%, 2019 | | | 385,000 | | | | 385,481 | |
27
Portfolio of Investments – continued
| | | | | | | | |
| Issuer | | Shares/Par | | | Value ($) | |
| | | | | | | | |
| Bonds - continued | | | | | | | | |
| Retailers - continued | | | | | | | | |
| Limited Brands, Inc., 6.9%, 2017 | | $ | 1,110,000 | | | $ | 1,237,650 | |
| Limited Brands, Inc., 6.95%, 2033 | | | 60,000 | | | | 58,200 | |
| Neiman Marcus Group, Inc., 10.375%, 2015 | | | 630,000 | | | | 655,994 | |
| QVC, Inc., 7.375%, 2020 (n) | | | 680,000 | | | | 753,100 | |
| Rite Aid Corp., 9.375%, 2015 | | | 285,000 | | | | 293,550 | |
| Sally Beauty Holdings, Inc., 6.875%, 2019 (n) | | | 225,000 | | | | 241,875 | |
| Toys “R” Us Property Co. II LLC, 8.5%, 2017 | | | 625,000 | | | | 660,938 | |
| Toys “R” Us, Inc., 10.75%, 2017 | | | 580,000 | | | | 643,075 | |
| Yankee Acquisition Corp., 8.5%, 2015 | | | 110,000 | | | | 112,614 | |
| YCC Holdings LLC/Yankee Finance, Inc., 10.25%, 2016 (p) | | | 470,000 | | | | 455,312 | |
| | | | | | | | |
| | | | | | | $ | 6,517,133 | |
| Specialty Chemicals - 0.0% | | | | | | | | |
| Koppers, Inc., 7.875%, 2019 | | $ | 180,000 | | | $ | 192,600 | |
| | |
| Specialty Stores - 0.1% | | | | | | | | |
| Michaels Stores, Inc., 11.375%, 2016 | | $ | 125,000 | | | $ | 132,488 | |
| Michaels Stores, Inc., 7.75%, 2018 | | | 945,000 | | | | 999,338 | |
| | | | | | | | |
| | | | | | | $ | 1,131,826 | |
| Steel - 0.1% | | | | | | | | |
| JSC Severstal, 6.25%, 2016 (n) | | $ | 1,097,000 | | | $ | 1,102,771 | |
| | |
| Telecommunications - Wireless - 1.8% | | | | | | | | |
| America Movil S.A.B. de C.V., 5%, 2020 | | $ | 877,000 | | | $ | 996,009 | |
| Clearwire Corp., 12%, 2015 (n) | | | 650,000 | | | | 632,125 | |
| Cricket Communications, Inc., 7.75%, 2016 | | | 500,000 | | | | 532,500 | |
| Cricket Communications, Inc., 7.75%, 2020 | | | 665,000 | | | | 661,675 | |
| Crown Castle International Corp., 9%, 2015 | | | 170,000 | | | | 187,425 | |
| Crown Castle International Corp., 7.125%, 2019 | | | 1,235,000 | | | | 1,352,325 | |
| Digicel Group Ltd., 8.25%, 2017 (n) | | | 160,000 | | | | 169,600 | |
| Digicel Group Ltd., 10.5%, 2018 (n) | | | 895,000 | | | | 975,550 | |
| Globo Comunicacoes e Participacoes S.A., 6.25% to 2015, 9.375% to 2049 (n) | | | 1,499,000 | | | | 1,592,687 | |
| MetroPCS Wireless, Inc., 7.875%, 2018 | | | 215,000 | | | | 230,588 | |
| MetroPCS Wireless, Inc., 6.625%, 2020 | | | 100,000 | | | | 103,000 | |
| Net Servicos de Comunicacao S.A., 7.5%, 2020 | | | 1,435,000 | | | | 1,686,125 | |
| Sprint Capital Corp., 6.875%, 2028 | | | 325,000 | | | | 253,500 | |
| Sprint Nextel Corp., 6%, 2016 | | | 595,000 | | | | 541,450 | |
| Sprint Nextel Corp., 8.375%, 2017 | | | 870,000 | | | | 852,600 | |
| Sprint Nextel Corp., 9%, 2018 (n) | | | 235,000 | | | | 262,025 | |
| VimpelCom Ltd., 7.504%, 2022 (n) | | | 1,337,000 | | | | 1,310,929 | |
| Wind Acquisition Finance S.A., 11.75%, 2017 (n) | | | 1,070,000 | | | | 1,096,750 | |
28
Portfolio of Investments – continued
| | | | | | | | |
| Issuer | | Shares/Par | | | Value ($) | |
| | | | | | | | |
| Bonds - continued | | | | | | | | |
| Telecommunications - Wireless - continued | | | | | | | | |
| Wind Acquisition Finance S.A., 7.25%, 2018 (n) | | $ | 400,000 | | | $ | 390,000 | |
| | | | | | | | |
| | | | | | | $ | 13,826,863 | |
| Telephone Services - 0.4% | | | | | | | | |
| Brasil Telecom S.A., 5.75%, 2022 (z) | | $ | 2,391,000 | | | $ | 2,450,775 | |
| Cogent Communications Group, Inc., 8.375%, 2018 (n) | | | 105,000 | | | | 110,512 | |
| Level 3 Financing, Inc., 9.375%, 2019 | | | 420,000 | | | | 464,100 | |
| Level 3 Financing, Inc., 8.625%, 2020 (z) | | | 245,000 | | | | 261,538 | |
| | | | | | | | |
| | | | | | | $ | 3,286,925 | |
| Transportation - 0.0% | | | | | | | | |
| Navios South American Logistics, Inc., 9.25%, 2019 (n) | | $ | 298,000 | | | $ | 247,340 | |
| | |
| Transportation - Services - 0.6% | | | | | | | | |
| ACL I Corp., 11.375%, 2016 (n)(p) | | $ | 383,129 | | | $ | 364,425 | |
| Aguila American Resources Ltd., 7.875%, 2018 (n) | | | 845,000 | | | | 888,306 | |
| Avis Budget Car Rental LLC , 9.75%, 2020 | | | 185,000 | | | | 202,575 | |
| CEVA Group PLC, 8.375%, 2017 (z) | | | 470,000 | | | | 468,825 | |
| Commercial Barge Line Co., 12.5%, 2017 | | | 820,000 | | | | 913,275 | |
| Hertz Corp., 7.5%, 2018 | | | 425,000 | | | | 458,469 | |
| Navios Maritime Acquisition Corp., 8.625%, 2017 | | | 555,000 | | | | 462,038 | |
| Navios Maritime Holdings, Inc., 8.875%, 2017 | | | 110,000 | | | | 108,900 | |
| Swift Services Holdings, Inc., 10%, 2018 | | | 470,000 | | | | 514,063 | |
| | | | | | | | |
| | | | | | | $ | 4,380,876 | |
| U.S. Government Agencies and Equivalents - 0.2% | | | | | | | | |
| Aid-Egypt, 4.45%, 2015 | | $ | 170,000 | | | $ | 191,731 | |
| FDIC Structured Sale Guarantee Note, 0%, 2012 (n) | | | 25,000 | | | | 24,967 | |
| Freddie Mac, 2.375%, 2022 | | | 680,000 | | | | 687,705 | |
| Small Business Administration, 6.34%, 2021 | | | 170,035 | | | | 188,463 | |
| Small Business Administration, 6.07%, 2022 | | | 172,815 | | | | 191,346 | |
| Small Business Administration, 5.16%, 2028 | | | 225,281 | | | | 252,939 | |
| | | | | | | | |
| | | | | | | $ | 1,537,151 | |
| U.S. Treasury Obligations - 10.2% | | | | | | | | |
| U.S. Treasury Bonds, 9.25%, 2016 | | $ | 47,000 | | | $ | 62,907 | |
| U.S. Treasury Bonds, 6.375%, 2027 | | | 106,000 | | | | 157,774 | |
| U.S. Treasury Bonds, 5.25%, 2029 | | | 3,921,000 | | | | 5,307,442 | |
| U.S. Treasury Bonds, 4.5%, 2036 | | | 70,000 | | | | 89,009 | |
| U.S. Treasury Bonds, 4.375%, 2038 | | | 638,000 | | | | 800,092 | |
| U.S. Treasury Bonds, 4.5%, 2039 | | | 5,283,000 | | | | 6,767,195 | |
| U.S. Treasury Notes, 1.375%, 2012 (f) | | | 18,049,000 | | | | 18,096,234 | |
| U.S. Treasury Notes, 1.375%, 2012 | | | 750,000 | | | | 755,625 | |
29
Portfolio of Investments – continued
| | | | | | | | |
| Issuer | | Shares/Par | | | Value ($) | |
| | | | | | | | |
| Bonds - continued | | | | | | | | |
| U.S. Treasury Obligations - continued | | | | | | | | |
| U.S. Treasury Notes, 1.375%, 2013 | | $ | 16,778,000 | | | $ | 16,980,510 | |
| U.S. Treasury Notes, 3.125%, 2013 | | | 305,000 | | | | 318,737 | |
| U.S. Treasury Notes, 4%, 2014 | | | 18,000 | | | | 19,298 | |
| U.S. Treasury Notes, 1.875%, 2014 | | | 417,000 | | | | 430,813 | |
| U.S. Treasury Notes, 4%, 2015 | | | 1,397,000 | | | | 1,542,812 | |
| U.S. Treasury Notes, 2.125%, 2015 | | | 14,254,000 | | | | 14,999,000 | |
| U.S. Treasury Notes, 2.625%, 2018 | | | 955,000 | | | | 1,038,339 | |
| U.S. Treasury Notes, 2.75%, 2019 | | | 1,590,000 | | | | 1,736,081 | |
| U.S. Treasury Notes, 3.125%, 2019 | | | 454,000 | | | | 506,919 | |
| U.S. Treasury Notes, 3.5%, 2020 | | | 8,997,000 | | | | 10,300,863 | |
| | | | | | | | |
| | | | | | | $ | 79,909,650 | |
| Utilities - Electric Power - 1.2% | | | | | | | | |
| AES Corp., 8%, 2017 | | $ | 570,000 | | | $ | 656,925 | |
| Atlantic Power Corp., 9%, 2018 (z) | | | 250,000 | | | | 255,000 | |
| Calpine Corp., 8%, 2016 (n) | | | 675,000 | | | | 734,062 | |
| Calpine Corp., 7.875%, 2020 (n) | | | 590,000 | | | | 651,950 | |
| Covanta Holding Corp., 7.25%, 2020 | | | 705,000 | | | | 752,083 | |
| Dolphin Subsidiary ll, Inc., 7.25%, 2021 (n) | | | 340,000 | | | | 387,600 | |
| Edison Mission Energy, 7%, 2017 | | | 375,000 | | | | 251,250 | |
| EDP Finance B.V., 6%, 2018 (n) | | | 865,000 | | | | 736,323 | |
| Empresa de Energia de Bogota S.A., 6.125%, 2021 (n) | | | 200,000 | | | | 210,000 | |
| Enel Finance International S.A., 6%, 2039 (n) | | | 195,000 | | | | 178,329 | |
| Energy Future Holdings Corp., 10%, 2020 | | | 225,000 | | | | 243,281 | |
| Energy Future Holdings Corp., 10%, 2020 | | | 1,795,000 | | | | 1,949,819 | |
| Energy Future Holdings Corp., 11.75%, 2022 (z) | | | 240,000 | | | | 246,000 | |
| GenOn Energy, Inc., 9.5%, 2018 | | | 380,000 | | | | 362,900 | |
| GenOn Energy, Inc., 9.875%, 2020 | | | 675,000 | | | | 632,812 | |
| NRG Energy, Inc., 7.375%, 2017 | | | 150,000 | | | | 155,625 | |
| NRG Energy, Inc., 8.25%, 2020 | | | 1,160,000 | | | | 1,174,500 | |
| Texas Competitive Electric Holdings Co. LLC, 11.5%, 2020 (n) | | | 195,000 | | | | 131,625 | |
| | | | | | | | |
| | | | | | | $ | 9,710,084 | |
| Total Bonds (Identified Cost, $409,524,409) | | | | | | $ | 422,451,539 | |
| | |
| Common Stocks - 40.1% | | | | | | | | |
| Aerospace - 0.5% | | | | | | | | |
| Lockheed Martin Corp. | | | 26,199 | | | $ | 2,316,254 | |
| Northrop Grumman Corp. | | | 28,004 | | | | 1,674,919 | |
| | | | | | | | |
| | | | | | | $ | 3,991,173 | |
| Automotive - 0.4% | | | | | | | | |
| Accuride Corp. (a) | | | 5,511 | | | $ | 43,812 | |
30
Portfolio of Investments – continued
| | | | | | | | |
| Issuer | | Shares/Par | | | Value ($) | |
| | | | | | | | |
| Common Stocks - continued | | | | | | | | |
| Automotive - continued | | | | | | | | |
| Johnson Controls, Inc. | | | 30,580 | | | $ | 997,825 | |
| Lear Corp. | | | 39,322 | | | | 1,777,748 | |
| | | | | | | | |
| | | | | | | $ | 2,819,385 | |
| Broadcasting - 0.1% | | | | | | | | |
| CBS Corp., “B” | | | 23,110 | | | $ | 690,989 | |
| New Young Broadcasting Holding Co., Inc. (a) | | | 21 | | | | 58,800 | |
| | | | | | | | |
| | | | | | | $ | 749,789 | |
| Brokerage & Asset Managers - 0.2% | | | | | | | | |
| Blackrock, Inc. | | | 5,528 | | | $ | 1,100,072 | |
| CME Group, Inc. | | | 2,056 | | | | 595,191 | |
| | | | | | | | |
| | | | | | | $ | 1,695,263 | |
| Cable TV - 0.4% | | | | | | | | |
| Comcast Corp., “A” | | | 24,332 | | | $ | 714,874 | |
| Time Warner Cable, Inc. | | | 33,072 | | | | 2,623,932 | |
| | | | | | | | |
| | | | | | | $ | 3,338,806 | |
| Chemicals - 0.1% | | | | | | | | |
| CF Industries Holdings, Inc. | | | 4,730 | | | $ | 879,780 | |
| | |
| Computer Software - 0.1% | | | | | | | | |
| Oracle Corp. | | | 15,996 | | | $ | 468,203 | |
| | |
| Computer Software - Systems - 0.2% | | | | | | | | |
| Seagate Technology PLC | | | 47,056 | | | $ | 1,235,691 | |
| Western Digital Corp. (a) | | | 16,448 | | | | 645,584 | |
| | | | | | | | |
| | | | | | | $ | 1,881,275 | |
| Construction - 0.4% | | | | | | | | |
| Owens Corning (a) | | | 67,590 | | | $ | 2,139,224 | |
| Stanley Black & Decker, Inc. | | | 15,100 | | | | 1,159,680 | |
| | | | | | | | |
| | | | | | | $ | 3,298,904 | |
| Consumer Products - 0.3% | | | | | | | | |
| Avon Products, Inc. | | | 36,584 | | | $ | 683,755 | |
| Kimberly-Clark Corp. | | | 14,210 | | | | 1,035,625 | |
| Newell Rubbermaid, Inc. | | | 40,421 | | | | 739,704 | |
| | | | | | | | |
| | | | | | | $ | 2,459,084 | |
| Electrical Equipment - 0.7% | | | | | | | | |
| General Electric Co. | | | 168,980 | | | $ | 3,219,069 | |
31
Portfolio of Investments – continued
| | | | | | | | |
| Issuer | | Shares/Par | | | Value ($) | |
| | | | | | | | |
| Common Stocks - continued | | | | | | | | |
| Electrical Equipment - continued | | | | | | | | |
| Tyco International Ltd. | | | 38,030 | | | $ | 1,970,715 | |
| | | | | | | | |
| | | | | | | $ | 5,189,784 | |
| Electronics - 0.6% | | | | | | | | |
| Intel Corp. | | | 67,676 | | | $ | 1,819,131 | |
| KLA-Tencor Corp. | | | 35,120 | | | | 1,699,808 | |
| Microchip Technology, Inc. | | | 33,660 | | | | 1,214,116 | |
| | | | | | | | |
| | | | | | | $ | 4,733,055 | |
| Energy - Independent - 0.4% | | | | | | | | |
| Energy XXI (Bermuda) Ltd. (a) | | | 18,438 | | | $ | 690,134 | |
| Marathon Oil Corp. | | | 38,412 | | | | 1,301,783 | |
| WPX Energy, Inc. (a) | | | 44,581 | | | | 809,591 | |
| | | | | | | | |
| | | | | | | $ | 2,801,508 | |
| Energy - Integrated - 1.6% | | | | | | | | |
| Chevron Corp. | | | 62,710 | | | $ | 6,842,915 | |
| ConocoPhillips | | | 20,685 | | | | 1,583,437 | |
| Exxon Mobil Corp. | | | 46,054 | | | | 3,983,671 | |
| | | | | | | | |
| | | | | | | $ | 12,410,023 | |
| Food & Beverages - 0.5% | | | | | | | | |
| Bunge Ltd. | | | 18,220 | | | $ | 1,226,570 | |
| Coca-Cola Enterprises, Inc. | | | 50,260 | | | | 1,452,514 | |
| Dr Pepper Snapple Group, Inc. | | | 18,601 | | | | 707,768 | |
| General Mills, Inc. | | | 19,113 | | | | 732,219 | |
| | | | | | | | |
| | | | | | | $ | 4,119,071 | |
| Food & Drug Stores - 0.4% | | | | | | | | |
| CVS Caremark Corp. | | | 36,520 | | | $ | 1,647,052 | |
| Kroger Co. | | | 53,970 | | | | 1,283,946 | |
| | | | | | | | |
| | | | | | | $ | 2,930,998 | |
| Forest & Paper Products - 0.3% | | | | | | | | |
| Domtar Corp. | | | 10,890 | | | $ | 1,044,024 | |
| International Paper Co. | | | 30,358 | | | | 1,067,084 | |
| | | | | | | | |
| | | | | | | $ | 2,111,108 | |
| General Merchandise - 0.3% | | | | | | | | |
| Macy’s, Inc. | | | 63,165 | | | $ | 2,398,375 | |
| | |
| Health Maintenance Organizations - 0.5% | | | | | | | | |
| Aetna, Inc. | | | 57,736 | | | $ | 2,699,735 | |
32
Portfolio of Investments – continued
| | | | | | | | |
| Issuer | | Shares/Par | | | Value ($) | |
| | | | | | | | |
| Common Stocks - continued | | | | | | | | |
| Health Maintenance Organizations - continued | | | | | | | | |
| Humana, Inc. | | | 11,165 | | | $ | 972,472 | |
| | | | | | | | |
| | | | | | | $ | 3,672,207 | |
| Insurance - 1.7% | | | | | | | | |
| ACE Ltd. | | | 19,993 | | | $ | 1,433,698 | |
| Aflac, Inc. | | | 55,117 | | | | 2,604,278 | |
| Allied World Assurance Co. | | | 29,679 | | | | 1,957,924 | |
| Chubb Corp. | | | 26,260 | | | | 1,784,630 | |
| Hartford Financial Services Group, Inc. | | | 40,410 | | | | 836,891 | |
| MetLife, Inc. | | | 9,485 | | | | 365,647 | |
| Principal Financial Group, Inc. | | | 30,260 | | | | 836,992 | |
| Prudential Financial, Inc. | | | 44,248 | | | | 2,706,208 | |
| Validus Holdings Ltd. | | | 21,780 | | | | 664,072 | |
| | | | | | | | |
| | | | | | | $ | 13,190,340 | |
| Internet - 0.1% | | | | | | | | |
| Google, Inc., “A” (a) | | | 1,630 | | | $ | 1,007,747 | |
| | |
| Leisure & Toys - 0.3% | | | | | | | | |
| Activision Blizzard, Inc. | | | 55,530 | | | $ | 663,583 | |
| Mattel, Inc. | | | 52,200 | | | | 1,693,368 | |
| | | | | | | | |
| | | | | | | $ | 2,356,951 | |
| Machinery & Tools - 0.1% | | | | | | | | |
| Pitney Bowes, Inc. | | | 22,860 | | | $ | 414,452 | |
| | |
| Major Banks - 1.9% | | | | | | | | |
| Bank of America Corp. | | | 115,956 | | | $ | 924,169 | |
| Bank of New York Mellon Corp. | | | 69,630 | | | | 1,539,519 | |
| JPMorgan Chase & Co. | | | 151,482 | | | | 5,944,154 | |
| KeyCorp | | | 193,268 | | | | 1,565,471 | |
| Morgan Stanley | | | 41,356 | | | | 766,740 | |
| PNC Financial Services Group, Inc. | | | 45,505 | | | | 2,708,458 | |
| Wells Fargo & Co. | | | 54,020 | | | | 1,690,286 | |
| | | | | | | | |
| | | | | | | $ | 15,138,797 | |
| Medical & Health Technology & Services - 0.1% | | | | | | | | |
| HCA Holdings, Inc. | | | 37,690 | | | $ | 1,005,192 | |
| | |
| Medical Equipment - 0.1% | | | | | | | | |
| Medtronic, Inc. | | | 22,054 | | | $ | 840,698 | |
33
Portfolio of Investments – continued
| | | | | | | | |
| Issuer | | Shares/Par | | | Value ($) | |
| | | | | | | | |
| Common Stocks - continued | | | | | | | | |
| Metals & Mining - 0.4% | | | | | | | | |
| Cliffs Natural Resources, Inc. | | | 30,720 | | | $ | 1,950,106 | |
| Nucor Corp. | | | 23,198 | | | | 1,009,809 | �� |
| | | | | | | | |
| | | | | | | $ | 2,959,915 | |
| Natural Gas - Distribution - 0.5% | | | | | | | | |
| NiSource, Inc. | | | 92,331 | | | $ | 2,215,944 | |
| ONEOK, Inc. | | | 21,860 | | | | 1,806,510 | |
| | | | | | | | |
| | | | | | | $ | 4,022,454 | |
| Natural Gas - Pipeline - 0.1% | | | | | | | | |
| Williams Cos., Inc. | | | 30,373 | | | $ | 907,545 | |
| | |
| Network & Telecom - 0.2% | | | | | | | | |
| Cisco Systems, Inc. | | | 64,150 | | | $ | 1,275,302 | |
| | |
| Other Banks & Diversified Financials - 1.0% | | | | | | | | |
| American Express Co. | | | 15,219 | | | $ | 804,933 | |
| Capital One Financial Corp. | | | 35,522 | | | | 1,797,413 | |
| Citigroup, Inc. | | | 63,611 | | | | 2,119,519 | |
| Discover Financial Services | | | 98,740 | | | | 2,963,187 | |
| | | | | | | | |
| | | | | | | $ | 7,685,052 | |
| Pharmaceuticals - 1.8% | | | | | | | | |
| Abbott Laboratories | | | 32,075 | | | $ | 1,815,766 | |
| Johnson & Johnson | | | 53,192 | | | | 3,461,735 | |
| Merck & Co., Inc. | | | 77,631 | | | | 2,963,175 | |
| Pfizer, Inc. | | | 271,842 | | | | 5,735,866 | |
| | | | | | | | |
| | | | | | | $ | 13,976,542 | |
| Pollution Control - 0.2% | | | | | | | | |
| Republic Services, Inc. | | | 51,108 | | | $ | 1,524,552 | |
| | |
| Printing & Publishing - 0.0% | | | | | | | | |
| American Media Operations, Inc. (a) | | | 6,684 | | | $ | 79,473 | |
| Quad/Graphics, Inc. | | | 15 | | | | 225 | |
| | | | | | | | |
| | | | | | | $ | 79,698 | |
| Railroad & Shipping - 0.2% | | | | | | | | |
| CSX Corp. | | | 28,478 | | | $ | 598,323 | |
| Kansas City Southern Co. (a) | | | 13,390 | | | | 931,676 | |
| | | | | | | | |
| | | | | | | $ | 1,529,999 | |
34
Portfolio of Investments – continued
| | | | | | | | |
| Issuer | | Shares/Par | | | Value ($) | |
| | | | | | | | |
| Common Stocks - continued | | | | | | | | |
| Real Estate - 20.6% | | | | | | | | |
| Alexandria Real Estate Equities, Inc., REIT | | | 65,853 | | | $ | 4,721,002 | |
| Atrium European Real Estate Ltd. | | | 427,589 | | | | 2,033,746 | |
| AvalonBay Communities, Inc., REIT | | | 49,535 | | | | 6,423,203 | |
| Big Yellow Group PLC, REIT | | | 477,900 | | | | 2,204,844 | |
| BioMed Realty Trust, Inc., REIT | | | 331,416 | | | | 6,104,683 | |
| Boston Properties, Inc., REIT | | | 62,605 | | | | 6,357,538 | |
| Cousins Properties, Inc., REIT | | | 473,962 | | | | 3,502,579 | |
| DCT Industrial Trust, Inc., REIT | | | 438,880 | | | | 2,484,061 | |
| DDR Corp., REIT | | | 201,360 | | | | 2,845,217 | |
| Digital Realty Trust, Inc., REIT | | | 40,818 | | | | 2,959,305 | |
| Douglas Emmett, Inc., REIT | | | 144,197 | | | | 3,038,231 | |
| DuPont Fabros Technology, Inc., REIT | | | 123,373 | | | | 2,825,242 | |
| EastGroup Properties, Inc., REIT | | | 106,780 | | | | 5,145,728 | |
| Entertainment Properties Trust, REIT | | | 66,020 | | | | 3,003,910 | |
| Equity Lifestyle Properties, Inc., REIT | | | 61,726 | | | | 4,105,396 | |
| Federal Realty Investment Trust, REIT | | | 37,477 | | | | 3,573,432 | |
| Home Properties, Inc., REIT | | | 80,720 | | | | 4,651,894 | |
| Host Hotels & Resorts, Inc., REIT | | | 336,028 | | | | 5,302,522 | |
| Kimco Realty Corp., REIT | | | 302,641 | | | | 5,562,542 | |
| Mack-Cali Realty Corp., REIT | | | 69,089 | | | | 1,975,945 | |
| Medical Properties Trust, Inc., REIT | | | 631,347 | | | | 6,136,693 | |
| Mid-America Apartment Communities, Inc., REIT | | | 96,077 | | | | 5,992,322 | |
| National Retail Properties, Inc., REIT | | | 156,160 | | | | 4,161,664 | |
| Parkway Properties, Inc., REIT | | | 235,772 | | | | 2,355,362 | |
| Plum Creek Timber Co. Inc., REIT | | | 113,386 | | | | 4,440,196 | |
| Prologis, Inc., REIT | | | 162,440 | | | | 5,467,730 | |
| Public Storage, Inc., REIT | | | 80,242 | | | | 10,758,045 | |
| Simon Property Group, Inc., REIT | | | 142,441 | | | | 19,297,907 | |
| Starwood Property Trust, Inc., REIT | | | 162,004 | | | | 3,197,959 | |
| Tanger Factory Outlet Centers, Inc., REIT | | | 143,888 | | | | 4,213,041 | |
| Ventas, Inc., REIT | | | 100,722 | | | | 5,632,374 | |
| Vornado Realty Trust, REIT | | | 99,353 | | | | 8,120,121 | |
| Weyerhaeuser Co., REIT | | | 134,376 | | | | 2,807,115 | |
| | | | | | | | |
| | | | | | | $ | 161,401,549 | |
| Restaurants - 0.1% | | | | | | | | |
| McDonald’s Corp. | | | 10,568 | | | $ | 1,049,191 | |
| | |
| Special Products & Services - 0.0% | | | | | | | | |
| Mark IV Industries LLC, Common Units, “A” (a) | | | 763 | | | $ | 27,277 | |
35
Portfolio of Investments – continued
| | | | | | | | |
| Issuer | | Shares/Par | | | Value ($) | |
| | | | | | | | |
| Common Stocks - continued | | | | | | | | |
| Specialty Stores - 0.2% | | | | | | | | |
| Foot Locker, Inc. | | | 28,749 | | | $ | 838,608 | |
| Home Depot, Inc. | | | 17,060 | | | | 811,544 | |
| | | | | | | | |
| | | | | | | $ | 1,650,152 | |
| Telephone Services - 1.1% | | | | | | | | |
| AT&T, Inc. | | | 102,292 | | | $ | 3,129,112 | |
| CenturyLink, Inc. | | | 70,435 | | | | 2,835,009 | |
| Verizon Communications, Inc. | | | 65,146 | | | | 2,482,714 | |
| | | | | | | | |
| | | | | | | $ | 8,446,835 | |
| Tobacco - 0.4% | | | | | | | | |
| Altria Group, Inc. | | | 44,260 | | | $ | 1,332,226 | |
| Lorillard, Inc. | | | 9,750 | | | | 1,278,030 | |
| Philip Morris International, Inc. | | | 11,154 | | | | 931,582 | |
| | | | | | | | |
| | | | | | | $ | 3,541,838 | |
| Utilities - Electric Power - 1.0% | | | | | | | | |
| AES Corp. (a) | | | 59,507 | | | $ | 806,915 | |
| Alliant Energy Corp. | | | 48,021 | | | | 2,047,615 | |
| American Electric Power Co., Inc. | | | 67,603 | | | | 2,542,549 | |
| PG&E Corp. | | | 11,160 | | | | 465,149 | |
| PPL Corp. | | | 62,648 | | | | 1,788,600 | |
| | | | | | | | |
| | | | | | | $ | 7,650,828 | |
| Total Common Stocks (Identified Cost, $291,376,278) | | | | | | $ | 313,630,697 | |
| | |
| Floating Rate Loans (g)(r) - 0.0% | | | | | | | | |
| Aerospace - 0.0% | | | | | | | | |
| Hawker Beechcraft Acquisition Co. LLC, Term Loan B, 10.5%, 2014 | | $ | 99,506 | | | $ | 75,293 | |
| | |
| Financial Institutions - 0.0% | | | | | | | | |
| Springleaf Finance Corp., Term Loan, 5.5%, 2017 | | $ | 147,839 | | | $ | 134,410 | |
| Total Floating Rate Loans (Identified Cost, $243,772) | | | | | | $ | 209,703 | |
| | |
| Convertible Preferred Stocks - 0.0% | | | | | | | | |
| Automotive - 0.0% | | | | | | | | |
| General Motors Co., 4.75% (Identified Cost, $336,495) | | $ | 6,860 | | | $ | 292,853 | |
| | |
| Preferred Stocks - 0.2% | | | | | | | | |
| Other Banks & Diversified Financials - 0.2% | | | | | | | | |
| Ally Financial, Inc., 7% (z) | | | 170 | | | $ | 147,507 | |
| Ally Financial, Inc., “A”, 8.5% | | | 37,762 | | | | 839,449 | |
36
Portfolio of Investments – continued
| | | | | | | | |
| Issuer | | Shares/Par | | | Value ($) | |
| | | | | | | | |
| Preferred Stocks - continued | | | | | | | | |
| Other Banks & Diversified Financials - continued | | | | | | | | |
| GMAC Capital Trust I, 8.125% | | | 22,075 | | | $ | 518,321 | |
| Total Preferred Stocks (Identified Cost, $1,612,398) | | | | | | $ | 1,505,277 | |
| | | | | | | | | | | | | | | | |
| | | | |
| | | Strike Price | | | First Exercise | | | | | | | |
| | | | | | | | | | | | | | | | |
| Warrants - 0.0% | | | | | | | | | | | | | | | | |
| Broadcasting - 0.0% | | | | | | | | | | | | | | | | |
New Young Broadcasting Holding Co., Inc.
(1 share for 1 warrant)
(Identified Cost, $109,854) (a) | | $ | 0.01 | | | | 7/14/10 | | | | 58 | | | $ | 162,400 | |
| | | | | | | | | | | | |
| | |
| Convertible Bonds - 0.1% | | | | | | | | |
| Network & Telecom - 0.1% | | | | | | | | | | | | |
Nortel Networks Corp., 2.125%, 2014
(Identified Cost, $532,975) (a)(d) | | | | | | | $540,000 | | | | $531,900 | |
| | | | |
| Issuer/Expiration Date/Strike Price | | | | | | Number of
Contracts | | | | |
| Put Options Purchased - 0.1% | | | | | | | | | | | | |
| iShares Dow Jones U.S. Real Estate - September 2012 @ $55 (Premiums Paid, $699,725) | | | | | | | 2,500 | | | | $650,000 | |
| | | | |
| Money Market Funds - 4.4% | | | | | | | | | | | | |
MFS Institutional Money Market Portfolio, 0.1%,
at Cost and Net Asset Value (v) | | | | | | | 34,744,532 | | | | $34,744,532 | |
| Total Investments (Identified Cost, $739,180,438) | | | | | | | | | | | $774,178,901 | |
| | | | |
| Other Assets, Less Liabilities - 1.1% | | | | | | | | | | | 8,595,558 | |
| Net Assets - 100.0% | | | | | | | | | | | $782,774,459 | |
| (a) | Non-income producing security. |
| (d) | In default. Interest and/or scheduled principal payment(s) have been missed. |
| (f) | All or a portion of the security has been segregated as collateral for open futures contracts. |
| (g) | The rate shown represents a weighted average coupon rate on settled positions at period end, unless otherwise indicated. |
| (n) | Securities exempt from registration under Rule 144A of the Securities Act of 1933. These securities may be sold in the ordinary course of business in transactions exempt from registration, normally to qualified institutional buyers. At period end, the aggregate value of these securities was $91,688,061, representing 11.7% of net assets. |
| (p) | Payment-in-kind security. |
| (r) | Remaining maturities of floating rate loans may be less than stated maturities shown as a result of contractual or optional prepayments by the borrower. Such prepayments cannot be predicted with certainty. These loans may be subject to restrictions on resale. Floating rate loans generally have rates of interest which are determined periodically by reference to a base lending rate plus a premium. |
37
Portfolio of Investments – continued
| (v) | Underlying affiliated fund that is available only to investment companies managed by MFS. The rate quoted for the MFS Institutional Money Market Portfolio is the annualized seven-day yield of the fund at period end. |
| (z) | Restricted securities are not registered under the Securities Act of 1933 and are subject to legal restrictions on resale. These securities generally may be resold in transactions exempt from registration or to the public if the securities are subsequently registered. Disposal of these securities may involve time-consuming negotiations and prompt sale at an acceptable price may be difficult. The fund holds the following restricted securities: |
| | | | | | | | | | |
| Restricted Securities | | Acquisition Date | | Cost | | | Value | |
| Ally Financial, Inc., 7% (Preferred Stock) | | 4/13/11-4/14/11 | | | $159,375 | | | | $147,507 | |
| American Media, Inc., 13.5%, 2018 | | 12/28/10 | | | 26,458 | | | | 20,084 | |
| Ardagh Packaging Finance PLC, 9.125%, 2020 | | 1/20/12 | | | 377,833 | | | | 397,512 | |
| Atlantic Power Corp., 9%, 2018 | | 10/26/11-1/09/12 | | | 246,587 | | | | 255,000 | |
| Banco del Estado de Chile, 3.875%, 2022 | | 2/01/12 | | | 186,812 | | | | 188,575 | |
| Brasil Telecom S.A., 5.75%, 2022 | | 2/06/12 | | | 2,391,000 | | | | 2,450,775 | |
| BreitBurn Energy Partners LP, 7.875%, 2022 | | 1/10/12 | | | 277,651 | | | | 293,300 | |
| CDW LLC/CDW Finance Corp., 8.5%, 2019 | | 2/02/12 | | | 146,102 | | | | 149,800 | |
| CEVA Group PLC, 8.375%, 2017 | | 1/27/12 | | | 464,764 | | | | 468,825 | |
| CIT Group, Inc., 5.5%, 2019 | | 2/02/12 | | | 625,000 | | | | 638,281 | |
| Caesars Operating Escrow LLC, 8.5%, 2020 | | 2/09/12-2/10/12 | | | 640,000 | | | | 652,800 | |
| Clear Channel Worldwide Holdings, Inc., 7.625%, 2020 | | 2/29/12 | | | 210,000 | | | | 210,000 | |
| Clear Channel Worldwide Holdings, Inc., “A” 7.625%, 2020 | | 2/29/12 | | | 30,000 | | | | 30,000 | |
| Comision Federal de Electricidad, 5.75%, 2042 | | 2/07/12 | | | 1,548,712 | | | | 1,578,937 | |
| Corporacion Financiera de Desarrollo S.A., 4.75%, 2022 | | 2/01/12 | | | 248,080 | | | | 253,562 | |
| Credit Acceptance Corp., 9.125%, 2017 | | 2/28/11 | | | 220,858 | | | | 223,125 | |
| Dematic S.A., 8.75%, 2016 | | 4/19/11-11/08/11 | | | 850,404 | | | | 884,925 | |
| Dolphin Energy Ltd., 5.5%, 2021 | | 2/07/12-2/09/12 | | | 402,493 | | | | 413,600 | |
| Dynacast International LLC, 9.25%, 2019 | | 7/12/11-7/15/11 | | | 379,843 | | | | 390,937 | |
| Energy Future Holdings Corp., 11.75%, 2022 | | 2/01/12-2/03/12 | | | 238,704 | | | | 246,000 | |
| Fresenius Medical Care Capital Trust III, 5.625%, 2019 | | 1/17/12 | | | 330,000 | | | | 351,450 | |
| G-Force LLC, CDO, “A2”, 4.83%, 2036 | | 1/20/11 | | | 159,424 | | | | 158,495 | |
| Heckler & Koch GmbH, 9.5%, 2018 | | 5/06/11-7/11/11 | | | 354,561 | | | | 228,623 | |
| INEOS Finance PLC, 8.375%, 2019 | | 2/03/12-2/06/12 | | | 566,910 | | | | 589,688 | |
| Icahn Enterprises LP, 8%, 2018 | | 1/06/12-1/27/12 | | | 594,487 | | | | 612,680 | |
| Israel Electric Corp. Ltd., 6.7%, 2017 | | 2/07/12 | | | 402,000 | | | | 410,993 | |
| JBS USA LLC/JBS USA Finance, 8.25%, 2020 | | 1/25/12-1/31/12 | | | 290,895 | | | | 299,425 | |
| LBI Media, Inc., 8.5%, 2017 | | 7/18/07 | | | 123,671 | | | | 41,250 | |
| Level 3 Financing, Inc., 8.625%, 2020 | | 1/10/12-1/11/12 | | | 245,384 | | | | 261,538 | |
| Listrindo Capital B.V., 6.95%, 2019 | | 2/13/12 | | | 200,000 | | | | 201,612 | |
| Local TV Finance LLC, 9.25%, 2015 | | 11/09/07-2/16/11 | | | 404,838 | | | | 421,068 | |
| Physio-Control International, Inc., 9.875%, 2019 | | 1/13/12-1/30/12 | | | 335,379 | | | | 346,500 | |
| Prestige Brands, Inc., 8.125%, 2020 | | 1/24/12 | | | 50,000 | | | | 54,750 | |
38
Portfolio of Investments – continued
| | | | | | | | | | |
| Restricted Securities - continued | | Acquisition Date | | Cost | | | Value | |
| Republic of Latvia, 5.25%, 2017 | | 2/14/12 | | | $235,720 | | | | $242,333 | |
| Reynolds Group, 9.875%, 2019 | | 2/09/12-2/10/12 | | | 695,623 | | | | 718,456 | |
| Sberbank of Russia, 6.125%, 2022 | | 1/31/12 | | | 379,000 | | | | 386,012 | |
| Tembec Industries, Inc., 11.25%, 2018 | | 2/17/12 | | | 94,940 | | | | 96,750 | |
| UPC Holding B.V., 9.875%, 2018 | | 1/26/12 | | | 439,586 | | | | 444,000 | |
| UR Financing Escrow Corp., 5.75%, 2018 | | 2/24/12 | | | 265,000 | | | | 272,288 | |
| UR Financing Escrow Corp., 7.625%, 2022 | | 2/24/12 | | | 267,000 | | | | 276,345 | |
| USI Holdings Corp., 9.75%, 2015 | | 4/26/07-11/28/07 | | | 200,585 | | | | 205,513 | |
| Valeant Pharmaceuticals International, Inc., 6.5%, 2016 | | 2/28/12 | | | 210,381 | | | | 209,100 | |
| Videotron Ltee, 5%, 2022 | | 2/29/12 | | | 155,000 | | | | 155,000 | |
| Total Restricted Securities | | | | | | | | | $16,877,414 | |
| % of Net assets | | | | | | | | | 2.2% | |
The following abbreviations are used in this report and are defined:
| CDO | | Collateralized Debt Obligation |
| FRN | | Floating Rate Note. Interest rate resets periodically and may not be the rate reported at period end. |
| PLC | | Public Limited Company |
| REIT | | Real Estate Investment Trust |
| STRIPS | | Separate Trading of Registered Interest and Principal of Securities |
Abbreviations indicate amounts shown in currencies other than the U.S. dollar. All amounts are stated in U.S. dollars unless otherwise indicated. A list of abbreviations is shown below:
Derivative Contracts at 2/29/12
Forward Foreign Currency Exchange Contracts at 2/29/12
| | | | | | | | | | | | | | | | | | | | | | | | |
| Type | | Currency | | Counterparty | | Contracts
to
Deliver/
Receive | | | Settlement
Date Range | | | In
Exchange
For | | | Contracts
at Value | | | Net
Unrealized
Appreciation
(Depreciation) | |
| Liability Derivatives | |
| SELL | | EUR | | Barclays Bank PLC | | | 522,040 | | | | 4/12/12 | | | | $664,546 | | | | $695,633 | | | | $(31,087 | ) |
| SELL | | EUR | | Credit Suisse Group | | | 522,039 | | | | 4/12/12 | | | | 664,488 | | | | 695,633 | | | | (31,145 | ) |
| | | | | | | | | | | | | | | | | | | | | | | | |
| | | | | | | | | | | | | | | | | | | | | | | $(62,232 | ) |
| | | | | | | | | | | | | | | | | | | | | | | | |
Futures Contracts Outstanding at 2/29/12
| | | | | | | | | | | | | | | | | | |
| Description | | Currency | | | Contracts | | | Value | | Expiration
Date | | | Unrealized
Appreciation
(Depreciation) | |
| Liability Derivatives | | | | | | | | | | | | | | | | | | |
| Interest Rate Futures | | | | | | | | | | | | | | | | | | |
| U.S. Treasury Note 10 yr (Short) | | | USD | | | | 8 | | | $1,047,625 | | | June - 2012 | | | | ($340 | ) |
At February 29, 2012, the fund had sufficient cash and/or other liquid securities to cover any commitments under these derivative contracts.
See Notes to Financial Statements
39
Financial Statements
STATEMENT OF ASSETS AND LIABILITIES
At 2/29/12
This statement represents your fund’s balance sheet, which details the assets and liabilities comprising the total value of the fund.
| | | | |
| Assets | | | | |
Investments- | | | | |
Non-affiliated issuers, at value (identified cost, $704,435,906) | | | $739,434,369 | |
Underlying affiliated funds, at cost and value | | | 34,744,532 | |
Total investments, at value (identified cost, $739,180,438) | | | $774,178,901 | |
Receivables for | | | | |
Daily variation margin on open futures contracts | | | 3,500 | |
Investments sold | | | 2,176,260 | |
Fund shares sold | | | 10,307,619 | |
Interest and dividends | | | 6,421,582 | |
Other assets | | | 6,271 | |
Total assets | | | $793,094,133 | |
| Liabilities | | | | |
Payables for | | | | |
Distributions | | | $423,206 | |
Forward foreign currency exchange contracts | | | 62,232 | |
Investments purchased | | | 8,490,394 | |
Fund shares reacquired | | | 944,623 | |
Payable to affiliates | | | | |
Investment adviser | | | 28,349 | |
Shareholder servicing costs | | | 188,133 | |
Distribution and service fees | | | 19,046 | |
Payable for independent Trustees’ compensation | | | 22 | |
Accrued expenses and other liabilities | | | 163,669 | |
Total liabilities | | | $10,319,674 | |
Net assets | | | $782,774,459 | |
| Net assets consist of | | | | |
Paid-in capital | | | $767,290,041 | |
Unrealized appreciation (depreciation) on investments and translation of assets and liabilities in foreign currencies | | | 34,936,239 | |
Accumulated net realized gain (loss) on investments and foreign currency transactions | | | (18,562,873 | ) |
Accumulated distributions in excess of net investment income | | | (888,948 | ) |
Net assets | | | $782,774,459 | |
Shares of beneficial interest outstanding | | | 70,857,310 | |
| | | | | | | | | | | | |
| | | Net assets | | | Shares
outstanding | | | Net asset value
per share (a) | |
Class A | | | $447,033,613 | | | | 40,460,352 | | | | $11.05 | |
Class C | | | 238,331,748 | | | | 21,581,824 | | | | 11.04 | |
Class I | | | 96,323,386 | | | | 8,716,829 | | | | 11.05 | |
Class R1 | | | 141,801 | | | | 12,849 | | | | 11.04 | |
Class R2 | | | 212,240 | | | | 19,224 | | | | 11.04 | |
Class R3 | | | 185,649 | | | | 16,805 | | | | 11.05 | |
Class R4 | | | 546,022 | | | | 49,427 | | | | 11.05 | |
| (a) | Maximum offering price per share was equal to the net asset value per share for all share classes, except for Class A, for which the maximum offering price per share was $11.60 [100 / 95.25 x $11.05]. On sales of $50,000 or more, the maximum offering price of Class A shares is reduced. A contingent deferred sales charge may be imposed on redemptions of Class A and Class C shares. Redemption price per share was equal to the net asset value per share for Classes I, R1, R2, R3, and R4. |
See Notes to Financial Statements
40
Financial Statements
STATEMENT OF OPERATIONS
Year ended 2/29/12
This statement describes how much your fund earned in investment income and accrued in expenses. It also describes any gains and/or losses generated by fund operations.
| | | | |
| Net investment income | | | | |
Income | | | | |
Interest | | | $18,428,905 | |
Dividends | | | 6,252,519 | |
Dividends from underlying affiliated funds | | | 31,112 | |
Foreign taxes withheld | | | (3,660 | ) |
Total investment income | | | $24,708,876 | |
Expenses | | | | |
Management fee | | | $3,758,548 | |
Distribution and service fees | | | 2,643,957 | |
Shareholder servicing costs | | | 578,505 | |
Administrative services fee | | | 95,890 | |
Independent Trustees’ compensation | | | 13,462 | |
Custodian fee | | | 144,533 | |
Shareholder communications | | | 56,197 | |
Audit and tax fees | | | 59,997 | |
Legal fees | | | 8,728 | |
Miscellaneous | | | 182,235 | |
Total expenses | | | $7,542,052 | |
Fees paid indirectly | | | (34 | ) |
Reduction of expenses by investment adviser | | | (2,220 | ) |
Net expenses | | | $7,539,798 | |
Net investment income | | | $17,169,078 | |
Realized and unrealized gain (loss) on investments
and foreign currency transactions | | | | |
Realized gain (loss) (identified cost basis) | | | | |
Investment transactions | | | $28,531,480 | |
Written option transactions | | | 16,250 | |
Futures contracts | | | (57,419 | ) |
Foreign currency transactions | | | 140,376 | |
Net realized gain (loss) on investments
and foreign currency transactions | | | $28,630,687 | |
Change in unrealized appreciation (depreciation) | | | | |
Investments | | | $(5,315,564 | ) |
Written options | | | (13,750 | ) |
Futures contracts | | | 433 | |
Translation of assets and liabilities in foreign currencies | | | (59,749 | ) |
Net unrealized gain (loss) on investments
and foreign currency translation | | | $(5,388,630 | ) |
Net realized and unrealized gain (loss) on investments
and foreign currency | | | $23,242,057 | |
Change in net assets from operations | | | $40,411,135 | |
See Notes to Financial Statements
41
Financial Statements
STATEMENTS OF CHANGES IN NET ASSETS
These statements describe the increases and/or decreases in net assets resulting from operations, any distributions, and any shareholder transactions.
| | | | | | | | |
| | | Years ended 2/29, 2/28 | |
| | | 2012 | | | 2011 | |
| Change in net assets | | | | | | |
| From operations | | | | | | | | |
Net investment income | | | $17,169,078 | | | | $9,747,383 | |
Net realized gain (loss) on investments and
foreign currency transactions | | | 28,630,687 | | | | 6,422,636 | |
Net unrealized gain (loss) on investments and
foreign currency translation | | | (5,388,630 | ) | | | 27,205,845 | |
Change in net assets from operations | | | $40,411,135 | | | | $43,375,864 | |
| Distributions declared to shareholders | | | | | | | | |
From net investment income | | | $(19,225,635 | ) | | | $(10,855,741 | ) |
Change in net assets from fund share transactions | | | $334,441,555 | | | | $210,670,060 | |
Total change in net assets | | | $355,627,055 | | | | $243,190,183 | |
| Net assets | | | | | | | | |
At beginning of period | | | 427,147,404 | | | | 183,957,221 | |
At end of period (including accumulated distributions in excess of net investment income of $888,948 and $613,430, respectively) | | | $782,774,459 | | | | $427,147,404 | |
See Notes to Financial Statements
42
Financial Statements
FINANCIAL HIGHLIGHTS
The financial highlights table is intended to help you understand the fund’s financial performance for the past 5 years (or life of a particular share class, if shorter). Certain information reflects financial results for a single fund share. The total returns in the table represent the rate by which an investor would have earned (or lost) on an investment in the fund share class (assuming reinvestment of all distributions) held for the entire period.
| | | | | | | | | | | | | | | | | | | | |
| Class A | | Years ended 2/29, 2/28 | |
| | | 2012 | | | 2011 | | | 2010 | | | 2009 | | | 2008 | |
Net asset value, beginning of period | | | $10.79 | | | | $9.60 | | | | $6.88 | | | | $10.04 | | | | $10.95 | |
| Income (loss) from investment operations | | | | | | | | | | | | | | | | | |
Net investment income (d) | | | $0.34 | | | | $0.40 | | | | $0.43 | | | | $0.47 | | | | $0.47 | |
Net realized and unrealized gain (loss)
on investments and foreign currency | | | 0.30 | | | | 1.23 | | | | 2.75 | | | | (3.13 | ) | | | (0.80 | ) |
Total from investment operations | | | $0.64 | | | | $1.63 | | | | $3.18 | | | | $(2.66 | ) | | | $(0.33 | ) |
| Less distributions declared to shareholders | | | | | | | | | | | | | | | | | |
From net investment income | | | $(0.38 | ) | | | $(0.44 | ) | | | $(0.46 | ) | | | $(0.49 | ) | | | $(0.48 | ) |
From net realized gain on investments | | | — | | | | — | | | | — | | | | (0.01 | ) | | | (0.10 | ) |
Total distributions declared to shareholders | | | $(0.38 | ) | | | $(0.44 | ) | | | $(0.46 | ) | | | $(0.50 | ) | | | $(0.58 | ) |
Net asset value, end of period (x) | | | $11.05 | | | | $10.79 | | | | $9.60 | | | | $6.88 | | | | $10.04 | |
Total return (%) (r)(s)(t)(x) | | | 6.09 | | | | 17.36 | | | | 47.12 | | | | (27.43 | ) | | | (3.18 | ) |
Ratios (%) (to average net assets)
and Supplemental data: | | | | | | | | | | | | | | | | | |
Expenses before expense reductions (f) | | | 1.10 | | | | 1.15 | | | | 1.20 | | | | 1.23 | | | | 1.18 | |
Expenses after expense reductions (f) | | | 1.10 | | | | 1.06 | | | | 0.94 | | | | 0.95 | | | | 0.95 | |
Net investment income | | | 3.18 | | | | 3.95 | | | | 5.02 | | | | 5.23 | | | | 4.35 | |
Portfolio turnover | | | 64 | | | | 59 | | | | 79 | | | | 80 | | | | 89 | |
Net assets at end of period (000 omitted) | | | $447,034 | | | | $257,247 | | | | $116,318 | | | | $91,445 | | | | $166,546 | |
See Notes to Financial Statements
43
Financial Highlights – continued
| | | | | | | | | | | | | | | | | | | | |
| Class C | | Years ended 2/29, 2/28 | |
| | | 2012 | | | 2011 | | | 2010 | | | 2009 | | | 2008 | |
Net asset value, beginning of period | | | $10.78 | | | | $9.59 | | | | $6.88 | | | | $10.03 | | | | $10.94 | |
| Income (loss) from investment operations | | | | | | | | | | | | | | | | | |
Net investment income (d) | | | $0.26 | | | | $0.33 | | | | $0.37 | | | | $0.41 | | | | $0.39 | |
Net realized and unrealized gain (loss)
on investments and foreign currency | | | 0.30 | | | | 1.22 | | | | 2.74 | | | | (3.13 | ) | | | (0.80 | ) |
Total from investment operations | | | $0.56 | | | | $1.55 | | | | $3.11 | | | | $(2.72 | ) | | | $(0.41 | ) |
| Less distributions declared to shareholders | | | | | | | | | | | | | | | | | |
From net investment income | | | $(0.30 | ) | | | $(0.36 | ) | | | $(0.40 | ) | | | $(0.42 | ) | | | $(0.40 | ) |
From net realized gain on investments | | | — | | | | — | | | | — | | | | (0.01 | ) | | | (0.10 | ) |
Total distributions declared to shareholders | | | $(0.30 | ) | | | $(0.36 | ) | | | $(0.40 | ) | | | $(0.43 | ) | | | $(0.50 | ) |
Net asset value, end of period (x) | | | $11.04 | | | | $10.78 | | | | $9.59 | | | | $6.88 | | | | $10.03 | |
Total return (%) (r)(s)(t)(x) | | | 5.31 | | | | 16.51 | | | | 45.90 | | | | (27.88 | ) | | | (3.87 | ) |
Ratios (%) (to average net assets)
and Supplemental data: | | | | | | | | | | | | | | | | | |
Expenses before expense reductions (f) | | | 1.85 | | | | 1.90 | | | | 1.95 | | | | 1.93 | | | | 1.89 | |
Expenses after expense reductions (f) | | | 1.85 | | | | 1.81 | | | | 1.69 | | | | 1.65 | | | | 1.65 | |
Net investment income | | | 2.43 | | | | 3.20 | | | | 4.27 | | | | 4.54 | | | | 3.64 | |
Portfolio turnover | | | 64 | | | | 59 | | | | 79 | | | | 80 | | | | 89 | |
Net assets at end of period (000 omitted) | | | $238,332 | | | | $138,344 | | | | $63,377 | | | | $46,617 | | | | $82,486 | |
See Notes to Financial Statements
44
Financial Highlights – continued
| | | | | | | | | | | | | | | | | | | | |
| Class I | | Years ended 2/29, 2/28 | |
| | | 2012 | | | 2011 | | | 2010 | | | 2009 | | | 2008 | |
Net asset value, beginning of period | | | $10.79 | | | | $9.60 | | | | $6.88 | | | | $10.04 | | | | $10.95 | |
| Income (loss) from investment operations | | | | | | | | | | | | | | | | | |
Net investment income (d) | | | $0.36 | | | | $0.41 | | | | $0.45 | | | | $0.50 | | | | $0.51 | |
Net realized and unrealized gain (loss)
on investments and foreign currency | | | 0.30 | | | | 1.25 | | | | 2.75 | | | | (3.14 | ) | | | (0.81 | ) |
Total from investment operations | | | $0.66 | | | | $1.66 | | | | $3.20 | | | | $(2.64 | ) | | | $(0.30 | ) |
| Less distributions declared to shareholders | | | | | | | | | | | | | | | | | |
From net investment income | | | $(0.40 | ) | | | $(0.47 | ) | | | $(0.48 | ) | | | $(0.51 | ) | | | $(0.51 | ) |
From net realized gain on investments | | | — | | | | — | | | | — | | | | (0.01 | ) | | | (0.10 | ) |
Total distributions declared to shareholders | | | $(0.40 | ) | | | $(0.47 | ) | | | $(0.48 | ) | | | $(0.52 | ) | | | $(0.61 | ) |
Net asset value, end of period (x) | | | $11.05 | | | | $10.79 | | | | $9.60 | | | | $6.88 | | | | $10.04 | |
Total return (%) (r)(s)(x) | | | 6.35 | | | | 17.65 | | | | 47.47 | | | | (27.21 | ) | | | (2.89 | ) |
Ratios (%) (to average net assets)
and Supplemental data: | | | | | | | | | | | | | | | | | |
Expenses before expense reductions (f) | | | 0.85 | | | | 0.89 | | | | 0.93 | | | | 0.93 | | | | 0.88 | |
Expenses after expense reductions (f) | | | 0.85 | | | | 0.83 | | | | 0.69 | | | | 0.65 | | | | 0.65 | |
Net investment income | | | 3.43 | | | | 3.94 | | | | 4.95 | | | | 5.56 | | | | 4.67 | |
Portfolio turnover | | | 64 | | | | 59 | | | | 79 | | | | 80 | | | | 89 | |
Net assets at end of period (000 omitted) | | | $96,323 | | | | $30,993 | | | | $3,835 | | | | $1,036 | | | | $1,507 | |
See Notes to Financial Statements
45
Financial Highlights – continued
| | | | | | | | | | | | | | | | |
| Class R1 | | Years ended 2/29, 2/28 | |
| | | 2012 | | | 2011 | | | 2010 | | | 2009 (i) | |
Net asset value, beginning of period | | | $10.78 | | | | $9.59 | | | | $6.87 | | | | $9.83 | |
| Income (loss) from investment operations | | | | | | | | | | | | | | | | |
Net investment income (d) | | | $0.26 | | | | $0.34 | | | | $0.37 | | | | $0.27 | |
Net realized and unrealized gain (loss)
on investments and foreign currency | | | 0.30 | | | | 1.21 | | | | 2.75 | | | | (2.94 | ) |
Total from investment operations | | | $0.56 | | | | $1.55 | | | | $3.12 | | | | $(2.67 | ) |
| Less distributions declared to shareholders | | | | | | | | | | | | | |
From net investment income | | | $(0.30 | ) | | | $(0.36 | ) | | | $(0.40 | ) | | | $(0.29 | ) |
Net asset value, end of period (x) | | | $11.04 | | | | $10.78 | | | | $9.59 | | | | $6.87 | |
Total return (%) (r)(s)(x) | | | 5.31 | | | | 16.51 | | | | 46.11 | | | | (27.52 | )(n) |
Ratios (%) (to average net assets)
and Supplemental data: | | | | | | | | | | | | | | | | |
Expenses before expense reductions (f) | | | 1.85 | | | | 1.90 | | | | 1.94 | | | | 1.97 | (a) |
Expenses after expense reductions (f) | | | 1.85 | | | | 1.80 | | | | 1.69 | | | | 1.65 | (a) |
Net investment income | | | 2.44 | | | | 3.32 | | | | 4.24 | | | | 4.76 | (a) |
Portfolio turnover | | | 64 | | | | 59 | | | | 79 | | | | 80 | |
Net assets at end of period (000 omitted) | | | $142 | | | | $126 | | | | $106 | | | | $73 | |
| | | | | | | | | | | | | | | | |
| Class R2 | | Years ended 2/29, 2/28 | |
| | | 2012 | | | 2011 | | | 2010 | | | 2009 (i) | |
Net asset value, beginning of period | | | $10.78 | | | | $9.59 | | | | $6.87 | | | | $9.83 | |
| Income (loss) from investment operations | | | | | | | | | | | | | | | | |
Net investment income (d) | | | $0.31 | | | | $0.39 | | | | $0.41 | | | | $0.29 | |
Net realized and unrealized gain (loss)
on investments and foreign currency | | | 0.30 | | | | 1.21 | | | | 2.75 | | | | (2.93 | ) |
Total from investment operations | | | $0.61 | | | | $1.60 | | | | $3.16 | | | | $(2.64 | ) |
| Less distributions declared to shareholders | | | | | | | | | | | | | |
From net investment income | | | $(0.35 | ) | | | $(0.41 | ) | | | $(0.44 | ) | | | $(0.32 | ) |
Net asset value, end of period (x) | | | $11.04 | | | | $10.78 | | | | $9.59 | | | | $6.87 | |
Total return (%) (r)(s)(x) | | | 5.83 | | | | 17.09 | | | | 46.82 | | | | (27.27 | )(n) |
Ratios (%) (to average net assets)
and Supplemental data: | | | | | | | | | | | | | | | | |
Expenses before expense reductions (f) | | | 1.35 | | | | 1.40 | | | | 1.45 | | | | 1.48 | (a) |
Expenses after expense reductions (f) | | | 1.35 | | | | 1.30 | | | | 1.19 | | | | 1.15 | (a) |
Net investment income | | | 2.93 | | | | 3.83 | | | | 4.74 | | | | 5.26 | (a) |
Portfolio turnover | | | 64 | | | | 59 | | | | 79 | | | | 80 | |
Net assets at end of period (000 omitted) | | | $212 | | | | $125 | | | | $107 | | | | $73 | |
See Notes to Financial Statements
46
Financial Highlights – continued
| | | | | | | | | | | | | | | | |
| Class R3 | | Years ended 2/29, 2/28 | |
| | | 2012 | | | 2011 | | | 2010 | | | 2009 (i) | |
Net asset value, beginning of period | | | $10.79 | | | | $9.59 | | | | $6.88 | | | | $9.84 | |
| Income (loss) from investment operations | | | | | | | | | | | | | | | | |
Net investment income (d) | | | $0.34 | | | | $0.41 | | | | $0.43 | | | | $0.31 | |
Net realized and unrealized gain (loss)
on investments and foreign currency | | | 0.30 | | | | 1.23 | | | | 2.74 | | | | (2.93 | ) |
Total from investment operations | | | $0.64 | | | | $1.64 | | | | $3.17 | | | | $(2.62 | ) |
| Less distributions declared to shareholders | | | | | | | | | | | | | |
From net investment income | | | $(0.38 | ) | | | $(0.44 | ) | | | $(0.46 | ) | | | $(0.34 | ) |
Net asset value, end of period (x) | | | $11.05 | | | | $10.79 | | | | $9.59 | | | | $6.88 | |
Total return (%) (r)(s)(x) | | | 6.09 | | | | 17.48 | | | | 46.96 | | | | (27.12 | )(n) |
Ratios (%) (to average net assets)
and Supplemental data: | | | | | | | | | | | | | | | | |
Expenses before expense reductions (f) | | | 1.10 | | | | 1.15 | | | | 1.20 | | | | 1.22 | (a) |
Expenses after expense reductions (f) | | | 1.10 | | | | 1.06 | | | | 0.94 | | | | 0.90 | (a) |
Net investment income | | | 3.17 | | | | 3.99 | | | | 4.99 | | | | 5.49 | (a) |
Portfolio turnover | | | 64 | | | | 59 | | | | 79 | | | | 80 | |
Net assets at end of period (000 omitted) | | | $186 | | | | $185 | | | | $107 | | | | $73 | |
| | | | | | | | | | | | | | | | |
| Class R4 | | Years ended 2/29, 2/28 | |
| | | 2012 | | | 2011 | | | 2010 | | | 2009 (i) | |
Net asset value, beginning of period | | | $10.79 | | | | $9.59 | | | | $6.88 | | | | $9.84 | |
| Income (loss) from investment operations | | | | | | | | | | | | | | | | |
Net investment income (d) | | | $0.36 | | | | $0.44 | | | | $0.46 | | | | $0.32 | |
Net realized and unrealized gain (loss)
on investments and foreign currency | | | 0.30 | | | | 1.23 | | | | 2.73 | | | | (2.93 | ) |
Total from investment operations | | | $0.66 | | | | $1.67 | | | | $3.19 | | | | $(2.61 | ) |
| Less distributions declared to shareholders | | | | | | | | | | | | | |
From net investment income | | | $(0.40 | ) | | | $(0.47 | ) | | | $(0.48 | ) | | | $(0.35 | ) |
Net asset value, end of period (x) | | | $11.05 | | | | $10.79 | | | | $9.59 | | | | $6.88 | |
Total return (%) (r)(s)(x) | | | 6.35 | | | | 17.78 | | | | 47.32 | | | | (26.99 | )(n) |
Ratios (%) (to average net assets)
and Supplemental data: | | | | | | | | | | | | | | | | |
Expenses before expense reductions (f) | | | 0.85 | | | | 0.90 | | | | 0.95 | | | | 0.97 | (a) |
Expenses after expense reductions (f) | | | 0.85 | | | | 0.80 | | | | 0.69 | | | | 0.65 | (a) |
Net investment income | | | 3.40 | | | | 4.32 | | | | 5.24 | | | | 5.76 | (a) |
Portfolio turnover | | | 64 | | | | 59 | | | | 79 | | | | 80 | |
Net assets at end of period (000 omitted) | | | $546 | | | | $127 | | | | $108 | | | | $73 | |
See Notes to Financial Statements
47
Financial Highlights – continued
| (d) | Per share data is based on average shares outstanding. |
| (f) | Ratios do not reflect reductions from fees paid indirectly, if applicable. |
| (i) | For the period from the class’ inception, July 1, 2008 (Classes R1, R2, R3, and R4) through the stated period end. |
| (r) | Certain expenses have been reduced without which performance would have been lower. |
| (s) | From time to time the fund may receive proceeds from litigation settlements, without which performance would be lower. |
| (t) | Total returns do not include any applicable sales charges. |
| (x) | The net asset values per share and total returns have been calculated on net assets which include adjustments made in accordance with U.S. generally accepted accounting principles required at period end for financial reporting purposes. |
See Notes to Financial Statements
48
NOTES TO FINANCIAL STATEMENTS
| (1) | | Business and Organization |
MFS Diversified Income Fund (the fund) is a series of MFS Series Trust XIII (the trust). The trust is organized as a Massachusetts business trust and is registered under the Investment Company Act of 1940, as amended, as an open-end management investment company.
| (2) | | Significant Accounting Policies |
General – The preparation of financial statements in conformity with U.S. generally accepted accounting principles requires management to make estimates and assumptions that affect the reported amounts of assets and liabilities, and disclosure of contingent assets and liabilities at the date of the financial statements and the reported amounts of revenues and expenses during the reporting period. Actual results could differ from those estimates. In the preparation of these financial statements, management has evaluated subsequent events occurring after the date of the fund’s Statement of Assets and Liabilities through the date that the financial statements were issued. The fund invests in foreign securities, including securities of emerging market issuers. Investments in foreign securities are vulnerable to the effects of changes in the relative values of the local currency and the U.S. dollar and to the effects of changes in each country’s legal, political, and economic environment. The markets of emerging markets countries are generally more volatile than the markets of developed countries with more mature economies. All of the risks of investing in foreign securities previously described are heightened when investing in emerging markets countries.
In December 2011, the Financial Accounting Standards Board issued Accounting Standards Update 2011-11, Balance Sheet (Topic 210) – Disclosures about Offsetting Assets and Liabilities (“ASU 2011-11”). Effective for annual reporting periods beginning on or after January 1, 2013 and interim periods within those annual periods, ASU 2011-11 is intended to enhance disclosure requirements on the offsetting of financial assets and liabilities. Although still evaluating the potential impacts of ASU 2011-11 to the fund, management expects that the impact of the fund’s adoption will be limited to additional financial statement disclosures.
Investment Valuations – Equity securities, including restricted equity securities, are generally valued at the last sale or official closing price as provided by a third-party pricing service on the market or exchange on which they are primarily traded. Equity securities, for which there were no sales reported that day, are generally valued at the last quoted daily bid quotation as provided by a third-party pricing service on the market or exchange on which such securities are primarily traded. Debt instruments and floating rate loans
49
Notes to Financial Statements – continued
(other than short-term instruments), including restricted debt instruments, are generally valued at an evaluated or composite bid as provided by a third-party pricing service. Short-term instruments with a maturity at issuance of 60 days or less generally are valued at amortized cost, which approximates market value. Exchange-traded options are generally valued at the last sale or official closing price as provided by a third-party pricing service on the exchange on which such options are primarily traded. Exchange-traded options for which there were no sales reported that day are generally valued at the last daily bid quotation as provided by a third-party pricing service on the exchange on which such options are primarily traded. Options not traded on an exchange are generally valued at a broker/dealer bid quotation. Foreign currency options are generally valued at valuations provided by a third-party pricing service. Futures contracts are generally valued at last posted settlement price as provided by a third-party pricing service on the market on which they are primarily traded. Futures contracts for which there were no trades that day for a particular position are generally valued at the closing bid quotation as provided by a third-party pricing service on the market on which such futures contracts are primarily traded. Forward foreign currency exchange contracts are generally valued at the mean of bid and asked prices for the time period interpolated from rates provided by a third-party pricing service for proximate time periods. Open-end investment companies are generally valued at net asset value per share. Securities and other assets generally valued on the basis of information from a third-party pricing service may also be valued at a broker/dealer bid quotation. Values obtained from third-party pricing services can utilize both transaction data and market information such as yield, quality, coupon rate, maturity, type of issue, trading characteristics, and other market data. The values of foreign securities and other assets and liabilities expressed in foreign currencies are converted to U.S. dollars using the mean of bid and asked prices for rates provided by a third-party pricing service.
The Board of Trustees has delegated primary responsibility for determining or causing to be determined the value of the fund’s investments (including any fair valuation) to the adviser pursuant to valuation policies and procedures approved by the Board. If the adviser determines that reliable market quotations are not readily available, investments are valued at fair value as determined in good faith by the adviser in accordance with such procedures under the oversight of the Board of Trustees. Under the fund’s valuation policies and procedures, market quotations are not considered to be readily available for most types of debt instruments and floating rate loans and many types of derivatives. These investments are generally valued at fair value based on information from third-party pricing services. In addition, investments may be valued at fair value if the adviser determines that an investment’s value has been materially affected by events occurring after the close of the exchange or
50
Notes to Financial Statements – continued
market on which the investment is principally traded (such as foreign exchange or market) and prior to the determination of the fund’s net asset value, or after the halting of trading of a specific security where trading does not resume prior to the close of the exchange or market on which the security is principally traded. Events that occur on a frequent basis after foreign markets close (such as developments in foreign markets and significant movements in the U.S. markets) and prior to the determination of the fund’s net asset value may be deemed to have a material effect on the value of securities traded in foreign markets. Accordingly, the fund’s foreign equity securities may often be valued at fair value. The adviser generally relies on third-party pricing services or other information (such as the correlation with price movements of similar securities in the same or other markets; the type, cost and investment characteristics of the security; the business and financial condition of the issuer; and trading and other market data) to assist in determining whether to fair value and at what value to fair value an investment. The value of an investment for purposes of calculating the fund’s net asset value can differ depending on the source and method used to determine value. When fair valuation is used, the value of an investment used to determine the fund’s net asset value may differ from quoted or published prices for the same investment. There can be no assurance that the fund could obtain the fair value assigned to an investment if it were to sell the investment at the same time at which the fund determines its net asset value per share.
Various inputs are used in determining the value of the fund’s assets or liabilities. These inputs are categorized into three broad levels. In certain cases, the inputs used to measure fair value may fall into different levels of the fair value hierarchy. In such cases, an investment’s level within the fair value hierarchy is based on the lowest level of input that is significant to the fair value measurement. The fund’s assessment of the significance of a particular input to the fair value measurement in its entirety requires judgment, and considers factors specific to the investment. Level 1 includes unadjusted quoted prices in active markets for identical assets or liabilities. Level 2 includes other significant observable market-based inputs (including quoted prices for similar securities, interest rates, prepayment speed, and credit risk). Level 3 includes unobservable inputs, which may include the adviser’s own assumptions in determining the fair value of investments. Other financial instruments are derivative instruments not reflected in total investments, such
51
Notes to Financial Statements – continued
as futures and forward foreign currency exchange contracts. The following is a summary of the levels used as of February 29, 2012 in valuing the fund’s assets or liabilities:
| | | | | | | | | | | | | | | | |
| Investments at Value | | Level 1 | | | Level 2 | | | Level 3 | | | Total | |
| Equity Securities | | | | | | | | | | | | | | | | |
United States | | | $311,527,181 | | | | $395,984 | | | | $79,473 | | | | $312,002,638 | |
United Kingdom | | | 2,204,844 | | | | — | | | | — | | | | 2,204,844 | |
Austria | | | 2,033,746 | | | | — | | | | — | | | | 2,033,746 | |
| U.S. Treasury Bonds & U.S. Government Agency & Equivalents | | | — | | | | 84,682,644 | | | | — | | | | 84,682,644 | |
| Non-U.S. Sovereign Debt | | | — | | | | 71,384,311 | | | | — | | | | 71,384,311 | |
| Municipal Bonds | | | — | | | | 235,712 | | | | — | | | | 235,712 | |
| Corporate Bonds | | | — | | | | 160,319,867 | | | | — | | | | 160,319,867 | |
| Residential Mortgage-Backed Securities | | | — | | | | 43,847,120 | | | | — | | | | 43,847,120 | |
| Commercial Mortgage-Backed Securities | | | — | | | | 660,706 | | | | — | | | | 660,706 | |
| Asset-Backed Securities (including CDOs) | | | — | | | | 158,495 | | | | — | | | | 158,495 | |
| Foreign Bonds | | | — | | | | 61,694,583 | | | | — | | | | 61,694,583 | |
| Floating Rate Loans | | | — | | | | 209,703 | | | | — | | | | 209,703 | |
| Mutual Funds | | | 34,744,532 | | | | — | | | | — | | | | 34,744,532 | |
| Total Investments | | | $350,510,303 | | | | $423,589,125 | | | | $79,473 | | | | $774,178,901 | |
| | | | |
| Other Financial Instruments | | | | | | | | | | | | |
| Futures | | | $(340 | ) | | | $— | | | | $— | | | | $(340 | ) |
| Forward Foreign Currency Exchange Contracts | | | $— | | | | $(62,232 | ) | | | $— | | | | $(62,232 | ) |
For further information regarding security characteristics, see the Portfolio of Investments.
The following is a reconciliation of level 3 assets for which significant unobservable inputs were used to determine fair value. The fund’s policy is to recognize transfers between the levels as of the end of the period. The table presents the activity of level 3 securities held at the beginning and the end of the period.
| | | | | | | | | | | | |
| | | Equity
Securities | | | Corporate
Bonds | | | Total | |
| Balance as of 2/28/11 | | | $— | | | | $0 | | | | $0 | |
Realized gain (loss) | | | — | | | | (64,518 | ) | | | (64,518 | ) |
Change in unrealized appreciation (depreciation) | | | — | | | | 64,518 | | | | 64,518 | |
Sales | | | — | | | | 0 | | | | 0 | |
Transfers into Level 3 | | | 79,473 | | | | — | | | | 79,473 | |
| Balance as of 2/29/12 | | | $79,473 | | | | $— | | | | $79,473 | |
52
Notes to Financial Statements – continued
The net change in unrealized appreciation (depreciation) from investments held as level 3 at February 29, 2012 is $0.
Inflation-Adjusted Debt Securities – The fund invests in inflation-adjusted debt securities issued by the U.S. Treasury. The fund may also invest in inflation-adjusted debt securities issued by U.S. Government agencies and instrumentalities other than the U.S. Treasury and by other entities such as U.S. and foreign corporations and foreign governments. The principal value of these debt securities is adjusted through income according to changes in the Consumer Price Index or another general price or wage index. These debt securities typically pay a fixed rate of interest, but this fixed rate is applied to the inflation-adjusted principal amount. The principal paid at maturity of the debt security is typically equal to the inflation-adjusted principal amount, or the security’s original par value, whichever is greater. Other types of inflation-adjusted securities may use other methods to adjust for other measures of inflation.
Foreign Currency Translation – Purchases and sales of foreign investments, income, and expenses are converted into U.S. dollars based upon currency exchange rates prevailing on the respective dates of such transactions or on the reporting date for foreign denominated receivables and payables. Gains and losses attributable to foreign currency exchange rates on sales of securities are recorded for financial statement purposes as net realized gains and losses on investments. Gains and losses attributable to foreign exchange rate movements on receivables, payables, income and expenses are recorded for financial statement purposes as foreign currency transaction gains and losses. That portion of both realized and unrealized gains and losses on investments that results from fluctuations in foreign currency exchange rates is not separately disclosed.
Derivatives – The fund uses derivatives for different purposes, primarily to increase or decrease exposure to a particular market or segment of the market, or security, to increase or decrease interest rate or currency exposure, or as alternatives to direct investments. Derivatives are used for hedging or non-hedging purposes. While hedging can reduce or eliminate losses, it can also reduce or eliminate gains. When the fund uses derivatives as an investment to increase market exposure, or for hedging purposes, gains and losses from derivative instruments may be substantially greater than the derivative’s original cost.
The derivative instruments used by the fund were written options, purchased options, futures contracts, and forward foreign currency exchange contracts. The fund’s period end derivatives, as presented in the Portfolio of Investments and the associated Derivative Contract Tables, generally are indicative of the volume of its derivative activity during the period.
53
Notes to Financial Statements – continued
The following table presents, by major type of derivative contract, the fair value, on a gross basis, of the asset and liability components of derivatives held by the fund at February 29, 2012 as reported in the Statement of Assets and Liabilities:
| | | | | | | | | | |
| | | | | Fair Value (a) | |
| Risk | | Derivative Contracts | | Asset Derivatives | | | Liability Derivatives | |
| Interest Rate | | Interest Rate Futures | | | $— | | | | $(340) | |
| Foreign Exchange | | Forward Foreign Currency Exchange | | | — | | | | (62,232 | ) |
| Equity | | Purchased Equity Options | | | 650,000 | | | | — | |
| Total | | | | | $650,000 | | | | $(62,572) | |
| (a) | The value of purchased options outstanding is included in total investments, at value, within the fund’s Statement of Assets and Liabilities. The value of futures contracts outstanding includes cumulative appreciation (depreciation) as reported in the fund’s Portfolio of Investments. Only the current day variation margin for futures contracts is separately reported within the fund’s Statement of Assets and Liabilities. |
The following table presents, by major type of derivative contract, the realized gain (loss) on derivatives held by the fund for the year ended February 29, 2012 as reported in the Statement of Operations:
| | | | | | | | | | | | | | | | |
| Risk | | Futures
Contracts | | | Foreign
Currency
Transactions | | | Investment
Transactions
(Purchased
Options) | | | Written
Options | |
| Interest Rate | | | $(57,419 | ) | | | $— | | | | $(555 | ) | | | $— | |
| Foreign Exchange | | | — | | | | 145,143 | | | | — | | | | — | |
| Equity | | | — | | | | — | | | | (43,895 | ) | | | 16,250 | |
| Total | | | $(57,419 | ) | | | $145,143 | | | | $(44,450 | ) | | | $16,250 | |
The following table presents, by major type of derivative contract, the change in unrealized appreciation (depreciation) on derivatives held by the fund for the year ended February 29, 2012 as reported in the Statement of Operations:
| | | | | | | | | | | | | | | | |
| Risk | | Futures
Contracts | | | Translation
of Assets and
Liabilities in
Foreign
Currencies | | | Investments
(Purchased
Options) | | | Written
Options | |
| Interest Rate | | | $433 | | | | $— | | | | $153 | | | | $— | |
| Foreign Exchange | | | — | | | | (59,896 | ) | | | — | | | | — | |
| Equity | | | — | | | | — | | | | 275 | | | | (13,750 | ) |
| Total | | | $433 | | | | $(59,896 | ) | | | $428 | | | | $(13,750 | ) |
Derivative counterparty credit risk is managed through formal evaluation of the creditworthiness of all potential counterparties. On certain over-the-counter derivatives, the fund attempts to reduce its exposure to counterparty credit risk whenever possible by entering into an International Swaps and Derivatives Association (ISDA) Master Agreement on a bilateral basis with each of the
54
Notes to Financial Statements – continued
counterparties with whom it undertakes a significant volume of transactions. The ISDA Master Agreement gives each party to the agreement the right to terminate all transactions traded under such agreement if there is a certain deterioration in the credit quality of the other party. The ISDA Master Agreement gives the fund the right, upon an event of default by the applicable counterparty or a termination of the agreement, to close out all transactions traded under such agreement and to net amounts owed under each transaction to one net amount payable by one party to the other. This right to close out and net payments across all transactions traded under the ISDA Master Agreement could result in a reduction of the fund’s credit risk to such counterparty equal to any amounts payable by the fund under the applicable transactions, if any. However, absent an event of default by the counterparty or a termination of the agreement, the ISDA Master Agreement does not result in an offset of reported amounts of assets and liabilities in the Statement of Assets and Liabilities across transactions between the fund and the applicable counterparty.
Collateral requirements differ by type of derivative. Collateral or margin requirements are set by the broker or exchange clearing house for exchange traded derivatives (i.e., futures and exchange-traded options) while collateral terms are contract specific for over-the-counter traded derivatives (i.e., forward foreign currency exchange contracts, swaps and over-the-counter options). For derivatives traded under an ISDA Master Agreement, the collateral requirements are netted across all transactions traded under such agreement and one amount is posted from one party to the other to collateralize such obligations. Cash collateral that has been pledged to cover obligations of the fund under derivative contracts, if any, will be reported separately on the Statement of Assets and Liabilities as restricted cash. Securities collateral pledged for the same purpose, if any, is noted in the Portfolio of Investments.
Written Options – In exchange for a premium, the fund wrote put options on securities that it anticipated the price would increase. At the time the option was written, the fund believed the premium received exceeded the potential loss that could result from adverse price changes in the options’ underlying securities. In a written option, the fund as the option writer grants the buyer the right to purchase from, or sell to, the fund a specified number of shares or units of a particular security, currency or index at a specified price within a specified period of time.
The premium received is initially recorded as a liability on the Statement of Assets and Liabilities. The option is subsequently marked-to-market daily with the difference between the premium received and the market value of the written option being recorded as unrealized appreciation or depreciation. When a written option expires, the fund realizes a gain equal to the amount of the premium received. The difference between the premium received and the
55
Notes to Financial Statements – continued
amount paid on effecting a closing transaction is considered a realized gain or loss. When a written put option is exercised, the premium reduces the cost basis of the security purchased by the fund.
At the initiation of the written option contract, for exchange traded options, the fund is required to deposit securities or cash as collateral with the custodian for the benefit of the broker. For over-the-counter options, the fund may post collateral subject to the terms of an ISDA Master Agreement as generally described above if the market value of the options contract moves against it. The fund, as writer of an option, may have no control over whether the underlying securities may be sold (call) or purchased (put) and, as a result, bears the market risk of an unfavorable change in the price of the securities underlying the written option. Losses from writing options can exceed the premium received and can exceed the potential loss from an ordinary buy and sell transaction. Although the fund’s market risk may be significant, the maximum counterparty credit risk to the fund is equal to the market value of any collateral posted to the broker. For over-the-counter options, this risk is mitigated in cases where there is an ISDA Master Agreement between the fund and the counterparty providing for netting as described above.
Written Option Transactions
| | | | | | | | |
| | | Number of
Contracts | | | Premiums
Received | |
| Outstanding, beginning of period | | | 1,250 | | | | $16,250 | |
| Options expired | | | (1,250 | ) | | | (16,250 | ) |
| Outstanding, end of period | | | — | | | | $— | |
Purchased Options – The fund purchased call and put options for a premium. Purchased call and put options entitle the holder to buy and sell a specified number of shares or units of a particular security, currency or index at a specified price at a specified date or within a specified period of time. Purchasing call options may be used to hedge against an anticipated increase in the dollar cost of securities or currency to be acquired or to increase the fund’s exposure to an underlying instrument. Purchasing put options may hedge against a decline in the value of portfolio securities or currency.
The premium paid is initially recorded as an investment in the Statement of Assets and Liabilities. That investment is subsequently marked-to-market daily with the difference between the premium paid and the market value of the purchased option being recorded as unrealized appreciation or depreciation. Premiums paid for purchased call and put options which have expired are treated as realized losses on investments in the Statement of Operations. Upon the exercise or closing of a purchased call option, the premium paid is added to the cost of the security or financial instrument. Upon the exercise or closing of a purchased put option, the premium paid is offset against the proceeds on the
56
Notes to Financial Statements – continued
sale of the underlying security or financial instrument in order to determine the realized gain or loss on investments.
The risk in purchasing an option is that the fund pays a premium whether or not the option is exercised. The fund’s maximum risk of loss due to counterparty credit risk is limited to the market value of the option. For over-the-counter options, this risk is mitigated in cases where there is an ISDA Master Agreement between the fund and the counterparty providing for netting as described above and for posting of collateral by the counterparty to the fund to cover the fund’s exposure to the counterparty under such ISDA Master Agreement.
Futures Contracts – The fund entered into futures contracts which may be used to hedge against or obtain broad market, interest rate, duration, or currency exposure. A futures contract represents a commitment for the future purchase or sale of an asset at a specified price on a specified date.
Upon entering into a futures contract, the fund is required to deposit with the broker, either in cash or securities, an initial margin in an amount equal to a certain percentage of the notional amount of the contract. Subsequent payments (variation margin) are made or received by the fund each day, depending on the daily fluctuations in the value of the contract, and are recorded for financial statement purposes as unrealized gain or loss by the fund until the contract is closed or expires at which point the gain or loss on futures is realized.
The fund bears the risk of interest rates, exchange rates or securities prices moving unexpectedly, in which case, the fund may not achieve the anticipated benefits of the futures contracts and may realize a loss. While futures may present less counterparty risk to the fund since the contracts are exchange traded and the exchange’s clearinghouse guarantees payments to the broker, there is still counterparty credit risk due to the insolvency of the broker. The fund’s maximum risk of loss due to counterparty credit risk is equal to the margin posted by the fund to the broker plus any gains or minus any losses on the outstanding futures contracts.
Forward Foreign Currency Exchange Contracts – The fund entered into forward foreign currency exchange contracts for the purchase or sale of a specific foreign currency at a fixed price on a future date. These contracts may be used to hedge the fund’s currency risk or for non-hedging purposes. For hedging purposes, the fund may enter into contracts to deliver or receive foreign currency that the fund will receive from or use in its normal investment activities. The fund may also use contracts to hedge against declines in the value of foreign currency denominated securities due to unfavorable exchange rate movements. For non-hedging purposes, the fund may enter into contracts with the intent of changing the relative exposure of
57
Notes to Financial Statements – continued
the fund’s portfolio of securities to different currencies to take advantage of anticipated exchange rate changes.
Forward foreign currency exchange contracts are adjusted by the daily exchange rate of the underlying currency and any unrealized gains or losses are recorded as a receivable or payable for forward foreign currency exchange contracts until the contract settlement date. On contract settlement date, any gain or loss on the contract is recorded as realized gains or losses on foreign currency transactions.
Risks may arise upon entering into these contracts from unanticipated movements in the value of the contract and from the potential inability of counterparties to meet the terms of their contracts. Generally, the fund’s maximum risk due to counterparty credit risk is the unrealized gain on the contract due to the use of Continuous Linked Settlement, an industry accepted settlement system. This risk is mitigated in cases where there is an ISDA Master Agreement between the fund and the counterparty providing for netting as described above and for posting of collateral by the counterparty to the fund to cover the fund’s exposure to the counterparty under such ISDA Master Agreement.
Loans and Other Direct Debt Instruments – The fund invests in loans and loan participations or other receivables. These investments may include standby financing commitments, including revolving credit facilities, which obligate the fund to supply additional cash to the borrower on demand. Loan participations involve a risk of insolvency of the lending bank or other financial intermediary.
Indemnifications – Under the fund’s organizational documents, its officers and Trustees may be indemnified against certain liabilities and expenses arising out of the performance of their duties to the fund. Additionally, in the normal course of business, the fund enters into agreements with service providers that may contain indemnification clauses. The fund’s maximum exposure under these agreements is unknown as this would involve future claims that may be made against the fund that have not yet occurred.
Investment Transactions and Income – Investment transactions are recorded on the trade date. Interest income is recorded on the accrual basis. All premium and discount is amortized or accreted for financial statement purposes in accordance with U.S. generally accepted accounting principles. The fund earns certain fees in connection with its floating rate loan purchasing activities. These fees are in addition to interest payments earned and may include amendment fees, commitment fees, facility fees, consent fees, and prepayment fees. Commitment fees are recorded on an accrual basis as income in the accompanying financial statements. Inflation-indexed bonds are fixed-income securities whose principal value is periodically adjusted upward or downward to
58
Notes to Financial Statements – continued
the rate of inflation. Interest is accrued based on the principal value, which is adjusted for inflation. Any increase or decrease in the principal amount of an inflation-indexed bond is generally recorded as an increase or decrease in interest income, respectively, even though the adjusted principal is not received until maturity. Dividends received in cash are recorded on the ex-dividend date. Certain dividends from foreign securities will be recorded when the fund is informed of the dividend if such information is obtained subsequent to the ex-dividend date. Dividend and interest payments received in additional securities are recorded on the ex-dividend or ex-interest date in an amount equal to the value of the security on such date. Debt obligations may be placed on non-accrual status or set to accrue at a rate of interest less than the contractual coupon when the collection of all or a portion of interest has become doubtful. Interest income for those debt obligations may be further reduced by the write-off of the related interest receivables when deemed uncollectible.
The fund may receive proceeds from litigation settlements. Any proceeds received from litigation involving portfolio holdings are reflected in the Statement of Operations in realized gain/loss if the security has been disposed of by the fund or in unrealized gain/loss if the security is still held by the fund. Any other proceeds from litigation not related to portfolio holdings are reflected as other income in the Statement of Operations.
The fund purchased or sold debt securities on a when-issued or delayed delivery basis, or in a “To Be Announced” (TBA) or “forward commitment” transaction with delivery or payment to occur at a later date beyond the normal settlement period. TBA securities resulting from these transactions are included in the Portfolio of Investments. At the time a fund enters into a commitment to purchase or sell a security, the transaction is recorded and the value of the security acquired is reflected in the fund’s net asset value. The price of such security and the date that the security will be delivered and paid for are fixed at the time the transaction is negotiated. The value of the security may vary with market fluctuations. No interest accrues to the fund until payment takes place. At the time that a fund enters into this type of transaction, the fund is required to have sufficient cash and/or liquid securities to cover its commitments. Losses may arise due to changes in the value of the underlying securities or if the counterparty does not perform under the contract’s terms, or if the issuer does not issue the securities due to political, economic or other factors. Additionally, losses may arise due to declines in the value of the securities prior to settlement date.
Fees Paid Indirectly – The fund’s custody fee may be reduced according to an arrangement that measures the value of cash deposited with the custodian by the fund. This amount, for the year ended February 29, 2012, is shown as a reduction of total expenses on the Statement of Operations.
59
Notes to Financial Statements – continued
Tax Matters and Distributions – The fund intends to qualify as a regulated investment company, as defined under Subchapter M of the Internal Revenue Code, and to distribute all of its taxable income, including realized capital gains. As a result, no provision for federal income tax is required. The fund’s federal tax returns for the prior three fiscal years remain subject to examination by the Internal Revenue Service. Foreign taxes have been accrued by the fund in the accompanying financial statements.
Distributions to shareholders are recorded on the ex-dividend date. Income and capital gain distributions are determined in accordance with income tax regulations, which may differ from U.S. generally accepted accounting principles. Certain capital accounts in the financial statements are periodically adjusted for permanent differences in order to reflect their tax character. These adjustments have no impact on net assets or net asset value per share. Temporary differences which arise from recognizing certain items of income, expense, gain or loss in different periods for financial statement and tax purposes will reverse at some time in the future. Distributions in excess of net investment income or net realized gains are temporary overdistributions for financial statement purposes resulting from differences in the recognition or classification of income or distributions for financial statement and tax purposes.
Book/tax differences primarily relate to amortization and accretion of debt securities and wash sale loss deferrals.
The tax character of distributions declared to shareholders for the last two fiscal years is as follows:
| | | | | | | | |
| | | 2/29/2012 | | | 2/28/2011 | |
| Ordinary income (including any short-term capital gains) | | | $19,225,635 | | | | $10,855,741 | |
The federal tax cost and the tax basis components of distributable earnings were as follows:
| | | | |
| As of 2/29/12 | | | |
| Cost of investments | | | $744,651,572 | |
| Gross appreciation | | | 38,549,443 | |
| Gross depreciation | | | (9,022,114 | ) |
| Net unrealized appreciation (depreciation) | | | $29,527,329 | |
| Undistributed ordinary income | | | 1,064,232 | |
| Capital loss carryforwards | | | (13,089,259 | ) |
| Other temporary differences | | | (2,017,884 | ) |
Under the Regulated Investment Company Modernization Act of 2010 (the “Act”), net capital losses recognized after February 29, 2012 may be carried forward indefinitely, and their character is retained as short-term and/or
60
Notes to Financial Statements – continued
long-term losses. Previously, net capital losses were carried forward for eight years and treated as short-term losses. As a transition rule, the Act requires that post-enactment net capital losses be used before pre-enactment net capital losses.
As of February 29, 2012, the fund had capital loss carryforwards available to offset future realized gains. Such losses expire as follows:
| | | | |
| Pre-enactment losses: | | | | |
| 2/28/18 | | | $(13,089,259 | ) |
Multiple Classes of Shares of Beneficial Interest – The fund offers multiple classes of shares, which differ in their respective distribution and service fees. The fund’s income and common expenses are allocated to shareholders based on the value of settled shares outstanding of each class. The fund’s realized and unrealized gain (loss) are allocated to shareholders based on the daily net assets of each class. Dividends are declared separately for each class. Differences in per share dividend rates are generally due to differences in separate class expenses. The fund’s distributions declared to shareholders as reported on the Statements of Changes in Net Assets are presented by class as follows:
| | | | | | | | |
| | | From net investment
income | |
| | | Year ended
2/29/12 | | | Year ended
2/28/11 | |
| Class A | | | $11,734,259 | | | | $7,167,650 | |
| Class C | | | 5,043,685 | | | | 3,185,496 | |
| Class I | | | 2,427,158 | | | | 482,602 | |
| Class R1 | | | 3,641 | | | | 4,145 | |
| Class R2 | | | 5,164 | | | | 4,708 | |
| Class R3 | | | 5,881 | | | | 5,806 | |
| Class R4 | | | 5,847 | | | | 5,334 | |
| Total | | | $19,225,635 | | | | $10,855,741 | |
| (3) | | Transactions with Affiliates |
Investment Adviser – The fund has an investment advisory agreement with MFS to provide overall investment management and related administrative services and facilities to the fund.
The management fee is computed daily and paid monthly at an annual rate of 0.65% of the fund’s average daily net assets. Prior to May 1, 2011, the adviser and the fund had retained Sun Capital Advisers LLC, referred to as Sun Capital or the sub-adviser, as a sub-adviser for the real estate related component of the fund. MFS paid a sub-advisory fee to the sub-adviser in an amount equal to 0.30% annually of the average daily net asset value of the fund’s assets managed by the sub-adviser. The fund was not responsible for paying the sub-advisory fee. The sub-advisory agreement with Sun Capital was terminated effective May 1, 2011, and accordingly MFS no longer pays the sub-advisory fee to Sun Capital.
61
Notes to Financial Statements – continued
The investment adviser has agreed in writing to pay a portion of the fund’s total annual operating expenses, exclusive of interest, taxes, extraordinary expenses, brokerage and transaction costs, and investment-related expenses, such that total annual fund operating expenses do not exceed the following rates annually of each class’ average daily net assets.
| | | | | | | | | | | | | | | | | | | | | | | | |
| Class A | | Class C | | | Class I | | | Class R1 | | | Class R2 | | | Class R3 | | | Class R4 | |
| 1.10% | | | 1.85% | | | | 0.85% | | | | 1.85% | | | | 1.35% | | | | 1.10% | | | | 0.85% | |
This written agreement will continue until modified by the fund’s Board of Trustees, but such agreement will continue at least until June 30, 2013. For the year ended February 29, 2012, the fund’s actual operating expenses did not exceed the limit and therefore, the investment advisor did not pay any portion of the fund’s expenses related to this agreement.
Distributor – MFS Fund Distributors, Inc. (MFD), a wholly-owned subsidiary of MFS, as distributor, received $623,669 for the year ended February 29, 2012, as its portion of the initial sales charge on sales of Class A shares of the fund.
The Board of Trustees has adopted a distribution plan for certain class shares pursuant to Rule 12b-1 of the Investment Company Act of 1940.
The fund’s distribution plan provides that the fund will pay MFD for services provided by MFD and financial intermediaries in connection with the distribution and servicing of certain share classes. One component of the plan is a distribution fee paid to MFD and another component of the plan is a service fee paid to MFD. MFD may subsequently pay all, or a portion, of the distribution and/or service fees to financial intermediaries.
Distribution Plan Fee Table:
| | | | | | | | | | | | | | | | | | | | |
| | | Distribution
Fee Rate (d) | | | Service
Fee Rate (d) | | | Total
Distribution
Plan (d) | | | Annual
Effective
Rate (e) | | | Distribution
and Service
Fee | |
| Class A | | | — | | | | 0.25% | | | | 0.25% | | | | 0.25% | | | | $830,784 | |
| Class C | | | 0.75% | | | | 0.25% | | | | 1.00% | | | | 1.00% | | | | 1,810,675 | |
| Class R1 | | | 0.75% | | | | 0.25% | | | | 1.00% | | | | 1.00% | | | | 1,300 | |
| Class R2 | | | 0.25% | | | | 0.25% | | | | 0.50% | | | | 0.50% | | | | 784 | |
| Class R3 | | | — | | | | 0.25% | | | | 0.25% | | | | 0.25% | | | | 414 | |
| Total Distribution and Service Fees | | | | | | | | | | | | | | | | $2,643,957 | |
| (d) | In accordance with the distribution plan for certain classes, the fund pays distribution and/or service fees equal to these annual percentage rates of each class’ average daily net assets. The distribution and service fee rates disclosed by class represent the current rates in effect at the end of the reporting period. |
| (e) | The annual effective rates represent actual fees incurred under the distribution plan for the year ended February 29, 2012 based on each class’ average daily net assets. |
Certain Class A shares are subject to a contingent deferred sales charge (CDSC) in the event of a shareholder redemption within 24 months of purchase. Class C shares are subject to a CDSC in the event of a shareholder redemption within
62
Notes to Financial Statements – continued
12 months of purchase. All contingent deferred sales charges are paid to MFD and during the year ended February 29, 2012, were as follows:
| | | | |
| | | Amount | |
| Class A | | | $8,880 | |
| Class C | | | $45,419 | |
Shareholder Servicing Agent – MFS Service Center, Inc. (MFSC), a wholly-owned subsidiary of MFS, receives a fee from the fund for its services as shareholder servicing agent calculated as a percentage of the average daily net assets of the fund as determined periodically under the supervision of the fund’s Board of Trustees. For the year ended February 29, 2012, the fee was $126,793, which equated to 0.0220% annually of the fund’s average daily net assets. MFSC also receives payment from the fund for out-of-pocket expenses, sub-accounting and other shareholder servicing costs which may be paid to affiliated and unaffiliated service providers. For the year ended February 29, 2012, these out-of-pocket expenses, sub-accounting and other shareholder servicing costs amounted to $451,712.
Administrator – MFS provides certain financial, legal, shareholder communications, compliance, and other administrative services to the fund. Under an administrative services agreement, the fund partially reimburses MFS the costs incurred to provide these services. The fund is charged an annual fixed amount of $17,500 plus a fee based on average daily net assets. The administrative services fee incurred for the year ended February 29, 2012 was equivalent to an annual effective rate of 0.0166% of the fund’s average daily net assets.
Trustees’ and Officers’ Compensation – The fund pays compensation to independent Trustees in the form of a retainer, attendance fees, and additional compensation to Board and Committee chairpersons. The fund does not pay compensation directly to Trustees or officers of the fund who are also officers of the investment adviser, all of whom receive remuneration for their services to the fund from MFS. Certain officers and Trustees of the fund are officers or directors of MFS, MFD, and MFSC.
Other – This fund and certain other funds managed by MFS (the funds) have entered into services agreements (the Agreements) which provide for payment of fees by the funds to Tarantino LLC and Griffin Compliance LLC in return for the provision of services of an Independent Chief Compliance Officer (ICCO) and Assistant ICCO, respectively, for the funds. The ICCO and Assistant ICCO are officers of the funds and the sole members of Tarantino LLC and Griffin Compliance LLC, respectively. The funds can terminate the Agreements with Tarantino LLC and Griffin Compliance LLC at any time under the terms of the Agreements. For the year ended February 29, 2012, the aggregate fees paid by the fund to Tarantino LLC and Griffin Compliance LLC were $4,925 and are included in miscellaneous expense on the Statement of Operations. MFS has
63
Notes to Financial Statements – continued
agreed to reimburse the fund for a portion of the payments made by the fund in the amount of $2,220, which is shown as a reduction of total expenses in the Statement of Operations. Additionally, MFS has agreed to bear all expenses associated with office space, other administrative support, and supplies provided to the ICCO and Assistant ICCO.
The fund invests in the MFS Institutional Money Market Portfolio which is managed by MFS and seeks a high level of current income consistent with preservation of capital and liquidity. Income earned on this investment is included in dividends from underlying affiliated funds on the Statement of Operations. This money market fund does not pay a management fee to MFS.
Purchases and sales of investments, other than purchased option transactions, and short-term obligations, were as follows:
| | | | | | | | |
| | | Purchases | | | Sales | |
| U.S. Government securities | | | $149,857,262 | | | | $96,815,281 | |
| Investments (non-U.S. Government securities) | | | $502,800,955 | | | | $249,703,033 | |
| (5) | | Shares of Beneficial Interest |
The fund’s Declaration of Trust permits the Trustees to issue an unlimited number of full and fractional shares of beneficial interest. Transactions in fund shares were as follows:
| | | | | | | | | | | | | | | | |
| | | Year ended
2/29/12 | | | Year ended
2/28/11 | |
| | | Shares | | | Amount | | | Shares | | | Amount | |
| Shares sold | | | | | | | | | | | | | | | | |
Class A | | | 24,496,866 | | | | $261,103,830 | | | | 15,865,631 | | | | $163,162,444 | |
Class C | | | 10,945,785 | | | | 116,827,058 | | | | 7,370,346 | | | | 75,831,109 | |
Class I | | | 8,203,883 | | | | 87,535,336 | | | | 2,690,752 | | | | 28,005,712 | |
Class R1 | | | 774 | | | | 7,808 | | | | 285 | | | | 2,873 | |
Class R2 | | | 7,167 | | | | 77,286 | | | | — | | | | — | |
Class R3 | | | 2,090 | | | | 22,621 | | | | 5,419 | | | | 56,104 | |
Class R4 | | | 37,178 | | | | 408,303 | | | | — | | | | — | |
| | | 43,693,743 | | | | $465,982,242 | | | | 25,932,433 | | | | $267,058,242 | |
| Shares issued to shareholders in reinvestment of distributions | | | | | | | | | | | | | | | | |
Class A | | | 939,008 | | | | $10,043,440 | | | | 510,353 | | | | $5,222,898 | |
Class C | | | 316,030 | | | | 3,378,617 | | | | 202,690 | | | | 2,072,344 | |
Class I | | | 118,669 | | | | 1,266,876 | | | | 16,446 | | | | 168,941 | |
Class R1 | | | 341 | | | | 3,641 | | | | 408 | | | | 4,145 | |
Class R2 | | | 482 | | | | 5,164 | | | | 464 | | | | 4,708 | |
Class R3 | | | 549 | | | | 5,881 | | | | 568 | | | | 5,806 | |
Class R4 | | | 544 | | | | 5,847 | | | | 524 | | | | 5,334 | |
| | | 1,375,623 | | | | $14,709,466 | | | | 731,453 | | | | $7,484,176 | |
64
Notes to Financial Statements – continued
| | | | | | | | | | | | | | | | |
| | | Year ended
2/29/12 | | | Year ended
2/28/11 | |
| | | Shares | | | Amount | | | Shares | | | Amount | |
| Shares reacquired | | | | | | | | | | | | | | | | |
Class A | | | (8,818,888 | ) | | | $(93,363,115 | ) | | | (4,652,805 | ) | | | $(47,705,796 | ) |
Class C | | | (2,508,643 | ) | | | (26,575,246 | ) | | | (1,351,941 | ) | | | (13,745,859 | ) |
Class I | | | (2,477,765 | ) | | | (26,278,443 | ) | | | (234,608 | ) | | | (2,420,703 | ) |
Class R1 | | | (1 | ) | | | (7 | ) | | | — | | | | — | |
Class R2 | | | (23 | ) | | | (250 | ) | | | — | | | | — | |
Class R3 | | | (2,990 | ) | | | (32,716 | ) | | | — | | | | — | |
Class R4 | | | (34 | ) | | | (376 | ) | | | — | | | | — | |
| | | (13,808,344 | ) | | | $(146,250,153 | ) | | | (6,239,354 | ) | | | $(63,872,358 | ) |
| Net change | | | | | | | | | | | | | | | | |
Class A | | | 16,616,986 | | | | $177,784,155 | | | | 11,723,179 | | | | $120,679,546 | |
Class C | | | 8,753,172 | | | | 93,630,429 | | | | 6,221,095 | | | | 64,157,594 | |
Class I | | | 5,844,787 | | | | 62,523,769 | | | | 2,472,590 | | | | 25,753,950 | |
Class R1 | | | 1,114 | | | | 11,442 | | | | 693 | | | | 7,018 | |
Class R2 | | | 7,626 | | | | 82,200 | | | | 464 | | | | 4,708 | |
Class R3 | | | (351 | ) | | | (4,214 | ) | | | 5,987 | | | | 61,910 | |
Class R4 | | | 37,688 | | | | 413,774 | | | | 524 | | | | 5,334 | |
| | | 31,261,022 | | | | $334,441,555 | | | | 20,424,532 | | | | $210,670,060 | |
The fund and certain other funds managed by MFS participate in a $1.1 billion unsecured committed line of credit, subject to a $1 billion sublimit, provided by a syndication of banks under a credit agreement. Borrowings may be made for temporary financing needs. Interest is charged to each fund, based on its borrowings, generally at a rate equal to the higher of the Federal Reserve funds rate or one month LIBOR plus an agreed upon spread. A commitment fee, based on the average daily, unused portion of the committed line of credit, is allocated among the participating funds at the end of each calendar quarter. In addition, the fund and other funds managed by MFS have established unsecured uncommitted borrowing arrangements with certain banks for temporary financing needs. Interest is charged to each fund, based on its borrowings, at a rate equal to the Federal Reserve funds rate plus an agreed upon spread. For the year ended February 29, 2012, the fund’s commitment fee and interest expense were $4,042 and $0, respectively, and are included in miscellaneous expense on the Statement of Operations.
65
Notes to Financial Statements – continued
| (7) | | Transactions in Underlying Affiliated Funds-Affiliated Issuers |
An affiliated issuer may be considered one in which the fund owns 5% or more of the outstanding voting securities, or a company which is under common control. For the purposes of this report, the fund assumes the following to be affiliated issuers:
| | | | | | | | | | | | | | | | |
| Underlying Affiliated Funds | | Beginning
Shares/Par
Amount | | | Acquisitions
Shares/Par
Amount | | | Dispositions
Shares/Par
Amount | | | Ending
Shares/Par
Amount | |
MFS Institutional Money
Market Portfolio | | | 21,088,116 | | | | 282,224,609 | | | | (268,568,193 | ) | | | 34,744,532 | |
| | | | |
| Underlying Affiliated Funds | | Realized
Gain (Loss) | | | Capital Gain
Distributions | | | Dividend
Income | | | Ending
Value | |
MFS Institutional Money
Market Portfolio | | | $— | | | | $— | | | | $31,112 | | | | $34,744,532 | |
66
REPORT OF INDEPENDENT REGISTERED PUBLIC ACCOUNTING FIRM
To the Trustees and Shareholders of MFS Diversified Income Fund:
We have audited the accompanying statement of assets and liabilities of MFS Diversified Income Fund (the Fund), including the portfolio of investments, as of February 29, 2012, and the related statement of operations for the year then ended, the statements of changes in net assets for each of the two years in the period then ended, and the financial highlights for each of the periods indicated therein. These financial statements and financial highlights are the responsibility of the Fund’s management. Our responsibility is to express an opinion on these financial statements and financial highlights based on our audits.
We conducted our audits in accordance with the standards of the Public Company Accounting Oversight Board (United States). Those standards require that we plan and perform the audit to obtain reasonable assurance about whether the financial statements and financial highlights are free of material misstatement. We were not engaged to perform an audit of the Fund’s internal control over financial reporting. Our audits included consideration of internal control over financial reporting as a basis for designing audit procedures that are appropriate in the circumstances, but not for the purpose of expressing an opinion on the effectiveness of the Fund’s internal control over financial reporting. Accordingly, we express no such opinion. An audit also includes examining, on a test basis, evidence supporting the amounts and disclosures in the financial statements and financial highlights, assessing the accounting principles used and significant estimates made by management, and evaluating the overall financial statement presentation. Our procedures included confirmation of securities owned as of February 29, 2012, by correspondence with the Fund’s custodian and brokers or by other appropriate auditing procedures when replies from brokers were not received. We believe that our audits provide a reasonable basis for our opinion.
In our opinion, the financial statements and financial highlights referred to above present fairly, in all material respects, the financial position of MFS Diversified Income Fund at February 29, 2012, the results of its operations for the year then ended, the changes in its net assets for each of the two years in the period then ended, and its financial highlights for the periods indicated therein, in conformity with U.S. generally accepted accounting principles.

Boston, Massachusetts April 13, 2012
67
TRUSTEES AND OFFICERS — IDENTIFICATION AND BACKGROUND
The Trustees and officers of the Trust, as of April 1, 2012, are listed below, together with their principal occupations during the past five years. (Their titles may have varied during that period.) The address of each Trustee and officer is 500 Boylston Street, Boston, Massachusetts 02116.
| | | | | | | | |
Name, Age | | Position(s) Held with Fund | | Trustee/Officer
Since (h) | | Principal Occupations
During the Past Five Years | | Other Directorships (j) |
| INTERESTED TRUSTEES |
Robert J. Manning (k)
(age 48) | | Trustee | | February 2004 | | Massachusetts Financial Services Company, Chairman, Chief Executive Officer and Director; President (until December 2009); Chief Investment Officer (until July 2010) | | N/A |
| INDEPENDENT TRUSTEES |
David H. Gunning
(age 69) | | Trustee and Chair of Trustees | | January 2004 | | Retired; Cleveland-Cliffs Inc. (mining products and service provider), Vice Chairman/Director (until May 2007) | | Lincoln Electric Holdings, Inc. (welding equipment manufacturer), Director; Development Alternatives, Inc. (consulting), Director/Non-Executive Chairman; Portman Limited (mining), Director (until 2008) |
Robert E. Butler
(age 70) | | Trustee | | January 2006 | | Consultant – investment company industry regulatory and compliance matters | | N/A |
Maureen R. Goldfarb
(age 56) | | Trustee | | January 2009 | | Private investor | | N/A |
68
Trustees and Officers – continued
| | | | | | | | |
Name, Age | | Position(s) Held with Fund | | Trustee/Officer
Since (h) | | Principal Occupations
During the Past Five Years | | Other Directorships (j) |
William R. Gutow
(age 70) | | Trustee | | December 1993 | | Private investor and real estate consultant; Capitol Entertainment Management Company (video franchise), Vice Chairman | | Atlantic Coast Tan (tanning salons), Vice Chairman (until 2007); Texas Donuts (donut franchise), Vice Chairman (until 2010) |
Michael Hegarty
(age 67) | | Trustee | | December 2004 | | Private investor | | N/A |
John P. Kavanaugh
(age 57) | | Trustee | | January 2009 | | Private investor; The Hanover Insurance Group, Inc., Vice President and Chief Investment Officer (until 2006); Allmerica Investment Trust, Allmerica Securities Trust and Opus Investment Trust (investment companies), Chairman, President and Trustee (until 2006) | | N/A |
J. Dale Sherratt
(age 73) | | Trustee | | June 1989 | | Insight Resources, Inc. (acquisition planning specialists), President; Wellfleet Investments (investor in health care companies), Managing General Partner | | N/A |
Laurie J. Thomsen
(age 54) | | Trustee | | March 2005 | | Private investor; New Profit, Inc. (venture philanthropy), Executive Partner (until 2010) | | The Travelers Companies (insurance), Director |
Robert W. Uek
(age 70) | | Trustee | | January 2006 | | Consultant to investment company industry | | N/A |
69
Trustees and Officers – continued
| | | | | | | | |
Name, Age | | Position(s) Held with Fund | | Trustee/Officer
Since (h) | | Principal Occupations
During the Past Five Years | | Other Directorships (j) |
| OFFICERS |
John M. Corcoran (k)
(age 46) | | President | | October 2008 | | Massachusetts Financial Services Company, Senior Vice President (since October 2008); State Street Bank and Trust (financial services provider), Senior Vice President, (until September 2008) | | N/A |
Christopher R.
Bohane (k)
(age 38) | | Assistant Secretary and Assistant Clerk | | July 2005 | | Massachusetts Financial Services Company, Vice President and Senior Counsel | | N/A |
Kino Clark (k)
(age 43) | | Assistant Treasurer | | January 2012 | | Massachusetts Financial Services Company, Vice President | | N/A |
Ethan D. Corey (k)
(age 48) | | Assistant
Secretary and Assistant Clerk | | July 2005 | | Massachusetts Financial Services Company, Senior Vice President and Associate General Counsel | | N/A |
David L. DiLorenzo (k)
(age 43) | | Treasurer | | July 2005 | | Massachusetts Financial Services Company,
Senior Vice President | | N/A |
70
Trustees and Officers – continued
| | | | | | | | |
Name, Age | | Position(s) Held with Fund | | Trustee/Officer
Since (h) | | Principal Occupations
During the Past Five Years | | Other Directorships (j) |
Robyn L. Griffin
(age 36) | | Assistant Independent Chief Compliance Officer | | August 2008 | | Griffin Compliance LLC (provider of compliance services), Principal (since August 2008); State Street Corporation (financial services provider), Mutual Fund Administration Assistant Vice President (October 2006 – July 2008); Liberty Mutual Group (insurance), Personal Market Assistant Controller (April 2006 – October 2006); Deloitte & Touche LLP (professional services firm). | | N/A |
Brian E.
Langenfeld (k)
(age 39) | | Assistant Secretary and Assistant Clerk | | June 2006 | | Massachusetts Financial Services Company, Vice President and Senior Counsel | | N/A |
Ellen Moynihan (k)
(age 54) | | Assistant Treasurer | | April 1997 | | Massachusetts Financial Services Company, Senior Vice President | | N/A |
Susan S. Newton (k)
(age 62) | | Assistant Secretary and Assistant Clerk | | May 2005 | | Massachusetts Financial Services Company, Senior Vice President and Associate General Counsel | | N/A |
Susan A. Pereira (k)
(age 41) | | Assistant Secretary and Assistant Clerk | | July 2005 | | Massachusetts Financial Services Company, Vice President and Senior Counsel | | N/A |
Mark N. Polebaum (k)
(age 59) | | Secretary and Clerk | | January 2006 | | Massachusetts Financial Services Company, Executive Vice President, General Counsel and Secretary | | N/A |
71
Trustees and Officers – continued
| | | | | | | | |
Name, Age | | Position(s) Held with Fund | | Trustee/Officer
Since (h) | | Principal Occupations
During the Past Five Years | | Other Directorships (j) |
Frank L. Tarantino
(age 68) | | Independent Chief Compliance Officer | | June 2004 | | Tarantino LLC (provider of compliance services), Principal | | N/A |
Richard S. Weitzel (k)
(age 41) | | Assistant Secretary and Assistant Clerk | | October 2007 | | Massachusetts Financial Services Company, Senior Vice President and Associate General Counsel | | N/A |
James O. Yost (k)
(age 51) | | Deputy Treasurer | | September 1990 | | Massachusetts Financial Services Company, Senior Vice President | | N/A |
| (h) | Date first appointed to serve as Trustee/officer of an MFS fund. Each Trustee has served continuously since appointment unless indicated otherwise. For the period from December 15, 2004 until February 22, 2005, Mr. Manning served as Advisory Trustee. For the period October 2008, until January 2012, Mr. Corcoran served as Treasurer of the Funds. Prior to January 2012, Messrs. DiLorenzo and Yost served as Assistant Treasurers of the Funds. |
| (j) | Directorships or trusteeships of companies required to report to the Securities and Exchange Commission (i.e., “public companies”). |
| (k) | “Interested person” of the Trust within the meaning of the Investment Company Act of 1940 (referred to as the 1940 Act), which is the principal federal law governing investment companies like the fund, as a result of position with MFS. The address of MFS is 500 Boylston Street, Boston, Massachusetts 02116. |
Each Trustee has been elected by shareholders and each Trustee and officer holds office until his or her successor is chosen and qualified or until his or her earlier death, resignation, retirement or removal. The Trust does not hold annual meetings for the purpose of electing Trustees, and Trustees are not elected for fixed terms. Messrs. Butler, Kavanaugh, Uek and Ms. Thomsen are members of the Trust’s Audit Committee.
Each of the Fund’s Trustees and officers holds comparable positions with certain other funds of which MFS or a subsidiary is the investment adviser or distributor, and, in the case of the officers, with certain affiliates of MFS. As of January 1, 2012, the Trustees served as board members of 131 funds within the MFS Family of Funds.
72
Trustees and Officers – continued
The Statement of Additional Information for the Fund includes further information about the Trustees and is available without charge upon request by calling 1-800-225-2606.
| | |
| Investment Adviser | | Custodian |
Massachusetts Financial Services Company
500 Boylston Street, Boston, MA 02116-3741 | | JPMorgan Chase Bank One Chase Manhattan Plaza, New York, NY 10081 |
| Distributor | | Independent Registered Public Accounting Firm |
MFS Fund Distributors, Inc.
500 Boylston Street, Boston, MA 02116-3741 | | Ernst & Young LLP 200 Clarendon Street, Boston, MA 02116 |
| Portfolio Managers | | |
William Adams David Cole Richard Gable Matthew Ryan Jonathan Sage Geoffrey Schechter James Swanson | | |
73
BOARD REVIEW OF INVESTMENT ADVISORY AGREEMENT
A discussion regarding the Board’s most recent review and renewal of the fund’s Investment Advisory Agreement with MFS is available by clicking on the fund’s name under “Mutual Funds” in the “Products and Performance” section of the MFS Web site (mfs.com).
PROXY VOTING POLICIES AND INFORMATION
A general description of the MFS funds’ proxy voting policies and procedures is available without charge, upon request, by calling
1-800-225-2606, by visiting the Proxy Voting section of mfs.com or by visiting the SEC’s Web site at http://www.sec.gov.
Information regarding how the fund voted proxies relating to portfolio securities during the most recent twelve-month period ended June 30 is available without charge by visiting the Proxy Voting section of mfs.com or by visiting the SEC’s Web site at http://www.sec.gov.
QUARTERLY PORTFOLIO DISCLOSURE
The fund will file a complete schedule of portfolio holdings with the Securities and Exchange Commission (the Commission) for the first and third quarters of each fiscal year on Form N-Q. A shareholder can obtain the quarterly portfolio holdings report at mfs.com. The fund’s Form N-Q is also available on the EDGAR database on the Commission’s Internet Web site at http://www.sec.gov, and may be reviewed and copied at the:
Public Reference Room
Securities and Exchange Commission
100 F Street, NE, Room 1580
Washington, D.C. 20549
Information on the operation of the Public Reference Room may be obtained by calling the Commission at 1-800-SEC-0330. Copies of the fund’s Form N-Q also may be obtained, upon payment of a duplicating fee, by electronic request at the following e-mail address: publicinfo@sec.gov or by writing the Public Reference Section at the above address.
FURTHER INFORMATION
From time to time, MFS may post important information about the fund or the MFS funds on the MFS web site (mfs.com). This information is available by visiting the “News & Commentary” section of mfs.com or by clicking on the fund’s name under “Mutual Funds” in the “Products and Performance” section of mfs.com.
74
FEDERAL TAX INFORMATION (unaudited)
The fund will notify shareholders of amounts for use in preparing 2012 income tax forms in January 2013. The following information is provided pursuant to provisions of the Internal Revenue Code.
The fund designates the maximum amount allowable as qualified dividend income eligible for the 15% tax rate.
For corporate shareholders, 17.04% of the ordinary income dividends paid during the fiscal year qualify for the corporate dividends received deduction.
75
rev. 3/11
| | | | |
| FACTS | | WHAT DOES MFS DO WITH YOUR PERSONAL INFORMATION? | |  |
| | |
| Why? | | Financial companies choose how they share your personal information. Federal law gives consumers the right to limit some but not all sharing. Federal law also requires us to tell you how we collect, share, and protect your personal information. Please read this notice carefully to understand what we do. |
| | |
| What? | | The types of personal information we collect and share depend on the product or service you have with us. This information can include: •Social Security number and account balances •Account transactions and transaction history •Checking account information and wire transfer instructions When you are no longer our customer, we continue to share your information as described in this notice. |
| | |
| How? | | All financial companies need to share customers’ personal information to run their everyday business. In the section below, we list the reasons financial companies can share their customers’ personal information; the reasons MFS chooses to share; and whether you can limit this sharing. |
| | | | |
| Reasons we can share your personal information | | Does MFS share? | | Can you limit
this sharing? |
For our everyday business purposes – such as to process your transactions, maintain your account(s), respond to court orders and legal investigations, or report to credit bureaus | | Yes | | No |
For our marketing purposes – to offer our products and services to you | | No | | We don’t share |
| For joint marketing with other financial companies | | No | | We don’t share |
For our affiliates’ everyday business purposes – information about your transactions and experiences | | No | | We don’t share |
For our affiliates’ everyday business purposes – information about your creditworthiness | | No | | We don’t share |
| For nonaffiliates to market to you | | No | | We don’t share |
| | |
| Questions? | | Call 800-225-2606 or go to mfs.com. |
76
| | |
| Who we are |
| Who is providing this notice? | | MFS Funds, MFS Investment Management, MFS Institutional Advisors, Inc., MFS Fund Distributors, Inc., MFS Heritage Trust Company, and MFS Service Center, Inc. |
| | |
| What we do |
| How does MFS protect my personal information? | | To protect your personal information from unauthorized access and use, we use security measures that comply with federal law. These measures include procedural, electronic, and physical safeguards for the protection of the personal information we collect about you. |
How does MFS
collect my personal information? | | We collect your personal information, for example, when you •open an account or provide account information •direct us to buy securities or direct us to sell your securities •make a wire transfer We also collect your personal information from others, such as credit bureaus, affiliates and other companies. |
| Why can’t I limit all sharing? | | Federal law gives you the right to limit only •sharing for affiliates’ everyday business purposes – information about your creditworthiness •affiliates from using your information to market to you •sharing for nonaffiliates to market to you State laws and individual companies may give you additional rights to limit sharing. |
| | |
| Definitions |
| Affiliates | | Companies related by common ownership or control. They can be financial and nonfinancial companies. •MFS does not share personal information with affiliates, except for everyday business purposes as described on page one of this notice. |
| Nonaffiliates | | Companies not related by common ownership or control. They can be financial and nonfinancial companies. •MFS does not share with nonaffiliates so they can market to you. |
| Joint Marketing | | A formal agreement between nonaffiliated financial companies that together market financial products or services to you. •MFS doesn’t jointly market. |
| | |
| Other important information |
| If you own an MFS product or receive an MFS service in the name of a third party such as a bank or broker-dealer, their privacy policy may apply to you instead of ours. |
77
Save paper with eDelivery.
MFS® will send you prospectuses, reports, and proxies directly via e-mail so you will get information faster with less mailbox clutter.
To sign up:
1. Go to mfs.com.
2. Log in via MFS® Access.
3. Select eDelivery.
If you own your MFS fund shares through a financial institution or a retirement plan, MFS® TALK, MFS® Access, or eDelivery may not be available to you.

Web site
mfs.com
MFS TALK
1-800-637-8255
24 hours a day
Account service and literature
Shareholders
1-800-225-2606
Financial advisors
1-800-343-2829
Retirement plan services
1-800-637-1255
Mailing address
MFS Service Center, Inc.
P.O. Box 55824
Boston, MA 02205-5824
Overnight mail
MFS Service Center, Inc.
c/o Boston Financial Data Services
30 Dan Road
Canton, MA 02021-2809

MFS® Government Securities Fund

ANNUAL REPORT
February 29, 2012
MFG-ANN
MFS® GOVERNMENT SECURITIES FUND
SIPC Contact Information: You may obtain information about the Securities Investor Protection Corporation (“SIPC”), including the SIPC Brochure, by contacting SIPC either by telephone (1-202-371-8300) or by accessing SIPC’s web site address (www.sipc.org).
The report is prepared for the general information of shareholders.
It is authorized for distribution to prospective investors only when preceded or accompanied by a current prospectus.
NOT FDIC INSURED Ÿ MAY LOSE VALUE Ÿ NO BANK GUARANTEE

LETTER FROM THE CHAIRMAN AND CEO
Dear Shareholders:
We are indeed living through some volatile times. Economic uncertainty is everywhere, as it seems no place in the world has been unmoved by crisis. Over the past year, we have seen a devastating earthquake and tsunami that have led to disruptions in the Japanese markets and supply chains. Protests have changed the face of the Middle East and left in their wake lingering tensions and questions about oil supplies. We have seen debt limits tested in Europe and the United States and policymakers grappling to craft often unpopular monetary and fiscal responses as consumers and businesses struggle with what appears to be a slowing global economy. And now, as the US economy begins to regain its footing, we see the economies of the eurozone heading toward recession as the region’s leaders continue to address sovereign debt crises.
When markets become volatile, managing risk becomes a top priority for investors and their advisors. At MFS® risk management is foremost in our minds in all market climates. Our analysts and portfolio managers keep risks firmly in mind when evaluating securities. Additionally, we have a team of quantitative analysts that measures and assesses the risk profiles of our portfolios and securities on an ongoing basis. The chief investment risk officer, who oversees the team, reports directly to the firm’s president and chief investment officer so the risk associated with each portfolio can be assessed objectively and independently.
As always, we continue to be mindful of the many economic challenges faced at the local, national, and international levels. It is in times such as these that we want to remind investors of the merits of maintaining a long-term view, adhering to basic investing principles such as asset allocation and diversification, and working closely with their advisors to research and identify appropriate investment opportunities.
Respectfully,

Robert J. Manning
Chairman and Chief Executive Officer
MFS Investment Management®
April 13, 2012
The opinions expressed in this letter are subject to change, may not be relied upon for investment advice, and no forecasts can be guaranteed.
1
PORTFOLIO COMPOSITION
Portfolio structure (i)
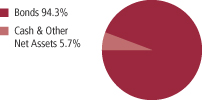
| | | | |
| Fixed income sectors (i) | | | | |
| U.S. Treasury Securities | | | 45.4% | |
| Mortgage-Backed Securities | | | 39.0% | |
| U.S. Government Agencies | | | 7.4% | |
| Commercial Mortgage-Backed Securities | | | 1.3% | |
| High Grade Corporates | | | 1.0% | |
| Municipal Bonds | | | 0.2% | |
| Composition including fixed income credit quality (a)(i) | |
| AAA | | | 1.0% | |
| AA | | | 1.1% | |
| A | | | 0.1% | |
| BBB | | | 0.3% | |
| U.S. Government | | | 46.3% | |
| Federal Agencies | | | 46.4% | |
| Not Rated | | | (0.9)% | |
| Cash & Other | | | 5.7% | |
| |
| Portfolio facts (i) | | | | |
| Average Duration (d) | | | 4.1 | |
| Average Effective Maturity (m) | | | 5.8 yrs. | |
| (a) | For all securities other than those specifically described below, ratings are assigned to underlying securities utilizing ratings from Moody’s, Fitch, and Standard & Poor’s rating agencies and applying the following hierarchy: If all three agencies provide a rating, the middle rating (after dropping the highest and lowest ratings) is assigned; if two of the three agencies rate a security, the lower of the two is assigned. Ratings are shown in the S&P and Fitch scale (e.g., AAA). All ratings are subject to change. U.S. Government includes securities issued by the U.S. Department of the Treasury. Federal Agencies includes rated and unrated U.S. Agency fixed-income securities, U.S. Agency mortgage-backed securities, and collateralized mortgage obligations of U.S. Agency mortgage-backed securities. Not Rated includes fixed income securities, including fixed income futures, which have not been rated by any rating agency. Cash & Other includes cash, other assets less liabilities, offsets to derivative positions, and short-term securities. |
| | The fund may not hold all of these instruments. The fund is not rated by these agencies. |
| (d) | Duration is a measure of how much a bond’s price is likely to fluctuate with general changes in interest rates, e.g., if rates rise 1.00%, a bond with a 5-year duration is likely to lose about 5.00% of its value due to the interest rate move. |
| (i) | For purposes of this presentation, the components include the market value of securities, and reflect the impact of the equivalent exposure of derivative positions, if any. These amounts may be negative from time to time. The bond component will include any accrued interest amounts. Equivalent exposure is a calculated amount that translates the derivative position into a reasonable approximation of the amount of the underlying asset that the portfolio would have to hold at a given point in time to have the same price sensitivity that results from the portfolio’s ownership of the derivative contract. When dealing with derivatives, equivalent exposure is a more representative measure of the potential impact of a position on portfolio performance than market value. Where the fund holds convertible bonds, these are treated as part of the equity portion of the portfolio. |
2
Portfolio Composition – continued
| (m) | In determining an instrument’s effective maturity for purposes of calculating the fund’s dollar-weighted average effective maturity, MFS uses the instrument’s stated maturity or, if applicable, an earlier date on which MFS believes it is probable that a maturity-shortening device (such as a put, pre-refunding or prepayment) will cause the instrument to be repaid. Such an earlier date can be substantially shorter than the instrument’s stated maturity. |
Percentages are based on net assets as of 2/29/12.
The portfolio is actively managed and current holdings may be different.
3
MANAGEMENT REVIEW
Summary of Results
For the twelve months ended February 29, 2012, Class A shares of the MFS Government Securities Fund (the “fund”) provided a total return of 7.04%, at net asset value. This compares with a return of 7.73% for the fund’s benchmark, the Barclays Capital U.S. Government/Mortgage Bond Index.
Market Environment
Prior to the beginning of the reporting period, looser U.S. monetary and fiscal policy fostered a sharp rebound in market risk sentiment. By the beginning of the period, global macroeconomic conditions had begun to weaken and renewed concerns surrounding eurozone sovereign debt arose, causing the recovery in asset valuations to plateau.
During the middle of the reporting period, worries about U.S. sovereign debt default and the long-term sustainability of the trend in U.S. fiscal policy resulted in one agency downgrading U.S. credit quality. Amidst this turmoil, global equity markets declined sharply and credit spreads widened. At the same time, global consumer and producer sentiment indicators fell precipitously and highly-rated sovereign bond yields hit multi-decade lows.
Late in the period, however, additional liquidity from the U.S. Federal Reserve (in the form of “Operation Twist”) and the European Central Bank (in the form of 3-year, Longer Term Refinancing Operations, or LTROs), coupled with improved global macroeconomic conditions, ushered in improved market dynamics.
Factors Affecting Performance
Relative to the Barclays Capital U.S. Government/Mortgage Bond Index, the fund’s lesser exposure to Government National Mortgage Association (Ginnie Mae) mortgage-backed securities held back relative performance as these bonds outperformed the benchmark over the reporting period.
The fund’s yield curve (y) positioning, particularly the fund’s greater exposure to the long end (centered around maturities of 30 or more years) of the yield curve, boosted relative performance as the yield curve flattened throughout the period.
4
Management Review – continued
The fund’s lesser exposure to Federal National Mortgage Association (Fannie Mae) and Federal Home Loan Mortgage Corporation (Freddie Mac) mortgage-backed securities also boosted relative results as these bonds underperformed the benchmark over the reporting period.
Respectfully,
Geoffrey Schechter
Portfolio Manager
| (y) | A yield curve graphically depicts the yields of different maturity bonds of the same credit quality and type; a normal yield curve is upward sloping, with short-term rates lower than long-term rates. |
The views expressed in this report are those of the portfolio manager only through the end of the period of the report as stated on the cover and do not necessarily reflect the views of MFS or any other person in the MFS organization. These views are subject to change at any time based on market or other conditions, and MFS disclaims any responsibility to update such views. These views may not be relied upon as investment advice or an indication of trading intent on behalf of any MFS portfolio. References to specific securities are not recommendations of such securities, and may not be representative of any MFS portfolio’s current or future investments.
5
PERFORMANCE SUMMARY THROUGH 2/29/12
The following chart illustrates a representative class of the fund’s historical performance in comparison to its benchmark(s). Performance results include the deduction of the maximum applicable sales charge and reflect the percentage change in net asset value, including reinvestment of dividends and capital gains distributions. The performance of other share classes will be greater than or less than that of the class depicted below. Benchmarks are unmanaged and may not be invested in directly. Benchmark returns do not reflect sales charges, commissions or expenses. (See Notes to Performance Summary.)
Performance data shown represents past performance and is no guarantee of future results. Investment return and principal value fluctuate so your shares, when sold, may be worth more or less than the original cost; current performance may be lower or higher than quoted. The performance shown does not reflect the deduction of taxes, if any, that a shareholder would pay on fund distributions or the redemption of fund shares.
Growth of a Hypothetical $10,000 Investment
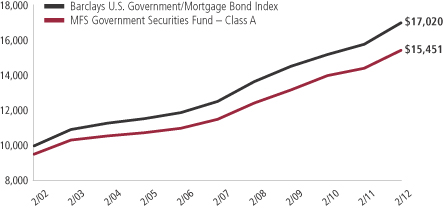
6
Performance Summary – continued
Total Returns through 2/29/12
Average annual without sales charge
| | | | | | | | | | | | | | |
| | | Share class | | Class inception date | | 1-yr | | 5-yr | | 10-yr | | Life (t) | | |
| | | A | | 7/25/84 | | 7.04% | | 6.04% | | 4.96% | | N/A | | |
| | | B | | 8/30/93 | | 6.35% | | 5.25% | | 4.21% | | N/A | | |
| | | C | | 4/01/96 | | 6.33% | | 5.25% | | 4.20% | | N/A | | |
| | | I | | 1/02/97 | | 7.41% | | 6.30% | | 5.25% | | N/A | | |
| | | R1 | | 4/01/05 | | 6.35% | | 5.21% | | N/A | | 4.60% | | |
| | | R2 | | 10/31/03 | | 6.88% | | 5.73% | | N/A | | 4.64% | | |
| | | R3 | | 4/01/05 | | 7.14% | | 6.01% | | N/A | | 5.37% | | |
| | | R4 | | 4/01/05 | | 7.40% | | 6.24% | | N/A | | 5.67% | | |
| Comparative benchmark | | | | | | | | | | |
| | | Barclays Capital U.S. Government/
Mortgage Bond Index (f) | | 7.73% | | 6.30% | | 5.46% | | N/A | | |
| Average annual with sales charge | | | | | | | | | | |
| | | A
With Initial Sales Charge (4.75%) | | 1.95% | | 5.01% | | 4.45% | | N/A | | |
| | | B
With CDSC (Declining over six years from 4% to 0%) (x) | | 2.35% | | 4.93% | | 4.21% | | N/A | | |
| | | C
With CDSC (1% for 12 months) (x) | | 5.33% | | 5.25% | | 4.20% | | N/A | | |
Class I, R1, R2, R3, and R4 shares do not have a sales charge.
CDSC – Contingent Deferred Sales Charge.
| (f) | Source: FactSet Research Systems Inc. |
| (t) | For the period from the class inception date through the stated period end (for those share classes with less than 10 years of performance history). No comparative benchmark performance information is provided for “life” periods. (See Notes to Performance Summary.) |
| (x) | Assuming redemption at the end of the applicable period. |
Benchmark Definition
Barclays Capital U.S. Government/Mortgage Bond Index – measures debt issued by the U.S. Government, and its agencies, as well as mortgage-backed pass-through securities of Ginnie Mae (GNMA), Fannie Mae (FNMA), and Freddie Mac (FHLMC).
It is not possible to invest directly in an index.
Notes to Performance Summary
Average annual total return represents the average annual change in value for each share class for the periods presented. Life returns are presented where the share class has less than 10 years of performance history and represent the
7
Performance Summary – continued
average annual total return from the class inception date to the stated period end date. As the fund’s share classes may have different inception dates, the life returns may represent different time periods and may not be comparable. As a result, no comparative benchmark performance information is provided for life periods.
Performance results reflect any applicable expense subsidies and waivers in effect during the periods shown. Without such subsidies and waivers the fund’s performance results would be less favorable. Please see the prospectus and financial statements for complete details.
Performance results do not include adjustments made for financial reporting purposes in accordance with U.S. generally accepted accounting principles and may differ from amounts reported in the financial highlights.
From time to time the fund may receive proceeds from litigation settlements, without which performance would be lower.
8
EXPENSE TABLE
Fund expenses borne by the shareholders during the period, September 1, 2011 through February 29, 2012
As a shareholder of the fund, you incur two types of costs: (1) transaction costs, including sales charges (loads) on certain purchase or redemption payments, and (2) ongoing costs, including management fees; distribution and service (12b-1) fees; and other fund expenses. This example is intended to help you understand your ongoing costs (in dollars) of investing in the fund and to compare these costs with the ongoing costs of investing in other mutual funds.
The example is based on an investment of $1,000 invested at the beginning of the period and held for the entire period September 1, 2011 through February 29, 2012.
The expenses include the payment of a portion of the transfer-agent-related expenses of MFS funds that invest in the fund. For further information, please see the Notes to the Financial Statements.
Actual Expenses
The first line for each share class in the following table provides information about actual account values and actual expenses. You may use the information in this line, together with the amount you invested, to estimate the expenses that you paid over the period. Simply divide your account value by $1,000 (for example, an $8,600 account value divided by $1,000 = 8.6), then multiply the result by the number in the first line under the heading entitled “Expenses
Paid During Period” to estimate the expenses you paid on your account during this period.
Hypothetical Example for Comparison Purposes
The second line for each share class in the following table provides information about hypothetical account values and hypothetical expenses based on the fund’s actual expense ratio and an assumed rate of return of 5% per year before expenses, which is not the fund’s actual return. The hypothetical account values and expenses may not be used to estimate the actual ending account balance or expenses you paid for the period. You may use this information to compare the ongoing costs of investing in the fund and other funds. To do so, compare this 5% hypothetical example with the 5% hypothetical examples that appear in the shareholder reports of the other funds.
Please note that the expenses shown in the table are meant to highlight your ongoing costs only and do not reflect any transactional costs, such as sales charges (loads). Therefore, the second line for each share class in the table is useful in comparing ongoing costs only, and will not help you determine the
9
Expense Table – continued
relative total costs of owning different funds. In addition, if these transactional costs were included, your costs would have been higher.
| | | | | | | | | | | | | | | | | | |
Share
Class | | | | Annualized
Expense
Ratio | | | Beginning
Account Value
9/01/11 | | | Ending
Account Value
2/29/12 | | | Expenses
Paid During
Period (p)
9/01/11-2/29/12 | |
| A | | Actual | | | 0.86% | | | | $1,000.00 | | | | $1,017.29 | | | | $4.31 | |
| | Hypothetical (h) | | | 0.86% | | | | $1,000.00 | | | | $1,020.59 | | | | $4.32 | |
| B | | Actual | | | 1.61% | | | | $1,000.00 | | | | $1,013.50 | | | | $8.06 | |
| | Hypothetical (h) | | | 1.61% | | | | $1,000.00 | | | | $1,016.86 | | | | $8.07 | |
| C | | Actual | | | 1.61% | | | | $1,000.00 | | | | $1,014.45 | | | | $8.06 | |
| | Hypothetical (h) | | | 1.61% | | | | $1,000.00 | | | | $1,016.86 | | | | $8.07 | |
| I | | Actual | | | 0.60% | | | | $1,000.00 | | | | $1,018.56 | | | | $3.01 | |
| | Hypothetical (h) | | | 0.60% | | | | $1,000.00 | | | | $1,021.88 | | | | $3.02 | |
| R1 | | Actual | | | 1.61% | | | | $1,000.00 | | | | $1,013.50 | | | | $8.06 | |
| | Hypothetical (h) | | | 1.61% | | | | $1,000.00 | | | | $1,016.86 | | | | $8.07 | |
| R2 | | Actual | | | 1.11% | | | | $1,000.00 | | | | $1,016.03 | | | | $5.56 | |
| | Hypothetical (h) | | | 1.11% | | | | $1,000.00 | | | | $1,019.34 | | | | $5.57 | |
| R3 | | Actual | | | 0.86% | | | | $1,000.00 | | | | $1,017.29 | | | | $4.31 | |
| | Hypothetical (h) | | | 0.86% | | | | $1,000.00 | | | | $1,020.59 | | | | $4.32 | |
| R4 | | Actual | | | 0.60% | | | | $1,000.00 | | | | $1,019.53 | | | | $3.01 | |
| | Hypothetical (h) | | | 0.60% | | | | $1,000.00 | | | | $1,021.88 | | | | $3.02 | |
| (h) | 5% class return per year before expenses. |
| (p) | Expenses paid are equal to each class’ annualized expense ratio, as shown above, multiplied by the average account value over the period, multiplied by the number of days in the period, divided by the number of days in the year. Expenses paid do not include any applicable sales charges (loads). If these transaction costs had been included, your costs would have been higher. |
10
PORTFOLIO OF INVESTMENTS
2/29/12
The Portfolio of Investments is a complete list of all securities owned by your fund. It is categorized by broad-based asset classes.
| | | | | | | | |
| Bonds - 94.7% | | | | | | | | |
| Issuer | | Shares/Par | | | Value ($) | |
| | | | | | | | |
| Agency - Other - 4.9% | | | | | | | | |
| Financing Corp., 10.7%, 2017 | | $ | 14,360,000 | | | $ | 21,241,254 | |
| Financing Corp., 9.4%, 2018 | | | 11,750,000 | | | | 16,704,540 | |
| Financing Corp., 9.8%, 2018 | | | 14,975,000 | | | | 21,920,600 | |
| Financing Corp., 10.35%, 2018 | | | 15,165,000 | | | | 22,956,913 | |
| Financing Corp., STRIPS, 0%, 2017 | | | 18,780,000 | | | | 17,067,170 | |
| | | | | | | | |
| | | | | | | $ | 99,890,477 | |
| Asset-Backed & Securitized - 1.3% | | | | | | | | |
| Citigroup/Deutsche Bank Commercial Mortgage Trust, 5.322%, 2049 | | $ | 4,260,000 | | | $ | 4,675,359 | |
| Commercial Mortgage Pass-Through Certificates, “A4”, 5.306%, 2046 | | | 9,314,763 | | | | 10,432,646 | |
| JPMorgan Chase Commercial Mortgage Securities Corp., FRN, 5.816%, 2049 | | | 5,431,290 | | | | 5,996,584 | |
| JPMorgan Chase Commercial Mortgage Securities Corp., FRN, 5.984%, 2051 | | | 5,341,614 | | | | 5,749,644 | |
| | | | | | | | |
| | | | | | | $ | 26,854,233 | |
| Local Authorities - 1.0% | | | | | | | | |
| Nashville & Davidson County, TN, Metropolitan Government Convention Center Authority (Build America Bonds), 6.731%, 2043 | | $ | 4,855,000 | | | $ | 5,831,389 | |
| Port Authority NY & NJ (168th Series), 4.926%, 2051 | | | 7,130,000 | | | | 7,669,456 | |
| San Francisco, CA, City & County Public Utilities Commission, Water Rev. (Build America Bonds), 6%, 2040 | | | 840,000 | | | | 1,007,656 | |
| State of California (Build America Bonds), 7.625%, 2040 | | | 1,225,000 | | | | 1,627,756 | |
| University of California Rev. (Build America Bonds), 5.77%, 2043 | | | 2,750,000 | | | | 3,321,753 | |
| | | | | | | | |
| | | | | | | $ | 19,458,010 | |
| Mortgage-Backed - 38.9% | | | | | | | | |
| Fannie Mae, 4.73%, 2012 | | $ | 2,542,222 | | | $ | 2,573,476 | |
| Fannie Mae, 4.77%, 2012 - 2014 | | | 1,998,230 | | | | 2,092,494 | |
| Fannie Mae, 4.876%, 2012 | | | 702,794 | | | | 704,857 | |
| Fannie Mae, 6.468%, 2012 | | | 353,502 | | | | 353,258 | |
| Fannie Mae, 4.374%, 2013 | | | 2,313,980 | | | | 2,380,158 | |
| Fannie Mae, 4.469%, 2013 | | | 1,559,208 | | | | 1,593,982 | |
| Fannie Mae, 4.518%, 2013 | | | 424,724 | | | | 432,431 | |
| Fannie Mae, 4.543%, 2013 | | | 2,497,342 | | | | 2,550,303 | |
| Fannie Mae, 4.845%, 2013 | | | 3,444,839 | | | | 3,553,126 | |
11
Portfolio of Investments – continued
| | | | | | | | |
| Issuer | | Shares/Par | | | Value ($) | |
| | | | | | | | |
| Bonds - continued | | | | | | | | |
| Mortgage-Backed - continued | | | | | | | | |
| Fannie Mae, 5%, 2013 - 2041 | | $ | 80,288,771 | | | $ | 86,714,815 | |
| Fannie Mae, 5.06%, 2013 - 2017 | | | 3,183,008 | | | | 3,448,233 | |
| Fannie Mae, 5.159%, 2013 | | | 1,975,804 | | | | 2,063,044 | |
| Fannie Mae, 5.37%, 2013 | | | 1,832,393 | | | | 1,878,064 | |
| Fannie Mae, 4.6%, 2014 | | | 1,676,514 | | | | 1,764,408 | |
| Fannie Mae, 4.61%, 2014 | | | 5,465,351 | | | | 5,773,548 | |
| Fannie Mae, 4.715%, 2014 | | | 2,032,804 | | | | 2,150,727 | |
| Fannie Mae, 4.82%, 2014 - 2015 | | | 4,861,038 | | | | 5,250,921 | |
| Fannie Mae, 4.839%, 2014 | | | 7,859,537 | | | | 8,336,390 | |
| Fannie Mae, 4.92%, 2014 | | | 542,703 | | | | 567,379 | |
| Fannie Mae, 4.935%, 2014 | | | 727,036 | | | | 763,650 | |
| Fannie Mae, 5.035%, 2014 | | | 5,098,898 | | | | 5,292,646 | |
| Fannie Mae, 5.1%, 2014 | | | 2,054,655 | | | | 2,203,853 | |
| Fannie Mae, 4.56%, 2015 | | | 2,172,259 | | | | 2,340,605 | |
| Fannie Mae, 4.564%, 2015 | | | 701,822 | | | | 747,480 | |
| Fannie Mae, 4.62%, 2015 | | | 3,103,795 | | | | 3,335,686 | |
| Fannie Mae, 4.665%, 2015 | | | 1,468,478 | | | | 1,584,788 | |
| Fannie Mae, 4.69%, 2015 | | | 1,196,503 | | | | 1,289,513 | |
| Fannie Mae, 4.7%, 2015 | | | 2,037,761 | | | | 2,194,249 | |
| Fannie Mae, 4.74%, 2015 | | | 1,669,690 | | | | 1,809,009 | |
| Fannie Mae, 4.78%, 2015 | | | 1,812,322 | | | | 1,975,078 | |
| Fannie Mae, 4.79%, 2015 | | | 1,876,518 | | | | 2,044,478 | |
| Fannie Mae, 4.81%, 2015 | | | 1,743,148 | | | | 1,899,971 | |
| Fannie Mae, 4.815%, 2015 | | | 1,921,885 | | | | 2,087,979 | |
| Fannie Mae, 4.85%, 2015 | | | 1,343,014 | | | | 1,449,571 | |
| Fannie Mae, 4.87%, 2015 | | | 1,279,828 | | | | 1,388,290 | |
| Fannie Mae, 4.89%, 2015 | | | 1,185,490 | | | | 1,281,891 | |
| Fannie Mae, 4.925%, 2015 | | | 3,348,888 | | | | 3,666,645 | |
| Fannie Mae, 5.27%, 2015 - 2019 | | | 1,678,656 | | | | 1,811,427 | |
| Fannie Mae, 5.471%, 2015 | | | 5,221,756 | | | | 5,789,258 | |
| Fannie Mae, 5.09%, 2016 | | | 600,000 | | | | 667,618 | |
| Fannie Mae, 5.249%, 2016 - 2019 | | | 2,022,089 | | | | 2,252,326 | |
| Fannie Mae, 5.324%, 2016 | | | 1,118,187 | | | | 1,249,232 | |
| Fannie Mae, 5.35%, 2016 | | | 1,771,263 | | | | 1,982,925 | |
| Fannie Mae, 5.445%, 2016 | | | 640,682 | | | | 710,900 | |
| Fannie Mae, 5.448%, 2016 | | | 1,327,411 | | | | 1,490,433 | |
| Fannie Mae, 5.604%, 2016 | | | 4,210,671 | | | | 4,763,376 | |
| Fannie Mae, 5.631%, 2016 | | | 690,000 | | | | 784,178 | |
| Fannie Mae, 5.915%, 2016 | | | 3,663,084 | | | | 4,180,898 | |
| Fannie Mae, 6.5%, 2016 - 2037 | | | 14,432,989 | | | | 16,396,611 | |
| Fannie Mae, 3.308%, 2017 | | | 4,933,485 | | | | 5,298,587 | |
| Fannie Mae, 5.05%, 2017 | | | 2,288,368 | | | | 2,549,861 | |
12
Portfolio of Investments – continued
| | | | | | | | |
| Issuer | | Shares/Par | | | Value ($) | |
| | | | | | | | |
| Bonds - continued | | | | | | | | |
| Mortgage-Backed - continued | | | | | | | | |
| Fannie Mae, 5.155%, 2017 | | $ | 4,382,291 | | | $ | 4,712,796 | |
| Fannie Mae, 5.3%, 2017 | | | 747,448 | | | | 838,153 | |
| Fannie Mae, 5.38%, 2017 | | | 1,974,080 | | | | 2,219,872 | |
| Fannie Mae, 5.5%, 2017 - 2038 | | | 107,070,364 | | | | 116,956,490 | |
| Fannie Mae, 5.505%, 2017 | | | 1,450,517 | | | | 1,633,709 | |
| Fannie Mae, 6%, 2017 - 2037 | | | 35,585,084 | | | | 39,365,916 | |
| Fannie Mae, 2.578%, 2018 | | | 9,100,000 | | | | 9,410,838 | |
| Fannie Mae, 3.926%, 2018 | | | 1,725,896 | | | | 1,884,916 | |
| Fannie Mae, 4.04%, 2018 | | | 1,644,189 | | | | 1,801,592 | |
| Fannie Mae, 4.123%, 2018 | | | 1,600,000 | | | | 1,763,402 | |
| Fannie Mae, 4.133%, 2018 | | | 1,613,119 | | | | 1,776,479 | |
| Fannie Mae, 4.329%, 2018 | | | 905,386 | | | | 1,005,094 | |
| Fannie Mae, 5.332%, 2018 | | | 807,204 | | | | 897,771 | |
| Fannie Mae, 5.549%, 2018 | | | 1,880,000 | | | | 2,137,185 | |
| Fannie Mae, 5.869%, 2018 | | | 1,116,964 | | | | 1,272,011 | |
| Fannie Mae, 2.43%, 2019 | | | 1,305,000 | | | | 1,338,759 | |
| Fannie Mae, 4.5%, 2019 - 2041 | | | 46,805,057 | | | | 50,130,267 | |
| Fannie Mae, 4.825%, 2019 | | | 1,180,000 | | | | 1,335,151 | |
| Fannie Mae, 4.991%, 2019 | | | 1,601,932 | | | | 1,815,642 | |
| Fannie Mae, 5.001%, 2019 | | | 615,739 | | | | 696,682 | |
| Fannie Mae, 5.038%, 2019 | | | 5,277,347 | | | | 6,006,387 | |
| Fannie Mae, 5.104%, 2019 | | | 424,399 | | | | 481,373 | |
| Fannie Mae, 5.218%, 2019 | | | 731,072 | | | | 830,644 | |
| Fannie Mae, 5.456%, 2019 | | | 578,900 | | | | 662,115 | |
| Fannie Mae, 5.652%, 2019 | | | 385,886 | | | | 436,847 | |
| Fannie Mae, 5.786%, 2019 | | | 1,368,168 | | | | 1,538,407 | |
| Fannie Mae, 3.999%, 2020 | | | 1,868,775 | | | | 2,043,215 | |
| Fannie Mae, 4.278%, 2020 | | | 1,150,203 | | | | 1,275,226 | |
| Fannie Mae, 4.88%, 2020 | | | 952,516 | | | | 1,047,021 | |
| Fannie Mae, 5.19%, 2020 | | | 2,014,335 | | | | 2,285,459 | |
| Fannie Mae, 7.5%, 2024 - 2031 | | | 405,841 | | | | 487,256 | |
| Fannie Mae, 4.5%, 2025 | | | 2,373,983 | | | | 2,541,566 | |
| Fannie Mae, 3.5%, 2042 | | | 12,835,697 | | | | 13,306,557 | |
| Freddie Mac, 4.5%, 2016 - 2041 | | | 11,574,573 | | | | 12,310,105 | |
| Freddie Mac, 5%, 2016 - 2040 | | | 31,834,608 | | | | 34,277,178 | |
| Freddie Mac, 6.5%, 2016 - 2038 | | | 4,322,157 | | | | 4,855,702 | |
| Freddie Mac, 3.882%, 2017 | | | 5,323,000 | | | | 5,881,766 | |
| Freddie Mac, 6%, 2017 - 2038 | | | 29,874,320 | | | | 32,953,162 | |
| Freddie Mac, 2.303%, 2018 | | | 2,003,882 | | | | 2,036,958 | |
| Freddie Mac, 2.323%, 2018 | | | 4,783,000 | | | | 4,873,585 | |
| Freddie Mac, 2.412%, 2018 (n) | | | 7,000,000 | | | | 7,170,905 | |
| Freddie Mac, 3.154%, 2018 | | | 5,293,000 | | | | 5,640,665 | |
13
Portfolio of Investments – continued
| | | | | | | | |
| Issuer | | Shares/Par | | | Value ($) | |
| | | | | | | | |
| Bonds - continued | | | | | | | | |
| Mortgage-Backed - continued | | | | | | | | |
| Freddie Mac, 4.186%, 2019 | | $ | 2,800,000 | | | $ | 3,124,433 | |
| Freddie Mac, 5.085%, 2019 | | | 6,865,000 | | | | 7,943,141 | |
| Freddie Mac, 2.757%, 2020 | | | 7,624,445 | | | | 7,999,575 | |
| Freddie Mac, 3.32%, 2020 | | | 7,702,254 | | | | 8,275,441 | |
| Freddie Mac, 4.224%, 2020 | | | 4,281,146 | | | | 4,779,527 | |
| Freddie Mac, 4.251%, 2020 | | | 3,106,000 | | | | 3,464,442 | |
| Freddie Mac, 5.5%, 2021 - 2038 | | | 40,534,100 | | | | 44,310,830 | |
| Freddie Mac, 4%, 2025 | | | 11,173,795 | | | | 11,818,533 | |
| Freddie Mac, 3.5%, 2041 - 2042 | | | 7,031,910 | | | | 7,278,636 | |
| Ginnie Mae, 4%, 2032 | | | 34,204 | | | | 34,245 | |
| Ginnie Mae, 4.5%, 2033 - 2041 | | | 35,963,505 | | | | 39,418,306 | |
| Ginnie Mae, 5.5%, 2033 - 2038 | | | 21,237,011 | | | | 23,693,356 | |
| Ginnie Mae, 3.5%, 2042 | | | 5,428,631 | | | | 5,703,676 | |
| Ginnie Mae, 5.612%, 2058 | | | 11,074,469 | | | | 11,882,203 | |
| Ginnie Mae, 6.357%, 2058 | | | 5,328,124 | | | | 5,697,555 | |
| | | | | | | | |
| | | | | | | $ | 792,823,349 | |
| Municipals - 0.2% | | | | | | | | |
| Triborough Bridge & Tunnel Authority Rev., NY, “A”, 5%, 2021 | | $ | 3,430,000 | | | $ | 4,255,224 | |
| | |
| U.S. Government Agencies and Equivalents - 2.4% | | | | | | | | |
| Aid-Egypt, 4.45%, 2015 | | $ | 6,204,000 | | | $ | 6,997,057 | |
| FDIC Structured Sale Guarantee Note, 0%, 2012 (n) | | | 1,106,000 | | | | 1,104,529 | |
| Freddie Mac, 2.375%, 2022 | | | 11,320,000 | | | | 11,448,267 | |
| Small Business Administration, 6.35%, 2021 | | | 974,771 | | | | 1,079,142 | |
| Small Business Administration, 6.34%, 2021 | | | 1,105,230 | | | | 1,225,011 | |
| Small Business Administration, 6.44%, 2021 | | | 1,054,411 | | | | 1,171,878 | |
| Small Business Administration, 6.625%, 2021 | | | 1,162,407 | | | | 1,296,958 | |
| Small Business Administration, 6.07%, 2022 | | | 1,254,141 | | | | 1,388,627 | |
| Small Business Administration, 4.98%, 2023 | | | 1,494,487 | | | | 1,639,822 | |
| Small Business Administration, 4.89%, 2023 | | | 3,360,500 | | | | 3,683,025 | |
| Small Business Administration, 4.77%, 2024 | | | 3,029,419 | | | | 3,314,597 | |
| Small Business Administration, 5.52%, 2024 | | | 2,125,166 | | | | 2,367,086 | |
| Small Business Administration, 4.99%, 2024 | | | 2,731,004 | | | | 3,003,794 | |
| Small Business Administration, 4.86%, 2024 | | | 2,041,202 | | | | 2,245,925 | |
| Small Business Administration, 4.86%, 2025 | | | 2,992,358 | | | | 3,292,376 | |
| Small Business Administration, 5.11%, 2025 | | | 2,723,938 | | | | 3,012,530 | |
| U.S. Department of Housing & Urban Development, 6.36%, 2016 | | | 530,000 | | | | 534,423 | |
| U.S. Department of Housing & Urban Development, 6.59%, 2016 | | | 201,000 | | | | 202,289 | |
| | | | | | | | |
| | | | | | | $ | 49,007,336 | |
14
Portfolio of Investments – continued
| | | | | | | | |
| Issuer | | Shares/Par | | | Value ($) | |
| | | | | | | | |
| Bonds - continued | | | | | | | | |
| U.S. Treasury Obligations - 46.0% | | | | | | | | |
| U.S. Treasury Bonds, 7.5%, 2016 | | $ | 3,421,000 | | | $ | 4,478,301 | |
| U.S. Treasury Bonds, 6.25%, 2023 | | | 1,445,000 | | | | 2,050,771 | |
| U.S. Treasury Bonds, 6%, 2026 | | | 5,933,000 | | | | 8,426,711 | |
| U.S. Treasury Bonds, 6.75%, 2026 | | | 6,811,000 | | | | 10,354,845 | |
| U.S. Treasury Bonds, 6.375%, 2027 | | | 2,309,000 | | | | 3,436,803 | |
| U.S. Treasury Bonds, 5.25%, 2029 | | | 72,368,000 | | | | 97,956,891 | |
| U.S. Treasury Bonds, 6.25%, 2030 | | | 3,166,000 | | | | 4,793,026 | |
| U.S. Treasury Bonds, 4.5%, 2036 | | | 2,662,000 | | | | 3,384,898 | |
| U.S. Treasury Bonds, 5%, 2037 | | | 4,133,000 | | | | 5,646,711 | |
| U.S. Treasury Bonds, 4.375%, 2038 | | | 3,297,000 | | | | 4,134,642 | |
| U.S. Treasury Bonds, 4.5%, 2039 | | | 62,458,300 | | | | 80,005,210 | |
| U.S. Treasury Notes, 1.375%, 2012 (f) | | | 214,573,000 | | | | 215,134,538 | |
| U.S. Treasury Notes, 1.375%, 2013 | | | 16,769,000 | | | | 16,941,922 | |
| U.S. Treasury Notes, 3.625%, 2013 | | | 5,523,000 | | | | 5,748,018 | |
| U.S. Treasury Notes, 3.375%, 2013 | | | 2,594,000 | | | | 2,708,196 | |
| U.S. Treasury Notes, 3.125%, 2013 | | | 48,289,000 | | | | 50,463,888 | |
| U.S. Treasury Notes, 4%, 2014 | | | 2,232,000 | | | | 2,392,947 | |
| U.S. Treasury Notes, 1.875%, 2014 | | | 16,258,000 | | | | 16,796,546 | |
| U.S. Treasury Notes, 2.625%, 2014 | | | 16,750,000 | | | | 17,634,601 | |
| U.S. Treasury Notes, 4%, 2015 | | | 13,740,000 | | | | 15,174,113 | |
| U.S. Treasury Notes, 2.125%, 2015 | | | 234,171,000 | | | | 246,410,181 | |
| U.S. Treasury Notes, 2.625%, 2016 | | | 4,787,000 | | | | 5,165,470 | |
| U.S. Treasury Notes, 4.75%, 2017 | | | 11,447,000 | | | | 13,742,662 | |
| U.S. Treasury Notes, 2.625%, 2018 | | | 2,713,000 | | | | 2,949,753 | |
| U.S. Treasury Notes, 2.75%, 2019 | | | 1,746,600 | | | | 1,907,069 | |
| U.S. Treasury Notes, 3.125%, 2019 | | | 12,026,000 | | | | 13,427,775 | |
| U.S. Treasury Notes, 3.5%, 2020 | | | 65,059,000 | | | | 74,487,480 | |
| U.S. Treasury Notes, 2.625%, 2020 | | | 11,920,000 | | | | 12,800,029 | |
| | | | | | | | |
| | | | | | | $ | 938,553,997 | |
| Total Bonds (Identified Cost, $1,823,022,476) | | | | | | $ | 1,930,842,626 | |
| | |
| Money Market Funds - 5.7% | | | | | | | | |
MFS Institutional Money Market Portfolio, 0.1%,
at Cost and Net Asset Value (v) | | | 116,572,471 | | | $ | 116,572,471 | |
| Total Investments (Identified Cost, $1,939,594,947) | | | $ | 2,047,415,097 | |
| | |
| Other Assets, Less Liabilities - (0.4)% | | | | | | | (7,706,857 | ) |
| Net Assets - 100.0% | | | | | | $ | 2,039,708,240 | |
| (f) | All or a portion of the security has been segregated as collateral for open futures contracts. |
| (n) | Securities exempt from registration under Rule 144A of the Securities Act of 1933. These securities may be sold in the ordinary course of business in transactions exempt from registration, normally to qualified |
15
Portfolio of Investments – continued
| | institutional buyers. At period end, the aggregate value of these securities was $8,275,434, representing 0.4% of net assets. |
| (v) | Underlying affiliated fund that is available only to investment companies managed by MFS. The rate quoted for the MFS Institutional Money Market Portfolio is the annualized seven-day yield of the fund at period end. |
The following abbreviations are used in this report and are defined:
| FRN | | Floating Rate Note. Interest rate resets periodically and may not be the rate reported at period end. |
| STRIPS | | Separate Trading of Registered Interest and Principal of Securities |
Derivative Contracts at 2/29/12
Futures Contracts Outstanding at 2/29/12
| | | | | | | | | | | | | | | | | | |
| Description | | Currency | | | Contracts | | | Value | | Expiration
Date | | | Unrealized
Appreciation
(Depreciation) | |
| Liability Derivatives | | | | | | | | | | | | | | | | | | |
| Interest Rate Futures | | | | | | | | | | | | | | | | | | |
| U.S. Treasury Note 10 yr (Short) | | | USD | | | | 139 | | | $(18,202,484) | | | June - 2012 | | | | $(5,908 | ) |
| | | | | | | | | | | | | | | | | | |
At February 29, 2012, the fund had sufficient cash and/or other liquid securities to cover any commitments under these derivative contracts.
See Notes to Financial Statements
16
Financial Statements
STATEMENT OF ASSETS AND LIABILITIES
At 2/29/12
This statement represents your fund’s balance sheet, which details the assets and liabilities comprising the total value of the fund.
| | | | |
| Assets | | | | |
Investments- | | | | |
Non-affiliated issuers, at value (identified cost, $1,823,022,476) | | | $1,930,842,626 | |
Underlying affiliated funds, at cost and value | | | 116,572,471 | |
Total investments, at value (identified cost, $1,939,594,947) | | | $2,047,415,097 | |
Cash | | | 2,039 | |
Receivables for | | | | |
Daily variation margin on open futures contracts | | | 60,812 | |
Investments sold | | | 4,074,557 | |
Fund shares sold | | | 5,765,438 | |
Interest and dividends | | | 9,862,981 | |
Other assets | | | 16,517 | |
Total assets | | | $2,067,197,441 | |
| Liabilities | | | | |
Payables for | | | | |
Distributions | | | $728,235 | |
Investments purchased | | | 23,865,962 | |
Fund shares reacquired | | | 1,900,435 | |
Payable to affiliates | | | | |
Investment adviser | | | 46,317 | |
Shareholder servicing costs | | | 619,688 | |
Distribution and service fees | | | 28,638 | |
Payable for independent Trustees’ compensation | | | 71,815 | |
Accrued expenses and other liabilities | | | 228,111 | |
Total liabilities | | | $27,489,201 | |
Net assets | | | $2,039,708,240 | |
| Net assets consist of | | | | |
Paid-in capital | | | $1,944,121,862 | |
Unrealized appreciation (depreciation) on investments | | | 107,814,242 | |
Accumulated net realized gain (loss) on investments | | | (13,454,054 | ) |
Undistributed net investment income | | | 1,226,190 | |
Net assets | | | $2,039,708,240 | |
Shares of beneficial interest outstanding | | | 193,442,713 | |
| | | | | | | | | | | | |
| | | Net assets | | | Shares
outstanding | | | Net asset value
per share (a) | |
Class A | | | $981,980,189 | | | | 93,124,236 | | | | $10.54 | |
Class B | | | 46,644,813 | | | | 4,429,104 | | | | 10.53 | |
Class C | | | 112,961,445 | | | | 10,690,609 | | | | 10.57 | |
Class I | | | 562,634,169 | | | | 53,364,680 | | | | 10.54 | |
Class R1 | | | 7,901,711 | | | | 750,121 | | | | 10.53 | |
Class R2 | | | 168,809,158 | | | | 16,025,556 | | | | 10.53 | |
Class R3 | | | 107,150,466 | | | | 10,163,742 | | | | 10.54 | |
Class R4 | | | 51,626,289 | | | | 4,894,665 | | | | 10.55 | |
| (a) | Maximum offering price per share was equal to the net asset value per share for all share classes, except for Class A, for which the maximum offering price per share was $11.07 [100 / 95.25 x $10.54]. On sales of $50,000 or more, the maximum offering price of Class A shares is reduced. A contingent deferred sales charge may be imposed on redemptions of Class A, Class B, and Class C shares. Redemption price per share was equal to the net asset value per share for Classes I, R1, R2, R3, and R4. |
See Notes to Financial Statements
17
Financial Statements
STATEMENT OF OPERATIONS
Year ended 2/29/12
This statement describes how much your fund earned in investment income and accrued in expenses. It also describes any gains and/or losses generated by fund operations.
| | | | |
| Net investment income | | | | |
Income | | | | |
Interest | | | $60,060,275 | |
Dividends from underlying affiliated funds | | | 152,609 | |
Total investment income | | | $60,212,884 | |
Expenses | | | | |
Management fee | | | $7,444,042 | |
Distribution and service fees | | | 4,942,899 | |
Shareholder servicing costs | | | 2,768,456 | |
Administrative services fee | | | 285,337 | |
Independent Trustees’ compensation | | | 48,913 | |
Custodian fee | | | 235,096 | |
Shareholder communications | | | 131,021 | |
Audit and tax fees | | | 53,812 | |
Legal fees | | | 26,871 | |
Miscellaneous | | | 247,047 | |
Total expenses | | | $16,183,494 | |
Fees paid indirectly | | | (140 | ) |
Reduction of expenses by investment adviser | | | (7,347 | ) |
Net expenses | | | $16,176,007 | |
Net investment income | | | $44,036,877 | |
| Realized and unrealized gain (loss) on investments | | | | |
Realized gain (loss) (identified cost basis) | | | | |
Investment transactions | | | $34,199,352 | |
Futures contracts | | | (523,784 | ) |
Net realized gain (loss) on investments | | | $33,675,568 | |
Change in unrealized appreciation (depreciation) | | | | |
Investments | | | $47,819,651 | |
Futures contracts | | | (5,908 | ) |
Net unrealized gain (loss) on investments | | | $47,813,743 | |
Net realized and unrealized gain (loss) on investments | | | $81,489,311 | |
Change in net assets from operations | | | $125,526,188 | |
See Notes to Financial Statements
18
Financial Statements
STATEMENTS OF CHANGES IN NET ASSETS
These statements describe the increases and/or decreases in net assets resulting from operations, any distributions, and any shareholder transactions.
| | | | | | | | |
| | | Years ended 2/29, 2/28 | |
| | | 2012 | | | 2011 | |
| Change in net assets | | | | | | |
| From operations | | | | | | | | |
Net investment income | | | $44,036,877 | | | | $48,578,197 | |
Net realized gain (loss) on investments | | | 33,675,568 | | | | 4,294,700 | |
Net unrealized gain (loss) on investments | | | 47,813,743 | | | | (7,709,733 | ) |
Change in net assets from operations | | | $125,526,188 | | | | $45,163,164 | |
| Distributions declared to shareholders | | | | | | | | |
From net investment income | | | $(52,285,367 | ) | | | $(52,591,517 | ) |
Change in net assets from fund share transactions | | | $222,403,035 | | | | $180,029,376 | |
Total change in net assets | | | $295,643,856 | | | | $172,601,023 | |
| Net assets | | | | | | | | |
At beginning of period | | | 1,744,064,384 | | | | 1,571,463,361 | |
At end of period (including undistributed net investment
income of $1,226,190 and $2,018,674, respectively) | | | $2,039,708,240 | | | | $1,744,064,384 | |
See Notes to Financial Statements
19
Financial Statements
FINANCIAL HIGHLIGHTS
The financial highlights table is intended to help you understand the fund’s financial performance for the past 5 years (or life of a particular share class, if shorter). Certain information reflects financial results for a single fund share. The total returns in the table represent the rate by which an investor would have earned (or lost) on an investment in the fund share class (assuming reinvestment of all distributions) held for the entire period.
| | | | | | | | | | | | | | | | | | | | |
| Class A | | Years ended 2/29, 2/28 | |
| | | 2012 | | | 2011 | | | 2010 | | | 2009 | | | 2008 | |
Net asset value, beginning of period | | | $10.13 | | | | $10.15 | | | | $9.92 | | | | $9.78 | | | | $9.48 | |
| Income (loss) from investment operations | | | | | | | | | | | | | | | | | |
Net investment income (d) | | | $0.25 | | | | $0.30 | | | | $0.35 | | | | $0.39 | | | | $0.41 | |
Net realized and unrealized gain (loss)
on investments | | | 0.46 | | | | (0.00 | )(w) | | | 0.27 | | | | 0.17 | | | | 0.33 | |
Total from investment operations | | | $0.71 | | | | $0.30 | | | | $0.62 | | | | $0.56 | | | | $0.74 | |
| Less distributions declared to shareholders | | | | | | | | | | | | | | | | | |
From net investment income | | | $(0.30 | ) | | | $(0.32 | ) | | | $(0.39 | ) | | | $(0.42 | ) | | | $(0.44 | ) |
Net asset value, end of period (x) | | | $10.54 | | | | $10.13 | | | | $10.15 | | | | $9.92 | | | | $9.78 | |
Total return (%) (r)(s)(t)(x) | | | 7.04 | | | | 2.96 | | | | 6.31 | | | | 5.95 | | | | 8.02 | |
Ratios (%) (to average net assets)
and Supplemental data: | | | | | | | | | | | | | | | | | |
Expenses before expense reductions (f) | | | 0.86 | | | | 0.87 | | | | 0.88 | | | | 0.91 | | | | 0.84 | |
Expenses after expense reductions (f) | | | 0.86 | | | | 0.87 | | | | 0.88 | | | | 0.80 | | | | 0.73 | |
Net investment income | | | 2.39 | | | | 2.88 | | | | 3.49 | | | | 3.98 | | | | 4.35 | |
Portfolio turnover | | | 49 | | | | 34 | | | | 32 | | | | 57 | | | | 55 | |
Net assets at end of period (000 omitted) | | | $981,980 | | | | $915,576 | | | | $923,918 | | | | $888,523 | | | | $740,620 | |
See Notes to Financial Statements
20
Financial Highlights – continued
| | | | | | | | | | | | | | | | | | | | |
| Class B | | Years ended 2/29, 2/28 | |
| | | 2012 | | | 2011 | | | 2010 | | | 2009 | | | 2008 | |
Net asset value, beginning of period | | | $10.11 | | | | $10.14 | | | | $9.91 | | | | $9.77 | | | | $9.47 | |
| Income (loss) from investment operations | | | | | | | | | | | | | | | | | |
Net investment income (d) | | | $0.17 | | | | $0.22 | | | | $0.28 | | | | $0.32 | | | | $0.34 | |
Net realized and unrealized gain (loss)
on investments | | | 0.47 | | | | (0.01 | ) | | | 0.26 | | | | 0.17 | | | | 0.33 | |
Total from investment operations | | | $0.64 | | | | $0.21 | | | | $0.54 | | | | $0.49 | | | | $0.67 | |
| Less distributions declared to shareholders | | | | | | | | | | | | | | | | | |
From net investment income | | | $(0.22 | ) | | | $(0.24 | ) | | | $(0.31 | ) | | | $(0.35 | ) | | | $(0.37 | ) |
Net asset value, end of period (x) | | | $10.53 | | | | $10.11 | | | | $10.14 | | | | $9.91 | | | | $9.77 | |
Total return (%) (r)(s)(t)(x) | | | 6.35 | | | | 2.09 | | | | 5.52 | | | | 5.16 | | | | 7.22 | |
Ratios (%) (to average net assets)
and Supplemental data: | | | | | | | | | | | | | | | | | |
Expenses before expense reductions (f) | | | 1.61 | | | | 1.62 | | | | 1.63 | | | | 1.66 | | | | 1.59 | |
Expenses after expense reductions (f) | | | 1.61 | | | | 1.62 | | | | 1.63 | | | | 1.55 | | | | 1.49 | |
Net investment income | | | 1.66 | | | | 2.15 | | | | 2.75 | | | | 3.25 | | | | 3.61 | |
Portfolio turnover | | | 49 | | | | 34 | | | | 32 | | | | 57 | | | | 55 | |
Net assets at end of period (000 omitted) | | | $46,645 | | | | $53,577 | | | | $74,842 | | | | $102,852 | | | | $94,206 | |
| |
| Class C | | Years ended 2/29, 2/28 | |
| | | 2012 | | | 2011 | | | 2010 | | | 2009 | | | 2008 | |
Net asset value, beginning of period | | | $10.15 | | | | $10.17 | | | | $9.95 | | | | $9.81 | | | | $9.51 | |
| Income (loss) from investment operations | | | | | | | | | | | | | | | | | |
Net investment income (d) | | | $0.17 | | | | $0.22 | | | | $0.27 | | | | $0.31 | | | | $0.34 | |
Net realized and unrealized gain (loss)
on investments | | | 0.47 | | | | 0.00 | (w) | | | 0.26 | | | | 0.18 | | | | 0.33 | |
Total from investment operations | | | $0.64 | | | | $0.22 | | | | $0.53 | | | | $0.49 | | | | $0.67 | |
| Less distributions declared to shareholders | | | | | | | | | | | | | | | | | |
From net investment income | | | $(0.22 | ) | | | $(0.24 | ) | | | $(0.31 | ) | | | $(0.35 | ) | | | $(0.37 | ) |
Net asset value, end of period (x) | | | $10.57 | | | | $10.15 | | | | $10.17 | | | | $9.95 | | | | $9.81 | |
Total return (%) (r)(s)(t)(x) | | | 6.33 | | | | 2.19 | | | | 5.40 | | | | 5.16 | | | | 7.21 | |
Ratios (%) (to average net assets)
and Supplemental data: | | | | | | | | | | | | | | | | | |
Expenses before expense reductions (f) | | | 1.61 | | | | 1.62 | | | | 1.62 | | | | 1.66 | | | | 1.59 | |
Expenses after expense reductions (f) | | | 1.61 | | | | 1.62 | | | | 1.62 | | | | 1.55 | | | | 1.49 | |
Net investment income | | | 1.64 | | | | 2.12 | | | | 2.71 | | | | 3.21 | | | | 3.59 | |
Portfolio turnover | | | 49 | | | | 34 | | | | 32 | | | | 57 | | | | 55 | |
Net assets at end of period (000 omitted) | | | $112,961 | | | | $111,328 | | | | $116,622 | | | | $92,046 | | | | $35,316 | |
See Notes to Financial Statements
21
Financial Highlights – continued
| | | | | | | | | | | | | | | | | | | | |
| Class I | | Years ended 2/29, 2/28 | |
| | | 2012 | | | 2011 | | | 2010 | | | 2009 | | | 2008 | |
Net asset value, beginning of period | | | $10.12 | | | | $10.15 | | | | $9.92 | | | | $9.78 | | | | $9.48 | |
| Income (loss) from investment operations | | | | | | | | | | | | | | | | | |
Net investment income (d) | | | $0.27 | | | | $0.32 | | | | $0.38 | | | | $0.41 | | | | $0.44 | |
Net realized and unrealized gain (loss)
on investments | | | 0.47 | | | | (0.00 | )(w) | | | 0.26 | | | | 0.18 | | | | 0.32 | |
Total from investment operations | | | $0.74 | | | | $0.32 | | | | $0.64 | | | | $0.59 | | | | $0.76 | |
| Less distributions declared to shareholders | | | | | | | | | | | | | | | | | |
From net investment income | | | $(0.32 | ) | | | $(0.35 | ) | | | $(0.41 | ) | | | $(0.45 | ) | | | $(0.46 | ) |
Net asset value, end of period (x) | | | $10.54 | | | | $10.12 | | | | $10.15 | | | | $9.92 | | | | $9.78 | |
Total return (%) (r)(s)(x) | | | 7.41 | | | | 3.11 | | | | 6.57 | | | | 6.21 | | | | 8.28 | |
Ratios (%) (to average net assets)
and Supplemental data: | | | | | | | | | | | | | | | | | |
Expenses before expense reductions (f) | | | 0.61 | | | | 0.62 | | | | 0.63 | | | | 0.66 | | | | 0.59 | |
Expenses after expense reductions (f) | | | 0.60 | | | | 0.62 | | | | 0.63 | | | | 0.55 | | | | 0.48 | |
Net investment income | | | 2.64 | | | | 3.13 | | | | 3.73 | | | | 4.26 | | | | 4.61 | |
Portfolio turnover | | | 49 | | | | 34 | | | | 32 | | | | 57 | | | | 55 | |
Net assets at end of period (000 omitted) | | | $562,634 | | | | $434,682 | | | | $318,667 | | | | $286,371 | | | | $449,109 | |
| |
| Class R1 | | Years ended 2/29, 2/28 | |
| | | 2012 | | | 2011 | | | 2010 | | | 2009 | | | 2008 | |
Net asset value, beginning of period | | | $10.11 | | | | $10.14 | | | | $9.91 | | | | $9.77 | | | | $9.48 | |
| Income (loss) from investment operations | | | | | | | | | | | | | | | | | |
Net investment income (d) | | | $0.17 | | | | $0.22 | | | | $0.28 | | | | $0.32 | | | | $0.33 | |
Net realized and unrealized gain (loss)
on investments | | | 0.47 | | | | (0.01 | ) | | | 0.26 | | | | 0.17 | | | | 0.32 | |
Total from investment operations | | | $0.64 | | | | $0.21 | | | | $0.54 | | | | $0.49 | | | | $0.65 | |
| Less distributions declared to shareholders | | | | | | | | | | | | | | | | | |
From net investment income | | | $(0.22 | ) | | | $(0.24 | ) | | | $(0.31 | ) | | | $(0.35 | ) | | | $(0.36 | ) |
Net asset value, end of period (x) | | | $10.53 | | | | $10.11 | | | | $10.14 | | | | $9.91 | | | | $9.77 | |
Total return (%) (r)(s)(x) | | | 6.35 | | | | 2.09 | | | | 5.52 | | | | 5.16 | | | | 7.00 | |
Ratios (%) (to average net assets)
and Supplemental data: | | | | | | | | | | | | | | | | | |
Expenses before expense reductions (f) | | | 1.61 | | | | 1.62 | | | | 1.63 | | | | 1.66 | | | | 1.68 | |
Expenses after expense reductions (f) | | | 1.61 | | | | 1.62 | | | | 1.63 | | | | 1.55 | | | | 1.58 | |
Net investment income | | | 1.64 | | | | 2.14 | | | | 2.74 | | | | 3.24 | | | | 3.45 | |
Portfolio turnover | | | 49 | | | | 34 | | | | 32 | | | | 57 | | | | 55 | |
Net assets at end of period (000 omitted) | | | $7,902 | | | | $7,219 | | | | $6,246 | | | | $5,713 | | | | $3,832 | |
See Notes to Financial Statements
22
Financial Highlights – continued
| | | | | | | | | | | | | | | | | | | | |
| Class R2 | | Years ended 2/29, 2/28 | |
| | | 2012 | | | 2011 | | | 2010 | | | 2009 | | | 2008 | |
Net asset value, beginning of period | | | $10.11 | | | | $10.14 | | | | $9.91 | | | | $9.77 | | | | $9.48 | |
| Income (loss) from investment operations | | | | | | | | | | | | | | | | | |
Net investment income (d) | | | $0.22 | | | | $0.27 | | | | $0.32 | | | | $0.36 | | | | $0.37 | |
Net realized and unrealized gain (loss)
on investments | | | 0.47 | | | | (0.01 | ) | | | 0.27 | | | | 0.18 | | | | 0.32 | |
Total from investment operations | | | $0.69 | | | | $0.26 | | | | $0.59 | | | | $0.54 | | | | $0.69 | |
| Less distributions declared to shareholders | | | | | | | | | | | | | | | | | |
From net investment income | | | $(0.27 | ) | | | $(0.29 | ) | | | $(0.36 | ) | | | $(0.40 | ) | | | $(0.40 | ) |
Net asset value, end of period (x) | | | $10.53 | | | | $10.11 | | | | $10.14 | | | | $9.91 | | | | $9.77 | |
Total return (%) (r)(s)(x) | | | 6.88 | | | | 2.60 | | | | 6.04 | | | | 5.69 | | | | 7.51 | |
Ratios (%) (to average net assets)
and Supplemental data: | | | | | | | | | | | | | | | | | |
Expenses before expense reductions (f) | | | 1.11 | | | | 1.12 | | | | 1.13 | | | | 1.16 | | | | 1.19 | |
Expenses after expense reductions (f) | | | 1.11 | | | | 1.12 | | | | 1.12 | | | | 1.05 | | | | 1.09 | |
Net investment income | | | 2.13 | | | | 2.62 | | | | 3.22 | | | | 3.74 | | | | 3.95 | |
Portfolio turnover | | | 49 | | | | 34 | | | | 32 | | | | 57 | | | | 55 | |
Net assets at end of period (000 omitted) | | | $168,809 | | | | $123,672 | | | | $73,052 | | | | $35,616 | | | | $13,863 | |
| |
| Class R3 | | Years ended 2/29, 2/28 | |
| | | 2012 | | | 2011 | | | 2010 | | | 2009 | | | 2008 | |
Net asset value, beginning of period | | | $10.12 | | | | $10.15 | | | | $9.92 | | | | $9.78 | | | | $9.48 | |
| Income (loss) from investment operations | | | | | | | | | | | | | | | | | |
Net investment income (d) | | | $0.25 | | | | $0.29 | | | | $0.35 | | | | $0.39 | | | | $0.40 | |
Net realized and unrealized gain (loss)
on investments | | | 0.46 | | | | (0.00 | )(w) | | | 0.27 | | | | 0.17 | | | | 0.33 | |
Total from investment operations | | | $0.71 | | | | $0.29 | | | | $0.62 | | | | $0.56 | | | | $0.73 | |
| Less distributions declared to shareholders | | | | | | | | | | | | | | | | | |
From net investment income | | | $(0.29 | ) | | | $(0.32 | ) | | | $(0.39 | ) | | | $(0.42 | ) | | | $(0.43 | ) |
Net asset value, end of period (x) | | | $10.54 | | | | $10.12 | | | | $10.15 | | | | $9.92 | | | | $9.78 | |
Total return (%) (r)(s)(x) | | | 7.14 | | | | 2.86 | | | | 6.31 | | | | 5.95 | | | | 7.88 | |
Ratios (%) (to average net assets)
and Supplemental data: | | | | | | | | | | | | | | | | | |
Expenses before expense reductions (f) | | | 0.86 | | | | 0.87 | | | | 0.88 | | | | 0.91 | | | | 0.95 | |
Expenses after expense reductions (f) | | | 0.86 | | | | 0.87 | | | | 0.87 | | | | 0.80 | | | | 0.85 | |
Net investment income | | | 2.36 | | | | 2.87 | | | | 3.47 | | | | 3.98 | | | | 4.21 | |
Portfolio turnover | | | 49 | | | | 34 | | | | 32 | | | | 57 | | | | 55 | |
Net assets at end of period (000 omitted) | | | $107,150 | | | | $70,988 | | | | $46,780 | | | | $25,009 | | | | $15,317 | |
See Notes to Financial Statements
23
Financial Highlights – continued
| | | | | | | | | | | | | | | | | | | | |
| Class R4 | | Years ended 2/29, 2/28 | |
| | | 2012 | | | 2011 | | | 2010 | | | 2009 | | | 2008 | |
Net asset value, beginning of period | | | $10.13 | | | | $10.15 | | | | $9.93 | | | | $9.78 | | | | $9.51 | |
| Income (loss) from investment operations | | | | | | | | | | | | | | | | | |
Net investment income (d) | | | $0.27 | | | | $0.32 | | | | $0.37 | | | | $0.41 | | | | $0.43 | |
Net realized and unrealized gain (loss)
on investments | | | 0.47 | | | | 0.01 | (g) | | | 0.26 | | | | 0.19 | | | | 0.29 | |
Total from investment operations | | | $0.74 | | | | $0.33 | | | | $0.63 | | | | $0.60 | | | | $0.72 | |
| Less distributions declared to shareholders | | | | | | | | | | | | | | | | | |
From net investment income | | | $(0.32 | ) | | | $(0.35 | ) | | | $(0.41 | ) | | | $(0.45 | ) | | | $(0.45 | ) |
Net asset value, end of period (x) | | | $10.55 | | | | $10.13 | | | | $10.15 | | | | $9.93 | | | | $9.78 | |
Total return (%) (r)(s)(x) | | | 7.40 | | | | 3.22 | | | | 6.46 | | | | 6.32 | | | | 7.85 | |
Ratios (%) (to average net assets)
and Supplemental data: | | | | | | | | | | | | | | | | | |
Expenses before expense reductions (f) | | | 0.60 | | | | 0.63 | | | | 0.63 | | | | 0.66 | | | | 0.65 | |
Expenses after expense reductions (f) | | | 0.60 | | | | 0.63 | | | | 0.62 | | | | 0.55 | | | | 0.55 | |
Net investment income | | | 2.61 | | | | 3.10 | | | | 3.71 | | | | 4.23 | | | | 4.47 | |
Portfolio turnover | | | 49 | | | | 34 | | | | 32 | | | | 57 | | | | 55 | |
Net assets at end of period (000 omitted) | | | $51,626 | | | | $27,022 | | | | $11,337 | | | | $4,361 | | | | $3,772 | |
| (d) | Per share data is based on average shares outstanding. |
| (f) | Ratios do not reflect reductions from fees paid indirectly, if applicable. |
| (g) | The per share amount varies from the net realized and unrealized gain/loss for the period because of the timing of sales of fund shares and the per share amount of realized and unrealized gains and losses at such time. |
| (r) | Certain expenses have been reduced without which performance would have been lower. |
| (s) | From time to time the fund may receive proceeds from litigation settlements, without which performance would be lower. |
| (t) | Total returns do not include any applicable sales charges. |
| (w) | Per share amount was less than $0.01. |
| (x) | The net asset values per share and total returns have been calculated on net assets which include adjustments made in accordance with U.S. generally accepted accounting principles required at period end for financial reporting purposes. |
See Notes to Financial Statements
24
NOTES TO FINANCIAL STATEMENTS
| (1) | | Business and Organization |
MFS Government Securities Fund (the fund) is a series of MFS Series Trust XIII (the trust). The trust is organized as a Massachusetts business trust and is registered under the Investment Company Act of 1940, as amended, as an open-end management investment company.
| (2) | | Significant Accounting Policies |
General – The preparation of financial statements in conformity with U.S. generally accepted accounting principles requires management to make estimates and assumptions that affect the reported amounts of assets and liabilities, and disclosure of contingent assets and liabilities at the date of the financial statements and the reported amounts of revenues and expenses during the reporting period. Actual results could differ from those estimates. In the preparation of these financial statements, management has evaluated subsequent events occurring after the date of the fund’s Statement of Assets and Liabilities through the date that the financial statements were issued. The fund invests a significant portion of its assets in asset-backed and/or mortgage-backed securities. The value of these securities may depend, in part, on the issuer’s or borrower’s credit quality or ability to pay principal and interest when due and may fall if an issuer or borrower defaults on its obligation to pay principal or interest or if the instrument’s credit rating is downgraded by a credit rating agency. U.S. Government securities not supported as to the payment of principal or interest by the U.S. Treasury, such as those issued by Fannie Mae, Freddie Mac, and the Federal Home Loan Banks, are subject to greater credit risk than are U.S. Government securities supported by the U.S. Treasury, such as those issued by Ginnie Mae.
In December 2011, the Financial Accounting Standards Board issued Accounting Standards Update 2011-11, Balance Sheet (Topic 210) – Disclosures about Offsetting Assets and Liabilities (“ASU 2011-11”). Effective for annual reporting periods beginning on or after January 1, 2013 and interim periods within those annual periods, ASU 2011-11 is intended to enhance disclosure requirements on the offsetting of financial assets and liabilities. Although still evaluating the potential impacts of ASU 2011-11 to the fund, management expects that the impact of the fund’s adoption will be limited to additional financial statement disclosures.
Investment Valuations – Debt instruments and floating rate loans (other than short-term instruments), including restricted debt instruments, are generally valued at an evaluated or composite bid as provided by a third-party pricing service. Short-term instruments with a maturity at issuance of 60 days or less generally are valued at amortized cost, which approximates market value.
25
Notes to Financial Statements – continued
Futures contracts are generally valued at last posted settlement price as provided by a third-party pricing service on the market on which they are primarily traded. Futures contracts for which there were no trades that day for a particular position are generally valued at the closing bid quotation as provided by a third-party pricing service on the market on which such futures contracts are primarily traded. Open-end investment companies are generally valued at net asset value per share. Securities and other assets generally valued on the basis of information from a third-party pricing service may also be valued at a broker/dealer bid quotation. Values obtained from third-party pricing services can utilize both transaction data and market information such as yield, quality, coupon rate, maturity, type of issue, trading characteristics, and other market data.
The Board of Trustees has delegated primary responsibility for determining or causing to be determined the value of the fund’s investments (including any fair valuation) to the adviser pursuant to valuation policies and procedures approved by the Board. If the adviser determines that reliable market quotations are not readily available, investments are valued at fair value as determined in good faith by the adviser in accordance with such procedures under the oversight of the Board of Trustees. Under the fund’s valuation policies and procedures, market quotations are not considered to be readily available for most types of debt instruments and floating rate loans and many types of derivatives. These investments are generally valued at fair value based on information from third-party pricing services. In addition, investments may be valued at fair value if the adviser determines that an investment’s value has been materially affected by events occurring after the close of the exchange or market on which the investment is principally traded (such as foreign exchange or market) and prior to the determination of the fund’s net asset value, or after the halting of trading of a specific security where trading does not resume prior to the close of the exchange or market on which the security is principally traded. The adviser generally relies on third-party pricing services or other information (such as the correlation with price movements of similar securities in the same or other markets; the type, cost and investment characteristics of the security; the business and financial condition of the issuer; and trading and other market data) to assist in determining whether to fair value and at what value to fair value an investment. The value of an investment for purposes of calculating the fund’s net asset value can differ depending on the source and method used to determine value. When fair valuation is used, the value of an investment used to determine the fund’s net asset value may differ from quoted or published prices for the same investment. There can be no assurance that the fund could obtain the fair value assigned to an investment if it were to sell the investment at the same time at which the fund determines its net asset value per share.
26
Notes to Financial Statements – continued
Various inputs are used in determining the value of the fund’s assets or liabilities. These inputs are categorized into three broad levels. In certain cases, the inputs used to measure fair value may fall into different levels of the fair value hierarchy. In such cases, an investment’s level within the fair value hierarchy is based on the lowest level of input that is significant to the fair value measurement. The fund’s assessment of the significance of a particular input to the fair value measurement in its entirety requires judgment, and considers factors specific to the investment. Level 1 includes unadjusted quoted prices in active markets for identical assets or liabilities. Level 2 includes other significant observable market-based inputs (including quoted prices for similar securities, interest rates, prepayment speed, and credit risk). Level 3 includes unobservable inputs, which may include the adviser’s own assumptions in determining the fair value of investments. Other financial instruments are derivative instruments not reflected in total investments, such as futures. The following is a summary of the levels used as of February 29, 2012 in valuing the fund’s assets or liabilities:
| | | | | | | | | | | | | | | | |
| Investments at Value | | Level 1 | | | Level 2 | | | Level 3 | | | Total | |
U.S. Treasury Bond & U.S.
Government Agency & Equivalents | | | $— | | | | $1,087,451,810 | | | | $— | | | | $1,087,451,810 | |
| Municipal Bonds | | | — | | | | 4,255,224 | | | | — | | | | 4,255,224 | |
| Corporate Bonds | | | — | | | | 19,458,010 | | | | — | | | | 19,458,010 | |
| Residential Mortgage-Backed Securities | | | — | | | | 792,823,349 | | | | — | | | | 792,823,349 | |
| Commercial Mortgage-Backed Securities | | | — | | | | 26,854,233 | | | | — | | | | 26,854,233 | |
| Mutual Funds | | | 116,572,471 | | | | — | | | | — | | | | 116,572,471 | |
| Total Investments | | | $116,572,471 | | | | $1,930,842,626 | | | | $— | | | | $2,047,415,097 | |
| | | | |
| Other Financial Instruments | | | | | | | | | | | | |
| Futures | | | $(5,908 | ) | | | $— | | | | $— | | | | $(5,908 | ) |
For further information regarding security characteristics, see the Portfolio of Investments.
Inflation-Adjusted Debt Securities – The fund invests in inflation-adjusted debt securities issued by the U.S. Treasury. The fund may also invest in inflation-adjusted debt securities issued by U.S. Government agencies and instrumentalities other than the U.S. Treasury and by other entities such as U.S. and foreign corporations and foreign governments. The principal value of these debt securities is adjusted through income according to changes in the Consumer Price Index or another general price or wage index. These debt securities typically pay a fixed rate of interest, but this fixed rate is applied to the inflation-adjusted principal amount. The principal paid at maturity of the debt security is typically equal to the inflation-adjusted principal amount, or the security’s original par value, whichever is greater. Other types of
27
Notes to Financial Statements – continued
inflation-adjusted securities may use other methods to adjust for other measures of inflation.
Derivatives – The fund uses derivatives for different purposes, primarily to increase or decrease exposure to a particular market or segment of the market, or security, to increase or decrease interest rate or currency exposure, or as alternatives to direct investments. Derivatives are used for hedging or non-hedging purposes. While hedging can reduce or eliminate losses, it can also reduce or eliminate gains. When the fund uses derivatives as an investment to increase market exposure, or for hedging purposes, gains and losses from derivative instruments may be substantially greater than the derivative’s original cost.
The derivative instruments used by the fund were purchased options and futures contracts. The fund’s period end derivatives, as presented in the Portfolio of Investments and the associated Derivative Contract Tables, generally are indicative of the volume of its derivative activity during the period.
The following table presents, by major type of derivative contract, the fair value, on a gross basis, of the asset and liability components of derivatives held by the fund at February 29, 2012 as reported in the Statement of Assets and Liabilities:
| | | | | | |
| | | | | Fair Value (a) | |
| Risk | | Derivative Contracts | | Liability Derivatives | |
| Interest Rate | | Interest Rate Futures | | | $(5,908 | ) |
| (a) | The value of futures contracts outstanding includes cumulative appreciation (depreciation) as reported in the fund’s Portfolio of Investments. Only the current day variation margin for futures contracts is separately reported within the fund’s Statement of Assets and Liabilities. |
The following table presents, by major type of derivative contract, the realized gain (loss) on derivatives held by the fund for the year ended February 29, 2012 as reported in the Statement of Operations:
| | | | | | | | |
| Risk | | Futures
Contracts | | | Investment
Transactions
(Purchased
Options) | |
| Interest Rate | | | $(523,784 | ) | | | $3,915 | |
The following table presents, by major type of derivative contract, the change in unrealized appreciation (depreciation) on derivatives held by the fund for the year ended February 29, 2012 as reported in the Statement of Operations:
| | | | | | | | |
| Risk | | Futures
Contracts | | | Investments
(Purchased
Options) | |
| Interest Rate | | | $(5,908 | ) | | | $2,792 | |
Derivative counterparty credit risk is managed through formal evaluation of the creditworthiness of all potential counterparties. On certain over-the-counter derivatives, the fund attempts to reduce its exposure to counterparty credit risk
28
Notes to Financial Statements – continued
whenever possible by entering into an International Swaps and Derivatives Association (ISDA) Master Agreement on a bilateral basis with each of the counterparties with whom it undertakes a significant volume of transactions. The ISDA Master Agreement gives each party to the agreement the right to terminate all transactions traded under such agreement if there is a certain deterioration in the credit quality of the other party. The ISDA Master Agreement gives the fund the right, upon an event of default by the applicable counterparty or a termination of the agreement, to close out all transactions traded under such agreement and to net amounts owed under each transaction to one net amount payable by one party to the other. This right to close out and net payments across all transactions traded under the ISDA Master Agreement could result in a reduction of the fund’s credit risk to such counterparty equal to any amounts payable by the fund under the applicable transactions, if any. However, absent an event of default by the counterparty or a termination of the agreement, the ISDA Master Agreement does not result in an offset of reported amounts of assets and liabilities in the Statement of Assets and Liabilities across transactions between the fund and the applicable counterparty.
Collateral requirements differ by type of derivative. Collateral or margin requirements are set by the broker or exchange clearing house for exchange traded derivatives (i.e., futures and exchange-traded options) while collateral terms are contract specific for over-the-counter traded derivatives (i.e., forward foreign currency exchange contracts, swaps and over-the-counter options). For derivatives traded under an ISDA Master Agreement, the collateral requirements are netted across all transactions traded under such agreement and one amount is posted from one party to the other to collateralize such obligations. Cash collateral that has been pledged to cover obligations of the fund under derivative contracts, if any, will be reported separately on the Statement of Assets and Liabilities as restricted cash. Securities collateral pledged for the same purpose, if any, is noted in the Portfolio of Investments.
Purchased Options – The fund purchased call and put options for a premium. Purchased call and put options entitle the holder to buy and sell a specified number of shares or units of a particular security, currency or index at a specified price at a specified date or within a specified period of time. Purchasing call options may be used to hedge against an anticipated increase in the dollar cost of securities or currency to be acquired or to increase the fund’s exposure to an underlying instrument. Purchasing put options may hedge against a decline in the value of portfolio securities or currency.
The premium paid is initially recorded as an investment in the Statement of Assets and Liabilities. That investment is subsequently marked-to-market daily with the difference between the premium paid and the market value of the purchased option being recorded as unrealized appreciation or depreciation.
29
Notes to Financial Statements – continued
Premiums paid for purchased call and put options which have expired are treated as realized losses on investments in the Statement of Operations. Upon the exercise or closing of a purchased call option, the premium paid is added to the cost of the security or financial instrument. Upon the exercise or closing of a purchased put option, the premium paid is offset against the proceeds on the sale of the underlying security or financial instrument in order to determine the realized gain or loss on investments.
The risk in purchasing an option is that the fund pays a premium whether or not the option is exercised. The fund’s maximum risk of loss due to counterparty credit risk is limited to the market value of the option. For over-the-counter options, this risk is mitigated in cases where there is an ISDA Master Agreement between the fund and the counterparty providing for netting as described above and for posting of collateral by the counterparty to the fund to cover the fund’s exposure to the counterparty under such ISDA Master Agreement.
Futures Contracts – The fund entered into futures contracts which may be used to hedge against or obtain broad market, interest rate or currency exposure. A futures contract represents a commitment for the future purchase or sale of an asset at a specified price on a specified date.
Upon entering into a futures contract, the fund is required to deposit with the broker, either in cash or securities, an initial margin in an amount equal to a certain percentage of the notional amount of the contract. Subsequent payments (variation margin) are made or received by the fund each day, depending on the daily fluctuations in the value of the contract, and are recorded for financial statement purposes as unrealized gain or loss by the fund until the contract is closed or expires at which point the gain or loss on futures is realized.
The fund bears the risk of interest rates, exchange rates or securities prices moving unexpectedly, in which case, the fund may not achieve the anticipated benefits of the futures contracts and may realize a loss. While futures may present less counterparty risk to the fund since the contracts are exchange traded and the exchange’s clearinghouse guarantees payments to the broker, there is still counterparty credit risk due to the insolvency of the broker. The fund’s maximum risk of loss due to counterparty credit risk is equal to the margin posted by the fund to the broker plus any gains or minus any losses on the outstanding futures contracts.
Indemnifications – Under the fund’s organizational documents, its officers and Trustees may be indemnified against certain liabilities and expenses arising out of the performance of their duties to the fund. Additionally, in the normal course of business, the fund enters into agreements with service providers that may contain indemnification clauses. The fund’s maximum
30
Notes to Financial Statements – continued
exposure under these agreements is unknown as this would involve future claims that may be made against the fund that have not yet occurred.
Investment Transactions and Income – Investment transactions are recorded on the trade date. Interest income is recorded on the accrual basis. All premium and discount is amortized or accreted for financial statement purposes in accordance with U.S. generally accepted accounting principles. Inflation-indexed bonds are fixed-income securities whose principal value is periodically adjusted upward or downward to the rate of inflation. Interest is accrued based on the principal value, which is adjusted for inflation. Any increase or decrease in the principal amount of an inflation-indexed bond is generally recorded as an increase or decrease in interest income, respectively, even though the adjusted principal is not received until maturity.
Dividends received in cash are recorded on the ex-dividend date. Certain dividends from foreign securities will be recorded when the fund is informed of the dividend if such information is obtained subsequent to the ex-dividend date. Dividend and interest payments received in additional securities are recorded on the ex-dividend or ex-interest date in an amount equal to the value of the security on such date.
The fund may receive proceeds from litigation settlements. Any proceeds received from litigation involving portfolio holdings are reflected in the Statement of Operations in realized gain/loss if the security has been disposed of by the fund or in unrealized gain/loss if the security is still held by the fund. Any other proceeds from litigation not related to portfolio holdings are reflected as other income in the Statement of Operations.
Fees Paid Indirectly – The fund’s custody fee may be reduced according to an arrangement that measures the value of cash deposited with the custodian by the fund. This amount, for the year ended February 29, 2012, is shown as a reduction of total expenses on the Statement of Operations.
Tax Matters and Distributions – The fund intends to qualify as a regulated investment company, as defined under Subchapter M of the Internal Revenue Code, and to distribute all of its taxable income, including realized capital gains. As a result, no provision for federal income tax is required. The fund’s federal tax returns for the prior three fiscal years remain subject to examination by the Internal Revenue Service.
Distributions to shareholders are recorded on the ex-dividend date. Income and capital gain distributions are determined in accordance with income tax regulations, which may differ from U.S. generally accepted accounting principles. Certain capital accounts in the financial statements are periodically adjusted for permanent differences in order to reflect their tax character. These adjustments have no impact on net assets or net asset value per share.
31
Notes to Financial Statements – continued
Temporary differences which arise from recognizing certain items of income, expense, gain or loss in different periods for financial statement and tax purposes will reverse at some time in the future. Distributions in excess of net investment income or net realized gains are temporary overdistributions for financial statement purposes resulting from differences in the recognition or classification of income or distributions for financial statement and tax purposes.
Book/tax differences primarily relate to amortization and accretion of debt securities and treating a portion of the proceeds from redemptions as a distribution for tax purposes.
The tax character of distributions declared to shareholders for the last two fiscal years is as follows:
| | | | | | | | |
| | | 2/29/12 | | | 2/28/11 | |
| Ordinary income (including any short-term capital gains) | | | $52,285,367 | | | | $52,591,517 | |
The federal tax cost and the tax basis components of distributable earnings were as follows:
| | | | |
| As of 2/29/12 | | | |
| Cost of investments | | | $1,961,621,085 | |
| Gross appreciation | | | 88,727,730 | |
| Gross depreciation | | | (2,933,718 | ) |
| Net unrealized appreciation (depreciation) | | | $85,794,012 | |
| |
| Undistributed ordinary income | | | 7,125,072 | |
| Undistributed long-term capital gain | | | 8,070,281 | |
| Other temporary differences | | | (5,402,987 | ) |
Multiple Classes of Shares of Beneficial Interest – The fund offers multiple classes of shares, which differ in their respective distribution and service fees. The fund’s income and common expenses are allocated to shareholders based on the value of settled shares outstanding of each class. The fund’s realized and unrealized gain (loss) are allocated to shareholders based on the daily net assets of each class. Dividends are declared separately for each class. Differences in per share dividend rates are generally due to differences in separate class expenses. Class B shares will convert to Class A shares approximately eight
32
Notes to Financial Statements – continued
years after purchase. The fund’s distributions declared to shareholders as reported on the Statements of Changes in Net Assets are presented by class as follows:
| | | | | | | | |
| | | From net investment
income | |
| | | Year ended
2/29/12 | | | Year ended
2/28/11 | |
| Class A | | | $26,706,371 | | | | $29,917,744 | |
| Class B | | | 1,008,331 | | | | 1,583,311 | |
| Class C | | | 2,234,815 | | | | 2,969,622 | |
| Class I | | | 14,786,741 | | | | 12,384,622 | |
| Class R1 | | | 151,598 | | | | 160,835 | |
| Class R2 | | | 3,778,589 | | | | 2,983,568 | |
| Class R3 | | | 2,448,948 | | | | 1,912,136 | |
| Class R4 | | | 1,169,974 | | | | 679,679 | |
| Total | | | $52,285,367 | | | | $52,591,517 | |
| (3) | | Transactions with Affiliates |
Investment Adviser – The fund has an investment advisory agreement with MFS to provide overall investment management and related administrative services and facilities to the fund. The management fee is computed daily and paid monthly at an annual rate of 0.40% of the fund’s average daily net assets.
The investment adviser had agreed in writing to pay a portion of the fund’s total annual operating expenses, exclusive of interest, taxes, extraordinary expenses, brokerage and transaction costs, and investment-related expenses, such that total annual fund operating expenses did not exceed the following rates annually of each class’ average daily net assets.
| | | | | | | | | | | | | | | | | | | | | | | | | | | | |
| Class A | | Class B | | | Class C | | | Class I | | | Class R1 | | | Class R2 | | | Class R3 | | | Class R4 | |
| 0.90% | | | 1.65% | | | | 1.65% | | | | 0.65% | | | | 1.65% | | | | 1.15% | | | | 0.90% | | | | 0.65% | |
This written agreement terminated on June 30, 2011. For the period March 1, 2011 through June 30, 2011, the fund’s actual operating expenses did not exceed the limit and therefore, the investment adviser did not pay any portion of the fund’s expenses.
Distributor – MFS Fund Distributors, Inc. (MFD), a wholly-owned subsidiary of MFS, as distributor, received $228,142 for the year ended February 29, 2012, as its portion of the initial sales charge on sales of Class A shares of the fund.
The Board of Trustees has adopted a distribution plan for certain class shares pursuant to Rule 12b-1 of the Investment Company Act of 1940.
The fund’s distribution plan provides that the fund will pay MFD for services provided by MFD and financial intermediaries in connection with the distribution and servicing of certain share classes. One component of the plan is a distribution fee paid to MFD and another component of the plan is a
33
Notes to Financial Statements – continued
service fee paid to MFD. MFD may subsequently pay all, or a portion, of the distribution and/or service fees to financial intermediaries.
Distribution Plan Fee Table:
| | | | | | | | | | | | | | | | | | | | |
| | | Distribution
Fee Rate (d) | | | Service
Fee Rate (d) | | | Total
Distribution
Plan (d) | | | Annual
Effective
Rate (e) | | | Distribution
and Service
Fee | |
| Class A | | | — | | | | 0.25% | | | | 0.25% | | | | 0.25% | | | | $2,361,404 | |
| Class B | | | 0.75% | | | | 0.25% | | | | 1.00% | | | | 1.00% | | | | 482,743 | |
| Class C | | | 0.75% | | | | 0.25% | | | | 1.00% | | | | 1.00% | | | | 1,072,935 | |
| Class R1 | | | 0.75% | | | | 0.25% | | | | 1.00% | | | | 1.00% | | | | 72,912 | |
| Class R2 | | | 0.25% | | | | 0.25% | | | | 0.50% | | | | 0.50% | | | | 735,100 | |
| Class R3 | | | — | | | | 0.25% | | | | 0.25% | | | | 0.25% | | | | 217,805 | |
| Total Distribution and Service Fees | | | | | | | | | | | | | | | | $4,942,899 | |
| (d) | In accordance with the distribution plan for certain classes, the fund pays distribution and/or service fees equal to these annual percentage rates of each class’ average daily net assets. The distribution and service fee rates disclosed by class represent the current rates in effect at the end of the reporting period. |
| (e) | The annual effective rates represent actual fees incurred under the distribution plan for the year ended February 29, 2012 based on each class’ average daily net assets. |
Certain Class A shares are subject to a contingent deferred sales charge (CDSC) in the event of a shareholder redemption within 24 months of purchase. Class C shares are subject to a CDSC in the event of a shareholder redemption within 12 months of purchase. Class B shares are subject to a CDSC in the event of a shareholder redemption within six years of purchase. All contingent deferred sales charges are paid to MFD and during the year ended February 29, 2012, were as follows:
| | | | |
| Class A | | | $1,615 | |
| Class B | | | 91,931 | |
| Class C | | | 19,233 | |
Shareholder Servicing Agent – MFS Service Center, Inc. (MFSC), a wholly-owned subsidiary of MFS, receives a fee from the fund for its services as shareholder servicing agent calculated as a percentage of the average daily net assets of the fund as determined periodically under the supervision of the fund’s Board of Trustees. For the year ended February 29, 2012, the fee was $706,004, which equated to 0.0380% annually of the fund’s average daily net assets. MFSC also receives payment from the fund for out-of-pocket expenses, sub-accounting and other shareholder servicing costs which may be paid to affiliated and unaffiliated service providers. For the year ended February 29, 2012, these out-of-pocket expenses, sub-accounting and other shareholder servicing costs amounted to $1,602,485.
Under a Special Servicing Agreement among MFS, each MFS fund which invests in other MFS funds (“MFS fund-of-funds”) and certain underlying funds in which a MFS fund-of-funds invests (“underlying funds”), each
34
Notes to Financial Statements – continued
underlying fund may pay a portion of each MFS fund-of-fund’s transfer agent-related expenses, including sub-accounting fees payable to financial intermediaries, to the extent such payments do not exceed the benefits realized or expected to be realized by the underlying fund from the investment in the underlying fund by the MFS fund-of-fund. For the year ended February 29, 2012, these costs for the fund amounted to $459,967 and are reflected in the shareholder servicing costs on the Statement of Operations.
Administrator – MFS provides certain financial, legal, shareholder communications, compliance, and other administrative services to the fund. Under an administrative services agreement, the fund partially reimburses MFS the costs incurred to provide these services. The fund is charged an annual fixed amount of $17,500 plus a fee based on average daily net assets. The administrative services fee incurred for the year ended February 29, 2012 was equivalent to an annual effective rate of 0.0154% of the fund’s average daily net assets.
Trustees’ and Officers’ Compensation – The fund pays compensation to independent Trustees in the form of a retainer, attendance fees, and additional compensation to Board and Committee chairpersons. The fund does not pay compensation directly to Trustees or officers of the fund who are also officers of the investment adviser, all of whom receive remuneration for their services to the fund from MFS. Certain officers and Trustees of the fund are officers or directors of MFS, MFD, and MFSC.
Prior to December 31, 2001, the fund had an unfunded defined benefit plan (“DB plan”) for independent Trustees. As of December 31, 2001, the Board took action to terminate the DB plan with respect to then-current and any future independent Trustees, such that the DB plan covers only certain of those former independent Trustees who retired on or before December 31, 2001. Effective January 1, 2002, accrued benefits under the DB plan for then-current independent Trustees who continued were credited to an unfunded retirement deferral plan (the “Retirement Deferral plan”), which was established for and exists solely with respect to these credited amounts, and is not available for other deferrals by these or other independent Trustees. Although the Retirement Deferral plan is unfunded, amounts deferred under the plan are periodically adjusted for investment experience as if they had been invested in shares of the fund. The DB plan resulted in a pension expense of $4,645 and the Retirement Deferral plan resulted in an expense of $3,769. Both amounts are included in independent Trustees’ compensation for the year ended February 29, 2012. The liability for deferred retirement benefits payable to certain independent Trustees under both plans amounted to $71,773 at February 29, 2012, and is included in payable for independent Trustees’ compensation on the Statement of Assets and Liabilities.
35
Notes to Financial Statements – continued
Other – This fund and certain other funds managed by MFS (the funds) have entered into services agreements (the Agreements) which provide for payment of fees by the funds to Tarantino LLC and Griffin Compliance LLC in return for the provision of services of an Independent Chief Compliance Officer (ICCO) and Assistant ICCO, respectively, for the funds. The ICCO and Assistant ICCO are officers of the funds and the sole members of Tarantino LLC and Griffin Compliance LLC, respectively. The funds can terminate the Agreements with Tarantino LLC and Griffin Compliance LLC at any time under the terms of the Agreements. For the year ended February 29, 2012, the aggregate fees paid by the fund to Tarantino LLC and Griffin Compliance LLC were $16,260 and are included in miscellaneous expense on the Statement of Operations. MFS has agreed to reimburse the fund for a portion of the payments made by the fund in the amount of $7,347, which is shown as a reduction of total expenses in the Statement of Operations. Additionally, MFS has agreed to bear all expenses associated with office space, other administrative support, and supplies provided to the ICCO and Assistant ICCO.
The fund invests in the MFS Institutional Money Market Portfolio which is managed by MFS and seeks a high level of current income consistent with preservation of capital and liquidity. Income earned on this investment is included in dividends from underlying affiliated funds on the Statement of Operations. This money market fund does not pay a management fee to MFS.
Purchases and sales of investments, other than purchased option transactions, and short-term obligations, were as follows:
| | | | | | | | |
| | | Purchases | | | Sales | |
| U.S. Government securities | | | $829,026,295 | | | | $767,804,825 | |
| Investments (non-U.S. Government securities) | | | $36,203,712 | | | | $30,344,844 | |
36
Notes to Financial Statements – continued
| (5) | | Shares of Beneficial Interest |
The fund’s Declaration of Trust permits the Trustees to issue an unlimited number of full and fractional shares of beneficial interest. Transactions in fund shares were as follows:
| | | | | | | | | | | | | | | | |
| | | Year ended
2/29/12 | | | Year ended
2/28/11 | |
| | | Shares | | | Amount | | | Shares | | | Amount | |
| Shares sold | | | | | | | | | | | | | | | | |
Class A | | | 25,550,792 | | | | $266,477,303 | | | | 26,667,083 | | | | $273,592,738 | |
Class B | | | 1,140,672 | | | | 11,895,317 | | | | 1,553,300 | | | | 15,930,201 | |
Class C | | | 3,801,616 | | | | 39,819,353 | | | | 5,026,803 | | | | 51,750,174 | |
Class I | | | 14,668,623 | | | | 152,989,083 | | | | 14,001,097 | | | | 143,194,324 | |
Class R1 | | | 315,425 | | | | 3,287,027 | | | | 394,547 | | | | 4,040,808 | |
Class R2 | | | 7,049,493 | | | | 73,270,147 | | | | 7,708,713 | | | | 78,920,205 | |
Class R3 | | | 5,732,513 | | | | 59,767,495 | | | | 4,462,455 | | | | 45,744,844 | |
Class R4 | | | 3,870,673 | | | | 40,296,186 | | | | 3,137,352 | | | | 32,426,895 | |
| | | 62,129,807 | | | | $647,801,911 | | | | 62,951,350 | | | | $645,600,189 | |
Shares issued to shareholders in
reinvestment of distributions | | | | | | | | | | | | | |
Class A | | | 1,849,457 | | | | $19,243,720 | | | | 2,092,509 | | | | $21,483,496 | |
Class B | | | 80,675 | | | | 837,638 | | | | 125,859 | | | | 1,290,097 | |
Class C | | | 139,019 | | | | 1,449,343 | | | | 177,402 | | | | 1,825,956 | |
Class I | | | 1,366,817 | | | | 14,226,652 | | | | 1,147,562 | | | | 11,772,037 | |
Class R1 | | | 14,495 | | | | 150,646 | | | | 15,593 | | | | 159,915 | |
Class R2 | | | 329,937 | | | | 3,433,554 | | | | 251,598 | | | | 2,579,819 | |
Class R3 | | | 234,603 | | | | 2,444,983 | | | | 185,930 | | | | 1,908,299 | |
Class R4 | | | 100,109 | | | | 1,044,017 | | | | 48,348 | | | | 496,050 | |
| | | 4,115,112 | | | | $42,830,553 | | | | 4,044,801 | | | | $41,515,669 | |
| Shares reacquired | | | | | | | | | | | | | | | | |
Class A | | | (24,703,093 | ) | | | $(256,721,654 | ) | | | (29,372,786 | ) | | | $(300,393,949 | ) |
Class B | | | (2,090,450 | ) | | | (21,594,046 | ) | | | (3,764,909 | ) | | | (38,469,699 | ) |
Class C | | | (4,221,833 | ) | | | (43,755,041 | ) | | | (5,698,132 | ) | | | (58,177,566 | ) |
Class I | | | (5,608,475 | ) | | | (58,567,892 | ) | | | (3,614,436 | ) | | | (37,064,519 | ) |
Class R1 | | | (293,501 | ) | | | (3,037,095 | ) | | | (312,562 | ) | | | (3,204,492 | ) |
Class R2 | | | (3,581,347 | ) | | | (37,219,533 | ) | | | (2,938,760 | ) | | | (30,064,238 | ) |
Class R3 | | | (2,815,966 | ) | | | (29,235,485 | ) | | | (2,245,914 | ) | | | (22,908,988 | ) |
Class R4 | | | (1,743,740 | ) | | | (18,098,683 | ) | | | (1,634,929 | ) | | | (16,803,031 | ) |
| | | (45,058,405 | ) | | | $(468,229,429 | ) | | | (49,582,428 | ) | | | $(507,086,482 | ) |
37
Notes to Financial Statements – continued
| | | | | | | | | | | | | | | | |
| | | Year ended
2/29/12 | | | Year ended
2/28/11 | |
| | | Shares | | | Amount | | | Shares | | | Amount | |
| Net change | | | | | | | | | | | | | | | | |
Class A | | | 2,697,156 | | | | $28,999,369 | | | | (613,194 | ) | | | $(5,317,715 | ) |
Class B | | | (869,103 | ) | | | (8,861,091 | ) | | | (2,085,750 | ) | | | (21,249,401 | ) |
Class C | | | (281,198 | ) | | | (2,486,345 | ) | | | (493,927 | ) | | | (4,601,436 | ) |
Class I | | | 10,426,965 | | | | 108,647,843 | | | | 11,534,223 | | | | 117,901,842 | |
Class R1 | | | 36,419 | | | | 400,578 | | | | 97,578 | | | | 996,231 | |
Class R2 | | | 3,798,083 | | | | 39,484,168 | | | | 5,021,551 | | | | 51,435,786 | |
Class R3 | | | 3,151,150 | | | | 32,976,993 | | | | 2,402,471 | | | | 24,744,155 | |
Class R4 | | | 2,227,042 | | | | 23,241,520 | | | | 1,550,771 | | | | 16,119,914 | |
| | | 21,186,514 | | | | $222,403,035 | | | | 17,413,723 | | | | $180,029,376 | |
The fund is one of several mutual funds in which the MFS funds-of-funds may invest. The MFS funds-of-funds do not invest in the underlying MFS funds for the purpose of exercising management or control. At the end of the period, the MFS Moderate Allocation Fund and the MFS Conservative Allocation Fund were the owners of record of approximately 16% and 8%, respectively, of the value of outstanding voting shares of the fund. In addition, the MFS Lifetime Retirement Income Fund, the MFS Lifetime 2010 Fund, and the MFS Lifetime 2020 Fund were each the owners of record of less than 1% of the value of outstanding voting shares of the fund.
The fund and certain other funds managed by MFS participate in a $1.1 billion unsecured committed line of credit, subject to a $1 billion sublimit, provided by a syndication of banks under a credit agreement. Borrowings may be made for temporary financing needs. Interest is charged to each fund, based on its borrowings, generally at a rate equal to the higher of the Federal Reserve funds rate or one month LIBOR plus an agreed upon spread. A commitment fee, based on the average daily, unused portion of the committed line of credit, is allocated among the participating funds at the end of each calendar quarter. In addition, the fund and other funds managed by MFS have established unsecured uncommitted borrowing arrangements with certain banks for temporary financing needs. Interest is charged to each fund, based on its borrowings, at a rate equal to the Federal Reserve funds rate plus an agreed upon spread. For the year ended February 29, 2012, the fund’s commitment fee and interest expense were $13,715 and $0, respectively, and are included in miscellaneous expense on the Statement of Operations.
The fund’s investment adviser, MFS, was the subject of an administrative proceeding concerning market timing which resulted in the Securities and Exchange Commission (the “SEC”) entering an order approving a settlement
38
Notes to Financial Statements – continued
with MFS and two of its former officers (the “Settlement Order”). Under the terms of the Settlement Order, MFS transferred $175 million in disgorgement and $50 million in penalty (the “Payments”) to the SEC, which established a Fair Fund from which settlement funds have been distributed to eligible current and former shareholders of the fund and certain other affected MFS retail funds. The Payments, along with additional amounts from a third-party settlement, have been distributed to eligible shareholders in accordance with a plan developed by an independent distribution consultant (the “IDC”) in consultation with MFS and the Board of Trustees of the MFS retail funds. The plan was approved in July 2007 by the SEC. Pursuant to the distribution plan, after the distributions to eligible shareholders have been made, any undistributed amounts could be designated “residual” and distributed to the fund and certain other affected MFS retail funds for the benefit of fund shareholders. In November 2010, the SEC issued an order designating certain undistributed amounts residual and ordering that such amounts be distributed to the affected MFS retail funds. The SEC order designated other undistributed amounts for use in funding certain additional distribution efforts to eligible shareholders. As a result of the SEC’s approval of the residual payments, the fund received $32,855 in November 2010. These additional distribution efforts were completed in 2011. The final residual payment of $19,580 was recorded by the fund in August 2011, in accordance with an SEC order designating remaining undistributed amounts as residual and ordering that such amounts be distributed to the affected MFS retail funds. No further residual amounts are to be received by the fund.
| (8) | | Transactions in Underlying Affiliated Funds-Affiliated Issuers |
An affiliated issuer may be considered one in which the fund owns 5% or more of the outstanding voting securities, or a company which is under common control. For the purposes of this report, the fund assumes the following to be affiliated issuers:
| | | | | | | | | | | | | | | | |
| Underlying Affiliated Funds | | Beginning
Shares/Par
Amount | | | Acquisitions
Shares/Par
Amount | | | Dispositions
Shares/Par
Amount | | | Ending
Shares/Par
Amount | |
| MFS Institutional Money Market Portfolio | | | 162,661,736 | | | | 762,756,080 | | | | (808,845,345 | ) | | | 116,572,471 | |
| | | | |
| Underlying Affiliated Funds | | Realized
Gain (Loss) | | | Capital Gain
Distributions | | | Dividend
Income | | | Ending
Value | |
| MFS Institutional Money Market Portfolio | | | $— | | | | $— | | | | $152,609 | | | | $116,572,471 | |
39
REPORT OF INDEPENDENT REGISTERED PUBLIC ACCOUNTING FIRM
To the Board of Trustees and the Shareholders of MFS Government Securities Fund:
We have audited the accompanying statement of assets and liabilities, including the portfolio of investments, of MFS Government Securities Fund (the “Fund”) as of February 29, 2012, and the related statement of operations for the year then ended, the statements of changes in net assets for each of the two years in the period then ended, and the financial highlights for each of the five years in the period then ended. These financial statements and financial highlights are the responsibility of the Fund’s management. Our responsibility is to express an opinion on these financial statements and financial highlights based on our audits.
We conducted our audits in accordance with the standards of the Public Company Accounting Oversight Board (United States). Those standards require that we plan and perform the audit to obtain reasonable assurance about whether the financial statements and financial highlights are free of material misstatement. The Fund is not required to have, nor were we engaged to perform, an audit of its internal control over financial reporting. Our audits included consideration of internal control over financial reporting as a basis for designing audit procedures that are appropriate in the circumstances, but not for the purpose of expressing an opinion on the effectiveness of the Fund’s internal control over financial reporting. Accordingly, we express no such opinion. An audit also includes examining, on a test basis, evidence supporting the amounts and disclosures in the financial statements, assessing the accounting principles used and significant estimates made by management, as well as evaluating the overall financial statement presentation. Our procedures included confirmation of securities owned as of February 29, 2012, by correspondence with the custodian and brokers; where replies were not received from brokers, we performed other auditing procedures. We believe that our audits provide a reasonable basis for our opinion.
In our opinion, the financial statements and financial highlights referred to above present fairly, in all material respects, the financial position of MFS Government Securities Fund as of February 29, 2012, the results of its operations for the year then ended, the changes in its net assets for each of the two years in the period then ended, and the financial highlights for each of the five years in the period then ended, in conformity with accounting principles generally accepted in the United States of America.
DELOITTE & TOUCHE LLP
Boston, Massachusetts
April 13, 2012
40
TRUSTEES AND OFFICERS — IDENTIFICATION AND BACKGROUND
The Trustees and officers of the Trust, as of April 1, 2012, are listed below, together with their principal occupations during the past five years. (Their titles may have varied during that period.) The address of each Trustee and officer is 500 Boylston Street, Boston, Massachusetts 02116.
| | | | | | | | |
Name, Age | | Position(s) Held with Fund | | Trustee/Officer
Since (h) | | Principal Occupations
During the Past Five Years | | Other Directorships (j) |
| INTERESTED TRUSTEES |
Robert J. Manning (k)
(age 48) | | Trustee | | February 2004 | | Massachusetts Financial Services Company, Chairman, Chief Executive Officer and Director; President (until December 2009); Chief Investment Officer (until July 2010) | | N/A |
| INDEPENDENT TRUSTEES |
David H. Gunning
(age 69) | | Trustee and Chair of Trustees | | January 2004 | | Retired; Cleveland-Cliffs Inc. (mining products and service provider), Vice Chairman/Director (until May 2007) | | Lincoln Electric Holdings, Inc. (welding equipment manufacturer), Director; Development Alternatives, Inc. (consulting), Director/Non-Executive Chairman; Portman Limited (mining), Director (until 2008) |
Robert E. Butler
(age 70) | | Trustee | | January 2006 | | Consultant – investment company industry regulatory and compliance matters | | N/A |
Maureen R. Goldfarb
(age 56) | | Trustee | | January 2009 | | Private investor | | N/A |
41
Trustees and Officers – continued
| | | | | | | | |
Name, Age | | Position(s) Held with Fund | | Trustee/Officer
Since (h) | | Principal Occupations
During the Past Five Years | | Other Directorships (j) |
William R. Gutow
(age 70) | | Trustee | | December 1993 | | Private investor and real estate consultant; Capitol Entertainment Management Company (video franchise), Vice Chairman | | Atlantic Coast Tan (tanning salons), Vice Chairman (until 2007); Texas Donuts (donut franchise), Vice Chairman (until 2010) |
Michael Hegarty
(age 67) | | Trustee | | December 2004 | | Private investor | | N/A |
John P. Kavanaugh
(age 57) | | Trustee | | January 2009 | | Private investor; The Hanover Insurance Group, Inc., Vice President and Chief Investment Officer (until 2006); Allmerica Investment Trust, Allmerica Securities Trust and Opus Investment Trust (investment companies), Chairman, President and Trustee (until 2006) | | N/A |
J. Dale Sherratt
(age 73) | | Trustee | | June 1989 | | Insight Resources, Inc. (acquisition planning specialists), President; Wellfleet Investments (investor in health care companies), Managing General Partner | | N/A |
Laurie J. Thomsen
(age 54) | | Trustee | | March 2005 | | Private investor; New Profit, Inc. (venture philanthropy), Executive Partner (until 2010) | | The Travelers Companies (insurance), Director |
Robert W. Uek
(age 70) | | Trustee | | January 2006 | | Consultant to investment company industry | | N/A |
42
Trustees and Officers – continued
| | | | | | | | |
Name, Age | | Position(s) Held with Fund | | Trustee/Officer
Since (h) | | Principal Occupations
During the Past Five Years | | Other Directorships (j) |
| OFFICERS |
John M. Corcoran (k)
(age 46) | | President | | October 2008 | | Massachusetts Financial Services Company, Senior Vice President (since October 2008); State Street Bank and Trust (financial services provider), Senior Vice President, (until September 2008) | | N/A |
Christopher R.
Bohane (k)
(age 38) | | Assistant Secretary and Assistant Clerk | | July 2005 | | Massachusetts Financial Services Company, Vice President and Senior Counsel | | N/A |
Kino Clark (k)
(age 43) | | Assistant Treasurer | | January 2012 | | Massachusetts Financial Services Company, Vice President | | N/A |
Ethan D. Corey (k)
(age 48) | | Assistant
Secretary and Assistant Clerk | | July 2005 | | Massachusetts Financial Services Company, Senior Vice President and Associate General Counsel | | N/A |
David L. DiLorenzo (k)
(age 43) | | Treasurer | | July 2005 | | Massachusetts Financial Services Company,
Senior Vice President | | N/A |
43
Trustees and Officers – continued
| | | | | | | | |
Name, Age | | Position(s) Held with Fund | | Trustee/Officer
Since (h) | | Principal Occupations
During the Past Five Years | | Other Directorships (j) |
Robyn L. Griffin
(age 36) | | Assistant Independent Chief Compliance Officer | | August 2008 | | Griffin Compliance LLC (provider of compliance services), Principal (since August 2008); State Street Corporation (financial services provider), Mutual Fund Administration Assistant Vice President (October 2006 – July 2008); Liberty Mutual Group (insurance), Personal Market Assistant Controller (April 2006 – October 2006); Deloitte & Touche LLP (professional services firm). | | N/A |
Brian E.
Langenfeld (k)
(age 39) | | Assistant Secretary and Assistant Clerk | | June 2006 | | Massachusetts Financial Services Company, Vice President and Senior Counsel | | N/A |
Ellen Moynihan (k)
(age 54) | | Assistant Treasurer | | April 1997 | | Massachusetts Financial Services Company, Senior Vice President | | N/A |
Susan S. Newton (k)
(age 62) | | Assistant Secretary and Assistant Clerk | | May 2005 | | Massachusetts Financial Services Company, Senior Vice President and Associate General Counsel | | N/A |
Susan A. Pereira (k)
(age 41) | | Assistant Secretary and Assistant Clerk | | July 2005 | | Massachusetts Financial Services Company, Vice President and Senior Counsel | | N/A |
Mark N. Polebaum (k)
(age 59) | | Secretary and Clerk | | January 2006 | | Massachusetts Financial Services Company, Executive Vice President, General Counsel and Secretary | | N/A |
44
Trustees and Officers – continued
| | | | | | | | |
Name, Age | | Position(s) Held with Fund | | Trustee/Officer
Since (h) | | Principal Occupations
During the Past Five Years | | Other Directorships (j) |
Frank L. Tarantino
(age 68) | | Independent Chief Compliance Officer | | June 2004 | | Tarantino LLC (provider of compliance services), Principal | | N/A |
Richard S. Weitzel (k)
(age 41) | | Assistant Secretary and Assistant Clerk | | October 2007 | | Massachusetts Financial Services Company, Senior Vice President and Associate General Counsel | | N/A |
James O. Yost (k)
(age 51) | | Deputy Treasurer | | September 1990 | | Massachusetts Financial Services Company, Senior Vice President | | N/A |
| (h) | Date first appointed to serve as Trustee/officer of an MFS fund. Each Trustee has served continuously since appointment unless indicated otherwise. For the period from December 15, 2004 until February 22, 2005, Mr. Manning served as Advisory Trustee. For the period October 2008, until January 2012, Mr. Corcoran served as Treasurer of the Funds. Prior to January 2012, Messrs. DiLorenzo and Yost served as Assistant Treasurers of the Funds. |
| (j) | Directorships or trusteeships of companies required to report to the Securities and Exchange Commission (i.e., “public companies”). |
| (k) | “Interested person” of the Trust within the meaning of the Investment Company Act of 1940 (referred to as the 1940 Act), which is the principal federal law governing investment companies like the fund, as a result of position with MFS. The address of MFS is 500 Boylston Street, Boston, Massachusetts 02116. |
Each Trustee has been elected by shareholders and each Trustee and officer holds office until his or her successor is chosen and qualified or until his or her earlier death, resignation, retirement or removal. The Trust does not hold annual meetings for the purpose of electing Trustees, and Trustees are not elected for fixed terms. Messrs. Butler, Kavanaugh, Uek and Ms. Thomsen are members of the Trust’s Audit Committee.
Each of the Fund’s Trustees and officers holds comparable positions with certain other funds of which MFS or a subsidiary is the investment adviser or distributor, and, in the case of the officers, with certain affiliates of MFS. As of January 1, 2012, the Trustees served as board members of 131 funds within the MFS Family of Funds.
45
Trustees and Officers – continued
The Statement of Additional Information for the Fund includes further information about the Trustees and is available without charge upon request by calling 1-800-225-2606.
| | |
| Investment Adviser | | Custodian |
Massachusetts Financial Services Company
500 Boylston Street, Boston, MA 02116-3741 | | JPMorgan Chase Bank One Chase Manhattan Plaza, New York, NY 10081 |
| Distributor | | Independent Registered Public Accounting Firm |
MFS Fund Distributors, Inc.
500 Boylston Street, Boston, MA 02116-3741 | | Deloitte & Touche LLP 200 Berkeley Street, Boston, MA 02116 |
| Portfolio Manager | | |
Geoffrey Schechter | | |
46
BOARD REVIEW OF INVESTMENT ADVISORY AGREEMENT
A discussion regarding the Board’s most recent review and renewal of the fund’s Investment Advisory Agreement with MFS is available by clicking on the fund’s name under “Mutual Funds” in the “Products and Performance” section of the MFS Web site (mfs.com).
PROXY VOTING POLICIES AND INFORMATION
A general description of the MFS funds’ proxy voting policies and procedures is available without charge, upon request, by calling
1-800-225-2606, by visiting the Proxy Voting section of mfs.com or by visiting the SEC’s Web site at http://www.sec.gov.
Information regarding how the fund voted proxies relating to portfolio securities during the most recent twelve-month period ended June 30 is available without charge by visiting the Proxy Voting section of mfs.com or by visiting the SEC’s Web site at http://www.sec.gov.
QUARTERLY PORTFOLIO DISCLOSURE
The fund will file a complete schedule of portfolio holdings with the Securities and Exchange Commission (the Commission) for the first and third quarters of each fiscal year on Form N-Q. A shareholder can obtain the quarterly portfolio holdings report at mfs.com. The fund’s Form N-Q is also available on the EDGAR database on the Commission’s Internet Web site at http://www.sec.gov, and may be reviewed and copied at the:
Public Reference Room
Securities and Exchange Commission
100 F Street, NE, Room 1580
Washington, D.C. 20549
Information on the operation of the Public Reference Room may be obtained by calling the Commission at 1-800-SEC-0330. Copies of the fund’s Form N-Q also may be obtained, upon payment of a duplicating fee, by electronic request at the following e-mail address: publicinfo@sec.gov or by writing the Public Reference Section at the above address.
FURTHER INFORMATION
From time to time, MFS may post important information about the fund or the MFS funds on the MFS web site (mfs.com). This information is available by visiting the “News & Commentary” section of mfs.com or by clicking on the fund’s name under “Mutual Funds” in the “Products and Performance” section of mfs.com.
FEDERAL TAX INFORMATION (unaudited)
The fund will notify shareholders of amounts for use in preparing 2012 income tax forms in January 2013. The following information is provided pursuant to provisions of the Internal Revenue Code.
The fund designates $2,114,400 as capital gain dividends paid during the fiscal year.
47
rev. 3/11
| | | | |
| FACTS | | WHAT DOES MFS DO WITH YOUR PERSONAL INFORMATION? | |  |
| | |
| Why? | | Financial companies choose how they share your personal information. Federal law gives consumers the right to limit some but not all sharing. Federal law also requires us to tell you how we collect, share, and protect your personal information. Please read this notice carefully to understand what we do. |
| | |
| What? | | The types of personal information we collect and share depend on the product or service you have with us. This information can include: •Social Security number and account balances •Account transactions and transaction history •Checking account information and wire transfer instructions When you are no longer our customer, we continue to share your information as described in this notice. |
| | |
| How? | | All financial companies need to share customers’ personal information to run their everyday business. In the section below, we list the reasons financial companies can share their customers’ personal information; the reasons MFS chooses to share; and whether you can limit this sharing. |
| | | | |
| Reasons we can share your personal information | | Does MFS share? | | Can you limit
this sharing? |
For our everyday business purposes – such as to process your transactions, maintain your account(s), respond to court orders and legal investigations, or report to credit bureaus | | Yes | | No |
For our marketing purposes – to offer our products and services to you | | No | | We don’t share |
| For joint marketing with other financial companies | | No | | We don’t share |
For our affiliates’ everyday business purposes – information about your transactions and experiences | | No | | We don’t share |
For our affiliates’ everyday business purposes – information about your creditworthiness | | No | | We don’t share |
| For nonaffiliates to market to you | | No | | We don’t share |
| | |
| Questions? | | Call 800-225-2606 or go to mfs.com. |
48
| | |
| Who we are |
| Who is providing this notice? | | MFS Funds, MFS Investment Management, MFS Institutional Advisors, Inc., MFS Fund Distributors, Inc., MFS Heritage Trust Company, and MFS Service Center, Inc. |
| | |
| What we do |
| How does MFS protect my personal information? | | To protect your personal information from unauthorized access and use, we use security measures that comply with federal law. These measures include procedural, electronic, and physical safeguards for the protection of the personal information we collect about you. |
How does MFS
collect my personal information? | | We collect your personal information, for example, when you •open an account or provide account information •direct us to buy securities or direct us to sell your securities •make a wire transfer We also collect your personal information from others, such as credit bureaus, affiliates and other companies. |
| Why can’t I limit all sharing? | | Federal law gives you the right to limit only •sharing for affiliates’ everyday business purposes – information about your creditworthiness •affiliates from using your information to market to you •sharing for nonaffiliates to market to you State laws and individual companies may give you additional rights to limit sharing. |
| | |
| Definitions |
| Affiliates | | Companies related by common ownership or control. They can be financial and nonfinancial companies. •MFS does not share personal information with affiliates, except for everyday business purposes as described on page one of this notice. |
| Nonaffiliates | | Companies not related by common ownership or control. They can be financial and nonfinancial companies. •MFS does not share with nonaffiliates so they can market to you. |
| Joint Marketing | | A formal agreement between nonaffiliated financial companies that together market financial products or services to you. •MFS doesn’t jointly market. |
| | |
| Other important information |
| If you own an MFS product or receive an MFS service in the name of a third party such as a bank or broker-dealer, their privacy policy may apply to you instead of ours. |
49
Save paper with eDelivery.
MFS® will send you prospectuses, reports, and proxies directly via e-mail so you will get information faster with less mailbox clutter.
To sign up:
1. Go to mfs.com.
2. Log in via MFS® Access.
3. Select eDelivery.
If you own your MFS fund shares through a financial institution or a retirement plan, MFS® TALK, MFS® Access, or eDelivery may not be available to you.

Web site
mfs.com
MFS TALK
1-800-637-8255
24 hours a day
Account service and literature
Shareholders
1-800-225-2606
Financial advisors
1-800-343-2829
Retirement plan services
1-800-637-1255
Mailing address
MFS Service Center, Inc.
P.O. Box 55824
Boston, MA 02205-5824
Overnight mail
MFS Service Center, Inc.
c/o Boston Financial Data Services
30 Dan Road
Canton, MA 02021-2809

MFS® Global Real Estate Fund

ANNUAL REPORT
February 29, 2012
GRE-ANN
MFS® GLOBAL REAL ESTATE FUND
SIPC Contact Information: You may obtain information about the Securities Investor Protection Corporation (“SIPC”), including the SIPC Brochure, by contacting SIPC either by telephone (1-202-371-8300) or by accessing SIPC’s web site address (www.sipc.org).
The report is prepared for the general information of shareholders.
It is authorized for distribution to prospective investors only when preceded or accompanied by a current prospectus.
NOT FDIC INSURED Ÿ MAY LOSE VALUE Ÿ NO BANK GUARANTEE

LETTER FROM THE CHAIRMAN AND CEO
Dear Shareholders:
We are indeed living through some volatile times. Economic uncertainty is everywhere, as it seems no place in the world has been unmoved by crisis. Over the past year, we have seen a devastating earthquake and tsunami that have led to disruptions in the Japanese markets and supply chains. Protests have changed the face of the Middle East and left in their wake lingering tensions and questions about oil supplies. We have seen debt limits tested in Europe and the United States and policymakers grappling to craft often unpopular monetary and fiscal responses as consumers and businesses struggle with what appears to be a slowing global economy. And now, as the US economy begins to regain its footing, we see the economies of the eurozone heading toward recession as the region’s leaders continue to address sovereign debt crises.
When markets become volatile, managing risk becomes a top priority for investors and their advisors. At MFS® risk management is foremost in our minds in all market climates. Our analysts and portfolio managers keep risks firmly in mind when evaluating securities. Additionally, we have a team of quantitative analysts that measures and assesses the risk profiles of our portfolios and securities on an ongoing basis. The chief investment risk officer, who oversees the team, reports directly to the firm’s president and chief investment officer so the risk associated with each portfolio can be assessed objectively and independently.
As always, we continue to be mindful of the many economic challenges faced at the local, national, and international levels. It is in times such as these that we want to remind investors of the merits of maintaining a long-term view, adhering to basic investing principles such as asset allocation and diversification, and working closely with their advisors to research and identify appropriate investment opportunities.
Respectfully,

Robert J. Manning
Chairman and Chief Executive Officer
MFS Investment Management®
April 13, 2012
The opinions expressed in this letter are subject to change, may not be relied upon for investment advice, and no forecasts can be guaranteed.
1
PORTFOLIO COMPOSITION
Portfolio structure

| | | | |
| Top ten holdings | | | | |
| Simon Property Group, Inc., REIT | | | 5.8% | |
| Sun Hung Kai Properties Ltd. | | | 4.8% | |
| Link, REIT | | | 3.3% | |
| Public Storage, Inc., REIT | | | 3.2% | |
| Mitsui Fudosan Co. Ltd. | | | 3.2% | |
| Unibail-Rodamco | | | 3.1% | |
| Westfield Group, REIT | | | 3.1% | |
| Mitsubishi Estate Co. Ltd. | | | 2.7% | |
| Stockland, IEU | | | 2.4% | |
| Vornado Realty Trust, REIT | | | 2.4% | |
| |
| Equity industry | | | | |
| Real Estate | | | 97.8% | |
| | | | |
| Issuer country weightings (x) | | | | |
| United States | | | 49.6% | |
| Hong Kong | | | 11.2% | |
| Japan | | | 9.6% | |
| Australia | | | 8.4% | |
| United Kingdom | | | 5.2% | |
| Singapore | | | 4.0% | |
| France | | | 3.1% | |
| Brazil | | | 2.3% | |
| Austria | | | 2.2% | |
| Other Countries | | | 4.4% | |
| |
| Currency exposure weightings (y) | | | | |
| United States Dollar | | | 49.5% | |
| Hong Kong Dollar | | | 11.2% | |
| Japanese Yen | | | 9.6% | |
| Australian Dollar | | | 8.4% | |
| Euro | | | 8.3% | |
| British Pound Sterling | | | 5.2% | |
| Singapore Dollar | | | 4.0% | |
| Brazilian Real | | | 2.3% | |
| Canadian Dollar | | | 1.5% | |
| (x) | Represents the portfolio’s exposure to issuer countries as a percentage of a portfolio’s net assets. |
| (y) | Represents the portfolio’s exposure to a particular currency as a percentage of a portfolio’s net assets. |
Percentages are based on net assets as of 2/29/12.
The portfolio is actively managed and current holdings may be different.
2
MANAGEMENT REVIEW
Summary of Results
For the twelve months ended February 29, 2012, Class A shares of the MFS Global Real Estate Fund (the “fund”) provided a total return of –1.88%, at net asset value. This compares with a return of 0.76% for the fund’s benchmark, the FTSE EPRA/NAREIT Developed Real Estate Index (“FTSE Index”).
Market Environment
Prior to the beginning of the reporting period, looser U.S. monetary and fiscal policy fostered a sharp rebound in market risk sentiment. By the beginning of the period, global macroeconomic conditions had begun to weaken and renewed concerns surrounding eurozone sovereign debt arose, causing the recovery in asset valuations to plateau.
During the middle of the reporting period, worries about U.S. sovereign debt default and the long-term sustainability of the trend in U.S. fiscal policy resulted in one agency downgrading U.S. credit quality. Amidst this turmoil, global equity markets declined sharply and credit spreads widened. At the same time, global consumer and producer sentiment indicators fell precipitously and highly-rated sovereign bond yields hit multi-decade lows.
Late in the period, however, additional liquidity from the U.S. Federal Reserve (in the form of “Operation Twist”) and the European Central Bank (in the form of 3-year, Longer Term Refinancing Operations, or LTROs), coupled with improved global macroeconomic conditions, ushered in improved market dynamics.
Detractors from Performance
An overweight allocation to Austrian real estate investments detracted from relative performance. Holdings of retail property investment company Atrium European Real Estate (b) (Austria) was among the fund’s top relative detractors.
An overweight allocation to real estate investments in Italy also held back relative performance. The fund’s overweight position in Beni Stabili (Italy) hurt results as its shares underperformed the benchmark over the reporting period.
Security selection of U.S. real estate investments weakened relative performance. Holdings of real estate investment trust Parkway Properties, and the timing of the fund’s ownership in shares of AvalonBay Communities, dampened relative performance over the reporting period.
Elsewhere, the fund’s overweight positions in SEGRO (United Kingdom), Tokyo Tatemono (h) (Japan), and NTT Urban Development (Japan), and holdings of New World Development (h) (Hong Kong), dampened relative returns as all four securities underperformed the benchmark. Additionally, not holding strong-performing China Overseas Land & Investment (China), and an overweight position in shares of Corio (Netherlands), weighed on relative performance.
3
Management Review – continued
Contributors to Performance
The fund’s overweight allocation to real estate investments in Brazil, led by holdings of shopping mall operator BR Malls Participacoes (b) (Brazil), contributed to relative performance over the reporting period.
Elsewhere, holdings of Digital Realty Trust and Link Real Estate Investment Trust (Hong Kong) were among the fund’s top relative contributors. Not owning shares of Hongkong Land (Hong Kong) and Sumitomo Realty & Development (Japan) also helped relative results as both of these benchmark constituents underperformed during the period. Additionally, holdings of strong-performing Equity Lifestyle Properties, Taubman Centers (h), BioMed Realty Trust, and Lennar (b)(h) supported relative performance.
The fund’s cash position was also a contributor to relative performance. The fund strives to be fully invested and only holds cash to buy new holdings and to provide liquidity. In a period when equity markets declined, as measured by the fund’s benchmark, holding cash helped performance versus the benchmark, which has no cash position.
Respectfully,
Richard Gable
Portfolio Manager
Note to Shareholders: Thomas Pedulla and Leo Saraceno are no longer co-managers of the fund.
| (b) | Security is not a benchmark constituent. |
| (h) | Security was not held in the portfolio at period end. |
The views expressed in this report are those of the portfolio manager only through the end of the period of the report as stated on the cover and do not necessarily reflect the views of MFS or any other person in the MFS organization. These views are subject to change at any time based on market or other conditions, and MFS disclaims any responsibility to update such views. These views may not be relied upon as investment advice or an indication of trading intent on behalf of any MFS portfolio. References to specific securities are not recommendations of such securities, and may not be representative of any MFS portfolio’s current or future investments.
4
PERFORMANCE SUMMARY THROUGH 2/29/12
The following chart illustrates a representative class of the fund’s historical performance in comparison to its benchmark(s). Performance results include the deduction of the maximum applicable sales charge and reflect the percentage change in net asset value, including reinvestment of dividends and capital gains distributions. The performance of other share classes will be greater than or less than that of the class depicted below. Benchmarks are unmanaged and may not be invested in directly. Benchmark returns do not reflect sales charges, commissions or expenses. (See Notes to Performance Summary.)
Performance data shown represents past performance and is no guarantee of future results. Investment return and principal value fluctuate so your shares, when sold, may be worth more or less than the original cost; current performance may be lower or higher than quoted. The performance shown does not reflect the deduction of taxes, if any, that a shareholder would pay on fund distributions or the redemption of fund shares.
Growth of a Hypothetical $10,000 Investment (t)
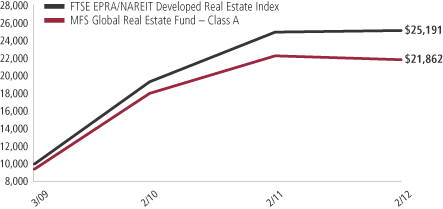
5
Performance Summary – continued
Total Returns through 2/29/12
Average annual without sales charge
| | | | | | | | | | |
| | | Share class | | Class inception date | | 1-yr | | Life (t) | | |
| | | A | | 3/11/09 | | (1.88)% | | 32.72% | | |
| | | I | | 3/11/09 | | (1.62)% | | 33.04% | | |
| Comparative benchmark | | | | | | |
| | | FTSE EPRA/NAREIT Developed Real Estate Index (f) | | 0.76% | | 36.28% | | |
| Average annual with sales charge | | | | | | |
| | | A
With Initial Sales Charge (5.75%) | | (7.52)% | | 30.10% | | |
Class I shares do not have a sales charge.
| (f) | Source: FactSet Research Systems Inc. |
| (t) | For the period from the class inception date through the stated period end. (See Notes to Performance Summary.) |
Benchmark Definition
FTSE EPRA/NAREIT Developed Real Estate Index – measures the performance of eligible real estate equities worldwide that generate a majority of their revenue and income through the ownership, disposure and development of income-producing real estate.
It is not possible to invest directly in an index.
Notes to Performance Summary
Average annual total return represents the average annual change in value for each share class for the periods presented. Life returns are presented where the share class has less than 10 years of performance history and represent the average annual total return from the class inception date to the stated period end date.
Performance results reflect any applicable expense subsidies and waivers in effect during the periods shown. Without such subsidies and waivers the fund’s performance results would be less favorable. Please see the prospectus and financial statements for complete details.
Performance results do not include adjustments made for financial reporting purposes in accordance with U.S. generally accepted accounting principles and may differ from amounts reported in the financial highlights.
From time to time the fund may receive proceeds from litigation settlements, without which performance would be lower.
6
EXPENSE TABLE
Fund expenses borne by the shareholders during the period,
September 1, 2011 through February 29, 2012
As a shareholder of the fund, you incur two types of costs: (1) transaction costs, including sales charges (loads) on certain purchase or redemption payments, and (2) ongoing costs, including management fees; distribution and service (12b-1) fees; and other fund expenses. This example is intended to help you understand your ongoing costs (in dollars) of investing in the fund and to compare these costs with the ongoing costs of investing in other mutual funds.
The example is based on an investment of $1,000 invested at the beginning of the period and held for the entire period September 1, 2011 through February 29, 2012.
Actual Expenses
The first line for each share class in the following table provides information about actual account values and actual expenses. You may use the information in this line, together with the amount you invested, to estimate the expenses that you paid over the period. Simply divide your account value by $1,000 (for example, an $8,600 account value divided by $1,000 = 8.6), then multiply the result by the number in the first line under the heading entitled “Expenses
Paid During Period” to estimate the expenses you paid on your account during this period.
Hypothetical Example for Comparison Purposes
The second line for each share class in the following table provides information about hypothetical account values and hypothetical expenses based on the fund’s actual expense ratio and an assumed rate of return of 5% per year before expenses, which is not the fund’s actual return. The hypothetical account values and expenses may not be used to estimate the actual ending account balance or expenses you paid for the period. You may use this information to compare the ongoing costs of investing in the fund and other funds. To do so, compare this 5% hypothetical example with the 5% hypothetical examples that appear in the shareholder reports
of the other funds.
Please note that the expenses shown in the table are meant to highlight your ongoing costs only and do not reflect any transactional costs, such as sales charges (loads). Therefore, the second line for each share class in the table is useful in comparing ongoing costs only, and will not help you determine the relative total costs of owning different funds. In addition, if these transactional costs were included, your costs would have been higher.
7
Expense Table – continued
| | | | | | | | | | | | | | | | | | |
Share
Class | | | | Annualized
Expense
Ratio | | | Beginning
Account Value
9/01/11 | | | Ending
Account Value
2/29/12 | | | Expenses
Paid During
Period (p)
9/01/11-2/29/12 | |
| A | | Actual | | | 1.25% | | | | $1,000.00 | | | | $1,042.76 | | | | $6.35 | |
| | Hypothetical (h) | | | 1.25% | | | | $1,000.00 | | | | $1,018.65 | | | | $6.27 | |
| I | | Actual | | | 1.00% | | | | $1,000.00 | | | | $1,044.38 | | | | $5.08 | |
| | Hypothetical (h) | | | 1.00% | | | | $1,000.00 | | | | $1,019.89 | | | | $5.02 | |
| (h) | 5% class return per year before expenses. |
| (p) | Expenses paid are equal to each class’ annualized expense ratio, as shown above, multiplied by the average account value over the period, multiplied by the number of days in the period, divided by the number of days in the year. Expenses paid do not include any applicable sales charges (loads). If these transaction costs had been included, your costs would have been higher. |
8
PORTFOLIO OF INVESTMENTS
2/29/12
The Portfolio of Investments is a complete list of all securities owned by your fund. It is categorized by broad-based asset classes.
| | | | | | | | |
| Common Stocks - 97.8% | | | | | | | | |
| Issuer | | Shares/Par | | | Value ($) | |
| | | | | | | | |
| Real Estate - 97.8% | | | | | | | | |
| Advance Residence Investment Corp., REIT | | | 1,053 | | | $ | 1,954,905 | |
| Alexandria Real Estate Equities, Inc., REIT | | | 49,188 | | | | 3,526,288 | |
| Atrium European Real Estate Ltd. | | | 1,146,260 | | | | 5,451,967 | |
| AvalonBay Communities, Inc., REIT | | | 36,680 | | | | 4,756,296 | |
| Beni Stabili S.p.A. | | | 4,336,363 | | | | 2,423,592 | |
| Big Yellow Group PLC, REIT | | | 1,082,270 | | | | 4,993,172 | |
| BioMed Realty Trust, Inc., REIT | | | 243,943 | | | | 4,493,430 | |
| Boardwalk, REIT | | | 28,155 | | | | 1,583,532 | |
| Boston Properties, Inc., REIT | | | 44,603 | | | | 4,529,435 | |
| BR Malls Participacoes S.A. | | | 429,971 | | | | 5,510,940 | |
| British Land Co. PLC, REIT | | | 247,415 | | | | 1,851,160 | |
| CapitaLand Ltd. | | | 2,116,030 | | | | 5,174,469 | |
| CFS Retail Property Trust, REIT | | | 2,113,023 | | | | 4,000,092 | |
| Corio N.V., REIT | | | 60,659 | | | | 2,915,031 | |
| Cousins Properties, Inc., REIT | | | 331,607 | | | | 2,450,576 | |
| DCT Industrial Trust, Inc., REIT | | | 337,330 | | | | 1,909,288 | |
| DDR Corp., REIT | | | 153,010 | | | | 2,162,031 | |
| Derwent London PLC, REIT | | | 64,790 | | | | 1,741,958 | |
| Digital Realty Trust, Inc., REIT | | | 30,991 | | | | 2,246,847 | |
| Douglas Emmett, Inc., REIT | | | 104,046 | | | | 2,192,249 | |
| DuPont Fabros Technology, Inc., REIT | | | 87,191 | | | | 1,996,674 | |
| EastGroup Properties, Inc., REIT | | | 76,220 | | | | 3,673,042 | |
| Entertainment Properties Trust, REIT | | | 47,845 | | | | 2,176,947 | |
| Equity Lifestyle Properties, Inc., REIT | | | 45,746 | | | | 3,042,566 | |
| Federal Realty Investment Trust, REIT | | | 27,965 | | | | 2,666,463 | |
| Global Logistic Properties Ltd. (a) | | | 2,612,901 | | | | 4,533,244 | |
| GSW Immobilien AG (a) | | | 53,729 | | | | 1,689,362 | |
| Hang Lung Properties Ltd. | | | 909,256 | | | | 3,426,860 | |
| Henderson Land Development Co. Ltd. | | | 234,643 | | | | 1,473,288 | |
| Home Properties, Inc., REIT | | | 59,213 | | | | 3,412,445 | |
| Host Hotels & Resorts, Inc., REIT | | | 245,566 | | | | 3,875,031 | |
| Kenedix Realty Investment Corp., REIT | | | 623 | | | | 2,145,897 | |
| Kimco Realty Corp., REIT | | | 219,955 | | | | 4,042,773 | |
| Land Securities Group PLC | | | 225,284 | | | | 2,419,229 | |
| Link, REIT | | | 2,129,891 | | | | 7,991,004 | |
| Mack-Cali Realty Corp., REIT | | | 49,825 | | | | 1,424,995 | |
| Macquarie Goodman Group, REIT | | | 4,093,083 | | | | 3,028,844 | |
| Medical Properties Trust, Inc., REIT | | | 466,533 | | | | 4,534,701 | |
9
Portfolio of Investments – continued
| | | | | | | | |
| Issuer | | Shares/Par | | | Value ($) | |
| Common Stocks - continued | | | | | | | | |
| Real Estate - continued | | | | | | | | |
| Mid-America Apartment Communities, Inc., REIT | | | 69,241 | | | $ | 4,318,561 | |
| Mitsubishi Estate Co. Ltd. | | | 355,135 | | | | 6,434,952 | |
| Mitsui Fudosan Co. Ltd. | | | 408,274 | | | | 7,762,544 | |
| National Retail Properties, Inc., REIT | | | 112,950 | | | | 3,010,117 | |
| Nippon Building Fund, Inc., REIT | | | 207 | | | | 1,980,367 | |
| NTT Urban Development Corp. | | | 3,662 | | | | 2,922,106 | |
| Parkway Properties, Inc., REIT | | | 198,261 | | | | 1,980,627 | |
| Plum Creek Timber Co. Inc., REIT | | | 82,464 | | | | 3,229,290 | |
| Primaris Retail, REIT | | | 89,375 | | | | 1,961,020 | |
| Prologis, Inc., REIT | | | 118,030 | | | | 3,972,890 | |
| Public Storage, Inc., REIT | | | 58,682 | | | | 7,867,496 | |
| SEGRO PLC, REIT | | | 456,706 | | | | 1,707,448 | |
| Simon Property Group, Inc., REIT | | | 103,279 | | | | 13,992,239 | |
| Starwood Property Trust, Inc., REIT | | | 121,600 | | | | 2,400,384 | |
| Stockland, IEU | | | 1,740,885 | | | | 5,886,673 | |
| Sun Hung Kai Properties Ltd. | | | 755,231 | | | | 11,594,820 | |
| Tanger Factory Outlet Centers, Inc., REIT | | | 106,272 | | | | 3,111,644 | |
| Unibail-Rodamco | | | 39,204 | | | | 7,573,563 | |
| Ventas, Inc., REIT | | | 74,793 | | | | 4,182,425 | |
| Vornado Realty Trust, REIT | | | 71,493 | | | | 5,843,123 | |
| Westfield Group, REIT | | | 796,301 | | | | 7,453,951 | |
| Weyerhaeuser Co., REIT | | | 102,179 | | | | 2,134,519 | |
| Wharf Holdings Ltd. | | | 444,596 | | | | 2,771,848 | |
| Total Common Stocks (Identified Cost, $186,005,982) | | | | | | $ | 237,513,230 | |
| | |
| Money Market Funds - 2.3% | | | | | | | | |
MFS Institutional Money Market Portfolio, 0.1%,
at Cost and Net Asset Value (v) | | | 5,523,158 | | | $ | 5,523,158 | |
| Total Investments (Identified Cost, $191,529,140) | | | | | | $ | 243,036,388 | |
| | |
| Other Assets, Less Liabilities - (0.1)% | | | | | | | (284,092 | ) |
| Net Assets - 100.0% | | | | | | $ | 242,752,296 | |
| (a) | Non-income producing security. |
| (v) | Underlying affiliated fund that is available only to investment companies managed by MFS. The rate quoted for the MFS Institutional Money Market Portfolio is the annualized seven-day yield of the fund at period end. |
The following abbreviations are used in this report and are defined:
| IEU | | International Equity Unit |
| PLC | | Public Limited Company |
| REIT | | Real Estate Investment Trust |
See Notes to Financial Statements
10
Financial Statements
STATEMENT OF ASSETS AND LIABILITIES
At 2/29/12
This statement represents your fund’s balance sheet, which details the assets and liabilities comprising the total value of the fund.
| | | | |
| Assets | | | | |
Investments- | | | | |
Non-affiliated issuers, at value (identified cost, $186,005,982) | | | $237,513,230 | |
Underlying affiliated funds, at cost and value | | | 5,523,158 | |
Total investments, at value (identified cost, $191,529,140) | | | $243,036,388 | |
Foreign currency, at value (identified cost, $615,674) | | | 624,893 | |
Receivables for | | | | |
Investments sold | | | 742,200 | |
Fund shares sold | | | 153,078 | |
Interest and dividends | | | 189,202 | |
Other assets | | | 2,338 | |
Total assets | | | $244,748,099 | |
| Liabilities | | | | |
Payables for | | | | |
Investments purchased | | | $1,889,244 | |
Fund shares reacquired | | | 18,744 | |
Payable to affiliates | | | | |
Investment adviser | | | 12,206 | |
Shareholder servicing costs | | | 27 | |
Distribution and service fees | | | 3 | |
Payable for independent Trustees’ compensation | | | 20 | |
Accrued expenses and other liabilities | | | 75,559 | |
Total liabilities | | | $1,995,803 | |
Net assets | | | $242,752,296 | |
| Net assets consist of | | | | |
Paid-in capital | | | $198,209,559 | |
Unrealized appreciation (depreciation) on investments and translation of assets and liabilities in foreign currencies | | | 51,512,534 | |
Accumulated distributions in excess of net realized gain on investments and foreign currency transactions | | | (7,711,644 | ) |
Undistributed net investment income | | | 741,847 | |
Net assets | | | $242,752,296 | |
Shares of beneficial interest outstanding | | | 17,959,159 | |
| | | | | | | | | | | | |
| | | Net assets | | | Shares
outstanding | | | Net asset value
per share (a) | |
Class A | | | $232,114 | | | | 17,182 | | | | $13.51 | |
Class I | | | 242,520,182 | | | | 17,941,977 | | | | 13.52 | |
Shares outstanding are rounded for presentation purposes.
| (a) | Maximum offering price per share was equal to the net asset value per share for all share classes, except for Class A, for which the maximum offering price per share was $14.33 [100 / 94.25 x $13.51]. On sales of $50,000 or more, the maximum offering price of Class A shares is reduced. A contingent deferred sales charge may be imposed on redemptions of Class A shares. Redemption price per share was equal to the net asset value per share for Class I. |
See Notes to Financial Statements
11
Financial Statements
STATEMENT OF OPERATIONS
Year ended 2/29/12
This statement describes how much your fund earned in investment income and accrued in expenses. It also describes any gains and/or losses generated by fund operations.
| | | | |
| Net investment income | | | | |
Income | | | | |
Dividends | | | $6,692,522 | |
Dividends from underlying affiliated funds | | | 4,804 | |
Foreign taxes withheld | | | (200,049 | ) |
Total investment income | | | $6,497,277 | |
Expenses | | | | |
Management fee | | | $1,966,105 | |
Distribution and service fees | | | 557 | |
Shareholder servicing costs | | | 140 | |
Administrative services fee | | | 42,439 | |
Independent Trustees’ compensation | | | 10,959 | |
Custodian fee | | | 56,578 | |
Shareholder communications | | | 7,230 | |
Audit and tax fees | | | 53,251 | |
Legal fees | | | 3,189 | |
Miscellaneous | | | 27,813 | |
Total expenses | | | $2,168,261 | |
Fees paid indirectly | | | (1,334 | ) |
Reduction of expenses by investment adviser | | | (899 | ) |
Net expenses | | | $2,166,028 | |
Net investment income | | | $4,331,249 | |
Realized and unrealized gain (loss) on investments
and foreign currency transactions | | | | |
Realized gain (loss) (identified cost basis) | | | | |
Investment transactions | | | $8,884,121 | |
Foreign currency transactions | | | (21,672 | ) |
Net realized gain (loss) on investments
and foreign currency transactions | | | $8,862,449 | |
Change in unrealized appreciation (depreciation) | | | | |
Investments | | | $(13,181,682 | ) |
Translation of assets and liabilities in foreign currencies | | | 138 | |
Net unrealized gain (loss) on investments
and foreign currency translation | | | $(13,181,544 | ) |
Net realized and unrealized gain (loss) on investments
and foreign currency | | | $(4,319,095 | ) |
Change in net assets from operations | | | $12,154 | |
See Notes to Financial Statements
12
Financial Statements
STATEMENTS OF CHANGES IN NET ASSETS
These statements describe the increases and/or decreases in net assets resulting from operations, any distributions, and any shareholder transactions.
| | | | | | | | |
| | | Years ended 2/29, 2/28 | |
| | | 2012 | | | 2011 | |
| Change in net assets | | | | | | |
| From operations | | | | | | | | |
Net investment income | | | $4,331,249 | | | | $7,018,995 | |
Net realized gain (loss) on investments and
foreign currency transactions | | | 8,862,449 | | | | 14,789,575 | |
Net unrealized gain (loss) on investments and
foreign currency translation | | | (13,181,544 | ) | | | 19,301,428 | |
Change in net assets from operations | | | $12,154 | | | | $41,109,998 | |
| Distributions declared to shareholders | | | | | | | | |
From net investment income | | | $(5,575,274 | ) | | | $(10,363,080 | ) |
From net realized gain on investments | | | (7,176,979 | ) | | | (20,475,685 | ) |
Total distributions declared to shareholders | | | $(12,752,253 | ) | | | $(30,838,765 | ) |
Change in net assets from fund share transactions | | | $39,174,069 | | | | $41,508,984 | |
Total change in net assets | | | $26,433,970 | | | | $51,780,217 | |
| Net assets | | | | | | | | |
At beginning of period | | | 216,318,326 | | | | 164,538,109 | |
At end of period (including undistributed net investment
income of $741,847 and $1,091,864, respectively) | | | $242,752,296 | | | | $216,318,326 | |
See Notes to Financial Statements
13
Financial Statements
FINANCIAL HIGHLIGHTS
The financial highlights table is intended to help you understand the fund’s financial performance for the past 5 years (or life of a particular share class, if shorter). Certain information reflects financial results for a single fund share. The total returns in the table represent the rate by which an investor would have earned (or lost) on an investment in the fund share class (assuming reinvestment of all distributions) held for the entire period.
| | | | | | | | | | | | |
| Class A | | Years ended 2/29, 2/28 | |
| | | 2012 | | | 2011 | | | 2010 (c) | |
Net asset value, beginning of period | | | $14.57 | | | | $14.02 | | | | $10.00 | |
| Income (loss) from investment operations | | | | | | | | | | | | |
Net investment income (d) | | | $0.23 | | | | $0.49 | | | | $0.42 | |
Net realized and unrealized gain (loss)
on investments and foreign currency | | | (0.55 | ) | | | 2.46 | | | | 8.68 | |
Total from investment operations | | | $(0.32 | ) | | | $2.95 | | | | $9.10 | |
| Less distributions declared to shareholders | | | | | | | | | | | | |
From net investment income | | | $(0.30 | ) | | | $(0.77 | ) | | | $(2.00 | ) |
From net realized gain on investments | | | (0.44 | ) | | | (1.63 | ) | | | (3.08 | ) |
Total distributions declared to shareholders | | | $(0.74 | ) | | | $(2.40 | ) | | | $(5.08 | ) |
Net asset value, end of period (x) | | | $13.51 | | | | $14.57 | | | | $14.02 | |
Total return (%) (r)(s)(t)(x) | | | (1.81 | ) | | | 23.61 | | | | 91.24 | (n) |
Ratios (%) (to average net assets)
and Supplemental data: | | | | | | | | | | | | |
Expenses before expense reductions (f) | | | 1.24 | | | | 1.25 | | | | 1.28 | (a) |
Expenses after expense reductions (f) | | | 1.24 | | | | 1.25 | | | | 1.28 | (a) |
Net investment income | | | 1.74 | | | | 3.45 | | | | 2.89 | (a) |
Portfolio turnover | | | 37 | | | | 33 | | | | 91 | |
Net assets at end of period (000 omitted) | | | $232 | | | | $236 | | | | $191 | |
See Notes to Financial Statements
14
Financial Highlights – continued
| | | | | | | | | | | | |
| Class I | | Years ended 2/29, 2/28 | |
| | | 2012 | | | 2011 | | | 2010 (c) | |
Net asset value, beginning of period | | | $14.58 | | | | $14.03 | | | | $10.00 | |
| Income (loss) from investment operations | | | | | | | | | | | | |
Net investment income (d) | | | $0.27 | | | | $0.54 | | | | $0.47 | |
Net realized and unrealized gain (loss)
on investments and foreign currency | | | (0.56 | ) | | | 2.45 | | | | 8.67 | |
Total from investment operations | | | $(0.29 | ) | | | $2.99 | | | | $9.14 | |
| Less distributions declared to shareholders | | | | | | | | | | | | |
From net investment income | | | $(0.33 | ) | | | $(0.81 | ) | | | $(2.03 | ) |
From net realized gain on investments | | | (0.44 | ) | | | (1.63 | ) | | | (3.08 | ) |
Total distributions declared to shareholders | | | $(0.77 | ) | | | $(2.44 | ) | | | $(5.11 | ) |
Net asset value, end of period (x) | | | $13.52 | | | | $14.58 | | | | $14.03 | |
Total return (%) (r)(s)(x) | | | (1.54 | ) | | | 23.89 | | | | 91.71 | (n) |
Ratios (%) (to average net assets)
and supplemental data: | | | | | | | | | | | | |
Expenses before expense reductions (f) | | | 0.99 | | | | 1.00 | | | | 1.03 | (a) |
Expenses after expense reductions (f) | | | 0.99 | | | | 1.00 | | | | 1.03 | (a) |
Net investment income | | | 1.98 | | | | 3.77 | | | | 3.22 | (a) |
Portfolio turnover | | | 37 | | | | 33 | | | | 91 | |
Net assets at end of period (000 omitted) | | | $242,520 | | | | $216,082 | | | | $164,347 | |
| (c) | For the period from the commencement of the fund’s investment operations, March 11, 2009, through the stated period end. |
| (d) | Per share data is based on average shares outstanding. |
| (f) | Ratios do not reflect reductions from fees paid indirectly, if applicable. |
| (r) | Certain expenses have been reduced without which performance would have been lower. |
| (s) | From time to time the fund may receive proceeds from litigation settlements, without which performance would be lower. |
| (t) | Total returns do not include any applicable sales charges. |
| (x) | The net asset values per share and total returns have been calculated on net assets which include adjustments made in accordance with U.S. generally accepted accounting principles required at period end for financial reporting purposes. |
See Notes to Financial Statements
15
NOTES TO FINANCIAL STATEMENTS
| (1) | | Business and Organization |
MFS Global Real Estate Fund (the fund) is a series of MFS Series Trust XIII (the trust). The trust is organized as a Massachusetts business trust and is registered under the Investment Company Act of 1940, as amended, as an open-end management investment company.
| (2) | | Significant Accounting Policies |
General – The preparation of financial statements in conformity with U.S. generally accepted accounting principles requires management to make estimates and assumptions that affect the reported amounts of assets and liabilities, and disclosure of contingent assets and liabilities at the date of the financial statements and the reported amounts of revenues and expenses during the reporting period. Actual results could differ from those estimates. In the preparation of these financial statements, management has evaluated subsequent events occurring after the date of the fund’s Statement of Assets and Liabilities through the date that the financial statements were issued. The fund invests a significant amount of its net assets in U.S. and foreign real estate related investments and as a result is subject to certain risks associated with the direct ownership of real estate and the real estate industry in general. These include risks related to general, regional and local economic conditions; fluctuations in interest rates; property tax rates, zoning laws, environmental regulations and other governmental action; cash flow dependency; increased operating expenses; lack of availability of mortgage funds; losses due to natural disasters; changes in property values and rental rates; and other factors. The fund invests in foreign securities. Investments in foreign securities are vulnerable to the effects of changes in the relative values of the local currency and the U.S. dollar and to the effects of changes in each country’s legal, political, and economic environment.
In December 2011, the Financial Accounting Standards Board issued Accounting Standards Update 2011-11, Balance Sheet (Topic 210) – Disclosures about Offsetting Assets and Liabilities (“ASU 2011-11”). Effective for annual reporting periods beginning on or after January 1, 2013 and interim periods within those annual periods, ASU 2011-11 is intended to enhance disclosure requirements on the offsetting of financial assets and liabilities. Although still evaluating the potential impacts of ASU 2011-11 to the fund, management expects that the impact of the fund’s adoption will be limited to additional financial statement disclosures.
Investment Valuations – Equity securities, including restricted equity securities, are generally valued at the last sale or official closing price as provided by a third-party pricing service on the market or exchange on which
16
Notes to Financial Statements – continued
they are primarily traded. Equity securities, for which there were no sales reported that day, are generally valued at the last quoted daily bid quotation as provided by a third-party pricing service on the market or exchange on which such securities are primarily traded. Equity securities held short, for which there were no sales reported for that day, are generally valued at the last quoted daily ask quotation as provided by a third-party pricing service on the market or exchange on which such securities are primarily traded. Short-term instruments with a maturity at issuance of 60 days or less generally are valued at amortized cost, which approximates market value. Open-end investment companies are generally valued at net asset value per share. Securities and other assets generally valued on the basis of information from a third-party pricing service may also be valued at a broker/dealer bid quotation. Values obtained from third-party pricing services can utilize both transaction data and market information such as yield, quality, coupon rate, maturity, type of issue, trading characteristics, and other market data. The values of foreign securities and other assets and liabilities expressed in foreign currencies are converted to U.S. dollars using the mean of bid and asked prices for rates provided by a third-party pricing service.
The Board of Trustees has delegated primary responsibility for determining or causing to be determined the value of the fund’s investments (including any fair valuation) to the adviser pursuant to valuation policies and procedures approved by the Board. If the adviser determines that reliable market quotations are not readily available, investments are valued at fair value as determined in good faith by the adviser in accordance with such procedures under the oversight of the Board of Trustees. Under the fund’s valuation policies and procedures, market quotations are not considered to be readily available for most types of debt instruments and floating rate loans and many types of derivatives. These investments are generally valued at fair value based on information from third-party pricing services. In addition, investments may be valued at fair value if the adviser determines that an investment’s value has been materially affected by events occurring after the close of the exchange or market on which the investment is principally traded (such as foreign exchange or market) and prior to the determination of the fund’s net asset value, or after the halting of trading of a specific security where trading does not resume prior to the close of the exchange or market on which the security is principally traded. Events that occur on a frequent basis after foreign markets close (such as developments in foreign markets and significant movements in the U.S. markets) and prior to the determination of the fund’s net asset value may be deemed to have a material effect on the value of securities traded in foreign markets. Accordingly, the fund’s foreign equity securities may often be valued at fair value. The adviser generally relies on third-party pricing services or other information (such as the correlation with
17
Notes to Financial Statements – continued
price movements of similar securities in the same or other markets; the type, cost and investment characteristics of the security; the business and financial condition of the issuer; and trading and other market data) to assist in determining whether to fair value and at what value to fair value an investment. The value of an investment for purposes of calculating the fund’s net asset value can differ depending on the source and method used to determine value. When fair valuation is used, the value of an investment used to determine the fund’s net asset value may differ from quoted or published prices for the same investment. There can be no assurance that the fund could obtain the fair value assigned to an investment if it were to sell the investment at the same time at which the fund determines its net asset value per share.
Various inputs are used in determining the value of the fund’s assets or liabilities. These inputs are categorized into three broad levels. In certain cases, the inputs used to measure fair value may fall into different levels of the fair value hierarchy. In such cases, an investment’s level within the fair value hierarchy is based on the lowest level of input that is significant to the fair value measurement. The fund’s assessment of the significance of a particular input to the fair value measurement in its entirety requires judgment, and considers factors specific to the investment. Level 1 includes unadjusted quoted prices in active markets for identical assets or liabilities. Level 2 includes other significant observable market-based inputs (including quoted prices for similar securities, interest rates, prepayment speed, and credit risk). Level 3 includes unobservable inputs, which may include the adviser’s own assumptions in determining the fair value of investments. The following is a summary of the levels used as of February 29, 2012 in valuing the fund’s assets or liabilities:
| | | | | | | | | | | | | | | | |
| Investments at Value | | Level 1 | | | Level 2 | | | Level 3 | | | Total | |
| Equity Securities: | | | | | | | | | | | | | | | | |
United States | | | $115,155,392 | | | | $— | | | | $— | | | | $115,155,392 | |
Hong Kong | | | 9,464,292 | | | | 17,793,528 | | | | — | | | | 27,257,820 | |
Japan | | | 2,145,897 | | | | 21,054,874 | | | | — | | | | 23,200,771 | |
Australia | | | 3,028,844 | | | | 17,340,716 | | | | — | | | | 20,369,560 | |
United Kingdom | | | 12,712,967 | | | | — | | | | — | | | | 12,712,967 | |
Singapore | | | — | | | | 9,707,713 | | | | — | | | | 9,707,713 | |
France | | | 7,573,563 | | | | — | | | | — | | | | 7,573,563 | |
Brazil | | | 5,510,940 | | | | — | | | | — | | | | 5,510,940 | |
Austria | | | 5,451,967 | | | | — | | | | — | | | | 5,451,967 | |
Other Countries | | | 10,572,537 | | | | — | | | | — | | | | 10,572,537 | |
| Mutual Funds | | | 5,523,158 | | | | — | | | | — | | | | 5,523,158 | |
| Total Investments | | | $177,139,557 | | | | $65,896,831 | | | | $— | | | | $243,036,388 | |
For further information regarding security characteristics, see the Portfolio of Investments.
18
Notes to Financial Statements – continued
Foreign Currency Translation – Purchases and sales of foreign investments, income, and expenses are converted into U.S. dollars based upon currency exchange rates prevailing on the respective dates of such transactions or on the reporting date for foreign denominated receivables and payables. Gains and losses attributable to foreign currency exchange rates on sales of securities are recorded for financial statement purposes as net realized gains and losses on investments. Gains and losses attributable to foreign exchange rate movements on receivables, payables, income and expenses are recorded for financial statement purposes as foreign currency transaction gains and losses. That portion of both realized and unrealized gains and losses on investments that results from fluctuations in foreign currency exchange rates is not separately disclosed.
Indemnifications – Under the fund’s organizational documents, its officers and Trustees may be indemnified against certain liabilities and expenses arising out of the performance of their duties to the fund. Additionally, in the normal course of business, the fund enters into agreements with service providers that may contain indemnification clauses. The fund’s maximum exposure under these agreements is unknown as this would involve future claims that may be made against the fund that have not yet occurred.
Investment Transactions and Income – Investment transactions are recorded on the trade date. Dividends received in cash are recorded on the ex-dividend date. Certain dividends from foreign securities will be recorded when the fund is informed of the dividend if such information is obtained subsequent to the ex-dividend date. Dividend and interest payments received in additional securities are recorded on the ex-dividend or ex-interest date in an amount equal to the value of the security on such date.
The fund may receive proceeds from litigation settlements. Any proceeds received from litigation involving portfolio holdings are reflected in the Statement of Operations in realized gain/loss if the security has been disposed of by the fund or in unrealized gain/loss if the security is still held by the fund. Any other proceeds from litigation not related to portfolio holdings are reflected as other income in the Statement of Operations.
Fees Paid Indirectly – The fund’s custody fee may be reduced according to an arrangement that measures the value of cash deposited with the custodian by the fund. This amount, for the year ended February 29, 2012, is shown as a reduction of total expenses on the Statement of Operations.
Tax Matters and Distributions – The fund intends to qualify as a regulated investment company, as defined under Subchapter M of the Internal Revenue Code, and to distribute all of its taxable income, including realized capital gains. As a result, no provision for federal income tax is required. The fund’s federal tax returns, when filed, will remain subject to examination by the
19
Notes to Financial Statements – continued
Internal Revenue Service for a three year period. Foreign taxes have been accrued by the fund in the accompanying financial statements.
Distributions to shareholders are recorded on the ex-dividend date. Income and capital gain distributions are determined in accordance with income tax regulations, which may differ from U.S. generally accepted accounting principles. Certain capital accounts in the financial statements are periodically adjusted for permanent differences in order to reflect their tax character. These adjustments have no impact on net assets or net asset value per share. Temporary differences which arise from recognizing certain items of income, expense, gain or loss in different periods for financial statement and tax purposes will reverse at some time in the future. Distributions in excess of net investment income or net realized gains are temporary overdistributions for financial statement purposes resulting from differences in the recognition or classification of income or distributions for financial statement and tax purposes.
Book/tax differences primarily relate to passive foreign investment company adjustments and wash sale loss deferrals.
The tax character of distributions declared to shareholders for the last two fiscal years is as follows:
| | | | | | | | |
| | | 2/29/12 | | | 2/28/11 | |
| Ordinary income (including any short-term capital gains) | | | $6,802,871 | | | | $26,689,299 | |
| Long-term capital gains | | | 5,949,382 | | | | 4,149,466 | |
| Total distributions | | | $12,752,253 | | | | $30,838,765 | |
The federal tax cost and the tax basis components of distributable earnings were as follows:
| | | | |
| As of 2/29/12 | | | |
| Cost of investments | | | $202,397,658 | |
| Gross appreciation | | | 44,932,531 | |
| Gross depreciation | | | (4,293,801 | ) |
| Net unrealized appreciation (depreciation) | | | $40,638,730 | |
| Undistributed ordinary income | | | 2,484,428 | |
| Undistributed long-term capital gain | | | 1,414,293 | |
| Other temporary differences | | | 5,286 | |
Multiple Classes of Shares of Beneficial Interest – The fund offers multiple classes of shares, which differ in their respective distribution and service fees. The fund’s income, realized and unrealized gain (loss), and common expenses are allocated to shareholders based on the daily net assets of each class. Dividends are declared separately for each class. Differences in per share dividend rates are generally due to differences in separate class expenses. The
20
Notes to Financial Statements – continued
fund’s distributions declared to shareholders as reported on the Statements of Changes in Net Assets are presented by class as follows:
| | | | | | | | | | | | | | | | |
| | | From net investment
income | | | From net realized gain on
investments | |
| | | Year ended
2/29/12 | | | Year ended
2/28/11 | | | Year ended
2/29/12 | | | Year ended
2/28/11 | |
| Class A | | | $4,914 | | | | $11,221 | | | | $7,172 | | | | $22,957 | |
| Class I | | | 5,570,360 | | | | 10,351,859 | | | | 7,169,807 | | | | 20,452,728 | |
| Total | | | $5,575,274 | | | | $10,363,080 | | | | $7,176,979 | | | | $20,475,685 | |
| (3) | | Transactions with Affiliates |
Investment Adviser – The fund has an investment advisory agreement with MFS to provide overall investment management and related administrative services and facilities to the fund. The management fee is computed daily and paid monthly at the following annual rates:
| | | | |
| First $1 billion of average daily net assets | | | 0.90 | % |
| Next $1.5 billion of average daily net assets | | | 0.75 | % |
| Average daily net assets in excess of $2.5 billion | | | 0.65 | % |
The management fee incurred for the year ended February 29, 2012 was equivalent to an annual effective rate of 0.90% of the fund’s average daily net assets.
Prior to May 1, 2011, the adviser and the fund had retained Sun Capital Advisers LLC, referred to as Sun Capital or the sub-adviser, as a sub-adviser to the fund. MFS paid a sub-advisory fee to Sun Capital at the following rates:
| | | | |
| First $1 billion of average daily net assets | | | 0.40 | % |
| Next $1.5 billion of average daily net assets | | | 0.33 | % |
| Average daily net assets in excess of $2.5 billion | | | 0.29 | % |
The sub-advisory agreement with Sun Capital was terminated effective May 1, 2011 and accordingly MFS no longer pays the sub-advisory fee to Sun Capital.
Distributor – MFS Fund Distributors, Inc. (MFD), a wholly-owned subsidiary of MFS, as distributor, received $0 for the year ended February 29, 2012, as its portion of the initial sales charge on sales of Class A shares of the fund.
The Board of Trustees has adopted a distribution plan for certain class shares pursuant to Rule 12b-1 of the Investment Company Act of 1940.
The fund’s distribution plan provides that the fund will pay MFD for services provided by MFD and financial intermediaries in connection with the distribution and servicing of certain share classes. One component of the plan is a distribution fee paid to MFD and another component of the plan is a service fee paid to MFD. MFD may subsequently pay all, or a portion, of the distribution and/or service fees to financial intermediaries.
21
Notes to Financial Statements – continued
Distribution Plan Fee Table:
| | | | | | | | | | | | | | | | | | | | |
| | | Distribution
Fee Rate (d) | | | Service
Fee Rate (d) | | | Total
Distribution
Plan (d) | | | Annual
Effective
Rate (e) | | | Distribution
and Service
Fee | |
| Class A | | | — | | | | 0.25% | | | | 0.25% | | | | 0.25% | | | | $557 | |
| (d) | In accordance with the distribution plan for certain classes, the fund pays distribution and/or service fees equal to these annual percentage rates of each class’ average daily net assets. The distribution and service fee rates disclosed by class represent the current rates in effect at the end of the reporting period. |
| (e) | The annual effective rates represent actual fees incurred under the distribution plan for the year ended February 29, 2012 based on each class’ average daily net assets. |
Certain Class A shares are subject to a contingent deferred sales charge (CDSC) in the event of a shareholder redemption within 24 months of purchase. All contingent deferred sales charges are paid to MFD. There were no contingent deferred sales charges imposed during the year ended February 29, 2012.
Shareholder Servicing Agent – MFS Service Center, Inc. (MFSC), a wholly-owned subsidiary of MFS, provides transfer agent and recordkeeping functions in connection with the issuance, transfer, and redemption of shares of the fund under a Shareholder Servicing Agent Agreement. MFSC is not paid a fee for providing these services. MFSC receives payment from the fund for out-of-pocket expenses paid by MFSC on behalf of the fund. For the year ended February 29, 2012, these costs amounted to $140. The fund may also pay shareholder servicing related costs to non-related parties.
Administrator – MFS provides certain financial, legal, shareholder communications, compliance, and other administrative services to the fund. Under an administrative services agreement, the fund partially reimburses MFS the costs incurred to provide these services. The fund is charged an annual fixed amount of $17,500 plus a fee based on average daily net assets. The administrative services fee incurred for the year ended February 29, 2012 was equivalent to an annual effective rate of 0.0194% of the fund’s average daily net assets.
Trustees’ and Officers’ Compensation – The fund pays compensation to independent Trustees in the form of a retainer, attendance fees, and additional compensation to Board and Committee chairpersons. The fund does not pay compensation directly to Trustees or to officers of the fund who are also officers of the investment adviser, all of whom receive remuneration for their services to the fund from MFS. Certain officers and Trustees of the fund are officers or directors of MFS, MFS Fund Distributors, Inc. (MFD), and MFSC.
Other – This fund and certain other funds managed by MFS (the funds) have entered into services agreements (the Agreements) which provide for payment of fees by the funds to Tarantino LLC and Griffin Compliance LLC in return for the provision of services of an Independent Chief Compliance Officer (ICCO) and Assistant ICCO, respectively, for the funds. The ICCO and Assistant ICCO
22
Notes to Financial Statements – continued
are officers of the funds and the sole members of Tarantino LLC and Griffin Compliance LLC, respectively. The funds can terminate the Agreements with Tarantino LLC and Griffin Compliance LLC at any time under the terms of the Agreements. For the year ended February 29, 2012, the aggregate fees paid by the fund to Tarantino LLC and Griffin Compliance LLC were $1,936 and are included in miscellaneous expense on the Statement of Operations. MFS has agreed to reimburse the fund for a portion of the payments made by the fund in the amount of $899, which is shown as a reduction of total expenses in the Statement of Operations. Additionally, MFS has agreed to bear all expenses associated with office space, other administrative support, and supplies provided to the ICCO and Assistant ICCO.
The fund invests in the MFS Institutional Money Market Portfolio which is managed by MFS and seeks a high level of current income consistent with preservation of capital and liquidity. Income earned on this investment is included in dividends from underlying affiliated funds on the Statement of Operations. This money market fund does not pay a management fee to MFS.
Purchases and sales of investments, other than U.S. Government securities, purchased option transactions, and short-term obligations, aggregated $111,163,683 and $79,709,180, respectively.
| (5) | | Shares of Beneficial Interest |
The fund’s Declaration of Trust permits the Trustees to issue an unlimited number of full and fractional shares of beneficial interest. Transactions in fund shares were as follows:
| | | | | | | | | | | | | | | | |
| | | Year ended
2/29/12 | | | Year ended
2/28/11 | |
| | | Shares | | | Amount | | | Shares | | | Amount | |
| Shares sold | | | | | | | | | | | | | | | | |
Class I | | | 2,875,159 | | | | $36,891,209 | | | | 2,192,094 | | | | $30,476,722 | |
| Shares issued to shareholders in reinvestment of distributions | | | | | | | | | | | | | | | | |
Class A | | | 957 | | | | $12,086 | | | | 2,584 | | | | $34,178 | |
Class I | | | 1,014,347 | | | | 12,740,167 | | | | 2,327,776 | | | | 30,804,587 | |
| | | 1,015,304 | | | | $12,752,253 | | | | 2,330,360 | | | | $30,838,765 | |
| Shares reacquired | | | | | | | | | | | | | | | | |
Class I | | | (771,970 | ) | | | $(10,469,393 | ) | | | (1,412,034 | ) | | | $(19,806,503 | ) |
| Net change | | | | | | | | | | | | | | | | |
Class A | | | 957 | | | | $12,086 | | | | 2,584 | | | | $34,178 | |
Class I | | | 3,117,536 | | | | 39,161,983 | | | | 3,107,836 | | | | 41,474,806 | |
| | | 3,118,493 | | | | $39,174,069 | | | | 3,110,420 | | | | $41,508,984 | |
23
Notes to Financial Statements – continued
Class A, Class B, Class C, Class R1, Class R2, Class R3, and Class R4 shares were not publicly available or sale during the period. During the period, the fund’s Class I shares were available for sale only to funds distributed by MFD that invest primarily in shares of other MFS funds (“MFS fund-of-funds”). Please see the fund’s prospectus for details.
The fund is one of several mutual funds in which the MFS funds-of-funds may invest. The MFS funds-of-funds do not invest in the underlying MFS funds for the purpose of exercising management or control. At the end of the period, the MFS Growth Allocation Fund, MFS Moderate Allocation Fund, MFS Aggressive Growth Allocation Fund, MFS Conservative Allocation Fund, MFS Lifetime 2030 Fund, MFS Lifetime 2040 Fund, and MFS Lifetime 2020 Fund were the owners of record of approximately 35%, 26%, 23%, 7%, 2%, 2%, and 1% respectively, of the value of outstanding voting shares of the fund. In addition, the MFS Lifetime 2050 Fund, MFS Lifetime 2010 Fund, and MFS Lifetime Retirement Income Fund were each the owners of record of less than 1% of the value of outstanding voting shares of the fund.
The fund and certain other funds managed by MFS participate in a $1.1 billion unsecured committed line of credit, subject to a $1 billion sublimit, provided by a syndication of banks under a credit agreement. Borrowings may be made for temporary financing needs. Interest is charged to each fund, based on its borrowings, generally at a rate equal to the higher of the Federal Reserve funds rate or one month LIBOR plus an agreed upon spread. A commitment fee, based on the average daily, unused portion of the committed line of credit, is allocated among the participating funds at the end of each calendar quarter. In addition, the fund and other funds managed by MFS have established unsecured uncommitted borrowing arrangements with certain banks for temporary financing needs. Interest is charged to each fund, based on its borrowings, at a rate equal to the Federal Reserve funds rate plus an agreed upon spread. For the year ended February 29, 2012, the fund’s commitment fee and interest expense were $1,644 and $0, respectively, and are included in miscellaneous expense on the Statement of Operations.
24
Notes to Financial Statements – continued
| (7) | | Transactions in Underlying Affiliated Funds-Affiliated Issuers |
An affiliated issuer may be considered one in which the fund owns 5% or more of the outstanding voting securities, or a company which is under common control. For the purposes of this report, the fund assumes the following to be affiliated issuers:
| | | | | | | | | | | | | | | | |
| Underlying Affiliated Funds | | Beginning
Shares/Par
Amount | | | Acquisitions
Shares/Par
Amount | | | Dispositions
Shares/Par
Amount | | | Ending
Shares/Par
Amount | |
| MFS Institutional Money Market Portfolio | | | 4,515,376 | | | | 74,802,343 | | | | (73,794,561 | ) | | | 5,523,158 | |
| | | | |
| Underlying Affiliated Funds | | Realized
Gain (Loss) | | | Capital Gain
Distributions | | | Dividend
Income | | | Ending Value | |
| MFS Institutional Money Market Portfolio | | | $— | | | | $— | | | | $4,804 | | | | $5,523,158 | |
25
REPORT OF INDEPENDENT REGISTERED PUBLIC ACCOUNTING FIRM
To the Trustees and Shareholders of MFS Global Real Estate Fund:
We have audited the accompanying statement of assets and liabilities of MFS Global Real Estate Fund (the Fund), including the portfolio of investments, as of February 29, 2012, and the related statement of operations for the year then ended, the statements of changes in net assets for each of the two years in the period then ended, and the financial highlights for each of the periods indicated therein. These financial statements and financial highlights are the responsibility of the Fund’s management. Our responsibility is to express an opinion on these financial statements and financial highlights based on our audits.
We conducted our audits in accordance with the standards of the Public Company Accounting Oversight Board (United States). Those standards require that we plan and perform the audit to obtain reasonable assurance about whether the financial statements and financial highlights are free of material misstatement. We were not engaged to perform an audit of the Fund’s internal control over financial reporting. Our audits included consideration of internal control over financial reporting as a basis for designing audit procedures that are appropriate in the circumstances, but not for the purpose of expressing an opinion on the effectiveness of the Fund’s internal control over financial reporting. Accordingly, we express no such opinion. An audit also includes examining, on a test basis, evidence supporting the amounts and disclosures in the financial statements and financial highlights, assessing the accounting principles used and significant estimates made by management, and evaluating the overall financial statement presentation. Our procedures included confirmation of securities owned as of February 29, 2012, by correspondence with the Fund’s custodian and brokers or by other appropriate auditing procedures when replies from brokers were not received. We believe that our audits provide a reasonable basis for our opinion.
In our opinion, the financial statements and financial highlights referred to above present fairly, in all material respects, the financial position of MFS Global Real Estate Fund at February 29, 2012, the results of its operations for the year then ended, the changes in its net assets for each of the two years in the period then ended, and its financial highlights for the periods indicated therein, in conformity with U.S. generally accepted accounting principles.

Boston, Massachusetts
April 13, 2012
26
TRUSTEES AND OFFICERS — IDENTIFICATION AND BACKGROUND
The Trustees and officers of the Trust, as of April 1, 2012, are listed below, together with their principal occupations during the past five years. (Their titles may have varied during that period.) The address of each Trustee and officer is 500 Boylston Street, Boston, Massachusetts 02116.
| | | | | | | | |
Name, Age | | Position(s) Held with Fund | | Trustee/Officer
Since (h) | | Principal Occupations
During the Past Five Years | | Other Directorships (j) |
| INTERESTED TRUSTEES |
Robert J. Manning (k)
(age 48) | | Trustee | | February 2004 | | Massachusetts Financial Services Company, Chairman, Chief Executive Officer and Director; President (until December 2009); Chief Investment Officer (until July 2010) | | N/A |
| INDEPENDENT TRUSTEES |
David H. Gunning
(age 69) | | Trustee and Chair of Trustees | | January 2004 | | Retired; Cleveland-Cliffs Inc. (mining products and service provider), Vice Chairman/Director (until May 2007) | | Lincoln Electric Holdings, Inc. (welding equipment manufacturer), Director; Development Alternatives, Inc. (consulting), Director/Non-Executive Chairman; Portman Limited (mining), Director (until 2008) |
Robert E. Butler
(age 70) | | Trustee | | January 2006 | | Consultant – investment company industry regulatory and compliance matters | | N/A |
Maureen R. Goldfarb
(age 56) | | Trustee | | January 2009 | | Private investor | | N/A |
27
Trustees and Officers – continued
| | | | | | | | |
Name, Age | | Position(s) Held with Fund | | Trustee/Officer
Since (h) | | Principal Occupations
During the Past Five Years | | Other Directorships (j) |
William R. Gutow
(age 70) | | Trustee | | December 1993 | | Private investor and real estate consultant; Capitol Entertainment Management Company (video franchise), Vice Chairman | | Atlantic Coast Tan (tanning salons), Vice Chairman (until 2007); Texas Donuts (donut franchise), Vice Chairman (until 2010) |
Michael Hegarty
(age 67) | | Trustee | | December 2004 | | Private investor | | N/A |
John P. Kavanaugh
(age 57) | | Trustee | | January 2009 | | Private investor; The Hanover Insurance Group, Inc., Vice President and Chief Investment Officer (until 2006); Allmerica Investment Trust, Allmerica Securities Trust and Opus Investment Trust (investment companies), Chairman, President and Trustee (until 2006) | | N/A |
J. Dale Sherratt
(age 73) | | Trustee | | June 1989 | | Insight Resources, Inc. (acquisition planning specialists), President; Wellfleet Investments (investor in health care companies), Managing General Partner | | N/A |
Laurie J. Thomsen
(age 54) | | Trustee | | March 2005 | | Private investor; New Profit, Inc. (venture philanthropy), Executive Partner (until 2010) | | The Travelers Companies (insurance), Director |
Robert W. Uek
(age 70) | | Trustee | | January 2006 | | Consultant to investment company industry | | N/A |
28
Trustees and Officers – continued
| | | | | | | | |
Name, Age | | Position(s) Held with Fund | | Trustee/Officer
Since (h) | | Principal Occupations
During the Past Five Years | | Other Directorships (j) |
| OFFICERS |
John M. Corcoran (k)
(age 46) | | President | | October 2008 | | Massachusetts Financial Services Company, Senior Vice President (since October 2008); State Street Bank and Trust (financial services provider), Senior Vice President, (until September 2008) | | N/A |
Christopher R.
Bohane (k)
(age 38) | | Assistant Secretary and Assistant Clerk | | July 2005 | | Massachusetts Financial Services Company, Vice President and Senior Counsel | | N/A |
Kino Clark (k)
(age 43) | | Assistant Treasurer | | January 2012 | | Massachusetts Financial Services Company, Vice President | | N/A |
Ethan D. Corey (k)
(age 48) | | Assistant
Secretary and Assistant Clerk | | July 2005 | | Massachusetts Financial Services Company, Senior Vice President and Associate General Counsel | | N/A |
David L. DiLorenzo (k)
(age 43) | | Treasurer | | July 2005 | | Massachusetts Financial Services Company,
Senior Vice President | | N/A |
29
Trustees and Officers – continued
| | | | | | | | |
Name, Age | | Position(s) Held with Fund | | Trustee/Officer
Since (h) | | Principal Occupations
During the Past Five Years | | Other Directorships (j) |
Robyn L. Griffin
(age 36) | | Assistant Independent Chief Compliance Officer | | August 2008 | | Griffin Compliance LLC (provider of compliance services), Principal (since August 2008); State Street Corporation (financial services provider), Mutual Fund Administration Assistant Vice President (October 2006 – July 2008); Liberty Mutual Group (insurance), Personal Market Assistant Controller (April 2006 – October 2006); Deloitte & Touche LLP (professional services firm). | | N/A |
Brian E.
Langenfeld (k)
(age 39) | | Assistant Secretary and Assistant Clerk | | June 2006 | | Massachusetts Financial Services Company, Vice President and Senior Counsel | | N/A |
Ellen Moynihan (k)
(age 54) | | Assistant Treasurer | | April 1997 | | Massachusetts Financial Services Company, Senior Vice President | | N/A |
Susan S. Newton (k)
(age 62) | | Assistant Secretary and Assistant Clerk | | May 2005 | | Massachusetts Financial Services Company, Senior Vice President and Associate General Counsel | | N/A |
Susan A. Pereira (k)
(age 41) | | Assistant Secretary and Assistant Clerk | | July 2005 | | Massachusetts Financial Services Company, Vice President and Senior Counsel | | N/A |
Mark N. Polebaum (k)
(age 59) | | Secretary and Clerk | | January 2006 | | Massachusetts Financial Services Company, Executive Vice President, General Counsel and Secretary | | N/A |
30
Trustees and Officers – continued
| | | | | | | | |
Name, Age | | Position(s) Held with Fund | | Trustee/Officer
Since (h) | | Principal Occupations
During the Past Five Years | | Other Directorships (j) |
Frank L. Tarantino
(age 68) | | Independent Chief Compliance Officer | | June 2004 | | Tarantino LLC (provider of compliance services), Principal | | N/A |
Richard S. Weitzel (k)
(age 41) | | Assistant Secretary and Assistant Clerk | | October 2007 | | Massachusetts Financial Services Company, Senior Vice President and Associate General Counsel | | N/A |
James O. Yost (k)
(age 51) | | Deputy Treasurer | | September 1990 | | Massachusetts Financial Services Company, Senior Vice President | | N/A |
| (h) | Date first appointed to serve as Trustee/officer of an MFS fund. Each Trustee has served continuously since appointment unless indicated otherwise. For the period from December 15, 2004 until February 22, 2005, Mr. Manning served as Advisory Trustee. For the period October 2008, until January 2012, Mr. Corcoran served as Treasurer of the Funds. Prior to January 2012, Messrs. DiLorenzo and Yost served as Assistant Treasurers of the Funds. |
| (j) | Directorships or trusteeships of companies required to report to the Securities and Exchange Commission (i.e., “public companies”). |
| (k) | “Interested person” of the Trust within the meaning of the Investment Company Act of 1940 (referred to as the 1940 Act), which is the principal federal law governing investment companies like the fund, as a result of position with MFS. The address of MFS is 500 Boylston Street, Boston, Massachusetts 02116. |
Each Trustee has been elected by shareholders and each Trustee and officer holds office until his or her successor is chosen and qualified or until his or her earlier death, resignation, retirement or removal. The Trust does not hold annual meetings for the purpose of electing Trustees, and Trustees are not elected for fixed terms. Messrs. Butler, Kavanaugh, Uek and Ms. Thomsen are members of the Trust’s Audit Committee.
Each of the Fund’s Trustees and officers holds comparable positions with certain other funds of which MFS or a subsidiary is the investment adviser or distributor, and, in the case of the officers, with certain affiliates of MFS. As of January 1, 2012, the Trustees served as board members of 131 funds within the MFS Family of Funds.
31
Trustees and Officers – continued
The Statement of Additional Information for the Fund includes further information about the Trustees and is available without charge upon request by calling 1-800-225-2606.
| | |
| Investment Adviser | | Custodian |
Massachusetts Financial Services Company
500 Boylston Street, Boston, MA 02116-3741 | | State Street Bank and Trust 1 Lincoln Street, Boston, MA 02111-2900 |
| Distributor | | Independent Registered Public Accounting Firm |
MFS Fund Distributors, Inc.
500 Boylston Street, Boston, MA 02116-3741 | | Ernst & Young LLP 200 Clarendon Street, Boston, MA 02116 |
| Portfolio Manager | | |
Richard Gable | | |
32
BOARD REVIEW OF INVESTMENT ADVISORY AGREEMENT
A discussion regarding the Board’s most recent review and renewal of the fund’s Investment Advisory Agreement with MFS is available by clicking on the fund’s name under “Mutual Funds” in the “Products and Performance” section of the MFS Web site (mfs.com).
PROXY VOTING POLICIES AND INFORMATION
A general description of the MFS funds’ proxy voting policies and procedures is available without charge, upon request, by calling
1-800-225-2606, by visiting the Proxy Voting section of mfs.com or by visiting the SEC’s Web site at http://www.sec.gov.
Information regarding how the fund voted proxies relating to portfolio securities during the most recent twelve-month period ended June 30 is available without charge by visiting the Proxy Voting section of mfs.com or by visiting the SEC’s Web site at http://www.sec.gov.
QUARTERLY PORTFOLIO DISCLOSURE
The fund will file a complete schedule of portfolio holdings with the Securities and Exchange Commission (the Commission) for the first and third quarters of each fiscal year on Form N-Q. A shareholder can obtain the quarterly portfolio holdings report at mfs.com. The fund’s Form N-Q is also available on the EDGAR database on the Commission’s Internet Web site at http://www.sec.gov, and may be reviewed and copied at the:
Public Reference Room
Securities and Exchange Commission
100 F Street, NE, Room 1580
Washington, D.C. 20549
Information on the operation of the Public Reference Room may be obtained by calling the Commission at 1-800-SEC-0330. Copies of the fund’s Form N-Q also may be obtained, upon payment of a duplicating fee, by electronic request at the following e-mail address: publicinfo@sec.gov or by writing the Public Reference Section at the above address.
FURTHER INFORMATION
From time to time, MFS may post important information about the fund or the MFS funds on the MFS web site (mfs.com). This information is available by visiting the “News & Commentary” section of mfs.com or by clicking on the fund’s name under “Mutual Funds” in the “Products and Performance” section of mfs.com.
33
FEDERAL TAX INFORMATION (unaudited)
The fund will notify shareholders of amounts for use in preparing 2012 income tax forms in January 2013. The following information is provided pursuant to provisions of the Internal Revenue Code.
The fund designates the maximum amount allowable as qualified dividend income eligible for the 15% tax rate.
The fund designates $6,633,000 as capital gain dividends paid during the fiscal year.
34
rev. 3/11
| | | | |
| FACTS | | WHAT DOES MFS DO WITH YOUR PERSONAL INFORMATION? | |  |
| | |
| Why? | | Financial companies choose how they share your personal information. Federal law gives consumers the right to limit some but not all sharing. Federal law also requires us to tell you how we collect, share, and protect your personal information. Please read this notice carefully to understand what we do. |
| | |
| What? | | The types of personal information we collect and share depend on the product or service you have with us. This information can include: • Social Security number and account balances • Account transactions and transaction history • Checking account information and wire transfer instructions When you are no longer our customer, we continue to share your information as described in this notice. |
| | |
| How? | | All financial companies need to share customers’ personal information to run their everyday business. In the section below, we list the reasons financial companies can share their customers’ personal information; the reasons MFS chooses to share; and whether you can limit this sharing. |
| | | | |
| Reasons we can share your personal information | | Does MFS share? | | Can you limit
this sharing? |
For our everyday business purposes – such as to process your transactions, maintain your account(s), respond to court orders and legal investigations, or report to credit bureaus | | Yes | | No |
For our marketing purposes – to offer our products and services to you | | No | | We don’t share |
| For joint marketing with other financial companies | | No | | We don’t share |
For our affiliates’ everyday business purposes – information about your transactions and experiences | | No | | We don’t share |
For our affiliates’ everyday business purposes – information about your creditworthiness | | No | | We don’t share |
| For nonaffiliates to market to you | | No | | We don’t share |
| | |
| Questions? | | Call 800-225-2606 or go to mfs.com. |
35
| | |
| Who we are |
| Who is providing this notice? | | MFS Funds, MFS Investment Management, MFS Institutional Advisors, Inc., MFS Fund Distributors, Inc., MFS Heritage Trust Company, and MFS Service Center, Inc. |
| | |
| What we do |
| How does MFS protect my personal information? | | To protect your personal information from unauthorized access and use, we use security measures that comply with federal law. These measures include procedural, electronic, and physical safeguards for the protection of the personal information we collect about you. |
How does MFS
collect my personal information? | | We collect your personal information, for example, when you •open an account or provide account information •direct us to buy securities or direct us to sell your securities •make a wire transfer We also collect your personal information from others, such as credit bureaus, affiliates and other companies. |
| Why can’t I limit all sharing? | | Federal law gives you the right to limit only •sharing for affiliates’ everyday business purposes – information about your creditworthiness •affiliates from using your information to market to you •sharing for nonaffiliates to market to you State laws and individual companies may give you additional rights to limit sharing. |
| | |
| Definitions |
| Affiliates | | Companies related by common ownership or control. They can be financial and nonfinancial companies. •MFS does not share personal information with affiliates, except for everyday business purposes as described on page one of this notice. |
| Nonaffiliates | | Companies not related by common ownership or control. They can be financial and nonfinancial companies. •MFS does not share with nonaffiliates so they can market to you. |
| Joint Marketing | | A formal agreement between nonaffiliated financial companies that together market financial products or services to you. •MFS doesn’t jointly market. |
| | |
| Other important information |
| If you own an MFS product or receive an MFS service in the name of a third party such as a bank or broker-dealer, their privacy policy may apply to you instead of ours. |
36
Save paper with eDelivery.
MFS® will send you prospectuses, reports, and proxies directly via e-mail so you will get information faster with less mailbox clutter.
To sign up:
1. Go to mfs.com.
2. Log in via MFS® Access.
3. Select eDelivery.
If you own your MFS fund shares through a financial institution or a retirement plan, MFS® TALK, MFS® Access, or eDelivery may not be available to you.

Web site
mfs.com
MFS TALK
1-800-637-8255
24 hours a day
Account service and literature
Shareholders
1-800-225-2606
Financial advisors
1-800-343-2829
Retirement plan services
1-800-637-1255
Mailing address
MFS Service Center, Inc.
P.O. Box 55824
Boston, MA 02205-5824
Overnight mail
MFS Service Center, Inc.
c/o Boston Financial Data Services
30 Dan Road
Canton, MA 02021-2809

MFS® New Discovery Value Fund

ANNUAL REPORT
February 29, 2012
NDV-ANN
MFS® NEW DISCOVERY VALUE FUND
SIPC Contact Information: You may obtain information about the Securities Investor Protection Corporation (“SIPC”), including the SIPC Brochure, by contacting SIPC either by telephone (1-202-371-8300) or by accessing SIPC’s web site address (www.sipc.org).
The report is prepared for the general information of shareholders. It is authorized for distribution to prospective investors only when preceded or accompanied by a current prospectus.
NOT FDIC INSURED Ÿ MAY LOSE VALUE Ÿ NO BANK GUARANTEE

LETTER FROM THE CHAIRMAN AND CEO
Dear Shareholders:
We are indeed living through some volatile times. Economic uncertainty is everywhere, as it seems no place in the world has been unmoved by crisis. Over the past year, we have seen a devastating earthquake and tsunami that have led to disruptions in the Japanese markets and supply chains. Protests have changed the face of the Middle East and left in their wake lingering tensions and questions about oil supplies. We have seen debt limits tested in Europe and the United States and policymakers grappling to craft often unpopular monetary and fiscal responses as consumers and businesses struggle with what appears to be a slowing global economy. And now, as the US economy begins to regain its footing, we see the economies of the eurozone heading toward recession as the region’s leaders continue to address sovereign debt crises.
When markets become volatile, managing risk becomes a top priority for investors and their advisors. At MFS® risk management is foremost in our minds in all market climates. Our analysts and portfolio managers keep risks firmly in mind when evaluating securities. Additionally, we have a team of quantitative analysts that measures and assesses the risk profiles of our portfolios and securities on an ongoing basis. The chief investment risk officer, who oversees the team, reports directly to the firm’s president and chief investment officer so the risk associated with each portfolio can be assessed objectively and independently.
As always, we continue to be mindful of the many economic challenges faced at the local, national, and international levels. It is in times such as these that we want to remind investors of the merits of maintaining a long-term view, adhering to basic investing principles such as asset allocation and diversification, and working closely with their advisors to research and identify appropriate investment opportunities.
Respectfully,

Robert J. Manning
Chairman and Chief Executive Officer
MFS Investment Management®
April 13, 2012
The opinions expressed in this letter are subject to change, may not be relied upon for investment advice, and no forecasts can be guaranteed.
1
PORTFOLIO COMPOSITION
Portfolio structure (i)
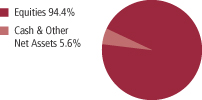
| | | | |
| Top ten holdings | | | | |
| CAI International, Inc. | | | 1.5% | |
| Lennox International, Inc. | | | 1.4% | |
| Ingram Micro, Inc., “A” | | | 1.3% | |
| Almost Family, Inc. | | | 1.3% | |
| Entertainment Properties Trust, REIT | | | 1.2% | |
| Foster Wheeler AG | | | 1.2% | |
| Destination Maternity Corp. | | | 1.2% | |
| CoreLogic, Inc. | | | 1.2% | |
| P.F. Chang’s China Bistro, Inc. | | | 1.1% | |
| American Eagle Outfitters, Inc. | | | 1.1% | |
| | | | |
| Equity sectors (i) | | | | |
| Financial Services | | | 22.8% | |
| Technology | | | 11.4% | |
| Industrial Goods & Services | | | 10.3% | |
| Retailing | | | 8.3% | |
| Health Care | | | 6.9% | |
| Special Products & Services | | | 6.7% | |
| Basic Materials | | | 6.1% | |
| Leisure | | | 5.0% | |
| Energy | | | 4.8% | |
| Utilities & Communications | | | 4.5% | |
| Autos & Housing | | | 3.3% | |
| Transportation | | | 2.9% | |
| Consumer Staples | | | 1.4% | |
| (i) | For purposes of this presentation, the components include the market value of securities, less any securities sold short, and reflect the impact of the equivalent exposure of derivative positions. These amounts may be negative from time to time. Equivalent exposure is a calculated amount that translates the derivative position into a reasonable approximation of the amount of the underlying asset that the portfolio would have to hold at a given point in time to have the same price sensitivity that results from the portfolio’s ownership of the derivative contract. When dealing with derivatives, equivalent exposure is a more representative measure of the potential impact of a position on portfolio performance than market value. |
Percentages are based on net assets as of 2/29/12.
The portfolio is actively managed and current holdings may be different.
2
MANAGEMENT REVIEW
Summary of Results
For the reporting period of May 26, 2011 (the day the fund commenced investment operations) to February 29, 2012, Class A shares of the MFS New Discovery Value Fund (the “fund”) provided a total return of 3.22%, at net asset value. This compares with a return of –0.66% for the fund’s benchmark, the Russell 2000 Value Index.
Market Environment
Prior to the beginning of the reporting period, looser U.S. monetary and fiscal policy fostered a sharp rebound in market risk sentiment. Later on, however, global macroeconomic conditions had begun to weaken and renewed concerns surrounding eurozone sovereign debt arose, causing the recovery in asset valuations to plateau.
At the beginning of August 2011, worries about U.S. sovereign debt default and the long-term sustainability of the trend in U.S. fiscal policy resulted in one agency downgrading U.S. credit quality. Amidst this turmoil, global equity markets declined sharply and credit spreads widened. At the same time, global consumer and producer sentiment indicators fell precipitously and highly-rated sovereign bond yields hit multi-decade lows.
Late in the period, however, additional liquidity from the U.S. Federal Reserve (in the form of “Operation Twist”) and the European Central Bank (in the form of 3-year, Longer Term Refinancing Operations, or LTROs), coupled with improved global macroeconomic conditions, ushered in improved market dynamics.
Contributors to Performance
Security selection in the technology sector was a primary factor in the fund’s outperformance relative to the Russell 2000 Value Index. Holdings of Internet-based postage solutions company Stamps.com (b)(h) and network optimization software firm DemandTec (b)(h) strongly benefited relative performance. Shares of DemandTec soared on the announcement of the company’s acquisition by diversified technology products and services company International Business Machines (IBM) in December 2011. The fund’s overweight position in credit score data company Fair Isaac Corporation also aided relative performance.
Stock selection in the financial services sector was another positive factor for relative performance. Holdings of construction equipment leasing firm RSC Holdings (h) helped boost the fund’s relative results. Additionally, holdings of residential mortgage servicer Walter Investment Management (h), and the timing of ownership in shares of freight container leasing and management company CAI International, were significant contributors to the fund’s outperformance.
3
Management Review – continued
Favorable security selection in the energy and industrial goods & services sectors also strengthened results relative to the benchmark. In the energy sector, shares of oil exploration company Brigham Exploration (b)(h) contributed to fund performance due, in part, to an announcement of the firm’s acquisition by oil and refiner StatoilHydro ASA in November 2011. Within the industrial goods & services sector, the fund’s holdings of lift truck accessory manufacturer Cascade Corp (h) and equipment manufacturer Charter International (b)(h) were also among the top relative contributors for the reporting period.
Detractors from Performance
Security selection in the retailing sector detracted from performance relative to the benchmark. There were no individual stocks within this sector that were among the fund’s top relative detractors.
Elsewhere, holdings of poor-performing specialty chemicals and materials company Ferro Corp., telecommunications component manufacturer Oclaro, home-based health care service provider LHC Group (h), semiconductor company Maxlinear (b), automated identification and data capture equipment manufacturer Intermec, gaming machine manufacturer and distributor WMS Industries (b), and Carrizo Oil & Gas (b)(h) held back relative performance.
Respectfully,
Kevin Schmitz
Portfolio Manager
| (b) | Security is not a benchmark constituent. |
| (h) | Security was not held in the portfolio at period end. |
The views expressed in this report are those of the portfolio manager only through the end of the period of the report as stated on the cover and do not necessarily reflect the views of MFS or any other person in the MFS organization. These views are subject to change at any time based on market or other conditions, and MFS disclaims any responsibility to update such views. These views may not be relied upon as investment advice or an indication of trading intent on behalf of any MFS portfolio. References to specific securities are not recommendations of such securities, and may not be representative of any MFS portfolio’s current or future investments.
4
PERFORMANCE SUMMARY THROUGH 2/29/12
The following chart illustrates a representative class of the fund’s historical performance in comparison to its benchmark(s). Performance results include the deduction of the maximum applicable sales charge and reflect the percentage change in net asset value, including reinvestment of dividends and capital gains distributions. The performance of other share classes will be greater than or less than that of the class depicted below. Benchmarks are unmanaged and may not be invested in directly. Benchmark returns do not reflect sales charges, commissions or expenses. (See Notes to Performance Summary.)
Performance data shown represents past performance and is no guarantee of future results. Investment return and principal value fluctuate so your shares, when sold, may be worth more or less than the original cost; current performance may be lower or higher than quoted. The performance shown does not reflect the deduction of taxes, if any, that a shareholder would pay on fund distributions or the redemption of fund shares.
Growth of a Hypothetical $10,000 Investment (t)
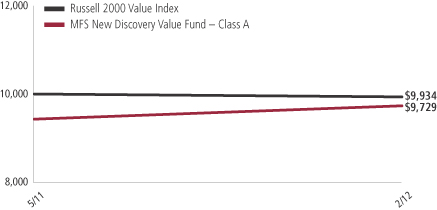
5
Performance Summary – continued
Total Returns through 2/29/12
Average annual without sales charge
| | | | | | | | |
| | | Share class | | Class inception date | | Life (t) | | |
| | | A | | 5/26/11 | | 3.22% | | |
| | | B | | 5/26/11 | | 2.56% | | |
| | | C | | 5/26/11 | | 2.62% | | |
| | | I | | 5/26/11 | | 3.39% | | |
| | | R1 | | 5/26/11 | | 2.66% | | |
| | | R2 | | 5/26/11 | | 2.98% | | |
| | | R3 | | 5/26/11 | | 3.23% | | |
| | | R4 | | 5/26/11 | | 3.39% | | |
| Comparative benchmark | | | | |
| | | Russell 2000 Value Index (f) | | (0.66)% | | |
| Average annual with sales charge | | | | |
| | | A
With Initial Sales Charge (5.75%) | | (2.71)% | | |
| | | B
With CDSC (Declining over six years from 4% to 0%) (x) | | (1.44)% | | |
| | | C
With CDSC (1% for 12 months) (x) | | 1.62% | | |
Class I, R1, R2, R3, and R4 shares do not have a sales charge.
CDSC – Contingent Deferred Sales Charge.
| (f) | Source: FactSet Research Systems Inc. |
| (t) | For the period from the class inception date through the stated period end. (See Notes to Performance Summary.) |
| (x) | Assuming redemption at the end of the applicable period. |
Benchmark Definition
Russell 2000 Value Index – a market-capitalization-weighted, value-oriented index that measures the performance of small-capitalization stocks that have relatively low price-to-book ratios and lower forecasted growth values.
It is not possible to invest directly in an index.
Notes to Performance Summary
Average annual total return represents the average annual change in value for each share class for the periods presented. Life returns are presented where the share class has less than 10 years of performance history and represent the
average annual total return from the class inception date to the stated period end date.
6
Performance Summary – continued
Performance results reflect any applicable expense subsidies and waivers in effect during the periods shown. Without such subsidies and waivers the fund’s performance results would be less favorable. Please see the prospectus and financial statements for complete details.
Performance results do not include adjustments made for financial reporting purposes in accordance with U.S. generally accepted accounting principles and may differ from amounts reported in the financial highlights.
From time to time the fund may receive proceeds from litigation settlements, without which performance would be lower.
7
EXPENSE TABLE
Fund expenses borne by the shareholders during the period, September 1, 2011 through February 29, 2012
As a shareholder of the fund, you incur two types of costs: (1) transaction costs, including sales charges (loads) on certain purchase or redemption payments, and (2) ongoing costs, including management fees; distribution and service (12b-1) fees; and other fund expenses. This example is intended to help you understand your ongoing costs (in dollars) of investing in the fund and to compare these costs with the ongoing costs of investing in other mutual funds.
The example is based on an investment of $1,000 invested at the beginning of the period and held for the entire period September 1, 2011 through February 29, 2012.
Actual Expenses
The first line for each share class in the following table provides information about actual account values and actual expenses. You may use the information in this line, together with the amount you invested, to estimate the expenses that you paid over the period. Simply divide your account value by $1,000 (for example, an $8,600 account value divided by $1,000 = 8.6), then multiply the result by the number in the first line under the heading entitled “Expenses Paid During Period” to estimate the expenses you paid on your account during this period.
Hypothetical Example for Comparison Purposes
The second line for each share class in the following table provides information about hypothetical account values and hypothetical expenses based on the fund’s actual expense ratio and an assumed rate of return of 5% per year before expenses, which is not the fund’s actual return. The hypothetical account values and expenses may not be used to estimate the actual ending account balance or expenses you paid for the period. You may use this information to compare the ongoing costs of investing in the fund and other funds. To do so, compare this 5% hypothetical example with the 5% hypothetical examples that appear in the shareholder reports of the other funds.
Please note that the expenses shown in the table are meant to highlight your ongoing costs only and do not reflect any transactional costs, such as sales charges (loads). Therefore, the second line for each share class in the table is useful in comparing ongoing costs only, and will not help you determine the relative total costs of owning different funds. In addition, if these transactional costs were included, your costs would have been higher.
8
Expense Table – continued
| | | | | | | | | | | | |
Share
Class | | | | Annualized
Expense Ratio | | Beginning
Account Value
9/01/11 | | Ending Account Value 2/29/12 | | Expenses Paid During Period (p) 9/01/11-2/29/12 | |
| A | | Actual | | 1.24% | | $1,000.00 | | $1,183.72 | | | $6.73 | |
| | Hypothetical (h) | | 1.24% | | $1,000.00 | | $1,018.70 | | | $6.22 | |
| B | | Actual | | 1.99% | | $1,000.00 | | $1,178.89 | | | $10.78 | |
| | Hypothetical (h) | | 1.99% | | $1,000.00 | | $1,014.97 | | | $9.97 | |
| C | | Actual | | 1.99% | | $1,000.00 | | $1,179.51 | | | $10.78 | |
| | Hypothetical (h) | | 1.99% | | $1,000.00 | | $1,014.97 | | | $9.97 | |
| I | | Actual | | 1.00% | | $1,000.00 | | $1,185.70 | | | $5.43 | |
| | Hypothetical (h) | | 1.00% | | $1,000.00 | | $1,019.89 | | | $5.02 | |
| R1 | | Actual | | 1.99% | | $1,000.00 | | $1,180.04 | | | $10.79 | |
| | Hypothetical (h) | | 1.99% | | $1,000.00 | | $1,014.97 | | | $9.97 | |
| R2 | | Actual | | 1.49% | | $1,000.00 | | $1,182.30 | | | $8.08 | |
| | Hypothetical (h) | | 1.49% | | $1,000.00 | | $1,017.45 | | | $7.47 | |
| R3 | | Actual | | 1.24% | | $1,000.00 | | $1,183.88 | | | $6.73 | |
| | Hypothetical (h) | | 1.24% | | $1,000.00 | | $1,018.70 | | | $6.22 | |
| R4 | | Actual | | 0.99% | | $1,000.00 | | $1,185.70 | | | $5.38 | |
| | Hypothetical (h) | | 0.99% | | $1,000.00 | | $1,019.94 | | | $4.97 | |
| (h) | 5% class return per year before expenses. |
| (p) | Expenses paid are equal to each class’ annualized expense ratio, as shown above, multiplied by the average account value over the period, multiplied by the number of days in the period, divided by the number of days in the year. Expenses paid do not include any applicable sales charges (loads). If these transaction costs had been included, your costs would have been higher. |
9
PORTFOLIO OF INVESTMENTS
2/29/12
The Portfolio of Investments is a complete list of all securities owned by your fund. It is categorized by broad-based asset classes.
| | | | | | | | |
| Common Stocks - 94.9% | | | | | | | | |
| Issuer | | Shares/Par | | | Value ($) | |
| | | | | | | | |
| Aerospace - 0.8% | | | | | | | | |
| Kaman Corp. | | | 39,890 | | | $ | 1,375,806 | |
| | |
| Apparel Manufacturers - 2.4% | | | | | | | | |
| Hanesbrands, Inc. (a) | | | 62,737 | | | $ | 1,802,434 | |
| Jones Group, Inc. | | | 135,930 | | | | 1,338,911 | |
| Maidenform Brands, Inc. (a) | | | 43,830 | | | | 920,430 | |
| | | | | | | | |
| | | | | | | $ | 4,061,775 | |
| Brokerage & Asset Managers - 1.5% | | | | | | | | |
| FXCM, Inc. “A” | | | 117,350 | | | $ | 1,110,131 | |
| GFI Group, Inc. | | | 377,924 | | | | 1,451,228 | |
| | | | | | | | |
| | | | | | | $ | 2,561,359 | |
| Business Services - 4.6% | | | | | | | | |
| CoreLogic, Inc. (a) | | | 126,191 | | | $ | 1,940,818 | |
| Dun & Bradstreet Corp. | | | 19,725 | | | | 1,630,271 | |
| FleetCor Technologies, Inc. (a) | | | 45,508 | | | | 1,685,161 | |
| G&K Services, Inc. | | | 34,749 | | | | 1,158,184 | |
| Portfolio Recovery Associates, Inc. (a) | | | 16,800 | | | | 1,171,464 | |
| | | | | | | | |
| | | | | | | $ | 7,585,898 | |
| Chemicals - 0.9% | | | | | | | | |
| Cabot Corp. | | | 38,220 | | | $ | 1,548,292 | |
| | |
| Computer Software - 2.0% | | | | | | | | |
| Fair Isaac Corp. | | | 45,602 | | | $ | 1,845,969 | |
| OBIC Co. Ltd. | | | 7,640 | | | | 1,455,195 | |
| | | | | | | | |
| | | | | | | $ | 3,301,164 | |
| Computer Software - Systems - 2.1% | | | | | | | | |
| Ingram Micro, Inc., “A” (a) | | | 112,639 | | | $ | 2,154,784 | |
| NICE Systems Ltd., ADR (a) | | | 36,439 | | | | 1,245,849 | |
| | | | | | | | |
| | | | | | | $ | 3,400,633 | |
| Construction - 3.3% | | | | | | | | |
| Beacon Roofing Supply, Inc. (a) | | | 71,967 | | | $ | 1,696,982 | |
| Lennox International, Inc. | | | 58,842 | | | | 2,302,487 | |
| M/I Homes, Inc. (a) | | | 118,618 | | | | 1,436,464 | |
| | | | | | | | |
| | | | | | | $ | 5,435,933 | |
10
Portfolio of Investments – continued
| | | | | | | | |
| Issuer | | Shares/Par | | | Value ($) | |
| | | | | | | | |
| Common Stocks - continued | | | | | | | | |
| Consumer Products - 0.9% | | | | | | | | |
| Sensient Technologies Corp. | | | 41,510 | | | $ | 1,535,455 | |
| | |
| Consumer Services - 1.6% | | | | | | | | |
| Dice Holdings, Inc. (a) | | | 96,030 | | | $ | 852,746 | |
| H&R Block, Inc. | | | 105,295 | | | | 1,716,308 | |
| | | | | | | | |
| | | | | | | $ | 2,569,054 | |
| Containers - 0.8% | | | | | | | | |
| Greif, Inc. | | | 6,610 | | | $ | 338,498 | |
| Greif, Inc., “B” | | | 19,466 | | | | 1,017,877 | |
| | | | | | | | |
| | | | | | | $ | 1,356,375 | |
| Electronics - 6.8% | | | | | | | | |
| Entegris, Inc. (a) | | | 99,040 | | | $ | 895,322 | |
| Entropic Communications, Inc. (a) | | | 223,958 | | | | 1,380,701 | |
| Hittite Microwave Corp. (a) | | | 20,340 | | | | 1,163,041 | |
| Intermec, Inc. (a) | | | 209,906 | | | | 1,570,097 | |
| MaxLinear, Inc., “A” (a) | | | 231,887 | | | | 1,275,379 | |
| Monolithic Power Systems, Inc. (a) | | | 93,992 | | | | 1,747,311 | |
| Oclaro, Inc. (a) | | | 198,328 | | | | 856,777 | |
| Ultratech, Inc. (a) | | | 51,730 | | | | 1,407,573 | |
| Veeco Instruments, Inc. (a) | | | 36,943 | | | | 998,939 | |
| | | | | | | | |
| | | | | | | $ | 11,295,140 | |
| Energy - Independent - 5.3% | | | | | | | | |
| Berry Petroleum Corp., “A” | | | 21,937 | | | $ | 1,183,720 | |
| Energy Partners Ltd. (a) | | | 102,701 | | | | 1,750,025 | |
| Energy XXI (Bermuda) Ltd. (a) | | | 33,100 | | | | 1,238,933 | |
| Lone Pine Resources, Inc. (a) | | | 168,930 | | | | 1,255,150 | |
| SM Energy Co. | | | 19,710 | | | | 1,551,571 | |
| WPX Energy, Inc. (a) | | | 99,190 | | | | 1,801,290 | |
| | | | | | | | |
| | | | | | | $ | 8,780,689 | |
| Engineering - Construction - 1.2% | | | | | | | | |
| Foster Wheeler AG (a) | | | 80,945 | | | $ | 1,993,675 | |
| | |
| Entertainment - 1.0% | | | | | | | | |
| Cinemark Holdings, Inc. | | | 78,665 | | | $ | 1,645,672 | |
| | |
| Food & Beverages - 0.5% | | | | | | | | |
| Snyders-Lance, Inc. | | | 35,037 | | | $ | 786,581 | |
11
Portfolio of Investments – continued
| | | | | | | | |
| Issuer | | Shares/Par | | | Value ($) | |
| | | | | | | | |
| Common Stocks - continued | | | | | | | | |
| Gaming & Lodging - 1.1% | | | | | | | | |
| WMS Industries, Inc. (a) | | | 81,795 | | | $ | 1,801,944 | |
| | |
| Insurance - 6.6% | | | | | | | | |
| Allied World Assurance Co. | | | 24,603 | | | $ | 1,623,060 | |
| Alterra Capital Holdings Ltd. | | | 72,980 | | | | 1,675,621 | |
| Aspen Insurance Holdings Ltd. | | | 63,709 | | | | 1,690,200 | |
| Everest Re Group Ltd. | | | 19,212 | | | | 1,687,774 | |
| Hanover Insurance Group, Inc. | | | 30,350 | | | | 1,238,887 | |
| Symetra Financial Corp. | | | 159,579 | | | | 1,586,215 | |
| Willis Group Holdings PLC | | | 41,260 | | | | 1,480,409 | |
| | | | | | | | |
| | | | | | | $ | 10,982,166 | |
| Internet - 0.5% | | | | | | | | |
| QuinStreet, Inc. (a) | | | 74,820 | | | $ | 781,869 | |
| | |
| Leisure & Toys - 1.0% | | | | | | | | |
| Callaway Golf Co. | | | 252,211 | | | $ | 1,651,982 | |
| | |
| Machinery & Tools - 7.5% | | | | | | | | |
| Altra Holdings, Inc. (a) | | | 63,400 | | | $ | 1,235,666 | |
| Columbus McKinnon Corp. (a) | | | 90,250 | | | | 1,502,663 | |
| Douglas Dynamics, Inc. | | | 110,595 | | | | 1,437,735 | |
| EnPro Industries, Inc. (a) | | | 26,850 | | | | 1,015,199 | |
| Herman Miller, Inc. | | | 86,995 | | | | 1,826,895 | |
| Interline Brands, Inc. (a) | | | 84,024 | | | | 1,727,533 | |
| Kennametal, Inc. | | | 24,970 | | | | 1,150,368 | |
| Polypore International, Inc. (a) | | | 30,660 | | | | 1,260,739 | |
| Regal Beloit Corp. | | | 19,530 | | | | 1,318,275 | |
| | | | | | | | |
| | | | | | | $ | 12,475,073 | |
| Major Banks - 1.0% | | | | | | | | |
| Huntington Bancshares, Inc. | | | 292,430 | | | $ | 1,709,253 | |
| | |
| Medical & Health Technology & Services - 6.9% | | | | | | | | |
| Almost Family, Inc. (a) | | | 93,045 | | | $ | 2,128,870 | |
| Community Health Systems, Inc. (a) | | | 71,312 | | | | 1,799,915 | |
| Cross Country Healthcare, Inc. (a) | | | 324,571 | | | | 1,837,072 | |
| IPC The Hospitalist Co., Inc. (a) | | | 33,260 | | | | 1,209,666 | |
| LifePoint Hospitals, Inc. (a) | | | 40,751 | | | | 1,588,066 | |
| Teleflex, Inc. | | | 27,613 | | | | 1,636,623 | |
| VCA Antech, Inc. (a) | | | 57,772 | | | | 1,270,406 | |
| | | | | | | | |
| | | | | | | $ | 11,470,618 | |
12
Portfolio of Investments – continued
| | | | | | | | |
| Issuer | | Shares/Par | | | Value ($) | |
| | | | | | | | |
| Common Stocks - continued | | | | | | | | |
| Metals & Mining - 1.1% | | | | | | | | |
| TMS International Corp., “A” (a) | | | 156,840 | | | $ | 1,866,396 | |
| | |
| Natural Gas - Distribution - 2.5% | | | | | | | | |
| AGL Resources, Inc. | | | 34,097 | | | $ | 1,359,447 | |
| NorthWestern Corp. | | | 38,860 | | | | 1,349,608 | |
| UGI Corp. | | | 52,171 | | | | 1,473,831 | |
| | | | | | | | |
| | | | | | | $ | 4,182,886 | |
| Other Banks & Diversified Financials - 10.1% | | | | | | | | |
| BBCN Bancorp, Inc. (a) | | | 166,851 | | | $ | 1,710,223 | |
| Brookline Bancorp, Inc. | | | 175,275 | | | | 1,609,025 | |
| CAI International, Inc. (a) | | | 124,210 | | | | 2,502,832 | |
| CapitalSource, Inc. | | | 231,108 | | | | 1,559,979 | |
| Cathay General Bancorp, Inc. | | | 104,796 | | | | 1,712,367 | |
| Glacier Bancorp, Inc. | | | 123,490 | | | | 1,704,162 | |
| International Bancshares Corp. | | | 60,786 | | | | 1,153,718 | |
| Sandy Spring Bancorp, Inc. | | | 78,788 | | | | 1,422,911 | |
| ViewPoint Financial Group | | | 112,458 | | | | 1,685,745 | |
| Wintrust Financial Corp. | | | 52,684 | | | | 1,775,978 | |
| | | | | | | | |
| | | | | | | $ | 16,836,940 | |
| Pollution Control - 0.8% | | | | | | | | |
| Progressive Waste Solutions Ltd. | | | 68,066 | | | $ | 1,393,992 | |
| | |
| Printing & Publishing - 0.8% | | | | | | | | |
| Lamar Advertising Co., “A” (a) | | | 40,010 | | | $ | 1,308,327 | |
| | |
| Railroad & Shipping - 0.8% | | | | | | | | |
| Diana Shipping, Inc. (a) | | | 149,034 | | | $ | 1,362,171 | |
| | |
| Real Estate - 3.6% | | | | | | | | |
| BioMed Realty Trust, Inc., REIT | | | 68,610 | | | $ | 1,263,796 | |
| Capstead Mortgage Corp., REIT | | | 128,972 | | | | 1,715,328 | |
| EastGroup Properties, Inc., REIT | | | 17,710 | | | | 853,445 | |
| Entertainment Properties Trust, REIT | | | 45,528 | | | | 2,071,524 | |
| | | | | | | | |
| | | | | | | $ | 5,904,093 | |
| Restaurants - 1.1% | | | | | | | | |
| P.F. Chang’s China Bistro, Inc. | | | 49,234 | | | $ | 1,886,647 | |
| | |
| Special Products & Services - 0.5% | | | | | | | | |
| WD-40 Co. | | | 19,170 | | | $ | 825,844 | |
13
Portfolio of Investments – continued
| | | | | | | | |
| Issuer | | Shares/Par | | | Value ($) | |
| | | | | | | | |
| Common Stocks - continued | | | | | | | | |
| Specialty Chemicals - 3.3% | | | | | | | | |
| A. Schulman, Inc. | | | 65,102 | | | $ | 1,682,236 | |
| Ferro Corp. (a) | | | 239,720 | | | | 1,330,446 | |
| Koppers Holdings, Inc. | | | 33,386 | | | | 1,256,315 | |
| Quaker Chemical Corp. | | | 28,930 | | | | 1,192,205 | |
| | | | | | | | |
| | | | | | | $ | 5,461,202 | |
| Specialty Stores - 5.9% | | | | | | | | |
| American Eagle Outfitters, Inc. | | | 128,724 | | | $ | 1,871,647 | |
| Ann, Inc. (a) | | | 68,548 | | | | 1,637,612 | |
| Destination Maternity Corp. | | | 110,803 | | | | 1,992,238 | |
| hhgregg, Inc. (a) | | | 121,168 | | | | 1,384,950 | |
| Kirkland’s, Inc. (a) | | | 109,960 | | | | 1,753,862 | |
| rue21, Inc. (a) | | | 46,040 | | | | 1,228,347 | |
| | | | | | | | |
| | | | | | | $ | 9,868,656 | |
| Trucking - 2.1% | | | | | | | | |
| Celadon Group, Inc. | | | 119,390 | | | $ | 1,762,196 | |
| Landstar System, Inc. | | | 31,914 | | | | 1,725,271 | |
| | | | | | | | |
| | | | | | | $ | 3,487,467 | |
| Utilities - Electric Power - 2.0% | | | | | | | | |
| El Paso Electric Co. | | | 42,760 | | | $ | 1,399,535 | |
| GenOn Energy, Inc. (a) | | | 190,680 | | | | 469,073 | |
| Great Plains Energy, Inc. | | | 70,277 | | | | 1,390,079 | |
| | | | | | | | |
| | | | | | | $ | 3,258,687 | |
| Total Common Stocks (Identified Cost, $153,982,524) | | | | | | $ | 157,749,714 | |
| | |
| Money Market Funds - 4.0% | | | | | | | | |
MFS Institutional Money Market Portfolio, 0.1%,
at Cost and Net Asset Value (v) | | | 6,717,269 | | | $ | 6,717,269 | |
| Total Investments (Identified Cost, $160,699,793) | | | | | | $ | 164,466,983 | |
| | |
| Other Assets, Less Liabilities - 1.1% | | | | | | | 1,785,501 | |
| Net Assets - 100.0% | | | | | | $ | 166,252,484 | |
| (a) | Non-income producing security. |
| (v) | Underlying affiliated fund that is available only to investment companies managed by MFS. The rate quoted for the MFS Institutional Money Market Portfolio is the annualized seven-day yield of the fund at period end. |
The following abbreviations are used in this report and are defined:
| ADR | | American Depositary Receipt |
| PLC | | Public Limited Company |
| REIT | | Real Estate Investment Trust |
14
Portfolio of Investments – continued
Derivative Contracts at 2/29/12
Swap Agreements at 2/29/12
| | | | | | | | | | | | | | | | | | |
| Expiration | | Currency | | | Notional
Amount | | | Counterparty | | Cash Flows
to Receive | | Cash Flows
to Pay | | Value | |
| Liability Derivatives | | | | | | | | | | | |
| Total Return Swaps | | | | | | | | | | | |
| 1/31/13 | | | USD | | | | 791,658 | | | Merrill Lynch International Bank | | 1 Month LIBOR | | (1) | | | $(842 | ) |
| | | | | | | | | | | | | | | | | | |
| (1) | Fund to pay based on the change in value of 10,117 shares of Apco Oil and Gas International, Inc. |
At February 29, 2012, the fund had sufficient cash and/or other liquid securities to cover any commitments under these derivative contracts.
See Notes to Financial Statements
15
Financial Statements
STATEMENT OF ASSETS AND LIABILITIES
At 2/29/12
This statement represents your fund’s balance sheet, which details the assets and liabilities comprising the total value of the fund.
| | | | |
| Assets | | | | |
Investments- | | | | |
Non-affiliated issuers, at value (identified cost, $153,982,524) | | | $157,749,714 | |
Underlying affiliated funds, at cost and value | | | 6,717,269 | |
Total investments, at value (identified cost, $160,699,793) | | | $164,466,983 | |
Receivables for | | | | |
Investments sold | | | 3,120,342 | |
Fund shares sold | | | 389,648 | |
Dividends | | | 139,264 | |
Other assets | | | 1,994 | |
Total assets | | | $168,118,231 | |
| Liabilities | | | | |
Payables for | | | | |
Investments purchased | | | $1,648,114 | |
Fund shares reacquired | | | 146,403 | |
Swaps, at value | | | 842 | |
Payable to affiliates | | | | |
Investment adviser | | | 8,476 | |
Shareholder servicing costs | | | 141 | |
Distribution and service fees | | | 56 | |
Payable for independent Trustees’ compensation | | | 23 | |
Accrued expenses and other liabilities | | | 61,692 | |
Total liabilities | | | $1,865,747 | |
Net assets | | | $166,252,484 | |
| Net assets consist of | | | | |
Paid-in capital | | | $159,267,651 | |
Unrealized appreciation (depreciation) on investments | | | 3,766,348 | |
Accumulated net realized gain (loss) on investments and foreign currency transactions | | | 3,274,114 | |
Accumulated distributions in excess of net investment income | | | (55,629 | ) |
Net assets | | | $166,252,484 | |
Shares of beneficial interest outstanding | | | 16,176,486 | |
| | | | | | | | | | | | |
| | | Net assets | | | Shares
outstanding | | | Net asset value
per share (a) | |
Class A | | | $1,872,036 | | | | 182,356 | | | | $10.27 | |
Class B | | | 200,008 | | | | 19,525 | | | | 10.24 | |
Class C | | | 181,973 | | | | 17,772 | | | | 10.24 | |
Class I | | | 163,584,628 | | | | 15,916,535 | | | | 10.28 | |
Class R1 | | | 102,618 | | | | 10,016 | | | | 10.25 | |
Class R2 | | | 104,605 | | | | 10,182 | | | | 10.27 | |
Class R3 | | | 103,209 | | | | 10,042 | | | | 10.28 | |
Class R4 | | | 103,407 | | | | 10,058 | | | | 10.28 | |
| (a) | Maximum offering price per share was equal to the net asset value per share for all share classes, except for Class A, for which the maximum offering price per share was $10.90 [100 / 94.25 x $10.27]. On sales of $50,000 or more, the maximum offering price of Class A shares is reduced. A contingent deferred sales charge may be imposed on redemptions of Class A, Class B, and Class C shares. Redemption price per share was equal to the net asset value per share for Classes I, R1, R2, R3, and R4. |
See Notes to Financial Statements
16
Financial Statements
STATEMENT OF OPERATIONS
Period ended 2/29/12 (c)
This statement describes how much your fund earned in investment income and accrued in expenses. It also describes any gains and/or losses generated by fund operations.
| | | | |
| Net investment income | | | | |
Income | | | | |
Dividends | | | $1,607,505 | |
Dividends from underlying affiliated funds | | | 2,321 | |
Foreign taxes withheld | | | (6,650 | ) |
Total investment income | | | $1,603,176 | |
Expenses | | | | |
Management fee | | | $974,047 | |
Distribution and service fees | | | 4,263 | |
Shareholder servicing costs | | | 449 | |
Administrative services fee | | | 24,033 | |
Independent Trustees’ compensation | | | 752 | |
Custodian fee | | | 20,238 | |
Shareholder communications | | | 6,438 | |
Audit and tax fees | | | 28,001 | |
Legal fees | | | 1,712 | |
Miscellaneous | | | 41,149 | |
Total expenses | | | $1,101,082 | |
Fees paid indirectly | | | (6 | ) |
Reduction of expenses by investment adviser | | | (326 | ) |
Net expenses | | | $1,100,750 | |
Net investment income | | | $502,426 | |
Realized and unrealized gain (loss) on investments
and foreign currency transactions | | | | |
Realized gain (loss) (identified cost basis) | | | | |
Investment transactions | | | $3,529,345 | |
Swap transactions | | | 31,062 | |
Foreign currency transactions | | | (3,751 | ) |
Net realized gain (loss) on investments
and foreign currency transactions | | | $3,556,656 | |
Change in unrealized appreciation (depreciation) | | | | |
Investments | | | $3,767,190 | |
Swap transactions | | | (842 | ) |
Net unrealized gain (loss) on investments | | | $3,766,348 | |
Net realized and unrealized gain (loss) on investments | | | $7,323,004 | |
Change in net assets from operations | | | $7,825,430 | |
| (c) | For the period from the commencement of the fund’s investment operations, May 26, 2011, through the stated period end. |
See Notes to Financial Statements
17
Financial Statements
STATEMENT OF CHANGES IN NET ASSETS
This statement describes the increases and/or decreases in net assets resulting from operations, any distributions, and any shareholder transactions.
| | | | |
| Change in net assets | | Period ended
2/29/12 (c) | |
| From operations | | | | |
Net investment income | | | $502,426 | |
Net realized gain (loss) on investments and
foreign currency transactions | | | 3,556,656 | |
Net unrealized gain (loss) on investments | | | 3,766,348 | |
Change in net assets from operations | | | $7,825,430 | |
| Distributions declared to shareholders | | | | |
From net investment income | | | $(604,075 | ) |
From net realized gain on investments | | | (232,152 | ) |
Total distributions declared to shareholders | | | $(836,227 | ) |
Change in net assets from fund share transactions | | | $159,263,281 | |
Total change in net assets | | | $166,252,484 | |
| Net assets | | | | |
At beginning of period | | | — | |
At end of period (including accumulated distributions in excess of net investment income of $55,629) | | | $166,252,484 | |
| (c) | For the period from the commencement of the fund’s investment operations, May 26, 2011, through the stated period end. |
See Notes to Financial Statements
18
Financial Statements
FINANCIAL HIGHLIGHTS
The financial highlights table is intended to help you understand the fund’s financial performance for the past 5 years (or life of a particular share class, if shorter). Certain information reflects financial results for a single fund share. The total returns in the table represent the rate by which an investor would have earned (or lost) on an investment in the fund share class (assuming reinvestment of all distributions) held for the entire period.
| | | | |
| Class A | | Period ended
2/29/12 (c) | |
Net asset value, beginning of period | | | $10.00 | |
| Income (loss) from investment operations | | | | |
Net investment income (d) | | | $0.01 | |
Net realized and unrealized gain (loss) on investments and foreign currency | | | 0.30 | |
Total from investment operations | | | $0.31 | |
| Less distributions declared to shareholders | | | | |
From net investment income | | | $(0.03 | ) |
From net realized gain on investments | | | (0.01 | ) |
Total distributions declared to shareholders | | | $(0.04 | ) |
Net asset value, end of period (x) | | | $10.27 | |
Total return (%) (r)(s)(t)(x) | | | 3.22 | (n) |
| Ratios (%) (to average net assets) and Supplemental data: | | | | |
Expenses before expense reductions (f) | | | 1.25 | (a) |
Expenses after expense reductions (f) | | | 1.25 | (a) |
Net investment income | | | 0.17 | (a) |
Portfolio turnover | | | 56 | |
Net assets at end of period (000 omitted) | | | $1,872 | |
See Notes to Financial Statements
19
Financial Highlights – continued
| | | | |
| Class B | | Period ended
2/29/12 (c) | |
Net asset value, beginning of period | | | $10.00 | |
| Income (loss) from investment operations | | | | |
Net investment loss (d) | | | $(0.04 | ) |
Net realized and unrealized gain (loss) on investments and foreign currency | | | 0.29 | |
Total from investment operations | | | $0.25 | |
| Less distributions declared to shareholders | | | | |
From net realized gain on investments | | | $(0.01 | ) |
Net asset value, end of period (x) | | | $10.24 | |
Total return (%) (r)(s)(t)(x) | | | 2.56 | (n) |
| Ratios (%) (to average net assets) and Supplemental data: | | | | |
Expenses before expense reductions (f) | | | 2.01 | (a) |
Expenses after expense reductions (f) | | | 2.01 | (a) |
Net investment loss | | | (0.57 | )(a) |
Portfolio turnover | | | 56 | |
Net assets at end of period (000 omitted) | | | $200 | |
| | | | |
| Class C | | Period ended
2/29/12 (c) | |
Net asset value, beginning of period | | | $10.00 | |
| Income (loss) from investment operations | | | | |
Net investment loss (d) | | | $(0.04 | ) |
Net realized and unrealized gain (loss) on investments and foreign currency | | | 0.29 | |
Total from investment operations | | | $0.25 | |
| Less distributions declared to shareholders | | | | |
From net investment income | | | $(0.00 | )(w) |
From net realized gain on investments | | | (0.01 | ) |
Total distributions declared to shareholders | | | $(0.01 | ) |
Net asset value, end of period (x) | | | $10.24 | |
Total return (%) (r)(s)(t)(x) | | | 2.62 | (n) |
| Ratios (%) (to average net assets) and Supplemental data: | | | | |
Expenses before expense reductions (f) | | | 2.01 | (a) |
Expenses after expense reductions (f) | | | 2.01 | (a) |
Net investment loss | | | (0.53 | )(a) |
Portfolio turnover | | | 56 | |
Net assets at end of period (000 omitted) | | | $182 | |
See Notes to Financial Statements
20
Financial Highlights – continued
| | | | |
| Class I | | Period ended
2/29/12 (c) | |
Net asset value, beginning of period | | | $10.00 | |
| Income (loss) from investment operations | | | | |
Net investment income (d) | | | $0.03 | |
Net realized and unrealized gain (loss) on investments and foreign currency | | | 0.30 | |
Total from investment operations | | | $0.33 | |
| Less distributions declared to shareholders | | | | |
From net investment income | | | $(0.04 | ) |
From net realized gain on investments | | | (0.01 | ) |
Total distributions declared to shareholders | | | $(0.05 | ) |
Net asset value, end of period (x) | | | $10.28 | |
Total return (%) (r)(s)(x) | | | 3.39 | (n) |
| Ratios (%) (to average net assets) and Supplemental data: | | | | |
Expenses before expense reductions (f) | | | 1.01 | (a) |
Expenses after expense reductions (f) | | | 1.01 | (a) |
Net investment income | | | 0.47 | (a) |
Portfolio turnover | | | 56 | |
Net assets at end of period (000 omitted) | | | $163,585 | |
| | | | |
| Class R1 | | Period ended
2/29/12 (c) | |
Net asset value, beginning of period | | | $10.00 | |
| Income (loss) from investment operations | | | | |
Net investment loss (d) | | | $(0.04 | ) |
Net realized and unrealized gain (loss) on investments and foreign currency | | | 0.30 | |
Total from investment operations | | | $0.26 | |
| Less distributions declared to shareholders | | | | |
From net realized gain on investments | | | $(0.01 | ) |
Net asset value, end of period (x) | | | $10.25 | |
Total return (%) (r)(s)(x) | | | 2.66 | (n) |
| Ratios (%) (to average net assets) and Supplemental data: | | | | |
Expenses before expense reductions (f) | | | 2.01 | (a) |
Expenses after expense reductions (f) | | | 2.01 | (a) |
Net investment loss | | | (0.56 | )(a) |
Portfolio turnover | | | 56 | |
Net assets at end of period (000 omitted) | | | $103 | |
See Notes to Financial Statements
21
Financial Highlights – continued
| | | | |
| Class R2 | | Period ended
2/29/12 (c) | |
Net asset value, beginning of period | | | $10.00 | |
| Income (loss) from investment operations | | | | |
Net investment loss (d) | | | $(0.00 | )(w) |
Net realized and unrealized gain (loss) on investments and foreign currency | | | 0.29 | |
Total from investment operations | | | $0.29 | |
| Less distributions declared to shareholders | | | | |
From net investment income | | | $(0.01 | ) |
From net realized gain on investments | | | (0.01 | ) |
Total distributions declared to shareholders | | | $(0.02 | ) |
Net asset value, end of period (x) | | | $10.27 | |
Total return (%) (r)(s)(x) | | | 2.98 | (n) |
| Ratios (%) (to average net assets) and Supplemental data: | | | | |
Expenses before expense reductions (f) | | | 1.51 | (a) |
Expenses after expense reductions (f) | | | 1.51 | (a) |
Net investment loss | | | (0.06 | )(a) |
Portfolio turnover | | | 56 | |
Net assets at end of period (000 omitted) | | | $105 | |
| | | | |
| Class R3 | | Period ended
2/29/12 (c) | |
Net asset value, beginning of period | | | $10.00 | |
| Income (loss) from investment operations | | | | |
Net investment income (d) | | | $0.01 | |
Net realized and unrealized gain (loss) on investments and foreign currency | | | 0.30 | |
Total from investment operations | | | $0.31 | |
| Less distributions declared to shareholders | | | | |
From net investment income | | | $(0.02 | ) |
From net realized gain on investments | | | (0.01 | ) |
Total distributions declared to shareholders | | | $(0.03 | ) |
Net asset value, end of period (x) | | | $10.28 | |
Total return (%) (r)(s)(x) | | | 3.23 | (n) |
| Ratios (%) (to average net assets) and Supplemental data: | | | | |
Expenses before expense reductions (f) | | | 1.26 | (a) |
Expenses after expense reductions (f) | | | 1.26 | (a) |
Net investment income | | | 0.19 | (a) |
Portfolio turnover | | | 56 | |
Net assets at end of period (000 omitted) | | | $103 | |
See Notes to Financial Statements
22
Financial Highlights – continued
| | | | |
| Class R4 | | Period ended
2/29/12 (c) | |
Net asset value, beginning of period | | | $10.00 | |
| Income (loss) from investment operations | | | | |
Net investment income (d) | | | $0.03 | |
Net realized and unrealized gain (loss) on investments and foreign currency | | | 0.30 | |
Total from investment operations | | | $0.33 | |
| Less distributions declared to shareholders | | | | |
From net investment income | | | $(0.04 | ) |
From net realized gain on investments | | | (0.01 | ) |
Total distributions declared to shareholders | | | $(0.05 | ) |
Net asset value, end of period (x) | | | $10.28 | |
Total return (%) (r)(s)(x) | | | 3.39 | (n) |
| Ratios (%) (to average net assets) and Supplemental data: | | | | |
Expenses before expense reductions (f) | | | 1.01 | (a) |
Expenses after expense reductions (f) | | | 1.01 | (a) |
Net investment income | | | 0.44 | (a) |
Portfolio turnover | | | 56 | |
Net assets at end of period (000 omitted) | | | $103 | |
| (c) | For the period from the commencement of the fund’s investment operations, May 26, 2011, through the stated period end. |
| (d) | Per share data is based on average shares outstanding. |
| (f) | Ratios do not reflect reductions from fees paid indirectly, if applicable. |
| (r) | Certain expenses have been reduced without which performance would have been lower. |
| (s) | From time to time the fund may receive proceeds from litigation settlements, without which performance would be lower. |
| (t) | Total returns do not include any applicable sales charges. |
| (w) | Per share amount was less than $0.01. |
| (x) | The net asset values per share and total returns have been calculated on net asset values which include adjustments made in accordance with U.S. generally accepted accounting principles required at period end for financial reporting purposes. |
See Notes to Financial Statements
23
NOTES TO FINANCIAL STATEMENTS
| (1) | | Business and Organization |
MFS New Discovery Value Fund (the fund) is a series of MFS Series Trust XIII (the trust). The trust is organized as a Massachusetts business trust and is registered under the Investment Company Act of 1940, as amended, as an open-end management investment company.
| (2) | | Significant Accounting Policies |
General – The preparation of financial statements in conformity with U.S. generally accepted accounting principles requires management to make estimates and assumptions that affect the reported amounts of assets and liabilities, and disclosure of contingent assets and liabilities at the date of the financial statements and the reported amounts of revenues and expenses during the reporting period. Actual results could differ from those estimates. In the preparation of these financial statements, management has evaluated subsequent events occurring after the date of the fund’s Statement of Assets and Liabilities through the date that the financial statements were issued. The fund will generally focus on securities of small size companies which may be more volatile than those of larger companies.
In December 2011, the Financial Accounting Standards Board issued Accounting Standards Update 2011-11, Balance Sheet (Topic 210) – Disclosures about Offsetting Assets and Liabilities (“ASU 2011-11”). Effective for annual reporting periods beginning on or after January 1, 2013 and interim periods within those annual periods, ASU 2011-11 is intended to enhance disclosure requirements on the offsetting of financial assets and liabilities. Although still evaluating the potential impacts of ASU 2011-11 to the fund, management expects that the impact of the fund’s adoption will be limited to additional financial statement disclosures.
Investment Valuations – Equity securities, including restricted equity securities, are generally valued at the last sale or official closing price as provided by a third-party pricing service on the market or exchange on which they are primarily traded. Equity securities, for which there were no sales reported that day, are generally valued at the last quoted daily bid quotation as provided by a third-party pricing service on the market or exchange on which such securities are primarily traded. Short-term instruments with a maturity at issuance of 60 days or less generally are valued at amortized cost, which approximates market value. Swaps are generally valued at valuations provided by a third-party pricing service. Open-end investment companies are generally valued at net asset value per share. Securities and other assets generally valued on the basis of information from a third-party pricing service may also be valued at a broker/dealer bid quotation. Values obtained from third-party pricing services can utilize both transaction data and market information such
24
Notes to Financial Statements – continued
as yield, quality, coupon rate, maturity, type of issue, trading characteristics, and other market data. The values of foreign securities and other assets and liabilities expressed in foreign currencies are converted to U.S. dollars using the mean of bid and asked prices for rates provided by a third-party pricing service.
The Board of Trustees has delegated primary responsibility for determining or causing to be determined the value of the fund’s investments (including any fair valuation) to the adviser pursuant to valuation policies and procedures approved by the Board. If the adviser determines that reliable market quotations are not readily available, investments are valued at fair value as determined in good faith by the adviser in accordance with such procedures under the oversight of the Board of Trustees. Under the fund’s valuation policies and procedures, market quotations are not considered to be readily available for most types of debt instruments and floating rate loans and many types of derivatives. These investments are generally valued at fair value based on information from third-party pricing services. In addition, investments may be valued at fair value if the adviser determines that an investment’s value has been materially affected by events occurring after the close of the exchange or market on which the investment is principally traded (such as foreign exchange or market) and prior to the determination of the fund’s net asset value, or after the halting of trading of a specific security where trading does not resume prior to the close of the exchange or market on which the security is principally traded. Events that occur on a frequent basis after foreign markets close (such as developments in foreign markets and significant movements in the U.S. markets) and prior to the determination of the fund’s net asset value may be deemed to have a material effect on the value of securities traded in foreign markets. Accordingly, the fund’s foreign equity securities may often be valued at fair value. The adviser generally relies on third-party pricing services or other information (such as the correlation with price movements of similar securities in the same or other markets; the type, cost and investment characteristics of the security; the business and financial condition of the issuer; and trading and other market data) to assist in determining whether to fair value and at what value to fair value an investment. The value of an investment for purposes of calculating the fund’s net asset value can differ depending on the source and method used to determine value. When fair valuation is used, the value of an investment used to determine the fund’s net asset value may differ from quoted or published prices for the same investment. There can be no assurance that the fund could obtain the fair value assigned to an investment if it were to sell the investment at the same time at which the fund determines its net asset value per share.
Various inputs are used in determining the value of the fund’s assets or liabilities. These inputs are categorized into three broad levels. In certain cases, the inputs used to measure fair value may fall into different levels of the fair
25
Notes to Financial Statements – continued
value hierarchy. In such cases, an investment’s level within the fair value hierarchy is based on the lowest level of input that is significant to the fair value measurement. The fund’s assessment of the significance of a particular input to the fair value measurement in its entirety requires judgment, and considers factors specific to the investment. Level 1 includes unadjusted quoted prices in active markets for identical assets or liabilities. Level 2 includes other significant observable market-based inputs (including quoted prices for similar securities, interest rates, prepayment speed, and credit risk). Level 3 includes unobservable inputs, which may include the adviser’s own assumptions in determining the fair value of investments. Other financial instruments are derivative instruments not reflected in total investments, such as swap contracts. The following is a summary of the levels used as of February 29, 2012 in valuing the fund’s assets or liabilities:
| | | | | | | | | | | | | | | | |
| Investments at Value | | Level 1 | | | Level 2 | | | Level 3 | | | Total | |
| Equity Securities: | | | | | | | | | | | | | | | | |
United States | | | $152,292,507 | | | | $— | | | | $— | | | | $152,292,507 | |
Japan | | | — | | | | 1,455,195 | | | | — | | | | 1,455,195 | |
Canada | | | 1,393,992 | | | | — | | | | — | | | | 1,393,992 | |
Greece | | | 1,362,171 | | | | — | | | | — | | | | 1,362,171 | |
Israel | | | 1,245,849 | | | | — | | | | — | | | | 1,245,849 | |
| Mutual Funds | | | 6,717,269 | | | | — | | | | — | | | | 6,717,269 | |
| Total Investments | | | $163,011,788 | | | | $1,455,195 | | | | $— | | | | $164,466,983 | |
| | | | |
| Other Financial Instruments | | | | | | | | | | | | |
| Swaps | | | $— | | | | $(842 | ) | | | $— | | | | $(842 | ) |
For further information regarding security characteristics, see the Portfolio of Investments.
Foreign Currency Translation – Purchases and sales of foreign investments, income, and expenses are converted into U.S. dollars based upon currency exchange rates prevailing on the respective dates of such transactions or on the reporting date for foreign denominated receivables and payables. Gains and losses attributable to foreign currency exchange rates on sales of securities are recorded for financial statement purposes as net realized gains and losses on investments. Gains and losses attributable to foreign exchange rate movements on receivables, payables, income and expenses are recorded for financial statement purposes as foreign currency transaction gains and losses. That portion of both realized and unrealized gains and losses on investments that results from fluctuations in foreign currency exchange rates is not separately disclosed.
Derivatives – The fund uses derivatives for different purposes, primarily to increase or decrease exposure to a particular market or segment of the market, or security, to increase or decrease interest rate or currency exposure, or as
26
Notes to Financial Statements – continued
alternatives to direct investments. Derivatives are used for hedging or non-hedging purposes. While hedging can reduce or eliminate losses, it can also reduce or eliminate gains. When the fund uses derivatives as an investment to increase market exposure, or for hedging purposes, gains and losses from derivative instruments may be substantially greater than the derivative’s original cost.
The derivative instruments used by the fund were swap agreements. The fund’s period end derivatives, as presented in the Portfolio of Investments and the associated Derivative Contract Tables, generally are indicative of the volume of its derivative activity during the period.
The following table presents, by major type of derivative contract, the fair value, on a gross basis, of the asset and liability components of derivatives held by the fund at February 29, 2012 as reported in the Statement of Assets and Liabilities:
| | | | | | | | | | |
| | | | | Fair Value | |
| Risk | | Derivative Contracts | | Asset Derivatives | | | Liability Derivatives | |
| Equity | | Total Return Swaps | | | $— | | | | $(842 | ) |
The following table presents, by major type of derivative contract, the realized gain (loss) on derivatives held by the fund for the period ended February 29, 2012 as reported in the Statement of Operations:
| | | | |
| Risk | | Swap Transactions | |
| Equity | | | $31,062 | |
The following table presents, by major type of derivative contract, the change in unrealized appreciation (depreciation) on derivatives held by the fund for the period ended February 29, 2012 as reported in the Statement of Operations:
| | | | |
| Risk | | Swap Transactions | |
| Equity | | | $(842 | ) |
Derivative counterparty credit risk is managed through formal evaluation of the creditworthiness of all potential counterparties. On certain over-the-counter derivatives, the fund attempts to reduce its exposure to counterparty credit risk whenever possible by entering into an International Swaps and Derivatives Association (ISDA) Master Agreement on a bilateral basis with each of the counterparties with whom it undertakes a significant volume of transactions. The ISDA Master Agreement gives each party to the agreement the right to terminate all transactions traded under such agreement if there is a certain deterioration in the credit quality of the other party. The ISDA Master Agreement gives the fund the right, upon an event of default by the applicable counterparty or a termination of the agreement, to close out all transactions traded under such agreement and to net amounts owed under each transaction to one net amount payable by one party to the other. This right to close out
27
Notes to Financial Statements – continued
and net payments across all transactions traded under the ISDA Master Agreement could result in a reduction of the fund’s credit risk to such counterparty equal to any amounts payable by the fund under the applicable transactions, if any. However, absent an event of default by the counterparty or a termination of the agreement, the ISDA Master Agreement does not result in an offset of reported amounts of assets and liabilities in the Statement of Assets and Liabilities across transactions between the fund and the applicable counterparty.
Collateral requirements differ by type of derivative. Collateral or margin requirements are set by the broker or exchange clearing house for exchange traded derivatives (i.e., futures and exchange-traded options) while collateral terms are contract specific for over-the-counter traded derivatives (i.e., forward foreign currency exchange contracts, swaps and over-the-counter options). For derivatives traded under an ISDA Master Agreement, the collateral requirements are netted across all transactions traded under such agreement and one amount is posted from one party to the other to collateralize such obligations. Cash collateral that has been pledged to cover obligations of the fund under derivative contracts, if any, will be reported separately on the Statement of Assets and Liabilities as restricted cash. Securities collateral pledged for the same purpose, if any, is noted in the Portfolio of Investments.
Swap Agreements – The fund entered into swap agreements. A swap is generally an exchange of cash payments, at specified intervals or upon the occurrence of specified events, between the fund and a counterparty. The net cash payments exchanged are recorded as a realized gain or loss on swap transactions in the Statement of Operations. The value of the swap, which is adjusted daily and includes any related interest accruals to be paid or received by the fund, is recorded on the Statement of Assets and Liabilities. The daily change in value, including any related interest accruals to be paid or received, is recorded as unrealized appreciation or depreciation on swap transactions in the Statement of Operations. Amounts paid or received at the inception of the swap are reflected as premiums paid or received on the Statement of Assets and Liabilities and are amortized using the effective interest method over the term of the agreement. A liquidation payment received or made upon early termination is recorded as a realized gain or loss on swap transactions in the Statement of Operations.
Risks related to swap agreements include the possible lack of a liquid market, unfavorable market and interest rate movements of the underlying instrument and the failure of the counterparty to perform under the terms of the agreements. To address counterparty risk, swap transactions are limited to only highly-rated counterparties. The risk is further mitigated by having an ISDA Master Agreement between the fund and the counterparty providing for
28
Notes to Financial Statements – continued
netting as described above and by the posting of collateral by the counterparty to the fund to cover the fund’s exposure to the counterparty under such ISDA Master Agreement.
The fund entered into total return swaps which involve commitments to pay interest in exchange for a market-linked return based on a notional amount. To the extent the total return of the security or index underlying the transaction exceeds or falls short of the offsetting interest rate obligation, the fund will receive a payment from or make a payment to the counterparty, respectively. The fund may enter into total return swaps on a particular security, or a basket or index of securities, in order to gain exposure to the underlying security or securities.
Indemnifications – Under the fund’s organizational documents, its officers and Trustees may be indemnified against certain liabilities and expenses arising out of the performance of their duties to the fund. Additionally, in the normal course of business, the fund enters into agreements with service providers that may contain indemnification clauses. The fund’s maximum exposure under these agreements is unknown as this would involve future claims that may be made against the fund that have not yet occurred.
Investment Transactions and Income – Investment transactions are recorded on the trade date. Dividends received in cash are recorded on the ex-dividend date. Certain dividends from foreign securities will be recorded when the fund is informed of the dividend if such information is obtained subsequent to the ex-dividend date. Dividend and interest payments received in additional securities are recorded on the ex-dividend or ex-interest date in an amount equal to the value of the security on such date.
The fund may receive proceeds from litigation settlements. Any proceeds received from litigation involving portfolio holdings are reflected in the Statement of Operations in realized gain/loss if the security has been disposed of by the fund or in unrealized gain/loss if the security is still held by the fund. Any other proceeds from litigation not related to portfolio holdings are reflected as other income in the Statement of Operations.
Fees Paid Indirectly – The fund’s custody fee may be reduced according to an arrangement that measures the value of cash deposited with the custodian by the fund. This amount, for the period ended February 29, 2012, is shown as a reduction of total expenses on the Statement of Operations.
Tax Matters and Distributions – The fund intends to qualify as a regulated investment company, as defined under Subchapter M of the Internal Revenue Code, and to distribute all of its taxable income, including realized capital gains. As a result, no provision for federal income tax is required. The fund’s federal tax returns, when filed, will remain subject to examination by the Internal Revenue
29
Notes to Financial Statements – continued
Service for a three year period. Foreign taxes have been accrued by the fund in the accompanying financial statements.
Distributions to shareholders are recorded on the ex-dividend date. Income and capital gain distributions are determined in accordance with income tax regulations, which may differ from U.S. generally accepted accounting principles. Certain capital accounts in the financial statements are periodically adjusted for permanent differences in order to reflect their tax character. These adjustments have no impact on net assets or net asset value per share. Temporary differences which arise from recognizing certain items of income, expense, gain or loss in different periods for financial statement and tax purposes will reverse at some time in the future. Distributions in excess of net investment income or net realized gains are temporary overdistributions for financial statement purposes resulting from differences in the recognition or classification of income or distributions for financial statement and tax purposes.
Book/tax differences primarily relate to wash sale loss deferrals.
The tax character of distributions declared to shareholders for the last fiscal year is as follows:
| | | | |
| | | 2/29/12 | |
Ordinary income (including any
short-term capital gains) | | | $836,227 | |
The federal tax cost and the tax basis components of distributable earnings were as follows:
| | | | |
| As of 2/29/12 | | | |
| Cost of investments | | | $160,931,977 | |
| Gross appreciation | | | 12,056,417 | |
| Gross depreciation | | | (8,521,411 | ) |
| Net unrealized appreciation (depreciation) | | | $3,535,006 | |
| Undistributed ordinary income | | | 3,505,303 | |
| Late year ordinary loss deferral | | | (55,629 | ) |
| Other temporary differences | | | 153 | |
Multiple Classes of Shares of Beneficial Interest – The fund offers multiple classes of shares, which differ in their respective distribution and service fees. The fund’s income, realized and unrealized gain (loss), and common expenses are allocated to shareholders based on the daily net assets of each class. Dividends are declared separately for each class. Differences in per share dividend rates are generally due to differences in separate class expenses. Class B shares will convert to Class A shares approximately eight years after
30
Notes to Financial Statements – continued
purchase. The fund’s distributions declared to shareholders as reported on the Statements of Changes in Net Assets are presented by class as follows:
| | | | | | | | |
| | | From net investment
income | | | From net realized gain on
investments | |
| | | Period ended
2/29/12 (c) | | | Period ended
2/29/12 (c) | |
| Class A | | | $3,257 | | | | $1,501 | |
| Class B | | | — | | | | 171 | |
| Class C | | | 85 | | | | 259 | |
| Class I | | | 600,039 | | | | 229,659 | |
| Class R1 | | | — | | | | 140 | |
| Class R2 | | | 99 | | | | 142 | |
| Class R3 | | | 230 | | | | 140 | |
| Class R4 | | | 365 | | | | 140 | |
| Total | | | $604,075 | | | | $232,152 | |
| (c) | For the period from the commencement of the fund’s investment operations, May 26, 2011, through the stated period end. |
| (3) | | Transactions with Affiliates |
Investment Adviser – The fund has an investment advisory agreement with MFS to provide overall investment management and related administrative services and facilities to the fund. The management fee is computed daily and paid monthly at the following annual rates:
| | | | |
| First $1 billion of average daily net assets | | | 0.90 | % |
| Next $1.5 billion of average daily net assets | | | 0.80 | % |
| Average daily net assets in excess of $2.5 billion | | | 0.75 | % |
The management fee incurred for the period ended February 29, 2012 was equivalent to an annual effective rate of 0.90% of the fund’s average daily net assets.
The investment adviser has agreed in writing to pay a portion of the fund’s total annual operating expenses, exclusive of interest, taxes, extraordinary expenses, brokerage and transaction costs, and investment-related expenses, such that total annual fund operating expenses do not exceed the following rates annually of each class’ average daily net assets.
| | | | | | | | | | | | | | | | | | | | | | | | | | | | |
| Class A | | Class B | | | Class C | | | Class I | | | Class R1 | | | Class R2 | | | Class R3 | | | Class R4 | |
| 1.45% | | | 2.20% | | | | 2.20% | | | | 1.20% | | | | 2.20% | | | | 1.70% | | | | 1.45% | | | | 1.20% | |
This written agreement will continue until modified by the fund’s Board of Trustees, but such agreement will continue at least until June 30, 2013. For the period ended February 29, 2012, the fund’s actual operating expenses did not exceed the limit and therefore, the investment adviser did not pay any portion of the fund’s expenses related to this agreement.
Distributor – MFS Fund Distributors, Inc. (MFD), a wholly-owned subsidiary of MFS, as distributor, received $2,179 for the period ended February 29, 2012, as its portion of the initial sales charge on sales of Class A shares of the fund.
31
Notes to Financial Statements – continued
The Board of Trustees has adopted a distribution plan for certain class shares pursuant to Rule 12b-1 of the Investment Company Act of 1940.
The fund’s distribution plan provides that the fund will pay MFD for services provided by MFD and financial intermediaries in connection with the distribution and servicing of certain share classes. One component of the plan is a distribution fee paid to MFD and another component of the plan is a service fee paid to MFD. MFD may subsequently pay all, or a portion, of the distribution and/or service fees to financial intermediaries.
Distribution Plan Fee Table:
| | | | | | | | | | | | | | | | | | | | |
| | | Distribution
Fee Rate (d) | | | Service
Fee Rate (d) | | | Total
Distribution
Plan (d) | | | Annual
Effective
Rate (e) | | | Distribution
and Service
Fee | |
| Class A | | | — | | | | 0.25% | | | | 0.25% | | | | 0.25% | | | | $1,325 | |
| Class B | | | 0.75% | | | | 0.25% | | | | 1.00% | | | | 1.00% | | | | 858 | |
| Class C | | | 0.75% | | | | 0.25% | | | | 1.00% | | | | 1.00% | | | | 849 | |
| Class R1 | | | 0.75% | | | | 0.25% | | | | 1.00% | | | | 1.00% | | | | 701 | |
| Class R2 | | | 0.25% | | | | 0.25% | | | | 0.50% | | | | 0.50% | | | | 354 | |
| Class R3 | | | — | | | | 0.25% | | | | 0.25% | | | | 0.25% | | | | 176 | |
| Total Distribution and Service Fees | | | | $4,263 | |
| (d) | In accordance with the distribution plan for certain classes, the fund pays distribution and/or service fees equal to these annual percentage rates of each class’ average daily net assets. The distribution and service fee rates disclosed by class represent the current rates in effect at the end of the reporting period. |
| (e) | The annual effective rates represent actual fees incurred under the distribution plan for the period ended February 29, 2012 based on each class’ average daily net assets. |
Certain Class A shares are subject to a contingent deferred sales charge (CDSC) in the event of a shareholder redemption within 24 months of purchase. Class C shares are subject to a CDSC in the event of a shareholder redemption within 12 months of purchase. Class B shares are subject to a CDSC in the event of a shareholder redemption within six years of purchase. All contingent deferred sales charges are paid to MFD and during the period ended February 29, 2012, were as follows:
| | | | |
| | | Amount | |
| Class A | | | $3,000 | |
| Class B | | | — | |
| Class C | | | — | |
Shareholder Servicing Agent – MFS Service Center, Inc. (MFSC), a wholly-owned subsidiary of MFS, provides transfer agent and recordkeeping functions in connection with the issuance, transfer, and redemption of shares of the fund under a Shareholder Servicing Agent Agreement. MFSC is not paid a fee for providing these services. MFSC receives payment from the fund for out-of-pocket expenses paid by MFSC on behalf of the fund. For the period ended February 29, 2012, these costs amounted to $449. The fund may also pay shareholder servicing related costs to non-related parties.
32
Notes to Financial Statements – continued
Administrator – MFS provides certain financial, legal, shareholder communications, compliance, and other administrative services to the fund. Under an administrative services agreement, the fund partially reimburses MFS the costs incurred to provide these services. The fund is charged an annual fixed amount of $17,500 plus a fee based on average daily net assets. The administrative services fee incurred for the period ended February 29, 2012 was equivalent to an annual effective rate of 0.0222% of the fund’s average daily net assets.
Trustees’ and Officers’ Compensation – The fund pays compensation to independent Trustees in the form of a retainer, attendance fees, and additional compensation to Board and Committee chairpersons. The fund does not pay compensation directly to Trustees or officers of the fund who are also officers of the investment adviser, all of whom receive remuneration for their services to the fund from MFS. Certain officers and Trustees of the fund are officers or directors of MFS, MFD, and MFSC. The independent Trustees currently are not receiving any payments for their services to the fund.
Other – This fund and certain other funds managed by MFS (the funds) have entered into services agreements (the Agreements) which provide for payment of fees by the funds to Tarantino LLC and Griffin Compliance LLC in return for the provision of services of an Independent Chief Compliance Officer (ICCO) and Assistant ICCO, respectively, for the funds. The ICCO and Assistant ICCO are officers of the funds and the sole members of Tarantino LLC and Griffin Compliance LLC, respectively. The funds can terminate the Agreements with Tarantino LLC and Griffin Compliance LLC at any time under the terms of the Agreements. For the period ended February 29, 2012, the aggregate fees paid by the fund to Tarantino LLC and Griffin Compliance LLC were $945 and are included in miscellaneous expense on the Statement of Operations. MFS has agreed to reimburse the fund for a portion of the payments made by the fund in the amount of $326, which is shown as a reduction of total expenses in the Statement of Operations. Additionally, MFS has agreed to bear all expenses associated with office space, other administrative support, and supplies provided to the ICCO and Assistant ICCO.
The fund invests in the MFS Institutional Money Market Portfolio which is managed by MFS and seeks a high level of current income consistent with preservation of capital and liquidity. Income earned on this investment is included in dividends from underlying affiliated funds on the Statement of Operations. This money market fund does not pay a management fee to MFS.
Purchases and sales of investments, other than U.S. Government securities, purchased option transactions, and short-term obligations, aggregated $223,900,246 and $73,392,324, respectively.
33
Notes to Financial Statements – continued
| (5) | | Shares of Beneficial Interest |
The fund’s Declaration of Trust permits the Trustees to issue an unlimited number of full and fractional shares of beneficial interest. Transactions in fund shares were as follows:
| | | | | | | | |
| | | Period ended
2/29/12 (c) | |
| | | Shares | | | Amount | |
| Shares sold | | | | | | | | |
Class A | | | 242,990 | | | | $2,247,490 | |
Class B | | | 19,798 | | | | 194,551 | |
Class C | | | 25,318 | | | | 245,371 | |
Class I | | | 17,071,139 | | | | 167,710,202 | |
Class R1 | | | 10,000 | | | | 100,000 | |
Class R2 | | | 10,154 | | | | 101,250 | |
Class R3 | | | 10,000 | | | | 100,000 | |
Class R4 | | | 10,000 | | | | 100,000 | |
| | | 17,399,399 | | | | $170,798,864 | |
Shares issued to shareholders in
reinvestment of distributions | | | | | | | | |
Class A | | | 525 | | | | $4,586 | |
Class B | | | 19 | | | | 164 | |
Class C | | | 39 | | | | 344 | |
Class I | | | 94,820 | | | | 829,674 | |
Class R1 | | | 16 | | | | 140 | |
Class R2 | | | 28 | | | | 241 | |
Class R3 | | | 42 | | | | 370 | |
Class R4 | | | 58 | | | | 505 | |
| | | 95,547 | | | | $836,024 | |
| Shares reacquired | | | | | | | | |
Class A | | | (61,159 | ) | | | $(615,710 | ) |
Class B | | | (292 | ) | | | (2,440 | ) |
Class C | | | (7,585 | ) | | | (71,813 | ) |
Class I | | | (1,249,424 | ) | | | (11,681,644 | ) |
| | | (1,318,460 | ) | | | $(12,371,607 | ) |
| Net change | | | | | | | | |
Class A | | | 182,356 | | | | $1,636,366 | |
Class B | | | 19,525 | | | | 192,275 | |
Class C | | | 17,772 | | | | 173,902 | |
Class I | | | 15,916,535 | | | | 156,858,232 | |
Class R1 | | | 10,016 | | | | 100,140 | |
Class R2 | | | 10,182 | | | | 101,491 | |
Class R3 | | | 10,042 | | | | 100,370 | |
Class R4 | | | 10,058 | | | | 100,505 | |
| | | 16,176,486 | | | | $159,263,281 | |
| (c) | For the period from the commencement of the fund’s investment operations, May 26, 2011, through the stated period end. |
34
Notes to Financial Statements – continued
The fund is one of several mutual funds in which the MFS funds-of-funds may invest. The MFS funds-of-funds do not invest in the underlying MFS funds for the purpose of exercising management or control. At the end of the period, the MFS Growth Allocation Fund, MFS Moderate Allocation Fund, MFS Aggressive Growth Allocation Fund, MFS Conservative Allocation Fund, MFS Lifetime 2030 Fund, MFS Lifetime 2040, and MFS Lifetime 2020 were the owners of record of approximately 36%, 30%, 17%, 10%, 2%, 1%, and 1%, respectively, of the value of outstanding voting shares of the fund. In addition, the MFS Lifetime Retirement Income Fund, MFS Lifetime 2010 Fund, and MFS Lifetime 2050 Fund were each the owners of record of less than 1% of the value of outstanding voting shares of the fund.
The fund is permitted to have bank borrowings for temporary or emergency purposes to fund shareholder redemptions. The fund has established borrowing arrangements with certain banks. The interest rate on the borrowings is equal to the Federal Reserve funds rate plus an agreed upon spread. The fund had no significant borrowings during the period.
| (7) | | Transactions in Underlying Affiliated Funds-Affiliated Issuers |
An affiliated issuer may be considered one in which the fund owns 5% or more of the outstanding voting securities, or a company which is under common control. For the purposes of this report, the fund assumes the following to be affiliated issuers:
| | | | | | | | | | | | | | | | |
| Underlying Affiliated Funds | | Beginning
Shares/Par
Amount | | | Acquisitions
Shares/Par
Amount | | | Dispositions
Shares/Par
Amount | | | Ending
Shares/Par
Amount | |
MFS Institutional Money
Market Portfolio | | | — | | | | 72,480,083 | | | | (65,762,814 | ) | | | 6,717,269 | |
| | | | |
| Underlying Affiliated Funds | | Realized
Gain (Loss) | | | Capital Gain
Distributions | | | Dividend
Income | | | Ending
Value | |
MFS Institutional Money
Market Portfolio | | | $— | | | | $— | | | | $2,321 | | | | $6,717,269 | |
35
REPORT OF INDEPENDENT REGISTERED PUBLIC ACCOUNTING FIRM
To the Trustees and Shareholders of MFS New Discovery Value Fund:
We have audited the accompanying statement of assets and liabilities of MFS New Discovery Value Fund (the Fund), including the portfolio of investments, as of February 29, 2012, and the related statement of operations, statement of changes in net assets, and the financial highlights for the period from May 26, 2011 (commencement of operations) through February 29, 2012. These financial statements and financial highlights are the responsibility of the Fund’s management. Our responsibility is to express an opinion on these financial statements and financial highlights based on our audit.
We conducted our audit in accordance with the standards of the Public Company Accounting Oversight Board (United States). Those standards require that we plan and perform the audit to obtain reasonable assurance about whether the financial statements and financial highlights are free of material misstatement. We were not engaged to perform an audit of the Fund’s internal control over financial reporting. Our audit included consideration of internal control over financial reporting as a basis for designing audit procedures that are appropriate in the circumstances, but not for the purpose of expressing an opinion on the effectiveness of the Fund’s internal control over financial reporting. Accordingly, we express no such opinion. An audit also includes examining, on a test basis, evidence supporting the amounts and disclosures in the financial statements and financial highlights, assessing the accounting principles used and significant estimates made by management, and evaluating the overall financial statement presentation. Our procedures included confirmation of securities owned as of February 29, 2012, by correspondence with the Fund’s custodian and brokers or by other appropriate auditing procedures when replies from brokers were not received. We believe that our audit provides a reasonable basis for our opinion.
In our opinion, the financial statements and financial highlights referred to above present fairly, in all material respects, the financial position of MFS New Discovery Value Fund at February 29, 2012, the results of its operations, changes in its net assets, and its financial highlights from May 26, 2011 (commencement of operations) through February 29, 2012 in conformity with U.S. generally accepted accounting principles.

Boston, Massachusetts
April 13, 2012
36
TRUSTEES AND OFFICERS — IDENTIFICATION AND BACKGROUND
The Trustees and officers of the Trust, as of April 1, 2012, are listed below, together with their principal occupations during the past five years. (Their titles may have varied during that period.) The address of each Trustee and officer is 500 Boylston Street, Boston, Massachusetts 02116.
| | | | | | | | |
Name, Age | | Position(s) Held with Fund | | Trustee/Officer
Since (h) | | Principal Occupations
During the Past Five Years | | Other Directorships (j) |
| INTERESTED TRUSTEES |
Robert J. Manning (k)
(age 48) | | Trustee | | February 2004 | | Massachusetts Financial Services Company, Chairman, Chief Executive Officer and Director; President (until December 2009); Chief Investment Officer (until July 2010) | | N/A |
| INDEPENDENT TRUSTEES |
David H. Gunning
(age 69) | | Trustee and Chair of Trustees | | January 2004 | | Retired; Cleveland-Cliffs Inc. (mining products and service provider), Vice Chairman/Director (until May 2007) | | Lincoln Electric Holdings, Inc. (welding equipment manufacturer), Director; Development Alternatives, Inc. (consulting), Director/Non-Executive Chairman; Portman Limited (mining), Director (until 2008) |
Robert E. Butler
(age 70) | | Trustee | | January 2006 | | Consultant – investment company industry regulatory and compliance matters | | N/A |
Maureen R. Goldfarb
(age 56) | | Trustee | | January 2009 | | Private investor | | N/A |
37
Trustees and Officers – continued
| | | | | | | | |
Name, Age | | Position(s) Held with Fund | | Trustee/Officer
Since (h) | | Principal Occupations
During the Past Five Years | | Other Directorships (j) |
William R. Gutow
(age 70) | | Trustee | | December 1993 | | Private investor and real estate consultant; Capitol Entertainment Management Company (video franchise), Vice Chairman | | Atlantic Coast Tan (tanning salons), Vice Chairman (until 2007); Texas Donuts (donut franchise), Vice Chairman (until 2010) |
Michael Hegarty
(age 67) | | Trustee | | December 2004 | | Private investor | | N/A |
John P. Kavanaugh
(age 57) | | Trustee | | January 2009 | | Private investor; The Hanover Insurance Group, Inc., Vice President and Chief Investment Officer (until 2006); Allmerica Investment Trust, Allmerica Securities Trust and Opus Investment Trust (investment companies), Chairman, President and Trustee (until 2006) | | N/A |
J. Dale Sherratt
(age 73) | | Trustee | | June 1989 | | Insight Resources, Inc. (acquisition planning specialists), President; Wellfleet Investments (investor in health care companies), Managing General Partner | | N/A |
Laurie J. Thomsen
(age 54) | | Trustee | | March 2005 | | Private investor; New Profit, Inc. (venture philanthropy), Executive Partner (until 2010) | | The Travelers Companies (insurance), Director |
Robert W. Uek
(age 70) | | Trustee | | January 2006 | | Consultant to investment company industry | | N/A |
38
Trustees and Officers – continued
| | | | | | | | |
Name, Age | | Position(s) Held with Fund | | Trustee/Officer
Since (h) | | Principal Occupations
During the Past Five Years | | Other Directorships (j) |
| OFFICERS |
John M. Corcoran (k)
(age 46) | | President | | October 2008 | | Massachusetts Financial Services Company, Senior Vice President (since October 2008); State Street Bank and Trust (financial services provider), Senior Vice President, (until September 2008) | | N/A |
Christopher R.
Bohane (k)
(age 38) | | Assistant Secretary and Assistant Clerk | | July 2005 | | Massachusetts Financial Services Company, Vice President and Senior Counsel | | N/A |
Kino Clark (k)
(age 43) | | Assistant Treasurer | | January 2012 | | Massachusetts Financial Services Company, Vice President | | N/A |
Ethan D. Corey (k)
(age 48) | | Assistant
Secretary and Assistant Clerk | | July 2005 | | Massachusetts Financial Services Company, Senior Vice President and Associate General Counsel | | N/A |
David L. DiLorenzo (k)
(age 43) | | Treasurer | | July 2005 | | Massachusetts Financial Services Company,
Senior Vice President | | N/A |
39
Trustees and Officers – continued
| | | | | | | | |
Name, Age | | Position(s) Held with Fund | | Trustee/Officer
Since (h) | | Principal Occupations
During the Past Five Years | | Other Directorships (j) |
Robyn L. Griffin
(age 36) | | Assistant Independent Chief Compliance Officer | | August 2008 | | Griffin Compliance LLC (provider of compliance services), Principal (since August 2008); State Street Corporation (financial services provider), Mutual Fund Administration Assistant Vice President (October 2006 – July 2008); Liberty Mutual Group (insurance), Personal Market Assistant Controller (April 2006 – October 2006); Deloitte & Touche LLP (professional services firm). | | N/A |
Brian E.
Langenfeld (k)
(age 39) | | Assistant Secretary and Assistant Clerk | | June 2006 | | Massachusetts Financial Services Company, Vice President and Senior Counsel | | N/A |
Ellen Moynihan (k)
(age 54) | | Assistant Treasurer | | April 1997 | | Massachusetts Financial Services Company, Senior Vice President | | N/A |
Susan S. Newton (k)
(age 62) | | Assistant Secretary and Assistant Clerk | | May 2005 | | Massachusetts Financial Services Company, Senior Vice President and Associate General Counsel | | N/A |
Susan A. Pereira (k)
(age 41) | | Assistant Secretary and Assistant Clerk | | July 2005 | | Massachusetts Financial Services Company, Vice President and Senior Counsel | | N/A |
Mark N. Polebaum (k)
(age 59) | | Secretary and Clerk | | January 2006 | | Massachusetts Financial Services Company, Executive Vice President, General Counsel and Secretary | | N/A |
40
Trustees and Officers – continued
| | | | | | | | |
Name, Age | | Position(s) Held with Fund | | Trustee/Officer
Since (h) | | Principal Occupations
During the Past Five Years | | Other Directorships (j) |
Frank L. Tarantino
(age 68) | | Independent Chief Compliance Officer | | June 2004 | | Tarantino LLC (provider of compliance services), Principal | | N/A |
Richard S. Weitzel (k)
(age 41) | | Assistant Secretary and Assistant Clerk | | October 2007 | | Massachusetts Financial Services Company, Senior Vice President and Associate General Counsel | | N/A |
James O. Yost (k)
(age 51) | | Deputy Treasurer | | September 1990 | | Massachusetts Financial Services Company, Senior Vice President | | N/A |
| (h) | Date first appointed to serve as Trustee/officer of an MFS fund. Each Trustee has served continuously since appointment unless indicated otherwise. For the period from December 15, 2004 until February 22, 2005, Mr. Manning served as Advisory Trustee. For the period October 2008, until January 2012, Mr. Corcoran served as Treasurer of the Funds. Prior to January 2012, Messrs. DiLorenzo and Yost served as Assistant Treasurers of the Funds. |
| (j) | Directorships or trusteeships of companies required to report to the Securities and Exchange Commission (i.e., “public companies”). |
| (k) | “Interested person” of the Trust within the meaning of the Investment Company Act of 1940 (referred to as the 1940 Act), which is the principal federal law governing investment companies like the fund, as a result of position with MFS. The address of MFS is 500 Boylston Street, Boston, Massachusetts 02116. |
Each Trustee has been elected by shareholders and each Trustee and officer holds office until his or her successor is chosen and qualified or until his or her earlier death, resignation, retirement or removal. The Trust does not hold annual meetings for the purpose of electing Trustees, and Trustees are not elected for fixed terms. Messrs. Butler, Kavanaugh, Uek and Ms. Thomsen are members of the Trust’s Audit Committee.
Each of the Fund’s Trustees and officers holds comparable positions with certain other funds of which MFS or a subsidiary is the investment adviser or distributor, and, in the case of the officers, with certain affiliates of MFS. As of January 1, 2012, the Trustees served as board members of 131 funds within the MFS Family of Funds.
41
Trustees and Officers – continued
The Statement of Additional Information for the Fund includes further information about the Trustees and is available without charge upon request by calling 1-800-225-2606.
| | |
| Investment Adviser | | Custodian |
Massachusetts Financial Services Company
500 Boylston Street, Boston, MA 02116-3741 | | State Street Bank and Trust 1 Lincoln Street, Boston, MA 02111-2900 |
| Distributor | | Independent Registered Public Accounting Firm |
MFS Fund Distributors, Inc.
500 Boylston Street, Boston, MA 02116-3741 | | Ernst & Young LLP 200 Clarendon Street, Boston, MA 02116 |
| Portfolio Manager | | |
Kevin Schmitz | | |
42
BOARD REVIEW OF INVESTMENT ADVISORY AGREEMENT
A discussion regarding the Board’s approval of the fund’s Investment Advisory Agreement with MFS is available by clicking on the fund’s name under “Mutual Funds” in the “Products and Performance” section of the MFS Web site (mfs.com).
PROXY VOTING POLICIES AND INFORMATION
A general description of the MFS funds’ proxy voting policies and procedures is available without charge, upon request, by calling
1-800-225-2606, by visiting the Proxy Voting section of mfs.com or by visiting the SEC’s Web site at http://www.sec.gov.
Information regarding how the fund voted proxies relating to portfolio securities during the most recent twelve-month period ended June 30 is available without charge by visiting the Proxy Voting section of mfs.com or by visiting the SEC’s Web site at http://www.sec.gov.
QUARTERLY PORTFOLIO DISCLOSURE
The fund will file a complete schedule of portfolio holdings with the Securities and Exchange Commission (the Commission) for the first and third quarters of each fiscal year on Form N-Q. A shareholder can obtain the quarterly portfolio holdings report at mfs.com. The fund’s Form N-Q is also available on the EDGAR database on the Commission’s Internet Web site at http://www.sec.gov, and may be reviewed and copied at the:
Public Reference Room
Securities and Exchange Commission
100 F Street, NE, Room 1580
Washington, D.C. 20549
Information on the operation of the Public Reference Room may be obtained by calling the Commission at 1-800-SEC-0330. Copies of the fund’s Form N-Q also may be obtained, upon payment of a duplicating fee, by electronic request at the following e-mail address: publicinfo@sec.gov or by writing the Public Reference Section at the above address.
FURTHER INFORMATION
From time to time, MFS may post important information about the fund or the MFS funds on the MFS web site (mfs.com). This information is available by visiting the “News & Commentary” section of mfs.com or by clicking on the fund’s name under “Mutual Funds” in the “Products and Performance” section of mfs.com.
43
FEDERAL TAX INFORMATION (unaudited)
The fund will notify shareholders of amounts for use in preparing 2012 income tax forms in January 2013. The following information is provided pursuant to provisions of the Internal Revenue Code.
The fund designates the maximum amount allowable as qualified dividend income eligible for the 15% tax rate.
The fund designates $72,596 as capital gain dividends paid during the fiscal year.
For corporate shareholders, 25.95% of the ordinary income dividends paid during the fiscal year qualify for the corporate dividends received deduction.
44
rev. 3/11
| | | | |
| FACTS | | WHAT DOES MFS DO WITH YOUR PERSONAL INFORMATION? | |  |
| | |
| Why? | | Financial companies choose how they share your personal information. Federal law gives consumers the right to limit some but not all sharing. Federal law also requires us to tell you how we collect, share, and protect your personal information. Please read this notice carefully to understand what we do. |
| | |
| What? | | The types of personal information we collect and share depend on the product or service you have with us. This information can include: • Social Security number and account balances • Account transactions and transaction history • Checking account information and wire transfer instructions When you are no longer our customer, we continue to share your information as described in this notice. |
| | |
| How? | | All financial companies need to share customers’ personal information to run their everyday business. In the section below, we list the reasons financial companies can share their customers’ personal information; the reasons MFS chooses to share; and whether you can limit this sharing. |
| | | | |
| Reasons we can share your personal information | | Does MFS share? | | Can you limit
this sharing? |
For our everyday business purposes – such as to process your transactions, maintain your account(s), respond to court orders and legal investigations, or report to credit bureaus | | Yes | | No |
For our marketing purposes – to offer our products and services to you | | No | | We don’t share |
| For joint marketing with other financial companies | | No | | We don’t share |
For our affiliates’ everyday business purposes – information about your transactions and experiences | | No | | We don’t share |
For our affiliates’ everyday business purposes – information about your creditworthiness | | No | | We don’t share |
| For nonaffiliates to market to you | | No | | We don’t share |
| | |
| Questions? | | Call 800-225-2606 or go to mfs.com. |
45
| | |
| Who we are |
| Who is providing this notice? | | MFS Funds, MFS Investment Management, MFS Institutional Advisors, Inc., MFS Fund Distributors, Inc., MFS Heritage Trust Company, and MFS Service Center, Inc. |
| | |
| What we do |
| How does MFS protect my personal information? | | To protect your personal information from unauthorized access and use, we use security measures that comply with federal law. These measures include procedural, electronic, and physical safeguards for the protection of the personal information we collect about you. |
How does MFS
collect my personal information? | | We collect your personal information, for example, when you • open an account or provide account information • direct us to buy securities or direct us to sell your securities • make a wire transfer We also collect your personal information from others, such as credit bureaus, affiliates and other companies. |
| Why can’t I limit all sharing? | | Federal law gives you the right to limit only • sharing for affiliates’ everyday business purposes – information about your creditworthiness • affiliates from using your information to market to you • sharing for nonaffiliates to market to you State laws and individual companies may give you additional rights to limit sharing. |
| | |
| Definitions |
| Affiliates | | Companies related by common ownership or control. They can be financial and nonfinancial companies. • MFS does not share personal information with affiliates, except for everyday business purposes as described on page one of this notice. |
| Nonaffiliates | | Companies not related by common ownership or control. They can be financial and nonfinancial companies. • MFS does not share with nonaffiliates so they can market to you. |
| Joint Marketing | | A formal agreement between nonaffiliated financial companies that together market financial products or services to you. • MFS doesn’t jointly market. |
| | |
| Other important information |
| If you own an MFS product or receive an MFS service in the name of a third party such as a bank or broker-dealer, their privacy policy may apply to you instead of ours. |
46
Save paper with eDelivery.
MFS® will send you prospectuses, reports, and proxies directly via e-mail so you will get information faster with less mailbox clutter.
To sign up:
1. Go to mfs.com.
2. Log in via MFS® Access.
3. Select eDelivery.
If you own your MFS fund shares through a financial institution or a retirement plan, MFS® TALK, MFS® Access, or eDelivery may not be available to you.

Web site
mfs.com
MFS TALK
1-800-637-8255
24 hours a day
Account service and literature
Shareholders
1-800-225-2606
Financial advisors
1-800-343-2829
Retirement plan services
1-800-637-1255
Mailing address
MFS Service Center, Inc.
P.O. Box 55824
Boston, MA 02205-5824
Overnight mail
MFS Service Center, Inc.
c/o Boston Financial Data Services
30 Dan Road
Canton, MA 02021-2809
The Registrant has adopted a Code of Ethics pursuant to Section 406 of the Sarbanes-Oxley Act and as defined in Form N-CSR that applies to the Registrant’s principal executive officer and principal financial and accounting officer. During the period covered by this report, the Registrant has not amended any provision in its Code of Ethics (the “Code”) that relates to an element of the Code’s definitions enumerated in paragraph (b) of Item 2 of this Form N-CSR. During the period covered by this report, the Registrant did not grant a waiver, including an implicit waiver, from any provision of the Code.
A copy of the Code of Ethics is filed as an exhibit to this Form N-CSR.
| ITEM 3. | AUDIT COMMITTEE FINANCIAL EXPERT. |
Messrs. Robert E. Butler, John P. Kavanaugh and Robert W. Uek and Ms. Laurie J. Thomsen, members of the Audit Committee, have been determined by the Board of Trustees in their reasonable business judgment to meet the definition of “audit committee financial expert” as such term is defined in Form N-CSR. In addition, Messrs. Butler, Kavanaugh and Uek and Ms. Thomsen are “independent” members of the Audit Committee (as such term has been defined by the Securities and Exchange Commission in regulations implementing Section 407 of the Sarbanes-Oxley Act of 2002). The Securities and Exchange Commission has stated that the designation of a person as an audit committee financial expert pursuant to this Item 3 on the Form N-CSR does not impose on such a person any duties, obligations or liability that are greater than the duties, obligations or liability imposed on such person as a member of the Audit Committee and the Board of Trustees in the absence of such designation or identification.
| ITEM 4. | PRINCIPAL ACCOUNTANT FEES AND SERVICES. |
Items 4(a) through 4(d) and 4(g):
The Board of Trustees has appointed Deloitte & Touche LLP (“Deloitte”) to serve as independent accountants to certain series of the Registrant and Ernst & Young LLP (“E&Y”) to serve in the same capacity to certain other series of the Registrant (the series referred to collectively as the “Funds” and singularly as a “Fund”). The tables below set forth the audit fees billed to the Funds as well as fees for non-audit services provided to the Funds and/or to the Funds’ investment adviser, Massachusetts Financial Services Company (“MFS”), and to various entities either controlling, controlled by, or under common control with MFS that provide ongoing services to the Funds (“MFS Related Entities”).
For the fiscal years ended February 29, 2012, and February 28, 2011, respectively, audit fees billed to the Funds by Deloitte and E&Y were as follows:
| | | | | | | | |
| | | Audit Fees | |
| | | 2012 | | | 2011 | |
Fees billed by Deloitte: | | | | | | | | |
MFS Government Securities Fund | | | 46,097 | | | | 44,397 | |
| |
| | | Audit Fees | |
| | | 2012 | | | 2011 | |
Fees billed by E&Y: | | | | | | | | |
MFS Diversified Income Fund | | | 50,377 | | | | 48,516 | |
MFS Global Real Estate Fund | | | 42,554 | | | | 40,987 | |
MFS New Discovery Value Fund | | | 20,800 | | | | NA | ** |
Total | | | 113,731 | | | | 89,503 | |
For the fiscal years ended February 29, 2012, and February 28, 2011, respectively, fees billed by Deloitte and E&Y for audit-related, tax and other services provided to the Funds and for audit-related, tax and other services provided to MFS and MFS Related Entities were as follows:
| | | | | | | | | | | | | | | | | | | | | | | | |
| | | Audit-Related Fees1 | | | Tax Fees2 | | | All Other Fees3 | |
| | | 2012 | | | 20115 | | | 2012 | | | 2011 | | | 2012 | | | 20115 | |
Fees billed by Deloitte: | | | | | | | | | | | | | | | | | | | | | | | | |
To MFS Government Securities Fund | | | 0 | | | | 0 | | | | 6,468 | | | | 6,225 | | | | 1,331 | | | | 1,158 | |
To MFS and MFS Related Entities of MFS Government Securities Fund* | | | 1,213,300 | | | | 1,179,704 | | | | 0 | | | | 0 | | | | 0 | | | | 113,100 | |
| | | | | | | | |
| | | 2012 | | | 20115 | |
Aggregate fees for non-audit services: | | | | | | | | |
To MFS Government Securities Fund, MFS and MFS Related Entities# | | | 1,621,814 | | | | 1,700,083 | |
| | | | | | | | | | | | | | | | | | | | | | | | |
| | | Audit-Related Fees1 | | | Tax Fees2 | | | All Other Fees4 | |
| | | 2012 | | | 2011 | | | 2012 | | | 2011 | | | 2012 | | | 2011 | |
Fees billed by E&Y: | | | | | | | | | | | | | | | | | | | | | | | | |
To MFS Diversified Income Fund | | | 0 | | | | 0 | | | | 7,673 | | | | 7,314 | | | | 0 | | | | 0 | |
To MFS Global Real Estate Fund | | | 0 | | | | 0 | | | | 9,450 | | | | 9,024 | | | | 0 | | | | 0 | |
To MFS New Discovery Value Fund | | | 0 | | | | NA | ** | | | 7,200 | | | | NA | ** | | | 0 | | | | NA | ** |
Total fees billed by E&Y To above Funds | | | 0 | | | | 0 | | | | 24,323 | | | | 16,338 | | | | 0 | | | | 0 | |
To MFS and MFS Related Entities of MFS Diversified Income Fund* | | | 0 | | | | 0 | | | | 0 | | | | 0 | | | | 0 | | | | 0 | |
To MFS and MFS Related Entities of MFS Global Real Estate Fund* | | | 0 | | | | 0 | | | | 0 | | | | 0 | | | | 0 | | | | 0 | |
To MFS and MFS Related Entities of MFS New Discovery Value Fund* | | | 0 | | | | 0 | | | | 0 | | | | 0 | | | | 0 | | | | 0 | |
| | | | | | | | |
| | | 2012 | | | 20115 | |
Aggregate fees for non-audit services: | | | | | | | | |
To MFS Diversified Income Fund, MFS and MFS Related Entities# | | | 142,673 | | | | 7,314 | |
To MFS Global Real Estate Fund, MFS and MFS Related Entities# | | | 144,450 | | | | 9,024 | |
To MFS New Discovery Value Fund, MFS and MFS Related Entities# | | | 142,200 | | |
| NA
|
** |
| * | This amount reflects the fees billed to MFS and MFS Related Entities for non-audit services relating directly to the operations and financial reporting of the Funds (portions of which services also related to the operations and financial reporting of other funds within the MFS Funds complex). |
| ** | MFS New Discovery Value Fund commenced investment operations in May 2011. |
| # | This amount reflects the aggregate fees billed by Deloitte or E&Y, as the case may be, for non-audit services rendered to the Funds and for non-audit services rendered to MFS and the MFS Related Entities. |
| 1 | The fees included under “Audit-Related Fees” are fees related to assurance and related services that are reasonably related to the performance of the audit or review of financial statements, but not reported under “Audit Fees,” including accounting consultations, agreed-upon procedure reports, attestation reports, comfort letters and internal control reviews. |
| 2 | The fees included under “Tax Fees” are fees associated with tax compliance, tax advice and tax planning, including services relating to the filing or amendment of federal, state or local income tax returns, regulated investment company qualification reviews and tax distribution and analysis. |
| 3 | The fees included under “All Other Fees” are fees for products and services provided by Deloitte other than those reported under “Audit Fees,” “Audit-Related Fees” and “Tax Fees,” including fees for services related to reviews of internal controls and review of Rule 38a-1 compliance program. |
| 4 | The fees under “All Other Fees” are fees for products and services provided by E&Y other than those reported under “Audit Fees,” “Audit-Related Fees” and “Tax Fees”. |
| 5 | Certain fees reported in 2011 have been restated in this filing from those reported in the Registrant’s filing for the reporting period ended February 28, 2011. |
Item 4(e)(1):
Set forth below are the policies and procedures established by the Audit Committee of the Board of Trustees relating to the pre-approval of audit and non-audit related services:
To the extent required by applicable law, pre-approval by the Audit Committee of the Board is needed for all audit and permissible non-audit services rendered to the Funds and all permissible non-audit services rendered to MFS or MFS Related Entities if the services relate directly to the operations and financial reporting of the Registrant. Pre-approval is currently on an engagement-by-engagement basis. In the event pre-approval of such services is necessary between regular meetings of the Audit Committee and it is not practical to wait to seek pre-approval at the next regular meeting of the Audit Committee, pre-approval of such services may be referred to the Chair of the Audit Committee for approval; provided that the Chair may not pre-approve any individual engagement for such services exceeding $50,000 or multiple engagements for such services in the aggregate exceeding $100,000 in each period between regular meetings of the Audit Committee. Any engagement pre-approved by the Chair between regular meetings of the Audit Committee shall be presented for ratification by the entire Audit Committee at its next regularly scheduled meeting.
Item 4(e)(2):
None, or 0%, of the services relating to the Audit-Related Fees, Tax Fees and All Other Fees paid by the Fund and MFS and MFS Related Entities relating directly to the operations and financial reporting of the Registrant disclosed above were approved by the audit committee pursuant to paragraphs (c)(7)(i)(C) of Rule 2-01 of Regulation S-X (which permits audit committee approval after the start of the engagement with respect to services other than audit, review or attest services, if certain conditions are satisfied).
Item 4(f): Not applicable.
Item 4(h): The Registrant’s Audit Committee has considered whether the provision by a Registrant’s independent registered public accounting firm of non-audit services to MFS and MFS Related Entities that were not pre-approved by the Committee (because such services did not relate directly to the operations and financial reporting of the Registrant) was compatible with maintaining the independence of the independent registered public accounting firm as the Registrant’s principal auditors.
| ITEM 5. | AUDIT COMMITTEE OF LISTED REGISTRANTS. |
Not applicable to the Registrant.
A schedule of investments of the Registrant is included as part of the report to shareholders of such series under Item 1 of this Form N-CSR.
| ITEM 7. | DISCLOSURE OF PROXY VOTING POLICIES AND PROCEDURES FOR CLOSED-END MANAGEMENT INVESTMENT COMPANIES. |
Not applicable to the Registrant.
| ITEM 8. | PORTFOLIO MANAGERS OF CLOSED-END MANAGEMENT INVESTMENT COMPANIES. |
Not applicable to the Registrant.
| ITEM 9. | PURCHASES OF EQUITY SECURITIES BY CLOSED-END MANAGEMENT INVESTMENT COMPANY AND AFFILIATED PURCHASERS. |
Not applicable to the Registrant.
| ITEM 10. | SUBMISSION OF MATTERS TO A VOTE OF SECURITY HOLDERS. |
There were no material changes to the procedures by which shareholders may send recommendations to the Board for nominees to the Registrant’s Board since the Registrant last provided disclosure as to such procedures in response to the requirements of Item 407 (c)(2)(iv) of Regulation S-K or this Item.
| ITEM 11. | CONTROLS AND PROCEDURES. |
| (a) | Based upon their evaluation of the effectiveness of the registrant’s disclosure controls and procedures (as defined in Rule 30a-3(c) under the Investment Company Act of 1940 (the “Act”)) as conducted within 90 days of the filing date of this report on Form N-CSR, the registrant’s principal financial officer and principal executive officer have concluded that those disclosure controls and procedures provide reasonable assurance that the material information required to be disclosed by the registrant on this report is recorded, processed, summarized and reported within the time periods specified in the Securities and Exchange Commission’s rules and forms. |
| (b) | There were no changes in the registrant’s internal controls over financial reporting (as defined in Rule 30a-3(d) under the Act) that occurred during the second fiscal quarter of the period covered by the report that have materially affected, or are reasonably likely to materially affect, the registrant’s internal control over financial reporting. |
| (a) | File the exhibits listed below as part of this form. Letter or number the exhibits in the sequence indicated. |
| | (1) | Any code of ethics, or amendment thereto, that is the subject of the disclosure required by Item 2, to the extent that the registrant intends to satisfy the Item 2 requirements through filing of an exhibit: Code of Ethics attached hereto. |
| | (2) | A separate certification for each principal executive officer and principal financial officer of the registrant as required by Rule 30a-2(a) under the Act (17 CFR 270.30a-2): Attached hereto. |
| (b) | If the report is filed under Section 13(a) or 15(d) of the Exchange Act, provide the certifications required by Rule 30a-2(b) under the Act (17 CFR 270.30a-2(b)), Rule 13a-14(b) or Rule 15d-14(b) under the Exchange Act (17 CFR 240.13a-14(b) or 240.15d-14(b)) and Section 1350 of Chapter 63 of Title 18 of the United States Code (18 U.S.C. 1350) as an exhibit. A certification furnished pursuant to this paragraph will not be deemed “filed” for the purposes of Section 18 of the Exchange Act (15 U.S.C. 78r), or otherwise subject to the liability of that section. Such certification will not be deemed to be incorporated by reference into any filing under the Securities Act of 1933 or the Exchange Act, except to the extent that the registrant specifically incorporates it by reference: Attached hereto. |
Notice
A copy of the Amended and Restated Declaration of Trust, as amended, of the Registrant is on file with the Secretary of State of The Commonwealth of Massachusetts and notice is hereby given that this instrument is executed on behalf of the Registrant by an officer of the Registrant as an officer and not individually and the obligations of or arising out of this instrument are not binding upon any of the Trustees or shareholders individually, but are binding only upon the assets and property of the respective constituent series of the Registrant.
SIGNATURES
Pursuant to the requirements of the Securities Exchange Act of 1934 and the Investment Company Act of 1940, the registrant has duly caused this report to be signed on its behalf by the undersigned, thereunto duly authorized.
(Registrant) MFS SERIES TRUST XIIII
| | |
| By (Signature and Title)* | | JOHN M. CORCORAN |
| | John M. Corcoran, President |
Date: April 13, 2012
Pursuant to the requirements of the Securities Exchange Act of 1934 and the Investment Company Act of 1940, this report has been signed below by the following persons on behalf of the registrant and in the capacities and on the dates indicated.
| | |
| By (Signature and Title)* | | JOHN M. CORCORAN |
| | John M. Corcoran, President (Principal Executive Officer) |
Date: April 13, 2012
| | |
| By (Signature and Title)* | | DAVID L. DILORENZO |
| | David L. DiLorenzo, Treasurer (Principal Financial Officer and Accounting Officer) |
Date: April 13, 2012
| * | Print name and title of each signing officer under his or her signature. |