UNITED STATES
SECURITIES AND EXCHANGE COMMISSION
Washington, D.C. 20549
FORM N-CSR
CERTIFIED SHAREHOLDER REPORT OF
REGISTERED MANAGEMENT INVESTMENT COMPANIES
Investment Company Act file number 811-03327
MFS SERIES TRUST XIII
(Exact name of registrant as specified in charter)
111 Huntington Avenue, Boston, Massachusetts 02199
(Address of principal executive offices) (Zip code)
Susan S. Newton
Massachusetts Financial Services Company
111 Huntington Avenue
Boston, Massachusetts 02199
(Name and address of agents for service)
Registrant’s telephone number, including area code: (617) 954-5000
Date of fiscal year end: The last day of February.
Date of reporting period: February 28, 2014
| ITEM 1. | REPORTS TO STOCKHOLDERS. |
ANNUAL REPORT
February 28, 2014

MFS® DIVERSIFIED INCOME FUND

DIF-ANN
MFS® DIVERSIFIED INCOME FUND
CONTENTS
The report is prepared for the general information of shareholders. It is authorized for distribution to prospective investors only when preceded or accompanied by a current prospectus.
NOT FDIC INSURED Ÿ MAY LOSE VALUE Ÿ NO BANK GUARANTEE

LETTER FROM THE CHAIRMAN AND CEO
Dear Shareholders:
The U.S. economy appears to have slowed early in 2014 after a strong second half of 2013. Harsh winter weather likely contributed to at least a temporary softening of consumer demand. Looking at the longer term, the pace of U.S. economic growth has
been modest since the recovery began late in 2009. Corporate profits remain healthy overall. A major plus is the removal of a highly confrontational atmosphere in the U.S. Congress, which had clouded business decision-making since 2011.
Globally, recent months have been dominated by volatility, including emerging market currency jitters and rising geopolitical tensions. These add to the possibility of economic uncertainty and financial market unease. However, the eurozone continues to show signs of recovery, while Japan is making progress as it seeks to break free of deflation.
China’s transition toward a more consumer-oriented and less export-driven economy — one with a more stable and sustainable growth rate — could be positive in the long term. However, in the near term, any deceleration in China’s rate of growth could have a ripple effect on its many global trading partners.
In uncertain times such as these, it is particularly important to remember that managing risk should always be a top priority. At MFS®, active risk management is an integral part of our collaborative process. Our global team of investment professionals shares ideas and evaluates opportunities that span continents, investment disciplines and asset classes. Our goal is to build better insights, and ultimately better results, for our clients.
We understand and appreciate the economic challenges investors face, and we believe in the value of maintaining a long-term view and applying proven principles, such as asset allocation and diversification. We are confident that our unique approach can serve investors well as they work with their financial advisors to identify and pursue the most suitable opportunities.
Respectfully,

Robert J. Manning
Chairman and Chief Executive Officer
MFS Investment Management
April 14, 2014
The opinions expressed in this letter are subject to change, may not be relied upon for investment advice, and no forecasts can be guaranteed.
1
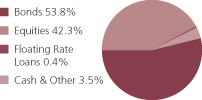
PORTFOLIO COMPOSITION
Portfolio structure (i)
| | | | |
| Top ten holdings (i) | | | | |
| Simon Property Group, Inc., REIT | | | 2.3% | |
| U.S. Treasury Notes, 2.125%, 5/31/15 | | | 1.5% | |
| U.S. Treasury Notes, 0.875%, 12/31/16 | | | 1.4% | |
| Public Storage, Inc., REIT | | | 1.4% | |
| Vornado Realty Trust, REIT | | | 1.3% | |
| Exxon Mobil Corp. | | | 1.3% | |
| AvalonBay Communities, Inc., REIT | | | 1.1% | |
| U.S. Treasury Notes, 3.125%, 5/15/21 | | | 1.0% | |
| Equity Lifestyle Properties, Inc., REIT | | | 0.9% | |
| Boston Properties, Inc., REIT | | | 0.9% | |
| |
| Equity sectors (i) | | | | |
| Financial Services | | | 24.8% | |
| Health Care | | | 3.5% | |
| Energy | | | 3.1% | |
| Utilities & Communications | | | 2.8% | |
| Technology | | | 2.3% | |
| Industrial Goods & Services | | | 1.4% | |
| Leisure | | | 0.9% | |
| Retailing | | | 0.9% | |
| Autos & Housing | | | 0.8% | |
| Consumer Staples | | | 0.8% | |
| Basic Materials | | | 0.8% | |
| Transportation | | | 0.2% | |
| | | | |
| Fixed income sectors (i) | | | | |
| High Yield Corporates | | | 22.7% | |
| Emerging Markets Bonds | | | 14.6% | |
| Mortgage-Backed Securities | | | 7.4% | |
| U.S. Treasury Securities | | | 6.0% | |
| Non-U.S. Government Bonds | | | 1.1% | |
| U.S. Government Agencies | | | 0.9% | |
| High Grade Corporates | | | 0.8% | |
| Floating Rate Loans | | | 0.4% | |
| Commercial Mortgage-Backed Securities | | | 0.3% | |
| Municipal Bonds (o) | | | 0.0% | |
| Collateralized Debt Obligations (o) | | | 0.0% | |
|
Composition including fixed income
credit quality (a)(i) | |
| AAA (o) | | | 0.0% | |
| AA | | | 0.3% | |
| A | | | 1.3% | |
| BBB | | | 8.9% | |
| BB | | | 13.2% | |
| B | | | 12.2% | |
| CCC | | | 3.7% | |
| C (o) | | | 0.0% | |
| U.S. Government | | | 6.2% | |
| Federal Agencies | | | 8.3% | |
| Not Rated | | | 0.1% | |
| Non-Fixed Income | | | 42.3% | |
| Cash & Other | | | 3.5% | |
2
Portfolio Composition – continued
| (a) | For all securities other than those specifically described below, ratings are assigned to underlying securities utilizing ratings from Moody’s, Fitch, and Standard & Poor’s rating agencies and applying the following hierarchy: If all three agencies provide a rating, the middle rating (after dropping the highest and lowest ratings) is assigned; if two of the three agencies rate a security, the lower of the two is assigned. Ratings are shown in the S&P and Fitch scale (e.g., AAA). Securities rated BBB or higher are considered investment grade. All ratings are subject to change. U.S. Government includes securities issued by the U.S. Department of the Treasury. Federal Agencies includes rated and unrated U.S. Agency fixed-income securities, U.S. Agency mortgage-backed securities, and collateralized mortgage obligations of U.S. Agency mortgage-backed securities. Not Rated includes fixed income securities, including fixed income futures contracts, which have not been rated by any rating agency. Non-Fixed Income includes equity securities (including convertible bonds and equity derivatives) and commodities. The fund may not hold all of these instruments. The fund is not rated by these agencies. |
| (i) | For purposes of this presentation, the components include the market value of securities, and reflect the impact of the equivalent exposure of derivative positions, if any. These amounts may be negative from time to time. Equivalent exposure is a calculated amount that translates the derivative position into a reasonable approximation of the amount of the underlying asset that the portfolio would have to hold at a given point in time to have the same price sensitivity that results from the portfolio’s ownership of the derivative contract. When dealing with derivatives, equivalent exposure is a more representative measure of the potential impact of a position on portfolio performance than market value. The bond component will include any accrued interest amounts. |
Where the fund holds convertible bonds, these are treated as part of the equity portion of the portfolio.
The fund invests a portion of its assets in the MFS High Yield Pooled Portfolio. Percentages reflect exposure to the underlying holdings of the MFS High Yield Pooled Portfolio and not to the exposure from investing directly in the MFS High Yield Pooled Portfolio itself.
Cash & Other includes cash, other assets less liabilities, offsets to derivative positions, and short-term securities.
Percentages are based on net assets as of 2/28/14.
The portfolio is actively managed and current holdings may be different.
3
MANAGEMENT REVIEW
Summary of Results
The MFS Diversified Income Fund includes investments in high yield corporate bonds, U.S. government securities, emerging markets debt, real estate investment trusts (“REITs”), and domestic equity securities.
For the twelve months ended February 28, 2014, Class A shares of the MFS Diversified Income Fund (“fund”) provided a total return of 7.87%, at net asset value. This compares with a return of 25.37% for the fund’s benchmark, the Standard & Poor’s 500 Stock Index. The fund’s other benchmark, the MFS Diversified Income Fund Blended Index (“Blended Index”), generated a return of 7.54%. The Blended Index reflects the blended returns of various equity and fixed income market indices, with percentage allocations to each index designed to resemble the allocations of the fund. The market indices and related percentage allocations used to compile the Blended Index are set forth in the Performance Summary.
Market Environment
Early in the period, jitters over a banking crisis in Cyprus was more than offset by ongoing accommodative global monetary policy and improving economic data, resulting in gains in both equity and fixed income markets. As the period progressed, concerns that the US Federal Reserve (“Fed”) would begin tapering its quantitative easing (“QE”) program caused sovereign bond yields to spike, credit spreads to widen, and equity valuations to fall. Equities subsequently outperformed fixed income in response to the improved economic fundamentals.
Toward the middle of the period, the Fed’s decision to postpone QE tapering surprised markets. Favorable market reactions were tempered, however, by tense negotiations over US fiscal policy which resulted in a 16-day partial shutdown of the federal government and a short-term extension in the debt ceiling. The volatility was short-lived, however, as an extension of budget and debt ceiling deadlines allowed the government to re-open, and subsequent economic data reflected moderate but resilient US growth. Also well-received was the decision by the European Central Bank to cut its policy rate as inflation pressures waned in the region. In addition, equity investors appeared to have concluded that there would be no major change in US monetary policy as a result of the nomination of Janet Yellen as the new Fed Chair for a term beginning in early 2014.
Later in the period, emerging market stresses resurfaced with political unrest, falling currencies and slowing growth which appeared to have impacted investor sentiment. Markets were also forced to contend with some unexpected weakness in the US economy due largely to weather-related interruptions to hiring and spending plans as well as production schedules. Once again, the setback was short-lived as the major US equity indexes traded near their all-time highs by the end of the period.
Factors Affecting Performance
During the reporting period, bond selection within the U.S. Government sleeve was a primary factor that detracted from relative performance as the fund’s holdings in this asset class generated lower returns than the Barclays U.S. Government/Mortgage Bond Index, which is a component of the Blended Index. The fund’s overweight allocation to
4
Management Review – continued
emerging markets debt issues also hindered relative performance as this market segment underperformed the Blended Index during the reporting period.
Strong security selection and an overweight allocation within the fund’s equity sleeve was a primary contributor to relative performance. In addition, positive security selection within the fund’s REIT sleeve also boosted relative returns as this asset class outperformed the Blended Index during the period.
Respectfully,
| | | | | | |
| William Adams | | Ward Brown | | David Cole | | Richard Gable |
| Portfolio Manager | | Portfolio Manager | | Portfolio Manager | | Portfolio Manager |
| | | | | | |
| Matthew Ryan | | Jonathon Sage | | Geoffrey Schechter | | James Swanson |
| Portfolio Manager | | Portfolio Manager | | Portfolio Manager | | Portfolio Manager |
Note to Shareholders: Effective April 30, 2013, Ward Brown is also a Portfolio Manager of the Fund.
The views expressed in this report are those of the portfolio managers only through the end of the period of the report as stated on the cover and do not necessarily reflect the views of MFS or any other person in the MFS organization. These views are subject to change at any time based on market or other conditions, and MFS disclaims any responsibility to update such views. These views may not be relied upon as investment advice or an indication of trading intent on behalf of any MFS portfolio. References to specific securities are not recommendations of such securities, and may not be representative of any MFS portfolio’s current or future investments.
5
PERFORMANCE SUMMARY THROUGH 2/28/14
The following chart illustrates a representative class of the fund’s historical performance in comparison to its benchmark(s). Performance results include the deduction of the maximum applicable sales charge and reflect the percentage change in net asset value, including reinvestment of dividends and capital gains distributions. The performance of other share classes will be greater than or less than that of the class depicted below. Benchmarks are unmanaged and may not be invested in directly. Benchmark returns do not reflect sales charges, commissions or expenses. (See Notes to Performance Summary.)
Performance data shown represents past performance and is no guarantee of future results. Investment return and principal value fluctuate so your shares, when sold, may be worth more or less than the original cost; current performance may be lower or higher than quoted. The performance shown does not reflect the deduction of taxes, if any, that a shareholder would pay on fund distributions or the redemption of fund shares.
Growth of a Hypothetical $10,000 Investment (t)
6
Performance Summary – continued
Total Returns through 2/28/14
Average annual without sales charge
| | | | | | | | | | | | |
| | | Share class | | Class inception date | | 1-yr | | 5-yr | | Life (t) | | |
| | | A | | 5/26/06 | | 7.87% | | 16.91% | | 7.37% | | |
| | | C | | 5/26/06 | | 6.97% | | 16.03% | | 6.58% | | |
| | | I | | 5/26/06 | | 8.14% | | 17.20% | | 7.66% | | |
| | | R1 | | 7/01/08 | | 7.06% | | 16.07% | | 7.75% | | |
| | | R2 | | 7/01/08 | | 7.51% | | 16.64% | | 8.29% | | |
| | | R3 | | 7/01/08 | | 7.77% | | 16.91% | | 8.55% | | |
| | | R4 | | 7/01/08 | | 8.13% | | 17.20% | | 8.82% | | |
| | | R5 | | 7/02/12 | | 8.23% | | N/A | | 10.09% | | |
Comparative benchmarks | | | | | | | | |
| | | Standard & Poor’s 500 Stock Index (f) | | 25.37% | | 23.00% | | 7.28% | | |
| | | MFS Diversified Income Blended Index (f)(w) | | 7.54% | | 17.88% | | 7.62% | | |
| | | Barclays U.S. Government/Mortgage Bond Index (f) | | (0.20)% | | 3.54% | | 5.07% | | |
| | | Barclays U.S. High-Yield Corporate Bond 2% Issuer
Capped Index (f) | | 8.36% | | 18.72% | | 9.30% | | |
| | | JPMorgan Emerging Markets Bond Index Global (f) | | (3.02)% | | 12.08% | | 8.18% | | |
| | | MSCI U.S. REIT Index (f) | | 6.75% | | 29.59% | | 5.75% | | |
| | | Russell 1000 Value Index (f) | | 23.44% | | 23.18% | | 6.11% | | |
Average annual with sales charge | | | | | | | | |
| | | A
With Initial Sales Charge (4.75%) | | 2.74% | | 15.78% | | 6.70% | | |
| | | C
With CDSC (1% for 12 months) (v) | | 5.97% | | 16.03% | | 6.58% | | |
Class I, R1, R2, R3, R4, and R5 shares do not have a sales charge.
CDSC – Contingent Deferred Sales Charge.
| (f) | Source: FactSet Research Systems Inc. |
| (t) | For the period from the class inception date through the stated period end. The comparative benchmark performance information provided for the “life” period is from the inception date of the Class A shares. (See Notes to Performance Summary.) |
| (v) | Assuming redemption at the end of the applicable period. |
| (w) | MFS Diversified Income Blended Index is at a point in time and allocations during the period can change. As of February 28, 2014, the blended index was comprised of 25% Barclays U.S. High-Yield Corporate Bond 2% Issuer Capped Index, 20% Barclays U.S. Government/Mortgage Bond Index, 20% Russell 1000 Value Index, 20% MSCI U.S. REIT Index, and 15% JPMorgan Emerging Markets Bond Index Global. |
7
Performance Summary – continued
Benchmark Definitions
Barclays U.S. Government/Mortgage Bond Index – measures debt issued by the U.S. Government, and its agencies, as well as mortgage-backed pass-through securities of Ginnie Mae (GNMA), Fannie Mae (FNMA), and Freddie Mac (FHLMC).
Barclays U.S. High-Yield Corporate Bond 2% Issuer Capped Index – a component of the Barclays U.S. High-Yield Corporate Bond Index, which measures performance of non-investment grade, fixed rate debt. The index limits the maximum exposure to any one issuer to 2%.
JPMorgan Emerging Markets Bond Index Global – measures the performance of U.S.-dollar-denominated debt instruments issued by emerging market sovereign and quasi-sovereign entities: Brady bonds, loans, Eurobonds.
MSCI U.S. REIT Index – a market capitalization-weighted index that is designed to measure equity market performance for real estate investment trusts (REITs) that generate a majority of their revenue and income from real estate rental and leasing operations.
Russell 1000 Value Index – constructed to provide a comprehensive barometer for the value securities in the large-cap segment of the U.S. equity universe. Companies in this index generally have lower price-to-book ratios and lower forecasted growth values.
Standard & Poor’s 500 Stock Index – a market capitalization-weighted index of 500 widely held equity securities, designed to measure broad U.S. equity performance.
It is not possible to invest directly in an index.
Notes to Performance Summary
Average annual total return represents the average annual change in value for each share class for the periods presented. Life returns are presented where the share class has less than 10 years of performance history and represent the average annual total return from the class inception date to the stated period end date. As the fund’s share classes may have different inception dates, the life returns may represent different time periods and may not be comparable.
Performance results reflect any applicable expense subsidies and waivers in effect during the periods shown. Without such subsidies and waivers the fund’s performance results would be less favorable. Please see the prospectus and financial statements for complete details.
Performance results do not include adjustments made for financial reporting purposes in accordance with U.S. generally accepted accounting principles and may differ from amounts reported in the financial highlights.
From time to time the fund may receive proceeds from litigation settlements, without which performance would be lower.
8
EXPENSE TABLE
Fund expenses borne by the shareholders during the period, September 1, 2013 through February 28, 2014
As a shareholder of the fund, you incur two types of costs: (1) transaction costs, including sales charges (loads) on certain purchase or redemption payments, and (2) ongoing costs, including management fees; distribution and service (12b-1) fees; and other fund expenses. This example is intended to help you understand your ongoing costs (in dollars) of investing in the fund and to compare these costs with the ongoing costs of investing in other mutual funds.
In addition to the fees and expenses which the fund bears directly, the fund indirectly bears a pro rata share of the fees and expenses of the underlying MFS Pooled Portfolio in which the fund invests. MFS Pooled Portfolios are mutual funds advised by MFS that do not pay management fees to MFS but do incur investment and operating costs. If these transactional and indirect costs were included, your costs would have been higher.
The example is based on an investment of $1,000 invested at the beginning of the period and held for the entire period September 1, 2013 through February 28, 2014.
Actual Expenses
The first line for each share class in the following table provides information about actual account values and actual expenses. You may use the information in this line, together with the amount you invested, to estimate the expenses that you paid over the period. Simply divide your account value by $1,000 (for example, an $8,600 account value divided by $1,000 = 8.6), then multiply the result by the number in the first line under the heading entitled “Expenses Paid During Period” to estimate the expenses you paid on your account during this period.
Hypothetical Example for Comparison Purposes
The second line for each share class in the following table provides information about hypothetical account values and hypothetical expenses based on the fund’s actual expense ratio and an assumed rate of return of 5% per year before expenses, which is not the fund’s actual return. The hypothetical account values and expenses may not be used to estimate the actual ending account balance or expenses you paid for the period. You may use this information to compare the ongoing costs of investing in the fund and other funds. To do so, compare this 5% hypothetical example with the 5% hypothetical examples that appear in the shareholder reports of the other funds.
Please note that the expenses shown in the table are meant to highlight your ongoing costs only and do not reflect any transactional costs, such as sales charges (loads). Therefore, the second line for each share class in the table is useful in comparing ongoing costs only, and will not help you determine the relative total costs of owning different funds. In addition, if these transactional costs were included, your costs would have been higher.
9
Expense Table – continued
| | | | | | | | | | | | | | | | | | |
Share Class | | | | Annualized Expense Ratio | | | Beginning Account Value 9/01/13 | | | Ending Account Value 2/28/14 | | | Expenses
Paid During
Period (p)
9/01/13-2/28/14 | |
| A | | Actual | | | 1.08% | | | | $1,000.00 | | | | $1,082.71 | | | | $5.58 | |
| | Hypothetical (h) | | | 1.08% | | | | $1,000.00 | | | | $1,019.44 | | | | $5.41 | |
| C | | Actual | | | 1.83% | | | | $1,000.00 | | | | $1,077.80 | | | | $9.43 | |
| | Hypothetical (h) | | | 1.83% | | | | $1,000.00 | | | | $1,015.72 | | | | $9.15 | |
| I | | Actual | | | 0.83% | | | | $1,000.00 | | | | $1,084.06 | | | | $4.29 | |
| | Hypothetical (h) | | | 0.83% | | | | $1,000.00 | | | | $1,020.68 | | | | $4.16 | |
| R1 | | Actual | | | 1.83% | | | | $1,000.00 | | | | $1,078.75 | | | | $9.43 | |
| | Hypothetical (h) | | | 1.83% | | | | $1,000.00 | | | | $1,015.72 | | | | $9.15 | |
| R2 | | Actual | | | 1.33% | | | | $1,000.00 | | | | $1,080.48 | | | | $6.86 | |
| | Hypothetical (h) | | | 1.33% | | | | $1,000.00 | | | | $1,018.20 | | | | $6.66 | |
| R3 | | Actual | | | 1.08% | | | | $1,000.00 | | | | $1,082.72 | | | | $5.58 | |
| | Hypothetical (h) | | | 1.08% | | | | $1,000.00 | | | | $1,019.44 | | | | $5.41 | |
| R4 | | Actual | | | 0.83% | | | | $1,000.00 | | | | $1,083.11 | | | | $4.29 | |
| | Hypothetical (h) | | | 0.83% | | | | $1,000.00 | | | | $1,020.68 | | | | $4.16 | |
| R5 | | Actual | | | 0.71% | | | | $1,000.00 | | | | $1,084.66 | | | | $3.67 | |
| | Hypothetical (h) | | | 0.71% | | | | $1,000.00 | | | | $1,021.27 | | | | $3.56 | |
| (h) | 5% class return per year before expenses. |
| (p) | Expenses Paid During Period are equal to each class’s annualized expense ratio, as shown above, multiplied by the average account value over the period, multiplied by 181/365 (to reflect the one-half year period). Expenses paid do not include any applicable sales charges (loads). If these transaction costs had been included, your costs would have been higher. In addition to the fees and expenses which the fund bears directly, the fund indirectly bears a pro rata share of the fees and expenses of the underlying funds in which the fund invests. If these indirect costs were included, your costs would have been higher. |
10
PORTFOLIO OF INVESTMENTS
2/28/14
The Portfolio of Investments is a complete list of all securities owned by your fund. It is categorized by broad-based asset classes.
| | | | | | | | |
| Bonds - 30.1% | | | | | | | | |
| Issuer | | Shares/Par | | | Value ($) | |
| | | | | | | | |
| Agency - Other - 0.2% | | | | | | | | |
| Financing Corp., 9.4%, 2/08/18 | | $ | 965,000 | | | $ | 1,254,749 | |
| Financing Corp., 10.35%, 8/03/18 | | | 715,000 | | | | 980,384 | |
| Financing Corp., STRIPS, 0%, 11/30/17 | | | 860,000 | | | | 814,709 | |
| | | | | | | | |
| | | | | | | $ | 3,049,842 | |
| Asset-Backed & Securitized - 0.3% | | | | | | | | |
| Citigroup Commercial Mortgage Trust, FRN, 5.706%, 12/10/49 | | $ | 198,555 | | | $ | 24,323 | |
Citigroup/Deutsche Bank Commercial Mortgage Trust,
5.322%, 12/11/49 | | | 100,000 | | | | 110,379 | |
Commercial Mortgage Pass-Through Certificates, “A4”,
5.306%, 12/10/46 | | | 199,556 | | | | 217,443 | |
Credit Suisse Commercial Mortgage Trust, “A4”, FRN,
5.757%, 9/15/39 | | | 918,488 | | | | 1,011,397 | |
| CWCapital Cobalt Ltd., “A4”, FRN, 5.77%, 5/15/46 | | | 1,311,070 | | | | 1,458,388 | |
| G-Force LLC, CDO, “A2”, 4.83%, 8/22/36 (z) | | | 7,542 | | | | 7,707 | |
| Goldman Sachs Mortgage Securities Corp., FRN, 5.819%, 8/10/45 | | | 1,407,626 | | | | 1,553,822 | |
| JPMorgan Chase Commercial Mortgage Securities Corp., “A3”, FRN, 5.939%, 2/15/51 | | | 56,549 | | | | 56,959 | |
| JPMorgan Chase Commercial Mortgage Securities Corp., “A4”, FRN, 5.813%, 6/15/49 | | | 1,437,604 | | | | 1,603,284 | |
| | | | | | | | |
| | | | | | | $ | 6,043,702 | |
| Broadcasting - 0.3% | | | | | | | | |
| Globo Comunicacoes e Participacoes S.A., 6.25% to 2015, 9.375% to 7/29/49 (n) | | $ | 1,499,000 | | | $ | 1,572,076 | |
| Myriad International Holdings B.V., 6%, 7/18/20 (n) | | | 3,692,000 | | | | 3,978,130 | |
| | | | | | | | |
| | | | | | | $ | 5,550,206 | |
| Building - 0.4% | | | | | | | | |
| Cementos Pacasmayo S.A.A., 4.5%, 2/08/23 | | $ | 1,214,000 | | | $ | 1,118,397 | |
| CEMEX Espana S.A., 9.25%, 5/12/20 | | | 1,545,000 | | | | 1,690,230 | |
| CEMEX Finance LLC, 9.375%, 10/12/22 | | | 1,060,000 | | | | 1,214,760 | |
| CEMEX S.A.B. de C.V., 6.5%, 12/10/19 (n) | | | 1,293,000 | | | | 1,360,882 | |
| CEMEX S.A.B. de C.V., 7.25%, 1/15/21 (n) | | | 1,164,000 | | | | 1,248,390 | |
| Odebrecht Finance Ltd., 7.125%, 6/26/42 (n) | | | 1,706,000 | | | | 1,663,350 | |
| | | | | | | | |
| | | | | | | $ | 8,296,009 | |
| Business Services - 0.1% | | | | | | | | |
| Tencent Holdings Ltd., 3.375%, 3/05/18 (n) | | $ | 1,326,000 | | | $ | 1,362,684 | |
11
Portfolio of Investments – continued
| | | | | | | | |
| Issuer | | Shares/Par | | | Value ($) | |
| | | | | | | | |
| Bonds - continued | | | | | | | | |
| Cable TV - 0.0% | | | | | | | | |
| VTR Finance B.V., 6.875%, 1/15/24 (n) | | $ | 600,000 | | | $ | 614,375 | |
| | |
| Chemicals - 0.1% | | | | | | | | |
| Sociedad Quimica y Minera de Chile S.A., 5.5%, 4/21/20 (n) | | $ | 1,594,000 | | | $ | 1,691,446 | |
| | |
| Conglomerates - 0.1% | | | | | | | | |
| Metalloinvest Finance Ltd., 5.625%, 4/17/20 (n) | | $ | 1,764,000 | | | $ | 1,706,670 | |
| | |
| Construction - 0.1% | | | | | | | | |
| Empresas ICA S.A.B. de C.V., 8.375%, 7/24/17 (n) | | $ | 1,409,000 | | | $ | 1,442,464 | |
| | |
| Emerging Market Quasi-Sovereign - 4.3% | | | | | | | | |
Abu Dhabi National Energy Co. PJSC (TAQA),
5.875%, 12/13/21 (n) | | $ | 955,000 | | | $ | 1,103,025 | |
Banco de Reservas de la Republica Dominicana,
7%, 2/01/23 (n) | | | 1,705,000 | | | | 1,587,355 | |
| Banco do Brasil S.A., FRN, 6.25%, 10/29/49 (n) | | | 3,705,000 | | | | 2,968,631 | |
| Banco do Estado Rio Grande do Sul S.A., 7.375%, 2/02/22 (n) | | | 2,497,000 | | | | 2,515,727 | |
| Banco do Nordeste do Brasil S.A., 4.375%, 5/03/19 (n) | | | 2,097,000 | | | | 2,036,711 | |
| Biz Finance PLC, 8.375%, 4/27/15 | | | 1,153,000 | | | | 951,225 | |
| Brazil Minas SPE, 5.333%, 2/15/28 (n) | | | 536,000 | | | | 514,024 | |
| CNOOC Finance (2012) Ltd., 3.875%, 5/02/22 (n) | | | 1,123,000 | | | | 1,101,393 | |
| CNOOC Finance (2013) Ltd., 3%, 5/09/23 | | | 2,512,000 | | | | 2,275,317 | |
| CNPC (HK) Overseas Capital Ltd., 4.5%, 4/28/21 (n) | | | 540,000 | | | | 560,697 | |
| CNPC General Capital Ltd., 3.4%, 4/16/23 (n) | | | 3,618,000 | | | | 3,358,929 | |
| Comision Federal de Electricidad, 4.875%, 1/15/24 (n) | | | 372,000 | | | | 376,650 | |
| Comision Federal de Electricidad, 5.75%, 2/14/42 (n) | | | 1,575,000 | | | | 1,508,062 | |
| Corporacion Financiera de Desarrollo S.A., 4.75%, 2/08/22 (n) | | | 2,106,000 | | | | 2,098,102 | |
| Development Bank of Kazakhstan, 4.125%, 12/10/22 | | | 4,494,000 | | | | 4,019,883 | |
| Dolphin Energy Ltd., 5.5%, 12/15/21 (n) | | | 1,418,000 | | | | 1,592,414 | |
| Ecopetrol S.A., 7.625%, 7/23/19 | | | 1,852,000 | | | | 2,222,400 | |
| Ecopetrol S.A., 7.375%, 9/18/43 | | | 818,000 | | | | 922,295 | |
Empresa de Transporte de Pasajeros Metro S.A.,
4.75%, 2/04/24 (n) | | | 345,000 | | | | 353,766 | |
| Gaz Capital S.A., 3.85%, 2/06/20 (n) | | | 996,000 | | | | 966,120 | |
| Gaz Capital S.A., 5.999%, 1/23/21 (n) | | | 2,212,000 | | | | 2,319,835 | |
| Gaz Capital S.A., 4.95%, 2/06/28 (n) | | | 3,446,000 | | | | 3,023,865 | |
| Gazprom Neft, 4.375%, 9/19/22 (n) | | | 554,000 | | | | 506,218 | |
| Gazprom Neft, 6%, 11/27/23 (n) | | | 844,000 | | | | 849,275 | |
| Instituto Costarricense, 6.375%, 5/15/43 (n) | | | 1,007,000 | | | | 848,398 | |
| JSC Georgian Railway, 7.75%, 7/11/22 (n) | | | 1,203,000 | | | | 1,290,218 | |
| KazAgro National Management Holding, 4.625%, 5/24/23 (n) | | | 5,564,000 | | | | 5,049,330 | |
| Kazakhstan Temir Zholy Co., 6.95%, 7/10/42 (n) | | | 2,711,000 | | | | 2,724,555 | |
| KazMunayGas National Co., 4.4%, 4/30/23 (n) | | | 5,329,000 | | | | 5,009,260 | |
12
Portfolio of Investments – continued
| | | | | | | | |
| Issuer | | Shares/Par | | | Value ($) | |
| | | | | | | | |
| Bonds - continued | | | | | | | | |
| Emerging Market Quasi-Sovereign - continued | | | | | | | | |
| Magyar Export-Import Bank, 5.5%, 2/12/18 (n) | | $ | 1,290,000 | | | $ | 1,338,375 | |
| Majapahit Holding B.V., 7.875%, 6/29/37 | | | 2,000,000 | | | | 2,180,000 | |
| OJSC Russian Agricultural Bank, 5.1%, 7/25/18 (n) | | | 566,000 | | | | 572,368 | |
| Pemex Project Funding Master Trust, 6.625%, 6/15/35 | | | 1,446,000 | | | | 1,583,745 | |
| Pertamina PT, 4.875%, 5/03/22 (n) | | | 2,381,000 | | | | 2,304,808 | |
| Pertamina PT, 4.3%, 5/20/23 (n) | | | 2,705,000 | | | | 2,475,075 | |
| Petroleos Mexicanos, 5.5%, 1/21/21 | | | 2,395,000 | | | | 2,610,550 | |
| Petroleos Mexicanos, 4.875%, 1/18/24 (z) | | | 694,000 | | | | 713,401 | |
| Petroleos Mexicanos, 4.875%, 1/18/24 | | | 584,000 | | | | 600,326 | |
| Petroleos Mexicanos, FRN, 2.257%, 7/18/18 | | | 611,000 | | | | 633,913 | |
| Petroleum Co. of Trinidad & Tobago Ltd., 6%, 5/08/22 | | | 792,625 | | | | 840,182 | |
| Rosneft, 4.199%, 3/06/22 (n) | | | 1,997,000 | | | | 1,822,263 | |
| Sberbank of Russia, 6.125%, 2/07/22 (n) | | | 3,590,000 | | | | 3,796,425 | |
| Sberbank of Russia, 5.5% to 2/26/2014, FRN to 2/26/24 (z) | | | 3,000,000 | | | | 2,958,750 | |
| Sinopec Capital (2013) Ltd., 3.125%, 4/24/23 (n) | | | 3,060,000 | | | | 2,768,960 | |
| Sinopec Capital (2013) Ltd., 4.25%, 4/24/43 (n) | | | 2,765,000 | | | | 2,381,605 | |
| State Grid Overseas Investment (2013) Ltd., 3.125%, 5/22/23 (n) | | | 1,852,000 | | | | 1,733,503 | |
| Turkiye Ihracat Kredi Bankasi A.S., 5.875%, 4/24/19 (n) | | | 2,725,000 | | | | 2,790,400 | |
| Vnesheconombank, 5.942%, 11/21/23 (n) | | | 620,000 | | | | 611,475 | |
| | | | | | | | |
| | | | | | | $ | 89,369,804 | |
| Emerging Market Sovereign - 4.2% | | | | | | | | |
| Dominican Republic, 7.5%, 5/06/21 (n) | | $ | 1,270,000 | | | $ | 1,403,350 | |
| Dominican Republic, 6.6%, 1/28/24 (n) | | | 447,000 | | | | 455,046 | |
| Dominican Republic, 5.875%, 4/18/24 (n) | | | 1,706,000 | | | | 1,661,218 | |
| Dominican Republic, 8.625%, 4/20/27 | | | 2,335,000 | | | | 2,577,256 | |
| Gabonese Republic, 6.375%, 12/12/24 (n) | | | 641,000 | | | | 657,025 | |
| Oriental Republic of Uruguay, 4.5%, 8/14/24 | | | 976,000 | | | | 993,568 | |
| Republic of Colombia, 6.125%, 1/18/41 | | | 562,000 | | | | 613,985 | |
| Republic of Colombia, 5.625%, 2/26/44 | | | 552,000 | | | | 563,868 | |
| Republic of Croatia, 5.5%, 4/04/23 (n) | | | 3,210,000 | | | | 3,242,100 | |
| Republic of Croatia, 6%, 1/26/24 (n) | | | 2,652,000 | | | | 2,735,538 | |
| Republic of Guatemala, 5.75%, 6/06/22 (n) | | | 1,764,000 | | | | 1,852,200 | |
| Republic of Guatemala, 4.875%, 2/13/28 (n) | | | 2,255,000 | | | | 2,099,405 | |
| Republic of Hungary, 6.25%, 1/29/20 | | | 2,470,000 | | | | 2,704,650 | |
| Republic of Hungary, 6.375%, 3/29/21 | | | 2,502,000 | | | | 2,739,690 | |
| Republic of Hungary, 5.375%, 2/21/23 | | | 2,930,000 | | | | 2,978,345 | |
| Republic of Hungary, 5.75%, 11/22/23 | | | 810,000 | | | | 833,288 | |
| Republic of Indonesia, 6.875%, 1/17/18 | | | 1,100,000 | | | | 1,254,000 | |
| Republic of Indonesia, 4.875%, 5/05/21 (n) | | | 2,623,000 | | | | 2,708,248 | |
| Republic of Indonesia, 5.375%, 10/17/23 (n) | | | 3,600,000 | | | | 3,744,000 | |
| Republic of Indonesia, 5.875%, 1/15/24 (n) | | | 527,000 | | | | 566,525 | |
| Republic of Indonesia, 6.75%, 1/15/44 (n) | | | 1,060,000 | | | | 1,144,800 | |
| Republic of Latvia, 5.25%, 2/22/17 (n) | | | 1,133,000 | | | | 1,241,768 | |
13
Portfolio of Investments – continued
| | | | | | | | |
| Issuer | | Shares/Par | | | Value ($) | |
| | | | | | | | |
| Bonds - continued | | | | | | | | |
| Emerging Market Sovereign - continued | | | | | | | | |
| Republic of Lithuania, 6.625%, 2/01/22 (n) | | $ | 1,794,000 | | | $ | 2,130,375 | |
| Republic of Paraguay, 4.625%, 1/25/23 (n) | | | 2,559,000 | | | | 2,528,292 | |
| Republic of Peru, 7.35%, 7/21/25 | | | 787,000 | | | | 1,003,425 | |
| Republic of Philippines, 5.5%, 3/30/26 | | | 1,293,000 | | | | 1,459,474 | |
| Republic of Philippines, 6.375%, 10/23/34 | | | 1,396,000 | | | | 1,734,530 | |
| Republic of Romania, 6.75%, 2/07/22 (n) | | | 2,104,000 | | | | 2,464,310 | |
| Republic of Romania, 4.375%, 8/22/23 (n) | | | 796,000 | | | | 788,040 | |
| Republic of Romania, 4.875%, 1/22/24 (n) | | | 768,000 | | | | 784,320 | |
| Republic of Serbia, 4.875%, 2/25/20 (n) | | | 587,000 | | | | 581,864 | |
| Republic of Slovakia, 4.375%, 5/21/22 (n) | | | 4,190,000 | | | | 4,493,775 | |
| Republic of Slovenia, 5.25%, 2/18/24 (z) | | | 621,000 | | | | 634,358 | |
| Republic of South Africa, 5.875%, 9/16/25 | | | 601,000 | | | | 643,070 | |
| Republic of Turkey, 5.625%, 3/30/21 | | | 1,594,000 | | | | 1,659,354 | |
| Republic of Turkey, 6.25%, 9/26/22 | | | 2,021,000 | | | | 2,165,502 | |
| Republic of Turkey, 7.375%, 2/05/25 | | | 1,983,000 | | | | 2,244,756 | |
| Republic of Turkey, 6.625%, 2/17/45 | | | 630,000 | | | | 637,875 | |
| Republic of Uruguay, 7.625%, 3/21/36 | | | 974,000 | | | | 1,205,812 | |
| Republic of Venezuela, 9.25%, 9/15/27 | | | 1,015,000 | | | | 735,875 | |
| Republic of Venezuela, 7%, 3/31/38 | | | 2,450,000 | | | | 1,463,875 | |
| Republic of Vietnam, 6.875%, 1/15/16 | | | 497,000 | | | | 532,411 | |
| Russian Federation, 4.5%, 4/04/22 (n) | | | 1,800,000 | | | | 1,822,500 | |
| Russian Federation, 4.875%, 9/16/23 (n) | | | 2,800,000 | | | | 2,843,400 | |
| Russian Federation, 7.5%, 3/31/30 | | | 1,166,165 | | | | 1,352,751 | |
| Russian Federation, 5.625%, 4/04/42 (n) | | | 1,200,000 | | | | 1,185,000 | |
| Russian Federation, 5.875%, 9/16/43 (n) | | | 6,000,000 | | | | 6,060,000 | |
| United Mexican States, 3.625%, 3/15/22 | | | 3,416,000 | | | | 3,441,620 | |
| United Mexican States, 4%, 10/02/23 | | | 1,672,000 | | | | 1,692,900 | |
| | | | | | | | |
| | | | | | | $ | 87,059,337 | |
| Energy - Independent - 0.1% | | | | | | | | |
| Afren PLC, 11.5%, 2/01/16 (n) | | $ | 200,000 | | | $ | 227,500 | |
| Nostrum Oil & Gas Finance B.V., 6.375%, 2/14/19 (z) | | | 895,000 | | | | 902,831 | |
| | | | | | | | |
| | | | | | | $ | 1,130,331 | |
| Energy - Integrated - 0.3% | | | | | | | | |
| LUKOIL International Finance B.V., 3.416%, 4/24/18 (n) | | $ | 823,000 | | | $ | 828,144 | |
| LUKOIL International Finance B.V., 4.563%, 4/24/23 (n) | | | 1,278,000 | | | | 1,193,333 | |
| Pacific Rubiales Energy Corp., 7.25%, 12/12/21 (n) | | | 2,923,000 | | | | 3,142,225 | |
| Pacific Rubiales Energy Corp., 5.125%, 3/28/23 (n) | | | 705,000 | | | | 676,800 | |
| | | | | | | | |
| | | | | | | $ | 5,840,502 | |
| Food & Beverages - 0.7% | | | | | | | | |
| Ajecorp B.V., 6.5%, 5/14/22 | | $ | 2,000,000 | | | $ | 1,960,000 | |
| Ajecorp B.V., 6.5%, 5/14/22 (n) | | | 1,956,000 | | | | 1,916,880 | |
14
Portfolio of Investments – continued
| | | | | | | | |
| Issuer | | Shares/Par | | | Value ($) | |
| | | | | | | | |
| Bonds - continued | | | | | | | | |
| Food & Beverages - continued | | | | | | | | |
| Corporacion Lindley S.A., 6.75%, 11/23/21 | | $ | 1,331,000 | | | $ | 1,424,170 | |
| Corporacion Lindley S.A., 6.75%, 11/23/21 (n) | | | 630,000 | | | | 674,100 | |
| Corporacion Lindley S.A., 4.625%, 4/12/23 (n) | | | 2,059,000 | | | | 1,938,034 | |
| Cosan Luxembourg S.A., 5%, 3/14/23 (n) | | | 2,579,000 | | | | 2,355,917 | |
| Embotelladora Andina S.A., 5%, 10/01/23 (n) | | | 868,000 | | | | 889,197 | |
| Grupo Bimbo S.A.B. de C.V., 4.5%, 1/25/22 (n) | | | 1,185,000 | | | | 1,200,659 | |
| JBS Investments GmbH, 7.75%, 10/28/20 (n) | | | 1,211,000 | | | | 1,253,385 | |
| | | | | | | | |
| | | | | | | $ | 13,612,342 | |
| Forest & Paper Products - 0.0% | | | | | | | | |
| Fibria Overseas Finance Ltd., 7.5%, 5/04/20 | | $ | 698,000 | | | $ | 767,800 | |
| | |
| Furniture & Appliances - 0.1% | | | | | | | | |
| Arcelik A.S., 5%, 4/03/23 (n) | | $ | 1,698,000 | | | $ | 1,489,995 | |
| | |
| International Market Quasi-Sovereign - 0.6% | | | | | | | | |
| Israel Electric Corp. Ltd., 5.625%, 6/21/18 (n) | | $ | 6,440,000 | | | $ | 6,839,280 | |
| Israel Electric Corp. Ltd., 6.875%, 6/21/23 (n) | | | 5,888,000 | | | | 6,382,651 | |
| | | | | | | | |
| | | | | | | $ | 13,221,931 | |
| International Market Sovereign - 0.4% | | | | | | | | |
| Republic of Iceland, 4.875%, 6/16/16 (n) | | $ | 1,933,000 | | | $ | 2,036,899 | |
| Republic of Iceland, 5.875%, 5/11/22 (n) | | | 4,811,000 | | | | 5,141,756 | |
| | | | | | | | |
| | | | | | | $ | 7,178,655 | |
| Internet - 0.2% | | | | | | | | |
| Baidu, Inc., 3.25%, 8/06/18 | | $ | 4,956,000 | | | $ | 5,064,269 | |
| | |
| Local Authorities - 0.1% | | | | | | | | |
Nashville & Davidson County, TN, Metropolitan Government Convention Center Authority (Build America Bonds),
6.731%, 7/01/43 | | $ | 1,115,000 | | | $ | 1,327,753 | |
| San Francisco, CA, City & County Public Utilities Commission, Water Rev. (Build America Bonds), 6%, 11/01/40 | | | 15,000 | | | | 17,891 | |
University of California Rev. (Build America Bonds),
5.77%, 5/15/43 | | | 60,000 | | | | 70,547 | |
| | | | | | | | |
| | | | | | | $ | 1,416,191 | |
| Machinery & Tools - 0.1% | | | | | | | | |
| Ferreycorp S.A.A., 4.875%, 4/26/20 (n) | | $ | 2,681,000 | | | $ | 2,510,086 | |
| | |
| Major Banks - 0.1% | | | | | | | | |
| DBS Bank Ltd., 3.625% to 2017, FRN to 9/21/22 (n) | | $ | 1,801,000 | | | $ | 1,863,441 | |
15
Portfolio of Investments – continued
| | | | | | | | |
| Issuer | | Shares/Par | | | Value ($) | |
| | | | | | | | |
| Bonds - continued | | | | | | | | |
| Metals & Mining - 0.1% | | | | | | | | |
| Minsur S.A., 6.25%, 2/07/24 (z) | | $ | 1,045,000 | | | $ | 1,076,350 | |
| Vale Overseas Ltd., 5.625%, 9/15/19 | | | 1,134,000 | | | | 1,261,878 | |
| | | | | | | | |
| | | | | | | $ | 2,338,228 | |
| Mortgage-Backed - 7.3% | | | | | | | | |
| Fannie Mae, 2.62%, 5/01/23 | | $ | 296,177 | | | $ | 288,754 | |
| Fannie Mae, 4.487%, 4/01/14 | | | 42,227 | | | | 42,135 | |
| Fannie Mae, 5.1%, 9/01/14 - 3/01/19 | | | 324,231 | | | | 339,102 | |
| Fannie Mae, 4.86%, 1/01/15 | | | 143,766 | | | | 146,182 | |
| Fannie Mae, 4.962%, 1/01/15 | | | 74,489 | | | | 74,424 | |
| Fannie Mae, 4.85%, 2/01/15 | | | 166,016 | | | | 169,382 | |
| Fannie Mae, 5.5%, 2/01/15 - 4/01/40 | | | 8,987,480 | | | | 9,932,780 | |
| Fannie Mae, 4.56%, 3/01/15 | | | 67,995 | | | | 70,151 | |
| Fannie Mae, 4.908%, 4/01/15 | | | 188,081 | | | | 193,190 | |
| Fannie Mae, 4.815%, 6/01/15 | | | 104,010 | | | | 107,232 | |
| Fannie Mae, 4.6%, 8/01/15 - 9/01/19 | | | 152,471 | | | | 167,340 | |
| Fannie Mae, 4.7%, 8/01/15 | | | 78,984 | | | | 82,268 | |
| Fannie Mae, 4.78%, 8/01/15 | | | 76,204 | | | | 79,044 | |
| Fannie Mae, 4.81%, 8/01/15 | | | 171,934 | | | | 178,370 | |
| Fannie Mae, 4.856%, 8/01/15 | | | 60,097 | | | | 62,301 | |
| Fannie Mae, 4.997%, 8/01/15 | | | 120,026 | | | | 125,192 | |
| Fannie Mae, 5.275%, 11/01/15 | | | 118,755 | | | | 123,031 | |
| Fannie Mae, 5.463%, 11/01/15 | | | 443,658 | | | | 468,128 | |
| Fannie Mae, 5.09%, 2/01/16 | | | 61,513 | | | | 65,699 | |
| Fannie Mae, 5.131%, 2/01/16 | | | 226,954 | | | | 241,250 | |
| Fannie Mae, 5.432%, 2/01/16 | | | 102,225 | | | | 109,693 | |
| Fannie Mae, 5.273%, 4/01/16 | | | 302,751 | | | | 324,728 | |
| Fannie Mae, 5.845%, 6/01/16 | | | 24,194 | | | | 25,412 | |
| Fannie Mae, 5.724%, 7/01/16 | | | 206,905 | | | | 226,805 | |
| Fannie Mae, 5.93%, 9/01/16 | | | 106,306 | | | | 114,754 | |
| Fannie Mae, 5.395%, 12/01/16 | | | 101,808 | | | | 112,092 | |
| Fannie Mae, 5.45%, 12/01/16 | | | 110,000 | | | | 121,945 | |
| Fannie Mae, 5.05%, 1/01/17 - 8/01/19 | | | 117,911 | | | | 127,797 | |
| Fannie Mae, 6.5%, 2/01/17 - 10/01/37 | | | 282,311 | | | | 317,050 | |
| Fannie Mae, 1.114%, 2/25/17 | | | 1,200,000 | | | | 1,198,774 | |
| Fannie Mae, 5.508%, 4/01/17 | | | 61,361 | | | | 66,883 | |
| Fannie Mae, 1.9%, 6/01/17 | | | 193,540 | | | | 196,696 | |
| Fannie Mae, 5.478%, 6/01/17 | | | 193,138 | | | | 217,569 | |
| Fannie Mae, 2.71%, 11/01/17 | | | 55,526 | | | | 58,127 | |
| Fannie Mae, 3.308%, 12/01/17 | | | 475,927 | | | | 506,360 | |
| Fannie Mae, 6%, 12/01/17 - 6/01/38 | | | 1,315,684 | | | | 1,460,990 | |
| Fannie Mae, 5.223%, 1/01/18 | | | 166,124 | | | | 178,453 | |
| Fannie Mae, 3.8%, 2/01/18 | | | 88,164 | | | | 94,321 | |
16
Portfolio of Investments – continued
| | | | | | | | |
| Issuer | | Shares/Par | | | Value ($) | |
| | | | | | | | |
| Bonds - continued | | | | | | | | |
| Mortgage-Backed - continued | | | | | | | | |
| Fannie Mae, 3.91%, 2/01/18 | | $ | 115,152 | | | $ | 124,584 | |
| Fannie Mae, 4%, 3/01/18 - 2/01/41 | | | 3,936,676 | | | | 4,135,105 | |
| Fannie Mae, 4.19%, 3/01/18 | | | 106,014 | | | | 115,762 | |
| Fannie Mae, 3.99%, 4/01/18 | | | 150,000 | | | | 163,191 | |
| Fannie Mae, 5.341%, 6/01/18 | | | 367,417 | | | | 416,119 | |
| Fannie Mae, 3.849%, 7/01/18 | | | 290,002 | | | | 314,375 | |
| Fannie Mae, 5%, 9/01/18 - 3/01/44 | | | 9,445,106 | | | | 10,341,401 | |
| Fannie Mae, 2.578%, 9/25/18 | | | 1,415,000 | | | | 1,470,322 | |
| Fannie Mae, 5.51%, 3/01/19 | | | 113,063 | | | | 124,704 | |
| Fannie Mae, 5.08%, 4/01/19 | | | 23,404 | | | | 25,634 | |
| Fannie Mae, 4.5%, 6/01/19 - 4/01/41 | | | 2,022,666 | | | | 2,170,843 | |
| Fannie Mae, 4.83%, 8/01/19 - 9/01/19 | | | 70,568 | | | | 78,852 | |
| Fannie Mae, 4.864%, 8/01/19 | | | 107,591 | | | | 120,653 | |
| Fannie Mae, 4.67%, 9/01/19 | | | 28,000 | | | | 31,123 | |
| Fannie Mae, 4.45%, 10/01/19 | | | 88,852 | | | | 97,996 | |
| Fannie Mae, 4.14%, 8/01/20 | | | 41,906 | | | | 45,608 | |
| Fannie Mae, 3.87%, 9/01/20 | | | 69,191 | | | | 74,458 | |
| Fannie Mae, 5.19%, 9/01/20 | | | 104,343 | | | | 114,276 | |
| Fannie Mae, 2.41%, 5/01/23 | | | 248,919 | | | | 238,790 | |
| Fannie Mae, 2.55%, 5/01/23 | | | 215,254 | | | | 208,761 | |
| Fannie Mae, 4.5%, 5/01/25 | | | 56,087 | | | | 60,746 | |
| Fannie Mae, 3%, 3/01/27 - 4/01/27 | | | 1,272,828 | | | | 1,319,379 | |
| Fannie Mae, 3.5%, 1/01/42 - 6/01/43 | | | 4,993,862 | | | | 5,068,707 | |
| Fannie Mae, 3.5%, 4/01/43 | | | 1,301,109 | | | | 1,320,681 | |
| Fannie Mae, TBA, 3%, 3/01/29 | | | 5,400,000 | | | | 5,589,843 | |
| Fannie Mae, TBA, 4%, 3/01/44 | | | 10,400,000 | | | | 10,900,500 | |
| Fannie Mae, TBA, 4.5%, 5/01/44 | | | 9,879,000 | | | | 10,547,376 | |
| Freddie Mac, 3.034%, 10/25/20 | | | 505,000 | | | | 523,934 | |
| Freddie Mac, 1.655%, 11/25/16 | | | 1,277,929 | | | | 1,299,430 | |
| Freddie Mac, 6%, 8/01/17 - 10/01/38 | | | 1,882,598 | | | | 2,107,860 | |
| Freddie Mac, 1.426%, 8/25/17 | | | 1,656,000 | | | | 1,668,885 | |
| Freddie Mac, 5%, 10/01/17 - 6/01/40 | | | 888,282 | | | | 958,113 | |
| Freddie Mac, 3.882%, 11/25/17 | | | 555,000 | | | | 599,910 | |
| Freddie Mac, 3.154%, 2/25/18 | | | 514,000 | | | | 544,511 | |
| Freddie Mac, 2.699%, 5/25/18 | | | 1,300,000 | | | | 1,354,639 | |
| Freddie Mac, 2.412%, 8/25/18 | | | 2,578,000 | | | | 2,655,072 | |
| Freddie Mac, 2.303%, 9/25/18 | | | 1,515,000 | | | | 1,550,234 | |
| Freddie Mac, 2.323%, 10/25/18 | | | 1,765,000 | | | | 1,804,993 | |
| Freddie Mac, 2.13%, 1/25/19 | | | 1,750,000 | | | | 1,768,158 | |
| Freddie Mac, 2.086%, 3/25/19 | | | 1,175,000 | | | | 1,182,695 | |
| Freddie Mac, 5.085%, 3/25/19 | | | 1,410,000 | | | | 1,605,310 | |
| Freddie Mac, 1.883%, 5/25/19 | | | 1,000,000 | | | | 995,203 | |
| Freddie Mac, 4.186%, 8/25/19 | | | 1,346,000 | | | | 1,482,054 | |
17
Portfolio of Investments – continued
| | | | | | | | |
| Issuer | | Shares/Par | | | Value ($) | |
| | | | | | | | |
| Bonds - continued | | | | | | | | |
| Mortgage-Backed - continued | | | | | | | | |
| Freddie Mac, 4.251%, 1/25/20 | | $ | 230,000 | | | $ | 253,812 | |
| Freddie Mac, 4.224%, 3/25/20 | | | 99,963 | | | | 110,344 | |
| Freddie Mac, 2.757%, 5/25/20 | | | 219,095 | | | | 228,621 | |
| Freddie Mac, 3.32%, 7/25/20 - 2/25/23 | | | 874,450 | | | | 898,672 | |
| Freddie Mac, 2.682%, 10/25/22 | | | 345,000 | | | | 336,527 | |
| Freddie Mac, 3.25%, 4/25/23 | | | 1,700,000 | | | | 1,720,905 | |
| Freddie Mac, 3.3%, 4/25/23 | | | 1,045,940 | | | | 1,064,513 | |
| Freddie Mac, 3.06%, 7/25/23 | | | 330,000 | | | | 327,599 | |
| Freddie Mac, 3.458%, 8/25/23 | | | 675,000 | | | | 690,991 | |
| Freddie Mac, 4.5%, 9/01/24 - 6/01/41 | | | 2,376,932 | | | | 2,550,934 | |
| Freddie Mac, 5.5%, 10/01/24 - 6/01/41 | | | 2,658,238 | | | | 2,945,189 | |
| Freddie Mac, 4%, 7/01/25 - 11/01/43 | | | 1,477,341 | | | | 1,549,790 | |
| Freddie Mac, 2.5%, 5/01/28 - 7/01/28 | | | 8,857,019 | | | | 8,922,019 | |
| Freddie Mac, 6.5%, 5/01/37 - 2/01/38 | | | 84,821 | | | | 95,191 | |
| Freddie Mac, 3.5%, 12/01/41 - 7/01/43 | | | 6,903,566 | | | | 6,991,882 | |
| Freddie Mac, 3%, 4/01/43 - 5/01/43 | | | 5,066,614 | | | | 4,923,473 | |
| Ginnie Mae, 4.5%, 7/20/33 - 9/20/41 | | | 4,674,030 | | | | 5,102,432 | |
| Ginnie Mae, 5.5%, 8/15/33 - 1/20/42 | | | 632,338 | | | | 702,838 | |
| Ginnie Mae, 4%, 10/15/39 - 4/20/41 | | | 703,587 | | | | 747,398 | |
| Ginnie Mae, 3.5%, 12/15/41 - 6/20/43 | | | 7,361,997 | | | | 7,594,560 | |
| Ginnie Mae, 3%, 7/20/43 | | | 1,941,833 | | | | 1,928,757 | |
| Ginnie Mae, 5.612%, 4/20/58 | | | 150,327 | | | | 156,716 | |
| Ginnie Mae, 6.357%, 4/20/58 | | | 110,899 | | | | 116,849 | |
| Ginnie Mae, TBA, 4%, 3/01/44 | | | 7,000,000 | | | | 7,423,282 | |
| | | | | | | | |
| | | | | | | $ | 153,118,488 | |
| Network & Telecom - 0.1% | | | | | | | | |
Empresa Nacional de Telecomunicaciones S.A.,
4.875%, 10/30/24 (n) | | $ | 1,557,000 | | | $ | 1,552,413 | |
| Telefonica Celular del Paraguay S.A., 6.75%, 12/13/22 (n) | | | 1,333,000 | | | | 1,389,653 | |
| | | | | | | | |
| | | | | | | $ | 2,942,066 | |
| Oil Services - 0.3% | | | | | | | | |
| Odebrecht Offshore Drilling Finance Ltd., 6.75%, 10/01/22 (n) | | $ | 4,528,175 | | | $ | 4,658,360 | |
| QGOG Constellation S.A., 6.25%, 11/09/19 (n) | | | 2,447,000 | | | | 2,330,768 | |
| | | | | | | | |
| | | | | | | $ | 6,989,128 | |
| Other Banks & Diversified Financials - 0.7% | | | | | | | | |
| Alfa Bank, 7.5%, 9/26/19 (n) | | $ | 1,274,000 | | | $ | 1,337,700 | |
| Banco de Credito del Peru, 6.125% to 2022, FRN to 4/24/27 (n) | | | 2,760,000 | | | | 2,794,500 | |
| Banco GNB Sudameris S.A., 3.875%, 5/02/18 (n) | | | 1,797,000 | | | | 1,716,135 | |
| Banco Santander S.A., 4.125%, 11/09/22 (n) | | | 1,607,000 | | | | 1,574,860 | |
| Banco Santander S.A., FRN, 5.95%, 1/30/24 (n) | | | 388,000 | | | | 404,490 | |
| BBVA Banco Continental S.A., 5%, 8/26/22 (n) | | | 1,265,000 | | | | 1,280,812 | |
18
Portfolio of Investments – continued
| | | | | | | | |
| Issuer | | Shares/Par | | | Value ($) | |
| | | | | | | | |
| Bonds - continued | | | | | | | | |
| Other Banks & Diversified Financials - continued | | | | | | | | |
| BBVA Bancomer S.A. de C.V., 6.5%, 3/10/21 (n) | | $ | 1,770,000 | | | $ | 1,920,450 | |
| BBVA Bancomer S.A. de C.V., 6.75%, 9/30/22 (n) | | | 1,788,000 | | | | 1,962,330 | |
| BBVA Continental, 5.75%, 1/18/17 (n) | | | 500,000 | | | | 541,875 | |
| Industrial Senior Trust, 5.5%, 11/01/22 (n) | | | 2,082,000 | | | | 1,964,888 | |
| | | | | | | | |
| | | | | | | $ | 15,498,040 | |
| Real Estate - 0.2% | | | | | | | | |
| Fibra Uno, REIT, 6.95%, 1/30/44 (n) | | $ | 3,155,000 | | | $ | 3,020,913 | |
| | |
| Retailers - 0.0% | | | | | | | | |
| Cencosud S.A., 4.875%, 1/20/23 (n) | | $ | 500,000 | | | $ | 476,227 | |
| | |
| Specialty Chemicals - 0.1% | | | | | | | | |
| SIBUR Securities Ltd., 3.914%, 1/31/18 (n) | | $ | 2,690,000 | | | $ | 2,616,025 | |
| | |
| Supranational - 0.1% | | | | | | | | |
| Eurasian Development Bank, 4.767%, 9/20/22 (n) | | $ | 1,352,000 | | | $ | 1,299,637 | |
| Inter-American Development Bank, 4.375%, 1/24/44 | | | 511,000 | | | | 526,211 | |
| | | | | | | | |
| | | | | | | $ | 1,825,848 | |
| Telecommunications - Wireless - 0.7% | | | | | | | | |
| Altice Financing S.A., 6.5%, 1/15/22 (n) | | $ | 2,769,000 | | | $ | 2,886,682 | |
| Altice Finco S.A., 8.125%, 1/15/24 (n) | | | 1,416,000 | | | | 1,515,120 | |
| America Movil S.A.B. de C.V., 5%, 3/30/20 | | | 877,000 | | | | 967,933 | |
| Comcel Trust, 6.875%, 2/06/24 (n) | | | 892,000 | | | | 922,105 | |
| Digicel Group Ltd., 10.5%, 4/15/18 (n) | | | 385,000 | | | | 409,063 | |
| Digicel Group Ltd., 8.25%, 9/30/20 (n) | | | 396,000 | | | | 418,770 | |
| Digicel Group Ltd., 6%, 4/15/21 (n) | | | 2,253,000 | | | | 2,264,265 | |
| Millicom International Cellular S.A., 4.75%, 5/22/20 (n) | | | 600,000 | | | | 576,000 | |
| Millicom International Cellular S.A., 6.625%, 10/15/21 (n) | | | 1,182,000 | | | | 1,232,235 | |
| MTS International Funding Ltd., 5%, 5/30/23 (n) | | | 2,819,000 | | | | 2,611,099 | |
| | | | | | | | |
| | | | | | | $ | 13,803,272 | |
| Telephone Services - 0.3% | | | | | | | | |
| B Communications Ltd., 7.375%, 2/15/21 (z) | | $ | 6,602,000 | | | $ | 6,915,595 | |
| | |
| Transportation - 0.1% | | | | | | | | |
| Far East Capital Ltd. S.A., 8%, 5/02/18 | | $ | 1,300,000 | | | $ | 1,176,500 | |
| Far Eastern Shipping Co., 8%, 5/02/18 (n) | | | 1,127,000 | | | | 1,019,935 | |
| Far Eastern Shipping Co., 8.75%, 5/02/20 (n) | | | 850,000 | | | | 769,250 | |
| | | | | | | | |
| | | | | | | $ | 2,965,685 | |
19
Portfolio of Investments – continued
| | | | | | | | |
| Issuer | | Shares/Par | | | Value ($) | |
| | | | | | | | |
| Bonds - continued | | | | | | | | |
| Transportation - Services - 0.0% | | | | | | | | |
| Navios South American Logistics, Inc., 9.25%, 4/15/19 | | $ | 149,000 | | | $ | 159,803 | |
| Topaz Marine S.A., 8.625%, 11/01/18 (n) | | | 583,000 | | | | 603,697 | |
| | | | | | | | |
| | | | | | | $ | 763,500 | |
| U.S. Government Agencies and Equivalents - 0.8% | | | | | | | | |
| Aid-Egypt, 4.45%, 9/15/15 | | $ | 170,000 | | | $ | 180,534 | |
| Fannie Mae, 1.125%, 4/27/17 | | | 5,500,000 | | | | 5,541,806 | |
| Fannie Mae, 0.875%, 5/21/18 | | | 4,000,000 | | | | 3,920,612 | |
| Hashemite Kingdom of Jordan, 2.503%, 10/30/20 | | | 1,108,000 | | | | 1,113,934 | |
| Private Export Funding Corp., 1.875%, 7/15/18 | | | 850,000 | | | | 861,208 | |
| Small Business Administration, 6.34%, 5/01/21 | | | 86,237 | | | | 94,211 | |
| Small Business Administration, 6.07%, 3/01/22 | | | 79,268 | | | | 86,512 | |
| Small Business Administration, 5.16%, 2/01/28 | | | 170,629 | | | | 188,608 | |
| Small Business Administration, 2.21%, 2/01/33 | | | 402,576 | | | | 380,236 | |
| Small Business Administration, 2.22%, 3/01/33 | | | 774,616 | | | | 731,809 | |
| Small Business Administration, 3.15%, 7/01/33 | | | 833,939 | | | | 837,483 | |
| Small Business Administration, 3.16%, 8/01/33 | | | 978,451 | | | | 982,822 | |
| Small Business Administration, 3.62%, 9/01/33 | | | 800,000 | | | | 824,823 | |
| Tennessee Valley Authority, 1.75%, 10/15/18 | | | 863,000 | | | | 869,430 | |
| | | | | | | | |
| | | | | | | $ | 16,614,028 | |
| U.S. Treasury Obligations - 6.2% | | | | | | | | |
| U.S. Treasury Bonds, 9.25%, 2/15/16 | | $ | 47,000 | | | $ | 55,146 | |
| U.S. Treasury Bonds, 6.375%, 8/15/27 | | | 106,000 | | | | 145,883 | |
| U.S. Treasury Bonds, 4.5%, 2/15/36 | | | 231,000 | | | | 270,631 | |
| U.S. Treasury Bonds, 4.375%, 2/15/38 | | | 346,000 | | | | 397,792 | |
| U.S. Treasury Bonds, 4.5%, 8/15/39 | | | 15,218,000 | | | | 17,845,479 | |
| U.S. Treasury Bonds, 3.125%, 2/15/43 | | | 3,076,700 | | | | 2,814,221 | |
| U.S. Treasury Notes, 1.25%, 4/15/14 | | | 6,250,000 | | | | 6,258,544 | |
| U.S. Treasury Notes, 1.875%, 4/30/14 | | | 417,000 | | | | 418,189 | |
| U.S. Treasury Notes, 4%, 2/15/15 | | | 1,397,000 | | | | 1,448,351 | |
| U.S. Treasury Notes, 2.125%, 5/31/15 | | | 29,431,000 | | | | 30,142,642 | |
| U.S. Treasury Notes, 2.625%, 4/30/16 | | | 2,800,000 | | | | 2,934,313 | |
| U.S. Treasury Notes, 0.875%, 12/31/16 | | | 29,991,000 | | | | 30,190,170 | |
| U.S. Treasury Notes, 2.625%, 4/30/18 | | | 1,752,000 | | | | 1,853,150 | |
| U.S. Treasury Notes, 2.75%, 2/15/19 | | | 2,949,000 | | | | 3,124,097 | |
| U.S. Treasury Notes, 3.125%, 5/15/19 | | | 1,116,000 | | | | 1,202,054 | |
| U.S. Treasury Notes, 2.625%, 8/15/20 | | | 2,260,000 | | | | 2,348,280 | |
| U.S. Treasury Notes, 2%, 11/30/20 | | | 1,761,000 | | | | 1,752,884 | |
| U.S. Treasury Notes, 3.125%, 5/15/21 | | | 19,451,000 | | | | 20,704,675 | |
| U.S. Treasury Notes, 1.75%, 5/15/22 | | | 3,949,000 | | | | 3,756,794 | |
| U.S. Treasury Notes, 2.5%, 8/15/23 | | | 2,037,000 | | | | 2,020,926 | |
| | | | | | | | |
| | | | | | | $ | 129,684,221 | |
20
Portfolio of Investments – continued
| | | | | | | | |
| Issuer | | Shares/Par | | | Value ($) | |
| | | | | | | | |
| Bonds - continued | | | | | | | | |
| Utilities - Electric Power - 0.2% | | | | | | | | |
| E-CL S.A., 5.625%, 1/15/21 | | $ | 2,177,000 | | | $ | 2,310,820 | |
| Empresa de Energia de Bogota S.A., 6.125%, 11/10/21 (n) | | | 200,000 | | | | 213,600 | |
| Transelec S.A., 4.625%, 7/26/23 (n) | | | 1,507,000 | | | | 1,471,590 | |
| | | | | | | | |
| | | | | | | $ | 3,996,010 | |
| Utilities - Gas - 0.1% | | | | | | | | |
| Transport de Gas Peru, 4.25%, 4/30/28 (n) | | $ | 3,039,000 | | | $ | 2,674,320 | |
| Total Bonds (Identified Cost, $626,614,446) | | | | | | $ | 626,523,676 | |
| | |
| Common Stocks - 42.6% | | | | | | | | |
| Aerospace - 0.8% | | | | | | | | |
| Exelis, Inc. | | | 183,310 | | | $ | 3,745,023 | |
| L-3 Communications Holdings, Inc. | | | 25,100 | | | | 2,896,540 | |
| Lockheed Martin Corp. | | | 35,340 | | | | 5,735,682 | |
| Northrop Grumman Corp. | | | 28,570 | | | | 3,457,827 | |
| | | | | | | | |
| | | | | | | $ | 15,835,072 | |
| Automotive - 0.6% | | | | | | | | |
| Delphi Automotive PLC | | | 49,911 | | | $ | 3,322,575 | |
| General Motors Co. | | | 183,760 | | | | 6,652,112 | |
| Johnson Controls, Inc. | | | 38,474 | | | | 1,900,616 | |
| TRW Automotive Holdings Corp. (a) | | | 16,350 | | | | 1,345,932 | |
| | | | | | | | |
| | | | | | | $ | 13,221,235 | |
| Cable TV - 0.5% | | | | | | | | |
| Comcast Corp., “A” | | | 49,987 | | | $ | 2,583,828 | |
| Time Warner Cable, Inc. | | | 53,240 | | | | 7,472,234 | |
| | | | | | | | |
| | | | | | | $ | 10,056,062 | |
| Chemicals - 0.3% | | | | | | | | |
| LyondellBasell Industries N.V., “A” | | | 72,840 | | | $ | 6,415,747 | |
| | |
| Computer Software - 0.4% | | | | | | | | |
| CA, Inc. | | | 156,490 | | | $ | 5,242,415 | |
| Symantec Corp. | | | 171,510 | | | | 3,684,035 | |
| | | | | | | | |
| | | | | | | $ | 8,926,450 | |
| Computer Software - Systems - 0.9% | | | | | | | | |
| Hewlett-Packard Co. | | | 368,997 | | | $ | 11,025,630 | |
| Western Digital Corp. | | | 73,930 | | | | 6,431,171 | |
| Xerox Corp. | | | 176,450 | | | | 1,939,186 | |
| | | | | | | | |
| | | | | | | $ | 19,395,987 | |
21
Portfolio of Investments – continued
| | | | | | | | |
| Issuer | | Shares/Par | | | Value ($) | |
| | | | | | | | |
| Common Stocks - continued | | | | | | | | |
| Consumer Products - 0.2% | | | | | | | | |
| Nu Skin Enterprises, Inc., “A” | | | 28,424 | | | $ | 2,373,972 | |
| Procter & Gamble Co. | | | 14,746 | | | | 1,159,920 | |
| | | | | | | | |
| | | | | | | $ | 3,533,892 | |
| Containers - 0.3% | | | | | | | | |
| Packaging Corp. of America | | | 93,780 | | | $ | 6,835,624 | |
| | |
| Electrical Equipment - 0.1% | | | | | | | | |
| General Electric Co. | | | 113,528 | | | $ | 2,891,558 | |
| | |
| Electronics - 0.4% | | | | | | | | |
| Intel Corp. | | | 138,611 | | | $ | 3,432,008 | |
| Microchip Technology, Inc. | | | 117,585 | | | | 5,355,997 | |
| | | | | | | | |
| | | | | | | $ | 8,788,005 | |
| Energy - Independent - 1.1% | | | | | | | | |
| Marathon Oil Corp. | | | 41,640 | | | $ | 1,394,940 | |
| Marathon Petroleum Corp. | | | 69,161 | | | | 5,809,524 | |
| Occidental Petroleum Corp. | | | 86,406 | | | | 8,339,907 | |
| Valero Energy Corp. | | | 150,053 | | | | 7,199,543 | |
| | | | | | | | |
| | | | | | | $ | 22,743,914 | |
| Energy - Integrated - 2.0% | | | | | | | | |
| Chevron Corp. | | | 137,264 | | | $ | 15,830,657 | |
| Exxon Mobil Corp. | | | 276,965 | | | | 26,663,421 | |
| | | | | | | | |
| | | | | | | $ | 42,494,078 | |
| Entertainment - 0.1% | | | | | | | | |
| Regal Entertainment Group, “A” | | | 167,779 | | | $ | 3,087,134 | |
| | |
| Food & Beverages - 0.3% | | | | | | | | |
| Coca-Cola Enterprises, Inc. | | | 20,377 | | | $ | 959,349 | |
| General Mills, Inc. | | | 94,037 | | | | 4,704,671 | |
| | | | | | | | |
| | | | | | | $ | 5,664,020 | |
| Food & Drug Stores - 0.4% | | | | | | | | |
| CVS Caremark Corp. | | | 24,972 | | | $ | 1,826,452 | |
| Kroger Co. | | | 157,320 | | | | 6,598,001 | |
| | | | | | | | |
| | | | | | | $ | 8,424,453 | |
| Forest & Paper Products - 0.1% | | | | | | | | |
| International Paper Co. | | | 53,082 | | | $ | 2,595,179 | |
| | |
| Furniture & Appliances - 0.2% | | | | | | | | |
| Whirlpool Corp. | | | 27,918 | | | $ | 4,037,780 | |
22
Portfolio of Investments – continued
| | | | | | | | |
| Issuer | | Shares/Par | | | Value ($) | |
| | | | | | | | |
| Common Stocks - continued | | | | | | | | |
| Gaming & Lodging - 0.2% | | | | | | | | |
| Carnival Corp. | | | 84,050 | | | $ | 3,333,423 | |
| | |
| General Merchandise - 0.4% | | | | | | | | |
| Macy’s, Inc. | | | 129,578 | | | $ | 7,497,383 | |
| | |
| Health Maintenance Organizations - 0.3% | | | | | | | | |
| WellPoint, Inc. | | | 70,850 | | | $ | 6,418,302 | |
| | |
| Insurance - 2.0% | | | | | | | | |
| Everest Re Group Ltd. | | | 48,909 | | | $ | 7,299,179 | |
| Lincoln National Corp. | | | 90,770 | | | | 4,550,300 | |
| MetLife, Inc. | | | 181,554 | | | | 9,199,341 | |
| Prudential Financial, Inc. | | | 91,775 | | | | 7,762,330 | |
| Travelers Cos., Inc. | | | 86,221 | | | | 7,228,769 | |
| Validus Holdings Ltd. | | | 186,615 | | | | 6,869,298 | |
| | | | | | | | |
| | | | | | | $ | 42,909,217 | |
| Internet - 0.5% | | | | | | | | |
| Yahoo!, Inc. (a) | | | 249,160 | | | $ | 9,635,017 | |
| | |
| Machinery & Tools - 0.5% | | | | | | | | |
| Eaton Corp. PLC | | | 115,228 | | | $ | 8,608,684 | |
| Joy Global, Inc. | | | 19,110 | | | | 1,051,050 | |
| | | | | | | | |
| | | | | | | $ | 9,659,734 | |
| Major Banks - 2.4% | | | | | | | | |
| Bank of America Corp. | | | 337,310 | | | $ | 5,575,734 | |
| Goldman Sachs Group, Inc. | | | 30,392 | | | | 5,058,748 | |
| JPMorgan Chase & Co. | | | 319,592 | | | | 18,159,217 | |
| PNC Financial Services Group, Inc. | | | 58,844 | | | | 4,812,262 | |
| Wells Fargo & Co. | | | 371,860 | | | | 17,261,741 | |
| | | | | | | | |
| | | | | | | $ | 50,867,702 | |
| Medical & Health Technology & Services - 0.7% | | | | | | | | |
| Capital Senior Living Corp. (a) | | | 163,710 | | | $ | 4,161,508 | |
| Cardinal Health, Inc. | | | 88,080 | | | | 6,300,362 | |
| HCA Holdings, Inc. (a) | | | 26,790 | | | | 1,371,648 | |
| HealthSouth Corp. | | | 67,680 | | | | 2,211,782 | |
| | | | | | | | |
| | | | | | | $ | 14,045,300 | |
| Medical Equipment - 0.4% | | | | | | | | |
| Abbott Laboratories | | | 101,130 | | | $ | 4,022,951 | |
| Covidien PLC | | | 24,080 | | | | 1,732,556 | |
23
Portfolio of Investments – continued
| | | | | | | | |
| Issuer | | Shares/Par | | | Value ($) | |
| | | | | | | | |
| Common Stocks - continued | | | | | | | | |
| Medical Equipment - continued | | | | | | | | |
| Thermo Fisher Scientific, Inc. | | | 29,520 | | | $ | 3,676,421 | |
| | | | | | | | |
| | | | | | | $ | 9,431,928 | |
| Other Banks & Diversified Financials - 1.6% | | | | | | | | |
| Assured Guaranty Ltd. | | | 65,320 | | | $ | 1,603,606 | |
| Citigroup, Inc. | | | 241,123 | | | | 11,725,811 | |
| Discover Financial Services | | | 166,080 | | | | 9,529,670 | |
| New York Community Bancorp, Inc. | | | 307,580 | | | | 4,915,128 | |
| SLM Corp. | | | 67,390 | | | | 1,613,317 | |
| Western Union Co. | | | 258,150 | | | | 4,318,850 | |
| | | | | | | | |
| | | | | | | $ | 33,706,382 | |
| Pharmaceuticals - 2.1% | | | | | | | | |
| Bristol-Myers Squibb Co. | | | 93,930 | | | $ | 5,050,616 | |
| Eli Lilly & Co. | | | 49,840 | | | | 2,970,962 | |
| Johnson & Johnson | | | 168,519 | | | | 15,523,970 | |
| Merck & Co., Inc. | | | 33,377 | | | | 1,902,155 | |
| Pfizer, Inc. | | | 557,200 | | | | 17,891,692 | |
| | | | | | | | |
| | | | | | | $ | 43,339,395 | |
| Pollution Control - 0.1% | | | | | | | | |
| Republic Services, Inc. | | | 36,490 | | | $ | 1,244,674 | |
| | |
| Printing & Publishing - 0.1% | | | | | | | | |
| American Media Operations, Inc. (a) | | | 6,684 | | | $ | 32,685 | |
| Gannett Co. Inc. | | | 50,220 | | | | 1,494,045 | |
| | | | | | | | |
| | | | | | | $ | 1,526,730 | |
| Railroad & Shipping - 0.1% | | | | | | | | |
| Kansas City Southern Co. | | | 14,991 | | | $ | 1,407,955 | |
| | |
| Real Estate - 19.1% | | | | | | | | |
| Alexandria Real Estate Equities, Inc., REIT | | | 218,353 | | | $ | 15,819,675 | |
| Atrium European Real Estate Ltd. | | | 560,019 | | | | 3,408,905 | |
| AvalonBay Communities, Inc., REIT | | | 176,925 | | | | 22,818,017 | |
| Big Yellow Group PLC, REIT | | | 572,480 | | | | 5,478,664 | |
| Boston Properties, Inc., REIT | | | 175,245 | | | | 19,702,795 | |
| Corporate Office Properties Trust, REIT | | | 439,220 | | | | 11,713,997 | |
| DDR Corp., REIT | | | 589,960 | | | | 9,805,135 | |
| Digital Realty Trust, Inc., REIT | | | 292,748 | | | | 15,855,232 | |
| EastGroup Properties, Inc., REIT | | | 128,860 | | | | 7,994,474 | |
| Equity Lifestyle Properties, Inc., REIT | | | 490,422 | | | | 19,739,486 | |
| Federal Realty Investment Trust, REIT | | | 109,857 | | | | 12,228,183 | |
| Home Properties, Inc., REIT | | | 226,390 | | | | 13,343,427 | |
24
Portfolio of Investments – continued
| | | | | | | | |
| Issuer | | Shares/Par | | | Value ($) | |
| | | | | | | | |
| Common Stocks - continued | | | | | | | | |
| Real Estate - continued | | | | | | | | |
| Host Hotels & Resorts, Inc., REIT | | | 959,918 | | | $ | 18,881,587 | |
| Medical Properties Trust, Inc., REIT | | | 482,507 | | | | 6,364,267 | |
| Mid-America Apartment Communities, Inc., REIT | | | 269,397 | | | | 18,222,013 | |
| National Health Investors, Inc., REIT | | | 202,240 | | | | 12,478,208 | |
| Plum Creek Timber Co. Inc., REIT | | | 390,966 | | | | 16,924,918 | |
| Public Storage, Inc., REIT | | | 169,672 | | | | 28,674,568 | |
| Retail Opportunity Investment Corp., REIT | | | 546,620 | | | | 8,106,375 | |
| Rexford Industrial Realty, Inc., REIT | | | 457,028 | | | | 6,485,227 | |
| Simon Property Group, Inc., REIT | | | 295,841 | | | | 47,716,195 | |
| Tanger Factory Outlet Centers, Inc., REIT | | | 421,398 | | | | 14,458,165 | |
| Ventas, Inc., REIT | | | 269,312 | | | | 16,813,148 | |
| Vornado Realty Trust, REIT | | | 291,003 | | | | 28,020,679 | |
| Weyerhaeuser Co., REIT | | | 583,196 | | | | 17,210,114 | |
| | | | | | | | |
| | | | | | | $ | 398,263,454 | |
| Restaurants - 0.1% | | | | | | | | |
| ARAMARK Holdings Corp. | | | 49,270 | | | $ | 1,387,443 | |
| | |
| Specialty Stores - 0.1% | | | | | | | | |
| Best Buy Co., Inc. | | | 64,100 | | | $ | 1,706,983 | |
| | |
| Telecommunications - Wireless - 0.4% | | | | | | | | |
| American Tower Corp., REIT | | | 104,800 | | | $ | 8,538,056 | |
| | |
| Telephone Services - 0.8% | | | | | | | | |
| AT&T, Inc. | | | 92,003 | | | $ | 2,937,656 | |
| CenturyLink, Inc. | | | 126,980 | | | | 3,969,395 | |
| Frontier Communications Corp. | | | 862,320 | | | | 4,208,122 | |
| Verizon Communications, Inc. | | | 125,310 | | | | 5,962,250 | |
| | | | | | | | |
| | | | | | | $ | 17,077,423 | |
| Tobacco - 0.3% | | | | | | | | |
| Altria Group, Inc. | | | 22,459 | | | $ | 814,363 | |
| Lorillard, Inc. | | | 129,374 | | | | 6,347,088 | |
| | | | | | | | |
| | | | | | | $ | 7,161,451 | |
| Trucking - 0.1% | | | | | | | | |
| Swift Transportation Co. (a) | | | 82,370 | | | $ | 2,006,533 | |
| | |
| Utilities - Electric Power - 1.6% | | | | | | | | |
| AES Corp. | | | 285,578 | | | $ | 3,898,140 | |
| Alliant Energy Corp. | | | 82,716 | | | | 4,486,516 | |
| American Electric Power Co., Inc. | | | 138,498 | | | | 6,952,600 | |
| Edison International | | | 19,060 | | | | 998,172 | |
25
Portfolio of Investments – continued
| | | | | | | | |
| Issuer | | Shares/Par | | | Value ($) | |
| | | | | | | | |
| Common Stocks - continued | | | | | | | | |
| Utilities - Electric Power - continued | | | | | | | | |
| Entergy Corp. | | | 45,520 | | | $ | 2,905,086 | |
| FirstEnergy Corp. | | | 23,610 | | | | 726,716 | |
| PG&E Corp. | | | 162,061 | | | | 7,140,408 | |
| PPL Corp. | | | 169,157 | | | | 5,462,080 | |
| | | | | | | | |
| | | | | | | $ | 32,569,718 | |
| Total Common Stocks (Identified Cost, $759,385,268) | | | | | | $ | 888,680,393 | |
| | |
| Issuer/Expiration Date/Strike Price | | Number
of Contracts | | | | |
| Put Options Purchased - 0.0% | | | | | | | | |
| iShares Dow Jones U.S. Real Estate - March 2014 @ $55 | | | 4,200 | | | $ | 12,600 | |
| iShares Dow Jones U.S. Real Estate - January 2015 @ $55 | | | 3,000 | | | | 303,000 | |
| iShares Dow Jones U.S. Real Estate - January 2015 @ $57 | | | 3,000 | | | | 390,000 | |
| iShares Dow Jones U.S. Real Estate - June 2014 @ $56 | | | 2,800 | | | | 47,600 | |
| iShares Dow Jones U.S. Real Estate - June 2014 @ $58 | | | 2,800 | | | | 67,200 | |
| Total Put Options Purchased (Premiums Paid, $2,064,452) | | | $ | 820,400 | |
| | |
| Issuer | | Shares/Par | | | | |
| Underlying Affiliated Funds - 24.0% | | | | | | | | |
| Mutual Funds - 24.0% | | | | | | | | |
MFS High Yield Pooled Portfolio
(Identified Cost, $484,980,113) (v) | | | 50,175,922 | | | $ | 500,755,700 | |
| | |
| Money Market Funds - 4.8% | | | | | | | | |
MFS Institutional Money Market Portfolio, 0.08%,
at Cost and Net Asset Value (v) | | | 99,410,765 | | | $ | 99,410,765 | |
| Total Investments (Identified Cost, $1,972,455,044) | | | | | | $ | 2,116,190,934 | |
| | |
| Other Assets, Less Liabilities - (1.5)% | | | | | | | (30,560,944 | ) |
| Net Assets - 100.0% | | | | | | $ | 2,085,629,990 | |
| (a) | Non-income producing security. |
| (n) | Securities exempt from registration under Rule 144A of the Securities Act of 1933. These securities may be sold in the ordinary course of business in transactions exempt from registration, normally to qualified institutional buyers. At period end, the aggregate value of these securities was $227,681,432, representing 10.9% of net assets. |
| (v) | Underlying affiliated fund that is available only to investment companies managed by MFS. The rate quoted for the MFS Institutional Money Market Portfolio is the annualized seven-day yield of the fund at period end. |
26
Portfolio of Investments – continued
| (z) | Restricted securities are not registered under the Securities Act of 1933 and are subject to legal restrictions on resale. These securities generally may be resold in transactions exempt from registration or to the public if the securities are subsequently registered. Disposal of these securities may involve time-consuming negotiations and prompt sale at an acceptable price may be difficult. The fund holds the following restricted securities: |
| | | | | | | | | | |
| Restricted Securities | | Acquisition
Date | | Cost | | | Value | |
| B Communications Ltd., 7.375%, 2/15/21 | | 2/10/14 | | | $6,602,000 | | | | $6,915,595 | |
| G-Force LLC, CDO, “A2”, 4.83%, 8/22/36 | | 1/20/11 | | | 7,330 | | | | 7,707 | |
| Minsur S.A., 6.25%, 2/07/24 | | 1/31/14 | | | 1,026,095 | | | | 1,076,350 | |
| Nostrum Oil & Gas Finance B.V., 6.375%, 2/14/19 | | 2/10/14 | | | 895,000 | | | | 902,831 | |
| Petroleos Mexicanos, 4.875%, 1/18/24 | | 1/15/14 | | | 690,234 | | | | 713,401 | |
| Republic of Slovenia, 5.25%, 2/18/24 | | 2/10/14-2/12/14 | | | 613,740 | | | | 634,358 | |
Sberbank of Russia, 5.5% to 2/26/2014,
FRN to 2/26/24 | | 2/18/14 | | | 3,000,000 | | | | 2,958,750 | |
| Total Restricted Securities | | | | $13,208,992 | |
| % of Net assets | | | | 0.6% | |
The following abbreviations are used in this report and are defined:
| CDO | | Collateralized Debt Obligation |
| FRN | | Floating Rate Note. Interest rate resets periodically and may not be the rate reported at period end. |
| PLC | | Public Limited Company |
| REIT | | Real Estate Investment Trust |
| STRIPS | | Separate Trading of Registered Interest and Principal of Securities |
Derivative Contracts at 2/28/14
Swap Agreements at 2/28/14
| | | | | | | | | | | | | | | | | | |
| Expiration | | | | | Notional
Amount | | | Counterparty | | Cash Flows
to Receive | | Cash Flows
to Pay | | Fair
Value | |
| Liability Derivatives | | | | | | | | | | | |
| Credit Default Swap Agreements | | | | | | | | |
| 3/20/24 | | | USD | | | | 6,148,000 | | | Barclays Bank (a) | | 1% (fixed rate) | | (1) | | | $(616,841 | ) |
| | | | | | | | | | | | | | | | | | |
| (1) | Fund, as protection seller, to pay notional amount upon a defined credit event by Federal Republic of Brazil, 12.25%, 3/6/30, a BBB rated bond. The fund entered into the contract to gain issuer exposure. |
| (a) | Net unamortized premiums received by the fund amounted to $656,949. |
The credit ratings presented here are an indicator of the current payment/performance risk of the related swap agreement, the reference obligation for which may be either a single security or, in the case of a credit default index, a basket of securities issued by corporate or sovereign issuers. Ratings are assigned to each reference security, including each individual security within a reference basket of securities, utilizing ratings from Moody’s, Fitch, and Standard & Poor’s rating agencies and applying the following hierarchy: If all three agencies provide a rating, the middle rating (after dropping the highest and lowest ratings) is assigned; if two of the three agencies rate a security, the lower of the two is assigned. Ratings are shown in the S&P and Fitch scale
27
Portfolio of Investments – continued
(e.g., AAA). The ratings for a credit default index are calculated by MFS as a weighted average of the external credit ratings of the individual securities that compose the index’s reference basket of securities.
At February 28, 2014, the fund had cash collateral of $510,000 to cover any commitments for certain derivative contracts. Cash collateral is comprised of “Restricted cash“ in the Statement of Assets and Liabilities.
See Notes to Financial Statements
28
Financial Statements
STATEMENT OF ASSETS AND LIABILITIES
At 2/28/14
This statement represents your fund’s balance sheet, which details the assets and liabilities comprising the total value of the fund.
| | | | |
| Assets | | | | |
Investments- | | | | |
Non-affiliated issuers, at value (identified cost, $1,388,064,166) | | | $1,516,024,469 | |
Underlying affiliated funds, at value (identified cost, $584,390,878) | | | 600,166,465 | |
Total investments, at value (identified cost, $1,972,455,044) | | | $2,116,190,934 | |
Cash | | | 1,951,950 | |
Restricted cash | | | 510,000 | |
Receivables for | | | | |
Investments sold | | | 41,071 | |
TBA sale commitments | | | 20,149,216 | |
Fund shares sold | | | 6,815,036 | |
Interest and dividends | | | 7,025,964 | |
Other assets | | | 11,361 | |
Total assets | | | $2,152,695,532 | |
| Liabilities | | | | |
Payables for | | | | |
Distributions | | | $635,183 | |
Investments purchased | | | 2,685,787 | |
TBA purchase commitments | | | 58,076,720 | |
Fund shares reacquired | | | 3,651,406 | |
Swaps, at value (net unamortized premiums received, $656,949) | | | 616,841 | |
Payable to affiliates | | | | |
Investment adviser | | | 69,404 | |
Shareholder servicing costs | | | 999,056 | |
Distribution and service fees | | | 48,886 | |
Payable for independent Trustees’ compensation | | | 7 | |
Accrued expenses and other liabilities | | | 282,252 | |
Total liabilities | | | $67,065,542 | |
Net assets | | | $2,085,629,990 | |
| Net assets consist of | | | | |
Paid-in capital | | | $1,937,341,825 | |
Unrealized appreciation (depreciation) on investments and translation of assets and liabilities in foreign currencies | | | 143,775,998 | |
Accumulated net realized gain (loss) on investments and foreign currency | | | 5,812,415 | |
Accumulated distributions in excess of net investment income | | | (1,300,248 | ) |
Net assets | | | $2,085,629,990 | |
Shares of beneficial interest outstanding | | | 170,832,141 | |
29
Statement of Assets and Liabilities – continued
| | | | | | | | | | | | |
| | | Net assets | | | Shares
outstanding | | | Net asset value
per share (a) | |
Class A | | | $1,071,400,055 | | | | 87,744,857 | | | | $12.21 | |
Class C | | | 630,809,738 | | | | 51,687,948 | | | | 12.20 | |
Class I | | | 371,274,470 | | | | 30,404,634 | | | | 12.21 | |
Class R1 | | | 775,289 | | | | 63,568 | | | | 12.20 | |
Class R2 | | | 1,179,741 | | | | 96,663 | | | | 12.20 | |
Class R3 | | | 5,255,917 | | | | 430,380 | | | | 12.21 | |
Class R4 | | | 2,834,139 | | | | 232,046 | | | | 12.21 | |
Class R5 | | | 2,100,641 | | | | 172,045 | | | | 12.21 | |
| (a) | Maximum offering price per share was equal to the net asset value per share for all share classes, except for Class A, for which the maximum offering price per share was $12.82 [100 / 95.25 x $12.21]. On sales of $50,000 or more, the maximum offering price of Class A shares is reduced. A contingent deferred sales charge may be imposed on redemptions of Class A and Class C shares. Redemption price per share was equal to the net asset value per share for Classes I, R1, R2, R3, R4, and R5. |
See Notes to Financial Statements
30
Financial Statements
STATEMENT OF OPERATIONS
Year ended 2/28/14
This statement describes how much your fund earned in investment income and accrued in expenses. It also describes any gains and/or losses generated by fund operations.
| | | | |
| Net investment income | | | | |
Income | | | | |
Interest | | | $22,752,385 | |
Dividends | | | 20,614,266 | |
Dividends from underlying affiliated funds | | | 30,206,052 | |
Total investment income | | | $73,572,703 | |
Expenses | | | | |
Management fee | | | $12,281,506 | |
Distribution and service fees | | | 8,114,637 | |
Shareholder servicing costs | | | 2,093,123 | |
Administrative services fee | | | 237,635 | |
Independent Trustees’ compensation | | | 29,188 | |
Custodian fee | | | 249,199 | |
Shareholder communications | | | 137,560 | |
Audit and tax fees | | | 66,749 | |
Legal fees | | | 21,663 | |
Miscellaneous | | | 371,943 | |
Total expenses | | | $23,603,203 | |
Fees paid indirectly | | | (773 | ) |
Reduction of expenses by investment adviser and distributor | | | (175,105 | ) |
Net expenses | | | $23,427,325 | |
Net investment income | | | $50,145,378 | |
| Realized and unrealized gain (loss) on investments and foreign currency | |
Realized gain (loss) (identified cost basis) | | | | |
Investments: | | | | |
Non-affiliated issuers | | | $42,722,193 | |
Underlying affiliated funds | | | (2,094,502 | ) |
Capital gain distributions from underlying affiliated funds | | | 3,614,409 | |
Swap agreements | | | (855,445 | ) |
Foreign currency | | | 92,847 | |
Net realized gain (loss) on investments and foreign currency | | | $43,479,502 | |
Change in unrealized appreciation (depreciation) | | | | |
Investments | | | $44,121,507 | |
Swap agreements | | | 187,505 | |
Translation of assets and liabilities in foreign currencies | | | (8,510 | ) |
Net unrealized gain (loss) on investments and foreign currency translation | | | $44,300,502 | |
Net realized and unrealized gain (loss) on investments and foreign currency | | | $87,780,004 | |
Change in net assets from operations | | | $137,925,382 | |
See Notes to Financial Statements
31
Financial Statements
STATEMENTS OF CHANGES IN NET ASSETS
These statements describe the increases and/or decreases in net assets resulting from operations, any distributions, and any shareholder transactions.
| | | | | | | | |
| | | Years ended 2/28 | |
| | | 2014 | | | 2013 | |
| Change in net assets | | | | | | |
| From operations | | | | | | | | |
Net investment income | | | $50,145,378 | | | | $30,135,730 | |
Net realized gain (loss) on investments and foreign currency | | | 43,479,502 | | | | 19,458,662 | |
Net unrealized gain (loss) on investments and foreign currency translation | | | 44,300,502 | | | | 64,539,257 | |
Change in net assets from operations | | | $137,925,382 | | | | $114,133,649 | |
| Distributions declared to shareholders | | | | | | | | |
From net investment income | | | $(51,204,939 | ) | | | $(34,119,558 | ) |
From net realized gain on investments | | | (28,187,612 | ) | | | (1,043,035 | ) |
Total distributions declared to shareholders | | | $(79,392,551 | ) | | | $(35,162,593 | ) |
Change in net assets from fund share transactions | | | $476,543,359 | | | | $688,808,285 | |
Total change in net assets | | | $535,076,190 | | | | $767,779,341 | |
| Net assets | | | | | | | | |
At beginning of period | | | 1,550,553,800 | | | | 782,774,459 | |
At end of period (including accumulated distributions in excess of net investment income of $1,300,248 and $1,995,208, respectively) | | | $2,085,629,990 | | | | $1,550,553,800 | |
See Notes to Financial Statements
32
Financial Statements
FINANCIAL HIGHLIGHTS
The financial highlights table is intended to help you understand the fund’s financial performance for the past 5 years (or life of a particular share class, if shorter). Certain information reflects financial results for a single fund share. The total returns in the table represent the rate by which an investor would have earned (or lost) on an investment in the fund share class (assuming reinvestment of all distributions) held for the entire period.
| | | | | | | | | | | | | | | | | | | | |
| Class A | | Years ended 2/28, 2/29 | |
| | | 2014 | | | 2013 | | | 2012 | | | 2011 | | | 2010 | |
Net asset value, beginning of period | | | $11.82 | | | | $11.05 | | | | $10.79 | | | | $9.60 | | | | $6.88 | |
| Income (loss) from investment operations | |
Net investment income (d) | | | $0.34 | | | | $0.33 | | | | $0.34 | | | | $0.40 | | | | $0.43 | |
Net realized and unrealized gain (loss)
on investments and foreign currency | | | 0.57 | | | | 0.82 | | | | 0.30 | | | | 1.23 | | | | 2.75 | |
Total from investment operations | | | $0.91 | | | | $1.15 | | | | $0.64 | | | | $1.63 | | | | $3.18 | |
| Less distributions declared to shareholders | |
From net investment income | | | $(0.35 | ) | | | $(0.37 | ) | | | $(0.38 | ) | | | $(0.44 | ) | | | $(0.46 | ) |
From net realized gain on investments | | | (0.17 | ) | | | (0.01 | ) | | | — | | | | — | | | | — | |
Total distributions declared to shareholders | | | $(0.52 | ) | | | $(0.38 | ) | | | $(0.38 | ) | | | $(0.44 | ) | | | $(0.46 | ) |
Net asset value, end of period (x) | | | $12.21 | | | | $11.82 | | | | $11.05 | | | | $10.79 | | | | $9.60 | |
Total return (%) (r)(s)(t)(x) | | | 7.87 | | | | 10.56 | | | | 6.09 | | | | 17.36 | | | | 47.12 | |
Ratios (%) (to average net assets)
and Supplemental data: | |
Expenses before expense reductions (f)(h) | | | 1.07 | | | | 1.08 | | | | 1.10 | | | | 1.15 | | | | 1.20 | |
Expenses after expense reductions (f)(h) | | | 1.06 | | | | 1.08 | | | | 1.10 | | | | 1.06 | | | | 0.94 | |
Net investment income | | | 2.83 | | | | 2.86 | | | | 3.18 | | | | 3.95 | | | | 5.02 | |
Portfolio turnover | | | 63 | | | | 64 | | | | 64 | | | | 59 | | | | 79 | |
Net assets at end of period (000 omitted) | | | $1,071,400 | | | | $797,338 | | | | $447,034 | | | | $257,247 | | | | $116,318 | |
See Notes to Financial Statements
33
Financial Highlights – continued
| | | | | | | | | | | | | | | | | | | | |
| Class C | | Years ended 2/28, 2/29 | |
| | | 2014 | | | 2013 | | | 2012 | | | 2011 | | | 2010 | |
Net asset value, beginning of period | | | $11.82 | | | | $11.04 | | | | $10.78 | | | | $9.59 | | | | $6.88 | |
| Income (loss) from investment operations | |
Net investment income (d) | | | $0.25 | | | | $0.24 | | | | $0.26 | | | | $0.33 | | | | $0.37 | |
Net realized and unrealized gain (loss)
on investments and foreign currency | | | 0.56 | | | | 0.83 | | | | 0.30 | | | | 1.22 | | | | 2.74 | |
Total from investment operations | | | $0.81 | | | | $1.07 | | | | $0.56 | | | | $1.55 | | | | $3.11 | |
| Less distributions declared to shareholders | |
From net investment income | | | $(0.26 | ) | | | $(0.28 | ) | | | $(0.30 | ) | | | $(0.36 | ) | | | $(0.40 | ) |
From net realized gain on investments | | | (0.17 | ) | | | (0.01 | ) | | | — | | | | — | | | | — | |
Total distributions declared to shareholders | | | $(0.43 | ) | | | $(0.29 | ) | | | $(0.30 | ) | | | $(0.36 | ) | | | $(0.40 | ) |
Net asset value, end of period (x) | | | $12.20 | | | | $11.82 | | | | $11.04 | | | | $10.78 | | | | $9.59 | |
Total return (%) (r)(s)(t)(x) | | | 6.97 | | | | 9.84 | | | | 5.31 | | | | 16.51 | | | | 45.90 | |
Ratios (%) (to average net assets)
and Supplemental data: | |
Expenses before expense reductions (f)(h) | | | 1.82 | | | | 1.83 | | | | 1.85 | | | | 1.90 | | | | 1.95 | |
Expenses after expense reductions (f)(h) | | | 1.81 | | | | 1.83 | | | | 1.85 | | | | 1.81 | | | | 1.69 | |
Net investment income | | | 2.08 | | | | 2.11 | | | | 2.43 | | | | 3.20 | | | | 4.27 | |
Portfolio turnover | | | 63 | | | | 64 | | | | 64 | | | | 59 | | | | 79 | |
Net assets at end of period (000 omitted) | | | $630,810 | | | | $466,361 | | | | $238,332 | | | | $138,344 | | | | $63,377 | |
| | | | | | | | | | | | | | | | | | | | |
| Class I | | Years ended 2/28, 2/29 | |
| | | 2014 | | | 2013 | | | 2012 | | | 2011 | | | 2010 | |
Net asset value, beginning of period | | | $11.82 | | | | $11.05 | | | | $10.79 | | | | $9.60 | | | | $6.88 | |
| Income (loss) from investment operations | |
Net investment income (d) | | | $0.37 | | | | $0.35 | | | | $0.36 | | | | $0.41 | | | | $0.45 | |
Net realized and unrealized gain (loss)
on investments and foreign currency | | | 0.57 | | | | 0.83 | | | | 0.30 | | | | 1.25 | | | | 2.75 | |
Total from investment operations | | | $0.94 | | | | $1.18 | | | | $0.66 | | | | $1.66 | | | | $3.20 | |
| Less distributions declared to shareholders | |
From net investment income | | | $(0.38 | ) | | | $(0.40 | ) | | | $(0.40 | ) | | | $(0.47 | ) | | | $(0.48 | ) |
From net realized gain on investments | | | (0.17 | ) | | | (0.01 | ) | | | — | | | | — | | | | — | |
Total distributions declared to shareholders | | | $(0.55 | ) | | | $(0.41 | ) | | | $(0.40 | ) | | | $(0.47 | ) | | | $(0.48 | ) |
Net asset value, end of period (x) | | | $12.21 | | | | $11.82 | | | | $11.05 | | | | $10.79 | | | | $9.60 | |
Total return (%) (r)(s)(x) | | | 8.14 | | | | 10.83 | | | | 6.35 | | | | 17.65 | | | | 47.47 | |
Ratios (%) (to average net assets)
and Supplemental data: | |
Expenses before expense reductions (f)(h) | | | 0.82 | | | | 0.83 | | | | 0.85 | | | | 0.89 | | | | 0.93 | |
Expenses after expense reductions (f)(h) | | | 0.81 | | | | 0.83 | | | | 0.85 | | | | 0.83 | | | | 0.69 | |
Net investment income | | | 3.08 | | | | 3.09 | | | | 3.43 | | | | 3.94 | | | | 4.95 | |
Portfolio turnover | | | 63 | | | | 64 | | | | 64 | | | | 59 | | | | 79 | |
Net assets at end of period (000 omitted) | | | $371,274 | | | | $280,443 | | | | $96,323 | | | | $30,993 | | | | $3,835 | |
See Notes to Financial Statements
34
Financial Highlights – continued
| | | | | | | | | | | | | | | | | | | | |
| Class R1 | | Years ended 2/28, 2/29 | |
| | | 2014 | | | 2013 | | | 2012 | | | 2011 | | | 2010 | |
Net asset value, beginning of period | | | $11.81 | | | | $11.04 | | | | $10.78 | | | | $9.59 | | | | $6.87 | |
| Income (loss) from investment operations | |
Net investment income (d) | | | $0.25 | | | | $0.23 | | | | $0.26 | | | | $0.34 | | | | $0.37 | |
Net realized and unrealized gain (loss)
on investments and foreign currency | | | 0.57 | | | | 0.83 | | | | 0.30 | | | | 1.21 | | | | 2.75 | |
Total from investment operations | | | $0.82 | | | | $1.06 | | | | $0.56 | | | | $1.55 | | | | $3.12 | |
| Less distributions declared to shareholders | |
From net investment income | | | $(0.26 | ) | | | $(0.28 | ) | | | $(0.30 | ) | | | $(0.36 | ) | | | $(0.40 | ) |
From net realized gain on investments | | | (0.17 | ) | | | (0.01 | ) | | | — | | | | — | | | | — | |
Total distributions declared to shareholders | | | $(0.43 | ) | | | $(0.29 | ) | | | $(0.30 | ) | | | $(0.36 | ) | | | $(0.40 | ) |
Net asset value, end of period (x) | | | $12.20 | | | | $11.81 | | | | $11.04 | | | | $10.78 | | | | $9.59 | |
Total return (%) (r)(s)(x) | | | 7.06 | | | | 9.75 | | | | 5.31 | | | | 16.51 | | | | 46.11 | |
Ratios (%) (to average net assets)
and Supplemental data: | |
Expenses before expense reductions (f)(h) | | | 1.82 | | | | 1.84 | | | | 1.85 | | | | 1.90 | | | | 1.94 | |
Expenses after expense reductions (f)(h) | | | 1.81 | | | | 1.84 | | | | 1.85 | | | | 1.80 | | | | 1.69 | |
Net investment income | | | 2.11 | | | | 2.04 | | | | 2.44 | | | | 3.32 | | | | 4.24 | |
Portfolio turnover | | | 63 | | | | 64 | | | | 64 | | | | 59 | | | | 79 | |
Net assets at end of period (000 omitted) | | | $775 | | | | $375 | | | | $142 | | | | $126 | | | | $106 | |
| | | | | | | | | | | | | | | | | | | | |
| Class R2 | | Years ended 2/28, 2/29 | |
| | | 2014 | | | 2013 | | | 2012 | | | 2011 | | | 2010 | |
Net asset value, beginning of period | | | $11.82 | | | | $11.04 | | | | $10.78 | | | | $9.59 | | | | $6.87 | |
| Income (loss) from investment operations | |
Net investment income (d) | | | $0.31 | | | | $0.30 | | | | $0.31 | | | | $0.39 | | | | $0.41 | |
Net realized and unrealized gain (loss)
on investments and foreign currency | | | 0.56 | | | | 0.83 | | | | 0.30 | | | | 1.21 | | | | 2.75 | |
Total from investment operations | | | $0.87 | | | | $1.13 | | | | $0.61 | | | | $1.60 | | | | $3.16 | |
| Less distributions declared to shareholders | |
From net investment income | | | $(0.32 | ) | | | $(0.34 | ) | | | $(0.35 | ) | | | $(0.41 | ) | | | $(0.44 | ) |
From net realized gain on investments | | | (0.17 | ) | | | (0.01 | ) | | | — | | | | — | | | | — | |
Total distributions declared to shareholders | | | $(0.49 | ) | | | $(0.35 | ) | | | $(0.35 | ) | | | $(0.41 | ) | | | $(0.44 | ) |
Net asset value, end of period (x) | | | $12.20 | | | | $11.82 | | | | $11.04 | | | | $10.78 | | | | $9.59 | |
Total return (%) (r)(s)(x) | | | 7.51 | | | | 10.39 | | | | 5.83 | | | | 17.09 | | | | 46.82 | |
Ratios (%) (to average net assets)
and Supplemental data: | |
Expenses before expense reductions (f)(h) | | | 1.32 | | | | 1.34 | | | | 1.35 | | | | 1.40 | | | | 1.45 | |
Expenses after expense reductions (f)(h) | | | 1.31 | | | | 1.34 | | | | 1.35 | | | | 1.30 | | | | 1.19 | |
Net investment income | | | 2.59 | | | | 2.59 | | | | 2.93 | | | | 3.83 | | | | 4.74 | |
Portfolio turnover | | | 63 | | | | 64 | | | | 64 | | | | 59 | | | | 79 | |
Net assets at end of period (000 omitted) | | | $1,180 | | | | $702 | | | | $212 | | | | $125 | | | | $107 | |
See Notes to Financial Statements
35
Financial Highlights – continued
| | | | | | | | | | | | | | | | | | | | |
| Class R3 | | Years ended 2/28, 2/29 | |
| | | 2014 | | | 2013 | | | 2012 | | | 2011 | | | 2010 | |
Net asset value, beginning of period | | | $11.83 | | | | $11.05 | | | | $10.79 | | | | $9.59 | | | | $6.88 | |
| Income (loss) from investment operations | |
Net investment income (d) | | | $0.34 | | | | $0.31 | | | | $0.34 | | | | $0.41 | | | | $0.43 | |
Net realized and unrealized gain (loss)
on investments and foreign currency | | | 0.56 | | | | 0.85 | | | | 0.30 | | | | 1.23 | | | | 2.74 | |
Total from investment operations | | | $0.90 | | | | $1.16 | | | | $0.64 | | | | $1.64 | | | | $3.17 | |
| Less distributions declared to shareholders | |
From net investment income | | | $(0.35 | ) | | | $(0.37 | ) | | | $(0.38 | ) | | | $(0.44 | ) | | | $(0.46 | ) |
From net realized gain on investments | | | (0.17 | ) | | | (0.01 | ) | | | — | | | | — | | | | — | |
Total distributions declared to shareholders | | | $(0.52 | ) | | | $(0.38 | ) | | | $(0.38 | ) | | | $(0.44 | ) | | | $(0.46 | ) |
Net asset value, end of period (x) | | | $12.21 | | | | $11.83 | | | | $11.05 | | | | $10.79 | | | | $9.59 | |
Total return (%) (r)(s)(x) | | | 7.77 | | | | 10.65 | | | | 6.09 | | | | 17.48 | | | | 46.96 | |
Ratios (%) (to average net assets)
and Supplemental data: | |
Expenses before expense reductions (f)(h) | | | 1.07 | | | | 1.10 | | | | 1.10 | | | | 1.15 | | | | 1.20 | |
Expenses after expense reductions (f)(h) | | | 1.06 | | | | 1.10 | | | | 1.10 | | | | 1.06 | | | | 0.94 | |
Net investment income | | | 2.84 | | | | 2.70 | | | | 3.17 | | | | 3.99 | | | | 4.99 | |
Portfolio turnover | | | 63 | | | | 64 | | | | 64 | | | | 59 | | | | 79 | |
Net assets at end of period (000 omitted) | | | $5,256 | | | | $2,783 | | | | $186 | | | | $185 | | | | $107 | |
| | | | | | | | | | | | | | | | | | | | |
| Class R4 | | Years ended 2/28, 2/29 | |
| | | 2014 | | | 2013 | | | 2012 | | | 2011 | | | 2010 | |
Net asset value, beginning of period | | | $11.82 | | | | $11.05 | | | | $10.79 | | | | $9.59 | | | | $6.88 | |
| Income (loss) from investment operations | |
Net investment income (d) | | | $0.37 | | | | $0.36 | | | | $0.36 | | | | $0.44 | | | | $0.46 | |
Net realized and unrealized gain (loss)
on investments and foreign currency | | | 0.57 | | | | 0.82 | | | | 0.30 | | | | 1.23 | | | | 2.73 | |
Total from investment operations | | | $0.94 | | | | $1.18 | | | | $0.66 | | | | $1.67 | | | | $3.19 | |
| Less distributions declared to shareholders | |
From net investment income | | | $(0.38 | ) | | | $(0.40 | ) | | | $(0.40 | ) | | | $(0.47 | ) | | | $(0.48 | ) |
From net realized gain on investments | | | (0.17 | ) | | | (0.01 | ) | | | — | | | | — | | | | — | |
Total distributions declared to shareholders | | | $(0.55 | ) | | | $(0.41 | ) | | | $(0.40 | ) | | | $(0.47 | ) | | | $(0.48 | ) |
Net asset value, end of period (x) | | | $12.21 | | | | $11.82 | | | | $11.05 | | | | $10.79 | | | | $9.59 | |
Total return (%) (r)(s)(x) | | | 8.13 | | | | 10.83 | | | | 6.35 | | | | 17.78 | | | | 47.32 | |
Ratios (%) (to average net assets)
and Supplemental data: | |
Expenses before expense reductions (f)(h) | | | 0.82 | | | | 0.84 | | | | 0.85 | | | | 0.90 | | | | 0.95 | |
Expenses after expense reductions (f)(h) | | | 0.81 | | | | 0.84 | | | | 0.85 | | | | 0.80 | | | | 0.69 | |
Net investment income | | | 3.08 | | | | 3.12 | | | | 3.40 | | | | 4.32 | | | | 5.24 | |
Portfolio turnover | | | 63 | | | | 64 | | | | 64 | | | | 59 | | | | 79 | |
Net assets at end of period (000 omitted) | | | $2,834 | | | | $1,159 | | | | $546 | | | | $127 | | | | $108 | |
See Notes to Financial Statements
36
Financial Highlights – continued
| | | | | | | | |
| Class R5 | | Years ended 2/28 | |
| | | 2014 | | | 2013 (i) | |
Net asset value, beginning of period | | | $11.82 | | | | $11.16 | |
| Income (loss) from investment operations | |
Net investment income (d) | | | $0.38 | | | | $0.19 | |
Net realized and unrealized gain (loss)
on investments and foreign currency | | | 0.57 | | | | 0.75 | |
Total from investment operations | | | $0.95 | | | | $0.94 | |
| Less distributions declared to shareholders | |
From net investment income | | | $(0.39 | ) | | | $(0.27 | ) |
From net realized gain on investments | | | (0.17 | ) | | | (0.01 | ) |
Total distributions declared to shareholders | | | $(0.56 | ) | | | $(0.28 | ) |
Net asset value, end of period (x) | | | $12.21 | | | | $11.82 | |
Total return (%) (r)(s)(x) | | | 8.23 | | | | 8.47 | (n) |
Ratios (%) (to average net assets)
and Supplemental data: | |
Expenses before expense reductions (f)(h) | | | 0.73 | | | | 0.79 | (a) |
Expenses after expense reductions (f)(h) | | | 0.72 | | | | 0.79 | (a) |
Net investment income | | | 3.18 | | | | 2.48 | (a) |
Portfolio turnover | | | 63 | | | | 64 | |
Net assets at end of period (000 omitted) | | | $2,101 | | | | $1,393 | |
| (d) | Per share data is based on average shares outstanding. |
| (f) | Ratios do not reflect reductions from fees paid indirectly, if applicable. |
| (h) | For the year ended February 28, 2014, in addition to the fees and expenses which the fund bears directly, the fund indirectly bears a pro rata share of the fees and expenses of the underlying affiliated funds in which the fund invests. Accordingly, the expense ratio for the fund reflects only those fees and expenses borne directly by the fund. Because the underlying affiliated funds have varied expense and fee levels and the fund may own different proportions of the underlying affiliated funds at different times, the amount of fees and expenses incurred indirectly by the fund will vary. |
| (i) | For the period from the class’s inception, July 2, 2012, through the stated period end. |
| (r) | Certain expenses have been reduced without which performance would have been lower. |
| (s) | From time to time the fund may receive proceeds from litigation settlements, without which performance would be lower. |
| (t) | Total returns do not include any applicable sales charges. |
| (x) | The net asset values per share and total returns have been calculated on net assets which include adjustments made in accordance with U.S. generally accepted accounting principles required at period end for financial reporting purposes. |
See Notes to Financial Statements
37
NOTES TO FINANCIAL STATEMENTS
(1) Business and Organization
MFS Diversified Income Fund (the fund) is a diversified series of MFS Series Trust XIII (the trust). The trust is organized as a Massachusetts business trust and is registered under the Investment Company Act of 1940, as amended, as an open-end management investment company.
(2) Significant Accounting Policies
General – The preparation of financial statements in conformity with U.S. generally accepted accounting principles requires management to make estimates and assumptions that affect the reported amounts of assets and liabilities, and disclosure of contingent assets and liabilities at the date of the financial statements and the reported amounts of increases and decreases in net assets from operations during the reporting period. Actual results could differ from those estimates. In the preparation of these financial statements, management has evaluated subsequent events occurring after the date of the fund’s Statement of Assets and Liabilities through the date that the financial statements were issued. The fund invests in the MFS High Yield Pooled Portfolio (“High Yield Pooled Portfolio”). The accounting policies of the High Yield Pooled Portfolio are outlined in its shareholder report, which is available without charge by calling 1-800-225-2606 and on the Securities and Exchange Commission (SEC) web site at http://www.sec.gov or at the SEC’s public reference room in Washington, D.C. The accounting policies detailed in the following paragraphs cover both the fund and the High Yield Pooled Portfolio. The High Yield Pooled Portfolio’s shareholder report is not covered by this report. The fund and the High Yield Pooled Portfolio invest in high-yield securities rated below investment grade. Investments in high-yield securities involve greater degrees of credit and market risk than investments in higher-rated securities and tend to be more sensitive to economic conditions.
In this reporting period, the fund adopted the disclosure provisions of the Financial Accounting Standards Board (FASB) Accounting Standards Update 2011-11 (“ASU 2011-11”), Balance Sheet (Topic 210) – Disclosures about Offsetting Assets and Liabilities along with the related scope clarification provisions of FASB Accounting Standards Update 2013-01 (“ASU 2013-01”) entitled Balance Sheet (Topic 210) – Clarifying the Scope of Disclosures about Offsetting Assets and Liabilities. ASU 2011-11 is intended to enhance disclosures on the offsetting of financial assets and liabilities by requiring entities to disclose both gross and net information about financial instruments and transactions that are either offset in the statement of financial position or subject to a an enforceable Master Netting Agreement or similar arrangement. ASU 2013-01 limits the scope of ASU 2011-11’s disclosure requirements on offsetting to financial assets and financial liabilities related to derivatives, repurchase and reverse repurchase agreements, and securities lending and securities borrowing transactions. The disclosures required by ASU 2011-11, to the extent applicable to the fund, have been included in the fund’s Significant Accounting Policies note under the captions for each of the fund’s in-scope financial instruments and transactions.
In June 2013, FASB issued Accounting Standards Update 2013-08 (“ASU 2013-08”) Financial Services – Investment Companies (Topic 946) – Amendments to the Scope, Measurement, and Disclosure Requirements which is effective for interim and annual
38
Notes to Financial Statements – continued
reporting periods in fiscal years that begin after December 15, 2013. ASU 2013-08 sets forth a methodology for determining whether an entity should be characterized as an investment company and prescribes fair value accounting for an investment company’s non-controlling ownership interest in another investment company. FASB has determined that a fund registered under the Investment Company Act of 1940 automatically meets ASU 2013-08’s criteria for an investment company. Although still evaluating the potential impacts of ASU 2013-08 to the fund, management expects that the impact of the fund’s adoption will be limited to additional financial statement disclosures.
Investment Valuations – The investments of the fund and the High Yield Pooled Portfolio are valued as described below. Equity securities, including restricted equity securities, are generally valued at the last sale or official closing price as provided by a third-party pricing service on the market or exchange on which they are primarily traded. Equity securities, for which there were no sales reported that day, are generally valued at the last quoted daily bid quotation as provided by a third-party pricing service on the market or exchange on which such securities are primarily traded. Debt instruments and floating rate loans (other than short-term instruments), including restricted debt instruments, are generally valued at an evaluated or composite bid as provided by a third-party pricing service. Short-term instruments with a maturity at issuance of 60 days or less generally are valued at amortized cost, which approximates market value. Exchange-traded options are generally valued at the last sale or official closing price as provided by a third-party pricing service on the exchange on which such options are primarily traded. Exchange-traded options for which there were no sales reported that day are generally valued at the last daily bid quotation as provided by a third-party pricing service on the exchange on which such options are primarily traded. Options not traded on an exchange are generally valued at a broker/dealer bid quotation. Foreign currency options are generally valued at valuations provided by a third-party pricing service. Forward foreign currency exchange contracts are generally valued at the mean of bid and asked prices for the time period interpolated from rates provided by a third-party pricing service for proximate time periods. Swap agreements are generally valued at valuations provided by a third-party pricing service, which for cleared swaps includes an evaluation of any trading activity at the clearinghouses. Open-end investment companies are generally valued at net asset value per share. Securities and other assets generally valued on the basis of information from a third-party pricing service may also be valued at a broker/dealer bid quotation. Values obtained from third-party pricing services can utilize both transaction data and market information such as yield, quality, coupon rate, maturity, type of issue, trading characteristics, and other market data. The values of foreign securities and other assets and liabilities expressed in foreign currencies are converted to U.S. dollars using the mean of bid and asked prices for rates provided by a third-party pricing service.
The Board of Trustees has delegated primary responsibility for determining or causing to be determined the value of the fund’s investments (including any fair valuation) to the adviser pursuant to valuation policies and procedures approved by the Board. If the adviser determines that reliable market quotations are not readily available, investments are valued at fair value as determined in good faith by the adviser in accordance with such procedures under the oversight of the Board of Trustees. Under the fund’s
39
Notes to Financial Statements – continued
valuation policies and procedures, market quotations are not considered to be readily available for most types of debt instruments and floating rate loans and many types of derivatives. These investments are generally valued at fair value based on information from third-party pricing services. In addition, investments may be valued at fair value if the adviser determines that an investment’s value has been materially affected by events occurring after the close of the exchange or market on which the investment is principally traded (such as foreign exchange or market) and prior to the determination of the fund’s net asset value, or after the halting of trading of a specific security where trading does not resume prior to the close of the exchange or market on which the security is principally traded. Events that occur on a frequent basis after foreign markets close (such as developments in foreign markets and significant movements in the U.S. markets) and prior to the determination of the fund’s net asset value may be deemed to have a material effect on the value of securities traded in foreign markets. Accordingly, the fund’s foreign equity securities may often be valued at fair value. The adviser generally relies on third-party pricing services or other information (such as the correlation with price movements of similar securities in the same or other markets; the type, cost and investment characteristics of the security; the business and financial condition of the issuer; and trading and other market data) to assist in determining whether to fair value and at what value to fair value an investment. The value of an investment for purposes of calculating the fund’s net asset value can differ depending on the source and method used to determine value. When fair valuation is used, the value of an investment used to determine the fund’s net asset value may differ from quoted or published prices for the same investment. There can be no assurance that the fund could obtain the fair value assigned to an investment if it were to sell the investment at the same time at which the fund determines its net asset value per share.
Various inputs are used in determining the value of the fund’s assets or liabilities. These inputs are categorized into three broad levels. In certain cases, the inputs used to measure fair value may fall into different levels of the fair value hierarchy. In such cases, an investment’s level within the fair value hierarchy is based on the lowest level of input that is significant to the fair value measurement. The fund’s assessment of the significance of a particular input to the fair value measurement in its entirety requires judgment, and considers factors specific to the investment. Level 1 includes unadjusted quoted prices in active markets for identical assets or liabilities. Level 2 includes other significant observable market-based inputs (including quoted prices for similar securities, interest rates, prepayment speed, and credit risk). Level 3 includes unobservable inputs, which may include the adviser’s own assumptions in determining the fair value of investments. Other financial instruments are derivative instruments not
40
Notes to Financial Statements – continued
reflected in total investments, such as swap agreements. The following is a summary of the levels used as of February 28, 2014 in valuing the fund’s assets or liabilities:
| | | | | | | | | | | | | | | | |
| Investments at Value | | Level 1 | | | Level 2 | | | Level 3 | | | Total | |
| Equity Securities: | | | | | | | | | | | | | | | | |
United States | | | $879,760,143 | | | | $820,400 | | | | $32,685 | | | | $880,613,228 | |
United Kingdom | | | 5,478,664 | | | | — | | | | — | | | | 5,478,664 | |
Austria | | | 3,408,904 | | | | — | | | | — | | | | 3,408,904 | |
| U.S. Treasury Bonds & U.S. Government Agency & Equivalents | | | — | | | | 149,348,091 | | | | — | | | | 149,348,091 | |
| Non-U.S. Sovereign Debt | | | — | | | | 198,141,550 | | | | — | | | | 198,141,550 | |
| U.S. Corporate Bonds | | | — | | | | 1,416,191 | | | | — | | | | 1,416,191 | |
| Residential Mortgage-Backed Securities | | | — | | | | 153,118,489 | | | | — | | | | 153,118,489 | |
| Commercial Mortgage-Backed Securities | | | — | | | | 6,035,995 | | | | — | | | | 6,035,995 | |
| Asset-Backed Securities (including CDOs) | | | — | | | | 7,707 | | | | — | | | | 7,707 | |
| Foreign Bonds | | | — | | | | 118,455,650 | | | | — | | | | 118,455,650 | |
| Mutual Funds | | | 600,166,465 | | | | — | | | | — | | | | 600,166,465 | |
| Total Investments | | | $1,488,814,176 | | | | $627,344,073 | | | | $32,685 | | | | $2,116,190,934 | |
| | | |
| Other Financial Instruments | | | | | | | | | | |
| Swap Agreements | | | $— | | | | $(616,841 | ) | | | $— | | | | $(616,841 | ) |
For further information regarding security characteristics, see the Portfolio of Investments.
The following is a reconciliation of level 3 assets for which significant unobservable inputs were used to determine fair value. The fund’s policy is to recognize transfers between the levels as of the end of the period. The table presents the activity of level 3 securities held at the beginning and the end of the period.
| | | | |
| | | Investments
in Securities | |
| Balance as of 2/28/13 | | | $35,091 | |
Change in unrealized appreciation (depreciation) | | | (2,406 | ) |
| Balance as of 2/28/14 | | | $32,685 | |
The net change in unrealized appreciation (depreciation) from investments still held as level 3 at February 28, 2014 is $(2,406).
Repurchase Agreements – The fund enters into repurchase agreements under the terms of Master Repurchase Agreements with approved counterparties. Each repurchase agreement is recorded at cost. The fund requires that the securities collateral in a repurchase transaction be transferred to a custodian. The fund monitors, on a daily basis, the value of the collateral to ensure that its value, including accrued interest, is greater than amounts owed to the fund under each such repurchase agreement. Upon an event of default under a Master Repurchase Agreement, the
41
Notes to Financial Statements – continued
non-defaulting party may close out all transactions traded under such agreement and net amounts owed under each transaction to one net amount payable by one party to the other. Absent an event of default, the Master Repurchase Agreement does not result in an offset of reported amounts of assets and liabilities in the Statement of Assets and Liabilities across transactions between the fund and the applicable counterparty.
Foreign Currency Translation – Purchases and sales of foreign investments, income, and expenses are converted into U.S. dollars based upon currency exchange rates prevailing on the respective dates of such transactions or on the reporting date for foreign denominated receivables and payables. Gains and losses attributable to foreign currency exchange rates on sales of securities are recorded for financial statement purposes as net realized gains and losses on investments. Gains and losses attributable to foreign exchange rate movements on receivables, payables, income and expenses are recorded for financial statement purposes as foreign currency transaction gains and losses. That portion of both realized and unrealized gains and losses on investments that results from fluctuations in foreign currency exchange rates is not separately disclosed.
Derivatives – The fund uses derivatives for different purposes, primarily to increase or decrease exposure to a particular market or segment of the market, or security, to increase or decrease interest rate or currency exposure, or as alternatives to direct investments. Derivatives are used for hedging or non-hedging purposes. While hedging can reduce or eliminate losses, it can also reduce or eliminate gains. When the fund uses derivatives as an investment to increase market exposure, or for hedging purposes, gains and losses from derivative instruments may be substantially greater than the derivative’s original cost.
The derivative instruments used by the fund were purchased options, forward foreign currency exchange contracts, and swap agreements. The fund’s period end derivatives, as presented in the Portfolio of Investments and the associated Derivative Contract tables, generally are indicative of the volume of its derivative activity during the period. The following table presents, by major type of derivative contract, the fair value, on a gross basis, of the asset and liability components of derivatives held by the fund at February 28, 2014 as reported in the Statement of Assets and Liabilities:
| | | | | | | | | | |
| | | | | Fair Value (a) | |
| Risk | | Derivative Contracts | | Asset Derivatives | | | Liability Derivatives | |
| Equity | | Purchased Equity Options | | | $820,400 | | | | $— | |
| Credit | | Credit Default Swaps | | | — | | | | (616,841 | ) |
| Total | | | | | $820,400 | | | $ | (616,841 | ) |
| (a) | The value of purchased options outstanding is included in total investments, at value, within the fund’s Statement of Assets and Liabilities. |
42
Notes to Financial Statements – continued
The following table presents, by major type of derivative contract, the realized gain (loss) on derivatives held by the fund for the year ended February 28, 2014 as reported in the Statement of Operations:
| | | | | | | | | | | | |
| Risk | | Swap
Agreements | | | Foreign
Currency | | | Investments
(Purchased
Options) | |
| Foreign Exchange | | | $— | | | | $25,018 | | | | $— | |
| Equity | | | — | | | | — | | | | (2,432,887 | ) |
| Credit | | | (855,445 | ) | | | — | | | | — | |
| Total | | | $(855,445 | ) | | | $25,018 | | | | $(2,432,887 | ) |
The following table presents, by major type of derivative contract, the change in unrealized appreciation (depreciation) on derivatives held by the fund for the year ended February 28, 2014 as reported in the Statement of Operations:
| | | | | | | | | | | | |
| Risk | | Swap
Agreements | | | Translation
of Assets and
Liabilities in
Foreign
Currencies | | | Investments
(Purchased
Options) | |
| Foreign Exchange | | | $— | | | | $(9,071 | ) | | | $— | |
| Equity | | | — | | | | — | | | | (700,063 | ) |
| Credit | | | 187,505 | | | | — | | | | — | |
| Total | | | $187,505 | | | | $(9,071 | ) | | | $(700,063 | ) |
Derivative counterparty credit risk is managed through formal evaluation of the creditworthiness of all potential counterparties. On certain, but not all, over-the-counter derivatives, the fund attempts to reduce its exposure to counterparty credit risk whenever possible by entering into an International Swaps and Derivatives Association (ISDA) Master Agreement on a bilateral basis with each of the counterparties with whom it undertakes a significant volume of transactions. The ISDA Master Agreement gives each party to the agreement the right to terminate all transactions traded under such agreement if there is a certain deterioration in the credit quality of the other party. Upon an event of default or a termination of the ISDA Master Agreement, the non-defaulting party has the right to close out all transactions traded under such agreement and to net amounts owed under each transaction to one net amount payable by one party to the other. This right to close out and net payments across all transactions traded under the ISDA Master Agreement could result in a reduction of the fund’s credit risk to such counterparty equal to any amounts payable by the fund under the applicable transactions, if any. The fund’s right to setoff may be restricted or prohibited by the bankruptcy or insolvency laws of the particular jurisdiction to which a specific ISDA counterparty is subject.
Collateral and margin requirements differ by type of derivative. Margin requirements are set by the broker or clearing house for cleared derivatives (i.e., futures contracts, cleared swaps, and exchange-traded options) while collateral terms are contract specific for over-the-counter traded derivatives (i.e., forward foreign currency exchange contracts, uncleared swap agreements, and over-the-counter options). For derivatives traded under an ISDA Master Agreement, the collateral requirements are netted across
43
Notes to Financial Statements – continued
all transactions traded under such agreement and one amount is posted from one party to the other to collateralize such obligations. Cash that has been segregated to cover the fund’s collateral or margin obligations under derivative contracts, if any, will be reported separately in the Statement of Assets and Liabilities as “Restricted cash” or “Deposits with brokers.” Securities pledged as collateral or margin for the same purpose, if any, are noted in the Portfolio of Investments.
The fund’s accounting policy with respect to balance sheet offsetting is that, absent an event of default by the counterparty or a termination of the agreement, the ISDA Master Agreement does not result in an offset of reported amounts of financial assets and financial liabilities in the Statement of Assets and Liabilities across transactions between the fund and the applicable counterparty.
Purchased Options – The fund purchased call and put options for a premium. Purchased call and put options entitle the holder to buy and sell a specified number of shares or units of a particular security, currency or index at a specified price at a specified date or within a specified period of time. Purchasing call options may hedge against an anticipated increase in the dollar cost of securities or currency to be acquired or increase the fund’s exposure to an underlying instrument. Purchasing put options may hedge against an anticipated decline in the value of portfolio securities or currency or decrease the fund’s exposure to an underlying instrument.
The premium paid is initially recorded as an investment in the Statement of Assets and Liabilities. That investment is subsequently marked-to-market daily with the difference between the premium paid and the market value of the purchased option being recorded as unrealized appreciation or depreciation. Premiums paid for purchased call and put options which have expired are treated as realized losses on investments in the Statement of Operations. Upon the exercise or closing of a purchased call option, the premium paid is added to the cost of the security or financial instrument purchased. Upon the exercise or closing of a purchased put option, the premium paid is offset against the proceeds on the sale of the underlying security or financial instrument in order to determine the realized gain or loss on investments.
Whether or not the option is exercised, the fund’s maximum risk of loss from purchasing an option is the amount of premium paid. All option contracts involve credit risk if the counterparty to the option contract fails to perform. For over-the-counter options, this risk is mitigated in cases where there is an ISDA Master Agreement between the fund and the counterparty providing for netting as described above and for posting of collateral by the counterparty to the fund to cover the fund’s exposure to the counterparty under such ISDA Master Agreement.
Forward Foreign Currency Exchange Contracts – The fund entered into forward foreign currency exchange contracts for the purchase or sale of a specific foreign currency at a fixed price on a future date. These contracts may be used to hedge the fund’s currency risk or for non-hedging purposes. For hedging purposes, the fund may enter into contracts to deliver or receive foreign currency that the fund will receive from or use in its normal investment activities. The fund may also use contracts to hedge against declines in the value of foreign currency denominated securities due to unfavorable exchange rate movements. For non-hedging purposes, the fund may enter
44
Notes to Financial Statements – continued
into contracts with the intent of changing the relative exposure of the fund’s portfolio of securities to different currencies to take advantage of anticipated exchange rate changes.
Forward foreign currency exchange contracts are adjusted by the daily exchange rate of the underlying currency and any unrealized gains or losses are recorded as a receivable or payable for forward foreign currency exchange contracts until the contract settlement date. On contract settlement date, any gain or loss on the contract is recorded as realized gains or losses on foreign currency.
Risks may arise upon entering into these contracts from unanticipated movements in the value of the contract and from the potential inability of counterparties to meet the terms of their contracts. Generally, the fund’s maximum risk due to counterparty credit risk is the unrealized gain on the contract due to the use of Continuous Linked Settlement, an industry accepted settlement system. This risk is mitigated in cases where there is an ISDA Master Agreement between the fund and the counterparty providing for netting as described above and for posting of collateral by the counterparty to the fund to cover the fund’s exposure to the counterparty under such ISDA Master Agreement.
Swap Agreements – During the period the fund entered into swap agreements. Effective June 10, 2013, certain types of swaps (“cleared swaps”) are required to be centrally cleared under provisions of the Dodd-Frank Regulatory Reform Bill. In a cleared swap transaction, the swap agreement is novated to a central counterparty (the “clearinghouse”) immediately following execution of the swap contract with an executing broker. Thereafter, throughout the term of the cleared swap, the fund interfaces indirectly with the clearinghouse through a clearing broker.
A swap agreement is generally an exchange of cash payments, at specified intervals or upon the occurrence of specified events, between the fund and a counterparty. The net cash payments exchanged are recorded as a realized gain or loss on swap agreements in the Statement of Operations. The value of the swap agreement, which is adjusted daily and includes any related interest accruals to be paid or received by the fund, is recorded in the Statement of Assets and Liabilities, as “Swaps, at value” for uncleared swaps and is included in “Due from brokers” or “Due to brokers” for cleared swaps. The daily change in value, including any related interest accruals to be paid or received, is recorded as unrealized appreciation or depreciation on swap agreements in the Statement of Operations. The daily change in valuation of centrally cleared swaps is recorded as a receivable or payable for variation margin in the Statement of Assets and Liabilities. Amounts paid or received at the inception of the swap agreement are reflected as premiums paid or received in the Statement of Assets and Liabilities and are amortized using the effective interest method over the term of the agreement. A liquidation payment received or made upon early termination is recorded as a realized gain or loss on swap agreements in the Statement of Operations.
Risks related to swap agreements include the possible lack of a liquid market, unfavorable market and interest rate movements of the underlying instrument and the failure of the counterparty to perform under the terms of the agreements. To address counterparty risk, swap agreements are limited to only highly-rated counterparties. For uncleared swaps, that risk is further reduced by having an ISDA Master Agreement
45
Notes to Financial Statements – continued
between the fund and the counterparty providing for netting as described above and by the posting of collateral by the counterparty to the fund to cover the fund’s exposure to the counterparty under such ISDA Master Agreement. Although not covered by an ISDA Master Agreement, the fund’s counterparty risk due to cleared swaps is mitigated by the clearinghouses’ margining requirements and financial safeguards in the event of a clearing broker default.
The fund entered into credit default swap agreements in order to manage its exposure to the market or certain sectors of the market, to reduce its credit risk exposure to defaults of corporate and sovereign issuers or to create exposure to corporate or sovereign issuers to which it is not otherwise exposed. In a credit default swap agreement, the protection buyer can make an upfront payment and will make a stream of payments to the protection seller based on a fixed percentage applied to the agreement notional amount in exchange for the right to receive a specified return upon the occurrence of a defined credit event on the reference obligation (which may be either a single security or a basket of securities issued by corporate or sovereign issuers) and, with respect to the rare cases where physical settlement applies, the delivery by the buyer to the seller of a defined deliverable obligation. Although agreement-specific, credit events generally consist of a combination of the following: bankruptcy, failure to pay, restructuring, obligation acceleration, obligation default, or repudiation/moratorium, each as defined in the 2003 ISDA Credit Derivatives Definitions as amended by the relevant agreement. Restructuring is generally not applicable when the reference obligation is issued by a North American corporation and obligation acceleration, obligation default, or repudiation/moratorium are generally only applicable when the reference obligation is issued by a sovereign entity or an entity in an emerging country. Upon determination of the final price for the deliverable obligation (or upon delivery of the deliverable obligation in the case of physical settlement), the difference between the value of the deliverable obligation and the swap agreement’s notional amount is recorded as realized gain or loss on swap agreements in the Statement of Operations.
Credit default swap agreements are considered to have credit-risk-related contingent features since they trigger payment by the protection seller to the protection buyer upon the occurrence of a defined credit event. The aggregate fair value of credit default swap agreements in a net liability position as of February 28, 2014 is disclosed in the footnotes to the Portfolio of Investments. The maximum amount of future, undiscounted payments that the fund, as protection seller, could be required to make is equal to the swap agreement’s notional amount. The protection seller’s payment obligation would be offset to the extent of the value of the agreement’s deliverable obligation. If a defined credit event had occurred as of February 28, 2014, the swap agreement’s credit-risk-related contingent features would have been triggered and, for those swap agreements in a net liability position for which the fund is the protection seller, the fund in order to settle these swap agreements would have been required to either (1) pay the swap agreement’s notional value of $6,148,000 less the value of the agreements’ related deliverable obligations as decided through an ISDA auction or (2) pay the notional value of the swap agreements in return for physical receipt of the deliverable obligations.
46
Notes to Financial Statements – continued
The fund’s maximum risk of loss from counterparty risk, either as the protection seller or as the protection buyer, is the fair value of the agreement. For uncleared swaps, counterparty risk is reduced by having an ISDA Master Agreement between the fund and the counterparty providing for netting as described above and by the posting of collateral by the counterparty to the fund to cover the fund’s exposure to the counterparty under such ISDA Master Agreement. For cleared swaps, the fund’s counterparty risk is mitigated by the clearinghouses’ margining requirements and financial safeguards in the event of a clearing broker default.
Security Loans – Under its Securities Lending Agency Agreement with the fund, JPMorgan Chase and Co. (“Chase”), as lending agent, loans the securities of the fund to certain qualified institutions (the “Borrowers”) approved by the fund. The loans are collateralized by cash and/or U.S. Treasury and federal agency obligations in an amount typically at least equal to the market value of the securities loaned. The market value of the loaned securities is determined at the close of business of the fund and any additional required collateral is delivered to the fund on the next business day. Chase provides the fund with indemnification against Borrower default. In the event of Borrower default, Chase will for the benefit of the fund either purchase securities identical to those loaned or, when such purchase is commercially impracticable, pay the fund the market value of the loaned securities. In return, Chase assumes the fund’s rights to the related collateral. If the collateral value is less than the cost to purchase identical securities, Chase is responsible for the shortfall, but only to the extent that such shortfall is not due to a decline in collateral value resulting from collateral reinvestment for which the fund bears the risk of loss. On loans collateralized by cash, the cash collateral is invested in repurchase agreements with approved counterparties. A portion of the income generated upon investment of the collateral is remitted to the Borrowers, and the remainder is allocated between the fund and the lending agent. On loans collateralized by U.S. Treasury and/or federal agency obligations, a fee is received from the Borrower, and is allocated between the fund and the lending agent. Income from securities lending is included in “Interest” income in the Statement of Operations. The dividend and interest income earned on the securities loaned is accounted for in the same manner as other dividend and interest income. At February 28, 2014, there were no securities on loan or collateral outstanding.
Loans and Other Direct Debt Instruments – The fund invests in loans and loan participations or other receivables. These investments may include standby financing commitments, including revolving credit facilities, which obligate the fund to supply additional cash to the borrower on demand. Loan participations involve a risk of insolvency of the lending bank or other financial intermediary.
Indemnifications – Under the fund’s organizational documents, its officers and Trustees may be indemnified against certain liabilities and expenses arising out of the performance of their duties to the fund. Additionally, in the normal course of business, the fund enters into agreements with service providers that may contain indemnification clauses. The fund’s maximum exposure under these agreements is unknown as this would involve future claims that may be made against the fund that have not yet occurred.
Investment Transactions and Income – Investment transactions are recorded on the trade date. Interest income is recorded on the accrual basis. All premium and discount
47
Notes to Financial Statements – continued
is amortized or accreted for financial statement purposes in accordance with U.S. generally accepted accounting principles. The fund earns certain fees in connection with its floating rate loan purchasing activities. These fees are in addition to interest payments earned and may include amendment fees, commitment fees, facility fees, consent fees, and prepayment fees. Commitment fees are recorded on an accrual basis as income in the accompanying financial statements. Dividends received in cash are recorded on the ex-dividend date. Certain dividends from foreign securities will be recorded when the fund is informed of the dividend if such information is obtained subsequent to the ex-dividend date. Dividend and interest payments received in additional securities are recorded on the ex-dividend or ex-interest date in an amount equal to the value of the security on such date.
The fund may receive proceeds from litigation settlements. Any proceeds received from litigation involving portfolio holdings are reflected in the Statement of Operations in realized gain/loss if the security has been disposed of by the fund or in unrealized gain/loss if the security is still held by the fund. Any other proceeds from litigation not related to portfolio holdings are reflected as other income in the Statement of Operations.
The fund purchased or sold debt securities on a when-issued or delayed delivery basis, or in a “To Be Announced” (TBA) or “forward commitment” transaction with delivery or payment to occur at a later date beyond the normal settlement period. TBA securities resulting from these transactions are included in the Portfolio of Investments. At the time a fund enters into a commitment to purchase or sell a security, the transaction is recorded and the value of the security acquired is reflected in the fund’s net asset value. The price of such security and the date that the security will be delivered and paid for are fixed at the time the transaction is negotiated. The value of the security may vary with market fluctuations. TBA purchase commitments and TBA sale commitments are held at carrying amount, which approximates fair value and are categorized as level 2 within the fair value hierarchy. No interest accrues to the fund until payment takes place. At the time that a fund enters into this type of transaction, the fund is required to have sufficient cash and/or liquid securities to cover its commitments. Losses may arise due to changes in the value of the underlying securities or if the counterparty does not perform under the contract’s terms, or if the issuer does not issue the securities due to political, economic or other factors. Additionally, losses may arise due to declines in the value of the securities prior to settlement date.
Fees Paid Indirectly – The fund’s custody fee may be reduced according to an arrangement that measures the value of cash deposited with the custodian by the fund. This amount, for the year ended February 28, 2014, is shown as a reduction of total expenses in the Statement of Operations.
Tax Matters and Distributions – The fund intends to qualify as a regulated investment company, as defined under Subchapter M of the Internal Revenue Code, and to distribute all of its taxable and income, including realized capital gains. As a result, no provision for federal income tax is required. The fund’s federal tax returns, when filed, will remain subject to examination by the Internal Revenue Service for a three year period. Management has analyzed the fund’s tax positions taken on federal and state tax returns for all open tax years and does not believe that there are any uncertain tax positions that require recognition of a tax liability. Foreign taxes, if any,
48
Notes to Financial Statements – continued
have been accrued by the fund in the accompanying financial statements in accordance with the applicable foreign tax law. Foreign income taxes may be withheld by certain countries in which the fund invests. Additionally, capital gains realized by the fund on securities issued in or by certain foreign countries may be subject to capital gains tax imposed by those countries.
Distributions to shareholders are recorded on the ex-dividend date. Income and capital gain distributions are determined in accordance with income tax regulations, which may differ from U.S. generally accepted accounting principles. Certain capital accounts in the financial statements are periodically adjusted for permanent differences in order to reflect their tax character. These adjustments have no impact on net assets or net asset value per share. Temporary differences which arise from recognizing certain items of income, expense, gain or loss in different periods for financial statement and tax purposes will reverse at some time in the future. Distributions in excess of net investment income or net realized gains are temporary overdistributions for financial statement purposes resulting from differences in the recognition or classification of income or distributions for financial statement and tax purposes.
Book/tax differences primarily relate to amortization and accretion of debt securities, wash sale loss deferrals, derivative transactions and treating a portion of the proceeds from redemptions as a distribution for tax purposes.
The tax character of distributions declared to shareholders for the last two fiscal years is as follows:
| | | | | | | | |
| | | 2/28/14 | | | 2/28/13 | |
| Ordinary income (including any short-term capital gains) | | | $58,438,112 | | | | $34,119,558 | |
| Long-term capital gains | | | 20,954,439 | | | | 1,043,035 | |
| Total distributions | | | $79,392,551 | | | | $35,162,593 | |
The federal tax cost and the tax basis components of distributable earnings were as follows:
| | | | |
| As of 2/28/14 | | | |
| Cost of investments | | | $1,982,910,458 | |
| Gross appreciation | | | 151,667,479 | |
| Gross depreciation | | | (18,387,003 | ) |
| Net unrealized appreciation (depreciation) | | | $133,280,476 | |
| Undistributed ordinary income | | | 4,508,200 | |
| Undistributed long-term capital gain | | | 13,701,583 | |
| Other temporary differences | | | (3,202,094 | ) |
Multiple Classes of Shares of Beneficial Interest – The fund offers multiple classes of shares, which differ in their respective distribution and service fees. The fund’s income and common expenses are allocated to shareholders based on the value of settled shares outstanding of each class. The fund’s realized and unrealized gain (loss) are allocated to shareholders based on the daily net assets of each class. Dividends are declared separately for each class. Differences in per share dividend rates are generally
49
Notes to Financial Statements – continued
due to differences in separate class expenses. The fund’s distributions declared to shareholders as reported in the Statements of Changes in Net Assets are presented by class as follows:
| | | | | | | | | | | | | | | | |
| | | From net investment
income | | | From net realized gain on
investments | |
| | | Year
ended
2/28/14 | | | Year
ended
2/28/13 (i) | | | Year
ended
2/28/14 | | | Year
ended
2/28/13 (i) | |
| Class A | | | $27,978,308 | | | | $19,218,114 | | | | $14,415,631 | | | | $541,503 | |
| Class C | | | 12,134,907 | | | | 8,439,963 | | | | 8,489,323 | | | | 319,214 | |
| Class I | | | 10,823,265 | | | | 6,376,885 | | | | 5,134,206 | | | | 179,492 | |
| Class R1 | | | 12,769 | | | | 4,540 | | | | 9,858 | | | | 123 | |
| Class R2 | | | 23,176 | | | | 13,081 | | | | 13,230 | | | | 562 | |
| Class R3 | | | 113,059 | | | | 27,427 | | | | 65,729 | | | | 1,315 | |
| Class R4 | | | 62,237 | | | | 26,771 | | | | 32,879 | | | | 743 | |
| Class R5 | | | 57,218 | | | | 12,777 | | | | 26,756 | | | | 83 | |
| Total | | | $51,204,939 | | | | $34,119,558 | | | | $28,187,612 | | | | $1,043,035 | |
| (i) | For Class R5, the period is from inception, July 2, 2012, through the stated period end. |
(3) Transactions with Affiliates
Investment Adviser – The fund has an investment advisory agreement with MFS to provide overall investment management and related administrative services and facilities to the fund.
The management fee is computed daily and paid monthly at an annual rate of 0.65% of the fund’s average daily net assets. Effective August 1, 2013, the investment adviser has agreed in writing to reduce its management fee to 0.60% of average daily net assets in excess of $1.5 billion up to $2.5 billion, and 0.55% of average daily net assets in excess of $2.5 billion. This written agreement will continue until modified by the fund’s Board of Trustees, but such agreement will continue at least until June 30, 2015. For the period August 1, 2013 through February 28, 2014, this management fee reduction amounted to $139,952, which is included in the reduction of total expenses in the Statement of Operations. Effective April 1, 2013, MFS has agreed in writing to reduce its management fee by a specified amount if certain MFS mutual fund assets exceed thresholds agreed to by MFS and the fund’s Board of Trustees. For the period April 1, 2013 through February 28, 2014, this management fee reduction amounted to $26,513, which is included in the reduction of total expenses in the Statement of Operations. The management fee incurred for the year ended February 28, 2014 was equivalent to an annual effective rate of 0.64% of the fund’s average daily net assets.
The investment adviser has agreed in writing to pay a portion of the fund’s total annual operating expenses, exclusive of interest, taxes, extraordinary expenses, brokerage and transaction costs, and investment-related expenses (such as fees and expenses associated with investments in investment companies and other similar investment vehicles), such that total fund operating expenses do not exceed the following rates annually of each class’s average daily net assets:
| | | | | | | | | | | | | | | | | | | | | | | | | | | | | | |
| Class A | | | Class C | | | Class I | | | Class R1 | | | Class R2 | | | Class R3 | | | Class R4 | | | Class R5 | |
| | 1.10% | | | | 1.85 | % | | | 0.85 | % | | | 1.85 | % | | | 1.35 | % | | | 1.10 | % | | | 0.85 | % | | | 0.79 | % |
50
Notes to Financial Statements – continued
This written agreement will continue until modified by the fund’s Board of Trustees, but such agreement will continue at least until June 30, 2015. For the year ended February 28, 2014, the fund’s actual operating expenses did not exceed the limit and therefore, the investment adviser did not pay any portion of the fund’s expenses related to this agreement.
Distributor – MFS Fund Distributors, Inc. (MFD), a wholly-owned subsidiary of MFS, as distributor, received $1,246,144 for the year ended February 28, 2014, as its portion of the initial sales charge on sales of Class A shares of the fund.
The Board of Trustees has adopted a distribution plan for certain class shares pursuant to Rule 12b-1 of the Investment Company Act of 1940.
The fund’s distribution plan provides that the fund will pay MFD for services provided by MFD and financial intermediaries in connection with the distribution and servicing of certain share classes. One component of the plan is a distribution fee paid to MFD and another component of the plan is a service fee paid to MFD. MFD may subsequently pay all, or a portion, of the distribution and/or service fees to financial intermediaries.
Distribution Plan Fee Table:
| | | | | | | | | | | | | | | | | | | | |
| | | Distribution
Fee Rate (d) | | | Service
Fee Rate (d) | | | Total
Distribution
Plan (d) | | | Annual
Effective
Rate (e) | | | Distribution
and Service
Fee | |
| Class A | | | — | | | | 0.25% | | | | 0.25% | | | | 0.25% | | | | $2,420,385 | |
| Class C | | | 0.75% | | | | 0.25% | | | | 1.00% | | | | 1.00% | | | | 5,674,203 | |
| Class R1 | | | 0.75% | | | | 0.25% | | | | 1.00% | | | | 1.00% | | | | 5,945 | |
| Class R2 | | | 0.25% | | | | 0.25% | | | | 0.50% | | | | 0.50% | | | | 4,378 | |
| Class R3 | | | — | | | | 0.25% | | | | 0.25% | | | | 0.25% | | | | 9,726 | |
| Total Distribution and Service Fees | | | | $8,114,637 | |
| (d) | In accordance with the distribution plan for certain classes, the fund pays distribution and/or service fees equal to these annual percentage rates of each class’s average daily net assets. The distribution and service fee rates disclosed by class represent the current rates in effect at the end of the reporting period. Any rate changes, if applicable, are detailed below. |
| (e) | The annual effective rates represent actual fees incurred under the distribution plan for the year ended February 28, 2014, based on each class’s average daily net assets. MFD has voluntarily agreed to rebate a portion of each class’s 0.25% service fee attributable to accounts for which MFD retains the 0.25% service fee except for accounts attributable to MFS or its affiliates’ seed money. For the year ended February 28, 2014, this rebate amounted to $4,397 and $163 for Class A and Class C, respectively, and is included in the reduction of total expenses in the Statement of Operations. |
Certain Class A shares are subject to a contingent deferred sales charge (CDSC) in the event of a shareholder redemption within 18 months of purchase for shares purchased on or after August 1, 2012, and within 24 months of purchase for shares purchased prior to August 1, 2012. Class C shares are subject to a CDSC in the event of a shareholder redemption within 12 months of purchase. All contingent deferred sales charges are paid to MFD and during the year ended February 28, 2014, were as follows:
| | | | |
| | | Amount | |
| Class A | | | $39,167 | |
| Class C | | | 119,821 | |
51
Notes to Financial Statements – continued
Shareholder Servicing Agent – MFS Service Center, Inc. (MFSC), a wholly-owned subsidiary of MFS, receives a fee from the fund for its services as shareholder servicing agent calculated as a percentage of the average daily net assets of the fund as determined periodically under the supervision of the fund’s Board of Trustees. For the year ended February 28, 2014, the fee was $190,645, which equated to 0.0101% annually of the fund’s average daily net assets. MFSC also receives payment from the fund for out-of-pocket expenses, sub-accounting and other shareholder servicing costs which may be paid to affiliated and unaffiliated service providers. Class R5 shares do not incur sub-accounting fees. For the year ended February 28, 2014, these out-of-pocket expenses, sub-accounting and other shareholder servicing costs amounted to $1,902,478.
Administrator – MFS provides certain financial, legal, shareholder communications, compliance, and other administrative services to the fund. Under an administrative services agreement, the fund partially reimburses MFS the costs incurred to provide these services. The fund is charged an annual fixed amount of $17,500 plus a fee based on average daily net assets. The administrative services fee incurred for the year ended February 28, 2014 was equivalent to an annual effective rate of 0.0126% of the fund’s average daily net assets.
Trustees’ and Officers’ Compensation – The fund pays compensation to independent Trustees in the form of a retainer, attendance fees, and additional compensation to Board and Committee chairpersons. The fund does not pay compensation directly to Trustees or officers of the fund who are also officers of the investment adviser, all of whom receive remuneration for their services to the fund from MFS. Certain officers and Trustees of the fund are officers or directors of MFS, MFD, and MFSC.
Other – This fund and certain other funds managed by MFS (the funds) have entered into services agreements (the Agreements) which provide for payment of fees by the funds to Tarantino LLC and Griffin Compliance LLC in return for the provision of services of an Independent Chief Compliance Officer (ICCO) and Assistant ICCO, respectively, for the funds. The ICCO and Assistant ICCO are officers of the funds and the sole members of Tarantino LLC and Griffin Compliance LLC, respectively. The funds can terminate the Agreements with Tarantino LLC and Griffin Compliance LLC at any time under the terms of the Agreements. For the year ended February 28, 2014, the aggregate fees paid by the fund to Tarantino LLC and Griffin Compliance LLC were $11,022 and are included in “Miscellaneous” expense in the Statement of Operations. MFS has agreed to reimburse the fund for a portion of the payments made by the fund in the amount of $4,080, which is included in the reduction of total expenses in the Statement of Operations. Additionally, MFS has agreed to bear all expenses associated with office space, other administrative support, and supplies provided to the ICCO and Assistant ICCO.
The fund invests in the MFS Institutional Money Market Portfolio which is managed by MFS and seeks current income consistent with preservation of capital and liquidity. Income earned on this investment is included in “Dividends from underlying affiliated funds” in the Statement of Operations. This money market fund does not pay a management fee to MFS.
52
Notes to Financial Statements – continued
The fund invests in the High Yield Pooled Portfolio. The High Yield Pooled Portfolio is a mutual fund advised by MFS that does not pay management fees to MFS but does incur investment and operating costs. The High Yield Pooled Portfolio is designed to be used by MFS funds to invest in a particular security type rather than invest in the security type directly. The fund invests in the High Yield Pooled Portfolio to gain exposure to high income debt instruments, rather than investing in high income debt instruments directly.
At close of business on March 22, 2013, the fund and certain other MFS funds transferred high income debt instruments, accrued interest and cash to the High Yield Pooled Portfolio, a series of MFS Series Trust III, in exchange for shares of the High Yield Pooled Portfolio. The purpose of the transaction was to pool the portion of the assets of the fund and certain other MFS funds invested in high income debt instruments in the High Yield Pooled Portfolio. The transfer was accomplished by a tax-free exchange by the fund of investments valued at approximately $330,270,781 with a cost basis of approximately $336,367,600, accrued interest of approximately $6,096,819 and cash of approximately $17,836,705 for approximately 35,420,430 shares of the High Yield Pooled Portfolio (valued at approximately $354,204,304). For financial reporting purposes, investments transferred and shares received by the fund were recorded at fair value; however, the cost basis of the investments delivered to the High Yield Pooled Portfolio was carried forward to the shares received. Income earned on this investment is included in “Dividends from underlying affiliated funds” in the Statement of Operations. The High Yield Pooled Portfolio does not pay a management fee, distribution and/or service fee, or sales charge.
On September 11, 2013, MFS redeemed 12,603 shares of Class R3 and 12,758 shares of Class R4 for an aggregate amount of $296,977.
(4) Portfolio Securities
Purchases and sales of investments, other than purchased option transactions, and short-term obligations, were as follows:
| | | | | | | | |
| | | Purchases | | | Sales | |
| U.S. Government securities | | | $629,378,536 | | | | $571,301,145 | |
| Investments (non-U.S. Government securities) | | | $974,521,888 | | | | $575,401,584 | |
53
Notes to Financial Statements – continued
(5) Shares of Beneficial Interest
The fund’s Declaration of Trust permits the Trustees to issue an unlimited number of full and fractional shares of beneficial interest. Transactions in fund shares were as follows:
| | | | | | | | | | | | | | | | |
| | | Year ended
2/28/14 | | | Year ended
2/28/13 (i) | |
| | | Shares | | | Amount | | | Shares | | | Amount | |
| Shares sold | | | | | | | | | | | | | | | | |
Class A | | | 37,587,136 | | | | $450,027,361 | | | | 39,010,733 | | | | $445,021,889 | |
Class C | | | 18,996,227 | | | | 227,450,288 | | | | 20,912,199 | | | | 238,437,602 | |
Class I | | | 18,322,679 | | | | 219,645,574 | | | | 18,750,518 | | | | 214,021,509 | |
Class R1 | | | 32,155 | | | | 384,614 | | | | 18,494 | | | | 215,264 | |
Class R2 | | | 54,627 | | | | 653,110 | | | | 49,668 | | | | 564,782 | |
Class R3 | | | 281,740 | | | | 3,362,171 | | | | 256,335 | | | | 2,952,073 | |
Class R4 | | | 265,541 | | | | 3,183,122 | | | | 76,267 | | | | 861,319 | |
Class R5 | | | 57,178 | | | | 681,829 | | | | 167,077 | | | | 1,921,929 | |
| | | 75,597,283 | | | | $905,388,069 | | | | 79,241,291 | | | | $903,996,367 | |
| | | |
Shares issued to shareholders in
reinvestment of distributions | | | | | | | | | | | | | |
Class A | | | 3,369,159 | | | | $40,255,619 | | | | 1,563,324 | | | | $17,887,514 | |
Class C | | | 1,350,335 | | | | 16,127,467 | | | | 563,309 | | | | 6,443,965 | |
Class I | | | 868,527 | | | | 10,377,666 | | | | 357,156 | | | | 4,093,307 | |
Class R1 | | | 1,895 | | | | 22,615 | | | | 407 | | | | 4,663 | |
Class R2 | | | 3,047 | | | | 36,405 | | | | 1,189 | | | | 13,643 | |
Class R3 | | | 14,959 | | | | 178,768 | | | | 2,469 | | | | 28,633 | |
Class R4 | | | 7,955 | | | | 95,113 | | | | 2,335 | | | | 26,783 | |
Class R5 | | | 7,027 | | | | 83,974 | | | | 1,097 | | | | 12,854 | |
| | | 5,622,904 | | | | $67,177,627 | | | | 2,491,286 | | | | $28,511,362 | |
| | | | |
| Shares reacquired | | | | | | | | | | | | | | | | |
Class A | | | (20,653,238 | ) | | | $(246,624,589 | ) | | | (13,592,609 | ) | | | $(154,248,250 | ) |
Class C | | | (8,125,518 | ) | | | (97,027,988 | ) | | | (3,590,428 | ) | | | (40,947,374 | ) |
Class I | | | (12,505,530 | ) | | | (149,098,458 | ) | | | (4,105,545 | ) | | | (46,987,667 | ) |
Class R1 | | | (2,230 | ) | | | (26,678 | ) | | | (2 | ) | | | (26 | ) |
Class R2 | | | (20,401 | ) | | | (243,948 | ) | | | (10,691 | ) | | | (123,251 | ) |
Class R3 | | | (101,664 | ) | | | (1,210,384 | ) | | | (40,264 | ) | | | (465,152 | ) |
Class R4 | | | (139,511 | ) | | | (1,669,858 | ) | | | (29,968 | ) | | | (335,648 | ) |
Class R5 | | | (9,961 | ) | | | (120,434 | ) | | | (50,373 | ) | | | (592,076 | ) |
| | | (41,558,053 | ) | | | $(496,022,337 | ) | | | (21,419,880 | ) | | | $(243,699,444 | ) |
54
Notes to Financial Statements – continued
| | | | | | | | | | | | | | | | |
| | | Year ended
2/28/14 | | | Year ended
2/28/13 (i) | |
| | | Shares | | | Amount | | | Shares | | | Amount | |
| Net change | | | | | | | | | | | | | | | | |
Class A | | | 20,303,057 | | | | $243,658,391 | | | | 26,981,448 | | | | $308,661,153 | |
Class C | | | 12,221,044 | | | | 146,549,767 | | | | 17,885,080 | | | | 203,934,193 | |
Class I | | | 6,685,676 | | | | 80,924,782 | | | | 15,002,129 | | | | 171,127,149 | |
Class R1 | | | 31,820 | | | | 380,551 | | | | 18,899 | | | | 219,901 | |
Class R2 | | | 37,273 | | | | 445,567 | | | | 40,166 | | | | 455,174 | |
Class R3 | | | 195,035 | | | | 2,330,555 | | | | 218,540 | | | | 2,515,554 | |
Class R4 | | | 133,985 | | | | 1,608,377 | | | | 48,634 | | | | 552,454 | |
Class R5 | | | 54,244 | | | | 645,369 | | | | 117,801 | | | | 1,342,707 | |
| | | 39,662,134 | | | | $476,543,359 | | | | 60,312,697 | | | | $688,808,285 | |
| (i) | For Class R5, the period is from inception, July 2, 2012, through the stated period end. |
(6) Line of Credit
The fund and certain other funds managed by MFS participate in a $1.1 billion unsecured committed line of credit, subject to a $1 billion sublimit, provided by a syndication of banks under a credit agreement. Borrowings may be made for temporary financing needs. Interest is charged to each fund, based on its borrowings, generally at a rate equal to the higher of the Federal Reserve funds rate or one month LIBOR plus an agreed upon spread. A commitment fee, based on the average daily, unused portion of the committed line of credit, is allocated among the participating funds at the end of each calendar quarter. In addition, the fund and other funds managed by MFS have established unsecured uncommitted borrowing arrangements with certain banks for temporary financing needs. Interest is charged to each fund, based on its borrowings, at a rate equal to the Federal Reserve funds rate plus an agreed upon spread. For the year ended February 28, 2014, the fund’s commitment fee and interest expense were $8,350 and $0, respectively, and are included in “Miscellaneous” expense in the Statement of Operations.
(7) Transactions in Underlying Affiliated Funds-Affiliated Issuers
An affiliated issuer may be considered one in which the fund owns 5% or more of the outstanding voting securities, or a company which is under common control. For the purposes of this report, the fund assumes the following to be affiliated issuers:
| | | | | | | | | | | | | | | | |
| Underlying Affiliated Funds | | Beginning
Shares/Par
Amount | | | Acquisitions
Shares/Par
Amount | | | Dispositions
Shares/Par
Amount | | | Ending
Shares/Par
Amount | |
| MFS High Yield Pooled Portfolio | | | — | | | | 54,788,347 | | | | (4,612,425 | ) | | | 50,175,922 | |
MFS Institutional Money
Market Portfolio | | | 154,459,260 | | | | 453,224,650 | | | | (508,273,145 | ) | | | 99,410,765 | |
| | | | |
| Underlying Affiliated Funds | | Realized
Gain (Loss) | | | Capital Gain
Distributions | | | Dividend
Income | | | Ending
Value | |
| MFS High Yield Pooled Portfolio | | | $(2,094,502 | ) | | | $3,614,409 | | | | $30,089,151 | | | | $500,755,700 | |
MFS Institutional Money
Market Portfolio | | | — | | | | — | | | | 116,901 | | | | 99,410,765 | |
| | | | | | | | | | | | | | | | |
| | | $(2,094,502 | ) | | | $3,614,409 | | | | $30,206,052 | | | | $600,166,465 | |
| | | | | | | | | | | | | | | | |
55
REPORT OF INDEPENDENT REGISTERED PUBLIC ACCOUNTING FIRM
To the Trustees and Shareholders of
MFS Diversified Income Fund:
We have audited the accompanying statement of assets and liabilities of MFS Diversified Income Fund (the Fund), including the portfolio of investments, as of February 28, 2014, and the related statement of operations for the year then ended, the statements of changes in net assets for each of the two years in the period then ended, and the financial highlights for each of the periods indicated therein. These financial statements and financial highlights are the responsibility of the Fund’s management. Our responsibility is to express an opinion on these financial statements and financial highlights based on our audits.
We conducted our audits in accordance with the standards of the Public Company Accounting Oversight Board (United States). Those standards require that we plan and perform the audit to obtain reasonable assurance about whether the financial statements and financial highlights are free of material misstatement. We were not engaged to perform an audit of the Fund’s internal control over financial reporting. Our audits included consideration of internal control over financial reporting as a basis for designing audit procedures that are appropriate in the circumstances, but not for the purpose of expressing an opinion on the effectiveness of the Fund’s internal control over financial reporting. Accordingly, we express no such opinion. An audit also includes examining, on a test basis, evidence supporting the amounts and disclosures in the financial statements and financial highlights, assessing the accounting principles used and significant estimates made by management, and evaluating the overall financial statement presentation. Our procedures included confirmation of securities owned as of February 28, 2014, by correspondence with the Fund’s custodian and others or by other appropriate auditing procedures where replies from others were not received. We believe that our audits provide a reasonable basis for our opinion.
In our opinion, the financial statements and financial highlights referred to above present fairly, in all material respects, the financial position of MFS Diversified Income Fund at February 28, 2014, the results of its operations for the year then ended, the changes in its net assets for each of the two years in the period then ended, and its financial highlights for each of the periods indicated therein, in conformity with U.S. generally accepted accounting principles.

Boston, Massachusetts
April 14, 2014
56
TRUSTEES AND OFFICERS — IDENTIFICATION AND BACKGROUND
The Trustees and Officers of the Trust, as of April 1, 2014, are listed below, together with their principal occupations during the past five years. (Their titles may have varied during that period.) The address of each Trustee and Officer is 111 Huntington Avenue, Boston, Massachusetts 02199-7618. It is expected that the Board will appoint Mr. Timothy M. Fagan as Chief Compliance Officer of the MFS Funds on November 1, 2014.
| | | | | | | | |
Name, Age | | Position(s) Held with Fund | | Trustee/Officer
Since (h) | | Principal
Occupations During the Past Five Years | | Other Directorships (j) |
| INTERESTED TRUSTEES |
Robert J. Manning (k) (age 50) | | Trustee | | February 2004 | | Massachusetts Financial Services Company, Chairman, Chief Executive Officer and Director; President (until 2009); Chief Investment Officer (until 2010) | | N/A |
Robin A. Stelmach (k) (age 52) | | Trustee | | January 2014 | | Massachusetts Financial Services Company, Executive Vice President and Chief Operating Officer | | N/A |
| INDEPENDENT TRUSTEES |
David H. Gunning (age 71) | | Trustee and Chair of Trustees | | January 2004 | | Private investor | | Lincoln Electric Holdings, Inc. (welding equipment manufacturer), Director; Development Alternatives, Inc. (consulting), Director/Non-Executive Chairman |
Steven E. Buller (age 62) | | Trustee | | February 2014 | | Chairman, Financial Accounting Standards Advisory Council; Standing Advisory Group, Public Company Accounting Oversight Board, Member; BlackRock, Inc. (investment management), Managing Director (until 2014), BlackRock Finco (investment management), UK, Director (until 2014) | | N/A |
57
Trustees and Officers – continued
| | | | | | | | |
Name, Age | | Position(s) Held with Fund | | Trustee/Officer
Since (h) | | Principal
Occupations During the Past Five Years | | Other Directorships (j) |
Robert E. Butler (age 72) | | Trustee | | January 2006 | | Consultant – investment company industry regulatory and compliance matters | | N/A |
Maureen R. Goldfarb (age 58) | | Trustee | | January 2009 | | Private investor | | N/A |
William R. Gutow (age 72) | | Trustee | | December 1993 | | Private investor and real estate consultant; Capitol Entertainment Management Company (video franchise), Vice Chairman | | Texas Donuts (donut franchise), Vice Chairman (until 2010) |
Michael Hegarty (age 69) | | Trustee | | December 2004 | | Private investor | | Brookfield Office Properties, Inc. (real estate), Director; Rouse Properties Inc. (real estate), Director; Capmark Financial Group Inc. (real estate), Director |
John P. Kavanaugh (age 59) | | Trustee | | January 2009 | | Private investor | | N/A |
Laurie J. Thomsen (age 56) | | Trustee | | March 2005 | | Private investor; New Profit, Inc. (venture philanthropy), Executive Partner (until 2010) | | The Travelers Companies (insurance), Director |
Robert W. Uek (age 72) | | Trustee | | January 2006 | | Consultant to investment company industry | | N/A |
| OFFICERS | | | | | | | | |
John M. Corcoran (k) (age 48) | | President | | October 2008 | | Massachusetts Financial Services Company, Senior Vice President | | N/A |
Christopher R. Bohane (k) (age 40) | | Assistant Secretary and Assistant Clerk | | July 2005 | | Massachusetts Financial Services Company, Vice President and Assistant General Counsel | | N/A |
Kino Clark (k) (age 45) | | Assistant Treasurer | | January 2012 | | Massachusetts Financial Services Company, Vice President | | N/A |
58
Trustees and Officers – continued
| | | | | | | | |
Name, Age | | Position(s) Held with Fund | | Trustee/Officer
Since (h) | | Principal
Occupations During the Past Five Years | | Other Directorships (j) |
Thomas H. Connors (k) (age 54) | | Assistant Secretary and Assistant Clerk | | September 2012 | | Massachusetts Financial Services Company, Vice President and Senior Counsel; Deutsche Investment Management Americas Inc. (financial service provider), Director and Senior Counsel (until 2012) | | N/A |
Ethan D. Corey (k) (age 50) | | Assistant Secretary and Assistant Clerk | | July 2005 | | Massachusetts Financial Services Company, Senior Vice President and Associate General Counsel | | N/A |
David L. DiLorenzo (k) (age 45) | | Treasurer | | July 2005 | | Massachusetts Financial Services Company, Senior Vice President | | N/A |
Robyn L. Griffin (age 38) | | Assistant Independent Chief Compliance Officer | | August 2008 | | Griffin Compliance LLC (provider of compliance services), Principal | | N/A |
Brian E. Langenfeld (k) (age 41) | | Assistant Secretary and Assistant Clerk | | June 2006 | | Massachusetts Financial Services Company, Vice President and Senior Counsel | | N/A |
Susan S. Newton (k) (age 64) | | Assistant Secretary and Assistant Clerk | | May 2005 | | Massachusetts Financial Services Company, Senior Vice President and Associate General Counsel | | N/A |
Susan A. Pereira (k) (age 43) | | Assistant Secretary and Assistant Clerk | | July 2005 | | Massachusetts Financial Services Company, Vice President and Senior Counsel | | N/A |
Kasey L. Phillips (k) (age 43) | | Assistant Treasurer | | September 2012 | | Massachusetts Financial Services Company, Vice President; Wells Fargo Funds Management, LLC, Senior Vice President, Fund Treasurer (until 2012) | | N/A |
59
Trustees and Officers – continued
| | | | | | | | |
Name, Age | | Position(s) Held with Fund | | Trustee/Officer
Since (h) | | Principal
Occupations During the Past Five Years | | Other Directorships (j) |
| Mark N. Polebaum (k) (age 61) | | Secretary and Clerk | | January 2006 | | Massachusetts Financial Services Company, Executive Vice President, General Counsel and Secretary | | N/A |
Frank L. Tarantino (l) (age 70) | | Independent Chief Compliance Officer | | June 2004 | | Tarantino LLC (provider of compliance services), Principal | | N/A |
Richard S. Weitzel (k) (age 43) | | Assistant Secretary and Assistant Clerk | | October 2007 | | Massachusetts Financial Services Company, Senior Vice President and Associate General Counsel | | N/A |
James O. Yost (k) (age 53) | | Deputy Treasurer | | September 1990 | | Massachusetts Financial Services Company, Senior Vice President | | N/A |
| (h) | Date first appointed to serve as Trustee/officer of an MFS Fund. Each Trustee has served continuously since appointment unless indicated otherwise. For the period from December 15, 2004 until February 22, 2005, Mr. Manning served as Advisory Trustee. For the period October 2008, until January 2012, Mr. Corcoran served as Treasurer of the Funds. Prior to January 2012, Messrs. DiLorenzo and Yost served as Assistant Treasurers of the Funds. |
| (j) | Directorships or trusteeships of companies required to report to the Securities and Exchange Commission (i.e., “public companies”). |
| (k) | “Interested person” of the Trust within the meaning of the Investment Company Act of 1940 (referred to as the 1940 Act), which is the principal federal law governing investment companies like the fund, as a result of position with MFS. The address of MFS is 111 Huntington Avenue, Boston, Massachusetts 02199-7618. |
| (l) | Mr. Tarantino will retire as Independent Chief Compliance Officer of the MFS Funds on October 31, 2014. It is expected that Mr. Tarantino will continue after that date as an Officer of the MFS Funds. |
Each Trustee (except Ms. Stelmach and Mr. Buller) has been elected by shareholders and each Trustee and officer holds office until his or her successor is chosen and qualified or until his or her earlier death, resignation, retirement or removal. The Trust does not hold annual meetings for the purpose of electing Trustees, and Trustees are not elected for fixed terms. Messrs. Butler, Kavanaugh, Uek and Ms. Thomsen are members of the Trust’s Audit Committee.
Each of the Fund’s Trustees and officers holds comparable positions with certain other funds of which MFS or a subsidiary is the investment adviser or distributor, and, in the case of the officers, with certain affiliates of MFS. As of January 1, 2014, the Trustees served as board members of 142 funds within the MFS Family of Funds.
60
Trustees and Officers – continued
The Statement of Additional Information for the Fund includes further information about the Trustees and is available without charge upon request by calling 1-800-225-2606.
| | |
| Investment Adviser | | Custodian |
Massachusetts Financial Services Company
111 Huntington Avenue
Boston, MA 02199-7618 | | JPMorgan Chase Bank One Chase Manhattan Plaza New York, NY 10081 |
| Distributor | | Independent Registered Public Accounting Firm |
MFS Fund Distributors, Inc.
111 Huntington Avenue
Boston, MA 02199-7618 | | Ernst & Young LLP 200 Clarendon Street Boston, MA 02116 |
| Portfolio Managers | | |
William Adams Ward Brown David Cole Richard Gable Matthew Ryan Jonathan Sage Geoffrey Schechter James Swanson | | |
61
BOARD REVIEW OF INVESTMENT ADVISORY AGREEMENT
A discussion regarding the Board’s most recent review and renewal of the fund’s Investment Advisory Agreement with MFS is available by clicking on the fund’s name under “Mutual Funds” in the “Products” section of the MFS Web site (mfs.com).
PROXY VOTING POLICIES AND INFORMATION
A general description of the MFS funds’ proxy voting policies and procedures is available without charge, upon request, by calling 1-800-225-2606, by visiting the Proxy Voting section of mfs.com or by visiting the SEC’s Web site at http://www.sec.gov.
Information regarding how the fund voted proxies relating to portfolio securities during the most recent twelve-month period ended June 30 is available without charge by visiting the Proxy Voting section of mfs.com or by visiting the SEC’s Web site at http://www.sec.gov.
QUARTERLY PORTFOLIO DISCLOSURE
The fund will file a complete schedule of portfolio holdings with the Securities and Exchange Commission (the Commission) for the first and third quarters of each fiscal year on Form N-Q. A shareholder can obtain the quarterly portfolio holdings report at mfs.com. The fund’s Form N-Q is also available on the EDGAR database on the Commission’s Internet Web site at http://www.sec.gov, and may be reviewed and copied at the:
Public Reference Room
Securities and Exchange Commission
100 F Street, NE, Room 1580
Washington, D.C. 20549
Information on the operation of the Public Reference Room may be obtained by calling the Commission at 1-800-SEC-0330. Copies of the fund’s Form N-Q also may be obtained, upon payment of a duplicating fee, by electronic request at the following e-mail address: publicinfo@sec.gov or by writing the Public Reference Section at the above address.
FURTHER INFORMATION
From time to time, MFS may post important information about the fund or the MFS funds on the MFS web site (mfs.com). This information is available by visiting the “Commentary & Announcements” and “Market Outlooks” sections of mfs.com or by clicking on the fund’s name under “Mutual Funds” in the “Products” section of mfs.com.
FEDERAL TAX INFORMATION (unaudited)
The fund will notify shareholders of amounts for use in preparing 2014 income tax forms in January 2015. The following information is provided pursuant to provisions of the Internal Revenue Code.
The fund designates the maximum amount allowable as qualified dividend income eligible for the 15% tax rate.
The fund designates $27,572,000 as capital gain dividends paid during the fiscal year.
For corporate shareholders, 16.24% of the ordinary income dividends paid during the fiscal year qualify for the corporate dividends received deduction.
62
rev. 3/11
| | | | |
| | | |
FACTS | | WHAT DOES MFS DO WITH YOUR PERSONAL INFORMATION? | |  |
| | |
| Why? | | Financial companies choose how they share your personal information. Federal law gives consumers the right to limit some but not all sharing. Federal law also requires us to tell you how we collect, share, and protect your personal information. Please read this notice carefully to understand what we do. |
| | |
| What? | | The types of personal information we collect and share depend on the product or service you have with us. This information can include: •Social Security number and account balances •Account transactions and transaction history •Checking account information and wire transfer instructions When you are no longer our customer, we continue to share your information as described in this notice. |
| | |
| How? | | All financial companies need to share customers’ personal information to run their everyday business. In the section below, we list the reasons financial companies can share their customers’ personal information; the reasons MFS chooses to share; and whether you can limit this sharing. |
| | | | |
Reasons we can share your
personal information | | Does MFS
share? | | Can you limit
this sharing? |
For our everyday business purposes – such as to process your transactions, maintain your account(s), respond to court orders and legal investigations, or report to credit bureaus | | Yes | | No |
For our marketing purposes – to offer our products and services to you | | No | | We don’t share |
| For joint marketing with other financial companies | | No | | We don’t share |
For our affiliates’ everyday business purposes – information about your transactions and experiences | | No | | We don’t share |
For our affiliates’ everyday business purposes – information about your creditworthiness | | No | | We don’t share |
| For nonaffiliates to market to you | | No | | We don’t share |
| | |
| Questions? | | Call 800-225-2606 or go to mfs.com. |
63
| | |
| Who we are |
| Who is providing this notice? | | MFS Funds, MFS Investment Management, MFS Institutional Advisors, Inc., MFS Fund Distributors, Inc., MFS Heritage Trust Company, and MFS Service Center, Inc. |
| | |
| What we do |
| How does MFS protect my personal information? | | To protect your personal information from unauthorized access and use, we use security measures that comply with federal law. These measures include procedural, electronic, and physical safeguards for the protection of the personal information we collect about you. |
| How does MFS collect my personal information? | | We collect your personal information, for example, when you •open an account or provide account information •direct us to buy securities or direct us to sell your securities •make a wire transfer We also collect your personal information from others, such as credit bureaus, affiliates and other companies. |
| Why can’t I limit all sharing? | | Federal law gives you the right to limit only •sharing for affiliates’ everyday business purposes – information about your creditworthiness •affiliates from using your information to market to you •sharing for nonaffiliates to market to you State laws and individual companies may give you additional rights to limit sharing. |
| | |
| Definitions |
| Affiliates | | Companies related by common ownership or control. They can be financial and nonfinancial companies. •MFS does not share personal information with affiliates, except for everyday business purposes as described on page one of this notice. |
| Nonaffiliates | | Companies not related by common ownership or control. They can be financial and nonfinancial companies. •MFS does not share with nonaffiliates so they can market to you. |
| Joint Marketing | | A formal agreement between nonaffiliated financial companies that together market financial products or services to you. •MFS doesn’t jointly market. |
| | |
| Other important information |
| If you own an MFS product or receive an MFS service in the name of a third party such as a bank or broker-dealer, their privacy policy may apply to you instead of ours. |
64
Save paper with eDelivery.

| MFS® will send you prospectuses, |
reports, and proxies directly via e-mail so you will get information faster with less mailbox clutter.
To sign up:
1. Go to mfs.com.
2. Log in via MFS® Access.
3. Select eDelivery.
If you own your MFS fund shares through a financial institution or a retirement plan, MFS® TALK, MFS® Access, or eDelivery may not be available to you.
CONTACT
WEB SITE
mfs.com
MFS TALK
1-800-637-8255
24 hours a day
ACCOUNT SERVICE AND LITERATURE
Shareholders
1-800-225-2606
Financial advisors
1-800-343-2829
Retirement plan services
1-800-637-1255
MAILING ADDRESS
MFS Service Center, Inc.
P.O. Box 55824
Boston, MA 02205-5824
OVERNIGHT MAIL
MFS Service Center, Inc.
c/o Boston Financial Data Services
30 Dan Road
Canton, MA 02021-2809
ANNUAL REPORT
February 28, 2014

MFS® GOVERNMENT SECURITIES FUND

MFG-ANN
MFS® GOVERNMENT SECURITIES FUND
CONTENTS
The report is prepared for the general information of shareholders. It is authorized for distribution to prospective investors only when preceded or accompanied by a current prospectus.
NOT FDIC INSURED Ÿ MAY LOSE VALUE Ÿ NO BANK GUARANTEE

LETTER FROM THE CHAIRMAN AND CEO
Dear Shareholders:
The U.S. economy appears to have slowed early in 2014 after a strong second half of 2013. Harsh winter weather likely contributed to at least a temporary softening of consumer demand. Looking at the longer term, the pace of U.S. economic growth has
been modest since the recovery began late in 2009. Corporate profits remain healthy overall. A major plus is the removal of a highly confrontational atmosphere in the U.S. Congress, which had clouded business decision-making since 2011.
Globally, recent months have been dominated by volatility, including emerging market currency jitters and rising geopolitical tensions. These add to the possibility of economic uncertainty and financial market unease. However, the eurozone continues to show signs of recovery, while Japan is making progress as it seeks to break free of deflation.
China’s transition toward a more consumer-oriented and less export-driven economy — one with a more stable and sustainable growth rate — could be positive in the long term. However, in the near term, any deceleration in China’s rate of growth could have a ripple effect on its many global trading partners.
In uncertain times such as these, it is particularly important to remember that managing risk should always be a top priority. At MFS®, active risk management is an integral part of our collaborative process. Our global team of investment professionals shares ideas and evaluates opportunities that span continents, investment disciplines and asset classes. Our goal is to build better insights, and ultimately better results, for our clients.
We understand and appreciate the economic challenges investors face, and we believe in the value of maintaining a long-term view and applying proven principles, such as asset allocation and diversification. We are confident that our unique approach can serve investors well as they work with their financial advisors to identify and pursue the most suitable opportunities.
Respectfully,

Robert J. Manning
Chairman and Chief Executive Officer
MFS Investment Management
April 14, 2014
The opinions expressed in this letter are subject to change, may not be relied upon for investment advice, and no forecasts can be guaranteed.
1
PORTFOLIO COMPOSITION
Portfolio structure (i)

| | | | |
| Fixed income sectors (i) | | | | |
| Mortgage-Backed Securities | | | 47.2% | |
| U.S. Treasury Securities | | | 40.2% | |
| U.S. Government Agencies | | | 7.4% | |
| Commercial Mortgage-Backed Securities | | | 2.6% | |
| High Grade Corporates | | | 0.5% | |
| Non-U.S. Government Bonds | | | 0.1% | |
| | | | |
| Composition including fixed income credit quality (a)(i) | |
| AAA | | | 1.0% | |
| AA | | | 0.2% | |
| A | | | 0.8% | |
| BBB | | | 1.2% | |
| U.S. Government | | | 37.5% | |
| Federal Agencies | | | 54.6% | |
| Not Rated | | | 2.7% | |
| Cash & Other | | | 2.0% | |
| |
| Portfolio facts (i) | | | | |
| Average Duration (d) | | | 4.6 | |
| Average Effective Maturity (m) | | | 5.6 yrs. | |
| (a) | For all securities other than those specifically described below, ratings are assigned to underlying securities utilizing ratings from Moody’s, Fitch, and Standard & Poor’s rating agencies and applying the following hierarchy: If all three agencies provide a rating, the middle rating (after dropping the highest and lowest ratings) is assigned; if two of the three agencies rate a security, the lower of the two is assigned. Ratings are shown in the S&P and Fitch scale (e.g., AAA). Securities rated BBB or higher are considered investment grade. All ratings are subject to change. U.S. Government includes securities issued by the U.S. Department of the Treasury. Federal Agencies includes rated and unrated U.S. Agency fixed-income securities, U.S. Agency mortgage-backed securities, and collateralized mortgage obligations of U.S. Agency mortgage-backed securities. Not Rated includes fixed income securities, including fixed income futures contracts, which have not been rated by any rating agency. The fund may not hold all of these instruments. The fund is not rated by these agencies. |
| (d) | Duration is a measure of how much a bond’s price is likely to fluctuate with general changes in interest rates, e.g., if rates rise 1.00%, a bond with a 5-year duration is likely to lose about 5.00% of its value due to the interest rate move. |
| (i) | For purposes of this presentation, the components include the market value of securities, and reflect the impact of the equivalent exposure of derivative positions, if any. These amounts may be negative from time to time. Equivalent exposure is a calculated amount that translates the derivative position into a reasonable approximation of the amount of the underlying asset that the portfolio would have to hold at a given point in time to have the same price sensitivity that results from the portfolio’s ownership of the derivative contract. When dealing with derivatives, equivalent exposure is a more representative measure of the potential impact of a position on portfolio performance than market value. The bond component will include any accrued interest amounts. |
2
Portfolio Composition – continued
| (m) | In determining an instrument’s effective maturity for purposes of calculating the fund’s dollar-weighted average effective maturity, MFS uses the instrument’s stated maturity or, if applicable, an earlier date on which MFS believes it is probable that a maturity-shortening device (such as a put, pre-refunding or prepayment) will cause the instrument to be repaid. Such an earlier date can be substantially shorter than the instrument’s stated maturity. |
Where the fund holds convertible bonds, these are treated as part of the equity portion of the portfolio.
Cash & Other includes cash, other assets less liabilities, offsets to derivative positions, and short-term securities.
Percentages are based on net assets as of 2/28/14.
The portfolio is actively managed and current holdings may be different.
3
MANAGEMENT REVIEW
Summary of Results
For the twelve months ended February 28, 2014, Class A shares of the MFS Government Securities Fund (“fund”) provided a total return of –1.00%, at net asset value. This compares with a return of –0.20% for the fund’s benchmark, the Barclays U.S. Government/Mortgage Bond Index.
Market Environment
Early in the period, jitters over a banking crisis in Cyprus was more than offset by ongoing accommodative global monetary policy and improving economic data, resulting in gains in both equity and fixed income markets. As the period progressed, concerns that the US Federal Reserve (“Fed”) would begin tapering its quantitative easing (“QE”) program caused sovereign bond yields to spike, credit spreads to widen, and equity valuations to fall. Equities subsequently outperformed fixed income in response to the improved economic fundamentals.
Toward the middle of the period, the Fed’s decision to postpone QE tapering surprised markets. Favorable market reactions were tempered, however, by tense negotiations over US fiscal policy which resulted in a 16-day partial shutdown of the federal government and a short-term extension in the debt ceiling. The volatility was short-lived, however, as an extension of budget and debt ceiling deadlines allowed the government to re-open, and subsequent economic data reflected moderate but resilient US growth. Also well-received was the decision by the European Central Bank to cut its policy rate as inflation pressures waned in the region. In addition, equity investors appeared to have concluded that there would be no major change in US monetary policy as a result of the nomination of Janet Yellen as the new Fed Chair for a term beginning in early 2014.
Later in the period, emerging market stresses resurfaced with political unrest, falling currencies and slowing growth which appeared to have impacted investor sentiment. Markets were also forced to contend with some unexpected weakness in the US economy due largely to weather-related interruptions to hiring and spending plans as well as production schedules. Once again, the setback was short-lived as the major US equity indexes traded near their all-time highs by the end of the period.
Factors Affecting Performance
Relative to the Barclays U.S. Government/Mortgage Bond Index, the fund’s greater exposure to Federal National Mortgage Association (FNMA) mortgage-backed securities held back relative performance.
Conversely, strong bond selection supported relative results. The fund’s greater exposure to the financal sector also contributed to relative performance as this market segment outperformed the benchmark over the reporting period. The fund’s yield curve (y) positioning, particularly its exposure to shifts in the long end (centered around maturities of 10 or more years) of the yield curve was another area of relative strength.
4
Management Review – continued
Additionally, the fund’s return from yield, which was greater than that of the benchmark, was a positive factor for relative performance.
Respectfully,
Geoffrey Schechter
Portfolio Manager
| (y) | A yield curve graphically depicts the yields of different maturity bonds of the same credit quality and type; a normal yield curve is upward sloping, with short-term rates lower than long-term rates. |
The views expressed in this report are those of the portfolio manager only through the end of the period of the report as stated on the cover and do not necessarily reflect the views of MFS or any other person in the MFS organization. These views are subject to change at any time based on market or other conditions, and MFS disclaims any responsibility to update such views. These views may not be relied upon as investment advice or an indication of trading intent on behalf of any MFS portfolio. References to specific securities are not recommendations of such securities, and may not be representative of any MFS portfolio’s current or future investments.
5
PERFORMANCE SUMMARY THROUGH 2/28/14
The following chart illustrates a representative class of the fund’s historical performance in comparison to its benchmark(s). Performance results include the deduction of the maximum applicable sales charge and reflect the percentage change in net asset value, including reinvestment of dividends and capital gains distributions. The performance of other share classes will be greater than or less than that of the class depicted below. Benchmarks are unmanaged and may not be invested in directly. Benchmark returns do not reflect sales charges, commissions or expenses. (See Notes to Performance Summary.)
Performance data shown represents past performance and is no guarantee of future results. Investment return and principal value fluctuate so your shares, when sold, may be worth more or less than the original cost; current performance may be lower or higher than quoted. The performance shown does not reflect the deduction of taxes, if any, that a shareholder would pay on fund distributions or the redemption of fund shares.
Growth of a Hypothetical $10,000 Investment
6
Performance Summary – continued
Total Returns through 2/28/14
Average annual without sales charge
| | | | | | | | | | | | | | |
| | | Share class | | Class inception date | | 1-yr | | 5-yr | | 10-yr | | Life (t) | | |
| | | A | | 7/25/84 | | (1.00)% | | 3.36% | | 3.95% | | N/A | | |
| | | B | | 8/30/93 | | (1.65)% | | 2.60% | | 3.18% | | N/A | | |
| | | C | | 4/01/96 | | (1.73)% | | 2.57% | | 3.17% | | N/A | | |
| | | I | | 1/02/97 | | (0.75)% | | 3.62% | | 4.22% | | N/A | | |
| | | R1 | | 4/01/05 | | (1.74)% | | 2.60% | | N/A | | 3.46% | | |
| | | R2 | | 10/31/03 | | (1.25)% | | 3.11% | | 3.61% | | N/A | | |
| | | R3 | | 4/01/05 | | (0.90)% | | 3.36% | | N/A | | 4.23% | | |
| | | R4 | | 4/01/05 | | (0.65)% | | 3.62% | | N/A | | 4.51% | | |
| | | R5 | | 7/02/12 | | (0.54)% | | N/A | | N/A | | 0.04% | | |
| Comparative benchmark | | | | | | | | | | |
| | | Barclays U.S. Government/Mortgage
Bond Index (f) | | (0.20)% | | 3.54% | | 4.37% | | N/A | | |
| Average annual with sales charge | | | | | | | | | | |
| | | A
With Initial Sales Charge (4.75%) | | (5.70)% | | 2.36% | | 3.44% | | N/A | | |
| | | B
With CDSC (Declining over six years from 4% to 0%) (v) | | (5.51)% | | 2.23% | | 3.18% | | N/A | | |
| | | C
With CDSC (1% for 12 months) (v) | | (2.70)% | | 2.57% | | 3.17% | | N/A | | |
Class I, R1, R2, R3, R4, and R5 shares do not have a sales charge.
CDSC – Contingent Deferred Sales Charge.
| (f) | Source: FactSet Research Systems Inc. |
| (t) | For the period from the class inception date through the stated period end (for those share classes with less than 10 years of performance history). No comparative benchmark performance information is provided for “life” periods. (See Notes to Performance Summary.) |
| (v) | Assuming redemption at the end of the applicable period. |
Benchmark Definition
Barclays U.S. Government/Mortgage Bond Index – measures debt issued by the U.S. Government, and its agencies, as well as mortgage-backed pass-through securities of Ginnie Mae (GNMA), Fannie Mae (FNMA), and Freddie Mac (FHLMC).
It is not possible to invest directly in an index.
Notes to Performance Summary
Average annual total return represents the average annual change in value for each share class for the periods presented. Life returns are presented where the share class has less than 10 years of performance history and represent the average annual total return from the class inception date to the stated period end date. As the fund’s share
7
Performance Summary – continued
classes may have different inception dates, the life returns may represent different time periods and may not be comparable. As a result, no comparative benchmark performance information is provided for life periods.
Performance results reflect any applicable expense subsidies and waivers in effect during the periods shown. Without such subsidies and waivers the fund’s performance results would be less favorable. Please see the prospectus and financial statements for complete details.
Performance results do not include adjustments made for financial reporting purposes in accordance with U.S. generally accepted accounting principles and may differ from amounts reported in the financial highlights.
From time to time the fund may receive proceeds from litigation settlements, without which performance would be lower.
8
EXPENSE TABLE
Fund expenses borne by the shareholders during the period, September 1, 2013 through February 28, 2014
As a shareholder of the fund, you incur two types of costs: (1) transaction costs, including sales charges (loads) on certain purchase or redemption payments, and (2) ongoing costs, including management fees; distribution and service (12b-1) fees; and other fund expenses. This example is intended to help you understand your ongoing costs (in dollars) of investing in the fund and to compare these costs with the ongoing costs of investing in other mutual funds.
The example is based on an investment of $1,000 invested at the beginning of the period and held for the entire period September 1, 2013 through February 28, 2014.
The expenses include the payment of a portion of the transfer-agent-related expenses of MFS funds that invest in the fund. For further information, please see the Notes to the Financial Statements.
Actual Expenses
The first line for each share class in the following table provides information about actual account values and actual expenses. You may use the information in this line, together with the amount you invested, to estimate the expenses that you paid over the period. Simply divide your account value by $1,000 (for example, an $8,600 account value divided by $1,000 = 8.6), then multiply the result by the number in the first line under the heading entitled “Expenses Paid During Period” to estimate the expenses you paid on your account during this period.
Hypothetical Example for Comparison Purposes
The second line for each share class in the following table provides information about hypothetical account values and hypothetical expenses based on the fund’s actual expense ratio and an assumed rate of return of 5% per year before expenses, which is not the fund’s actual return. The hypothetical account values and expenses may not be used to estimate the actual ending account balance or expenses you paid for the period. You may use this information to compare the ongoing costs of investing in the fund and other funds. To do so, compare this 5% hypothetical example with the 5% hypothetical examples that appear in the shareholder reports of the other funds.
Please note that the expenses shown in the table are meant to highlight your ongoing costs only and do not reflect any transactional costs, such as sales charges (loads). Therefore, the second line for each share class in the table is useful in comparing ongoing costs only, and will not help you determine the relative total costs of owning different funds. In addition, if these transactional costs were included, your costs would have been higher.
9
Expense Table – continued
| | | | | | | | | | | | | | | | | | |
Share
Class | | | | Annualized
Expense
Ratio | | | Beginning
Account Value
9/01/13 | | | Ending
Account Value
2/28/14 | | | Expenses
Paid During
Period (p)
9/01/13-2/28/14 | |
| A | | Actual | | | 0.86% | | | | $1,000.00 | | | | $1,018.87 | | | | $4.30 | |
| | Hypothetical (h) | | | 0.86% | | | | $1,000.00 | | | | $1,020.53 | | | | $4.31 | |
| B | | Actual | | | 1.62% | | | | $1,000.00 | | | | $1,015.08 | | | | $8.09 | |
| | Hypothetical (h) | | | 1.62% | | | | $1,000.00 | | | | $1,016.76 | | | | $8.10 | |
| C | | Actual | | | 1.62% | | | | $1,000.00 | | | | $1,015.06 | | | | $8.09 | |
| | Hypothetical (h) | | | 1.62% | | | | $1,000.00 | | | | $1,016.76 | | | | $8.10 | |
| I | | Actual | | | 0.62% | | | | $1,000.00 | | | | $1,020.14 | | | | $3.11 | |
| | Hypothetical (h) | | | 0.62% | | | | $1,000.00 | | | | $1,021.72 | | | | $3.11 | |
| R1 | | Actual | | | 1.62% | | | | $1,000.00 | | | | $1,015.08 | | | | $8.09 | |
| | Hypothetical (h) | | | 1.62% | | | | $1,000.00 | | | | $1,016.76 | | | | $8.10 | |
| R2 | | Actual | | | 1.12% | | | | $1,000.00 | | | | $1,017.61 | | | | $5.60 | |
| | Hypothetical (h) | | | 1.12% | | | | $1,000.00 | | | | $1,019.24 | | | | $5.61 | |
| R3 | | Actual | | | 0.87% | | | | $1,000.00 | | | | $1,018.87 | | | | $4.35 | |
| | Hypothetical (h) | | | 0.87% | | | | $1,000.00 | | | | $1,020.48 | | | | $4.36 | |
| R4 | | Actual | | | 0.62% | | | | $1,000.00 | | | | $1,021.15 | | | | $3.11 | |
| | Hypothetical (h) | | | 0.62% | | | | $1,000.00 | | | | $1,021.72 | | | | $3.11 | |
| R5 | | Actual | | | 0.51% | | | | $1,000.00 | | | | $1,021.68 | | | | $2.56 | |
| | Hypothetical (h) | | | 0.51% | | | | $1,000.00 | | | | $1,022.27 | | | | $2.56 | |
| (h) | 5% class return per year before expenses. |
| (p) | Expenses Paid During Period are equal to each class’s annualized expense ratio, as shown above, multiplied by the average account value over the period, multiplied by 181/365 (to reflect the one-half year period). Expenses paid do not include any applicable sales charges (loads). If these transaction costs had been included, your costs would have been higher. |
Notes to Expense Table
Each class with a Rule 12b-1 service fee is subject to a rebate of a portion of such fee. Such rebates are included in the expense ratios above. For Class A shares, this rebate reduced the expense ratio above by 0.01%. See Note 3 in the Notes to Financial Statements for additional information.
10
PORTFOLIO OF INVESTMENTS
2/28/14
The Portfolio of Investments is a complete list of all securities owned by your fund. It is categorized by broad-based asset classes.
| | | | | | | | |
| Bonds - 94.9% | | | | | | | | |
| Issuer | | Shares/Par | | | Value ($) | |
| | | | | | | | |
| Agency - Other - 4.5% | | | | | | | | |
| Financing Corp., 10.7%, 10/06/17 | | $ | 14,360,000 | | | $ | 19,099,667 | |
| Financing Corp., 9.4%, 2/08/18 | | | 11,750,000 | | | | 15,278,032 | |
| Financing Corp., 9.8%, 4/06/18 | | | 14,975,000 | | | | 19,871,555 | |
| Financing Corp., 10.35%, 8/03/18 | | | 15,165,000 | | | | 20,793,732 | |
| Financing Corp., STRIPS, 0%, 11/30/17 | | | 18,780,000 | | | | 17,790,970 | |
| | | | | | | | |
| | | | | | | $ | 92,833,956 | |
| Asset-Backed & Securitized - 2.6% | | | | | | | | |
| Citigroup/Deutsche Bank Commercial Mortgage Trust, 5.322%, 12/11/49 | | $ | 4,260,000 | | | $ | 4,702,154 | |
| Commercial Mortgage Pass-Through Certificates, “A4”, 5.306%, 12/10/46 | | | 9,314,763 | | | | 10,149,673 | |
| Credit Suisse Commercial Mortgage Trust, “A4”, FRN, 5.757%, 9/15/39 | | | 5,869,762 | | | | 6,463,512 | |
| CWCapital Cobalt Ltd., “A4”, FRN, 5.77%, 5/15/46 | | | 7,511,304 | | | | 8,355,312 | |
| Goldman Sachs Mortgage Securities Corp., FRN, 5.819%, 8/10/45 | | | 9,046,472 | | | | 9,986,038 | |
| JPMorgan Chase Commercial Mortgage Securities Corp., “A3”, FRN, 5.939%, 2/15/51 | | | 2,871,278 | | | | 2,892,103 | |
| JPMorgan Chase Commercial Mortgage Securities Corp., “A4”, FRN, 5.813%, 6/15/49 | | | 9,239,502 | | | | 10,304,327 | |
| | | | | | | | |
| | | | | | | $ | 52,853,119 | |
| Local Authorities - 0.5% | | | | | | | | |
| Nashville & Davidson County, TN, Metropolitan Government Convention Center Authority (Build America Bonds), 6.731%, 7/01/43 | | $ | 4,855,000 | | | $ | 5,781,383 | |
| San Francisco, CA, City & County Public Utilities Commission, Water Rev. (Build America Bonds), 6%, 11/01/40 | | | 840,000 | | | | 1,001,902 | |
| University of California Rev. (Build America Bonds), 5.77%, 5/15/43 | | | 2,750,000 | | | | 3,233,395 | |
| | | | | | | | |
| | | | | | | $ | 10,016,680 | |
| Mortgage-Backed - 47.1% | | | | | | | | |
| Fannie Mae, 4.487%, 4/01/14 | | $ | 1,928,162 | | | $ | 1,923,964 | |
| Fannie Mae, 4.77%, 7/01/14 | | | 1,368,822 | | | | 1,373,038 | |
| Fannie Mae, 4.718%, 8/01/14 | | | 1,864,840 | | | | 1,870,718 | |
| Fannie Mae, 4.92%, 8/01/14 | | | 122,947 | | | | 122,946 | |
| Fannie Mae, 5.1%, 9/01/14 - 3/01/19 | | | 3,637,528 | | | | 3,726,968 | |
| Fannie Mae, 4.82%, 12/01/14 - 1/01/15 | | | 4,658,884 | | | | 4,751,852 | |
11
Portfolio of Investments – continued
| | | | | | | | |
| Issuer | | Shares/Par | | | Value ($) | |
| | | | | | | | |
| Bonds - continued | | | | | | | | |
| Mortgage-Backed - continued | | | | | | | | |
| Fannie Mae, 4.62%, 1/01/15 | | $ | 2,962,916 | | | $ | 3,010,622 | |
| Fannie Mae, 4.962%, 1/01/15 | | | 198,039 | | | | 197,865 | |
| Fannie Mae, 4.85%, 2/01/15 | | | 1,285,772 | | | | 1,311,842 | |
| Fannie Mae, 4.56%, 3/01/15 | | | 2,074,137 | | | | 2,139,909 | |
| Fannie Mae, 4.665%, 3/01/15 | | | 1,403,182 | | | | 1,435,317 | |
| Fannie Mae, 4.89%, 3/01/15 | | | 1,134,546 | | | | 1,161,554 | |
| Fannie Mae, 4.74%, 4/01/15 | | | 1,600,771 | | | | 1,643,678 | |
| Fannie Mae, 4.908%, 4/01/15 | | | 2,462,569 | | | | 2,529,461 | |
| Fannie Mae, 4.87%, 5/01/15 | | | 1,224,502 | | | | 1,261,696 | |
| Fannie Mae, 4.815%, 6/01/15 | | | 1,860,831 | | | | 1,918,470 | |
| Fannie Mae, 4.7%, 8/01/15 | | | 158,643 | | | | 162,708 | |
| Fannie Mae, 4.78%, 8/01/15 | | | 1,732,137 | | | | 1,796,700 | |
| Fannie Mae, 4.81%, 8/01/15 | | | 1,667,761 | | | | 1,730,187 | |
| Fannie Mae, 5.463%, 11/01/15 | | | 4,862,466 | | | | 5,130,655 | |
| Fannie Mae, 5.08%, 2/01/16 - 4/01/19 | | | 1,929,611 | | | | 2,069,133 | |
| Fannie Mae, 5.132%, 2/01/16 | | | 842,971 | | | | 896,071 | |
| Fannie Mae, 5.432%, 2/01/16 | | | 3,572,575 | | | | 3,833,573 | |
| Fannie Mae, 5.273%, 4/01/16 | | | 1,276,752 | | | | 1,369,435 | |
| Fannie Mae, 6.5%, 4/01/16 - 10/01/37 | | | 5,789,479 | | | | 6,509,273 | |
| Fannie Mae, 5.724%, 7/01/16 | | | 3,310,485 | | | | 3,628,875 | |
| Fannie Mae, 5.09%, 12/01/16 | | | 591,067 | | | | 648,459 | |
| Fannie Mae, 5.27%, 12/01/16 | | | 623,086 | | | | 686,108 | |
| Fannie Mae, 5.45%, 12/01/16 | | | 690,000 | | | | 764,930 | |
| Fannie Mae, 4.998%, 1/01/17 | | | 2,887,508 | | | | 2,954,916 | |
| Fannie Mae, 5.05%, 1/01/17 - 8/01/19 | | | 2,929,982 | | | | 3,177,717 | |
| Fannie Mae, 5.06%, 1/01/17 | | | 1,755,355 | | | | 1,896,922 | |
| Fannie Mae, 5.3%, 4/01/17 | | | 720,652 | | | | 782,383 | |
| Fannie Mae, 5.508%, 4/01/17 | | | 1,332,411 | | | | 1,452,326 | |
| Fannie Mae, 5.38%, 5/01/17 | | | 1,904,611 | | | | 2,076,131 | |
| Fannie Mae, 1.9%, 6/01/17 | | | 803,190 | | | | 816,290 | |
| Fannie Mae, 5.5%, 8/01/17 - 8/01/38 | | | 56,523,694 | | | | 62,548,934 | |
| Fannie Mae, 6%, 8/01/17 - 12/01/37 | | | 15,917,923 | | | | 17,636,472 | |
| Fannie Mae, 3.308%, 12/01/17 | | | 4,759,272 | | | | 5,063,600 | |
| Fannie Mae, 5.223%, 1/01/18 | | | 619,445 | | | | 665,419 | |
| Fannie Mae, 3.8%, 2/01/18 | | | 1,676,074 | | | | 1,793,125 | |
| Fannie Mae, 3.91%, 2/01/18 | | | 1,596,634 | | | | 1,727,414 | |
| Fannie Mae, 4%, 3/01/18 - 2/01/41 | | | 24,847,520 | | | | 26,131,962 | |
| Fannie Mae, 4.19%, 3/01/18 | | | 881,844 | | | | 962,928 | |
| Fannie Mae, 3.99%, 4/01/18 | | | 1,600,000 | | | | 1,740,702 | |
| Fannie Mae, 5.37%, 5/01/18 | | | 1,864,972 | | | | 2,115,153 | |
| Fannie Mae, 5.68%, 6/01/18 | | | 1,083,227 | | | | 1,196,053 | |
| Fannie Mae, 2.578%, 9/25/18 | | | 9,100,000 | | | | 9,455,783 | |
| Fannie Mae, 2.43%, 1/01/19 | | | 1,279,732 | | | | 1,318,056 | |
12
Portfolio of Investments – continued
| | | | | | | | |
| Issuer | | Shares/Par | | | Value ($) | |
| | | | | | | | |
| Bonds - continued | | | | | | | | |
| Mortgage-Backed - continued | | | | | | | | |
| Fannie Mae, 5.6%, 1/01/19 | | $ | 1,206,000 | | | $ | 1,320,804 | |
| Fannie Mae, 5.47%, 2/01/19 | | | 374,971 | | | | 409,412 | |
| Fannie Mae, 5%, 4/01/19 - 5/01/41 | | | 45,121,090 | | | | 49,340,712 | |
| Fannie Mae, 5.28%, 4/01/19 | | | 561,695 | | | | 619,572 | |
| Fannie Mae, 4.84%, 5/01/19 | | | 587,227 | | | | 655,035 | |
| Fannie Mae, 4.5%, 6/01/19 - 4/01/41 | | | 24,294,864 | | | | 26,117,905 | |
| Fannie Mae, 4.83%, 8/01/19 - 9/01/19 | | | 1,554,566 | | | | 1,737,218 | |
| Fannie Mae, 4.864%, 8/01/19 | | | 4,973,152 | | | | 5,576,934 | |
| Fannie Mae, 4.67%, 9/01/19 | | | 1,180,000 | | | | 1,311,613 | |
| Fannie Mae, 4.94%, 9/01/19 | | | 412,499 | | | | 463,422 | |
| Fannie Mae, 4.88%, 3/01/20 | | | 753,220 | | | | 821,955 | |
| Fannie Mae, 4.14%, 8/01/20 | | | 1,406,765 | | | | 1,531,039 | |
| Fannie Mae, 3.87%, 9/01/20 | | | 1,808,443 | | | | 1,946,120 | |
| Fannie Mae, 5.19%, 9/01/20 | | | 1,883,795 | | | | 2,063,129 | |
| Fannie Mae, 2.41%, 5/01/23 | | | 1,610,073 | | | | 1,544,557 | |
| Fannie Mae, 2.55%, 5/01/23 | | | 1,390,268 | | | | 1,348,325 | |
| Fannie Mae, 2.59%, 5/01/23 | | | 878,518 | | | | 853,944 | |
| Fannie Mae, 7.5%, 6/01/24 - 9/01/31 | | | 277,961 | | | | 321,939 | |
| Fannie Mae, 4.5%, 5/01/25 | | | 956,003 | | | | 1,035,423 | |
| Fannie Mae, 3%, 3/01/27 - 4/01/27 | | | 10,344,269 | | | | 10,722,593 | |
| Fannie Mae, 2.5%, 5/01/28 | | | 2,868,942 | | | | 2,888,442 | |
| Fannie Mae, 3.5%, 1/01/42 | | | 6,749,922 | | | | 6,855,488 | |
| Fannie Mae, 3.5%, 4/01/43 | | | 11,567,281 | | | | 11,741,287 | |
| Fannie Mae, TBA, 3%, 3/01/28 | | | 11,407,000 | | | | 11,808,027 | |
| Fannie Mae, TBA, 4%, 3/01/44 | | | 63,778,000 | | | | 66,847,316 | |
| Fannie Mae, TBA, 4.5%, 5/01/44 | | | 58,088,000 | | | | 62,018,013 | |
| Freddie Mac, 3.034%, 10/25/20 | | | 3,117,000 | | | | 3,233,869 | |
| Freddie Mac, 6.5%, 4/01/16 - 2/01/38 | | | 1,765,826 | | | | 1,972,724 | |
| Freddie Mac, 1.655%, 11/25/16 | | | 8,873,478 | | | | 9,022,774 | |
| Freddie Mac, 6%, 8/01/17 - 10/01/38 | | | 14,017,470 | | | | 15,576,396 | |
| Freddie Mac, 3.882%, 11/25/17 | | | 5,323,000 | | | | 5,753,732 | |
| Freddie Mac, 3.154%, 2/25/18 | | | 5,293,000 | | | | 5,607,187 | |
| Freddie Mac, 2.412%, 8/25/18 | | | 7,000,000 | | | | 7,209,272 | |
| Freddie Mac, 5%, 9/01/18 - 6/01/40 | | | 13,920,015 | | | | 15,186,590 | |
| Freddie Mac, 2.303%, 9/25/18 | | | 2,438,882 | | | | 2,495,603 | |
| Freddie Mac, 2.323%, 10/25/18 | | | 4,783,000 | | | | 4,891,378 | |
| Freddie Mac, 2.13%, 1/25/19 | | | 10,400,000 | | | | 10,507,910 | |
| Freddie Mac, 5.085%, 3/25/19 | | | 6,865,000 | | | | 7,815,926 | |
| Freddie Mac, 1.883%, 5/25/19 | | | 1,100,000 | | | | 1,094,723 | |
| Freddie Mac, 4.186%, 8/25/19 | | | 2,800,000 | | | | 3,083,024 | |
| Freddie Mac, 4.251%, 1/25/20 | | | 3,106,000 | | | | 3,427,567 | |
| Freddie Mac, 2.313%, 3/25/20 | | | 6,978,000 | | | | 6,999,555 | |
| Freddie Mac, 4.224%, 3/25/20 | | | 4,281,146 | | | | 4,725,717 | |
13
Portfolio of Investments – continued
| | | | | | | | |
| Issuer | | Shares/Par | | | Value ($) | |
| | | | | | | | |
| Bonds - continued | | | | | | | | |
| Mortgage-Backed - continued | | | | | | | | |
| Freddie Mac, 2.757%, 5/25/20 | | $ | 5,782,791 | | | $ | 6,034,233 | |
| Freddie Mac, 3.32%, 7/25/20 - 2/25/23 | | | 10,419,138 | | | | 10,848,632 | |
| Freddie Mac, 5.5%, 4/01/21 - 1/01/38 | | | 16,862,229 | | | | 18,702,305 | |
| Freddie Mac, 2.682%, 10/25/22 | | | 2,229,000 | | | | 2,174,256 | |
| Freddie Mac, 4.5%, 11/01/22 - 6/01/41 | | | 13,304,580 | | | | 14,298,698 | |
| Freddie Mac, 3.25%, 4/25/23 | | | 9,000,000 | | | | 9,110,673 | |
| Freddie Mac, 3.3%, 4/25/23 | | | 4,629,861 | | | | 4,712,073 | |
| Freddie Mac, 3.06%, 7/25/23 | | | 2,074,000 | | | | 2,058,908 | |
| Freddie Mac, 3.458%, 8/25/23 | | | 4,348,000 | | | | 4,451,008 | |
| Freddie Mac, 4%, 7/01/25 - 11/01/43 | | | 12,437,570 | | | | 13,103,669 | |
| Freddie Mac, 2.5%, 2/01/28 - 7/01/28 | | | 52,317,801 | | | | 52,695,587 | |
| Freddie Mac, 3.5%, 12/01/41 - 7/01/43 | | | 56,551,983 | | | | 57,276,667 | |
| Freddie Mac, 3%, 4/01/43 - 5/01/43 | | | 28,891,659 | | | | 28,075,448 | |
| Freddie Mac, TBA, 4%, 3/01/44 | | | 2,944,000 | | | | 3,077,975 | |
| Ginnie Mae, 5.5%, 3/15/33 - 1/20/42 | | | 12,885,012 | | | | 14,349,231 | |
| Ginnie Mae, 4.5%, 7/20/33 - 9/20/41 | | | 29,287,023 | | | | 31,999,652 | |
| Ginnie Mae, 4%, 10/15/39 - 4/20/41 | | | 6,173,527 | | | | 6,557,807 | |
| Ginnie Mae, 3.5%, 12/15/41 - 7/20/43 | | | 47,767,288 | | | | 49,280,366 | |
| Ginnie Mae, 3%, 7/20/43 | | | 13,864,509 | | | | 13,771,151 | |
| Ginnie Mae, 5.612%, 4/20/58 | | | 5,610,724 | | | | 5,849,179 | |
| Ginnie Mae, 6.357%, 4/20/58 | | | 2,627,129 | | | | 2,768,090 | |
| Ginnie Mae, TBA, 4%, 3/01/43 | | | 33,964,000 | | | | 36,017,762 | |
| | | | | | | | |
| | | | | | | $ | 972,835,834 | |
| Supranational - 0.1% | | | | | | | | |
| Inter-American Development Bank, 4.375%, 1/24/44 | | $ | 2,796,000 | | | $ | 2,879,231 | |
| |
| U.S. Government Agencies and Equivalents - 2.8% | | | | | |
| Aid-Egypt, 4.45%, 9/15/15 | | $ | 6,204,000 | | | $ | 6,588,437 | |
| Hashemite Kingdom of Jordan, 2.503%, 10/30/20 | | | 6,688,000 | | | | 6,723,821 | |
| Private Export Funding Corp., 1.875%, 7/15/18 | | | 5,330,000 | | | | 5,400,281 | |
| Small Business Administration, 6.35%, 4/01/21 | | | 527,927 | | | | 579,046 | |
| Small Business Administration, 6.34%, 5/01/21 | | | 560,538 | | | | 612,374 | |
| Small Business Administration, 6.44%, 6/01/21 | | | 541,778 | | | | 598,766 | |
| Small Business Administration, 6.625%, 7/01/21 | | | 543,872 | | | | 599,084 | |
| Small Business Administration, 6.07%, 3/01/22 | | | 575,263 | | | | 627,830 | |
| Small Business Administration, 4.98%, 11/01/23 | | | 738,025 | | | | 805,083 | |
| Small Business Administration, 4.89%, 12/01/23 | | | 1,904,136 | | | | 2,073,149 | |
| Small Business Administration, 4.77%, 4/01/24 | | | 1,814,944 | | | | 1,940,753 | |
| Small Business Administration, 5.52%, 6/01/24 | | | 1,148,206 | | | | 1,257,266 | |
| Small Business Administration, 4.99%, 9/01/24 | | | 1,762,679 | | | | 1,918,836 | |
| Small Business Administration, 4.86%, 10/01/24 | | | 1,189,226 | | | | 1,279,650 | |
| Small Business Administration, 4.86%, 1/01/25 | | | 1,959,614 | | | | 2,110,742 | |
14
Portfolio of Investments – continued
| | | | | | | | |
| Issuer | | Shares/Par | | | Value ($) | |
| | | | | | | | |
| Bonds - continued | | | | | | | | |
| U.S. Government Agencies and Equivalents - continued | | | | | |
| Small Business Administration, 5.11%, 4/01/25 | | $ | 1,679,403 | | | $ | 1,814,502 | |
| Small Business Administration, 2.21%, 2/01/33 | | | 3,203,678 | | | | 3,025,895 | |
| Small Business Administration, 2.22%, 3/01/33 | | | 5,907,060 | | | | 5,580,625 | |
| Small Business Administration, 3.15%, 7/01/33 | | | 5,222,166 | | | | 5,244,356 | |
| Small Business Administration, 3.16%, 8/01/33 | | | 1,956,901 | | | | 1,965,645 | |
| Small Business Administration, 3.62%, 9/01/33 | | | 2,000,000 | | | | 2,062,058 | |
| Tennessee Valley Authority, 1.75%, 10/15/18 | | | 4,231,000 | | | | 4,262,525 | |
| U.S. Department of Housing & Urban Development, 6.36%, 8/01/16 | | | 310,000 | | | | 312,694 | |
| U.S. Department of Housing & Urban Development, 6.59%, 8/01/16 | | | 138,000 | | | | 138,962 | |
| | | | | | | | |
| | | | | | | $ | 57,522,380 | |
| U.S. Treasury Obligations - 37.3% | | | | | | | | |
| U.S. Treasury Bonds, 7.5%, 11/15/16 | | $ | 3,421,000 | | | $ | 4,053,618 | |
| U.S. Treasury Bonds, 6.25%, 8/15/23 | | | 1,445,000 | | | | 1,900,740 | |
| U.S. Treasury Bonds, 6%, 2/15/26 | | | 5,933,000 | | | | 7,828,777 | |
| U.S. Treasury Bonds, 6.75%, 8/15/26 | | | 981,000 | | | | 1,379,225 | |
| U.S. Treasury Bonds, 6.375%, 8/15/27 | | | 2,309,000 | | | | 3,177,761 | |
| U.S. Treasury Bonds, 5.25%, 2/15/29 | | | 2,438,000 | | | | 3,055,882 | |
| U.S. Treasury Bonds, 5%, 5/15/37 | | | 4,133,000 | | | | 5,180,459 | |
| U.S. Treasury Bonds, 4.375%, 2/15/38 | | | 9,535,000 | | | | 10,962,275 | |
| U.S. Treasury Bonds, 4.5%, 8/15/39 | | | 64,440,300 | | | | 75,566,304 | |
| U.S. Treasury Bonds, 3.125%, 2/15/43 | | | 17,406,000 | | | | 15,921,059 | |
| U.S. Treasury Notes, 1.875%, 4/30/14 | | | 16,258,000 | | | | 16,304,368 | |
| U.S. Treasury Notes, 2.625%, 6/30/14 | | | 16,750,000 | | | | 16,890,013 | |
| U.S. Treasury Notes, 4%, 2/15/15 | | | 13,740,000 | | | | 14,245,055 | |
| U.S. Treasury Notes, 2.125%, 5/31/15 (f) | | | 161,986,000 | | | | 165,902,821 | |
| U.S. Treasury Notes, 0.375%, 2/15/16 | | | 132,408,600 | | | | 132,548,291 | |
| U.S. Treasury Notes, 2.625%, 4/30/16 | | | 4,787,000 | | | | 5,016,628 | |
| U.S. Treasury Notes, 0.875%, 12/31/16 | | | 101,987,000 | | | | 102,664,296 | |
| U.S. Treasury Notes, 4.75%, 8/15/17 | | | 11,447,000 | | | | 12,936,003 | |
| U.S. Treasury Notes, 2.625%, 4/30/18 | | | 26,085,000 | | | | 27,590,991 | |
| U.S. Treasury Notes, 2.75%, 2/15/19 | | | 19,471,600 | | | | 20,627,726 | |
| U.S. Treasury Notes, 3.125%, 5/15/19 | | | 18,313,000 | | | | 19,725,097 | |
| U.S. Treasury Notes, 2.625%, 8/15/20 | | | 15,874,000 | | | | 16,494,070 | |
| U.S. Treasury Notes, 2%, 11/30/20 | | | 6,679,000 | | | | 6,648,216 | |
| U.S. Treasury Notes, 3.125%, 5/15/21 | | | 25,810,000 | | | | 27,473,532 | |
| U.S. Treasury Notes, 1.75%, 5/15/22 | | | 59,944,000 | | | | 57,026,406 | |
| U.S. Treasury Notes, 2.5%, 8/15/23 | | | 634,000 | | | | 628,997 | |
| | | | | | | | |
| | | | | | | $ | 771,748,610 | |
| Total Bonds (Identified Cost, $1,915,496,800) | | | | | | $ | 1,960,689,810 | |
15
Portfolio of Investments – continued
| | | | | | | | |
| Money Market Funds - 13.3% | | | | | | | | |
| Issuer | | Shares/Par | | | Value ($) | |
MFS Institutional Money Market Portfolio, 0.08%,
at Cost and Net Asset Value (v) | | | 275,347,466 | | | $ | 275,347,466 | |
| Total Investments (Identified Cost, $2,190,844,266) | | | $ | 2,236,037,276 | |
| | |
| Other Assets, Less Liabilities - (8.2)% | | | | | | | (169,624,476 | ) |
| Net Assets - 100.0% | | | | | | $ | 2,066,412,800 | |
| (f) | All or a portion of the security has been segregated as collateral for open futures contracts. |
| (v) | Underlying affiliated fund that is available only to investment companies managed by MFS. The rate quoted for the MFS Institutional Money Market Portfolio is the annualized seven-day yield of the fund at period end. |
The following abbreviations are used in this report and are defined:
| FRN | | Floating Rate Note. Interest rate resets periodically and may not be the rate reported at period end. |
| STRIPS | | Separate Trading of Registered Interest and Principal of Securities |
Derivative Contracts at 2/28/14
Futures Contracts Outstanding at 2/28/14
| | | | | | | | | | | | | | | | | | |
| Description | | Currency | | | Contracts | | | Value | | Expiration
Date | | | Unrealized
Appreciation
(Depreciation) | |
| Asset Derivatives | | | | | | | | | | | | | | | | | | |
| Interest Rate Futures | | | | | | | | | | | | | | | | | | |
| U.S. Treasury Bond (Long) | | | USD | | | | 230 | | | $33,026,563 | | | June - 2014 | | | | $15,347 | |
| | | | | | | | | | | | | | | | | | |
| Liability Derivatives | | | | | | | | | | | | | | | | | | |
| Interest Rate Futures | | | | | | | | | | | | | | | | | | |
| U.S. Treasury Note 5 yr (Long) | | | USD | | | | 200 | | | $23,971,875 | | | June - 2014 | | | | $(2,246 | ) |
| | | | | | | | | | | | | | | | | | |
At February 28, 2014, the fund had sufficient cash and/or other liquid securities to cover any commitments under these derivative contracts.
See Notes to Financial Statements
16
Financial Statements
STATEMENT OF ASSETS AND LIABILITIES
At 2/28/14
This statement represents your fund’s balance sheet, which details the assets and liabilities comprising the total value of the fund.
| | | | |
| Assets | | | | |
Investments- | | | | |
Non-affiliated issuers, at value (identified cost, $1,915,496,800) | | | $1,960,689,810 | |
Underlying affiliated funds, at cost and value | | | 275,347,466 | |
Total investments, at value (identified cost, $2,190,844,266) | | | $2,236,037,276 | |
Receivables for | | | | |
TBA sale commitments | | | 62,513,579 | |
Fund shares sold | | | 3,447,055 | |
Interest | | | 7,770,115 | |
Other assets | | | 10,692 | |
Total assets | | | $2,309,778,717 | |
| Liabilities | | | | |
Payables for | | | | |
Distributions | | | $492,794 | |
Daily variation margin on open futures contracts | | | 9,061 | |
TBA purchase commitments | | | 238,843,294 | |
Fund shares reacquired | | | 2,738,098 | |
Payable to affiliates | | | | |
Investment adviser | | | 42,187 | |
Shareholder servicing costs | | | 946,972 | |
Distribution and service fees | | | 16,514 | |
Payable for independent Trustees’ compensation | | | 53,310 | |
Accrued expenses and other liabilities | | | 223,687 | |
Total liabilities | | | $243,365,917 | |
Net assets | | | $2,066,412,800 | |
| Net assets consist of | | | | |
Paid-in capital | | | $2,071,038,564 | |
Unrealized appreciation (depreciation) on investments | | | 45,206,111 | |
Accumulated distributions in excess of net realized gain on investments | | | (49,834,239 | ) |
Undistributed net investment income | | | 2,364 | |
Net assets | | | $2,066,412,800 | |
Shares of beneficial interest outstanding | | | 205,629,701 | |
17
Statement of Assets and Liabilities – continued
| | | | | | | | | | | | |
| | | Net assets | | | Shares
outstanding | | | Net asset value
per share (a) | |
Class A | | | $698,250,846 | | | | 69,454,432 | | | | $10.05 | |
Class B | | | 28,208,112 | | | | 2,809,380 | | | | 10.04 | |
Class C | | | 58,229,031 | | | | 5,780,675 | | | | 10.07 | |
Class I | | | 20,973,933 | | | | 2,086,874 | | | | 10.05 | |
Class R1 | | | 5,344,577 | | | | 532,141 | | | | 10.04 | |
Class R2 | | | 142,395,643 | | | | 14,178,621 | | | | 10.04 | |
Class R3 | | | 98,701,071 | | | | 9,820,630 | | | | 10.05 | |
Class R4 | | | 70,548,828 | | | | 7,015,586 | | | | 10.06 | |
Class R5 | | | 943,760,759 | | | | 93,951,362 | | | | 10.05 | |
| (a) | Maximum offering price per share was equal to the net asset value per share for all share classes, except for Class A, for which the maximum offering price per share was $10.55 [100 / 95.25 x $10.05]. On sales of $50,000 or more, the maximum offering price of Class A shares is reduced. A contingent deferred sales charge may be imposed on redemptions of Class A, Class B, and Class C shares. Redemption price per share was equal to the net asset value per share for Classes I, R1, R2, R3, R4, and R5. |
See Notes to Financial Statements
18
Financial Statements
STATEMENT OF OPERATIONS
Year ended 2/28/14
This statement describes how much your fund earned in investment income and accrued in expenses. It also describes any gains and/or losses generated by fund operations.
| | | | |
| Net investment income | | | | |
Income | | | | |
Interest | | | $53,920,307 | |
Dividends from underlying affiliated funds | | | 302,771 | |
Total investment income | | | $54,223,078 | |
Expenses | | | | |
Management fee | | | $8,247,660 | |
Distribution and service fees | | | 4,087,303 | |
Shareholder servicing costs | | | 2,718,802 | |
Administrative services fee | | | 258,884 | |
Independent Trustees’ compensation | | | 45,067 | |
Custodian fee | | | 220,803 | |
Shareholder communications | | | 132,277 | |
Audit and tax fees | | | 59,529 | |
Legal fees | | | 21,409 | |
Miscellaneous | | | 229,226 | |
Total expenses | | | $16,020,960 | |
Fees paid indirectly | | | (29 | ) |
Reduction of expenses by investment adviser and distributor | | | (79,647 | ) |
Net expenses | | | $15,941,284 | |
Net investment income | | | $38,281,794 | |
| Realized and unrealized gain (loss) on investments | |
Realized gain (loss) (identified cost basis) | | | | |
Investments | | | $(10,267,983 | ) |
Futures contracts | | | 1,115,779 | |
Net realized gain (loss) on investments | | | $(9,152,204 | ) |
Change in unrealized appreciation (depreciation) | | | | |
Investments | | | $(47,598,474 | ) |
Futures contracts | | | 13,101 | |
Net unrealized gain (loss) on investments | | | $(47,585,373 | ) |
Net realized and unrealized gain (loss) on investments | | | $(56,737,577 | ) |
Change in net assets from operations | | | $(18,455,783 | ) |
See Notes to Financial Statements
19
Financial Statements
STATEMENTS OF CHANGES IN NET ASSETS
These statements describe the increases and/or decreases in net assets resulting from operations, any distributions, and any shareholder transactions.
| | | | | | | | |
| | | Years ended 2/28 | |
| | | 2014 | | | 2013 | |
| Change in net assets | | | | | | |
| From operations | | | | | | | | |
Net investment income | | | $38,281,794 | | | | $38,700,747 | |
Net realized gain (loss) on investments | | | (9,152,204 | ) | | | 11,778,976 | |
Net unrealized gain (loss) on investments | | | (47,585,373 | ) | | | (15,022,758 | ) |
Change in net assets from operations | | | $(18,455,783 | ) | | | $35,456,965 | |
| Distributions declared to shareholders | | | | | | | | |
From net investment income | | | $(47,334,608 | ) | | | $(53,090,312 | ) |
From net realized gain on investments | | | (6,619,454 | ) | | | (9,521,417 | ) |
Total distributions declared to shareholders | | | $(53,954,062 | ) | | | $(62,611,729 | ) |
Change in net assets from fund share transactions | | | $36,869,356 | | | | $89,399,813 | |
Total change in net assets | | | $(35,540,489 | ) | | | $62,245,049 | |
| Net assets | | | | | | | | |
At beginning of period | | | 2,101,953,289 | | | | 2,039,708,240 | |
At end of period (including undistributed net investment income of $2,364 and accumulated distributions in excess of net investment income of $922,506, respectively) | | | $2,066,412,800 | | | | $2,101,953,289 | |
See Notes to Financial Statements
20
Financial Statements
FINANCIAL HIGHLIGHTS
The financial highlights table is intended to help you understand the fund’s financial performance for the past 5 years (or life of a particular share class, if shorter). Certain information reflects financial results for a single fund share. The total returns in the table represent the rate by which an investor would have earned (or lost) on an investment in the fund share class (assuming reinvestment of all distributions) held for the entire period.
| | | | | | | | | | | | | | | | | | | | |
| Class A | | Years ended 2/29, 2/28 | |
| | | 2014 | | | 2013 | | | 2012 | | | 2011 | | | 2010 | |
Net asset value, beginning of period | | | $10.41 | | | | $10.54 | | | | $10.13 | | | | $10.15 | | | | $9.92 | |
| Income (loss) from investment operations | | | | | | | | | | | | | | | | | | | | |
Net investment income (d) | | | $0.18 | | | | $0.20 | | | | $0.25 | | | | $0.30 | | | | $0.35 | |
Net realized and unrealized gain (loss) on
investments | | | (0.79 | ) | | | (0.02 | ) | | | 0.46 | | | | (0.00 | )(w) | | | 0.27 | |
Total from investment operations | | | $(0.61 | ) | | | $0.18 | | | | $0.71 | | | | $0.30 | | | | $0.62 | |
| Less distributions declared to shareholders | | | | | | | | | | | | | | | | | | | | |
From net investment income | | | $0.22 | | | | $(0.26 | ) | | | $(0.30 | ) | | | $(0.32 | ) | | | $(0.39 | ) |
From net realized gain on investments | | | 0.03 | | | | (0.05 | ) | | | — | | | | — | | | | — | |
Total distributions declared to shareholders | | | $0.25 | | | | $(0.31 | ) | | | $(0.30 | ) | | | $(0.32 | ) | | | $(0.39 | ) |
Net asset value, end of period (x) | | | $10.05 | | | | $10.41 | | | | $10.54 | | | | $10.13 | | | | $10.15 | |
Total return (%) (r)(s)(t)(x) | | | (1.00 | ) | | | 1.74 | | | | 7.04 | | | | 2.96 | | | | 6.31 | |
Ratios (%) (to average net assets)
and Supplemental data: | | | | | | | | | | | | | | | | | | | | |
Expenses before expense reductions (f) | | | 0.88 | | | | 0.87 | | | | 0.86 | | | | 0.87 | | | | 0.88 | |
Expenses after expense reductions (f) | | | 0.87 | | | | 0.87 | | | | 0.86 | | | | 0.87 | | | | 0.88 | |
Net investment income | | | 1.76 | | | | 1.88 | | | | 2.39 | | | | 2.88 | | | | 3.49 | |
Portfolio turnover | | | 112 | | | | 81 | | | | 49 | | | | 34 | | | | 32 | |
Net assets at end of period (000 omitted) | | | $698,251 | | | | $847,276 | | | | $981,980 | | | | $915,576 | | | | $923,918 | |
See Notes to Financial Statements
21
Financial Highlights – continued
| | | | | | | | | | | | | | | | | | | | |
| Class B | | Years ended 2/29, 2/28 | |
| | | 2014 | | | 2013 | | | 2012 | | | 2011 | | | 2010 | |
Net asset value, beginning of period | | | $10.39 | | | | $10.53 | | | | $10.11 | | | | $10.14 | | | | $9.91 | |
| Income (loss) from investment operations | | | | | | | | | | | | | | | | | | | | |
Net investment income (d) | | | $0.10 | | | | $0.12 | | | | $0.17 | | | | $0.22 | | | | $0.28 | |
Net realized and unrealized gain (loss) on
investments | | | (0.63 | ) | | | (0.03 | ) | | | 0.47 | | | | (0.01 | ) | | | 0.26 | |
Total from investment operations | | | $(0.53 | ) | | | $0.09 | | | | $0.64 | | | | $0.21 | | | | $0.54 | |
| Less distributions declared to shareholders | | | | | | | | | | | | | | | | | | | | |
From net investment income | | | $0.15 | | | | $(0.18 | ) | | | $(0.22 | ) | | | $(0.24 | ) | | | $(0.31 | ) |
From net realized gain on investments | | | 0.03 | | | | (0.05 | ) | | | — | | | | — | | | | — | |
Total distributions declared to shareholders | | | $0.18 | | | | $(0.23 | ) | | | $(0.22 | ) | | | $(0.24 | ) | | | $(0.31 | ) |
Net asset value, end of period (x) | | | $10.04 | | | | $10.39 | | | | $10.53 | | | | $10.11 | | | | $10.14 | |
Total return (%) (r)(s)(t)(x) | | | (1.65 | ) | | | 0.88 | | | | 6.35 | | | | 2.09 | | | | 5.52 | |
Ratios (%) (to average net assets)
and Supplemental data: | | | | | | | | | | | | | | | | | | | | |
Expenses before expense reductions (f) | | | 1.63 | | | | 1.62 | | | | 1.61 | | | | 1.62 | | | | 1.63 | |
Expenses after expense reductions (f) | | | 1.63 | | | | 1.62 | | | | 1.61 | | | | 1.62 | | | | 1.63 | |
Net investment income | | | 1.00 | | | | 1.13 | | | | 1.66 | | | | 2.15 | | | | 2.75 | |
Portfolio turnover | | | 112 | | | | 81 | | | | 49 | | | | 34 | | | | 32 | |
Net assets at end of period (000 omitted) | | | $28,208 | | | | $44,012 | | | | $46,645 | | | | $53,577 | | | | $74,842 | |
| |
| Class C | | Years ended 2/29, 2/28 | |
| | | 2014 | | | 2013 | | | 2012 | | | 2011 | | | 2010 | |
Net asset value, beginning of period | | | $10.43 | | | | $10.57 | | | | $10.15 | | | | $10.17 | | | | $9.95 | |
| Income (loss) from investment operations | | | | | | | | | | | | | | | | | | | | |
Net investment income (d) | | | $0.10 | | | | $0.12 | | | | $0.17 | | | | $0.22 | | | | $0.27 | |
Net realized and unrealized gain (loss) on
investments | | | (0.64 | ) | | | (0.02 | ) | | | 0.47 | | | | (0.00 | )(w) | | | 0.26 | |
Total from investment operations | | | $(0.54 | ) | | | $0.10 | | | | $0.64 | | | | $0.22 | | | | $0.53 | |
| Less distributions declared to shareholders | | | | | | | | | | | | | | | | | | | | |
From net investment income | | | $0.15 | | | | $(0.19 | ) | | | $(0.22 | ) | | | $(0.24 | ) | | | $(0.31 | ) |
From net realized gain on investments | | | 0.03 | | | | (0.05 | ) | | | — | | | | — | | | | — | |
Total distributions declared to shareholders | | | $0.18 | | | | $(0.24 | ) | | | $(0.22 | ) | | | $(0.24 | ) | | | $(0.31 | ) |
Net asset value, end of period (x) | | | $10.07 | | | | $10.43 | | | | $10.57 | | | | $10.15 | | | | $10.17 | |
Total return (%) (r)(s)(t)(x) | | | (1.73 | ) | | | 0.88 | | | | 6.33 | | | | 2.19 | | | | 5.40 | |
Ratios (%) (to average net assets)
and Supplemental data: | | | | | | | | | | | | | | | | | | | | |
Expenses before expense reductions (f) | | | 1.63 | | | | 1.62 | | | | 1.61 | | | | 1.62 | | | | 1.62 | |
Expenses after expense reductions (f) | | | 1.63 | | | | 1.62 | | | | 1.61 | | | | 1.62 | | | | 1.62 | |
Net investment income | | | 0.99 | | | | 1.13 | | | | 1.64 | | | | 2.12 | | | | 2.71 | |
Portfolio turnover | | | 112 | | | | 81 | | | | 49 | | | | 34 | | | | 32 | |
Net assets at end of period (000 omitted) | | | $58,229 | | | | $101,229 | | | | $112,961 | | | | $111,328 | | | | $116,622 | |
See Notes to Financial Statements
22
Financial Highlights – continued
| | | | | | | | | | | | | | | | | | | | |
| Class I | | Years ended 2/29, 2/28 | |
| | | 2014 | | | 2013 | | | 2012 | | | 2011 | | | 2010 | |
Net asset value, beginning of period | | | $10.41 | | | | $10.54 | | | | $10.12 | | | | $10.15 | | | | $9.92 | |
| Income (loss) from investment operations | | | | | | | | | | | | | | | | | | | | |
Net investment income (d) | | | $0.20 | | | | $0.25 | | | | $0.27 | | | | $0.32 | | | | $0.38 | |
Net realized and unrealized gain (loss) on
investments | | | (0.84 | ) | | | (0.04 | ) | | | 0.47 | | | | (0.00 | )(w) | | | 0.26 | |
Total from investment operations | | | $(0.64 | ) | | | $0.21 | | | | $0.74 | | | | $0.32 | | | | $0.64 | |
| Less distributions declared to shareholders | | | | | | | | | | | | | | | | | | | | |
From net investment income | | | $0.25 | | | | $(0.29 | ) | | | $(0.32 | ) | | | $(0.35 | ) | | | $(0.41 | ) |
From net realized gain on investments | | | 0.03 | | | | (0.05 | ) | | | — | | | | — | | | | — | |
Total distributions declared to shareholders | | | $0.28 | | | | $(0.34 | ) | | | $(0.32 | ) | | | $(0.35 | ) | | | $(0.41 | ) |
Net asset value, end of period (x) | | | $10.05 | | | | $10.41 | | | | $10.54 | | | | $10.12 | | | | $10.15 | |
Total return (%) (r)(s)(x) | | | (0.75 | ) | | | 1.99 | | | | 7.41 | | | | 3.11 | | | | 6.57 | |
Ratios (%) (to average net assets)
and Supplemental data: | | | | | | | | | | | | | | | | | | | | |
Expenses before expense reductions (f) | | | 0.63 | | | | 0.59 | | | | 0.61 | | | | 0.62 | | | | 0.63 | |
Expenses after expense reductions (f) | | | 0.63 | | | | 0.59 | | | | 0.60 | | | | 0.62 | | | | 0.63 | |
Net investment income | | | 1.98 | | | | 2.33 | | | | 2.64 | | | | 3.13 | | | | 3.73 | |
Portfolio turnover | | | 112 | | | | 81 | | | | 49 | | | | 34 | | | | 32 | |
Net assets at end of period (000 omitted) | | | $20,974 | | | | $40,628 | | | | $562,634 | | | | $434,682 | | | | $318,667 | |
| |
| Class R1 | | Years ended 2/29, 2/28 | |
| | | 2014 | | | 2013 | | | 2012 | | | 2011 | | | 2010 | |
Net asset value, beginning of period | | | $10.40 | | | | $10.53 | | | | $10.11 | �� | | | $10.14 | | | | $9.91 | |
| Income (loss) from investment operations | | | | | | | | | | | | | | | | | | | | |
Net investment income (d) | | | $0.10 | | | | $0.12 | | | | $0.17 | | | | $0.22 | | | | $0.28 | |
Net realized and unrealized gain (loss) on
investments | | | (0.64 | ) | | | (0.02 | ) | | | 0.47 | | | | (0.01 | ) | | | 0.26 | |
Total from investment operations | | | $(0.54 | ) | | | $0.10 | | | | $0.64 | | | | $0.21 | | | | $0.54 | |
| Less distributions declared to shareholders | | | | | | | | | | | | | | | | | | | | |
From net investment income | | | $0.15 | | | | $(0.18 | ) | | | $(0.22 | ) | | | $(0.24 | ) | | | $(0.31 | ) |
From net realized gain on investments | | | 0.03 | | | | (0.05 | ) | | | — | | | | — | | | | — | |
Total distributions declared to shareholders | | | $0.18 | | | | $(0.23 | ) | | | $(0.22 | ) | | | $(0.24 | ) | | | $(0.31 | ) |
Net asset value, end of period (x) | | | $10.04 | | | | $10.40 | | | | $10.53 | | | | $10.11 | | | | $10.14 | |
Total return (%) (r)(s)(x) | | | (1.74 | ) | | | 0.98 | | | | 6.35 | | | | 2.09 | | | | 5.52 | |
Ratios (%) (to average net assets)
and Supplemental data: | | | | | | | | | | | | | | | | | | | | |
Expenses before expense reductions (f) | | | 1.63 | | | | 1.62 | | | | 1.61 | | | | 1.62 | | | | 1.63 | |
Expenses after expense reductions (f) | | | 1.63 | | | | 1.62 | | | | 1.61 | | | | 1.62 | | | | 1.63 | |
Net investment income | | | 1.00 | | | | 1.14 | | | | 1.64 | | | | 2.14 | | | | 2.74 | |
Portfolio turnover | | | 112 | | | | 81 | | | | 49 | | | | 34 | | | | 32 | |
Net assets at end of period (000 omitted) | | | $5,345 | | | | $6,647 | | | | $7,902 | | | | $7,219 | | | | $6,246 | |
See Notes to Financial Statements
23
Financial Highlights – continued
| | | | | | | | | | | | | | | | | | | | |
| Class R2 | | Years ended 2/29, 2/28 | |
| | | 2014 | | | 2013 | | | 2012 | | | 2011 | | | 2010 | |
Net asset value, beginning of period | | | $10.40 | | | | $10.53 | | | | $10.11 | | | | $10.14 | | | | $9.91 | |
| Income (loss) from investment operations | | | | | | | | | | | | | | | | | | | | |
Net investment income (d) | | | $0.15 | | | | $0.17 | | | | $0.22 | | | | $0.27 | | | | $0.32 | |
Net realized and unrealized gain (loss) on
investments | | | (0.74 | ) | | | (0.01 | ) | | | 0.47 | | | | (0.01 | ) | | | 0.27 | |
Total from investment operations | | | $(0.59 | ) | | | $0.16 | | | | $0.69 | | | | $0.26 | | | | $0.59 | |
| Less distributions declared to shareholders | | | | | | | | | | | | | | | | | | | | |
From net investment income | | | $0.20 | | | | $(0.24 | ) | | | $(0.27 | ) | | | $(0.29 | ) | | | $(0.36 | ) |
From net realized gain on investments | | | 0.03 | | | | (0.05 | ) | | | — | | | | — | | | | — | |
Total distributions declared to shareholders | | | $0.23 | | | | $(0.29 | ) | | | $(0.27 | ) | | | $(0.29 | ) | | | $(0.36 | ) |
Net asset value, end of period (x) | | | $10.04 | | | | $10.40 | | | | $10.53 | | | | $10.11 | | | | $10.14 | |
Total return (%) (r)(s)(x) | | | (1.25 | ) | | | 1.48 | | | | 6.88 | | | | 2.60 | | | | 6.04 | |
Ratios (%) (to average net assets)
and Supplemental data: | | | | | | | | | | | | | | | | | | | | |
Expenses before expense reductions (f) | | | 1.13 | | | | 1.12 | | | | 1.11 | | | | 1.12 | | | | 1.13 | |
Expenses after expense reductions (f) | | | 1.13 | | | | 1.12 | | | | 1.11 | | | | 1.12 | | | | 1.12 | |
Net investment income | | | 1.51 | | | | 1.63 | | | | 2.13 | | | | 2.62 | | | | 3.22 | |
Portfolio turnover | | | 112 | | | | 81 | | | | 49 | | | | 34 | | | | 32 | |
Net assets at end of period (000 omitted) | | | $142,396 | | | | $165,865 | | | | $168,809 | | | | $123,672 | | | | $73,052 | |
| |
| Class R3 | | Years ended 2/29, 2/28 | |
| | | 2014 | | | 2013 | | | 2012 | | | 2011 | | | 2010 | |
Net asset value, beginning of period | | | $10.40 | | | | $10.54 | | | | $10.12 | | | | $10.15 | | | | $9.92 | |
| Income (loss) from investment operations | | | | | | | | | | | | | | | | | | | | |
Net investment income (d) | | | $0.18 | | | | $0.20 | | | | $0.25 | | | | $0.29 | | | | $0.35 | |
Net realized and unrealized gain (loss) on
investments | | | (0.78 | ) | | | (0.03 | ) | | | 0.46 | | | | (0.00 | )(w) | | | 0.27 | |
Total from investment operations | | | $(0.60 | ) | | | $0.17 | | | | $0.71 | | | | $0.29 | | | | $0.62 | |
| Less distributions declared to shareholders | | | | | | | | | | | | | | | | | | | | |
From net investment income | | | $0.22 | | | | $(0.26 | ) | | | $(0.29 | ) | | | $(0.32 | ) | | | $(0.39 | ) |
From net realized gain on investments | | | 0.03 | | | | (0.05 | ) | | | — | | | | — | | | | — | |
Total distributions declared to shareholders | | | $0.25 | | | | $(0.31 | ) | | | $(0.29 | ) | | | $(0.32 | ) | | | $(0.39 | ) |
Net asset value, end of period (x) | | | $10.05 | | | | $10.40 | | | | $10.54 | | | | $10.12 | | | | $10.15 | |
Total return (%) (r)(s)(x) | | | (0.90 | ) | | | 1.64 | | | | 7.14 | | | | 2.86 | | | | 6.31 | |
Ratios (%) (to average net assets)
and Supplemental data: | | | | | | | | | | | | | | | | | | | | |
Expenses before expense reductions (f) | | | 0.88 | | | | 0.87 | | | | 0.86 | | | | 0.87 | | | | 0.88 | |
Expenses after expense reductions (f) | | | 0.87 | | | | 0.87 | | | | 0.86 | | | | 0.87 | | | | 0.87 | |
Net investment income | | | 1.76 | | | | 1.88 | | | | 2.36 | | | | 2.87 | | | | 3.47 | |
Portfolio turnover | | | 112 | | | | 81 | | | | 49 | | | | 34 | | | | 32 | |
Net assets at end of period (000 omitted) | | | $98,701 | | | | $104,515 | | | | $107,150 | | | | $70,988 | | | | $46,780 | |
See Notes to Financial Statements
24
Financial Highlights – continued
| | | | | | | | | | | | | | | | | | | | |
| Class R4 | | Years ended 2/29, 2/28 | |
| | | 2014 | | | 2013 | | | 2012 | | | 2011 | | | 2010 | |
Net asset value, beginning of period | | | $10.41 | | | | $10.55 | | | | $10.13 | | | | $10.15 | | | | $9.93 | |
| Income (loss) from investment operations | | | | | | | | | | | | | | | | | | | | |
Net investment income (d) | | | $0.20 | | | | $0.22 | | | | $0.27 | | | | $0.32 | | | | $0.37 | |
Net realized and unrealized gain (loss) on
investments | | | (0.83 | ) | | | (0.02 | ) | | | 0.47 | | | | 0.01 | (g) | | | 0.26 | |
Total from investment operations | | | $(0.63 | ) | | | $0.20 | | | | $0.74 | | | | $0.33 | | | | $0.63 | |
| Less distributions declared to shareholders | | | | | | | | | | | | | | | | | | | | |
From net investment income | | | $0.25 | | | | $(0.29 | ) | | | $(0.32 | ) | | | $(0.35 | ) | | | $(0.41 | ) |
From net realized gain on investments | | | 0.03 | | | | (0.05 | ) | | | — | | | | — | | | | — | |
Total distributions declared to shareholders | | | $0.28 | | | | $(0.34 | ) | | | $(0.32 | ) | | | $(0.35 | ) | | | $(0.41 | ) |
Net asset value, end of period (x) | | | $10.06 | | | | $10.41 | | | | $10.55 | | | | $10.13 | | | | $10.15 | |
Total return (%) (r)(s)(x) | | | (0.65 | ) | | | 1.89 | | | | 7.40 | | | | 3.22 | | | | 6.46 | |
Ratios (%) (to average net assets)
and Supplemental data: | | | | | | | | | | | | | | | | | | | | |
Expenses before expense reductions (f) | | | 0.63 | | | | 0.62 | | | | 0.60 | | | | 0.63 | | | | 0.63 | |
Expenses after expense reductions (f) | | | 0.62 | | | | 0.62 | | | | 0.60 | | | | 0.63 | | | | 0.62 | |
Net investment income | | | 2.01 | | | | 2.10 | | | | 2.61 | | | | 3.10 | | | | 3.71 | |
Portfolio turnover | | | 112 | | | | 81 | | | | 49 | | | | 34 | | | | 32 | |
Net assets at end of period (000 omitted) | | | $70,549 | | | | $70,662 | | | | $51,626 | | | | $27,022 | | | | $11,337 | |
| | | | | | | | |
| Class R5 | | Years ended 2/28 | |
| | | 2014 | | | 2013 (i) | |
Net asset value, beginning of period | | | $10.40 | | | | $10.53 | |
| Income (loss) from investment operations | | | | | | | | |
Net investment income (d) | | | $0.21 | | | | $0.13 | |
Net realized and unrealized gain (loss) on
investments and foreign currency | | | (0.85 | ) | | | (0.06 | ) |
Total from investment operations | | | $(0.64 | ) | | | $0.07 | |
| Less distributions declared to shareholders | | | | | | | | |
From net investment income | | | $0.26 | | | | $(0.20 | ) |
From net realized gain on investments | | | 0.03 | | | | — | |
Total distributions declared to shareholders | | | $0.29 | | | | $(0.20 | ) |
Net asset value, end of period (x) | | | $10.05 | | | | $10.40 | |
Total return (%) (r)(s)(x) | | | (0.54 | ) | | | 0.62 | (n) |
Ratios (%) (to average net assets)
and Supplemental data: | | | | | | | | |
Expenses before expense reductions (f) | | | 0.51 | | | | 0.54 | (a) |
Expenses after expense reductions (f) | | | 0.51 | | | | 0.54 | (a) |
Net investment income | | | 2.13 | | | | 1.81 | (a) |
Portfolio turnover | | | 112 | | | | 81 | |
Net assets at end of period (000 omitted) | | | $943,761 | | | | $721,119 | |
See Notes to Financial Statements
25
Financial Highlights – continued
| (d) | Per share data is based on average shares outstanding. |
| (f) | Ratios do not reflect reductions from fees paid indirectly, if applicable. |
| (g) | The per share amount varies from the net realized and unrealized gain/loss for the period because of the timing of sales of fund shares and the per share amount of realized and unrealized gains and losses at such time. |
| (i) | For the period from the class inception, July 2, 2012, through the stated period end. |
| (r) | Certain expenses have been reduced without which performance would have been lower. |
| (s) | From time to time the fund may receive proceeds from litigation settlements, without which performance would be lower. |
| (t) | Total returns do not include any applicable sales charges. |
| (w) | Per share amount was less than $0.01. |
| (x) | The net asset values per share and total returns have been calculated on net assets which include adjustments made in accordance with U.S. generally accepted accounting principles required at period end for financial reporting purposes. |
See Notes to Financial Statements
26
NOTES TO FINANCIAL STATEMENTS
(1) Business and Organization
MFS Government Securities Fund (the fund) is a diversified series of MFS Series Trust XIII (the trust). The trust is organized as a Massachusetts business trust and is registered under the Investment Company Act of 1940, as amended, as an open-end management investment company.
(2) Significant Accounting Policies
General – The preparation of financial statements in conformity with U.S. generally accepted accounting principles requires management to make estimates and assumptions that affect the reported amounts of assets and liabilities, and disclosure of contingent assets and liabilities at the date of the financial statements and the reported amounts of increases and decreases in net assets from operations during the reporting period. Actual results could differ from those estimates. In the preparation of these financial statements, management has evaluated subsequent events occurring after the date of the fund’s Statement of Assets and Liabilities through the date that the financial statements were issued. The fund invests a significant portion of its assets in asset-backed and/or mortgage-backed securities. The value of these securities may depend, in part, on the issuer’s or borrower’s credit quality or ability to pay principal and interest when due and may fall if an issuer or borrower defaults on its obligation to pay principal or interest or if the instrument’s credit rating is downgraded by a credit rating agency. U.S. Government securities not supported as to the payment of principal or interest by the U.S. Treasury, such as those issued by Fannie Mae, Freddie Mac, and the Federal Home Loan Banks, are subject to greater credit risk than are U.S. Government securities supported by the U.S. Treasury, such as those issued by Ginnie Mae.
In this reporting period, the fund adopted the disclosure provisions of the Financial Accounting Standards Board (FASB) Accounting Standards Update 2011-11 (“ASU 2011-11”), Balance Sheet (Topic 210) – Disclosures about Offsetting Assets and Liabilities along with the related scope clarification provisions of FASB Accounting Standards Update 2013-01 (“ASU 2013-01”) entitled Balance Sheet (Topic 210) – Clarifying the Scope of Disclosures about Offsetting Assets and Liabilities. ASU 2011-11 is intended to enhance disclosures on the offsetting of financial assets and liabilities by requiring entities to disclose both gross and net information about financial instruments and transactions that are either offset in the statement of financial position or subject to a an enforceable Master Netting Agreement or similar arrangement. ASU 2013-01 limits the scope of ASU 2011-11’s disclosure requirements on offsetting to financial assets and financial liabilities related to derivatives, repurchase and reverse repurchase agreements, and securities lending and securities borrowing transactions. The disclosures required by ASU 2011-11, to the extent applicable to the fund, have been included in the fund’s Significant Accounting Policies note under the captions for each of the fund’s in-scope financial instruments and transactions.
In June 2013, FASB issued Accounting Standards Update 2013-08 (“ASU 2013-08”) Financial Services – Investment Companies (Topic 946) – Amendments to the Scope, Measurement, and Disclosure Requirements which is effective for interim and annual reporting periods in fiscal years that begin after December 15, 2013. ASU 2013-08 sets
27
Notes to Financial Statements – continued
forth a methodology for determining whether an entity should be characterized as an investment company and prescribes fair value accounting for an investment company’s non-controlling ownership interest in another investment company. FASB has determined that a fund registered under the Investment Company Act of 1940 automatically meets ASU 2013-08’s criteria for an investment company. Although still evaluating the potential impacts of ASU 2013-08 to the fund, management expects that the impact of the fund’s adoption will be limited to additional financial statement disclosures.
Investment Valuations – Debt instruments and floating rate loans (other than short-term instruments), including restricted debt instruments, are generally valued at an evaluated or composite bid as provided by a third-party pricing service. Short-term instruments with a maturity at issuance of 60 days or less generally are valued at amortized cost, which approximates market value. Futures contracts are generally valued at last posted settlement price as provided by a third-party pricing service on the market on which they are primarily traded. Futures contracts for which there were no trades that day for a particular position are generally valued at the closing bid quotation as provided by a third-party pricing service on the market on which such futures contracts are primarily traded. Open-end investment companies are generally valued at net asset value per share. Securities and other assets generally valued on the basis of information from a third-party pricing service may also be valued at a broker/dealer bid quotation. Values obtained from third-party pricing services can utilize both transaction data and market information such as yield, quality, coupon rate, maturity, type of issue, trading characteristics, and other market data.
The Board of Trustees has delegated primary responsibility for determining or causing to be determined the value of the fund’s investments (including any fair valuation) to the adviser pursuant to valuation policies and procedures approved by the Board. If the adviser determines that reliable market quotations are not readily available, investments are valued at fair value as determined in good faith by the adviser in accordance with such procedures under the oversight of the Board of Trustees. Under the fund’s valuation policies and procedures, market quotations are not considered to be readily available for most types of debt instruments and floating rate loans and many types of derivatives. These investments are generally valued at fair value based on information from third-party pricing services. In addition, investments may be valued at fair value if the adviser determines that an investment’s value has been materially affected by events occurring after the close of the exchange or market on which the investment is principally traded (such as foreign exchange or market) and prior to the determination of the fund’s net asset value, or after the halting of trading of a specific security where trading does not resume prior to the close of the exchange or market on which the security is principally traded. The adviser generally relies on third-party pricing services or other information (such as the correlation with price movements of similar securities in the same or other markets; the type, cost and investment characteristics of the security; the business and financial condition of the issuer; and trading and other market data) to assist in determining whether to fair value and at what value to fair value an investment. The value of an investment for purposes of calculating the fund’s net asset value can differ depending on the source and method used to determine value. When fair valuation is used, the value of an investment used to determine the
28
Notes to Financial Statements – continued
fund’s net asset value may differ from quoted or published prices for the same investment. There can be no assurance that the fund could obtain the fair value assigned to an investment if it were to sell the investment at the same time at which the fund determines its net asset value per share.
Various inputs are used in determining the value of the fund’s assets or liabilities. These inputs are categorized into three broad levels. In certain cases, the inputs used to measure fair value may fall into different levels of the fair value hierarchy. In such cases, an investment’s level within the fair value hierarchy is based on the lowest level of input that is significant to the fair value measurement. The fund’s assessment of the significance of a particular input to the fair value measurement in its entirety requires judgment, and considers factors specific to the investment. Level 1 includes unadjusted quoted prices in active markets for identical assets or liabilities. Level 2 includes other significant observable market-based inputs (including quoted prices for similar securities, interest rates, prepayment speed, and credit risk). Level 3 includes unobservable inputs, which may include the adviser’s own assumptions in determining the fair value of investments. Other financial instruments are derivative instruments not reflected in total investments, such as futures contracts. The following is a summary of the levels used as of February 28, 2014 in valuing the fund’s assets or liabilities:
| | | | | | | | | | | | | | | | |
| Investments at Value | | Level 1 | | | Level 2 | | | Level 3 | | | Total | |
| U.S. Treasury Bonds & U.S. Government Agency & Equivalents | | | $— | | | | $922,104,946 | | | | $— | | | | $922,104,946 | |
| Non-U.S. Sovereign Debt | | | — | | | | 2,879,231 | | | | — | | | | 2,879,231 | |
| U.S. Corporate Bonds | | | — | | | | 10,016,680 | | | | — | | | | 10,016,680 | |
| Residential Mortgage-Backed Securities | | | — | | | | 972,835,834 | | | | — | | | | 972,835,834 | |
| Commercial Mortgage-Backed Securities | | | — | | | | 52,853,119 | | | | — | | | | 52,853,119 | |
| Mutual Funds | | | 275,347,466 | | | | — | | | | — | | | | 275,347,466 | |
| Total Investments | | | $275,347,466 | | | | $1,960,689,810 | | | | $— | | | | $2,236,037,276 | |
| | | |
| Other Financial Instruments | | | | | | | | | | |
| Futures Contracts | | | $13,101 | | | | $— | | | | $— | | | | $13,101 | |
For further information regarding security characteristics, see the Portfolio of Investments.
Derivatives – The fund uses derivatives for different purposes, primarily to increase or decrease exposure to a particular market or segment of the market, or security, to increase or decrease interest rate exposure, or as alternatives to direct investments. Derivatives are used for hedging or non-hedging purposes. While hedging can reduce or eliminate losses, it can also reduce or eliminate gains. When the fund uses derivatives as an investment to increase market exposure, or for hedging purposes, gains and losses from derivative instruments may be substantially greater than the derivative’s original cost.
The derivative instruments used by the fund were futures contracts. The fund’s period end derivatives, as presented in the Portfolio of Investments and the associated Derivative Contract tables, generally are indicative of the volume of its derivative activity during the period.
29
Notes to Financial Statements – continued
The following table presents, by major type of derivative contract, the fair value, on a gross basis, of the asset and liability components of derivatives held by the fund at February 28, 2014 as reported in the Statement of Assets and Liabilities:
| | | | | | | | | | |
| | | | | Fair Value (a) | |
| Risk | | Derivative Contracts | | Asset Derivatives | | | Liability Derivatives | |
| Interest Rate | | Interest Rate Futures | | | $15,347 | | | | $(2,246) | |
| (a) | The value of futures contracts outstanding includes cumulative appreciation (depreciation) as reported in the fund’s Portfolio of Investments. Only the current day variation margin for futures contracts is separately reported within the fund’s Statement of Assets and Liabilities. |
The following table presents, by major type of derivative contract, the realized gain (loss) on derivatives held by the fund for the year ended February 28, 2014 as reported in the Statement of Operations:
| | | | |
| Risk | | Futures Contracts | |
| Interest Rate | | | $1,115,779 | |
The following table presents, by major type of derivative contract, the change in unrealized appreciation (depreciation) on derivatives held by the fund for the year ended February 28, 2014 as reported in the Statement of Operations:
| | | | |
| Risk | | Futures Contracts | |
| Interest Rate | | | $13,101 | |
Derivative counterparty credit risk is managed through formal evaluation of the creditworthiness of all potential counterparties. On certain, but not all, over-the-counter derivatives, the fund attempts to reduce its exposure to counterparty credit risk whenever possible by entering into an International Swaps and Derivatives Association (ISDA) Master Agreement on a bilateral basis with each of the counterparties with whom it undertakes a significant volume of transactions. The ISDA Master Agreement gives each party to the agreement the right to terminate all transactions traded under such agreement if there is a certain deterioration in the credit quality of the other party. Upon an event of default or a termination of the ISDA Master Agreement, the non-defaulting party has the right to close out all transactions traded under such agreement and to net amounts owed under each transaction to one net amount payable by one party to the other. This right to close out and net payments across all transactions traded under the ISDA Master Agreement could result in a reduction of the fund’s credit risk to such counterparty equal to any amounts payable by the fund under the applicable transactions, if any. The fund’s right to setoff may be restricted or prohibited by the bankruptcy or insolvency laws of the particular jurisdiction to which a specific ISDA counterparty is subject.
Collateral and margin requirements differ by type of derivative. Margin requirements are set by the broker or clearing house for cleared derivatives (i.e., futures contracts, cleared swaps, and exchange-traded options) while collateral terms are contract specific for over-the-counter traded derivatives (i.e., forward foreign currency exchange contracts, uncleared swap agreements, and over-the-counter options). For derivatives traded under an ISDA Master Agreement, the collateral requirements are netted across all transactions traded under such agreement and one amount is posted from
30
Notes to Financial Statements – continued
one party to the other to collateralize such obligations. Cash that has been segregated to cover the fund’s collateral or margin obligations under derivative contracts, if any, will be reported separately in the Statement of Assets and Liabilities as “Restricted cash” or “Deposits with brokers.” Securities pledged as collateral or margin for the same purpose, if any, are noted in the Portfolio of Investments.
The fund’s accounting policy with respect to balance sheet offsetting is that, absent an event of default by the counterparty or a termination of the agreement, the ISDA Master Agreement does not result in an offset of reported amounts of financial assets and financial liabilities in the Statement of Assets and Liabilities across transactions between the fund and the applicable counterparty.
Futures Contracts – The fund entered into futures contracts which may be used to hedge against or obtain broad market exposure, interest rate exposure, or to manage duration. A futures contract represents a commitment for the future purchase or sale of an asset at a specified price on a specified date.
Upon entering into a futures contract, the fund is required to deposit with the broker, either in cash or securities, an initial margin in an amount equal to a certain percentage of the notional amount of the contract. Subsequent payments (variation margin) are made or received by the fund each day, depending on the daily fluctuations in the value of the contract, and are recorded for financial statement purposes as unrealized gain or loss by the fund until the contract is closed or expires at which point the gain or loss on futures contracts is realized.
The fund bears the risk of interest rates or securities prices moving unexpectedly, in which case, the fund may not achieve the anticipated benefits of the futures contracts and may realize a loss. While futures contracts may present less counterparty risk to the fund since the contracts are exchange traded and the exchange’s clearinghouse guarantees payments to the broker, there is still counterparty credit risk due to the insolvency of the broker. The fund’s maximum risk of loss due to counterparty credit risk is equal to the margin posted by the fund to the broker plus any gains or minus any losses on the outstanding futures contracts.
Indemnifications – Under the fund’s organizational documents, its officers and Trustees may be indemnified against certain liabilities and expenses arising out of the performance of their duties to the fund. Additionally, in the normal course of business, the fund enters into agreements with service providers that may contain indemnification clauses. The fund’s maximum exposure under these agreements is unknown as this would involve future claims that may be made against the fund that have not yet occurred.
Investment Transactions and Income – Investment transactions are recorded on the trade date. Interest income is recorded on the accrual basis. All premium and discount is amortized or accreted for financial statement purposes in accordance with U.S. generally accepted accounting principles. Interest payments received in additional securities are recorded on the ex-interest date in an amount equal to the value of the security on such date.
The fund may receive proceeds from litigation settlements. Any proceeds received from litigation involving portfolio holdings are reflected in the Statement of Operations in realized gain/loss if the security has been disposed of by the fund or in unrealized
31
Notes to Financial Statements – continued
gain/loss if the security is still held by the fund. Any other proceeds from litigation not related to portfolio holdings are reflected as other income in the Statement of Operations.
The fund purchased or sold debt securities on a when-issued or delayed delivery basis, or in a “To Be Announced” (TBA) or “forward commitment” transaction with delivery or payment to occur at a later date beyond the normal settlement period. TBA securities resulting from these transactions are included in the Portfolio of Investments. At the time a fund enters into a commitment to purchase or sell a security, the transaction is recorded and the value of the security acquired is reflected in the fund’s net asset value. The price of such security and the date that the security will be delivered and paid for are fixed at the time the transaction is negotiated. The value of the security may vary with market fluctuations. TBA purchase and sale commitments are held at carrying amount, which approximates fair value and are categorized as level 2 within the fair value hierarchy. No interest accrues to the fund until payment takes place. At the time that a fund enters into this type of transaction, the fund is required to have sufficient cash and/or liquid securities to cover its commitments. Losses may arise due to changes in the value of the underlying securities or if the counterparty does not perform under the contract’s terms, or if the issuer does not issue the securities due to political, economic or other factors. Additionally, losses may arise due to declines in the value of the securities prior to settlement date.
Fees Paid Indirectly – The fund’s custody fee may be reduced according to an arrangement that measures the value of cash deposited with the custodian by the fund. This amount, for the year ended February 28, 2014, is shown as a reduction of total expenses in the Statement of Operations.
Tax Matters and Distributions – The fund intends to qualify as a regulated investment company, as defined under Subchapter M of the Internal Revenue Code, and to distribute all of its taxable and tax-exempt income, including realized capital gains. As a result, no provision for federal income tax is required. The fund’s federal tax returns, when filed, will remain subject to examination by the Internal Revenue Service for a three year period. Management has analyzed the fund’s tax positions taken on federal and state tax returns for all open tax years and does not believe that there are any uncertain tax positions that require recognition of a tax liability.
Distributions to shareholders are recorded on the ex-dividend date. Income and capital gain distributions are determined in accordance with income tax regulations, which may differ from U.S. generally accepted accounting principles. Certain capital accounts in the financial statements are periodically adjusted for permanent differences in order to reflect their tax character. These adjustments have no impact on net assets or net asset value per share. Temporary differences which arise from recognizing certain items of income, expense, gain or loss in different periods for financial statement and tax purposes will reverse at some time in the future. Distributions in excess of net investment income or net realized gains are temporary overdistributions for financial statement purposes resulting from differences in the recognition or classification of income or distributions for financial statement and tax purposes.
Book/tax differences primarily relate to amortization and accretion of debt securities.
32
Notes to Financial Statements – continued
The tax character of distributions declared to shareholders for the last two fiscal years is as follows:
| | | | | | | | |
| | | 2/28/14 | | | 2/28/13 | |
Ordinary income (including any
short-term capital gains) | | | $53,954,062 | | | | $54,540,894 | |
| Long-term capital gains | | | — | | | | 8,070,835 | |
| Total distributions | | | $53,954,062 | | | | $62,611,729 | |
The federal tax cost and the tax basis components of distributable earnings were as follows:
| | | | |
| As of 2/28/14 | | | |
| Cost of investments | | | $2,221,822,910 | |
| Gross appreciation | | | 42,228,049 | |
| Gross depreciation | | | (28,013,683 | ) |
| Net unrealized appreciation (depreciation) | | | $14,214,366 | |
| Undistributed ordinary income | | | 4,333,995 | |
| Capital loss carryforwards | | | (16,219,770 | ) |
| Post-October capital loss deferral | | | (1,946,752 | ) |
| Other temporary differences | | | (5,007,603 | ) |
As of February 28, 2014, the fund had capital loss carryforwards available to offset future realized gains. Such losses are characterized as follows:
| | | | |
| Short-Term | | | $(7,870,930 | ) |
| Long-Term | | | (8,348,840 | ) |
| Total | | | $(16,219,770 | ) |
Under the Regulated Investment Company Modernization Act of 2010 (the “Act”), the above net capital losses may be carried forward indefinitely, and their character is retained as short-term and/or long-term losses. Previously, net capital losses were carried forward for eight years and treated as short-term losses.
Multiple Classes of Shares of Beneficial Interest – The fund offers multiple classes of shares, which differ in their respective distribution and service fees. The fund’s income and common expenses are allocated to shareholders based on the value of settled shares outstanding of each class. The fund’s realized and unrealized gain (loss) are allocated to shareholders based on the daily net assets of each class. Dividends are declared separately for each class. Differences in per share dividend rates are generally due to differences in separate class expenses. Class B shares will convert to Class A
33
Notes to Financial Statements – continued
shares approximately eight years after purchase. The fund’s distributions declared to shareholders as reported in the Statements of Changes in Net Assets are presented by class as follows:
| | | | | | | | | | | | | | | | |
| | | From net investment
income | | | From net realized gain on
investments | |
| | | Year
ended
2/28/14 | | | Year
ended
2/28/13 (i) | | | Year
ended
2/28/14 | | | Year
ended
2/28/13 (i) | |
| Class A | | | $16,599,827 | | | | $23,727,857 | | | | $2,545,083 | | | | $4,419,398 | |
| Class B | | | 503,035 | | | | 827,611 | | | | 126,410 | | | | 216,076 | |
| Class C | | | 1,094,015 | | | | 1,965,696 | | | | 285,650 | | | | 520,156 | |
| Class I | | | 742,543 | | | | 6,811,018 | | | | 119,771 | | | | 2,769,801 | |
| Class R1 | | | 82,315 | | | | 129,706 | | | | 18,634 | | | | 33,904 | |
| Class R2 | | | 2,935,046 | | | | 3,957,416 | | | | 493,835 | | | | 801,446 | |
| Class R3 | | | 2,281,830 | | | | 2,789,529 | | | | 340,540 | | | | 516,221 | |
| Class R4 | | | 1,687,754 | | | | 1,489,916 | | | | 218,191 | | | | 244,415 | |
| Class R5 | | | 21,408,243 | | | | 11,391,563 | | | | 2,471,340 | | | | — | |
| Total | | | $47,334,608 | | | | $53,090,312 | | | | $6,619,454 | | | | $9,521,417 | |
| (i) | For Class R5, the period is from inception, July 2, 2012, through the stated period end. |
(3) Transactions with Affiliates
Investment Adviser – The fund has an investment advisory agreement with MFS to provide overall investment management and related administrative services and facilities to the fund. The management fee is computed daily and paid monthly at an annual rate of 0.40% of the fund’s average daily net assets.
Effective April 1, 2013, MFS has agreed in writing to reduce its management fee by a specified amount if certain MFS mutual fund assets exceed thresholds agreed to by MFS and the fund’s Board of Trustees. For the period April 1, 2013 through February 28, 2014, this management fee reduction amounted to $27,518, which is included in the reduction of total expenses in the Statement of Operations. The management fee incurred for the year ended February 28, 2014 was equivalent to an annual effective rate of 0.40% of the fund’s average daily net assets.
Distributor – MFS Fund Distributors, Inc. (MFD), a wholly-owned subsidiary of MFS, as distributor, received $208,762 for the year ended February 28, 2014, as its portion of the initial sales charge on sales of Class A shares of the fund.
The Board of Trustees has adopted a distribution plan for certain class shares pursuant to Rule 12b-1 of the Investment Company Act of 1940.
The fund’s distribution plan provides that the fund will pay MFD for services provided by MFD and financial intermediaries in connection with the distribution and servicing of certain share classes. One component of the plan is a distribution fee paid to MFD and another component of the plan is a service fee paid to MFD. MFD may subsequently pay all, or a portion, of the distribution and/or service fees to financial intermediaries.
34
Notes to Financial Statements – continued
Distribution Plan Fee Table:
| | | | | | | | | | | | | | | | | | | | |
| | | Distribution
Fee Rate (d) | | | Service
Fee Rate (d) | | | Total
Distribution
Plan (d) | | | Annual
Effective
Rate (e) | | | Distribution
and Service
Fee | |
| Class A | | | — | | | | 0.25% | | | | 0.25% | | | | 0.24% | | | | $1,894,743 | |
| Class B | | | 0.75% | | | | 0.25% | | | | 1.00% | | | | 1.00% | | | | 352,341 | |
| Class C | | | 0.75% | | | | 0.25% | | | | 1.00% | | | | 1.00% | | | | 767,912 | |
| Class R1 | | | 0.75% | | | | 0.25% | | | | 1.00% | | | | 1.00% | | | | 57,115 | |
| Class R2 | | | 0.25% | | | | 0.25% | | | | 0.50% | | | | 0.50% | | | | 755,284 | |
| Class R3 | | | — | | | | 0.25% | | | | 0.25% | | | | 0.25% | | | | 259,908 | |
| Total Distribution and Service Fees | | | | $4,087,303 | |
| (d) | In accordance with the distribution plan for certain classes, the fund pays distribution and/or service fees equal to these annual percentage rates of each class’s average daily net assets. The distribution and service fee rates disclosed by class represent the current rates in effect at the end of the reporting period. Any rate changes, if applicable, are detailed below. |
| (e) | The annual effective rates represent actual fees incurred under the distribution plan for the year ended February 28, 2014 based on each class’s average daily net assets. MFD has voluntarily agreed to rebate a portion of each class’s 0.25% service fee attributable to accounts for which MFD retains the 0.25% service fee except for accounts attributable to MFS or its affiliates’ seed money. For the year ended February 28, 2014, this rebate amounted to $46,646, $461, $206, and $87 for Class A, Class B, Class C, and Class R2, respectively, and is included in the reduction of total expenses in the Statement of Operations. |
Certain Class A shares are subject to a contingent deferred sales charge (CDSC) in the event of a shareholder redemption within 18 months of purchase for shares purchased on or after August 1, 2012, and within 24 months of purchase for shares purchased prior to August 1, 2012. Class C shares are subject to a CDSC in the event of a shareholder redemption within 12 months of purchase. Class B shares are subject to a CDSC in the event of a shareholder redemption within six years of purchase. All contingent deferred sales charges are paid to MFD and during the year ended February 28, 2014, were as follows:
| | | | |
| | | Amount | |
| Class A | | | $29,246 | |
| Class B | | | 104,138 | |
| Class C | | | 16,548 | |
Shareholder Servicing Agent – MFS Service Center, Inc. (MFSC), a wholly-owned subsidiary of MFS, receives a fee from the fund for its services as shareholder servicing agent calculated as a percentage of the average daily net assets of the fund as determined periodically under the supervision of the fund’s Board of Trustees. For the year ended February 28, 2014, the fee was $375,415, which equated to 0.0182% annually of the fund’s average daily net assets. MFSC also receives payment from the fund for out-of-pocket expenses, sub-accounting and other shareholder servicing costs which may be paid to affiliated and unaffiliated service providers. Class R5 shares do not incur sub-accounting fees. For the year ended February 28, 2014, these out-of-pocket expenses, sub-accounting and other shareholder servicing costs amounted to $1,629,813.
35
Notes to Financial Statements – continued
Under a Special Servicing Agreement among MFS, each MFS fund which invests in other MFS funds (“MFS fund-of-funds”) and certain underlying funds in which a MFS fund-of-funds invests (“underlying funds”), each underlying fund may pay a portion of each MFS fund-of-fund’s transfer agent-related expenses, including sub-accounting fees payable to financial intermediaries, to the extent such payments do not exceed the benefits realized or expected to be realized by the underlying fund from the investment in the underlying fund by the MFS fund-of-fund. For the year ended February 28, 2014, these costs for the fund amounted to $713,574 and are included in “Shareholder servicing costs” in the Statement of Operations.
Administrator – MFS provides certain financial, legal, shareholder communications, compliance, and other administrative services to the fund. Under an administrative services agreement, the fund partially reimburses MFS the costs incurred to provide these services. The fund is charged an annual fixed amount of $17,500 plus a fee based on average daily net assets. The administrative services fee incurred for the year ended February 28, 2014 was equivalent to an annual effective rate of 0.0126% of the fund’s average daily net assets.
Trustees’ and Officers’ Compensation – The fund pays compensation to independent Trustees in the form of a retainer, attendance fees, and additional compensation to Board and Committee chairpersons. The fund does not pay compensation directly to Trustees or officers of the fund who are also officers of the investment adviser, all of whom receive remuneration for their services to the fund from MFS. Certain officers and Trustees of the fund are officers or directors of MFS, MFD, and MFSC.
Prior to December 31, 2001, the fund had an unfunded defined benefit plan (“DB plan”) for independent Trustees. As of December 31, 2001, the Board took action to terminate the DB plan with respect to then-current and any future independent Trustees, such that the DB plan covers only certain of those former independent Trustees who retired on or before December 31, 2001. Effective January 1, 2002, accrued benefits under the DB plan for then-current independent Trustees who continued were credited to an unfunded retirement deferral plan (the “Retirement Deferral plan”), which was established for and exists solely with respect to these credited amounts, and is not available for other deferrals by these or other independent Trustees. Although the Retirement Deferral plan is unfunded, amounts deferred under the plan are periodically adjusted for investment experience as if they had been invested in shares of the fund. The DB plan resulted in a pension expense of $3,228 and the Retirement Deferral plan resulted in a net decrease in expense of $425. Both amounts are included in independent Trustees’ compensation for the year ended February 28, 2014. The liability for deferred retirement benefits payable to certain independent Trustees under both plans amounted to $53,255 at February 28, 2014, and is included in “Payable for independent Trustees’ compensation” in the Statement of Assets and Liabilities.
Other – This fund and certain other funds managed by MFS (the funds) have entered into services agreements (the Agreements) which provide for payment of fees by the funds to Tarantino LLC and Griffin Compliance LLC in return for the provision of services of an Independent Chief Compliance Officer (ICCO) and Assistant ICCO, respectively, for the funds. The ICCO and Assistant ICCO are officers of the funds and
36
Notes to Financial Statements – continued
the sole members of Tarantino LLC and Griffin Compliance LLC, respectively. The funds can terminate the Agreements with Tarantino LLC and Griffin Compliance LLC at any time under the terms of the Agreements. For the year ended February 28, 2014, the aggregate fees paid by the fund to Tarantino LLC and Griffin Compliance LLC were $12,296 and are included in “Miscellaneous” expense in the Statement of Operations. MFS has agreed to reimburse the fund for a portion of the payments made by the fund in the amount of $4,729, which is included in the reduction of total expenses in the Statement of Operations. Additionally, MFS has agreed to bear all expenses associated with office space, other administrative support, and supplies provided to the ICCO and Assistant ICCO.
The fund invests in the MFS Institutional Money Market Portfolio which is managed by MFS and seeks current income consistent with preservation of capital and liquidity. Income earned on this investment is included in “Dividends from underlying affiliated funds” in the Statement of Operations. This money market fund does not pay a management fee to MFS.
(4) Portfolio Securities
Purchases and sales of investments, other than short-term obligations, were as follows:
| | | | | | | | |
| | | Purchases | | | Sales | |
| U.S. Government securities | | | $2,174,149,747 | | | | $2,252,634,793 | |
| Investments (non-U.S. Government securities) | | | $102,304,586 | | | | $48,616,317 | |
(5) Shares of Beneficial Interest
The fund’s Declaration of Trust permits the Trustees to issue an unlimited number of full and fractional shares of beneficial interest. Transactions in fund shares were as follows:
| | | | | | | | | | | | | | | | |
| | | Year ended
2/28/14 | | | Year ended
2/28/13 (i) | |
| | | Shares | | | Amount | | | Shares | | | Amount | |
| Shares sold | | | | | | | | | | | | | | | | |
Class A | | | 14,080,093 | | | | $142,636,059 | | | | 19,324,791 | | | | $203,271,251 | |
Class B | | | 283,664 | | | | 2,899,313 | | | | 1,107,143 | | | | 11,637,204 | |
Class C | | | 844,314 | | | | 8,628,824 | | | | 2,965,801 | | | | 31,274,468 | |
Class I | | | 1,049,600 | | | | 10,687,176 | | | | 7,517,986 | | | | 79,192,395 | |
Class R1 | | | 110,936 | | | | 1,119,255 | | | | 187,327 | | | | 1,967,965 | |
Class R2 | | | 2,625,758 | | | | 26,567,943 | | | | 4,803,800 | | | | 50,439,705 | |
Class R3 | | | 3,352,214 | | | | 34,136,677 | | | | 3,674,269 | | | | 38,608,698 | |
Class R4 | | | 1,904,389 | | | | 19,277,307 | | | | 5,137,378 | | | | 53,893,566 | |
Class R5 | | | 23,416,145 | | | | 236,910,312 | | | | 68,774,393 | | | | 725,004,633 | |
| | | 47,667,113 | | | | $482,862,866 | | | | 113,492,888 | | | | $1,195,289,885 | |
37
Notes to Financial Statements – continued
| | | | | | | | | | | | | | | | |
| | | Year ended
2/28/14 | | | Year ended
2/28/13 (i) | |
| | | Shares | | | Amount | | | Shares | | | Amount | |
| Shares issued to shareholders in reinvestment of distributions | | | | | | | | | | | | | |
Class A | | | 1,352,204 | | | | $13,694,550 | | | | 1,947,717 | | | | $20,509,344 | |
Class B | | | 57,513 | | | | 582,189 | | | | 87,264 | | | | 917,581 | |
Class C | | | 100,602 | | | | 1,022,649 | | | | 172,413 | | | | 1,819,446 | |
Class I | | | 40,362 | | | | 409,006 | | | | 808,136 | | | | 8,518,305 | |
Class R1 | | | 9,957 | | | | 100,802 | | | | 15,504 | | | | 163,124 | |
Class R2 | | | 316,642 | | | | 3,203,039 | | | | 420,973 | | | | 4,427,835 | |
Class R3 | | | 259,117 | | | | 2,621,905 | | | | 313,790 | | | | 3,302,614 | |
Class R4 | | | 155,305 | | | | 1,572,129 | | | | 136,578 | | | | 1,436,753 | |
Class R5 | | | 2,363,750 | | | | 23,879,560 | | | | 1,085,283 | | | | 11,391,532 | |
| | | 4,655,452 | | | | $47,085,829 | | | | 4,987,658 | | | | $52,486,534 | |
| | | | |
| Shares reacquired | | | | | | | | | | | | | | | | |
Class A | | | (27,389,621 | ) | | | $(277,118,802 | ) | | | (32,984,988 | ) | | | $(346,824,129 | ) |
Class B | | | (1,766,066 | ) | | | (17,866,030 | ) | | | (1,389,242 | ) | | | (14,570,937 | ) |
Class C | | | (4,871,157 | ) | | | (49,437,235 | ) | | | (4,121,907 | ) | | | (43,376,063 | ) |
Class I | | | (2,907,146 | ) | | | (29,363,430 | ) | | | (57,786,744 | ) | | | (610,566,814 | ) |
Class R1 | | | (228,064 | ) | | | (2,319,835 | ) | | | (313,640 | ) | | | (3,295,793 | ) |
Class R2 | | | (4,717,216 | ) | | | (47,784,438 | ) | | | (5,296,892 | ) | | | (55,615,422 | ) |
Class R3 | | | (3,835,483 | ) | | | (38,793,912 | ) | | | (4,107,019 | ) | | | (43,124,948 | ) |
Class R4 | | | (1,831,448 | ) | | | (18,581,291 | ) | | | (3,381,281 | ) | | | (35,521,097 | ) |
Class R5 | | | (1,171,501 | ) | | | (11,814,366 | ) | | | (516,708 | ) | | | (5,481,403 | ) |
| | | (48,717,702 | ) | | | $(493,079,339 | ) | | | (109,898,421 | ) | | | $(1,158,376,606 | ) |
| | | | |
| Net change | | | | | | | | | | | | | | | | |
Class A | | | (11,957,324 | ) | | | $(120,788,193 | ) | | | (11,712,480 | ) | | | $(123,043,534 | ) |
Class B | | | (1,424,889 | ) | | | (14,384,528 | ) | | | (194,835 | ) | | | (2,016,152 | ) |
Class C | | | (3,926,241 | ) | | | (39,785,762 | ) | | | (983,693 | ) | | | (10,282,149 | ) |
Class I | | | (1,817,184 | ) | | | (18,267,248 | ) | | | (49,460,622 | ) | | | (522,856,114 | ) |
Class R1 | | | (107,171 | ) | | | (1,099,778 | ) | | | (110,809 | ) | | | (1,164,704 | ) |
Class R2 | | | (1,774,816 | ) | | | (18,013,456 | ) | | | (72,119 | ) | | | (747,882 | ) |
Class R3 | | | (224,152 | ) | | | (2,035,330 | ) | | | (118,960 | ) | | | (1,213,636 | ) |
Class R4 | | | 228,246 | | | | 2,268,145 | | | | 1,892,675 | | | | 19,809,222 | |
Class R5 | | | 24,608,394 | | | | 248,975,506 | | | | 69,342,968 | | | | 730,914,762 | |
| | | 3,604,863 | | | | $36,869,356 | | | | 8,582,125 | | | | $89,399,813 | |
| (i) | For Class R5, the period is from inception, July 2, 2012, through the stated period end. |
On July 6, 2012, certain Class I shares were automatically converted to Class R5 shares. Shareholders of certain Class I shares became shareholders of Class R5 and received Class R5 shares with a total net asset value equal to their Class I shares at the time of the conversion.
The fund is one of several mutual funds in which the MFS funds-of-funds may invest. The MFS funds-of-funds do not invest in the underlying funds for the purpose of exercising management or control. At the end of the period, the MFS Moderate
38
Notes to Financial Statements – continued
Allocation Fund, the MFS Conservative Allocation Fund, the MFS Lifetime Retirement Income Fund, the MFS Lifetime 2020 Fund, and the MFS Lifetime 2010 Fund were the owners of record of approximately 28%, 13%, 2%, 2%, and 1%, respectively, of the value of outstanding voting shares of the fund. In addition, the MFS Lifetime 2015 Fund and the MFS Lifetime 2025 Fund were each the owners of record of less than 1% of the value of outstanding voting shares of the fund.
(6) Line of Credit
The fund and certain other funds managed by MFS participate in a $1.1 billion unsecured committed line of credit, subject to a $1 billion sublimit, provided by a syndication of banks under a credit agreement. Borrowings may be made for temporary financing needs. Interest is charged to each fund, based on its borrowings, generally at a rate equal to the higher of the Federal Reserve funds rate or one month LIBOR plus an agreed upon spread. A commitment fee, based on the average daily, unused portion of the committed line of credit, is allocated among the participating funds at the end of each calendar quarter. In addition, the fund and other funds managed by MFS have established unsecured uncommitted borrowing arrangements with certain banks for temporary financing needs. Interest is charged to each fund, based on its borrowings, at a rate equal to the Federal Reserve funds rate plus an agreed upon spread. For the year ended February 28, 2014, the fund’s commitment fee and interest expense were $9,514 and $0, respectively, and are included in “Miscellaneous” expense in the Statement of Operations.
(7) Transactions in Underlying Affiliated Funds-Affiliated Issuers
An affiliated issuer may be considered one in which the fund owns 5% or more of the outstanding voting securities, or a company which is under common control. For the purposes of this report, the fund assumes the following to be an affiliated issuer:
| | | | | | | | | | | | | | | | |
| Underlying Affiliated Fund | | Beginning
Shares/Par
Amount | | | Acquisitions
Shares/Par
Amount | | | Dispositions
Shares/Par
Amount | | | Ending
Shares/Par
Amount | |
MFS Institutional Money
Market Portfolio | | | 473,727,945 | | | | 625,441,956 | | | | (823,822,435 | ) | | | 275,347,466 | |
| | | | |
| Underlying Affiliated Fund | | Realized
Gain (Loss) | | | Capital Gain
Distributions | | | Dividend
Income | | | Ending
Value | |
MFS Institutional Money
Market Portfolio | | | $— | | | | $— | | | | $302,771 | | | | $275,347,466 | |
39
REPORT OF INDEPENDENT REGISTERED PUBLIC ACCOUNTING FIRM
To the Board of Trustees and the Shareholders of MFS Government Securities Fund:
We have audited the accompanying statement of assets and liabilities, including the portfolio of investments, of MFS Government Securities Fund (the “Fund”) as of February 28, 2014, and the related statement of operations for the year then ended, the statements of changes in net assets for each of the two years in the period then ended, and the financial highlights for the periods presented. These financial statements and financial highlights are the responsibility of the Fund’s management. Our responsibility is to express an opinion on these financial statements and financial highlights based on our audits.
We conducted our audits in accordance with the standards of the Public Company Accounting Oversight Board (United States). Those standards require that we plan and perform the audit to obtain reasonable assurance about whether the financial statements and financial highlights are free of material misstatement. The Fund is not required to have, nor were we engaged to perform, an audit of its internal control over financial reporting. Our audits included consideration of internal control over financial reporting as a basis for designing audit procedures that are appropriate in the circumstances, but not for the purpose of expressing an opinion on the effectiveness of the Fund’s internal control over financial reporting. Accordingly, we express no such opinion. An audit also includes examining, on a test basis, evidence supporting the amounts and disclosures in the financial statements, assessing the accounting principles used and significant estimates made by management, as well as evaluating the overall financial statement presentation. Our procedures included confirmation of securities owned as of February 28, 2014, by correspondence with the custodian and brokers; where replies were not received from brokers, we performed other auditing procedures. We believe that our audits provide a reasonable basis for our opinion.
In our opinion, the financial statements and financial highlights referred to above present fairly, in all material respects, the financial position of MFS Government Securities Fund as of February 28, 2014, the results of its operations for the year then ended, the changes in its net assets for each of the two years in the period then ended, and the financial highlights for the periods presented, in conformity with accounting principles generally accepted in the United States of America.
DELOITTE & TOUCHE LLP
Boston, Massachusetts
April 14, 2014
40
TRUSTEES AND OFFICERS — IDENTIFICATION
AND BACKGROUND
The Trustees and Officers of the Trust, as of April 1, 2014, are listed below, together with their principal occupations during the past five years. (Their titles may have varied during that period.) The address of each Trustee and Officer is 111 Huntington Avenue, Boston, Massachusetts 02199-7618. It is expected that the Board will appoint Mr. Timothy M. Fagan as Chief Compliance Officer of the MFS Funds on November 1, 2014.
| | | | | | | | |
Name, Age | | Position(s) Held with Fund | | Trustee/Officer
Since (h) | | Principal
Occupations During the Past Five Years | | Other Directorships (j) |
| INTERESTED TRUSTEES |
Robert J. Manning (k) (age 50) | | Trustee | | February 2004 | | Massachusetts Financial Services Company, Chairman, Chief Executive Officer and Director; President (until 2009); Chief Investment Officer (until 2010) | | N/A |
Robin A. Stelmach (k) (age 52) | | Trustee | | January 2014 | | Massachusetts Financial Services Company, Executive Vice President and Chief Operating Officer | | N/A |
| INDEPENDENT TRUSTEES |
David H. Gunning (age 71) | | Trustee and Chair of Trustees | | January 2004 | | Private investor | | Lincoln Electric Holdings, Inc. (welding equipment manufacturer), Director; Development Alternatives, Inc. (consulting), Director/Non-Executive Chairman |
Steven E. Buller (age 62) | | Trustee | | February 2014 | | Chairman, Financial Accounting Standards Advisory Council; Standing Advisory Group, Public Company Accounting Oversight Board, Member; BlackRock, Inc. (investment management), Managing Director (until 2014), BlackRock Finco (investment management), UK, Director (until 2014) | | N/A |
41
Trustees and Officers – continued
| | | | | | | | |
Name, Age | | Position(s) Held with Fund | | Trustee/Officer
Since (h) | | Principal
Occupations During the Past Five Years | | Other Directorships (j) |
Robert E. Butler (age 72) | | Trustee | | January 2006 | | Consultant – investment company industry regulatory and compliance matters | | N/A |
Maureen R. Goldfarb (age 58) | | Trustee | | January 2009 | | Private investor | | N/A |
William R. Gutow (age 72) | | Trustee | | December 1993 | | Private investor and real estate consultant; Capitol Entertainment Management Company (video franchise), Vice Chairman | | Texas Donuts (donut franchise), Vice Chairman (until 2010) |
Michael Hegarty (age 69) | | Trustee | | December 2004 | | Private investor | | Brookfield Office Properties, Inc. (real estate), Director; Rouse Properties Inc. (real estate), Director; Capmark Financial Group Inc. (real estate), Director |
John P. Kavanaugh (age 59) | | Trustee | | January 2009 | | Private investor | | N/A |
Laurie J. Thomsen (age 56) | | Trustee | | March 2005 | | Private investor; New Profit, Inc. (venture philanthropy), Executive Partner (until 2010) | | The Travelers Companies (insurance), Director |
Robert W. Uek (age 72) | | Trustee | | January 2006 | | Consultant to investment company industry | | N/A |
| OFFICERS | | | | | | | | |
John M. Corcoran (k) (age 48) | | President | | October 2008 | | Massachusetts Financial Services Company, Senior Vice President | | N/A |
Christopher R. Bohane (k) (age 40) | | Assistant Secretary and Assistant Clerk | | July 2005 | | Massachusetts Financial Services Company, Vice President and Assistant General Counsel | | N/A |
Kino Clark (k) (age 45) | | Assistant Treasurer | | January 2012 | | Massachusetts Financial Services Company, Vice President | | N/A |
42
Trustees and Officers – continued
| | | | | | | | |
Name, Age | | Position(s) Held with Fund | | Trustee/Officer
Since (h) | | Principal
Occupations During the Past Five Years | | Other Directorships (j) |
Thomas H. Connors (k) (age 54) | | Assistant Secretary and Assistant Clerk | | September 2012 | | Massachusetts Financial Services Company, Vice President and Senior Counsel; Deutsche Investment Management Americas Inc. (financial service provider), Director and Senior Counsel (until 2012) | | N/A |
Ethan D. Corey (k) (age 50) | | Assistant Secretary and Assistant Clerk | | July 2005 | | Massachusetts Financial Services Company, Senior Vice President and Associate General Counsel | | N/A |
David L. DiLorenzo (k) (age 45) | | Treasurer | | July 2005 | | Massachusetts Financial Services Company, Senior Vice President | | N/A |
Robyn L. Griffin (age 38) | | Assistant Independent Chief Compliance Officer | | August 2008 | | Griffin Compliance LLC (provider of compliance services), Principal | | N/A |
Brian E. Langenfeld (k) (age 41) | | Assistant Secretary and Assistant Clerk | | June 2006 | | Massachusetts Financial Services Company, Vice President and Senior Counsel | | N/A |
Susan S. Newton (k) (age 64) | | Assistant Secretary and Assistant Clerk | | May 2005 | | Massachusetts Financial Services Company, Senior Vice President and Associate General Counsel | | N/A |
Susan A. Pereira (k) (age 43) | | Assistant Secretary and Assistant Clerk | | July 2005 | | Massachusetts Financial Services Company, Vice President and Senior Counsel | | N/A |
Kasey L. Phillips (k) (age 43) | | Assistant Treasurer | | September 2012 | | Massachusetts Financial Services Company, Vice President; Wells Fargo Funds Management, LLC, Senior Vice President, Fund Treasurer (until 2012) | | N/A |
43
Trustees and Officers – continued
| | | | | | | | |
Name, Age | | Position(s) Held with Fund | | Trustee/Officer
Since (h) | | Principal
Occupations During the Past Five Years | | Other Directorships (j) |
Mark N. Polebaum (k)
(age 61) | | Secretary and Clerk | | January 2006 | | Massachusetts Financial Services Company, Executive Vice President, General Counsel and Secretary | | N/A |
Frank L. Tarantino (l) (age 70) | | Independent Chief Compliance Officer | | June 2004 | | Tarantino LLC (provider of compliance services), Principal | | N/A |
Richard S. Weitzel (k) (age 43) | | Assistant Secretary and Assistant Clerk | | October 2007 | | Massachusetts Financial Services Company, Senior Vice President and Associate General Counsel | | N/A |
James O. Yost (k) (age 53) | | Deputy Treasurer | | September 1990 | | Massachusetts Financial Services Company, Senior Vice President | | N/A |
| (h) | Date first appointed to serve as Trustee/officer of an MFS Fund. Each Trustee has served continuously since appointment unless indicated otherwise. For the period from December 15, 2004 until February 22, 2005, Mr. Manning served as Advisory Trustee. For the period October 2008, until January 2012, Mr. Corcoran served as Treasurer of the Funds. Prior to January 2012, Messrs. DiLorenzo and Yost served as Assistant Treasurers of the Funds. |
| (j) | Directorships or trusteeships of companies required to report to the Securities and Exchange Commission (i.e., “public companies”). |
| (k) | “Interested person” of the Trust within the meaning of the Investment Company Act of 1940 (referred to as the 1940 Act), which is the principal federal law governing investment companies like the fund, as a result of position with MFS. The address of MFS is 111 Huntington Avenue, Boston, Massachusetts 02199-7618. |
| (l) | Mr. Tarantino will retire as Independent Chief Compliance Officer of the MFS Funds on October 31, 2014. It is expected that Mr. Tarantino will continue after that date as an Officer of the MFS Funds. |
Each Trustee (except Ms. Stelmach and Mr. Buller) has been elected by shareholders and each Trustee and officer holds office until his or her successor is chosen and qualified or until his or her earlier death, resignation, retirement or removal. The Trust does not hold annual meetings for the purpose of electing Trustees, and Trustees are not elected for fixed terms. Messrs. Butler, Kavanaugh, Uek and Ms. Thomsen are members of the Trust’s Audit Committee.
Each of the Fund’s Trustees and officers holds comparable positions with certain other funds of which MFS or a subsidiary is the investment adviser or distributor, and, in the case of the officers, with certain affiliates of MFS. As of January 1, 2014, the Trustees served as board members of 142 funds within the MFS Family of Funds.
44
Trustees and Officers – continued
The Statement of Additional Information for the Fund includes further information about the Trustees and is available without charge upon request by calling 1-800-225-2606.
| | |
| Investment Adviser | | Custodian |
Massachusetts Financial Services Company
111 Huntington Avenue
Boston, MA 02199-7618 | | JPMorgan Chase Bank One Chase Manhattan Plaza New York, NY 10081 |
| Distributor | | Independent Registered Public Accounting Firm |
MFS Fund Distributors, Inc.
111 Huntington Avenue
Boston, MA 02199-7618 | | Deloitte & Touche LLP 200 Berkeley Street Boston, MA 02116 |
| Portfolio Manager | | |
Geoffrey Schechter | | |
45
BOARD REVIEW OF INVESTMENT ADVISORY AGREEMENT
A discussion regarding the Board’s most recent review and renewal of the fund’s Investment Advisory Agreement with MFS is available by clicking on the fund’s name under “Mutual Funds” in the “Products” section of the MFS Web site (mfs.com).
PROXY VOTING POLICIES AND INFORMATION
A general description of the MFS funds’ proxy voting policies and procedures is available without charge, upon request, by calling 1-800-225-2606, by visiting the Proxy Voting section of mfs.com or by visiting the SEC’s Web site at http://www.sec.gov.
Information regarding how the fund voted proxies relating to portfolio securities during the most recent twelve-month period ended June 30 is available without charge by visiting the Proxy Voting section of mfs.com or by visiting the SEC’s Web site at http://www.sec.gov.
QUARTERLY PORTFOLIO DISCLOSURE
The fund will file a complete schedule of portfolio holdings with the Securities and Exchange Commission (the Commission) for the first and third quarters of each fiscal year on Form N-Q. A shareholder can obtain the quarterly portfolio holdings report at mfs.com. The fund’s Form N-Q is also available on the EDGAR database on the Commission’s Internet Web site at http://www.sec.gov, and may be reviewed and copied at the:
Public Reference Room
Securities and Exchange Commission
100 F Street, NE, Room 1580
Washington, D.C. 20549
Information on the operation of the Public Reference Room may be obtained by calling the Commission at 1-800-SEC-0330. Copies of the fund’s Form N-Q also may be obtained, upon payment of a duplicating fee, by electronic request at the following e-mail address: publicinfo@sec.gov or by writing the Public Reference Section at the above address.
FURTHER INFORMATION
From time to time, MFS may post important information about the fund or the MFS funds on the MFS web site (mfs.com). This information is available by visiting the “Commentary & Announcements” and “Market Outlooks” sections of mfs.com or by clicking on the fund’s name under “Mutual Funds” in the “Products” section of mfs.com.
FEDERAL TAX INFORMATION (unaudited)
The fund will notify shareholders of amounts for use in preparing 2014 income tax forms in January 2015.
46
rev. 3/11
| | | | |
| | | |
FACTS | | WHAT DOES MFS DO WITH YOUR PERSONAL INFORMATION? | |  |
| | |
| Why? | | Financial companies choose how they share your personal information. Federal law gives consumers the right to limit some but not all sharing. Federal law also requires us to tell you how we collect, share, and protect your personal information. Please read this notice carefully to understand what we do. |
| | |
| What? | | The types of personal information we collect and share depend on the product or service you have with us. This information can include: • Social Security number and account balances • Account transactions and transaction history • Checking account information and wire transfer instructions When you are no longer our customer, we continue to share your information as described in this notice. |
| | |
| How? | | All financial companies need to share customers’ personal information to run their everyday business. In the section below, we list the reasons financial companies can share their customers’ personal information; the reasons MFS chooses to share; and whether you can limit this sharing. |
| | | | |
Reasons we can share your
personal information | | Does MFS
share? | | Can you limit
this sharing? |
For our everyday business purposes – such as to process your transactions, maintain your account(s), respond to court orders and legal investigations, or report to credit bureaus | | Yes | | No |
For our marketing purposes – to offer our products and services to you | | No | | We don’t share |
| For joint marketing with other financial companies | | No | | We don’t share |
For our affiliates’ everyday business purposes – information about your transactions and experiences | | No | | We don’t share |
For our affiliates’ everyday business purposes – information about your creditworthiness | | No | | We don’t share |
| For nonaffiliates to market to you | | No | | We don’t share |
| | |
| Questions? | | Call 800-225-2606 or go to mfs.com. |
47
| | |
| Who we are |
| Who is providing this notice? | | MFS Funds, MFS Investment Management, MFS Institutional Advisors, Inc., MFS Fund Distributors, Inc., MFS Heritage Trust Company, and MFS Service Center, Inc. |
| | |
| What we do |
| How does MFS protect my personal information? | | To protect your personal information from unauthorized access and use, we use security measures that comply with federal law. These measures include procedural, electronic, and physical safeguards for the protection of the personal information we collect about you. |
| How does MFS collect my personal information? | | We collect your personal information, for example, when you •open an account or provide account information •direct us to buy securities or direct us to sell your securities •make a wire transfer We also collect your personal information from others, such as credit bureaus, affiliates and other companies. |
| Why can’t I limit all sharing? | | Federal law gives you the right to limit only •sharing for affiliates’ everyday business purposes – information about your creditworthiness •affiliates from using your information to market to you •sharing for nonaffiliates to market to you State laws and individual companies may give you additional rights to limit sharing. |
| | |
| Definitions |
| Affiliates | | Companies related by common ownership or control. They can be financial and nonfinancial companies. •MFS does not share personal information with affiliates, except for everyday business purposes as described on page one of this notice. |
| Nonaffiliates | | Companies not related by common ownership or control. They can be financial and nonfinancial companies. •MFS does not share with nonaffiliates so they can market to you. |
| Joint Marketing | | A formal agreement between nonaffiliated financial companies that together market financial products or services to you. •MFS doesn’t jointly market. |
| | |
| Other important information |
| If you own an MFS product or receive an MFS service in the name of a third party such as a bank or broker-dealer, their privacy policy may apply to you instead of ours. |
48
Save paper with eDelivery.

| MFS® will send you prospectuses, |
reports, and proxies directly via e-mail so you will get information faster with less mailbox clutter.
To sign up:
1. Go to mfs.com.
2. Log in via MFS® Access.
3. Select eDelivery.
If you own your MFS fund shares through a financial institution or a retirement plan, MFS® TALK, MFS® Access, or eDelivery may not be available to you.
CONTACT
WEB SITE
mfs.com
MFS TALK
1-800-637-8255
24 hours a day
ACCOUNT SERVICE AND LITERATURE
Shareholders
1-800-225-2606
Financial advisors
1-800-343-2829
Retirement plan services
1-800-637-1255
MAILING ADDRESS
MFS Service Center, Inc.
P.O. Box 55824
Boston, MA 02205-5824
OVERNIGHT MAIL
MFS Service Center, Inc.
c/o Boston Financial Data Services
30 Dan Road
Canton, MA 02021-2809
ANNUAL REPORT
February 28, 2014

MFS® GLOBAL REAL ESTATE FUND

GRE-ANN
MFS® GLOBAL REAL ESTATE FUND
CONTENTS
The report is prepared for the general information of shareholders. It is authorized for distribution to prospective investors only when preceded or accompanied by a current prospectus.
NOT FDIC INSURED Ÿ MAY LOSE VALUE Ÿ NO BANK GUARANTEE

LETTER FROM THE CHAIRMAN AND CEO
Dear Shareholders:
The U.S. economy appears to have slowed early in 2014 after a strong second half of 2013. Harsh winter weather likely contributed to at least a temporary softening of consumer demand. Looking at the longer term, the pace of U.S. economic growth has
been modest since the recovery began late in 2009. Corporate profits remain healthy overall. A major plus is the removal of a highly confrontational atmosphere in the U.S. Congress, which had clouded business decision-making since 2011.
Globally, recent months have been dominated by volatility, including emerging market currency jitters and rising geopolitical tensions. These add to the possibility of economic uncertainty and financial market unease. However, the eurozone continues to show signs of recovery, while Japan is making progress as it seeks to break free of deflation.
China’s transition toward a more consumer-oriented and less export-driven economy — one with a more stable and sustainable growth rate — could be positive in the long term. However, in the near term, any deceleration in China’s rate of growth could have a ripple effect on its many global trading partners.
In uncertain times such as these, it is particularly important to remember that managing risk should always be a top priority. At MFS®, active risk management is an integral part of our collaborative process. Our global team of investment professionals shares ideas and evaluates opportunities that span continents, investment disciplines and asset classes. Our goal is to build better insights, and ultimately better results, for our clients.
We understand and appreciate the economic challenges investors face, and we believe in the value of maintaining a long-term view and applying proven principles, such as asset allocation and diversification. We are confident that our unique approach can serve investors well as they work with their financial advisors to identify and pursue the most suitable opportunities.
Respectfully,

Robert J. Manning
Chairman and Chief Executive Officer
MFS Investment Management
April 14, 2014
The opinions expressed in this letter are subject to change, may not be relied upon for investment advice, and no forecasts can be guaranteed.
1
PORTFOLIO COMPOSITION
Portfolio structure
| | | | |
| Top ten holdings | | | | |
| Simon Property Group, Inc., REIT | | | 5.0% | |
| Mitsui Fudosan Co. Ltd. | | | 3.9% | |
| Corio N.V., REIT | | | 3.3% | |
| Mitsubishi Estate Co. Ltd. | | | 3.2% | |
| Public Storage, Inc., REIT | | | 3.2% | |
| Vornado Realty Trust, REIT | | | 3.2% | |
| AvalonBay Communities, Inc., REIT | | | 3.2% | |
| Unibail-Rodamco, REIT | | | 2.8% | |
| Host Hotels & Resorts, Inc., REIT | | | 2.6% | |
| CapitaCommercial Trust, REIT | | | 2.5% | |
| |
| Equity industries | | | | |
| Real Estate | | | 95.4% | |
| Telecommunications-Wireless | | | 1.0% | |
| Medical & Health Technology & Services | | | 0.8% | |
| | | | |
| Issuer country weightings (x) | | | | |
| United States | | | 51.6% | |
| Japan | | | 11.3% | |
| United Kingdom | | | 7.4% | |
| Hong Kong | | | 7.1% | |
| Singapore | | | 4.2% | |
| Australia | | | 4.1% | |
| Netherlands | | | 3.3% | |
| France | | | 2.8% | |
| Germany | | | 2.5% | |
| Other Countries | | | 5.7% | |
|
| Currency exposure weightings (y) | |
| United States Dollar | | | 51.6% | |
| Japanese Yen | | | 11.3% | |
| Euro | | | 11.0% | |
| British Pound Sterling | | | 7.4% | |
| Hong Kong Dollar | | | 7.1% | |
| Singapore Dollar | | | 4.2% | |
| Australian Dollar | | | 4.1% | |
| Brazilian Real | | | 2.4% | |
| Mexican Peso | | | 0.9% | |
| (x) | Represents the portfolio’s exposure to issuer countries as a percentage of a portfolio’s net assets. For purposes of this presentation, United States includes Cash & Other. |
| (y) | Represents the portfolio’s exposure to a particular currency as a percentage of a portfolio’s net assets. For purposes of this presentation, United States Dollar includes Cash & Other. |
Percentages are based on net assets as of 2/28/14.
The portfolio is actively managed and current holdings may be different.
2
MANAGEMENT REVIEW
Summary of Results
For the twelve months ended February 28, 2014, Class A shares of the MFS Global Real Estate Fund (“fund”) provided a total return of 4.31%, at net asset value. This compares with a return of 4.35% for the fund’s benchmark, the FTSE EPRA/NAREIT Developed Real Estate Index (“FTSE Index”).
Market Environment
Early in the period, jitters over a banking crisis in Cyprus was more than offset by ongoing accommodative global monetary policy and improving economic data, resulting in gains in both equity and fixed income markets. As the period progressed, concerns that the US Federal Reserve (“Fed”) would begin tapering its quantitative easing (“QE”) program caused sovereign bond yields to spike, credit spreads to widen, and equity valuations to fall. Equities subsequently outperformed fixed income in response to the improved economic fundamentals.
Toward the middle of the period, the Fed’s decision to postpone QE tapering surprised markets. Favorable market reactions were tempered, however, by tense negotiations over US fiscal policy which resulted in a 16-day partial shutdown of the federal government and a short-term extension in the debt ceiling. The volatility was short-lived, however, as an extension of budget and debt ceiling deadlines allowed the government to re-open, and subsequent economic data reflected moderate but resilient US growth. Also well-received was the decision by the European Central Bank to cut its policy rate as inflation pressures waned in the region. In addition, equity investors appeared to have concluded that there would be no major change in US monetary policy as a result of the nomination of Janet Yellen as the new Fed Chair for a term beginning in early 2014.
Later in the period, emerging market stresses resurfaced with political unrest, falling currencies and slowing growth which appeared to have impacted investor sentiment. Markets were also forced to contend with some unexpected weakness in the US economy due largely to weather-related interruptions to hiring and spending plans as well as production schedules. Once again, the setback was short-lived as the major US equity indexes traded near their all-time highs by the end of the period.
Detractors from Performance
During the reporting period, the fund’s overweight allocation to real estate investments located in Brazil detracted from performance relative to the FTSE Index. The fund’s ownership in shares of BR Malls Participacoes S.A. (b) and Multiplan Empreendimentos (b) held back relative results as both stocks underperformed the benchmark.
Stock selection and an underweight position in real estate investments in Japan also weakened relative returns. An overweight position in NTT Urban Development and not owning strong-performing Sumitomo Realty & Development weighed on relative performance.
Elsewhere, the fund’s overweight positions in Hang Lung Properties (Hong Kong), Link REIT (Hong Kong) and Stockland (Australia) were among the fund’s largest detractors from relative performance during the period. Additionally, not owning shares of
3
Management Review – continued
strong-performing Gladstone Land (United Kingdom), and holdings of poor-performing Ascendas India Trust (Singapore) and Plum Creek Timber (United States), held back relative results.
Contributors to Performance
Security selection and an overweight position in real estate investments in the United Kingdom contributed to relative performance. The fund’s overweight positions in SEGRO, Big Yellow Group and British Land Company were among the largest contributors to relative returns.
Stock selection in real estate investments located in Singapore also supported relative results. An overweight position in Global Logistics Properties (h) and not owning shares in CapitalLand supported relative returns.
An underweight allocation to real estate investments in Canada also aided relative results as Canadian real estate performed poorly relative to the benchmark. Within this region, there were no individual securities that were among the fund’s top relative contributors.
Elsewhere, the fund’s avoidance of weak-performing Health Care Property (United States), Wharf Holdings (Hong Kong), Hongkong Land (Hong Kong) and New World Development (Hong Kong) were additional positive factors for relative returns. Additionally, an overweight position in Vornado Realty Trust (United States) aided relative results as the company’s share price outpaced the benchmark during the reporting period.
Respectfully,
Richard Gable
Portfolio Manager
| (b) | Security is not a benchmark constituent. |
| (h) | Security was not held in the portfolio at period end. |
The views expressed in this report are those of the portfolio manager only through the end of the period of the report as stated on the cover and do not necessarily reflect the views of MFS or any other person in the MFS organization. These views are subject to change at any time based on market or other conditions, and MFS disclaims any responsibility to update such views. These views may not be relied upon as investment advice or an indication of trading intent on behalf of any MFS portfolio. References to specific securities are not recommendations of such securities, and may not be representative of any MFS portfolio’s current or future investments.
4
PERFORMANCE SUMMARY THROUGH 2/28/14
The following chart illustrates a representative class of the fund’s historical performance in comparison to its benchmark(s). Performance results include the deduction of the maximum applicable sales charge and reflect the percentage change in net asset value, including reinvestment of dividends and capital gains distributions. The performance of other share classes will be greater than or less than that of the class depicted below. Benchmarks are unmanaged and may not be invested in directly. Benchmark returns do not reflect sales charges, commissions or expenses. (See Notes to Performance Summary.)
Performance data shown represents past performance and is no guarantee of future results. Investment return and principal value fluctuate so your shares, when sold, may be worth more or less than the original cost; current performance may be lower or higher than quoted. The performance shown does not reflect the deduction of taxes, if any, that a shareholder would pay on fund distributions or the redemption of fund shares.
Growth of a Hypothetical $10,000 Investment (t)
5
Performance Summary – continued
Total Returns through 2/28/14
Average annual without sales charge
| | | | | | | | | | |
| | | Share class | | Class inception date | �� | 1-yr | | Life (t) | | |
| | | A | | 3/11/09 | | 4.31% | | 23.94% | | |
| | | I | | 3/11/09 | | 4.57% | | 24.24% | | |
| | | R5 | | 7/02/12 | | 4.57% | | 12.55% | | |
| Comparative benchmark | | | | | | |
| | | FTSE EPRA/NAREIT Developed Real Estate Index (f) | | 4.35% | | 25.94% | | |
| Average annual with sales charge | | | | | | |
| | | A
With Initial Sales Charge (5.75%) | | (1.69)% | | 22.47% | | |
Class I and R5 shares do not have a sales charge.
| (f) | Source: FactSet Research Systems Inc. |
| (t) | For the period from the class inception date through the stated period end. The comparative benchmark performance information provided for the “life” period is from the inception date of the Class A shares. (See Notes to Performance Summary.) |
Benchmark Definition
FTSE EPRA/NAREIT Developed Real Estate Index – measures the performance of eligible real estate equities worldwide that generate a majority of their revenue and income through the ownership, disposure and development of income-producing real estate.
It is not possible to invest directly in an index.
Notes to Performance Summary
Average annual total return represents the average annual change in value for each share class for the periods presented. Life returns are presented where the share class has less than 10 years of performance history and represent the average annual total return from the class inception date to the stated period end date. As the fund’s share classes may have different inception dates, the life returns may represent different time periods and may not be comparable.
Performance results reflect any applicable expense subsidies and waivers in effect during the periods shown. Without such subsidies and waivers the fund’s performance results would be less favorable. Please see the prospectus and financial statements for complete details.
Performance results do not include adjustments made for financial reporting purposes in accordance with U.S. generally accepted accounting principles and may differ from amounts reported in the financial highlights.
From time to time the fund may receive proceeds from litigation settlements, without which performance would be lower.
6
EXPENSE TABLE
Fund expenses borne by the shareholders during the period, September 1, 2013 through February 28, 2014
As a shareholder of the fund, you incur two types of costs: (1) transaction costs, including sales charges (loads) on certain purchase or redemption payments, and (2) ongoing costs, including management fees; distribution and service (12b-1) fees; and other fund expenses. This example is intended to help you understand your ongoing costs (in dollars) of investing in the fund and to compare these costs with the ongoing costs of investing in other mutual funds.
The example is based on an investment of $1,000 invested at the beginning of the period and held for the entire period September 1, 2013 through February 28, 2014.
Actual Expenses
The first line for each share class in the following table provides information about actual account values and actual expenses. You may use the information in this line, together with the amount you invested, to estimate the expenses that you paid over the period. Simply divide your account value by $1,000 (for example, an $8,600 account value divided by $1,000 = 8.6), then multiply the result by the number in the first line under the heading entitled “Expenses Paid During Period” to estimate the expenses you paid on your account during this period.
Hypothetical Example for Comparison Purposes
The second line for each share class in the following table provides information about hypothetical account values and hypothetical expenses based on the fund’s actual expense ratio and an assumed rate of return of 5% per year before expenses, which is not the fund’s actual return. The hypothetical account values and expenses may not be used to estimate the actual ending account balance or expenses you paid for the period. You may use this information to compare the ongoing costs of investing in the fund and other funds. To do so, compare this 5% hypothetical example with the 5% hypothetical examples that appear in the shareholder reports of the other funds.
Please note that the expenses shown in the table are meant to highlight your ongoing costs only and do not reflect any transactional costs, such as sales charges (loads). Therefore, the second line for each share class in the table is useful in comparing ongoing costs only, and will not help you determine the relative total costs of owning different funds. In addition, if these transactional costs were included, your costs would have been higher.
7
Expense Table – continued
| | | | | | | | | | | | | | | | | | |
Share
Class | | | | Annualized
Expense
Ratio | | | Beginning
Account Value
9/01/13 | | | Ending
Account Value
2/28/14 | | | Expenses
Paid During
Period (p)
9/01/13-2/28/14 | |
| A | | Actual | | | 1.22% | | | | $1,000.00 | | | | $1,096.82 | | | | $6.34 | |
| | Hypothetical (h) | | | 1.22% | | | | $1,000.00 | | | | $1,018.74 | | | | $6.11 | |
| I | | Actual | | | 0.97% | | | | $1,000.00 | | | | $1,097.60 | | | | $5.04 | |
| | Hypothetical (h) | | | 0.97% | | | | $1,000.00 | | | | $1,019.98 | | | | $4.86 | |
| R5 | | Actual | | | 0.97% | | | | $1,000.00 | | | | $1,097.61 | | | | $5.04 | |
| | Hypothetical (h) | | | 0.97% | | | | $1,000.00 | | | | $1,019.98 | | | | $4.86 | |
| (h) | 5% class return per year before expenses. |
| (p) | Expenses Paid During Period are equal to each class’s annualized expense ratio, as shown above, multiplied by the average account value over the period, multiplied by 181/365 (to reflect the one-half year period). Expenses paid do not include any applicable sales charges (loads). If these transaction costs had been included, your costs would have been higher. |
8
PORTFOLIO OF INVESTMENTS
2/28/14
The Portfolio of Investments is a complete list of all securities owned by your fund. It is categorized by broad-based asset classes.
| | | | | | | | |
| Common Stocks - 96.7% | | | | | | | | |
| Issuer | | Shares/Par | | | Value ($) | |
| | | | | | | | |
| Medical & Health Technology & Services - 0.8% | | | | | | | | |
| Capital Senior Living Corp. (a) | | | 122,860 | | | $ | 3,123,101 | |
| | |
| Real Estate - 94.9% | | | | | | | | |
| Advance Residence Investment Corp., REIT | | | 1,924 | | | $ | 4,121,372 | |
| Alexandria Real Estate Equities, Inc., REIT | | | 111,338 | | | | 8,066,438 | |
| Alstria Office REIT, AG | | | 274,660 | | | | 3,815,775 | |
| Ascendas India Trust, IEU | | | 12,498,000 | | | | 7,049,320 | |
| Atrium European Real Estate Ltd. | | | 1,294,260 | | | | 7,878,322 | |
| AvalonBay Communities, Inc., REIT | | | 101,610 | | | | 13,104,642 | |
| Big Yellow Group PLC, REIT | | | 947,880 | | | | 9,071,268 | |
| Boston Properties, Inc., REIT | | | 88,003 | | | | 9,894,177 | |
| BR Malls Participacoes S.A. | | | 596,571 | | | | 4,569,534 | |
| British Land Co. PLC, REIT | | | 502,772 | | | | 5,868,164 | |
| CapitaCommercial Trust, REIT | | | 8,794,000 | | | | 10,163,066 | |
| Concentradora Fibra Danhos S.A. de C.V., REIT | | | 1,019,100 | | | | 1,982,752 | |
| Corio N.V., REIT | | | 290,324 | | | | 13,628,974 | |
| Corporate Office Properties Trust, REIT | | | 223,920 | | | | 5,971,946 | |
| DDR Corp., REIT | | | 293,400 | | | | 4,876,308 | |
| Digital Realty Trust, Inc., REIT | | | 150,181 | | | | 8,133,803 | |
| EastGroup Properties, Inc., REIT | | | 66,010 | | | | 4,095,262 | |
| Equity Lifestyle Properties, Inc., REIT | | | 245,992 | | | | 9,901,178 | |
| Federal Realty Investment Trust, REIT | | | 53,585 | | | | 5,964,546 | |
| Hang Lung Properties Ltd. | | | 2,011,256 | | | | 5,584,986 | |
| Henderson Land Development Co. Ltd. | | | 1,444,339 | | | | 8,095,914 | |
| Home Properties, Inc., REIT | | | 113,453 | | | | 6,686,920 | |
| Host Hotels & Resorts, Inc., REIT | | | 539,706 | | | | 10,616,017 | |
| Intu Properties PLC, REIT | | | 391,320 | | | | 2,127,711 | |
| Kenedix Office Investment Corp., REIT | | | 1,397 | | | | 6,932,151 | |
| Lar Espana Real Estate Socimi S.A. | | | 148,145 | | | | 2,044,846 | |
| LEG Immobilien AG | | | 54,120 | | | | 3,518,457 | |
| Link REIT | | | 1,524,405 | | | | 7,081,302 | |
| LondonMetric Property PLC, REIT | | | 1,026,050 | | | | 2,482,760 | |
| Macquarie Mexico Real Estate S.A. de C.V., REIT | | | 943,200 | | | | 1,636,637 | |
| Medical Properties Trust, Inc., REIT | | | 242,083 | | | | 3,193,075 | |
| Mid-America Apartment Communities, Inc., REIT | | | 132,711 | | | | 8,976,572 | |
| Mitsubishi Estate Co. Ltd. | | | 564,135 | | | | 13,320,393 | |
| Mitsui Fudosan Co. Ltd. | | | 535,274 | | | | 15,920,943 | |
| Multiplan Empreendimentos Imobiliarios S.A. | | | 264,800 | | | | 5,206,218 | |
| National Health Investors, Inc., REIT | | | 94,890 | | | | 5,854,713 | |
| NTT Urban Development Corp. | | | 706,300 | | | | 6,086,520 | |
9
Portfolio of Investments – continued
| | | | | | | | |
| Issuer | | Shares/Par | | | Value ($) | |
| | | | | | | | |
| Common Stocks - continued | | | | | | | | |
| Real Estate - continued | | | | | | | | |
| Plum Creek Timber Co. Inc., REIT | | | 202,054 | | | $ | 8,746,918 | |
| Public Storage, Inc., REIT | | | 78,232 | | | | 13,221,208 | |
| Quintain Estates & Development PLC (a) | | | 2,013,610 | | | | 3,506,768 | |
| Retail Opportunity Investment Corp., REIT | | | 287,080 | | | | 4,257,396 | |
| Rexford Industrial Realty, Inc., REIT | | | 235,070 | | | | 3,335,643 | |
| SEGRO PLC, REIT | | | 891,038 | | | | 5,325,264 | |
| Simon Property Group, Inc., REIT | | | 126,379 | | | | 20,383,669 | |
| Stockland, IEU | | | 2,788,075 | | | | 9,603,439 | |
| Sun Hung Kai Properties Ltd. | | | 671,385 | | | | 8,590,697 | |
| TAG Immobilien AG | | | 237,910 | | | | 3,003,101 | |
| Tanger Factory Outlet Centers, Inc., REIT | | | 203,522 | | | | 6,982,840 | |
| Unibail-Rodamco, REIT (a) | | | 42,829 | | | | 11,285,413 | |
| Ventas, Inc., REIT | | | 143,283 | | | | 8,945,158 | |
| Vornado Realty Trust, REIT | | | 136,883 | | | | 13,180,464 | |
| Westfield Group, REIT | | | 778,761 | | | | 7,136,901 | |
| Weyerhaeuser Co., REIT | | | 289,099 | | | | 8,531,313 | |
| | | | | | | | |
| | | | | | | $ | 389,559,174 | |
| Telecommunications - Wireless - 1.0% | | | | | | | | |
| American Tower Corp., REIT | | | 48,690 | | | $ | 3,966,774 | |
| Total Common Stocks (Identified Cost, $319,916,146) | | | | | | $ | 396,649,049 | |
| | |
| Closed-End Fund - 0.5% | | | | | | | | |
| Real Estate - 0.5% | | | | | | | | |
Kennedy Wilson Europe Real Estate PLC
(Identified Cost, $2,020,092) (a) | | | 116,300 | | | $ | 2,066,300 | |
| | |
| Money Market Funds - 2.9% | | | | | | | | |
MFS Institutional Money Market Portfolio, 0.8%,
at Cost and Net Asset Value (v) | | | 12,111,962 | | | $ | 12,111,962 | |
| Total Investments (Identified Cost, $334,048,200) | | | | | | $ | 410,827,311 | |
| | |
| Other Assets, Less Liabilities - (0.1)% | | | | | | | (492,285 | ) |
| Net Assets - 100.0% | | | | | | $ | 410,335,026 | |
| (a) | Non-income producing security. |
| (v) | Underlying affiliated fund that is available only to investment companies managed by MFS. The rate quoted for the MFS Institutional Money Market Portfolio is the annualized seven-day yield of the fund at period end. |
The following abbreviations are used in this report and are defined:
| IEU | | International Equity Unit |
| PLC | | Public Limited Company |
| REIT | | Real Estate Investment Trust |
See Notes to Financial Statements
10
Financial Statements
STATEMENT OF ASSETS AND LIABILITIES
At 2/28/14
This statement represents your fund’s balance sheet, which details the assets and liabilities comprising the total value of the fund.
| | | | |
| Assets | | | | |
Investments- | | | | |
Non-affiliated issuers, at value (identified cost, $321,936,238) | | | $398,715,349 | |
Underlying affiliated funds, at cost and value | | | 12,111,962 | |
Total investments, at value (identified cost, $334,048,200) | | | $410,827,311 | |
Foreign currency, at value (identified cost, $670,525) | | | 671,346 | |
Receivables for | | | | |
Fund shares sold | | | 862,951 | |
Dividends | | | 221,837 | |
Other assets | | | 2,401 | |
Total assets | | | $412,585,846 | |
| Liabilities | | | | |
Payables for | | | | |
Investments purchased | | | $2,125,250 | |
Fund shares reacquired | | | 5,137 | |
Payable to affiliates | | | | |
Investment adviser | | | 19,578 | |
Shareholder servicing costs | | | 38 | |
Distribution and service fees | | | 4 | |
Payable for independent Trustees’ compensation | | | 416 | |
Accrued expenses and other liabilities | | | 100,397 | |
Total liabilities | | | $2,250,820 | |
Net assets | | | $410,335,026 | |
| Net assets consist of | | | | |
Paid-in capital | | | $343,817,189 | |
Unrealized appreciation (depreciation) on investments and translation of assets and liabilities in foreign currencies | | | 76,784,106 | |
Accumulated distributions in excess of net realized gain on investments and foreign currency | | | (9,472,041 | ) |
Accumulated distributions in excess of net investment income | | | (794,228 | ) |
Net assets | | | $410,335,026 | |
Shares of beneficial interest outstanding | | | 27,860,557 | |
| | | | | | | | | | | | |
| | | Net assets | | | Shares
outstanding | | | Net asset value
per share (a) | |
Class A | | | $290,663 | | | | 19,748 | | | | $14.72 | |
Class I | | | 121,831 | | | | 8,272 | | | | 14.73 | |
Class R5 | | | 409,922,532 | | | | 27,832,537 | | | | 14.73 | |
| (a) | Maximum offering price per share was equal to the net asset value per share for all share classes, except for Class A, for which the maximum offering price per share was $15.62 [100 / 94.25 x $14.72]. On sales of $50,000 or more, the maximum offering price of Class A shares is reduced. A contingent deferred sales charge may be imposed on redemptions of Class A shares. Redemption price per share was equal to the net asset value per share for Classes I and R5. |
See Notes to Financial Statements
11
Financial Statements
STATEMENT OF OPERATIONS
Year ended 2/28/14
This statement describes how much your fund earned in investment income and accrued in expenses. It also describes any gains and/or losses generated by fund operations.
| | | | |
| Net investment income | | | | |
Income | | | | |
Dividends | | | $10,741,434 | |
Dividends from underlying affiliated funds | | | 5,941 | |
Foreign taxes withheld | | | (423,327 | ) |
Total investment income | | | $10,324,048 | |
Expenses | | | | |
Management fee | | | $3,187,349 | |
Distribution and service fees | | | 712 | |
Shareholder servicing costs | | | 292 | |
Administrative services fee | | | 53,855 | |
Independent Trustees’ compensation | | | 9,726 | |
Custodian fee | | | 84,516 | |
Shareholder communications | | | 7,717 | |
Audit and tax fees | | | 56,234 | |
Legal fees | | | 3,401 | |
Miscellaneous | | | 41,860 | |
Total expenses | | | $3,445,662 | |
Fees paid indirectly | | | (11 | ) |
Reduction of expenses by investment adviser | | | (5,793 | ) |
Net expenses | | | $3,439,858 | |
Net investment income | | | $6,884,190 | |
| Realized and unrealized gain (loss) on investments and foreign currency | |
Realized gain (loss) (identified cost basis) | | | | |
Investments | | | $14,099,471 | |
Foreign currency | | | (77,642 | ) |
Net realized gain (loss) on investments and foreign currency | | | $14,021,829 | |
Change in unrealized appreciation (depreciation) | | | | |
Investments | | | $(3,074,670 | ) |
Translation of assets and liabilities in foreign currencies | | | 12,643 | |
Net unrealized gain (loss) on investments and foreign currency translation | | | $(3,062,027 | ) |
Net realized and unrealized gain (loss) on investments and foreign currency | | | $10,959,802 | |
Change in net assets from operations | | | $17,843,992 | |
See Notes to Financial Statements
12
Financial Statements
STATEMENTS OF CHANGES IN NET ASSETS
These statements describe the increases and/or decreases in net assets resulting from operations, any distributions, and any shareholder transactions.
| | | | | | | | |
| | | Years ended 2/28 | |
| | | 2014 | | | 2013 | |
| Change in net assets | | | | | | |
| From operations | | | | | | | | |
Net investment income | | | $6,884,190 | | | | $5,464,776 | |
Net realized gain (loss) on investments and foreign currency | | | 14,021,829 | | | | 15,386,959 | |
Net unrealized gain (loss) on investments and foreign currency translation | | | (3,062,027 | ) | | | 28,333,599 | |
Change in net assets from operations | | | $17,843,992 | | | | $49,185,334 | |
| Distributions declared to shareholders | | | | | | | | |
From net investment income | | | $(10,492,384 | ) | | | $(9,892,136 | ) |
From net realized gain on investments | | | (14,946,588 | ) | | | (9,487,195 | ) |
Total distributions declared to shareholders | | | $(25,438,972 | ) | | | $(19,379,331 | ) |
Change in net assets from fund share transactions | | | $114,634,367 | | | | $30,737,340 | |
Total change in net assets | | | $107,039,387 | | | | $60,543,343 | |
| Net assets | | | | | | | | |
At beginning of period | | | 303,295,639 | | | | 242,752,296 | |
At end of period (including accumulated distributions in excess of net investment income of $794,228 and undistributed net investment income of $3,391,941, respectively) | | | $410,335,026 | | | | $303,295,639 | |
See Notes to Financial Statements
13
Financial Statements
FINANCIAL HIGHLIGHTS
The financial highlights table is intended to help you understand the fund’s financial performance for the past 5 years (or life of a particular share class, if shorter). Certain information reflects financial results for a single fund share. The total returns in the table represent the rate by which an investor would have earned (or lost) on an investment in the fund share class (assuming reinvestment of all distributions) held for the entire period.
| | | | | | | | | | | | | | | | | | | | |
| Class A | | Years ended 2/28, 2/29 | | | Period ended 2/28/10 (c) | |
| | | 2014 | | | 2013 | | | 2012 | | | 2011 | | |
Net asset value, beginning of period | | | $15.12 | | | | $13.51 | | | | $14.57 | | | | $14.02 | | | | $10.00 | |
| Income (loss) from investment operations | | | | | | | | | | | | | | | | | |
Net investment income (d) | | | $0.26 | | | | $0.26 | | | | $0.23 | | | | $0.49 | | | | $0.42 | |
Net realized and unrealized gain (loss) on
investments and foreign currency | | | 0.33 | | | | 2.38 | | | | (0.55 | ) | | | 2.46 | | | | 8.68 | |
Total from investment operations | | | $0.59 | | | | $2.64 | | | | $(0.32 | ) | | | $2.95 | | | | $9.10 | |
| Less distributions declared to shareholders | | | | | | | | | | | | | | | | | |
From net investment income | | | $(0.38 | ) | | | $(0.51 | ) | | | $(0.30 | ) | | | $(0.77 | ) | | | $(2.00 | ) |
From net realized gain on investments | | | (0.61 | ) | | | (0.52 | ) | | | (0.44 | ) | | | (1.63 | ) | | | (3.08 | ) |
Total distributions declared to shareholders | | | $(0.99 | ) | | | $(1.03 | ) | | | $(0.74 | ) | | | $(2.40 | ) | | | $(5.08 | ) |
Net asset value, end of period (x) | | | $14.72 | | | | $15.12 | | | | $13.51 | | | | $14.57 | | | | $14.02 | |
Total return (%) (r)(s)(t)(x) | | | 4.24 | | | | 20.14 | | | | (1.81 | ) | | | 23.61 | | | | 91.24 | (n) |
Ratios (%) (to average net assets)
and Supplemental data: | | | | | | | | | | | | | | | | | | | | |
Expenses before expense reductions (f) | | | 1.22 | | | | 1.23 | | | | 1.24 | | | | 1.25 | | | | 1.28 | (a) |
Expenses after expense reductions (f) | | | 1.22 | | | | 1.23 | | | | 1.24 | | | | 1.25 | | | | 1.28 | (a) |
Net investment income | | | 1.74 | | | | 1.85 | | | | 1.74 | | | | 3.45 | | | | 2.89 | (a) |
Portfolio turnover | | | 30 | | | | 46 | | | | 37 | | | | 33 | | | | 91 | |
Net assets at end of period (000 omitted) | | | $291 | | | | $279 | | | | $232 | | | | $236 | | | | $191 | |
See Notes to Financial Statements
14
Financial Highlights – continued
| | | | | | | | | | | | | | | | | | | | |
| Class I | | Years ended 2/28, 2/29 | | | Period
ended
2/28/10 (c) | |
| | | 2014 | | | 2013 | | | 2012 | | | 2011 | | |
Net asset value, beginning of period | | | $15.13 | | | | $13.52 | | | | $14.58 | | | | $14.03 | | | | $10.00 | |
| Income (loss) from investment operations | | | | | | | | | | | | | | | | | |
Net investment income (d) | | | $0.30 | | | | $0.44 | | | | $0.27 | | | | $0.54 | | | | $0.47 | |
Net realized and unrealized gain (loss) on
investments and foreign currency | | | 0.33 | | | | 2.23 | | | | (0.56 | ) | | | 2.45 | | | | 8.67 | |
Total from investment operations | | | $0.63 | | | | $2.67 | | | | $(0.29 | ) | | | $2.99 | | | | $9.14 | |
| Less distributions declared to shareholders | | | | | | | | | | | | | | | | | |
From net investment income | | | $(0.42 | ) | | | $(0.54 | ) | | | $(0.33 | ) | | | $(0.81 | ) | | | $(2.03 | ) |
From net realized gain on investments | | | (0.61 | ) | | | (0.52 | ) | | | (0.44 | ) | | | (1.63 | ) | | | (3.08 | ) |
Total distributions declared to shareholders | | | $(1.03 | ) | | | $(1.06 | ) | | | $(0.77 | ) | | | $(2.44 | ) | | | $(5.11 | ) |
Net asset value, end of period (x) | | | $14.73 | | | | $15.13 | | | | $13.52 | | | | $14.58 | | | | $14.03 | |
Total return (%) (r)(s)(x) | | | 4.50 | | | | 20.41 | | | | (1.54 | ) | | | 23.89 | | | | 91.71 | (n) |
Ratios (%) (to average net assets)
and Supplemental data: | | | | | | | | | | | | | | | | | | | | |
Expenses before expense reductions (f) | | | 0.97 | | | | 0.98 | | | | 0.99 | | | | 1.00 | | | | 1.03 | (a) |
Expenses after expense reductions (f) | | | 0.97 | | | | 0.98 | | | | 0.99 | | | | 1.00 | | | | 1.03 | (a) |
Net investment income | | | 1.99 | | | | 3.30 | | | | 1.98 | | | | 3.77 | | | | 3.22 | (a) |
Portfolio turnover | | | 30 | | | | 46 | | | | 37 | | | �� | 33 | | | | 91 | |
Net assets at end of period (000 omitted) | | | $122 | | | | $117 | | | | $242,520 | | | | $216,082 | | | | $164,347 | |
| | | | | | | | |
| Class R5 | | Years ended 2/28 | |
| | | 2014 | | | 2013 (i) | |
Net asset value, beginning of period | | | $15.13 | | | | $13.74 | |
| Income (loss) from investment operations | | | | | |
Net investment income (d) | | | $0.29 | | | | $0.14 | |
Net realized and unrealized gain (loss) on
investments and foreign currency | | | 0.34 | | | | 2.10 | |
Total from investment operations | | | $0.63 | | | | $2.24 | |
| Less distributions declared to shareholders | | | | | |
From net investment income | | | $(0.42 | ) | | | $(0.50 | ) |
From net realized gain on investments | | | (0.61 | ) | | | (0.35 | ) |
Total distributions declared to shareholders | | | $(1.03 | ) | | | $(0.85 | ) |
Net asset value, end of period (x) | | | $14.73 | | | | $15.13 | |
Total return (%) (r)(s)(x) | | | 4.50 | | | | 16.56 | (n) |
Ratios (%) (to average net assets)
and Supplemental data: | | | | | | | | |
Expenses before expense reductions (f) | | | 0.97 | | | | 0.98 | (a) |
Expenses after expense reductions (f) | | | 0.97 | | | | 0.98 | (a) |
Net investment income | | | 1.94 | | | | 1.48 | (a) |
Portfolio turnover | | | 30 | | | | 46 | (n) |
Net assets at end of period (000 omitted) | | | $409,923 | | | | $302,900 | |
See Notes to Financial Statements
15
Financial Highlights – continued
| (c) | For the period from the commencement of the fund’s investment operations, March 11, 2009, through the stated period end. |
| (d) | Per share data is based on average shares outstanding. |
| (f) | Ratios do not reflect reductions from fees paid indirectly, if applicable. |
| (i) | For the period from the class inception, July 2, 2012, through the stated period end. |
| (r) | Certain expenses have been reduced without which performance would have been lower. |
| (s) | From time to time the fund may receive proceeds from litigation settlements, without which performance would be lower. |
| (t) | Total returns do not include any applicable sales charges. |
| (x) | The net asset values per share and total returns have been calculated on net assets which include adjustments made in accordance with U.S. generally accepted accounting principles required at period end for financial reporting purposes. |
See Notes to Financial Statements
16
NOTES TO FINANCIAL STATEMENTS
(1) Business and Organization
MFS Global Real Estate Fund (the fund) is a diversified series of MFS Series Trust XIII (the trust). The trust is organized as a Massachusetts business trust and is registered under the Investment Company Act of 1940, as amended, as an open-end management investment company.
(2) Significant Accounting Policies
General – The preparation of financial statements in conformity with U.S. generally accepted accounting principles requires management to make estimates and assumptions that affect the reported amounts of assets and liabilities, and disclosure of contingent assets and liabilities at the date of the financial statements and the reported amounts of increases and decreases in net assets from operations during the reporting period. Actual results could differ from those estimates. In the preparation of these financial statements, management has evaluated subsequent events occurring after the date of the fund’s Statement of Assets and Liabilities through the date that the financial statements were issued. The fund invests a significant amount of its net assets in U.S. and foreign real estate related investments and as a result is subject to certain risks associated with the direct ownership of real estate and the real estate industry in general. These include risks related to general, regional and local economic conditions; fluctuations in interest rates; property tax rates, zoning laws, environmental regulations and other governmental action; cash flow dependency; increased operating expenses; lack of availability of mortgage funds; losses due to natural disasters; changes in property values and rental rates; and other factors. The fund invests in foreign securities. Investments in foreign securities are vulnerable to the effects of changes in the relative values of the local currency and the U.S. dollar and to the effects of changes in each country’s legal, political, and economic environment.
In this reporting period, the fund adopted the disclosure provisions of the Financial Accounting Standards Board (FASB) Accounting Standards Update 2011-11 (“ASU 2011-11”), Balance Sheet (Topic 210) – Disclosures about Offsetting Assets and Liabilities along with the related scope clarification provisions of FASB Accounting Standards Update 2013-01 (“ASU 2013-01”) entitled Balance Sheet (Topic 210) – Clarifying the Scope of Disclosures about Offsetting Assets and Liabilities. ASU 2011-11 is intended to enhance disclosures on the offsetting of financial assets and liabilities by requiring entities to disclose both gross and net information about financial instruments and transactions that are either offset in the statement of financial position or subject to a an enforceable Master Netting Agreement or similar arrangement. ASU 2013-01 limits the scope of ASU 2011-11’s disclosure requirements on offsetting to financial assets and financial liabilities related to derivatives, repurchase and reverse repurchase agreements, and securities lending and securities borrowing transactions. The disclosures required by ASU 2011-11, to the extent applicable to the fund, have been included in the fund’s Significant Accounting Policies note under the captions for each of the fund’s in-scope financial instruments and transactions.
In June 2013, FASB issued Accounting Standards Update 2013-08 (“ASU 2013-08”) Financial Services – Investment Companies (Topic 946) – Amendments to the Scope, Measurement, and Disclosure Requirements which is effective for interim and annual
17
Notes to Financial Statements – continued
reporting periods in fiscal years that begin after December 15, 2013. ASU 2013-08 sets forth a methodology for determining whether an entity should be characterized as an investment company and prescribes fair value accounting for an investment company’s non-controlling ownership interest in another investment company. FASB has determined that a fund registered under the Investment Company Act of 1940 automatically meets ASU 2013-08’s criteria for an investment company. Although still evaluating the potential impacts of ASU 2013-08 to the fund, management expects that the impact of the fund’s adoption will be limited to additional financial statement disclosures.
Investment Valuations – Equity securities, including restricted equity securities, are generally valued at the last sale or official closing price as provided by a third-party pricing service on the market or exchange on which they are primarily traded. Equity securities, for which there were no sales reported that day, are generally valued at the last quoted daily bid quotation as provided by a third-party pricing service on the market or exchange on which such securities are primarily traded. Short-term instruments with a maturity at issuance of 60 days or less generally are valued at amortized cost, which approximates market value. Open-end investment companies are generally valued at net asset value per share. Securities and other assets generally valued on the basis of information from a third-party pricing service may also be valued at a broker/dealer bid quotation. Values obtained from third-party pricing services can utilize both transaction data and market information such as yield, quality, coupon rate, maturity, type of issue, trading characteristics, and other market data. The values of foreign securities and other assets and liabilities expressed in foreign currencies are converted to U.S. dollars using the mean of bid and asked prices for rates provided by a third-party pricing service.
The Board of Trustees has delegated primary responsibility for determining or causing to be determined the value of the fund’s investments (including any fair valuation) to the adviser pursuant to valuation policies and procedures approved by the Board. If the adviser determines that reliable market quotations are not readily available, investments are valued at fair value as determined in good faith by the adviser in accordance with such procedures under the oversight of the Board of Trustees. Under the fund’s valuation policies and procedures, market quotations are not considered to be readily available for most types of debt instruments and floating rate loans and many types of derivatives. These investments are generally valued at fair value based on information from third-party pricing services. In addition, investments may be valued at fair value if the adviser determines that an investment’s value has been materially affected by events occurring after the close of the exchange or market on which the investment is principally traded (such as foreign exchange or market) and prior to the determination of the fund’s net asset value, or after the halting of trading of a specific security where trading does not resume prior to the close of the exchange or market on which the security is principally traded. Events that occur on a frequent basis after foreign markets close (such as developments in foreign markets and significant movements in the U.S. markets) and prior to the determination of the fund’s net asset value may be deemed to have a material effect on the value of securities traded in foreign markets. Accordingly, the fund’s foreign equity securities may often be valued at fair value. The adviser generally relies on third-party pricing services or other information (such as the
18
Notes to Financial Statements – continued
correlation with price movements of similar securities in the same or other markets; the type, cost and investment characteristics of the security; the business and financial condition of the issuer; and trading and other market data) to assist in determining whether to fair value and at what value to fair value an investment. The value of an investment for purposes of calculating the fund’s net asset value can differ depending on the source and method used to determine value. When fair valuation is used, the value of an investment used to determine the fund’s net asset value may differ from quoted or published prices for the same investment. There can be no assurance that the fund could obtain the fair value assigned to an investment if it were to sell the investment at the same time at which the fund determines its net asset value per share.
Various inputs are used in determining the value of the fund’s assets or liabilities. These inputs are categorized into three broad levels. In certain cases, the inputs used to measure fair value may fall into different levels of the fair value hierarchy. In such cases, an investment’s level within the fair value hierarchy is based on the lowest level of input that is significant to the fair value measurement. The fund’s assessment of the significance of a particular input to the fair value measurement in its entirety requires judgment, and considers factors specific to the investment. Level 1 includes unadjusted quoted prices in active markets for identical assets or liabilities. Level 2 includes other significant observable market-based inputs (including quoted prices for similar securities, interest rates, prepayment speed, and credit risk). Level 3 includes unobservable inputs, which may include the adviser’s own assumptions in determining the fair value of investments. The following is a summary of the levels used as of February 28, 2014 in valuing the fund’s assets or liabilities:
| | | | | | | | | | | | | | | | |
| Investments at Value | | Level 1 | | | Level 2 | | | Level 3 | | | Total | |
| Equity Securities: | | | | | | | | | | | | | | | | |
United States | | | $200,010,081 | | | | $— | | | | $— | | | | $200,010,081 | |
Japan | | | 46,381,379 | | | | — | | | | — | | | | 46,381,379 | |
United Kingdom | | | 30,448,235 | | | | — | | | | — | | | | 30,448,235 | |
Hong Kong | | | 29,352,899 | | | | — | | | | — | | | | 29,352,899 | |
Singapore | | | 17,212,386 | | | | — | | | | — | | | | 17,212,386 | |
Australia | | | 16,740,340 | | | | — | | | | — | | | | 16,740,340 | |
Netherlands | | | 13,628,974 | | | | — | | | | — | | | | 13,628,974 | |
France | | | 11,285,413 | | | | — | | | | — | | | | 11,285,413 | |
Germany | | | 10,337,333 | | | | — | | | | — | | | | 10,337,333 | |
Other Countries | | | 21,273,463 | | | | 2,044,846 | | | | — | | | | 23,318,309 | |
| Mutual Funds | | | 12,111,962 | | | | — | | | | — | | | | 12,111,962 | |
| Total Investments | | | $408,782,465 | | | | $2,044,846 | | | | $— | | | | $410,827,311 | |
For further information regarding security characteristics, see the Portfolio of Investments.
Of the level 1 investments presented above, equity investments amounting to $43,286,798 would have been considered level 2 investments at the beginning of the period. The primary reason for changes in the classifications between levels 1 and 2 occurs when foreign equity securities are fair valued using other observable market-based inputs in place of the closing exchange price due to events occurring after the close of the exchange or market on which the investment is principally traded.
19
Notes to Financial Statements – continued
The fund’s foreign equity securities may often be valued at fair value. The fund’s policy is to recognize transfers between the levels as of the end of the period.
Foreign Currency Translation – Purchases and sales of foreign investments, income, and expenses are converted into U.S. dollars based upon currency exchange rates prevailing on the respective dates of such transactions or on the reporting date for foreign denominated receivables and payables. Gains and losses attributable to foreign currency exchange rates on sales of securities are recorded for financial statement purposes as net realized gains and losses on investments. Gains and losses attributable to foreign exchange rate movements on receivables, payables, income and expenses are recorded for financial statement purposes as foreign currency transaction gains and losses. That portion of both realized and unrealized gains and losses on investments that results from fluctuations in foreign currency exchange rates is not separately disclosed.
Indemnifications – Under the fund’s organizational documents, its officers and Trustees may be indemnified against certain liabilities and expenses arising out of the performance of their duties to the fund. Additionally, in the normal course of business, the fund enters into agreements with service providers that may contain indemnification clauses. The fund’s maximum exposure under these agreements is unknown as this would involve future claims that may be made against the fund that have not yet occurred.
Investment Transactions and Income – Investment transactions are recorded on the trade date. Dividends received in cash are recorded on the ex-dividend date. Certain dividends from foreign securities will be recorded when the fund is informed of the dividend if such information is obtained subsequent to the ex-dividend date. Dividend payments received in additional securities are recorded on the ex-dividend date in an amount equal to the value of the security on such date.
The fund may receive proceeds from litigation settlements. Any proceeds received from litigation involving portfolio holdings are reflected in the Statement of Operations in realized gain/loss if the security has been disposed of by the fund or in unrealized gain/loss if the security is still held by the fund. Any other proceeds from litigation not related to portfolio holdings are reflected as other income in the Statement of Operations.
Fees Paid Indirectly – The fund’s custody fee may be reduced according to an arrangement that measures the value of cash deposited with the custodian by the fund. This amount, for the year ended February 28, 2014, is shown as a reduction of total expenses in the Statement of Operations.
Tax Matters and Distributions – The fund intends to qualify as a regulated investment company, as defined under Subchapter M of the Internal Revenue Code, and to distribute all of its taxable income, including realized capital gains. As a result, no provision for federal income tax is required. The fund’s federal tax returns, when filed, will remain subject to examination by the Internal Revenue Service for a three year period. Management has analyzed the fund’s tax positions taken on federal and state tax returns for all open tax years and does not believe that there are any uncertain tax positions that require recognition of a tax liability. Foreign taxes, if any, have been accrued by the fund in the accompanying financial statements in accordance with the
20
Notes to Financial Statements – continued
applicable foreign tax law. Foreign income taxes may be withheld by certain countries in which the fund invests. Additionally, capital gains realized by the fund on securities issued in or by certain foreign countries may be subject to capital gains tax imposed by those countries.
Distributions to shareholders are recorded on the ex-dividend date. Income and capital gain distributions are determined in accordance with income tax regulations, which may differ from U.S. generally accepted accounting principles. Certain capital accounts in the financial statements are periodically adjusted for permanent differences in order to reflect their tax character. These adjustments have no impact on net assets or net asset value per share. Temporary differences which arise from recognizing certain items of income, expense, gain or loss in different periods for financial statement and tax purposes will reverse at some time in the future. Distributions in excess of net investment income or net realized gains are temporary overdistributions for financial statement purposes resulting from differences in the recognition or classification of income or distributions for financial statement and tax purposes.
Book/tax differences primarily relate to passive foreign investment companies and wash sale loss deferrals.
The tax character of distributions declared to shareholders for the last two fiscal years is as follows:
| | | | | | | | |
| | | 2/28/14 | | | 2/28/13 | |
| Ordinary income (including any short-term capital gains) | | | $14,724,587 | | | | $13,925,927 | |
| Long-term capital gains | | | 10,714,385 | | | | 5,453,404 | |
| Total distributions | | | $25,438,972 | | | | $19,379,331 | |
The federal tax cost and the tax basis components of distributable earnings were as follows:
| | | | |
| As of 2/28/14 | | | |
| Cost of investments | | | $342,724,225 | |
| Gross appreciation | | | 71,720,244 | |
| Gross depreciation | | | (3,617,158 | ) |
| Net unrealized appreciation (depreciation) | | | $68,103,086 | |
| Post-October capital loss deferral | | | (796,016 | ) |
| Late year ordinary loss deferral | | | (794,228 | ) |
| Other temporary differences | | | 4,995 | |
Multiple Classes of Shares of Beneficial Interest – The fund offers multiple classes of shares, which differ in their respective distribution and/or service fees. The fund’s income, realized and unrealized gain (loss), and common expenses are allocated to shareholders based on the daily net assets of each class. Dividends are declared separately for each class. Differences in per share dividend rates are generally due to
21
Notes to Financial Statements – continued
differences in separate class expenses. The fund’s distributions declared to shareholders as reported in the Statements of Changes in Net Assets are presented by class as follows:
| | | | | | | | | | | | | | | | |
| | | From net investment
income | | | From net realized gain on
investments | |
| | | Year
ended
2/28/14 | | | Year
ended
2/28/13 (i) | | | Year
ended
2/28/14 | | | Year
ended
2/28/13 (i) | |
| Class A | | | $7,140 | | | | $8,821 | | | | $11,513 | | | | $8,986 | |
| Class I | | | 3,280 | | | | 745,043 | | | | 4,811 | | | | 3,157,110 | |
| Class R5 | | | 10,481,964 | | | | 9,138,272 | | | | 14,930,264 | | | | 6,321,099 | |
| Total | | | $10,492,384 | | | | $9,892,136 | | | | $14,946,588 | | | | $9,487,195 | |
| (i) | For Class R5, the period is from inception, July 2, 2012, through the stated period end. |
(3) Transactions with Affiliates
Investment Adviser – The fund has an investment advisory agreement with MFS to provide overall investment management and related administrative services and facilities to the fund. The management fee is computed daily and paid monthly at the following annual rates:
| | | | |
| First $1 billion of average daily net assets | | | 0.90 | % |
| Next $1.5 billion of average daily net assets | | | 0.75 | % |
| Average daily net assets in excess of $2.5 billion | | | 0.65 | % |
Effective April 1, 2013, MFS has agreed in writing to reduce its management fee by a specified amount if certain MFS mutual fund assets exceed thresholds agreed to by MFS and the fund’s Board of Trustees. For the period April 1, 2013 through February 28, 2014, this management fee reduction amounted to $5,037, which is included in the reduction of total expenses in the Statement of Operations. The management fee incurred for the year ended February 28, 2014 was equivalent to an annual effective rate of 0.90% of the fund’s average daily net assets.
Distributor – MFS Fund Distributors, Inc. (MFD), a wholly-owned subsidiary of MFS, as distributor, received no payment for the year ended February 28, 2014, as its portion of the initial sales charge on sales of Class A shares of the fund.
The Board of Trustees has adopted a distribution plan for certain class shares pursuant to Rule 12b-1 of the Investment Company Act of 1940.
The fund’s distribution plan provides that the fund will pay MFD for services provided by MFD and financial intermediaries in connection with the distribution and servicing of certain share classes. One component of the plan is a distribution fee paid to MFD and another component of the plan is a service fee paid to MFD. MFD may subsequently pay all, or a portion, of the distribution and/or service fees to financial intermediaries.
Distribution Plan Fee Table:
| | | | | | | | | | | | | | | | | | | | |
| | | Distribution
Fee Rate (d) | | | Service
Fee Rate (d) | | | Total
Distribution
Plan (d) | | | Annual
Effective
Rate (e) | | | Distribution
and Service
Fee | |
| Class A | | | — | | | | 0.25% | | | | 0.25% | | | | 0.25% | | | | $712 | |
22
Notes to Financial Statements – continued
| (d) | In accordance with the distribution plan for certain classes, the fund pays distribution and/or service fees equal to these annual percentage rates of each class’s average daily net assets. The distribution and service fee rates disclosed by class represent the current rates in effect at the end of the reporting period. |
| (e) | The annual effective rates represent actual fees incurred under the distribution plan for the year ended February 28, 2014 based on each class’s average daily net assets. |
Certain Class A shares are subject to a contingent deferred sales charge (CDSC) in the event of a shareholder redemption within 18 months of purchase for shares purchased on or after August 1, 2012, and within 24 months of purchase for shares purchased prior to August 1, 2012. There were no contingent deferred sales charges imposed during the year ended February 28, 2014.
Shareholder Servicing Agent – MFS Service Center, Inc. (MFSC), a wholly-owned subsidiary of MFS, provides transfer agent and recordkeeping functions in connection with the issuance, transfer, and redemption of shares of the fund under a Shareholder Servicing Agent Agreement. MFSC is not paid a fee for providing these services. MFSC may receive payment from the fund for out-of-pocket expenses, sub-accounting and other shareholder servicing costs which may be paid to affiliated and unaffiliated service providers. Class R5 shares do not incur sub-accounting fees. For the year ended February 28, 2014, out-of-pocket expenses amounted to $292. The fund may also pay shareholder servicing related costs to non-related parties.
Administrator – MFS provides certain financial, legal, shareholder communications, compliance, and other administrative services to the fund. Under an administrative services agreement, the fund partially reimburses MFS the costs incurred to provide these services. The fund is charged an annual fixed amount of $17,500 plus a fee based on average daily net assets. The administrative services fee incurred for the year ended February 28, 2014 was equivalent to an annual effective rate of 0.0152% of the fund’s average daily net assets.
Trustees’ and Officers’ Compensation – The fund pays compensation to independent Trustees in the form of a retainer, attendance fees, and additional compensation to Board and Committee chairpersons. The fund does not pay compensation directly to Trustees or to officers of the fund who are also officers of the investment adviser, all of whom receive remuneration for their services to the fund from MFS. Certain officers and Trustees of the fund are officers or directors of MFS, MFS Fund Distributors, Inc. (MFD), and MFSC.
Other – This fund and certain other funds managed by MFS (the funds) have entered into services agreements (the Agreements) which provide for payment of fees by the funds to Tarantino LLC and Griffin Compliance LLC in return for the provision of services of an Independent Chief Compliance Officer (ICCO) and Assistant ICCO, respectively, for the funds. The ICCO and Assistant ICCO are officers of the funds and the sole members of Tarantino LLC and Griffin Compliance LLC, respectively. The funds can terminate the Agreements with Tarantino LLC and Griffin Compliance LLC at any time under the terms of the Agreements. For the year ended February 28, 2014, the aggregate fees paid by the fund to Tarantino LLC and Griffin Compliance LLC were $1,995 and are included in “Miscellaneous” expense in the Statement of Operations. MFS has agreed to reimburse the fund for a portion of the payments made by the fund in the amount of $756, which is included in the reduction of total expenses in the
23
Notes to Financial Statements – continued
Statement of Operations. Additionally, MFS has agreed to bear all expenses associated with office space, other administrative support, and supplies provided to the ICCO and Assistant ICCO.
The fund invests in the MFS Institutional Money Market Portfolio which is managed by MFS and seeks current income consistent with preservation of capital and liquidity. Income earned on this investment is included in “Dividends from underlying affiliated funds” in the Statement of Operations. This money market fund does not pay a management fee to MFS.
On June 29, 2012, MFS purchased 7,278 shares of Class R5 for an aggregate amount of $100,000. On September 11, 2013, MFS redeemed 7,807 shares of Class R5 for an aggregate amount of $116,246. At February 28, 2014, MFS held 100% of the outstanding shares of Class A and Class I.
(4) Portfolio Securities
Purchases and sales of investments, other than short-term obligations, aggregated $198,262,605 and $104,778,166, respectively.
(5) Shares of Beneficial Interest
The fund’s Declaration of Trust permits the Trustees to issue an unlimited number of full and fractional shares of beneficial interest. Transactions in fund shares were as follows:
| | | | | | | | | | | | | | | | |
| | | Year ended
2/28/14 | | | Year ended
2/28/13 (i) | |
| | | Shares | | | Amount | | | Shares | | | Amount | |
| Shares sold | | | | | | | | | | | | | | | | |
Class I | | | — | | | | $— | | | | 696,721 | | | | $9,351,221 | |
Class R5 | | | 7,202,580 | | | | 107,486,452 | | | | 20,161,300 | | | | 280,296,080 | |
| | | 7,202,580 | | | | $107,486,452 | | | | 20,858,021 | | | | $289,647,301 | |
| | | | |
| Shares issued to shareholders in reinvestment of distributions | | | | | | | | | | | | | | | | |
Class A | | | 1,304 | | | | $18,653 | | | | 1,262 | | | | $17,807 | |
Class I | | | 566 | | | | 8,091 | | | | 303,616 | | | | 3,902,153 | |
Class R5 | | | 1,781,163 | | | | 25,412,228 | | | | 1,069,113 | | | | 15,459,371 | |
| | | 1,783,033 | | | | $25,438,972 | | | | 1,373,991 | | | | $19,379,331 | |
| | | | |
| Shares reacquired | | | | | | | | | | | | | | | | |
Class I | | | — | | | | $— | | | | (18,934,608 | ) | | | $(260,810,383 | ) |
Class R5 | | | (1,176,705 | ) | | | (18,291,057 | ) | | | (1,204,914 | ) | | | (17,478,909 | ) |
| | | (1,176,705 | ) | | | $(18,291,057 | ) | | | (20,139,522 | ) | | | $(278,289,292 | ) |
| | | | |
| Net change | | | | | | | | | | | | | | | | |
Class A | | | 1,304 | | | | $18,653 | | | | 1,262 | | | | $17,807 | |
Class I | | | 566 | | | | 8,091 | | | | (17,934,271 | ) | | | (247,557,009 | ) |
Class R5 | | | 7,807,038 | | | | 114,607,623 | | | | 20,025,499 | | | | 278,276,542 | |
| | | 7,808,908 | | | | $114,634,367 | | | | 2,092,490 | | | | $30,737,340 | |
| (i) | For Class R5, the period is from inception, July 2, 2012, through the stated period end. |
24
Notes to Financial Statements – continued
Class A, Class B, Class C, Class R1, Class R2, Class R3, and Class R4 shares were not available for sale during the period. During the period, the fund’s Class I and Class R5 shares were available for sale only to funds distributed by MFD that invest primarily in shares of other MFS funds (“MFS fund-of-funds”). Effective June 28, 2013, Class I shares are not available for sale. Please see the fund’s prospectus for details.
The fund is solely invested in by MFS and the MFS funds-of-funds. The MFS funds-of-funds do not invest in the underlying funds for the purpose of exercising management or control. At the end of the period, the MFS Growth Allocation Fund, MFS Moderate Allocation Fund, MFS Aggressive Growth Allocation Fund, MFS Conservative Allocation Fund, MFS Liftetime 2040 Fund, MFS Liftetime 2030 Fund, and MFS Liftetime 2020 Fund were the owners of record of approximately 35%, 28%, 20%, 7%, 3%, 3%, and 1%, respectively, of the value of outstanding voting shares of the fund. In addition, the MFS Lifetime Retirement Income Fund, MFS Lifetime 2055 Fund, MFS Lifetime 2050 Fund, MFS Lifetime 2045 Fund, MFS Lifetime 2035 Fund, MFS Lifetime 2025 Fund, MFS Lifetime 2015 Fund, and the MFS Lifetime 2010 Fund were each the owners of record of less than 1% of the value of outstanding voting shares of the fund.
(6) Line of Credit
The fund and certain other funds managed by MFS participate in a $1.1 billion unsecured committed line of credit, subject to a $1 billion sublimit, provided by a syndication of banks under a credit agreement. Borrowings may be made for temporary financing needs. Interest is charged to each fund, based on its borrowings, generally at a rate equal to the higher of the Federal Reserve funds rate or one month LIBOR plus an agreed upon spread. A commitment fee, based on the average daily, unused portion of the committed line of credit, is allocated among the participating funds at the end of each calendar quarter. In addition, the fund and other funds managed by MFS have established unsecured uncommitted borrowing arrangements with certain banks for temporary financing needs. Interest is charged to each fund, based on its borrowings, at a rate equal to the Federal Reserve funds rate plus an agreed upon spread. For the year ended February 28, 2014, the fund’s commitment fee and interest expense were $1,542 and $0, respectively, and are included in “Miscellaneous” expense in the Statement of Operations.
(7) Transactions in Underlying Affiliated Funds-Affiliated Issuers
An affiliated issuer may be considered one in which the fund owns 5% or more of the outstanding voting securities, or a company which is under common control. For the purposes of this report, the fund assumes the following to be an affiliated issuer:
| | | | | | | | | | | | | | | | |
| Underlying Affiliated Fund | | Beginning
Shares/Par
Amount | | | Acquisitions
Shares/Par
Amount | | | Dispositions
Shares/Par
Amount | | | Ending
Shares/Par
Amount | |
MFS Institutional Money
Market Portfolio | | | 4,064,702 | | | | 140,013,664 | | | | (131,966,404 | ) | | | 12,111,962 | |
| | | | |
| Underlying Affiliated Fund | | Realized
Gain (Loss) | | | Capital Gain
Distributions | | | Dividend
Income | | | Ending
Value | |
MFS Institutional Money
Market Portfolio | | | $— | | | | $— | | | | $5,941 | | | | $12,111,962 | |
25
REPORT OF INDEPENDENT REGISTERED PUBLIC ACCOUNTING FIRM
To the Trustees and Shareholders of
MFS Global Real Estate Fund:
We have audited the accompanying statement of assets and liabilities of MFS Global Real Estate Fund (the Fund), including the portfolio of investments, as of February 28, 2014, and the related statement of operations for the year then ended, the statements of changes in net assets for each of the two years in the period then ended, and the financial highlights for each of the periods indicated therein. These financial statements and financial highlights are the responsibility of the Fund’s management. Our responsibility is to express an opinion on these financial statements and financial highlights based on our audits.
We conducted our audits in accordance with the standards of the Public Company Accounting Oversight Board (United States). Those standards require that we plan and perform the audit to obtain reasonable assurance about whether the financial statements and financial highlights are free of material misstatement. We were not engaged to perform an audit of the Fund’s internal control over financial reporting. Our audits included consideration of internal control over financial reporting as a basis for designing audit procedures that are appropriate in the circumstances, but not for the purpose of expressing an opinion on the effectiveness of the Fund’s internal control over financial reporting. Accordingly, we express no such opinion. An audit also includes examining, on a test basis, evidence supporting the amounts and disclosures in the financial statements and financial highlights, assessing the accounting principles used and significant estimates made by management, and evaluating the overall financial statement presentation. Our procedures included confirmation of securities owned as of February 28, 2014, by correspondence with the Fund’s custodian and others or by other appropriate auditing procedures where replies from others were not received. We believe that our audits provide a reasonable basis for our opinion.
In our opinion, the financial statements and financial highlights referred to above present fairly, in all material respects, the financial position of MFS Global Real Estate Fund at February 28, 2014, the results of its operations for the year then ended, the changes in its net assets for each of the two years in the period then ended, and its financial highlights for each of the periods indicated therein, in conformity with U.S. generally accepted accounting principles.

Boston, Massachusetts
April 14, 2014
26
TRUSTEES AND OFFICERS — IDENTIFICATION AND BACKGROUND
The Trustees and Officers of the Trust, as of April 1, 2014, are listed below, together with their principal occupations during the past five years. (Their titles may have varied during that period.) The address of each Trustee and Officer is 111 Huntington Avenue, Boston, Massachusetts 02199-7618. It is expected that the Board will appoint Mr. Timothy M. Fagan as Chief Compliance Officer of the MFS Funds on November 1, 2014.
| | | | | | | | |
Name, Age | | Position(s) Held with Fund | | Trustee/Officer
Since (h) | | Principal
Occupations During the Past Five Years | | Other Directorships (j) |
| INTERESTED TRUSTEES |
Robert J. Manning (k) (age 50) | | Trustee | | February 2004 | | Massachusetts Financial Services Company, Chairman, Chief Executive Officer and Director; President (until 2009); Chief Investment Officer (until 2010) | | N/A |
Robin A. Stelmach (k) (age 52) | | Trustee | | January 2014 | | Massachusetts Financial Services Company, Executive Vice President and Chief Operating Officer | | N/A |
| INDEPENDENT TRUSTEES |
David H. Gunning (age 71) | | Trustee and Chair of Trustees | | January 2004 | | Private investor | | Lincoln Electric Holdings, Inc. (welding equipment manufacturer), Director; Development Alternatives, Inc. (consulting), Director/Non-Executive Chairman |
Steven E. Buller (age 62) | | Trustee | | February 2014 | | Chairman, Financial Accounting Standards Advisory Council; Standing Advisory Group, Public Company Accounting Oversight Board, Member; BlackRock, Inc. (investment management), Managing Director (until 2014), BlackRock Finco (investment management), UK, Director (until 2014) | | N/A |
27
Trustees and Officers – continued
| | | | | | | | |
Name, Age | | Position(s) Held with Fund | | Trustee/Officer
Since (h) | | Principal
Occupations During the Past Five Years | | Other Directorships (j) |
Robert E. Butler (age 72) | | Trustee | | January 2006 | | Consultant – investment company industry regulatory and compliance matters | | N/A |
Maureen R. Goldfarb (age 58) | | Trustee | | January 2009 | | Private investor | | N/A |
William R. Gutow (age 72) | | Trustee | | December 1993 | | Private investor and real estate consultant; Capitol Entertainment Management Company (video franchise), Vice Chairman | | Texas Donuts (donut franchise), Vice Chairman (until 2010) |
Michael Hegarty (age 69) | | Trustee | | December 2004 | | Private investor | | Brookfield Office Properties, Inc. (real estate), Director; Rouse Properties Inc. (real estate), Director; Capmark Financial Group Inc. (real estate), Director |
John P. Kavanaugh (age 59) | | Trustee | | January 2009 | | Private investor | | N/A |
Laurie J. Thomsen (age 56) | | Trustee | | March 2005 | | Private investor; New Profit, Inc. (venture philanthropy), Executive Partner (until 2010) | | The Travelers Companies (insurance), Director |
Robert W. Uek (age 72) | | Trustee | | January 2006 | | Consultant to investment company industry | | N/A |
| OFFICERS | | | | | | | | |
John M. Corcoran (k) (age 48) | | President | | October 2008 | | Massachusetts Financial Services Company, Senior Vice President | | N/A |
Christopher R. Bohane (k) (age 40) | | Assistant Secretary and Assistant Clerk | | July 2005 | | Massachusetts Financial Services Company, Vice President and Assistant General Counsel | | N/A |
Kino Clark (k) (age 45) | | Assistant Treasurer | | January 2012 | | Massachusetts Financial Services Company, Vice President | | N/A |
28
Trustees and Officers – continued
| | | | | | | | |
Name, Age | | Position(s) Held with Fund | | Trustee/Officer
Since (h) | | Principal
Occupations During the Past Five Years | | Other Directorships (j) |
Thomas H. Connors (k) (age 54) | | Assistant Secretary and Assistant Clerk | | September 2012 | | Massachusetts Financial Services Company, Vice President and Senior Counsel; Deutsche Investment Management Americas Inc. (financial service provider), Director and Senior Counsel (until 2012) | | N/A |
Ethan D. Corey (k) (age 50) | | Assistant Secretary and Assistant Clerk | | July 2005 | | Massachusetts Financial Services Company, Senior Vice President and Associate General Counsel | | N/A |
David L. DiLorenzo (k) (age 45) | | Treasurer | | July 2005 | | Massachusetts Financial Services Company, Senior Vice President | | N/A |
Robyn L. Griffin (age 38) | | Assistant Independent Chief Compliance Officer | | August 2008 | | Griffin Compliance LLC (provider of compliance services), Principal | | N/A |
Brian E. Langenfeld (k) (age 41) | | Assistant Secretary and Assistant Clerk | | June 2006 | | Massachusetts Financial Services Company, Vice President and Senior Counsel | | N/A |
Susan S. Newton (k) (age 64) | | Assistant Secretary and Assistant Clerk | | May 2005 | | Massachusetts Financial Services Company, Senior Vice President and Associate General Counsel | | N/A |
Susan A. Pereira (k) (age 43) | | Assistant Secretary and Assistant Clerk | | July 2005 | | Massachusetts Financial Services Company, Vice President and Senior Counsel | | N/A |
Kasey L. Phillips (k) (age 43) | | Assistant Treasurer | | September 2012 | | Massachusetts Financial Services Company, Vice President; Wells Fargo Funds Management, LLC, Senior Vice President, Fund Treasurer (until 2012) | | N/A |
29
Trustees and Officers – continued
| | | | | | | | |
Name, Age | | Position(s) Held with Fund | | Trustee/Officer
Since (h) | | Principal
Occupations During the Past Five Years | | Other Directorships (j) |
Mark N. Polebaum (k) (age 61) | | Secretary and Clerk | | January 2006 | | Massachusetts Financial Services Company, Executive Vice President, General Counsel and Secretary | | N/A |
Frank L. Tarantino (l) (age 70) | | Independent
Chief Compliance Officer | | June 2004 | | Tarantino LLC (provider of compliance services), Principal | | N/A |
Richard S. Weitzel (k) (age 43) | | Assistant Secretary and Assistant Clerk | | October 2007 | | Massachusetts Financial Services Company, Senior Vice President and Associate General Counsel | | N/A |
James O. Yost (k) (age 53) | | Deputy
Treasurer | | September 1990 | | Massachusetts Financial Services Company, Senior Vice President | | N/A |
| (h) | Date first appointed to serve as Trustee/officer of an MFS Fund. Each Trustee has served continuously since appointment unless indicated otherwise. For the period from December 15, 2004 until February 22, 2005, Mr. Manning served as Advisory Trustee. For the period October 2008, until January 2012, Mr. Corcoran served as Treasurer of the Funds. Prior to January 2012, Messrs. DiLorenzo and Yost served as Assistant Treasurers of the Funds. |
| (j) | Directorships or trusteeships of companies required to report to the Securities and Exchange Commission (i.e., “public companies”). |
| (k) | “Interested person” of the Trust within the meaning of the Investment Company Act of 1940 (referred to as the 1940 Act), which is the principal federal law governing investment companies like the fund, as a result of position with MFS. The address of MFS is 111 Huntington Avenue, Boston, Massachusetts 02199-7618. |
| (l) | Mr. Tarantino will retire as Independent Chief Compliance Officer of the MFS Funds on October 31, 2014. It is expected that Mr. Tarantino will continue after that date as an Officer of the MFS Funds. |
Each Trustee (except Ms. Stelmach and Mr. Buller) has been elected by shareholders and each Trustee and officer holds office until his or her successor is chosen and qualified or until his or her earlier death, resignation, retirement or removal. The Trust does not hold annual meetings for the purpose of electing Trustees, and Trustees are not elected for fixed terms. Messrs. Butler, Kavanaugh, Uek and Ms. Thomsen are members of the Trust’s Audit Committee.
Each of the Fund’s Trustees and officers holds comparable positions with certain other funds of which MFS or a subsidiary is the investment adviser or distributor, and, in the case of the officers, with certain affiliates of MFS. As of January 1, 2014, the Trustees served as board members of 142 funds within the MFS Family of Funds.
30
Trustees and Officers – continued
The Statement of Additional Information for the Fund includes further information about the Trustees and is available without charge upon request by calling 1-800-225-2606.
| | |
| Investment Adviser | | Custodian |
Massachusetts Financial Services Company
111 Huntington Avenue
Boston, MA 02199-7618 | | State Street Bank and Trust Company 1 Lincoln Street Boston, MA 02111-2900 |
| Distributor | | Independent Registered Public Accounting Firm |
MFS Fund Distributors, Inc.
111 Huntington Avenue
Boston, MA 02199-7618 | | Ernst & Young LLP 200 Clarendon Street Boston, MA 02116 |
| Portfolio Manager | | |
Richard Gable | | |
31
BOARD REVIEW OF INVESTMENT ADVISORY AGREEMENT
A discussion regarding the Board’s most recent review and renewal of the fund’s Investment Advisory Agreement with MFS is available by clicking on the fund’s name under “Mutual Funds” in the “Products” section of the MFS Web site (mfs.com).
PROXY VOTING POLICIES AND INFORMATION
A general description of the MFS funds’ proxy voting policies and procedures is available without charge, upon request, by calling 1-800-225-2606, by visiting the Proxy Voting section of mfs.com or by visiting the SEC’s Web site at http://www.sec.gov.
Information regarding how the fund voted proxies relating to portfolio securities during the most recent twelve-month period ended June 30 is available without charge by visiting the Proxy Voting section of mfs.com or by visiting the SEC’s Web site at http://www.sec.gov.
QUARTERLY PORTFOLIO DISCLOSURE
The fund will file a complete schedule of portfolio holdings with the Securities and Exchange Commission (the Commission) for the first and third quarters of each fiscal year on Form N-Q. A shareholder can obtain the quarterly portfolio holdings report at mfs.com. The fund’s Form N-Q is also available on the EDGAR database on the Commission’s Internet Web site at http://www.sec.gov, and may be reviewed and copied at the:
Public Reference Room
Securities and Exchange Commission
100 F Street, NE, Room 1580
Washington, D.C. 20549
Information on the operation of the Public Reference Room may be obtained by calling the Commission at 1-800-SEC-0330. Copies of the fund’s Form N-Q also may be obtained, upon payment of a duplicating fee, by electronic request at the following e-mail address: publicinfo@sec.gov or by writing the Public Reference Section at the above address.
FURTHER INFORMATION
From time to time, MFS may post important information about the fund or the MFS funds on the MFS web site (mfs.com). This information is available by visiting the “Commentary & Announcements” and “Market Outlooks” sections of mfs.com or by clicking on the fund’s name under “Mutual Funds” in the “Products” section of mfs.com.
FEDERAL TAX INFORMATION (unaudited)
The fund will notify shareholders of amounts for use in preparing 2014 income tax forms in January 2015. The following information is provided pursuant to provisions of the Internal Revenue Code.
The fund designates the maximum amount allowable as qualified dividend income eligible for the 15% tax rate.
The fund designates $11,969,000 as capital gain dividends paid during the fiscal year.
32
rev. 3/11
| | | | |
| | | |
FACTS | | WHAT DOES MFS DO WITH YOUR PERSONAL INFORMATION? | |  |
| | |
| Why? | | Financial companies choose how they share your personal information. Federal law gives consumers the right to limit some but not all sharing. Federal law also requires us to tell you how we collect, share, and protect your personal information. Please read this notice carefully to understand what we do. |
| | |
| What? | | The types of personal information we collect and share depend on the product or service you have with us. This information can include: • Social Security number and account balances • Account transactions and transaction history • Checking account information and wire transfer instructions When you are no longer our customer, we continue to share your information as described in this notice. |
| | |
| How? | | All financial companies need to share customers’ personal information to run their everyday business. In the section below, we list the reasons financial companies can share their customers’ personal information; the reasons MFS chooses to share; and whether you can limit this sharing. |
| | | | |
Reasons we can share your
personal information | | Does MFS
share? | | Can you limit
this sharing? |
For our everyday business purposes – such as to process your transactions, maintain your account(s), respond to court orders and legal investigations, or report to credit bureaus | | Yes | | No |
For our marketing purposes – to offer our products and services to you | | No | | We don’t share |
| For joint marketing with other financial companies | | No | | We don’t share |
For our affiliates’ everyday business purposes – information about your transactions and experiences | | No | | We don’t share |
For our affiliates’ everyday business purposes – information about your creditworthiness | | No | | We don’t share |
| For nonaffiliates to market to you | | No | | We don’t share |
| | |
| Questions? | | Call 800-225-2606 or go to mfs.com. |
33
| | |
| Who we are |
| Who is providing this notice? | | MFS Funds, MFS Investment Management, MFS Institutional Advisors, Inc., MFS Fund Distributors, Inc., MFS Heritage Trust Company, and MFS Service Center, Inc. |
| | |
| What we do |
| How does MFS protect my personal information? | | To protect your personal information from unauthorized access and use, we use security measures that comply with federal law. These measures include procedural, electronic, and physical safeguards for the protection of the personal information we collect about you. |
| How does MFS collect my personal information? | | We collect your personal information, for example, when you •open an account or provide account information •direct us to buy securities or direct us to sell your securities •make a wire transfer We also collect your personal information from others, such as credit bureaus, affiliates and other companies. |
| Why can’t I limit all sharing? | | Federal law gives you the right to limit only •sharing for affiliates’ everyday business purposes – information about your creditworthiness •affiliates from using your information to market to you •sharing for nonaffiliates to market to you State laws and individual companies may give you additional rights to limit sharing. |
| | |
| Definitions |
| Affiliates | | Companies related by common ownership or control. They can be financial and nonfinancial companies. •MFS does not share personal information with affiliates, except for everyday business purposes as described on page one of this notice. |
| Nonaffiliates | | Companies not related by common ownership or control. They can be financial and nonfinancial companies. •MFS does not share with nonaffiliates so they can market to you. |
| Joint Marketing | | A formal agreement between nonaffiliated financial companies that together market financial products or services to you. •MFS doesn’t jointly market. |
| | |
| Other important information |
| If you own an MFS product or receive an MFS service in the name of a third party such as a bank or broker-dealer, their privacy policy may apply to you instead of ours. |
34
Save paper with eDelivery.

| MFS® will send you prospectuses, |
reports, and proxies directly via e-mail so you will get information faster with less mailbox clutter.
To sign up:
1. Go to mfs.com.
2. Log in via MFS® Access.
3. Select eDelivery.
If you own your MFS fund shares through a financial institution or a retirement plan, MFS® TALK, MFS® Access, or eDelivery may not be available to you.
CONTACT
WEB SITE
mfs.com
MFS TALK
1-800-637-8255
24 hours a day
ACCOUNT SERVICE AND LITERATURE
Shareholders
1-800-225-2606
Financial advisors
1-800-343-2829
Retirement plan services
1-800-637-1255
MAILING ADDRESS
MFS Service Center, Inc.
P.O. Box 55824
Boston, MA 02205-5824
OVERNIGHT MAIL
MFS Service Center, Inc.
c/o Boston Financial Data Services
30 Dan Road
Canton, MA 02021-2809
ANNUAL REPORT
February 28, 2014

MFS® NEW DISCOVERY VALUE FUND

NDV-ANN
MFS® NEW DISCOVERY VALUE FUND
CONTENTS
The report is prepared for the general information of shareholders. It is authorized for distribution to prospective investors only when preceded or accompanied by a current prospectus.
NOT FDIC INSURED Ÿ MAY LOSE VALUE Ÿ NO BANK GUARANTEE

LETTER FROM THE CHAIRMAN AND CEO
Dear Shareholders:
The U.S. economy appears to have slowed early in 2014 after a strong second half of 2013. Harsh winter weather likely contributed to at least a temporary softening of consumer demand. Looking at the longer term, the pace of U.S. economic growth has
been modest since the recovery began late in 2009. Corporate profits remain healthy overall. A major plus is the removal of a highly confrontational atmosphere in the U.S. Congress, which had clouded business decision-making since 2011.
Globally, recent months have been dominated by volatility, including emerging market currency jitters and rising geopolitical tensions. These add to the possibility of economic uncertainty and financial market unease. However, the eurozone continues to show signs of recovery, while Japan is making progress as it seeks to break free of deflation.
China’s transition toward a more consumer-oriented and less export-driven economy — one with a more stable and sustainable growth rate — could be positive in the long term. However, in the near term, any deceleration in China’s rate of growth could have a ripple effect on its many global trading partners.
In uncertain times such as these, it is particularly important to remember that managing risk should always be a top priority. At MFS®, active risk management is an integral part of our collaborative process. Our global team of investment professionals shares ideas and evaluates opportunities that span continents, investment disciplines and asset classes. Our goal is to build better insights, and ultimately better results, for our clients.
We understand and appreciate the economic challenges investors face, and we believe in the value of maintaining a long-term view and applying proven principles, such as asset allocation and diversification. We are confident that our unique approach can serve investors well as they work with their financial advisors to identify and pursue the most suitable opportunities.
Respectfully,

Robert J. Manning
Chairman and Chief Executive Officer
MFS Investment Management
April 14, 2014
The opinions expressed in this letter are subject to change, may not be relied upon for investment advice, and no forecasts can be guaranteed.
1
PORTFOLIO COMPOSITION
Portfolio structure
| | | | |
| Top ten holdings | | | | |
| CAI International, Inc. | | | 2.0% | |
| Global Payments, Inc. | | | 1.6% | |
| Diana Shipping, Inc. | | | 1.4% | |
| MEDNAX, Inc. | | | 1.4% | |
| TCF Financial Corp. | | | 1.4% | |
| EZCORP, Inc., “A” | | | 1.4% | |
| Iluka Resources Ltd. | | | 1.4% | |
| Rovi Corp. | | | 1.4% | |
| Corporate Office Properties Trust, REIT | | | 1.3% | |
| Everest Re Group Ltd. | | | 1.3% | |
| | | | |
| Equity sectors | | | | |
| Financial Services | | | 28.9% | |
| Technology | | | 11.9% | |
| Industrial Goods & Services | | | 7.6% | |
| Special Products & Services | | | 7.5% | |
| Energy | | | 7.0% | |
| Retailing | | | 6.7% | |
| Basic Materials | | | 6.5% | |
| Leisure | | | 5.8% | |
| Health Care | | | 4.7% | |
| Utilities & Communications | | | 4.2% | |
| Transportation | | | 3.9% | |
| Consumer Staples | | | 1.9% | |
| Autos & Housing | | | 1.1% | |
Percentages are based on net assets as of 2/28/14.
The portfolio is actively managed and current holdings may be different.
2
MANAGEMENT REVIEW
Summary of Results
For the twelve months ended February 28, 2014, Class A shares of the MFS New Discovery Value Fund (“fund”) provided a total return of 27.39%, at net asset value. This compares with a return of 26.19% for the fund’s benchmark, the Russell 2000 Value Index.
Market Environment
Early in the period, jitters over a banking crisis in Cyprus was more than offset by ongoing accommodative global monetary policy and improving economic data, resulting in gains in both equity and fixed income markets. As the period progressed, concerns that the US Federal Reserve (“Fed”) would begin tapering its quantitative easing (“QE”) program caused sovereign bond yields to spike, credit spreads to widen, and equity valuations to fall. Equities subsequently outperformed fixed income in response to the improved economic fundamentals.
Toward the middle of the period, the Fed’s decision to postpone QE tapering surprised markets. Favorable market reactions were tempered, however, by tense negotiations over US fiscal policy which resulted in a 16-day partial shutdown of the federal government and a short-term extension in the debt ceiling. The volatility was short-lived, however, as an extension of budget and debt ceiling deadlines allowed the government to re-open, and subsequent economic data reflected moderate but resilient US growth. Also well-received was the decision by the European Central Bank to cut its policy rate as inflation pressures waned in the region. In addition, equity investors appeared to have concluded that there would be no major change in US monetary policy as a result of the nomination of Janet Yellen as the new Fed Chair for a term beginning in early 2014.
Later in the period, emerging market stresses resurfaced with political unrest, falling currencies and slowing growth which appeared to have impacted investor sentiment. Markets were also forced to contend with some unexpected weakness in the US economy due largely to weather-related interruptions to hiring and spending plans as well as production schedules. Once again, the setback was short-lived as the major US equity indexes traded near their all-time highs by the end of the period.
Contributors to Performance
Stock selection and an underweight position in the financial services sector was a primary factor for the fund’s outperformance relative to the Russell 2000 Value Index. Within this sector, overweight positions in strong-performing loan products provider Regional Management and financial services provider PrivateBancorp benefited relative performance. Shares of PrivateBancorp traded higher in the latter half of the reporting period as the company reported solid earnings with improving loan growth and net interest income.
Security selection in the special products & services sector also aided relative results. Here, the fund’s holdings of electronic payments processor Global Payments (b) and education services provider Grand Canyon Education (b)(h) boosted relative performance as both stocks turned in strong performance for the period.
3
Management Review – continued
Positive stock selection within the consumer staples sector contributed to relative returns, led by an overweight position in strong-performing tobacco products supplier Schweitzer-Mauduit (h).
The combination of an underweight allocation and stock selection within the utilities & communications sector also supported relative results. However, there were no individual stocks within this sector that were among the fund’s top relative contributors.
Elsewhere, the fund’s holdings of apparel manufacturer Hanesbrands (b), wholesale technology distribution company Ingram Micro (b) and digital entertainment provider Rovi (b) boosted relative performance as all three stocks outperformed the benchmark. Shares of Hanesbrands appeared to react positively to the company’s acquisition of Maidenform Brands. The company also beat market expectations on earnings and gross margin. Overweight allocations to healthcare staffing services provider Cross Country Healthcare and movie theater operator Carmike Cinemas also contributed to relative results.
Detractors from Performance
Stock selection in the industrial goods & services sector was a primary detractor from relative performance. The fund’s holdings of weak-performing high technology filtration company Polypore International (b) hindered relative results. Shares of Polypore International declined towards the end of the period after management reported weaker-than-expected lithium ion battery separator revenue. Additionally, the firm experienced margin contraction across this division which appeared to have further pressured the stock.
Elsewhere, the fund’s overweight positions in freight container supplier CAI International, air cargo and aircraft operation solutions provider Atlas Air Worldwide Holdings, potassium-related products producer Intrepid Potash (h) and apparel retailer Gordmans Stores held back relative returns as all four stocks underperformed the benchmark over the reporting period. Additionally, the fund’s holdings of mining company Iluka Resources (b) (Australia), semiconductor equipment supplier Ultratech (b), industrial packaging product supplier Greif (b) and real estate investment trust Hatteras Financial (b) weakened relative performance. Shares of Ultratech dropped after management lowered the firm’s guidance late in the period related to order push outs in their LSA product due to yield issues at several customers.
The fund’s cash and/or cash equivalents position during the period also weakened relative performance. Under normal market conditions, the fund strives to be fully invested and generally holds cash to buy new holdings and to provide liquidity. In a period when equity markets rose, as measured by the fund’s benchmark, holding cash hurt performance versus the benchmark, which has no cash position.
Respectfully,
Kevin Schmitz
Portfolio Manager
| (b) | Security is not a benchmark constituent. |
| (h) | Security was not held in the portfolio at period end. |
4
Management Review – continued
The views expressed in this report are those of the portfolio manager only through the end of the period of the report as stated on the cover and do not necessarily reflect the views of MFS or any other person in the MFS organization. These views are subject to change at any time based on market or other conditions, and MFS disclaims any responsibility to update such views. These views may not be relied upon as investment advice or an indication of trading intent on behalf of any MFS portfolio. References to specific securities are not recommendations of such securities, and may not be representative of any MFS portfolio’s current or future investments.
5
PERFORMANCE SUMMARY THROUGH 2/28/14
The following chart illustrates a representative class of the fund’s historical performance in comparison to its benchmark(s). Performance results include the deduction of the maximum applicable sales charge and reflect the percentage change in net asset value, including reinvestment of dividends and capital gains distributions. The performance of other share classes will be greater than or less than that of the class depicted below. Benchmarks are unmanaged and may not be invested in directly. Benchmark returns do not reflect sales charges, commissions or expenses. (See Notes to Performance Summary.)
Performance data shown represents past performance and is no guarantee of future results. Investment return and principal value fluctuate so your shares, when sold, may be worth more or less than the original cost; current performance may be lower or higher than quoted. The performance shown does not reflect the deduction of taxes, if any, that a shareholder would pay on fund distributions or the redemption of fund shares.
Growth of a Hypothetical $10,000 Investment (t)
6
Performance Summary – continued
Total Returns through 2/28/14
Average annual without sales charge
| | | | | | | | | | |
| | | Share class | | Class inception date | | 1-yr | | Life (t) | | |
| | | A | | 5/26/11 | | 27.39% | | 17.24% | | |
| | | B | | 5/26/11 | | 26.40% | | 16.35% | | |
| | | C | | 5/26/11 | | 26.46% | | 16.39% | | |
| | | I | | 5/26/11 | | 27.71% | | 17.53% | | |
| | | R1 | | 5/26/11 | | 26.50% | | 16.39% | | |
| | | R2 | | 5/26/11 | | 27.12% | | 16.97% | | |
| | | R3 | | 5/26/11 | | 27.38% | | 17.25% | | |
| | | R4 | | 5/26/11 | | 27.77% | | 17.55% | | |
| | | R5 | | 7/02/12 | | 27.77% | | 27.86% | | |
| Comparative benchmark | | | | | | |
| | | Russell 2000 Value Index (f) | | 26.19% | | 14.81% | | |
| Average annual with sales charge | | | | | | |
| | | A
With initial Sales Charge (5.75%) | | 20.07% | | 14.75% | | |
| | | B
With CDSC (Declining over six years from 4% to 0%) (v) | | 22.40% | | 15.52% | | |
| | | C
With CDSC (1% for 12 months) (v) | | 25.46% | | 16.39% | | |
Class I, R1, R2, R3, R4, and R5 shares do not have a sales charge.
CDSC – Contingent Deferred Sales Charge.
| (f) | Source: FactSet Research Systems Inc. |
| (t) | For the period from the class inception date through the stated period end. The comparative benchmark performance information provided for the “life” period is from the inception date of the Class A shares. (See Notes to Performance Summary.) |
| (v) | Assuming redemption at the end of the applicable period. |
Benchmark Definition
Russell 2000 Value Index – a market-capitalization-weighted, value-oriented index that measures the performance of small-capitalization stocks that have relatively low price-to-book ratios and lower forecasted growth values.
It is not possible to invest directly in an index.
Notes to Performance Summary
Average annual total return represents the average annual change in value for each share class for the periods presented. Life returns are presented where the share class has less than 10 years of performance history and represent the average annual total return from the class inception date to the stated period end date. As the fund’s share classes may have different inception dates, the life returns may represent different time periods and may not be comparable.
7
Performance Summary – continued
Performance results reflect any applicable expense subsidies and waivers in effect during the periods shown. Without such subsidies and waivers the fund’s performance results would be less favorable. Please see the prospectus and financial statements for complete details.
Performance results do not include adjustments made for financial reporting purposes in accordance with U.S. generally accepted accounting principles and may differ from amounts reported in the financial highlights.
From time to time the fund may receive proceeds from litigation settlements, without which performance would be lower.
8
EXPENSE TABLE
Fund expenses borne by the shareholders during the period, September 1, 2013 through February 28, 2014
As a shareholder of the fund, you incur two types of costs: (1) transaction costs, including sales charges (loads) on certain purchase or redemption payments, and (2) ongoing costs, including management fees; distribution and service (12b-1) fees; and other fund expenses. This example is intended to help you understand your ongoing costs (in dollars) of investing in the fund and to compare these costs with the ongoing costs of investing in other mutual funds.
The example is based on an investment of $1,000 invested at the beginning of the period and held for the entire period September 1, 2013 through February 28, 2014.
The expenses include the payment of a portion of the transfer-agent-related expenses of MFS funds that invest in the fund. For further information, please see the Notes to the Financial Statements.
Actual Expenses
The first line for each share class in the following table provides information about actual account values and actual expenses. You may use the information in this line, together with the amount you invested, to estimate the expenses that you paid over the period. Simply divide your account value by $1,000 (for example, an $8,600 account value divided by $1,000 = 8.6), then multiply the result by the number in the first line under the heading entitled “Expenses Paid During Period” to estimate the expenses you paid on your account during this period.
Hypothetical Example for Comparison Purposes
The second line for each share class in the following table provides information about hypothetical account values and hypothetical expenses based on the fund’s actual expense ratio and an assumed rate of return of 5% per year before expenses, which is not the fund’s actual return. The hypothetical account values and expenses may not be used to estimate the actual ending account balance or expenses you paid for the period. You may use this information to compare the ongoing costs of investing in the fund and other funds. To do so, compare this 5% hypothetical example with the 5% hypothetical examples that appear in the shareholder reports of the other funds.
Please note that the expenses shown in the table are meant to highlight your ongoing costs only and do not reflect any transactional costs, such as sales charges (loads). Therefore, the second line for each share class in the table is useful in comparing ongoing costs only, and will not help you determine the relative total costs of owning different funds. In addition, if these transactional costs were included, your costs would have been higher.
9
Expense Table – continued
| | | | | | | | | | | | | | | | | | |
Share
Class | | | | Annualized
Expense Ratio | | | Beginning
Account Value
9/01/13 | | | Ending Account Value 2/28/14 | | | Expenses Paid During Period (p) 9/01/13-2/28/14 | |
| A | | Actual | | | 1.45% | | | | $1,000.00 | | | | $1,155.87 | | | | $7.75 | |
| | Hypothetical (h) | | | 1.45% | | | | $1,000.00 | | | | $1,017.60 | | | | $7.25 | |
| B | | Actual | | | 2.20% | | | | $1,000.00 | | | | $1,151.13 | | | | $11.73 | |
| | Hypothetical (h) | | | 2.20% | | | | $1,000.00 | | | | $1,013.88 | | | | $10.99 | |
| C | | Actual | | | 2.20% | | | | $1,000.00 | | | | $1,151.45 | | | | $11.74 | |
| | Hypothetical (h) | | | 2.20% | | | | $1,000.00 | | | | $1,013.88 | | | | $10.99 | |
| I | | Actual | | | 1.20% | | | | $1,000.00 | | | | $1,157.04 | | | | $6.42 | |
| | Hypothetical (h) | | | 1.20% | | | | $1,000.00 | | | | $1,018.84 | | | | $6.01 | |
| R1 | | Actual | | | 2.20% | | | | $1,000.00 | | | | $1,152.01 | | | | $11.74 | |
| | Hypothetical (h) | | | 2.20% | | | | $1,000.00 | | | | $1,013.88 | | | | $10.99 | |
| R2 | | Actual | | | 1.70% | | | | $1,000.00 | | | | $1,154.44 | | | | $9.08 | |
| | Hypothetical (h) | | | 1.70% | | | | $1,000.00 | | | | $1,016.36 | | | | $8.50 | |
| R3 | | Actual | | | 1.45% | | | | $1,000.00 | | | | $1,155.92 | | | | $7.75 | |
| | Hypothetical (h) | | | 1.45% | | | | $1,000.00 | | | | $1,017.60 | | | | $7.25 | |
| R4 | | Actual | | | 1.20% | | | | $1,000.00 | | | | $1,156.69 | | | | $6.42 | |
| | Hypothetical (h) | | | 1.20% | | | | $1,000.00 | | | | $1,018.84 | | | | $6.01 | |
| R5 | | Actual | | | 1.12% | | | | $1,000.00 | | | | $1,157.47 | | | | $5.99 | |
| | Hypothetical (h) | | | 1.12% | | | | $1,000.00 | | | | $1,019.24 | | | | $5.61 | |
| (h) | 5% class return per year before expenses. |
| (p) | Expenses Paid During Period are equal to each class’s annualized expense ratio, as shown above, multiplied by the average account value over the period, multiplied by 181/365 (to reflect the one-half year period). Expenses paid do not include any applicable sales charges (loads). If these transaction costs had been included, your costs would have been higher. |
10
PORTFOLIO OF INVESTMENTS
2/28/14
The Portfolio of Investments is a complete list of all securities owned by your fund. It is categorized by broad-based asset classes.
| | | | | | | | |
| Common Stocks - 97.7% | | | | | | | | |
| Issuer | | Shares/Par | | | Value ($) | |
| | | | | | | | |
| Apparel Manufacturers - 1.4% | | | | | | | | |
| Guess?, Inc. | | | 86,900 | | | $ | 2,636,537 | |
| Hanesbrands, Inc. | | | 22,987 | | | | 1,684,487 | |
| | | | | | | | |
| | | | | | | $ | 4,321,024 | |
| Broadcasting - 0.9% | | | | | | | | |
| Stroer Out-of-Home Media AG (a) | | | 162,070 | | | $ | 2,874,613 | |
| | |
| Brokerage & Asset Managers - 1.9% | | | | | | | | |
| FXCM, Inc., “A” | | | 122,490 | | | $ | 2,063,957 | |
| NASDAQ OMX Group, Inc. | | | 96,686 | | | | 3,711,776 | |
| | | | | | | | |
| | | | | | | $ | 5,775,733 | |
| Business Services - 5.6% | | | | | | | | |
| Forrester Research, Inc. | | | 71,030 | | | $ | 2,572,707 | |
| Global Payments, Inc. | | | 69,980 | | | | 4,921,693 | |
| RE/MAX Holdings, Inc., “A” (a) | | | 91,110 | | | | 2,789,788 | |
| Resources Connection, Inc. | | | 278,740 | | | | 3,818,738 | |
| Serco Group PLC | | | 426,369 | | | | 3,287,862 | |
| | | | | | | | |
| | | | | | | $ | 17,390,788 | |
| Computer Software - 2.0% | | | | | | | | |
| OBIC Co. Ltd. | | | 65,500 | | | $ | 2,062,764 | |
| Rovi Corp. (a) | | | 169,170 | | | | 4,202,183 | |
| | | | | | | | |
| | | | | | | $ | 6,264,947 | |
| Computer Software - Systems - 3.1% | | | | | | | | |
| Ingram Micro, Inc., “A” (a) | | | 131,879 | | | $ | 3,883,837 | |
| Model N, Inc. (a) | | | 160,710 | | | | 1,766,203 | |
| NICE Systems Ltd., ADR | | | 93,319 | | | | 3,833,545 | |
| | | | | | | | |
| | | | | | | $ | 9,483,585 | |
| Construction - 1.1% | | | | | | | | |
| Beacon Roofing Supply, Inc. (a) | | | 45,110 | | | $ | 1,704,707 | |
| Lennox International, Inc. | | | 19,562 | | | | 1,797,357 | |
| | | | | | | | |
| | | | | | | $ | 3,502,064 | |
| Consumer Products - 1.1% | | | | | | | | |
| Sensient Technologies Corp. | | | 61,990 | | | $ | 3,250,136 | |
11
Portfolio of Investments – continued
| | | | | | | | |
| Issuer | | Shares/Par | | | Value ($) | |
| | | | | | | | |
| Common Stocks - continued | | | | | | | | |
| Consumer Services - 1.9% | | | | | | | | |
| DeVry, Inc. | | | 65,170 | | | $ | 2,737,792 | |
| ITT Educational Services, Inc. (a) | | | 99,890 | | | | 3,099,587 | |
| | | | | | | | |
| | | | | | | $ | 5,837,379 | |
| Containers - 1.1% | | | | | | | | |
| Greif, Inc., “A” | | | 66,656 | | | $ | 3,336,799 | |
| | |
| Electronics - 6.1% | | | | | | | | |
| Entegris, Inc. (a) | | | 180,530 | | | $ | 2,175,387 | |
| Entropic Communications, Inc. (a) | | | 352,518 | | | | 1,544,029 | |
| Lattice Semiconductor Corp. (a) | | | 263,280 | | | | 1,993,030 | |
| M/A-COM Technology Solutions Holdings, Inc. (a) | | | 147,890 | | | | 2,508,214 | |
| MaxLinear, Inc., “A” (a) | | | 262,887 | | | | 2,457,993 | |
| Micrel, Inc. | | | 269,070 | | | | 2,809,091 | |
| MKS Instruments, Inc. | | | 59,170 | | | | 1,778,650 | |
| Ultratech, Inc. (a) | | | 138,550 | | | | 3,632,781 | |
| | | | | | | | |
| | | | | | | $ | 18,899,175 | |
| Energy - Independent - 2.7% | | | | | | | | |
| Energen Corp. | | | 36,560 | | | $ | 2,940,886 | |
| Rosetta Resources, Inc. (a) | | | 38,400 | | | | 1,703,808 | |
| SM Energy Co. | | | 30,900 | | | | 2,278,875 | |
| Walter Energy, Inc. (l) | | | 140,910 | | | | 1,520,419 | |
| | | | | | | | |
| | | | | | | $ | 8,443,988 | |
| Entertainment - 3.0% | | | | | | | | |
| AMC Entertainment Holdings, Inc., “A” (a) | | | 127,680 | | | $ | 2,922,595 | |
| Carmike Cinemas, Inc. (a) | | | 124,050 | | | | 3,690,488 | |
| Cinemark Holdings, Inc. | | | 95,315 | | | | 2,804,167 | |
| | | | | | | | |
| | | | | | | $ | 9,417,250 | |
| Food & Beverages - 0.8% | | | | | | | | |
| Pinnacle Foods, Inc. | | | 89,640 | | | $ | 2,538,605 | |
| | |
| Health Maintenance Organizations - 1.3% | | | | | | | | |
| BioScrip, Inc. (a) | | | 269,060 | | | $ | 1,918,398 | |
| Molina Healthcare, Inc. (a) | | | 57,660 | | | | 2,172,629 | |
| | | | | | | | |
| | | | | | | $ | 4,091,027 | |
| Insurance - 6.2% | | | | | | | | |
| Allied World Assurance Co. | | | 32,823 | | | $ | 3,273,110 | |
| Aspen Insurance Holdings Ltd. | | | 75,569 | | | | 2,838,372 | |
| Everest Re Group Ltd. | | | 26,680 | | | | 3,981,723 | |
| Hanover Insurance Group, Inc. | | | 48,840 | | | | 2,873,746 | |
12
Portfolio of Investments – continued
| | | | | | | | |
| Issuer | | Shares/Par | | | Value ($) | |
| | | | | | | | |
| Common Stocks - continued | | | | | | | | |
| Insurance - continued | | | | | | | | |
| Symetra Financial Corp. | | | 189,719 | | | $ | 3,737,464 | |
| Third Point Reinsurance Ltd. (a) | | | 177,360 | | | | 2,660,400 | |
| | | | | | | | |
| | | | | | | $ | 19,364,815 | |
| Leisure & Toys - 1.9% | | | | | | | | |
| Brunswick Corp. | | | 60,370 | | | $ | 2,703,972 | |
| Callaway Golf Co. | | | 372,291 | | | | 3,134,690 | |
| | | | | | | | |
| | | | | | | $ | 5,838,662 | |
| Machinery & Tools - 6.5% | | | | | | | | |
| Columbus McKinnon Corp. (a) | | | 117,350 | | | $ | 2,987,731 | |
| Douglas Dynamics, Inc. | | | 202,025 | | | | 3,268,765 | |
| Herman Miller, Inc. | | | 85,575 | | | | 2,411,504 | |
| Joy Global, Inc. | | | 58,620 | | | | 3,224,100 | |
| Kennametal, Inc. | | | 62,720 | | | | 2,743,373 | |
| Polypore International, Inc. (a) | | | 63,960 | | | | 2,213,656 | |
| Regal Beloit Corp. | | | 45,030 | | | | 3,318,261 | |
| | | | | | | | |
| | | | | | | $ | 20,167,390 | |
| Major Banks - 2.3% | | | | | | | | |
| Comerica, Inc. | | | 68,200 | | | $ | 3,285,876 | |
| Huntington Bancshares, Inc. | | | 396,450 | | | | 3,778,169 | |
| | | | | | | | |
| | | | | | | $ | 7,064,045 | |
| Medical & Health Technology & Services - 2.2% | | | | | | | | |
| Cross Country Healthcare, Inc. (a) | | | 254,451 | | | $ | 2,646,290 | |
| MEDNAX, Inc. (a) | | | 70,340 | | | | 4,278,079 | |
| | | | | | | | |
| | | | | | | $ | 6,924,369 | |
| Medical Equipment - 1.1% | | | | | | | | |
| Teleflex, Inc. | | | 34,223 | | | $ | 3,490,404 | |
| | |
| Metals & Mining - 3.5% | | | | | | | | |
| GrafTech International Ltd. (a) | | | 340,650 | | | $ | 3,304,305 | |
| Horsehead Holding Corp. (a) | | | 183,140 | | | | 3,254,398 | |
| Iluka Resources Ltd. | | | 502,464 | | | | 4,210,228 | |
| | | | | | | | |
| | | | | | | $ | 10,768,931 | |
| Natural Gas - Distribution - 1.8% | | | | | | | | |
| AGL Resources, Inc. | | | 58,147 | | | $ | 2,735,235 | |
| UGI Corp. | | | 65,531 | | | | 2,928,580 | |
| | | | | | | | |
| | | | | | | $ | 5,663,815 | |
| Natural Gas - Pipeline - 0.5% | | | | | | | | |
| StealthGas, Inc. (a) | | | 151,130 | | | $ | 1,588,376 | |
13
Portfolio of Investments – continued
| | | | | | | | |
| Issuer | | Shares/Par | | | Value ($) | |
| | | | | | | | |
| Common Stocks - continued | | | | | | | | |
| Network & Telecom - 0.7% | | | | | | | | |
| Polycom, Inc. (a) | | | 168,220 | | | $ | 2,247,419 | |
| | |
| Oil Services - 4.3% | | | | | | | | |
| C&J Energy Services, Inc. (a) | | | 143,110 | | | $ | 3,699,394 | |
| Superior Energy Services, Inc. | | | 115,380 | | | | 3,414,094 | |
| Tesco Corp. (a) | | | 181,370 | | | | 3,440,589 | |
| Tidewater, Inc. | | | 57,380 | | | | 2,795,554 | |
| | | | | | | | |
| | | | | | | $ | 13,349,631 | |
| Other Banks & Diversified Financials - 12.7% | | | | | | | | |
| Aaron’s, Inc. | | | 77,800 | | | $ | 2,390,794 | |
| Berkshire Hills Bancorp, Inc. | | | 82,590 | | | | 2,075,487 | |
| Brookline Bancorp, Inc. | | | 352,075 | | | | 3,214,445 | |
| CAI International, Inc. (a) | | | 259,810 | | | | 6,323,775 | |
| Cathay General Bancorp, Inc. | | | 117,056 | | | | 2,974,393 | |
| EZCORP, Inc., “A” (a) | | | 336,930 | | | | 4,258,795 | |
| First Interstate BancSystem, Inc. | | | 107,770 | | | | 2,791,243 | |
| PrivateBancorp, Inc. | | | 131,920 | | | | 3,807,211 | |
| Regional Management Corp. (a) | | | 50,460 | | | | 1,522,883 | |
| Sandy Spring Bancorp, Inc. | | | 96,188 | | | | 2,282,541 | |
| TCF Financial Corp. | | | 264,830 | | | | 4,269,060 | |
| Textainer Group Holdings Ltd. | | | 93,320 | | | | 3,403,380 | |
| | | | | | | | |
| | | | | | | $ | 39,314,007 | |
| Pollution Control - 1.1% | | | | | | | | |
| Progressive Waste Solutions Ltd. | | | 140,196 | | | $ | 3,541,351 | |
| | |
| Railroad & Shipping - 1.5% | | | | | | | | |
| Diana Shipping, Inc. (a) | | | 343,944 | | | $ | 4,478,151 | |
| | |
| Real Estate - 5.9% | | | | | | | | |
| BioMed Realty Trust, Inc., REIT | | | 161,240 | | | $ | 3,334,443 | |
| Corporate Office Properties Trust, REIT | | | 154,980 | | | | 4,133,317 | |
| EPR Properties, REIT | | | 67,848 | | | | 3,613,584 | |
| Hatteras Financial Corp., REIT | | | 182,250 | | | | 3,593,970 | |
| Select Income, REIT | | | 124,350 | | | | 3,624,803 | |
| | | | | | | | |
| | | | | | | $ | 18,300,117 | |
| Specialty Chemicals - 1.9% | | | | | | | | |
| Taminco Corp. (a) | | | 115,940 | | | $ | 2,634,157 | |
| Tronox Ltd., “A” | | | 143,320 | | | | 3,395,251 | |
| | | | | | | | |
| | | | | | | $ | 6,029,408 | |
14
Portfolio of Investments – continued
| | | | | | | | |
| Issuer | | Shares/Par | | | Value ($) | |
| Common Stocks - continued | | | | | | | | |
| Specialty Stores - 5.4% | | | | | | | | |
| American Eagle Outfitters, Inc. | | | 238,270 | | | $ | 3,462,063 | |
| ANN, Inc. (a) | | | 84,130 | | | | 2,999,235 | |
| Children’s Place Retail Stores, Inc. (a) | | | 53,380 | | | | 2,891,595 | |
| Gordmans Stores, Inc. | | | 218,242 | | | | 1,385,837 | |
| Kirkland’s, Inc. (a) | | | 91,270 | | | | 1,613,654 | |
| Rent-A-Center, Inc. | | | 87,220 | | | | 2,192,711 | |
| Tilly’s, Inc. (a) | | | 170,680 | | | | 2,041,333 | |
| | | | | | | | |
| | | | | | | $ | 16,586,428 | |
| Trucking - 2.4% | | | | | | | | |
| Atlas Air Worldwide Holdings, Inc. (a) | | | 61,070 | | | $ | 1,840,039 | |
| Celadon Group, Inc. | | | 89,700 | | | | 2,036,190 | |
| Marten Transport Ltd. | | | 189,380 | | | | 3,691,016 | |
| | | | | | | | |
| | | | | | | $ | 7,567,245 | |
| Utilities - Electric Power - 1.8% | | | | | | | | |
| El Paso Electric Co. | | | 75,090 | | | $ | 2,646,923 | |
| Great Plains Energy, Inc. | | | 115,617 | | | | 3,037,259 | |
| | | | | | | | |
| | | | | | | $ | 5,684,182 | |
| Total Common Stocks (Identified Cost, $246,858,856) | | | | | | $ | 303,395,859 | |
| | |
| Money Market Funds - 2.2% | | | | | | | | |
MFS Institutional Money Market Portfolio, 0.08%,
at Cost and Net Asset Value (v) | | | 6,909,737 | | | $ | 6,909,737 | |
| | |
| Collateral for Securities Loaned - 0.3% | | | | | | | | |
Navigator Securities Lending Prime Portfolio, 0.18%,
at Cost and Net Asset Value (j) | | | 850,794 | | | $ | 850,794 | |
| Total Investments (Identified Cost, $254,619,387) | | | | | | $ | 311,156,390 | |
| | |
| Other Assets, Less Liabilities - (0.2)% | | | | | | | (698,310 | ) |
| Net Assets - 100.0% | | | | | | $ | 310,458,080 | |
| (a) | Non-income producing security. |
| (j) | The rate quoted is the annualized seven-day yield of the fund at period end. |
| (l) | A portion of this security is on loan. |
| (v) | Underlying affiliated fund that is available only to investment companies managed by MFS. The rate quoted for the MFS Institutional Money Market Portfolio is the annualized seven-day yield of the fund at period end. |
The following abbreviations are used in this report and are defined:
| ADR | | American Depositary Receipt |
| PLC | | Public Limited Company |
| REIT | | Real Estate Investment Trust |
See Notes to Financial Statements
15
Financial Statements
STATEMENT OF ASSETS AND LIABILITIES
At 2/28/14
This statement represents your fund’s balance sheet, which details the assets and liabilities comprising the total value of the fund.
| | | | |
| Assets | | | | |
Investments- | | | | |
Non-affiliated issuers, at value (identified cost, $247,709,650) | | | $304,246,653 | |
Underlying affiliated funds, at cost and value | | | 6,909,737 | |
Total investments, at value, including $781,282 of securities on loan
(identified cost, $254,619,387) | | | $311,156,390 | |
Receivables for | | | | |
Investments sold | | | 1,023,246 | |
Fund shares sold | | | 181,212 | |
Interest and dividends | | | 317,555 | |
Receivable from investment adviser | | | 61,969 | |
Other assets | | | 2,000 | |
Total assets | | | $312,742,372 | |
| Liabilities | | | | |
Payables for | | | | |
Investments purchased | | | $1,056,824 | |
Fund shares reacquired | | | 94,637 | |
Collateral for securities loaned, at value | | | 850,794 | |
Payable to affiliates | | | | |
Shareholder servicing costs | | | 199,998 | |
Distribution and service fees | | | 465 | |
Payable for independent Trustees’ compensation | | | 9 | |
Accrued expenses and other liabilities | | | 81,565 | |
Total liabilities | | | $2,284,292 | |
Net assets | | | $310,458,080 | |
| Net assets consist of | | | | |
Paid-in capital | | | $246,099,704 | |
Unrealized appreciation (depreciation) on investments and translation of assets and liabilities in foreign currencies | | | 56,536,781 | |
Accumulated net realized gain (loss) on investments and foreign currency | | | 7,846,622 | |
Accumulated distributions in excess of net investment income | | | (25,027 | ) |
Net assets | | | $310,458,080 | |
Shares of beneficial interest outstanding | | | 23,379,064 | |
16
Statement of Assets and Liabilities – continued
| | | | | | | | | | | | |
| | | Net assets | | | Shares
outstanding | | | Net asset value
per share (a) | |
Class A | | | $19,101,432 | | | | 1,442,560 | | | | $13.24 | |
Class B | | | 954,371 | | | | 72,770 | | | | 13.11 | |
Class C | | | 3,042,776 | | | | 232,513 | | | | 13.09 | |
Class I | | | 7,463,768 | | | | 562,001 | | | | 13.28 | |
Class R1 | | | 288,485 | | | | 21,995 | | | | 13.12 | |
Class R2 | | | 488,082 | | | | 36,838 | | | | 13.25 | |
Class R3 | | | 513,074 | | | | 38,667 | | | | 13.27 | |
Class R4 | | | 156,371 | | | | 11,765 | | | | 13.29 | |
Class R5 | | | 278,449,721 | | | | 20,959,955 | | | | 13.28 | |
| (a) | Maximum offering price per share was equal to the net asset value per share for all share classes, except for Class A, for which the maximum offering price per share was $14.05 [100 / 94.25 x $13.24]. On sales of $50,000 or more, the maximum offering price of Class A shares is reduced. A contingent deferred sales charge may be imposed on redemptions of Class A, Class B, and Class C shares. Redemption price per share was equal to the net asset value per share for Classes I, R1, R2, R3, R4, and R5. |
See Notes to Financial Statements
17
Financial Statements
STATEMENT OF OPERATIONS
Year ended 2/28/14
This statement describes how much your fund earned in investment income and accrued in expenses. It also describes any gains and/or losses generated by fund operations.
| | | | |
| Net investment income | | | | |
Income | | | | |
Dividends | | | $4,248,137 | |
Interest | | | 2,031 | |
Dividends from underlying affiliated funds | | | 9,941 | |
Foreign taxes withheld | | | (23,284 | ) |
Total investment income | | | $4,236,825 | |
Expenses | | | | |
Management fee | | | $2,351,781 | |
Distribution and service fees | | | 58,339 | |
Shareholder servicing costs | | | 660,121 | |
Administrative services fee | | | 42,743 | |
Independent Trustees’ compensation | | | 5,431 | |
Custodian fee | | | 38,281 | |
Shareholder communications | | | 15,669 | |
Audit and tax fees | | | 52,443 | |
Legal fees | | | 2,569 | |
Miscellaneous | | | 142,868 | |
Total expenses | | | $3,370,245 | |
Fees paid indirectly | | | (14 | ) |
Reduction of expenses by investment adviser and distributor | | | (306,400 | ) |
Net expenses | | | $3,063,831 | |
Net investment income | | | $1,172,994 | |
| Realized and unrealized gain (loss) on investments and foreign currency | |
Realized gain (loss) (identified cost basis) | | | | |
Investments | | | $31,179,223 | |
Foreign currency | | | (5,899 | ) |
Net realized gain (loss) on investments and foreign currency | | | $31,173,324 | |
Change in unrealized appreciation (depreciation) | | | | |
Investments | | | $31,661,430 | |
Translation of assets and liabilities in foreign currencies | | | (222 | ) |
Net unrealized gain (loss) on investments and foreign currency translation | | | $31,661,208 | |
Net realized and unrealized gain (loss) on investments and foreign currency | | | $62,834,532 | |
Change in net assets from operations | | | $64,007,526 | |
See Notes to Financial Statements
18
Financial Statements
STATEMENTS OF CHANGES IN NET ASSETS
These statements describe the increases and/or decreases in net assets resulting from operations, any distributions, and any shareholder transactions.
| | | | | | | | |
| | | Years ended 2/28 | |
| | | 2014 | | | 2013 | |
| Change in net assets | | | | | | |
| From operations | | | | | | | | |
Net investment income | | | $1,172,994 | | | | $1,531,591 | |
Net realized gain (loss) on investments and foreign currency | | | 31,173,324 | | | | 10,585,807 | |
Net unrealized gain (loss) on investments and foreign currency translation | | | 31,661,208 | | | | 21,109,225 | |
Change in net assets from operations | | | $64,007,526 | | | | $33,226,623 | |
| Distributions declared to shareholders | | | | | | | | |
From net investment income | | | $(1,080,227 | ) | | | $(1,600,024 | ) |
From net realized gain on investments | | | (23,479,772 | ) | | | (10,275,610 | ) |
Total distributions declared to shareholders | | | $(24,559,999 | ) | | | $(11,875,634 | ) |
Change in net assets from fund share transactions | | | $57,814,112 | | | | $25,592,968 | |
Total change in net assets | | | $97,261,639 | | | | $46,943,957 | |
| Net assets | | | | | | | | |
At beginning of period | | | 213,196,441 | | | | 166,252,484 | |
At end of period (including accumulated distributions in excess of net investment income of $25,027 and $123,476, respectively) | | | $310,458,080 | | | | $213,196,441 | |
See Notes to Financial Statements
19
Financial Statements
FINANCIAL HIGHLIGHTS
The financial highlights table is intended to help you understand the fund’s financial performance for the past 5 years (or life of a particular share class, if shorter). Certain information reflects financial results for a single fund share. The total returns in the table represent the rate by which an investor would have earned (or lost) on an investment in the fund share class (assuming reinvestment of all distributions) held for the entire period.
| | | | | | | | | | | | |
| Class A | | Years ended 2/28 | | | Period ended
2/29/12 (c) | |
| | | 2014 | | | 2013 | | |
Net asset value, beginning of period | | | $11.37 | | | | $10.27 | | | | $10.00 | |
| Income (loss) from investment operations | | | | | |
Net investment income (d) | | | $0.02 | | | | $0.06 | | | | $0.01 | |
Net realized and unrealized gain (loss) on
investments and foreign currency | | | 3.02 | | | | 1.69 | | | | 0.30 | |
Total from investment operations | | | $3.04 | | | | $1.75 | | | | $0.31 | |
| Less distributions declared to shareholders | | | | | |
From net investment income | | | $(0.03 | ) | | | $(0.07 | ) | | | $(0.03 | ) |
From net realized gain on investments | | | (1.14 | ) | | | (0.58 | ) | | | (0.01 | ) |
Total distributions declared to shareholders | | | $(1.17 | ) | | | $(0.65 | ) | | | $(0.04 | ) |
Net asset value, end of period (x) | | | $13.24 | | | | $11.37 | | | | $10.27 | |
Total return (%) (r)(s)(t)(x) | | | 27.39 | | | | 18.04 | | | | 3.22 | (n) |
Ratios (%) (to average net assets)
and Supplemental data: | | | | | |
Expenses before expense reductions (f) | | | 1.59 | | | | 1.39 | | | | 1.25 | (a) |
Expenses after expense reductions (f) | | | 1.45 | | | | 1.34 | | | | 1.25 | (a) |
Net investment income | | | 0.14 | | | | 0.53 | | | | 0.17 | (a) |
Portfolio turnover | | | 55 | | | | 67 | | | | 56 | (n) |
Net assets at end of period (000 omitted) | | | $19,101 | | | | $4,596 | | | | $1,872 | |
See Notes to Financial Statements
20
Financial Highlights – continued
| | | | | | | | | | | | |
| Class B | | Years ended 2/28 | | | Period ended
2/29/12 (c) | |
| | | 2014 | | | 2013 | | |
Net asset value, beginning of period | | | $11.33 | | | | $10.24 | | | | $10.00 | |
| Income (loss) from investment operations | | | | | |
Net investment loss (d) | | | $(0.08 | ) | | | $(0.02 | ) | | | $(0.04 | ) |
Net realized and unrealized gain (loss) on
investments and foreign currency | | | 3.00 | | | | 1.69 | | | | 0.29 | |
Total from investment operations | | | $2.92 | | | | $1.67 | | | | $0.25 | |
| Less distributions declared to shareholders | | | | | |
From net realized gain on investments | | | $(1.14 | ) | | | $(0.58 | ) | | | $(0.01 | ) |
Net asset value, end of period (x) | | | $13.11 | | | | $11.33 | | | | $10.24 | |
Total return (%) (r)(s)(t)(x) | | | 26.40 | | | | 17.24 | | | | 2.56 | (n) |
Ratios (%) (to average net assets)
and Supplemental data: | | | | | |
Expenses before expense reductions (f) | | | 2.33 | | | | 2.14 | | | | 2.01 | (a) |
Expenses after expense reductions (f) | | | 2.20 | | | | 2.08 | | | | 2.01 | (a) |
Net investment loss | | | (0.60 | ) | | | (0.17 | ) | | | (0.57 | )(a) |
Portfolio turnover | | | 55 | | | | 67 | | | | 56 | (n) |
Net assets at end of period (000 omitted) | | | $954 | | | | $353 | | | | $200 | |
| | |
| Class C | | Years ended 2/28 | | | Period ended
2/29/12 (c) | |
| | | 2014 | | | 2013 | | |
Net asset value, beginning of period | | | $11.31 | | | | $10.24 | | | | $10.00 | |
| Income (loss) from investment operations | | | | | |
Net investment loss (d) | | | $(0.08 | ) | | | $(0.02 | ) | | | $(0.04 | ) |
Net realized and unrealized gain (loss) on
investments and foreign currency | | | 3.00 | | | | 1.69 | | | | 0.29 | |
Total from investment operations | | | $2.92 | | | | $1.67 | | | | $0.25 | |
| Less distributions declared to shareholders | | | | | |
From net investment income | | | $— | | | | $(0.02 | ) | | | $(0.00 | )(w) |
From net realized gain on investments | | | (1.14 | ) | | | (0.58 | ) | | | (0.01 | ) |
Total distributions declared to shareholders | | | $(1.14 | ) | | | $(0.60 | ) | | | $(0.01 | ) |
Net asset value, end of period (x) | | | $13.09 | | | | $11.31 | | | | $10.24 | |
Total return (%) (r)(s)(t)(x) | | | 26.46 | | | | 17.22 | | | | 2.62 | (n) |
Ratios (%) (to average net assets)
and Supplemental data: | | | | | |
Expenses before expense reductions (f) | | | 2.34 | | | | 2.15 | | | | 2.01 | (a) |
Expenses after expense reductions (f) | | | 2.20 | | | | 2.09 | | | | 2.01 | (a) |
Net investment loss | | | (0.61 | ) | | | (0.22 | ) | | | (0.53 | )(a) |
Portfolio turnover | | | 55 | | | | 67 | | | | 56 | (n) |
Net assets at end of period (000 omitted) | | | $3,043 | | | | $691 | | | | $182 | |
See Notes to Financial Statements
21
Financial Highlights – continued
| | | | | | | | | | | | |
| Class I | | Years ended 2/28 | | | Period ended
2/29/12 (c) | |
| | | 2014 | | | 2013 | | |
Net asset value, beginning of period | | | $11.39 | | | | $10.28 | | | | $10.00 | |
| Income (loss) from investment operations | | | | | |
Net investment income (d) | | | $0.05 | | | | $0.11 | | | | $0.03 | |
Net realized and unrealized gain (loss) on
investments and foreign currency | | | 3.03 | | | | 1.67 | | | | 0.30 | |
Total from investment operations | | | $3.08 | | | | $1.78 | | | | $0.33 | |
| Less distributions declared to shareholders | | | | | |
From net investment income | | | $(0.05 | ) | | | $(0.09 | ) | | | $(0.04 | ) |
From net realized gain on investments | | | (1.14 | ) | | | (0.58 | ) | | | (0.01 | ) |
Total distributions declared to shareholders | | | $(1.19 | ) | | | $(0.67 | ) | | | $(0.05 | ) |
Net asset value, end of period (x) | | | $13.28 | | | | $11.39 | | | | $10.28 | |
Total return (%) (r)(s)(x) | | | 27.71 | | | | 18.35 | | | | 3.39 | (n) |
Ratios (%) (to average net assets)
and Supplemental data: | | | | | |
Expenses before expense reductions (f) | | | 1.33 | | | | 1.02 | | | | 1.01 | (a) |
Expenses after expense reductions (f) | | | 1.20 | | | | 1.02 | | | | 1.01 | (a) |
Net investment income | | | 0.41 | | | | 1.04 | | | | 0.47 | (a) |
Portfolio turnover | | | 55 | | | | 67 | | | | 56 | (n) |
Net assets at end of period (000 omitted) | | | $7,464 | | | | $1,633 | | | | $163,585 | |
| | |
| Class R1 | | Years ended 2/28 | | | Period ended
2/29/12 (c) | |
| | | 2014 | | | 2013 | | |
Net asset value, beginning of period | | | $11.34 | | | | $10.25 | | | | $10.00 | |
| Income (loss) from investment operations | | | | | |
Net investment loss (d) | | | $(0.07 | ) | | | $(0.01 | ) | | | $(0.04 | ) |
Net realized and unrealized gain (loss) on
investments and foreign currency | | | 2.99 | | | | 1.68 | | | | 0.30 | |
Total from investment operations | | | $2.92 | | | | $1.67 | | | | $0.26 | |
| Less distributions declared to shareholders | | | | | |
From net investment income | | | $— | | | | $(0.00 | )(w) | | | $— | |
From net realized gain on investments | | | (1.14 | ) | | | (0.58 | ) | | | (0.01 | ) |
Total distributions declared to shareholders | | | $(1.14 | ) | | | $(0.58 | ) | | | $(0.01 | ) |
Net asset value, end of period (x) | | | $13.12 | | | | $11.34 | | | | $10.25 | |
Total return (%) (r)(s)(x) | | | 26.39 | | | | 17.25 | | | | 2.66 | (n) |
Ratios (%) (to average net assets)
and Supplemental data: | | | | | |
Expenses before expense reductions (f) | | | 2.32 | | | | 2.13 | | | | 2.01 | (a) |
Expenses after expense reductions (f) | | | 2.20 | | | | 2.08 | | | | 2.01 | (a) |
Net investment loss | | | (0.59 | ) | | | (0.14 | ) | | | (0.56 | )(a) |
Portfolio turnover | | | 55 | | | | 67 | | | | 56 | (n) |
Net assets at end of period (000 omitted) | | | $288 | | | | $148 | | | | $103 | |
See Notes to Financial Statements
22
Financial Highlights – continued
| | | | | | | | | | | | |
| Class R2 | | Years ended 2/28 | | | Period ended
2/29/12 (c) | |
| | | 2014 | | | 2013 | | |
Net asset value, beginning of period | | | $11.39 | | | | $10.27 | | | | $10.00 | |
| Income (loss) from investment operations | | | | | |
Net investment income (loss) (d) | | | $(0.01 | ) | | | $0.04 | | | | $(0.00 | )(w) |
Net realized and unrealized gain (loss) on
investments and foreign currency | | | 3.01 | | | | 1.70 | | | | 0.29 | |
Total from investment operations | | | $3.00 | | | | $1.74 | | | | $0.29 | |
| Less distributions declared to shareholders | | | | | |
From net investment income | | | $(0.00 | )(w) | | | $(0.04 | ) | | | $(0.01 | ) |
From net realized gain on investments | | | (1.14 | ) | | | (0.58 | ) | | | (0.01 | ) |
Total distributions declared to shareholders | | | $(1.14 | ) | | | $(0.62 | ) | | | $(0.02 | ) |
Net asset value, end of period (x) | | | $13.25 | | | | $11.39 | | | | $10.27 | |
Total return (%) (r)(s)(x) | | | 27.01 | | | | 17.92 | | | | 2.98 | (n) |
Ratios (%) (to average net assets)
and Supplemental data: | | | | | |
Expenses before expense reductions (f) | | | 1.83 | | | | 1.63 | | | | 1.51 | (a) |
Expenses after expense reductions (f) | | | 1.70 | | | | 1.58 | | | | 1.51 | (a) |
Net investment income (loss) | | | (0.09 | ) | | | 0.34 | | | | (0.06 | )(a) |
Portfolio turnover | | | 55 | | | | 67 | | | | 56 | (n) |
Net assets at end of period (000 omitted) | | | $488 | | | | $137 | | | | $105 | |
| | |
| Class R3 | | Years ended 2/28 | | | Period ended
2/29/12 (c) | |
| | | 2014 | | | 2013 | | |
Net asset value, beginning of period | | | $11.39 | | | | $10.28 | | | | $10.00 | |
| Income (loss) from investment operations | | | | | |
Net investment income (d) | | | $0.02 | | | | $0.05 | | | | $0.01 | |
Net realized and unrealized gain (loss) on
investments and foreign currency | | | 3.02 | | | | 1.70 | | | | 0.30 | |
Total from investment operations | | | $3.04 | | | | $1.75 | | | | $0.31 | |
| Less distributions declared to shareholders | | | | | |
From net investment income | | | $(0.02 | ) | | | $(0.06 | ) | | | $(0.02 | ) |
From net realized gain on investments | | | (1.14 | ) | | | (0.58 | ) | | | (0.01 | ) |
Total distributions declared to shareholders | | | $(1.16 | ) | | | $(0.64 | ) | | | $(0.03 | ) |
Net asset value, end of period (x) | | | $13.27 | | | | $11.39 | | | | $10.28 | |
Total return (%) (r)(s)(x) | | | 27.38 | | | | 18.08 | | | | 3.23 | (n) |
Ratios (%) (to average net assets)
and Supplemental data: | | | | | |
Expenses before expense reductions (f) | | | 1.58 | | | | 1.40 | | | | 1.26 | (a) |
Expenses after expense reductions (f) | | | 1.45 | | | | 1.34 | | | | 1.26 | (a) |
Net investment income | | | 0.15 | | | | 0.47 | | | | 0.19 | (a) |
Portfolio turnover | | | 55 | | | | 67 | | | | 56 | (n) |
Net assets at end of period (000 omitted) | | | $513 | | | | $215 | | | | $103 | |
See Notes to Financial Statements
23
Financial Highlights – continued
| | | | | | | | | | | | |
| Class R4 | | Years ended 2/28 | | | Period ended
2/29/12 (c) | |
| | | 2014 | | | 2013 | | |
Net asset value, beginning of period | | | $11.40 | | | | $10.28 | | | | $10.00 | |
| Income (loss) from investment operations | | | | | |
Net investment income (d) | | | $0.05 | | | | $0.09 | | | | $0.03 | |
Net realized and unrealized gain (loss) on
investments and foreign currency | | | 3.03 | | | | 1.70 | | | | 0.30 | |
Total from investment operations | | | $3.08 | | | | $1.79 | | | | $0.33 | |
| Less distributions declared to shareholders | | | | | |
From net investment income | | | $(0.05 | ) | | | $(0.09 | ) | | | $(0.04 | ) |
From net realized gain on investments | | | (1.14 | ) | | | (0.58 | ) | | | (0.01 | ) |
Total distributions declared to shareholders | | | $(1.19 | ) | | | $(0.67 | ) | | | $(0.05 | ) |
Net asset value, end of period (x) | | | $13.29 | | | | $11.40 | | | | $10.28 | |
Total return (%) (r)(s)(x) | | | 27.66 | | | | 18.46 | | | | 3.39 | (n) |
Ratios (%) (to average net assets)
and Supplemental data: | | | | | |
Expenses before expense reductions (f) | | | 1.32 | | | | 1.12 | | | | 1.01 | (a) |
Expenses after expense reductions (f) | | | 1.20 | | | | 1.08 | | | | 1.01 | (a) |
Net investment income | | | 0.42 | | | | 0.85 | | | | 0.44 | (a) |
Portfolio turnover | | | 55 | | | | 67 | | | | 56 | (n) |
Net assets at end of period (000 omitted) | | | $156 | | | | $122 | | | | $103 | |
| | | | | | | | |
| Class R5 | | Years ended 2/28 | |
| | | 2014 | | | 2013 (i) | |
Net asset value, beginning of period | | | $11.40 | | | | $10.10 | |
| Income (loss) from investment operations | |
Net investment income (d) | | | $0.06 | | | | $0.05 | |
Net realized and unrealized gain (loss) on
investments and foreign currency | | | 3.01 | | | | 1.71 | |
Total from investment operations | | | $3.07 | | | | $1.76 | |
| Less distributions declared to shareholders | |
From net investment income | | | $(0.05 | ) | | | $(0.09 | ) |
From net realized gain on investments | | | (1.14 | ) | | | (0.37 | ) |
Total distributions declared to shareholders | | | $(1.19 | ) | | | $(0.46 | ) |
Net asset value, end of period (x) | | | $13.28 | | | | $11.40 | |
Total return (%) (r)(s)(x) | | | 27.66 | | | | 18.05 | (n) |
Ratios (%) (to average net assets)
and Supplemental data: | |
Expenses before expense reductions (f) | | | 1.26 | | | | 1.12 | (a) |
Expenses after expense reductions (f) | | | 1.15 | | | | 1.09 | (a) |
Net investment income | | | 0.48 | | | | 0.76 | (a) |
Portfolio turnover | | | 55 | | | | 67 | |
Net assets at end of period (000 omitted) | | | $278,450 | | | | $205,301 | |
See Notes to Financial Statements
24
Financial Highlights – continued
| (c) | For the period from the commencement of the fund’s investment operations, May 26, 2011, through the stated period end. |
| (d) | Per share data is based on average shares outstanding. |
| (f) | Ratios do not reflect reductions from fees paid indirectly, if applicable. |
| (i) | For the period from the class inception, July 2, 2012, through the stated period end. |
| (r) | Certain expenses have been reduced without which performance would have been lower. |
| (s) | From time to time the fund may receive proceeds from litigation settlements, without which performance would be lower. |
| (t) | Total returns do not include any applicable sales charges. |
| (w) | Per share amount was less than $0.01. |
| (x) | The net asset values per share and total returns have been calculated on net assets which include adjustments made in accordance with U.S. generally accepted accounting principles required at period end for financial reporting purposes. |
See Notes to Financial Statements
25
NOTES TO FINANCIAL STATEMENTS
(1) Business and Organization
MFS New Discovery Value Fund (the fund) is a diversified series of MFS Series Trust XIII (the trust). The trust is organized as a Massachusetts business trust and is registered under the Investment Company Act of 1940, as amended, as an open-end management investment company.
(2) Significant Accounting Policies
General – The preparation of financial statements in conformity with U.S. generally accepted accounting principles requires management to make estimates and assumptions that affect the reported amounts of assets and liabilities, and disclosure of contingent assets and liabilities at the date of the financial statements and the reported amounts of increases and decreases in net assets from operations during the reporting period. Actual results could differ from those estimates. In the preparation of these financial statements, management has evaluated subsequent events occurring after the date of the fund’s Statement of Assets and Liabilities through the date that the financial statements were issued. The fund will generally focus on securities of small size companies which may be more volatile than those of larger companies.
In this reporting period, the fund adopted the disclosure provisions of the Financial Accounting Standards Board (FASB) Accounting Standards Update 2011-11 (“ASU 2011-11”), Balance Sheet (Topic 210) – Disclosures about Offsetting Assets and Liabilities along with the related scope clarification provisions of FASB Accounting Standards Update 2013-01 (“ASU 2013-01”) entitled Balance Sheet (Topic 210) – Clarifying the Scope of Disclosures about Offsetting Assets and Liabilities. ASU 2011-11 is intended to enhance disclosures on the offsetting of financial assets and liabilities by requiring entities to disclose both gross and net information about financial instruments and transactions that are either offset in the statement of financial position or subject to a an enforceable Master Netting Agreement or similar arrangement. ASU 2013-01 limits the scope of ASU 2011-11’s disclosure requirements on offsetting to financial assets and financial liabilities related to derivatives, repurchase and reverse repurchase agreements, and securities lending and securities borrowing transactions. The disclosures required by ASU 2011-11, to the extent applicable to the fund, have been included in the fund’s Significant Accounting Policies note under the captions for each of the fund’s in-scope financial instruments and transactions.
In June 2013, FASB issued Accounting Standards Update 2013-08 (“ASU 2013-08”) Financial Services – Investment Companies (Topic 946) – Amendments to the Scope, Measurement, and Disclosure Requirements which is effective for interim and annual reporting periods in fiscal years that begin after December 15, 2013. ASU 2013-08 sets forth a methodology for determining whether an entity should be characterized as an investment company and prescribes fair value accounting for an investment company’s non-controlling ownership interest in another investment company. FASB has determined that a fund registered under the Investment Company Act of 1940 automatically meets ASU 2013-08’s criteria for an investment company. Although still evaluating the potential impacts of ASU 2013-08 to the fund, management expects that the impact of the fund’s adoption will be limited to additional financial statement disclosures.
26
Notes to Financial Statements – continued
Investment Valuations – Equity securities, including restricted equity securities, are generally valued at the last sale or official closing price as provided by a third-party pricing service on the market or exchange on which they are primarily traded. Equity securities, for which there were no sales reported that day, are generally valued at the last quoted daily bid quotation as provided by a third-party pricing service on the market or exchange on which such securities are primarily traded. Short-term instruments with a maturity at issuance of 60 days or less generally are valued at amortized cost, which approximates market value. Open-end investment companies are generally valued at net asset value per share. Securities and other assets generally valued on the basis of information from a third-party pricing service may also be valued at a broker/dealer bid quotation. Values obtained from third-party pricing services can utilize both transaction data and market information such as yield, quality, coupon rate, maturity, type of issue, trading characteristics, and other market data. The values of foreign securities and other assets and liabilities expressed in foreign currencies are converted to U.S. dollars using the mean of bid and asked prices for rates provided by a third-party pricing service.
The Board of Trustees has delegated primary responsibility for determining or causing to be determined the value of the fund’s investments (including any fair valuation) to the adviser pursuant to valuation policies and procedures approved by the Board. If the adviser determines that reliable market quotations are not readily available, investments are valued at fair value as determined in good faith by the adviser in accordance with such procedures under the oversight of the Board of Trustees. Under the fund’s valuation policies and procedures, market quotations are not considered to be readily available for most types of debt instruments and floating rate loans and many types of derivatives. These investments are generally valued at fair value based on information from third-party pricing services. In addition, investments may be valued at fair value if the adviser determines that an investment’s value has been materially affected by events occurring after the close of the exchange or market on which the investment is principally traded (such as foreign exchange or market) and prior to the determination of the fund’s net asset value, or after the halting of trading of a specific security where trading does not resume prior to the close of the exchange or market on which the security is principally traded. Events that occur on a frequent basis after foreign markets close (such as developments in foreign markets and significant movements in the U.S. markets) and prior to the determination of the fund’s net asset value may be deemed to have a material effect on the value of securities traded in foreign markets. Accordingly, the fund’s foreign equity securities may often be valued at fair value. The adviser generally relies on third-party pricing services or other information (such as the correlation with price movements of similar securities in the same or other markets; the type, cost and investment characteristics of the security; the business and financial condition of the issuer; and trading and other market data) to assist in determining whether to fair value and at what value to fair value an investment. The value of an investment for purposes of calculating the fund’s net asset value can differ depending on the source and method used to determine value. When fair valuation is used, the value of an investment used to determine the fund’s net asset value may differ from quoted or published prices for the same investment. There can be no assurance that
27
Notes to Financial Statements – continued
the fund could obtain the fair value assigned to an investment if it were to sell the investment at the same time at which the fund determines its net asset value per share.
Various inputs are used in determining the value of the fund’s assets or liabilities. These inputs are categorized into three broad levels. In certain cases, the inputs used to measure fair value may fall into different levels of the fair value hierarchy. In such cases, an investment’s level within the fair value hierarchy is based on the lowest level of input that is significant to the fair value measurement. The fund’s assessment of the significance of a particular input to the fair value measurement in its entirety requires judgment, and considers factors specific to the investment. Level 1 includes unadjusted quoted prices in active markets for identical assets or liabilities. Level 2 includes other significant observable market-based inputs (including quoted prices for similar securities, interest rates, prepayment speed, and credit risk). Level 3 includes unobservable inputs, which may include the adviser’s own assumptions in determining the fair value of investments. The following is a summary of the levels used as of February 28, 2014 in valuing the fund’s assets or liabilities:
| | | | | | | | | | | | | | | | |
| Investments at Value | | Level 1 | | | Level 2 | | | Level 3 | | | Total | |
| Equity Securities | | | $303,395,859 | | | | $— | | | | $— | | | | $303,395,859 | |
| Mutual Funds | | | 7,760,531 | | | | — | | | | — | | | | 7,760,531 | |
| Total Investments | | | $311,156,390 | | | | $— | | | | $— | | | | $311,156,390 | |
For further information regarding security characteristics, see the Portfolio of Investments.
Of the level 1 investments presented above, equity investments amounting to $4,210,228 would have been considered level 2 investments at the beginning of the period. The primary reason for changes in the classifications between levels 1 and 2 occurs when foreign equity securities are fair valued using other observable market-based inputs in place of the closing exchange price due to events occurring after the close of the exchange or market on which the investment is principally traded. The fund’s foreign equity securities may often be valued at fair value. The fund’s policy is to recognize transfers between the levels as of the end of the period.
Foreign Currency Translation – Purchases and sales of foreign investments, income, and expenses are converted into U.S. dollars based upon currency exchange rates prevailing on the respective dates of such transactions or on the reporting date for foreign denominated receivables and payables. Gains and losses attributable to foreign currency exchange rates on sales of securities are recorded for financial statement purposes as net realized gains and losses on investments. Gains and losses attributable to foreign exchange rate movements on receivables, payables, income and expenses are recorded for financial statement purposes as foreign currency transaction gains and losses. That portion of both realized and unrealized gains and losses on investments that results from fluctuations in foreign currency exchange rates is not separately disclosed.
Security Loans – Under its Securities Lending Agency Agreement with the fund, State Street Bank and Trust Company (“State Street”), as lending agent, loans the securities of the fund to certain qualified institutions (the “Borrowers”) approved by the fund. The loans are collateralized by cash and/or U.S. Treasury and federal agency obligations in an amount typically at least equal to the market value of the securities loaned. The
28
Notes to Financial Statements – continued
market value of the loaned securities is determined at the close of business of the fund and any additional required collateral is delivered to the fund on the next business day. State Street provides the fund with indemnification against Borrower default. In the event of Borrower default, State Street will for the benefit of the fund either purchase securities identical to those loaned or, when such purchase is commercially impracticable, pay the fund the market value of the loaned securities. In return, State Street assumes the fund’s rights to the related collateral. If the collateral value is less than the cost to purchase identical securities, State Street is responsible for the shortfall, but only to the extent that such shortfall is not due to a decline in collateral value resulting from collateral reinvestment for which the fund bears the risk of loss. On loans collateralized by cash, the cash collateral is invested in a money market fund or short-term securities. At period end, the fund had investment securities on loan with a fair value of $781,282 and a related liability of $850,794 for collateral received on securities loaned, both of which are presented gross on the Statement of Assets and Liabilities. Collateral for securities loaned is carried at fair value, which is categorized as level 2 within the fair value hierarchy. The collateral received on securities loaned exceeded the value of securities on loan at period end. A portion of the income generated upon investment of the collateral is remitted to the Borrowers, and the remainder is allocated between the fund and the lending agent. On loans collateralized by U.S. Treasury and/or federal agency obligations, a fee is received from the Borrower, and is allocated between the fund and the lending agent. Income from securities lending is included in “Interest” income in the Statement of Operations. The dividend and interest income earned on the securities loaned is accounted for in the same manner as other dividend and interest income.
Indemnifications – Under the fund’s organizational documents, its officers and Trustees may be indemnified against certain liabilities and expenses arising out of the performance of their duties to the fund. Additionally, in the normal course of business, the fund enters into agreements with service providers that may contain indemnification clauses. The fund’s maximum exposure under these agreements is unknown as this would involve future claims that may be made against the fund that have not yet occurred.
Investment Transactions and Income – Investment transactions are recorded on the trade date. Interest income is recorded on the accrual basis. Dividends received in cash are recorded on the ex-dividend date. Certain dividends from foreign securities will be recorded when the fund is informed of the dividend if such information is obtained subsequent to the ex-dividend date. Dividend and interest payments received in additional securities are recorded on the ex-dividend or ex-interest date in an amount equal to the value of the security on such date.
The fund may receive proceeds from litigation settlements. Any proceeds received from litigation involving portfolio holdings are reflected in the Statement of Operations in realized gain/loss if the security has been disposed of by the fund or in unrealized gain/loss if the security is still held by the fund. Any other proceeds from litigation not related to portfolio holdings are reflected as other income in the Statement of Operations.
29
Notes to Financial Statements – continued
Fees Paid Indirectly – The fund’s custody fee may be reduced according to an arrangement that measures the value of cash deposited with the custodian by the fund. This amount, for the year ended February 28, 2014, is shown as a reduction of total expenses in the Statement of Operations.
Tax Matters and Distributions – The fund intends to qualify as a regulated investment company, as defined under Subchapter M of the Internal Revenue Code, and to distribute all of its taxable income, including realized capital gains. As a result, no provision for federal income tax is required. The fund’s federal tax returns, when filed, will remain subject to examination by the Internal Revenue Service for a three year period. Management has analyzed the fund’s tax positions taken on federal and state tax returns for all open tax years and does not believe that there are any uncertain tax positions that require recognition of a tax liability. Foreign taxes, if any, have been accrued by the fund in the accompanying financial statements in accordance with the applicable foreign tax law. Foreign income taxes may be withheld by certain countries in which the fund invests. Additionally, capital gains realized by the fund on securities issued in or by certain foreign countries may be subject to capital gains tax imposed by those countries.
Distributions to shareholders are recorded on the ex-dividend date. Income and capital gain distributions are determined in accordance with income tax regulations, which may differ from U.S. generally accepted accounting principles. Certain capital accounts in the financial statements are periodically adjusted for permanent differences in order to reflect their tax character. These adjustments have no impact on net assets or net asset value per share. Temporary differences which arise from recognizing certain items of income, expense, gain or loss in different periods for financial statement and tax purposes will reverse at some time in the future. Distributions in excess of net investment income or net realized gains are temporary overdistributions for financial statement purposes resulting from differences in the recognition or classification of income or distributions for financial statement and tax purposes.
Book/tax differences primarily relate to wash sale loss deferrals and treating a portion of the proceeds from redemptions as a distribution for tax purposes.
The tax character of distributions declared to shareholders for the last two fiscal years is as follows:
| | | | | | | | |
| | | 2/28/14 | | | 2/28/13 | |
| Ordinary income (including any short-term capital gains) | | | $10,239,803 | | | | $11,875,634 | |
| Long-term capital gains | | | 14,320,196 | | | | — | |
| Total distributions | | | $24,559,999 | | | | $11,875,634 | |
30
Notes to Financial Statements – continued
The federal tax cost and the tax basis components of distributable earnings were as follows:
| | | | |
| As of 2/28/14 | | | |
| Cost of investments | | | $255,250,438 | |
| Gross appreciation | | | 60,457,568 | |
| Gross depreciation | | | (4,551,616 | ) |
| Net unrealized appreciation (depreciation) | | | $55,905,952 | |
| Undistributed ordinary income | | | 3,972,815 | |
| Undistributed long-term capital gain | | | 4,504,858 | |
| Late year ordinary loss deferral | | | (25,027 | ) |
| Other temporary differences | | | (222 | ) |
Multiple Classes of Shares of Beneficial Interest – The fund offers multiple classes of shares, which differ in their respective distribution and service fees. The fund’s income, realized and unrealized gain (loss), and common expenses are allocated to shareholders based on the daily net assets of each class. Dividends are declared separately for each class. Differences in per share dividend rates are generally due to differences in separate class expenses. Class B shares will convert to Class A shares approximately eight years after purchase. The fund’s distributions declared to shareholders as reported in the Statements of Changes in Net Assets are presented by class as follows:
| | | | | | | | | | | | | | | | |
| | | From net investment
income | | | From net realized gain on
investments | |
| | | Year
ended
2/28/14 | | | Year
ended
2/28/13 (i) | | | Year
ended
2/28/14 | | | Year
ended
2/28/13 (i) | |
| Class A | | | $34,129 | | | | $19,095 | | | | $1,291,858 | | | | $158,761 | |
| Class B | | | — | | | | — | | | | 67,226 | | | | 13,586 | |
| Class C | | | — | | | | 841 | | | | 204,446 | | | | 25,995 | |
| Class I | | | 19,162 | | | | 10,699 | | | | 441,897 | | | | 3,479,620 | |
| Class R1 | | | — | | | | 21 | | | | 21,801 | | | | 6,785 | |
| Class R2 | | | 89 | | | | 421 | | | | 37,067 | | | | 6,339 | |
| Class R3 | | | 730 | | | | 690 | | | | 37,053 | | | | 6,208 | |
| Class R4 | | | 490 | | | | 900 | | | | 12,321 | | | | 5,926 | |
| Class R5 | | | 1,025,627 | | | | 1,567,357 | | | | 21,366,103 | | | | 6,572,390 | |
| Total | | | $1,080,227 | | | | $1,600,024 | | | | $23,479,772 | | | | $10,275,610 | |
| (i) | For Class R5, the period is from inception, July 2, 2012, through the stated period end. |
(3) Transactions with Affiliates
Investment Adviser – The fund has an investment advisory agreement with MFS to provide overall investment management and related administrative services and facilities to the fund. The management fee is computed daily and paid monthly at the following annual rates:
| | | | |
| First $1 billion of average daily net assets | | | 0.90 | % |
| Next $1.5 billion of average daily net assets | | | 0.80 | % |
| Average daily net assets in excess of $2.5 billion | | | 0.75 | % |
31
Notes to Financial Statements – continued
Effective April 1, 2013, MFS has agreed in writing to reduce its management fee by a specified amount if certain MFS mutual fund assets exceed thresholds agreed to by MFS and the fund’s Board of Trustees. For the period April 1, 2013 through February 28, 2014, this management fee reduction amounted to $3,754, which is included in the reduction of total expenses in the Statement of Operations. The management fee incurred for the year ended February 28, 2014 was equivalent to an annual effective rate of 0.90% of the fund’s average daily net assets.
Prior to July 1, 2013, the investment adviser had agreed in writing to pay a portion of the fund’s total annual operating expenses, exclusive of interest, taxes, extraordinary expenses, brokerage and transaction costs, and investment-related expenses, such that total fund operating expenses did not exceed the following rates annually of each class’s average daily net assets:
| | | | | | | | | | | | | | | | | | | | | | | | | | | | | | | | |
| Classes | |
| A | | B | | | C | | | I | | | R1 | | | R2 | | | R3 | | | R4 | | | R5 | |
| 1.45% | | | 2.20% | | | | 2.20% | | | | 1.20% | | | | 2.20% | | | | 1.70% | | | | 1.45% | | | | 1.20% | | | | 1.20% | |
This written agreement expired June 30, 2013. For the period March 1, 2013 through June 30, 2013, this reduction amounted to $49,832 and is included in the reduction of total expenses in the Statement of Operations. Effective July 1, 2013, the investment adviser has agreed in writing to pay a portion of the fund’s total annual operating expenses, exclusive of interest, taxes, extraordinary expenses, brokerage and transaction costs, and investment-related expenses, such that total fund operating expenses do not exceed the following rates annually of each class’s average daily net assets:
| | | | | | | | | | | | | | | | | | | | | | | | | | | | | | | | |
| Classes | |
| A | | B | | | C | | | I | | | R1 | | | R2 | | | R3 | | | R4 | | | R5 | |
| 1.45% | | | 2.20% | | | | 2.20% | | | | 1.20% | | | | 2.20% | | | | 1.70% | | | | 1.45% | | | | 1.20% | | | | 1.16% | |
This written agreement will continue until modified by the fund’s Board of Trustees, but such agreement will continue at least until June 30, 2015. For the period July 1, 2013 through February 28, 2014, this reduction amounted to $251,852 and is included in the reduction of total expenses in the Statement of Operations.
Distributor – MFS Fund Distributors, Inc. (MFD), a wholly-owned subsidiary of MFS, as distributor, received $18,144 for the year ended February 28, 2014, as its portion of the initial sales charge on sales of Class A shares of the fund.
The Board of Trustees has adopted a distribution plan for certain class shares pursuant to Rule 12b-1 of the Investment Company Act of 1940.
The fund’s distribution plan provides that the fund will pay MFD for services provided by MFD and financial intermediaries in connection with the distribution and servicing of certain share classes. One component of the plan is a distribution fee paid to MFD and another component of the plan is a service fee paid to MFD. MFD may subsequently pay all, or a portion, of the distribution and/or service fees to financial intermediaries.
32
Notes to Financial Statements – continued
Distribution Plan Fee Table:
| | | | | | | | | | | | | | | | | | | | |
| | | Distribution
Fee Rate (d) | | | Service
Fee Rate (d) | | | Total
Distribution
Plan (d) | | | Annual
Effective
Rate (e) | | | Distribution
and Service
Fee | |
| Class A | | | — | | | | 0.25% | | | | 0.25% | | | | 0.25% | | | | $28,991 | |
| Class B | | | 0.75% | | | | 0.25% | | | | 1.00% | | | | 1.00% | | | | 6,328 | |
| Class C | | | 0.75% | | | | 0.25% | | | | 1.00% | | | | 1.00% | | | | 17,939 | |
| Class R1 | | | 0.75% | | | | 0.25% | | | | 1.00% | | | | 1.00% | | | | 2,348 | |
| Class R2 | | | 0.25% | | | | 0.25% | | | | 0.50% | | | | 0.50% | | | | 1,786 | |
| Class R3 | | | — | | | | 0.25% | | | | 0.25% | | | | 0.25% | | | | 947 | |
| Total Distribution and Service Fees | | | | | | | | | | | | $58,339 | |
| (d) | In accordance with the distribution plan for certain classes, the fund pays distribution and/or service fees equal to these annual percentage rates of each class’s average daily net assets. The distribution and service fee rates disclosed by class represent the current rates in effect at the end of the reporting period. Any rate changes, if applicable, are detailed below. |
| (e) | The annual effective rates represent actual fees incurred under the distribution plan for the year ended February 28, 2014 based on each class’s average daily net assets. MFD has voluntarily agreed to rebate a portion of each class’s 0.25% service fee attributable to accounts for which MFD retains the 0.25% service fee except for accounts attributable to MFS or its affiliates’ seed money. For the year ended February 28, 2014, this rebate amounted to $398 and $9 for Class A and Class C, respectively, and is included in the reduction of total expenses in the Statement of Operations. |
Certain Class A shares are subject to a contingent deferred sales charge (CDSC) in the event of a shareholder redemption within 18 months of purchase for shares purchased on or after August 1, 2012, and within 24 months of purchase for shares purchased prior to August 1, 2012. Class C shares are subject to a CDSC in the event of a shareholder redemption within 12 months of purchase. Class B shares are subject to a CDSC in the event of a shareholder redemption within six years of purchase. All contingent deferred sales charges are paid to MFD and during the year ended February 28, 2014, were as follows:
| | | | |
| | | Amount | |
| Class A | | | $— | |
| Class B | | | 59 | |
| Class C | | | 151 | |
Shareholder Servicing Agent – MFS Service Center, Inc. (MFSC), a wholly-owned subsidiary of MFS, receives a fee from the fund for its services as shareholder servicing agent calculated as a percentage of the average daily net assets of the fund as determined periodically under the supervision of the fund’s Board of Trustees. For the year ended February 28, 2014, the fee was $5,732, which equated to 0.0022% annually of the fund’s average daily net assets. MFSC also receives payment from the fund for out-of-pocket expenses, sub-accounting and other shareholder servicing costs which may be paid to affiliated and unaffiliated service providers. Class R5 shares do not incur sub-accounting fees. For the year ended February 28, 2014, these out-of-pocket expenses, sub-accounting and other shareholder servicing costs amounted to $18,370.
33
Notes to Financial Statements – continued
Under a Special Servicing Agreement among MFS, each MFS fund which invests in other MFS funds (“MFS fund-of-funds”) and certain underlying funds in which a MFS fund-of-funds invests (“underlying funds”), each underlying fund may pay a portion of each MFS fund-of-fund’s transfer agent-related expenses, including sub-accounting fees payable to financial intermediaries, to the extent such payments do not exceed the benefits realized or expected to be realized by the underlying fund from the investment in the underlying fund by the MFS fund-of-fund. For the year ended February 28, 2014, these costs for the fund amounted to $636,019 and are included in “Shareholder servicing costs” in the Statement of Operations.
Administrator – MFS provides certain financial, legal, shareholder communications, compliance, and other administrative services to the fund. Under an administrative services agreement, the fund partially reimburses MFS the costs incurred to provide these services. The fund is charged an annual fixed amount of $17,500 plus a fee based on average daily net assets. The administrative services fee incurred for the year ended February 28, 2014 was equivalent to an annual effective rate of 0.0163% of the fund’s average daily net assets.
Trustees’ and Officers’ Compensation – The fund pays compensation to independent Trustees in the form of a retainer, attendance fees, and additional compensation to Board and Committee chairpersons. The fund does not pay compensation directly to Trustees or officers of the fund who are also officers of the investment adviser, all of whom receive remuneration for their services to the fund from MFS. Certain officers and Trustees of the fund are officers or directors of MFS, MFD, and MFSC.
Other – This fund and certain other funds managed by MFS (the funds) have entered into services agreements (the Agreements) which provide for payment of fees by the funds to Tarantino LLC and Griffin Compliance LLC in return for the provision of services of an Independent Chief Compliance Officer (ICCO) and Assistant ICCO, respectively, for the funds. The ICCO and Assistant ICCO are officers of the funds and the sole members of Tarantino LLC and Griffin Compliance LLC, respectively. The funds can terminate the Agreements with Tarantino LLC and Griffin Compliance LLC at any time under the terms of the Agreements. For the year ended February 28, 2014, the aggregate fees paid by the fund to Tarantino LLC and Griffin Compliance LLC were $1,472 and are included in “Miscellaneous” expense in the Statement of Operations. MFS has agreed to reimburse the fund for a portion of the payments made by the fund in the amount of $555, which is included in the reduction of total expenses in the Statement of Operations. Additionally, MFS has agreed to bear all expenses associated with office space, other administrative support, and supplies provided to the ICCO and Assistant ICCO.
The fund invests in the MFS Institutional Money Market Portfolio which is managed by MFS and seeks current income consistent with preservation of capital and liquidity. Income earned on this investment is included in “Dividends from underlying affiliated funds” in the Statement of Operations. This money market fund does not pay a management fee to MFS.
On June 29, 2012, MFS purchased 9,901 shares of Class R5 for an aggregate amount of $100,000. On April 2, 2012, MFS redeemed 10,048 shares of Class A and 30,171
34
Notes to Financial Statements – continued
shares of Class I for an aggregate amount of $431,852. On September 11, 2013, MFS redeemed 10,421 shares of Class R5 for an aggregate amount of $134,952. At February 28, 2014, MFS held 53% and 100% of the outstanding shares of Class R1 and Class R4, respectively.
(4) Portfolio Securities
Purchases and sales of investments, other than short-term obligations, aggregated $178,503,453 and $137,559,083, respectively.
(5) Shares of Beneficial Interest
The fund’s Declaration of Trust permits the Trustees to issue an unlimited number of full and fractional shares of beneficial interest. Transactions in fund shares were as follows:
| | | | | | | | | | | | | | | | |
| | | Year ended
2/28/14 | | | Year ended
2/28/13 (i) | |
| | | Shares | | | Amount | | | Shares | | | Amount | |
| Shares sold | | | | | | | | | | | | | | | | |
Class A | | | 1,200,327 | | | | $15,282,295 | | | | 470,145 | | | | $4,935,450 | |
Class B | | | 43,127 | | | | 541,707 | | | | 17,843 | | | | 185,668 | |
Class C | | | 189,466 | | | | 2,375,617 | | | | 46,852 | | | | 480,959 | |
Class I | | | 436,223 | | | | 5,492,740 | | | | 1,028,623 | | | | 10,375,139 | |
Class R1 | | | 7,521 | | | | 89,438 | | | | 2,367 | | | | 24,532 | |
Class R2 | | | 25,353 | | | | 317,789 | | | | 1,180 | | | | 12,039 | |
Class R3 | | | 18,740 | | | | 234,145 | | | | 11,239 | | | | 119,762 | |
Class R5 | | | 2,450,057 | | | | 30,086,802 | | | | 18,470,131 | | | | 187,876,080 | |
| | | 4,370,814 | | | | $54,420,533 | | | | 20,048,380 | | | | $204,009,629 | |
| | | | |
| Shares issued to shareholders in reinvestment of distributions | | | | | | | | | | | | | | | | |
Class A | | | 105,478 | | | | $1,321,262 | | | | 17,288 | | | | $171,856 | |
Class B | | | 5,212 | | | | 64,757 | | | | 1,241 | | | | 12,281 | |
Class C | | | 16,443 | | | | 203,831 | | | | 2,706 | | | | 26,836 | |
Class I | | | 35,966 | | | | 451,412 | | | | 360,340 | | | | 3,490,278 | |
Class R1 | | | 1,756 | | | | 21,801 | | | | 687 | | | | 6,806 | |
Class R2 | | | 2,965 | | | | 37,156 | | | | 681 | | | | 6,760 | |
Class R3 | | | 3,014 | | | | 37,783 | | | | 694 | | | | 6,898 | |
Class R4 | | | 1,021 | | | | 12,811 | | | | 686 | | | | 6,815 | |
Class R5 | | | 1,785,649 | | | | 22,391,730 | | | | 808,316 | | | | 8,139,747 | |
| | | 1,957,504 | | | | $24,542,543 | | | | 1,192,639 | | | | $11,868,277 | |
| | | | |
| Shares reacquired | | | | | | | | | | | | | | | | |
Class A | | | (267,315 | ) | | | $(3,428,441 | ) | | | (265,719 | ) | | | $(2,671,266 | ) |
Class B | | | (6,671 | ) | | | (83,294 | ) | | | (7,507 | ) | | | (73,632 | ) |
Class C | | | (34,507 | ) | | | (427,723 | ) | | | (6,219 | ) | | | (65,424 | ) |
Class I | | | (53,487 | ) | | | (683,088 | ) | | | (17,162,199 | ) | | | (173,917,452 | ) |
Class R1 | | | (352 | ) | | | (4,333 | ) | | | — | | | | — | |
Class R2 | | | (3,523 | ) | | | (45,302 | ) | | | — | | | | — | |
Class R3 | | | (1,969 | ) | | | (25,314 | ) | | | (3,093 | ) | | | (30,760 | ) |
Class R5 | | | (1,291,091 | ) | | | (16,451,469 | ) | | | (1,263,107 | ) | | | (13,526,404 | ) |
| | | (1,658,915 | ) | | | $(21,148,964 | ) | | | (18,707,844 | ) | | | $(190,284,938 | ) |
35
Notes to Financial Statements – continued
| | | | | | | | | | | | | | | | |
| | | Year ended
2/28/14 | | | Year ended
2/28/13 (i) | |
| | | Shares | | | Amount | | | Shares | | | Amount | |
| Net change | | | | | | | | | | | | | | | | |
Class A | | | 1,038,490 | | | | $13,175,116 | | | | 221,714 | | | | $2,436,040 | |
Class B | | | 41,668 | | | | 523,170 | | | | 11,577 | | | | 124,317 | |
Class C | | | 171,402 | | | | 2,151,725 | | | | 43,339 | | | | 442,371 | |
Class I | | | 418,702 | | | | 5,261,064 | | | | (15,773,236 | ) | | | (160,052,035 | ) |
Class R1 | | | 8,925 | | | | 106,906 | | | | 3,054 | | | | 31,338 | |
Class R2 | | | 24,795 | | | | 309,643 | | | | 1,861 | | | | 18,799 | |
Class R3 | | | 19,785 | | | | 246,614 | | | | 8,840 | | | | 95,900 | |
Class R4 | | | 1,021 | | | | 12,811 | | | | 686 | | | | 6,815 | |
Class R5 | | | 2,944,615 | | | | 36,027,063 | | | | 18,015,340 | | | | 182,489,423 | |
| | | 4,669,403 | | | | $57,814,112 | | | | 2,533,175 | | | | $25,592,968 | |
| (i) | For Class R5, the period is from inception, July 2, 2012, through the stated period end. |
The fund is one of several mutual funds in which the MFS funds-of-funds may invest. The MFS funds-of-funds do not invest in the underlying MFS funds for the purpose of exercising management or control. At the end of the period, the MFS Growth Allocation Fund, MFS Moderate Allocation Fund, MFS Aggressive Growth Allocation Fund, MFS Conservative Allocation Fund, MFS Lifetime 2030 Fund, MFS Lifetime 2040 Fund, MFS Lifetime 2020 Fund, and MFS Lifetime Retirement Income Fund were the owners of record of approximately 31%, 28%, 13%, 9%, 2%, 2%, 1%, and 1%, respectively, of the value of outstanding voting shares of the fund. In addition, the MFS Lifetime 2010 Fund, MFS Lifetime 2015 Fund, MFS Lifetime 2025 Fund, MFS Lifetime 2035 Fund, MFS Lifetime 2045 Fund, MFS Lifetime 2050 Fund, and MFS Lifetime 2055 Fund were each the owners of record of less than 1% of the value of outstanding voting shares of the fund.
(6) Line of Credit
The fund and certain other funds managed by MFS participate in a $1.1 billion unsecured committed line of credit, subject to a $1 billion sublimit, provided by a syndication of banks under a credit agreement. Borrowings may be made for temporary financing needs. Interest is charged to each fund, based on its borrowings, generally at a rate equal to the higher of the Federal Reserve funds rate or one month LIBOR plus an agreed upon spread. A commitment fee, based on the average daily, unused portion of the committed line of credit, is allocated among the participating funds at the end of each calendar quarter. In addition, the fund and other funds managed by MFS have established unsecured uncommitted borrowing arrangements with certain banks for temporary financing needs. Interest is charged to each fund, based on its borrowings, at a rate equal to the Federal Reserve funds rate plus an agreed upon spread. For the year ended February 28, 2014, the fund’s commitment fee and interest expense were $1,125 and $0, respectively, and are included in “Miscellaneous” expense in the Statement of Operations.
36
Notes to Financial Statements – continued
(7) Transactions in Underlying Affiliated Funds-Affiliated Issuers
An affiliated issuer may be considered one in which the fund owns 5% or more of the outstanding voting securities, or a company which is under common control. For the purposes of this report, the fund assumes the following to be an affiliated issuer:
| | | | | | | | | | | | | | | | |
| Underlying Affiliated Fund | | Beginning
Shares/Par
Amount | | | Acquisitions
Shares/Par
Amount | | | Dispositions
Shares/Par
Amount | | | Ending
Shares/Par
Amount | |
| MFS Institutional Money Market Portfolio | | | 9,711,634 | | | | 79,749,076 | | | | (82,550,973 | ) | | | 6,909,737 | |
| | | | |
| Underlying Affiliated Fund | | Realized
Gain (Loss) | | | Capital Gain
Distributions | | | Dividend
Income | | | Ending
Value | |
| MFS Institutional Money Market Portfolio | | | $— | | | | $— | | | | $9,941 | | | | $6,909,737 | |
37
REPORT OF INDEPENDENT REGISTERED PUBLIC ACCOUNTING FIRM
To the Trustees and Shareholders of MFS New Discovery Value Fund:
We have audited the accompanying statement of assets and liabilities of MFS New Discovery Value Fund (the Fund), including the portfolio of investments, as of February 28, 2014, and the related statement of operations for the year then ended, the statements of changes in net assets for each of the two years in the period then ended, and the financial highlights for each of the periods indicated therein. These financial statements and financial highlights are the responsibility of the Fund’s management. Our responsibility is to express an opinion on these financial statements and financial highlights based on our audits.
We conducted our audits in accordance with the standards of the Public Company Accounting Oversight Board (United States). Those standards require that we plan and perform the audit to obtain reasonable assurance about whether the financial statements and financial highlights are free of material misstatement. We were not engaged to perform an audit of the Fund’s internal control over financial reporting. Our audits included consideration of internal control over financial reporting as a basis for designing audit procedures that are appropriate in the circumstances, but not for the purpose of expressing an opinion on the effectiveness of the Fund’s internal control over financial reporting. Accordingly, we express no such opinion. An audit also includes examining, on a test basis, evidence supporting the amounts and disclosures in the financial statements and financial highlights, assessing the accounting principles used and significant estimates made by management, and evaluating the overall financial statement presentation. Our procedures included confirmation of securities owned as of February 28, 2014, by correspondence with the Fund’s custodian and others or by other appropriate auditing procedures where replies from others were not received. We believe that our audits provide a reasonable basis for our opinion.
In our opinion, the financial statements and financial highlights referred to above present fairly, in all material respects, the financial position of MFS New Discovery Value Fund at February 28, 2014, the results of its operations for the year then ended, the changes in its net assets for each of the two years in the period then ended, and its financial highlights for each of the periods indicated therein, in conformity with U.S. generally accepted accounting principles.

Boston, Massachusetts
April 14, 2014
38
TRUSTEES AND OFFICERS — IDENTIFICATION AND BACKGROUND
The Trustees and Officers of the Trust, as of April 1, 2014, are listed below, together with their principal occupations during the past five years. (Their titles may have varied during that period.) The address of each Trustee and Officer is 111 Huntington Avenue, Boston, Massachusetts 02199-7618. It is expected that the Board will appoint Mr. Timothy M. Fagan as Chief Compliance Officer of the MFS Funds on November 1, 2014.
| | | | | | | | |
Name, Age | | Position(s) Held with Fund | | Trustee/Officer
Since (h) | | Principal
Occupations During the Past Five Years | | Other Directorships (j) |
| INTERESTED TRUSTEES |
Robert J. Manning (k) (age 50) | | Trustee | | February 2004 | | Massachusetts Financial Services Company, Chairman, Chief Executive Officer and Director; President (until 2009); Chief Investment Officer (until 2010) | | N/A |
Robin A. Stelmach (k) (age 52) | | Trustee | | January 2014 | | Massachusetts Financial Services Company, Executive Vice President and Chief Operating Officer | | N/A |
| INDEPENDENT TRUSTEES |
David H. Gunning (age 71) | | Trustee and Chair of Trustees | | January 2004 | | Private investor | | Lincoln Electric Holdings, Inc. (welding equipment manufacturer), Director; Development Alternatives, Inc. (consulting), Director/Non-Executive Chairman |
Steven E. Buller (age 62) | | Trustee | | February 2014 | | Chairman, Financial Accounting Standards Advisory Council; Standing Advisory Group, Public Company Accounting Oversight Board, Member; BlackRock, Inc. (investment management), Managing Director (until 2014), BlackRock Finco (investment management), UK, Director (until 2014) | | N/A |
39
Trustees and Officers – continued
| | | | | | | | |
Name, Age | | Position(s) Held with Fund | | Trustee/Officer
Since (h) | | Principal
Occupations During the Past Five Years | | Other Directorships (j) |
Robert E. Butler (age 72) | | Trustee | | January 2006 | | Consultant – investment company industry regulatory and compliance matters | | N/A |
Maureen R. Goldfarb (age 58) | | Trustee | | January 2009 | | Private investor | | N/A |
William R. Gutow (age 72) | | Trustee | | December 1993 | | Private investor and real estate consultant; Capitol Entertainment Management Company (video franchise), Vice Chairman | | Texas Donuts (donut franchise), Vice Chairman (until 2010) |
Michael Hegarty (age 69) | | Trustee | | December 2004 | | Private investor | | Brookfield Office Properties, Inc. (real estate), Director; Rouse Properties Inc. (real estate), Director; Capmark Financial Group Inc. (real estate), Director |
John P. Kavanaugh (age 59) | | Trustee | | January 2009 | | Private investor | | N/A |
Laurie J. Thomsen (age 56) | | Trustee | | March 2005 | | Private investor; New Profit, Inc. (venture philanthropy), Executive Partner (until 2010) | | The Travelers Companies (insurance), Director |
Robert W. Uek (age 72) | | Trustee | | January 2006 | | Consultant to investment company industry | | N/A |
| OFFICERS | | | | | | | | |
John M. Corcoran (k) (age 48) | | President | | October 2008 | | Massachusetts Financial Services Company, Senior Vice President | | N/A |
Christopher R. Bohane (k) (age 40) | | Assistant Secretary and Assistant Clerk | | July 2005 | | Massachusetts Financial Services Company, Vice President and Assistant General Counsel | | N/A |
Kino Clark (k) (age 45) | | Assistant Treasurer | | January 2012 | | Massachusetts Financial Services Company, Vice President | | N/A |
40
Trustees and Officers – continued
| | | | | | | | |
Name, Age | | Position(s) Held with Fund | | Trustee/Officer
Since (h) | | Principal
Occupations During the Past Five Years | | Other Directorships (j) |
Thomas H. Connors (k) (age 54) | | Assistant Secretary and Assistant Clerk | | September 2012 | | Massachusetts Financial Services Company, Vice President and Senior Counsel; Deutsche Investment Management Americas Inc. (financial service provider), Director and Senior Counsel (until 2012) | | N/A |
Ethan D. Corey (k) (age 50) | | Assistant Secretary and Assistant Clerk | | July 2005 | | Massachusetts Financial Services Company, Senior Vice President and Associate General Counsel | | N/A |
David L. DiLorenzo (k) (age 45) | | Treasurer | | July 2005 | | Massachusetts Financial Services Company, Senior Vice President | | N/A |
Robyn L. Griffin (age 38) | | Assistant Independent Chief Compliance Officer | | August 2008 | | Griffin Compliance LLC (provider of compliance services), Principal | | N/A |
Brian E. Langenfeld (k) (age 41) | | Assistant Secretary and Assistant Clerk | | June 2006 | | Massachusetts Financial Services Company, Vice President and Senior Counsel | | N/A |
Susan S. Newton (k) (age 64) | | Assistant Secretary and Assistant Clerk | | May 2005 | | Massachusetts Financial Services Company, Senior Vice President and Associate General Counsel | | N/A |
Susan A. Pereira (k) (age 43) | | Assistant Secretary and Assistant Clerk | | July 2005 | | Massachusetts Financial Services Company, Vice President and Senior Counsel | | N/A |
Kasey L. Phillips (k) (age 43) | | Assistant Treasurer | | September 2012 | | Massachusetts Financial Services Company, Vice President; Wells Fargo Funds Management, LLC, Senior Vice President, Fund Treasurer (until 2012) | | N/A |
41
Trustees and Officers – continued
| | | | | | | | |
Name, Age | | Position(s) Held with Fund | | Trustee/Officer
Since (h) | | Principal
Occupations During the Past Five Years | | Other Directorships (j) |
| Mark N. Polebaum (k) (age 61) | | Secretary and Clerk | | January 2006 | | Massachusetts Financial Services Company, Executive Vice President, General Counsel and Secretary | | N/A |
Frank L. Tarantino (l) (age 70) | | Independent Chief Compliance Officer | | June 2004 | | Tarantino LLC (provider of compliance services), Principal | | N/A |
Richard S. Weitzel (k) (age 43) | | Assistant Secretary and Assistant Clerk | | October 2007 | | Massachusetts Financial Services Company, Senior Vice President and Associate General Counsel | | N/A |
James O. Yost (k) (age 53) | | Deputy Treasurer | | September 1990 | | Massachusetts Financial Services Company, Senior Vice President | | N/A |
| (h) | Date first appointed to serve as Trustee/officer of an MFS Fund. Each Trustee has served continuously since appointment unless indicated otherwise. For the period from December 15, 2004 until February 22, 2005, Mr. Manning served as Advisory Trustee. For the period October 2008, until January 2012, Mr. Corcoran served as Treasurer of the Funds. Prior to January 2012, Messrs. DiLorenzo and Yost served as Assistant Treasurers of the Funds. |
| (j) | Directorships or trusteeships of companies required to report to the Securities and Exchange Commission (i.e., “public companies”). |
| (k) | “Interested person” of the Trust within the meaning of the Investment Company Act of 1940 (referred to as the 1940 Act), which is the principal federal law governing investment companies like the fund, as a result of position with MFS. The address of MFS is 111 Huntington Avenue, Boston, Massachusetts 02199-7618. |
| (l) | Mr. Tarantino will retire as Independent Chief Compliance Officer of the MFS Funds on October 31, 2014. It is expected that Mr. Tarantino will continue after that date as an Officer of the MFS Funds. |
Each Trustee (except Ms. Stelmach and Mr. Buller) has been elected by shareholders and each Trustee and officer holds office until his or her successor is chosen and qualified or until his or her earlier death, resignation, retirement or removal. The Trust does not hold annual meetings for the purpose of electing Trustees, and Trustees are not elected for fixed terms. Messrs. Butler, Kavanaugh, Uek and Ms. Thomsen are members of the Trust’s Audit Committee.
Each of the Fund’s Trustees and officers holds comparable positions with certain other funds of which MFS or a subsidiary is the investment adviser or distributor, and, in the case of the officers, with certain affiliates of MFS. As of January 1, 2014, the Trustees served as board members of 142 funds within the MFS Family of Funds.
42
Trustees and Officers – continued
The Statement of Additional Information for the Fund includes further information about the Trustees and is available without charge upon request by calling 1-800-225-2606.
| | |
| Investment Adviser | | Custodian |
Massachusetts Financial Services Company
111 Huntington Avenue
Boston, MA 02199-7618 | | State Street Bank and Trust Company 1 Lincoln Street Boston, MA 02111-2900 |
| Distributor | | Independent Registered Public Accounting Firm |
MFS Fund Distributors, Inc.
111 Huntington Avenue
Boston, MA 02199-7618 | | Ernst & Young LLP 200 Clarendon Street Boston, MA 02116 |
| Portfolio Manager | | |
Kevin Schmitz | | |
43
BOARD REVIEW OF INVESTMENT ADVISORY AGREEMENT
A discussion regarding the Board’s most recent review and renewal of the fund’s Investment Advisory Agreement with MFS is available by clicking on the fund’s name under “Mutual Funds” in the “Products” section of the MFS Web site (mfs.com).
PROXY VOTING POLICIES AND INFORMATION
A general description of the MFS funds’ proxy voting policies and procedures is available without charge, upon request, by calling 1-800-225-2606, by visiting the Proxy Voting section of mfs.com or by visiting the SEC’s Web site at http://www.sec.gov.
Information regarding how the fund voted proxies relating to portfolio securities during the most recent twelve-month period ended June 30 is available without charge by visiting the Proxy Voting section of mfs.com or by visiting the SEC’s Web site at http://www.sec.gov.
QUARTERLY PORTFOLIO DISCLOSURE
The fund will file a complete schedule of portfolio holdings with the Securities and Exchange Commission (the Commission) for the first and third quarters of each fiscal year on Form N-Q. A shareholder can obtain the quarterly portfolio holdings report at mfs.com. The fund’s Form N-Q is also available on the EDGAR database on the Commission’s Internet Web site at http://www.sec.gov, and may be reviewed and copied at the:
Public Reference Room
Securities and Exchange Commission
100 F Street, NE, Room 1580
Washington, D.C. 20549
Information on the operation of the Public Reference Room may be obtained by calling the Commission at 1-800-SEC-0330. Copies of the fund’s Form N-Q also may be obtained, upon payment of a duplicating fee, by electronic request at the following e-mail address: publicinfo@sec.gov or by writing the Public Reference Section at the above address.
FURTHER INFORMATION
From time to time, MFS may post important information about the fund or the MFS funds on the MFS web site (mfs.com). This information is available by visiting the “Commentary & Announcements” and “Market Outlooks” sections of mfs.com or by clicking on the fund’s name under “Mutual Funds” in the “Products” section of mfs.com.
FEDERAL TAX INFORMATION (unaudited)
The fund will notify shareholders of amounts for use in preparing 2014 income tax forms in January 2015. The following information is provided pursuant to provisions of the Internal Revenue Code.
The fund designates the maximum amount allowable as qualified dividend income eligible for the 15% tax rate.
The fund designates $16,516,000 as capital gain dividends paid during the fiscal year.
For corporate shareholders, 22.51% of the ordinary income dividends paid during the fiscal year qualify for the corporate dividends received deduction.
44
rev. 3/11
| | | | |
| | | |
FACTS | | WHAT DOES MFS DO WITH YOUR PERSONAL INFORMATION? | |  |
| | |
| Why? | | Financial companies choose how they share your personal information. Federal law gives consumers the right to limit some but not all sharing. Federal law also requires us to tell you how we collect, share, and protect your personal information. Please read this notice carefully to understand what we do. |
| | |
| What? | | The types of personal information we collect and share depend on the product or service you have with us. This information can include: • Social Security number and account balances • Account transactions and transaction history • Checking account information and wire transfer instructions When you are no longer our customer, we continue to share your information as described in this notice. |
| | |
| How? | | All financial companies need to share customers’ personal information to run their everyday business. In the section below, we list the reasons financial companies can share their customers’ personal information; the reasons MFS chooses to share; and whether you can limit this sharing. |
| | | | |
Reasons we can share your
personal information | | Does MFS
share? | | Can you limit
this sharing? |
For our everyday business purposes – such as to process your transactions, maintain your account(s), respond to court orders and legal investigations, or report to credit bureaus | | Yes | | No |
For our marketing purposes – to offer our products and services to you | | No | | We don’t share |
| For joint marketing with other financial companies | | No | | We don’t share |
For our affiliates’ everyday business purposes – information about your transactions and experiences | | No | | We don’t share |
For our affiliates’ everyday business purposes – information about your creditworthiness | | No | | We don’t share |
| For nonaffiliates to market to you | | No | | We don’t share |
| | |
| Questions? | | Call 800-225-2606 or go to mfs.com. |
45
| | |
| Who we are |
| Who is providing this notice? | | MFS Funds, MFS Investment Management, MFS Institutional Advisors, Inc., MFS Fund Distributors, Inc., MFS Heritage Trust Company, and MFS Service Center, Inc. |
| | |
| What we do |
| How does MFS protect my personal information? | | To protect your personal information from unauthorized access and use, we use security measures that comply with federal law. These measures include procedural, electronic, and physical safeguards for the protection of the personal information we collect about you. |
| How does MFS collect my personal information? | | We collect your personal information, for example, when you •open an account or provide account information •direct us to buy securities or direct us to sell your securities •make a wire transfer We also collect your personal information from others, such as credit bureaus, affiliates and other companies. |
| Why can’t I limit all sharing? | | Federal law gives you the right to limit only •sharing for affiliates’ everyday business purposes – information about your creditworthiness •affiliates from using your information to market to you •sharing for nonaffiliates to market to you State laws and individual companies may give you additional rights to limit sharing. |
| | |
| Definitions |
| Affiliates | | Companies related by common ownership or control. They can be financial and nonfinancial companies. •MFS does not share personal information with affiliates, except for everyday business purposes as described on page one of this notice. |
| Nonaffiliates | | Companies not related by common ownership or control. They can be financial and nonfinancial companies. •MFS does not share with nonaffiliates so they can market to you. |
| Joint Marketing | | A formal agreement between nonaffiliated financial companies that together market financial products or services to you. •MFS doesn’t jointly market. |
| | |
| Other important information |
| If you own an MFS product or receive an MFS service in the name of a third party such as a bank or broker-dealer, their privacy policy may apply to you instead of ours. |
46
Save paper with eDelivery.

| MFS® will send you prospectuses, |
reports, and proxies directly via e-mail so you will get information faster with less mailbox clutter.
To sign up:
1. Go to mfs.com.
2. Log in via MFS® Access.
3. Select eDelivery.
If you own your MFS fund shares through a financial institution or a retirement plan, MFS® TALK, MFS® Access, or eDelivery may not be available to you.
CONTACT
WEB SITE
mfs.com
MFS TALK
1-800-637-8255
24 hours a day
ACCOUNT SERVICE AND LITERATURE
Shareholders
1-800-225-2606
Financial advisors
1-800-343-2829
Retirement plan services
1-800-637-1255
MAILING ADDRESS
MFS Service Center, Inc.
P.O. Box 55824
Boston, MA 02205-5824
OVERNIGHT MAIL
MFS Service Center, Inc.
c/o Boston Financial Data Services
30 Dan Road
Canton, MA 02021-2809
The Registrant has adopted a Code of Ethics pursuant to Section 406 of the Sarbanes-Oxley Act and as defined in Form N-CSR that applies to the Registrant’s principal executive officer and principal financial and accounting officer. During the period covered by this report, the Registrant has not amended any provision in its Code of Ethics (the “Code”) that relates to an element of the Code’s definitions enumerated in paragraph (b) of Item 2 of this Form N-CSR. During the period covered by this report, the Registrant did not grant a waiver, including an implicit waiver, from any provision of the Code.
A copy of the Code of Ethics is filed as an exhibit to this Form N-CSR.
| ITEM 3. | AUDIT COMMITTEE FINANCIAL EXPERT. |
Messrs. Robert E. Butler, John P. Kavanaugh and Robert W. Uek and Ms. Laurie J. Thomsen, members of the Audit Committee, have been determined by the Board of Trustees in their reasonable business judgment to meet the definition of “audit committee financial expert” as such term is defined in Form N-CSR. In addition, Messrs. Butler, Kavanaugh and Uek and Ms. Thomsen are “independent” members of the Audit Committee (as such term has been defined by the Securities and Exchange Commission in regulations implementing Section 407 of the Sarbanes-Oxley Act of 2002). The Securities and Exchange Commission has stated that the designation of a person as an audit committee financial expert pursuant to this Item 3 on the Form N-CSR does not impose on such a person any duties, obligations or liability that are greater than the duties, obligations or liability imposed on such person as a member of the Audit Committee and the Board of Trustees in the absence of such designation or identification.
| ITEM 4. | PRINCIPAL ACCOUNTANT FEES AND SERVICES. |
Items 4(a) through 4(d) and 4(g):
The Board of Trustees has appointed Deloitte & Touche LLP (“Deloitte”) to serve as independent accountants to certain series of the Registrant and Ernst & Young LLP (“E&Y”) to serve in the same capacity to certain other series of the Registrant (the series referred to collectively as the “Funds” and singularly as a “Fund”). The tables below set forth the audit fees billed to the Funds as well as fees for non-audit services provided to the Funds and/or to the Funds’ investment adviser, Massachusetts Financial Services Company (“MFS”), and to various entities either controlling, controlled by, or under common control with MFS that provide ongoing services to the Funds (“MFS Related Entities”).
For the fiscal years ended February 28, 2014 and February 28, 2013, respectively, audit fees billed to the Funds by Deloitte and E&Y were as follows:
| | | | | | | | |
| | | Audit Fees | |
| | 2014 | | | 2013 | |
Fees billed by Deloitte: | | | | | | | | |
MFS Government Securities Fund | | | 50,593 | | | | 50,003 | |
| | | | | | | | |
| | | Audit Fees | |
| | 2014 | | | 2013 | |
Fees billed by E&Y: | | | | | | | | |
MFS Diversified Income Fund | | | 53,746 | | | | 53,118 | |
MFS Global Real Estate Fund | | | 44,406 | | | | 43,889 | |
MFS New Discovery Value Fund | | | 42,393 | | | | 31,900 | |
| | | | | | | | |
Total | | | 140,545 | | | | 128,907 | |
For the fiscal years ended February 28, 2014 and February 28, 2013, respectively, fees billed by Deloitte and E&Y for audit-related, tax and other services provided to the Funds and for audit-related, tax and other services provided to MFS and MFS Related Entities were as follows:
| | | | | | | | | | | | | | | | | | | | | | | | |
| | | Audit-Related Fees1 | | | Tax Fees2 | | | All Other Fees3 | |
| | 2014 | | | 2013 | | | 2014 | | | 2013 | | | 2014 | | | 2013 | |
Fees billed by Deloitte: | | | | | | | | | | | | | | | | | | | | | | | | |
To MFS Government Securities Fund | | | 0 | | | | 0 | | | | 6,676 | | | | 6,597 | | | | 1,272 | | | | 1,191 | |
| | | |
| | | Audit-Related Fees1 | | | Tax Fees2 | | | All Other Fees3 | |
| | 2014 | | | 20135 | | | 2014 | | | 2013 | | | 2014 | | | 2013 | |
Fees billed by Deloitte: | | | | | | | | | | | | | | | | | | | | | | | | |
To MFS and MFS Related Entities of MFS Government Securities Fund* | | | 1,872,104 | | | | 1,260,713 | | | | 0 | | | | 0 | | | | 0 | | | | 0 | |
| | | | | | | | |
| | | Aggregate fees for non-audit services | |
| | 2014 | | | 20135 | |
Fees billed by Deloitte: | | | | | | | | |
To MFS Government Securities Fund, MFS and MFS Related Entities# | | | 1,891,872 | | | | 1,413,071 | |
| | | | | | | | | | | | | | | | | | | | | | | | |
| | | Audit-Related Fees1 | | | Tax Fees2 | | | All Other Fees4 | |
| | 2014 | | | 2013 | | | 2014 | | | 2013 | | | 2014 | | | 2013 | |
Fees billed by E&Y: | | | | | | | | | | | | | | | | | | | | | | | | |
To MFS Diversified Income Fund | | | 0 | | | | 0 | | | | 7,930 | | | | 7,934 | | | | 0 | | | | 0 | |
To MFS Global Real Estate Fund | | | 0 | | | | 0 | | | | 9,779 | | | | 9,746 | | | | 0 | | | | 0 | |
To MFS New Discovery Value Fund | | | 0 | | | | 0 | | | | 7,979 | | | | 7,982 | | | | 0 | | | | 0 | |
Total fees billed by E&Y To above Funds | | | 0 | | | | 0 | | | | 25,688 | | | | 25,662 | | | | 0 | | | | 0 | |
| | | | | | | | | | | | | | | | | | | | | | | | |
| | | Audit-Related Fees1 | | | Tax Fees2 | | | All Other Fees4 | |
| | 2014 | | | 2013 | | | 2014 | | | 2013 | | | 2014 | | | 2013 | |
Fees billed by E&Y: | | | | | | | | | | | | | | | | | | | | | | | | |
To MFS and MFS Related Entities of MFS Diversified Income Fund* | | | 0 | | | | 0 | | | | 0 | | | | 0 | | | | 0 | | | | 0 | |
To MFS and MFS Related Entities of MFS Global Real Estate Fund* | | | 0 | | | | 0 | | | | 0 | | | | 0 | | | | 0 | | | | 0 | |
To MFS and MFS Related Entities of MFS New Discovery Value Fund* | | | 0 | | | | 0 | | | | 0 | | | | 0 | | | | 0 | | | | 0 | |
| | | | | | | | |
| | | Aggregate fees for non-audit services | |
| | 2014 | | | 2013 | |
Fees billed by E&Y: | | | | | | | | |
To MFS Diversified Income Fund, MFS and MFS Related Entities# | | | 70,930 | | | | 52,934 | |
To MFS Global Real Estate Fund, MFS and MFS Related Entities# | | | 72,779 | | | | 54,746 | |
To MFS New Discovery Value Fund, MFS and MFS Related Entities# | | | 70,979 | | | | 52,982 | |
| * | This amount reflects the fees billed to MFS and MFS Related Entities for non-audit services relating directly to the operations and financial reporting of the Funds (portions of which services also related to the operations and financial reporting of other funds within the MFS Funds complex). |
| # | This amount reflects the aggregate fees billed by Deloitte or E&Y, as the case may be, for non-audit services rendered to the Funds and for non-audit services rendered to MFS and the MFS Related Entities. |
| 1 | The fees included under “Audit-Related Fees” are fees related to assurance and related services that are reasonably related to the performance of the audit or review of financial statements, but not reported under ‘‘Audit Fees,’’ including accounting consultations, agreed-upon procedure reports, attestation reports, comfort letters and internal control reviews. |
| 2 | The fees included under “Tax Fees” are fees associated with tax compliance, tax advice and tax planning, including services relating to the filing or amendment of federal, state or local income tax returns, regulated investment company qualification reviews and tax distribution and analysis. |
| 3 | The fees included under “All Other Fees” are fees for products and services provided by Deloitte other than those reported under “Audit Fees,” “Audit-Related Fees” and “Tax Fees,” including fees for services related to reviews of internal controls and review of Rule 38a-1 compliance program. |
| 4 | The fees under “All Other Fees” are fees for products and services provided by E&Y other than those reported under “Audit Fees,” “Audit-Related Fees” and “Tax Fees”. |
| 5 | Fees reported in 2013 have been restated in this filing from those reported in the Registrant’s filing for the reporting period ended February 28, 2013. |
Item 4(e)(1):
Set forth below are the policies and procedures established by the Audit Committee of the Board of Trustees relating to the pre-approval of audit and non-audit related services:
To the extent required by applicable law, pre-approval by the Audit Committee of the Board is needed for all audit and permissible non-audit services rendered to the Funds and all permissible non-audit services rendered to MFS or MFS Related Entities if the services relate directly to the operations and financial reporting of the Registrant. Pre-approval is
currently on an engagement-by-engagement basis. In the event pre-approval of such services is necessary between regular meetings of the Audit Committee and it is not practical to wait to seek pre-approval at the next regular meeting of the Audit Committee, pre-approval of such services may be referred to the Chair of the Audit Committee for approval; provided that the Chair may not pre-approve any individual engagement for such services exceeding $50,000 or multiple engagements for such services in the aggregate exceeding $100,000 in each period between regular meetings of the Audit Committee. Any engagement pre-approved by the Chair between regular meetings of the Audit Committee shall be presented for ratification by the entire Audit Committee at its next regularly scheduled meeting.
Item 4(e)(2):
None, or 0%, of the services relating to the Audit-Related Fees, Tax Fees and All Other Fees paid by the Fund and MFS and MFS Related Entities relating directly to the operations and financial reporting of the Registrant disclosed above were approved by the audit committee pursuant to paragraphs (c)(7)(i)(C) of Rule 2-01 of Regulation S-X (which permits audit committee approval after the start of the engagement with respect to services other than audit, review or attest services, if certain conditions are satisfied).
Item 4(f): Not applicable.
Item 4(h): The Registrant’s Audit Committee has considered whether the provision by a Registrant’s independent registered public accounting firm of non-audit services to MFS and MFS Related Entities that were not pre-approved by the Committee (because such services did not relate directly to the operations and financial reporting of the Registrant) was compatible with maintaining the independence of the independent registered public accounting firm as the Registrant’s principal auditors.
| ITEM 5. | AUDIT COMMITTEE OF LISTED REGISTRANTS. |
Not applicable to the Registrant.
A schedule of investments of the Registrant is included as part of the report to shareholders of such series under Item 1 of this Form N-CSR.
| ITEM 7. | DISCLOSURE OF PROXY VOTING POLICIES AND PROCEDURES FOR CLOSED-END MANAGEMENT INVESTMENT COMPANIES. |
Not applicable to the Registrant.
| ITEM 8. | PORTFOLIO MANAGERS OF CLOSED-END MANAGEMENT INVESTMENT COMPANIES. |
Not applicable to the Registrant.
| ITEM 9. | PURCHASES OF EQUITY SECURITIES BY CLOSED-END MANAGEMENT INVESTMENT COMPANY AND AFFILIATED PURCHASERS. |
Not applicable to the Registrant.
| ITEM 10. | SUBMISSION OF MATTERS TO A VOTE OF SECURITY HOLDERS. |
There were no material changes to the procedures by which shareholders may send recommendations to the Board for nominees to the Registrant’s Board since the Registrant last provided disclosure as to such procedures in response to the requirements of Item 407 (c)(2)(iv) of Regulation S-K or this Item.
| ITEM 11. | CONTROLS AND PROCEDURES. |
| (a) | Based upon their evaluation of the effectiveness of the registrant’s disclosure controls and procedures (as defined in Rule 30a-3(c) under the Investment Company Act of 1940 (the “Act”)) as conducted within 90 days of the filing date of this report on Form N-CSR, the registrant’s principal financial officer and principal executive officer have concluded that those disclosure controls and procedures provide reasonable assurance that the material information required to be disclosed by the registrant on this report is recorded, processed, summarized and reported within the time periods specified in the Securities and Exchange Commission’s rules and forms. |
| (b) | There were no changes in the registrant’s internal controls over financial reporting (as defined in Rule 30a-3(d) under the Act) that occurred during the second fiscal quarter of the period covered by the report that have materially affected, or are reasonably likely to materially affect, the registrant’s internal control over financial reporting. |
| (a) | File the exhibits listed below as part of this form. Letter or number the exhibits in the sequence indicated. |
| | (1) | Any code of ethics, or amendment thereto, that is the subject of the disclosure required by Item 2, to the extent that the registrant intends to satisfy the Item 2 requirements through filing of an exhibit: Code of Ethics attached hereto. |
| | (2) | A separate certification for each principal executive officer and principal financial officer of the registrant as required by Rule 30a-2(a) under the Act (17 CFR 270.30a-2): Attached hereto. |
| (b) | If the report is filed under Section 13(a) or 15(d) of the Exchange Act, provide the certifications required by Rule 30a-2(b) under the Act (17 CFR 270.30a-2(b)), Rule 13a-14(b) or Rule 15d-14(b) under the Exchange Act (17 CFR 240.13a-14(b) or 240.15d-14(b)) and Section 1350 of Chapter 63 of Title 18 of the United States Code (18 U.S.C. 1350) as an exhibit. A certification furnished pursuant to this paragraph will not be deemed “filed” for the purposes of Section 18 of the Exchange Act (15 U.S.C. 78r), or otherwise subject to the liability of that section. Such certification will not be deemed to be incorporated by reference into any filing under the Securities Act of 1933 or the Exchange Act, except to the extent that the registrant specifically incorporates it by reference: Attached hereto. |
Notice
A copy of the Amended and Restated Declaration of Trust, as amended, of the Registrant is on file with the Secretary of State of The Commonwealth of Massachusetts and notice is hereby given that this instrument is executed on behalf of the Registrant by an officer of the Registrant as an officer and not individually and the obligations of or arising out of this instrument are not binding upon any of the Trustees or shareholders individually, but are binding only upon the assets and property of the respective constituent series of the Registrant.
SIGNATURES
Pursuant to the requirements of the Securities Exchange Act of 1934 and the Investment Company Act of 1940, the registrant has duly caused this report to be signed on its behalf by the undersigned, thereunto duly authorized.
(Registrant) MFS SERIES TRUST XIII
| | |
| By (Signature and Title)* | | JOHN M. CORCORAN |
| | John M. Corcoran, President |
Date: April 14, 2014
Pursuant to the requirements of the Securities Exchange Act of 1934 and the Investment Company Act of 1940, this report has been signed below by the following persons on behalf of the registrant and in the capacities and on the dates indicated.
| | |
| By (Signature and Title)* | | JOHN M. CORCORAN |
| | John M. Corcoran, President |
| | (Principal Executive Officer) |
Date: April 14, 2014
| | |
| By (Signature and Title)* | | DAVID L. DILORENZO |
| | David L. DiLorenzo, Treasurer |
| | (Principal Financial Officer and Accounting Officer) |
Date: April 14, 2014
| * | Print name and title of each signing officer under his or her signature. |