UNITED STATES
SECURITIES AND EXCHANGE COMMISSION
Washington, D.C. 20549
FORM N-CSR
CERTIFIED SHAREHOLDER REPORT OF
REGISTERED MANAGEMENT INVESTMENT COMPANIES
Investment Company Act file number 811-3327
MFS SERIES TRUST XIII
(Exact name of registrant as specified in charter)
111 Huntington Avenue, Boston, Massachusetts 02199
(Address of principal executive offices) (Zip code)
Kristin V. Collins
Massachusetts Financial Services Company
111 Huntington Avenue
Boston, Massachusetts 02199
(Name and address of agents for service)
Registrant’s telephone number, including area code: (617) 954-5000
Date of fiscal year end: August 31*
Date of reporting period: August 31, 2015
| * | This Form N-CSR pertains only to the following series of the Registrant: MFS Global Real Estate Fund. The remaining series of the Registrant has a fiscal year end other than 8/31. |
| ITEM 1. | REPORTS TO STOCKHOLDERS. |
ANNUAL REPORT
August 31, 2015

MFS® GLOBAL REAL ESTATE FUND

GRE-ANN
MFS® GLOBAL REAL ESTATE FUND
CONTENTS
The report is prepared for the general information of shareholders.
It is authorized for distribution to prospective investors only when preceded or accompanied by a current prospectus.
NOT FDIC INSURED • MAY LOSE VALUE • NO BANK GUARANTEE

LETTER FROM THE CHAIRMAN
Dear Shareholders:
The U.S. economy bounced back after another harsh winter curtailed domestic consumption. Despite strengthening labor and housing markets, however, a stronger U.S. dollar and weak overseas demand have held back corporate earnings.
China’s economic growth continues to slow, raising concerns and adding to global market volatility. Commodity exporters, including Australia and Canada, have been hurt by weaker Chinese demand. Global oil markets remain oversupplied, putting pressure on crude oil and gasoline prices.
In Europe, concerns about a potential Greek debt default have faded, and the eurozone’s economy is expanding mildly. Hopes for a more robust regionwide recovery rest on the European Central Bank’s quantitative easing program.
The world’s financial markets have become increasingly complex in recent years. Now, more than ever, it is important to understand companies on a global basis. At MFS®, we believe our integrated research platform, collaborative culture, active risk management process and long-term focus give us a research advantage.
As investors, we aim to add long-term value. We believe this approach will serve you well as you work with your financial advisor to reach your investment objectives.
Respectfully,

Robert J. Manning
Chairman
MFS Investment Management
October 15, 2015
The opinions expressed in this letter are subject to change and may not be relied upon for investment advice. No forecasts can be guaranteed.
1
PORTFOLIO COMPOSITION
Portfolio structure

| | | | |
| Top ten holdings | | | | |
| Simon Property Group, Inc., REIT | | | 5.4% | |
| Public Storage, Inc., REIT | | | 4.5% | |
| Mitsubishi Estate Co. Ltd. | | | 3.5% | |
| Mitsui Fudosan Co. Ltd. | | | 3.4% | |
| AvalonBay Communities, Inc., REIT | | | 3.2% | |
| Mid-America Apartment Communities, Inc., REIT | | | 3.1% | |
| Vornado Realty Trust, REIT | | | 3.0% | |
| Equity Lifestyle Properties, Inc., REIT | | | 2.9% | |
| Unibail-Rodamco, REIT | | | 2.9% | |
| Plum Creek Timber Co. Inc., REIT | | | 2.7% | |
| |
| Equity industries | | | | |
| Real Estate | | | 95.2% | |
| Telecommunications-Wireless | | | 2.2% | |
| Medical & Health Technology & Services | | | 0.4% | |
| | | | |
| Issuer country weightings (x) | |
| United States | | | 54.5% | |
| Japan | | | 10.6% | |
| United Kingdom | | | 7.7% | |
| Hong Kong | | | 7.6% | |
| Singapore | | | 4.0% | |
| France | | | 2.9% | |
| Australia | | | 2.6% | |
| Spain | | | 2.4% | |
| Canada | | | 2.2% | |
| Other Countries | | | 5.5% | |
|
| Currency exposure weightings (y) | |
| United States Dollar | | | 54.5% | |
| Japanese Yen | | | 10.6% | |
| Euro | | | 10.3% | |
| British Pound Sterling | | | 7.7% | |
| Hong Kong Dollar | | | 7.6% | |
| Singapore Dollar | | | 4.0% | |
| Australian Dollar | | | 2.6% | |
| Canadian Dollar | | | 2.2% | |
| Mexican Peso | | | 0.5% | |
| (x) | Represents the portfolio’s exposure to issuer countries as a percentage of a portfolio’s net assets. For purposes of this presentation, United States includes Cash & Other. |
| (y) | Represents the portfolio’s exposure to a particular currency as a percentage of a portfolio’s net assets. For purposes of this presentation, United States Dollar includes Cash & Other. |
Cash & Other can include cash, other assets less liabilities, offsets to derivative positions, and short-term securities. Please see the Statement of Assets and Liabilities for additional information related to the fund’s cash position and the Notes to Financial Statements for additional information related to certain risks associated with assets included in “Other”.
Percentages are based on net assets as of 8/31/15.
The portfolio is actively managed and current holdings may be different.
2
MANAGEMENT REVIEW
Summary of Results
For the six months ended August 31, 2015, Class A shares of the MFS Global Real Estate Fund (“fund”) provided a total return of –7.94%, at net asset value. This compares with a return of –9.29% for the fund’s benchmark, the FTSE EPRA/NAREIT Developed Real Estate Index (“FTSE Index”). Effective March 1, 2015, the fund changed its year-end from February 28 to August 31. As a result, this commentary reflects the performance results for the period March 1, 2015 through August 31, 2015 for this fiscal year but will continue to report annual results going forward.
Market Environment
Before the start of the reporting period, a generally risk-friendly environment prevailed and any market setbacks, triggered by global growth concerns, were short-lived as central banks responded and kept monetary policy accommodative. For example, the US tempered rate hike expectations while Japan, Europe and China provided fresh stimulus measures which ultimately supported risk assets. Early in the period, the European Central Bank cut policy interest rates and announced non-conventional easing measures, pushing yields on a significant portion of Eurozone sovereign bonds deeper into negative territory, a notable highlight amid a mini-wave of global easing due to declining inflation and inflation expectations. However, the environment supporting risk began to break down in the latter phases of the period, with both US investment grade and high yield corporate spreads widening out and any individual company performance below expectations resulted in market selling.
A dominant trend for most of the period was the ongoing rise in US equities. Early in the period, this was paired with a decline in US and global bond yields. The uptrend in US corporate margins and profits continued throughout the second half of 2014, but in the latter part of the period the margin results became more bifurcated with energy and materials suffering and the rest of the companies holding on to net margins in an ongoing slow revenue growth environment. A rising dollar and a sharp decline in commodity prices, particularly crude oil prices, negatively impacted credit markets, notably US high yield and emerging market debt. The higher weightings of oil and gas credits in these asset classes resulted in widening spreads and increased volatility. During the period, global sovereign bond yields rose, shrugging off concerns over a Greek debt default. The rise tempered the equity advance, as odds of a 2015 US Federal Reserve rate hike increased. At the end of the period, the stronger US dollar slowed revenues in many US-based multinational companies. As the last month of the period began, risk shedding became a theme across emerging market countries and continued to weaken Chinese economic data as well as economic data of the commodity-driven countries. Risk shedding accelerated outflows and cross-border selling. By the end of the period, many of the world’s equity markets had entered into “correction” territory.
Contributors to performance
During the reporting period, the fund’s security selection in real estate investments in the United Kingdom contributed to performance relative to the FTSE Index. An overweight position in Quintain Estates and Development and Big Yellow Group benefited relative performance.
3
Management Review – continued
Stock selection in real estate investments located in the United States also supported relative results. The fund’s overweight positions in Mid-America Apartment Communities, Equity Lifestyle Properties, Home Properties and Public Storage supported relative returns.
Elsewhere, the fund’s ownership in shares of Hibernia REIT (b) (Ireland) aided relative results. Additionally, the timing of the fund’s ownership in shares of Sun Hung Kai Property (h) (Hong Kong) and an overweight position in Lar Espana Real Estate Socimi (Spain) were additional positive factors for relative returns.
The fund’s cash and/or cash equivalents position during the period was also a contributor to relative performance. Under normal market conditions, the fund strives to be fully invested and generally holds cash to buy new holdings and to provide liquidity. In a period when equity markets fell, as measured by the fund’s benchmark, holding cash helped performance versus the benchmark, which has no cash position.
Detractors from performance
Security selection in real estate investments in Canada detracted from relative performance. An overweight position in Dream Office Real Estate Investment Trust held back relative results.
The fund’s allocation to real estate investments in Germany further weighed on relative performance. Within this country, there were no individual securities that were among the fund’s top relative detractors.
Elsewhere, the fund’s overweight positions in Washington Prime Group (h), Corporate Office Properties, Vornaldo Realty, Mapletree Logistics Trust (Singapore), Hang Lung Properties (Hong Kong), Kenedix Office Investment (Japan), Medical Properties Trust, Rexford Industrial Realty and Gramercy Property Trust were among the fund’s largest detractors from relative performance during the period.
Respectfully,
Richard Gable
Portfolio Manager
| (b) | Security is not a benchmark constituent. |
| (h) | Security was not held in the portfolio at period end. |
Note to Shareholders: Effective March 1, 2015, the fund changed its fiscal year-end from February 28 to August 31.
The views expressed in this report are those of the portfolio manager only through the end of the period of the report as stated on the cover and do not necessarily reflect the views of MFS or any other person in the MFS organization. These views are subject to change at any time based on market or other conditions, and MFS disclaims any responsibility to update such views. These views may not be relied upon as investment advice or an indication of trading intent on behalf of any MFS portfolio. References to specific securities are not recommendations of such securities, and may not be representative of any MFS portfolio’s current or future investments.
4
PERFORMANCE SUMMARY THROUGH 8/31/15
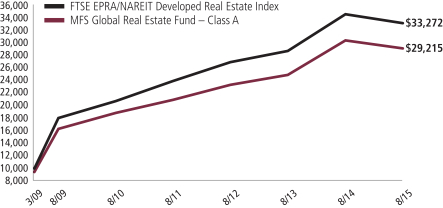
The following chart illustrates a representative class of the fund’s historical performance in comparison to its benchmark(s). Performance results include the deduction of the maximum applicable sales charge and reflect the percentage change in net asset value, including reinvestment of dividends and capital gains distributions. The performance of other share classes will be greater than or less than that of the class depicted below. Benchmarks are unmanaged and may not be invested in directly. Benchmark returns do not reflect sales charges, commissions or expenses. (See Notes to Performance Summary.)
Performance data shown represents past performance and is no guarantee of future results. Investment return and principal value fluctuate so your shares, when sold, may be worth more or less than the original cost; current performance may be lower or higher than quoted. The performance shown does not reflect the deduction of taxes, if any, that a shareholder would pay on fund distributions or the redemption of fund shares.
Growth of a Hypothetical $10,000 Investment (t)
5
Performance Summary – continued
Total Returns through 8/31/15
Average annual without sales charge
| | | | | | | | | | | | | | |
| | | Share Class | | Class Inception Date | | 6 month (a) | | 1-yr | | 5-yr | | Life (t) | | |
| | | A | | 3/11/09 | | (7.94)% | | (4.17)% | | 9.14% | | 19.09% | | |
| | | B | | 12/19/14 | | (8.31)% | | N/A | | N/A | | (4.83)% | | |
| | | C | | 12/19/14 | | (8.41)% | | N/A | | N/A | | (4.93)% | | |
| | | I | | 3/11/09 | | (7.93)% | | (3.99)% | | 9.39% | | 19.37% | | |
| | | R1 | | 12/19/14 | | (8.31)% | | N/A | | N/A | | (4.83)% | | |
| | | R2 | | 12/19/14 | | (8.15)% | | N/A | | N/A | | (4.57)% | | |
| | | R3 | | 12/19/14 | | (7.92)% | | N/A | | N/A | | (4.32)% | | |
| | | R4 | | 12/19/14 | | (7.87)% | | N/A | | N/A | | (4.18)% | | |
| | | R5 | | 7/02/12 | | (7.93)% | | (3.99)% | | N/A | | 8.70% | | |
| Comparative benchmark | | | | | | | | | | |
| | | FTSE EPRA/NAREIT Developed Real
Estate Index (f) | | (9.29)% | | (4.02)% | | 9.86% | | 20.39% | | |
| Average annual with sales charge | | | | | | | | | | |
| | | A
With initial Sales Charge (5.75%) | | (13.24)% | | (9.68)% | | 7.85% | | 18.00% | | |
| | | B
With CDSC (Declining over six years
from 4% to 0%) (v) | | (11.90)% | | N/A | | N/A | | (8.55)% | | |
| | | C
With CDSC (1% for 12 months) (v) | | (9.30)% | | N/A | | N/A | | (5.86)% | | |
| (a) | For the period March 1, 2015 through August 31, 2015. Effective March 1, 2015, the fund’s fiscal year-end was changed from February 28 to August 31. |
Class I, R1, R2, R3, R4, and R5 shares do not have a sales charge.
| (f) | Source: FactSet Research Systems Inc. |
| (t) | For the period from the class inception date through the stated period end. The comparative benchmark performance information provided for the “life” period is from the inception date of the Class A shares. (See Notes to Performance Summary.) |
Benchmark Definition
FTSE EPRA/NAREIT Developed Real Estate Index – measures the performance of eligible real estate equities worldwide that generate a majority of their revenue and income through the ownership, disposure and development of income-producing real estate.
It is not possible to invest directly in an index.
Notes to Performance Summary
Average annual total return represents the average annual change in value for each share class for the periods presented. Life returns are presented where the share class has less than 10 years of performance history and represent the average annual total
6
Performance Summary – continued
return from the class inception date to the stated period end date. As the fund’s share classes may have different inception dates, the life returns may represent different time periods and may not be comparable.
Performance results reflect any applicable expense subsidies and waivers in effect during the periods shown. Without such subsidies and waivers the fund’s performance results would be less favorable. Please see the prospectus and financial statements for complete details.
Performance results do not include adjustments made for financial reporting purposes in accordance with U.S. generally accepted accounting principles and may differ from amounts reported in the financial highlights.
From time to time the fund may receive proceeds from litigation settlements, without which performance would be lower.
7
EXPENSE TABLE
Fund expenses borne by the shareholders during the period, March 1, 2015 through August 31, 2015
As a shareholder of the fund, you incur two types of costs: (1) transaction costs, including sales charges (loads) on certain purchase or redemption payments, and (2) ongoing costs, including management fees; distribution and service (12b-1) fees; and other fund expenses. This example is intended to help you understand your ongoing costs (in dollars) of investing in the fund and to compare these costs with the ongoing costs of investing in other mutual funds.
The example is based on an investment of $1,000 invested at the beginning of the period and held for the entire period March 1, 2015 through August 31, 2015.
Actual Expenses
The first line for each share class in the following table provides information about actual account values and actual expenses. You may use the information in this line, together with the amount you invested, to estimate the expenses that you paid over the period. Simply divide your account value by $1,000 (for example, an $8,600 account value divided by $1,000 = 8.6), then multiply the result by the number in the first line under the heading entitled “Expenses Paid During Period” to estimate the expenses you paid on your account during this period.
Hypothetical Example for Comparison Purposes
The second line for each share class in the following table provides information about hypothetical account values and hypothetical expenses based on the fund’s actual expense ratio and an assumed rate of return of 5% per year before expenses, which is not the fund’s actual return. The hypothetical account values and expenses may not be used to estimate the actual ending account balance or expenses you paid for the period. You may use this information to compare the ongoing costs of investing in the fund and other funds. To do so, compare this 5% hypothetical example with the 5% hypothetical examples that appear in the shareholder reports of the other funds.
Please note that the expenses shown in the table are meant to highlight your ongoing costs only and do not reflect any transactional costs, such as sales charges (loads). Therefore, the second line for each share class in the table is useful in comparing ongoing costs only, and will not help you determine the relative total costs of owning different funds. In addition, if these transactional costs were included, your costs would have been higher.
8
Expense Table – continued
| | | | | | | | | | | | | | | | | | |
Share
Class | | | | Annualized Expense Ratio | | | Beginning Account Value 3/01/15 | | | Ending Account Value 8/31/15 | | | Expenses Paid During Period (p) 3/01/15-8/31/15 | |
| A | | Actual | | | 1.24% | | | | $1,000.00 | | | | $920.56 | | | | $6.00 | |
| | Hypothetical (h) | | | 1.24% | | | | $1,000.00 | | | | $1,018.95 | | | | $6.31 | |
| B | | Actual | | | 2.00% | | | | $1,000.00 | | | | $916.86 | | | | $9.66 | |
| | Hypothetical (h) | | | 2.00% | | | | $1,000.00 | | | | $1,015.12 | | | | $10.16 | |
| C | | Actual | | | 2.00% | | | | $1,000.00 | | | | $915.92 | | | | $9.66 | |
| | Hypothetical (h) | | | 2.00% | | | | $1,000.00 | | | | $1,015.12 | | | | $10.16 | |
| I | | Actual | | | 1.00% | | | | $1,000.00 | | | | $920.73 | | | | $4.84 | |
| | Hypothetical (h) | | | 1.00% | | | | $1,000.00 | | | | $1,020.16 | | | | $5.09 | |
| R1 | | Actual | | | 2.00% | | | | $1,000.00 | | | | $916.85 | | | | $9.66 | |
| | Hypothetical (h) | | | 2.00% | | | | $1,000.00 | | | | $1,015.12 | | | | $10.16 | |
| R2 | | Actual | | | 1.50% | | | | $1,000.00 | | | | $918.52 | | | | $7.25 | |
| | Hypothetical (h) | | | 1.50% | | | | $1,000.00 | | | | $1,017.64 | | | | $7.63 | |
| R3 | | Actual | | | 1.25% | | | | $1,000.00 | | | | $920.85 | | | | $6.05 | |
| | Hypothetical (h) | | | 1.25% | | | | $1,000.00 | | | | $1,018.90 | | | | $6.36 | |
| R4 | | Actual | | | 1.00% | | | | $1,000.00 | | | | $921.31 | | | | $4.84 | |
| | Hypothetical (h) | | | 1.00% | | | | $1,000.00 | | | | $1,020.16 | | | | $5.09 | |
| R5 | | Actual | | | 0.99% | | | | $1,000.00 | | | | $920.73 | | | | $4.79 | |
| | Hypothetical (h) | | | 0.99% | | | | $1,000.00 | | | | $1,020.21 | | | | $5.04 | |
| (h) | 5% class return per year before expenses. |
| (p) | “Expenses Paid During Period” are equal to each class’s annualized expense ratio, as shown above, multiplied by the average account value over the period, multiplied by 184/365 (to reflect the one-half year period). Expenses paid do not include any applicable sales charges (loads). If these transaction costs had been included, your costs would have been higher. |
Notes to Expense Table
Each class with a Rule 12b-1 service fee is subject to a rebate of a portion of such fee. Such rebates are included in the expense ratios above. For Class A shares, this rebate reduced the expense ratio above by 0.01%. See Note 3 in the Notes to Financial Statements for additional information.
9
PORTFOLIO OF INVESTMENTS
8/31/15
The Portfolio of Investments is a complete list of all securities owned by your fund. It is categorized by broad-based asset classes.
| | | | | | | | |
| Common Stocks - 97.8% | | | | | | | | |
| Issuer | | Shares/Par | | | Value ($) | |
| Medical & Health Technology & Services - 0.4% | | | | | | | | |
| Capital Senior Living Corp. (a) | | | 74,878 | | | $ | 1,560,458 | |
| | |
| Real Estate - 95.2% | | | | | | | | |
| Advance Residence Investment Corp., REIT | | | 2,498 | | | $ | 5,202,661 | |
| Alexandria Real Estate Equities, Inc., REIT | | | 96,338 | | | | 8,284,105 | |
| Ascendas India Trust, REIT | | | 16,659,200 | | | | 10,448,526 | |
| Atrium European Real Estate Ltd. | | | 1,750,969 | | | | 7,920,314 | |
| AvalonBay Communities, Inc., REIT | | | 87,573 | | | | 14,454,799 | |
| Big Yellow Group PLC, REIT | | | 977,190 | | | | 10,079,704 | |
| British Land Co. PLC, REIT | | | 355,779 | | | | 4,437,270 | |
| Care Capital Properties, Inc., REIT (a) | | | 47,744 | | | | 1,517,782 | |
| Corporate Office Properties Trust, REIT | | | 298,474 | | | | 6,276,908 | |
| Dream Office REIT | | | 602,060 | | | | 9,729,246 | |
| EastGroup Properties, Inc., REIT | | | 38,757 | | | | 2,092,878 | |
| Equity Lifestyle Properties, Inc., REIT | | | 234,330 | | | | 13,066,241 | |
| Federal Realty Investment Trust, REIT | | | 42,211 | | | | 5,448,596 | |
| Gramercy Property Trust, Inc., REIT | | | 237,798 | | | | 5,257,714 | |
| Grand City Properties S.A. | | | 110,128 | | | | 1,947,624 | |
| Hang Lung Properties Ltd. | | | 4,079,256 | | | | 9,211,164 | |
| Henderson Land Development Co. Ltd. | | | 1,429,035 | | | | 8,804,643 | |
| Hibernia PLC, REIT | | | 4,931,058 | | | | 7,331,741 | |
| Home Properties, Inc., REIT | | | 47,525 | | | | 3,526,830 | |
| InfraREIT, Inc. | | | 41,573 | | | | 1,171,527 | |
| Kenedix Office Investment Corp., REIT | | | 1,659 | | | | 7,416,819 | |
| Lar Espana Real Estate Socimi S.A., REIT | | | 1,063,411 | | | | 10,859,096 | |
| LEG Immobilien AG | | | 68,363 | | | | 5,130,604 | |
| Link REIT | | | 1,643,405 | | | | 8,715,292 | |
| LondonMetric Property PLC, REIT | | | 2,689,577 | | | | 6,664,553 | |
| Mapletree Logistics Trust, REIT | | | 10,347,200 | | | | 7,186,319 | |
| Medical Properties Trust, Inc., REIT | | | 762,355 | | | | 8,896,683 | |
| Mid-America Apartment Communities, Inc., REIT | | | 176,899 | | | | 13,902,492 | |
| Mitsubishi Estate Co. Ltd. | | | 733,135 | | | | 15,777,203 | |
| Mitsui Fudosan Co. Ltd. | | | 542,274 | | | | 15,028,999 | |
| National Health Investors, Inc., REIT | | | 99,665 | | | | 5,491,542 | |
| NTT Urban Development Corp. | | | 387,000 | | | | 3,616,703 | |
| Plum Creek Timber Co. Inc., REIT | | | 317,790 | | | | 12,231,737 | |
| Prologis Property Mexico S.A. de C.V., REIT | | | 1,330,971 | | | | 2,074,396 | |
| Public Storage, Inc., REIT | | | 100,214 | | | | 20,170,072 | |
| Quintain Estates & Development PLC (a) | | | 4,323,676 | | | | 8,606,522 | |
10
Portfolio of Investments – continued
| | | | | | | | |
| Issuer | | Shares/Par | | | Value ($) | |
| Common Stocks - continued | | | | | | | | |
| Real Estate - continued | | | | | | | | |
| Rexford Industrial Realty, Inc., REIT | | | 692,051 | | | $ | 8,941,299 | |
| Shaftesbury PLC, REIT | | | 346,045 | | | | 4,759,470 | |
| Simon Property Group, Inc., REIT | | | 133,534 | | | | 23,945,317 | |
| Sino Land Co. Ltd. | | | 4,938,000 | | | | 7,340,051 | |
| Starwood Property Trust, Inc., REIT | | | 323,849 | | | | 6,891,507 | |
| Starwood Waypoint Residential Trust, REIT | | | 237,225 | | | | 5,714,750 | |
| Tanger Factory Outlet Centers, Inc., REIT | | | 302,527 | | | | 9,571,954 | |
| Unibail-Rodamco, REIT | | | 49,105 | | | | 12,742,616 | |
| Urban Edge Properties, REIT | | | 215,217 | | | | 4,500,187 | |
| Ventas, Inc., REIT | | | 190,976 | | | | 10,507,500 | |
| Vornado Realty Trust, REIT | | | 151,215 | | | | 13,184,436 | |
| Westfield Corp., REIT | | | 1,685,046 | | | | 11,691,840 | |
| Weyerhaeuser Co., REIT | | | 183,695 | | | | 5,132,438 | |
| WP GLIMCHER, Inc., REIT | | | 917,326 | | | | 11,108,818 | |
| | | | | | | | |
| | | | | | | $ | 424,011,488 | |
| Telecommunications - Wireless - 2.2% | | | | | | | | |
| American Tower Corp., REIT | | | 108,553 | | | $ | 10,007,501 | |
| Total Common Stocks (Identified Cost, $376,746,699) | | | | | | $ | 435,579,447 | |
| | |
| Money Market Funds - 2.0% | | | | | | | | |
MFS Institutional Money Market Portfolio, 0.11%,
at Cost and Net Asset Value (v) | | | 8,634,269 | | | $ | 8,634,269 | |
| Total Investments (Identified Cost, $385,380,968) | | | | | | $ | 444,213,716 | |
| | |
| Other Assets, Less Liabilities - 0.2% | | | | | | | 983,472 | |
| Net Assets - 100.0% | | | | | | $ | 445,197,188 | |
| (a) | Non-income producing security. |
| (v) | Underlying affiliated fund that is available only to investment companies managed by MFS. The rate quoted for the MFS Institutional Money Market Portfolio is the annualized seven-day yield of the fund at period end. |
The following abbreviations are used in this report and are defined:
| PLC | | Public Limited Company |
| REIT | | Real Estate Investment Trust |
See Notes to Financial Statements
11
Financial Statements
STATEMENT OF ASSETS AND LIABILITIES
At 8/31/15
This statement represents your fund’s balance sheet, which details the assets and liabilities comprising the total value of the fund.
| | | | |
| Assets | | | | |
Investments | | | | |
Non-affiliated issuers, at value (identified cost, $376,746,699) | | | $435,579,447 | |
Underlying affiliated funds, at cost and value | | | 8,634,269 | |
Total investments, at value (identified cost, $385,380,968) | | | $444,213,716 | |
Foreign currency, at value (identified cost, $330,130) | | | 325,104 | |
Receivables for | | | | |
Fund shares sold | | | 437,612 | |
Interest and dividends | | | 457,511 | |
Other assets | | | 652 | |
Total assets | | | $445,434,595 | |
| Liabilities | | | | |
Payable for fund shares reacquired | | | $89,967 | |
Payable to affiliates | | | | |
Investment adviser | | | 46,506 | |
Shareholder servicing costs | | | 212 | |
Distribution and service fees | | | 247 | |
Payable for independent Trustees’ compensation | | | 7 | |
Accrued expenses and other liabilities | | | 100,468 | |
Total liabilities | | | $237,407 | |
Net assets | | | $445,197,188 | |
| Net assets consist of | | | | |
Paid-in capital | | | $376,715,640 | |
Unrealized appreciation (depreciation) on investments and translation of assets and liabilities in foreign currencies | | | 58,826,116 | |
Accumulated net realized gain (loss) on investments and foreign currency | | | 7,661,809 | |
Undistributed net investment income | | | 1,993,623 | |
Net assets | | | $445,197,188 | |
Shares of beneficial interest outstanding | | | 30,026,908 | |
12
Statement of Assets and Liabilities – continued
| | | | | | | | | | | | |
| | | Net assets | | | Shares
outstanding | | | Net asset value
per share (a) | |
Class A | | | $3,528,648 | | | | 237,851 | | | | $14.84 | |
Class B | | | 675,770 | | | | 72,681 | | | | 9.30 | |
Class C | | | 835,933 | | | | 89,940 | | | | 9.29 | |
Class I | | | 1,248,252 | | | | 83,982 | | | | 14.86 | |
Class R1 | | | 105,160 | | | | 11,300 | | | | 9.31 | |
Class R2 | | | 95,460 | | | | 10,229 | | | | 9.33 | |
Class R3 | | | 95,628 | | | | 10,233 | | | | 9.35 | |
Class R4 | | | 95,795 | | | | 10,237 | | | | 9.36 | |
Class R5 | | | 438,516,542 | | | | 29,500,455 | | | | 14.86 | |
| (a) | Maximum offering price per share was equal to the net asset value per share for all share classes, except for Class A, for which the maximum offering price per share was $15.75 [100 / 94.25 x $14.84]. On sales of $50,000 or more, the maximum offering price of Class A shares is reduced. A contingent deferred sales charge may be imposed on redemptions of Class A, Class B, and Class C shares. Redemption price per share was equal to the net asset value per share for Classes I, R1, R2, R3, R4, and R5. |
See Notes to Financial Statements
13
Financial Statements
STATEMENTS OF OPERATIONS
These statements describe how much your fund earned in investment income and accrued in expenses. It also describes any gains and/or losses generated by fund operations.
| | | | | | | | |
| | | Period ended
8/31/15 (z) | | | Year ended
2/28/15 | |
| Net investment income | | | | | | | | |
Income | | | | | | | | |
Dividends | | | $7,343,717 | | | | $12,700,783 | |
Dividends from underlying affiliated funds | | | 4,668 | | | | 6,747 | |
Foreign taxes withheld | | | (281,083 | ) | | | (493,595 | ) |
Total investment income | | | $7,067,302 | | | | $12,213,935 | |
Expenses | | | | | | | | |
Management fee | | | $2,100,337 | | | | $3,937,308 | |
Distribution and service fees | | | 9,664 | | | | 2,041 | |
Shareholder servicing costs | | | 3,113 | | | | 987 | |
Administrative services fee | | | 41,135 | | | | 72,380 | |
Independent Trustees’ compensation | | | 4,960 | | | | 9,175 | |
Custodian fee | | | 48,726 | | | | 95,548 | |
Shareholder communications | | | 7,695 | | | | 3,973 | |
Audit and tax fees | | | 59,213 | | | | 56,284 | |
Legal fees | | | 1,821 | | | | 3,655 | |
Miscellaneous | | | 60,505 | | | | 154,500 | |
Total expenses | | | $2,337,169 | | | | $4,335,851 | |
Fees paid indirectly | | | — | | | | (2 | ) |
Reduction of expenses by investment adviser and distributor | | | (15,966 | ) | | | (23,543 | ) |
Net expenses | | | $2,321,203 | | | | $4,312,306 | |
Net investment income | | | $4,746,099 | | | | $7,901,629 | |
| Realized and unrealized gain (loss) on investments and foreign currency | | | | | | | | |
Realized gain (loss) (identified cost basis) | | | | | | | | |
Investments | | | $12,482,581 | | | | $21,250,663 | |
Foreign currency | | | (20,756 | ) | | | (51,697 | ) |
Net realized gain (loss) on investments and foreign currency | | | $12,461,825 | | | | $21,198,966 | |
Change in unrealized appreciation (depreciation) | | | | | | | | |
Investments | | | $(54,680,717 | ) | | | $36,734,354 | |
Translation of assets and liabilities in foreign currencies | | | 2,137 | | | | (13,764 | ) |
Net unrealized gain (loss) on investments and foreign currency translation | | | $(54,678,580 | ) | | | $36,720,590 | |
Net realized and unrealized gain (loss) on investments and foreign currency | | | $(42,216,755 | ) | | | $57,919,556 | |
Change in net assets from operations | | | $(37,470,656 | ) | | | $65,821,185 | |
| (z) | For the period March 1, 2015 through August 31, 2015. Effective March 1, 2015, the fund changed its fiscal year-end from February 28 to August 31. |
See Notes to Financial Statements
14
Financial Statements
STATEMENTS OF CHANGES IN NET ASSETS
These statements describe the increases and/or decreases in net assets resulting from operations, any distributions, and any shareholder transactions.
| | | | | | | | | | | | |
| | | Period ended 8/31/15 (z) | | | Years ended 2/28 | |
| | | | 2015 | | | 2014 | |
| Change in net assets | | | | | | | | | |
| From operations | | | | | | | | | | | | |
Net investment income | | | $4,746,099 | | | | $7,901,629 | | | | $6,884,190 | |
Net realized gain (loss) on investments and foreign currency | | | 12,461,825 | | | | 21,198,966 | | | | 14,021,829 | |
Net unrealized gain (loss) on investments and foreign currency translation | | | (54,678,580 | ) | | | 36,720,590 | | | | (3,062,027 | ) |
Change in net assets from operations | | | $(37,470,656 | ) | | | $65,821,185 | | | | $17,843,992 | |
| Distributions declared to shareholders | | | | | | | | | |
From net investment income | | | $(2,285,070 | ) | | | $(12,100,176 | ) | | | $(10,492,384 | ) |
From net realized gain on investments | | | (4,678,398 | ) | | | (6,782,166 | ) | | | (14,946,588 | ) |
Total distributions declared to shareholders | | | $(6,963,468 | ) | | | $(18,882,342 | ) | | | $(25,438,972 | ) |
Change in net assets from fund share transactions | | | $36,301,369 | | | | $(3,943,926 | ) | | | $114,634,367 | |
Total change in net assets | | | $(8,132,755 | ) | | | $42,994,917 | | | | $107,039,387 | |
| Net assets | | | | | | | | | | | | |
At beginning of period | | | 453,329,943 | | | | 410,335,026 | | | | 303,295,639 | |
At end of period (including undistributed net investment income of $1,993,623, $2,284,891, and accumulated distributions in excess of net investment income of 794,228, respectively) | | | $445,197,188 | | | | $453,329,943 | | | | $410,335,026 | |
| (z) | For the period March 1, 2015 through August 31, 2015. Effective March 1, 2015, the fund changed its fiscal year-end from February 28 to August 31. |
See Notes to Financial Statements
15
Financial Statements
FINANCIAL HIGHLIGHTS
The financial highlights table is intended to help you understand the fund’s financial performance for the past 5 years (or life of a particular share class, if shorter). Certain information reflects financial results for a single fund share. The total returns in the table represent the rate by which an investor would have earned (or lost) on an investment in the fund share class (assuming reinvestment of all distributions) held for the entire period.
| | | | | | | | | | | | | | | | | | | | | | | | |
| | | Period
ended 8/31/15 (z) | | | Years ended 2/28, 2/29 | |
| Class A | | | 2015 | | | 2014 | | | 2013 | | | 2012 | | | 2011 | |
Net asset value, beginning of period | | | $16.36 | | | | $14.72 | | | | $15.12 | | | | $13.51 | | | | $14.57 | | | | $14.02 | |
| Income (loss) from investment operations | |
Net investment income (d) | | | $0.13 | | | | $0.22 | | | | $0.26 | | | | $0.26 | | | | $0.23 | | | | $0.49 | |
Net realized and unrealized gain (loss)
on investments and foreign currency | | | (1.41 | ) | | | 2.08 | | | | 0.33 | | | | 2.38 | | | | (0.55 | ) | | | 2.46 | |
Total from investment operations | | | $(1.28 | ) | | | $2.30 | | | | $0.59 | | | | $2.64 | | | | $(0.32 | ) | | | $2.95 | |
| Less distributions declared to shareholders | |
From net investment income | | | $(0.08 | ) | | | $(0.41 | ) | | | $(0.38 | ) | | | $(0.51 | ) | | | $(0.30 | ) | | | $(0.77 | ) |
From net realized gain on investments | | | (0.16 | ) | | | (0.25 | ) | | | (0.61 | ) | | | (0.52 | ) | | | (0.44 | ) | | | (1.63 | ) |
Total distributions declared to
shareholders | | | $(0.24 | ) | | | $(0.66 | ) | | | $(0.99 | ) | | | $(1.03 | ) | | | $(0.74 | ) | | | $(2.40 | ) |
Net asset value, end of period (x) | | | $14.84 | | | | $16.36 | | | | $14.72 | | | | $15.12 | | | | $13.51 | | | | $14.57 | |
Total return (%) (r)(s)(t)(x) | | | (7.94 | )(n) | | | 15.83 | | | | 4.24 | | | | 20.14 | | | | (1.81 | ) | | | 23.61 | |
Ratios (%) (to average net assets)
and Supplemental data: | |
Expenses before expense reductions (f) | | | 1.26 | (a) | | | 1.25 | | | | 1.22 | | | | 1.23 | | | | 1.24 | | | | 1.25 | |
Expenses after expense reductions (f) | | | 1.24 | (a) | | | 1.25 | | | | 1.22 | | | | 1.23 | | | | 1.24 | | | | 1.25 | |
Net investment income | | | 1.69 | (a) | | | 1.37 | | | | 1.74 | | | | 1.85 | | | | 1.74 | | | | 3.45 | |
Portfolio turnover | | | 14 | (n) | | | 37 | | | | 30 | | | | 46 | | | | 37 | | | | 33 | |
Net assets at end of period (000 omitted) | | | $3,529 | | | | $962 | | | | $291 | | | | $279 | | | | $232 | | | | $236 | |
See Notes to Financial Statements
16
Financial Highlights – continued
| | | | | | | | |
| Class B | | Period ended
8/31/15 (z) | | | Year ended
2/28/15 (i) | |
Net asset value, beginning of period | | | $10.38 | | | | $10.00 | |
| Income (loss) from investment operations | | | | | | | | |
Net investment income (d) | | | $0.05 | | | | $(0.00 | )(w) |
Net realized and unrealized gain (loss) on investments and foreign
currency | | | (0.90 | )(g) | | | 0.38 | (g) |
Total from investment operations | | | $(0.85 | ) | | | $0.38 | |
| Less distributions declared to shareholders | | | | | | | | |
From net investment income | | | $(0.07 | ) | | | $— | |
From net realized gain on investments | | | (0.16 | ) | | | — | |
Total distributions declared to shareholders | | | $(0.23 | ) | | | $— | |
Net asset value, end of period (x) | | | $9.30 | | | | $10.38 | |
Total return (%) (r)(s)(t)(x) | | | (8.31 | )(n) | | | 3.80 | (n) |
Ratios (%) (to average net assets)
and Supplemental data: | |
Expenses before expense reductions (f) | | | 2.01 | (a) | | | 2.07 | (a) |
Expenses after expense reductions (f) | | | 2.00 | (a) | | | 2.06 | (a) |
Net investment income (loss) | | | 0.97 | (a) | | | (0.14 | )(a) |
Portfolio turnover | | | 14 | (n) | | | 37 | |
Net assets at end of period (000 omitted) | | | $676 | | | | $317 | |
| | |
| Class C | | Period
ended
8/31/15 (z) | | | Year
ended
2/28/15 (i) | |
Net asset value, beginning of period | | | $10.38 | | | | $10.00 | |
| Income (loss) from investment operations | | | | | | | | |
Net investment income (d) | | | $0.04 | | | | $(0.00 | )(w) |
Net realized and unrealized gain (loss) on investments and foreign
currency | | | (0.90 | )(g) | | | 0.38 | (g) |
Total from investment operations | | | $(0.86 | ) | | | $0.38 | |
| Less distributions declared to shareholders | | | | | | | | |
From net investment income | | | $(0.07 | ) | | | $— | |
From net realized gain on investments | | | (0.16 | ) | | | — | |
Total distributions declared to shareholders | | | $(0.23 | ) | | | $— | |
Net asset value, end of period (x) | | | $9.29 | | | | $10.38 | |
Total return (%) (r)(s)(t)(x) | | | (8.41 | )(n) | | | 3.80 | (n) |
Ratios (%) (to average net assets)
and Supplemental data: | |
Expenses before expense reductions (f) | | | 2.01 | (a) | | | 2.07 | (a) |
Expenses after expense reductions (f) | | | 2.00 | (a) | | | 2.06 | (a) |
Net investment income (loss) | | | 0.89 | (a) | | | (0.10 | )(a) |
Portfolio turnover | | | 14 | (n) | | | 37 | |
Net assets at end of period (000 omitted) | | | $836 | | | | $330 | |
See Notes to Financial Statements
17
Financial Highlights – continued
| | | | | | | | | | | | | | | | | | | | | | | | |
| | | Period
ended 8/31/15 (z) | | | Years ended 2/28, 2/29 | |
| Class I | | | 2015 | | | 2014 | | | 2013 | | | 2012 | | | 2011 | |
Net asset value, beginning of period | | | $16.38 | | | | $14.73 | | | | $15.13 | | | | $13.52 | | | | $14.58 | | | | $14.03 | |
| Income (loss) from investment operations | |
Net investment income (d) | | | $0.16 | | | | $0.27 | | | | $0.30 | | | | $0.44 | | | | $0.27 | | | | $0.54 | |
Net realized and unrealized gain (loss)
on investments and foreign currency | | | (1.44 | ) | | | 2.08 | | | | 0.33 | | | | 2.23 | | | | (0.56 | ) | | | 2.45 | |
Total from investment operations | | | $(1.28 | ) | | | $2.35 | | | | $0.63 | | | | $2.67 | | | | $(0.29 | ) | | | $2.99 | |
| Less distributions declared to shareholders | |
From net investment income | | | $(0.08 | ) | | | $(0.45 | ) | | | $(0.42 | ) | | | $(0.54 | ) | | | $(0.33 | ) | | | $(0.81 | ) |
From net realized gain on investments | | | (0.16 | ) | | | (0.25 | ) | | | (0.61 | ) | | | (0.52 | ) | | | (0.44 | ) | | | (1.63 | ) |
Total distributions declared to
shareholders | | | $(0.24 | ) | | | $(0.70 | ) | | | $(1.03 | ) | | | $(1.06 | ) | | | $(0.77 | ) | | | $(2.44 | ) |
Net asset value, end of period (x) | | | $14.86 | | | | $16.38 | | | | $14.73 | | | | $15.13 | | | | $13.52 | | | | $14.58 | |
Total return (%) (r)(s)(x) | | | (7.93 | )(n) | | | 16.17 | | | | 4.50 | | | | 20.41 | | | | (1.54 | ) | | | 23.89 | |
Ratios (%) (to average net assets)
and Supplemental data: | |
Expenses before expense reductions (f) | | | 1.00 | (a) | | | 1.00 | | | | 0.97 | | | | 0.98 | | | | 0.99 | | | | 1.00 | |
Expenses after expense reductions (f) | | | 1.00 | (a) | | | 1.00 | | | | 0.97 | | | | 0.98 | | | | 0.99 | | | | 1.00 | |
Net investment income | | | 2.05 | (a) | | | 1.67 | | | | 1.99 | | | | 3.30 | | | | 1.98 | | | | 3.77 | |
Portfolio turnover | | | 14 | (n) | | | 37 | | | | 30 | | | | 46 | | | | 37 | | | | 33 | |
Net assets at end of period (000 omitted) | | | $1,248 | | | | $477 | | | | $122 | | | | $117 | | | | $242,520 | | | | $216,082 | |
See Notes to Financial Statements
18
Financial Highlights – continued
| | | | | | | | |
| Class R1 | | Period ended
8/31/15 (z) | | | Year ended 2/28/15 (i) | |
Net asset value, beginning of period | | | $10.38 | | | | $10.00 | |
| Income (loss) from investment operations | | | | | | | | |
Net investment income (d) | | | $0.05 | | | | $0.01 | |
Net realized and unrealized gain (loss) on investments and foreign
currency | | | (0.90 | )(g) | | | 0.37 | (g) |
Total from investment operations | | | $(0.85 | ) | | | $0.38 | |
| Less distributions declared to shareholders | | | | | | | | |
From net investment income | | | $(0.06 | ) | | | $— | |
From net realized gain on investments | | | (0.16 | ) | | | — | |
Total distributions declared to shareholders | | | $(0.22 | ) | | | $— | |
Net asset value, end of period (x) | | | $9.31 | | | | $10.38 | |
Total return (%) (r)(s)(x) | | | (8.31 | )(n) | | | 3.80 | |
Ratios (%) (to average net assets)
and Supplemental data: | |
Expenses before expense reductions (f) | | | 2.01 | (a) | | | 2.06 | (a) |
Expenses after expense reductions (f) | | | 2.00 | (a) | | | 2.06 | (a) |
Net investment income | | | 0.99 | (a) | | | 0.28 | (a) |
Portfolio turnover | | | 14 | (n) | | | 37 | |
Net assets at end of period (000 omitted) | | | $105 | | | | $104 | |
| | |
| Class R2 | | Period
ended
8/31/15 (z) | | | Year
ended
2/28/15 (i) | |
Net asset value, beginning of period | | | $10.39 | | | | $10.00 | |
| Income (loss) from investment operations | | | | | | | | |
Net investment income (d) | | | $0.08 | | | | $0.02 | |
Net realized and unrealized gain (loss) on investments and foreign
currency | | | (0.91 | )(g) | | | 0.37 | (g) |
Total from investment operations | | | $(0.83 | ) | | | $0.39 | |
| Less distributions declared to shareholders | | | | | | | | |
From net investment income | | | $(0.07 | ) | | | $— | |
From net realized gain on investments | | | (0.16 | ) | | | — | |
Total distributions declared to shareholders | | | $(0.23 | ) | | | $— | |
Net asset value, end of period (x) | | | $9.33 | | | | $10.39 | |
Total return (%) (r)(s)(x) | | | (8.15 | )(n) | | | 3.90 | (n) |
Ratios (%) (to average net assets)
and Supplemental data: | |
Expenses before expense reductions (f) | | | 1.51 | (a) | | | 1.56 | (a) |
Expenses after expense reductions (f) | | | 1.50 | (a) | | | 1.56 | (a) |
Net investment income | | | 1.53 | (a) | | | 0.78 | (a) |
Portfolio turnover | | | 14 | (n) | | | 37 | |
Net assets at end of period (000 omitted) | | | $95 | | | | $104 | |
See Notes to Financial Statements
19
Financial Highlights – continued
| | | | | | | | |
| Class R3 | | Period
ended
8/31/15 (z) | | | Year
ended
2/28/15 (i) | |
Net asset value, beginning of period | | | $10.39 | | | | $10.00 | |
| Income (loss) from investment operations | | | | | | | | |
Net investment income (d) | | | $0.09 | | | | $0.02 | |
Net realized and unrealized gain (loss) on investments and foreign
currency | | | (0.90 | )(g) | | | 0.37 | (g) |
Total from investment operations | | | $(0.81 | ) | | | $0.39 | |
| Less distributions declared to shareholders | | | | | | | | |
From net investment income | | | $(0.07 | ) | | | $— | |
From net realized gain on investments | | | (0.16 | ) | | | — | |
Total distributions declared to shareholders | | | $(0.23 | ) | | | $— | |
Net asset value, end of period (x) | | | $9.35 | | | | $10.39 | |
Total return (%) (r)(s)(x) | | | (7.92 | )(n) | | | 3.90 | (n) |
Ratios (%) (to average net assets)
and Supplemental data: | |
Expenses before expense reductions (f) | | | 1.26 | (a) | | | 1.31 | (a) |
Expenses after expense reductions (f) | | | 1.25 | (a) | | | 1.31 | (a) |
Net investment income | | | 1.78 | (a) | | | 1.03 | (a) |
Portfolio turnover | | | 14 | (n) | | | 37 | |
Net assets at end of period (000 omitted) | | | $96 | | | | $104 | |
| | |
| Class R4 | | Period
ended
8/31/15 (z) | | | Year
ended
2/28/15 (i) | |
Net asset value, beginning of period | | | $10.40 | | | | $10.00 | |
| Income (loss) from investment operations | | | | | | | | |
Net investment income (d) | | | $0.10 | | | | $0.03 | |
Net realized and unrealized gain (loss) on investments and foreign
currency | | | (0.90 | )(g) | | | 0.37 | (g) |
Total from investment operations | | | $(0.80 | ) | | | $0.40 | |
| Less distributions declared to shareholders | | | | | | | | |
From net investment income | | | $(0.08 | ) | | | $— | |
From net realized gain on investments | | | (0.16 | ) | | | — | |
Total distributions declared to shareholders | | | $(0.24 | ) | | | $— | |
Net asset value, end of period (x) | | | $9.36 | | | | $10.40 | |
Total return (%) (r)(s)(x) | | | (7.87 | )(n) | | | 4.00 | (n) |
Ratios (%) (to average net assets)
and Supplemental data: | |
Expenses before expense reductions (f) | | | 1.01 | (a) | | | 1.06 | (a) |
Expenses after expense reductions (f) | | | 1.00 | (a) | | | 1.06 | (a) |
Net investment income | | | 2.03 | (a) | | | 1.28 | (a) |
Portfolio turnover | | | 14 | (n) | | | 37 | |
Net assets at end of period (000 omitted) | | | $96 | | | | $104 | |
See Notes to Financial Statements
20
Financial Highlights – continued
| | | | | | | | | | | | | | | | |
| | | Period
ended 8/31/15 (z) | | | Years ended 2/28 | |
| Class R5 | | | 2015 | | | 2014 | | | 2013 (i) | |
Net asset value, beginning of period | | | $16.38 | | | | $14.73 | | | | $15.13 | | | | $13.74 | |
| Income (loss) from investment operations | |
Net investment income (d) | | | $0.16 | | | | $0.29 | | | | $0.29 | | | | $0.14 | |
Net realized and unrealized gain (loss) on
investments and foreign currency | | | (1.44 | ) | | | 2.06 | | | | 0.34 | | | | 2.10 | |
Total from investment operations | | | $(1.28 | ) | | | $2.35 | | | | $0.63 | | | | $2.24 | |
| Less distributions declared to shareholders | |
From net investment income | | | $(0.08 | ) | | | $(0.45 | ) | | | $(0.42 | ) | | | $(0.50 | ) |
From net realized gain on investments | | | (0.16 | ) | | | (0.25 | ) | | | (0.61 | ) | | | (0.35 | ) |
Total distributions declared to shareholders | | | $(0.24 | ) | | | $(0.70 | ) | | | $(1.03 | ) | | | $(0.85 | ) |
Net asset value, end of period (x) | | | $14.86 | | | | $16.38 | | | | $14.73 | | | | $15.13 | |
Total return (%) (r)(s)(x) | | | (7.93 | )(n) | | | 16.17 | | | | 4.50 | | | | 16.56 | (n) |
Ratios (%) (to average net assets)
and Supplemental data: | |
Expenses before expense reductions (f) | | | 1.00 | (a) | | | 0.99 | | | | 0.97 | | | | 0.98 | (a) |
Expenses after expense reductions (f) | | | 0.99 | (a) | | | 0.99 | | | | 0.97 | | | | 0.98 | (a) |
Net investment income | | | 2.04 | (a) | | | 1.81 | | | | 1.94 | | | | 1.48 | (a) |
Portfolio turnover | | | 14 | (n) | | | 37 | | | | 30 | | | | 46 | |
Net assets at end of period (000 omitted) | | | $438,517 | | | | $450,828 | | | | $409,923 | | | | $302,900 | |
| (d) | Per share data is based on average shares outstanding. |
| (f) | Ratios do not reflect reductions from fees paid indirectly, if applicable. |
| (g) | The per share amount varies from the net realized and unrealized gain/loss for the period because of the timing of sales of fund shares and the per share amount of realized and unrealized gains and losses at such time. |
| (i) | For the period from the class inception, July 2, 2012 (Class R5) and December 19, 2014 (Class B, Class C, Class R1, Class R2, Class R3, and Class R4), through the stated period end. |
| (r) | Certain expenses have been reduced without which performance would have been lower. |
| (s) | From time to time the fund may receive proceeds from litigation settlements, without which performance would be lower. |
| (t) | Total returns do not include any applicable sales charges. |
| (w) | Per share amount was less than $0.01. |
| (x) | The net asset values and total returns have been calculated on net assets which include adjustments made in accordance with U.S. generally accepted accounting principles required at period end for financial reporting purposes. |
| (z) | For the period March 1, 2015 through August 31, 2015. Effective March 1, 2015, the fund changed its fiscal year-end from February 28 to August 31. |
See Notes to Financial Statements
21
NOTES TO FINANCIAL STATEMENTS
(1) Business and Organization
MFS Global Real Estate Fund (the fund) is a diversified series of MFS Series Trust XIII (the trust). The trust is organized as a Massachusetts business trust and is registered under the Investment Company Act of 1940, as amended, as an open-end management investment company.
Effective March 1, 2015, the fund changed its year-end from February 28 to August 31, and financial statements are thus being presented for the period March 1, 2015 through August 31, 2015. References hereinafter to the period ended August 31, 2015 are to the six-month period commencing on March 1, 2015.
The fund is an investment company and accordingly follows the investment company accounting and reporting guidance of the Financial Accounting Standards Board (FASB) Accounting Standards Codification Topic 946 Financial Services – Investment Companies.
(2) Significant Accounting Policies
General – The preparation of financial statements in conformity with U.S. generally accepted accounting principles requires management to make estimates and assumptions that affect the reported amounts of assets and liabilities, and disclosure of contingent assets and liabilities at the date of the financial statements and the reported amounts of increases and decreases in net assets from operations during the reporting period. Actual results could differ from those estimates. In the preparation of these financial statements, management has evaluated subsequent events occurring after the date of the fund’s Statement of Assets and Liabilities through the date that the financial statements were issued. The fund invests a significant amount of its net assets in U.S. and foreign real estate related investments and as a result is subject to certain risks associated with the direct ownership of real estate and the real estate industry in general. These include risks related to general, regional and local economic conditions; fluctuations in interest rates; property tax rates, zoning laws, environmental regulations and other governmental action; cash flow dependency; increased operating expenses; lack of availability of mortgage funds; losses due to natural disasters; changes in property values and rental rates; and other factors. The fund invests in foreign securities. Investments in foreign securities are vulnerable to the effects of changes in the relative values of the local currency and the U.S. dollar and to the effects of changes in each country’s legal, political, and economic environment.
In June 2014, FASB issued Accounting Standards Update 2014-11, Transfers and Servicing (Topic 860) – Repurchase-to-Maturity Transactions, Repurchase Financings, and Disclosures (“ASU 2014-11”). ASU 2014-11 changes the accounting for repurchase-to-maturity transactions (i.e., repurchase agreements that settle at the same time as the maturity of the transferred financial asset) and enhances the required disclosures for repurchase agreements and other similar transactions. Although still evaluating the potential impacts of ASU 2014-11 to the fund, management expects that the impact of the fund’s adoption will be limited to additional financial statement disclosures which would first be effective for interim reporting periods beginning after March 15, 2015.
22
Notes to Financial Statements – continued
Balance Sheet Offsetting – The fund’s accounting policy with respect to balance sheet offsetting is that, absent an event of default by the counterparty or a termination of the agreement, the International Swaps and Derivatives Association (ISDA) Master Agreement does not result in an offset of reported amounts of financial assets and financial liabilities in the Statement of Assets and Liabilities across transactions between the fund and the applicable counterparty. The fund’s right to setoff may be restricted or prohibited by the bankruptcy or insolvency laws of the particular jurisdiction to which a specific master netting agreement counterparty is subject. Balance sheet offsetting disclosures, to the extent applicable to the fund, have been included in the fund’s Significant Accounting Policies note under the captions for each of the fund’s in-scope financial instruments and transactions.
Investment Valuations – Equity securities, including restricted equity securities, are generally valued at the last sale or official closing price as provided by a third-party pricing service on the market or exchange on which they are primarily traded. Equity securities, for which there were no sales reported that day, are generally valued at the last quoted daily bid quotation as provided by a third-party pricing service on the market or exchange on which such securities are primarily traded. Short-term instruments with a maturity at issuance of 60 days or less may be valued at amortized cost, which approximates market value. Open-end investment companies are generally valued at net asset value per share. Securities and other assets generally valued on the basis of information from a third-party pricing service may also be valued at a broker/dealer bid quotation. Values obtained from third-party pricing services can utilize both transaction data and market information such as yield, quality, coupon rate, maturity, type of issue, trading characteristics, and other market data. The values of foreign securities and other assets and liabilities expressed in foreign currencies are converted to U.S. dollars using the mean of bid and asked prices for rates provided by a third-party pricing service.
The Board of Trustees has delegated primary responsibility for determining or causing to be determined the value of the fund’s investments (including any fair valuation) to the adviser pursuant to valuation policies and procedures approved by the Board. If the adviser determines that reliable market quotations are not readily available, investments are valued at fair value as determined in good faith by the adviser in accordance with such procedures under the oversight of the Board of Trustees. Under the fund’s valuation policies and procedures, market quotations are not considered to be readily available for most types of debt instruments and floating rate loans and many types of derivatives. These investments are generally valued at fair value based on information from third-party pricing services. In addition, investments may be valued at fair value if the adviser determines that an investment’s value has been materially affected by events occurring after the close of the exchange or market on which the investment is principally traded (such as foreign exchange or market) and prior to the determination of the fund’s net asset value, or after the halting of trading of a specific security where trading does not resume prior to the close of the exchange or market on which the security is principally traded. Events that occur on a frequent basis after foreign markets close (such as developments in foreign markets and significant movements in the U.S. markets) and prior to the determination of the fund’s net asset value may be deemed to have a material effect on the value of securities traded in foreign markets.
23
Notes to Financial Statements – continued
Accordingly, the fund’s foreign equity securities may often be valued at fair value. The adviser generally relies on third-party pricing services or other information (such as the correlation with price movements of similar securities in the same or other markets; the type, cost and investment characteristics of the security; the business and financial condition of the issuer; and trading and other market data) to assist in determining whether to fair value and at what value to fair value an investment. The value of an investment for purposes of calculating the fund’s net asset value can differ depending on the source and method used to determine value. When fair valuation is used, the value of an investment used to determine the fund’s net asset value may differ from quoted or published prices for the same investment. There can be no assurance that the fund could obtain the fair value assigned to an investment if it were to sell the investment at the same time at which the fund determines its net asset value per share.
Various inputs are used in determining the value of the fund’s assets or liabilities. These inputs are categorized into three broad levels. In certain cases, the inputs used to measure fair value may fall into different levels of the fair value hierarchy. In such cases, an investment’s level within the fair value hierarchy is based on the lowest level of input that is significant to the fair value measurement. The fund’s assessment of the significance of a particular input to the fair value measurement in its entirety requires judgment, and considers factors specific to the investment. Level 1 includes unadjusted quoted prices in active markets for identical assets or liabilities. Level 2 includes other significant observable market-based inputs (including quoted prices for similar securities, interest rates, prepayment speed, and credit risk). Level 3 includes unobservable inputs, which may include the adviser’s own assumptions in determining the fair value of investments. The following is a summary of the levels used as of August 31, 2015 in valuing the fund’s assets or liabilities:
| | | | | | | | | | | | | | | | |
| Investments at Value | | Level 1 | | | Level 2 | | | Level 3 | | | Total | |
| Equity Securities: | | | | | | | | | | | | | | | | |
United States | | | $232,856,071 | | | | $— | | | | $— | | | | $232,856,071 | |
Japan | | | 47,042,385 | | | | — | | | | — | | | | 47,042,385 | |
United Kingdom | | | — | | | | 34,547,519 | | | | — | | | | 34,547,519 | |
Hong Kong | | | 34,071,150 | | | | — | | | | — | | | | 34,071,150 | |
Singapore | | | 17,634,845 | | | | — | | | | — | | | | 17,634,845 | |
France | | | 12,742,616 | | | | — | | | | — | | | | 12,742,616 | |
Australia | | | 11,691,840 | | | | — | | | | — | | | | 11,691,840 | |
Spain | | | 10,859,096 | | | | — | | | | — | | | | 10,859,096 | |
Canada | | | 9,729,246 | | | | — | | | | — | | | | 9,729,246 | |
Other Countries | | | 24,404,679 | | | | — | | | | — | | | | 24,404,679 | |
| Mutual Funds | | | 8,634,269 | | | | — | | | | — | | | | 8,634,269 | |
| Total Investments | | | $409,666,197 | | | | $34,547,519 | | | | $— | | | | $444,213,716 | |
For further information regarding security characteristics, see the Portfolio of Investments.
Of the level 2 investments presented above, equity investments amounting to $29,788,048 would have been considered level 1 investments at the beginning of the period. The primary reason for changes in the classifications between levels 1 and 2 occurs when foreign equity securities are fair valued using other observable market-based inputs in place of the closing exchange price due to events occurring
24
Notes to Financial Statements – continued
after the close of the exchange or market on which the investment is principally traded. The fund’s foreign equity securities may often be valued at fair value. The fund’s policy is to recognize transfers between the levels as of the end of the period.
Foreign Currency Translation – Purchases and sales of foreign investments, income, and expenses are converted into U.S. dollars based upon currency exchange rates prevailing on the respective dates of such transactions or on the reporting date for foreign denominated receivables and payables. Gains and losses attributable to foreign currency exchange rates on sales of securities are recorded for financial statement purposes as net realized gains and losses on investments. Gains and losses attributable to foreign exchange rate movements on receivables, payables, income and expenses are recorded for financial statement purposes as foreign currency transaction gains and losses. That portion of both realized and unrealized gains and losses on investments that results from fluctuations in foreign currency exchange rates is not separately disclosed.
Indemnifications – Under the fund’s organizational documents, its officers and Trustees may be indemnified against certain liabilities and expenses arising out of the performance of their duties to the fund. Additionally, in the normal course of business, the fund enters into agreements with service providers that may contain indemnification clauses. The fund’s maximum exposure under these agreements is unknown as this would involve future claims that may be made against the fund that have not yet occurred.
Investment Transactions and Income – Investment transactions are recorded on the trade date. Dividends received in cash are recorded on the ex-dividend date. Certain dividends from foreign securities will be recorded when the fund is informed of the dividend if such information is obtained subsequent to the ex-dividend date. Dividend payments received in additional securities are recorded on the ex-dividend date in an amount equal to the value of the security on such date.
The fund may receive proceeds from litigation settlements. Any proceeds received from litigation involving portfolio holdings are reflected in the Statements of Operations in realized gain/loss if the security has been disposed of by the fund or in unrealized gain/loss if the security is still held by the fund. Any other proceeds from litigation not related to portfolio holdings are reflected as other income in the Statements of Operations.
Fees Paid Indirectly – The fund’s custody fee may be reduced by a credit earned under an arrangement that measures the value of U.S. dollars deposited with the custodian by the fund. For the period ended August 31, 2015, custody fees were not reduced. This amount, for the year ended February 28, 2015, is shown as a reduction of total expenses in the Statement of Operations.
Tax Matters and Distributions – The fund intends to qualify as a regulated investment company, as defined under Subchapter M of the Internal Revenue Code, and to distribute all of its taxable income, including realized capital gains. As a result, no provision for federal income tax is required. The fund’s federal tax returns, when filed, will remain subject to examination by the Internal Revenue Service for a three year period. Management has analyzed the fund’s tax positions taken on federal and state tax returns for all open tax years and does not believe that there are any uncertain
25
Notes to Financial Statements – continued
tax positions that require recognition of a tax liability. Foreign taxes, if any, have been accrued by the fund in the accompanying financial statements in accordance with the applicable foreign tax law. Foreign income taxes may be withheld by certain countries in which the fund invests. Additionally, capital gains realized by the fund on securities issued in or by certain foreign countries may be subject to capital gains tax imposed by those countries.
Distributions to shareholders are recorded on the ex-dividend date. Income and capital gain distributions are determined in accordance with income tax regulations, which may differ from U.S. generally accepted accounting principles. Certain capital accounts in the financial statements are periodically adjusted for permanent differences in order to reflect their tax character. These adjustments have no impact on net assets or net asset value per share. Temporary differences which arise from recognizing certain items of income, expense, gain or loss in different periods for financial statement and tax purposes will reverse at some time in the future. Distributions in excess of net investment income or net realized gains are temporary overdistributions for financial statement purposes resulting from differences in the recognition or classification of income or distributions for financial statement and tax purposes.
Book/tax differences primarily relate to passive foreign investment companies and wash sale loss deferrals.
The tax character of distributions declared to shareholders for the last three fiscal years is as follows:
| | | | | | | | | | | | |
| | | 8/31/15 (z) | | | 2/28/15 | | | 2/28/14 | |
Ordinary income (including any
short-term capital gains) | | | $5,235,941 | | | | $13,093,218 | | | | $14,724,587 | |
| Long-term capital gains | | | 1,727,527 | | | | 5,789,124 | | | | 10,714,385 | |
| Total distributions | | | $6,963,468 | | | | $18,882,342 | | | | $25,438,972 | |
| (z) | For the period March 1, 2015 through August 31, 2015. Effective March 1, 2015, the fund changed its fiscal year-end from February 28 to August 31. |
The federal tax cost and the tax basis components of distributable earnings were as follows:
| | | | |
| As of 8/31/15 | | | |
| Cost of investments | | | $390,012,141 | |
| Gross appreciation | | | 72,963,698 | |
| Gross depreciation | | | (18,762,123 | ) |
| Net unrealized appreciation (depreciation) | | | $54,201,575 | |
| Undistributed ordinary income | | | 2,229,313 | |
| Undistributed long-term capital gain | | | 12,057,292 | |
| Other temporary differences | | | (6,632 | ) |
Multiple Classes of Shares of Beneficial Interest – The fund offers multiple classes of shares, which differ in their respective distribution and service fees. The fund’s income, realized and unrealized gain (loss), and common expenses are allocated to shareholders based on the daily net assets of each class. Dividends are declared separately for each class. Differences in per share dividend rates are generally due to
26
Notes to Financial Statements – continued
differences in separate class expenses. Class B shares will convert to Class A shares approximately eight years after purchase. The fund’s distributions declared to shareholders as reported in the Statements of Changes in Net Assets are presented by class as follows:
| | | | | | | | | | | | | | | | | | | | | | | | |
| | | From net investment
income | | | From net realized gain on
investments | |
| | | Period
ended
8/31/15 (z) | | | Year
ended
2/28/15 | | | Year
ended
2/28/14 | | | Period
ended
8/31/15 (z) | | | Year
ended
2/28/15 | | | Year
ended
2/28/14 | |
| Class A | | | $15,740 | | | | $8,135 | | | | $7,140 | | | | $32,744 | | | | $4,989 | | | | $11,513 | |
| Class B | | | 5,341 | | | | — | | | | — | | | | 11,647 | | | | — | | | | — | |
| Class C | | | 6,257 | | | | — | | | | — | | | | 13,535 | | | | — | | | | — | |
| Class I | | | 8,130 | | | | 3,728 | | | | 3,280 | | | | 16,642 | | | | 2,090 | | | | 4,811 | |
| Class R1 | | | 681 | | | | — | | | | — | | | | 1,740 | | | | — | | | | — | |
| Class R2 | | | 684 | | | | — | | | | — | | | | 1,576 | | | | — | | | | — | |
| Class R3 | | | 726 | | | | — | | | | — | | | | 1,576 | | | | — | | | | — | |
| Class R4 | | | 768 | | | | — | | | | — | | | | 1,576 | | | | — | | | | — | |
| Class R5 | | | 2,246,743 | | | | 12,088,313 | | | | 10,481,964 | | | | 4,597,362 | | | | 6,775,087 | | | | 14,930,264 | |
| Total | | | $2,285,070 | | | | $12,100,176 | | | | $10,492,384 | | | | $4,678,398 | | | | $6,782,166 | | | | $14,946,588 | |
| (z) | For the period March 1, 2015 through August 31, 2015. Effective March 1, 2015, the fund changed its fiscal year-end from February 28 to August 31. |
(3) Transactions with Affiliates
Investment Adviser – The fund has an investment advisory agreement with MFS to provide overall investment management and related administrative services and facilities to the fund. The management fee is computed daily and paid monthly at the following annual rates:
| | | | |
| First $1 billion of average daily net assets | | | 0.90 | % |
| Next $1.5 billion of average daily net assets | | | 0.75 | % |
| Average daily net assets in excess of $2.5 billion | | | 0.65 | % |
MFS has agreed in writing to reduce its management fee by a specified amount if certain MFS mutual fund assets exceed thresholds agreed to by MFS and the fund’s Board of Trustees. For the period ended August 31, 2015 and year ended February 28, 2015 these management fee reductions amounted to $15,853 and $22,951, respectively, which is included in the reduction of total expenses in the Statements of Operations. The management fee incurred for the period ended August 31, 2015 and the year ended February 28, 2015 was equivalent to an annual effective rate of 0.89% of the fund’s average daily net assets.
Distributor – MFS Fund Distributors, Inc. (MFD), a wholly-owned subsidiary of MFS, as distributor, received $10,883 and $1,454 for the period ended August 31, 2015, and year ended February 28, 2015, respectively, as its portion of the initial sales charge on sales of Class A shares of the fund.
The Board of Trustees has adopted a distribution plan for certain share classes pursuant to Rule 12b-1 of the Investment Company Act of 1940.
The fund’s distribution plan provides that the fund will pay MFD for services provided by MFD and financial intermediaries in connection with the distribution and servicing of
27
Notes to Financial Statements – continued
certain share classes. One component of the plan is a distribution fee paid to MFD and another component of the plan is a service fee paid to MFD. MFD may subsequently pay all, or a portion, of the distribution and/or service fees to financial intermediaries.
Distribution Plan Fee Table:
| | | | | | | | | | | | | | | | | | | | | | | | | | | | |
| | | Distribution Fee Rate (d) | | | Service Fee Rate (d) | | | Total Distribution Plan (d) | | | Period ended
8/31/15 (z) Annual Effective Rate (e) | | | Year ended
2/28/15 Annual Effective Rate (e) | | | Period ended
8/31/15 (z)
Distribution and Service Fee | | | Year ended
2/28/15
Distribution and Service Fee | |
| Class A | | | — | | | | 0.25% | | | | 0.25% | | | | 0.24% | | | | 0.25% | | | | $2,921 | | | | $910 | |
| Class B | | | 0.75% | | | | 0.25% | | | | 1.00% | | | | 1.00% | | | | 1.00% | | | | 2,741 | | | | 383 | |
| Class C | | | 0.75% | | | | 0.25% | | | | 1.00% | | | | 1.00% | | | | 1.00% | | | | 3,090 | | | | 391 | |
| Class R1 | | | 0.75% | | | | 0.25% | | | | 1.00% | | | | 1.00% | | | | 1.00% | | | | 528 | | | | 204 | |
| Class R2 | | | 0.25% | | | | 0.25% | | | | 0.50% | | | | 0.50% | | | | 0.50% | | | | 256 | | | | 102 | |
| Class R3 | | | — | | | | 0.25% | | | | 0.25% | | | | 0.25% | | | | 0.25% | | | | 128 | | | | 51 | |
| Total Distribution and Service Fees | | | | | | | | | | | | $9,664 | | | | $2,041 | |
| (d) | In accordance with the distribution plan for certain classes, the fund pays distribution and/or service fees equal to these annual percentage rates of each class’s average daily net assets. The distribution and service fee rates disclosed by class represent the current rates in effect at the end of the reporting period. Any rate changes, if applicable, are detailed below. |
| (e) | The annual effective rates represent actual fees incurred under the distribution plan for the period ended August 31, 2015 and year ended February 28, 2015 based on each class’s average daily net assets. MFD has voluntarily agreed to rebate a portion of each class’s 0.25% service fee attributable to accounts for which MFD retains the 0.25% service fee except for accounts attributable to MFS or its affiliates’ seed money. For the period ended August 31, 2015 and year ended February 28, 2105 this rebate amounted to $113 and $5, respectively, for Class A and is included in the reduction of total expenses in the Statements of Operations. |
| (z) | For the period March 1, 2015 through August 31, 2015. Effective March 1, 2015, the fund changed its fiscal year-end from February 28 to August 31. |
Certain Class A shares are subject to a contingent deferred sales charge (CDSC) in the event of a shareholder redemption within 18 months of purchase. Class C shares are subject to a CDSC in the event of a shareholder redemption within 12 months of purchase. Class B shares are subject to a CDSC in the event of a shareholder redemption within six years of purchase. All contingent deferred sales charges are paid to MFD and during the period ended August 31, 2015 and year ended February 28, 2015, were as follows:
| | | | | | | | |
| | | Period ended
8/31/15 (z) | | | Year ended
2/28/15 | |
| Class B | | | $14 | | | | $— | |
| Class C | | | 89 | | | | — | |
| (z) | For the period March 1, 2015 through August 31, 2015. Effective March 1, 2015, the fund changed its fiscal year-end from February 28 to August 31. |
Shareholder Servicing Agent – MFS Service Center, Inc. (MFSC), a wholly-owned subsidiary of MFS, receives a fee from the fund for its services as shareholder servicing agent calculated as a percentage of the average daily net assets of the fund as determined periodically under the supervision of the fund’s Board of Trustees. For the
28
Notes to Financial Statements – continued
period ended August 31, 2015 and year ended February 28, 2015, the fees were $1,396 and $536, respectively, which equated to 0.0006% and 0.0001%, respectively, annually of the fund’s average daily net assets. MFSC also receives payment from the fund for out-of-pocket expenses, sub-accounting and other shareholder servicing costs which may be paid to affiliated and unaffiliated service providers. Class R5 shares do not incur sub-accounting fees. For the period ended August 31, 2015 and year ended February 28, 2015, out-of-pocket expenses, sub-accounting and other shareholder servicing costs amounted to $1,717 and $451, respectively.
Administrator – MFS provides certain financial, legal, shareholder communications, compliance, and other administrative services to the fund. Under an administrative services agreement, the fund reimburses MFS the costs incurred to provide these services. The fund is charged an annual fixed amount of $17,500 plus a fee based on average daily net assets. The administrative services fee incurred for the period ended August 31, 2015 and year ended February 28, 2015 were equivalent to an annual effective rate of 0.0176% and 0.0165%, respectively, of the fund’s average daily net assets.
Trustees’ and Officers’ Compensation – The fund pays compensation to independent Trustees in the form of a retainer, attendance fees, and additional compensation to Board and Committee chairpersons. The fund does not pay compensation directly to Trustees or officers of the fund who are also officers of the investment adviser, all of whom receive remuneration for their services to the fund from MFS. Certain officers and Trustees of the fund are officers or directors of MFS, MFD, and MFSC.
Other – Effective November 1, 2014, this fund and certain other funds managed by MFS (the funds) have entered into a service agreement (the ISO Agreement) which provides for payment of fees solely by the funds to Tarantino LLC in return for the provision of services of an Independent Senior Officer (ISO) for the funds. Frank L. Tarantino serves as the ISO and is an officer of the funds and the sole member of Tarantino LLC. The funds can terminate the ISO Agreement with Tarantino LLC at any time under the terms of the ISO Agreement. Prior to November 1, 2014, the funds had entered into a service agreement (the Compliance Officer Agreement) which provided for payment of fees by the funds to Tarantino LLC in return for the provision of services of an Independent Chief Compliance Officer (ICCO) for the funds. Prior to November 1, 2014, Frank L. Tarantino served as the ICCO. Effective October 31, 2014, Mr. Tarantino resigned as ICCO and the Compliance Officer Agreement between the funds and Tarantino LLC was terminated. Prior to June 1, 2014, Robyn L. Griffin served as the Assistant ICCO and was an officer of the funds. Ms. Griffin is the sole member of Griffin Compliance LLC. Effective May 31, 2014, Ms. Griffin resigned as Assistant ICCO and the Compliance Officer Agreement between the funds and Griffin Compliance LLC was terminated. For the period ended August 31, 2015 and year ended February 28, 2015, the aggregate fees paid by the fund under these agreements were $634 and $1,882, respectively, and are included in “Miscellaneous” expense in the Statements of Operations. MFS had agreed to reimburse the fund for a portion of the payments made by the fund for the services under the Compliance Officer Agreements in the amount of $0 for the period ended August 31, 2015 and $587 for the year ended February 28, 2015, which is included in the reduction of total expenses in the Statements of
29
Notes to Financial Statements – continued
Operations. Additionally, MFS has agreed to bear all expenses associated with office space, other administrative support, and supplies provided to the ICCO and ISO.
The fund invests in the MFS Institutional Money Market Portfolio which is managed by MFS and seeks current income consistent with preservation of capital and liquidity. Income earned on this investment is included in “Dividends from underlying affiliated funds” in the Statements of Operations. This money market fund does not pay a management fee to MFS.
On December 17, 2014, MFS purchased 10,000 shares of Class B, Class C, Class R1, Class R2, Class R3, and Class R4 for an aggregate amount of $600,000 as an initial investment in the class.
At August 31, 2015, MFS held approximately 90%, 100%, 100%, and 100% of the outstanding shares of Class R1, Class R2, Class R3, and Class R4, respectively.
(4) Portfolio Securities
For the period ended August 31, 2015, purchases and sales of investments, other than short-term obligations, aggregated $100,430,149 and $64,900,095, respectively. For the year ended February 28, 2015, purchases and sales of investments, other than short-term obligations, aggregated $158,710,701 and $170,415,960, respectively.
(5) Shares of Beneficial Interest
The fund’s Declaration of Trust permits the Trustees to issue an unlimited number of full and fractional shares of beneficial interest. Transactions in fund shares were as follows:
| | | | | | | | | | | | | | | | | | | | | | | | |
| | | Period ended
8/31/15 (z) | | | Year ended
2/28/15 (i) | | | Year ended
2/28/14 | |
| | | Shares | | | Amount | | | Shares | | | Amount | | | Shares | | | Amount | |
| Shares sold | | | | | | | | | | | | | | | | | | | | | | | | |
Class A | | | 190,551 | | | | $3,039,320 | | | | 38,347 | | | | $629,817 | | | | — | | | | $ — | |
Class B | | | 52,901 | | | | 535,663 | | | | 30,562 | | | | 314,021 | | | | — | | | | — | |
Class C | | | 67,105 | | | | 675,727 | | | | 31,773 | | | | 327,370 | | | | — | | | | — | |
Class I | | | 94,866 | | | | 1,536,130 | | | | 20,510 | | | | 337,581 | | | | — | | | | — | |
Class R1 | | | 1,054 | | | | 10,390 | | | | 10,000 | | | | 100,000 | | | | — | | | | — | |
Class R2 | | | — | | | | — | | | | 10,000 | | | | 100,000 | | | | — | | | | — | |
Class R3 | | | — | | | | — | | | | 10,000 | | | | 100,000 | | | | — | | | | — | |
Class R4 | | | — | | | | — | | | | 10,000 | | | | 100,000 | | | | — | | | | — | |
Class R5 | | | 1,866,839 | | | | 29,887,613 | | | | 1,806,201 | | | | 28,335,887 | | | | 7,202,580 | | | | 107,486,452 | |
| | | 2,273,316 | | | | $35,684,843 | | | | 1,967,393 | | | | $30,344,676 | | | | 7,202,580 | | | | $107,486,452 | |
30
Notes to Financial Statements – continued
| | | | | | | | | | | | | | | | | | | | | | | | |
| | | Period ended
8/31/15 (z) | | | Year ended
2/28/15 (i) | | | Year ended
2/28/14 | |
| | | Shares | | | Amount | | | Shares | | | Amount | | | Shares | | | Amount | |
| Shares issued to shareholders in reinvestment of distributions | | | | | | | | | | | | | | | | | | | | | | | | |
Class A | | | 3,086 | | | | $48,484 | | | | 834 | | | | $13,124 | | | | 1,304 | | | | $18,653 | |
Class B | | | 1,725 | | | | 16,988 | | | | — | | | | — | | | | — | | | | — | |
Class C | | | 2,009 | | | | 19,792 | | | | — | | | | — | | | | — | | | | — | |
Class I | | | 1,566 | | | | 24,635 | | | | 369 | | | | 5,818 | | | | 566 | | | | 8,091 | |
Class R1 | | | 246 | | | | 2,421 | | | | — | | | | — | | | | — | | | | — | |
Class R2 | | | 229 | | | | 2,260 | | | | — | | | | — | | | | — | | | | — | |
Class R3 | | | 233 | | | | 2,302 | | | | — | | | | — | | | | — | | | | — | |
Class R4 | | | 237 | | | | 2,344 | | | | — | | | | — | | | | — | | | | — | |
Class R5 | | | 435,099 | | | | 6,844,105 | | | | 1,197,676 | | | | 18,863,400 | | | | 1,781,163 | | | | 25,412,228 | |
| | | 444,430 | | | | $6,963,331 | | | | 1,198,879 | | | | $18,882,342 | | | | 1,783,033 | | | | $25,438,972 | |
| | | | | | |
| Shares reacquired | | | | | | | | | | | | | | | | | | | | | | | | |
Class A | | | (14,605 | ) | | | $(226,873 | ) | | | (110 | ) | | | $(1,815 | ) | | | — | | | | $ — | |
Class B | | | (12,485 | ) | | | (123,077 | ) | | | (22 | ) | | | (227 | ) | | | — | | | | — | |
Class C | | | (10,946 | ) | | | (108,342 | ) | | | (1 | ) | | | (8 | ) | | | — | | | | — | |
Class I | | | (41,601 | ) | | | (656,157 | ) | | | — | | | | — | | | | — | | | | — | |
Class R1 | | | — | | | | — | | | | — | | | | — | | | | — | | | | — | |
Class R5 | | | (330,454 | ) | | | (5,232,356 | ) | | | (3,307,443 | ) | | | (53,168,894 | ) | | | (1,176,705 | ) | | | (18,291,057 | ) |
| | | (410,091 | ) | | | $(6,346,805 | ) | | | (3,307,576 | ) | | | $(53,170,944 | ) | | | (1,176,705 | ) | | | $(18,291,057 | ) |
| | | | | | |
| Net change | | | | | | | | | | | | | | | | | | | | | | | | |
Class A | | | 179,032 | | | | $2,860,931 | | | | 39,071 | | | | $641,126 | | | | 1,304 | | | | $18,653 | |
Class B | | | 42,141 | | | | 429,574 | | | | 30,540 | | | | 313,794 | | | | — | | | | — | |
Class C | | | 58,168 | | | | 587,177 | | | | 31,772 | | | | 327,362 | | | | — | | | | — | |
Class I | | | 54,831 | | | | 904,608 | | | | 20,879 | | | | 343,399 | | | | 566 | | | | 8,091 | |
Class R1 | | | 1,300 | | | | 12,809 | | | | 10,000 | | | | 100,000 | | | | — | | | | — | |
Class R2 | | | 229 | | | | 2,260 | | | | 10,000 | | | | 100,000 | | | | — | | | | — | |
Class R3 | | | 233 | | | | 2,302 | | | | 10,000 | | | | 100,000 | | | | — | | | | — | |
Class R4 | | | 237 | | | | 2,344 | | | | 10,000 | | | | 100,000 | | | | — | | | | — | |
Class R5 | | | 1,971,484 | | | | 31,499,364 | | | | (303,566 | ) | | | (5,969,607 | ) | | | 7,807,038 | | | | 114,607,623 | |
| | | 2,307,655 | | | | $36,301,369 | | | | (141,304 | ) | | | $(3,943,926 | ) | | | 7,808,908 | | | | $114,634,367 | |
| (i) | For Classes B, C, R1, R2, R3, and R4, the period is from inception date December 19, 2014, through the stated period. |
| (z) | For the period March 1, 2015 through August 31, 2015. Effective March 1, 2015, the fund changed its fiscal year-end from February 28 to August 31. |
The fund is one of several mutual funds in which certain MFS funds may invest. The MFS funds do not invest in the underlying funds for the purpose of exercising management or control. At the end of the period, the MFS Growth Allocation Fund, the MFS Moderate Allocation Fund, the MFS Aggressive Growth Allocation Fund, the MFS Conservative Allocation Fund, the MFS Lifetime 2040 Fund, the MFS Lifetime 2030
31
Notes to Financial Statements – continued
Fund, the MFS Lifetime Income Fund, and the MFS Lifetime 2050 Fund were the owners of record of approximately 34%, 27%, 19%, 7%, 3%, 3%, 1%, and 1%, respectively, of the value of outstanding voting shares of the fund. In addition, the MFS Global Multi-Asset Fund, the MFS Lifetime 2055 Fund, the MFS Lifetime 2045 Fund, the MFS Lifetime 2035 Fund, the MFS Lifetime 2025 Fund, the MFS Lifetime 2020 Fund, and the MFS Lifetime 2015 Fund were each the owners of record of less than 1% of the value of outstanding voting shares of the fund.
(6) Line of Credit
The fund and certain other funds managed by MFS participate in a $1.25 billion unsecured committed line of credit, subject to a $1 billion sublimit, provided by a syndication of banks under a credit agreement. Borrowings may be made for temporary financing needs. Interest is charged to each fund, based on its borrowings, generally at a rate equal to the higher of the Overnight Federal Reserve funds rate or daily one month LIBOR plus an agreed upon spread. A commitment fee, based on the average daily, unused portion of the committed line of credit, is allocated among the participating funds at the end of each calendar quarter. In addition, the fund and other funds managed by MFS have established unsecured uncommitted borrowing arrangements with certain banks for temporary financing needs. Interest is charged to each fund, based on its borrowings, at a rate equal to the Overnight Federal Reserve funds rate plus an agreed upon spread. For the period ended August 31, 2015 and year ended February 28, 2015 the fund’s commitment fees were $839 and $1,562, respectively, and interest expense were $0 and $0, respectively, and are included in “Miscellaneous” expense in the Statements of Operations.
(7) Transactions in Underlying Affiliated Funds-Affiliated Issuers
An affiliated issuer may be considered one in which the fund owns 5% or more of the outstanding voting securities, or a company which is under common control. For the purposes of this report, the fund assumes the following to be an affiliated issuer:
| | | | | | | | | | | | | | | | |
| | | Period ended 8/31/15 (z) | |
| Underlying Affiliated Fund | | Beginning
Shares/Par
Amount | | | Acquisitions
Shares/Par
Amount | | | Dispositions
Shares/Par
Amount | | | Ending
Shares/Par
Amount | |
MFS Institutional Money
Market Portfolio | | | 11,849,633 | | | | 64,772,938 | | | | (67,988,302 | ) | | | 8,634,269 | |
| | | | |
| Underlying Affiliated Fund | | Realized
Gain (Loss) | | | Capital Gain
Distributions | | | Dividend
Income | | | Ending
Value | |
MFS Institutional Money
Market Portfolio | | | $— | | | | $— | | | | $4,668 | | | | $8,634,269 | |
32
Notes to Financial Statements – continued
| | | | | | | | | | | | | | | | |
| | | Year ended 2/28/15 | |
| Underlying Affiliated Fund | | Beginning
Shares/Par
Amount | | | Acquisitions
Shares/Par
Amount | | | Dispositions
Shares/Par
Amount | | | Ending
Shares/Par
Amount | |
| MFS Institutional Money Market Portfolio | | | 12,111,962 | | | | 115,833,452 | | | | (116,095,781 | ) | | | 11,849,633 | |
| | | | |
| Underlying Affiliated Fund | | Realized
Gain (Loss) | | | Capital Gain
Distributions | | | Dividend
Income | | | Ending
Value | |
| MFS Institutional Money Market Portfolio | | | $— | | | | $— | | | | $6,747 | | | | $11,849,633 | |
| (z) | For the period March 1, 2015 through August 31, 2015. Effective March 1, 2015, the fund changed its fiscal year-end from February 28 to August 31. |
33
REPORT OF INDEPENDENT REGISTERED PUBLIC ACCOUNTING FIRM
To the Board of Trustees of MFS Series Trust XIII and Shareholders of MFS Global Real Estate Fund:
We have audited the accompanying statement of assets and liabilities of MFS Global Real Estate Fund (the Fund) (one of the series constituting MFS Series Trust XIII), including the portfolio of investments, as of August 31, 2015, and the related statements of operations, changes in net assets and the financial highlights for each of the periods indicated therein. These financial statements and financial highlights are the responsibility of the Fund’s management. Our responsibility is to express an opinion on these financial statements and financial highlights based on our audits.
We conducted our audits in accordance with the standards of the Public Company Accounting Oversight Board (United States). Those standards require that we plan and perform the audit to obtain reasonable assurance about whether the financial statements and financial highlights are free of material misstatement. We were not engaged to perform an audit of the Fund’s internal control over financial reporting. Our audits included consideration of internal control over financial reporting as a basis for designing audit procedures that are appropriate in the circumstances, but not for the purpose of expressing an opinion on the effectiveness of the Fund’s internal control over financial reporting. Accordingly, we express no such opinion. An audit also includes examining, on a test basis, evidence supporting the amounts and disclosures in the financial statements and financial highlights, assessing the accounting principles used and significant estimates made by management, and evaluating the overall financial statement presentation. Our procedures included confirmation of securities owned as of August 31, 2015, by correspondence with the custodian and others. We believe that our audits provide a reasonable basis for our opinion.
In our opinion, the financial statements and financial highlights referred to above present fairly, in all material respects, the financial position of MFS Global Real Estate Fund (one of the series constituting MFS Series Trust XIII) at August 31, 2015, the results of its operations, the changes in its net assets and the financial highlights for each of the periods indicated therein, in conformity with U.S. generally accepted accounting principles.

Boston, Massachusetts
October 15, 2015
34
TRUSTEES AND OFFICERS — IDENTIFICATION AND BACKGROUND
The Trustees and Officers of the Trust, as of October 1, 2015, are listed below, together with their principal occupations during the past five years. (Their titles may have varied during that period.) The address of each Trustee and Officer is 111 Huntington Avenue, Boston, Massachusetts 02199-7618.
| | | | | | | | |
Name, Age | | Position(s) Held with Fund | | Trustee/Officer
Since (h) | | Principal
Occupations During the Past Five Years | | Other Directorships (j) |
| INTERESTED TRUSTEES |
Robert J. Manning (k) (age 51) | | Trustee | | February 2004 | | Massachusetts Financial Services Company, Chairman, Co-Chief Executive Officer and Director; Chief Investment Officer (until 2010) | | N/A |
Robin A. Stelmach (k) (age 54) | | Trustee and President | | January 2014 | | Massachusetts Financial Services Company, Executive Vice President and Chief Operating Officer | | N/A |
| INDEPENDENT TRUSTEES | | | | | | |
David H. Gunning (age 73) | | Trustee and Chair of Trustees | | January 2004 | | Private investor | | Lincoln Electric Holdings, Inc., Director; Development Alternatives, Inc., Director/Non-Executive Chairman |
Steven E. Buller (age 64) | | Trustee | | February 2014 | | Chairman, Financial Accounting Standards Advisory Council; Standing Advisory Group, Public Company Accounting Oversight Board, Member (until 2014); BlackRock, Inc. (investment management), Managing Director (until 2014), BlackRock Finco UK (investment management), Director (until 2014) | | N/A |
Robert E. Butler (age 73) | | Trustee | | January 2006 | | Consultant – investment company industry regulatory and compliance matters | | N/A |
35
Trustees and Officers – continued
| | | | | | | | |
Name, Age | | Position(s) Held with Fund | | Trustee/Officer
Since (h) | | Principal
Occupations During the Past Five Years | | Other Directorships (j) |
Maureen R. Goldfarb (age 60) | | Trustee | | January 2009 | | Private investor | | N/A |
William R. Gutow (age 74) | | Trustee | | December 1993 | | Private investor and real estate consultant; Capitol Entertainment Management Company (video franchise), Vice Chairman | | Texas Donuts, Vice Chairman (until 2010) |
Michael Hegarty (age 70) | | Trustee | | December 2004 | | Private investor | | Rouse Properties Inc., Director; Capmark Financial Group Inc., Director |
John P. Kavanaugh (age 60) | | Trustee | | January 2009 | | Private investor | | N/A |
Maryanne L. Roepke (age 59) | | Trustee | | May 2014 | | American Century Investments (investment management), Senior Vice President and Chief Compliance Officer (until 2014) | | N/A |
Laurie J. Thomsen (age 58) | | Trustee | | March 2005 | | Private investor; New Profit, Inc. (venture philanthropy), Executive Partner (until 2010) | | The Travelers Companies, Director; Dycom Industries, Inc. |
Robert W. Uek (age 74) | | Trustee | | January 2006 | | Consultant to investment company industry | | N/A |
| OFFICERS | | | | | | |
Christopher R. Bohane (k) (age 41) | | Assistant Secretary and Assistant Clerk | | July 2005 | | Massachusetts Financial Services Company, Vice President and Assistant General Counsel | | N/A |
Kino Clark (k) (age 47) | | Assistant Treasurer | | January 2012 | | Massachusetts Financial Services Company, Vice President | | N/A |
Kristin V. Collins (k) (age 42) | | Assistant Secretary and Assistant Clerk | | September 2015 | | Massachusetts Financial Services Company, Vice President and Assistant General Counsel | | N/A |
36
Trustees and Officers – continued
| | | | | | | | |
Name, Age | | Position(s) Held with Fund | | Trustee/Officer
Since (h) | | Principal
Occupations During the Past Five Years | | Other Directorships (j) |
Thomas H. Connors (k) (age 56) | | Assistant Secretary and Assistant Clerk | | September 2012 | | Massachusetts Financial Services Company, Vice President and Senior Counsel; Deutsche Investment Management Americas Inc. (financial service provider), Director and Senior Counsel (until 2012) | | N/A |
Ethan D. Corey (k) (age 51) | | Assistant Secretary and Assistant Clerk | | July 2005 | | Massachusetts Financial Services Company, Senior Vice President and Associate General Counsel | | N/A |
David L. DiLorenzo (k) (age 47) | | Treasurer | | July 2005 | | Massachusetts Financial Services Company, Senior Vice President | | N/A |
Susan S. Newton (k) (age 65) | | Assistant Secretary and Assistant Clerk | | May 2005 | | Massachusetts Financial Services Company, Senior Vice President and Associate General Counsel | | N/A |
Kenneth Paek (k) (age 41) | | Assistant Treasurer | | February 2015 | | Massachusetts Financial Services Company, Vice President; Cohen & Steers, Vice President/Head of Fund Administration (until 2014) | | N/A |
Susan A. Pereira (k) (age 44) | | Assistant Secretary and Assistant Clerk | | July 2005 | | Massachusetts Financial Services Company, Vice President and Senior Counsel | | N/A |
Kasey L. Phillips (k) (age 44) | | Assistant Treasurer | | September 2012 | | Massachusetts Financial Services Company, Vice President; Wells Fargo Funds Management, LLC, Senior Vice President, Fund Treasurer (until 2012) | | N/A |
37
Trustees and Officers – continued
| | | | | | | | |
Name, Age | | Position(s) Held with Fund | | Trustee/Officer
Since (h) | | Principal
Occupations During the Past Five Years | | Other Directorships (j) |
Mark N. Polebaum (k) (age 63) | | Secretary and Clerk | | January 2006 | | Massachusetts Financial Services Company, Executive Vice President, General Counsel and Secretary | | N/A |
Matthew A. Stowe (k) (age 40) | | Assistant Secretary and Assistant Clerk | | October 2014 | | Massachusetts Financial Services Company, Vice President and Assistant General Counsel | | N/A |
Frank L. Tarantino (age 71) | | Independent Senior Officer | | June 2004 | | Tarantino LLC (provider of compliance services), Principal | | N/A |
Richard S. Weitzel (k) (age 45) | | Assistant Secretary and Assistant Clerk | | October 2007 | | Massachusetts Financial Services Company, Senior Vice President and Associate General Counsel | | N/A |
Martin J. Wolin (k) (age 48) | | Chief Compliance Officer | | July 2015 | | Massachusetts Financial Services Company, Senior Vice President and Chief Compliance Officer (since July 2015); Mercer (financial service provider), Chief Risk and Compliance Officer, North America and Latin America (until June 2015) | | N/A |
James O. Yost (k) (age 55) | | Deputy Treasurer | | September 1990 | | Massachusetts Financial Services Company, Senior Vice President | | N/A |
| (h) | Date first appointed to serve as Trustee/officer of an MFS Fund. Each Trustee has served continuously since appointment unless indicated otherwise. For the period from December 15, 2004 until February 22, 2005, Mr. Manning served as Advisory Trustee. Prior to January 2012, Messrs. DiLorenzo and Yost served as Assistant Treasurers of the Funds. Ms. Stelmach was appointed as President of the Funds as of October 1, 2014. |
| (j) | Directorships or trusteeships of companies required to report to the Securities and Exchange Commission (i.e., “public companies”). |
| (k) | “Interested person” of the Trust within the meaning of the Investment Company Act of 1940 (referred to as the 1940 Act), which is the principal federal law governing investment companies like the fund, as a result of a position with MFS. The address of MFS is 111 Huntington Avenue, Boston, Massachusetts 02199-7618. |
38
Trustees and Officers – continued
Each Trustee (except Ms. Stelmach, Mr. Buller and Ms. Roepke) has been elected by shareholders and each Trustee and officer holds office until his or her successor is chosen and qualified or until his or her earlier death, resignation, retirement or removal. The Trust does not hold annual meetings for the purpose of electing Trustees, and Trustees are not elected for fixed terms. Messrs. Butler, Kavanaugh, Uek and Mses. Thomsen and Roepke are members of the Trust’s Audit Committee.
Each of the Fund’s Trustees and officers holds comparable positions with certain other funds of which MFS or a subsidiary is the investment adviser or distributor, and, in the case of the officers, with certain affiliates of MFS. As of October 1, 2015, the Trustees served as board members of 138 funds within the MFS Family of Funds.
The Statement of Additional Information for a Fund includes further information about the Trustees and is available without charge upon request by calling 1-800-225-2606.
| | |
| Investment Adviser | | Custodian |
Massachusetts Financial Services Company
111 Huntington Avenue
Boston, MA 02199-7618 | | State Street Bank and Trust Company 1 Lincoln Street Boston, MA 02111-2900 |
| Distributor | | Independent Registered Public Accounting Firm |
MFS Fund Distributors, Inc.
111 Huntington Avenue
Boston, MA 02199-7618 | | Ernst & Young LLP 200 Clarendon Street Boston, MA 02116 |
| Portfolio Manager | | |
Richard Gable | | |
39
BOARD REVIEW OF INVESTMENT ADVISORY AGREEMENT
The Investment Company Act of 1940 requires that both the full Board of Trustees and a majority of the non-interested (“independent”) Trustees, voting separately, annually approve the continuation of the Fund’s investment advisory agreement with MFS. The Trustees consider matters bearing on the Fund and its advisory arrangements at their meetings throughout the year, including a review of performance data at each regular meeting. In addition, the independent Trustees met several times over the course of three months beginning in May and ending in July, 2015 (“contract review meetings”) for the specific purpose of considering whether to approve the continuation of the investment advisory agreement for the Fund and the other investment companies that the Board oversees (the “MFS Funds”). The independent Trustees were assisted in their evaluation of the Fund’s investment advisory agreement by independent legal counsel, from whom they received separate legal advice and with whom they met separately from MFS during various contract review meetings. The independent Trustees were also assisted in this process by the MFS Funds’ Independent Senior Officer, a senior officer appointed by and reporting to the independent Trustees.
In connection with their deliberations regarding the continuation of the investment advisory agreement, the Trustees, including the independent Trustees, considered such information and factors as they believed, in light of the legal advice furnished to them and their own business judgment, to be relevant. The investment advisory agreement for the Fund was considered separately, although the Trustees also took into account the common interests of all MFS Funds in their review. As described below, the Trustees considered the nature, quality, and extent of the various investment advisory, administrative, and shareholder services performed by MFS under the existing investment advisory agreement and other arrangements with the Fund.
In connection with their contract review meetings, the Trustees received and relied upon materials that included, among other items: (i) information provided by Lipper Inc., an independent third party, on the investment performance of the Fund for various time periods ended December 31, 2014 and the investment performance of a group of funds with substantially similar investment classifications/objectives (the “Lipper performance universe”), (ii) information provided by Lipper Inc. on the Fund’s advisory fees and other expenses and the advisory fees and other expenses of comparable funds identified by Lipper Inc. (the “Lipper expense group”), (iii) information provided by MFS on the advisory fees of comparable portfolios of other clients of MFS, including institutional separate accounts and other clients, (iv) information as to whether and to what extent applicable expense waivers, reimbursements or fee “breakpoints” are observed for the Fund, (v) information regarding MFS’ financial results and financial condition, including MFS’ and certain of its affiliates’ estimated profitability from services performed for the Fund and the MFS Funds as a whole, and compared to MFS’ institutional business, (vi) MFS’ views regarding the outlook for the mutual fund industry and the strategic business plans of MFS, (vii) descriptions of various functions performed by MFS for the Funds, such as compliance monitoring and portfolio trading practices, and (viii) information regarding the overall organization of MFS, including information about MFS’ senior management and other personnel providing investment advisory, administrative and other services to
40
Board Review of Investment Advisory Agreement – continued
the Fund and the other MFS Funds. The comparative performance, fee and expense information prepared and provided by Lipper Inc. was not independently verified and the independent Trustees did not independently verify any information provided to them by MFS.
The Trustees’ conclusion as to the continuation of the investment advisory agreement was based on a comprehensive consideration of all information provided to the Trustees and not the result of any single factor. Some of the factors that figured particularly in the Trustees’ deliberations are described below, although individual Trustees may have evaluated the information presented differently from one another, giving different weights to various factors. It is also important to recognize that the fee arrangements for the Fund and other MFS Funds are the result of years of review and discussion between the independent Trustees and MFS, that certain aspects of such arrangements may receive greater scrutiny in some years than in others, and that the Trustees’ conclusions may be based, in part, on their consideration of these same arrangements during the course of the year and in prior years.
Effective May 1, 2011, the Board of Trustees terminated the Fund’s sub-advisory investment agreement among MFS Series Trust XIII, on behalf of the Fund, MFS and Sun Capital Advisers LLC (“Sun Capital”), and MFS assumed responsibility for day-to-day management of the Fund. The Sun Capital portfolio manager who was responsible for the day-to-day management of the Fund became an employee of MFS on or about May 1, 2011 and continues to manage the Fund.
Based on information provided by Lipper Inc. and MFS, the Trustees reviewed the Fund’s total return investment performance as well as the performance of peer groups of funds over various time periods. The Trustees placed particular emphasis on the total return performance of the Fund’s Class A shares in comparison to the performance of funds in its Lipper performance universe over the three-year period ended December 31, 2014, which the Trustees believed was a long enough period to reflect differing market conditions. The total return performance of the Fund’s Class A shares was in the 1st quintile relative to the other funds in the universe for this three-year period (the 1st quintile being the best performers and the 5th quintile being the worst performers). The total return performance of the Fund’s Class A shares was in the 2nd quintile for the one-year period and the 3rd quintile for the five-year period ended December 31, 2014 relative to the Lipper performance universe. Because of the passage of time, these performance results may differ from the performance results for more recent periods, including those shown elsewhere in this report.
In the course of their deliberations, the Trustees took into account information provided by MFS in connection with the contract review meetings, as well as during investment review meetings conducted with portfolio management personnel during the course of the year regarding the Fund’s performance. After reviewing these and related factors, the Trustees concluded, within the context of their overall conclusions regarding the investment advisory agreement, that they were satisfied with MFS’ responses and efforts relating to investment performance.
In assessing the reasonableness of the Fund’s advisory fee, the Trustees considered, among other information, the Fund’s advisory fee and the total expense ratio of the Fund’s Class A shares as a percentage of average daily net assets and the advisory fee
41
Board Review of Investment Advisory Agreement – continued
and total expense ratios of peer groups of funds based on information provided by Lipper Inc. The Trustees considered that, according to the Lipper data (which takes into account any fee reductions or expense limitations that were in effect during the Fund’s last fiscal year), the Fund’s effective advisory fee rate was higher than the Lipper expense group median, and the Fund’s total expense ratio was lower than the Lipper expense group median.
The Trustees also considered the advisory fees charged by MFS to any institutional separate accounts advised by MFS (“separate accounts”) and unaffiliated investment companies for which MFS serves as subadviser (“subadvised funds”) that have comparable investment strategies to the Fund. In comparing these fees, the Trustees considered information provided by MFS as to the generally broader scope of services provided by MFS to the Fund, as well as the more extensive regulatory burdens imposed on MFS in managing the Fund, in comparison to separate accounts and subadvised funds. The Trustees also considered the higher demands placed on MFS’ investment personnel and trading infrastructure as a result of the daily cash in-flows and out-flows of the Fund in comparison to separate accounts.
The Trustees also considered whether the Fund may benefit from any economies of scale in the management of the Fund in the event of growth in assets of the Fund and/or growth in assets of the MFS Funds as a whole. They noted that the Fund’s advisory fee rate schedule is subject to contractual breakpoints that reduce the Fund’s advisory fee rate on average daily net assets over $1 billion and $2.5 billion. The Trustees also noted that MFS has agreed in writing to waive a portion of the management fees of certain MFS Funds, including the Fund, if the total combined assets of certain funds within the MFS Funds’ complex increase above agreed upon thresholds (the “group fee waiver”), enabling the Fund’s shareholders to share in the benefits from any economies of scale at the complex level. The group fee waiver is reviewed and renewed annually between the Board and MFS. The Trustees concluded that the breakpoints and the group fee waiver were sufficient to allow the Fund to benefit from economies of scale as its assets and overall complex assets grow.
The Trustees also considered information prepared by MFS relating to MFS’ costs and profits with respect to the Fund, the MFS Funds considered as a group, and other investment companies and accounts advised by MFS, as well as MFS’ methodologies used to determine and allocate its costs to the MFS Funds, the Fund and other accounts and products for purposes of estimating profitability.
After reviewing these and other factors described herein, the Trustees concluded, within the context of their overall conclusions regarding the investment advisory agreement, that the advisory fees charged to the Fund represent reasonable compensation in light of the services being provided by MFS to the Fund.
In addition, the Trustees considered MFS’ resources and related efforts to continue to retain, attract and motivate capable personnel to serve the Fund. The Trustees also considered current and developing conditions in the financial services industry, including the presence of large and well-capitalized companies which are spending, and appear to be prepared to continue to spend, substantial sums to engage personnel and to provide services to competing investment companies. In this regard, the Trustees also considered the financial resources of MFS and its ultimate parent, Sun Life
42
Board Review of Investment Advisory Agreement – continued
Financial Inc. The Trustees also considered the advantages and possible disadvantages to the Fund of having an adviser that also serves other investment companies as well as other accounts.
The Trustees also considered the nature, quality, cost, and extent of administrative, transfer agency, and distribution services provided to the Fund by MFS and its affiliates under agreements and plans other than the investment advisory agreement, including any 12b-1 fees the Fund pays to MFS Fund Distributors, Inc., an affiliate of MFS. The Trustees also considered the nature, extent and quality of certain other services MFS performs or arranges for on the Fund’s behalf, which may include securities lending programs, directed expense payment programs, class action recovery programs, and MFS’ interaction with third-party service providers, principally custodians and sub-custodians. The Trustees concluded that the various non-advisory services provided by MFS and its affiliates on behalf of the Fund were satisfactory.
The Trustees also considered benefits to MFS from the use of the Fund’s portfolio brokerage commissions, if applicable, to pay for investment research and various other factors. Additionally, the Trustees considered so-called “fall-out benefits” to MFS such as reputational value derived from serving as investment manager to the Fund.
Based on their evaluation of factors that they deemed to be material, including those factors described above, the Board of Trustees, including the independent Trustees, concluded that the Fund’s investment advisory agreement with MFS should be continued for an additional one-year period, commencing August 1, 2015.
43
PROXY VOTING POLICIES AND INFORMATION
MFS votes proxies on behalf of the fund pursuant to proxy voting policies and procedures that are available without charge, upon request, by calling 1-800-225-2606, by visiting the Proxy Voting section of mfs.com or by visiting the SEC’s Web site at http://www.sec.gov.
Information regarding how the fund voted proxies relating to portfolio securities during the most recent twelve-month period ended June 30 is available without charge by visiting the Proxy Voting section of mfs.com or by visiting the SEC’s Web site at http://www.sec.gov.
QUARTERLY PORTFOLIO DISCLOSURE
The fund will file a complete schedule of portfolio holdings with the Securities and Exchange Commission (the Commission) for the first and third quarters of each fiscal year on Form N-Q. A shareholder can obtain the quarterly portfolio holdings report at mfs.com. The fund’s Form N-Q is also available on the EDGAR database on the Commission’s Internet Web site at http://www.sec.gov, and may be reviewed and copied at the:
Public Reference Room
Securities and Exchange Commission
100 F Street, NE, Room 1580
Washington, D.C. 20549
Information on the operation of the Public Reference Room may be obtained by calling the Commission at 1-800-SEC-0330. Copies of the fund’s Form N-Q also may be obtained, upon payment of a duplicating fee, by electronic request at the following e-mail address: publicinfo@sec.gov or by writing the Public Reference Section at the above address.
FURTHER INFORMATION
From time to time, MFS may post important information about the fund or the MFS funds on the MFS web site (mfs.com). This information is available by visiting the “Market Commentary” and “Announcements” sub sections in the “Market Outlooks” section of mfs.com or by clicking on the fund’s name under “Mutual Funds” in the “Products” section of mfs.com.
FEDERAL TAX INFORMATION (unaudited)
The fund will notify shareholders of amounts for use in preparing 2015 income tax forms in January 2016. The following information is provided pursuant to provisions of the Internal Revenue Code.
The fund designates the maximum amount allowable as qualified dividend income eligible to be taxed at the same rate as long-term capital gain.
The fund designates $2,024,000 as capital gain dividends paid during the fiscal year.
44
rev. 3/11
| | | | |
| | | |
FACTS | | WHAT DOES MFS DO WITH YOUR PERSONAL INFORMATION? | |  |
| | |
| Why? | | Financial companies choose how they share your personal information. Federal law gives consumers the right to limit some but not all sharing. Federal law also requires us to tell you how we collect, share, and protect your personal information. Please read this notice carefully to understand what we do. |
| | |
| What? | | The types of personal information we collect and share depend on the product or service you have with us. This information can include: • Social Security number and account balances • Account transactions and transaction history • Checking account information and wire transfer instructions When you are no longer our customer, we continue to share your information as described in this notice. |
| | |
| How? | | All financial companies need to share customers’ personal information to run their everyday business. In the section below, we list the reasons financial companies can share their customers’ personal information; the reasons MFS chooses to share; and whether you can limit this sharing. |
| | | | |
Reasons we can share your
personal information | | Does MFS
share? | | Can you limit
this sharing? |
For our everyday business purposes – such as to process your transactions, maintain your account(s), respond to court orders and legal investigations, or report to credit bureaus | | Yes | | No |
For our marketing purposes – to offer our products and services to you | | No | | We don’t share |
| For joint marketing with other financial companies | | No | | We don’t share |
For our affiliates’ everyday business purposes – information about your transactions and experiences | | No | | We don’t share |
For our affiliates’ everyday business purposes – information about your creditworthiness | | No | | We don’t share |
| For nonaffiliates to market to you | | No | | We don’t share |
| | |
| Questions? | | Call 800-225-2606 or go to mfs.com. |
45
| | |
| Who we are |
| Who is providing this notice? | | MFS Funds, MFS Investment Management, MFS Institutional Advisors, Inc., MFS Fund Distributors, Inc., MFS Heritage Trust Company, and MFS Service Center, Inc. |
| | |
| What we do |
| How does MFS protect my personal information? | | To protect your personal information from unauthorized access and use, we use security measures that comply with federal law. These measures include procedural, electronic, and physical safeguards for the protection of the personal information we collect about you. |
| How does MFS collect my personal information? | | We collect your personal information, for example, when you • open an account or provide account information • direct us to buy securities or direct us to sell your securities • make a wire transfer We also collect your personal information from others, such as credit bureaus, affiliates and other companies. |
| Why can’t I limit all sharing? | | Federal law gives you the right to limit only • sharing for affiliates’ everyday business purposes – information about your creditworthiness • affiliates from using your information to market to you • sharing for nonaffiliates to market to you State laws and individual companies may give you additional rights to limit sharing. |
| | |
| Definitions |
| Affiliates | | Companies related by common ownership or control. They can be financial and nonfinancial companies. • MFS does not share personal information with affiliates, except for everyday business purposes as described on page one of this notice. |
| Nonaffiliates | | Companies not related by common ownership or control. They can be financial and nonfinancial companies. • MFS does not share with nonaffiliates so they can market to you. |
| Joint Marketing | | A formal agreement between nonaffiliated financial companies that together market financial products or services to you. • MFS doesn’t jointly market. |
| | |
| Other important information |
| If you own an MFS product or receive an MFS service in the name of a third party such as a bank or broker-dealer, their privacy policy may apply to you instead of ours. |
46
Save paper with eDelivery.

| MFS® will send you prospectuses, |
reports, and proxies directly via e-mail so you will get information faster with less mailbox clutter.
To sign up:
1. Go to mfs.com.
2. Log in via MFS® Access.
3. Select eDelivery.
If you own your MFS fund shares through a financial institution or a retirement plan, MFS® TALK, MFS® Access, or eDelivery may not be available to you.
CONTACT
WEB SITE
mfs.com
MFS TALK
1-800-637-8255
24 hours a day
ACCOUNT SERVICE AND LITERATURE
Shareholders
1-800-225-2606
Financial advisors
1-800-343-2829
Retirement plan services
1-800-637-1255
MAILING ADDRESS
MFS Service Center, Inc.
P.O. Box 55824
Boston, MA 02205-5824
OVERNIGHT MAIL
MFS Service Center, Inc.
c/o Boston Financial Data Services
30 Dan Road
Canton, MA 02021-2809
The Registrant has adopted a Code of Ethics pursuant to Section 406 of the Sarbanes-Oxley Act and as defined in Form N-CSR that applies to the Registrant’s principal executive officer and principal financial and accounting officer. During the period covered by this report, the Registrant has not amended any provision in its Code of Ethics (the “Code”) that relates to an element of the Code’s definitions enumerated in paragraph (b) of Item 2 of this Form N-CSR. During the period covered by this report, the Registrant did not grant a waiver, including an implicit waiver, from any provision of the Code.
A copy of the Code of Ethics is filed as an exhibit to this Form N-CSR.
| ITEM 3. | AUDIT COMMITTEE FINANCIAL EXPERT. |
Messrs. Robert E. Butler, John P. Kavanaugh and Robert W. Uek and Mses. Maryanne L. Roepke and Laurie J. Thomsen, members of the Audit Committee, have been determined by the Board of Trustees in their reasonable business judgment to meet the definition of “audit committee financial expert” as such term is defined in Form N-CSR. In addition, Messrs. Butler, Kavanaugh and Uek and Mses. Roepke and Thomsen are “independent” members of the Audit Committee (as such term has been defined by the Securities and Exchange Commission in regulations implementing Section 407 of the Sarbanes-Oxley Act of 2002). The Securities and Exchange Commission has stated that the designation of a person as an audit committee financial expert pursuant to this Item 3 on the Form N-CSR does not impose on such a person any duties, obligations or liability that are greater than the duties, obligations or liability imposed on such person as a member of the Audit Committee and the Board of Trustees in the absence of such designation or identification.
| ITEM 4. | PRINCIPAL ACCOUNTANT FEES AND SERVICES. |
Items 4(a) through 4(d) and 4(g):
The Board of Trustees has appointed Ernst & Young LLP (“E&Y”) to serve as independent accountants to the MFS Global Real Estate Fund (the “Fund”). The tables below set forth the audit fees billed to the Fund as well as fees for non-audit services provided to the Fund and/or to the Fund’s investment adviser, Massachusetts Financial Services Company (“MFS”), and to various entities either controlling, controlled by, or under common control with MFS that provide ongoing services to the Fund (“MFS Related Entities”).
For the fiscal years ended August 31, 2015^ and February 28, 2015 and 2014, audit fees billed to the Fund by E&Y were as follows:
| | | | | | | | | | | | |
| | | Audit Fees | |
| | August
2015 | | | February
2015 | | | February
2014 | |
Fees billed by E&Y: | | | | | | | | | | | | |
MFS Global Real Estate Fund^ | | | 48,148 | | | | 45,148 | | | | 44,406 | |
For the fiscal years ended August 31, 2015^ and February 28, 2015 and 2014, fees billed by E&Y for audit-related, tax and other services provided to the Fund and for audit-related, tax and other services provided to MFS and MFS Related Entities were as follows:
| | | | | | | | | | | | | | | | | | | | | | | | | | | | | | | | | | | | |
| | | Audit-Related Fees1 | | | Tax Fees2 | | | All Other Fees3 | |
| | August
2015 | | | February
2015 | | | February
2014 | | | August
2015 | | | February
2015 | | | February
2014 | | | August
2015 | | | February
2015 | | | February
2014 | |
Fees billed by E&Y: | | | | | | | | | | | | | | | | | | | | | | | | | | | | | | | | | | | | |
To MFS Global Real Estate Fund^ | | | 0 | | | | 0 | | | | 0 | | | | 9,917 | | | | 9,900 | | | | 9,779 | | | | 568 | | | | 0 | | | | 0 | |
| | | |
| | | Audit-Related Fees1 | | | Tax Fees2 | | | All Other Fees3 | |
| | August
2015 | | | February
2015 | | | February
2014 | | | August
2015 | | | February
2015 | | | February
2014 | | | August
2015 | | | February
2015 | | | February
2014 | |
Fees billed by E&Y: | | | | | | | | | | | | | | | | | | | | | | | | | | | | | | | | | | | | |
To MFS and MFS Related Entities of MFS Global Real Estate Fund ^, ^^, * | | | 825,954 | | | | 0 | | | | 0 | | | | 0 | | | | 0 | | | | 0 | | | | 0 | | | | 0 | | | | 0 | |
| | | | | | | | | | | | |
| | | Aggregate Fees for Non-audit
Services | |
| | August
2015 | | | February
2015 | | | February
2014 | |
Fees Billed by E&Y: | | | | | | | | | | | | |
To MFS Global Real Estate Fund, MFS and MFS Related Entities^, ^^, # | | | 922,439 | | | | 99,900 | | | | 72,779 | |
| ^ | Effective March 1, 2015, the fiscal year end of the Fund changed from February 28th to August 31st. Fees reported for the Fund for the fiscal year end August 31, 2015 only include fees billed during the period of March 1, 2015 through August 31, 2015. |
| ^^ | Fees reported for MFS and MFS Related Entities of the Fund for the Fund’s fiscal year end August 31, 2015 only include fees billed during the period of March 1, 2015 through August 31, 2015. |
| * | This amount reflects the fees billed to MFS and MFS Related Entities for non-audit services relating directly to the operations and financial reporting of the Funds (portions of which services also related to the operations and financial reporting of other funds within the MFS Funds complex). |
| # | This amount reflects the aggregate fees billed by E&Y for non-audit services rendered to the Funds and for non-audit services rendered to MFS and the MFS Related Entities. |
| 1 | The fees included under “Audit-Related Fees” are fees related to assurance and related services that are reasonably related to the performance of the audit or review of financial statements, but not reported under ‘‘Audit Fees,’’ including accounting consultations, agreed-upon procedure reports, attestation reports, comfort letters and internal control reviews. |
| 2 | The fees included under “Tax Fees” are fees associated with tax compliance, tax advice and tax planning, including services relating to the filing or amendment of federal, state or local income tax returns, regulated investment company qualification reviews and tax distribution and analysis. |
| 3 | The fees included under “All Other Fees” are fees for products and services provided by E&Y other than those reported under “Audit Fees,” “Audit-Related Fees” and “Tax Fees,” including fees for services related to review of internal controls and Rule 38a-1 compliance program. |
Item 4(e)(1):
Set forth below are the policies and procedures established by the Audit Committee of the Board of Trustees relating to the pre-approval of audit and non-audit related services:
To the extent required by applicable law, pre-approval by the Audit Committee of the Board is needed for all audit and permissible non-audit services rendered to the Fund and all permissible non-audit services rendered to MFS or MFS Related Entities if the services relate directly to the operations and financial reporting of the Registrant. Pre-approval is currently on an engagement-by-engagement basis. In the event pre-approval of such services is necessary between regular meetings of the Audit Committee and it is not practical to wait to seek pre-approval at the next regular meeting of the Audit Committee, pre-approval of such services may be referred to the Chair of the Audit Committee for approval; provided that the Chair may not pre-approve any individual engagement for such services exceeding $50,000 or multiple engagements for such services in the aggregate exceeding $100,000 between such regular meetings of the Audit Committee. Any engagement pre-approved by the Chair between regular meetings of the Audit Committee shall be presented for ratification by the entire Audit Committee at its next regularly scheduled meeting.
Item 4(e)(2):
None, or 0%, of the services relating to the Audit-Related Fees, Tax Fees and All Other Fees paid by the Fund and MFS and MFS Related Entities relating directly to the operations and financial reporting of the Registrant disclosed above were approved by the audit committee pursuant to paragraphs (c)(7)(i)(C) of Rule 2-01 of Regulation S-X (which permits audit committee approval after the start of the engagement with respect to services other than audit, review or attest services, if certain conditions are satisfied).
Item 4(f): Not applicable.
Item 4(h): The Registrant’s Audit Committee has considered whether the provision by a Registrant’s independent registered public accounting firm of non-audit services to MFS and MFS Related Entities that were not pre-approved by the Committee (because such services were provided prior to the effectiveness of SEC rules requiring pre-approval or because such services did not relate directly to the operations and financial reporting of the Registrant) was compatible with maintaining the independence of the independent registered public accounting firm as the Registrant’s principal auditors.
| ITEM 5. | AUDIT COMMITTEE OF LISTED REGISTRANTS. |
Not applicable to the Registrant.
A schedule of investments of the Registrant is included as part of the report to shareholders of such series under Item 1 of this Form N-CSR.
| ITEM 7. | DISCLOSURE OF PROXY VOTING POLICIES AND PROCEDURES FOR CLOSED-END MANAGEMENT INVESTMENT COMPANIES. |
Not applicable to the Registrant.
| ITEM 8. | PORTFOLIO MANAGERS OF CLOSED-END MANAGEMENT INVESTMENT COMPANIES. |
Not applicable to the Registrant.
| ITEM 9. | PURCHASES OF EQUITY SECURITIES BY CLOSED-END MANAGEMENT INVESTMENT COMPANY AND AFFILIATED PURCHASERS. |
Not applicable to the Registrant.
ITEM 10. SUBMISSION OF MATTERS TO A VOTE OF SECURITY HOLDERS.
There were no material changes to the procedures by which shareholders may send recommendations to the Board for nominees to the Registrant’s Board since the Registrant last provided disclosure as to such procedures in response to the requirements of Item 407 (c)(2)(iv) of Regulation S-K or this Item.
ITEM 11. CONTROLS AND PROCEDURES.
| (a) | Based upon their evaluation of the effectiveness of the registrant’s disclosure controls and procedures (as defined in Rule 30a-3(c) under the Investment Company Act of 1940 (the “Act”)) as conducted within 90 days of the filing date of this report on Form N-CSR, the registrant’s principal financial officer and principal executive officer have concluded that those disclosure controls and procedures provide reasonable assurance that the material information required to be disclosed by the registrant on this report is recorded, processed, summarized and reported within the time periods specified in the Securities and Exchange Commission’s rules and forms. |
| (b) | There were no changes in the registrant’s internal controls over financial reporting (as defined in Rule 30a-3(d) under the Act) that occurred during the second fiscal quarter of the period covered by the report that have materially affected, or are reasonably likely to materially affect, the registrant’s internal control over financial reporting. |
ITEM 12. EXHIBITS.
| (a) | File the exhibits listed below as part of this form. Letter or number the exhibits in the sequence indicated. |
| | (1) | Any code of ethics, or amendment thereto, that is the subject of the disclosure required by Item 2, to the extent that the registrant intends to satisfy the Item 2 requirements through filing of an exhibit: Code of Ethics attached hereto. |
| | (2) | A separate certification for each principal executive officer and principal financial officer of the registrant as required by Rule 30a-2(a) under the Act (17 CFR 270.30a-2): Attached hereto. |
| (b) | If the report is filed under Section 13(a) or 15(d) of the Exchange Act, provide the certifications required by Rule 30a-2(b) under the Act (17 CFR 270.30a-2(b)), Rule 13a-14(b) or Rule 15d-14(b) under the Exchange Act (17 CFR 240.13a-14(b) or 240.15d-14(b)) and Section 1350 of Chapter 63 of Title 18 of the United States Code (18 U.S.C. 1350) as an exhibit. A certification furnished pursuant to this paragraph will not be deemed “filed” for the purposes of Section 18 of the Exchange Act (15 U.S.C. 78r), or otherwise subject to the liability of that section. Such certification will not be deemed to be incorporated by reference into any filing under the Securities Act of 1933 or the Exchange Act, except to the extent that the registrant specifically incorporates it by reference: Attached hereto. |
Notice
A copy of the Amended and Restated Declaration of Trust, as amended, of the Registrant is on file with the Secretary of State of The Commonwealth of Massachusetts and notice is hereby given that this instrument is executed on behalf of the Registrant by an officer of the Registrant as an officer and not individually and the obligations of or arising out of this instrument are not binding upon any of the Trustees or shareholders individually, but are binding only upon the assets and property of the respective constituent series of the Registrant.
SIGNATURES
Pursuant to the requirements of the Securities Exchange Act of 1934 and the Investment Company Act of 1940, the registrant has duly caused this report to be signed on its behalf by the undersigned, thereunto duly authorized.
(Registrant) MFS SERIES TRUST XIII
| | |
| By (Signature and Title)* | | ROBIN A. STELMACH |
| | Robin A. Stelmach, President |
Date: October 15, 2015
Pursuant to the requirements of the Securities Exchange Act of 1934 and the Investment Company Act of 1940, this report has been signed below by the following persons on behalf of the registrant and in the capacities and on the dates indicated.
| | |
| By (Signature and Title)* | | ROBIN A. STELMACH |
| | Robin A. Stelmach, President (Principal Executive Officer) |
Date: October 15, 2015
| | |
| By (Signature and Title)* | | DAVID L. DILORENZO |
| | David L. DiLorenzo, Treasurer (Principal Financial Officer and Accounting Officer) |
Date: October 15, 2015
| * | Print name and title of each signing officer under his or her signature. |