UNITED STATES
SECURITIES AND EXCHANGE COMMISSION
Washington, D.C. 20549
FORM N-CSR
CERTIFIED SHAREHOLDER REPORT OF
REGISTERED MANAGEMENT INVESTMENT COMPANIES
Investment Company Act file number 811-03327
MFS SERIES TRUST XIII
(Exact name of registrant as specified in charter)
111 Huntington Avenue, Boston, Massachusetts 02199
(Address of principal executive offices) (Zip code)
Christopher R. Bohane
Massachusetts Financial Services Company
111 Huntington Avenue
Boston, Massachusetts 02199
(Name and address of agents for service)
Registrant’s telephone number, including area code: (617) 954-5000
Date of fiscal year end: February 28*
Date of reporting period: February 28, 2017
| * | This Form N-CSR pertains to the following series of the Registrant: MFS Diversified Income Fund, MFS Government Securities Fund and MFS New Discovery Value Fund. The remaining series of the Registrant has a fiscal year end other than February 28. |
| ITEM 1. | REPORTS TO STOCKHOLDERS. |
ANNUAL REPORT
February 28, 2017

MFS® DIVERSIFIED INCOME FUND

DIF-ANN
MFS® DIVERSIFIED INCOME FUND
CONTENTS
The report is prepared for the general information of shareholders.
It is authorized for distribution to prospective investors only when preceded or accompanied by a current prospectus.
NOT FDIC INSURED • MAY LOSE VALUE • NO BANK GUARANTEE
LETTER FROM THE EXECUTIVE CHAIRMAN

Dear Shareholders:
Despite June’s unexpected vote by the United Kingdom to leave the European Union and the surprising result in November’s U.S. presidential election, most markets have
proved resilient. U.S. share prices quickly reversed post-Brexit declines, and indices reached new highs following the November elections. U.S. bond yields rose after Donald Trump’s victory on hopes that his proposed policy mix of lower taxes, increased spending on infrastructure and a lower regulatory burden on businesses will lift both U.S. economic growth and inflation. However, interest rates in most developed markets remain very low, with major central banks maintaining extremely accommodative monetary policies to reinvigorate slow-growing economies against a backdrop of still-low inflation. Even after the rise in yields following the election, interest rates remain low by historical standards.
Globally, economic growth has shown signs of recovery of late, led by the United States and the eurozone. Despite better growth, there are few immediate signs of worrisome inflation. Emerging market economies are recovering at a somewhat slower pace amid fears that restrictive U.S. trade policies could further hamper the already slow pace of global trade growth. Looking ahead, markets will have to contend with a series of European elections during 2017, which, depending on the outcome, could further call into question the future direction of the European Union.
At MFS®, we believe in a patient, long-term approach to investing. Viewing investments with a long lens makes it possible to filter out short-term market noise and focus on achieving solid risk-adjusted returns over a full market cycle.
In our view, such an approach, along with the professional guidance of a financial advisor, will help you reach your investment objectives.
Respectfully,

Robert J. Manning
Executive Chairman
MFS Investment Management
April 13, 2017
The opinions expressed in this letter are subject to change and may not be relied upon for investment advice. No forecasts can be guaranteed.
1
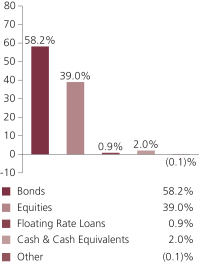
PORTFOLIO COMPOSITION
Portfolio structure (i)
| | | | |
| Top ten holdings (i) | |
| U.S. Treasury Notes, 1.625%, 6/30/2019 | | | 2.1% | |
| Fannie Mae, 4%, 30 Years | | | 1.9% | |
| Fannie Mae, 3.5%, 30 Years | | | 1.8% | |
| Public Storage, Inc., REIT | | | 1.6% | |
| Simon Property Group, Inc., REIT | | | 1.6% | |
| U.S. Treasury Notes, 2.5%, 8/15/2023 | | | 1.3% | |
| AvalonBay Communities, Inc., REIT | | | 1.3% | |
| U.S. Treasury Notes, 2.75%, 2/15/2019 | | | 1.3% | |
| Medical Properties Trust, Inc., REIT | | | 1.1% | |
| Mid-America Apartment Communities, Inc., REIT | | | 1.1% | |
| | | | |
| Fixed income sectors (i) | |
| High Yield Corporates | | | 24.3% | |
| Mortgage-Backed Securities | | | 11.1% | |
| U.S. Treasury Securities | | | 10.3% | |
| Emerging Markets Bonds | | | 9.6% | |
| U.S. Government Agencies | | | 1.2% | |
| Investment Grade Corporates | | | 1.0% | |
| Floating Rate Loans | | | 0.9% | |
| Commercial Mortgage-Backed Securities | | | 0.6% | |
| Collateralized Debt Obligations | | | 0.1% | |
| Asset-Backed Securities (o) | | | 0.0% | |
| Non-U.S. Government Bonds (o) | | | 0.0% | |
| |
| Equity sectors (i) | | | | |
| Financial Services | | | 22.3% | |
| Consumer Staples | | | 3.4% | |
| Utilities & Communications | | | 3.4% | |
| Health Care | | | 2.7% | |
| Technology | | | 1.9% | |
| Energy | | | 1.5% | |
| Industrial Goods & Services | | | 0.9% | |
| Leisure | | | 0.8% | |
| Basic Materials | | | 0.7% | |
| Retailing | | | 0.6% | |
| Autos & Housing | | | 0.6% | |
| Transportation | | | 0.2% | |
2
Portfolio Composition – continued
| | | | |
| Composition including fixed income credit quality (a)(i) | |
| AAA | | | 0.6% | |
| AA | | | 0.1% | |
| A | | | 0.3% | |
| BBB | | | 4.9% | |
| BB | | | 14.0% | |
| B | | | 12.6% | |
| CCC | | | 3.7% | |
| CC (o) | | | 0.0% | |
| C (o) | | | 0.0% | |
| D | | | 0.1% | |
| U.S. Government | | | 9.9% | |
| Federal Agencies | | | 12.3% | |
| Not Rated | | | 0.6% | |
| Non-Fixed Income | | | 39.0% | |
| Cash & Cash Equivalents | | | 2.0% | |
| Other | | | (0.1)% | |
| (a) | For all securities other than those specifically described below, ratings are assigned to underlying securities utilizing ratings from Moody’s, Fitch, and Standard & Poor’s rating agencies and applying the following hierarchy: If all three agencies provide a rating, the middle rating (after dropping the highest and lowest ratings) is assigned; if two of the three agencies rate a security, the lower of the two is assigned. Ratings are shown in the S&P and Fitch scale (e.g., AAA). Securities rated BBB or higher are considered investment grade. All ratings are subject to change. U.S. Government includes securities issued by the U.S. Department of the Treasury. Federal Agencies includes rated and unrated U.S. Agency fixed-income securities, U.S. Agency mortgage-backed securities, and collateralized mortgage obligations of U.S. Agency mortgage-backed securities. Not Rated includes fixed income securities, including fixed income futures contracts, which have not been rated by any rating agency. Non-Fixed Income includes equity securities (including convertible bonds and equity derivatives) and/or commodity-linked derivatives. The fund may or may not have held all of these instruments on this date. The fund is not rated by these agencies. |
| (i) | For purposes of this presentation, the components include the value of securities, and reflect the impact of the equivalent exposure of derivative positions, if any. These amounts may be negative from time to time. Equivalent exposure is a calculated amount that translates the derivative position into a reasonable approximation of the amount of the underlying asset that the portfolio would have to hold at a given point in time to have the same price sensitivity that results from the portfolio’s ownership of the derivative contract. When dealing with derivatives, equivalent exposure is a more representative measure of the potential impact of a position on portfolio performance than value. The bond component will include any accrued interest amounts. |
Where the fund holds convertible bonds, these are treated as part of the equity portion of the portfolio.
3
Portfolio Composition – continued
The fund invests a portion of its assets in the MFS High Yield Pooled Portfolio. Percentages reflect exposure to the underlying holdings, including Cash & Cash Equivalents and Other, of the MFS High Yield Pooled Portfolio and not to the exposure from investing directly in the MFS High Yield Pooled Portfolio itself.
Cash & Cash Equivalents includes any cash, investments in money market funds, short-term securities, and other assets less liabilities. Please see the Statement of Assets and Liabilities for additional information related to the fund’s cash position and other assets and liabilities.
Other includes equivalent exposure from currency derivatives and/or any offsets to derivative positions and may be negative.
Percentages are based on net assets as of 2/28/17.
The portfolio is actively managed and current holdings may be different.
4
MANAGEMENT REVIEW
Summary of Results
The MFS Diversified Income Fund (“fund”) includes investments in high yield corporate bonds, U.S. government securities, emerging markets debt, real estate investment trusts (“REITs”) and global equity securities.
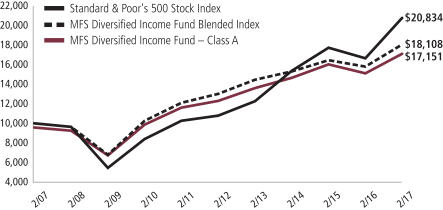
For the twelve months ended February 28, 2017, Class A shares of the fund provided a total return of 13.26%, at net asset value. This compares with a return of 24.98% for the fund’s benchmark, the Standard & Poor’s 500 Stock Index. The fund’s other benchmark, the MFS Diversified Income Fund Blended Index (“Blended Index”) generated a return of 14.42% over the reporting period. The Blended Index reflects the blended returns of various equity and fixed income market indices, with percentage allocations to each index designed to resemble the allocations of the fund. The market indices and related percentage allocations used to compile the Blended Index are set forth in the Performance Summary.
Market Environment
Global growth improved during much of the reporting period as oil prices recovered from their earlier plunge and fiscal and monetary stimulus from China took hold. Market confidence increased after the US elections in November in anticipation of lower taxes, a lighter regulatory burden and increased infrastructure spending, boosting US equities and bond yields. The US Federal Reserve increased interest rates by 25 basis points at the end of the period, the second hike of the cycle which began in December 2015. Globally, however, central bank policy remained highly accommodative, which forced many government, and even some corporate, bond yields into negative territory during the period. During the first half of the period, the United Kingdom voted to leave the European Union (“EU”), beginning a multi-year process of negotiation in order to achieve “Brexit.” While markets initially reacted to the vote with alarm, the spillover to European and emerging market (“EM”) economies was relatively short-lived, although risks of further hits to EU cohesiveness could re-emerge.
Headwinds from lower energy and commodity prices abated during the period as stabilizing oil prices helped push energy earnings higher relative to expectations. A sharp rise in the US dollar was an earnings headwind for multinationals. US consumer spending held up well during the second half of the period amid a modest increase in real wages and relatively low gasoline prices. Demand for autos reached near-record territory, while the housing market continued its recovery. Global trade, which was sluggish early in the period, showed signs of improvement in the period’s second half and EM countries began to show signs of a modest upturn in activity along with adjustment in their external accounts. These improved conditions appeared to have reassured investors and contributed to record inflows into the asset class during July and August as negative yields for an increasing share of developed market bonds drove yield-hungry investors further out on the risk spectrum. Similar investor inflows were experienced in the investment grade and high yield corporate markets. Late in the reporting period, however, new challenges emerged for emerging markets debt (“EMD”) as a result of the US presidential election, which raised concerns about the potential for a protectionist turn in US trade policy which could negatively impact EM
5
Management Review – continued
economies. These concerns, along with rising expectations for US growth, inflation and interest rates, have turned the tables on flows into EMD. Since the election, flows have reversed. As of the end of the period, the markets seemed to be in “wait-and-see” mode, looking for evidence to either confirm or refute the repricing of risk that has occurred since Election Day.
Factors Affecting Performance
During the reporting period, security selection within the fund’s high yield corporate debt segment was a primary factor that detracted from relative performance as the fund’s holdings in this asset class generated lower returns than the Bloomberg Barclays U.S. High-Yield Corporate Bond 2% Issuer Capped Index, which is a component of the Blended Index. To a lesser extent, poor security selection and an underweight allocation to the equity segment of the fund, also dampened relative results.
Strong security selection within both the fund’s REIT and Emerging Markets Debt segments contributed to relative performance during the reporting period.
Respectfully,
| | | | | | |
| William Adams | | Ward Brown | | David Cole | | Richard Gable |
| Portfolio Manager | | Portfolio Manager | | Portfolio Manager | | Portfolio Manager |
| | | |
| Matthew Ryan | | Jonathan Sage | | Geoffrey Schechter | | James Swanson |
| Portfolio Manager | | Portfolio Manager | | Portfolio Manager | | Portfolio Manager |
The views expressed in this report are those of the portfolio managers only through the end of the period of the report as stated on the cover and do not necessarily reflect the views of MFS or any other person in the MFS organization. These views are subject to change at any time based on market or other conditions, and MFS disclaims any responsibility to update such views. These views may not be relied upon as investment advice or an indication of trading intent on behalf of any MFS portfolio. References to specific securities are not recommendations of such securities, and may not be representative of any MFS portfolio’s current or future investments.
6
PERFORMANCE SUMMARY THROUGH 2/28/17
The following chart illustrates a representative class of the fund’s historical performance in comparison to its benchmark(s). Performance results include the deduction of the maximum applicable sales charge and reflect the percentage change in net asset value, including reinvestment of dividends and capital gains distributions. The performance of other share classes will be greater than or less than that of the class depicted below. Benchmarks are unmanaged and may not be invested in directly. Benchmark returns do not reflect sales charges, commissions or expenses. (See Notes to Performance Summary.)
Performance data shown represents past performance and is no guarantee of future results. Investment return and principal value fluctuate so your shares, when sold, may be worth more or less than the original cost; current performance may be lower or higher than quoted. The performance shown does not reflect the deduction of taxes, if any, that a shareholder would pay on fund distributions or the redemption of fund shares.
Growth of a Hypothetical $10,000 Investment
7
Performance Summary – continued
Total Returns through 2/28/17
Average annual without sales charge
| | | | | | | | | | | | | | |
| | | Share Class | | Class Inception Date | | 1-yr | | 5-yr | | 10-yr | | Life (t) | | |
| | | A | | 5/26/06 | | 13.26% | | 6.84% | | 6.00% | | N/A | | |
| | | C | | 5/26/06 | | 12.43% | | 6.06% | | 5.24% | | N/A | | |
| | | I | | 5/26/06 | | 13.54% | | 7.10% | | 6.28% | | N/A | | |
| | | R1 | | 7/01/08 | | 12.35% | | 6.03% | | N/A | | 6.61% | | |
| | | R2 | | 7/01/08 | | 12.98% | | 6.59% | | N/A | | 7.16% | | |
| | | R3 | | 7/01/08 | | 13.26% | | 6.84% | | N/A | | 7.41% | | |
| | | R4 | | 7/01/08 | | 13.53% | | 7.12% | | N/A | | 7.69% | | |
| | | R6 (formerly Class R5) | | 7/02/12 | | 13.65% | | N/A | | N/A | | 7.22% | | |
| Comparative benchmarks | | |
| | | Standard & Poor’s 500 Stock Index (f) | | 24.98% | | 14.01% | | 7.62% | | N/A | | |
| | | MFS Diversified Income Fund Blended Index (f)(w) | | 14.42% | | 6.79% | | 6.12% | | N/A | | |
| | | Bloomberg Barclays U.S. Government/Mortgage Bond
Index (f) | | (0.49)% | | 1.68% | | 3.96% | | N/A | | |
| | | Bloomberg Barclays U.S. High-Yield Corporate Bond 2%
Issuer Capped Index (f) | | 21.83% | | 6.84% | | 7.58% | | N/A | | |
| | | JPMorgan Emerging Markets Bond Index Global (f) | | 12.06% | | 5.20% | | 6.98% | | N/A | | |
| | | MSCI All Country World High Dividend Yield Index (f) | | 19.97% | | 7.55% | | 4.27% | | N/A | | |
| | | MSCI US REIT Index (f) | | 16.69% | | 11.47% | | 4.71% | | N/A | | |
| Average annual with sales charge | | |
| | | A With Initial Sales Charge (4.25%) | | | | 8.45% | | 5.91% | | 5.54% | | N/A | | |
| | | C
With CDSC (1% for 12 months) (v) | | 11.43% | | 6.06% | | 5.24% | | N/A | | |
CDSC – Contingent Deferred Sales Charge.
Class I, R1, R2, R3, R4, and R6 shares do not have a sales charge.
Effective August 26, 2016, Class R5 shares were renamed Class R6 shares.
| (f) | Source: FactSet Research Systems Inc. |
| (t) | For the period from the class inception date through the stated period end (for those share classes with less than 10 years of performance history). No comparative benchmark performance information is provided for “life” periods. (See Notes to Performance Summary.) |
| (v) | Assuming redemption at the end of the applicable period. |
| (w) | MFS Diversified Income Fund Blended Index is at a point in time and allocations during the period can change. As of February 28, 2017, the blended index was comprised of 25% Bloomberg Barclays U.S. High-Yield Corporate Bond 2% Issuer Capped Index, 20% Bloomberg Barclays U.S. Government/Mortgage Bond Index, 20% MSCI All Country World High Dividend Yield Index, 20% MSCI US REIT Index, and 15% JPMorgan Emerging Markets Bond Index Global. |
8
Performance Summary – continued
Benchmark Definition
Bloomberg Barclays U.S. Government/Mortgage Bond Index (formerly Barclays U.S. Government/Mortgage Bond Index) – measures debt issued by the U.S. Government, and its agencies, as well as mortgage-backed pass-through securities of Ginnie Mae (GNMA), Fannie Mae (FNMA), and Freddie Mac (FHLMC).
Bloomberg Barclays U.S. High-Yield Corporate Bond 2% Issuer Capped Index (formerly Barclays U.S. High-Yield Corporate Bond 2% Issuer Capped Index) – a component of the Bloomberg Barclays U.S. High-Yield Corporate Bond Index, which measures performance of non-investment grade, fixed rate debt. The index limits the maximum exposure to any one issuer to 2%.
JPMorgan Emerging Markets Bond Index Global – measures the performance of U.S. dollar-denominated debt instruments issued by emerging market sovereign and quasi-sovereign entities: Brady bonds, loans, Eurobonds.
MSCI All Country World High Dividend Yield Index – designed to reflect the performance of developed and emerging markets equities with higher-than-average dividend income and quality characteristics.
MSCI U.S. REIT Index – a market capitalization-weighted index that is designed to measure equity market performance for real estate investment trusts (REITs) that generate a majority of their revenue and income from real estate rental and leasing operations.
Standard & Poor’s 500 Stock Index – a market capitalization-weighted index of 500 widely held equity securities, designed to measure broad U.S. equity performance.
It is not possible to invest directly in an index.
Notes to Performance Summary
Average annual total return represents the average annual change in value for each share class for the periods presented. Life returns are presented where the share class has less than 10 years of performance history and represent the average annual total return from the class inception date to the stated period end date. As the fund’s share classes may have different inception dates, the life returns may represent different time periods and may not be comparable.
Performance results reflect any applicable expense subsidies and waivers in effect during the periods shown. Without such subsidies and waivers the fund’s performance results would be less favorable. Please see the prospectus and financial statements for complete details.
Performance results do not include adjustments made for financial reporting purposes in accordance with U.S. generally accepted accounting principles and may differ from amounts reported in the financial highlights.
From time to time the fund may receive proceeds from litigation settlements, without which performance would be lower.
9
EXPENSE TABLE
Fund expenses borne by the shareholders during the period, September 1, 2016 through February 28, 2017
As a shareholder of the fund, you incur two types of costs: (1) transaction costs, including sales charges (loads) on certain purchase or redemption payments, and (2) ongoing costs, including management fees; distribution and service (12b-1) fees; and other fund expenses. This example is intended to help you understand your ongoing costs (in dollars) of investing in the fund and to compare these costs with the ongoing costs of investing in other mutual funds.
In addition to the fees and expenses which the fund bears directly, the fund indirectly bears a pro rata share of the fees and expenses of the underlying MFS Pooled Portfolio in which the fund invests. MFS Pooled Portfolios are mutual funds advised by MFS that do not pay management fees to MFS but do incur investment and operating costs. If these transactional and indirect costs were included, your costs would have been higher.
The example is based on an investment of $1,000 invested at the beginning of the period and held for the entire period September 1, 2016 through February 28, 2017.
Actual Expenses
The first line for each share class in the following table provides information about actual account values and actual expenses. You may use the information in this line, together with the amount you invested, to estimate the expenses that you paid over the period. Simply divide your account value by $1,000 (for example, an $8,600 account value divided by $1,000 = 8.6), then multiply the result by the number in the first line under the heading entitled “Expenses Paid During Period” to estimate the expenses you paid on your account during this period.
Hypothetical Example for Comparison Purposes
The second line for each share class in the following table provides information about hypothetical account values and hypothetical expenses based on the fund’s actual expense ratio and an assumed rate of return of 5% per year before expenses, which is not the fund’s actual return. The hypothetical account values and expenses may not be used to estimate the actual ending account balance or expenses you paid for the period. You may use this information to compare the ongoing costs of investing in the fund and other funds. To do so, compare this 5% hypothetical example with the 5% hypothetical examples that appear in the shareholder reports of the other funds.
Please note that the expenses shown in the table are meant to highlight your ongoing costs only and do not reflect any transactional costs, such as sales charges (loads). Therefore, the second line for each share class in the table is useful in comparing ongoing costs only, and will not help you determine the relative total costs of owning different funds. In addition, if these transactional costs were included, your costs would have been higher.
10
Expense Table – continued
| | | | | | | | | | | | | | | | | | |
Share Class | | | | Annualized Expense Ratio | | | Beginning
Account Value 9/01/16 | | | Ending
Account Value 2/28/17 | | | Expenses
Paid During
Period (p) 9/01/16-2/28/17 | |
| A | | Actual | | | 1.00% | | | | $1,000.00 | | | | $1,016.35 | | | | $5.00 | |
| | Hypothetical (h) | | | 1.00% | | | | $1,000.00 | | | | $1,019.84 | | | | $5.01 | |
| C | | Actual | | | 1.75% | | | | $1,000.00 | | | | $1,013.37 | | | | $8.74 | |
| | Hypothetical (h) | | | 1.75% | | | | $1,000.00 | | | | $1,016.12 | | | | $8.75 | |
| I | | Actual | | | 0.76% | | | | $1,000.00 | | | | $1,017.61 | | | | $3.80 | |
| | Hypothetical (h) | | | 0.76% | | | | $1,000.00 | | | | $1,021.03 | | | | $3.81 | |
| R1 | | Actual | | | 1.75% | | | | $1,000.00 | | | | $1,012.56 | | | | $8.73 | |
| | Hypothetical (h) | | | 1.75% | | | | $1,000.00 | | | | $1,016.12 | | | | $8.75 | |
| R2 | | Actual | | | 1.25% | | | | $1,000.00 | | | | $1,015.90 | | | | $6.25 | |
| | Hypothetical (h) | | | 1.25% | | | | $1,000.00 | | | | $1,018.60 | | | | $6.26 | |
| R3 | | Actual | | | 1.00% | | | | $1,000.00 | | | | $1,016.34 | | | | $5.00 | |
| | Hypothetical (h) | | | 1.00% | | | | $1,000.00 | | | | $1,019.84 | | | | $5.01 | |
| R4 | | Actual | | | 0.75% | | | | $1,000.00 | | | | $1,018.43 | | | | $3.75 | |
| | Hypothetical (h) | | | 0.75% | | | | $1,000.00 | | | | $1,021.08 | | | | $3.76 | |
| R6 | | Actual | | | 0.66% | | | | $1,000.00 | | | | $1,018.11 | | | | $3.30 | |
| | Hypothetical (h) | | | 0.66% | | | | $1,000.00 | | | | $1,021.52 | | | | $3.31 | |
| (h) | 5% class return per year before expenses. |
| (p) | “Expenses Paid During Period” are equal to each class’s annualized expense ratio, as shown above, multiplied by the average account value over the period, multiplied by 181/365 (to reflect the one-half year period). Expenses paid do not include any applicable sales charges (loads). If these transaction costs had been included, your costs would have been higher. In addition to the fees and expenses which the fund bears directly, the fund indirectly bears a pro rata share of the fees and expenses of the underlying funds in which the fund invests. If these indirect costs were included, your costs would have been higher. |
11
PORTFOLIO OF INVESTMENTS
2/28/17
The Portfolio of Investments is a complete list of all securities owned by your fund. It is categorized by broad-based asset classes.
| | | | | | | | |
| Bonds - 32.2% | | | | | | | | |
| Issuer | | Shares/Par | | | Value ($) | |
| Agency - Other - 0.1% | | | | | | | | |
| Financing Corp., 9.4%, 2/08/2018 | | $ | 965,000 | | | $ | 1,039,767 | |
| Financing Corp., 10.35%, 8/03/2018 | | | 715,000 | | | | 807,741 | |
| Financing Corp., STRIPS, 0%, 11/30/2017 | | | 860,000 | | | | 853,860 | |
| | | | | | | | |
| | | | | | | $ | 2,701,368 | |
| Asset-Backed & Securitized - 0.7% | | | | | | | | |
| Cent CLO LP, 2014-21A, “A1”, FRN, 2.527%, 7/27/2026 (z) | | $ | 3,552,111 | | | $ | 3,552,111 | |
| Citigroup Commercial Mortgage Trust, 2015-GC27, “A5”, 3.137%, 2/10/2048 | | | 2,850,000 | | | | 2,850,588 | |
| Citigroup Commercial Mortgage Trust, FRN, 5.724%, 12/10/2049 | | | 198,555 | | | | 15,102 | |
| CNH Equipment Trust, 2015-C, “A2B”, FRN, 1.24%, 12/17/2018 | | | 284,148 | | | | 284,234 | |
| Commercial Mortgage Trust, 2015-DC1, “A5”, 3.35%, 2/10/2048 | | | 2,574,000 | | | | 2,600,939 | |
| Commercial Mortgage Trust, 2015-PC1, “A5”, 3.902%, 7/10/2050 | | | 1,800,000 | | | | 1,886,706 | |
| Credit Suisse Commercial Mortgage Trust, “A4”, FRN, 5.941%, 9/15/2039 | | | 452,601 | | | | 456,211 | |
| Credit Suisse Commercial Mortgage Trust, “AM”, FRN, 5.638%, 6/15/2039 | | | 852,108 | | | | 859,564 | |
| Credit Suisse Commercial Mortgage Trust, “C4”, FRN, 5.941%, 9/15/2039 | | | 809,025 | | | | 819,151 | |
| CSAIL Commercial Mortgage Trust, 2015-C2, “A4”, 3.504%, 6/15/2057 | | | 58,835 | | | | 60,185 | |
| CWCapital Cobalt Ltd., “A4”, FRN, 5.775%, 5/15/2046 | | | 716,212 | | | | 720,125 | |
| Ford Credit Floorplan Master Owner Trust, 2015-4, “A2”, FRN, 1.37%, 8/15/2020 | | | 691,000 | | | | 694,455 | |
| Fortress Credit BSL Ltd., 2013-1A, “A”, FRN, 2.205%, 1/19/2025 (n) | | | 1,210,616 | | | | 1,212,903 | |
| GS Mortgage Securities Trust, 2015-GC30, “A4”, 3.382%, 5/10/2050 | | | 1,750,000 | | | | 1,779,377 | |
| JPMBB Commercial Mortgage Securities Trust, 2014-C26, 3.494%, 1/15/2048 | | | 1,888,516 | | | | 1,946,106 | |
| JPMorgan Chase Commercial Mortgage Securities Corp., “A4”, FRN, 5.787%, 6/15/2049 | | | 781,730 | | | | 783,298 | |
| Morgan Stanley Capital I Trust, “AM”, FRN, 5.715%, 4/15/2049 | | | 945,000 | | | | 946,144 | |
| Wells Fargo Commercial Mortgage Trust, 2015-C28, “A4”, 3.54%, 5/15/2048 | | | 1,516,848 | | | | 1,557,618 | |
12
Portfolio of Investments – continued
| | | | | | | | |
| Issuer | | Shares/Par | | | Value ($) | |
| Bonds - continued | | | | | | | | |
| Asset-Backed & Securitized - continued | | | | | | | | |
| Wells Fargo Commercial Mortgage Trust, 2015-NXS1, “A5”, 3.148%, 5/15/2048 | | $ | 1,258,254 | | | $ | 1,263,931 | |
| Wells Fargo Commercial Mortgage Trust, 2016-LC25, “A4”, 3.64%, 11/15/2026 | | | 2,500,000 | | | | 2,582,754 | |
| | | | | | | | |
| | | | | | | $ | 26,871,502 | |
| Automotive - 0.1% | | | | | | | | |
| Ford Motor Credit Co. LLC, 2.551%, 10/05/2018 | | $ | 748,000 | | | $ | 754,264 | |
| Hyundai Capital America, 2%, 3/19/2018 (n) | | | 810,000 | | | | 811,062 | |
| Hyundai Capital America, 2.4%, 10/30/2018 (n) | | | 182,000 | | | | 182,688 | |
| | | | | | | | |
| | | | | | | $ | 1,748,014 | |
| Building - 0.3% | | | | | | | | |
| Cimpor Financial Operations B.V., 5.75%, 7/17/2024 (n) | | $ | 618,000 | | | $ | 548,475 | |
| Elementia S.A. de C.V., 5.5%, 1/15/2025 (n) | | | 4,284,000 | | | | 4,209,030 | |
| Union Andina de Cementos S.A.A., 5.875%, 10/30/2021 (n) | | | 6,819,000 | | | | 7,108,808 | |
| | | | | | | | |
| | | | | | | $ | 11,866,313 | |
| Business Services - 0.0% | | | | | | | | |
| Cisco Systems, Inc., 2.6%, 2/28/2023 | | $ | 1,052,000 | | | $ | 1,050,628 | |
| | |
| Cable TV - 0.1% | | | | | | | | |
| VTR Finance B.V., 6.875%, 1/15/2024 (n) | | $ | 4,248,000 | | | $ | 4,502,880 | |
| | |
| Chemicals - 0.1% | | | | | | | | |
| Consolidated Energy Finance S.A., 6.75%, 10/15/2019 (n) | | $ | 4,558,000 | | | $ | 4,614,975 | |
| | |
| Computer Software - 0.0% | | | | | | | | |
| Microsoft Corp., 3.125%, 11/03/2025 | | $ | 476,000 | | | $ | 477,920 | |
| | |
| Computer Software - Systems - 0.0% | | | | | | | | |
| Apple, Inc., 3.25%, 2/23/2026 | | $ | 1,404,000 | | | $ | 1,425,155 | |
| | |
| Construction - 0.0% | | | | | | | | |
| Empresas ICA S.A.B. de C.V., 8.375%, 7/24/2017 (a)(d)(n) | | $ | 1,409,000 | | | $ | 338,160 | |
| Empresas ICA S.A.B. de C.V., 8.875%, 5/29/2024 (a)(d) | | | 2,102,000 | | | | 491,237 | |
| Empresas ICA S.A.B. de C.V., 8.875%, 5/29/2024 (a)(d)(n) | | | 3,072,000 | | | | 717,926 | |
| | | | | | | | |
| | | | | | | $ | 1,547,323 | |
| Consumer Products - 0.1% | | | | | | | | |
| Controladora Mabe S.A. de C.V., 7.875%, 10/28/2019 | | $ | 1,424,000 | | | $ | 1,562,840 | |
| Newell Rubbermaid, Inc., 3.15%, 4/01/2021 | | | 998,000 | | | | 1,017,841 | |
| | | | | | | | |
| | | | | | | $ | 2,580,681 | |
13
Portfolio of Investments – continued
| | | | | | | | |
| Issuer | | Shares/Par | | | Value ($) | |
| Bonds - continued | | | | | | | | |
| Consumer Services - 0.1% | | | | | | | | |
| Grupo Posadas S.A.B. de C.V., 7.875%, 6/30/2022 (n) | | $ | 2,656,000 | | | $ | 2,742,320 | |
| | |
| Emerging Market Quasi-Sovereign - 2.4% | | | | | | | | |
| Autoridad del Canal de Panama, 4.95%, 7/29/2035 (n) | | $ | 281,000 | | | $ | 299,265 | |
| Banco do Brasil S.A., 6.25% to 4/15/2024, FRN to 10/29/2049 (n) | | | 3,705,000 | | | | 2,985,415 | |
| Banco Nacional de Comercio Exterior, S.N.C., 3.8% to 8/11/2021, FRN to 8/11/2026 (n) | | | 2,508,000 | | | | 2,432,760 | |
| CNOOC Finance (2012) Ltd., 3.875%, 5/02/2022 (n) | | | 1,123,000 | | | | 1,165,476 | |
| CNPC (HK) Overseas Capital Ltd., 4.5%, 4/28/2021 (n) | | | 2,287,000 | | | | 2,432,736 | |
| Corporacion Financiera de Desarrollo S.A., 4.75%, 2/08/2022 (n) | | | 2,106,000 | | | | 2,246,260 | |
| Corporacion Financiera de Desarrollo S.A., 4.75%, 7/15/2025 (n) | | | 3,928,000 | | | | 4,171,536 | |
| Development Bank of Kazakhstan, 4.125%, 12/10/2022 | | | 4,894,000 | | | | 4,841,282 | |
| Empresa Nacional del Petroleo, 4.75%, 12/06/2021 | | | 1,721,000 | | | | 1,815,391 | |
| Empresa Nacional del Petroleo, 4.375%, 10/30/2024 (n) | | | 2,469,000 | | | | 2,533,705 | |
| Export-Import Bank of India, 3.375%, 8/05/2026 (n) | | | 316,000 | | | | 304,003 | |
| Gaz Capital S.A., 4.95%, 2/06/2028 (n) | | | 3,726,000 | | | | 3,722,855 | |
| Hrvatska Elektroprivreda, 5.875%, 10/23/2022 (n) | | | 3,146,000 | | | | 3,346,388 | |
| Lima Metro Line 2 Finance Ltd., 5.875%, 7/05/2034 | | | 4,620,000 | | | | 4,885,650 | |
| Magyar Export-Import Bank PLC, 4%, 1/30/2020 | | | 2,518,000 | | | | 2,581,192 | |
| Majapahit Holding B.V., 7.875%, 6/29/2037 | | | 2,000,000 | | | | 2,542,500 | |
| NTPC Ltd., 4.375%, 11/26/2024 | | | 5,157,000 | | | | 5,356,560 | |
| Office Cherifien des Phosphates S.A., 4.5%, 10/22/2025 (n) | | | 2,898,000 | | | | 2,835,751 | |
| Office Cherifien des Phosphates S.A., 6.875%, 4/25/2044 (n) | | | 2,519,000 | | | | 2,682,735 | |
| ONGC Videsh Ltd., 4.625%, 7/15/2024 | | | 5,783,000 | | | | 6,106,848 | |
| Pertamina PT, 6%, 5/03/2042 | | | 3,260,000 | | | | 3,397,859 | |
| Pertamina PT, 5.625%, 5/20/2043 (n) | | | 4,150,000 | | | | 4,172,360 | |
| Pertamina PT, 6.45%, 5/30/2044 (n) | | | 3,276,000 | | | | 3,614,794 | |
| Petrobras Global Finance B.V., 8.75%, 5/23/2026 | | | 3,050,000 | | | | 3,460,225 | |
| PT Perusahaan Gas Negara (Persero) Tbk, 5.125%, 5/16/2024 (n) | | | 2,533,000 | | | | 2,672,386 | |
| Sinopec Capital (2013) Ltd., 4.25%, 4/24/2043 (n) | | | 2,765,000 | | | | 2,698,071 | |
| Sinopec Group Overseas Development (2014) Ltd., 4.375%, 4/10/2024 (n) | | | 1,301,000 | | | | 1,382,119 | |
| Southern Gas Corridor CJSC, 6.875%, 3/24/2026 (n) | | | 2,087,000 | | | | 2,298,831 | |
| State Oil Company of the Azerbaijan Republic, 4.75%, 3/13/2023 | | | 3,933,000 | | | | 3,864,172 | |
| State Oil Company of the Azerbaijan Republic, 6.95%, 3/18/2030 | | | 2,926,000 | | | | 3,138,720 | |
| Turkiye Ihracat Kredi Bankasi A.S., 5.875%, 4/24/2019 (n) | | | 2,725,000 | | | | 2,814,293 | |
| | | | | | | | |
| | | | | | | $ | 92,802,138 | |
14
Portfolio of Investments – continued
| | | | | | | | |
| Issuer | | Shares/Par | | | Value ($) | |
| Bonds - continued | | | | | | | | |
| Emerging Market Sovereign - 3.8% | | | | | | | | |
| Arab Republic of Egypt, 6.125%, 1/31/2022 (n) | | $ | 2,754,000 | | | $ | 2,860,717 | |
| Dominican Republic, 5.5%, 1/27/2025 (n) | | | 1,211,000 | | | | 1,235,220 | |
| Dominican Republic, 6.875%, 1/29/2026 | | | 3,350,000 | | | | 3,678,199 | |
| Dominican Republic, 8.625%, 4/20/2027 | | | 2,335,000 | | | | 2,739,585 | |
| Government of Ukraine, 7.75%, 9/01/2020 | | | 4,814,000 | | | | 4,777,895 | |
| Government of Ukraine, 7.75%, 9/01/2024 (n) | | | 2,600,000 | | | | 2,457,208 | |
| Government of Ukraine, 7.75%, 9/01/2025 (n) | | | 2,600,000 | | | | 2,430,470 | |
| Government of Ukraine, 7.75%, 9/01/2025 | | | 600,000 | | | | 560,878 | |
| Republic of Argentina, 6.875%, 4/22/2021 (n) | | | 6,587,000 | | | | 7,028,329 | |
| Republic of Argentina, 7.5%, 4/22/2026 | | | 1,500,000 | | | | 1,567,500 | |
| Republic of Argentina, 7.5%, 4/22/2026 (n) | | | 4,428,000 | | | | 4,627,260 | |
| Republic of Argentina, 2.5% to 3/31/2019, 3.75% to 3/31/2029, 5.25% to 12/31/2038 | | | 6,131,000 | | | | 3,862,530 | |
| Republic of Colombia, 6.125%, 1/18/2041 | | | 2,582,000 | | | | 2,914,432 | |
| Republic of Cote d’Ivoire, 6.375%, 3/03/2028 (n) | | | 2,834,000 | | | | 2,812,887 | |
| Republic of Croatia, 5.5%, 4/04/2023 (n) | | | 1,410,000 | | | | 1,514,269 | |
| Republic of Hungary, 6.25%, 1/29/2020 | | | 2,470,000 | | | | 2,717,741 | |
| Republic of Hungary, 6.375%, 3/29/2021 | | | 2,502,000 | | | | 2,805,618 | |
| Republic of Hungary, 5.75%, 11/22/2023 | | | 4,366,000 | | | | 4,929,563 | |
| Republic of Hungary, 5.375%, 3/25/2024 | | | 5,344,000 | | | | 5,933,016 | |
| Republic of Indonesia, 4.875%, 5/05/2021 (n) | | | 1,278,000 | | | | 1,371,363 | |
| Republic of Indonesia, 5.375%, 10/17/2023 (n) | | | 3,600,000 | | | | 3,983,162 | |
| Republic of Indonesia, 5.875%, 1/15/2024 (n) | | | 2,730,000 | | | | 3,100,518 | |
| Republic of Indonesia, 4.125%, 1/15/2025 (n) | | | 2,232,000 | | | | 2,287,450 | |
| Republic of Indonesia, 4.75%, 1/08/2026 (n) | | | 4,918,000 | | | | 5,248,578 | |
| Republic of Indonesia, 6.75%, 1/15/2044 (n) | | | 1,060,000 | | | | 1,359,268 | |
| Republic of Kazakhstan, 5.125%, 7/21/2025 (n) | | | 2,952,000 | | | | 3,195,540 | |
| Republic of Kazakhstan, 6.5%, 7/21/2045 (n) | | | 711,000 | | | | 832,780 | |
| Republic of Panama, 3.875%, 3/17/2028 | | | 4,293,000 | | | | 4,353,102 | |
| Republic of Paraguay, 4.625%, 1/25/2023 (n) | | | 2,912,000 | | | | 2,999,360 | |
| Republic of Paraguay, 6.1%, 8/11/2044 | | | 4,422,000 | | | | 4,576,770 | |
| Republic of Paraguay, 6.1%, 8/11/2044 (n) | | | 2,621,000 | | | | 2,712,735 | |
| Republic of South Africa, 4.875%, 4/14/2026 | | | 3,453,000 | | | | 3,544,995 | |
| Republic of South Africa, 4.3%, 10/12/2028 | | | 3,694,000 | | | | 3,555,475 | |
| Republic of Sri Lanka, 6.125%, 6/03/2025 | | | 8,941,000 | | | | 9,011,705 | |
| Republic of Sri Lanka, 6.85%, 11/03/2025 | | | 4,040,000 | | | | 4,202,315 | |
| Republic of Sri Lanka, 6.825%, 7/18/2026 (n) | | | 5,702,000 | | | | 5,931,426 | |
| Republic of Turkey, 3.25%, 3/23/2023 | | | 2,486,000 | | | | 2,261,266 | |
| Republic of Turkey, 5.75%, 3/22/2024 | | | 3,383,000 | | | | 3,472,480 | |
| Republic of Turkey, 7.375%, 2/05/2025 | | | 1,983,000 | | | | 2,223,935 | |
| Republic of Turkey, 4.875%, 10/09/2026 | | | 3,189,000 | | | | 3,028,367 | |
| Republic of Turkey, 6.875%, 3/17/2036 | | | 1,403,000 | | | | 1,493,550 | |
| Russian Federation, 4.5%, 4/04/2022 (n) | | | 1,800,000 | | | | 1,910,084 | |
15
Portfolio of Investments – continued
| | | | | | | | |
| Issuer | | Shares/Par | | | Value ($) | |
| Bonds - continued | | | | | | | | |
| Emerging Market Sovereign - continued | | | | | | | | |
| Russian Federation, 4.875%, 9/16/2023 | | $ | 3,200,000 | | | $ | 3,441,408 | |
| Russian Federation, 5.875%, 9/16/2043 (n) | | | 4,000,000 | | | | 4,524,480 | |
| | | | | | | | |
| | | | | | | $ | 146,075,429 | |
| Energy - Independent - 0.1% | | | | | | | | |
| Afren PLC, 11.5%, 2/01/2018 (a)(d)(n) | | $ | 200,000 | | | $ | 40 | |
| Tengizchevroil Finance Co. International Ltd., 4%, 8/15/2026 (n) | | | 2,119,000 | | | | 2,032,651 | |
| | | | | | | | |
| | | | | | | $ | 2,032,691 | |
| Energy - Integrated - 0.2% | | | | | | | | |
| Inkia Energy Ltd., 8.375%, 4/04/2021 | | $ | 3,013,000 | | | $ | 3,099,624 | |
| Reliance Industries Ltd., 4.125%, 1/28/2025 (n) | | | 4,120,000 | | | | 4,208,555 | |
| | | | | | | | |
| | | | | | | $ | 7,308,179 | |
| Financial Institutions - 0.0% | | | | | | | | |
| Gruposura Finance S.A., 5.5%, 4/29/2026 (n) | | $ | 724,000 | | | $ | 770,155 | |
| | |
| Food & Beverages - 0.2% | | | | | | | | |
| Central American Bottling Corp., 5.75%, 1/31/2027 (n) | | $ | 800,000 | | | $ | 828,000 | |
| Corporacion Lindley S.A., 6.75%, 11/23/2021 (n) | | | 1,145,000 | | | | 1,288,125 | |
| Corporacion Lindley S.A., 6.75%, 11/23/2021 | | | 1,010,000 | | | | 1,136,250 | |
| Minerva Luxembourg S.A., 6.5%, 9/20/2026 (n) | | | 5,500,000 | | | | 5,458,750 | |
| | | | | | | | |
| | | | | | | $ | 8,711,125 | |
| Local Authorities - 0.2% | | | | | | | | |
| Buenos Aires Province, 7.5%, 6/01/2027 (n) | | $ | 1,989,000 | | | $ | 2,043,697 | |
| Provincia de Buenos Aires, “A”, 6.5%, 2/15/2023 (n) | | | 171,000 | | | | 171,000 | |
| Provincia de Buenos Aires, “A”, 7.875%, 6/15/2027 (n) | | | 4,358,000 | | | | 4,356,693 | |
| State of California (Build America Bonds), 7.6%, 11/01/2040 | | | 970,000 | | | | 1,450,082 | |
| University of California Rev. (Build America Bonds), 5.77%, 5/15/2043 | | | 60,000 | | | | 74,804 | |
| | | | | | | | |
| | | | | | | $ | 8,096,276 | |
| Mortgage-Backed - 11.0% | | | | | | | | |
| Fannie Mae, 5.43%, 4/01/2017 | | $ | 1,169 | | | $ | 1,167 | |
| Fannie Mae, 1.9%, 6/01/2017 | | | 180,910 | | | | 180,756 | |
| Fannie Mae, 5.388%, 6/01/2017 | | | 10,978 | | | | 11,002 | |
| Fannie Mae, 5.5%, 8/01/2017 - 4/01/2040 | | | 8,130,727 | | | | 9,136,336 | |
| Fannie Mae, 2.71%, 11/01/2017 | | | 51,894 | | | | 52,045 | |
| Fannie Mae, 3.189%, 12/01/2017 | | | 189,013 | | | | 190,010 | |
| Fannie Mae, 6%, 12/01/2017 - 6/01/2038 | | | 584,354 | | | | 663,931 | |
| Fannie Mae, 3.8%, 2/01/2018 | | | 193,681 | | | | 195,833 | |
| Fannie Mae, 4%, 3/01/2018 - 2/01/2045 | | | 58,800,033 | | | | 62,146,948 | |
| Fannie Mae, 3.99%, 4/01/2018 - 7/01/2021 | | | 965,144 | | | | 1,021,968 | |
16
Portfolio of Investments – continued
| | | | | | | | |
| Issuer | | Shares/Par | | | Value ($) | |
| Bonds - continued | | | | | | | | |
| Mortgage-Backed - continued | | | | | | | | |
| Fannie Mae, 5.286%, 6/01/2018 | | $ | 248,866 | | | $ | 256,304 | |
| Fannie Mae, 3.828%, 7/01/2018 | | | 187,411 | | | | 191,790 | |
| Fannie Mae, 5%, 9/01/2018 - 3/01/2042 | | | 10,627,126 | | | | 11,675,465 | |
| Fannie Mae, 2.578%, 9/25/2018 | | | 1,203,128 | | | | 1,213,081 | |
| Fannie Mae, 5.1%, 3/01/2019 | | | 106,554 | | | | 111,812 | |
| Fannie Mae, 5.51%, 3/01/2019 | | | 107,513 | | | | 113,456 | |
| Fannie Mae, 5.08%, 4/01/2019 | | | 22,154 | | | | 23,544 | |
| Fannie Mae, 4.5%, 6/01/2019 - 2/01/2046 | | | 29,564,934 | | | | 31,857,208 | |
| Fannie Mae, 4.829%, 8/01/2019 | | | 71,143 | | | | 75,651 | |
| Fannie Mae, 4.83%, 8/01/2019 - 9/01/2019 | | | 66,836 | | | | 71,064 | |
| Fannie Mae, 5.05%, 8/01/2019 | | | 22,426 | | | | 23,915 | |
| Fannie Mae, 4.6%, 9/01/2019 | | | 121,419 | | | | 128,370 | |
| Fannie Mae, 4.67%, 9/01/2019 | | | 27,156 | | | | 28,809 | |
| Fannie Mae, 4.45%, 10/01/2019 | | | 84,396 | | | | 89,228 | |
| Fannie Mae, 4.88%, 3/01/2020 | | | 368,247 | | | | 384,578 | |
| Fannie Mae, 4.14%, 8/01/2020 | | | 39,712 | | | | 42,145 | |
| Fannie Mae, 5.19%, 9/01/2020 | | | 91,863 | | | | 97,603 | |
| Fannie Mae, 3.416%, 10/01/2020 | | | 797,471 | | | | 829,691 | |
| Fannie Mae, 4.448%, 1/01/2021 | | | 609,991 | | | | 648,127 | |
| Fannie Mae, 3.87%, 7/01/2022 | | | 935,836 | | | | 992,174 | |
| Fannie Mae, 2.152%, 1/25/2023 | | | 1,298,000 | | | | 1,274,121 | |
| Fannie Mae, 2.41%, 5/01/2023 | | | 235,340 | | | | 234,294 | |
| Fannie Mae, 2.55%, 5/01/2023 | | | 203,202 | | | | 203,836 | |
| Fannie Mae, 2.62%, 5/01/2023 | | | 279,421 | | | | 281,347 | |
| Fannie Mae, 3.65%, 9/01/2023 | | | 816,614 | | | | 864,822 | |
| Fannie Mae, 3.78%, 10/01/2023 | | | 477,882 | | | | 507,096 | |
| Fannie Mae, 3.92%, 10/01/2023 | | | 987,000 | | | | 1,055,398 | |
| Fannie Mae, 4.5%, 5/01/2025 | | | 21,960 | | | | 23,001 | |
| Fannie Mae, 2.7%, 7/01/2025 | | | 680,000 | | | | 671,826 | |
| Fannie Mae, 3.96%, 11/01/2025 | | | 551,722 | | | | 594,207 | |
| Fannie Mae, 3.59%, 9/01/2026 | | | 375,747 | | | | 394,616 | |
| Fannie Mae, 3%, 3/01/2027 - 11/01/2046 | | | 30,740,230 | | | | 31,224,338 | |
| Fannie Mae, 4.01%, 1/01/2029 | | | 717,157 | | | | 775,482 | |
| Fannie Mae, 4.96%, 6/01/2030 | | | 1,226,894 | | | | 1,362,186 | |
| Fannie Mae, 6.5%, 1/01/2033 - 10/01/2037 | | | 131,359 | | | | 149,348 | |
| Fannie Mae, 3.5%, 1/01/2042 - 10/01/2046 | | | 42,531,565 | | | | 43,749,350 | |
| Fannie Mae, FRN, 1.128%, 5/25/2018 | | | 940,674 | | | | 940,971 | |
| Fannie Mae, TBA, 3%, 3/01/2032 | | | 10,675,000 | | | | 10,976,902 | |
| Fannie Mae, TBA, 3.5%, 3/01/2047 | | | 22,990,000 | | | | 23,566,545 | |
| Fannie Mae, TBA, 4%, 3/01/2047 | | | 8,750,000 | | | | 9,195,777 | |
| Freddie Mac, 6%, 8/01/2017 - 10/01/2038 | | | 678,891 | | | | 777,620 | |
| Freddie Mac, 5%, 10/01/2017 - 6/01/2040 | | | 310,051 | | | | 333,320 | |
| Freddie Mac, 3.154%, 2/25/2018 | | | 599,726 | | | | 606,657 | |
17
Portfolio of Investments – continued
| | | | | | | | |
| Issuer | | Shares/Par | | | Value ($) | |
| Bonds - continued | | | | | | | | |
| Mortgage-Backed - continued | | | | | | | | |
| Freddie Mac, 2.699%, 5/25/2018 | | $ | 2,422,754 | | | $ | 2,450,235 | |
| Freddie Mac, 2.412%, 8/25/2018 | | | 2,900,085 | | | | 2,927,549 | |
| Freddie Mac, 2.303%, 9/25/2018 | | | 1,515,000 | | | | 1,529,034 | |
| Freddie Mac, 2.323%, 10/25/2018 | | | 1,755,264 | | | | 1,774,007 | |
| Freddie Mac, 1.72%, 1/25/2019 | | | 1,465,068 | | | | 1,468,163 | |
| Freddie Mac, 2.13%, 1/25/2019 | | | 1,731,778 | | | | 1,744,821 | |
| Freddie Mac, 2.086%, 3/25/2019 | | | 1,400,000 | | | | 1,409,846 | |
| Freddie Mac, 5.085%, 3/25/2019 | | | 2,160,000 | | | | 2,279,185 | |
| Freddie Mac, 1.883%, 5/25/2019 | | | 1,000,000 | | | | 1,002,812 | |
| Freddie Mac, 2.456%, 8/25/2019 | | | 2,109,000 | | | | 2,136,433 | |
| Freddie Mac, 4.186%, 8/25/2019 | | | 1,484,668 | | | | 1,561,738 | |
| Freddie Mac, 4.251%, 1/25/2020 | | | 400,000 | | | | 424,385 | |
| Freddie Mac, 4.224%, 3/25/2020 | | | 320,000 | | | | 340,038 | |
| Freddie Mac, 3.808%, 8/25/2020 | | | 806,000 | | | | 851,036 | |
| Freddie Mac, 3.034%, 10/25/2020 | | | 505,000 | | | | 521,906 | |
| Freddie Mac, 2.856%, 1/25/2021 | | | 1,434,000 | | | | 1,475,298 | |
| Freddie Mac, 2.791%, 1/25/2022 | | | 2,010,000 | | | | 2,059,222 | |
| Freddie Mac, 2.716%, 6/25/2022 | | | 1,295,920 | | | | 1,322,544 | |
| Freddie Mac, 2.682%, 10/25/2022 | | | 1,626,000 | | | | 1,652,627 | |
| Freddie Mac, 2.51%, 11/25/2022 | | | 1,821,000 | | | | 1,832,219 | |
| Freddie Mac, 3.32%, 2/25/2023 | | | 677,000 | | | | 709,898 | |
| Freddie Mac, 3.25%, 4/25/2023 | | | 1,700,000 | | | | 1,775,437 | |
| Freddie Mac, 3.3%, 4/25/2023 - 10/25/2026 | | | 3,285,940 | | | | 3,405,393 | |
| Freddie Mac, 3.06%, 7/25/2023 | | | 330,000 | | | | 340,741 | |
| Freddie Mac, 2.454%, 8/25/2023 | | | 7,333,000 | | | | 7,300,906 | |
| Freddie Mac, 3.458%, 8/25/2023 | | | 675,000 | | | | 711,387 | |
| Freddie Mac, 4.5%, 9/01/2024 - 5/01/2042 | | | 3,764,578 | | | | 4,054,307 | |
| Freddie Mac, 5.5%, 10/01/2024 - 6/01/2041 | | | 1,140,754 | | | | 1,274,032 | |
| Freddie Mac, 2.67%, 12/25/2024 | | | 2,555,000 | | | | 2,549,711 | |
| Freddie Mac, 2.811%, 1/25/2025 | | | 2,125,000 | | | | 2,137,182 | |
| Freddie Mac, 3.023%, 1/25/2025 | | | 1,000,000 | | | | 1,019,727 | |
| Freddie Mac, 3.329%, 5/25/2025 | | | 5,166,000 | | | | 5,360,523 | |
| Freddie Mac, 3.284%, 6/25/2025 | | | 5,000,000 | | | | 5,183,092 | |
| Freddie Mac, 4%, 7/01/2025 - 9/01/2044 | | | 2,723,404 | | | | 2,870,674 | |
| Freddie Mac, 3.01%, 7/25/2025 | | | 1,675,000 | | | | 1,701,420 | |
| Freddie Mac, 2.745%, 1/25/2026 | | | 3,263,000 | | | | 3,236,738 | |
| Freddie Mac, 2.673%, 3/25/2026 | | | 2,368,000 | | | | 2,333,349 | |
| Freddie Mac, 6.5%, 5/01/2037 | | | 28,909 | | | | 32,491 | |
| Freddie Mac, 3.5%, 12/01/2041 - 1/01/2047 | | | 30,478,091 | | | | 31,294,019 | |
| Freddie Mac, 3%, 4/01/2043 - 11/01/2046 | | | 27,000,922 | | | | 26,890,790 | |
| Ginnie Mae, 5.5%, 5/15/2033 - 1/20/2042 | | | 438,719 | | | | 491,630 | |
| Ginnie Mae, 4.5%, 7/20/2033 - 9/20/2041 | | | 7,434,913 | | | | 8,033,792 | |
| Ginnie Mae, 4%, 10/15/2039 - 4/20/2041 | | | 337,665 | | | | 358,795 | |
18
Portfolio of Investments – continued
| | | | | | | | |
| Issuer | | Shares/Par | | | Value ($) | |
| Bonds - continued | | | | | | | | |
| Mortgage-Backed - continued | | | | | | | | |
| Ginnie Mae, 3.5%, 12/15/2041 - 5/20/2046 | | $ | 24,746,294 | | | $ | 25,790,080 | |
| Ginnie Mae, 3%, 2/15/2043 - 7/20/2043 | | | 1,811,340 | | | | 1,840,648 | |
| Ginnie Mae, 6.157%, 4/20/2058 | | | 3,100 | | | | 3,432 | |
| | | | | | | | |
| | | | | | | $ | 423,680,363 | |
| Natural Gas - Distribution - 0.1% | | | | | | | | |
| GNL Quintero S.A., 4.634%, 7/31/2029 (n) | | $ | 4,778,000 | | | $ | 4,843,698 | |
| | |
| Network & Telecom - 0.3% | | | | | | | | |
| Columbus International, Inc., 7.375%, 3/30/2021 (n) | | $ | 2,592,000 | | | $ | 2,758,225 | |
| Empresa Nacional de Telecomunicaciones S.A., 4.75%, 8/01/2026 | | | 5,020,000 | | | | 5,132,629 | |
| Telefonica Celular del Paraguay S.A., 6.75%, 12/13/2022 (n) | | | 3,437,000 | | | | 3,591,665 | |
| | | | | | | | |
| | | | | | | $ | 11,482,519 | |
| Oil Services - 0.0% | | | | | | | | |
| Odebrecht Offshore Drilling Finance Ltd., 6.75%, 10/01/2022 (n) | | $ | 3,868,679 | | | $ | 1,416,904 | |
| | |
| Other Banks & Diversified Financials - 0.2% | | | | | | | | |
| Banco de Bogota S.A., 6.25%, 5/12/2026 (n) | | $ | 2,917,000 | | | $ | 3,058,474 | |
| Banque Federative du Credit Mutuel S.A., 2.5%, 4/13/2021 (n) | | | 1,152,000 | | | | 1,140,503 | |
| Industrial Senior Trust Co., 5.5%, 11/01/2022 (n) | | | 2,082,000 | | | | 2,066,385 | |
| | | | | | | | |
| | | | | | | $ | 6,265,362 | |
| Railroad & Shipping - 0.0% | | | | | | | | |
| Rumo Luxembourg Sarl, “A”, 7.375%, 2/09/2024 (n) | | $ | 863,000 | | | $ | 886,733 | |
| | |
| Restaurants - 0.0% | | | | | | | | |
| McDonald’s Corp., 2.75%, 12/09/2020 | | $ | 453,000 | | | $ | 460,940 | |
| | |
| Retailers - 0.2% | | | | | | | | |
| Cencosud S.A., 4.875%, 1/20/2023 (n) | | $ | 3,733,000 | | | $ | 3,910,387 | |
| Cencosud S.A., 5.15%, 2/12/2025 (n) | | | 1,744,000 | | | | 1,827,543 | |
| | | | | | | | |
| | | | | | | $ | 5,737,930 | |
| Supranational - 0.1% | | | | | | | | |
| Inter-American Development Bank, 4.375%, 1/24/2044 | | $ | 511,000 | | | $ | 599,070 | |
| West African Development Bank, 5.5%, 5/06/2021 (n) | | | 2,283,000 | | | | 2,368,612 | |
| | | | | | | | |
| | | | | | | $ | 2,967,682 | |
| Telecommunications - Wireless - 0.2% | | | | | | | | |
| Digicel Group Ltd., 6%, 4/15/2021 (n) | | $ | 2,253,000 | | | $ | 2,082,538 | |
| Digicel Group Ltd., 7.125%, 4/01/2022 | | | 4,997,000 | | | | 4,048,919 | |
| Digicel Group Ltd., 6.75%, 3/01/2023 | | | 2,373,000 | | | | 2,183,160 | |
| | | | | | | | |
| | | | | | | $ | 8,314,617 | |
19
Portfolio of Investments – continued
| | | | | | | | |
| Issuer | | Shares/Par | | | Value ($) | |
| Bonds - continued | | | | | | | | |
| Transportation - Services - 0.0% | | | | | | | | |
| Delhi International Airport, 6.125%, 10/31/2026 (n) | | $ | 1,078,000 | | | $ | 1,127,979 | |
| | |
| U.S. Government Agencies and Equivalents - 1.2% | | | | | | | | |
| AID-Tunisia, 2.452%, 7/24/2021 | | $ | 728,000 | | | $ | 740,363 | |
| AID-Ukraine, 1.844%, 5/16/2019 | | | 3,674,000 | | | | 3,715,476 | |
| AID-Ukraine, 1.847%, 5/29/2020 | | | 8,820,000 | | | | 8,857,273 | |
| Fannie Mae, 1.125%, 4/27/2017 | | | 5,500,000 | | | | 5,505,522 | |
| Fannie Mae, 0.875%, 5/21/2018 | | | 4,000,000 | | | | 3,990,984 | |
| Fannie Mae, 1.75%, 11/26/2019 | | | 4,750,000 | | | | 4,782,537 | |
| Fannie Mae, 1.625%, 1/21/2020 | | | 7,500,000 | | | | 7,516,687 | |
| Hashemite Kingdom of Jordan, 1.945%, 6/23/2019 | | | 987,000 | | | | 996,914 | |
| Hashemite Kingdom of Jordan, 2.503%, 10/30/2020 | | | 1,108,000 | | | | 1,135,349 | |
| Private Export Funding Corp., 2.25%, 3/15/2020 | | | 419,000 | | | | 425,189 | |
| Private Export Funding Corp., 2.3%, 9/15/2020 | | | 2,000,000 | | | | 2,025,324 | |
| Private Export Funding Corp., 1.875%, 7/15/2018 | | | 850,000 | | | | 857,716 | |
| Small Business Administration, 6.34%, 5/01/2021 | | | 25,032 | | | | 26,435 | |
| Small Business Administration, 6.07%, 3/01/2022 | | | 23,238 | | | | 24,928 | |
| Small Business Administration, 5.16%, 2/01/2028 | | | 95,038 | | | | 102,286 | |
| Small Business Administration, 2.21%, 2/01/2033 | | | 288,989 | | | | 282,803 | |
| Small Business Administration, 2.22%, 3/01/2033 | | | 547,797 | | | | 536,070 | |
| Small Business Administration, 3.15%, 7/01/2033 | | | 611,772 | | | | 630,665 | |
| Small Business Administration, 3.16%, 8/01/2033 | | | 716,163 | | | | 738,913 | |
| Small Business Administration, 3.62%, 9/01/2033 | | | 581,306 | | | | 613,549 | |
| Tennessee Valley Authority, 1.75%, 10/15/2018 | | | 863,000 | | | | 870,152 | |
| | | | | | | | |
| | | | | | | $ | 44,375,135 | |
| U.S. Treasury Obligations - 9.9% | | | | | | | | |
| U.S. Treasury Bonds, 6.375%, 8/15/2027 | | $ | 106,000 | | | $ | 144,976 | |
| U.S. Treasury Bonds, 5.25%, 2/15/2029 | | | 2,965,000 | | | | 3,816,859 | |
| U.S. Treasury Bonds, 4.5%, 2/15/2036 | | | 3,629,000 | | | | 4,637,891 | |
| U.S. Treasury Bonds, 4.375%, 2/15/2038 | | | 1,349,000 | | | | 1,697,158 | |
| U.S. Treasury Bonds, 4.5%, 8/15/2039 | | | 7,120,000 | | | | 9,052,688 | |
| U.S. Treasury Bonds, 3.125%, 2/15/2043 | | | 9,137,900 | | | | 9,397,764 | |
| U.S. Treasury Bonds, 2.875%, 5/15/2043 | | | 33,730,000 | | | | 33,109,435 | |
| U.S. Treasury Bonds, 2.5%, 2/15/2045 | | | 20,314,000 | | | | 18,421,467 | |
| U.S. Treasury Notes, 0.75%, 6/30/2017 | | | 30,382,000 | | | | 30,400,958 | |
| U.S. Treasury Notes, 2.625%, 4/30/2018 | | | 1,752,000 | | | | 1,784,918 | |
| U.S. Treasury Notes, 2.75%, 2/15/2019 | | | 46,949,000 | | | | 48,329,958 | |
| U.S. Treasury Notes, 3.125%, 5/15/2019 | | | 1,116,000 | | | | 1,160,160 | |
| U.S. Treasury Notes, 1%, 6/30/2019 | | | 12,606,000 | | | | 12,514,405 | |
| U.S. Treasury Notes, 1.625%, 6/30/2019 (f) | | | 81,820,000 | | | | 82,379,322 | |
| U.S. Treasury Notes, 2.625%, 8/15/2020 | | | 6,082,000 | | | | 6,288,928 | |
| U.S. Treasury Notes, 2%, 11/30/2020 | | | 22,044,000 | | | | 22,292,855 | |
| U.S. Treasury Notes, 3.125%, 5/15/2021 | | | 3,748,000 | | | | 3,950,774 | |
20
Portfolio of Investments – continued
| | | | | | | | |
| Issuer | | Shares/Par | | | Value ($) | |
| Bonds - continued | | | | | | | | |
| U.S. Treasury Obligations - continued | | | | | | | | |
| U.S. Treasury Notes, 1.75%, 5/15/2022 | | $ | 3,949,000 | | | $ | 3,908,432 | |
| U.S. Treasury Notes, 2.5%, 8/15/2023 | | | 50,494,000 | | | | 51,620,269 | |
| U.S. Treasury Notes, 2.75%, 2/15/2024 | | | 7,855,000 | | | | 8,141,888 | |
| U.S. Treasury Notes, 2.5%, 5/15/2024 | | | 12,602,000 | | | | 12,846,164 | |
| U.S. Treasury Notes, 2%, 8/15/2025 | | | 11,808,000 | | | | 11,509,576 | |
| U.S. Treasury Notes, 2%, 11/15/2026 | | | 2,031,000 | | | | 1,965,230 | |
| | | | | | | | |
| | | | | | | $ | 379,372,075 | |
| Utilities - Electric Power - 0.4% | | | | | | | | |
| Adani Transmission Ltd., 4%, 8/03/2026 (n) | | $ | 260,000 | | | $ | 254,460 | |
| Enel Americas S.A., 4%, 10/25/2026 | | | 635,000 | | | | 631,031 | |
| Engie Energia Chile S.A., 5.625%, 1/15/2021 | | | 2,177,000 | | | | 2,362,190 | |
| Engie Energia Chile S.A., 4.5%, 1/29/2025 (n) | | | 2,824,000 | | | | 2,887,247 | |
| Greenko Dutch B.V., 8%, 8/01/2019 (n) | | | 2,261,000 | | | | 2,379,703 | |
| NextEra Energy Capital Holdings, Inc., 2.056%, 9/01/2017 | | | 950,000 | | | | 953,600 | |
| Transelec S.A., 4.25%, 1/14/2025 (n) | | | 2,631,000 | | | | 2,659,443 | |
| Transelec S.A., 3.875%, 1/12/2029 (n) | | | 3,854,000 | | | | 3,715,295 | |
| | | | | | | | |
| | | | | | | $ | 15,842,969 | |
| Utilities - Gas - 0.1% | | | | | | | | |
| Transport de Gas Peru, 4.25%, 4/30/2028 (n) | | $ | 3,039,000 | | | $ | 3,048,877 | |
| Total Bonds (Identified Cost, $1,241,891,890) | | | | | | $ | 1,237,748,855 | |
| | |
| Common Stocks - 38.8% | | | | | | | | |
| Aerospace - 0.1% | | | | | | | | |
| Northrop Grumman Corp. | | | 21,898 | | | $ | 5,410,777 | |
| | |
| Airlines - 0.2% | | | | | | | | |
| Air Canada (a) | | | 345,333 | | | $ | 3,478,810 | |
| Copa Holdings S.A., “A” | | | 40,784 | | | | 4,343,088 | |
| | | | | | | | |
| | | | | | | $ | 7,821,898 | |
| Automotive - 0.4% | | | | | | | | |
| General Motors Co. | | | 266,996 | | | $ | 9,836,133 | |
| Hyundai Motor Co. | | | 19,792 | | | | 2,616,762 | |
| Magna International, Inc. | | | 62,255 | | | | 2,661,844 | |
| | | | | | | | |
| | | | | | | $ | 15,114,739 | |
| Biotechnology - 0.2% | | | | | | | | |
| Celgene Corp. (a) | | | 65,120 | | | $ | 8,042,971 | |
| | |
| Cable TV - 0.4% | | | | | | | | |
| Charter Communications, Inc., “A” (a) | | | 47,383 | | | $ | 15,307,552 | |
21
Portfolio of Investments – continued
| | | | | | | | |
| Issuer | | Shares/Par | | | Value ($) | |
| Common Stocks - continued | | | | | | | | |
| Chemicals - 0.1% | | | | | | | | |
| LyondellBasell Industries N.V., “A” | | | 24,288 | | | $ | 2,216,037 | |
| | |
| Computer Software - 0.3% | | | | | | | | |
| Check Point Software Technologies Ltd. (a) | | | 116,060 | | | $ | 11,479,495 | |
| | |
| Computer Software - Systems - 0.2% | | | | | | | | |
| Hon Hai Precision Industry Co. Ltd. | | | 2,331,900 | | | $ | 6,793,010 | |
| | |
| Construction - 0.1% | | | | | | | | |
| Bellway PLC | | | 46,205 | | | $ | 1,494,110 | |
| Owens Corning | | | 73,038 | | | | 4,271,993 | |
| | | | | | | | |
| | | | | | | $ | 5,766,103 | |
| Consumer Products - 0.8% | | | | | | | | |
| Procter & Gamble Co. | | | 198,212 | | | $ | 18,051,167 | |
| Svenska Cellulosa Aktiebolaget | | | 472,135 | | | | 14,509,367 | |
| | | | | | | | |
| | | | | | | $ | 32,560,534 | |
| Electrical Equipment - 0.5% | | | | | | | | |
| Siemens AG | | | 137,459 | | | $ | 17,882,635 | |
| | |
| Electronics - 1.2% | | | | | | | | |
| Intel Corp. | | | 241,752 | | | $ | 8,751,422 | |
| Samsung Electronics Co. Ltd. | | | 8,704 | | | | 14,794,683 | |
| Taiwan Semiconductor Manufacturing Co. Ltd., ADR | | | 724,871 | | | | 22,811,690 | |
| | | | | | | | |
| | | | | | | $ | 46,357,795 | |
| Energy - Independent - 0.6% | | | | | | | | |
| Galp Energia SGPS S.A. | | | 455,808 | | | $ | 6,707,245 | |
| Pacific Exploration & Production Corp. (a) | | | 36,341 | | | | 1,410,031 | |
| Rice Energy, Inc. (a) | | | 360,847 | | | | 6,729,797 | |
| Valero Energy Corp. | | | 116,478 | | | | 7,914,680 | |
| | | | | | | | |
| | | | | | | $ | 22,761,753 | |
| Energy - Integrated - 0.8% | | | | | | | | |
| BP PLC | | | 1,740,865 | | | $ | 9,797,371 | |
| China Petroleum & Chemical Corp. | | | 4,692,000 | | | | 3,638,568 | |
| Exxon Mobil Corp. | | | 125,741 | | | | 10,225,258 | |
| LUKOIL PJSC, ADR | | | 123,851 | | | | 6,564,103 | |
| | | | | | | | |
| | | | | | | $ | 30,225,300 | |
| Engineering - Construction - 0.3% | | | | | | | | |
| Bouygues | | | 77,707 | | | $ | 2,994,080 | |
| VINCI S.A. | | | 110,741 | | | | 7,978,866 | |
| | | | | | | | |
| | | | | | | $ | 10,972,946 | |
22
Portfolio of Investments – continued
| | | | | | | | |
| Issuer | | Shares/Par | | | Value ($) | |
| Common Stocks - continued | | | | | | | | |
| Food & Beverages - 0.8% | | | | | | | | |
| General Mills, Inc. | | | 230,549 | | | $ | 13,918,243 | |
| Marine Harvest A.S.A. | | | 463,983 | | | | 8,113,545 | |
| Nestle S.A. | | | 52,357 | | | | 3,870,670 | |
| Tyson Foods, Inc., “A” | | | 55,517 | | | | 3,473,144 | |
| | | | | | | | |
| | | | | | | $ | 29,375,602 | |
| Food & Drug Stores - 0.2% | | | | | | | | |
| Lawson, Inc. (l) | | | 25,900 | | | $ | 1,786,684 | |
| Wesfarmers Ltd. | | | 218,892 | | | | 7,169,462 | |
| | | | | | | | |
| | | | | | | $ | 8,956,146 | |
| Gaming & Lodging - 0.2% | | | | | | | | |
| Sands China Ltd. | | | 1,817,200 | | | $ | 7,584,444 | |
| | |
| Insurance - 1.1% | | | | | | | | |
| MetLife, Inc. | | | 171,712 | | | $ | 9,004,577 | |
| Prudential Financial, Inc. | | | 84,959 | | | | 9,391,368 | |
| Swiss Re Ltd. | | | 40,998 | | | | 3,665,675 | |
| Zurich Insurance Group AG | | | 76,923 | | | | 21,238,361 | |
| | | | | | | | |
| | | | | | | $ | 43,299,981 | |
| Major Banks - 1.2% | | | | | | | | |
| BNP Paribas | | | 105,654 | | | $ | 6,170,692 | |
| BOC Hong Kong Holdings Ltd. | | | 1,309,500 | | | | 5,178,690 | |
| Canadian Imperial Bank of Commerce | | | 82,928 | | | | 7,280,706 | |
| China Construction Bank | | | 13,016,000 | | | | 10,714,068 | |
| National Australia Bank Ltd. | | | 100,147 | | | | 2,456,279 | |
| Royal Bank of Canada | | | 41,658 | | | | 3,027,287 | |
| Toronto-Dominion Bank | | | 99,238 | | | | 5,115,068 | |
| UBS Group AG | | | 307,986 | | | | 4,743,907 | |
| | | | | | | | |
| | | | | | | $ | 44,686,697 | |
| Medical & Health Technology & Services - 0.2% | | | | | | | | |
| HCA Holdings, Inc. (a) | | | 73,026 | | | $ | 6,370,788 | |
| | |
| Metals & Mining - 0.4% | | | | | | | | |
| Rio Tinto PLC | | | 350,180 | | | $ | 14,326,152 | |
| | |
| Natural Gas - Distribution - 0.2% | | | | | | | | |
| Engie | | | 744,893 | | | $ | 9,106,671 | |
| | |
| Natural Gas - Pipeline - 0.1% | | | | | | | | |
| Williams Partners LP | | | 122,005 | | | $ | 4,916,802 | |
23
Portfolio of Investments – continued
| | | | | | | | |
| Issuer | | Shares/Par | | | Value ($) | |
| Common Stocks - continued | | | | | | | | |
| Network & Telecom - 0.2% | | | | | | | | |
| Cisco Systems, Inc. | | | 251,068 | | | $ | 8,581,504 | |
| | |
| Oil Services - 0.1% | | | | | | | | |
| TechnipFMC PLC (a) | | | 101,671 | | | $ | 3,279,239 | |
| | |
| Other Banks & Diversified Financials - 0.4% | | | | | | | | |
| Agricultural Bank of China | | | 5,453,000 | | | $ | 2,514,748 | |
| DBS Group Holdings Ltd. | | | 899,100 | | | | 12,016,657 | |
| | | | | | | | |
| | | | | | | $ | 14,531,405 | |
| Pharmaceuticals - 2.4% | | | | | | | | |
| Bayer AG | | | 110,139 | | | $ | 12,111,514 | |
| Eli Lilly & Co. | | | 220,538 | | | | 18,262,752 | |
| Merck & Co., Inc. | | | 513,806 | | | | 33,844,401 | |
| Novartis AG | | | 247,599 | | | | 19,327,686 | |
| Roche Holding AG | | | 31,078 | | | | 7,571,849 | |
| | | | | | | | |
| | | | | | | $ | 91,118,202 | |
| Real Estate - 20.0% | | | | | | | | |
| Alexandria Real Estate Equities, Inc., REIT | | | 339,627 | | | $ | 40,520,897 | |
| AvalonBay Communities, Inc., REIT | | | 275,228 | | | | 50,581,402 | |
| Boardwalk, REIT | | | 745,961 | | | | 24,975,821 | |
| Colony Starwood Homes, REIT | | | 772,157 | | | | 25,403,965 | |
| Equity Commonwealth, REIT (a) | | | 1,018,918 | | | | 31,851,377 | |
| Equity Lifestyle Properties, Inc., REIT | | | 467,612 | | | | 37,231,267 | |
| Gramercy Property Trust, REIT | | | 1,025,236 | | | | 28,665,599 | |
| Life Storage, Inc., REIT | | | 437,028 | | | | 38,733,792 | |
| Medical Properties Trust, Inc., REIT | | | 3,251,606 | | | | 43,636,553 | |
| Mid-America Apartment Communities, Inc., REIT | | | 423,521 | | | | 43,508,312 | |
| OUTFRONT Media, Inc., REIT | | | 945,373 | | | | 24,532,429 | |
| Parkway, Inc., REIT | | | 523,667 | | | | 10,986,534 | |
| Public Storage, Inc., REIT | | | 278,872 | | | | 63,432,225 | |
| Rexford Industrial Realty, Inc., REIT | | | 783,670 | | | | 18,008,737 | |
| Simon Property Group, Inc., REIT | | | 335,529 | | | | 61,871,548 | |
| STAG Industrial, Inc., REIT | | | 973,344 | | | | 25,141,476 | |
| Starwood Property Trust, Inc., REIT | | | 1,287,183 | | | | 29,425,003 | |
| Store Capital Corp., REIT | | | 1,222,873 | | | | 30,461,766 | |
| Sun Communities, Inc., REIT | | | 355,072 | | | | 29,410,614 | |
| Tanger Factory Outlet Centers, Inc., REIT | | | 637,877 | | | | 21,604,894 | |
| Urban Edge Properties, REIT | | | 861,808 | | | | 23,897,936 | |
| Vornado Realty Trust, REIT | | | 64,940 | | | | 7,134,958 | |
| Washington Prime Group, Inc., REIT | | | 3,002,263 | | | | 27,830,977 | |
| Weyerhaeuser Co., REIT | | | 884,655 | | | | 29,830,567 | |
| | | | | | | | |
| | | | | | | $ | 768,678,649 | |
24
Portfolio of Investments – continued
| | | | | | | | |
| Issuer | | Shares/Par | | | Value ($) | |
| Common Stocks - continued | | | | | | | | |
| Restaurants - 0.1% | | | | | | | | |
| Brinker International, Inc. | | | 102,856 | | | $ | 4,344,637 | |
| Greggs PLC | | | 112,281 | | | | 1,362,587 | |
| | | | | | | | |
| | | | | | | $ | 5,707,224 | |
| Specialty Chemicals - 0.3% | | | | | | | | |
| PTT Global Chemical PLC | | | 4,697,200 | | | $ | 9,588,045 | |
| Tosoh Corp. | | | 193,000 | | | | 1,678,410 | |
| | | | | | | | |
| | | | | | | $ | 11,266,455 | |
| Specialty Stores - 0.4% | | | | | | | | |
| Gap, Inc. | | | 382,362 | | | $ | 9,490,225 | |
| Just Eat PLC (a) | | | 740,130 | | | | 4,596,543 | |
| Urban Outfitters, Inc. (a) | | | 64,220 | | | | 1,671,647 | |
| | | | | | | | |
| | | | | | | $ | 15,758,415 | |
| Telecommunications - Wireless - 1.0% | | | | | | | | |
| American Tower Corp., REIT | | | 266,517 | | | $ | 30,593,486 | |
| SoftBank Group Corp. | | | 51,000 | | | | 3,796,003 | |
| Vodafone Group PLC | | | 1,795,630 | | | | 4,498,549 | |
| | | | | | | | |
| | | | | | | $ | 38,888,038 | |
| Telephone Services - 0.6% | | | | | | | | |
| AT&T, Inc. | | | 75,631 | | | $ | 3,160,619 | |
| British Telecom Group, PLC | | | 2,608,956 | | | | 10,589,283 | |
| Nippon Telegraph & Telephone Corp. | | | 132,700 | | | | 5,611,800 | |
| TDC A.S. (a) | | | 973,532 | | | | 5,238,899 | |
| | | | | | | | |
| | | | | | | $ | 24,600,601 | |
| Tobacco - 1.8% | | | | | | | | |
| Altria Group, Inc. | | | 423,597 | | | $ | 31,735,887 | |
| Imperial Brands PLC | | | 68,948 | | | | 3,245,068 | |
| Japan Tobacco, Inc. | | | 500,200 | | | | 16,727,504 | |
| Philip Morris International, Inc. | | | 147,762 | | | | 16,157,775 | |
| | | | | | | | |
| | | | | | | $ | 67,866,234 | |
| Utilities - Electric Power - 0.9% | | | | | | | | |
| American Electric Power Co., Inc. | | | 232,683 | | | $ | 15,582,780 | |
| Energias de Portugal S.A. | | | 1,253,194 | | | | 3,875,363 | |
| SSE PLC | | | 545,796 | | | | 10,436,437 | |
| Xcel Energy, Inc. | | | 132,237 | | | | 5,780,079 | |
| | | | | | | | |
| | | | | | | $ | 35,674,659 | |
| Total Common Stocks (Identified Cost, $1,318,380,468) | | | $ | 1,493,287,453 | |
25
Portfolio of Investments – continued
| | | | | | | | |
| Convertible Preferred Stocks - 0.4% | | | | | | | | |
| Issuer | | Shares/Par | | | Value ($) | |
| Utilities - Electric Power - 0.4% | | | | | | | | |
| Exelon Corp., 6.5% (Identified Cost, $14,697,596) | | | 329,802 | | | $ | 16,351,583 | |
| | |
| Preferred Stocks - 0.1% | | | | | | | | |
| Other Banks & Diversified Financials - 0.1% | | | | | | | | |
| Itau Unibanco Holding S.A. (Identified Cost, $1,662,068) | | | 166,500 | | | $ | 2,142,396 | |
| | |
| Issuer/Expiration Date/Strike Price | | Number
of
Contracts | | | | |
| Put Options Purchased - 0.0% | | | | | | | | |
| iShares Dow Jones U.S. Real Estate ETF - June 2017 @ $67 | | | 5,250 | | | $ | 162,750 | |
| iShares Dow Jones U.S. Real Estate ETF - March 2017 @ $69 | | | 5,000 | | | | 20,000 | |
| iShares Dow Jones U.S. Real Estate ETF - March 2017 @ $71 | | | 4,200 | | | | 12,600 | |
| iShares Dow Jones U.S. Real Estate ETF - September 2017 @ $68 | | | 4,920 | | | | 467,400 | |
| iShares Dow Jones U.S. Real Estate ETF - June 2017 @ $70 | | | 4,920 | | | | 241,080 | |
Total Put Options Purchased
(Premiums Paid, $4,391,457) | | | | | | $ | 903,830 | |
| | |
| Issuer | | Shares/Par | | | | |
| Underlying Affiliated Funds - 27.0% | | | | | | | | |
MFS High Yield Pooled Portfolio (v)
(Identified Cost, $1,027,352,782) | | | 110,654,801 | | | $ | 1,037,942,036 | |
| | |
| Money Market Funds - 2.6% | | | | | | | | |
MFS Institutional Money Market Portfolio, 0.64% (v)
(Identified Cost, $101,603,242) | | | 101,605,564 | | | $ | 101,605,564 | |
| | |
| Collateral for Securities Loaned - 0.0% | | | | | | | | |
JPMorgan U.S. Government Money Market Fund, 0.48% (j)
(Identified Cost, $1,421,581) | | | 1,421,581 | | | $ | 1,421,581 | |
| Total Investments (Identified Cost, $3,711,401,084) | | | | | | $ | 3,891,403,298 | |
| | |
| Other Assets, Less Liabilities - (1.1)% | | | | | | | (43,392,552 | ) |
| Net Assets - 100.0% | | | | | | $ | 3,848,010,746 | |
| (a) | Non-income producing security. |
| (f) | All or a portion of the security has been segregated as collateral for open futures contracts. |
| (j) | The rate quoted is the annualized seven-day yield of the fund at period end. |
| (l) | A portion of this security is on loan. |
| (n) | Securities exempt from registration under Rule 144A of the Securities Act of 1933. These securities may be sold in the ordinary course of business in transactions exempt from registration, normally to qualified institutional buyers. At period end, the aggregate value of these securities was $209,406,407, representing 5.4% of net assets. |
26
Portfolio of Investments – continued
| (v) | Underlying affiliated fund that is available only to investment companies managed by MFS. The rate quoted for the MFS Institutional Money Market Portfolio is the annualized seven-day yield of the fund at period end. |
| (z) | Restricted securities are not registered under the Securities Act of 1933 and are subject to legal restrictions on resale. These securities generally may be resold in transactions exempt from registration or to the public if the securities are subsequently registered. Disposal of these securities may involve time-consuming negotiations and prompt sale at an acceptable price may be difficult. The fund holds the following restricted securities: |
| | | | | | | | | | |
| Restricted Securities | | Acquisition
Date | | Cost | | | Value | |
| Cent CLO LP, 2014-21A, “A1”, FRN, 2.527%, 7/27/2026 | | 2/17/17 | | | $3,552,111 | | | | $3,552,111 | |
| % of Net assets | | | | | | | | | 0.1% | |
The following abbreviations are used in this report and are defined:
| ADR | | American Depositary Receipt |
| FRN | | Floating Rate Note. Interest rate resets periodically and the current rate may not be the rate reported at period end. |
| PJSC | | Public Joint Stock Company |
| PLC | | Public Limited Company |
| REIT | | Real Estate Investment Trust |
| STRIPS | | Separate Trading of Registered Interest and Principal of Securities |
Abbreviations indicate amounts shown in currencies other than the U.S. dollar. All amounts are stated in U.S. dollars unless otherwise indicated. A list of abbreviations is shown below:
Derivative Contracts at 2/28/17
Forward Foreign Currency Exchange Contracts at 2/28/17
| | | | | | | | | | | | | | | | | | | | | | | | |
| Type | | Currency | | Counter- party | | Contracts
to
Deliver/
Receive | | | Settlement
Date Range | | | In
Exchange
For | | | Contracts
at Value | | | Unrealized
Appreciation
(Depreciation) | |
| Asset Derivatives | | | | | | | | | | | | | | | |
| SELL | | EUR | | Citibank N.A. | | | 4,483,236 | | | | 3/10/17 | | | | $4,825,603 | | | | $4,750,964 | | | | $74,639 | |
| | | | | |
| Liability Derivatives | | | | | | | | | | | | | | | |
| BUY | | EUR | | Morgan Stanley
Capital Services, Inc. | | | 4,684,654 | | | | 3/10/17 | | | | $5,015,203 | | | | $4,964,410 | | | | $(50,793 | ) |
27
Portfolio of Investments – continued
Futures Contracts at 2/28/17
| | | | | | | | | | | | | | | | | | |
| Description | | Currency | | | Contracts | | | Value | | Expiration
Date | | | Unrealized
Appreciation
(Depreciation) | |
| Liability Derivatives | | | | | | | | | | | | | | | | | | |
| Interest Rate Futures | | | | | | | | | | | | | | | | | | |
| U.S. Treasury Note 5 yr (Long) | | | USD | | | | 150 | | | $17,655,469 | | | June - 2017 | | | | $(16,818 | ) |
| | | | | | | | | | | | | | | | | | |
At February 28, 2017, the fund had liquid securities with an aggregate value of $135,923 to cover any commitments for certain derivative contracts.
See Notes to Financial Statements
28
Financial Statements
STATEMENT OF ASSETS AND LIABILITIES
At 2/28/17
This statement represents your fund’s balance sheet, which details the assets and liabilities comprising the total value of the fund.
| | | | |
| Assets | | | | |
Investments | | | | |
Non-affiliated issuers, at value (identified cost, $2,582,445,060) | | | $2,751,855,698 | |
Underlying affiliated funds, at value (identified cost, $1,128,956,024) | | | 1,139,547,600 | |
Total investments, at value, including $1,356,328 of securities on loan (identified cost, $3,711,401,084) | | | $3,891,403,298 | |
Cash | | | 5,145,308 | |
Receivables for | | | | |
Forward foreign currency exchange contracts | | | 74,639 | |
Investments sold | | | 20,299,293 | |
Fund shares sold | | | 19,081,154 | |
Interest and dividends | | | 11,016,861 | |
Other assets | | | 15,179 | |
Total assets | | | $3,947,035,732 | |
| Liabilities | | | | |
Payables for | | | | |
Distributions | | | $1,031,336 | |
Forward foreign currency exchange contracts | | | 50,793 | |
Daily variation margin on open futures contracts | | | 12,887 | |
Investments purchased | | | 41,238,732 | |
TBA purchase commitments | | | 43,665,282 | |
Fund shares reacquired | | | 9,827,238 | |
Collateral for securities loaned, at value | | | 1,421,581 | |
Payable to affiliates | | | | |
Investment adviser | | | 126,954 | |
Shareholder servicing costs | | | 1,032,019 | |
Distribution and service fees | | | 75,423 | |
Payable for independent Trustees’ compensation | | | 11 | |
Deferred country tax expense payable | | | 96,459 | |
Accrued expenses and other liabilities | | | 446,271 | |
Total liabilities | | | $99,024,986 | |
Net assets | | | $3,848,010,746 | |
| Net assets consist of | | | | |
Paid-in capital | | | $3,715,788,909 | |
Unrealized appreciation (depreciation) on investments and translation of assets and liabilities in foreign currencies (net of $96,459 deferred country tax) | | | 179,901,357 | |
Accumulated distributions in excess of net realized gain on investments and foreign currency | | | (43,132,096 | ) |
Accumulated distributions in excess of net investment income | | | (4,547,424 | ) |
Net assets | | | $3,848,010,746 | |
Shares of beneficial interest outstanding | | | 313,335,289 | |
29
Statement of Assets and Liabilities – continued
| | | | | | | | | | | | |
| | | Net assets | | | Shares
outstanding | | | Net asset value
per share (a) | |
| Class A | | | $1,321,134,518 | | | | 107,550,077 | | | | $12.28 | |
| Class C | | | 1,046,945,956 | | | | 85,283,623 | | | | 12.28 | |
| Class I | | | 1,434,279,749 | | | | 116,784,890 | | | | 12.28 | |
| Class R1 | | | 937,978 | | | | 76,486 | | | | 12.26 | |
| Class R2 | | | 4,223,311 | | | | 344,021 | | | | 12.28 | |
| Class R3 | | | 19,274,076 | | | | 1,568,917 | | | | 12.28 | |
| Class R4 | | | 6,178,969 | | | | 502,940 | | | | 12.29 | |
| Class R6 (formerly Class R5) | | | 15,036,189 | | | | 1,224,335 | | | | 12.28 | |
| (a) | Maximum offering price per share was equal to the net asset value per share for all share classes, except for Class A, for which the maximum offering price per share was $12.83 [100 / 95.75 x $12.28]. On sales of $100,000 or more, the maximum offering price of Class A shares is reduced. A contingent deferred sales charge may be imposed on redemptions of Class A and Class C shares. Redemption price per share was equal to the net asset value per share for Classes I, R1, R2, R3, R4, and R6. |
See Notes to Financial Statements
30
Financial Statements
STATEMENT OF OPERATIONS
Year ended 2/28/17
This statement describes how much your fund earned in investment income and accrued in expenses. It also describes any gains and/or losses generated by fund operations.
| | | | |
| Net investment income | | | | |
Income | | | | |
Dividends from underlying affiliated funds | | | $66,678,637 | |
Interest | | | 40,658,394 | |
Dividends | | | 42,819,109 | |
Foreign taxes withheld | | | (1,285,678 | ) |
Total investment income | | | $148,870,462 | |
Expenses | | | | |
Management fee | | | $21,548,836 | |
Distribution and service fees | | | 14,127,867 | |
Shareholder servicing costs | | | 3,722,086 | |
Administrative services fee | | | 551,586 | |
Independent Trustees’ compensation | | | 50,995 | |
Custodian fee | | | 343,425 | |
Shareholder communications | | | 329,539 | |
Audit and tax fees | | | 72,218 | |
Legal fees | | | 53,755 | |
Miscellaneous | | | 438,374 | |
Total expenses | | | $41,238,681 | |
Fees paid indirectly | | | (384 | ) |
Reduction of expenses by investment adviser and distributor | | | (744,932 | ) |
Net expenses | | | $40,493,365 | |
Net investment income | | | $108,377,097 | |
| Realized and unrealized gain (loss) on investments and foreign currency | |
Realized gain (loss) (identified cost basis) | | | | |
Investments: | | | | |
Non-affiliated issuers | | | $3,779,325 | |
Underlying affiliated funds | | | (20,957,866 | ) |
Futures contracts | | | 93,779 | |
Foreign currency | | | 102,050 | |
Net realized gain (loss) on investments and foreign currency | | | $(16,982,712 | ) |
Change in unrealized appreciation (depreciation) | | | | |
Investments (net of $94,718 increase in deferred country tax) | | | $322,419,030 | |
Futures contracts | | | (16,818 | ) |
Translation of assets and liabilities in foreign currencies | | | 49,677 | |
Net unrealized gain (loss) on investments and foreign currency translation | | | $322,451,889 | |
Net realized and unrealized gain (loss) on investments and foreign currency | | | $305,469,177 | |
Change in net assets from operations | | | $413,846,274 | |
See Notes to Financial Statements
31
Financial Statements
STATEMENTS OF CHANGES IN NET ASSETS
These statements describe the increases and/or decreases in net assets resulting from operations, any distributions, and any shareholder transactions.
| | | | | | | | |
| | | Year ended
2/28/17 | | | Year ended
2/29/16 | |
| Change in net assets | | | | | | |
| From operations | | | | | | | | |
Net investment income | | | $108,377,097 | | | | $94,753,324 | |
Net realized gain (loss) on investments and foreign currency | | | (16,982,712 | ) | | | 76,261,413 | |
Net unrealized gain (loss) on investments and foreign currency translation | | | 322,451,889 | | | | (359,537,750 | ) |
Change in net assets from operations | | | $413,846,274 | | | | $(188,523,013 | ) |
| Distributions declared to shareholders | | | | | | | | |
From net investment income | | | $(114,441,132 | ) | | | $(97,491,038 | ) |
From net realized gain on investments | | | (918,231 | ) | | | (108,687,055 | ) |
Total distributions declared to shareholders | | | $(115,359,363 | ) | | | $(206,178,093 | ) |
Change in net assets from fund share transactions | | | $472,281,792 | | | | $537,782,587 | |
Total change in net assets | | | $770,768,703 | | | | $143,081,481 | |
| Net assets | | | | | | | | |
At beginning of period | | | 3,077,242,043 | | | | 2,934,160,562 | |
At end of period (including accumulated distributions in excess of net investment income of $4,547,424 and $2,394,349, respectively) | | | $3,848,010,746 | | | | $3,077,242,043 | |
See Notes to Financial Statements
32
Financial Statements
FINANCIAL HIGHLIGHTS
The financial highlights table is intended to help you understand the fund’s financial performance for the past 5 years (or life of a particular share class, if shorter). Certain information reflects financial results for a single fund share. The total returns in the table represent the rate by which an investor would have earned (or lost) on an investment in the fund share class (assuming reinvestment of all distributions) held for the entire period.
| | | | | | | | | | | | | | | | | | | | |
| Class A | | Years ended 2/28, 2/29 | |
| | | 2017 | | | 2016 | | | 2015 | | | 2014 | | | 2013 | |
Net asset value, beginning of period | | | $11.22 | | | | $12.70 | | | | $12.21 | | | | $11.82 | | | | $11.05 | |
| Income (loss) from investment operations | | | | | | | | | |
Net investment income (d) | | | $0.39 | | | | $0.38 | | | | $0.34 | | | | $0.34 | | | | $0.33 | |
Net realized and unrealized gain (loss)
on investments and foreign
currency | | | 1.08 | | | | (1.06 | ) | | | 0.75 | | | | 0.57 | | | | 0.82 | |
Total from investment operations | | | $1.47 | | | | $(0.68 | ) | | | $1.09 | | | | $0.91 | | | | $1.15 | |
| Less distributions declared to shareholders | | | | | | | | | |
From net investment income | | | $(0.41 | ) | | | $(0.39 | ) | | | $(0.36 | ) | | | $(0.35 | ) | | | $(0.37 | ) |
From net realized gain on
investments | | | (0.00 | )(w) | | | (0.41 | ) | | | (0.24 | ) | | | (0.17 | ) | | | (0.01 | ) |
Total distributions declared to
shareholders | | | $(0.41 | ) | | | $(0.80 | ) | | | $(0.60 | ) | | | $(0.52 | ) | | | $(0.38 | ) |
Net asset value, end of period (x) | | | $12.28 | | | | $11.22 | | | | $12.70 | | | | $12.21 | | | | $11.82 | |
Total return (%) (r)(s)(t)(x) | | | 13.26 | | | | (5.53 | ) | | | 9.09 | | | | 7.87 | | | | 10.56 | |
Ratios (%) (to average net assets)
and Supplemental data: | | | | | | | | | | | | | | | | | |
Expenses before expense reductions (f) | | | 1.02 | (h) | | | 1.06 | (h) | | | 1.06 | (h) | | | 1.07 | (h) | | | 1.08 | |
Expenses after expense reductions (f) | | | 1.00 | (h) | | | 1.01 | (h) | | | 1.03 | (h) | | | 1.06 | (h) | | | 1.08 | |
Net investment income | | | 3.25 | | | | 3.17 | | | | 2.70 | | | | 2.83 | | | | 2.86 | |
Portfolio turnover | | | 46 | | | | 62 | | | | 48 | | | | 63 | | | | 64 | |
Net assets at end of period
(000 omitted) | | | $1,321,135 | | | | $1,408,719 | | | | $1,334,418 | | | | $1,071,400 | | | | $797,338 | |
See Notes to Financial Statements
33
Financial Highlights – continued
| | | | | | | | | | | | | | | | | | | | |
| Class C | | Years ended 2/28, 2/29 | |
| | | 2017 | | | 2016 | | | 2015 | | | 2014 | | | 2013 | |
Net asset value, beginning of period | | | $11.22 | | | | $12.70 | | | | $12.20 | | | | $11.82 | | | | $11.04 | |
| Income (loss) from investment operations | | | | | | | | | | | | | | | | | |
Net investment income (d) | | | $0.30 | | | | $0.29 | | | | $0.24 | | | | $0.25 | | | | $0.24 | |
Net realized and unrealized gain (loss)
on investments and foreign
currency | | | 1.08 | | | | (1.06 | ) | | | 0.77 | | | | 0.56 | | | | 0.83 | |
Total from investment operations | | | $1.38 | | | | $(0.77 | ) | | | $1.01 | | | | $0.81 | | | | $1.07 | |
| Less distributions declared to shareholders | | | | | | | | | | | | | | | | | |
From net investment income | | | $(0.32 | ) | | | $(0.30 | ) | | | $(0.27 | ) | | | $(0.26 | ) | | | $(0.28 | ) |
From net realized gain on
investments | | | (0.00 | )(w) | | | (0.41 | ) | | | (0.24 | ) | | | (0.17 | ) | | | (0.01 | ) |
Total distributions declared to
shareholders | | | $(0.32 | ) | | | $(0.71 | ) | | | $(0.51 | ) | | | $(0.43 | ) | | | $(0.29 | ) |
Net asset value, end of period (x) | | | $12.28 | | | | $11.22 | | | | $12.70 | | | | $12.20 | | | | $11.82 | |
Total return (%) (r)(s)(t)(x) | | | 12.43 | | | | (6.24 | ) | | | 8.36 | | | | 6.97 | | | | 9.84 | |
Ratios (%) (to average net assets)
and Supplemental data: | | | | | | | | | | | | | | | | | |
Expenses before expense reductions (f) | | | 1.77 | (h) | | | 1.81 | (h) | | | 1.81 | (h) | | | 1.82 | (h) | | | 1.83 | |
Expenses after expense reductions (f) | | | 1.75 | (h) | | | 1.76 | (h) | | | 1.78 | (h) | | | 1.81 | (h) | | | 1.83 | |
Net investment income | | | 2.50 | | | | 2.42 | | | | 1.96 | | | | 2.08 | | | | 2.11 | |
Portfolio turnover | | | 46 | | | | 62 | | | | 48 | | | | 63 | | | | 64 | |
Net assets at end of period
(000 omitted) | | | $1,046,946 | | | | $939,801 | | | | $859,969 | | | | $630,810 | | | | $466,361 | |
See Notes to Financial Statements
34
Financial Highlights – continued
| | | | | | | | | | | | | | | | | | | | |
| Class I | | Years ended 2/28, 2/29 | |
| | | 2017 | | | 2016 | | | 2015 | | | 2014 | | | 2013 | |
Net asset value, beginning of period | | | $11.22 | | | | $12.70 | | | | $12.21 | | | | $11.82 | | | | $11.05 | |
| Income (loss) from investment operations | | | | | | | | | | | | | | | | | |
Net investment income (d) | | | $0.41 | | | | $0.41 | | | | $0.37 | | | | $0.37 | | | | $0.35 | |
Net realized and unrealized gain (loss)
on investments and foreign
currency | | | 1.09 | | | | (1.06 | ) | | | 0.75 | | | | 0.57 | | | | 0.83 | |
Total from investment operations | | | $1.50 | | | | $(0.65 | ) | | | $1.12 | | | | $0.94 | | | | $1.18 | |
| Less distributions declared to shareholders | | | | | | | | | | | | | | | | | |
From net investment income | | | $(0.44 | ) | | | $(0.42 | ) | | | $(0.39 | ) | | | $(0.38 | ) | | | $(0.40 | ) |
From net realized gain on
investments | | | (0.00 | )(w) | | | (0.41 | ) | | | (0.24 | ) | | | (0.17 | ) | | | (0.01 | ) |
Total distributions declared to
shareholders | | | $(0.44 | ) | | | $(0.83 | ) | | | $(0.63 | ) | | | $(0.55 | ) | | | $(0.41 | ) |
Net asset value, end of period (x) | | | $12.28 | | | | $11.22 | | | | $12.70 | | | | $12.21 | | | | $11.82 | |
Total return (%) (r)(s)(x) | | | 13.54 | | | | (5.29 | ) | | | 9.36 | | | | 8.14 | | | | 10.83 | |
Ratios (%) (to average net assets)
and Supplemental data: | | | | | | | | | | | | | | | | | |
Expenses before expense reductions (f) | | | 0.77 | (h) | | | 0.81 | (h) | | | 0.81 | (h) | | | 0.82 | (h) | | | 0.83 | |
Expenses after expense reductions (f) | | | 0.75 | (h) | | | 0.76 | (h) | | | 0.78 | (h) | | | 0.81 | (h) | | | 0.83 | |
Net investment income | | | 3.44 | | | | 3.42 | | | | 2.97 | | | | 3.08 | | | | 3.09 | |
Portfolio turnover | | | 46 | | | | 62 | | | | 48 | | | | 63 | | | | 64 | |
Net assets at end of period
(000 omitted) | | | $1,434,280 | | | | $692,677 | | | | $721,242 | | | | $371,274 | | | | $280,443 | |
See Notes to Financial Statements
35
Financial Highlights – continued
| | | | | | | | | | | | | | | | | | | | |
| Class R1 | | Years ended 2/28, 2/29 | |
| | | 2017 | | | 2016 | | | 2015 | | | 2014 | | | 2013 | |
Net asset value, beginning of period | | | $11.21 | | | | $12.68 | | | | $12.20 | | | | $11.81 | | | | $11.04 | |
| Income (loss) from investment operations | | | | | | | | | | | | | | | | | |
Net investment income (d) | | | $0.31 | | | | $0.29 | | | | $0.24 | | | | $0.25 | | | | $0.23 | |
Net realized and unrealized gain (loss)
on investments and foreign
currency | | | 1.06 | | | | (1.05 | ) | | | 0.75 | | | | 0.57 | | | | 0.83 | |
Total from investment operations | | | $1.37 | | | | $(0.76 | ) | | | $0.99 | | | | $0.82 | | | | $1.06 | |
| Less distributions declared to shareholders | | | | | | | | | | | | | | | | | |
From net investment income | | | $(0.32 | ) | | | $(0.30 | ) | | | $(0.27 | ) | | | $(0.26 | ) | | | $(0.28 | ) |
From net realized gain on
investments | | | (0.00 | )(w) | | | (0.41 | ) | | | (0.24 | ) | | | (0.17 | ) | | | (0.01 | ) |
Total distributions declared to
shareholders | | | $(0.32 | ) | | | $(0.71 | ) | | | $(0.51 | ) | | | $(0.43 | ) | | | $(0.29 | ) |
Net asset value, end of period (x) | | | $12.26 | | | | $11.21 | | | | $12.68 | | | | $12.20 | | | | $11.81 | |
Total return (%) (r)(s)(x) | | | 12.35 | | | | (6.17 | ) | | | 8.20 | | | | 7.06 | | | | 9.75 | |
Ratios (%) (to average net assets)
and Supplemental data: | | | | | | | | | | | | | | | | | |
Expenses before expense reductions (f) | | | 1.77 | (h) | | | 1.81 | (h) | | | 1.81 | (h) | | | 1.82 | (h) | | | 1.84 | |
Expenses after expense reductions (f) | | | 1.75 | (h) | | | 1.76 | (h) | | | 1.78 | (h) | | | 1.81 | (h) | | | 1.84 | |
Net investment income | | | 2.55 | | | | 2.43 | | | | 1.95 | | | | 2.11 | | | | 2.04 | |
Portfolio turnover | | | 46 | | | | 62 | | | | 48 | | | | 63 | | | | 64 | |
Net assets at end of period
(000 omitted) | | | $938 | | | | $1,268 | | | | $918 | | | | $775 | | | | $375 | |
See Notes to Financial Statements
36
Financial Highlights – continued
| | | | | | | | | | | | | | | | | | | | |
| Class R2 | | Years ended 2/28, 2/29 | |
| | | 2017 | | | 2016 | | | 2015 | | | 2014 | | | 2013 | |
Net asset value, beginning of period | | | $11.22 | | | | $12.70 | | | | $12.20 | | | | $11.82 | | | | $11.04 | |
| Income (loss) from investment operations | | | | | | | | | | | | | | | | | |
Net investment income (d) | | | $0.36 | | | | $0.35 | | | | $0.31 | | | | $0.31 | | | | $0.30 | |
Net realized and unrealized gain (loss)
on investments and foreign
currency | | | 1.08 | | | | (1.06 | ) | | | 0.76 | | | | 0.56 | | | | 0.83 | |
Total from investment operations | | | $1.44 | | | | $(0.71 | ) | | | $1.07 | | | | $0.87 | | | | $1.13 | |
| Less distributions declared to shareholders | | | | | | | | | | | | | | | | | |
From net investment income | | | $(0.38 | ) | | | $(0.36 | ) | | | $(0.33 | ) | | | $(0.32 | ) | | | $(0.34 | ) |
From net realized gain on
investments | | | (0.00 | )(w) | | | (0.41 | ) | | | (0.24 | ) | | | (0.17 | ) | | | (0.01 | ) |
Total distributions declared to
shareholders | | | $(0.38 | ) | | | $(0.77 | ) | | | $(0.57 | ) | | | $(0.49 | ) | | | $(0.35 | ) |
Net asset value, end of period (x) | | | $12.28 | | | | $11.22 | | | | $12.70 | | | | $12.20 | | | | $11.82 | |
Total return (%) (r)(s)(x) | | | 12.98 | | | | (5.77 | ) | | | 8.90 | | | | 7.51 | | | | 10.39 | |
Ratios (%) (to average net assets)
and Supplemental data: | | | | | | | | | | | | | | | | | |
Expenses before expense reductions (f) | | | 1.27 | (h) | | | 1.31 | (h) | | | 1.31 | (h) | | | 1.32 | (h) | | | 1.34 | |
Expenses after expense reductions (f) | | | 1.25 | (h) | | | 1.26 | (h) | | | 1.28 | (h) | | | 1.31 | (h) | | | 1.34 | |
Net investment income | | | 2.99 | | | | 2.94 | | | | 2.47 | | | | 2.59 | | | | 2.59 | |
Portfolio turnover | | | 46 | | | | 62 | | | | 48 | | | | 63 | | | | 64 | |
Net assets at end of period
(000 omitted) | | | $4,223 | | | | $3,139 | | | | $2,113 | | | | $1,180 | | | | $702 | |
See Notes to Financial Statements
37
Financial Highlights – continued
| | | | | | | | | | | | | | | | | | | | |
| Class R3 | | Years ended 2/28, 2/29 | |
| | | 2017 | | | 2016 | | | 2015 | | | 2014 | | | 2013 | |
Net asset value, beginning of period | | | $11.23 | | | | $12.71 | | | | $12.21 | | | | $11.83 | | | | $11.05 | |
| Income (loss) from investment operations | | | | | | | | | | | | | | | | | |
Net investment income (d) | | | $0.39 | | | | $0.38 | | | | $0.34 | | | | $0.34 | | | | $0.31 | |
Net realized and unrealized gain (loss)
on investments and foreign
currency | | | 1.07 | | | | (1.06 | ) | | | 0.76 | | | | 0.56 | | | | 0.85 | |
Total from investment operations | | | $1.46 | | | | $(0.68 | ) | | | $1.10 | | | | $0.90 | | | | $1.16 | |
| Less distributions declared to shareholders | | | | | | | | | | | | | | | | | |
From net investment income | | | $(0.41 | ) | | | $(0.39 | ) | | | $(0.36 | ) | | | $(0.35 | ) | | | $(0.37 | ) |
From net realized gain on
investments | | | (0.00 | )(w) | | | (0.41 | ) | | | (0.24 | ) | | | (0.17 | ) | | | (0.01 | ) |
Total distributions declared to
shareholders | | | $(0.41 | ) | | | $(0.80 | ) | | | $(0.60 | ) | | | $(0.52 | ) | | | $(0.38 | ) |
Net asset value, end of period (x) | | | $12.28 | | | | $11.23 | | | | $12.71 | | | | $12.21 | | | | $11.83 | |
Total return (%) (r)(s)(x) | | | 13.16 | | | | (5.52 | ) | | | 9.17 | | | | 7.77 | | | | 10.65 | |
Ratios (%) (to average net assets)
and Supplemental data: | | | | | | | | | | | | | | | | | |
Expenses before expense reductions (f) | | | 1.02 | (h) | | | 1.07 | (h) | | | 1.06 | (h) | | | 1.07 | (h) | | | 1.10 | |
Expenses after expense reductions (f) | | | 1.00 | (h) | | | 1.02 | (h) | | | 1.03 | (h) | | | 1.06 | (h) | | | 1.10 | |
Net investment income | | | 3.24 | | | | 3.19 | | | | 2.70 | | | | 2.84 | | | | 2.70 | |
Portfolio turnover | | | 46 | | | | 62 | | | | 48 | | | | 63 | | | | 64 | |
Net assets at end of period
(000 omitted) | | | $19,274 | | | | $15,393 | | | | $7,995 | | | | $5,256 | | | | $2,783 | |
See Notes to Financial Statements
38
Financial Highlights – continued
| | | | | | | | | | | | | | | | | | | | |
| Class R4 | | Years ended 2/28, 2/29 | |
| | | 2017 | | | 2016 | | | 2015 | | | 2014 | | | 2013 | |
Net asset value, beginning of period | | | $11.23 | | | | $12.71 | | | | $12.21 | | | | $11.82 | | | | $11.05 | |
| Income (loss) from investment operations | | | | | | | | | | | | | | | | | |
Net investment income (d) | | | $0.42 | | | | $0.41 | | | | $0.37 | | | | $0.37 | | | | $0.36 | |
Net realized and unrealized gain (loss)
on investments and foreign
currency | | | 1.08 | | | | (1.06 | ) | | | 0.76 | | | | 0.57 | | | | 0.82 | |
Total from investment operations | | | $1.50 | | | | $(0.65 | ) | | | $1.13 | | | | $0.94 | | | | $1.18 | |
| Less distributions declared to shareholders | | | | | | | | | | | | | | | | | |
From net investment income | | | $(0.44 | ) | | | $(0.42 | ) | | | $(0.39 | ) | | | $(0.38 | ) | | | $(0.40 | ) |
From net realized gain on
investments | | | (0.00 | )(w) | | | (0.41 | ) | | | (0.24 | ) | | | (0.17 | ) | | | (0.01 | ) |
Total distributions declared to
shareholders | | | $(0.44 | ) | | | $(0.83 | ) | | | $(0.63 | ) | | | $(0.55 | ) | | | $(0.41 | ) |
Net asset value, end of period (x) | | | $12.29 | | | | $11.23 | | | | $12.71 | | | | $12.21 | | | | $11.82 | |
Total return (%) (r)(s)(x) | | | 13.53 | | | | (5.29 | ) | | | 9.44 | | | | 8.13 | | | | 10.83 | |
Ratios (%) (to average net assets)
and Supplemental data: | | | | | | | | | | | | | | | | | |
Expenses before expense reductions (f) | | | 0.77 | (h) | | | 0.81 | (h) | | | 0.81 | (h) | | | 0.82 | (h) | | | 0.84 | |
Expenses after expense reductions (f) | | | 0.75 | (h) | | | 0.76 | (h) | | | 0.78 | (h) | | | 0.81 | (h) | | | 0.84 | |
Net investment income | | | 3.50 | | | | 3.42 | | | | 2.96 | | | | 3.08 | | | | 3.12 | |
Portfolio turnover | | | 46 | | | | 62 | | | | 48 | | | | 63 | | | | 64 | |
Net assets at end of period
(000 omitted) | | | $6,179 | | | | $5,173 | | | | $4,936 | | | | $2,834 | | | | $1,159 | |
See Notes to Financial Statements
39
Financial Highlights – continued
| | | | | | | | | | | | | | | | | | | | |
| Class R6 (formerly Class R5) | | Years ended 2/28, 2/29 | |
| | | 2017 | | | 2016 | | | 2015 | | | 2014 | | | 2013 (i) | |
Net asset value, beginning of period | | | $11.22 | | | | $12.70 | | | | $12.21 | | | | $11.82 | | | | $11.16 | |
| Income (loss) from investment operations | | | | | | | | | | | | | | | | | |
Net investment income (d) | | | $0.43 | | | | $0.42 | | | | $0.38 | | | | $0.38 | | | | $0.19 | |
Net realized and unrealized gain (loss)
on investments and foreign
currency | | | 1.08 | | | | (1.06 | ) | | | 0.75 | | | | 0.57 | | | | 0.75 | |
Total from investment operations | | | $1.51 | | | | $(0.64 | ) | | | $1.13 | | | | $0.95 | | | | $0.94 | |
| Less distributions declared to shareholders | | | | | | | | | | | | | | | | | |
From net investment income | | | $(0.45 | ) | | | $(0.43 | ) | | | $(0.40 | ) | | | $(0.39 | ) | | | $(0.27 | ) |
From net realized gain on
investments | | | (0.00 | )(w) | | | (0.41 | ) | | | (0.24 | ) | | | (0.17 | ) | | | (0.01 | ) |
Total distributions declared to
shareholders | | | $(0.45 | ) | | | $(0.84 | ) | | | $(0.64 | ) | | | $(0.56 | ) | | | $(0.28 | ) |
Net asset value, end of period (x) | | | $12.28 | | | | $11.22 | | | | $12.70 | | | | $12.21 | | | | $11.82 | |
Total return (%) (r)(s)(x) | | | 13.65 | | | | (5.20 | ) | | | 9.46 | | | | 8.23 | | | | 8.47 | (n) |
Ratios (%) (to average net assets)
and Supplemental data: | | | | | | | | | | | | | | | | | |
Expenses before expense reductions (f) | | | 0.67 | (h) | | | 0.70 | (h) | | | 0.72 | (h) | | | 0.73 | (h) | | | 0.79 | (a) |
Expenses after expense reductions (f) | | | 0.65 | (h) | | | 0.65 | (h) | | | 0.69 | (h) | | | 0.72 | (h) | | | 0.79 | (a) |
Net investment income | | | 3.57 | | | | 3.55 | | | | 3.05 | | | | 3.18 | | | | 2.48 | (a) |
Portfolio turnover | | | 46 | | | | 62 | | | | 48 | | | | 63 | | | | 64 | |
Net assets at end of period
(000 omitted) | | | $15,036 | | | | $11,073 | | | | $2,569 | | | | $2,101 | | | | $1,393 | |
| (d) | Per share data is based on average shares outstanding. |
| (f) | Ratios do not reflect reductions from fees paid indirectly, if applicable. |
| (h) | In addition to the fees and expenses which the fund bears directly, the fund indirectly bears a pro rata share of the fees and expenses of the underlying affiliated funds in which the fund invests. Accordingly, the expense ratio for the fund reflects only those fees and expenses borne directly by the fund. Because the underlying affiliated funds have varied expense and fee levels and the fund may own different proportions of the underlying affiliated funds at different times, the amount of fees and expenses incurred indirectly by the fund will vary. |
| (i) | For the period from the class’s inception, July 2, 2012, through the stated period end. |
| (r) | Certain expenses have been reduced without which performance would have been lower. |
| (s) | From time to time the fund may receive proceeds from litigation settlements, without which performance would be lower. |
| (t) | Total returns do not include any applicable sales charges. |
| (w) | Per share amount was less than $0.01. |
| (x) | The net asset values and total returns have been calculated on net assets which include adjustments made in accordance with U.S. generally accepted accounting principles required at period end for financial reporting purposes |
See Notes to Financial Statements
40
NOTES TO FINANCIAL STATEMENTS
(1) Business and Organization
MFS Diversified Income Fund (the fund) is a diversified series of MFS Series Trust XIII (the trust). The trust is organized as a Massachusetts business trust and is registered under the Investment Company Act of 1940, as amended, as an open-end management investment company.
The fund is an investment company and accordingly follows the investment company accounting and reporting guidance of the Financial Accounting Standards Board (FASB) Accounting Standards Codification Topic 946 Financial Services – Investment Companies.
(2) Significant Accounting Policies
General – The preparation of financial statements in conformity with U.S. generally accepted accounting principles requires management to make estimates and assumptions that affect the reported amounts of assets and liabilities, and disclosure of contingent assets and liabilities at the date of the financial statements and the reported amounts of increases and decreases in net assets from operations during the reporting period. Actual results could differ from those estimates. In the preparation of these financial statements, management has evaluated subsequent events occurring after the date of the fund’s Statement of Assets and Liabilities through the date that the financial statements were issued. The fund invests in the MFS High Yield Pooled Portfolio (“High Yield Pooled Portfolio”). MFS does not receive a management fee from the High Yield Pooled Portfolio. The High Yield Pooled Portfolio’s investment objective is to seek total return with an emphasis on high current income, but also considering capital appreciation. The accounting policies of the High Yield Pooled Portfolio are outlined in its shareholder report, which is available without charge by calling 1-800-225-2606 and on the Securities and Exchange Commission (SEC) web site at http://www.sec.gov or at the SEC’s public reference room in Washington, D.C. The accounting policies detailed in the Significant Accounting Policies note cover both the fund and the High Yield Pooled Portfolio. For purposes of this policy disclosure, “fund” refers to both the fund and the High Yield Pooled Portfolio in which the fund invests. The High Yield Pooled Portfolio’s shareholder report is not covered by this report. The fund and the High Yield Pooled Portfolio invest in high-yield securities rated below investment grade. Investments in high-yield securities involve greater degrees of credit and market risk than investments in higher-rated securities and tend to be more sensitive to economic conditions. The fund and the High Yield Pooled Portfolio invest in foreign securities. Investments in foreign securities are vulnerable to the effects of changes in the relative values of the local currency and the U.S. dollar and to the effects of changes in each country’s legal, political, and economic environment. The fund invests a significant amount of its net assets in U.S. and foreign real estate related investments and as a result is subject to certain risks associated with the direct ownership of real estate and the real estate industry in general. These include risks related to general, regional and local economic conditions; fluctuations in interest rates; property tax rates, zoning laws, environmental regulations and other governmental action; cash flow dependency; increased operating expenses; lack of availability of mortgage funds; losses due to natural disasters; changes in property values and rental rates; and other factors.
41
Notes to Financial Statements – continued
In October 2016, the Securities and Exchange Commission (SEC) released its Final Rule on Investment Company Reporting Modernization (the “Rule”). The Rule, which introduces two new regulatory reporting forms for investment companies – Form N-PORT and Form N-CEN – also contains amendments to Regulation S-X which impact financial statement presentation, particularly the presentation of derivative investments. Although still evaluating the impacts of the Rule, management believes that many of the Regulation S-X amendments are consistent with the fund’s current financial statement presentation and expects that the fund will be able to comply with the Rule’s Regulation S-X amendments by the August 1, 2017 compliance date.
Balance Sheet Offsetting – The fund’s accounting policy with respect to balance sheet offsetting is that, absent an event of default by the counterparty or a termination of the agreement, the International Swaps and Derivatives Association (ISDA) Master Agreement does not result in an offset of reported amounts of financial assets and financial liabilities in the Statement of Assets and Liabilities across transactions between the fund and the applicable counterparty. The fund’s right to setoff may be restricted or prohibited by the bankruptcy or insolvency laws of the particular jurisdiction to which a specific master netting agreement counterparty is subject. Balance sheet offsetting disclosures, to the extent applicable to the fund, have been included in the fund’s Significant Accounting Policies note under the captions for each of the fund’s in-scope financial instruments and transactions.
Investment Valuations – The investments of the fund and the High Yield Pooled Portfolio are valued as described below.
Equity securities, including restricted equity securities, are generally valued at the last sale or official closing price on their primary market or exchange as provided by a third-party pricing service. Equity securities, for which there were no sales reported that day, are generally valued at the last quoted daily bid quotation on their primary market or exchange as provided by a third-party pricing service. Debt instruments and floating rate loans, including restricted debt instruments, are generally valued at an evaluated or composite bid as provided by a third-party pricing service. Short-term instruments with a maturity at issuance of 60 days or less may be valued at amortized cost, which approximates market value. Exchange-traded options are generally valued at the last sale or official closing price on their primary exchange as provided by a third-party pricing service. Exchange-traded options for which there were no sales reported that day are generally valued at the last daily bid quotation on their primary exchange as provided by a third-party pricing service. Options not traded on an exchange are generally valued at a broker/dealer bid quotation. Foreign currency options are generally valued at valuations provided by a third-party pricing service. Futures contracts are generally valued at last posted settlement price on their primary exchange as provided by a third-party pricing service. Futures contracts for which there were no trades that day for a particular position are generally valued at the closing bid quotation on their primary exchange as provided by a third-party pricing service. Forward foreign currency exchange contracts are generally valued at the mean of bid and asked prices for the time period interpolated from rates provided by a third-party pricing service for proximate time periods. Open-end investment companies are generally valued at net asset value per share. Securities and other assets generally valued on the basis of information from a third-party pricing service may also be valued
42
Notes to Financial Statements – continued
at a broker/dealer bid quotation. Values obtained from third-party pricing services can utilize both transaction data and market information such as yield, quality, coupon rate, maturity, type of issue, trading characteristics, and other market data. The values of foreign securities and other assets and liabilities expressed in foreign currencies are converted to U.S. dollars using the mean of bid and asked prices for rates provided by a third-party pricing service.
The Board of Trustees has delegated primary responsibility for determining or causing to be determined the value of the fund’s investments (including any fair valuation) to the adviser pursuant to valuation policies and procedures approved by the Board. If the adviser determines that reliable market quotations are not readily available, investments are valued at fair value as determined in good faith by the adviser in accordance with such procedures under the oversight of the Board of Trustees. Under the fund’s valuation policies and procedures, market quotations are not considered to be readily available for most types of debt instruments and floating rate loans and many types of derivatives. These investments are generally valued at fair value based on information from third-party pricing services. In addition, investments may be valued at fair value if the adviser determines that an investment’s value has been materially affected by events occurring after the close of the exchange or market on which the investment is principally traded (such as foreign exchange or market) and prior to the determination of the fund’s net asset value, or after the halting of trading of a specific security where trading does not resume prior to the close of the exchange or market on which the security is principally traded. Events that occur on a frequent basis after foreign markets close (such as developments in foreign markets and significant movements in the U.S. markets) and prior to the determination of the fund’s net asset value may be deemed to have a material effect on the value of securities traded in foreign markets. Accordingly, the fund’s foreign equity securities may often be valued at fair value. The adviser generally relies on third-party pricing services or other information (such as the correlation with price movements of similar securities in the same or other markets; the type, cost and investment characteristics of the security; the business and financial condition of the issuer; and trading and other market data) to assist in determining whether to fair value and at what value to fair value an investment. The value of an investment for purposes of calculating the fund’s net asset value can differ depending on the source and method used to determine value. When fair valuation is used, the value of an investment used to determine the fund’s net asset value may differ from quoted or published prices for the same investment. There can be no assurance that the fund could obtain the fair value assigned to an investment if it were to sell the investment at the same time at which the fund determines its net asset value per share.
Various inputs are used in determining the value of the fund’s assets or liabilities. These inputs are categorized into three broad levels. In certain cases, the inputs used to measure fair value may fall into different levels of the fair value hierarchy. In such cases, an investment’s level within the fair value hierarchy is based on the lowest level of input that is significant to the fair value measurement. The fund’s assessment of the significance of a particular input to the fair value measurement in its entirety requires judgment, and considers factors specific to the investment. Level 1 includes unadjusted quoted prices in active markets for identical assets or liabilities. Level 2 includes other significant observable market-based inputs (including quoted prices for similar
43
Notes to Financial Statements – continued
securities, interest rates, prepayment speed, and credit risk). Level 3 includes unobservable inputs, which may include the adviser’s own assumptions in determining the fair value of investments. Other financial instruments are derivative instruments not reflected in total investments, such as futures contracts and forward foreign currency exchange contracts. The following is a summary of the levels used as of February 28, 2017 in valuing the fund’s assets or liabilities:
| | | | | | | | | | | | | | | | |
| Investments at Value | | Level 1 | | | Level 2 | | | Level 3 | | | Total | |
| Equity Securities: | | | | | | | | | | | | | | | | |
United States | | | $1,087,080,631 | | | | $195,350 | | | | $— | | | | $1,087,275,981 | |
Switzerland | | | 60,418,148 | | | | — | | | | — | | | | 60,418,148 | |
United Kingdom | | | 60,346,101 | | | | — | | | | — | | | | 60,346,101 | |
Canada | | | 46,539,537 | | | | — | | | | — | | | | 46,539,537 | |
Germany | | | 29,994,149 | | | | — | | | | — | | | | 29,994,149 | |
Taiwan | | | 29,604,701 | | | | — | | | | — | | | | 29,604,701 | |
Japan | | | 29,600,401 | | | | — | | | | — | | | | 29,600,401 | |
France | | | 26,250,310 | | | | — | | | | — | | | | 26,250,310 | |
South Korea | | | 17,411,446 | | | | — | | | | — | | | | 17,411,446 | |
Other Countries | | | 115,656,447 | | | | 9,588,045 | | | | — | | | | 125,244,492 | |
| U.S. Treasury Bonds & U.S. Government Agency & Equivalents | | | — | | | | 426,448,577 | | | | — | | | | 426,448,577 | |
| Non-U.S. Sovereign Debt | | | — | | | | 241,845,249 | | | | — | | | | 241,845,249 | |
| U.S. Corporate Bonds | | | — | | | | 7,665,234 | | | | — | | | | 7,665,234 | |
| Residential Mortgage-Backed Securities | | | — | | | | 423,680,363 | | | | — | | | | 423,680,363 | |
| Commercial Mortgage-Backed Securities | | | — | | | | 21,127,799 | | | | — | | | | 21,127,799 | |
| Asset-Backed Securities (including CDOs) | | | — | | | | 5,743,703 | | | | — | | | | 5,743,703 | |
| Foreign Bonds | | | — | | | | 111,237,926 | | | | — | | | | 111,237,926 | |
| Mutual Funds | | | 1,140,969,181 | | | | — | | | | — | | | | 1,140,969,181 | |
| Total Investments | | | $2,643,871,052 | | | | $1,247,532,246 | | | | $— | | | | $3,891,403,298 | |
| | | | |
| Other Financial Instruments | | | | | | | | | | | | |
| Futures Contracts – Liabilities | | | $(16,818 | ) | | | $— | | | | $— | | | | $(16,818 | ) |
| Forward Currency Contracts – Assets | | | — | | | | 74,639 | | | | — | | | | 74,639 | |
| Forward Currency Contracts – Liabilities | | | — | | | | (50,793 | ) | | | — | | | | (50,793 | ) |
For further information regarding security characteristics, see the Portfolio of Investments. Please refer to the High Yield Pooled Portfolio’s shareholder reports for further information regarding the levels used in valuing the underlying funds’ assets or liabilities.
Of the level 1 investments presented above, equity investments amounting to $209,632,121 were considered level 2 investments at the beginning of the period. The primary reason for changes in the classifications between levels 1 and 2 occurs when foreign equity securities are fair valued using other observable market-based inputs in place of the closing exchange price due to events occurring after the close of the exchange or market on which the investment is principally traded. The fund’s foreign equity securities may often be valued using other observable market-based inputs. The fund’s policy is to recognize transfers between the levels as of the end of the period.
44
Notes to Financial Statements – continued
Inflation-Adjusted Debt Securities – The fund invests in inflation-adjusted debt securities issued by the U.S. Treasury. The principal value of these debt securities is adjusted through income according to changes in the Consumer Price Index. These debt securities typically pay a fixed rate of interest, but this fixed rate is applied to the inflation-adjusted principal amount. The principal paid at maturity of the debt security is typically equal to the inflation-adjusted principal amount, or the security’s original par value, whichever is greater. Other types of inflation-adjusted securities may use other methods to adjust for other measures of inflation.
Foreign Currency Translation – Purchases and sales of foreign investments, income, and expenses are converted into U.S. dollars based upon currency exchange rates prevailing on the respective dates of such transactions or on the reporting date for foreign denominated receivables and payables. Gains and losses attributable to foreign currency exchange rates on sales of securities are recorded for financial statement purposes as net realized gains and losses on investments. Gains and losses attributable to foreign exchange rate movements on receivables, payables, income and expenses are recorded for financial statement purposes as foreign currency transaction gains and losses. That portion of both realized and unrealized gains and losses on investments that results from fluctuations in foreign currency exchange rates is not separately disclosed.
Derivatives – The fund uses derivatives for different purposes, primarily to increase or decrease exposure to a particular market or segment of the market, or security, to increase or decrease interest rate or currency exposure, or as alternatives to direct investments. Derivatives are used for hedging or non-hedging purposes. While hedging can reduce or eliminate losses, it can also reduce or eliminate gains. When the fund uses derivatives as an investment to increase market exposure, or for hedging purposes, gains and losses from derivative instruments may be substantially greater than the derivative’s original cost.
The derivative instruments used by the fund were purchased options, futures contracts and forward foreign currency exchange contracts. The fund’s period end derivatives, as presented in the Portfolio of Investments and the associated Derivative Contract tables, generally are indicative of the volume of its derivative activity during the period.
The following table presents, by major type of derivative contract, the fair value, on a gross basis, of the asset and liability components of derivatives held by the fund at February 28, 2017 as reported in the Statement of Assets and Liabilities:
| | | | | | | | | | |
| | | | | Fair Value (a) | |
| Risk | | Derivative Contracts | | Asset Derivatives | | | Liability Derivatives | |
| Interest Rate | | Interest Rate Futures | | | $— | | | | $(16,818 | ) |
| Foreign Exchange | | Forward Foreign Currency Exchange | | | 74,639 | | | | (50,793 | ) |
| Equity | | Purchased Equity Options | | | 903,830 | | | | — | |
| Total | | | | | $978,469 | | | | $(67,611 | ) |
| (a) | The value of purchased options outstanding is included in total investments, at value, within the fund’s Statement of Assets and Liabilities. The value of futures contracts includes cumulative appreciation (depreciation) as reported in the fund’s Portfolio of Investments. Only |
45
Notes to Financial Statements – continued
| | the current day net variation margin for futures contracts is separately reported within the fund’s Statement of Assets and Liabilities. |
The following table presents, by major type of derivative contract, the realized gain (loss) on derivatives held by the fund for the year ended February 28, 2017 as reported in the Statement of Operations:
| | | | | | | | | | | | |
| Risk | | Futures
Contracts | | | Foreign
Currency | | | Investments
(Purchased
Options) | |
| Interest Rate | | | $93,779 | | | | $— | | | | $— | |
| Foreign Exchange | | | — | | | | 110,112 | | | | — | |
| Equity | | | — | | | | — | | | | (2,871,885 | ) |
| Total | | | $93,779 | | | | $110,112 | | | | $(2,871,885 | ) |
The following table presents, by major type of derivative contract, the change in unrealized appreciation (depreciation) on derivatives held by the fund for the year ended February 28, 2017 as reported in the Statement of Operations:
| | | | | | | | | | | | |
| Risk | | Futures
Contracts | | | Translation
of Assets and
Liabilities in
Foreign
Currencies | | | Investments
(Purchased
Options) | |
| Interest Rate | | | $(16,818 | ) | | | $— | | | | $— | |
| Foreign Exchange | | | — | | | | 38,587 | | | | — | |
| Equity | | | — | | | | — | | | | (2,698,817 | ) |
| Total | | | $(16,818 | ) | | | $38,587 | | | | $(2,698,817 | ) |
Derivative counterparty credit risk is managed through formal evaluation of the creditworthiness of all potential counterparties. On certain, but not all, uncleared derivatives, the fund attempts to reduce its exposure to counterparty credit risk whenever possible by entering into an ISDA Master Agreement on a bilateral basis. The ISDA Master Agreement gives each party to the agreement the right to terminate all transactions traded under such agreement if there is a certain deterioration in the credit quality of the other party. Upon an event of default or a termination of the ISDA Master Agreement, the non-defaulting party has the right to close out all transactions traded under such agreement and to net amounts owed under each agreement to one net amount payable by one party to the other. This right to close out and net payments across all transactions traded under the ISDA Master Agreement could result in a reduction of the fund’s credit risk to such counterparty equal to any amounts payable by the fund under the applicable transactions, if any.
Collateral and margin requirements differ by type of derivative. Margin requirements are set by the clearing broker and the clearing house for cleared derivatives (e.g., futures contracts, cleared swaps, and exchange-traded options) while collateral terms are contract specific for uncleared derivatives (e.g., forward foreign currency exchange contracts, uncleared swap agreements, and uncleared options). For derivatives traded under an ISDA Master Agreement, which contains a collateral support annex, the collateral requirements are netted across all transactions traded under such agreement and one amount is posted from one party to the other to collateralize such obligations.
46
Notes to Financial Statements – continued
Cash that has been segregated to cover the fund’s collateral or margin obligations under derivative contracts, if any, will be reported separately in the Statement of Assets and Liabilities as “Restricted cash” or “Deposits with brokers.” Securities pledged as collateral or margin for the same purpose, if any, are noted in the Portfolio of Investments. The fund may be required to make payments of interest on uncovered collateral or margin obligations with the broker. Any such payments are included in “Miscellaneous” expense in the Statement of Operations.
Purchased Options – The fund purchased put options for a premium. Purchased put options entitle the holder to sell a specified number of shares or units of a particular security, currency or index at a specified price at a specified date or within a specified period of time. Purchasing put options may hedge against an anticipated decline in the value of portfolio securities or currency or decrease the fund’s exposure to an underlying instrument.
The premium paid is initially recorded as an investment in the Statement of Assets and Liabilities. That investment is subsequently marked-to-market daily with the difference between the premium paid and the market value of the purchased option being recorded as unrealized appreciation or depreciation. Premiums paid for purchased put options which have expired are treated as realized losses on investments in the Statement of Operations. Upon the exercise or closing of a purchased put option, the premium paid is offset against the proceeds on the sale of the underlying security or financial instrument in order to determine the realized gain or loss on investments.
Whether or not the option is exercised, the fund’s maximum risk of loss from purchasing an option is the amount of premium paid. All option contracts involve credit risk if the counterparty to the option contract fails to perform. For uncleared options, this risk is mitigated in cases where there is an ISDA Master Agreement between the fund and the counterparty providing for netting as described above and, where applicable, by the posting of collateral by the counterparty to the fund to cover the fund’s exposure to the counterparty under such ISDA Master Agreement.
Futures Contracts – The fund entered into futures contracts which may be used to hedge against or obtain broad market exposure, interest rate exposure, currency exposure, or to manage duration. A futures contract represents a commitment for the future purchase or sale of an asset at a specified price on a specified date.
Upon entering into a futures contract, the fund is required to deposit with the broker, either in cash or securities, an initial margin in an amount equal to a certain percentage of the notional amount of the contract. Subsequent payments (variation margin) are made or received by the fund each day, depending on the daily fluctuations in the value of the contract, and are recorded for financial statement purposes as unrealized gain or loss by the fund until the contract is closed or expires at which point the gain or loss on futures contracts is realized.
The fund bears the risk of interest rates, exchange rates or securities prices moving unexpectedly, in which case, the fund may not achieve the anticipated benefits of the futures contracts and may realize a loss. While futures contracts may present less counterparty risk to the fund since the contracts are exchange traded and the exchange’s clearinghouse guarantees payments to the broker, there is still counterparty credit risk due to the insolvency of the broker. The fund’s maximum risk of loss due to
47
Notes to Financial Statements – continued
counterparty credit risk is equal to the margin posted by the fund to the broker plus any gains or minus any losses on the outstanding futures contracts.
Forward Foreign Currency Exchange Contracts – The fund entered into forward foreign currency exchange contracts for the purchase or sale of a specific foreign currency at a fixed price on a future date. These contracts may be used to hedge the fund’s currency risk or for non-hedging purposes. For hedging purposes, the fund may enter into contracts to deliver or receive foreign currency that the fund will receive from or use in its normal investment activities. The fund may also use contracts to hedge against declines in the value of foreign currency denominated securities due to unfavorable exchange rate movements. For non-hedging purposes, the fund may enter into contracts with the intent of changing the relative exposure of the fund’s portfolio of securities to different currencies to take advantage of anticipated exchange rate changes.
Forward foreign currency exchange contracts are adjusted by the daily exchange rate of the underlying currency and any unrealized gains or losses are recorded as a receivable or payable for forward foreign currency exchange contracts until the contract settlement date. On contract settlement date, any gain or loss on the contract is recorded as realized gains or losses on foreign currency.
Risks may arise upon entering into these contracts from unanticipated movements in the value of the contract and from the potential inability of counterparties to meet the terms of their contracts. Generally, the fund’s maximum risk due to counterparty credit risk is the unrealized gain on the contract due to the use of Continuous Linked Settlement, a multicurrency cash settlement system for the centralized settlement of foreign transactions. This risk is mitigated in cases where there is an ISDA Master Agreement between the fund and the counterparty providing for netting as described above and, where applicable, by the posting of collateral by the counterparty to the fund to cover the fund’s exposure to the counterparty under such ISDA Master Agreement.
Security Loans – Under its Securities Lending Agency Agreement with the fund, JPMorgan Chase and Co. (“Chase”), as lending agent, loans the securities of the fund to certain qualified institutions (the “Borrowers”) approved by the fund. Security loans can be terminated at the discretion of either the lending agent or the fund and the related securities must be returned within the earlier of the standard trade settlement period for such securities or within three business days. The loans are collateralized by cash and/or U.S. Treasury and federal agency obligations in an amount typically at least equal to the market value of the securities loaned. On loans collateralized by cash, the cash collateral is invested in a money market fund. The market value of the loaned securities is determined at the close of business of the fund and any additional required collateral is delivered to the fund on the next business day. Chase provides the fund with indemnification against Borrower default. In the event of Borrower default, Chase will, for the benefit of the fund, either purchase securities identical to those loaned or, when such purchase is commercially impracticable, pay the fund the market value of the loaned securities. In return, Chase assumes the fund’s rights to the related collateral. If the collateral value is less than the cost to purchase identical securities, Chase is responsible for the shortfall, but only to the extent that such shortfall is not
48
Notes to Financial Statements – continued
due to a decline in collateral value resulting from collateral reinvestment for which the fund bears the risk of loss. At period end, the fund had investment securities on loan, all of which were classified as equity securities in the fund’s Portfolio of Investments, with a fair value of $1,356,328. The fair value of the fund’s investment securities on loan and a related liability of $1,421,581 for cash collateral received on securities loaned are both presented gross in the Statement of Assets and Liabilities. The collateral received on securities loaned exceeded the value of securities on loan at period end. The liability for cash collateral for securities loaned is carried at fair value, which is categorized as level 2 within the fair value hierarchy. A portion of the income generated upon investment of the collateral is remitted to the Borrowers, and the remainder is allocated between the fund and the lending agent. On loans collateralized by U.S. Treasury and/or federal agency obligations, a fee is received from the Borrower, and is allocated between the fund and the lending agent. Income from securities lending is included in “Interest” income in the Statement of Operations. The dividend and interest income earned on the securities loaned is accounted for in the same manner as other dividend and interest income.
Dollar Roll Transactions – The fund enters into dollar roll transactions, with respect to mortgage-backed securities issued by Ginnie Mae, Fannie Mae, and Freddie Mac, in which the fund sells mortgage-backed securities to financial institutions and simultaneously agrees to purchase similar (same issuer, type and coupon) securities at a later date at an agreed-upon price. During the period between the sale and repurchase in a dollar roll transaction the fund will not be entitled to receive interest and principal payments on the securities sold but is compensated by interest earned on the proceeds of the initial sale and by a lower purchase price on the securities to be repurchased which enhances the fund’s total return. The fund accounts for dollar roll transactions as purchases and sales and realizes gains and losses on these transactions.
Loans and Other Direct Debt Instruments – The fund invests in loans and loan participations or other receivables. These investments may include standby financing commitments, including revolving credit facilities, which contractually obligate the fund to supply additional cash to the borrower on demand. The fund generally provides this financial support in order to preserve its existing investment or to obtain a more senior secured interest in the assets of the borrower. Loan participations involve a risk of insolvency of the lending bank or other financial intermediary.
Indemnifications – Under the fund’s organizational documents, its officers and Trustees may be indemnified against certain liabilities and expenses arising out of the performance of their duties to the fund. Additionally, in the normal course of business, the fund enters into agreements with service providers that may contain indemnification clauses. The fund’s maximum exposure under these agreements is unknown as this would involve future claims that may be made against the fund that have not yet occurred.
Investment Transactions and Income – Investment transactions are recorded on the trade date. Interest income is recorded on the accrual basis. All premium and discount is amortized or accreted for financial statement purposes in accordance with U.S. generally accepted accounting principles. Inflation-indexed bonds are fixed-income securities whose principal value is periodically adjusted upward or downward based on
49
Notes to Financial Statements – continued
the rate of inflation. Interest is accrued based on the principal value, which is adjusted for inflation. Any increase or decrease in the principal amount of an inflation-indexed bond is generally recorded as an increase or decrease in interest income, respectively, even though the adjusted principal is not received until maturity. Dividends received in cash are recorded on the ex-dividend date. Certain dividends from foreign securities will be recorded when the fund is informed of the dividend if such information is obtained subsequent to the ex-dividend date. Dividend and interest payments received in additional securities are recorded on the ex-dividend or ex-interest date in an amount equal to the value of the security on such date. Debt obligations may be placed on non-accrual status or set to accrue at a rate of interest less than the contractual coupon when the collection of all or a portion of interest has become doubtful. Interest income for those debt obligations may be further reduced by the write-off of the related interest receivables when deemed uncollectible.
The fund may receive proceeds from litigation settlements. Any proceeds received from litigation involving portfolio holdings are reflected in the Statement of Operations in realized gain/loss if the security has been disposed of by the fund or in unrealized gain/loss if the security is still held by the fund. Any other proceeds from litigation not related to portfolio holdings are reflected as other income in the Statement of Operations.
The fund invests a significant portion of its assets in asset-backed and/or mortgage-backed securities. The value of these securities may depend, in part, on the issuer’s or borrower’s credit quality or ability to pay principal and interest when due and that value may fall if an issuer or borrower defaults on its obligation to pay principal or interest or if the instrument’s credit rating is downgraded by a credit rating agency. U.S. Government securities not supported as to the payment of principal or interest by the U.S. Treasury, such as those issued by Fannie Mae, Freddie Mac, and the Federal Home Loan Banks, are subject to greater credit risk than are U.S. Government securities supported by the U.S. Treasury, such as those issued by Ginnie Mae.
The fund purchased or sold debt securities on a when-issued or delayed delivery basis, or in a “To Be Announced” (TBA) or “forward commitment” transaction with delivery or payment to occur at a later date beyond the normal settlement period. At the time a fund enters into a commitment to purchase or sell a security, the transaction is recorded and the value of the security acquired is reflected in the fund’s net asset value. The price of such security and the date that the security will be delivered and paid for are fixed at the time the transaction is negotiated. The value of the security may vary with market fluctuations. TBA securities resulting from these transactions are included in the Portfolio of Investments. TBA purchase commitments are held at carrying amount, which approximates fair value and are categorized as level 2 within the fair value hierarchy. No interest accrues to the fund until payment takes place. At the time that a fund enters into this type of transaction, the fund is required to have sufficient cash and/or liquid securities to cover its commitments. Losses may arise due to changes in the value of the underlying securities or if the counterparty does not perform under the contract’s terms, or if the issuer does not issue the securities due to political, economic or other factors. Additionally, losses may arise due to declines in the value of the securities prior to settlement date.
50
Notes to Financial Statements – continued
To mitigate this risk of loss on TBA securities and other types of forward settling mortgage-backed securities, the fund whenever possible enters into a Master Securities Forward Transaction Agreement (“MSFTA”) on a bilateral basis with each of the counterparties with whom it undertakes a significant volume of transactions. The MSFTA gives each party to the agreement the right to terminate all transactions traded under such agreement if there is a certain deterioration in the credit quality of the other party. Upon an event of default or a termination of the MSFTA, the non-defaulting party has the right to close out all transactions traded under such agreement and to net amounts owed under each transaction to one net amount payable by one party to the other. This right to close out and net payments across all transactions traded under the MSFTA could result in a reduction of the fund’s credit risk to such counterparty equal to any amounts payable by the fund under the applicable transactions, if any.
For mortgage-backed securities traded under a MSFTA, the collateral and margining requirements are contract specific. Collateral amounts across all transactions traded under such agreement are netted and one amount is posted from one party to the other to collateralize such obligations. Cash that has been pledged to cover the fund’s collateral or margin obligations under a MSFTA, if any, will be reported separately on the Statement of Assets and Liabilities as restricted cash. Securities pledged as collateral or margin for the same purpose, if any, are noted in the Portfolio of Investments.
Fees Paid Indirectly – The fund’s custody fee may be reduced by a credit earned under an arrangement that measures the value of U.S. dollars deposited with the custodian by the fund. The amount of the credit, for the year ended February 28, 2017, is shown as a reduction of total expenses in the Statement of Operations.
Tax Matters and Distributions – The fund intends to qualify as a regulated investment company, as defined under Subchapter M of the Internal Revenue Code, and to distribute all of its taxable income, including realized capital gains. As a result, no provision for federal income tax is required. The fund’s federal tax returns, when filed, will remain subject to examination by the Internal Revenue Service for a three year period. Management has analyzed the fund’s tax positions taken on federal and state tax returns for all open tax years and does not believe that there are any uncertain tax positions that require recognition of a tax liability. Foreign taxes, if any, have been accrued by the fund in the accompanying financial statements in accordance with the applicable foreign tax law. Foreign income taxes may be withheld by certain countries in which the fund invests. Additionally, capital gains realized by the fund on securities issued in or by certain foreign countries may be subject to capital gains tax imposed by those countries.
Distributions to shareholders are recorded on the ex-dividend date. Income and capital gain distributions are determined in accordance with income tax regulations, which may differ from U.S. generally accepted accounting principles. Certain capital accounts in the financial statements are periodically adjusted for permanent differences in order to reflect their tax character. These adjustments have no impact on net assets or net asset value per share. Temporary differences which arise from recognizing certain items of income, expense, gain or loss in different periods for financial statement and tax purposes will reverse at some time in the future. Distributions in excess of net investment income or net realized gains are temporary overdistributions for financial
51
Notes to Financial Statements – continued
statement purposes resulting from differences in the recognition or classification of income or distributions for financial statement and tax purposes.
Book/tax differences primarily relate amortization and accretion of debt securities and wash sale loss deferrals.
The tax character of distributions declared to shareholders for the last two fiscal years is as follows:
| | | | | | | | |
| | | 2/28/17 | | | 2/29/16 | |
| Ordinary income (including any short-term capital gains) | | | $114,442,050 | | | | $103,618,206 | |
| Long-term capital gains | | | 917,313 | | | | 102,559,887 | |
| Total distributions | | | $115,359,363 | | | | $206,178,093 | |
The federal tax cost and the tax basis components of distributable earnings were as follows:
| | | | |
| As of 2/28/17 | | | |
| Cost of investments | | | $3,749,166,070 | |
| Gross appreciation | | | 204,154,149 | |
| Gross depreciation | | | (61,916,921 | ) |
| Net unrealized appreciation (depreciation) | | | $142,237,228 | |
| Undistributed ordinary income | | | 5,447,763 | |
| Capital loss carryforwards | | | (5,079,916 | ) |
| Other temporary differences | | | (10,383,238 | ) |
As of February 28, 2017, the fund had capital loss carryforwards available to offset future realized gains. These net capital losses may be carried forward indefinitely and their character is retained as short-term and/or long-term losses. Such losses are characterized as follows:
Multiple Classes of Shares of Beneficial Interest – The fund offers multiple classes of shares, which differ in their respective distribution and service fees. The fund’s income and common expenses are allocated to shareholders based on the value of settled shares outstanding of each class. The fund’s realized and unrealized gain (loss) are allocated to shareholders based on the daily net assets of each class. Dividends are declared separately for each class. Differences in per share dividend rates are generally due to differences in separate class expenses. The fund’s distributions declared to
52
Notes to Financial Statements – continued
shareholders as reported in the Statements of Changes in Net Assets are presented by class as follows:
| | | | | | | | | | | | | | | | |
| | | From net investment
income | | | From net realized gain on
investments | |
| | | Year
ended
2/28/17 | | | Year
ended
2/29/16 | | | Year
ended
2/28/17 | | | Year
ended
2/29/16 | |
| Class A | | | $52,461,798 | | | | $46,562,523 | | | | $411,975 | | | | $49,319,402 | |
| Class C | | | 27,338,665 | | | | 23,571,768 | | | | 270,190 | | | | 32,748,100 | |
| Class I | | | 33,156,646 | | | | 26,445,150 | | | | 224,907 | | | | 25,575,204 | |
| Class R1 | | | 35,699 | | | | 31,251 | | | | 399 | | | | 45,325 | |
| Class R2 | | | 124,331 | | | | 70,366 | | | | 1,074 | | | | 82,081 | |
| Class R3 | | | 600,645 | | | | 368,225 | | | | 4,579 | | | | 447,507 | |
| Class R4 | | | 210,970 | | | | 185,199 | | | | 1,532 | | | | 182,530 | |
| Class R6 (formerly Class R5) | | | 512,378 | | | | 256,556 | | | | 3,575 | | | | 286,906 | |
| Total | | | $114,441,132 | | | | $97,491,038 | | | | $918,231 | | | | $108,687,055 | |
Effective August 26, 2016, Class R5 shares were renamed Class R6 shares.
(3) Transactions with Affiliates
Investment Adviser – The fund has an investment advisory agreement with MFS to provide overall investment management and related administrative services and facilities to the fund. For the period from March 1, 2016 through June 27, 2016, the management fee was computed daily and paid monthly at an annual rate of 0.65% of the fund’s average daily net assets.
The investment adviser had agreed in writing to reduce its management fee to 0.60% of average daily net assets in excess of $1 billion up to $2.5 billion, 0.55% of average daily net assets in excess of $2.5 billion up to $5 billion, and 0.50% of average daily net assets in excess of $5 billion. This written agreement terminated on June 27, 2016. For the period from March 1, 2016 through June 27, 2016, this management fee reduction amounted to $491,704, which is included in the reduction of total expenses in the Statement of Operations.
Effective June 28, 2016, the management fee is computed daily and paid monthly at the following annual rates:
| | | | |
| First $1 billion of average daily net assets | | | 0.65 | % |
| Average daily net assets in excess of $1 billion up to $2.5 billion | | | 0.60 | % |
| Average daily net assets in excess of $2.5 billion up to $5 billion | | | 0.55 | % |
| Average daily net assets in excess of $5 billion | | | 0.50 | % |
MFS has also agreed in writing to reduce its management fee by a specified amount if certain MFS mutual fund assets exceed thresholds agreed to by MFS and the fund’s Board of Trustees. For the year ended February 28, 2017, this management fee reduction amounted to $247,975, which is included in the reduction of total expenses in the Statement of Operations. The management fee incurred for the year ended February 28, 2017 was equivalent to an annual effective rate of 0.59% of the fund’s average daily net assets.
53
Notes to Financial Statements – continued
The investment adviser has agreed in writing to pay a portion of the fund’s total annual operating expenses, excluding interest, taxes, extraordinary expenses, brokerage and transaction costs, and investment-related expenses (such as fees and expenses associated with investments in investment companies and other similar investment vehicles), such that total fund operating expenses do not exceed the following rates annually of each class’s average daily net assets:
| | | | | | | | | | | | | | | | | | | | | | | | | | | | | | |
| Class A | | | Class C | | | Class I | | | Class R1 | | | Class R2 | | | Class R3 | | | Class R4 | | | Class R6
(formerly
Class R5) | |
| | 1.10% | | | | 1.85 | % | | | 0.85 | % | | | 1.85 | % | | | 1.35 | % | | | 1.10 | % | | | 0.85 | % | | | 0.79 | % |
This written agreement will continue until modified by the fund’s Board of Trustees. but such agreement will continue at least until June 30, 2018. For the year ended February 28, 2017, the fund’s actual operating expenses did not exceed the limit and therefore, the investment adviser did not pay any portion of the fund’s expenses related to this agreement.
Distributor – MFS Fund Distributors, Inc. (MFD), a wholly-owned subsidiary of MFS, as distributor, received $368,200 for the year ended February 28, 2017, as its portion of the initial sales charge on sales of Class A shares of the fund.
The Board of Trustees has adopted a distribution plan for certain share classes pursuant to Rule 12b-1 of the Investment Company Act of 1940.
The fund’s distribution plan provides that the fund will pay MFD for services provided by MFD and financial intermediaries in connection with the distribution and servicing of certain share classes. One component of the plan is a distribution fee paid to MFD and another component of the plan is a service fee paid to MFD. MFD may subsequently pay all, or a portion, of the distribution and/or service fees to financial intermediaries.
Distribution Plan Fee Table:
| | | | | | | | | | | | | | | | | | | | |
| | | Distribution
Fee Rate (d) | | | Service
Fee Rate (d) | | | Total
Distribution
Plan (d) | | | Annual
Effective
Rate (e) | | | Distribution
and Service
Fee | |
| Class A | | | — | | | | 0.25% | | | | 0.25% | | | | 0.25% | | | | $3,830,515 | |
| Class C | | | 0.75% | | | | 0.25% | | | | 1.00% | | | | 1.00% | | | | 10,220,577 | |
| Class R1 | | | 0.75% | | | | 0.25% | | | | 1.00% | | | | 1.00% | | | | 13,214 | |
| Class R2 | | | 0.25% | | | | 0.25% | | | | 0.50% | | | | 0.50% | | | | 19,618 | |
| Class R3 | | | — | | | | 0.25% | | | | 0.25% | | | | 0.25% | | | | 43,943 | |
| Total Distribution and Service Fees | | | | | | | | | | | | $14,127,867 | |
| (d) | In accordance with the distribution plan for certain classes, the fund pays distribution and/or service fees equal to these annual percentage rates of each class’s average daily net assets. The distribution and service fee rates disclosed by class represent the current rates in effect at the end of the reporting period. Any rate changes, if applicable, are detailed below. |
| (e) | The annual effective rates represent actual fees incurred under the distribution plan for the year ended February 28, 2017 based on each class’s average daily net assets. MFD has voluntarily agreed to rebate a portion of each class’s 0.25% service fee attributable to accounts for which MFD retains the 0.25% service fee except for accounts attributable to MFS or its affiliates’ seed money. For the year ended February 28, 2017, this rebate amounted to $4,934 and $319 for Class A and Class C, respectively, and is included in the reduction of total expenses in the Statement of Operations. |
54
Notes to Financial Statements – continued
Certain Class A shares are subject to a contingent deferred sales charge (CDSC) in the event of a shareholder redemption within 18 months of purchase. Class C shares are subject to a CDSC in the event of a shareholder redemption within 12 months of purchase. Class B shares are subject to a CDSC in the event of a shareholder redemption within six years of purchase. All contingent deferred sales charges are paid to MFD and during the year ended February 28, 2017, were as follows:
| | | | |
| | | Amount | |
| Class A | | | $42,899 | |
| Class C | | | 132,165 | |
Shareholder Servicing Agent – MFS Service Center, Inc. (MFSC), a wholly-owned subsidiary of MFS, receives a fee from the fund for its services as shareholder servicing agent calculated as a percentage of the average daily net assets of the fund as determined periodically under the supervision of the fund’s Board of Trustees. For the year ended February 28, 2017, the fee was $224,510, which equated to 0.0064% annually of the fund’s average daily net assets. MFSC also receives payment from the fund for out-of-pocket expenses, sub-accounting and other shareholder servicing costs which may be paid to affiliated and unaffiliated service providers. Class R6 shares do not incur sub-accounting fees. For the year ended February 28, 2017, these out-of-pocket expenses, sub-accounting and other shareholder servicing costs amounted to $3,497,576.
Administrator – MFS provides certain financial, legal, shareholder communications, compliance, and other administrative services to the fund. Under an administrative services agreement, the fund reimburses MFS the costs incurred to provide these services. The fund is charged an annual fixed amount of $17,500 plus a fee based on average daily net assets. The administrative services fee incurred for the year ended February 28, 2017 was equivalent to an annual effective rate of 0.0157% of the fund’s average daily net assets.
Trustees’ and Officers’ Compensation – The fund pays compensation to independent Trustees in the form of a retainer, attendance fees, and additional compensation to Board and Committee chairpersons. The fund does not pay compensation directly to Trustees or officers of the fund who are also officers of the investment adviser, all of whom receive remuneration for their services to the fund from MFS. Certain officers and Trustees of the fund are officers or directors of MFS, MFD, and MFSC.
Other – This fund and certain other funds managed by MFS (the funds) have entered into a service agreement (the ISO Agreement) which provides for payment of fees solely by the funds to Tarantino LLC in return for the provision of services of an Independent Senior Officer (ISO) for the funds. Frank L. Tarantino serves as the ISO and is an officer of the funds and the sole member of Tarantino LLC. The funds can terminate the ISO Agreement with Tarantino LLC at any time under the terms of the ISO Agreement. For the year ended February 28, 2017, the fee paid by the fund under this agreement was $6,672 and is included in “Miscellaneous” expense in the Statement of Operations. MFS has agreed to bear all expenses associated with office space, other administrative support, and supplies provided to the ISO.
55
Notes to Financial Statements – continued
The fund invests in the MFS Institutional Money Market Portfolio which is managed by MFS and seeks current income consistent with preservation of capital and liquidity. This money market fund does not pay a management fee to MFS.
The fund invests in the High Yield Pooled Portfolio, which is a mutual fund advised by MFS that does not pay management fees to MFS but does incur investment and operating costs. The fund invests in the High Yield Pooled Portfolio to gain exposure to high income debt instruments, rather than investing in high income debt instruments directly. The High Yield Pooled Portfolio does not pay a management fee to MFS or distribution and/or service fee to MFD.
On March 16, 2016, MFS redeemed 117,729 shares of Class I for an aggregate amount of $1,365,651.
The fund is permitted to engage in purchase and sale transactions (“cross-trades”) with funds and accounts for which MFS serves as investment adviser or sub-adviser pursuant to a policy adopted by the Board of Trustees. This policy has been designed to ensure that cross-trades conducted by the fund comply with Rule 17a-7 under the Investment Company Act of 1940. Under this policy, cross-trades are effected at current market prices with no remuneration paid in connection with the transaction. During the year ended February 28, 2017, the fund engaged in purchase and sale transactions pursuant to this policy, which amounted to $12,843,300 and $1,458,939, respectively. The sales transactions resulted in net realized gains (losses) of $49,492.
(4) Portfolio Securities
For the year ended February 28, 2017, purchases and sales of investments, other than purchased option transactions and short-term obligations, were as follows:
| | | | | | | | |
| | | Purchases | | | Sales | |
| U.S. Government securities | | | $732,277,333 | | | | $417,485,982 | |
| Investments (non-U.S. Government securities) | | | $1,233,498,804 | | | | $1,139,335,732 | |
(5) Shares of Beneficial Interest
The fund’s Declaration of Trust permits the Trustees to issue an unlimited number of full and fractional shares of beneficial interest. Transactions in fund shares were as follows:
| | | | | | | | | | | | | | | | |
| | | Year ended
2/28/17 | | | Year ended
2/29/16 | |
| | | Shares | | | Amount | | | Shares | | | Amount | |
| Shares sold | | | | | | | | | | | | | | | | |
Class A | | | 41,350,523 | | | | $496,539,781 | | | | 40,389,688 | | | | $491,549,369 | |
Class C | | | 20,261,667 | | | | 243,583,864 | | | | 25,246,673 | | | | 307,653,165 | |
Class I | | | 79,362,295 | | | | 958,782,670 | | | | 26,865,624 | | | | 326,705,363 | |
Class R1 | | | 21,357 | | | | 250,824 | | | | 65,393 | | | | 797,299 | |
Class R2 | | | 129,398 | | | | 1,547,887 | | | | 154,820 | | | | 1,815,682 | |
Class R3 | | | 455,616 | | | | 5,447,509 | | | | 906,031 | | | | 10,755,213 | |
Class R4 | | | 182,758 | | | | 2,198,683 | | | | 154,200 | | | | 1,876,658 | |
Class R6 (formerly Class R5) | | | 557,181 | | | | 6,708,893 | | | | 991,517 | | | | 11,726,396 | |
| | | 142,320,795 | | | | $1,715,060,111 | | | | 94,773,946 | | | | $1,152,879,145 | |
56
Notes to Financial Statements – continued
| | | | | | | | | | | | | | | | |
| | | Year ended
2/28/17 | | | Year ended
2/29/16 | |
| | | Shares | | | Amount | | | Shares | | | Amount | |
| Shares issued to shareholders in reinvestment of distributions | | | | | | | | | | | | | | | | |
Class A | | | 4,249,168 | | | | $51,151,692 | | | | 7,890,934 | | | | $93,065,125 | |
Class C | | | 1,914,222 | | | | 23,033,487 | | | | 3,959,870 | | | | 46,553,158 | |
Class I | | | 2,202,332 | | | | 26,546,711 | | | | 3,359,205 | | | | 39,693,818 | |
Class R1 | | | 2,967 | | | | 35,647 | | | | 6,504 | | | | 76,208 | |
Class R2 | | | 9,310 | | | | 112,046 | | | | 12,738 | | | | 149,550 | |
Class R3 | | | 50,161 | | | | 604,178 | | | | 69,884 | | | | 815,638 | |
Class R4 | | | 17,640 | | | | 212,496 | | | | 31,088 | | | | 367,043 | |
Class R6 (formerly Class R5) | | | 12,577 | | | | 151,528 | | | | 14,965 | | | | 177,542 | |
| | | 8,458,377 | | | | $101,847,785 | | | | 15,345,188 | | | | $180,898,082 | |
| | | | |
| Shares reacquired | | | | | | | | | | | | | | | | |
Class A | | | (63,554,253 | ) | | | $(767,824,667 | ) | | | (27,822,763 | ) | | | $(331,597,494 | ) |
Class C | | | (20,665,375 | ) | | | (247,829,597 | ) | | | (13,165,736 | ) | | | (156,538,137 | ) |
Class I | | | (26,493,533 | ) | | | (317,775,430 | ) | | | (25,283,969 | ) | | | (300,066,122 | ) |
Class R1 | | | (61,001 | ) | | | (737,857 | ) | | | (31,150 | ) | | | (359,703 | ) |
Class R2 | | | (74,466 | ) | | | (895,224 | ) | | | (54,206 | ) | | | (650,367 | ) |
Class R3 | | | (308,056 | ) | | | (3,678,785 | ) | | | (233,954 | ) | | | (2,811,055 | ) |
Class R4 | | | (158,202 | ) | | | (1,895,968 | ) | | | (112,994 | ) | | | (1,345,647 | ) |
Class R6 (formerly Class R5) | | | (332,117 | ) | | | (3,988,576 | ) | | | (222,051 | ) | | | (2,626,115 | ) |
| | | (111,647,003 | ) | | | $(1,344,626,104 | ) | | | (66,926,823 | ) | | | $(795,994,640 | ) |
| | | | |
| Net change | | | | | | | | | | | | | | | | |
Class A | | | (17,954,562 | ) | | | $(220,133,194 | ) | | | 20,457,859 | | | | $253,017,000 | |
Class C | | | 1,510,514 | | | | 18,787,754 | | | | 16,040,807 | | | | 197,668,186 | |
Class I | | | 55,071,094 | | | | 667,553,951 | | | | 4,940,860 | | | | 66,333,059 | |
Class R1 | | | (36,677 | ) | | | (451,386 | ) | | | 40,747 | | | | 513,804 | |
Class R2 | | | 64,242 | | | | 764,709 | | | | 113,352 | | | | 1,314,865 | |
Class R3 | | | 197,721 | | | | 2,372,902 | | | | 741,961 | | | | 8,759,796 | |
Class R4 | | | 42,196 | | | | 515,211 | | | | 72,294 | | | | 898,054 | |
Class R6 (formerly Class R5) | | | 237,641 | | | | 2,871,845 | | | | 784,431 | | | | 9,277,823 | |
| | | 39,132,169 | | | | $472,281,792 | | | | 43,192,311 | | | | $537,782,587 | |
Effective August 26, 2016, Class R5 shares were renamed Class R6 shares.
(6) Line of Credit
The fund and certain other funds managed by MFS participate in a $1.25 billion unsecured committed line of credit, subject to a $1 billion sublimit, provided by a syndication of banks under a credit agreement. Borrowings may be made for temporary financing needs. Interest is charged to each fund, based on its borrowings, generally at a rate equal to the higher of the Overnight Federal Reserve funds rate or daily one month LIBOR plus an agreed upon spread. A commitment fee, based on the average daily, unused portion of the committed line of credit, is allocated among the participating funds at the end of each calendar quarter. In addition, the fund and other funds managed by MFS have established unsecured uncommitted borrowing arrangements with certain banks for temporary financing needs. Interest is charged to
57
Notes to Financial Statements – continued
each fund, based on its borrowings, at a rate equal to the Overnight Federal Reserve funds rate plus an agreed upon spread. For the year ended February 28, 2017, the fund’s commitment fee and interest expense were $20,484 and $0, respectively, and are included in “Miscellaneous” expense in the Statement of Operations.
(7) Transactions in Underlying Affiliated Funds-Affiliated Issuers
An affiliated issuer may be considered one in which the fund owns 5% or more of the outstanding voting securities, or a company which is under common control. For the purposes of this report, the fund assumes the following to be affiliated issuers:
| | | | | | | | | | | | | | | | |
| Underlying Affiliated Funds | | Beginning
Shares/Par
Amount | | | Acquisitions
Shares/Par
Amount | | | Dispositions
Shares/Par
Amount | | | Ending
Shares/Par
Amount | |
| MFS High Yield Pooled Portfolio | | | 114,536,783 | | | | 20,802,441 | | | | (24,684,423 | ) | | | 110,654,801 | |
| MFS Institutional Money Market Portfolio | | | 88,669,227 | | | | 879,041,762 | | | | (866,105,425 | ) | | | 101,605,564 | |
| | | | |
| Underlying Affiliated Funds | | Realized
Gain (Loss) | | | Capital Gain
Distributions | | | Dividend
Income | | | Ending Value | |
| MFS High Yield Pooled Portfolio | | | $(20,959,377 | ) | | | $— | | | | $66,271,260 | | | | $1,037,942,036 | |
| MFS Institutional Money Market Portfolio | | | 1,511 | | | | — | | | | 407,377 | | | | 101,605,564 | |
| | | | | | | | | | | | | | | | |
| | | $(20,957,866 | ) | | | $— | | | | $66,678,637 | | | | $1,139,547,600 | |
| | | | | | | | | | | | | | | | |
(8) Legal Proceedings
In May 2015, the Motors Liquidation Company Avoidance Action Trust (hereafter, “AAT”) served upon the fund a complaint in an adversary proceeding in the U.S. Bankruptcy Court for the Southern District of New York, captioned Motors Liquidation Company Avoidance Action Trust v. JPMorgan Chase Bank, N.A., et al. (No. 09-00504 (REG)). The complaint, which was originally filed in 2009 but not served on the fund until 2015, names as defendants over 500 entities (including the fund) that held an interest in a $1.5 billion General Motors (GM) term loan in 2009, when GM filed for bankruptcy. The AAT alleges that the fund and the other term loan lenders were improperly treated as secured lenders with respect to the term loan shortly before and immediately after GM’s bankruptcy, receiving full principal and interest payments under the loan. The AAT alleges that the fund and other term loan lenders should have been treated as unsecured (or partially unsecured) creditors because the main lien securing the collateral was allegedly not perfected at the time of GM’s bankruptcy due to an erroneous filing in October 2008 that terminated the financing statement perfecting the lien. The AAT seeks to claw back payments made to the fund and the other term loan lenders after, and during the 90 days before, GM’s June 2009 bankruptcy petition. During that time period, the fund received term loan payments of approximately $380,000. The fund cannot predict the outcome of this proceeding. Among other things, it is unclear whether the AAT’s claims will succeed; what the fund would be entitled to as an unsecured (or partially unsecured) creditor, given the existence of other collateral not impacted by the erroneous October 2008 filing; whether third parties responsible for the erroneous October 2008 filing would bear some or all of any liability; and the degree to which the fund may be entitled to indemnification from a third party for any amount required to be disgorged. The fund has and will continue to incur legal expenses associated with the defense of this action and in related claims against third parties.
58
REPORT OF INDEPENDENT REGISTERED PUBLIC ACCOUNTING FIRM
To the Board of Trustees of MFS Series Trust XIII and Shareholders of MFS Diversified Income Fund:
We have audited the accompanying statement of assets and liabilities, including the portfolio of investments, of MFS Diversified Income Fund (the Fund) (one of the series constituting the MFS Series Trust XIII) as of February 28, 2017, and the related statement of operations for the year then ended, the statements of changes in net assets for each of the two years in the period then ended and the financial highlights for each of the periods indicated therein. These financial statements and financial highlights are the responsibility of the Fund’s management. Our responsibility is to express an opinion on these financial statements and financial highlights based on our audits.
We conducted our audits in accordance with the standards of the Public Company Accounting Oversight Board (United States). Those standards require that we plan and perform the audit to obtain reasonable assurance about whether the financial statements and financial highlights are free of material misstatement. We were not engaged to perform an audit of the Fund’s internal control over financial reporting. Our audits included consideration of internal control over financial reporting as a basis for designing audit procedures that are appropriate in the circumstances, but not for the purpose of expressing an opinion on the effectiveness of the Fund’s internal control over financial reporting. Accordingly, we express no such opinion. An audit also includes examining, on a test basis, evidence supporting the amounts and disclosures in the financial statements and financial highlights, assessing the accounting principles used and significant estimates made by management, and evaluating the overall financial statement presentation. Our procedures included confirmation of securities owned as of February 28, 2017, by correspondence with the custodian and others or by other appropriate auditing procedures where replies from others were not received. We believe that our audits provide a reasonable basis for our opinion.
In our opinion, the financial statements and financial highlights referred to above present fairly, in all material respects, the financial position of MFS Diversified Income Fund (one of the series constituting the MFS Series Trust XIII) at February 28, 2017, the results of its operations for the year then ended, the changes in its net assets for each of the two years in the period then ended and the financial highlights for each of the periods indicated therein, in conformity with U.S. generally accepted accounting principles.

Boston, Massachusetts
April 13, 2017
59
TRUSTEES AND OFFICERS — IDENTIFICATION AND BACKGROUND
The Trustees and Officers of the Trust, as of April 1, 2017, are listed below, together with their principal occupations during the past five years. (Their titles may have varied during that period.) The address of each Trustee and Officer is 111 Huntington Avenue, Boston, Massachusetts 02199-7618.
| | | | | | | | |
Name, Age | | Position(s) Held with Fund | | Trustee/Officer
Since (h) | | Principal
Occupations During the Past Five Years | | Other Directorships (j) |
| INTERESTED TRUSTEES |
Robert J. Manning (k) (age 53) | | Trustee | | February 2004 | | Massachusetts Financial Services Company, Executive Chairman (since January 2017); Director and Chairman of the Board; Chief Executive Officer (until 2015); Co-Chief Executive Officer (2015-2016) | | N/A |
Robin A. Stelmach (k) (age 55) | | Trustee | | January 2014 | | Massachusetts Financial Services Company, Vice Chair (since January 2017); Chief Operating Officer and Executive Vice President (until January 2017) | | N/A |
| INDEPENDENT TRUSTEES | | | | | | |
David H. Gunning
(age 74) | | Trustee and Chair of Trustees | | January 2004 | | Private investor | | Lincoln Electric Holdings, Inc., Director; Development Alternatives, Inc., Director/Non-Executive Chairman |
60
Trustees and Officers – continued
| | | | | | | | |
Name, Age | | Position(s) Held with Fund | | Trustee/Officer
Since (h) | | Principal
Occupations During the Past Five Years | | Other Directorships (j) |
Steven E. Buller
(age 65) | | Trustee | | February 2014 | | Chairman, Financial Accounting Standards Advisory Council (until 2015); Standing Advisory Group, Public Company Accounting Oversight Board, Member (until 2014); BlackRock, Inc. (investment management), Managing Director (until 2014), BlackRock Finco UK (investment management), Director (until 2014) | | N/A |
John A. Caroselli
(age 63) | | Trustee | | March 2017 | | JC Global Advisors, LLC, President; First Capital Corporation, Executive Vice President (until 2015) | | N/A |
Maureen R. Goldfarb
(age 61) | | Trustee | | January 2009 | | Private investor | | N/A |
Michael Hegarty
(age 72) | | Trustee | | December 2004 | | Private investor | | Rouse Properties Inc., Director; Capmark Financial Group Inc., Director (until 2015) |
John P. Kavanaugh
(age 62) | | Trustee and Vice Chair of Trustees | | January 2009 | | Private investor | | N/A |
Clarence Otis, Jr.
(age 61) | | Trustee | | March 2017 | | Darden Restaurants, Inc., Chief Executive Officer (until 2014) | | VF Corporation, Director; Verizon Communications, Inc., Director; Federal Reserve Bank of Atlanta, Director (until 2015) |
Maryanne L. Roepke
(age 61) | | Trustee | | May 2014 | | American Century Investments (investment management), Senior Vice President and Chief Compliance Officer (until 2014) | | N/A |
61
Trustees and Officers – continued
| | | | | | | | |
Name, Age | | Position(s) Held with Fund | | Trustee/Officer
Since (h) | | Principal
Occupations During the Past Five Years | | Other Directorships (j) |
Laurie J. Thomsen
(age 59) | | Trustee | | March 2005 | | Private investor | | The Travelers Companies, Director; Dycom Industries, Inc., Director |
| OFFICERS | | | | | | |
Christopher R. Bohane (k)
(age 43) | | Assistant Secretary and Assistant Clerk | | July 2005 | | Massachusetts Financial Services Company, Vice President and Assistant General Counsel | | N/A |
Kino Clark (k)
(age 48) | | Assistant Treasurer | | January 2012 | | Massachusetts Financial Services Company, Vice President | | N/A |
Thomas H. Connors (k)
(age 57) | | Assistant Secretary and Assistant Clerk | | September 2012 | | Massachusetts Financial Services Company, Vice President and Senior Counsel; Deutsche Investment Management Americas Inc. (financial service provider), Director and Senior Counsel (until 2012) | | N/A |
Ethan D. Corey (k)
(age 53) | | Assistant Secretary and Assistant Clerk | | July 2005 | | Massachusetts Financial Services Company, Senior Vice President and Associate General Counsel | | N/A |
David L. DiLorenzo (k)
(age 48) | | President | | July 2005 | | Massachusetts Financial Services Company, Senior Vice President | | N/A |
Brian E. Langenfeld (k)
(age 44) | | Assistant Secretary and Assistant Clerk | | June 2006 | | Massachusetts Financial Services Company, Vice President and Senior Counsel | | N/A |
Susan A. Pereira (k)
(age 46) | | Assistant Secretary and Assistant Clerk | | July 2005 | | Massachusetts Financial Services Company, Vice President and Senior Counsel | | N/A |
62
Trustees and Officers – continued
| | | | | | | | |
Name, Age | | Position(s) Held with Fund | | Trustee/Officer
Since (h) | | Principal
Occupations During the Past Five Years | | Other Directorships (j) |
Kasey L. Phillips (k)
(age 46) | | Assistant Treasurer | | September 2012 | | Massachusetts Financial Services Company, Vice President; Wells Fargo Funds Management, LLC, Senior Vice President, Fund Treasurer (until 2012) | | N/A |
Mark N. Polebaum (k)
(age 64) | | Secretary and Clerk | | January 2006 | | Massachusetts Financial Services Company, Executive Vice President; General Counsel and Secretary (until March 2017) | | N/A |
Matthew A. Stowe (k)
(age 42) | | Assistant Secretary and Assistant Clerk | | October 2014 | | Massachusetts Financial Services Company, Vice President and Assistant General Counsel | | N/A |
Frank L. Tarantino
(age 73) | | Independent Senior Officer | | June 2004 | | Tarantino LLC (provider of compliance services), Principal | | N/A |
Richard S. Weitzel (k)
(age 46) | | Assistant Secretary and Assistant Clerk | | October 2007 | | Massachusetts Financial Services Company, Senior Vice President and Associate General Counsel | | N/A |
Martin J. Wolin (k)
(age 49) | | Chief Compliance Officer | | July 2015 | | Massachusetts Financial Services Company, Senior Vice President and Chief Compliance Officer (since July 2015); Mercer (financial service provider), Chief Risk and Compliance Officer, North America and Latin America (until June 2015) | | N/A |
James O. Yost (k)
(age 56) | | Treasurer | | September 1990 | | Massachusetts Financial Services Company, Senior Vice President | | N/A |
63
Trustees and Officers – continued
| (h) | Date first appointed to serve as Trustee/officer of an MFS Fund. Each Trustee has served continuously since appointment unless indicated otherwise. For the period from December 15, 2004 until February 22, 2005, Mr. Manning served as Advisory Trustee. Prior to January 2012, Messrs. DiLorenzo and Yost served as Assistant Treasurers of the Funds. From January 2012 through December 2016, Messrs. DiLorenzo and Yost served as Treasurer and Deputy Treasurer of the Funds, respectively. |
| (j) | Directorships or trusteeships of companies required to report to the Securities and Exchange Commission (i.e., “public companies”). |
| (k) | “Interested person” of the Trust within the meaning of the Investment Company Act of 1940 (referred to as the 1940 Act), which is the principal federal law governing investment companies like the fund, as a result of a position with MFS. The address of MFS is 111 Huntington Avenue, Boston, Massachusetts 02199-7618. |
Each Trustee has been elected by shareholders and each Trustee and officer holds office until his or her successor is chosen and qualified or until his or her earlier death, resignation, retirement or removal. The Trust does not hold annual meetings for the purpose of electing Trustees, and Trustees are not elected for fixed terms. Messrs. Buller, Kavanaugh and Otis and Ms. Roepke are members of the Trust’s Audit Committee.
Each of the Fund’s Trustees and officers holds comparable positions with certain other funds of which MFS or a subsidiary is the investment adviser or distributor, and, in the case of the officers, with certain affiliates of MFS. As of April 1, 2017, except for Messrs. Caroselli and Otis, the Trustees served as board members of 136 funds within the MFS Family of Funds. As of April 1, 2017, Messrs. Caroselli and Otis served as board members of 125 funds within the MFS Family of Funds.
The Statement of Additional Information for a Fund includes further information about the Trustees and is available without charge upon request by calling 1-800-225-2606.
| | |
| Investment Adviser | | Custodian |
Massachusetts Financial Services Company
111 Huntington Avenue
Boston, MA 02199-7618 | | JPMorgan Chase Bank, NA 4 Metrotech Center New York, NY 11245 |
| Distributor | | Independent Registered Public Accounting Firm |
MFS Fund Distributors, Inc.
111 Huntington Avenue
Boston, MA 02199-7618 | | Ernst & Young LLP 200 Clarendon Street Boston, MA 02116 |
| Portfolio Managers | | |
William Adams Ward Brown David Cole Rick Gable Matt Ryan Jonathan Sage Geoffrey Schechter Jim Swanson | | |
64
PROXY VOTING POLICIES AND INFORMATION
MFS votes proxies on behalf of the fund pursuant to proxy voting policies and procedures that are available without charge, upon request, by calling 1-800-225-2606, by visiting mfs.com (once you have selected “Individual Investor” as your role, click on “Individual Investor Home” in the top navigation and then select “Learn More About Proxy Voting” under the “I want to…” header on the left hand column of the page), or by visiting the SEC’s Web site at http://www.sec.gov.
Information regarding how the fund voted proxies relating to portfolio securities during the most recent twelve-month period ended June 30 is available by August 31 of each year without charge by visiting mfs.com (once you have selected “Individual Investor” as your role, click on “Individual Investor Home” in the top navigation and then select “Learn More About Proxy Voting” under the “I want to…” header on the left hand column of the page), or by visiting the SEC’s Web site at http://www.sec.gov.
QUARTERLY PORTFOLIO DISCLOSURE
The fund will file a complete schedule of portfolio holdings with the Securities and Exchange Commission (the Commission) for the first and third quarters of each fiscal year on Form N-Q. A shareholder can obtain the quarterly portfolio holdings report at mfs.com. The fund’s Form N-Q is also available on the EDGAR database on the Commission’s Internet Web site at http://www.sec.gov, and may be reviewed and copied at the:
Public Reference Room
Securities and Exchange Commission
100 F Street, NE, Room 1580
Washington, D.C. 20549
Information on the operation of the Public Reference Room may be obtained by calling the Commission at 1-800-SEC-0330. Copies of the fund’s Form N-Q also may be obtained, upon payment of a duplicating fee, by electronic request at the following e-mail address: publicinfo@sec.gov or by writing the Public Reference Section at the above address.
FURTHER INFORMATION
From time to time, MFS may post important information about the fund or the MFS funds on the MFS web site (mfs.com). This information is available on mfs.com by following these steps once you have selected “Individual Investor” as your role: (1) Click on the “Individual Investor Home” in the top navigation and then select the “Announcements” option within the “Market Outlooks” drop down, or (2) Click on “Products & Services” and “Mutual Funds” and then choose the fund’s name in the “Select a fund” menu.
65
INFORMATION ABOUT FUND CONTRACTS AND LEGAL CLAIMS
The fund has entered into contractual arrangements with an investment adviser, administrator, distributor, shareholder servicing agent, 529 program manager (if applicable), and custodian who each provide services to the fund. Unless expressly stated otherwise, shareholders are not parties to, or intended beneficiaries of these contractual arrangements, and these contractual arrangements are not intended to create any shareholder right to enforce them against the service providers or to seek any remedy under them against the service providers, either directly or on behalf of the fund.
Under the Trust’s By-Laws and Declaration of Trust, any claims asserted against or on behalf of the MFS Funds, including claims against Trustees and Officers, must be brought in state and federal courts located within the Commonwealth of Massachusetts.
FEDERAL TAX INFORMATION (unaudited)
The fund will notify shareholders of amounts for use in preparing 2017 income tax forms in January 2018. The following information is provided pursuant to provisions of the Internal Revenue Code.
The fund designates the maximum amount allowable as qualified dividend income eligible to be taxed at the same rate as long-term capital gain.
The fund designates $1,010,000 as capital gain dividends paid during the fiscal year.
For corporate shareholders, 6.90% of the ordinary income dividends paid during the fiscal year qualify for the corporate dividends received deduction.
66
rev. 3/16
| | | | |
| | | |
FACTS | | WHAT DOES MFS DO WITH YOUR PERSONAL INFORMATION? | |  |
| | |
| Why? | | Financial companies choose how they share your personal information. Federal law gives consumers the right to limit some but not all sharing. Federal law also requires us to tell you how we collect, share, and protect your personal information. Please read this notice carefully to understand what we do. |
| | |
| What? | | The types of personal information we collect and share depend on the product or service you have with us. This information can include: • Social Security number and account balances • Account transactions and transaction history • Checking account information and wire transfer instructions When you are no longer our customer, we continue to share your information as described in this notice. |
| | |
| How? | | All financial companies need to share customers’ personal information to run their everyday business. In the section below, we list the reasons financial companies can share their customers’ personal information; the reasons MFS chooses to share; and whether you can limit this sharing. |
| | | | |
Reasons we can share your
personal information | | Does MFS
share? | | Can you limit
this sharing? |
For our everyday business purposes – such as to process your transactions, maintain your account(s), respond to court orders and legal investigations, or report to credit bureaus | | Yes | | No |
For our marketing purposes – to offer our products and services to you | | No | | We don’t share |
For joint marketing with other financial companies | | No | | We don’t share |
For our affiliates’ everyday business purposes – information about your transactions and experiences | | No | | We don’t share |
For our affiliates’ everyday business purposes – information about your creditworthiness | | No | | We don’t share |
| For nonaffiliates to market to you | | No | | We don’t share |
| | |
| Questions? | | Call 800-225-2606 or go to mfs.com. |
67
| | |
| Who we are |
| Who is providing this notice? | | MFS Funds, MFS Investment Management, MFS Institutional Advisors, Inc., and MFS Heritage Trust Company. |
| | |
| What we do |
| How does MFS protect my personal information? | | To protect your personal information from unauthorized access and use, we use security measures that comply with federal law. These measures include procedural, electronic, and physical safeguards for the protection of the personal information we collect about you. |
| How does MFS collect my personal information? | | We collect your personal information, for example, when you • open an account or provide account information • direct us to buy securities or direct us to sell your securities • make a wire transfer We also collect your personal information from others, such as credit bureaus, affiliates, or other companies. |
| Why can’t I limit all sharing? | | Federal law gives you the right to limit only • sharing for affiliates’ everyday business purposes – information about your creditworthiness • affiliates from using your information to market to you • sharing for nonaffiliates to market to you State laws and individual companies may give you additional rights to limit sharing. |
| | |
| Definitions |
| Affiliates | | Companies related by common ownership or control. They can be financial and nonfinancial companies. • MFS does not share personal information with affiliates, except for everyday business purposes as described on page one of this notice. |
| Nonaffiliates | | Companies not related by common ownership or control. They can be financial and nonfinancial companies. • MFS does not share with nonaffiliates so they can market to you. |
| Joint marketing | | A formal agreement between nonaffiliated financial companies that together market financial products or services to you. • MFS doesn’t jointly market. |
| | |
| Other important information |
| If you own an MFS product or receive an MFS service in the name of a third party such as a bank or broker-dealer, their privacy policy may apply to you instead of ours. |
68
Save paper with eDelivery.

| MFS® will send you prospectuses, |
reports, and proxies directly via e-mail so you will get information faster with less mailbox clutter.
To sign up:
1. Go to mfs.com.
2. Log in via MFS® Access.
3. Select eDelivery.
If you own your MFS fund shares through a financial institution or a retirement plan, MFS® TALK, MFS® Access, or eDelivery may not be available to you.
CONTACT
WEB SITE
mfs.com
MFS TALK
1-800-637-8255
24 hours a day
ACCOUNT SERVICE AND LITERATURE
Shareholders
1-800-225-2606
Financial advisors
1-800-343-2829
Retirement plan services
1-800-637-1255
MAILING ADDRESS
MFS Service Center, Inc.
P.O. Box 55824
Boston, MA 02205-5824
OVERNIGHT MAIL
MFS Service Center, Inc.
c/o Boston Financial Data Services
30 Dan Road
Canton, MA 02021-2809
ANNUAL REPORT
February 28, 2017

MFS® GOVERNMENT SECURITIES FUND

MFG-ANN
MFS® GOVERNMENT SECURITIES FUND
CONTENTS
The report is prepared for the general information of shareholders.
It is authorized for distribution to prospective investors only when preceded or accompanied by a current prospectus.
NOT FDIC INSURED • MAY LOSE VALUE • NO BANK GUARANTEE

LETTER FROM THE EXECUTIVE CHAIRMAN
Dear Shareholders:
Despite June’s unexpected vote by the United Kingdom to leave the European Union and the surprising result in November’s U.S. presidential election, most markets have
proved resilient. U.S. share prices quickly reversed post-Brexit declines, and indices reached new highs following the November elections. U.S. bond yields rose after Donald Trump’s victory on hopes that his proposed policy mix of lower taxes, increased spending on infrastructure and a lower regulatory burden on businesses will lift both U.S. economic growth and inflation. However, interest rates in most developed markets remain very low, with major central banks maintaining extremely accommodative monetary policies to reinvigorate slow-growing economies against a backdrop of still-low inflation. Even after the rise in yields following the election, interest rates remain low by historical standards.
Globally, economic growth has shown signs of recovery of late, led by the United States and the eurozone. Despite better growth, there are few immediate signs of worrisome inflation. Emerging market economies are recovering at a somewhat slower pace amid fears that restrictive U.S. trade policies could further hamper the already slow pace of global trade growth. Looking ahead, markets will have to contend with a series of European elections during 2017, which, depending on the outcome, could further call into question the future direction of the European Union.
At MFS®, we believe in a patient, long-term approach to investing. Viewing investments with a long lens makes it possible to filter out short-term market noise and focus on achieving solid risk-adjusted returns over a full market cycle.
In our view, such an approach, along with the professional guidance of a financial advisor, will help you reach your investment objectives.
Respectfully,

Robert J. Manning
Executive Chairman
MFS Investment Management
April 13, 2017
The opinions expressed in this letter are subject to change and may not be relied upon for investment advice. No forecasts can be guaranteed.
1
PORTFOLIO COMPOSITION
Portfolio structure (i)
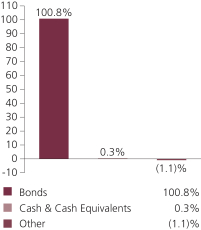
| | | | |
| Fixed income sectors (i) | | | | |
| Mortgage-Backed Securities | | | 51.4% | |
| U.S. Treasury Securities | | | 36.7% | |
| U.S. Government Agencies | | | 6.9% | |
| Commercial Mortgage-Backed Securities | | | 3.0% | |
| Investment Grade Corporates | | | 1.7% | |
| Collateralized Debt Obligations | | | 0.6% | |
| Asset-Backed Securities | | | 0.2% | |
| Emerging Markets Bonds | | | 0.2% | |
| Non-U.S. Government Bonds | | | 0.1% | |
| | | | |
Composition including fixed
income credit quality (a)(i) | |
| AAA | | | 3.0% | |
| AA | | | 0.7% | |
| A | | | 0.6% | |
| BBB | | | 1.0% | |
| BB | | | 0.2% | |
| B | | | 0.3% | |
| U.S. Government | | | 35.5% | |
| Federal Agencies | | | 58.3% | |
| Not Rated | | | 1.2% | |
| Cash & Cash Equivalents | | | 0.3% | |
| Other | | | (1.1)% | |
| |
| Portfolio facts (i) | | | | |
| Average Duration (d) | | | 5.4 | |
| Average Effective Maturity (m) | | | 7.1 yrs. | |
| (a) | For all securities other than those specifically described below, ratings are assigned to underlying securities utilizing ratings from Moody’s, Fitch, and Standard & Poor’s rating agencies and applying the following hierarchy: If all three agencies provide a rating, the middle rating (after dropping the highest and lowest ratings) is assigned; if two of the three agencies rate a security, the lower of the two is assigned. Ratings are shown in the S&P and Fitch scale (e.g., AAA). Securities rated BBB or higher are considered investment grade. All ratings are subject to change. U.S. Government includes securities issued by the U.S. Department of the Treasury. Federal Agencies includes rated and unrated U.S. Agency fixed-income securities, U.S. Agency mortgage-backed securities, and collateralized mortgage obligations of U.S. Agency mortgage-backed securities. Not Rated includes fixed income securities, including fixed income futures contracts, which have not been rated by any rating agency. The fund may or may not have held all of these instruments on this date. The fund is not rated by these agencies. |
2
Portfolio Composition – continued
| (d) | Duration is a measure of how much a bond’s price is likely to fluctuate with general changes in interest rates, e.g., if rates rise 1.00%, a bond with a 5-year duration is likely to lose about 5.00% of its value due to the interest rate move. |
| (i) | For purposes of this presentation, the components include the value of securities, and reflect the impact of the equivalent exposure of derivative positions, if any. These amounts may be negative from time to time. Equivalent exposure is a calculated amount that translates the derivative position into a reasonable approximation of the amount of the underlying asset that the portfolio would have to hold at a given point in time to have the same price sensitivity that results from the portfolio’s ownership of the derivative contract. When dealing with derivatives, equivalent exposure is a more representative measure of the potential impact of a position on portfolio performance than value. The bond component will include any accrued interest amounts. |
| (m) | In determining an instrument’s effective maturity for purposes of calculating the fund’s dollar-weighted average effective maturity, MFS uses the instrument’s stated maturity or, if applicable, an earlier date on which MFS believes it is probable that a maturity-shortening device (such as a put, pre-refunding or prepayment) will cause the instrument to be repaid. Such an earlier date can be substantially shorter than the instrument’s stated maturity. |
Where the fund holds convertible bonds, these are treated as part of the equity portion of the portfolio.
Cash & Cash Equivalents includes any cash, investments in money market funds, short-term securities, and other assets less liabilities. Please see the Statement of Assets and Liabilities for additional information related to the fund’s cash position and other assets and liabilities.
Other includes equivalent exposure from currency derivatives and/or any offsets to derivative positions and may be negative.
Percentages are based on net assets as of 2/28/17.
The portfolio is actively managed and current holdings may be different.
3
MANAGEMENT REVIEW
Summary of Results
For the twelve months ended February 28, 2017, Class A shares of the MFS Government Securities Fund (“fund”) provided a total return of –0.97%, at net asset value. This compares with a return of –0.49% for the fund’s benchmark, the Bloomberg Barclays U.S. Government/Mortgage Bond Index (formerly “Barclays U.S. Government/Mortgage Bond Index”).
Market Environment
Global growth improved during much of the reporting period as oil prices recovered from their earlier plunge and fiscal and monetary stimulus from China took hold. Market confidence increased after the US elections in November in anticipation of lower taxes, a lighter regulatory burden and increased infrastructure spending, boosting US equities and bond yields. The US Federal Reserve increased interest rates by 25 basis points at the end of the period, the second hike of the cycle which began in December 2015. Globally, however, central bank policy remained highly accommodative, which forced many government, and even some corporate, bond yields into negative territory during the period. During the first half of the period, the United Kingdom voted to leave the European Union (“EU”), beginning a multi-year process of negotiation in order to achieve “Brexit.” While markets initially reacted to the vote with alarm, the spillover to European and emerging market (“EM”) economies was relatively short-lived, although risks of further hits to EU cohesiveness could re-emerge.
Headwinds from lower energy and commodity prices abated during the period as stabilizing oil prices helped push energy earnings higher relative to expectations. A sharp rise in the US dollar was an earnings headwind for multinationals. US consumer spending held up well during the second half of the period amid a modest increase in real wages and relatively low gasoline prices. Demand for autos reached near-record territory, while the housing market continued its recovery. Global trade, which was sluggish early in the period, showed signs of improvement in the period’s second half and EM countries began to show signs of a modest upturn in activity along with adjustment in their external accounts. These improved conditions appeared to have reassured investors and contributed to record inflows into the asset class during July and August as negative yields for an increasing share of developed market bonds drove yield-hungry investors further out on the risk spectrum. Similar investor inflows were experienced in the investment grade and high yield corporate markets. Late in the reporting period, however, new challenges emerged for emerging markets debt (“EMD”) as a result of the US presidential election, which raised concerns about the potential for a protectionist turn in US trade policy which could negatively impact EM economies. These concerns, along with rising expectations for US growth, inflation and interest rates, have turned the tables on flows into EMD. Since the election, flows have reversed. As of the end of the period, the markets seemed to be in “wait-and-see” mode, looking for evidence to either confirm or refute the repricing of risk that has occurred since Election Day.
4
Management Review – continued
Factors Affecting Performance
Relative to the Bloomberg Barclays U.S. Government/Mortgage Bond Index, the fund’s yield curve (y) positioning, particularly its lesser exposure to two-year and five-year key rates, was a primary factor that detracted from relative returns as yields increased over the reporting period. Conversely, the fund’s out-of-benchmark holdings of commercial mortgage-backed securities, and a lesser exposure to the treasury sector, contributed to relative performance.
Respectfully,
Geoffrey Schechter
Portfolio Manager
| (y) | A yield curve graphically depicts the yields of different maturity bonds of the same credit quality and type; a normal yield curve is upward sloping, with short-term rates lower than long-term rates. |
The views expressed in this report are those of the portfolio manager only through the end of the period of the report as stated on the cover and do not necessarily reflect the views of MFS or any other person in the MFS organization. These views are subject to change at any time based on market or other conditions, and MFS disclaims any responsibility to update such views. These views may not be relied upon as investment advice or an indication of trading intent on behalf of any MFS portfolio. References to specific securities are not recommendations of such securities, and may not be representative of any MFS portfolio’s current or future investments.
5
PERFORMANCE SUMMARY THROUGH 2/28/17
The following chart illustrates a representative class of the fund’s historical performance in comparison to its benchmark(s). Performance results include the deduction of the maximum applicable sales charge and reflect the percentage change in net asset value, including reinvestment of dividends and capital gains distributions. The performance of other share classes will be greater than or less than that of the class depicted below. Benchmarks are unmanaged and may not be invested in directly. Benchmark returns do not reflect sales charges, commissions or expenses. (See Notes to Performance Summary.)
Performance data shown represents past performance and is no guarantee of future results. Investment return and principal value fluctuate so your shares, when sold, may be worth more or less than the original cost; current performance may be lower or higher than quoted. The performance shown does not reflect the deduction of taxes, if any, that a shareholder would pay on fund distributions or the redemption of fund shares.
Growth of a Hypothetical $10,000 Investment
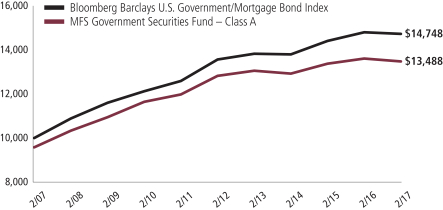
6
Performance Summary – continued
Total Returns through 2/28/17
Average annual without sales charge
| | | | | | | | | | | | | | |
| | | Share Class | | Class Inception Date | | 1-yr | | 5-yr | | 10-yr | | Life (t) | | |
| | | A | | 7/25/84 | | (0.97)% | | 0.99% | | 3.49% | | N/A | | |
| | | B | | 8/30/93 | | (1.82)% | | 0.22% | | 2.71% | | N/A | | |
| | | C | | 4/01/96 | | (1.81)% | | 0.20% | | 2.69% | | N/A | | |
| | | I | | 1/02/97 | | (0.73)% | | 1.23% | | 3.73% | | N/A | | |
| | | R1 | | 4/01/05 | | (1.72)% | | 0.24% | | 2.69% | | N/A | | |
| | | R2 | | 10/31/03 | | (1.22)% | | 0.74% | | 3.21% | | N/A | | |
| | | R3 | | 4/01/05 | | (1.07)% | | 0.97% | | 3.46% | | N/A | | |
| | | R4 | | 4/01/05 | | (0.72)% | | 1.23% | | 3.70% | | N/A | | |
| | | R6 (formerly Class R5) | | 7/02/12 | | (0.61)% | | N/A | | N/A | | 1.14% | | |
| Comparative benchmark | | |
| | | Bloomberg Barclays U.S.
Government/Mortgage Bond Index (f) | | (0.49)% | | 1.68% | | 3.96% | | N/A | | |
| Average annual with sales charge | | |
| | | A
With Initial Sales Charge (4.25%) | | (5.18)% | | 0.12% | | 3.04% | | N/A | | |
| | | B
With CDSC (Declining over six years from 4% to 0%) (v) | | (5.68)% | | (0.15)% | | 2.71% | | N/A | | |
| | | C
With CDSC (1% for 12 months) (v) | | (2.77)% | | 0.20% | | 2.69% | | N/A | | |
CDSC – Contingent Deferred Sales Charge.
Class I, R1, R2, R3, R4, and R6 shares do not have a sales charge.
Effective August 26, 2016, Class R5 shares were renamed Class R6 shares.
| (f) | Source: FactSet Research Systems Inc. |
| (t) | For the period from the class inception date through the stated period end (for those share classes with less than 10 years of performance history). No comparative benchmark performance information is provided for “life” periods. (See Notes to Performance Summary.) |
| (v) | Assuming redemption at the end of the applicable period. |
Benchmark Definition
Bloomberg Barclays U.S. Government/Mortgage Bond Index (formerly Barclays U.S. Government/Mortgage Bond Index) – measures debt issued by the U.S. Government, and its agencies, as well as mortgage-backed pass-through securities of Ginnie Mae (GNMA), Fannie Mae (FNMA), and Freddie Mac (FHLMC).
It is not possible to invest directly in an index.
Notes to Performance Summary
Average annual total return represents the average annual change in value for each share class for the periods presented. Life returns are presented where the share class
7
Performance Summary – continued
has less than 10 years of performance history and represent the average annual total return from the class inception date to the stated period end date. As the fund’s share classes may have different inception dates, the life returns may represent different time periods and may not be comparable. As a result, no comparative benchmark performance information is provided for life periods.
Performance results reflect any applicable expense subsidies and waivers in effect during the periods shown. Without such subsidies and waivers the fund’s performance results would be less favorable. Please see the prospectus and financial statements for complete details.
Performance results do not include adjustments made for financial reporting purposes in accordance with U.S. generally accepted accounting principles and may differ from amounts reported in the financial highlights.
From time to time the fund may receive proceeds from litigation settlements, without which performance would be lower.
8
EXPENSE TABLE
Fund expenses borne by the shareholders during the period, September 1, 2016 through February 28, 2017
As a shareholder of the fund, you incur two types of costs: (1) transaction costs, including sales charges (loads) on certain purchase or redemption payments, and (2) ongoing costs, including management fees; distribution and service (12b-1) fees; and other fund expenses. This example is intended to help you understand your ongoing costs (in dollars) of investing in the fund and to compare these costs with the ongoing costs of investing in other mutual funds.
The example is based on an investment of $1,000 invested at the beginning of the period and held for the entire period September 1, 2016 through February 28, 2017.
The expenses include the payment of a portion of the transfer-agent-related expenses of MFS funds that invest in the fund. For further information, please see the Notes to the Financial Statements.
Actual Expenses
The first line for each share class in the following table provides information about actual account values and actual expenses. You may use the information in this line, together with the amount you invested, to estimate the expenses that you paid over the period. Simply divide your account value by $1,000 (for example, an $8,600 account value divided by $1,000 = 8.6), then multiply the result by the number in the first line under the heading entitled “Expenses Paid During Period” to estimate the expenses you paid on your account during this period.
Hypothetical Example for Comparison Purposes
The second line for each share class in the following table provides information about hypothetical account values and hypothetical expenses based on the fund’s actual expense ratio and an assumed rate of return of 5% per year before expenses, which is not the fund’s actual return. The hypothetical account values and expenses may not be used to estimate the actual ending account balance or expenses you paid for the period. You may use this information to compare the ongoing costs of investing in the fund and other funds. To do so, compare this 5% hypothetical example with the 5% hypothetical examples that appear in the shareholder reports of the other funds.
Please note that the expenses shown in the table are meant to highlight your ongoing costs only and do not reflect any transactional costs, such as sales charges (loads). Therefore, the second line for each share class in the table is useful in comparing ongoing costs only, and will not help you determine the relative total costs of owning different funds. In addition, if these transactional costs were included, your costs would have been higher.
9
Expense Table – continued
| | | | | | | | | | | | | | | | | | |
Share Class | | | | Annualized Expense Ratio | | | Beginning
Account Value
9/01/16 | | | Ending
Account Value
2/28/17 | | | Expenses Paid During
Period (p) 9/01/16-2/28/17 | |
| A | | Actual | | | 0.87% | | | | $1,000.00 | | | | $973.64 | | | | $4.26 | |
| | Hypothetical (h) | | | 0.87% | | | | $1,000.00 | | | | $1,020.48 | | | | $4.36 | |
| B | | Actual | | | 1.62% | | | | $1,000.00 | | | | $968.96 | | | | $7.91 | |
| | Hypothetical (h) | | | 1.62% | | | | $1,000.00 | | | | $1,016.76 | | | | $8.10 | |
| C | | Actual | | | 1.62% | | | | $1,000.00 | | | | $969.07 | | | | $7.91 | |
| | Hypothetical (h) | | | 1.62% | | | | $1,000.00 | | | | $1,016.76 | | | | $8.10 | |
| I | | Actual | | | 0.62% | | | | $1,000.00 | | | | $974.83 | | | | $3.04 | |
| | Hypothetical (h) | | | 0.62% | | | | $1,000.00 | | | | $1,021.72 | | | | $3.11 | |
| R1 | | Actual | | | 1.62% | | | | $1,000.00 | | | | $969.94 | | | | $7.91 | |
| | Hypothetical (h) | | | 1.62% | | | | $1,000.00 | | | | $1,016.76 | | | | $8.10 | |
| R2 | | Actual | | | 1.13% | | | | $1,000.00 | | | | $972.39 | | | | $5.53 | |
| | Hypothetical (h) | | | 1.13% | | | | $1,000.00 | | | | $1,019.19 | | | | $5.66 | |
| R3 | | Actual | | | 0.88% | | | | $1,000.00 | | | | $972.66 | | | | $4.30 | |
| | Hypothetical (h) | | | 0.88% | | | | $1,000.00 | | | | $1,020.43 | | | | $4.41 | |
| R4 | | Actual | | | 0.63% | | | | $1,000.00 | | | | $974.87 | | | | $3.08 | |
| | Hypothetical (h) | | | 0.63% | | | | $1,000.00 | | | | $1,021.67 | | | | $3.16 | |
| R6 | | Actual | | | 0.50% | | | | $1,000.00 | | | | $975.45 | | | | $2.45 | |
| | Hypothetical (h) | | | 0.50% | | | | $1,000.00 | | | | $1,022.32 | | | | $2.51 | |
| (h) | 5% class return per year before expenses. |
| (p) | “Expenses Paid During Period” are equal to each class’s annualized expense ratio, as shown above, multiplied by the average account value over the period, multiplied by 181/365 (to reflect the one-half year period). Expenses paid do not include any applicable sales charges (loads). If these transaction costs had been included, your costs would have been higher. |
Notes to Expense Table
Each class with a Rule 12b-1 service fee is subject to a rebate of a portion of such fee. Such rebates are included in the expense ratios above. For Class A shares, this rebate reduced the expense ratio above by 0.01%. See Note 3 in the Notes to Financial Statements for additional information.
10
PORTFOLIO OF INVESTMENTS
2/28/17
The Portfolio of Investments is a complete list of all securities owned by your fund. It is categorized by broad-based asset classes.
| | | | | | | | |
| Bonds - 99.3% | | | | | | | | |
| Issuer | | Shares/Par | | | Value ($) | |
| Agency - Other - 3.8% | | | | | | | | |
| Financing Corp., 10.7%, 10/06/2017 | | $ | 14,360,000 | | | $ | 15,214,553 | |
| Financing Corp., 9.4%, 2/08/2018 | | | 11,750,000 | | | | 12,660,378 | |
| Financing Corp., 9.8%, 4/06/2018 | | | 14,975,000 | | | | 16,386,558 | |
| Financing Corp., 10.35%, 8/03/2018 | | | 15,165,000 | | | | 17,132,022 | |
| Financing Corp., STRIPS, 0%, 11/30/2017 | | | 18,780,000 | | | | 18,645,911 | |
| | | | | | | | |
| | | | | | | $ | 80,039,422 | |
| Asset-Backed & Securitized - 3.7% | | | | | | | | |
| Cent CLO LP, 2014-21A, “A1”, FRN, 0%, 7/27/2026 (z) | | $ | 8,305,747 | | | $ | 8,305,747 | |
| Citigroup Commercial Mortgage Trust, 2015-GC27, “A5”, 3.137%, 2/10/2048 | | | 1,000,000 | | | | 1,000,207 | |
| CNH Equipment Trust, 2015-C, “A2B”, FRN, 1.24%, 12/17/2018 | | | 1,000,605 | | | | 1,000,909 | |
| Commercial Mortgage Trust, 2014-CR19, “A5”, 3.796%, 8/10/2047 | | | 1,000,000 | | | | 1,046,513 | |
| Commercial Mortgage Trust, 2015-DC1, “A5”, 3.35%, 2/10/2048 | | | 4,990,000 | | | | 5,042,225 | |
| Commercial Mortgage Trust, 2015-LC21, “A4”, 3.708%, 7/10/2048 | | | 3,135,000 | | | | 3,251,677 | |
| Commercial Mortgage Trust, 2015-PC1, “A5”, 3.902%, 7/10/2050 | | | 5,300,000 | | | | 5,555,300 | |
| Credit Suisse Commercial Mortgage Trust, “A4”, FRN, 5.941%, 9/15/2039 | | | 2,892,429 | | | | 2,915,499 | |
| Credit Suisse Commercial Mortgage Trust, “AM”, FRN, 5.638%, 6/15/2039 | | | 4,878,716 | | | | 4,921,405 | |
| Credit Suisse Commercial Mortgage Trust, “C4”, FRN, 5.941%, 9/15/2039 | | | 4,632,039 | | | | 4,690,015 | |
| CSAIL Commercial Mortgage Trust, 2015-C2, “A4”, 3.504%, 6/15/2057 | | | 5,341,994 | | | | 5,464,597 | |
| CWCapital Cobalt Ltd., “A4”, FRN, 5.775%, 5/15/2046 | | | 4,103,278 | | | | 4,125,700 | |
| Ford Credit Floorplan Master Owner Trust, 2015-4, “A2”, FRN, 1.37%, 8/15/2020 | | | 2,875,000 | | | | 2,889,375 | |
| Fortress Credit BSL Ltd., 2013-1A, “A”, FRN, 2.205%, 1/19/2025 (n) | | | 4,622,359 | | | | 4,631,091 | |
| GS Mortgage Securities Trust, 2015-GC30, “A4”, 3.382%, 5/10/2050 | | | 5,500,000 | | | | 5,592,329 | |
| JPMorgan Chase Commercial Mortgage Securities Corp., “A4”, FRN, 5.787%, 6/15/2049 | | | 5,024,188 | | | | 5,034,266 | |
| Morgan Stanley Capital I Trust, “AM”, FRN, 5.715%, 4/15/2049 | | | 5,336,000 | | | | 5,342,459 | |
| Wells Fargo Commercial Mortgage Trust, 2015-C28, “A4”, 3.54%, 5/15/2048 | | | 5,531,348 | | | | 5,680,021 | |
11
Portfolio of Investments – continued
| | | | | | | | |
| Issuer | | Shares/Par | | | Value ($) | |
| Bonds - continued | | | | | | | | |
| Asset-Backed & Securitized - continued | | | | | | | | |
| Wells Fargo Commercial Mortgage Trust, 2015-NXS1, “A5”, 3.148%, 5/15/2048 | | $ | 2,177,277 | | | $ | 2,187,100 | |
| | | | | | | | |
| | | | | | | $ | 78,676,435 | |
| Automotive - 0.3% | | | | | | | | |
| Ford Motor Credit Co. LLC, 2.551%, 10/05/2018 | | $ | 2,611,000 | | | $ | 2,632,865 | |
| Hyundai Capital America, 2%, 3/19/2018 (n) | | | 3,122,000 | | | | 3,126,093 | |
| Hyundai Capital America, 2.4%, 10/30/2018 (n) | | | 654,000 | | | | 656,472 | |
| | | | | | | | |
| | | | | | | $ | 6,415,430 | |
| Business Services - 0.2% | | | | | | | | |
| Cisco Systems, Inc., 2.6%, 2/28/2023 | | $ | 4,048,000 | | | $ | 4,042,721 | |
| | |
| Computer Software - 0.1% | | | | | | | | |
| Microsoft Corp., 3.125%, 11/03/2025 | | $ | 1,640,000 | | | $ | 1,646,614 | |
| | |
| Computer Software - Systems - 0.3% | | | | | | | | |
| Apple, Inc., 3.25%, 2/23/2026 | | $ | 5,398,000 | | | $ | 5,479,337 | |
| | |
| Consumer Products - 0.2% | | | | | | | | |
| Newell Rubbermaid, Inc., 3.15%, 4/01/2021 | | $ | 3,719,000 | | | $ | 3,792,937 | |
| | |
| Local Authorities - 0.5% | | | | | | | | |
| State of California (Build America Bonds), 7.6%, 11/01/2040 | | $ | 4,220,000 | | | $ | 6,308,605 | |
| University of California Rev. (Build America Bonds), 5.77%, 5/15/2043 | | | 2,750,000 | | | | 3,428,508 | |
| | | | | | | | |
| | | | | | | $ | 9,737,113 | |
| Mortgage-Backed - 51.3% | | | | | | | | |
| Fannie Mae, 5.43%, 4/01/2017 | | $ | 25,382 | | | $ | 25,330 | |
| Fannie Mae, 5.38%, 5/01/2017 | | | 1,784,027 | | | | 1,784,501 | |
| Fannie Mae, 1.9%, 6/01/2017 | | | 750,777 | | | | 750,139 | |
| Fannie Mae, 5.5%, 8/01/2017 - 12/01/2038 | | | 27,850,096 | | | | 31,137,170 | |
| Fannie Mae, 6%, 8/01/2017 - 12/01/2037 | | | 7,304,406 | | | | 8,324,411 | |
| Fannie Mae, 3.189%, 12/01/2017 | | | 1,890,134 | | | | 1,900,100 | |
| Fannie Mae, 3.8%, 2/01/2018 | | | 1,590,364 | | | | 1,608,041 | |
| Fannie Mae, 4%, 3/01/2018 - 2/01/2045 | | | 149,935,451 | | | | 158,196,064 | |
| Fannie Mae, 3.99%, 4/01/2018 | | | 1,600,000 | | | | 1,626,134 | |
| Fannie Mae, 5.37%, 5/01/2018 | | | 1,794,554 | | | | 1,840,830 | |
| Fannie Mae, 2.578%, 9/25/2018 | | | 7,737,433 | | | | 7,801,441 | |
| Fannie Mae, 5.6%, 1/01/2019 | | | 921,375 | | | | 975,589 | |
| Fannie Mae, 5.47%, 2/01/2019 | | | 355,770 | | | | 374,324 | |
| Fannie Mae, 5.1%, 3/01/2019 | | | 360,196 | | | | 377,969 | |
| Fannie Mae, 5%, 4/01/2019 - 3/01/2042 | | | 28,698,867 | | | | 31,450,292 | |
12
Portfolio of Investments – continued
| | | | | | | | |
| Issuer | | Shares/Par | | | Value ($) | |
| Bonds - continued | | | | | | | | |
| Mortgage-Backed - continued | | | | | | | | |
| Fannie Mae, 5.08%, 4/01/2019 | | $ | 731,483 | | | $ | 777,363 | |
| Fannie Mae, 5.28%, 4/01/2019 | | | 620,313 | | | | 661,135 | |
| Fannie Mae, 4.84%, 5/01/2019 | | | 620,724 | | | | 658,060 | |
| Fannie Mae, 4.5%, 6/01/2019 - 6/01/2044 | | | 81,027,125 | | | | 87,220,988 | |
| Fannie Mae, 4.829%, 8/01/2019 | | | 3,288,442 | | | | 3,496,781 | |
| Fannie Mae, 4.83%, 8/01/2019 - 9/01/2019 | | | 1,472,215 | | | | 1,564,984 | |
| Fannie Mae, 5.05%, 8/01/2019 | | | 675,462 | | | | 720,312 | |
| Fannie Mae, 4.67%, 9/01/2019 | | | 1,144,448 | | | | 1,214,086 | |
| Fannie Mae, 4.94%, 9/01/2019 | | | 391,668 | | | | 417,382 | |
| Fannie Mae, 4.88%, 3/01/2020 | | | 460,240 | | | | 480,651 | |
| Fannie Mae, 4.14%, 8/01/2020 | | | 1,333,109 | | | | 1,414,774 | |
| Fannie Mae, 5.19%, 9/01/2020 | | | 1,658,488 | | | | 1,762,117 | |
| Fannie Mae, 2.152%, 1/25/2023 | | | 4,740,000 | | | | 4,652,801 | |
| Fannie Mae, 2.41%, 5/01/2023 | | | 1,522,239 | | | | 1,515,473 | |
| Fannie Mae, 2.55%, 5/01/2023 | | | 1,312,423 | | | | 1,316,519 | |
| Fannie Mae, 2.59%, 5/01/2023 | | | 832,082 | | | | 836,406 | |
| Fannie Mae, 3.78%, 10/01/2023 | | | 916,578 | | | | 972,610 | |
| Fannie Mae, 4.5%, 5/01/2025 | | | 374,309 | | | | 392,057 | |
| Fannie Mae, 3.59%, 9/01/2026 | | | 1,051,900 | | | | 1,104,721 | |
| Fannie Mae, 3%, 3/01/2027 - 11/01/2046 | | | 100,916,402 | | | | 102,839,013 | |
| Fannie Mae, 6.5%, 1/01/2032 - 10/01/2037 | | | 2,774,237 | | | | 3,172,711 | |
| Fannie Mae, 3.5%, 1/01/2042 - 10/01/2046 | | | 88,558,894 | | | | 91,073,053 | |
| Fannie Mae, FRN, 1.128%, 5/25/2018 | | | 3,628,223 | | | | 3,629,370 | |
| Fannie Mae, TBA, 3.5%, 3/01/2047 | | | 12,484,000 | | | | 12,797,075 | |
| Freddie Mac, 6%, 8/01/2017 - 10/01/2038 | | | 5,474,798 | | | | 6,193,636 | |
| Freddie Mac, 3.154%, 2/25/2018 | | | 4,891,142 | | | | 4,947,668 | |
| Freddie Mac, 2.412%, 8/25/2018 | | | 7,128,394 | | | | 7,195,900 | |
| Freddie Mac, 5%, 9/01/2018 - 7/01/2041 | | | 10,937,536 | | | | 12,014,245 | |
| Freddie Mac, 2.303%, 9/25/2018 | | | 2,438,882 | | | | 2,461,474 | |
| Freddie Mac, 2.323%, 10/25/2018 | | | 4,756,616 | | | | 4,807,408 | |
| Freddie Mac, 2.13%, 1/25/2019 | | | 10,291,712 | | | | 10,369,225 | |
| Freddie Mac, 5.085%, 3/25/2019 | | | 6,865,000 | | | | 7,243,798 | |
| Freddie Mac, 1.883%, 5/25/2019 | | | 1,100,000 | | | | 1,103,093 | |
| Freddie Mac, 2.456%, 8/25/2019 | | | 4,923,000 | | | | 4,987,037 | |
| Freddie Mac, 4.186%, 8/25/2019 | | | 2,800,000 | | | | 2,945,349 | |
| Freddie Mac, 4.251%, 1/25/2020 | | | 3,106,000 | | | | 3,295,353 | |
| Freddie Mac, 2.313%, 3/25/2020 | | | 6,978,000 | | | | 7,058,735 | |
| Freddie Mac, 4.224%, 3/25/2020 | | | 4,281,146 | | | | 4,549,222 | |
| Freddie Mac, 3.808%, 8/25/2020 | | | 2,877,000 | | | | 3,037,757 | |
| Freddie Mac, 3.034%, 10/25/2020 | | | 5,417,000 | | | | 5,598,347 | |
| Freddie Mac, 2.856%, 1/25/2021 | | | 4,724,000 | | | | 4,860,047 | |
| Freddie Mac, 5.5%, 4/01/2021 - 1/01/2038 | | | 7,533,121 | | | | 8,419,137 | |
| Freddie Mac, 2.791%, 1/25/2022 | | | 6,917,000 | | | | 7,086,387 | |
13
Portfolio of Investments – continued
| | | | | | | | |
| Issuer | | Shares/Par | | | Value ($) | |
| Bonds - continued | | | | | | | | |
| Mortgage-Backed - continued | | | | | | | | |
| Freddie Mac, 2.716%, 6/25/2022 | | $ | 4,738,552 | | | $ | 4,835,902 | |
| Freddie Mac, 2.682%, 10/25/2022 | | | 2,394,000 | | | | 2,433,204 | |
| Freddie Mac, 4.5%, 11/01/2022 - 5/01/2042 | | | 14,249,185 | | | | 15,319,169 | |
| Freddie Mac, 2.51%, 11/25/2022 | | | 6,640,000 | | | | 6,680,910 | |
| Freddie Mac, 3.32%, 2/25/2023 | | | 4,605,000 | | | | 4,828,776 | |
| Freddie Mac, 3.25%, 4/25/2023 | | | 9,000,000 | | | | 9,399,373 | |
| Freddie Mac, 3.3%, 4/25/2023 - 10/25/2026 | | | 12,437,861 | | | | 12,899,902 | |
| Freddie Mac, 3.06%, 7/25/2023 | | | 2,074,000 | | | | 2,141,508 | |
| Freddie Mac, 2.454%, 8/25/2023 | | | 4,795,000 | | | | 4,774,014 | |
| Freddie Mac, 3.458%, 8/25/2023 | | | 4,600,000 | | | | 4,847,972 | |
| Freddie Mac, 2.67%, 12/25/2024 | | | 10,788,000 | | | | 10,765,668 | |
| Freddie Mac, 2.811%, 1/25/2025 | | | 9,000,000 | | | | 9,051,594 | |
| Freddie Mac, 3.329%, 5/25/2025 | | | 9,024,000 | | | | 9,363,793 | |
| Freddie Mac, 4%, 7/01/2025 - 9/01/2044 | | | 10,869,945 | | | | 11,452,169 | |
| Freddie Mac, 3.01%, 7/25/2025 | | | 2,651,000 | | | | 2,692,815 | |
| Freddie Mac, 2.745%, 1/25/2026 | | | 8,567,000 | | | | 8,498,049 | |
| Freddie Mac, 2.673%, 3/25/2026 | | | 7,802,000 | | | | 7,687,834 | |
| Freddie Mac, 6.5%, 5/01/2037 | | | 629,974 | | | | 708,030 | |
| Freddie Mac, 3.5%, 12/01/2041 - 1/01/2047 | | | 102,815,092 | | | | 105,654,919 | |
| Freddie Mac, 3%, 4/01/2043 - 11/01/2046 | | | 62,021,929 | | | | 61,825,868 | |
| Ginnie Mae, 5.5%, 3/15/2033 - 1/20/2042 | | | 6,069,466 | | | | 6,823,521 | |
| Ginnie Mae, 4.5%, 7/20/2033 - 9/20/2041 | | | 14,830,627 | | | | 16,078,519 | |
| Ginnie Mae, 4%, 10/15/2039 - 4/20/2041 | | | 2,920,172 | | | | 3,101,106 | |
| Ginnie Mae, 3.5%, 12/15/2041 - 5/20/2046 | | | 59,101,560 | | | | 61,620,449 | |
| Ginnie Mae, 3%, 7/20/2043 | | | 9,143,978 | | | | 9,293,106 | |
| Ginnie Mae, 6.157%, 4/20/2058 | | | 73,444 | | | | 81,295 | |
| | | | | | | | |
| | | | | | | $ | 1,073,896,060 | |
| Other Banks & Diversified Financials - 0.2% | | | | | | | | |
| Banque Federative du Credit Mutuel S.A., 2.5%, 4/13/2021 (n) | | $ | 4,294,000 | | | $ | 4,251,146 | |
| | |
| Restaurants - 0.1% | | | | | | | | |
| McDonald’s Corp., 2.75%, 12/09/2020 | | $ | 1,587,000 | | | $ | 1,614,817 | |
| | |
| Supranational - 0.1% | | | | | | | | |
| Inter-American Development Bank, 4.375%, 1/24/2044 | | $ | 2,796,000 | | | $ | 3,277,885 | |
| | |
| U.S. Government Agencies and Equivalents - 2.9% | | | | | | | | |
| AID-Tunisia, 2.452%, 7/24/2021 | | $ | 4,063,000 | | | $ | 4,131,998 | |
| AID-Ukraine, 1.844%, 5/16/2019 | | | 7,271,000 | | | | 7,353,082 | |
| AID-Ukraine, 1.847%, 5/29/2020 | | | 3,250,000 | | | | 3,263,735 | |
| Hashemite Kingdom of Jordan, 1.945%, 6/23/2019 | | | 5,532,000 | | | | 5,587,569 | |
| Hashemite Kingdom of Jordan, 2.503%, 10/30/2020 | | | 6,688,000 | | | | 6,853,080 | |
14
Portfolio of Investments – continued
| | | | | | | | |
| Issuer | | Shares/Par | | | Value ($) | |
| Bonds - continued | | | | | | | | |
| U.S. Government Agencies and Equivalents - continued | |
| Private Export Funding Corp., 2.25%, 3/15/2020 | | $ | 1,681,000 | | | $ | 1,705,828 | |
| Private Export Funding Corp., 2.3%, 9/15/2020 | | | 4,100,000 | | | | 4,151,914 | |
| Private Export Funding Corp., 1.875%, 7/15/2018 | | | 5,330,000 | | | | 5,378,386 | |
| Small Business Administration, 6.35%, 4/01/2021 | | | 129,956 | | | | 137,296 | |
| Small Business Administration, 6.34%, 5/01/2021 | | | 162,710 | | | | 171,825 | |
| Small Business Administration, 6.44%, 6/01/2021 | | | 167,846 | | | | 176,556 | |
| Small Business Administration, 6.625%, 7/01/2021 | | | 168,633 | | | | 179,019 | |
| Small Business Administration, 6.07%, 3/01/2022 | | | 168,641 | | | | 180,903 | |
| Small Business Administration, 4.98%, 11/01/2023 | | | 302,563 | | | | 321,219 | |
| Small Business Administration, 4.89%, 12/01/2023 | | | 652,507 | | | | 691,423 | |
| Small Business Administration, 4.77%, 4/01/2024 | | | 743,754 | | | | 777,385 | |
| Small Business Administration, 5.52%, 6/01/2024 | | | 366,631 | | | | 390,530 | |
| Small Business Administration, 4.99%, 9/01/2024 | | | 576,172 | | | | 605,083 | |
| Small Business Administration, 4.86%, 10/01/2024 | | | 398,709 | | | | 418,314 | |
| Small Business Administration, 4.86%, 1/01/2025 | | | 733,614 | | | | 771,678 | |
| Small Business Administration, 5.11%, 4/01/2025 | | | 619,957 | | | | 657,175 | |
| Small Business Administration, 2.21%, 2/01/2033 | | | 2,299,755 | | | | 2,250,531 | |
| Small Business Administration, 2.22%, 3/01/2033 | | | 4,177,387 | | | | 4,087,954 | |
| Small Business Administration, 3.15%, 7/01/2033 | | | 3,830,943 | | | | 3,949,249 | |
| Small Business Administration, 3.16%, 8/01/2033 | | | 1,432,326 | | | | 1,477,826 | |
| Small Business Administration, 3.62%, 9/01/2033 | | | 1,453,266 | | | | 1,533,872 | |
| Tennessee Valley Authority, 1.75%, 10/15/2018 | | | 4,231,000 | | | | 4,266,062 | |
| | | | | | | | |
| | | | | | | $ | 61,469,492 | |
| U.S. Treasury Obligations - 35.4% | | | | | | | | |
| U.S. Treasury Bonds, 6.25%, 8/15/2023 | | $ | 1,445,000 | | | $ | 1,808,056 | |
| U.S. Treasury Bonds, 6%, 2/15/2026 | | | 5,933,000 | | | | 7,700,156 | |
| U.S. Treasury Bonds, 6.75%, 8/15/2026 | | | 981,000 | | | | 1,347,649 | |
| U.S. Treasury Bonds, 6.375%, 8/15/2027 | | | 2,309,000 | | | | 3,158,008 | |
| U.S. Treasury Bonds, 4.375%, 2/15/2038 | | | 12,361,000 | | | | 15,551,201 | |
| U.S. Treasury Bonds, 4.5%, 8/15/2039 | | | 21,621,300 | | | | 27,490,294 | |
| U.S. Treasury Bonds, 3.125%, 2/15/2043 | | | 28,535,600 | | | | 29,347,095 | |
| U.S. Treasury Bonds, 2.875%, 5/15/2043 | | | 27,528,200 | | | | 27,021,736 | |
| U.S. Treasury Bonds, 2.5%, 2/15/2045 | | | 79,972,000 | | | | 72,521,489 | |
| U.S. Treasury Notes, 2.625%, 4/30/2018 | | | 26,085,000 | | | | 26,575,111 | |
| U.S. Treasury Notes, 2.75%, 2/15/2019 | | | 19,471,600 | | | | 20,044,338 | |
| U.S. Treasury Notes, 1%, 6/30/2019 | | | 97,559,000 | | | | 96,850,136 | |
| U.S. Treasury Notes, 1.625%, 6/30/2019 | | | 57,876,000 | | | | 58,271,640 | |
| U.S. Treasury Notes, 2.625%, 8/15/2020 | | | 32,222,000 | | | | 33,318,289 | |
| U.S. Treasury Notes, 2%, 11/30/2020 | | | 6,679,000 | | | | 6,754,399 | |
| U.S. Treasury Notes, 3.125%, 5/15/2021 (f) | | | 63,935,000 | | | | 67,394,011 | |
| U.S. Treasury Notes, 1.75%, 5/15/2022 | | | 49,023,000 | | | | 48,519,387 | |
| U.S. Treasury Notes, 2.5%, 8/15/2023 | | | 136,673,000 | | | | 139,721,491 | |
| U.S. Treasury Notes, 2.75%, 2/15/2024 | | | 8,033,000 | | | | 8,326,389 | |
15
Portfolio of Investments – continued
| | | | | | | | |
| Issuer | | Shares/Par | | | Value ($) | |
| Bonds - continued | | | | | | | | |
| U.S. Treasury Obligations - continued | | | | | | | | |
| U.S. Treasury Notes, 2.5%, 5/15/2024 | | $ | 42,851,000 | | | $ | 43,681,238 | |
| U.S. Treasury Notes, 2%, 11/15/2026 | | | 6,400,000 | | | | 6,192,749 | |
| | | | | | | | |
| | | | | | | $ | 741,594,862 | |
| Utilities - Electric Power - 0.2% | | | | | | | | |
| NextEra Energy Capital Holdings, Inc., 2.056%, 9/01/2017 | | $ | 3,358,000 | | | $ | 3,370,723 | |
| Total Bonds (Identified Cost, $2,063,992,300) | | | | | | $ | 2,079,304,994 | |
| | |
| Money Market Funds - 1.4% | | | | | | | | |
MFS Institutional Money Market Portfolio, 0.64% (v)
(Identified Cost, $29,765,151) | | | 29,765,172 | | | $ | 29,765,172 | |
| Total Investments (Identified Cost, $2,093,757,451) | | | | | | $ | 2,109,070,166 | |
| | |
| Other Assets, Less Liabilities - (0.7)% | | | | | | | (14,527,900 | ) |
| Net Assets - 100.0% | | | | | | $ | 2,094,542,266 | |
| (f) | All or a portion of the security has been segregated as collateral for open futures contracts. |
| (n) | Securities exempt from registration under Rule 144A of the Securities Act of 1933. These securities may be sold in the ordinary course of business in transactions exempt from registration, normally to qualified institutional buyers. At period end, the aggregate value of these securities was $12,664,802, representing 0.6% of net assets. |
| (v) | Underlying affiliated fund that is available only to investment companies managed by MFS. The rate quoted for the MFS Institutional Money Market Portfolio is the annualized seven-day yield of the fund at period end. |
| (z) | Restricted securities are not registered under the Securities Act of 1933 and are subject to legal restrictions on resale. These securities generally may be resold in transactions exempt from registration or to the public if the securities are subsequently registered. Disposal of these securities may involve time-consuming negotiations and prompt sale at an acceptable price may be difficult. The fund holds the following restricted securities: |
| | | | | | | | | | |
| Restricted Securities | | Acquisition
Date | | Cost | | | Value | |
| Cent CLO LP, 2014-21A, “A1”, FRN, 0%, 7/27/2026 | | 2/17/17 | | | $8,305,747 | | | | $8,305,747 | |
| % of Net assets | | | | | | | | | 0.4% | |
The following abbreviations are used in this report and are defined:
| CLO | | Collateralized Loan Obligation |
| FRN | | Floating Rate Note. Interest rate resets periodically and the current rate may not be the rate reported at period end. |
| STRIPS | | Separate Trading of Registered Interest and Principal of Securities |
16
Portfolio of Investments – continued
Derivative Contracts at 2/28/17
Futures Contracts at 2/28/17
| | | | | | | | | | | | | | | | | | |
| Description | | Currency | | | Contracts | | | Value | | Expiration
Date | | | Unrealized
Appreciation
(Depreciation) | |
| Asset Derivatives | | | | | | | | | | | | | | | | | | |
| Interest Rate Futures | | | | | | | | | | | | | | | | | | |
| U.S. Treasury Bond 30 yr (Long) | | | USD | | | | 15 | | | $2,274,844 | | | June - 2017 | | | | $18,124 | |
| | | | | | | | | | | | | | | | | | |
| Liability Derivatives | | | | | | | | | | | | | | | | | | |
| Interest Rate Futures | | | | | | | | | | | | | | | | | | |
| U.S. Treasury Note 5 yr (Long) | | | USD | | | | 185 | | | $21,775,078 | | | June - 2017 | | | | $(20,742 | ) |
| | | | | | | | | | | | | | | | | | |
At February 28, 2017, the fund had liquid securities with an aggregate value of $242,443 to cover any commitments for certain derivative contracts.
See Notes to Financial Statements
17
Financial Statements
STATEMENT OF ASSETS AND LIABILITIES
At 2/28/17
This statement represents your fund’s balance sheet, which details the assets and liabilities comprising the total value of the fund.
| | | | |
| Assets | | | | |
Investments | | | | |
Non-affiliated issuers, at value (identified cost, $2,063,992,300) | | | $2,079,304,994 | |
Underlying affiliated funds, at value (identified cost, $29,765,151) | | | 29,765,172 | |
Total investments, at value (identified cost, $2,093,757,451) | | | $2,109,070,166 | |
Receivables for | | | | |
Investments sold | | | 444,002 | |
Fund shares sold | | | 3,286,465 | |
Interest | | | 7,959,603 | |
Other assets | | | 9,414 | |
Total assets | | | $2,120,769,650 | |
| Liabilities | | | | |
Payables for | | | | |
Distributions | | | $490,509 | |
Daily variation margin on open futures contracts | | | 11,680 | |
Investments purchased | | | 10,135,380 | |
TBA purchase commitments | | | 12,819,443 | |
Fund shares reacquired | | | 1,818,065 | |
Payable to affiliates | | | | |
Investment adviser | | | 46,836 | |
Shareholder servicing costs | | | 642,272 | |
Distribution and service fees | | | 13,982 | |
Payable for independent Trustees’ compensation | | | 21,818 | |
Accrued expenses and other liabilities | | | 227,399 | |
Total liabilities | | | $26,227,384 | |
Net assets | | | $2,094,542,266 | |
| Net assets consist of | | | | |
Paid-in capital | | | $2,147,811,881 | |
Unrealized appreciation (depreciation) on investments | | | 15,310,097 | |
Accumulated net realized gain (loss) on investments | | | (71,985,205 | ) |
Undistributed net investment income | | | 3,405,493 | |
Net assets | | | $2,094,542,266 | |
Shares of beneficial interest outstanding | | | 213,052,398 | |
18
Statement of Assets and Liabilities – continued
| | | | | | | | | | | | |
| | | Net assets | | | Shares
outstanding | | | Net asset value
per share (a) | |
Class A | | | $685,255,674 | | | | 69,665,707 | | | | $9.84 | |
Class B | | | 18,013,030 | | | | 1,833,502 | | | | 9.82 | |
Class C | | | 41,824,069 | | | | 4,244,835 | | | | 9.85 | |
Class I | | | 43,439,303 | | | | 4,420,191 | | | | 9.83 | |
Class R1 | | | 3,264,696 | | | | 332,250 | | | | 9.83 | |
Class R2 | | | 111,122,940 | | | | 11,309,216 | | | | 9.83 | |
Class R3 | | | 88,434,114 | | | | 8,994,264 | | | | 9.83 | |
Class R4 | | | 64,370,655 | | | | 6,544,303 | | | | 9.84 | |
Class R6 (formerly Class R5) | | | 1,038,817,785 | | | | 105,708,130 | | | | 9.83 | |
| (a) | Maximum offering price per share was equal to the net asset value per share for all share classes, except for Class A, for which the maximum offering price per share was $10.28 [100 / 95.75 x $9.84]. On sales of $50,000 or more, the maximum offering price of Class A shares is reduced. A contingent deferred sales charge may be imposed on redemptions of Class A, Class B, and Class C shares. Redemption price per share was equal to the net asset value per share for Classes I, R1, R2, R3, R4, and R6. |
See Notes to Financial Statements
19
Financial Statements
STATEMENT OF OPERATIONS
Year ended 2/28/17
This statement describes how much your fund earned in investment income and accrued in expenses. It also describes any gains and/or losses generated by fund operations.
| | | | |
| Net investment income | | | | |
Income | | | | |
Interest | | | $61,259,283 | |
Dividends from underlying affiliated funds | | | 253,485 | |
Other | | | 5,468 | |
Total investment income | | | $61,518,236 | |
Expenses | | | | |
Management fee | | | $8,778,829 | |
Distribution and service fees | | | 3,407,803 | |
Shareholder servicing costs | | | 2,613,555 | |
Administrative services fee | | | 348,989 | |
Independent Trustees’ compensation | | | 51,126 | |
Custodian fee | | | 212,025 | |
Reimbursement of custodian expenses | | | (21,398 | ) |
Shareholder communications | | | 225,032 | |
Audit and tax fees | | | 61,589 | |
Legal fees | | | 20,571 | |
Miscellaneous | | | 252,306 | |
Total expenses | | | $15,950,427 | |
Fees paid indirectly | | | (294 | ) |
Reduction of expenses by investment adviser and distributor | | | (191,157 | ) |
Net expenses | | | $15,758,976 | |
Net investment income | | | $45,759,260 | |
| Realized and unrealized gain (loss) on investments | |
Realized gain (loss) (identified cost basis) | | | | |
Investments: | | | | |
Non-affiliated issuers | | | $(7,092,139 | ) |
Underlying affiliated funds | | | 140 | |
Futures contracts | | | 41,655 | |
Net realized gain (loss) on investments | | | $(7,050,344 | ) |
Change in unrealized appreciation (depreciation) | | | | |
Investments | | | $(57,313,998 | ) |
Futures contracts | | | 11,435 | |
Net unrealized gain (loss) on investments | | | $(57,302,563 | ) |
Net realized and unrealized gain (loss) on investments | | | $(64,352,907 | ) |
Change in net assets from operations | | | $(18,593,647 | ) |
See Notes to Financial Statements
20
Financial Statements
STATEMENTS OF CHANGES IN NET ASSETS
These statements describe the increases and/or decreases in net assets resulting from operations, any distributions, and any shareholder transactions.
| | | | | | | | |
| | | Year ended
2/28/17 | | | Year ended
2/29/16 | |
| Change in net assets | | | | | | |
| From operations | | | | | | | | |
Net investment income | | | $45,759,260 | | | | $40,790,397 | |
Net realized gain (loss) on investments | | | (7,050,344 | ) | | | (3,250,827 | ) |
Net unrealized gain (loss) on investments | | | (57,302,563 | ) | | | 672,718 | |
Change in net assets from operations | | | $(18,593,647 | ) | | | $38,212,288 | |
| Distributions declared to shareholders | | | | | | | | |
From net investment income | | | $(54,285,439 | ) | | | $(45,906,618 | ) |
Change in net assets from fund share transactions | | | $(9,494,486 | ) | | | $27,707,069 | |
Total change in net assets | | | $(82,373,572 | ) | | | $20,012,739 | |
| Net assets | | | | | | | | |
At beginning of period | | | 2,176,915,838 | | | | 2,156,903,099 | |
At end of period (including undistributed net investment income of $3,405,493 and $1,162,251, respectively) | | | $2,094,542,266 | | | | $2,176,915,838 | |
See Notes to Financial Statements
21
Financial Statements
FINANCIAL HIGHLIGHTS
The financial highlights table is intended to help you understand the fund’s financial performance for the past 5 years (or life of a particular share class, if shorter). Certain information reflects financial results for a single fund share. The total returns in the table represent the rate by which an investor would have earned (or lost) on an investment in the fund share class (assuming reinvestment of all distributions) held for the entire period.
| | | | | | | | | | | | | | | | | | | | |
| Class A | | Years ended 2/28, 2/29 | |
| | | 2017 | | | 2016 | | | 2015 | | | 2014 | | | 2013 | |
Net asset value, beginning of period | | | $10.17 | | | | $10.20 | | | | $10.05 | | | | $10.41 | | | | $10.54 | |
| Income (loss) from investment operations | | | | | | | | | |
Net investment income (d) | | | $0.19 | (c) | | | $0.18 | | | | $0.16 | | | | $0.18 | | | | $0.20 | |
Net realized and unrealized gain (loss) on investments | | | (0.29 | ) | | | (0.01 | ) | | | 0.20 | | | | (0.29 | ) | | | (0.02 | ) |
Total from investment operations | | | $(0.10 | ) | | | $0.17 | | | | $0.36 | | | | $(0.11 | ) | | | $0.18 | |
| Less distributions declared to shareholders | | | | | | | | | |
From net investment income | | | $(0.23 | ) | | | $(0.20 | ) | | | $(0.21 | ) | | | $(0.22 | ) | | | $(0.26 | ) |
From net realized gain on investments | | | — | | | | — | | | | — | | | | (0.03 | ) | | | (0.05 | ) |
Total distributions declared to shareholders | | | $(0.23 | ) | | | $(0.20 | ) | | | $(0.21 | ) | | | $(0.25 | ) | | | $(0.31 | ) |
Net asset value, end of period (x) | | | $9.84 | | | | $10.17 | | | | $10.20 | | | | $10.05 | | | | $10.41 | |
Total return (%) (r)(s)(t)(x) | | | (0.97 | )(c) | | | 1.69 | | | | 3.59 | | | | (1.00 | ) | | | 1.74 | |
Ratios (%) (to average net assets)
and Supplemental data: | | | | | | | | | | | | | | | | | |
Expenses before expense reductions (f) | | | 0.88 | (c) | | | 0.88 | | | | 0.88 | | | | 0.88 | | | | 0.87 | |
Expenses after expense reductions (f) | | | 0.86 | (c) | | | 0.87 | | | | 0.87 | | | | 0.87 | | | | 0.87 | |
Net investment income | | | 1.93 | (c) | | | 1.74 | | | | 1.58 | | | | 1.76 | | | | 1.88 | |
Portfolio turnover | | | 48 | | | | 88 | | | | 67 | | | | 112 | | | | 81 | |
Net assets at end of period (000 omitted) | | | $685,256 | | | | $719,585 | | | | $692,680 | | | | $698,251 | | | | $847,276 | |
See Notes to Financial Statements
22
Financial Highlights – continued
| | | | | | | | | | | | | | | | | | | | |
| Class B | | Years ended 2/28, 2/29 | |
| | | 2017 | | | 2016 | | | 2015 | | | 2014 | | | 2013 | |
Net asset value, beginning of period | | | $10.16 | | | | $10.19 | | | | $10.04 | | | | $10.39 | | | | $10.53 | |
| Income (loss) from investment operations | | | | | | | | | |
Net investment income (d) | | | $0.12 | (c) | | | $0.10 | | | | $0.08 | | | | $0.10 | | | | $0.12 | |
Net realized and unrealized gain (loss) on investments | | | (0.30 | ) | | | (0.01 | ) | | | 0.20 | | | | (0.27 | ) | | | (0.03 | ) |
Total from investment operations | | | $(0.18 | ) | | | $0.09 | | | | $0.28 | | | | $(0.17 | ) | | | $0.09 | |
| Less distributions declared to shareholders | | | | | | | | | |
From net investment income | | | $(0.16 | ) | | | $(0.12 | ) | | | $(0.13 | ) | | | $(0.15 | ) | | | $(0.18 | ) |
From net realized gain on investments | | | — | | | | — | | | | — | | | | (0.03 | ) | | | (0.05 | ) |
Total distributions declared to shareholders | | | $(0.16 | ) | | | $(0.12 | ) | | | $(0.13 | ) | | | $(0.18 | ) | | | $(0.23 | ) |
Net asset value, end of period (x) | | | $9.82 | | | | $10.16 | | | | $10.19 | | | | $10.04 | | | | $10.39 | |
Total return (%) (r)(s)(t)(x) | | | (1.82 | )(c) | | | 0.93 | | | | 2.82 | | | | (1.65 | ) | | | 0.88 | |
Ratios (%) (to average net assets)
and Supplemental data: | | | | | | | | | | | | | | | | | |
Expenses before expense reductions (f) | | | 1.63 | (c) | | | 1.63 | | | | 1.63 | | | | 1.63 | | | | 1.62 | |
Expenses after expense reductions (f) | | | 1.62 | (c) | | | 1.62 | | | | 1.62 | | | | 1.63 | | | | 1.62 | |
Net investment income | | | 1.18 | (c) | | | 0.99 | | | | 0.83 | | | | 1.00 | | | | 1.13 | |
Portfolio turnover | | | 48 | | | | 88 | | | | 67 | | | | 112 | | | | 81 | |
Net assets at end of period (000 omitted) | | | $18,013 | | | | $22,289 | | | | $23,857 | | | | $28,208 | | | | $44,012 | |
| |
| Class C | | Years ended 2/28, 2/29 | |
| | | 2017 | | | 2016 | | | 2015 | | | 2014 | | | 2013 | |
Net asset value, beginning of period | | | $10.19 | | | | $10.22 | | | | $10.07 | | | | $10.43 | | �� | | $10.57 | |
| Income (loss) from investment operations | | | | | | | | | |
Net investment income (d) | | | $0.12 | (c) | | | $0.10 | | | | $0.08 | | | | $0.10 | | | | $0.12 | |
Net realized and unrealized gain (loss) on investments | | | (0.30 | ) | | | (0.01 | ) | | | 0.20 | | | | (0.28 | ) | | | (0.02 | ) |
Total from investment operations | | | $(0.18 | ) | | | $0.09 | | | | $0.28 | | | | $(0.18 | ) | | | $0.10 | |
| Less distributions declared to shareholders | | | | | | | | | |
From net investment income | | | $(0.16 | ) | | | $(0.12 | ) | | | $(0.13 | ) | | | $(0.15 | ) | | | $(0.19 | ) |
From net realized gain on investments | | | — | | | | — | | | | — | | | | (0.03 | ) | | | (0.05 | ) |
Total distributions declared to shareholders | | | $(0.16 | ) | | | $(0.12 | ) | | | $(0.13 | ) | | | $(0.18 | ) | | | $(0.24 | ) |
Net asset value, end of period (x) | | | $9.85 | | | | $10.19 | | | | $10.22 | | | | $10.07 | | | | $10.43 | |
Total return (%) (r)(s)(t)(x) | | | (1.81 | )(c) | | | 0.93 | | | | 2.81 | | | | (1.73 | ) | | | 0.88 | |
Ratios (%) (to average net assets)
and Supplemental data: | | | | | | | | | | | | | | | | | |
Expenses before expense reductions (f) | | | 1.63 | (c) | | | 1.63 | | | | 1.63 | | | | 1.63 | | | | 1.62 | |
Expenses after expense reductions (f) | | | 1.62 | (c) | | | 1.62 | | | | 1.62 | | | | 1.63 | | | | 1.62 | |
Net investment income | | | 1.17 | (c) | | | 0.98 | | | | 0.82 | | | | 0.99 | | | | 1.13 | |
Portfolio turnover | | | 48 | | | | 88 | | | | 67 | | | | 112 | | | | 81 | |
Net assets at end of period (000 omitted) | | | $41,824 | | | | $49,104 | | | | $51,361 | | | | $58,229 | | | | $101,229 | |
See Notes to Financial Statements
23
Financial Highlights – continued
| | | | | | | | | | | | | | | | | | | | |
| Class I | | Years ended 2/28, 2/29 | |
| | | 2017 | | | 2016 | | | 2015 | | | 2014 | | | 2013 | |
Net asset value, beginning of period | | | $10.16 | | | | $10.20 | | | | $10.05 | | | | $10.41 | | | | $10.54 | |
| Income (loss) from investment operations | | | | | | | | | |
Net investment income (d) | | | $0.22 | (c) | | | $0.20 | | | | $0.18 | | | | $0.20 | | | | $0.25 | |
Net realized and unrealized gain (loss) on investments | | | (0.29 | ) | | | (0.02 | ) | | | 0.20 | | | | (0.28 | ) | | | (0.04 | ) |
Total from investment operations | | | $(0.07 | ) | | | $0.18 | | | | $0.38 | | | | $(0.08 | ) | | | $0.21 | |
| Less distributions declared to shareholders | | | | | | | | | |
From net investment income | | | $(0.26 | ) | | | $(0.22 | ) | | | $(0.23 | ) | | | $(0.25 | ) | | | $(0.29 | ) |
From net realized gain on investments | | | — | | | | — | | | | — | | | | (0.03 | ) | | | (0.05 | ) |
Total distributions declared to shareholders | | | $(0.26 | ) | | | $(0.22 | ) | | | $(0.23 | ) | | | $(0.28 | ) | | | $(0.34 | ) |
Net asset value, end of period (x) | | | $9.83 | | | | $10.16 | | | | $10.20 | | | | $10.05 | | | | $10.41 | |
Total return (%) (r)(s)(x) | | | (0.73 | )(c) | | | 1.85 | | | | 3.85 | | | | (0.75 | ) | | | 1.99 | |
Ratios (%) (to average net assets)
and Supplemental data: | | | | | | | | | | | | | | | | | |
Expenses before expense reductions (f) | | | 0.63 | (c) | | | 0.63 | | | | 0.63 | | | | 0.63 | | | | 0.59 | |
Expenses after expense reductions (f) | | | 0.62 | (c) | | | 0.62 | | | | 0.63 | | | | 0.63 | | | | 0.59 | |
Net investment income | | | 2.17 | (c) | | | 1.98 | | | | 1.80 | | | | 1.98 | | | | 2.33 | |
Portfolio turnover | | | 48 | | | | 88 | | | | 67 | | | | 112 | | | | 81 | |
Net assets at end of period (000 omitted) | | | $43,439 | | | | $42,563 | | | | $22,984 | | | | $20,974 | | | | $40,628 | |
| |
| Class R1 | | Years ended 2/28, 2/29 | |
| | | 2017 | | | 2016 | | | 2015 | | | 2014 | | | 2013 | |
Net asset value, beginning of period | | | $10.16 | | | | $10.19 | | | | $10.04 | | | | $10.40 | | | | $10.53 | |
| Income (loss) from investment operations | | | | | | | | | |
Net investment income (d) | | | $0.12 | (c) | | | $0.10 | | | | $0.08 | | | | $0.10 | | | | $0.12 | |
Net realized and unrealized gain (loss) on investments | | | (0.29 | ) | | | (0.01 | ) | | | 0.20 | | | | (0.28 | ) | | | (0.02 | ) |
Total from investment operations | | | $(0.17 | ) | | | $0.09 | | | | $0.28 | | | | $(0.18 | ) | | | $0.10 | |
| Less distributions declared to shareholders | | | | | | | | | |
From net investment income | | | $(0.16 | ) | | | $(0.12 | ) | | | $(0.13 | ) | | | $(0.15 | ) | | | $(0.18 | ) |
From net realized gain on investments | | | — | | | | — | | | | — | | | | (0.03 | ) | | | (0.05 | ) |
Total distributions declared to shareholders | | | $(0.16 | ) | | | $(0.12 | ) | | | $(0.13 | ) | | | $(0.18 | ) | | | $(0.23 | ) |
Net asset value, end of period (x) | | | $9.83 | | | | $10.16 | | | | $10.19 | | | | $10.04 | | | | $10.40 | |
Total return (%) (r)(s)(x) | | | (1.72 | )(c) | | | 0.93 | | | | 2.82 | | | | (1.74 | ) | | | 0.98 | |
Ratios (%) (to average net assets)
and Supplemental data: | | | | | | | | | | | | | | | | | |
Expenses before expense reductions (f) | | | 1.63 | (c) | | | 1.63 | | | | 1.63 | | | | 1.63 | | | | 1.62 | |
Expenses after expense reductions (f) | | | 1.62 | (c) | | | 1.62 | | | | 1.63 | | | | 1.63 | | | | 1.62 | |
Net investment income | | | 1.18 | (c) | | | 0.99 | | | | 0.82 | | | | 1.00 | | | | 1.14 | |
Portfolio turnover | | | 48 | | | | 88 | | | | 67 | | | | 112 | | | | 81 | |
Net assets at end of period (000 omitted) | | | $3,265 | | | | $4,671 | | | | $5,128 | | | | $5,345 | | | | $6,647 | |
See Notes to Financial Statements
24
Financial Highlights – continued
| | | | | | | | | | | | | | | | | | | | |
| Class R2 | | Years ended 2/28, 2/29 | |
| | | 2017 | | | 2016 | | | 2015 | | | 2014 | | | 2013 | |
Net asset value, beginning of period | | | $10.16 | | | | $10.19 | | | | $10.04 | | | | $10.40 | | | | $10.53 | |
| Income (loss) from investment operations | | | | | | | | | |
Net investment income (d) | | | $0.17 | (c) | | | $0.15 | | | | $0.13 | | | | $0.15 | | | | $0.17 | |
Net realized and unrealized gain (loss) on investments | | | (0.29 | ) | | | (0.01 | ) | | | 0.20 | | | | (0.28 | ) | | | (0.01 | ) |
Total from investment operations | | | $(0.12 | ) | | | $0.14 | | | | $0.33 | | | | $(0.13 | ) | | | $0.16 | |
| Less distributions declared to shareholders | | | | | | | | | |
From net investment income | | | $(0.21 | ) | | | $(0.17 | ) | | | $(0.18 | ) | | | $(0.20 | ) | | | $(0.24 | ) |
From net realized gain on investments | | | — | | | | — | | | | — | | | | (0.03 | ) | | | (0.05 | ) |
Total distributions declared to shareholders | | | $(0.21 | ) | | | $(0.17 | ) | | | $(0.18 | ) | | | $(0.23 | ) | | | $(0.29 | ) |
Net asset value, end of period (x) | | | $9.83 | | | | $10.16 | | | | $10.19 | | | | $10.04 | | | | $10.40 | |
Total return (%) (r)(s)(x) | | | (1.22 | )(c) | | | 1.44 | | | | 3.33 | | | | (1.25 | ) | | | 1.48 | |
Ratios (%) (to average net assets)
and Supplemental data: | | | | | | | | | | | | | | | | | |
Expenses before expense reductions (f) | | | 1.13 | (c) | | | 1.13 | | | | 1.13 | | | | 1.13 | | | | 1.12 | |
Expenses after expense reductions (f) | | | 1.12 | (c) | | | 1.12 | | | | 1.13 | | | | 1.13 | | | | 1.12 | |
Net investment income | | | 1.68 | (c) | | | 1.49 | | | | 1.33 | | | | 1.51 | | | | 1.63 | |
Portfolio turnover | | | 48 | | | | 88 | | | | 67 | | | | 112 | | | | 81 | |
Net assets at end of period (000 omitted) | | | $111,123 | | | | $122,117 | | | | $139,048 | | | | $142,396 | | | | $165,865 | |
| |
| Class R3 | | Years ended 2/28, 2/29 | |
| | | 2017 | | | 2016 | | | 2015 | | | 2014 | | | 2013 | |
Net asset value, beginning of period | | | $10.17 | | | | $10.20 | | | | $10.05 | | | | $10.40 | | | | $10.54 | |
| Income (loss) from investment operations | | | | | | | | | |
Net investment income (d) | | | $0.19 | (c) | | | $0.18 | | | | $0.16 | | | | $0.18 | | | | $0.20 | |
Net realized and unrealized gain (loss) on investments | | | (0.30 | ) | | | (0.01 | ) | | | 0.20 | | | | (0.28 | ) | | | (0.03 | ) |
Total from investment operations | | | $(0.11 | ) | | | $0.17 | | | | $0.36 | | | | $(0.10 | ) | | | $0.17 | |
| Less distributions declared to shareholders | | | | | | | | | |
From net investment income | | | $(0.23 | ) | | | $(0.20 | ) | | | $(0.21 | ) | | | $(0.22 | ) | | | $(0.26 | ) |
From net realized gain on investments | | | — | | | | — | | | | — | | | | (0.03 | ) | | | (0.05 | ) |
Total distributions declared to shareholders | | | $(0.23 | ) | | | $(0.20 | ) | | | $(0.21 | ) | | | $(0.25 | ) | | | $(0.31 | ) |
Net asset value, end of period (x) | | | $9.83 | | | | $10.17 | | | | $10.20 | | | | $10.05 | | | | $10.40 | |
Total return (%) (r)(s)(x) | | | (1.07 | )(c) | | | 1.69 | | | | 3.59 | | | | (0.90 | ) | | | 1.64 | |
Ratios (%) (to average net assets)
and Supplemental data: | | | | | | | | | | | | | | | | | |
Expenses before expense reductions (f) | | | 0.88 | (c) | | | 0.88 | | | | 0.88 | | | | 0.88 | | | | 0.87 | |
Expenses after expense reductions (f) | | | 0.87 | (c) | | | 0.87 | | | | 0.88 | | | | 0.87 | | | | 0.87 | |
Net investment income | | | 1.93 | (c) | | | 1.74 | | | | 1.57 | | | | 1.76 | | | | 1.88 | |
Portfolio turnover | | | 48 | | | | 88 | | | | 67 | | | | 112 | | | | 81 | |
Net assets at end of period (000 omitted) | | | $88,434 | | | | $109,531 | | | | $105,929 | | | | $98,701 | | | | $104,515 | |
See Notes to Financial Statements
25
Financial Highlights – continued
| | | | | | | | | | | | | | | | | | | | |
| Class R4 | | Years ended 2/28, 2/29 | |
| | | 2017 | | | 2016 | | | 2015 | | | 2014 | | | 2013 | |
Net asset value, beginning of period | | | $10.17 | | | | $10.21 | | | | $10.06 | | | | $10.41 | | | | $10.55 | |
| Income (loss) from investment operations | | | | | | | | | |
Net investment income (d) | | | $0.22 | (c) | | | $0.20 | | | | $0.18 | | | | $0.20 | | | | $0.22 | |
Net realized and unrealized gain (loss) on investments | | | (0.29 | ) | | | (0.02 | ) | | | 0.20 | | | | (0.27 | ) | | | (0.02 | ) |
Total from investment operations | | | $(0.07 | ) | | | $0.18 | | | | $0.38 | | | | $(0.07 | ) | | | $0.20 | |
| Less distributions declared to shareholders | | | | | | | | | |
From net investment income | | | $(0.26 | ) | | | $(0.22 | ) | | | $(0.23 | ) | | | $(0.25 | ) | | | $(0.29 | ) |
From net realized gain on investments | | | — | | | | — | | | | — | | | | (0.03 | ) | | | (0.05 | ) |
Total distributions declared to shareholders | | | $(0.26 | ) | | | $(0.22 | ) | | | $(0.23 | ) | | | $(0.28 | ) | | | $(0.34 | ) |
Net asset value, end of period (x) | | | $9.84 | | | | $10.17 | | | | $10.21 | | | | $10.06 | | | | $10.41 | |
Total return (%) (r)(s)(x) | | | (0.72 | )(c) | | | 1.85 | | | | 3.84 | | | | (0.65 | ) | | | 1.89 | |
Ratios (%) (to average net assets)
and Supplemental data: | | | | | | | | | | | | | | | | | |
Expenses before expense reductions (f) | | | 0.63 | (c) | | | 0.63 | | | | 0.63 | | | | 0.63 | | | | 0.62 | |
Expenses after expense reductions (f) | | | 0.62 | (c) | | | 0.62 | | | | 0.63 | | | | 0.62 | | | | 0.62 | |
Net investment income | | | 2.18 | (c) | | | 1.99 | | | | 1.82 | | | | 2.01 | | | | 2.10 | |
Portfolio turnover | | | 48 | | | | 88 | | | | 67 | | | | 112 | | | | 81 | |
Net assets at end of period (000 omitted) | | | $64,371 | | | | $86,552 | | | | $77,065 | | | | $70,549 | | | | $70,662 | |
| |
| Class R6 (formerly Class R5) | | Years ended 2/28, 2/29 | |
| | | 2017 | | | 2016 | | | 2015 | | | 2014 | | | 2013 (i) | |
Net asset value, beginning of period | | | $10.16 | | | | $10.20 | | | | $10.05 | | | | $10.40 | | | | $10.53 | |
| Income (loss) from investment operations | | | | | | | | | |
Net investment income (d) | | | $0.23 | (c) | | | $0.21 | | | | $0.20 | | | | $0.21 | | | | $0.13 | |
Net realized and unrealized gain (loss) on investments | | | (0.29 | ) | | | (0.01 | ) | | | 0.19 | | | | (0.27 | ) | | | (0.06 | ) |
Total from investment operations | | | $(0.06 | ) | | | $0.20 | | | | $0.39 | | | | $(0.06 | ) | | | $0.07 | |
| Less distributions declared to shareholders | | | | | | | | | |
From net investment income | | | $(0.27 | ) | | | $(0.24 | ) | | | $(0.24 | ) | | | $(0.26 | ) | | | $(0.20 | ) |
From net realized gain on investments | | | — | | | | — | | | | — | | | | (0.03 | ) | | | — | |
Total distributions declared to shareholders | | | $(0.27 | ) | | | $(0.24 | ) | | | $(0.24 | ) | | | $(0.29 | ) | | | $(0.20 | ) |
Net asset value, end of period (x) | | | $9.83 | | | | $10.16 | | | | $10.20 | | | | $10.05 | | | | $10.40 | |
Total return (%) (r)(s)(x) | | | (0.61 | )(c) | | | 1.96 | | | | 3.96 | | | | (0.54 | ) | | | 0.62 | (n) |
Ratios (%) (to average net assets)
and Supplemental data: | | | | | | | | | | | | | | | | | |
Expenses before expense reductions (f) | | | 0.51 | (c) | | | 0.52 | | | | 0.52 | | | | 0.51 | | | | 0.54 | (a) |
Expenses after expense reductions (f) | | | 0.50 | (c) | | | 0.51 | | | | 0.51 | | | | 0.51 | | | | 0.54 | (a) |
Net investment income | | | 2.30 | (c) | | | 2.10 | | | | 1.94 | | | | 2.13 | | | | 1.81 | (a) |
Portfolio turnover | | | 48 | | | | 88 | | | | 67 | | | | 112 | | | | 81 | |
Net assets at end of period (000 omitted) | | | $1,038,818 | | | | $1,020,504 | | | | $1,038,851 | | | | $943,761 | | | | $721,119 | |
See Notes to Financial Statements
26
Financial Highlights – continued
| (c) | Amount reflects a one-time reimbursement of expenses by the custodian (or former custodian) without which net investment income and performance would be lower and expenses would be higher. See Note 2 in the Notes to Financial Statements for additional information. |
| (d) | Per share data is based on average shares outstanding. |
| (f) | Ratios do not reflect reductions from fees paid indirectly, if applicable. |
| (i) | For the period from the class inception, July 2, 2012, through the stated period end. |
| (r) | Certain expenses have been reduced without which performance would have been lower. |
| (s) | From time to time the fund may receive proceeds from litigation settlements, without which performance would be lower. |
| (t) | Total returns do not include any applicable sales charges. |
| (x) | The net asset values and total returns have been calculated on net assets which include adjustments made in accordance with U.S. generally accepted accounting principles required at period end for financial reporting purposes. |
See Notes to Financial Statements
27
NOTES TO FINANCIAL STATEMENTS
(1) Business and Organization
MFS Government Securities Fund (the fund) is a diversified series of MFS Series Trust XIII (the trust). The trust is organized as a Massachusetts business trust and is registered under the Investment Company Act of 1940, as amended, as an open-end management investment company.
The fund is an investment company and accordingly follows the investment company accounting and reporting guidance of the Financial Accounting Standards Board (FASB) Accounting Standards Codification Topic 946 Financial Services – Investment Companies.
(2) Significant Accounting Policies
General – The preparation of financial statements in conformity with U.S. generally accepted accounting principles requires management to make estimates and assumptions that affect the reported amounts of assets and liabilities, and disclosure of contingent assets and liabilities at the date of the financial statements and the reported amounts of increases and decreases in net assets from operations during the reporting period. Actual results could differ from those estimates. In the preparation of these financial statements, management has evaluated subsequent events occurring after the date of the fund’s Statement of Assets and Liabilities through the date that the financial statements were issued.
In October 2016, the Securities and Exchange Commission (SEC) released its Final Rule on Investment Company Reporting Modernization (the “Rule”). The Rule, which introduces two new regulatory reporting forms for investment companies – Form N-PORT and Form N-CEN – also contains amendments to Regulation S-X which impact financial statement presentation, particularly the presentation of derivative investments. Although still evaluating the impacts of the Rule, management believes that many of the Regulation S-X amendments are consistent with the fund’s current financial statement presentation and expects that the fund will be able to comply with the Rule’s Regulation S-X amendments by the August 1, 2017 compliance date.
Balance Sheet Offsetting – The fund’s accounting policy with respect to balance sheet offsetting is that, absent an event of default by the counterparty or a termination of the agreement, the International Swaps and Derivatives Association (ISDA) Master Agreement does not result in an offset of reported amounts of financial assets and financial liabilities in the Statement of Assets and Liabilities across transactions between the fund and the applicable counterparty. The fund’s right to setoff may be restricted or prohibited by the bankruptcy or insolvency laws of the particular jurisdiction to which a specific master netting agreement counterparty is subject. Balance sheet offsetting disclosures, to the extent applicable to the fund, have been included in the fund’s Significant Accounting Policies note under the captions for each of the fund’s in-scope financial instruments and transactions.
Investment Valuations – Debt instruments and floating rate loans, including restricted debt instruments, are generally valued at an evaluated or composite bid as provided by a third-party pricing service. Short-term instruments with a maturity at issuance of 60 days or less may be valued at amortized cost, which approximates
28
Notes to Financial Statements – continued
market value. Futures contracts are generally valued at last posted settlement price on their primary exchange as provided by a third-party pricing service. Futures contracts for which there were no trades that day for a particular position are generally valued at the closing bid quotation on their primary exchange as provided by a third-party pricing service. Open-end investment companies are generally valued at net asset value per share. Securities and other assets generally valued on the basis of information from a third-party pricing service may also be valued at a broker/dealer bid quotation. Values obtained from third-party pricing services can utilize both transaction data and market information such as yield, quality, coupon rate, maturity, type of issue, trading characteristics, and other market data. The values of foreign securities and other assets and liabilities expressed in foreign currencies are converted to U.S. dollars using the mean of bid and asked prices for rates provided by a third-party pricing service.
The Board of Trustees has delegated primary responsibility for determining or causing to be determined the value of the fund’s investments (including any fair valuation) to the adviser pursuant to valuation policies and procedures approved by the Board. If the adviser determines that reliable market quotations are not readily available, investments are valued at fair value as determined in good faith by the adviser in accordance with such procedures under the oversight of the Board of Trustees. Under the fund’s valuation policies and procedures, market quotations are not considered to be readily available for most types of debt instruments and floating rate loans and many types of derivatives. These investments are generally valued at fair value based on information from third-party pricing services. In addition, investments may be valued at fair value if the adviser determines that an investment’s value has been materially affected by events occurring after the close of the exchange or market on which the investment is principally traded (such as foreign exchange or market) and prior to the determination of the fund’s net asset value, or after the halting of trading of a specific security where trading does not resume prior to the close of the exchange or market on which the security is principally traded. The adviser generally relies on third-party pricing services or other information (such as the correlation with price movements of similar securities in the same or other markets; the type, cost and investment characteristics of the security; the business and financial condition of the issuer; and trading and other market data) to assist in determining whether to fair value and at what value to fair value an investment. The value of an investment for purposes of calculating the fund’s net asset value can differ depending on the source and method used to determine value. When fair valuation is used, the value of an investment used to determine the fund’s net asset value may differ from quoted or published prices for the same investment. There can be no assurance that the fund could obtain the fair value assigned to an investment if it were to sell the investment at the same time at which the fund determines its net asset value per share.
Various inputs are used in determining the value of the fund’s assets or liabilities. These inputs are categorized into three broad levels. In certain cases, the inputs used to measure fair value may fall into different levels of the fair value hierarchy. In such cases, an investment’s level within the fair value hierarchy is based on the lowest level of input that is significant to the fair value measurement. The fund’s assessment of the significance of a particular input to the fair value measurement in its entirety requires judgment, and considers factors specific to the investment. Level 1 includes unadjusted
29
Notes to Financial Statements – continued
quoted prices in active markets for identical assets or liabilities. Level 2 includes other significant observable market-based inputs (including quoted prices for similar securities, interest rates, prepayment speed, and credit risk). Level 3 includes unobservable inputs, which may include the adviser’s own assumptions in determining the fair value of investments. Other financial instruments are derivative instruments not reflected in total investments, such as futures contracts. The following is a summary of the levels used as of February 28, 2017 in valuing the fund’s assets or liabilities:
| | | | | | | | | | | | | | | | |
| Investments at Value | | Level 1 | | | Level 2 | | | Level 3 | | | Total | |
| U.S. Treasury Bonds & U.S. Government Agency & Equivalents | | | $— | | | | $883,103,776 | | | | $— | | | | $883,103,776 | |
| Non-U.S. Sovereign Debt | | | — | | | | 3,277,885 | | | | — | | | | 3,277,885 | |
| U.S. Corporate Bonds | | | — | | | | 32,317,127 | | | | — | | | | 32,317,127 | |
| Residential Mortgage-Backed Securities | | | — | | | | 1,073,896,060 | | | | — | | | | 1,073,896,060 | |
| Commercial Mortgage-Backed Securities | | | — | | | | 61,849,313 | | | | — | | | | 61,849,313 | |
| Asset-Backed Securities (including CDOs) | | | — | | | | 16,827,122 | | | | — | | | | 16,827,122 | |
| Foreign Bonds | | | — | | | | 8,033,711 | | | | — | | | | 8,033,711 | |
| Mutual Funds | | | 29,765,172 | | | | — | | | | — | | | | 29,765,172 | |
| Total Investments | | | $29,765,172 | | | | $2,079,304,994 | | | | $— | | | | $2,109,070,166 | |
| | | | |
| Other Financial Instruments | | | | | | | | | | | | |
| Futures Contracts – Assets | | | $18,124 | | | | $— | | | | $— | | | | $18,124 | |
| Futures Contracts – Liabilities | | | (20,742 | ) | | | — | | | | — | | | | (20,742 | ) |
For further information regarding security characteristics, see the Portfolio of Investments.
Inflation-Adjusted Debt Securities – The fund invests in inflation-adjusted debt securities issued by the U.S. Treasury. The principal value of these debt securities is adjusted through income according to changes in the Consumer Price Index. These debt securities typically pay a fixed rate of interest, but this fixed rate is applied to the inflation-adjusted principal amount. The principal paid at maturity of the debt security is typically equal to the inflation-adjusted principal amount, or the security’s original par value, whichever is greater. Other types of inflation-adjusted securities may use other methods to adjust for other measures of inflation.
Derivatives – The fund uses derivatives for different purposes, primarily to increase or decrease exposure to a particular market or segment of the market, or security, to increase or decrease interest rate exposure, or as alternatives to direct investments. Derivatives are used for hedging or non-hedging purposes. While hedging can reduce or eliminate losses, it can also reduce or eliminate gains. When the fund uses derivatives as an investment to increase market exposure, or for hedging purposes, gains and losses from derivative instruments may be substantially greater than the derivative’s original cost.
The derivative instruments used by the fund were futures contracts. The fund’s period end derivatives, as presented in the Portfolio of Investments and the associated Derivative Contract tables, generally are indicative of the volume of its derivative activity during the period.
30
Notes to Financial Statements – continued
The following table presents, by major type of derivative contract, the fair value, on a gross basis, of the asset and liability components of derivatives held by the fund at February 28, 2017 as reported in the Statement of Assets and Liabilities:
| | | | | | | | | | |
| | | | | Fair Value (a) | |
| Risk | | Derivative Contracts | | Asset Derivatives | | | Liability Derivatives | |
| Interest Rate | | Interest Rate Futures | | $ | 18,124 | | | $ | (20,742 | ) |
| (a) | The value of futures contracts includes cumulative appreciation (depreciation) as reported in the fund’s Portfolio of Investments. Only the current day net variation margin for futures contracts is separately reported within the fund’s Statement of Assets and Liabilities. |
The following table presents, by major type of derivative contract, the realized gain (loss) on derivatives held by the fund for the year ended February 28, 2017 as reported in the Statement of Operations:
| | | | |
| Risk | | Futures Contracts | |
| Interest Rate | | | $41,655 | |
The following table presents, by major type of derivative contract, the change in unrealized appreciation (depreciation) on derivatives held by the fund for the year ended February 28, 2017 as reported in the Statement of Operations:
| | | | |
| Risk | | Futures Contracts | |
| Interest Rate | | | $11,435 | |
Derivative counterparty credit risk is managed through formal evaluation of the creditworthiness of all potential counterparties. On certain, but not all, uncleared derivatives, the fund attempts to reduce its exposure to counterparty credit risk whenever possible by entering into an ISDA Master Agreement on a bilateral basis. The ISDA Master Agreement gives each party to the agreement the right to terminate all transactions traded under such agreement if there is a certain deterioration in the credit quality of the other party. Upon an event of default or a termination of the ISDA Master Agreement, the non-defaulting party has the right to close out all transactions traded under such agreement and to net amounts owed under each agreement to one net amount payable by one party to the other. This right to close out and net payments across all transactions traded under the ISDA Master Agreement could result in a reduction of the fund’s credit risk to such counterparty equal to any amounts payable by the fund under the applicable transactions, if any.
Collateral and margin requirements differ by type of derivative. Margin requirements are set by the clearing broker and the clearing house for cleared derivatives (e.g., futures contracts, cleared swaps, and exchange-traded options) while collateral terms are contract specific for uncleared derivatives (e.g., forward foreign currency exchange contracts, uncleared swap agreements, and uncleared options). For derivatives traded under an ISDA Master Agreement, which contains a collateral support annex, the collateral requirements are netted across all transactions traded under such agreement and one amount is posted from one party to the other to collateralize such obligations. Cash that has been segregated to cover the fund’s collateral or margin obligations under derivative contracts, if any, will be reported separately in the Statement of Assets and Liabilities as “Restricted cash” or “Deposits
31
Notes to Financial Statements – continued
with brokers.” Securities pledged as collateral or margin for the same purpose, if any, are noted in the Portfolio of Investments. The fund may be required to make payments of interest on uncovered collateral or margin obligations with the broker. Any such payments are included in “Miscellaneous” expense in the Statement of Operations.
Futures Contracts – The fund entered into futures contracts which may be used to hedge against or obtain broad market exposure, interest rate exposure, or to manage duration. A futures contract represents a commitment for the future purchase or sale of an asset at a specified price on a specified date.
Upon entering into a futures contract, the fund is required to deposit with the broker, either in cash or securities, an initial margin in an amount equal to a certain percentage of the notional amount of the contract. Subsequent payments (variation margin) are made or received by the fund each day, depending on the daily fluctuations in the value of the contract, and are recorded for financial statement purposes as unrealized gain or loss by the fund until the contract is closed or expires at which point the gain or loss on futures contracts is realized.
The fund bears the risk of interest rates or securities prices moving unexpectedly, in which case, the fund may not achieve the anticipated benefits of the futures contracts and may realize a loss. While futures contracts may present less counterparty risk to the fund since the contracts are exchange traded and the exchange’s clearinghouse guarantees payments to the broker, there is still counterparty credit risk due to the insolvency of the broker. The fund’s maximum risk of loss due to counterparty credit risk is equal to the margin posted by the fund to the broker plus any gains or minus any losses on the outstanding futures contracts.
Dollar Roll Transactions – The fund enters into dollar roll transactions, with respect to mortgage-backed securities issued by Ginnie Mae, Fannie Mae, and Freddie Mac, in which the fund sells mortgage-backed securities to financial institutions and simultaneously agrees to purchase similar (same issuer, type and coupon) securities at a later date at an agreed-upon price. During the period between the sale and repurchase in a dollar roll transaction the fund will not be entitled to receive interest and principal payments on the securities sold but is compensated by interest earned on the proceeds of the initial sale and by a lower purchase price on the securities to be repurchased which enhances the fund’s total return. The fund accounts for dollar roll transactions as purchases and sales and realizes gains and losses on these transactions.
Indemnifications – Under the fund’s organizational documents, its officers and Trustees may be indemnified against certain liabilities and expenses arising out of the performance of their duties to the fund. Additionally, in the normal course of business, the fund enters into agreements with service providers that may contain indemnification clauses. The fund’s maximum exposure under these agreements is unknown as this would involve future claims that may be made against the fund that have not yet occurred.
Investment Transactions and Income – Investment transactions are recorded on the trade date. Interest income is recorded on the accrual basis. All premium and discount is amortized or accreted for financial statement purposes in accordance with U.S. generally accepted accounting principles. Inflation-indexed bonds are fixed-income securities whose principal value is periodically adjusted upward or downward based on
32
Notes to Financial Statements – continued
the rate of inflation. Interest is accrued based on the principal value, which is adjusted for inflation. Any increase or decrease in the principal amount of an inflation-indexed bond is generally recorded as an increase or decrease in interest income, respectively, even though the adjusted principal is not received until maturity. Interest payments received in additional securities are recorded on the ex-interest date in an amount equal to the value of the security on such date.
The fund may receive proceeds from litigation settlements. Any proceeds received from litigation involving portfolio holdings are reflected in the Statement of Operations in realized gain/loss if the security has been disposed of by the fund or in unrealized gain/loss if the security is still held by the fund. Any other proceeds from litigation not related to portfolio holdings are reflected as other income in the Statement of Operations.
The fund invests a significant portion of its assets in asset-backed and/or mortgage-backed securities. The value of these securities may depend, in part, on the issuer’s or borrower’s credit quality or ability to pay principal and interest when due and that value may fall if an issuer or borrower defaults on its obligation to pay principal or interest or if the instrument’s credit rating is downgraded by a credit rating agency. U.S. Government securities not supported as to the payment of principal or interest by the U.S. Treasury, such as those issued by Fannie Mae, Freddie Mac, and the Federal Home Loan Banks, are subject to greater credit risk than are U.S. Government securities supported by the U.S. Treasury, such as those issued by Ginnie Mae.
The fund purchased or sold debt securities on a when-issued or delayed delivery basis, or in a “To Be Announced” (TBA) or “forward commitment” transaction with delivery or payment to occur at a later date beyond the normal settlement period. At the time a fund enters into a commitment to purchase or sell a security, the transaction is recorded and the value of the security acquired is reflected in the fund’s net asset value. The price of such security and the date that the security will be delivered and paid for are fixed at the time the transaction is negotiated. The value of the security may vary with market fluctuations. TBA securities resulting from these transactions are included in the Portfolio of Investments. TBA purchase commitments are held at carrying amount, which approximates fair value and are categorized as level 2 within the fair value hierarchy. No interest accrues to the fund until payment takes place. At the time that a fund enters into this type of transaction, the fund is required to have sufficient cash and/or liquid securities to cover its commitments. Losses may arise due to changes in the value of the underlying securities or if the counterparty does not perform under the contract’s terms, or if the issuer does not issue the securities due to political, economic or other factors. Additionally, losses may arise due to declines in the value of the securities prior to settlement date.
To mitigate this risk of loss on TBA securities and other types of forward settling mortgage-backed securities, the fund whenever possible enters into a Master Securities Forward Transaction Agreement (“MSFTA”) on a bilateral basis with each of the counterparties with whom it undertakes a significant volume of transactions. The MSFTA gives each party to the agreement the right to terminate all transactions traded under such agreement if there is a certain deterioration in the credit quality of the other party. Upon an event of default or a termination of the MSFTA, the
33
Notes to Financial Statements – continued
non-defaulting party has the right to close out all transactions traded under such agreement and to net amounts owed under each transaction to one net amount payable by one party to the other. This right to close out and net payments across all transactions traded under the MSFTA could result in a reduction of the fund’s credit risk to such counterparty equal to any amounts payable by the fund under the applicable transactions, if any.
For mortgage-backed securities traded under a MSFTA, the collateral and margining requirements are contract specific. Collateral amounts across all transactions traded under such agreement are netted and one amount is posted from one party to the other to collateralize such obligations. Cash that has been pledged to cover the fund’s collateral or margin obligations under a MSFTA, if any, will be reported separately on the Statement of Assets and Liabilities as restricted cash. Securities pledged as collateral or margin for the same purpose, if any, are noted in the Portfolio of Investments.
Fees Paid Indirectly – The fund’s custody fee may be reduced by a credit earned under an arrangement that measures the value of U.S. dollars deposited with the custodian by the fund. The amount of the credit, for the year ended February 28, 2017, is shown as a reduction of total expenses in the Statement of Operations.
Reimbursement of Expenses by Custodian – In December 2015, the fund’s custodian (or former custodian), State Street Bank and Trust Company, announced that it intended to reimburse its asset servicing clients for expense amounts that it billed in error during the period 1998 through 2015. The amount of this one-time reimbursement attributable to the fund is reflected as “Reimbursement of custodian expenses” in the Statement of Operations.
Tax Matters and Distributions – The fund intends to qualify as a regulated investment company, as defined under Subchapter M of the Internal Revenue Code, and to distribute all of its taxable income, including realized capital gains. As a result, no provision for federal income tax is required. The fund’s federal tax returns, when filed, will remain subject to examination by the Internal Revenue Service for a three year period. Management has analyzed the fund’s tax positions taken on federal and state tax returns for all open tax years and does not believe that there are any uncertain tax positions that require recognition of a tax liability.
Distributions to shareholders are recorded on the ex-dividend date. Income and capital gain distributions are determined in accordance with income tax regulations, which may differ from U.S. generally accepted accounting principles. Certain capital accounts in the financial statements are periodically adjusted for permanent differences in order to reflect their tax character. These adjustments have no impact on net assets or net asset value per share. Temporary differences which arise from recognizing certain items of income, expense, gain or loss in different periods for financial statement and tax purposes will reverse at some time in the future. Distributions in excess of net investment income or net realized gains are temporary overdistributions for financial statement purposes resulting from differences in the recognition or classification of income or distributions for financial statement and tax purposes.
Book/tax differences primarily relate to amortization and accretion of debt securities and straddle loss deferrals.
34
Notes to Financial Statements – continued
The tax character of distributions declared to shareholders for the last two fiscal years is as follows:
| | | | | | | | |
| | | 2/28/17 | | | 2/29/16 | |
| Ordinary income (including any short-term capital gains) | | | $54,285,439 | | | | $45,906,618 | |
The federal tax cost and the tax basis components of distributable earnings were as follows:
| | | | |
| As of 2/28/17 | | | |
| Cost of investments | | | $2,128,103,102 | |
| Gross appreciation | | | 24,754,040 | |
| Gross depreciation | | | (43,786,976 | ) |
| Net unrealized appreciation (depreciation) | | | $(19,032,936 | ) |
| Undistributed ordinary income | | | 8,183,818 | |
| Capital loss carryforwards | | | (36,175,329 | ) |
| Other temporary differences | | | (6,245,168 | ) |
As of February 28, 2017, the fund had capital loss carryforwards available to offset future realized gains. These net capital losses may be carried forward indefinitely and their character is retained as short-term and/or long-term losses. Such losses are characterized as follows:
| | | | |
| Short-Term | | | $(10,409,971 | ) |
| Long-Term | | | (25,765,358 | ) |
| Total | | | $(36,175,329 | ) |
Multiple Classes of Shares of Beneficial Interest – The fund offers multiple classes of shares, which differ in their respective distribution and service fees. The fund’s income and common expenses are allocated to shareholders based on the value of settled shares outstanding of each class. The fund’s realized and unrealized gain (loss) are allocated to shareholders based on the daily net assets of each class. Dividends are declared separately for each class. Differences in per share dividend rates are generally due to differences in separate class expenses. Class B shares will convert to Class A
35
Notes to Financial Statements – continued
shares approximately eight years after purchase. The fund’s distributions declared to shareholders as reported in the Statements of Changes in Net Assets are presented by class as follows:
| | | | | | | | |
| | | From net investment
income | |
| | | Year
ended
2/28/17 | | | Year
ended
2/29/16 | |
| Class A | | | $16,911,235 | | | | $13,719,601 | |
| Class B | | | 337,034 | | | | 271,116 | |
| Class C | | | 751,462 | | | | 596,650 | |
| Class I | | | 1,267,576 | | | | 525,580 | |
| Class R1 | | | 62,281 | | | | 59,694 | |
| Class R2 | | | 2,447,287 | | | | 2,239,663 | |
| Class R3 | | | 2,437,496 | | | | 2,122,503 | |
| Class R4 | | | 1,849,270 | | | | 1,859,359 | |
| Class R6 (formerly Class R5) | | | 28,221,798 | | | | 24,512,452 | |
| Total | | | $54,285,439 | | | | $45,906,618 | |
Effective August 26, 2016, Class R5 shares were renamed Class R6 shares.
(3) Transactions with Affiliates
Investment Adviser – The fund has an investment advisory agreement with MFS to provide overall investment management and related administrative services and facilities to the fund. For the period March 1, 2016 to July 31, 2016, the management fee was computed daily and paid monthly at an annual rate of 0.40% of the fund’s average daily net assets. Effective August 1, 2016, the management fee is computed daily and paid monthly at the following annual rates:
| | | | |
| First $2.5 billion of average daily net assets | | | 0.40 | % |
| Average daily net assets in excess of $2.5 billion | | | 0.35 | % |
MFS has agreed in writing to reduce its management fee by a specified amount if certain MFS mutual fund assets exceed thresholds agreed to by MFS and the fund’s Board of Trustees. For the year ended February 28, 2017, this management fee reduction amounted to $154,728, which is included in the reduction of total expenses in the Statement of Operations. The management fee incurred for the year ended February 28, 2017 was equivalent to an annual effective rate of 0.39% of the fund’s average daily net assets.
Distributor – MFS Fund Distributors, Inc. (MFD), a wholly-owned subsidiary of MFS, as distributor, received $85,984 for the year ended February 28, 2017, as its portion of the initial sales charge on sales of Class A shares of the fund.
The Board of Trustees has adopted a distribution plan for certain share classes pursuant to Rule 12b-1 of the Investment Company Act of 1940.
36
Notes to Financial Statements – continued
The fund’s distribution plan provides that the fund will pay MFD for services provided by MFD and financial intermediaries in connection with the distribution and servicing of certain share classes. One component of the plan is a distribution fee paid to MFD and another component of the plan is a service fee paid to MFD. MFD may subsequently pay all, or a portion, of the distribution and/or service fees to financial intermediaries.
Distribution Plan Fee Table:
| | | | | | | | | | | | | | | | | | | | |
| | | Distribution
Fee Rate (d) | | | Service
Fee Rate (d) | | | Total
Distribution
Plan (d) | | | Annual
Effective
Rate (e) | | | Distribution
and Service
Fee | |
| Class A | | | — | | | | 0.25% | | | | 0.25% | | | | 0.24% | | | | $1,819,190 | |
| Class B | | | 0.75% | | | | 0.25% | | | | 1.00% | | | | 1.00% | | | | 215,505 | |
| Class C | | | 0.75% | | | | 0.25% | | | | 1.00% | | | | 1.00% | | | | 479,577 | |
| Class R1 | | | 0.75% | | | | 0.25% | | | | 1.00% | | | | 1.00% | | | | 40,083 | |
| Class R2 | | | 0.25% | | | | 0.25% | | | | 0.50% | | | | 0.50% | | | | 590,388 | |
| Class R3 | | | — | | | | 0.25% | | | | 0.25% | | | | 0.25% | | | | 263,060 | |
| Total Distribution and Service Fees | | | | | | | | | | | | $3,407,803 | |
| (d) | In accordance with the distribution plan for certain classes, the fund pays distribution and/or service fees equal to these annual percentage rates of each class’s average daily net assets. The distribution and service fee rates disclosed by class represent the current rates in effect at the end of the reporting period. Any rate changes, if applicable, are detailed below. |
| (e) | The annual effective rates represent actual fees incurred under the distribution plan for the year ended February 28, 2017 based on each class’s average daily net assets. MFD has voluntarily agreed to rebate a portion of each class’s 0.25% service fee attributable to accounts for which MFD retains the 0.25% service fee except for accounts attributable to MFS or its affiliates’ seed money. For the year ended February 28, 2017, this rebate amounted to $36,067, $332, and $30 for Class A, Class B, and Class C, respectively, and is included in the reduction of total expenses in the Statement of Operations. |
Certain Class A shares are subject to a contingent deferred sales charge (CDSC) in the event of a shareholder redemption within 18 months of purchase. Class C shares are subject to a CDSC in the event of a shareholder redemption within 12 months of purchase. Class B shares are subject to a CDSC in the event of a shareholder redemption within six years of purchase. All contingent deferred sales charges are paid to MFD and during the year ended February 28, 2017, were as follows:
| | | | |
| | | Amount | |
| Class A | | | $14,344 | |
| Class B | | | 39,363 | |
| Class C | | | 7,007 | |
Shareholder Servicing Agent – MFS Service Center, Inc. (MFSC), a wholly-owned subsidiary of MFS, receives a fee from the fund for its services as shareholder servicing agent calculated as a percentage of the average daily net assets of the fund as determined periodically under the supervision of the fund’s Board of Trustees. For the year ended February 28, 2017, the fee was $275,205, which equated to 0.0125% annually of the fund’s average daily net assets. MFSC also receives payment from the fund for out-of-pocket expenses, sub-accounting and other shareholder servicing costs which may be paid to affiliated and unaffiliated service providers. Class R6 shares do
37
Notes to Financial Statements – continued
not incur sub-accounting fees. For the year ended February 28, 2017, these out-of-pocket expenses, sub-accounting and other shareholder servicing costs amounted to $1,486,999.
Under a Special Servicing Agreement among MFS, certain MFS funds which invest in other MFS funds (“MFS fund-of-funds”) and certain underlying funds in which a MFS fund-of-funds invests (“underlying funds”), each underlying fund may pay a portion of each MFS fund-of-funds’ transfer agent-related expenses, including sub-accounting fees payable to financial intermediaries, to the extent such payments do not exceed the benefits realized or expected to be realized by the underlying fund from the investment in the underlying fund by the MFS fund-of-funds. For the year ended February 28, 2017, these costs for the fund amounted to $851,351 and are included in “Shareholder servicing costs” in the Statement of Operations.
Administrator – MFS provides certain financial, legal, shareholder communications, compliance, and other administrative services to the fund. Under an administrative services agreement, the fund reimburses MFS the costs incurred to provide these services. The fund is charged an annual fixed amount of $17,500 plus a fee based on average daily net assets. The administrative services fee incurred for the year ended February 28, 2017 was equivalent to an annual effective rate of 0.0159% of the fund’s average daily net assets.
Trustees’ and Officers’ Compensation – The fund pays compensation to independent Trustees in the form of a retainer, attendance fees, and additional compensation to Board and Committee chairpersons. The fund does not pay compensation directly to Trustees or officers of the fund who are also officers of the investment adviser, all of whom receive remuneration for their services to the fund from MFS. Certain officers and Trustees of the fund are officers or directors of MFS, MFD, and MFSC.
Prior to December 31, 2001, the fund had an unfunded defined benefit plan (“DB plan”) for independent Trustees. As of December 31, 2001, the Board took action to terminate the DB plan with respect to then-current and any future independent Trustees, such that the DB plan covers only certain of those former independent Trustees who retired on or before December 31, 2001. Effective January 1, 2002, accrued benefits under the DB plan for then-current independent Trustees who continued were credited to an unfunded retirement deferral plan (the “Retirement Deferral plan”), which was established for and exists solely with respect to these credited amounts, and is not available for other deferrals by these or other independent Trustees. Although the Retirement Deferral plan is unfunded, amounts deferred under the plan are periodically adjusted for investment experience as if they had been invested in shares of the fund. The DB plan resulted in a pension expense of $4,029 and the Retirement Deferral plan resulted in a net decrease in expense of $200. Both amounts are included in “Independent Trustees’ compensation” in the Statement of Operations for the year ended February 28, 2017. The liability for deferred retirement benefits payable to certain independent Trustees under both plans amounted to $21,763 at February 28, 2017, and is included in “Payable for independent Trustees’ compensation” in the Statement of Assets and Liabilities.
38
Notes to Financial Statements – continued
Other – This fund and certain other funds managed by MFS (the funds) have entered into a service agreement (the ISO Agreement) which provides for payment of fees solely by the funds to Tarantino LLC in return for the provision of services of an Independent Senior Officer (ISO) for the funds. Frank L. Tarantino serves as the ISO and is an officer of the funds and the sole member of Tarantino LLC. The funds can terminate the ISO Agreement with Tarantino LLC at any time under the terms of the ISO Agreement. For the year ended February 28, 2017, the fee paid by the fund under this agreement was $4,361 and is included in “Miscellaneous” expense in the Statement of Operations. MFS has agreed to bear all expenses associated with office space, other administrative support, and supplies provided to the ISO.
The fund invests in the MFS Institutional Money Market Portfolio which is managed by MFS and seeks current income consistent with preservation of capital and liquidity. This money market fund does not pay a management fee to MFS.
On September 9, 2015, MFS redeemed 14 shares of Class R3, 11 shares of Class R4, and 10,316 shares of Class R5, for an aggregate amount of $104,031. On March 16, 2016, MFS purchased 20,790 shares of Class I for an aggregate amount of $210,185.
(4) Portfolio Securities
For the year ended February 28, 2017, purchases and sales of investments, other than short-term obligations, were as follows:
| | | | | | | | |
| | | Purchases | | | Sales | |
| U.S. Government securities | | | $1,105,409,867 | | | | $979,702,513 | |
| Investments (non-U.S. Government securities) | | | $46,725,117 | | | | $55,171,546 | |
(5) Shares of Beneficial Interest
The fund’s Declaration of Trust permits the Trustees to issue an unlimited number of full and fractional shares of beneficial interest. Transactions in fund shares were as follows:
| | | | | | | | | | | | | | | | |
| | | Year ended
2/28/17 | | | Year ended
2/29/16 | |
| | | Shares | | | Amount | | | Shares | | | Amount | |
| Shares sold | | | | | | | | | | | | | | | | |
Class A | | | 21,865,280 | | | | $219,895,829 | | | | 18,960,613 | | | | $191,630,151 | |
Class B | | | 420,030 | | | | 4,253,002 | | | | 456,943 | | | | 4,612,496 | |
Class C | | | 1,077,678 | | | | 10,957,005 | | | | 1,468,425 | | | | 14,872,129 | |
Class I | | | 6,012,855 | | | | 60,589,197 | | | | 3,215,897 | | | | 32,534,100 | |
Class R1 | | | 80,749 | | | | 815,556 | | | | 77,244 | | | | 778,024 | |
Class R2 | | | 2,176,967 | | | | 21,922,218 | | | | 1,912,876 | | | | 19,318,511 | |
Class R3 | | | 3,393,322 | | | | 34,228,923 | | | | 3,141,005 | | | | 31,752,808 | |
Class R4 | | | 3,191,983 | | | | 32,364,425 | | | | 3,933,426 | | | | 39,718,005 | |
Class R6 (formerly Class R5) | | | 8,278,653 | | | | 83,505,749 | | | | 5,533,675 | | | | 55,981,186 | |
| | | 46,497,517 | | | | $468,531,904 | | | | 38,700,104 | | | | $391,197,410 | |
39
Notes to Financial Statements – continued
| | | | | | | | | | | | | | | | |
| | | Year ended
2/28/17 | | | Year ended
2/29/16 | |
| | | Shares | | | Amount | | | Shares | | | Amount | |
| Shares issued to shareholders in reinvestment of distributions | | | | | | | | | | | | | | | | |
Class A | | | 1,249,684 | | | | $12,588,044 | | | | 978,978 | | | | $9,892,849 | |
Class B | | | 32,377 | | | | 325,899 | | | | 25,754 | | | | 259,933 | |
Class C | | | 63,065 | | | | 636,300 | | | | 45,847 | | | | 464,084 | |
Class I | | | 102,357 | | | | 1,028,811 | | | | 34,989 | | | | 353,777 | |
Class R1 | | | 6,159 | | | | 62,042 | | | | 5,907 | | | | 59,624 | |
Class R2 | | | 227,461 | | | | 2,288,142 | | | | 208,950 | | | | 2,109,361 | |
Class R3 | | | 241,415 | | | | 2,432,790 | | | | 209,982 | | | | 2,121,368 | |
Class R4 | | | 111,549 | | | | 1,125,153 | | | | 132,443 | | | | 1,338,609 | |
Class R6 (formerly Class R5) | | | 2,794,221 | | | | 28,113,069 | | | | 2,423,773 | | | | 24,471,001 | |
| | | 4,828,288 | | | | $48,600,250 | | | | 4,066,623 | | | | $41,070,606 | |
| | | | |
| Shares reacquired | | | | | | | | | | | | | | | | |
Class A | | | (24,205,675 | ) | | | $(242,520,585 | ) | | | (17,060,665 | ) | | | $(172,311,769 | ) |
Class B | | | (813,330 | ) | | | (8,148,616 | ) | | | (629,081 | ) | | | (6,340,343 | ) |
Class C | | | (1,715,816 | ) | | | (17,248,140 | ) | | | (1,718,022 | ) | | | (17,377,821 | ) |
Class I | | | (5,883,278 | ) | | | (58,779,959 | ) | | | (1,315,942 | ) | | | (13,316,786 | ) |
Class R1 | | | (214,448 | ) | | | (2,168,845 | ) | | | (126,409 | ) | | | (1,274,534 | ) |
Class R2 | | | (3,115,804 | ) | | | (31,298,077 | ) | | | (3,741,521 | ) | | | (37,748,547 | ) |
Class R3 | | | (5,414,439 | ) | | | (54,397,251 | ) | | | (2,960,505 | ) | | | (29,886,977 | ) |
Class R4 | | | (5,268,733 | ) | | | (53,525,290 | ) | | | (3,106,733 | ) | | | (31,329,287 | ) |
Class R6 (formerly Class R5) | | | (5,798,590 | ) | | | (58,539,877 | ) | | | (9,410,858 | ) | | | (94,974,883 | ) |
| | | (52,430,113 | ) | | | $(526,626,640 | ) | | | (40,069,736 | ) | | | $(404,560,947 | ) |
| | | | |
| Net change | | | | | | | | | | | | | | | | |
Class A | | | (1,090,711 | ) | | | $(10,036,712 | ) | | | 2,878,926 | | | | $29,211,231 | |
Class B | | | (360,923 | ) | | | (3,569,715 | ) | | | (146,384 | ) | | | (1,467,914 | ) |
Class C | | | (575,073 | ) | | | (5,654,835 | ) | | | (203,750 | ) | | | (2,041,608 | ) |
Class I | | | 231,934 | | | | 2,838,049 | | | | 1,934,944 | | | | 19,571,091 | |
Class R1 | | | (127,540 | ) | | | (1,291,247 | ) | | | (43,258 | ) | | | (436,886 | ) |
Class R2 | | | (711,376 | ) | | | (7,087,717 | ) | | | (1,619,695 | ) | | | (16,320,675 | ) |
Class R3 | | | (1,779,702 | ) | | | (17,735,538 | ) | | | 390,482 | | | | 3,987,199 | |
Class R4 | | | (1,965,201 | ) | | | (20,035,712 | ) | | | 959,136 | | | | 9,727,327 | |
Class R6 (formerly Class R5) | | | 5,274,284 | | | | 53,078,941 | | | | (1,453,410 | ) | | | (14,522,696 | ) |
| | | (1,104,308 | ) | | | $(9,494,486 | ) | | | 2,696,991 | | | | $27,707,069 | |
Effective August 26, 2016, Class R5 shares were renamed Class R6 shares.
The fund is one of several mutual funds in which certain MFS funds may invest. The MFS funds do not invest in the underlying funds for the purpose of exercising management or control. At the end of the period, the MFS Moderate Allocation Fund, the MFS Conservative Allocation Fund, the MFS Lifetime Income Fund, the MFS Lifetime 2020 Fund, and the MFS Lifetime 2025 Fund were the owners of record of approximately 28%, 14%, 3%, 2%, and 1%, respectively, of the value of outstanding voting shares of the fund. In addition, the MFS Lifetime 2030 Fund was the owner of record of less than 1% of the value of outstanding voting shares of the fund.
40
Notes to Financial Statements – continued
(6) Line of Credit
The fund and certain other funds managed by MFS participate in a $1.25 billion unsecured committed line of credit, subject to a $1 billion sublimit, provided by a syndication of banks under a credit agreement. Borrowings may be made for temporary financing needs. Interest is charged to each fund, based on its borrowings, generally at a rate equal to the higher of the Overnight Federal Reserve funds rate or daily one month LIBOR plus an agreed upon spread. A commitment fee, based on the average daily, unused portion of the committed line of credit, is allocated among the participating funds at the end of each calendar quarter. In addition, the fund and other funds managed by MFS have established unsecured uncommitted borrowing arrangements with certain banks for temporary financing needs. Interest is charged to each fund, based on its borrowings, at a rate equal to the Overnight Federal Reserve funds rate plus an agreed upon spread. For the year ended February 28, 2017, the fund’s commitment fee and interest expense were $13,816 and $0, respectively, and are included in “Miscellaneous” expense in the Statement of Operations.
(7) Transactions in Underlying Affiliated Funds-Affiliated Issuers
An affiliated issuer may be considered one in which the fund owns 5% or more of the outstanding voting securities, or a company which is under common control. For the purposes of this report, the fund assumes the following to be an affiliated issuer:
| | | | | | | | | | | | | | | | |
| Underlying Affiliated Fund | | Beginning
Shares/Par
Amount | | | Acquisitions
Shares/Par
Amount | | | Dispositions
Shares/Par
Amount | | | Ending
Shares/Par
Amount | |
| MFS Institutional Money Market Portfolio | | | 163,241,753 | | | | 513,475,333 | | | | (646,951,914 | ) | | | 29,765,172 | |
| | | | |
| Underlying Affiliated Fund | | Realized
Gain (Loss) | | | Capital Gain
Distributions | | | Dividend
Income | | | Ending
Value | |
| MFS Institutional Money Market Portfolio | | | $140 | | | | $— | | | | $253,485 | | | | $29,765,172 | |
41
REPORT OF INDEPENDENT REGISTERED PUBLIC ACCOUNTING FIRM
To the Board of Trustees of MFS Series Trust XIII and the Shareholders of MFS Government Securities Fund:
We have audited the accompanying statement of assets and liabilities, including the portfolio of investments, of MFS Government Securities Fund (one of the series of MFS Series Trust XIII) (the “Fund”) as of February 28, 2017, and the related statement of operations for the year then ended, the statements of changes in net assets for each of the two years in the period then ended, and the financial highlights for each of the five years in the period then ended. These financial statements and financial highlights are the responsibility of the Fund’s management. Our responsibility is to express an opinion on these financial statements and financial highlights based on our audits.
We conducted our audits in accordance with the standards of the Public Company Accounting Oversight Board (United States). Those standards require that we plan and perform the audit to obtain reasonable assurance about whether the financial statements and financial highlights are free of material misstatement. The Fund is not required to have, nor were we engaged to perform, an audit of its internal control over financial reporting. Our audits included consideration of internal control over financial reporting as a basis for designing audit procedures that are appropriate in the circumstances, but not for the purpose of expressing an opinion on the effectiveness of the Fund’s internal control over financial reporting. Accordingly, we express no such opinion. An audit also includes examining, on a test basis, evidence supporting the amounts and disclosures in the financial statements, assessing the accounting principles used and significant estimates made by management, as well as evaluating the overall financial statement presentation. Our procedures included confirmation of securities owned as of February 28, 2017, by correspondence with the custodian and brokers; when replies were not received from brokers, we performed other auditing procedures. We believe that our audits provide a reasonable basis for our opinion.
In our opinion, such financial statements and financial highlights referred to above present fairly, in all material respects, the financial position of MFS Government Securities Fund as of February 28, 2017, the results of its operations for the year then ended, the changes in its net assets for each of the two years in the period then ended, and the financial highlights for each of the five years in the period then ended, in conformity with accounting principles generally accepted in the United States of America.
DELOITTE & TOUCHE LLP
Boston, Massachusetts
April 13, 2017
42
TRUSTEES AND OFFICERS — IDENTIFICATION AND BACKGROUND
The Trustees and Officers of the Trust, as of April 1, 2017, are listed below, together with their principal occupations during the past five years. (Their titles may have varied during that period.) The address of each Trustee and Officer is 111 Huntington Avenue, Boston, Massachusetts 02199-7618.
| | | | | | | | |
Name, Age | | Position(s) Held with Fund | | Trustee/Officer
Since (h) | | Principal
Occupations During the Past Five Years | | Other Directorships (j) |
| INTERESTED TRUSTEES |
Robert J. Manning (k) (age 53) | | Trustee | | February 2004 | | Massachusetts Financial Services Company, Executive Chairman (since January 2017); Director and Chairman of the Board; Chief Executive Officer (until 2015); Co-Chief Executive Officer (2015-2016) | | N/A |
Robin A. Stelmach (k) (age 55) | | Trustee | | January 2014 | | Massachusetts Financial Services Company, Vice Chair (since January 2017); Chief Operating Officer and Executive Vice President (until January 2017) | | N/A |
| INDEPENDENT TRUSTEES | | | | | | |
David H. Gunning
(age 74) | | Trustee and Chair of Trustees | | January 2004 | | Private investor | | Lincoln Electric Holdings, Inc., Director; Development Alternatives, Inc., Director/Non-Executive Chairman |
43
Trustees and Officers – continued
| | | | | | | | |
Name, Age | | Position(s) Held with Fund | | Trustee/Officer
Since (h) | | Principal
Occupations During the Past Five Years | | Other Directorships (j) |
Steven E. Buller
(age 65) | | Trustee | | February 2014 | | Chairman, Financial Accounting Standards Advisory Council (until 2015); Standing Advisory Group, Public Company Accounting Oversight Board, Member (until 2014); BlackRock, Inc. (investment management), Managing Director (until 2014), BlackRock Finco UK (investment management), Director (until 2014) | | N/A |
John A. Caroselli
(age 63) | | Trustee | | March 2017 | | JC Global Advisors, LLC, President; First Capital Corporation, Executive Vice President (until��2015) | | N/A |
Maureen R. Goldfarb
(age 61) | | Trustee | | January 2009 | | Private investor | | N/A |
Michael Hegarty
(age 72) | | Trustee | | December 2004 | | Private investor | | Rouse Properties Inc., Director; Capmark Financial Group Inc., Director (until 2015) |
John P. Kavanaugh
(age 62) | | Trustee and Vice Chair of Trustees | | January 2009 | | Private investor | | N/A |
Clarence Otis, Jr.
(age 61) | | Trustee | | March 2017 | | Darden Restaurants, Inc., Chief Executive Officer (until 2014) | | VF Corporation, Director; Verizon Communications, Inc., Director; Federal Reserve Bank of Atlanta, Director (until 2015) |
Maryanne L. Roepke
(age 61) | | Trustee | | May 2014 | | American Century Investments (investment management), Senior Vice President and Chief Compliance Officer (until 2014) | | N/A |
44
Trustees and Officers – continued
| | | | | | | | |
Name, Age | | Position(s) Held with Fund | | Trustee/Officer
Since (h) | | Principal
Occupations During the Past Five Years | | Other Directorships (j) |
Laurie J. Thomsen
(age 59) | | Trustee | | March 2005 | | Private investor | | The Travelers Companies, Director; Dycom Industries, Inc., Director |
| OFFICERS | | | | | | |
Christopher R. Bohane (k)
(age 43) | | Assistant Secretary and Assistant Clerk | | July 2005 | | Massachusetts Financial Services Company, Vice President and Assistant General Counsel | | N/A |
Kino Clark (k)
(age 48) | | Assistant Treasurer | | January 2012 | | Massachusetts Financial Services Company, Vice President | | N/A |
Thomas H. Connors (k)
(age 57) | | Assistant Secretary and Assistant Clerk | | September 2012 | | Massachusetts Financial Services Company, Vice President and Senior Counsel; Deutsche Investment Management Americas Inc. (financial service provider), Director and Senior Counsel (until 2012) | | N/A |
Ethan D. Corey (k)
(age 53) | | Assistant Secretary and Assistant Clerk | | July 2005 | | Massachusetts Financial Services Company, Senior Vice President and Associate General Counsel | | N/A |
David L. DiLorenzo (k)
(age 48) | | President | | July 2005 | | Massachusetts Financial Services Company, Senior Vice President | | N/A |
Brian E. Langenfeld (k)
(age 44) | | Assistant Secretary and Assistant Clerk | | June 2006 | | Massachusetts Financial Services Company, Vice President and Senior Counsel | | N/A |
Susan A. Pereira (k)
(age 46) | | Assistant Secretary and Assistant Clerk | | July 2005 | | Massachusetts Financial Services Company, Vice President and Senior Counsel | | N/A |
45
Trustees and Officers – continued
| | | | | | | | |
Name, Age | | Position(s) Held with Fund | | Trustee/Officer
Since (h) | | Principal
Occupations During the Past Five Years | | Other Directorships (j) |
Kasey L. Phillips (k)
(age 46) | | Assistant Treasurer | | September 2012 | | Massachusetts Financial Services Company, Vice President; Wells Fargo Funds Management, LLC, Senior Vice President, Fund Treasurer (until 2012) | | N/A |
Mark N. Polebaum (k)
(age 64) | | Secretary and Clerk | | January 2006 | | Massachusetts Financial Services Company, Executive Vice President; General Counsel and Secretary (until March 2017) | | N/A |
Matthew A. Stowe (k)
(age 42) | | Assistant Secretary and Assistant Clerk | | October 2014 | | Massachusetts Financial Services Company, Vice President and Assistant General Counsel | | N/A |
Frank L. Tarantino
(age 73) | | Independent Senior Officer | | June 2004 | | Tarantino LLC (provider of compliance services), Principal | | N/A |
Richard S. Weitzel (k)
(age 46) | | Assistant Secretary and Assistant Clerk | | October 2007 | | Massachusetts Financial Services Company, Senior Vice President and Associate General Counsel | | N/A |
Martin J. Wolin (k)
(age 49) | | Chief Compliance Officer | | July 2015 | | Massachusetts Financial Services Company, Senior Vice President and Chief Compliance Officer (since July 2015); Mercer (financial service provider), Chief Risk and Compliance Officer, North America and Latin America (until June 2015) | | N/A |
James O. Yost (k)
(age 56) | | Treasurer | | September 1990 | | Massachusetts Financial Services Company, Senior Vice President | | N/A |
46
Trustees and Officers – continued
| (h) | Date first appointed to serve as Trustee/officer of an MFS Fund. Each Trustee has served continuously since appointment unless indicated otherwise. For the period from December 15, 2004 until February 22, 2005, Mr. Manning served as Advisory Trustee. Prior to January 2012, Messrs. DiLorenzo and Yost served as Assistant Treasurers of the Funds. From January 2012 through December 2016, Messrs. DiLorenzo and Yost served as Treasurer and Deputy Treasurer of the Funds, respectively. |
| (j) | Directorships or trusteeships of companies required to report to the Securities and Exchange Commission (i.e., “public companies”). |
| (k) | “Interested person” of the Trust within the meaning of the Investment Company Act of 1940 (referred to as the 1940 Act), which is the principal federal law governing investment companies like the fund, as a result of a position with MFS. The address of MFS is 111 Huntington Avenue, Boston, Massachusetts 02199-7618. |
Each Trustee has been elected by shareholders and each Trustee and officer holds office until his or her successor is chosen and qualified or until his or her earlier death, resignation, retirement or removal. The Trust does not hold annual meetings for the purpose of electing Trustees, and Trustees are not elected for fixed terms. Messrs. Buller, Kavanaugh and Otis and Ms. Roepke are members of the Trust’s Audit Committee.
Each of the Fund’s Trustees and officers holds comparable positions with certain other funds of which MFS or a subsidiary is the investment adviser or distributor, and, in the case of the officers, with certain affiliates of MFS. As of April 1, 2017, except for Messrs. Caroselli and Otis, the Trustees served as board members of 136 funds within the MFS Family of Funds. As of April 1, 2017, Messrs. Caroselli and Otis served as board members of 125 funds within the MFS Family of Funds.
The Statement of Additional Information for a Fund includes further information about the Trustees and is available without charge upon request by calling 1-800-225-2606.
| | |
| Investment Adviser | | Custodian |
Massachusetts Financial Services Company
111 Huntington Avenue
Boston, MA 02199-7618 | | JPMorgan Chase Bank, NA 4 Metrotech Center New York, NY 11245 |
| Distributor | | Independent Registered Public Accounting Firm |
MFS Fund Distributors, Inc.
111 Huntington Avenue
Boston, MA 02199-7618 | | Deloitte & Touche LLP 200 Berkeley Street Boston, MA 02116 |
| Portfolio Manager | | |
Geoffrey Schechter | | |
47
PROXY VOTING POLICIES AND INFORMATION
MFS votes proxies on behalf of the fund pursuant to proxy voting policies and procedures that are available without charge, upon request, by calling 1-800-225-2606, by visiting mfs.com (once you have selected “Individual Investor” as your role, click on “Individual Investor Home” in the top navigation and then select “Learn More About Proxy Voting” under the “I want to…” header on the left hand column of the page), or by visiting the SEC’s Web site at http://www.sec.gov.
Information regarding how the fund voted proxies relating to portfolio securities during the most recent twelve-month period ended June 30 is available by August 31 of each year without charge by visiting mfs.com (once you have selected “Individual Investor” as your role, click on “Individual Investor Home” in the top navigation and then select “Learn More About Proxy Voting” under the “I want to…” header on the left hand column of the page), or by visiting the SEC’s Web site at http://www.sec.gov.
QUARTERLY PORTFOLIO DISCLOSURE
The fund will file a complete schedule of portfolio holdings with the Securities and Exchange Commission (the Commission) for the first and third quarters of each fiscal year on Form N-Q. A shareholder can obtain the quarterly portfolio holdings report at mfs.com. The fund’s Form N-Q is also available on the EDGAR database on the Commission’s Internet Web site at http://www.sec.gov, and may be reviewed and copied at the:
Public Reference Room
Securities and Exchange Commission
100 F Street, NE, Room 1580
Washington, D.C. 20549
Information on the operation of the Public Reference Room may be obtained by calling the Commission at 1-800-SEC-0330. Copies of the fund’s Form N-Q also may be obtained, upon payment of a duplicating fee, by electronic request at the following e-mail address: publicinfo@sec.gov or by writing the Public Reference Section at the above address.
FURTHER INFORMATION
From time to time, MFS may post important information about the fund or the MFS funds on the MFS web site (mfs.com). This information is available on mfs.com by following these steps once you have selected “Individual Investor” as your role: (1) Click on the “Individual Investor Home” in the top navigation and then select the “Announcements” option within the “Market Outlooks” drop down, or (2) Click on “Products & Services” and “Mutual Funds” and then choose the fund’s name in the “Select a fund” menu.
48
INFORMATION ABOUT FUND CONTRACTS AND LEGAL CLAIMS
The fund has entered into contractual arrangements with an investment adviser, administrator, distributor, shareholder servicing agent, 529 program manager (if applicable), and custodian who each provide services to the fund. Unless expressly stated otherwise, shareholders are not parties to, or intended beneficiaries of these contractual arrangements, and these contractual arrangements are not intended to create any shareholder right to enforce them against the service providers or to seek any remedy under them against the service providers, either directly or on behalf of the fund.
Under the Trust’s By-Laws and Declaration of Trust, any claims asserted against or on behalf of the MFS Funds, including claims against Trustees and Officers, must be brought in state and federal courts located within the Commonwealth of Massachusetts.
FEDERAL TAX INFORMATION (unaudited)
The fund will notify shareholders of amounts for use in preparing 2017 income tax forms in January 2018.
49
rev. 3/16
| | | | |
| | | |
FACTS | | WHAT DOES MFS DO WITH YOUR PERSONAL INFORMATION? | |  |
| | |
| Why? | | Financial companies choose how they share your personal information. Federal law gives consumers the right to limit some but not all sharing. Federal law also requires us to tell you how we collect, share, and protect your personal information. Please read this notice carefully to understand what we do. |
| | |
| What? | | The types of personal information we collect and share depend on the product or service you have with us. This information can include: • Social Security number and account balances • Account transactions and transaction history • Checking account information and wire transfer instructions When you are no longer our customer, we continue to share your information as described in this notice. |
| | |
| How? | | All financial companies need to share customers’ personal information to run their everyday business. In the section below, we list the reasons financial companies can share their customers’ personal information; the reasons MFS chooses to share; and whether you can limit this sharing. |
| | | | |
Reasons we can share your
personal information | | Does MFS
share? | | Can you limit
this sharing? |
For our everyday business purposes – such as to process your transactions, maintain your account(s), respond to court orders and legal investigations, or report to credit bureaus | | Yes | | No |
For our marketing purposes – to offer our products and services to you | | No | | We don’t share |
For joint marketing with other financial companies | | No | | We don’t share |
For our affiliates’ everyday business purposes – information about your transactions and experiences | | No | | We don’t share |
For our affiliates’ everyday business purposes – information about your creditworthiness | | No | | We don’t share |
| For nonaffiliates to market to you | | No | | We don’t share |
| | |
| Questions? | | Call 800-225-2606 or go to mfs.com. |
50
| | |
| Who we are |
| Who is providing this notice? | | MFS Funds, MFS Investment Management, MFS Institutional Advisors, Inc., and MFS Heritage Trust Company. |
| | |
| What we do |
| How does MFS protect my personal information? | | To protect your personal information from unauthorized access and use, we use security measures that comply with federal law. These measures include procedural, electronic, and physical safeguards for the protection of the personal information we collect about you. |
| How does MFS collect my personal information? | | We collect your personal information, for example, when you • open an account or provide account information • direct us to buy securities or direct us to sell your securities • make a wire transfer We also collect your personal information from others, such as credit bureaus, affiliates, or other companies. |
| Why can’t I limit all sharing? | | Federal law gives you the right to limit only • sharing for affiliates’ everyday business purposes – information about your creditworthiness • affiliates from using your information to market to you • sharing for nonaffiliates to market to you State laws and individual companies may give you additional rights to limit sharing. |
| | |
| Definitions |
| Affiliates | | Companies related by common ownership or control. They can be financial and nonfinancial companies. • MFS does not share personal information with affiliates, except for everyday business purposes as described on page one of this notice. |
| Nonaffiliates | | Companies not related by common ownership or control. They can be financial and nonfinancial companies. • MFS does not share with nonaffiliates so they can market to you. |
| Joint marketing | | A formal agreement between nonaffiliated financial companies that together market financial products or services to you. • MFS doesn’t jointly market. |
| | |
| Other important information |
| If you own an MFS product or receive an MFS service in the name of a third party such as a bank or broker-dealer, their privacy policy may apply to you instead of ours. |
51
Save paper with eDelivery.

| MFS® will send you prospectuses, |
reports, and proxies directly via e-mail so you will get information faster with less mailbox clutter.
To sign up:
1. Go to mfs.com.
2. Log in via MFS® Access.
3. Select eDelivery.
If you own your MFS fund shares through a financial institution or a retirement plan, MFS® TALK, MFS® Access, or eDelivery may not be available to you.
CONTACT
WEB SITE
mfs.com
MFS TALK
1-800-637-8255
24 hours a day
ACCOUNT SERVICE AND LITERATURE
Shareholders
1-800-225-2606
Financial advisors
1-800-343-2829
Retirement plan services
1-800-637-1255
MAILING ADDRESS
MFS Service Center, Inc.
P.O. Box 55824
Boston, MA 02205-5824
OVERNIGHT MAIL
MFS Service Center, Inc.
c/o Boston Financial Data Services
30 Dan Road
Canton, MA 02021-2809
ANNUAL REPORT
February 28, 2017

MFS® NEW DISCOVERY VALUE FUND

NDV-ANN
MFS® NEW DISCOVERY VALUE FUND
CONTENTS
The report is prepared for the general information of shareholders.
It is authorized for distribution to prospective investors only when preceded or accompanied by a current prospectus.
NOT FDIC INSURED • MAY LOSE VALUE • NO BANK GUARANTEE

LETTER FROM THE EXECUTIVE CHAIRMAN
Dear Shareholders:
Despite June’s unexpected vote by the United Kingdom to leave the European Union and the surprising result in November’s U.S. presidential election, most markets have
proved resilient. U.S. share prices quickly reversed post-Brexit declines, and indices reached new highs following the November elections. U.S. bond yields rose after Donald Trump’s victory on hopes that his proposed policy mix of lower taxes, increased spending on infrastructure and a lower regulatory burden on businesses will lift both U.S. economic growth and inflation. However, interest rates in most developed markets remain very low, with major central banks maintaining extremely accommodative monetary policies to reinvigorate slow-growing economies against a backdrop of still-low inflation. Even after the rise in yields following the election, interest rates remain low by historical standards.
Globally, economic growth has shown signs of recovery of late, led by the United States and the eurozone. Despite better growth, there are few immediate signs of worrisome inflation. Emerging market economies are recovering at a somewhat slower pace amid fears that restrictive U.S. trade policies could further hamper the already slow pace of global trade growth. Looking ahead, markets will have to contend with a series of European elections during 2017, which, depending on the outcome, could further call into question the future direction of the European Union.
At MFS®, we believe in a patient, long-term approach to investing. Viewing investments with a long lens makes it possible to filter out short-term market noise and focus on achieving solid risk-adjusted returns over a full market cycle.
In our view, such an approach, along with the professional guidance of a financial advisor, will help you reach your investment objectives.
Respectfully,

Robert J. Manning
Executive Chairman
MFS Investment Management
April 13, 2017
The opinions expressed in this letter are subject to change and may not be relied upon for investment advice. No forecasts can be guaranteed.
1
PORTFOLIO COMPOSITION
Portfolio structure

| | | | |
| Top ten holdings | | | | |
| El Paso Electric Co. | | | 1.8% | |
| First Interstate BancSystem, Inc. | | | 1.6% | |
| Portland General Electric Co. | | | 1.6% | |
| PNM Resources, Inc. | | | 1.6% | |
| LifePoint Health, Inc. | | | 1.5% | |
| Plexus Corp. | | | 1.5% | |
| Huntington Bancshares, Inc. | | | 1.5% | |
| Select Income, REIT | | | 1.4% | |
| Wintrust Financial Corp. | | | 1.4% | |
| Berkshire Hills Bancorp, Inc. | | | 1.4% | |
| | | | |
| Equity sectors | | | | |
| Financial Services | | | 35.1% | |
| Industrial Goods & Services | | | 11.6% | |
| Health Care | | | 7.3% | |
| Autos & Housing | | | 6.9% | |
| Basic Materials | | | 6.3% | |
| Technology | | | 6.2% | |
| Utilities & Communications | | | 6.0% | |
| Energy | | | 4.4% | |
| Special Products & Services | | | 4.3% | |
| Retailing | | | 3.3% | |
| Transportation | | | 2.7% | |
| Consumer Staples | | | 2.7% | |
| Leisure | | | 2.0% | |
Cash & Cash Equivalents includes any cash, investments in money market funds, short-term securities, and other assets less liabilities. Please see the Statement of Assets and Liabilities for additional information related to the fund’s cash position and other assets and liabilities.
Percentages are based on net assets as of 2/28/17.
The portfolio is actively managed and current holdings may be different.
2
MANAGEMENT REVIEW
Summary of Results
For the twelve months ended February 28, 2017, Class A shares of the MFS New Discovery Value Fund (“fund”) provided a total return of 37.22%, at net asset value. This compares with a return of 41.29% for the fund’s benchmark, the Russell 2000® Value Index.
Market Environment
Global growth improved during much of the reporting period as oil prices recovered from their earlier plunge and fiscal and monetary stimulus from China took hold. Market confidence increased after the US elections in November in anticipation of lower taxes, a lighter regulatory burden and increased infrastructure spending, boosting US equities and bond yields. The US Federal Reserve increased interest rates by 25 basis points at the end of the period, the second hike of the cycle which began in December 2015. Globally, however, central bank policy remained highly accommodative, which forced many government, and even some corporate, bond yields into negative territory during the period. During the first half of the period, the United Kingdom voted to leave the European Union (“EU”), beginning a multi-year process of negotiation in order to achieve “Brexit.” While markets initially reacted to the vote with alarm, the spillover to European and emerging market (“EM”) economies was relatively short-lived, although risks of further hits to EU cohesiveness could re-emerge.
Headwinds from lower energy and commodity prices abated during the period as stabilizing oil prices helped push energy earnings higher relative to expectations. A sharp rise in the US dollar was an earnings headwind for multinationals. US consumer spending held up well during the second half of the period amid a modest increase in real wages and relatively low gasoline prices. Demand for autos reached near-record territory, while the housing market continued its recovery. Global trade, which was sluggish early in the period, showed signs of improvement in the period’s second half and EM countries began to show signs of a modest upturn in activity along with adjustment in their external accounts. These improved conditions appeared to have reassured investors and contributed to record inflows into the asset class during July and August as negative yields for an increasing share of developed market bonds drove yield-hungry investors further out on the risk spectrum. Similar investor inflows were experienced in the investment grade and high yield corporate markets. Late in the reporting period, however, new challenges emerged for emerging markets debt (“EMD”) as a result of the US presidential election, which raised concerns about the potential for a protectionist turn in US trade policy which could negatively impact EM economies. These concerns, along with rising expectations for US growth, inflation and interest rates, have turned the tables on flows into EMD. Since the election, flows have reversed. As of the end of the period, the markets seemed to be in “wait-and-see” mode, looking for evidence to either confirm or refute the repricing of risk that has occurred since Election Day.
3
Management Review – continued
Detractors from Performance
Weak stock selection within both the technology and basic materials sectors detracted from performance relative to the Russell 2000® Value Index. Within the technology sector, not owning shares of global semiconductor company Advanced Micro Devices, and the fund’s position in data recording products provider NICE Systems (b) (Israel), weighed on relative returns. Within the basic materials sector, the fund’s ownership of packaging solutions provider Graphic Packaging Holding (b) held back relative returns owing primarily to softer volumes and lowered full-year guidance.
Security selection within both the health care and energy sectors also hindered relative results. Within the health care sector, the fund’s ownership of health facilities operator LifePoint Health (b) and physician services provider MEDNAX (b) dampened relative performance. Shares of LifePoint Health were negatively affected by weak earnings results that missed market expectations following disappointing physician turnover and earlier-than-expected expenses linked to previously acquired hospitals. Within the energy sector, the fund’s position in tubular services provider Frank’s International (b) further detracted from relative returns.
Elsewhere, the fund’s overweight positions in decorative home accessories retailer Tuesday Morning, automotive parts provider Fenix Parts and travel and tourism commerce provider Travelport Worldwide weakened relative returns. Shares of Tuesday Morning depreciated in the second half of the reporting period owing to weaker-than-anticipated margins, moderate same-store sales growth and higher-than-anticipated selling, general & administrative (SG&A) expenses. The share price of Fenix Parts also detracted during the period as a result of a number of setbacks, in particular, goodwill impairment and inventory write-downs that negatively impacted the company’s borrowing base.
The fund’s cash and/or cash equivalents position during the period detracted from relative performance. Under normal market conditions, the fund strives to be fully invested and generally holds cash to buy new holdings and to provide liquidity. In a period when markets rose, as measured by the fund’s benchmark, holding cash hurt performance versus the benchmark, which has no cash position.
Contributors to Performance
Strong stock selection within the financial services sector aided relative performance. Within this sector, overweight positions in banking services providers Texas Capital Bancshares, First Interstate BancSystem and Wintrust Financial boosted relative returns. Shares of Texas Capital Bancshares grew on positive results from the company’s mortgage finance segment, increased spread revenues and fees as well as lowered operating expenses. Additionally, the fund’s positions in financial services provider East West Bancorp (b) and insurance company Allied World Assurance (b)(h) also helped relative results. The share price of East West Bancorp appreciated towards the end of the calendar year owing to stronger loan growth and an increase in core net interest margins. Additionally, shares of US financial firms rallied post the US presidential election on expectations of a more favorable regulatory, tax and rates environment.
Stocks in other sectors that contributed to relative performance included overweight positions in chemicals manufacturers, Ingevity and Univar, and oil and gas services
4
Management Review – continued
provider Forum Energy Technologies (h). Shares of Ingevity grew consistently since the stock went public in May, driven partially by strong performance within the company’s materials division. The share price of Univar rallied toward the end of the calendar year on the back of better-than-expected earnings driven by robust domestic sales. Additionally, the timing of the fund’s ownership in shares of cinemas operator Carmike Cinemas (h) and the fund’s holding of bakery company Hostess Brands (b) also aided relative returns.
Respectfully,
Kevin Schmitz
Portfolio Manager
| (b) | Security is not a benchmark constituent. |
| (h) | Security was not held in the portfolio at period end. |
The views expressed in this report are those of the portfolio manager only through the end of the period of the report as stated on the cover and do not necessarily reflect the views of MFS or any other person in the MFS organization. These views are subject to change at any time based on market or other conditions, and MFS disclaims any responsibility to update such views. These views may not be relied upon as investment advice or an indication of trading intent on behalf of any MFS portfolio. References to specific securities are not recommendations of such securities, and may not be representative of any MFS portfolio’s current or future investments.
5
PERFORMANCE SUMMARY THROUGH 2/28/17
The following chart illustrates a representative class of the fund’s historical performance in comparison to its benchmark(s). Performance results include the deduction of the maximum applicable sales charge and reflect the percentage change in net asset value, including reinvestment of dividends and capital gains distributions. The performance of other share classes will be greater than or less than that of the class depicted below. Benchmarks are unmanaged and may not be invested in directly. Benchmark returns do not reflect sales charges, commissions or expenses. (See Notes to Performance Summary.)
Performance data shown represents past performance and is no guarantee of future results. Investment return and principal value fluctuate so your shares, when sold, may be worth more or less than the original cost; current performance may be lower or higher than quoted. The performance shown does not reflect the deduction of taxes, if any, that a shareholder would pay on fund distributions or the redemption of fund shares.
Growth of a Hypothetical $10,000 Investment (t)
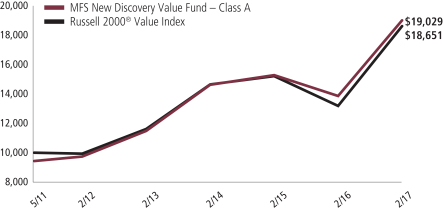
6
Performance Summary – continued
Total Returns through 2/28/17
Average annual without sales charge
| | | | | | | | | | | | |
| | | Share Class | | Class Inception Date | | 1-yr | | 5-yr | | Life (t) | | |
| | | A | | 5/26/11 | | 37.22% | | 14.36% | | 12.96% | | |
| | | B | | 5/26/11 | | 36.17% | | 13.52% | | 12.12% | | |
| | | C | | 5/26/11 | | 36.17% | | 13.51% | | 12.12% | | |
| | | I | | 5/26/11 | | 37.54% | | 14.64% | | 13.23% | | |
| | | R1 | | 5/26/11 | | 36.19% | | 13.50% | | 12.12% | | |
| | | R2 | | 5/26/11 | | 36.81% | | 14.09% | | 12.68% | | |
| | | R3 | | 5/26/11 | | 37.11% | | 14.36% | | 12.96% | | |
| | | R4 | | 5/26/11 | | 37.46% | | 14.66% | | 13.25% | | |
| | | R6 (formerly Class R5) | | 7/02/12 | | 37.68% | | N/A | | 15.77% | | |
| Comparative benchmark | | |
| | | Russell 2000® Value Index (f) | | 41.29% | | 13.43% | | 11.41% | | |
| Average annual with sales charge | | |
| | | A
With Initial Sales Charge (5.75%) | | 29.33% | | 13.01% | | 11.81% | | |
| | | B
With CDSC (Declining over six years from 4% to 0%) (v) | | 32.17% | | 13.27% | | 12.01% | | |
| | | C
With CDSC (1% for 12 months) (v) | | 35.17% | | 13.51% | | 12.12% | | |
CDSC – Contingent Deferred Sales Charge.
Class I, R1, R2, R3, R4, and R6 shares do not have a sales charge.
Effective August 26, 2016, Class R5 shares were renamed Class R6 shares.
| (f) | Source: FactSet Research Systems Inc. |
| (t) | For the period from the class inception date through the stated period end. The comparative benchmark performance information provided for the “life” period is from the inception date of the Class A shares. (See Notes to Performance Summary.) |
| (v) | Assuming redemption at the end of the applicable period. |
Benchmark Definition
Russell 2000® Value Index – a market-capitalization-weighted, value-oriented index that measures the performance of small-capitalization stocks that have relatively low price-to-book ratios and lower forecasted growth values. The Russell 2000® Value Index is a trademark/service mark of the Frank Russell Company. Russell® is a trademark of the Frank Russell Company.
It is not possible to invest directly in an index.
Notes to Performance Summary
Average annual total return represents the average annual change in value for each share class for the periods presented. Life returns are presented where the share class
7
Performance Summary – continued
has less than 10 years of performance history and represent the average annual total return from the class inception date to the stated period end date. As the fund’s share classes may have different inception dates, the life returns may represent different time periods and may not be comparable.
Performance results reflect any applicable expense subsidies and waivers in effect during the periods shown. Without such subsidies and waivers the fund’s performance results would be less favorable. Please see the prospectus and financial statements for complete details.
Performance results do not include adjustments made for financial reporting purposes in accordance with U.S. generally accepted accounting principles and may differ from amounts reported in the financial highlights.
From time to time the fund may receive proceeds from litigation settlements, without which performance would be lower.
8
EXPENSE TABLE
Fund expenses borne by the shareholders during the period, September 1, 2016 through February 28, 2017
As a shareholder of the fund, you incur two types of costs: (1) transaction costs, including sales charges (loads) on certain purchase or redemption payments, and (2) ongoing costs, including management fees; distribution and service (12b-1) fees; and other fund expenses. This example is intended to help you understand your ongoing costs (in dollars) of investing in the fund and to compare these costs with the ongoing costs of investing in other mutual funds.
The example is based on an investment of $1,000 invested at the beginning of the period and held for the entire period September 1, 2016 through February 28, 2017.
Actual Expenses
The first line for each share class in the following table provides information about actual account values and actual expenses. You may use the information in this line, together with the amount you invested, to estimate the expenses that you paid over the period. Simply divide your account value by $1,000 (for example, an $8,600 account value divided by $1,000 = 8.6), then multiply the result by the number in the first line under the heading entitled “Expenses Paid During Period” to estimate the expenses you paid on your account during this period.
Hypothetical Example for Comparison Purposes
The second line for each share class in the following table provides information about hypothetical account values and hypothetical expenses based on the fund’s actual expense ratio and an assumed rate of return of 5% per year before expenses, which is not the fund’s actual return. The hypothetical account values and expenses may not be used to estimate the actual ending account balance or expenses you paid for the period. You may use this information to compare the ongoing costs of investing in the fund and other funds. To do so, compare this 5% hypothetical example with the 5% hypothetical examples that appear in the shareholder reports of the other funds.
Please note that the expenses shown in the table are meant to highlight your ongoing costs only and do not reflect any transactional costs, such as sales charges (loads). Therefore, the second line for each share class in the table is useful in comparing ongoing costs only, and will not help you determine the relative total costs of owning different funds. In addition, if these transactional costs were included, your costs would have been higher.
9
Expense Table – continued
| | | | | | | | | | | | | | | | | | |
Share
Class | | | | Annualized
Expense
Ratio | | | Beginning
Account Value
9/01/16 | | | Ending
Account Value
2/28/17 | | | Expenses
Paid During
Period (p)
9/01/16-2/28/17 | |
| A | | Actual | | | 1.39% | | | | $1,000.00 | | | | $1,150.77 | | | | $7.41 | |
| | Hypothetical (h) | | | 1.39% | | | | $1,000.00 | | | | $1,017.90 | | | | $6.95 | |
| B | | Actual | | | 2.14% | | | | $1,000.00 | | | | $1,146.64 | | | | $11.39 | |
| | Hypothetical (h) | | | 2.14% | | | | $1,000.00 | | | | $1,014.18 | | | | $10.69 | |
| C | | Actual | | | 2.14% | | | | $1,000.00 | | | | $1,146.70 | | | | $11.39 | |
| | Hypothetical (h) | | | 2.14% | | | | $1,000.00 | | | | $1,014.18 | | | | $10.69 | |
| I | | Actual | | | 1.14% | | | | $1,000.00 | | | | $1,152.34 | | | | $6.08 | |
| | Hypothetical (h) | | | 1.14% | | | | $1,000.00 | | | | $1,019.14 | | | | $5.71 | |
| R1 | | Actual | | | 2.14% | | | | $1,000.00 | | | | $1,146.78 | | | | $11.39 | |
| | Hypothetical (h) | | | 2.14% | | | | $1,000.00 | | | | $1,014.18 | | | | $10.69 | |
| R2 | | Actual | | | 1.64% | | | | $1,000.00 | | | | $1,149.06 | | | | $8.74 | |
| | Hypothetical (h) | | | 1.64% | | | | $1,000.00 | | | | $1,016.66 | | | | $8.20 | |
| R3 | | Actual | | | 1.39% | | | | $1,000.00 | | | | $1,150.40 | | | | $7.41 | |
| | Hypothetical (h) | | | 1.39% | | | | $1,000.00 | | | | $1,017.90 | | | | $6.95 | |
| R4 | | Actual | | | 1.14% | | | | $1,000.00 | | | | $1,152.09 | | | | $6.08 | |
| | Hypothetical (h) | | | 1.14% | | | | $1,000.00 | | | | $1,019.14 | | | | $5.71 | |
| R6 | | Actual | | | 0.98% | | | | $1,000.00 | | | | $1,153.52 | | | | $5.23 | |
| | Hypothetical (h) | | | 0.98% | | | | $1,000.00 | | | | $1,019.93 | | | | $4.91 | |
| (h) | 5% class return per year before expenses. |
| (p) | “Expenses Paid During Period” are equal to each class’s annualized expense ratio, as shown above, multiplied by the average account value over the period, multiplied by 181/365 (to reflect the one-half year period). Expenses paid do not include any applicable sales charges (loads). If these transaction costs had been included, your costs would have been higher. |
10
PORTFOLIO OF INVESTMENTS
2/28/17
The Portfolio of Investments is a complete list of all securities owned by your fund. It is categorized by broad-based asset classes.
| | | | | | | | |
| Common Stocks - 98.8% | | | | | | | | |
| Issuer | | Shares/Par | | | Value ($) | |
| Aerospace - 1.7% | | | | | | | | |
| Leidos Holdings, Inc. | | | 131,051 | | | $ | 6,985,018 | |
| ManTech International Corp., “A” | | | 209,758 | | | | 7,681,338 | |
| | | | | | | | |
| | | | $ | 14,666,356 | |
| Automotive - 0.1% | | | | | | | | |
| Fenix Parts, Inc. (a)(l) | | | 472,711 | | | $ | 945,422 | |
| | |
| Brokerage & Asset Managers - 2.4% | | | | | | | | |
| Apollo Global Management LLC, “A” | | | 373,810 | | | $ | 8,500,439 | |
| NASDAQ, Inc. | | | 87,814 | | | | 6,244,454 | |
| Raymond James Financial, Inc. | | | 77,341 | | | | 6,075,909 | |
| | | | | | | | |
| | | | $ | 20,820,802 | |
| Business Services - 2.7% | | | | | | | | |
| Conduent, Inc. (a) | | | 407,384 | | | $ | 6,554,809 | |
| Forrester Research, Inc. | | | 94,590 | | | | 3,452,535 | |
| PRA Group, Inc. (a) | | | 132,176 | | | | 5,392,781 | |
| Travelport Worldwide Ltd. | | | 642,958 | | | | 8,165,567 | |
| | | | | | | | |
| | | | $ | 23,565,692 | |
| Chemicals - 0.5% | | | | | | | | |
| Ingevity Corp. (a) | | | 78,516 | | | $ | 4,237,509 | |
| | |
| Computer Software - 0.3% | | | | | | | | |
| TiVo, Inc. | | | 120,291 | | | $ | 2,225,384 | |
| | |
| Computer Software - Systems - 2.9% | | | | | | | | |
| Model N, Inc. (a) | | | 437,723 | | | $ | 4,661,750 | |
| NICE Systems Ltd., ADR | | | 167,512 | | | | 11,432,694 | |
| Verint Systems, Inc. (a) | | | 246,053 | | | | 9,288,501 | |
| | | | | | | | |
| | | | $ | 25,382,945 | |
| Construction - 6.8% | | | | | | | | |
| Armstrong World Industries, Inc. (a) | | | 159,254 | | | $ | 7,325,684 | |
| GMS, Inc. (a) | | | 238,701 | | | | 7,180,126 | |
| Owens Corning | | | 200,450 | | | | 11,724,321 | |
| Siteone Landscape Supply, Inc. (a) | | | 274,729 | | | | 10,772,124 | |
| Toll Brothers, Inc. (a) | | | 343,664 | | | | 11,732,689 | |
| TopBuild Corp. (a) | | | 242,455 | | | | 10,178,261 | |
| | | | | | | | |
| | | | $ | 58,913,205 | |
11
Portfolio of Investments – continued
| | | | | | | | |
| Issuer | | Shares/Par | | | Value ($) | |
| Common Stocks - continued | | | | | | | | |
| Consumer Products - 1.2% | | | | | | | | |
| Sensient Technologies Corp. | | | 132,965 | | | $ | 10,629,222 | |
| | |
| Consumer Services - 0.5% | | | | | | | | |
| ServiceMaster Global Holdings, Inc. (a) | | | 105,886 | | | $ | 4,217,439 | |
| | |
| Containers - 2.3% | | | | | | | | |
| Berry Plastics Group, Inc. (a) | | | 189,638 | | | $ | 9,544,481 | |
| Graphic Packaging Holding Co. | | | 761,745 | | | | 10,169,296 | |
| | | | | | | | |
| | | | $ | 19,713,777 | |
| Electrical Equipment - 2.7% | | | | | | | | |
| MSC Industrial Direct Co., Inc., “A” | | | 87,453 | | | $ | 8,796,897 | |
| TriMas Corp. (a) | | | 383,976 | | | | 8,466,671 | |
| WESCO International, Inc. (a) | | | 90,643 | | | | 6,299,689 | |
| | | | | | | | |
| | | | $ | 23,563,257 | |
| Electronics - 3.0% | | | | | | | | |
| Integrated Device Technology, Inc. (a) | | | 205,524 | | | $ | 4,914,079 | |
| OSI Systems, Inc. (a) | | | 102,188 | | | | 7,707,019 | |
| Plexus Corp. (a) | | | 234,855 | | | | 13,168,320 | |
| | | | | | | | |
| | | | $ | 25,789,418 | |
| Energy - Independent - 1.7% | | | | | | | | |
| Cabot Oil & Gas Corp. | | | 204,994 | | | $ | 4,489,369 | |
| Energen Corp. (a) | | | 189,811 | | | | 9,965,078 | |
| | | | | | | | |
| | | | $ | 14,454,447 | |
| Engineering - Construction - 1.1% | | | | | | | | |
| KBR, Inc. | | | 625,615 | | | $ | 9,415,506 | |
| | |
| Entertainment - 0.8% | | | | | | | | |
| Parques Reunidos Servicios Centrales S.A.U. (a) | | | 411,929 | | | $ | 7,196,193 | |
| | |
| Food & Beverages - 1.5% | | | | | | | | |
| Cal-Maine Foods, Inc. (l) | | | 134,895 | | | $ | 5,119,265 | |
| TreeHouse Foods, Inc. (a) | | | 92,815 | | | | 7,896,700 | |
| | | | | | | | |
| | | | $ | 13,015,965 | |
| Health Maintenance Organizations - 0.6% | | | | | | | | |
| Molina Healthcare, Inc. (a) | | | 106,443 | | | $ | 5,163,550 | |
| | |
| Insurance - 5.7% | | | | | | | | |
| Aspen Insurance Holdings Ltd. | | | 190,947 | | | $ | 10,702,579 | |
| Everest Re Group Ltd. | | | 49,660 | | | | 11,677,052 | |
12
Portfolio of Investments – continued
| | | | | | | | |
| Issuer | | Shares/Par | | | Value ($) | |
| Common Stocks - continued | | | | | | | | |
| Insurance - continued | | | | | | | | |
| Hanover Insurance Group, Inc. | | | 101,188 | | | $ | 9,108,944 | |
| Safety Insurance Group, Inc. | | | 127,064 | | | | 9,021,544 | |
| Third Point Reinsurance Ltd. (a) | | | 472,599 | | | | 5,860,227 | |
| Validus Holdings Ltd. | | | 54,949 | | | | 3,168,359 | |
| | | | | | | | |
| | | | $ | 49,538,705 | |
| Leisure & Toys - 1.2% | | | | | | | | |
| Brunswick Corp. | | | 171,822 | | | $ | 10,290,420 | |
| | |
| Machinery & Tools - 4.4% | | | | | | | | |
| Allison Transmission Holdings, Inc. | | | 233,062 | | | $ | 8,385,571 | |
| Herman Miller, Inc. | | | 125,155 | | | | 3,729,619 | |
| ITT, Inc. | | | 136,792 | | | | 5,604,368 | |
| Regal Beloit Corp. | | | 159,117 | | | | 11,846,261 | |
| SPX FLOW, Inc. (a) | | | 251,749 | | | | 8,559,466 | |
| | | | | | | | |
| | | | $ | 38,125,285 | |
| Major Banks - 1.5% | | | | | | | | |
| Huntington Bancshares, Inc. | | | 918,627 | | | $ | 12,989,386 | |
| | |
| Medical & Health Technology & Services - 4.9% | | | | | | | | |
| Community Health Systems, Inc. (a) | | | 289,459 | | | $ | 2,822,225 | |
| HMS Holdings Corp. (a) | | | 374,619 | | | | 6,979,152 | |
| LifePoint Health, Inc. (a) | | | 208,490 | | | | 13,353,785 | |
| MEDNAX, Inc. (a) | | | 150,423 | | | | 10,708,613 | |
| Premier, Inc., “A” (a) | | | 285,076 | | | | 8,959,938 | |
| | | | | | | | |
| | | | $ | 42,823,713 | |
| Medical Equipment - 1.7% | | | | | | | | |
| Steris PLC | | | 132,715 | | | $ | 9,307,303 | |
| VWR Corp. (a) | | | 198,672 | | | | 5,582,683 | |
| | | | | | | | |
| | | | $ | 14,889,986 | |
| Natural Gas - Pipeline - 1.0% | | | | | | | | |
| Boardwalk Pipeline Partners LP | | | 478,645 | | | $ | 8,663,475 | |
| | |
| Oil Services - 2.7% | | | | | | | | |
| Frank’s International N.V. (l) | | | 739,290 | | | $ | 9,019,338 | |
| Keane Group, Inc. (a)(l) | | | 244,818 | | | | 4,289,211 | |
| Superior Energy Services, Inc. (a) | | | 325,527 | | | | 5,371,196 | |
| Tesco Corp. (a) | | | 571,105 | | | | 4,768,727 | |
| | | | | | | | |
| | | | $ | 23,448,472 | |
13
Portfolio of Investments – continued
| | | | | | | | |
| Issuer | | Shares/Par | | | Value ($) | |
| Common Stocks - continued | | | | | | | | |
| Other Banks & Diversified Financials - 18.4% | | | | | | | | |
| Air Lease Corp. | | | 258,666 | | | $ | 10,069,867 | |
| Berkshire Hills Bancorp, Inc. | | | 352,481 | | | | 12,460,203 | |
| Brookline Bancorp, Inc. | | | 490,567 | | | | 7,775,487 | |
| East West Bancorp, Inc. | | | 171,562 | | | | 9,284,935 | |
| Element Fleet Management Corp. | | | 1,008,910 | | | | 10,687,670 | |
| Encore Capital Group, Inc. (a) | | | 213,178 | | | | 7,098,827 | |
| First Interstate BancSystem, Inc. | | | 316,398 | | | | 13,874,052 | |
| Glacier Bancorp, Inc. | | | 290,897 | | | | 10,739,917 | |
| Hanmi Financial Corp. | | | 158,319 | | | | 5,287,854 | |
| Lakeland Financial Corp. | | | 167,216 | | | | 7,589,934 | |
| Sandy Spring Bancorp, Inc. | | | 209,872 | | | | 9,037,088 | |
| Santander Consumer USA Holdings, Inc. (a) | | | 340,956 | | | | 5,039,329 | |
| TCF Financial Corp. | | | 593,910 | | | | 10,334,034 | |
| Texas Capital Bancshares, Inc. (a) | | | 110,293 | | | | 9,832,621 | |
| UMB Financial Corp. | | | 135,231 | | | | 10,658,907 | |
| Valley National Bancorp | | | 592,662 | | | | 7,331,229 | |
| Wintrust Financial Corp. | | | 169,494 | | | | 12,491,708 | |
| | | | | | | | |
| | | | $ | 159,593,662 | |
| Pollution Control - 1.7% | | | | | | | | |
| Advanced Disposal Services, Inc. (a) | | | 204,196 | | | $ | 4,467,808 | |
| Clean Harbors, Inc. (a) | | | 178,987 | | | | 10,374,087 | |
| | | | | | | | |
| | | | $ | 14,841,895 | |
| Real Estate - 7.1% | | | | | | | | |
| Corporate Office Properties Trust, REIT | | | 232,824 | | | $ | 7,936,970 | |
| Life Storage, Inc., REIT | | | 87,075 | | | | 7,717,457 | |
| Medical Properties Trust, Inc., REIT | | | 912,100 | | | | 12,240,382 | |
| Select Income, REIT | | | 481,412 | | | | 12,516,712 | |
| STAG Industrial, Inc., REIT | | | 366,634 | | | | 9,470,156 | |
| Store Capital Corp., REIT | | | 454,765 | | | | 11,328,196 | |
| | | | | | | | |
| | | | $ | 61,209,873 | |
| Special Products & Services - 1.1% | | | | | | | | |
| Hostess Brands, Inc. (a) | | | 603,826 | | | $ | 9,196,270 | |
| | |
| Specialty Chemicals - 3.5% | | | | | | | | |
| A. Schulman, Inc. | | | 137,408 | | | $ | 4,637,520 | |
| Ferro Corp. (a) | | | 709,507 | | | | 9,933,098 | |
| Ferroglobe PLC | | | 877,726 | | | | 9,470,664 | |
| Ferroglobe R&W Trust (a) | | | 566,663 | | | | 0 | |
| Univar, Inc. (a) | | | 193,525 | | | | 6,231,505 | |
| | | | | | | | |
| | | | $ | 30,272,787 | |
14
Portfolio of Investments – continued
| | | | | | | | |
| Issuer | | Shares/Par | | | Value ($) | |
| Common Stocks - continued | | | | | | | | |
| Specialty Stores - 3.3% | | | | | | | | |
| Citi Trends, Inc. | | | 231,157 | | | $ | 3,853,387 | |
| Express, Inc. (a) | | | 449,494 | | | | 5,052,313 | |
| Michaels Co., Inc. (a) | | | 328,935 | | | | 6,608,304 | |
| Tuesday Morning Corp. (a) | | | 549,071 | | | | 2,004,109 | |
| Urban Outfitters, Inc. (a) | | | 247,287 | | | | 6,436,881 | |
| Zumiez, Inc. (a) | | | 226,885 | | | | 4,628,454 | |
| | | | | | | | |
| | | | $ | 28,583,448 | |
| Trucking - 2.8% | | | | | | | | |
| Knight Transportation, Inc. | | | 202,332 | | | $ | 6,616,256 | |
| Marten Transport Ltd. | | | 251,208 | | | | 6,167,156 | |
| Swift Transportation Co. (a) | | | 197,161 | | | | 4,282,337 | |
| Werner Enterprises, Inc. | | | 243,785 | | | | 6,825,980 | |
| | | | | | | | |
| | | | $ | 23,891,729 | |
| Utilities - Electric Power - 5.0% | | | | | | | | |
| El Paso Electric Co. | | | 320,412 | | | $ | 15,652,126 | |
| PNM Resources, Inc. | | | 377,932 | | | | 13,718,932 | |
| Portland General Electric Co. | | | 303,369 | | | | 13,751,717 | |
| | | | | | | | |
| | | | $ | 43,122,775 | |
| Total Common Stocks (Identified Cost, $718,661,834) | | | $ | 855,397,970 | |
| | |
| Money Market Funds - 6.8% | | | | | | | | |
MFS Institutional Money Market Portfolio, 0.64% (v)
(Identified Cost, $58,892,818) | | | 58,893,027 | | | $ | 58,893,027 | |
| | |
| Collateral for Securities Loaned - 0.4% | | | | | | | | |
| State Street Navigator Securities Lending Government Money Market Portfolio, 0.50% (j) (Identified Cost, $3,393,502) | | | 3,393,502 | | | $ | 3,393,502 | |
| Total Investments (Identified Cost, $780,948,154) | | | $ | 917,684,499 | |
| |
| Other Assets, Less Liabilities - (6.0)% | | | | (51,744,546 | ) |
| Net Assets - 100.0% | | | $ | 865,939,953 | |
| (a) | Non-income producing security. |
| (j) | The rate quoted is the annualized seven-day yield of the fund at period end. |
| (l) | A portion of this security is on loan. |
| (v) | Underlying affiliated fund that is available only to investment companies managed by MFS. The rate quoted for the MFS Institutional Money Market Portfolio is the annualized seven-day yield of the fund at period end. |
The following abbreviations are used in this report and are defined:
| ADR | | American Depositary Receipt |
| PLC | | Public Limited Company |
| REIT | | Real Estate Investment Trust |
See Notes to Financial Statements
15
Financial Statements
STATEMENT OF ASSETS AND LIABILITIES
At 2/28/17
This statement represents your fund’s balance sheet, which details the assets and liabilities comprising the total value of the fund.
| | | | |
| Assets | | | | |
Investments | | | | |
Non-affiliated issuers, at value (identified cost, $722,055,336) | | | $858,791,472 | |
Underlying affiliated funds, at value (identified cost, $58,892,818) | | | 58,893,027 | |
Total investments, at value, including $3,237,825 of securities on loan (identified cost, $780,948,154) | | | $917,684,499 | |
Cash | | | 32,222 | |
Receivables for | | | | |
Investments sold | | | 2,565,769 | |
Fund shares sold | | | 15,772,668 | |
Interest and dividends | | | 491,305 | |
Other assets | | | 3,122 | |
Total assets | | | $936,549,585 | |
| Liabilities | | | | |
Payables for | | | | |
Investments purchased | | | $65,938,271 | |
Fund shares reacquired | | | 985,029 | |
Collateral for securities loaned, at value | | | 3,393,502 | |
Payable to affiliates | | | | |
Investment adviser | | | 5,998 | |
Shareholder servicing costs | | | 130,767 | |
Distribution and service fees | | | 6,517 | |
Payable for independent Trustees’ compensation | | | 13 | |
Accrued expenses and other liabilities | | | 149,535 | |
Total liabilities | | | $70,609,632 | |
Net assets | | | $865,939,953 | |
| Net assets consist of | | | | |
Paid-in capital | | | $710,862,586 | |
Unrealized appreciation (depreciation) on investments and translation of assets and liabilities in foreign currencies | | | 136,736,327 | |
Accumulated net realized gain (loss) on investments and foreign currency | | | 18,332,230 | |
Undistributed net investment income | | | 8,810 | |
Net assets | | | $865,939,953 | |
Shares of beneficial interest outstanding | | | 57,692,221 | |
16
Statement of Assets and Liabilities – continued
| | | | | | | | | | | | |
| | | Net assets | | | Shares
outstanding | | | Net asset value
per share (a) | |
Class A | | | $189,745,724 | | | | 12,659,452 | | | | $14.99 | |
Class B | | | 5,871,588 | | | | 402,160 | | | | 14.60 | |
Class C | | | 63,140,081 | | | | 4,343,622 | | | | 14.54 | |
Class I | | | 242,153,798 | | | | 16,078,263 | | | | 15.06 | |
Class R1 | | | 210,149 | | | | 14,386 | | | | 14.61 | |
Class R2 | | | 1,216,005 | | | | 81,204 | | | | 14.97 | |
Class R3 | | | 14,207,707 | | | | 945,048 | | | | 15.03 | |
Class R4 | | | 2,439,923 | | | | 161,768 | | | | 15.08 | |
Class R6 (formerly Class R5) | | | 346,954,978 | | | | 23,006,318 | | | | 15.08 | |
| (a) | Maximum offering price per share was equal to the net asset value per share for all share classes, except for Class A, for which the maximum offering price per share was $15.90 [100 / 94.25 x $14.99]. On sales of $50,000 or more, the maximum offering price of Class A shares is reduced. A contingent deferred sales charge may be imposed on redemptions of Class A, Class B, and Class C shares. Redemption price per share was equal to the net asset value per share for Classes I, R1, R2, R3, R4, and R6. |
See Notes to Financial Statements
17
Financial Statements
STATEMENT OF OPERATIONS
Year ended 2/28/17
This statement describes how much your fund earned in investment income and accrued in expenses. It also describes any gains and/or losses generated by fund operations.
| | | | |
| Net investment income | |
Income | | | | |
Dividends | | | $9,508,525 | |
Interest | | | 118,018 | |
Dividends from underlying affiliated funds | | | 48,604 | |
Other | | | 10 | |
Foreign taxes withheld | | | (35,928 | ) |
Total investment income | | | $9,639,229 | |
Expenses | | | | |
Management fee | | | $5,149,729 | |
Distribution and service fees | | | 798,559 | |
Shareholder servicing costs | | | 800,542 | |
Administrative services fee | | | 98,051 | |
Independent Trustees’ compensation | | | 11,599 | |
Custodian fee | | | 40,266 | |
Reimbursement of custodian expenses | | | (1,163 | ) |
Shareholder communications | | | 78,907 | |
Audit and tax fees | | | 53,888 | |
Legal fees | | | 4,449 | |
Miscellaneous | | | 203,569 | |
Total expenses | | | $7,238,396 | |
Reduction of expenses by investment adviser and distributor | | | (278,453 | ) |
Net expenses | | | $6,959,943 | |
Net investment income | | | $2,679,286 | |
| Realized and unrealized gain (loss) on investments and foreign currency | |
Realized gain (loss) (identified cost basis) | | | | |
Investments: | | | | |
Non-affiliated issuers | | | $46,484,434 | |
Underlying affiliated funds | | | (108 | ) |
Foreign currency | | | 15,872 | |
Net realized gain (loss) on investments and foreign currency | | | $46,500,198 | |
Change in unrealized appreciation (depreciation) | | | | |
Investments | | | $128,542,804 | |
Translation of assets and liabilities in foreign currencies | | | 42 | |
Net unrealized gain (loss) on investments and foreign currency translation | | | $128,542,846 | |
Net realized and unrealized gain (loss) on investments and foreign currency | | | $175,043,044 | |
Change in net assets from operations | | | $177,722,330 | |
See Notes to Financial Statements
18
Financial Statements
STATEMENTS OF CHANGES IN NET ASSETS
These statements describe the increases and/or decreases in net assets resulting from operations, any distributions, and any shareholder transactions.
| | | | | | | | |
| | | Year ended 2/28/17 | | | Year ended 2/29/16 | |
| Change in net assets | | | | | | |
| From operations | | | | | | | | |
Net investment income | | | $2,679,286 | | | | $2,326,056 | |
Net realized gain (loss) on investments and foreign currency | | | 46,500,198 | | | | 14,069,380 | |
Net unrealized gain (loss) on investments and foreign currency translation | | | 128,542,846 | | | | (53,522,017 | ) |
Change in net assets from operations | | | $177,722,330 | | | | $(37,126,581 | ) |
| Distributions declared to shareholders | | | | | | | | |
From net investment income | | | $(3,324,236 | ) | | | $(2,228,433 | ) |
From net realized gain on investments | | | (25,045,933 | ) | | | (10,434,350 | ) |
Total distributions declared to shareholders | | | $(28,370,169 | ) | | | $(12,662,783 | ) |
Change in net assets from fund share transactions | | | $302,281,941 | | | | $112,021,087 | |
Total change in net assets | | | $451,634,102 | | | | $62,231,723 | |
| Net assets | | | | | | | | |
At beginning of period | | | 414,305,851 | | | | 352,074,128 | |
At end of period (including undistributed net investment income of $8,810 and $88,350, respectively) | | | $865,939,953 | | | | $414,305,851 | |
See Notes to Financial Statements
19
Financial Statements
FINANCIAL HIGHLIGHTS
The financial highlights table is intended to help you understand the fund’s financial performance for the past 5 years (or life of a particular share class, if shorter). Certain information reflects financial results for a single fund share. The total returns in the table represent the rate by which an investor would have earned (or lost) on an investment in the fund share class (assuming reinvestment of all distributions) held for the entire period.
| | | | | | | | | | | | | | | | | | | | |
| Class A | | Years ended 2/28, 2/29 | |
| | | 2017 | | | 2016 | | | 2015 | | | 2014 | | | 2013 | |
Net asset value, beginning of period | | | $11.40 | | | | $12.98 | | | | $13.24 | | | | $11.37 | | | | $10.27 | |
| Income (loss) from investment operations | | | | | |
Net investment income (d) | | | $0.03 | (c) | | | $0.05 | | | | $0.01 | | | | $0.02 | | | | $0.06 | |
Net realized and unrealized gain (loss)
on investments and foreign currency | | | 4.18 | | | | (1.26 | ) | | | 0.55 | | | | 3.02 | | | | 1.69 | |
Total from investment operations | | | $4.21 | | | | $(1.21 | ) | | | $0.56 | | | | $3.04 | | | | $1.75 | |
| Less distributions declared to shareholders | | | | | | | | | | | | | | | | | |
From net investment income | | | $(0.06 | ) | | | $(0.05 | ) | | | $(0.01 | ) | | | $(0.03 | ) | | | $(0.07 | ) |
From net realized gain on investments | | | (0.56 | ) | | | (0.32 | ) | | | (0.81 | ) | | | (1.14 | ) | | | (0.58 | ) |
Total distributions declared to shareholders | | | $(0.62 | ) | | | $(0.37 | ) | | | $(0.82 | ) | | | $(1.17 | ) | | | $(0.65 | ) |
Net asset value, end of period (x) | | | $14.99 | | | | $11.40 | | | | $12.98 | | | | $13.24 | | | | $11.37 | |
Total return (%) (r)(s)(t)(x) | | | 37.22 | (c) | | | (9.38 | ) | | | 4.60 | | | | 27.39 | | | | 18.04 | |
Ratios (%) (to average net assets)
and Supplemental data: | | | | | | | | | | | | | | | | | | | | |
Expenses before expense reductions (f) | | | 1.43 | (c) | | | 1.55 | | | | 1.58 | | | | 1.59 | | | | 1.39 | |
Expenses after expense reductions (f) | | | 1.39 | (c) | | | 1.39 | | | | 1.45 | | | | 1.45 | | | | 1.34 | |
Net investment income | | | 0.22 | (c) | | | 0.38 | | | | 0.10 | | | | 0.14 | | | | 0.53 | |
Portfolio turnover | | | 60 | | | | 60 | | | | 53 | | | | 55 | | | | 67 | |
Net assets at end of period (000 omitted) | | | $189,746 | | | | $52,645 | | | | $18,215 | | | | $19,101 | | | | $4,596 | |
See Notes to Financial Statements
20
Financial Highlights – continued
| | | | | | | | | | | | | | | | | | | | |
| Class B | | Years ended 2/28, 2/29 | |
| | | 2017 | | | 2016 | | | 2015 | | | 2014 | | | 2013 | |
Net asset value, beginning of period | | | $11.16 | | | | $12.76 | | | | $13.11 | | | | $11.33 | | | | $10.24 | |
| Income (loss) from investment operations | | | | | | | | | | | | | |
Net investment loss (d) | | | $(0.07) | (c) | | | $(0.05 | ) | | | $(0.08 | ) | | | $(0.08 | ) | | | $(0.02 | ) |
Net realized and unrealized gain (loss)
on investments and foreign currency | | | 4.08 | | | | (1.23 | ) | | | 0.54 | | | | 3.00 | | | | 1.69 | |
Total from investment operations | | | $4.01 | | | | $(1.28 | ) | | | $0.46 | | | | $2.92 | | | | $1.67 | |
| Less distributions declared to shareholders | | | | | | | | | | | | | | | | | |
From net investment income | | | $(0.01 | ) | | | $— | | | | $— | | | | $— | | | | $— | |
From net realized gain on investments | | | (0.56 | ) | | | (0.32 | ) | | | (0.81 | ) | | | (1.14 | ) | | | (0.58 | ) |
Total distributions declared to shareholders | | | $(0.57 | ) | | | $(0.32 | ) | | | $(0.81 | ) | | | $(1.14 | ) | | | $(0.58 | ) |
Net asset value, end of period (x) | | | $14.60 | | | | $11.16 | | | | $12.76 | | | | $13.11 | | | | $11.33 | |
Total return (%) (r)(s)(t)(x) | | | 36.17 | (c) | | | (10.10 | ) | | | 3.90 | | | | 26.40 | | | | 17.24 | |
Ratios (%) (to average net assets)
and Supplemental data: | | | | | | | | | | | | | |
Expenses before expense reductions (f) | | | 2.18 | (c) | | | 2.28 | | | | 2.34 | | | | 2.33 | | | | 2.14 | |
Expenses after expense reductions (f) | | | 2.14 | (c) | | | 2.14 | | | | 2.20 | | | | 2.20 | | | | 2.08 | |
Net investment loss | | | (0.54 | )(c) | | | (0.38 | ) | | | (0.65 | ) | | | (0.60 | ) | | | (0.17 | ) |
Portfolio turnover | | | 60 | | | | 60 | | | | 53 | | | | 55 | | | | 67 | |
Net assets at end of period (000 omitted) | | | $5,872 | | | | $1,545 | | | | $1,503 | | | | $954 | | | | $353 | |
| |
| Class C | | Years ended 2/28, 2/29 | |
| | | 2017 | | | 2016 | | | 2015 | | | 2014 | | | 2013 | |
Net asset value, beginning of period | | | $11.11 | | | | $12.73 | | | | $13.09 | | | | $11.31 | | | | $10.24 | |
| Income (loss) from investment operations | | | | | | | | | | | | | |
Net investment loss (d) | | | $(0.06 | )(c) | | | $(0.04 | ) | | | $(0.08 | ) | | | $(0.08 | ) | | | $(0.02 | ) |
Net realized and unrealized gain (loss)
on investments and foreign currency | | | 4.05 | | | | (1.23 | ) | | | 0.53 | | | | 3.00 | | | | 1.69 | |
Total from investment operations | | | $3.99 | | | | $(1.27 | ) | | | $0.45 | | | | $2.92 | | | | $1.67 | |
| Less distributions declared to shareholders | | | | | | | | | | | | | |
From net investment income | | | $— | | | | $(0.03 | ) | | | $— | | | | $— | | | | $(0.02 | ) |
From net realized gain on investments | | | (0.56 | ) | | | (0.32 | ) | | | (0.81 | ) | | | (1.14 | ) | | | (0.58 | ) |
Total distributions declared to shareholders | | | $(0.56 | ) | | | $(0.35 | ) | | | $(0.81 | ) | | | $(1.14 | ) | | | $(0.60 | ) |
Net asset value, end of period (x) | | | $14.54 | | | | $11.11 | | | | $12.73 | | | | $13.09 | | | | $11.31 | |
Total return (%) (r)(s)(t)(x) | | | 36.17 | (c) | | | (10.08 | ) | | | 3.83 | | | | 26.46 | | | | 17.22 | |
Ratios (%) (to average net assets)
and Supplemental data: | | | | | | | | | | | | | |
Expenses before expense reductions (f) | | | 2.18 | (c) | | | 2.30 | | | | 2.33 | | | | 2.34 | | | | 2.15 | |
Expenses after expense reductions (f) | | | 2.14 | (c) | | | 2.14 | | | | 2.19 | | | | 2.20 | | | | 2.09 | |
Net investment loss | | | (0.46 | )(c) | | | (0.37) | | | | (0.64 | ) | | | (0.61 | ) | | | (0.22 | ) |
Portfolio turnover | | | 60 | | | | 60 | | | | 53 | | | | 55 | | | | 67 | |
Net assets at end of period (000 omitted) | | | $63,140 | | | | $35,227 | | | | $4,144 | | | | $3,043 | | | | $691 | |
See Notes to Financial Statements
21
Financial Highlights – continued
| | | | | | | | | | | | | | | | | | | | |
| Class I | | Years ended 2/28, 2/29 | |
| | | 2017 | | | 2016 | | | 2015 | | | 2014 | | | 2013 | |
Net asset value, beginning of period | | | $11.44 | | | | $13.01 | | | | $13.28 | | | | $11.39 | | | | $10.28 | |
| Income (loss) from investment operations | | | | | | | | | | | | | | | | | | | | |
Net investment income (d) | | | $0.06 | (c) | | | $0.08 | | | | $0.04 | | | | $0.05 | | | | $0.11 | |
Net realized and unrealized gain (loss)
on investments and foreign currency | | | 4.20 | | | | (1.26 | ) | | | 0.54 | | | | 3.03 | | | | 1.67 | |
Total from investment operations | | | $4.26 | | | | $(1.18 | ) | | | $0.58 | | | | $3.08 | | | | $1.78 | |
| Less distributions declared to shareholders | | | | | | | | | | | | | |
From net investment income | | | $(0.08 | ) | | | $(0.07 | ) | | | $(0.04 | ) | | | $(0.05 | ) | | | $(0.09 | ) |
From net realized gain on investments | | | (0.56 | ) | | | (0.32 | ) | | | (0.81 | ) | | | (1.14 | ) | | | (0.58 | ) |
Total distributions declared to shareholders | | | $(0.64 | ) | | | $(0.39 | ) | | | $(0.85 | ) | | | $(1.19 | ) | | | $(0.67 | ) |
Net asset value, end of period (x) | | | $15.06 | | | | $11.44 | | | | $13.01 | | | | $13.28 | | | | $11.39 | |
Total return (%) (r)(s)(x) | | | 37.54 | (c) | | | (9.15 | ) | | | 4.84 | | | | 27.71 | | | | 18.35 | |
Ratios (%) (to average net assets)
and Supplemental data: | | | | | | | | | | | | | |
Expenses before expense reductions (f) | | | 1.18 | (c) | | | 1.29 | | | | 1.34 | | | | 1.33 | | | | 1.02 | |
Expenses after expense reductions (f) | | | 1.14 | (c) | | | 1.14 | | | | 1.20 | | | | 1.20 | | | | 1.02 | |
Net investment income | | | 0.42 | (c) | | | 0.62 | | | | 0.34 | | | | 0.41 | | | | 1.04 | |
Portfolio turnover | | | 60 | | | | 60 | | | | 53 | | | | 55 | | | | 67 | |
Net assets at end of period (000 omitted) | | | $242,154 | | | | $31,278 | | | | $13,567 | | | | $7,464 | | | | $1,633 | |
| |
| Class R1 | | Years ended 2/28, 2/29 | |
| | | 2017 | | | 2016 | | | 2015 | | | 2014 | | | 2013 | |
Net asset value, beginning of period | | | $11.16 | | | | $12.76 | | | | $13.12 | | | | $11.34 | | | | $10.25 | |
| Income (loss) from investment operations | | | | | | | | | | | | | | | | | | | | |
Net investment loss (d) | | | $(0.06 | )(c) | | | $(0.05 | ) | | | $(0.08 | ) | | | $(0.07 | ) | | | $(0.01 | ) |
Net realized and unrealized gain (loss)
on investments and foreign currency | | | 4.07 | | | | (1.23 | ) | | | 0.53 | | | | 2.99 | | | | 1.68 | |
Total from investment operations | | | $4.01 | | | | $(1.28 | ) | | | $0.45 | | | | $2.92 | | | | $1.67 | |
| Less distributions declared to shareholders | | | | | | | | | | | | | |
From net investment income | | | $— | | | | $— | | | | $— | | | | $— | | | | $(0.00 | )(w) |
From net realized gain on investments | | | (0.56 | ) | | | (0.32 | ) | | | (0.81 | ) | | | (1.14 | ) | | | (0.58 | ) |
Total distributions declared to shareholders | | | $(0.56 | ) | | | $(0.32 | ) | | | $(0.81 | ) | | | $(1.14 | ) | | | $(0.58 | ) |
Net asset value, end of period (x) | | | $14.61 | | | | $11.16 | | | | $12.76 | | | | $13.12 | | | | $11.34 | |
Total return (%) (r)(s)(x) | | | 36.19 | (c) | | | (10.10 | ) | | | 3.82 | | | | 26.39 | | | | 17.25 | |
Ratios (%) (to average net assets)
and Supplemental data: | | | | | | | | | | | | | |
Expenses before expense reductions (f) | | | 2.18 | (c) | | | 2.28 | | | | 2.33 | | | | 2.32 | | | | 2.13 | |
Expenses after expense reductions (f) | | | 2.14 | (c) | | | 2.14 | | | | 2.20 | | | | 2.20 | | | | 2.08 | |
Net investment loss | | | (0.45 | )(c) | | | (0.37 | ) | | | (0.64 | ) | | | (0.59 | ) | | | (0.14 | ) |
Portfolio turnover | | | 60 | | | | 60 | | | | 53 | | | | 55 | | | | 67 | |
Net assets at end of period (000 omitted) | | | $210 | | | | $200 | | | | $302 | | | | $288 | | | | $148 | |
See Notes to Financial Statements
22
Financial Highlights – continued
| | | | | | | | | | | | | | | | | | | | |
| Class R2 | | Years ended 2/28, 2/29 | |
| | | 2017 | | | 2016 | | | 2015 | | | 2014 | | | 2013 | |
Net asset value, beginning of period | | | $11.40 | | | | $12.96 | | | | $13.25 | | | | $11.39 | | | | $10.27 | |
| Income (loss) from investment operations | | | | | | | | | | | | | | | | | |
Net investment income (loss) (d) | | | $(0.00) | (c)(w) | | | $0.02 | | | | $(0.02 | ) | | | $(0.01 | ) | | | $0.04 | |
Net realized and unrealized gain (loss)
on investments and foreign currency | | | 4.17 | | | | (1.25 | ) | | | 0.54 | | | | 3.01 | | | | 1.70 | |
Total from investment operations | | | $4.17 | | | | $(1.23 | ) | | | $0.52 | | | | $3.00 | | | | $1.74 | |
| Less distributions declared to shareholders | | | | | | | | | | | | | | | | | |
From net investment income | | | $(0.04 | ) | | | $(0.01 | ) | | | $— | | | | $(0.00 | )(w) | | | $(0.04 | ) |
From net realized gain on investments | | | (0.56 | ) | | | (0.32 | ) | | | (0.81 | ) | | | (1.14 | ) | | | (0.58 | ) |
Total distributions declared to shareholders | | | $(0.60 | ) | | | $(0.33 | ) | | | $(0.81 | ) | | | $(1.14 | ) | | | $(0.62 | ) |
Net asset value, end of period (x) | | | $14.97 | | | | $11.40 | | | | $12.96 | | | | $13.25 | | | | $11.39 | |
Total return (%) (r)(s)(x) | | | 36.81 | (c) | | | (9.58 | ) | | | 4.32 | | | | 27.01 | | | | 17.92 | |
Ratios (%) (to average net assets)
and Supplemental data: | | | | | | | | | | | | | | | | | |
Expenses before expense reductions (f) | | | 1.68 | (c) | | | 1.78 | | | | 1.83 | | | | 1.83 | | | | 1.63 | |
Expenses after expense reductions (f) | | | 1.64 | (c) | | | 1.64 | | | | 1.70 | | | | 1.70 | | | | 1.58 | |
Net investment income (loss) | | | (0.02 | )(c) | | | 0.14 | | | | (0.15 | ) | | | (0.09 | ) | | | 0.34 | |
Portfolio turnover | | | 60 | | | | 60 | | | | 53 | | | | 55 | | | | 67 | |
Net assets at end of period (000 omitted) | | | $1,216 | | | | $528 | | | | $567 | | | | $488 | | | | $137 | |
| |
| Class R3 | | Years ended 2/28, 2/29 | |
| | | 2017 | | | 2016 | | | 2015 | | | 2014 | | | 2013 | |
Net asset value, beginning of period | | | $11.43 | | | | $13.00 | | | | $13.27 | | | | $11.39 | | | | $10.28 | |
| Income (loss) from investment operations | | | | | | | | | | | | | | | | | |
Net investment income (d) | | | $0.01 | (c) | | | $0.04 | | | | $0.01 | | | | $0.02 | | | | $0.05 | |
Net realized and unrealized gain (loss)
on investments and foreign currency | | | 4.20 | | | | (1.24 | ) | | | 0.54 | | | | 3.02 | | | | 1.70 | |
Total from investment operations | | | $4.21 | | | | $(1.20 | ) | | | $0.55 | | | | $3.04 | | | | $1.75 | |
| Less distributions declared to shareholders | | | | | | | | | | | | | | | | | |
From net investment income | | | $(0.05 | ) | | | $(0.05 | ) | | | $(0.01 | ) | | | $(0.02 | ) | | | $(0.06 | ) |
From net realized gain on investments | | | (0.56 | ) | | | (0.32 | ) | | | (0.81 | ) | | | (1.14 | ) | | | (0.58 | ) |
Total distributions declared to shareholders | | | $(0.61 | ) | | | $(0.37 | ) | | | $(0.82 | ) | | | $(1.16 | ) | | | $(0.64 | ) |
Net asset value, end of period (x) | | | $15.03 | | | | $11.43 | | | | $13.00 | | | | $13.27 | | | | $11.39 | |
Total return (%) (r)(s)(x) | | | 37.11 | (c) | | | (9.30 | ) | | | 4.57 | | | | 27.38 | | | | 18.08 | |
Ratios (%) (to average net assets)
and Supplemental data: | | | | | | | | | | | | | | | | | |
Expenses before expense reductions (f) | | | 1.46 | (c) | | | 1.55 | | | | 1.59 | | | | 1.58 | | | | 1.40 | |
Expenses after expense reductions (f) | | | 1.39 | (c) | | | 1.39 | | | | 1.45 | | | | 1.45 | | | | 1.34 | |
Net investment income | | | 0.08 | (c) | | | 0.36 | | | | 0.10 | | | | 0.15 | | | | 0.47 | |
Portfolio turnover | | | 60 | | | | 60 | | | | 53 | | | | 55 | | | | 67 | |
Net assets at end of period (000 omitted) | | | $14,208 | | | | $2,095 | | | | $739 | | | | $513 | | | | $215 | |
See Notes to Financial Statements
23
Financial Highlights – continued
| | | | | | | | | | | | | | | | | | | | |
| Class R4 | | Years ended 2/28, 2/29 | |
| | | 2017 | | | 2016 | | | 2015 | | | 2014 | | | 2013 | |
Net asset value, beginning of period | | | $11.46 | | | | $13.03 | | | | $13.29 | | | | $11.40 | | | | $10.28 | |
| Income (loss) from investment operations | | | | | | | | | | | | | | | | | |
Net investment income (d) | | | $0.06 | (c) | | | $0.08 | | | | $0.05 | | | | $0.05 | | | | $0.09 | |
Net realized and unrealized gain (loss)
on investments and foreign currency | | | 4.20 | | | | (1.26 | ) | | | 0.54 | | | | 3.03 | | | | 1.70 | |
Total from investment operations | | | $4.26 | | | | $(1.18 | ) | | | $0.59 | | | | $3.08 | | | | $1.79 | |
| Less distributions declared to shareholders | | | | | | | | | | | | | | | | | |
From net investment income | | | $(0.08 | ) | | | $(0.07 | ) | | | $(0.04 | ) | | | $(0.05 | ) | | | $(0.09 | ) |
From net realized gain on investments | | | (0.56 | ) | | | (0.32 | ) | | | (0.81 | ) | | | (1.14 | ) | | | (0.58 | ) |
Total distributions declared to shareholders | | | $(0.64 | ) | | | $(0.39 | ) | | | $(0.85 | ) | | | $(1.19 | ) | | | $(0.67 | ) |
Net asset value, end of period (x) | | | $15.08 | | | | $11.46 | | | | $13.03 | | | | $13.29 | | | | $11.40 | |
Total return (%) (r)(s)(x) | | | 37.46 | (c) | | | (9.12 | ) | | | 4.89 | | | | 27.66 | | | | 18.46 | |
Ratios (%) (to average net assets)
and Supplemental data: | | | | | | | | | | | | | | | | | |
Expenses before expense reductions (f) | | | 1.20 | (c) | | | 1.29 | | | | 1.33 | | | | 1.32 | | | | 1.12 | |
Expenses after expense reductions (f) | | | 1.14 | (c) | | | 1.14 | | | | 1.20 | | | | 1.20 | | | | 1.08 | |
Net investment income | | | 0.45 | (c) | | | 0.65 | | | | 0.35 | | | | 0.42 | | | | 0.85 | |
Portfolio turnover | | | 60 | | | | 60 | | | | 53 | | | | 55 | | | | 67 | |
Net assets at end of period (000 omitted) | | | $2,440 | | | | $584 | | | | $178 | | | | $156 | | | | $122 | |
| |
| Class R6 (formerly Class R5) | | Years ended 2/28, 2/29 | |
| | | 2017 | | | 2016 | | | 2015 | | | 2014 | | | 2013 (i) | |
Net asset value, beginning of period | | | $11.45 | | | | $13.02 | | | | $13.28 | | | | $11.40 | | | | $10.10 | |
| Income (loss) from investment operations | | | | | | | | | | | | | |
Net investment income (d) | | | $0.10 | (c) | | | $0.09 | | | | $0.06 | | | | $0.06 | | | | $0.05 | |
Net realized and unrealized gain (loss)
on investments and foreign currency | | | 4.18 | | | | (1.26 | ) | | | 0.55 | | | | 3.01 | | | | 1.71 | |
Total from investment operations | | | $4.28 | | | | $(1.17 | ) | | | $0.61 | | | | $3.07 | | | | $1.76 | |
| Less distributions declared to shareholders | | | | | | | | | | | | | |
From net investment income | | | $(0.09 | ) | | | $(0.08 | ) | | | $(0.06 | ) | | | $(0.05 | ) | | | $(0.09 | ) |
From net realized gain on investments | | | (0.56 | ) | | | (0.32 | ) | | | (0.81 | ) | | | (1.14 | ) | | | (0.37 | ) |
Total distributions declared to shareholders | | | $(0.65 | ) | | | $(0.40 | ) | | | $(0.87 | ) | | | $(1.19 | ) | | | $(0.46 | ) |
Net asset value, end of period (x) | | | $15.08 | | | | $11.45 | | | | $13.02 | | | | $13.28 | | | | $11.40 | |
Total return (%) (r)(s)(x) | | | 37.68 | (c) | | | (9.09 | ) | | | 5.00 | | | | 27.66 | | | | 18.05 | (n) |
Ratios (%) (to average net assets)
and Supplemental data: | | | | | | | | | | | | | |
Expenses before expense reductions (f) | | | 1.07 | (c) | | | 1.21 | | | | 1.23 | | | | 1.26 | | | | 1.12 | (a) |
Expenses after expense reductions (f) | | | 1.02 | (c) | | | 1.06 | | | | 1.10 | | | | 1.15 | | | | 1.09 | (a) |
Net investment income | | | 0.73 | (c) | | | 0.71 | | | | 0.45 | | | | 0.48 | | | | 0.76 | (a) |
Portfolio turnover | | | 60 | | | | 60 | | | | 53 | | | | 55 | | | | 67 | |
| Net assets at end of period (000 omitted) | | | $346,955 | | | | $290,204 | | | | $312,860 | | | | $278,450 | | | | $205,301 | |
See Notes to Financial Statements
24
Financial Highlights – continued
| (c) | Amount reflects a one-time reimbursement of expenses by the custodian (or former custodian) without which net investment income and performance would be lower and expenses would be higher. See Note 2 in the Notes to Financial Statements for additional information. |
| (d) | Per share data is based on average shares outstanding. |
| (f) | Ratios do not reflect reductions from fees paid indirectly, if applicable. |
| (i) | For the period from the class inception, July 2, 2012, through the stated period end. |
| (r) | Certain expenses have been reduced without which performance would have been lower. |
| (s) | From time to time the fund may receive proceeds from litigation settlements, without which performance would be lower. |
| (t) | Total returns do not include any applicable sales charges. |
| (w) | Per share amount was less than $0.01. |
| (x) | The net asset values and total returns have been calculated on net assets which include adjustments made in accordance with U.S. generally accepted accounting principles required at period end for financial reporting purposes. |
See Notes to Financial Statements
25
NOTES TO FINANCIAL STATEMENTS
(1) Business and Organization
MFS New Discovery Value Fund (the fund) is a diversified series of MFS Series Trust XIII (the trust). The trust is organized as a Massachusetts business trust and is registered under the Investment Company Act of 1940, as amended, as an open-end management investment company.
The fund is an investment company and accordingly follows the investment company accounting and reporting guidance of the Financial Accounting Standards Board (FASB) Accounting Standards Codification Topic 946 Financial Services – Investment Companies.
(2) Significant Accounting Policies
General – The preparation of financial statements in conformity with U.S. generally accepted accounting principles requires management to make estimates and assumptions that affect the reported amounts of assets and liabilities, and disclosure of contingent assets and liabilities at the date of the financial statements and the reported amounts of increases and decreases in net assets from operations during the reporting period. Actual results could differ from those estimates. In the preparation of these financial statements, management has evaluated subsequent events occurring after the date of the fund’s Statement of Assets and Liabilities through the date that the financial statements were issued. The fund will generally focus on securities of small size companies which may be more volatile than those of larger companies.
In October 2016, the Securities and Exchange Commission (SEC) released its Final Rule on Investment Company Reporting Modernization (the “Rule”). The Rule, which introduces two new regulatory reporting forms for investment companies – Form N-PORT and Form N-CEN – also contains amendments to Regulation S-X which impact financial statement presentation, particularly the presentation of derivative investments. Although still evaluating the impacts of the Rule, management believes that many of the Regulation S-X amendments are consistent with the fund’s current financial statement presentation and expects that the fund will be able to comply with the Rule’s Regulation S-X amendments by the August 1, 2017 compliance date.
Balance Sheet Offsetting – The fund’s accounting policy with respect to balance sheet offsetting is that, absent an event of default by the counterparty or a termination of the agreement, the International Swaps and Derivatives Association (ISDA) Master Agreement does not result in an offset of reported amounts of financial assets and financial liabilities in the Statement of Assets and Liabilities across transactions between the fund and the applicable counterparty. The fund’s right to setoff may be restricted or prohibited by the bankruptcy or insolvency laws of the particular jurisdiction to which a specific master netting agreement counterparty is subject. Balance sheet offsetting disclosures, to the extent applicable to the fund, have been included in the fund’s Significant Accounting Policies note under the captions for each of the fund’s in-scope financial instruments and transactions.
Investment Valuations – Equity securities, including restricted equity securities, are generally valued at the last sale or official closing price on their primary market or exchange as provided by a third-party pricing service. Equity securities, for which there
26
Notes to Financial Statements – continued
were no sales reported that day, are generally valued at the last quoted daily bid quotation on their primary market or exchange as provided by a third-party pricing service. Short-term instruments with a maturity at issuance of 60 days or less may be valued at amortized cost, which approximates market value. Open-end investment companies are generally valued at net asset value per share. Securities and other assets generally valued on the basis of information from a third-party pricing service may also be valued at a broker/dealer bid quotation. Values obtained from third-party pricing services can utilize both transaction data and market information such as yield, quality, coupon rate, maturity, type of issue, trading characteristics, and other market data. The values of foreign securities and other assets and liabilities expressed in foreign currencies are converted to U.S. dollars using the mean of bid and asked prices for rates provided by a third-party pricing service.
The Board of Trustees has delegated primary responsibility for determining or causing to be determined the value of the fund’s investments (including any fair valuation) to the adviser pursuant to valuation policies and procedures approved by the Board. If the adviser determines that reliable market quotations are not readily available, investments are valued at fair value as determined in good faith by the adviser in accordance with such procedures under the oversight of the Board of Trustees. Under the fund’s valuation policies and procedures, market quotations are not considered to be readily available for most types of debt instruments and floating rate loans and many types of derivatives. These investments are generally valued at fair value based on information from third-party pricing services. In addition, investments may be valued at fair value if the adviser determines that an investment’s value has been materially affected by events occurring after the close of the exchange or market on which the investment is principally traded (such as foreign exchange or market) and prior to the determination of the fund’s net asset value, or after the halting of trading of a specific security where trading does not resume prior to the close of the exchange or market on which the security is principally traded. Events that occur on a frequent basis after foreign markets close (such as developments in foreign markets and significant movements in the U.S. markets) and prior to the determination of the fund’s net asset value may be deemed to have a material effect on the value of securities traded in foreign markets. Accordingly, the fund’s foreign equity securities may often be valued at fair value. The adviser generally relies on third-party pricing services or other information (such as the correlation with price movements of similar securities in the same or other markets; the type, cost and investment characteristics of the security; the business and financial condition of the issuer; and trading and other market data) to assist in determining whether to fair value and at what value to fair value an investment. The value of an investment for purposes of calculating the fund’s net asset value can differ depending on the source and method used to determine value. When fair valuation is used, the value of an investment used to determine the fund’s net asset value may differ from quoted or published prices for the same investment. There can be no assurance that the fund could obtain the fair value assigned to an investment if it were to sell the investment at the same time at which the fund determines its net asset value per share.
Various inputs are used in determining the value of the fund’s assets or liabilities. These inputs are categorized into three broad levels. In certain cases, the inputs used to measure fair value may fall into different levels of the fair value hierarchy. In such cases,
27
Notes to Financial Statements – continued
an investment’s level within the fair value hierarchy is based on the lowest level of input that is significant to the fair value measurement. The fund’s assessment of the significance of a particular input to the fair value measurement in its entirety requires judgment, and considers factors specific to the investment. Level 1 includes unadjusted quoted prices in active markets for identical assets or liabilities. Level 2 includes other significant observable market-based inputs (including quoted prices for similar securities, interest rates, prepayment speed, and credit risk). Level 3 includes unobservable inputs, which may include the adviser’s own assumptions in determining the fair value of investments. The following is a summary of the levels used as of February 28, 2017 in valuing the fund’s assets or liabilities:
| | | | | | | | | | | | | | | | |
| Investments at Value | | Level 1 | | | Level 2 | | | Level 3 | | | Total | |
| Equity Securities | | | $855,397,970 | | | | $— | | | | $0 | | | | $855,397,970 | |
| Mutual Funds | | | 62,286,529 | | | | — | | | | — | | | | 62,286,529 | |
| Total Investments | | | $917,684,499 | | | | $— | | | | $0 | | | | $917,684,499 | |
For further information regarding security characteristics, see the Portfolio of Investments.
The following is a reconciliation of level 3 assets for which significant unobservable inputs were used to determine fair value. The fund’s policy is to recognize transfers between the levels as of the end of the period. The table presents the activity of level 3 securities held at the beginning and the end of the period.
| | | | |
| | | Equity Securities | |
| Balance as of 2/29/16 | | | $— | |
Received as part of corporate action | | | 0 | |
| Balance as of 2/28/17 | | | $0 | |
The net change in unrealized appreciation (depreciation) from investments held as level 3 at February 28, 2017 is $0. At February 28, 2017, the fund held 1 level 3 security.
Foreign Currency Translation – Purchases and sales of foreign investments, income, and expenses are converted into U.S. dollars based upon currency exchange rates prevailing on the respective dates of such transactions or on the reporting date for foreign denominated receivables and payables. Gains and losses attributable to foreign currency exchange rates on sales of securities are recorded for financial statement purposes as net realized gains and losses on investments. Gains and losses attributable to foreign exchange rate movements on receivables, payables, income and expenses are recorded for financial statement purposes as foreign currency transaction gains and losses. That portion of both realized and unrealized gains and losses on investments that results from fluctuations in foreign currency exchange rates is not separately disclosed.
Security Loans – Under its Securities Lending Agency Agreement with the fund, State Street Bank and Trust Company (“State Street”), as lending agent, loans the securities of the fund to certain qualified institutions (the “Borrowers”) approved by the fund. Security loans can be terminated at the discretion of either the lending agent or the fund and the related securities must be returned within the earlier of the standard
28
Notes to Financial Statements – continued
trade settlement period for such securities or within three business days. The loans are collateralized by cash and/or U.S. Treasury and federal agency obligations in an amount typically at least equal to the market value of the securities loaned. On loans collateralized by cash, the cash collateral is invested in a money market fund. The market value of the loaned securities is determined at the close of business of the fund and any additional required collateral is delivered to the fund on the next business day. State Street provides the fund with indemnification against Borrower default. In the event of Borrower default, State Street will, for the benefit of the fund, either purchase securities identical to those loaned or, when such purchase is commercially impracticable, pay the fund the market value of the loaned securities. In return, State Street assumes the fund’s rights to the related collateral. If the collateral value is less than the cost to purchase identical securities, State Street is responsible for the shortfall, but only to the extent that such shortfall is not due to a decline in collateral value resulting from collateral reinvestment for which the fund bears the risk of loss. At period end, the fund had investment securities on loan, all of which were classified as equity securities in the fund’s Portfolio of Investments, with a fair value of $3,237,825. The fair value of the fund’s investment securities on loan and a related liability of $3,393,502 for cash collateral received on securities loaned are both presented gross in the Statement of Assets and Liabilities. The collateral received on securities loaned exceeded the value of securities on loan at period end. The liability for cash collateral for securities loaned is carried at fair value, which is categorized as level 2 within the fair value hierarchy. A portion of the income generated upon investment of the collateral is remitted to the Borrowers, and the remainder is allocated between the fund and the lending agent. On loans collateralized by U.S. Treasury and/or federal agency obligations, a fee is received from the Borrower, and is allocated between the fund and the lending agent. Income from securities lending is included in “Interest” income in the Statement of Operations. The dividend and interest income earned on the securities loaned is accounted for in the same manner as other dividend and interest income.
Indemnifications – Under the fund’s organizational documents, its officers and Trustees may be indemnified against certain liabilities and expenses arising out of the performance of their duties to the fund. Additionally, in the normal course of business, the fund enters into agreements with service providers that may contain indemnification clauses. The fund’s maximum exposure under these agreements is unknown as this would involve future claims that may be made against the fund that have not yet occurred.
Investment Transactions and Income – Investment transactions are recorded on the trade date. Interest income is recorded on the accrual basis. Dividends received in cash are recorded on the ex-dividend date. Certain dividends from foreign securities will be recorded when the fund is informed of the dividend if such information is obtained subsequent to the ex-dividend date. Dividend and interest payments received in additional securities are recorded on the ex-dividend or ex-interest date in an amount equal to the value of the security on such date.
The fund may receive proceeds from litigation settlements. Any proceeds received from litigation involving portfolio holdings are reflected in the Statement of Operations in realized gain/loss if the security has been disposed of by the fund or in unrealized
29
Notes to Financial Statements – continued
gain/loss if the security is still held by the fund. Any other proceeds from litigation not related to portfolio holdings are reflected as other income in the Statement of Operations.
Reimbursement of Expenses by Custodian – In December 2015, the fund’s custodian (or former custodian), State Street Bank and Trust Company, announced that it intended to reimburse its asset servicing clients for expense amounts that it billed in error during the period 1998 through 2015. The amount of this one-time reimbursement attributable to the fund is reflected as “Reimbursement of custodian expenses” in the Statement of Operations.
Tax Matters and Distributions – The fund intends to qualify as a regulated investment company, as defined under Subchapter M of the Internal Revenue Code, and to distribute all of its taxable income, including realized capital gains. As a result, no provision for federal income tax is required. The fund’s federal tax returns, when filed, will remain subject to examination by the Internal Revenue Service for a three year period. Management has analyzed the fund’s tax positions taken on federal and state tax returns for all open tax years and does not believe that there are any uncertain tax positions that require recognition of a tax liability. Foreign taxes, if any, have been accrued by the fund in the accompanying financial statements in accordance with the applicable foreign tax law. Foreign income taxes may be withheld by certain countries in which the fund invests. Additionally, capital gains realized by the fund on securities issued in or by certain foreign countries may be subject to capital gains tax imposed by those countries.
Distributions to shareholders are recorded on the ex-dividend date. Income and capital gain distributions are determined in accordance with income tax regulations, which may differ from U.S. generally accepted accounting principles. Certain capital accounts in the financial statements are periodically adjusted for permanent differences in order to reflect their tax character. These adjustments have no impact on net assets or net asset value per share. Temporary differences which arise from recognizing certain items of income, expense, gain or loss in different periods for financial statement and tax purposes will reverse at some time in the future. Distributions in excess of net investment income or net realized gains are temporary overdistributions for financial statement purposes resulting from differences in the recognition or classification of income or distributions for financial statement and tax purposes.
Book/tax differences primarily relate to wash sale loss deferrals and treating a portion of the proceeds from redemptions as a distribution for tax purposes.
The tax character of distributions declared to shareholders for the last two fiscal years is as follows:
| | | | | | | | |
| | | 2/28/17 | | | 2/29/16 | |
Ordinary income (including any
short-term capital gains) | | | $11,381,210 | | | | $3,718,549 | |
| Long-term capital gains | | | 16,988,959 | | | | 8,944,234 | |
| Total distributions | | | $28,370,169 | | | | $12,662,783 | |
30
Notes to Financial Statements – continued
The federal tax cost and the tax basis components of distributable earnings were as follows:
| | | | |
| As of 2/28/17 | | | |
| Cost of investments | | | $785,799,427 | |
| Gross appreciation | | | 140,844,124 | |
| Gross depreciation | | | (8,959,052 | ) |
| Net unrealized appreciation (depreciation) | | | $131,885,072 | |
| Undistributed ordinary income | | | 10,252,318 | |
| Undistributed long-term capital gain | | | 12,930,241 | |
| Other temporary differences | | | 9,736 | |
Multiple Classes of Shares of Beneficial Interest – The fund offers multiple classes of shares, which differ in their respective distribution and service fees. The fund’s income, realized and unrealized gain (loss), and common expenses are allocated to shareholders based on the daily net assets of each class. Dividends are declared separately for each class. Differences in per share dividend rates are generally due to differences in separate class expenses. Class B shares will convert to Class A shares approximately eight years after purchase. The fund’s distributions declared to shareholders as reported in the Statements of Changes in Net Assets are presented by class as follows:
| | | | | | | | | | | | | | | | |
| | | From net investment
income | | | From net realized gain on
investments | |
| | | Year
ended
2/28/17 | | | Year
ended
2/29/16 | | | Year
ended
2/28/17 | | | Year
ended
2/29/16 | |
| Class A | | | $642,448 | | | | $176,902 | | | | $5,610,928 | | | | $1,084,271 | |
| Class B | | | 2,362 | | | | — | | | | 160,295 | | | | 43,668 | |
| Class C | | | — | | | | 71,393 | | | | 2,161,325 | | | | 906,148 | |
| Class I | | | 851,123 | | | | 109,688 | | | | 5,495,450 | | | | 511,276 | |
| Class R1 | | | — | | | | — | | | | 10,479 | | | | 4,842 | |
| Class R2 | | | 2,442 | | | | 324 | | | | 36,223 | | | | 15,058 | |
| Class R3 | | | 13,145 | | | | 5,464 | | | | 143,669 | | | | 35,153 | |
| Class R4 | | | 7,727 | | | | 3,382 | | | | 51,233 | | | | 15,257 | |
| Class R6 (formerly Class R5) | | | 1,804,989 | | | | 1,861,280 | | | | 11,376,331 | | | | 7,818,677 | |
| Total | | | $3,324,236 | | | | $2,228,433 | | | | $25,045,933 | | | | $10,434,350 | |
Effective August 26, 2016, Class R5 shares were renamed Class R6 shares.
(3) Transactions with Affiliates
Investment Adviser – The fund has an investment advisory agreement with MFS to provide overall investment management and related administrative services and facilities to the fund. The management fee is computed daily and paid monthly at the following annual rates:
| | | | |
| First $1 billion of average daily net assets | | | 0.90 | % |
| Next $1.5 billion of average daily net assets | | | 0.80 | % |
| Average daily net assets in excess of $2.5 billion | | | 0.75 | % |
31
Notes to Financial Statements – continued
MFS has agreed in writing to reduce its management fee by a specified amount if certain MFS mutual fund assets exceed thresholds agreed to by MFS and the fund’s Board of Trustees. For the year ended February 28, 2017, this management fee reduction amounted to $40,651, which is included in the reduction of total expenses in the Statement of Operations. The management fee incurred for the year ended February 28, 2017 was equivalent to an annual effective rate of 0.89% of the fund’s average daily net assets.
The investment adviser has agreed in writing to pay a portion of the fund’s total annual operating expenses, excluding interest, taxes, extraordinary expenses, brokerage and transaction costs, and investment-related expenses, such that total fund operating expenses do not exceed the following rates annually of each class’s average daily net assets:
| | | | | | | | | | | | | | | | | | | | | | | | | | | | | | | | |
| Classes | |
| A | | B | | | C | | | I | | | R1 | | | R2 | | | R3 | | | R4 | | | R6 (formerly
Class R5) | |
| 1.39% | | | 2.14% | | | | 2.14% | | | | 1.14% | | | | 2.14% | | | | 1.64% | | | | 1.39% | | | | 1.14% | | | | 1.10% | |
This written agreement will continue until modified by the fund’s Board of Trustees, but such agreement will continue at least until June 30, 2018. For the year ended February 28, 2017, this reduction amounted to $237,173, which is included in the reduction of total expenses in the Statement of Operations.
Distributor – MFS Fund Distributors, Inc. (MFD), a wholly-owned subsidiary of MFS, as distributor, received $310,723 for the year ended February 28, 2017, as its portion of the initial sales charge on sales of Class A shares of the fund.
The Board of Trustees has adopted a distribution plan for certain share classes pursuant to Rule 12b-1 of the Investment Company Act of 1940.
The fund’s distribution plan provides that the fund will pay MFD for services provided by MFD and financial intermediaries in connection with the distribution and servicing of certain share classes. One component of the plan is a distribution fee paid to MFD and another component of the plan is a service fee paid to MFD. MFD may subsequently pay all, or a portion, of the distribution and/or service fees to financial intermediaries.
Distribution Plan Fee Table:
| | | | | | | | | | | | | | | | | | | | |
| | | Distribution Fee Rate (d) | | | Service Fee Rate (d) | | | Total Distribution Plan (d) | | | Annual Effective Rate (e) | | | Distribution and Service Fee | |
| Class A | | | — | | | | 0.25% | | | | 0.25% | | | | 0.25% | | | | $272,624 | |
| Class B | | | 0.75% | | | | 0.25% | | | | 1.00% | | | | 1.00% | | | | 30,628 | |
| Class C | | | 0.75% | | | | 0.25% | | | | 1.00% | | | | 1.00% | | | | 477,408 | |
| Class R1 | | | 0.75% | | | | 0.25% | | | | 1.00% | | | | 1.00% | | | | 2,268 | |
| Class R2 | | | 0.25% | | | | 0.25% | | | | 0.50% | | | | 0.50% | | | | 3,900 | |
| Class R3 | | | — | | | | 0.25% | | | | 0.25% | | | | 0.25% | | | | 11,731 | |
| Total Distribution and Service Fees | | | | $798,559 | |
| (d) | In accordance with the distribution plan for certain classes, the fund pays distribution and/or service fees equal to these annual percentage rates of each class’s average daily net assets. The distribution and service fee rates disclosed by class represent the current rates in effect at the end of the reporting period. Any rate changes, if applicable, are detailed below. |
32
Notes to Financial Statements – continued
| (e) | The annual effective rates represent actual fees incurred under the distribution plan for the year ended February 28, 2017 based on each class’s average daily net assets. MFD has voluntarily agreed to rebate a portion of each class’s 0.25% service fee attributable to accounts for which MFD retains the 0.25% service fee except for accounts attributable to MFS or its affiliates’ seed money. For the year ended February 28, 2017, this rebate amounted to $560, $11, and $58 for Class A, Class B, and Class C, respectively, and is included in the reduction of total expenses in the Statement of Operations. |
Certain Class A shares are subject to a contingent deferred sales charge (CDSC) in the event of a shareholder redemption within 18 months of purchase. Class C shares are subject to a CDSC in the event of a shareholder redemption within 12 months of purchase. Class B shares are subject to a CDSC in the event of a shareholder redemption within six years of purchase. All contingent deferred sales charges are paid to MFD and during the year ended February 28, 2017, were as follows:
| | | | |
| | | Amount | |
| Class A | | | $3,427 | |
| Class B | | | 7,542 | |
| Class C | | | 7,922 | |
Shareholder Servicing Agent – MFS Service Center, Inc. (MFSC), a wholly-owned subsidiary of MFS, receives a fee from the fund for its services as shareholder servicing agent calculated as a percentage of the average daily net assets of the fund as determined periodically under the supervision of the fund’s Board of Trustees. For the year ended February 28, 2017, the fee was $21,692, which equated to 0.0038% annually of the fund’s average daily net assets. MFSC also receives payment from the fund for out-of-pocket expenses, sub-accounting and other shareholder servicing costs which may be paid to affiliated and unaffiliated service providers. Class R6 shares do not incur sub-accounting fees. For the year ended February 28, 2017, these out-of-pocket expenses, sub-accounting and other shareholder servicing costs amounted to $373,690.
Under a Special Servicing Agreement among MFS, certain MFS funds which invest in other MFS funds (“MFS fund-of-funds”) and certain underlying funds in which a MFS fund-of-funds invests (“underlying funds”), each underlying fund may pay a portion of each MFS fund-of-funds’ transfer agent-related expenses, including sub-accounting fees payable to financial intermediaries, to the extent such payments do not exceed the benefits realized or expected to be realized by the underlying fund from the investment in the underlying fund by the MFS fund-of-funds. For the period from March 1, 2016 through August 31, 2016, these costs for the fund amounted to $405,160 and are included in “Shareholder servicing costs” in the Statement of Operations. Effective September 1, 2016, the fund no longer participates in this agreement.
Administrator – MFS provides certain financial, legal, shareholder communications, compliance, and other administrative services to the fund. Under an administrative services agreement, the fund reimburses MFS the costs incurred to provide these services. The fund is charged an annual fixed amount of $17,500 plus a fee based on average daily net assets. The administrative services fee incurred for the year ended February 28, 2017 was equivalent to an annual effective rate of 0.0171% of the fund’s average daily net assets.
33
Notes to Financial Statements – continued
Trustees’ and Officers’ Compensation – The fund pays compensation to independent Trustees in the form of a retainer, attendance fees, and additional compensation to Board and Committee chairpersons. The fund does not pay compensation directly to Trustees or officers of the fund who are also officers of the investment adviser, all of whom receive remuneration for their services to the fund from MFS. Certain officers and Trustees of the fund are officers or directors of MFS, MFD, and MFSC.
Other – This fund and certain other funds managed by MFS (the funds) have entered into a service agreement (the ISO Agreement) which provides for payment of fees solely by the funds to Tarantino LLC in return for the provision of services of an Independent Senior Officer (ISO) for the funds. Frank L. Tarantino serves as the ISO and is an officer of the funds and the sole member of Tarantino LLC. The funds can terminate the ISO Agreement with Tarantino LLC at any time under the terms of the ISO Agreement. For the year ended February 28, 2017, the fee paid by the fund under this agreement was $1,064 and is included in “Miscellaneous” expense in the Statement of Operations. MFS has agreed to bear all expenses associated with office space, other administrative support, and supplies provided to the ISO.
The fund invests in the MFS Institutional Money Market Portfolio which is managed by MFS and seeks current income consistent with preservation of capital and liquidity. This money market fund does not pay a management fee to MFS.
On September 9, 2015, MFS redeemed 12,405, 8,326, 8,437, 8,531, and 8,639 shares of Class C, Class R1, Class R2, Class R3, and Class R4, respectively, for an aggregate amount of $572,341. On March 16, 2016, MFS redeemed 10,616 shares of Class I for an aggregate amount of $128,342. On June 29, 2016, MFS redeemed 4,082 shares of Class R3 for an aggregate amount of $51,760.
The fund is permitted to engage in purchase and sale transactions (“cross-trades”) with funds and accounts for which MFS serves as investment adviser or sub-adviser pursuant to a policy adopted by the Board of Trustees. This policy has been designed to ensure that cross-trades conducted by the fund comply with Rule 17a-7 under the Investment Company Act of 1940. Under this policy, cross-trades are effected at current market prices with no remuneration paid in connection with the transaction. During the year ended February 28, 2017, the fund engaged in purchase and sale transactions pursuant to this policy, which amounted to $607,525 and $3,728,788, respectively. The sales transactions resulted in net realized gains (losses) of $11,209.
(4) Portfolio Securities
For the year ended February 28, 2017, purchases and sales of investments, other than short-term obligations, aggregated $623,078,094 and $344,156,027, respectively.
34
Notes to Financial Statements – continued
(5) Shares of Beneficial Interest
The fund’s Declaration of Trust permits the Trustees to issue an unlimited number of full and fractional shares of beneficial interest. Transactions in fund shares were as follows:
| | | | | | | | | | | | | | | | |
| | | Year ended
2/28/17 | | | Year ended
2/29/16 | |
| | | Shares | | | Amount | | | Shares | | | Amount | |
| Shares sold | | | | | | | | | | | | | | | | |
Class A | | | 10,572,308 | | | | $146,078,659 | | | | 3,499,198 | | | | $42,931,152 | |
Class B | | | 278,540 | | | | 3,808,776 | | | | 56,066 | | | | 693,707 | |
Class C | | | 1,342,515 | | | | 18,024,707 | | | | 2,856,705 | | | | 35,401,194 | |
Class I | | | 15,118,518 | | | | 212,258,680 | | | | 2,698,037 | | | | 32,598,964 | |
Class R1 | | | 9,576 | | | | 133,936 | | | | 8,401 | | | | 99,864 | |
Class R2 | | | 49,281 | | | | 690,710 | | | | 24,600 | | | | 312,596 | |
Class R3 | | | 832,454 | | | | 11,966,668 | | | | 186,600 | | | | 2,227,977 | |
Class R4 | | | 144,231 | | | | 2,088,076 | | | | 49,993 | | | | 645,472 | |
Class R6 (formerly Class R5) | | | 4,627,016 | | | | 68,409,141 | | | | 1,511,181 | | | | 18,510,462 | |
| | | 32,974,439 | | | | $463,459,353 | | | | 10,890,781 | | | | $133,421,388 | |
| | | | |
| Shares issued to shareholders in reinvestment of distributions | | | | | | | | | | | | | | | | |
Class A | | | 434,140 | | | | $6,244,914 | | | | 106,029 | | | | $1,256,449 | |
Class B | | | 11,476 | | | | 160,970 | | | | 3,703 | | | | 43,028 | |
Class C | | | 155,133 | | | | 2,160,472 | | | | 84,508 | | | | 976,914 | |
Class I | | | 393,274 | | | | 5,692,541 | | | | 51,908 | | | | 617,184 | |
Class R1 | | | 749 | | | | 10,479 | | | | 417 | | | | 4,842 | |
Class R2 | | | 2,692 | | | | 38,665 | | | | 1,298 | | | | 15,382 | |
Class R3 | | | 10,904 | | | | 156,814 | | | | 3,419 | | | | 40,617 | |
Class R4 | | | 4,074 | | | | 58,960 | | | | 1,566 | | | | 18,639 | |
Class R6 (formerly Class R5) | | | 897,854 | | | | 12,913,008 | | | | 805,608 | | | | 9,578,675 | |
| | | 1,910,296 | | | | $27,436,823 | | | | 1,058,456 | | | | $12,551,730 | |
| | | | |
| Shares reacquired | | | | | | | | | | | | | | | | |
Class A | | | (2,964,975 | ) | | | $(42,244,629 | ) | | | (390,225 | ) | | | $(4,781,082 | ) |
Class B | | | (26,302 | ) | | | (356,871 | ) | | | (39,188 | ) | | | (469,022 | ) |
Class C | | | (325,354 | ) | | | (4,401,666 | ) | | | (95,473 | ) | | | (1,139,717 | ) |
Class I | | | (2,167,786 | ) | | | (30,202,526 | ) | | | (1,058,108 | ) | | | (13,094,713 | ) |
Class R1 | | | (13,827 | ) | | | (189,877 | ) | | | (14,601 | ) | | | (176,140 | ) |
Class R2 | | | (17,073 | ) | | | (241,744 | ) | | | (23,306 | ) | | | (290,888 | ) |
Class R3 | | | (81,649 | ) | | | (1,151,799 | ) | | | (63,474 | ) | | | (778,954 | ) |
Class R4 | | | (37,512 | ) | | | (533,842 | ) | | | (14,236 | ) | | | (177,090 | ) |
Class R6 (formerly Class R5) | | | (7,865,928 | ) | | | (109,291,281 | ) | | | (997,121 | ) | | | (13,044,425 | ) |
| | | (13,500,406 | ) | | | $(188,614,235 | ) | | | (2,695,732 | ) | | | $(33,952,031 | ) |
35
Notes to Financial Statements – continued
| | | | | | | | | | | | | | | | |
| | | Year ended
2/28/17 | | | Year ended
2/29/16 | |
| | | Shares | | | Amount | | | Shares | | | Amount | |
| Net change | | | | | | | | | | | | | | | | |
Class A | | | 8,041,473 | | | | $110,078,944 | | | | 3,215,002 | | | | $39,406,519 | |
Class B | | | 263,714 | | | | 3,612,875 | | | | 20,581 | | | | 267,713 | |
Class C | | | 1,172,294 | | | | 15,783,513 | | | | 2,845,740 | | | | 35,238,391 | |
Class I | | | 13,344,006 | | | | 187,748,695 | | | | 1,691,837 | | | | 20,121,435 | |
Class R1 | | | (3,502 | ) | | | (45,462 | ) | | | (5,783 | ) | | | (71,434 | ) |
Class R2 | | | 34,900 | | | | 487,631 | | | | 2,592 | | | | 37,090 | |
Class R3 | | | 761,709 | | | | 10,971,683 | | | | 126,545 | | | | 1,489,640 | |
Class R4 | | | 110,793 | | | | 1,613,194 | | | | 37,323 | | | | 487,021 | |
Class R6 (formerly Class R5) | | | (2,341,058 | ) | | | (27,969,132 | ) | | | 1,319,668 | | | | 15,044,712 | |
| | | 21,384,329 | | | | $302,281,941 | | | | 9,253,505 | | | | $112,021,087 | |
Effective August 26, 2016, Class R5 shares were renamed Class R6 shares.
The fund is one of several mutual funds in which certain MFS funds may invest. The MFS funds do not invest in the underlying funds for the purpose of exercising management or control. At the end of the period, the MFS Growth Allocation Fund, the MFS Moderate Allocation Fund, the MFS Aggressive Growth Allocation Fund, the MFS Conservative Allocation Fund, the MFS Lifetime 2040 Fund, and the MFS Lifetime 2030 Fund were the owners of record of approximately 12%, 10%, 5%, 3%, 1%, and 1%, respectively, of the value of outstanding voting shares of the fund. In addition, the MFS Lifetime 2020 Fund, the MFS Lifetime 2025 Fund, the MFS Lifetime 2035 Fund, the MFS Lifetime 2045 Fund, the MFS Lifetime 2050 Fund, the MFS Lifetime 2055 Fund, the MFS Lifetime 2060 Fund, and the MFS Lifetime Income Fund were each the owners of record of less than 1% of the value of outstanding voting shares of the fund.
(6) Line of Credit
The fund and certain other funds managed by MFS participate in a $1.25 billion unsecured committed line of credit, subject to a $1 billion sublimit, provided by a syndication of banks under a credit agreement. Borrowings may be made for temporary financing needs. Interest is charged to each fund, based on its borrowings, generally at a rate equal to the higher of the Overnight Federal Reserve funds rate or daily one month LIBOR plus an agreed upon spread. A commitment fee, based on the average daily, unused portion of the committed line of credit, is allocated among the participating funds at the end of each calendar quarter. In addition, the fund and other funds managed by MFS have established unsecured uncommitted borrowing arrangements with certain banks for temporary financing needs. Interest is charged to each fund, based on its borrowings, at a rate equal to the Overnight Federal Reserve funds rate plus an agreed upon spread. For the year ended February 28, 2017, the fund’s commitment fee and interest expense were $3,130 and $0, respectively, and are included in “Miscellaneous” expense in the Statement of Operations.
36
Notes to Financial Statements – continued
(7) Transactions in Underlying Affiliated Funds-Affiliated Issuers
An affiliated issuer may be considered one in which the fund owns 5% or more of the outstanding voting securities, or a company which is under common control. For the purposes of this report, the fund assumes the following to be an affiliated issuer:
| | | | | | | | | | | | | | | | |
| Underlying Affiliated Fund | | Beginning
Shares/Par
Amount | | | Acquisitions
Shares/Par
Amount | | | Dispositions
Shares/Par
Amount | | | Ending
Shares/Par
Amount | |
MFS Institutional Money
Market Portfolio | | | 10,365,520 | | | | 338,045,303 | | | | (289,517,796 | ) | | | 58,893,027 | |
| | | | |
| Underlying Affiliated Fund | | Realized
Gain (Loss) | | | Capital Gain
Distributions | | | Dividend
Income | | | Ending
Value | |
MFS Institutional Money
Market Portfolio | | | $(108 | ) | | | $— | | | | $48,604 | | | | $58,893,027 | |
37
REPORT OF INDEPENDENT REGISTERED PUBLIC ACCOUNTING FIRM
To the Board of Trustees of MFS Series Trust XIII and Shareholders of MFS New Discovery Value Fund:
We have audited the accompanying statement of assets and liabilities, including the portfolio of investments, of MFS New Discovery Value Fund (the Fund) (one of the series constituting the MFS Series Trust XIII) as of February 28, 2017, and the related statement of operations for the year then ended, the statements of changes in net assets for each of the two years in the period then ended and the financial highlights for each of the periods indicated therein. These financial statements and financial highlights are the responsibility of the Fund’s management. Our responsibility is to express an opinion on these financial statements and financial highlights based on our audits.
We conducted our audits in accordance with the standards of the Public Company Accounting Oversight Board (United States). Those standards require that we plan and perform the audit to obtain reasonable assurance about whether the financial statements and financial highlights are free of material misstatement. We were not engaged to perform an audit of the Fund’s internal control over financial reporting. Our audits included consideration of internal control over financial reporting as a basis for designing audit procedures that are appropriate in the circumstances, but not for the purpose of expressing an opinion on the effectiveness of the Fund’s internal control over financial reporting. Accordingly, we express no such opinion. An audit also includes examining, on a test basis, evidence supporting the amounts and disclosures in the financial statements and financial highlights, assessing the accounting principles used and significant estimates made by management, and evaluating the overall financial statement presentation. Our procedures included confirmation of securities owned as of February 28, 2017, by correspondence with the custodian and others or by other appropriate auditing procedures where replies from others were not received. We believe that our audits provide a reasonable basis for our opinion.
In our opinion, the financial statements and financial highlights referred to above present fairly, in all material respects, the financial position of MFS New Discovery Value Fund (one of the series constituting the MFS Series Trust XIII) at February 28, 2017, the results of its operations for the year then ended, the changes in its net assets for each of the two years in the period then ended and the financial highlights for each of the periods indicated therein, in conformity with U.S. generally accepted accounting principles.

Boston, Massachusetts
April 13, 2017
38
TRUSTEES AND OFFICERS — IDENTIFICATION AND BACKGROUND
The Trustees and Officers of the Trust, as of April 1, 2017, are listed below, together with their principal occupations during the past five years. (Their titles may have varied during that period.) The address of each Trustee and Officer is 111 Huntington Avenue, Boston, Massachusetts 02199-7618.
| | | | | | | | |
Name, Age | | Position(s) Held with Fund | | Trustee/Officer
Since (h) | | Principal
Occupations During the Past Five Years | | Other Directorships (j) |
| INTERESTED TRUSTEES |
Robert J. Manning (k) (age 53) | | Trustee | | February 2004 | | Massachusetts Financial Services Company, Executive Chairman (since January 2017); Director and Chairman of the Board; Chief Executive Officer (until 2015); Co-Chief Executive Officer (2015-2016) | | N/A |
Robin A. Stelmach (k) (age 55) | | Trustee | | January 2014 | | Massachusetts Financial Services Company, Vice Chair (since January 2017); Chief Operating Officer and Executive Vice President (until January 2017) | | N/A |
| INDEPENDENT TRUSTEES | | | | | | |
David H. Gunning
(age 74) | | Trustee and Chair of Trustees | | January 2004 | | Private investor | | Lincoln Electric Holdings, Inc., Director; Development Alternatives, Inc., Director/Non-Executive Chairman |
39
Trustees and Officers – continued
| | | | | | | | |
Name, Age | | Position(s) Held with Fund | | Trustee/Officer
Since (h) | | Principal
Occupations During the Past Five Years | | Other Directorships (j) |
Steven E. Buller
(age 65) | | Trustee | | February 2014 | | Chairman, Financial Accounting Standards Advisory Council (until 2015); Standing Advisory Group, Public Company Accounting Oversight Board, Member (until 2014); BlackRock, Inc. (investment management), Managing Director (until 2014), BlackRock Finco UK (investment management), Director (until 2014) | | N/A |
John A. Caroselli
(age 63) | | Trustee | | March 2017 | | JC Global Advisors, LLC, President; First Capital Corporation, Executive Vice President (until 2015) | | N/A |
Maureen R. Goldfarb
(age 61) | | Trustee | | January 2009 | | Private investor | | N/A |
Michael Hegarty
(age 72) | | Trustee | | December 2004 | | Private investor | | Rouse Properties Inc., Director; Capmark Financial Group Inc., Director (until 2015) |
John P. Kavanaugh
(age 62) | | Trustee and Vice Chair of Trustees | | January 2009 | | Private investor | | N/A |
Clarence Otis, Jr.
(age 61) | | Trustee | | March 2017 | | Darden Restaurants, Inc., Chief Executive Officer (until 2014) | | VF Corporation, Director; Verizon Communications, Inc., Director; Federal Reserve Bank of Atlanta, Director (until 2015) |
Maryanne L. Roepke
(age 61) | | Trustee | | May 2014 | | American Century Investments (investment management), Senior Vice President and Chief Compliance Officer (until 2014) | | N/A |
40
Trustees and Officers – continued
| | | | | | | | |
Name, Age | | Position(s) Held with Fund | | Trustee/Officer
Since (h) | | Principal
Occupations During the Past Five Years | | Other Directorships (j) |
Laurie J. Thomsen
(age 59) | | Trustee | | March 2005 | | Private investor | | The Travelers Companies, Director; Dycom Industries, Inc., Director |
| OFFICERS | | | | | | |
Christopher R. Bohane (k)
(age 43) | | Assistant Secretary and Assistant Clerk | | July 2005 | | Massachusetts Financial Services Company, Vice President and Assistant General Counsel | | N/A |
Kino Clark (k)
(age 48) | | Assistant Treasurer | | January 2012 | | Massachusetts Financial Services Company, Vice President | | N/A |
Thomas H. Connors (k)
(age 57) | | Assistant Secretary and Assistant Clerk | | September 2012 | | Massachusetts Financial Services Company, Vice President and Senior Counsel; Deutsche Investment Management Americas Inc. (financial service provider), Director and Senior Counsel (until 2012) | | N/A |
Ethan D. Corey (k)
(age 53) | | Assistant Secretary and Assistant Clerk | | July 2005 | | Massachusetts Financial Services Company, Senior Vice President and Associate General Counsel | | N/A |
David L. DiLorenzo (k)
(age 48) | | President | | July 2005 | | Massachusetts Financial Services Company, Senior Vice President | | N/A |
Brian E. Langenfeld (k)
(age 44) | | Assistant Secretary and Assistant Clerk | | June 2006 | | Massachusetts Financial Services Company, Vice President and Senior Counsel | | N/A |
Susan A. Pereira (k)
(age 46) | | Assistant Secretary and Assistant Clerk | | July 2005 | | Massachusetts Financial Services Company, Vice President and Senior Counsel | | N/A |
41
Trustees and Officers – continued
| | | | | | | | |
Name, Age | | Position(s) Held with Fund | | Trustee/Officer
Since (h) | | Principal
Occupations During the Past Five Years | | Other Directorships (j) |
Kasey L. Phillips (k)
(age 46) | | Assistant Treasurer | | September 2012 | | Massachusetts Financial Services Company, Vice President; Wells Fargo Funds Management, LLC, Senior Vice President, Fund Treasurer (until 2012) | | N/A |
Mark N. Polebaum (k)
(age 64) | | Secretary and Clerk | | January 2006 | | Massachusetts Financial Services Company, Executive Vice President; General Counsel and Secretary (until March 2017) | | N/A |
Matthew A. Stowe (k)
(age 42) | | Assistant Secretary and Assistant Clerk | | October 2014 | | Massachusetts Financial Services Company, Vice President and Assistant General Counsel | | N/A |
Frank L. Tarantino
(age 73) | | Independent Senior Officer | | June 2004 | | Tarantino LLC (provider of compliance services), Principal | | N/A |
Richard S. Weitzel (k)
(age 46) | | Assistant Secretary and Assistant Clerk | | October 2007 | | Massachusetts Financial Services Company, Senior Vice President and Associate General Counsel | | N/A |
Martin J. Wolin (k)
(age 49) | | Chief Compliance Officer | | July 2015 | | Massachusetts Financial Services Company, Senior Vice President and Chief Compliance Officer (since July 2015); Mercer (financial service provider), Chief Risk and Compliance Officer, North America and Latin America (until June 2015) | | N/A |
James O. Yost (k)
(age 56) | | Treasurer | | September 1990 | | Massachusetts Financial Services Company, Senior Vice President | | N/A |
42
Trustees and Officers – continued
| (h) | Date first appointed to serve as Trustee/officer of an MFS Fund. Each Trustee has served continuously since appointment unless indicated otherwise. For the period from December 15, 2004 until February 22, 2005, Mr. Manning served as Advisory Trustee. Prior to January 2012, Messrs. DiLorenzo and Yost served as Assistant Treasurers of the Funds. From January 2012 through December 2016, Messrs. DiLorenzo and Yost served as Treasurer and Deputy Treasurer of the Funds, respectively. |
| (j) | Directorships or trusteeships of companies required to report to the Securities and Exchange Commission (i.e., “public companies”). |
| (k) | “Interested person” of the Trust within the meaning of the Investment Company Act of 1940 (referred to as the 1940 Act), which is the principal federal law governing investment companies like the fund, as a result of a position with MFS. The address of MFS is 111 Huntington Avenue, Boston, Massachusetts 02199-7618. |
Each Trustee has been elected by shareholders and each Trustee and officer holds office until his or her successor is chosen and qualified or until his or her earlier death, resignation, retirement or removal. The Trust does not hold annual meetings for the purpose of electing Trustees, and Trustees are not elected for fixed terms. Messrs. Buller, Kavanaugh and Otis and Ms. Roepke are members of the Trust’s Audit Committee.
Each of the Fund’s Trustees and officers holds comparable positions with certain other funds of which MFS or a subsidiary is the investment adviser or distributor, and, in the case of the officers, with certain affiliates of MFS. As of April 1, 2017, except for Messrs. Caroselli and Otis, the Trustees served as board members of 136 funds within the MFS Family of Funds. As of April 1, 2017, Messrs. Caroselli and Otis served as board members of 125 funds within the MFS Family of Funds.
The Statement of Additional Information for a Fund includes further information about the Trustees and is available without charge upon request by calling 1-800-225-2606.
| | |
| Investment Adviser | | Custodian |
Massachusetts Financial Services Company
111 Huntington Avenue
Boston, MA 02199-7618 | | State Street Bank and Trust Company 1 Lincoln Street Boston, MA 02111-2900 |
| Distributor | | Independent Registered Public Accounting Firm |
MFS Fund Distributors, Inc.
111 Huntington Avenue
Boston, MA 02199-7618 | | Ernst & Young LLP 200 Clarendon Street Boston, MA 02116 |
| Portfolio Manager | | |
Kevin Schmitz | | |
43
PROXY VOTING POLICIES AND INFORMATION
MFS votes proxies on behalf of the fund pursuant to proxy voting policies and procedures that are available without charge, upon request, by calling 1-800-225-2606, by visiting mfs.com (once you have selected “Individual Investor” as your role, click on “Individual Investor Home” in the top navigation and then select “Learn More About Proxy Voting” under the “I want to…” header on the left hand column of the page), or by visiting the SEC’s Web site at http://www.sec.gov.
Information regarding how the fund voted proxies relating to portfolio securities during the most recent twelve-month period ended June 30 is available by August 31 of each year without charge by visiting mfs.com (once you have selected “Individual Investor” as your role, click on “Individual Investor Home” in the top navigation and then select “Learn More About Proxy Voting” under the “I want to…” header on the left hand column of the page), or by visiting the SEC’s Web site at http://www.sec.gov.
QUARTERLY PORTFOLIO DISCLOSURE
The fund will file a complete schedule of portfolio holdings with the Securities and Exchange Commission (the Commission) for the first and third quarters of each fiscal year on Form N-Q. A shareholder can obtain the quarterly portfolio holdings report at mfs.com. The fund’s Form N-Q is also available on the EDGAR database on the Commission’s Internet Web site at http://www.sec.gov, and may be reviewed and copied at the:
Public Reference Room
Securities and Exchange Commission
100 F Street, NE, Room 1580
Washington, D.C. 20549
Information on the operation of the Public Reference Room may be obtained by calling the Commission at 1-800-SEC-0330. Copies of the fund’s Form N-Q also may be obtained, upon payment of a duplicating fee, by electronic request at the following e-mail address: publicinfo@sec.gov or by writing the Public Reference Section at the above address.
FURTHER INFORMATION
From time to time, MFS may post important information about the fund or the MFS funds on the MFS web site (mfs.com). This information is available on mfs.com by following these steps once you have selected “Individual Investor” as your role: (1) Click on the “Individual Investor Home” in the top navigation and then select the “Announcements” option within the “Market Outlooks” drop down, or (2) Click on “Products & Services” and “Mutual Funds” and then choose the fund’s name in the “Select a fund” menu.
44
INFORMATION ABOUT FUND CONTRACTS AND LEGAL CLAIMS
The fund has entered into contractual arrangements with an investment adviser, administrator, distributor, shareholder servicing agent, 529 program manager (if applicable), and custodian who each provide services to the fund. Unless expressly stated otherwise, shareholders are not parties to, or intended beneficiaries of these contractual arrangements, and these contractual arrangements are not intended to create any shareholder right to enforce them against the service providers or to seek any remedy under them against the service providers, either directly or on behalf of the fund.
Under the Trust’s By-Laws and Declaration of Trust, any claims asserted against or on behalf of the MFS Funds, including claims against Trustees and Officers, must be brought in state and federal courts located within the Commonwealth of Massachusetts.
FEDERAL TAX INFORMATION (unaudited)
The fund will notify shareholders of amounts for use in preparing 2017 income tax forms in January 2018. The following information is provided pursuant to provisions of the Internal Revenue Code.
The fund designates the maximum amount allowable as qualified dividend income eligible to be taxed at the same rate as long-term capital gain.
The fund designates $22,088,000 as capital gain dividends paid during the fiscal year.
For corporate shareholders, 31.38% of the ordinary income dividends paid during the fiscal year qualify for the corporate dividends received deduction.
45
rev. 3/16
| | | | |
| | | |
FACTS | | WHAT DOES MFS DO WITH YOUR PERSONAL INFORMATION? | |  |
| | |
| Why? | | Financial companies choose how they share your personal information. Federal law gives consumers the right to limit some but not all sharing. Federal law also requires us to tell you how we collect, share, and protect your personal information. Please read this notice carefully to understand what we do. |
| | |
| What? | | The types of personal information we collect and share depend on the product or service you have with us. This information can include: • Social Security number and account balances • Account transactions and transaction history • Checking account information and wire transfer instructions When you are no longer our customer, we continue to share your information as described in this notice. |
| | |
| How? | | All financial companies need to share customers’ personal information to run their everyday business. In the section below, we list the reasons financial companies can share their customers’ personal information; the reasons MFS chooses to share; and whether you can limit this sharing. |
| | | | |
Reasons we can share your
personal information | | Does MFS
share? | | Can you limit
this sharing? |
For our everyday business purposes – such as to process your transactions, maintain your account(s), respond to court orders and legal investigations, or report to credit bureaus | | Yes | | No |
For our marketing purposes – to offer our products and services to you | | No | | We don’t share |
For joint marketing with other financial companies | | No | | We don’t share |
For our affiliates’ everyday business purposes – information about your transactions and experiences | | No | | We don’t share |
For our affiliates’ everyday business purposes – information about your creditworthiness | | No | | We don’t share |
| For nonaffiliates to market to you | | No | | We don’t share |
| | |
| Questions? | | Call 800-225-2606 or go to mfs.com. |
46
| | |
| Who we are |
| Who is providing this notice? | | MFS Funds, MFS Investment Management, MFS Institutional Advisors, Inc., and MFS Heritage Trust Company. |
| | |
| What we do |
| How does MFS protect my personal information? | | To protect your personal information from unauthorized access and use, we use security measures that comply with federal law. These measures include procedural, electronic, and physical safeguards for the protection of the personal information we collect about you. |
| How does MFS collect my personal information? | | We collect your personal information, for example, when you • open an account or provide account information • direct us to buy securities or direct us to sell your securities • make a wire transfer We also collect your personal information from others, such as credit bureaus, affiliates, or other companies. |
| Why can’t I limit all sharing? | | Federal law gives you the right to limit only • sharing for affiliates’ everyday business purposes – information about your creditworthiness • affiliates from using your information to market to you • sharing for nonaffiliates to market to you State laws and individual companies may give you additional rights to limit sharing. |
| | |
| Definitions |
| Affiliates | | Companies related by common ownership or control. They can be financial and nonfinancial companies. • MFS does not share personal information with affiliates, except for everyday business purposes as described on page one of this notice. |
| Nonaffiliates | | Companies not related by common ownership or control. They can be financial and nonfinancial companies. • MFS does not share with nonaffiliates so they can market to you. |
| Joint marketing | | A formal agreement between nonaffiliated financial companies that together market financial products or services to you. • MFS doesn’t jointly market. |
| | |
| Other important information |
| If you own an MFS product or receive an MFS service in the name of a third party such as a bank or broker-dealer, their privacy policy may apply to you instead of ours. |
47
Save paper with eDelivery.

| MFS® will send you prospectuses, |
reports, and proxies directly via e-mail so you will get information faster with less mailbox clutter.
To sign up:
1. Go to mfs.com.
2. Log in via MFS® Access.
3. Select eDelivery.
If you own your MFS fund shares through a financial institution or a retirement plan, MFS® TALK, MFS® Access, or eDelivery may not be available to you.
CONTACT
WEB SITE
mfs.com
MFS TALK
1-800-637-8255
24 hours a day
ACCOUNT SERVICE AND LITERATURE
Shareholders
1-800-225-2606
Financial advisors
1-800-343-2829
Retirement plan services
1-800-637-1255
MAILING ADDRESS
MFS Service Center, Inc.
P.O. Box 55824
Boston, MA 02205-5824
OVERNIGHT MAIL
MFS Service Center, Inc.
c/o Boston Financial Data Services
30 Dan Road
Canton, MA 02021-2809
The Registrant has adopted a Code of Ethics pursuant to Section 406 of the Sarbanes-Oxley Act and as defined in Form N-CSR that applies to the Registrant’s principal executive officer and principal financial and accounting officer. Effective January 1, 2017, the Code was amended to (i) clarify that the term “for profit” company as used in Section II.B of the Code excludes the investment adviser and its subsidiaries and pooled investment vehicles sponsored by the investment adviser or its subsidiaries, (ii) align the Code’s provisions regarding receipt of gifts and entertainment in Section II.B of the Code with the gifts and entertainment policy of the Funds’ investment adviser, and (iii) make other administrative changes. During the period covered by the report, the Registrant did not grant a waiver, including an implicit waiver, from any provision of the Code.
A copy of the amended Code of Ethics effective as of January 1, 2017 is filed as an exhibit to this Form N-CSR.
| ITEM 3. | AUDIT COMMITTEE FINANCIAL EXPERT. |
Messrs. Steven E. Buller and John P. Kavanaugh and Ms. Maryanne L. Roepke, members of the Audit Committee, have been determined by the Board of Trustees in their reasonable business judgment to meet the definition of “audit committee financial expert” as such term is defined in Form N-CSR. In addition, Messrs. Buller and Kavanaugh and Ms. Roepke are “independent” members of the Audit Committee (as such term has been defined by the Securities and Exchange Commission in regulations implementing Section 407 of the Sarbanes-Oxley Act of 2002). The Securities and Exchange Commission has stated that the designation of a person as an audit committee financial expert pursuant to this Item 3 on the Form N-CSR does not impose on such a person any duties, obligations or liability that are greater than the duties, obligations or liability imposed on such person as a member of the Audit Committee and the Board of Trustees in the absence of such designation or identification. Effective April 1, 2017, Mr. Clarence Otis, Jr. became a member of the Audit Committee.
| ITEM 4. | PRINCIPAL ACCOUNTANT FEES AND SERVICES. |
Items 4(a) through 4(d) and 4(g):
The Board of Trustees has appointed Deloitte & Touche LLP (“Deloitte”) to serve as independent accountants to a series of the Registrant and Ernst & Young LLP (“E&Y”) to serve in the same capacity to the other series of the Registrant (each a “Fund” and collectively the “Funds”). The tables below set forth the audit fees billed to each Fund as well as fees for non-audit services provided to each Fund and/or to the Fund’s investment adviser, Massachusetts Financial Services Company (“MFS”), and to various entities either controlling, controlled by, or under common control with MFS that provide ongoing services to the Funds (“MFS Related Entities”).
For the fiscal years ended February 28, 2017 and February 29, 2016, respectively, audit fees billed to each Fund by Deloitte and E&Y were as follows:
| | | | | | | | |
| | | Audit Fees | |
| | 2017 | | | 2016 | |
Fees billed by Deloitte: | | | | | | | | |
MFS Government Securities Fund | | | 52,554 | | | | 51,539 | |
| |
| | | Audit Fees | |
| | 2017 | | | 2016 | |
Fees billed by E&Y: | | | | | | | | |
MFS Diversified Income Fund | | | 56,262 | | | | 54,646 | |
MFS New Discovery Value Fund | | | 44,369 | | | | 43,100 | |
| | | | | | | | |
Total | | | 100,631 | | | | 97,746 | |
For the fiscal years ended February 28, 2017 and February 29, 2016, respectively, fees billed by Deloitte and E&Y for audit-related, tax and other services provided to each Fund and for audit-related, tax and other services provided to MFS and MFS Related Entities were as follows:
| | | | | | | | | | | | | | | | | | | | | | | | |
| | | Audit-Related Fees1 | | | Tax Fees2 | | | All Other Fees3 | |
| | | 2017 | | | 2016 | | | 2017 | | | 2016 | | | 2017 | | | 2016 | |
Fees billed by Deloitte: | | | | | | | | | | | | | | | | | | | | | | | | |
To MFS Government Securities Fund | | | 0 | | | | 0 | | | | 6,891 | | | | 6,789 | | | | 0 | | | | 0 | |
| | | |
| | | Audit-Related Fees1 | | | Tax Fees2 | | | All Other Fees3 | |
| | | 2017 | | | 2016 | | | 2017 | | | 2016 | | | 2017 | | | 2016 | |
Fees billed by Deloitte: | | | | | | | | | | | | | | | | | | | | | | | | |
To MFS and MFS Related Entities of MFS Government Securities Fund* | | | 0 | | | | 0 | | | | 0 | | | | 0 | | | | 5,000 | | | | 5,000 | |
| | | | | | | | |
| | | Aggregate fees for non-audit
services | |
| | | 2017 | | | 2016 | |
Fees billed by Deloitte: | | | | | | | | |
To MFS Government Securities Fund, MFS and MFS Related Entities# | | | 526,960 | | | | 11,789 | |
| | | | | | | | | | | | | | | | | | | | | | | | |
| | | Audit-Related Fees1 | | | Tax Fees2 | | | All Other Fees4 | |
| | | 2017 | | | 2016 | | | 2017 | | | 2016 | | | 2017 | | | 2016 | |
Fees billed by E&Y: | | | | | | | | | | | | | | | | | | | | | | | | |
To MFS Diversified Income Fund | | | 0 | | | | 0 | | | | 8,278 | | | | 8,052 | | | | 2,354 | | | | 2,169 | |
To MFS New Discovery Value Fund | | | 0 | | | | 0 | | | | 11,329 | | | | 8,102 | | | | 1,421 | | | | 1,139 | |
Total fees billed by E&Y To above Funds | | | 0 | | | | 0 | | | | 19,607 | | | | 16,154 | | | | 3,775 | | | | 3,308 | |
| | | |
| | | Audit-Related Fees1 | | | Tax Fees2 | | | All Other Fees4 | |
| | | 2017 | | | 2016 | | | 2017 | | | 2016 | | | 2017 | | | 2016 | |
Fees billed by E&Y: | | | | | | | | | | | | | | | | | | | | | | | | |
To MFS and MFS Related Entities of MFS Diversified Income Fund* | | | 1,079,010 | | | | 1,786,175 | | | | 0 | | | | 0 | | | | 99,450 | | | | 149,169 | |
To MFS and MFS Related Entities of MFS New Discovery Value Fund * | | | 1,079,010 | | | | 1,786,175 | | | | 0 | | | | 0 | | | | 99,450 | | | | 149,169 | |
| | | | | | | | |
| | | Aggregate fees for non-audit
services | |
| | | 2017 | | | 2016 | |
Fees billed by E&Y: | | | | | | | | |
To MFS Diversified Income Fund, MFS and MFS Related Entities# | | | 1,346,692 | | | | 2,146,565 | |
To MFS New Discovery Value Fund, MFS and MFS Related Entities# | | | 1,348,810 | | | | 2,145,585 | |
| * | This amount reflects the fees billed to MFS and MFS Related Entities for non-audit services relating directly to the operations and financial reporting of the Funds (portions of which services also related to the operations and financial reporting of other funds within the MFS Funds complex). |
| # | This amount reflects the aggregate fees billed by Deloitte or E&Y, as the case may be, for non-audit services rendered to the Funds and for non-audit services rendered to MFS and the MFS Related Entities. |
| 1 | The fees included under “Audit-Related Fees” are fees related to assurance and related services that are reasonably related to the performance of the audit or review of financial statements, but not reported under ‘‘Audit Fees,’’ including accounting consultations, agreed-upon procedure reports, attestation reports, comfort letters and internal control reviews. |
| 2 | The fees included under “Tax Fees” are fees associated with tax compliance, tax advice and tax planning, including services relating to the filing or amendment of federal, state or local income tax returns, regulated investment company qualification reviews and tax distribution and analysis. |
| 3 | The fees included under “All Other Fees” are fees for products and services provided by Deloitte other than those reported under “Audit Fees,” “Audit-Related Fees” and “Tax Fees”. |
| 4 | The fees included under “All Other Fees” are fees for products and services provided by E&Y other than those reported under “Audit Fees,” “Audit-Related Fees” and “Tax Fees,” including fees for services related to reviews of internal controls and review of Rule 38a-1 compliance program. |
Item 4(e)(1):
Set forth below are the policies and procedures established by the Audit Committee of the Board of Trustees relating to the pre-approval of audit and non-audit related services:
To the extent required by applicable law, pre-approval by the Audit Committee of the Board is needed for all audit and permissible non-audit services rendered to the Funds and all permissible non-audit services rendered to MFS or MFS Related Entities if the services relate directly to the operations and financial reporting of the Registrant. Pre-approval is currently on an engagement-by-engagement basis. In the event pre-approval of such services is necessary between regular meetings of the Audit Committee and it is not practical to wait to seek pre-approval at the next regular meeting of the Audit Committee, pre-approval of such services may be referred to the Chair of the Audit Committee for approval; provided that the Chair may not pre-approve any individual engagement for such services exceeding $50,000 or multiple engagements for such services in the aggregate exceeding $100,000 in each period between regular meetings of the Audit Committee. Any engagement pre-approved by the Chair between regular meetings of the Audit Committee shall be presented for ratification by the entire Audit Committee at its next regularly scheduled meeting.
Item 4(e)(2):
None, or 0%, of the services relating to the Audit-Related Fees, Tax Fees and All Other Fees paid by the Fund and MFS and MFS Related Entities relating directly to the operations and financial reporting of the Registrant disclosed above were approved by the audit committee pursuant to paragraphs (c)(7)(i)(C) of Rule 2-01 of Regulation S-X (which permits audit committee approval after the start of the engagement with respect to services other than audit, review or attest services, if certain conditions are satisfied).
Item 4(f): Not applicable.
Item 4(h): The Registrant’s Audit Committee has considered whether the provision by a Registrant’s independent registered public accounting firm of non-audit services to MFS and MFS Related Entities that were not pre-approved by the Committee (because such services did not relate directly to the operations and financial reporting of the Registrant) was compatible with maintaining the independence of the independent registered public accounting firm as the Registrant’s principal auditors.
| ITEM 5. | AUDIT COMMITTEE OF LISTED REGISTRANTS. |
Not applicable to the Registrant.
A schedule of investments of the Registrant is included as part of the report to shareholders of such series under Item 1 of this Form N-CSR.
| ITEM 7. | DISCLOSURE OF PROXY VOTING POLICIES AND PROCEDURES FOR CLOSED-END MANAGEMENT INVESTMENT COMPANIES. |
Not applicable to the Registrant.
| ITEM 8. | PORTFOLIO MANAGERS OF CLOSED-END MANAGEMENT INVESTMENT COMPANIES. |
Not applicable to the Registrant.
| ITEM 9. | PURCHASES OF EQUITY SECURITIES BY CLOSED-END MANAGEMENT INVESTMENT COMPANY AND AFFILIATED PURCHASERS. |
Not applicable to the Registrant.
| ITEM 10. | SUBMISSION OF MATTERS TO A VOTE OF SECURITY HOLDERS. |
There were no material changes to the procedures by which shareholders may send recommendations to the Board for nominees to the Registrant’s Board since the Registrant last provided disclosure as to such procedures in response to the requirements of Item 407 (c)(2)(iv) of Regulation S-K or this Item.
| ITEM 11. | CONTROLS AND PROCEDURES. |
| (a) | Based upon their evaluation of the effectiveness of the registrant’s disclosure controls and procedures (as defined in Rule 30a-3(c) under the Investment Company Act of 1940 (the “Act”)) as conducted within 90 days of the filing date of this report on Form N-CSR, the registrant’s principal financial officer and principal executive officer have concluded that those disclosure controls and procedures provide reasonable assurance that the material information required to be disclosed by the registrant on this report is recorded, processed, summarized and reported within the time periods specified in the Securities and Exchange Commission’s rules and forms. |
| (b) | There were no changes in the registrant’s internal controls over financial reporting (as defined in Rule 30a-3(d) under the Act) that occurred during the second fiscal quarter of the period covered by the report that have materially affected, or are reasonably likely to materially affect, the registrant’s internal control over financial reporting. |
| (a) | File the exhibits listed below as part of this form. Letter or number the exhibits in the sequence indicated. |
| | (1) | Any code of ethics, or amendment thereto, that is the subject of the disclosure required by Item 2, to the extent that the registrant intends to satisfy the Item 2 requirements through filing of an exhibit: Code of Ethics attached hereto. |
| | (2) | A separate certification for each principal executive officer and principal financial officer of the registrant as required by Rule 30a-2(a) under the Act (17 CFR 270.30a-2): Attached hereto. |
| (b) | If the report is filed under Section 13(a) or 15(d) of the Exchange Act, provide the certifications required by Rule 30a-2(b) under the Act (17 CFR 270.30a-2(b)), Rule 13a-14(b) or Rule 15d-14(b) under the Exchange Act (17 CFR 240.13a-14(b) or 240.15d-14(b)) and Section 1350 of Chapter 63 of Title 18 of the United States Code (18 U.S.C. 1350) as an exhibit. A certification furnished pursuant to this paragraph will not be deemed “filed” for the purposes of Section 18 of the Exchange Act (15 U.S.C. 78r), or otherwise subject to the liability of that section. Such certification will not be deemed to be incorporated by reference into any filing under the Securities Act of 1933 or the Exchange Act, except to the extent that the registrant specifically incorporates it by reference: Attached hereto. |
Notice
A copy of the Amended and Restated Declaration of Trust, as amended, of the Registrant is on file with the Secretary of State of The Commonwealth of Massachusetts and notice is hereby given that this instrument is executed on behalf of the Registrant by an officer of the Registrant as an officer and not individually and the obligations of or arising out of this instrument are not binding upon any of the Trustees or shareholders individually, but are binding only upon the assets and property of the respective constituent series of the Registrant.
SIGNATURES
Pursuant to the requirements of the Securities Exchange Act of 1934 and the Investment Company Act of 1940, the registrant has duly caused this report to be signed on its behalf by the undersigned, thereunto duly authorized.
(Registrant) MFS SERIES TRUST XIII
| | |
| By (Signature and Title)* | | DAVID L. DILORENZO |
| | David L. DiLorenzo, President |
Date: April 13, 2017
Pursuant to the requirements of the Securities Exchange Act of 1934 and the Investment Company Act of 1940, this report has been signed below by the following persons on behalf of the registrant and in the capacities and on the dates indicated.
| | |
| By (Signature and Title)* | | DAVID L. DILORENZO |
| | David L. DiLorenzo, President (Principal Executive Officer) |
Date: April 13, 2017
| | |
| By (Signature and Title)* | | JAMES O. YOST |
| | James O. Yost, Treasurer (Principal Financial Officer and Accounting Officer) |
Date: April 13, 2017
| * | Print name and title of each signing officer under his or her signature. |