UNITED STATES
SECURITIES AND EXCHANGE COMMISSION
Washington, D.C. 20549
FORM N-CSR
CERTIFIED SHAREHOLDER REPORT OF
REGISTERED MANAGEMENT INVESTMENT COMPANIES
Investment Company Act file number 811-03327
MFS SERIES TRUST XIII
(Exact name of registrant as specified in charter)
111 Huntington Avenue, Boston, Massachusetts 02199
(Address of principal executive offices) (Zip code)
Susan S. Newton
Massachusetts Financial Services Company
111 Huntington Avenue
Boston, Massachusetts 02199
(Name and address of agents for service)
Registrant’s telephone number, including area code: (617) 954-5000
Date of fiscal year end: The last day of February.
Date of reporting period: February 28, 2013*
* EXPLANATORY NOTE - The Registrant is filing this amendment to its Form N-CSR for the fiscal year ended February 28, 2013, originally filed with the Securities and Exchange Commission on May 2, 2013 (Accession Number 0001193125-13-194677) to amend and restate the financial statements included in the annual report to shareholders of the MFS Global Real Estate Fund (“Global Real Estate Fund”), a series of the Registrant. The purpose of the modification of the Global Real Estate Fund’s financial statements is to correct the erroneous reclassification of a corporate action as a return of capital. The correction of the error resulted in an increase in dividend income and costs of investments and a reduction in unrealized gain on investments over previously reported amounts. The Statement of Assets and Liabilities, Portfolio of Investments, Statement of Operations, Statement of Changes in Net Assets and Financial Highlights in the Global Real Estate Fund’s financial statements have all been amended to correct the error, and a note entitled “Correction Information” has been added to the financial statements as Note 8 to the Notes to Financial Statements to provide further information about the error and the information being corrected. Other than the information described in Note 8 to the Notes to Financial Statements, no other information, including reported investments at value, net assets, changes in net assets from operations, annual total return or net asset value per share, in the Global Real Estate Fund’s financial statements has been changed or requires correction for the error. Other than the aforementioned amendment to the financial statements included in the Global Real Estate Fund’s annual report to shareholders, this Form N-CSR/A does not reflect events occurring after the filing of the original Form N-CSR, or otherwise modify or update the disclosures therein in any way.
| ITEM 1. | REPORTS TO STOCKHOLDERS. |
ANNUAL REPORT
February 28, 2013

MFS® GLOBAL REAL ESTATE FUND

GRE-ANN
MFS® GLOBAL REAL ESTATE FUND
CONTENTS
The report is prepared for the general information of shareholders.
It is authorized for distribution to prospective investors only when preceded or accompanied by a current prospectus.
NOT FDIC INSURED Ÿ MAY LOSE VALUE Ÿ NO BANK GUARANTEE

LETTER FROM THE CHAIRMAN AND CEO
Dear Shareholders:
Global financial markets began 2013 with greater optimism. U.S. and Asian economic trends have turned more positive. Europe continues to struggle through its economic
slump. However, even there, sentiment has improved. The U.S. Congress averted its year-end fiscal cliff, but a degree of uncertainty remains regarding upcoming negotiations over spending cuts and the debt ceiling. The U.S. Federal Reserve Board is continuing its accommodative monetary easing, while the U.S. housing and job markets have made steady gains. Corporate profits have been resilient, and investors have demonstrated increased tolerance for risk.
Overseas, the eurozone remains in a broad contraction, with economic output receding in France as well as Italy and Spain.
However, large-scale early repayments of European Central Bank loans by banks and Germany’s strong rebound in manufacturing activity are encouraging signs. In Asia, both China and Japan appear to be in the early stages of a turnaround. China’s economic activity has picked up from last year’s relative slowdown, and Japan’s sharp devaluation of the yen, an important anti-deflationary measure, seems to be having its desired impact: Japanese stocks have soared, corporate profits are rising and confidence is returning among consumers, businesses and investors.
As always, managing risk in the face of uncertainty remains a top priority for investors. At MFS®, our uniquely collaborative investment process employs global research and active risk management. Our global team of investment professionals shares ideas and evaluates opportunities across continents, investment disciplines and asset classes — all with a goal of building better insights, and ultimately better results, for our clients.
We remain mindful of the many economic challenges investors face today, and believe it is more important than ever to maintain a long-term view and employ time-tested principles, such as asset allocation and diversification. We also remain confident that our unique approach can serve investors well as they work with their financial advisors to identify and pursue the most suitable opportunities.
Respectfully,

Robert J. Manning
Chairman and Chief Executive Officer
MFS Investment Management®
April 12, 2013
The opinions expressed in this letter are subject to change, may not be relied upon for investment advice, and no forecasts can be guaranteed.
1
PORTFOLIO COMPOSITION
Portfolio structure

| | | | |
| Top ten holdings | | | | |
| Simon Property Group, Inc., REIT | | | 4.5% | |
| Hang Lung Properties Ltd. | | | 3.8% | |
| Public Storage, Inc., REIT | | | 3.8% | |
| Mitsubishi Estate Co. Ltd. | | | 3.6% | |
| Mitsui Fudosan Co. Ltd. | | | 3.6% | |
| Stockland, IEU | | | 3.0% | |
| Link, REIT | | | 2.8% | |
| Unibail-Rodamco | | | 2.8% | |
| Corio N.V., REIT | | | 2.8% | |
| Westfield Group, REIT | | | 2.7% | |
| |
| Equity industries | | | | |
| Real Estate | | | 97.1% | |
| Telecommunications-wireless | | | 0.3% | |
| | | | |
| Issuer country weightings (x) | |
| United States | | | 48.6% | |
| Japan | | | 11.9% | |
| Hong Kong | | | 9.8% | |
| Australia | | | 7.5% | |
| United Kingdom | | | 5.6% | |
| Singapore | | | 3.6% | |
| France | | | 2.8% | |
| Netherlands | | | 2.8% | |
| Austria | | | 2.4% | |
| Other Countries | | | 5.0% | |
|
| Currency exposure weightings (y) | |
| United States Dollar | | | 48.6% | |
| Japanese Yen | | | 11.9% | |
| Euro | | | 9.9% | |
| Hong Kong Dollar | | | 9.8% | |
| Australian Dollar | | | 7.5% | |
| British Pound Sterling | | | 5.6% | |
| Singapore Dollar | | | 3.6% | |
| Brazilian Real | | | 1.7% | |
| Canadian Dollar | | | 1.0% | |
| Other Currencies | | | 0.4% | |
| (x) | Represents the portfolio’s exposure to issuer countries as a percentage of a portfolio’s net assets. |
| (y) | Represents the portfolio’s exposure to a particular currency as a percentage of a portfolio’s net assets. |
Percentages are based on net assets as of 2/28/13.
The portfolio is actively managed and current holdings may be different.
2
MANAGEMENT REVIEW
Summary of Results
For the twelve months ended February 28, 2013, Class A shares of the MFS Global Real Estate Fund (“fund”) provided a total return of 20.15%, at net asset value. This compares with a return of 19.83% for the fund’s benchmark, the FTSE EPRA/NAREIT Developed Real Estate Index (“FTSE Index”).
Market Environment
The beginning of the period was characterized by a risk-on sentiment as a result of additional liquidity measures by the Federal Reserve Bank (“Fed”) and the European Central Bank (“ECB”) as well as a commensurate improvement in macroeconomic conditions. During this time, global equity valuations rose, credit spreads contracted, and high-quality sovereign yields increased modestly.
During the middle of the period, however, conditions worsened, driven by broadly weaker global macroeconomic indicators, as well as renewed concerns over the eurozone’s capacity and determination to address its ongoing crisis. Despite this deterioration, broad market sentiment remained relatively resilient as equity markets generally maintained gains and credit spreads did not indicate deterioration.
However, this renewed weakness in the fundamentals precipitated a further round of monetary easing by both the Fed (through a third round of quantitative easing) and the ECB (through a new bond purchase facility) in the second half of the period, which soon instilled additional confidence in risk markets. Nonetheless, towards the end of the period, weaker equity earnings reports and declining forward guidance caused market sentiment to soften. In addition, as we moved toward year end, the fiscal cliff negotiations between the Republicans in the U.S. Congress and President Obama were a particular source of market attention, where uncertainty surrounding the fiscal negotiations continued right up to the end-of-year deadline. A last minute political agreement averted the worst-case scenario and markets gravitated towards risk assets again, though the implementation of the U.S. budget sequester, combined with the uncertainty surrounding the Italian election results, inserted a greater degree of caution as the reporting period ended.
Contributors to Performance
Stock selection in real estate investments located in the United States was a primary factor that contributed to performance relative to the FTSE Index. The fund’s holdings of Medical Properties Trust (United States), and Weyerhaeuser (b) (United States), and the timing of ownership in shares of Dupont Fabros Technology (h) (United States) were among the largest contributors in the U.S. market. Additionally, the fund’s avoidance of weak-performing Equity Residential (United States) was another positive factor for relative results.
A combination of the fund’s security selection and underweight allocation to real estate investments in Canada benefited relative results as Canadian real estate generally underperformed the benchmark. The fund’s holding of Primaris Retail Real Estate (h) (Canada) was the largest relative contributor in the Canadian market.
3
Management Review – continued
An overweight allocation and stock selection in Japanese real estate investments supported relative returns as the Japanese real estate market posted strong performance relative to the benchmark. The fund’s holdings of Mitsubishi Estate Company (Japan), Mitsui Fudosan (Japan), and NTT Urban Development Corporation (Japan) helped bolster relative returns.
The fund’s overweight allocation to real estate investments in Austria also boosted relative performance as the Austrian real estate market outpaced the Index. The fund’s holdings of Atrium European Real Estate (b) (Austria) benefited relative performance.
Elsewhere, the fund’s holdings in Link REIT (Hong Kong) supported relative returns as this security posted solid performance during the period relative to the benchmark.
Detractors from Performance
A combination of the fund’s underweight allocations and stock selection in real estate investments in Singapore and Hong Kong held back relative performance. The timing of the fund’s ownership in shares of CapitaLand (h) (Singapore) negatively affected relative results. The fund’s holdings of Sun Hung Kai Properties (Hong Kong), and not holding shares of Hongkong Land (Hong Kong) also hampered relative returns.
Elsewhere, the fund’s holdings of AvalonBay Community (United States), BR Malls Participacoes (Brazil), Vornado Realty Trust (United States), Corio (Netherlands), and Alexandria Real Estate Equities (United States) were among the fund’s largest detractors from relative performance during the period. Additionally, not holding strong-performing Health Care Properties (United States) and Sumitomo Realty & Development (Japan) hindered relative returns.
Respectfully,
| | |
| Richard Gable | | |
| Portfolio Manager | | |
| (b) | Security is not a benchmark constituent. |
| (h) | Security was not held in the portfolio at period end. |
The views expressed in this report are those of the portfolio manager only through the end of the period of the report as stated on the cover and do not necessarily reflect the views of MFS or any other person in the MFS organization. These views are subject to change at any time based on market or other conditions, and MFS disclaims any responsibility to update such views. These views may not be relied upon as investment advice or an indication of trading intent on behalf of any MFS portfolio. References to specific securities are not recommendations of such securities, and may not be representative of any MFS portfolio’s current or future investments.
4
PERFORMANCE SUMMARY THROUGH 2/28/13
The following chart illustrates a representative class of the fund’s historical performance in comparison to its benchmark(s). Performance results include the deduction of the maximum applicable sales charge and reflect the percentage change in net asset value, including reinvestment of dividends and capital gains distributions. The performance of other share classes will be greater than or less than that of the class depicted below. Benchmarks are unmanaged and may not be invested in directly. Benchmark returns do not reflect sales charges, commissions or expenses. (See Notes to Performance Summary.)
Performance data shown represents past performance and is no guarantee of future results. Investment return and principal value fluctuate so your shares, when sold, may be worth more or less than the original cost; current performance may be lower or higher than quoted. The performance shown does not reflect the deduction of taxes, if any, that a shareholder would pay on fund distributions or the redemption of fund shares.
Growth of a Hypothetical $10,000 Investment (t)

5
Performance Summary – continued
Total Returns through 2/28/13
Average annual without sales charge
| | | | | | | | | | |
| | | Share class | | Class inception date | | 1-yr | | Life (t) | | |
| | | A | | 3/11/09 | | 20.15% | | 29.43% | | |
| | | I | | 3/11/09 | | 20.42% | | 29.75% | | |
| | | R5 | | 7/02/12 | | N/A | | 16.48% | | |
| Comparative benchmark | | | | | | |
| | | FTSE EPRA/NAREIT Developed Real Estate Index (f) | | 19.83% | | 32.04% | | |
| Average annual with sales charge | | | | | | |
| | | A
With Initial Sales Charge (5.75%) | | 13.24% | | 27.52% | | |
Class I and R5 shares do not have a sales charge.
| (f) | Source: FactSet Research Systems Inc. |
| (t) | For the period from the class inception date through the stated period end. The comparative benchmark performance information provided for the “life” period is from the inception date of the Class A shares. (See Notes to Performance Summary.) |
Periods less than one year are actual, not annualized.
Benchmark Definition
FTSE EPRA/NAREIT Developed Real Estate Index – measures the performance of eligible real estate equities worldwide that generate a majority of their revenue and income through the ownership, disposure and development of income-producing real estate.
It is not possible to invest directly in an index.
Notes to Performance Summary
Average annual total return represents the average annual change in value for each share class for the periods presented. Life returns are presented where the share class has less than 10 years of performance history and represent the average annual total return from the class inception date to the stated period end date. As the fund’s share classes may have different inception dates, the life returns may represent different time periods and may not be comparable.
Performance results reflect any applicable expense subsidies and waivers in effect during the periods shown. Without such subsidies and waivers the fund’s performance results would be less favorable. Please see the prospectus and financial statements for complete details.
Performance results do not include adjustments made for financial reporting purposes in accordance with U.S. generally accepted accounting principles and may differ from amounts reported in the financial highlights.
From time to time the fund may receive proceeds from litigation settlements, without which performance would be lower.
6
EXPENSE TABLE
Fund expenses borne by the shareholders during the period,
September 1, 2012 through February 28, 2013
As a shareholder of the fund, you incur two types of costs: (1) transaction costs, including sales charges (loads) on certain purchase or redemption payments, and (2) ongoing costs, including management fees; distribution and service (12b-1) fees; and other fund expenses. This example is intended to help you understand your ongoing costs (in dollars) of investing in the fund and to compare these costs with the ongoing costs of investing in other mutual funds.
The example is based on an investment of $1,000 invested at the beginning of the period and held for the entire period September 1, 2012 through February 28, 2013.
Actual Expenses
The first line for each share class in the following table provides information about actual account values and actual expenses. You may use the information in this line, together with the amount you invested, to estimate the expenses that you paid over the period. Simply divide your account value by $1,000 (for example, an $8,600 account value divided by $1,000 = 8.6), then multiply the result by the number in the first line under the heading entitled “Expenses Paid During Period” to estimate the expenses you paid on your account during this period.
Hypothetical Example for Comparison Purposes
The second line for each share class in the following table provides information about hypothetical account values and hypothetical expenses based on the fund’s actual expense ratio and an assumed rate of return of 5% per year before expenses, which is not the fund’s actual return. The hypothetical account values and expenses may not be used to estimate the actual ending account balance or expenses you paid for the period. You may use this information to compare the ongoing costs of investing in the fund and other funds. To do so, compare this 5% hypothetical example with the 5% hypothetical examples that appear in the shareholder reports of the other funds.
Please note that the expenses shown in the table are meant to highlight your ongoing costs only and do not reflect any transactional costs, such as sales charges (loads). Therefore, the second line for each share class in the table is useful in comparing ongoing costs only, and will not help you determine the relative total costs of owning different funds. In addition, if these transactional costs were included, your costs would have been higher.
7
Expense Table – continued
| | | | | | | | | | | | | | | | | | |
Share
Class | | | | Annualized
Expense Ratio | | | Beginning
Account Value
9/01/12 | | | Ending Account Value
2/28/13 | | | Expenses Paid During
Period (p) 9/01/12-2/28/13 | |
| A | | Actual | | | 1.23% | | | | $1,000.00 | | | | $1,124.20 | | | | $6.48 | |
| | Hypothetical (h) | | | 1.23% | | | | $1,000.00 | | | | $1,018.70 | | | | $6.16 | |
| I | | Actual | | | 0.98% | | | | $1,000.00 | | | | $1,125.51 | | | | $5.16 | |
| | Hypothetical (h) | | | 0.98% | | | | $1,000.00 | | | | $1,019.93 | | | | $4.91 | |
| R5 | | Actual | | | 0.98% | | | | $1,000.00 | | | | $1,125.51 | | | | $5.16 | |
| | Hypothetical (h) | | | 0.98% | | | | $1,000.00 | | | | $1,019.93 | | | | $4.91 | |
| (h) | 5% class return per year before expenses. |
| (p) | Expenses paid are equal to each class’s annualized expense ratio, as shown above, multiplied by the average account value over the period, multiplied by the number of days in the period, divided by the number of days in the year. Expenses paid do not include any applicable sales charges (loads). If these transaction costs had been included, your costs would have been higher. |
8
PORTFOLIO OF INVESTMENTS
2/28/13
The Portfolio of Investments is a complete list of all securities owned by your fund. It is categorized by broad-based asset classes.
| | | | | | | | |
| Common Stocks - 97.4% | | | | | | | | |
| Issuer | | Shares/Par | | | Value ($) | |
| Real Estate - 97.1% | | | | | | | | |
| Advance Residence Investment Corp., REIT | | | 1,365 | | | $ | 2,899,649 | |
| Alexandria Real Estate Equities, Inc., REIT | | | 63,758 | | | | 4,535,744 | |
| Ascendas India Trust, IEU | | | 8,461,000 | | | | 5,697,121 | |
| Atrium European Real Estate Ltd. | | | 1,237,540 | | | | 7,420,771 | |
| AvalonBay Communities, Inc., REIT | | | 47,610 | | | | 5,943,156 | |
| Big Yellow Group PLC, REIT | | | 902,510 | | | | 5,112,417 | |
| BioMed Realty Trust, Inc., REIT | | | 230,133 | | | | 4,860,409 | |
| Boston Properties, Inc., REIT | | | 46,253 | | | | 4,804,762 | |
| BR Malls Participacoes S.A. | | | 211,371 | | | | 2,733,706 | |
| British Land Co. PLC, REIT | | | 467,348 | | | | 4,014,415 | |
| CFS Retail Property Trust Group, REIT | | | 2,558,563 | | | | 5,452,115 | |
| Corio N.V., REIT | | | 181,295 | | | | 8,342,468 | |
| Corporate Office Properties Trust, REIT | | | 103,040 | | | | 2,665,645 | |
| DDR Corp., REIT | | | 198,610 | | | | 3,429,995 | |
| Derwent London PLC, REIT | | | 81,181 | | | | 2,709,898 | |
| Digital Realty Trust, Inc., REIT | | | 40,141 | | | | 2,688,644 | |
| EastGroup Properties, Inc., REIT | | | 98,790 | | | | 5,612,260 | |
| EPR Properties, REIT | | | 62,035 | | | | 3,026,688 | |
| Equity Lifestyle Properties, Inc., REIT | | | 83,246 | | | | 6,134,398 | |
| Federal Realty Investment Trust, REIT | | | 36,275 | | | | 3,852,768 | |
| Global Logistic Properties Ltd. | | | 2,543,901 | | | | 5,183,989 | |
| Granite, REIT | | | 79,770 | | | | 3,073,997 | |
| GSW Immobilien AG | | | 80,124 | | | | 3,193,094 | |
| Hang Lung Properties Ltd. | | | 3,007,256 | | | | 11,651,973 | |
| Henderson Land Development Co. Ltd. | | | 641,418 | | | | 4,461,873 | |
| Home Properties, Inc., REIT | | | 76,793 | | | | 4,793,419 | |
| Host Hotels & Resorts, Inc., REIT | | | 365,356 | | | | 6,090,485 | |
| Kenedix Realty Investment Corp., REIT | | | 1,225 | | | | 5,048,549 | |
| LEG Immobilien AG (a) | | | 8,070 | | | | 463,258 | |
| Link, REIT | | | 1,615,405 | | | | 8,633,573 | |
| Macquarie Mexico Real Estate S.A. de C.V., REIT (a) | | | 638,400 | | | | 1,446,391 | |
| Medical Properties Trust, Inc., REIT | | | 369,983 | | | | 5,372,153 | |
| Mid-America Apartment Communities, Inc., REIT | | | 89,851 | | | | 6,239,253 | |
| Mitsubishi Estate Co. Ltd. | | | 439,135 | | | | 10,944,027 | |
| Mitsui Fudosan Co. Ltd. | | | 429,274 | | | | 10,920,575 | |
| Multiplan Empreendimentos Imobiliarios S.A. | | | 82,000 | | | | 2,346,822 | |
| National Health Investors, Inc., REIT | | | 64,230 | | | | 4,162,104 | |
| National Retail Properties, Inc., REIT | | | 125,080 | | | | 4,309,006 | |
| NTT Urban Development Corp. | | | 6,248 | | | | 6,363,267 | |
9
Portfolio of Investments – continued
| | | | | | | | |
| Issuer | | Shares/Par | | | Value ($) | |
| Common Stocks - continued | | | | | | | | |
| Real Estate - continued | | | | | | | | |
| Plum Creek Timber Co. Inc., REIT | | | 126,684 | | | $ | 6,144,174 | |
| Public Storage, Inc., REIT | | | 76,062 | | | | 11,501,335 | |
| Retail Opportunity Investment Corp., REIT | | | 231,480 | | | | 2,988,407 | |
| SEGRO PLC, REIT | | | 1,330,334 | | | | 5,164,531 | |
| Simon Property Group, Inc., REIT | | | 85,549 | | | | 13,590,314 | |
| Spirit Realty Capital, Inc., REIT | | | 99,740 | | | | 1,986,821 | |
| Stockland, IEU | | | 2,353,095 | | | | 9,022,358 | |
| Sun Hung Kai Properties Ltd. | | | 312,661 | | | | 4,837,707 | |
| TAG Immobilien AG | | | 168,630 | | | | 1,995,923 | |
| Tanger Factory Outlet Centers, Inc., REIT | | | 137,772 | | | | 4,861,974 | |
| Unibail-Rodamco | | | 37,129 | | | | 8,575,643 | |
| Ventas, Inc., REIT | | | 97,003 | | | | 6,865,872 | |
| Vornado Realty Trust, REIT | | | 92,663 | | | | 7,432,499 | |
| Westfield Group, REIT | | | 713,101 | | | | 8,133,291 | |
| Weyerhaeuser Co., REIT | | | 158,489 | | | | 4,661,161 | |
| | | | | | | | |
| | | | | | | $ | 294,396,847 | |
| Telecommunications - Wireless - 0.3% | | | | | | | | |
| American Tower Corp., REIT | | | 14,140 | | | $ | 1,097,264 | |
| Total Common Stocks (Identified Cost, $215,640,330) | | | | | | $ | 295,494,111 | |
| | |
| Money Market Funds - 1.4% | | | | | | | | |
MFS Institutional Money Market Portfolio, 0.13%,
at Cost and Net Asset Value (v) | | | 4,064,702 | | | $ | 4,064,702 | |
| Total Investments (Identified Cost, $219,705,032) | | | | | | $ | 299,558,813 | |
| | |
| Other Assets, Less Liabilities - 1.2% | | | | | | | 3,736,826 | |
| Net Assets - 100.0% | | | | | | $ | 303,295,639 | |
| (a) | Non-income producing security. |
| (v) | Underlying affiliated fund that is available only to investment companies managed by MFS. The rate quoted for the MFS Institutional Money Market Portfolio is the annualized seven-day yield of the fund at period end. |
The following abbreviations are used in this report and are defined:
| IEU | | International Equity Unit |
| PLC | | Public Limited Company |
| REIT | | Real Estate Investment Trust |
See Notes to Financial Statements
10
Financial Statements
STATEMENT OF ASSETS AND LIABILITIES
At 2/28/13
This statement represents your fund’s balance sheet, which details the assets and liabilities comprising the total value of the fund.
| | | | |
| Assets | | | | |
Investments- | | | | |
Non-affiliated issuers, at value (identified cost, $215,640,330) | | | $295,494,111 | |
Underlying affiliated funds, at cost and value | | | 4,064,702 | |
Total investments, at value (identified cost, $219,705,032) | | | $299,558,813 | |
Foreign currency, at value (identified cost, $587,517) | | | 582,107 | |
Receivables for | | | | |
Investments sold | | | 259,302 | |
Fund shares sold | | | 7,080,705 | |
Interest and dividends | | | 177,456 | |
Other assets | | | 2,157 | |
Total assets | | | $307,660,540 | |
| Liabilities | | | | |
Payables for | | | | |
Investments purchased | | | $4,038,422 | |
Fund shares reacquired | | | 237,291 | |
Payable to affiliates | | | | |
Investment adviser | | | 14,949 | |
Shareholder servicing costs | | | 71 | |
Distribution and service fees | | | 4 | |
Payable for independent Trustees’ compensation | | | 5 | |
Accrued expenses and other liabilities | | | 74,159 | |
Total liabilities | | | $4,364,901 | |
Net assets | | | $303,295,639 | |
| Net assets consist of | | | | |
Paid-in capital | | | $229,077,616 | |
Unrealized appreciation (depreciation) on investments and translation of assets and liabilities in foreign currencies | | | 79,846,133 | |
Accumulated distributions in excess of net realized gain on investments and foreign currency | | | (9,020,051 | ) |
Undistributed net investment income | | | 3,391,941 | |
Net assets | | | $303,295,639 | |
Shares of beneficial interest outstanding | | | 20,051,649 | |
| | | | | | | | | | | | |
| | | Net assets | | | Shares
outstanding | | | Net asset value
per share (a) | |
Class A | | | $278,791 | | | | 18,444 | | | | $15.12 | |
Class I | | | 116,562 | | | | 7,706 | | | | 15.13 | |
Class R5 | | | 302,900,286 | | | | 20,025,499 | | | | 15.13 | |
| (a) | Maximum offering price per share was equal to the net asset value per share for all share classes, except for Class A, for which the maximum offering price per share was $16.04 [100 / 94.25 x $15.12]. On sales of $50,000 or more, the maximum offering price of Class A shares is reduced. A contingent deferred sales charge may be imposed on redemptions of Class A shares. Redemption price per share was equal to the net asset value per share for Classes I and R5. |
See Notes to Financial Statements
11
Financial Statements
STATEMENT OF OPERATIONS
Year ended 2/28/13
This statement describes how much your fund earned in investment income and accrued in expenses. It also describes any gains and/or losses generated by fund operations.
| | | | |
| Net investment income | | | | |
Income | | | | |
Dividends | | | $8,321,993 | |
Dividends from underlying affiliated funds | | | 7,339 | |
Foreign taxes withheld | | | (304,228 | ) |
Total investment income | | | $8,025,104 | |
Expenses | | | | |
Management fee | | | $2,354,422 | |
Distribution and service fees | | | 624 | |
Shareholder servicing costs | | | 224 | |
Administrative services fee | | | 46,443 | |
Independent Trustees’ compensation | | | 10,272 | |
Custodian fee | | | 58,300 | |
Shareholder communications | | | 6,277 | |
Audit and tax fees | | | 54,536 | |
Legal fees | | | 3,389 | |
Miscellaneous | | | 26,700 | |
Total expenses | | | $2,561,187 | |
Fees paid indirectly | | | (8 | ) |
Reduction of expenses by investment adviser | | | (851 | ) |
Net expenses | | | $2,560,328 | |
Net investment income | | | $5,464,776 | |
| Realized and unrealized gain (loss) on investments and foreign currency | |
Realized gain (loss) (identified cost basis) | | | | |
Investments | | | $15,430,322 | |
Foreign currency | | | (43,363 | ) |
Net realized gain (loss) on investments and foreign currency | | | $15,386,959 | |
Change in unrealized appreciation (depreciation) | | | | |
Investments | | | $28,346,533 | |
Translation of assets and liabilities in foreign currencies | | | (12,934 | ) |
Net unrealized gain (loss) on investments and foreign currency translation | | | $28,333,599 | |
Net realized and unrealized gain (loss) on investments and foreign currency | | | $43,720,558 | |
Change in net assets from operations | | | $49,185,334 | |
See Notes to Financial Statements
12
Financial Statements
STATEMENTS OF CHANGES IN NET ASSETS
These statements describe the increases and/or decreases in net assets resulting from operations, any distributions, and any shareholder transactions.
| | | | | | | | |
| | | Years ended 2/28, 2/29 | |
| | | 2013 | | | 2012 | |
| Change in net assets | | | | | | |
| From operations | | | | | | | | |
Net investment income | | | $5,464,776 | | | | $4,331,249 | |
Net realized gain (loss) on investments and foreign currency | | | 15,386,959 | | | | 8,862,449 | |
Net unrealized gain (loss) on investments and foreign currency translation | | | 28,333,599 | | | | (13,181,544 | ) |
Change in net assets from operations | | | $49,185,334 | | | | $12,154 | |
| Distributions declared to shareholders | | | | | | | | |
From net investment income | | | $(9,892,136 | ) | | | $(5,575,274 | ) |
From net realized gain on investments | | | (9,487,195 | ) | | | (7,176,979 | ) |
Total distributions declared to shareholders | | | $(19,379,331 | ) | | | $(12,752,253 | ) |
Change in net assets from fund share transactions | | | $30,737,340 | | | | $39,174,069 | |
Total change in net assets | | | $60,543,343 | | | | $26,433,970 | |
| Net assets | | | | | | | | |
At beginning of period | | | 242,752,296 | | | | 216,318,326 | |
At end of period (including undistributed net investment income of $3,391,941 and $741,847, respectively) | | | $303,295,639 | | | | $242,752,296 | |
See Notes to Financial Statements
13
Financial Statements
FINANCIAL HIGHLIGHTS
The financial highlights table is intended to help you understand the fund’s financial performance for the past 5 years (or life of a particular share class, if shorter). Certain information reflects financial results for a single fund share. The total returns in the table represent the rate by which an investor would have earned (or lost) on an investment in the fund share class (assuming reinvestment of all distributions) held for the entire period.
| | | | | | | | | | | | | | | | |
| Class A | | Years ended 2/28, 2/29 | |
| | | 2013 | | | 2012 | | | 2011 | | | 2010 (c) | |
Net asset value, beginning of period | | | $13.51 | | | | $14.57 | | | | $14.02 | | | | $10.00 | |
| Income (loss) from investment operations | | | | | | | | | | | | | | | | |
Net investment income (d) | | | $0.26 | | | | $0.23 | | | | $0.49 | | | | $0.42 | |
Net realized and unrealized gain (loss) on investments
and foreign currency | | | 2.38 | | | | (0.55 | ) | | | 2.46 | | | | 8.68 | |
Total from investment operations | | | $2.64 | | | | $(0.32 | ) | | | $2.95 | | | | $9.10 | |
| Less distributions declared to shareholders | | | | | | | | | | | | | | | | |
From net investment income | | | $(0.51 | ) | | | $(0.30 | ) | | | $(0.77 | ) | | | $(2.00 | ) |
From net realized gain on investments | | | (0.52 | ) | | | (0.44 | ) | | | (1.63 | ) | | | (3.08 | ) |
Total distributions declared to shareholders | | | $(1.03 | ) | | | $(0.74 | ) | | | $(2.40 | ) | | | $(5.08 | ) |
Net asset value, end of period (x) | | | $15.12 | | | | $13.51 | | | | $14.57 | | | | $14.02 | |
Total return (%) (r)(s)(t)(x) | | | 20.14 | | | | (1.81 | ) | | | 23.61 | | | | 91.24 | (n) |
Ratios (%) (to average net assets)
and Supplemental data: | | | | | | | | | | | | | | | | |
Expenses before expense reductions (f) | | | 1.23 | | | | 1.24 | | | | 1.25 | | | | 1.28 | (a) |
Expenses after expense reductions (f) | | | 1.23 | | | | 1.24 | | | | 1.25 | | | | 1.28 | (a) |
Net investment income | | | 1.85 | | | | 1.74 | | | | 3.45 | | | | 2.89 | (a) |
Portfolio turnover | | | 46 | | | | 37 | | | | 33 | | | | 91 | |
Net assets at end of period (000 omitted) | | | $279 | | | | $232 | | | | $236 | | | | $191 | |
See Notes to Financial Statements
14
Financial Highlights – continued
| | | | | | | | | | | | | | | | |
| Class I | | Years ended 2/28, 2/29 | |
| | | 2013 | | | 2012 | | | 2011 | | | 2010 (c) | |
Net asset value, beginning of period | | | $13.52 | | | | $14.58 | | | | $14.03 | | | | $10.00 | |
| Income (loss) from investment operations | | | | | | | | | | | | | | | | |
Net investment income (d) | | | $0.44 | | | | $0.27 | | | | $0.54 | | | | $0.47 | |
Net realized and unrealized gain (loss) on investments
and foreign currency | | | 2.23 | | | | (0.56 | ) | | | 2.45 | | | | 8.67 | |
Total from investment operations | | | $2.67 | | | | $(0.29 | ) | | | $2.99 | | | | $9.14 | |
| Less distributions declared to shareholders | | | | | | | | | | | | | | | | |
From net investment income | | | $(0.54 | ) | | | $(0.33 | ) | | | $(0.81 | ) | | | $(2.03 | ) |
From net realized gain on investments | | | (0.52 | ) | | | (0.44 | ) | | | (1.63 | ) | | | (3.08 | ) |
Total distributions declared to shareholders | | | $(1.06 | ) | | | $(0.77 | ) | | | $(2.44 | ) | | | $(5.11 | ) |
Net asset value, end of period (x) | | | $15.13 | | | | $13.52 | | | | $14.58 | | | | $14.03 | |
Total return (%) (r)(s)(x) | | | 20.41 | | | | (1.54 | ) | | | 23.89 | | | | 91.71 | (n) |
Ratios (%) (to average net assets)
and Supplemental data: | | | | | | | | | | | | | | | | |
Expenses before expense reductions (f) | | | 0.98 | | | | 0.99 | | | | 1.00 | | | | 1.03 | (a) |
Expenses after expense reductions (f) | | | 0.98 | | | | 0.99 | | | | 1.00 | | | | 1.03 | (a) |
Net investment income | | | 3.30 | | | | 1.98 | | | | 3.77 | | | | 3.22 | (a) |
Portfolio turnover | | | 46 | | | | 37 | | | | 33 | | | | 91 | |
Net assets at end of period (000 omitted) | | | $117 | | | | $242,520 | | | | $216,082 | | | | $164,347 | |
| | | | |
| Class R5 | | Period
ended
2/28/13 (i) | |
Net asset value, beginning of period | | | $13.74 | |
| Income (loss) from investment operations | | | | |
Net investment income (d) | | | $0.14 | |
Net realized and unrealized gain (loss) on investments and foreign currency | | | 2.10 | |
Total from investment operations | | | $2.24 | |
| Less distributions declared to shareholders | | | | |
From net investment income | | | $(0.50 | ) |
From net realized gain on investments | | | (0.35 | ) |
Total distributions declared to shareholders | | | $(0.85 | ) |
Net asset value, end of period (x) | | | $15.13 | |
Total return (%) (r)(s)(x) | | | 16.56 | (n) |
Ratios (%) (to average net assets)
and Supplemental data: | | | | |
Expenses before expense reductions (f) | | | 0.98 | (a) |
Expenses after expense reductions (f) | | | 0.98 | (a) |
Net investment income | | | 1.48 | (a) |
Portfolio turnover | | | 46 | (n) |
Net assets at end of period (000 omitted) | | | $302,900 | |
See Notes to Financial Statements
15
Financial Highlights – continued
| (c) | For the period from the commencement of the fund’s investment operations, March 11, 2009, through the stated period end. |
| (d) | Per share data is based on average shares outstanding. |
| (f) | Ratios do not reflect reductions from fees paid indirectly, if applicable. |
| (i) | For the period from the class inception, July 2, 2012, through the stated period end. |
| (r) | Certain expenses have been reduced without which performance would have been lower. |
| (s) | From time to time the fund may receive proceeds from litigation settlements, without which performance would be lower. |
| (t) | Total returns do not include any applicable sales charges. |
| (x) | The net asset values per share and total returns have been calculated on net assets which include adjustments made in accordance with U.S. generally accepted accounting principles required at period end for financial reporting purposes. |
See Notes to Financial Statements
16
NOTES TO FINANCIAL STATEMENTS
(1) Business and Organization
MFS Global Real Estate Fund (the fund) is a series of MFS Series Trust XIII (the trust). The trust is organized as a Massachusetts business trust and is registered under the Investment Company Act of 1940, as amended, as an open-end management investment company.
(2) Significant Accounting Policies
General – The preparation of financial statements in conformity with U.S. generally accepted accounting principles requires management to make estimates and assumptions that affect the reported amounts of assets and liabilities, and disclosure of contingent assets and liabilities at the date of the financial statements and the reported amounts of revenues and expenses during the reporting period. Actual results could differ from those estimates. In the preparation of these financial statements, management has evaluated subsequent events occurring after the date of the fund’s Statement of Assets and Liabilities through the date that the financial statements were issued. The fund invests a significant amount of its net assets in U.S. and foreign real estate related investments and as a result is subject to certain risks associated with the direct ownership of real estate and the real estate industry in general. These include risks related to general, regional and local economic conditions; fluctuations in interest rates; property tax rates, zoning laws, environmental regulations and other governmental action; cash flow dependency; increased operating expenses; lack of availability of mortgage funds; losses due to natural disasters; changes in property values and rental rates; and other factors. The fund invests in foreign securities. Investments in foreign securities are vulnerable to the effects of changes in the relative values of the local currency and the U.S. dollar and to the effects of changes in each country’s legal, political, and economic environment.
In this reporting period the fund adopted Financial Accounting Standards Board (FASB) Accounting Standards Update 2011-04, Fair Value Measurement (Topic 820) – Amendments to Achieve Common Fair Value Measurement and Disclosure Requirements in U.S. GAAP and IFRSs (“ASU 2011-04”). ASU 2011-04 seeks to improve the comparability of fair value measurements as presented and disclosed in financial statements prepared in accordance with U.S. GAAP and International Financial Reporting Standards (IFRS) by providing common requirements for fair value measurement and disclosure.
In January 2013, the FASB issued Accounting Standards Update 2013-01 (“ASU 2013-01”) entitled Balance Sheet (Topic 210) – Clarifying the Scope of Disclosures about Offsetting Assets and Liabilities which is intended to clarify the scope of Accounting Standards Update 2011-11 (“ASU 2011-11”), Balance Sheet (Topic 210) – Disclosures about Offsetting Assets and Liabilities. Consistent with the effective date for ASU 2011-11, ASU 2013-01 is effective for annual reporting periods beginning on or after January 1, 2013, and interim periods within those annual periods. ASU 2013-01 limits the scope of ASU 2011-11’s disclosure requirements on offsetting to financial assets and financial liabilities related to derivatives, repurchase and reverse repurchase agreements, and securities lending and securities borrowing transactions.
17
Notes to Financial Statements – continued
Although still evaluating the potential impact of these two ASUs to the fund, management expects that the impact of the fund’s adoption will be limited to additional financial statement disclosures.
Investment Valuations – Equity securities, including restricted equity securities, are generally valued at the last sale or official closing price as provided by a third-party pricing service on the market or exchange on which they are primarily traded. Equity securities, for which there were no sales reported that day, are generally valued at the last quoted daily bid quotation as provided by a third-party pricing service on the market or exchange on which such securities are primarily traded. Short-term instruments with a maturity at issuance of 60 days or less generally are valued at amortized cost, which approximates market value. Open-end investment companies are generally valued at net asset value per share. Securities and other assets generally valued on the basis of information from a third-party pricing service may also be valued at a broker/dealer bid quotation. Values obtained from third-party pricing services can utilize both transaction data and market information such as yield, quality, coupon rate, maturity, type of issue, trading characteristics, and other market data. The values of foreign securities and other assets and liabilities expressed in foreign currencies are converted to U.S. dollars using the mean of bid and asked prices for rates provided by a third-party pricing service.
The Board of Trustees has delegated primary responsibility for determining or causing to be determined the value of the fund’s investments (including any fair valuation) to the adviser pursuant to valuation policies and procedures approved by the Board. If the adviser determines that reliable market quotations are not readily available, investments are valued at fair value as determined in good faith by the adviser in accordance with such procedures under the oversight of the Board of Trustees. Under the fund’s valuation policies and procedures, market quotations are not considered to be readily available for most types of debt instruments and floating rate loans and many types of derivatives. These investments are generally valued at fair value based on information from third-party pricing services. In addition, investments may be valued at fair value if the adviser determines that an investment’s value has been materially affected by events occurring after the close of the exchange or market on which the investment is principally traded (such as foreign exchange or market) and prior to the determination of the fund’s net asset value, or after the halting of trading of a specific security where trading does not resume prior to the close of the exchange or market on which the security is principally traded. Events that occur on a frequent basis after foreign markets close (such as developments in foreign markets and significant movements in the U.S. markets) and prior to the determination of the fund’s net asset value may be deemed to have a material effect on the value of securities traded in foreign markets. Accordingly, the fund’s foreign equity securities may often be valued at fair value. The adviser generally relies on third-party pricing services or other information (such as the correlation with price movements of similar securities in the same or other markets; the type, cost and investment characteristics of the security; the business and financial condition of the issuer; and trading and other market data) to assist in determining whether to fair value and at what value to fair value an investment. The value of an investment for purposes of calculating the fund’s net asset value can differ depending on the source and method used to determine value. When fair valuation is used, the
18
Notes to Financial Statements – continued
value of an investment used to determine the fund’s net asset value may differ from quoted or published prices for the same investment. There can be no assurance that the fund could obtain the fair value assigned to an investment if it were to sell the investment at the same time at which the fund determines its net asset value per share.
Various inputs are used in determining the value of the fund’s assets or liabilities. These inputs are categorized into three broad levels. In certain cases, the inputs used to measure fair value may fall into different levels of the fair value hierarchy. In such cases, an investment’s level within the fair value hierarchy is based on the lowest level of input that is significant to the fair value measurement. The fund’s assessment of the significance of a particular input to the fair value measurement in its entirety requires judgment, and considers factors specific to the investment. Level 1 includes unadjusted quoted prices in active markets for identical assets or liabilities. Level 2 includes other significant observable market-based inputs (including quoted prices for similar securities, interest rates, prepayment speed, and credit risk). Level 3 includes unobservable inputs, which may include the adviser’s own assumptions in determining the fair value of investments. The following is a summary of the levels used as of February 28, 2013 in valuing the fund’s assets or liabilities:
| | | | | | | | | | | | | | | | |
| Investments at Value | | Level 1 | | | Level 2 | | | Level 3 | | | Total | |
| Equity Securities: | | | | | | | | | | | | | | | | |
United States | | | $139,650,710 | | | | $— | | | | $— | | | | $139,650,710 | |
Japan | | | 36,176,067 | | | | — | | | | — | | | | 36,176,067 | |
Hong Kong | | | 29,585,126 | | | | — | | | | — | | | | 29,585,126 | |
Australia | | | — | | | | 22,607,764 | | | | — | | | | 22,607,764 | |
United Kingdom | | | 10,276,948 | | | | 6,724,313 | | | | — | | | | 17,001,261 | |
Singapore | | | — | | | | 10,881,110 | | | | — | | | | 10,881,110 | |
France | | | — | | | | 8,575,643 | | | | — | | | | 8,575,643 | |
Netherlands | | | — | | | | 8,342,468 | | | | — | | | | 8,342,468 | |
Austria | | | 7,420,771 | | | | — | | | | — | | | | 7,420,771 | |
Other Countries | | | 15,253,191 | | | | — | | | | — | | | | 15,253,191 | |
| Mutual Funds | | | 4,064,702 | | | | — | | | | — | | | | 4,064,702 | |
| Total Investments | | | $242,427,515 | | | | $57,131,298 | | | | $— | | | | $299,558,813 | |
For further information regarding security characteristics, see the Portfolio of Investments.
Of the level 2 investments presented above, equity investments amounting to $23,642,424 would have been considered level 1 investments at the beginning of the period. Of the level 1 investments presented above, equity investments amounting to $47,617,198 would have been considered level 2 investments at the beginning of the period. The primary reason for changes in the classifications between levels 1 and 2 occurs when foreign equity securities are fair valued using other observable market-based inputs in place of the closing exchange price due to events occurring after the close of the exchange or market on which the investment is principally traded. The fund’s foreign equity securities may often be valued at fair value. The fund’s policy is to recognize transfers between the levels as of the end of the period.
Foreign Currency Translation – Purchases and sales of foreign investments, income, and expenses are converted into U.S. dollars based upon currency exchange rates
19
Notes to Financial Statements – continued
prevailing on the respective dates of such transactions or on the reporting date for foreign denominated receivables and payables. Gains and losses attributable to foreign currency exchange rates on sales of securities are recorded for financial statement purposes as net realized gains and losses on investments. Gains and losses attributable to foreign exchange rate movements on receivables, payables, income and expenses are recorded for financial statement purposes as foreign currency transaction gains and losses. That portion of both realized and unrealized gains and losses on investments that results from fluctuations in foreign currency exchange rates is not separately disclosed.
Indemnifications – Under the fund’s organizational documents, its officers and Trustees may be indemnified against certain liabilities and expenses arising out of the performance of their duties to the fund. Additionally, in the normal course of business, the fund enters into agreements with service providers that may contain indemnification clauses. The fund’s maximum exposure under these agreements is unknown as this would involve future claims that may be made against the fund that have not yet occurred.
Investment Transactions and Income – Investment transactions are recorded on the trade date. Dividends received in cash are recorded on the ex-dividend date. Certain dividends from foreign securities will be recorded when the fund is informed of the dividend if such information is obtained subsequent to the ex-dividend date. Dividend payments received in additional securities are recorded on the ex-dividend date in an amount equal to the value of the security on such date.
The fund may receive proceeds from litigation settlements. Any proceeds received from litigation involving portfolio holdings are reflected in the Statement of Operations in realized gain/loss if the security has been disposed of by the fund or in unrealized gain/loss if the security is still held by the fund. Any other proceeds from litigation not related to portfolio holdings are reflected as other income in the Statement of Operations.
Fees Paid Indirectly – The fund’s custody fee may be reduced according to an arrangement that measures the value of cash deposited with the custodian by the fund. This amount, for the year ended February 28, 2013, is shown as a reduction of total expenses in the Statement of Operations.
Tax Matters and Distributions – The fund intends to qualify as a regulated investment company, as defined under Subchapter M of the Internal Revenue Code, and to distribute all of its taxable income, including realized capital gains. As a result, no provision for federal income tax is required. The fund’s federal tax returns, when filed, will remain subject to examination by the Internal Revenue Service for a three year period. Foreign taxes have been accrued by the fund in the accompanying financial statements.
Distributions to shareholders are recorded on the ex-dividend date. Income and capital gain distributions are determined in accordance with income tax regulations, which may differ from U.S. generally accepted accounting principles. Certain capital accounts in the financial statements are periodically adjusted for permanent differences in order to reflect their tax character. These adjustments have no impact on net assets or net asset value per share. Temporary differences which arise from recognizing certain items
20
Notes to Financial Statements – continued
of income, expense, gain or loss in different periods for financial statement and tax purposes will reverse at some time in the future. Distributions in excess of net investment income or net realized gains are temporary overdistributions for financial statement purposes resulting from differences in the recognition or classification of income or distributions for financial statement and tax purposes.
Book/tax differences primarily relate to passive foreign investment companies, wash sale loss deferrals, and treating a portion of the proceeds from redemptions as a distribution for tax purposes.
The tax character of distributions declared to shareholders for the last two fiscal years is as follows:
| | | | | | | | |
| | | 2/28/13 | | | 2/29/12 | |
Ordinary income (including any
short-term capital gains) | | | $13,925,927 | | | | $6,802,871 | |
| Long-term capital gains | | | 5,453,404 | | | | 5,949,382 | |
| Total distributions | | | $19,379,331 | | | | $12,752,253 | |
The federal tax cost and the tax basis components of distributable earnings were as follows:
| | | | |
| As of 2/28/13 | | | |
| Cost of investments | | | $232,414,929 | |
| Gross appreciation | | | 68,310,083 | |
| Gross depreciation | | | (1,166,199 | ) |
| Net unrealized appreciation (depreciation) | | | $67,143,884 | |
| Undistributed ordinary income | | | 4,779,703 | |
| Undistributed long-term capital gain | | | 2,302,084 | |
| Other temporary differences | | | (7,648 | ) |
Multiple Classes of Shares of Beneficial Interest – The fund offers multiple classes of shares, which differ in their respective distribution and/or service fees. The fund’s income, realized and unrealized gain (loss), and common expenses are allocated to shareholders based on the daily net assets of each class. Dividends are declared separately for each class. Differences in per share dividend rates are generally due to differences in separate class expenses. The fund’s distributions declared to shareholders as reported in the Statements of Changes in Net Assets are presented by class as follows:
| | | | | | | | | | | | | | | | |
| | | From net investment
income | | | From net realized gain on
investments | |
| | | Year
ended
2/28/13 (i) | | | Year
ended
2/29/12 | | | Year
ended
2/28/13 (i) | | | Year
ended
2/29/12 | |
| Class A | | | $8,821 | | | | $4,914 | | | | $8,986 | | | | $7,172 | |
| Class I | | | 745,043 | | | | 5,570,360 | | | | 3,157,110 | | | | 7,169,807 | |
| Class R5 | | | 9,138,272 | | | | — | | | | 6,321,099 | | | | — | |
| Total | | | $9,892,136 | | | | $5,575,274 | | | | $9,487,195 | | | | $7,176,979 | |
| (i) | For Class R5, the period is from inception, July 2, 2012, through the stated period end. |
21
Notes to Financial Statements – continued
(3) Transactions with Affiliates
Investment Adviser – The fund has an investment advisory agreement with MFS to provide overall investment management and related administrative services and facilities to the fund. The management fee is computed daily and paid monthly at the following annual rates:
| | | | |
| First $1 billion of average daily net assets | | | 0.90 | % |
| Next $1.5 billion of average daily net assets | | | 0.75 | % |
| Average daily net assets in excess of $2.5 billion | | | 0.65 | % |
The management fee incurred for the year ended February 28, 2013 was equivalent to an annual effective rate of 0.90% of the fund’s average daily net assets.
Distributor – MFS Fund Distributors, Inc. (MFD), a wholly-owned subsidiary of MFS, as distributor, received $0 for the year ended February 28, 2013, as its portion of the initial sales charge on sales of Class A shares of the fund.
The Board of Trustees has adopted a distribution plan for certain class shares pursuant to Rule 12b-1 of the Investment Company Act of 1940.
The fund’s distribution plan provides that the fund will pay MFD for services provided by MFD and financial intermediaries in connection with the distribution and servicing of certain share classes. One component of the plan is a distribution fee paid to MFD and another component of the plan is a service fee paid to MFD. MFD may subsequently pay all, or a portion, of the distribution and/or service fees to financial intermediaries.
Distribution Plan Fee Table:
| | | | | | | | | | | | | | | | | | | | |
| | | Distribution
Fee Rate (d) | | | Service
Fee Rate (d) | | | Total
Distribution
Plan (d) | | | Annual
Effective
Rate (e) | | | Distribution
and Service
Fee | |
| Class A | | | — | | | | 0.25% | | | | 0.25% | | | | 0.25% | | | | $624 | |
| (d) | In accordance with the distribution plan for certain classes, the fund pays distribution and/or service fees equal to these annual percentage rates of each class’s average daily net assets. The distribution and service fee rates disclosed by class represent the current rates in effect at the end of the reporting period. |
| (e) | The annual effective rates represent actual fees incurred under the distribution plan for the year ended February 28, 2013 based on each class’s average daily net assets. |
Certain Class A shares are subject to a contingent deferred sales charge (CDSC) in the event of a shareholder redemption within 18 months of purchase for shares purchased on or after August 1, 2012, and within 24 months of purchase for shares purchased prior to August 1, 2012. There were no contingent deferred sales charges imposed during the year ended February 28, 2013.
Shareholder Servicing Agent – MFS Service Center, Inc. (MFSC), a wholly-owned subsidiary of MFS, provides transfer agent and recordkeeping functions in connection with the issuance, transfer, and redemption of shares of the fund under a Shareholder Servicing Agent Agreement. MFSC is not paid a fee for providing these services. MFSC may receive payment from the fund for out-of-pocket expenses, sub-accounting and other shareholder servicing costs which may be paid to affiliated and unaffiliated service providers. Class R5 shares do not incur sub-accounting fees. For the year ended February 28, 2013, out-of-pocket expenses amounted to $224. The fund may also pay shareholder servicing related costs to non-related parties.
22
Notes to Financial Statements – continued
Administrator – MFS provides certain financial, legal, shareholder communications, compliance, and other administrative services to the fund. Under an administrative services agreement, the fund partially reimburses MFS the costs incurred to provide these services. The fund is charged an annual fixed amount of $17,500 plus a fee based on average daily net assets. The administrative services fee incurred for the year ended February 28, 2013 was equivalent to an annual effective rate of 0.0177% of the fund’s average daily net assets.
Trustees’ and Officers’ Compensation – The fund pays compensation to independent Trustees in the form of a retainer, attendance fees, and additional compensation to Board and Committee chairpersons. The fund does not pay compensation directly to Trustees or to officers of the fund who are also officers of the investment adviser, all of whom receive remuneration for their services to the fund from MFS. Certain officers and Trustees of the fund are officers or directors of MFS, MFS Fund Distributors, Inc. (MFD), and MFSC.
Other – This fund and certain other funds managed by MFS (the funds) have entered into services agreements (the Agreements) which provide for payment of fees by the funds to Tarantino LLC and Griffin Compliance LLC in return for the provision of services of an Independent Chief Compliance Officer (ICCO) and Assistant ICCO, respectively, for the funds. The ICCO and Assistant ICCO are officers of the funds and the sole members of Tarantino LLC and Griffin Compliance LLC, respectively. The funds can terminate the Agreements with Tarantino LLC and Griffin Compliance LLC at any time under the terms of the Agreements. For the year ended February 28, 2013, the aggregate fees paid by the fund to Tarantino LLC and Griffin Compliance LLC were $2,058 and are included in “Miscellaneous” expense in the Statement of Operations. MFS has agreed to reimburse the fund for a portion of the payments made by the fund in the amount of $851, which is shown as a reduction of total expenses in the Statement of Operations. Additionally, MFS has agreed to bear all expenses associated with office space, other administrative support, and supplies provided to the ICCO and Assistant ICCO.
The fund invests in the MFS Institutional Money Market Portfolio which is managed by MFS and seeks current income consistent with preservation of capital and liquidity. Income earned on this investment is included in “Dividends from underlying affiliated funds” in the Statement of Operations. This money market fund does not pay a management fee to MFS.
On June 29, 2012, MFS purchased 7,278 shares of Class R5 for an aggregate amount of $100,000. At February 28, 2013, MFS held 100% and 100% of the outstanding shares of Class A and Class I, respectively.
(4) Portfolio Securities
Purchases and sales of investments, other than short-term obligations aggregated $132,989,124 and $118,252,908, respectively.
23
Notes to Financial Statements – continued
(5) Shares of Beneficial Interest
The fund’s Declaration of Trust permits the Trustees to issue an unlimited number of full and fractional shares of beneficial interest. Transactions in fund shares were as follows:
| | | | | | | | | | | | | | | | |
| | | Year ended
2/28/13 (i) | | | Year ended
2/29/12 | |
| | | Shares | | | Amount | | | Shares | | | Amount | |
| Shares sold | | | | | | | | | | | | | | | | |
Class A | | | — | | | | $— | | | | — | | | | $— | |
Class I | | | 696,721 | | | | 9,351,221 | | | | 2,875,159 | | | | 36,891,209 | |
Class R5 | | | 20,161,300 | | | | 280,296,080 | | | | — | | | | — | |
| | | 20,858,021 | | | | $289,647,301 | | | | 2,875,159 | | | | $36,891,209 | |
| | | |
Shares issued to shareholders in
reinvestment of distributions | | | | | | | | | | | | | |
Class A | | | 1,262 | | | | $17,807 | | | | 957 | | | | $12,086 | |
Class I | | | 303,616 | | | | 3,902,153 | | | | 1,014,347 | | | | 12,740,167 | |
Class R5 | | | 1,069,113 | | | | 15,459,371 | | | | — | | | | — | |
| | | 1,373,991 | | | | $19,379,331 | | | | 1,015,304 | | | | $12,752,253 | |
| | | |
| Shares reacquired | | | | | | | | | | | | | |
Class I | | | (18,934,608 | ) | | | $(260,810,383 | ) | | | (771,970 | ) | | | $(10,469,393 | ) |
Class R5 | | | (1,204,914 | ) | | | (17,478,909 | ) | | | — | | | | — | |
| | | (20,139,522 | ) | | | $(278,289,292 | ) | | | (771,970 | ) | | | $(10,469,393 | ) |
| | | | |
| Net change | | | | | | | | | | | | | | | | |
Class A | | | 1,262 | | | | $17,807 | | | | 957 | | | | $12,086 | |
Class I | | | (17,934,271 | ) | | | (247,557,009 | ) | | | 3,117,536 | | | | 39,161,983 | |
Class R5 | | | 20,025,499 | | | | 278,276,542 | | | | — | | | | — | |
| | | 2,092,490 | | | | $30,737,340 | | | | 3,118,493 | | | | $39,174,069 | |
| (i) | For Class R5, the period is from inception, July 2, 2012, through the stated period end. |
Class A, Class B, Class C, Class R1, Class R2, Class R3, and Class R4 shares were not available for sale during the period. During the period, the fund’s Class I and Class R5 shares were available for sale only to funds distributed by MFD that invest primarily in shares of other MFS funds (“MFS fund-of-funds”). Please see the fund’s prospectus for details.
The fund is solely invested in by the MFS funds-of-funds. The MFS funds-of-funds do not invest in the underlying MFS funds for the purpose of exercising management or control. At the end of the period, the MFS Growth Allocation Fund, MFS Moderate Allocation Fund, MFS Aggressive Growth Allocation Fund, MFS Conservative Allocation Fund, MFS Lifetime 2040 Fund, MFS Lifetime 2030 Fund, and MFS Lifetime 2020 Fund were the owners of record of approximately 34%, 28%, 20%, 7%, 3%, 3%, and 1% respectively, of the value of outstanding voting shares of the fund. In addition, the MFS Lifetime 2055 Fund, MFS Lifetime 2050 Fund,
24
Notes to Financial Statements – continued
MFS Lifetime 2045 Fund, MFS Lifetime 2035 Fund, MFS Lifetime 2025 Fund, MFS Lifetime 2015 Fund, MFS Lifetime 2010 Fund, and MFS Lifetime Retirement Income Fund were each the owners of record of less than 1% of the value of outstanding voting shares of the fund.
(6) Line of Credit
The fund and certain other funds managed by MFS participate in a $1.1 billion unsecured committed line of credit, subject to a $1 billion sublimit, provided by a syndication of banks under a credit agreement. Borrowings may be made for temporary financing needs. Interest is charged to each fund, based on its borrowings, generally at a rate equal to the higher of the Federal Reserve funds rate or one month LIBOR plus an agreed upon spread. A commitment fee, based on the average daily, unused portion of the committed line of credit, is allocated among the participating funds at the end of each calendar quarter. In addition, the fund and other funds managed by MFS have established unsecured uncommitted borrowing arrangements with certain banks for temporary financing needs. Interest is charged to each fund, based on its borrowings, at a rate equal to the Federal Reserve funds rate plus an agreed upon spread. For the year ended February 28, 2013, the fund’s commitment fee and interest expense were $1,601 and $0, respectively, and are included in “Miscellaneous” expense in the Statement of Operations.
(7) Transactions in Underlying Affiliated Funds-Affiliated Issuers
An affiliated issuer may be considered one in which the fund owns 5% or more of the outstanding voting securities, or a company which is under common control. For the purposes of this report, the fund assumes the following to be an affiliated issuer:
| | | | | | | | | | | | | | | | |
| Underlying Affiliated Fund | | Beginning Shares/Par Amount | | | Acquisitions Shares/Par Amount | | | Dispositions Shares/Par Amount | | | Ending Shares/Par Amount | |
MFS Institutional Money
Market Portfolio | | | 5,523,158 | | | | 88,840,297 | | | | (90,298,753 | ) | | | 4,064,702 | |
| | | | |
| Underlying Affiliated Fund | | Realized
Gain (Loss) | | | Capital Gain
Distributions | | | Dividend Income | | | Ending Value | |
MFS Institutional Money
Market Portfolio | | | $— | | | | $— | | | | $7,339 | | | | $4,064,702 | |
(8) Correction Information
The purpose of the modification of the fund’s financial statements is to correct the erroneous reclassification of a corporate action as a return of capital. The correction of the error resulted in an increase in dividend income and cost of investments and a reduction in unrealized gain on investments over previously reported amounts. The Statement of Assets and Liabilities, Portfolio of Investments, Statement of Operations, Statements of Changes in Net Assets and Financial Highlights in the fund’s financial statements have all been amended to correct the error. Other than the information described in this note, no other information, including reported investments at value, net assets, changes in net assets from operations, annual total return or net asset value per share, in the fund’s financial statements has been amended.
Detailed below are the previously reported and corrected balances for each of the impacted statements.
25
Notes to Financial Statements – continued
| | | | | | | | |
| | | Previously
Reported | | | Corrected | |
| | |
| Portfolio of Investments at February 28, 2013 | | | | | | |
| Total Common Stocks (Identified Cost) | | | $212,785,463 | | | | $215,640,330 | |
| Total Investments (Identified Cost) | | | $216,850,165 | | | | $219,705,032 | |
| | |
Statement of Assets and
Liabilities at February 28, 2013 | | | | | | |
| Investments, Non-affiliated issuers identified cost | | | $212,785,463 | | | | $215,640,330 | |
| Total investments identified cost | | | $216,850,165 | | | | $219,705,032 | |
| Unrealized appreciation (depreciation) on investments and translation of assets and liabilities in foreign currencies | | | $82,701,000 | | | | $79,846,133 | |
| Undistributed net investment income | | | $537,074 | | | | $3,391,941 | |
| | |
Statement of Operations
Year ended February 28, 2013 | | | | | | |
| Income: | | | | | | | | |
Dividends | | | $5,467,126 | | | | $8,321,993 | |
| Total investment income | | | $5,170,237 | | | | $8,025,104 | |
| Net investment income | | | $2,609,909 | | | | $5,464,776 | |
| Change in unrealized appreciation (depreciation): | | | | | | | | |
Investments | | | $31,201,400 | | | | $28,346,533 | |
Net unrealized gain (loss) on investments and foreign
currency translation | | | $31,188,466 | | | | $28,333,599 | |
Net realized and unrealized gain (loss) on investments and
foreign currency | | | $46,575,425 | | | | $43,720,558 | |
| | |
Statements of Changes in Net Assets
Year ended February 28, 2013 | | | | | | |
| Net investment income | | | $2,609,909 | | | | $5,464,776 | |
| Net unrealized gain (loss) on investments and foreign currency translation | | | $31,188,466 | | | | $28,333,599 | |
| Net assets: undistributed net investment income | | | $537,074 | | | | $3,391,941 | |
| | | | | | | | | | | | | | | | | | | | | | | | |
Financial Highlights Year ended February 28, 2013 | | | | |
| | | |
| | | Class A | | | Class I | | | Class R5 | |
| | | Previously
Reported | | | Corrected | | | Previously
Reported | | | Corrected | | | Previously
Reported | | | Corrected | |
| |
| Income (loss) from investment operations | | | | |
| Net investment income | | | $0.11 | | | | $0.26 | | | | $0.30 | | | | $0.44 | | | | $0.04 | | | | $0.14 | |
| Net realized and unrealized gain (loss) on investments and foreign currency | | | $2.53 | | | | $2.38 | | | | $2.37 | | | | $2.23 | | | | $2.20 | | | | $2.10 | |
| |
| Ratios (%) (to average net assets): | | | | |
| Net investment income | | | 0.76 | | | | 1.85 | | | | 2.20 | | | | 3.30 | | | | 0.39 | | | | 1.48 | |
26
REPORT OF INDEPENDENT REGISTERED PUBLIC ACCOUNTING FIRM
To the Trustees and Shareholders of
MFS Global Real Estate Fund:
We have audited the accompanying statement of assets and liabilities of MFS Global Real Estate Fund (the Fund), including the portfolio of investments, as of February 28, 2013, and the related statement of operations for the year then ended, the statements of changes in net assets for each of the two years in the period then ended, and the financial highlights for each of the periods indicated therein. These financial statements and financial highlights are the responsibility of the Fund’s management. Our responsibility is to express an opinion on these financial statements and financial highlights based on our audits.
We conducted our audits in accordance with the standards of the Public Company Accounting Oversight Board (United States). Those standards require that we plan and perform the audit to obtain reasonable assurance about whether the financial statements and financial highlights are free of material misstatement. We were not engaged to perform an audit of the Fund’s internal control over financial reporting. Our audits included consideration of internal control over financial reporting as a basis for designing audit procedures that are appropriate in the circumstances, but not for the purpose of expressing an opinion on the effectiveness of the Fund’s internal control over financial reporting. Accordingly, we express no such opinion. An audit also includes examining, on a test basis, evidence supporting the amounts and disclosures in the financial statements and financial highlights, assessing the accounting principles used and significant estimates made by management, and evaluating the overall financial statement presentation. Our procedures included confirmation of securities owned as of February 28, 2013, by correspondence with the Fund’s custodian and brokers or by other appropriate auditing procedures when replies from brokers were not received. We believe that our audits provide a reasonable basis for our opinion.
In our opinion, the financial statements and financial highlights referred to above present fairly, in all material respects, the financial position of MFS Global Real Estate Fund at February 28, 2013, the results of its operations for the year then ended, the changes in its net assets for each of the two years in the period then ended, and its financial highlights for the periods indicated therein, in conformity with U.S. generally accepted accounting principles.

Boston, Massachusetts
April 12, 2013, except as to Note 8, which is as of June 19, 2013
27
TRUSTEES AND OFFICERS — IDENTIFICATION AND BACKGROUND
The Trustees and officers of the Trust, as of April 1, 2013, are listed below, together with their principal occupations during the past five years. (Their titles may have varied during that period.) The address of each Trustee and officer is 111 Huntington Avenue, Boston, Massachusetts 02199-7618.
| | | | | | | | |
Name, Age | | Position(s) Held with Fund | | Trustee/Officer Since (h) | | Principal
Occupations During the Past Five Years | | Other Directorships (j) |
| INTERESTED TRUSTEES |
Robert J. Manning (k) (age 49) | | Trustee | | February 2004 | | Massachusetts Financial Services Company, Chairman, Chief Executive Officer and Director; President (until December 2009); Chief Investment Officer (until July 2010) | | N/A |
| INDEPENDENT TRUSTEES |
David H. Gunning (age 70) | | Trustee and Chair of Trustees | | January 2004 | | Private investor | | Lincoln Electric Holdings, Inc. (welding equipment manufacturer), Director; Development Alternatives, Inc. (consulting), Director/Non-Executive Chairman; Portman Limited (mining), Director (until 2008) |
Robert E. Butler (age 71) | | Trustee | | January 2006 | | Consultant – investment company industry regulatory and compliance matters | | N/A |
Maureen R. Goldfarb (age 57) | | Trustee | | January 2009 | | Private investor | | N/A |
William R. Gutow (age 71) | | Trustee | | December 1993 | | Private investor and real estate consultant; Capitol Entertainment Management Company (video franchise), Vice Chairman | | Texas Donuts (donut franchise), Vice Chairman (until 2010) |
28
Trustees and Officers – continued
| | | | | | | | |
Name, Age | | Position(s) Held with Fund | | Trustee/Officer Since (h) | | Principal
Occupations During the Past Five Years | | Other Directorships (j) |
Michael Hegarty (age 68) | | Trustee | | December 2004 | | Private investor; Rouse Properties Inc. (real estate), Director | | Brookfield Office Properties, Inc. (real estate), Director; Rouse Properties Inc.
(real estate), Director; Capmark Financial Group Inc. (real estate), Director |
John P. Kavanaugh (age 58) | | Trustee | | January 2009 | | Private investor | | N/A |
J. Dale Sherratt (age 74) | | Trustee | | June 1989 | | Insight Resources, Inc. (acquisition planning specialists), President; Wellfleet Investments (investor in health care companies), Managing General Partner | | N/A |
Laurie J. Thomsen (age 55) | | Trustee | | March 2005 | | Private investor; New Profit, Inc. (venture philanthropy), Executive Partner
(until 2010) | | The Travelers Companies (insurance), Director |
Robert W. Uek (age 71) | | Trustee | | January 2006 | | Consultant to investment company industry | | N/A |
| OFFICERS |
John M. Corcoran (k) (age 47) | | President | | October 2008 | | Massachusetts Financial Services Company, Senior Vice President (since October 2008); State Street Bank and Trust (financial services provider), Senior Vice President, (until September 2008) | | N/A |
Christopher R. Bohane (k) (age 39) | | Assistant Secretary and Assistant Clerk | | July 2005 | | Massachusetts Financial Services Company, Vice President and Senior Counsel | | N/A |
Kino Clark (k) (age 44) | | Assistant Treasurer | | January 2012 | | Massachusetts Financial Services Company, Vice President | | N/A |
29
Trustees and Officers – continued
| | | | | | | | |
Name, Age | | Position(s) Held with Fund | | Trustee/Officer Since (h) | | Principal
Occupations During the Past Five Years | | Other Directorships (j) |
Thomas H. Connors (k) (age 53) | | Assistant Secretary and Assistant Clerk | | September 2012 | | Massachusetts Financial Services Company, Vice President and Senior Counsel; Deutsche Investment Management Americas Inc. (financial service provider), Director and Senior Counsel (until 2012) | | N/A |
Ethan D. Corey (k) (age 49) | | Assistant Secretary and Assistant Clerk | | July 2005 | | Massachusetts Financial Services Company, Senior Vice President and Associate General Counsel | | N/A |
David L. DiLorenzo (k) (age 44) | | Treasurer | | July 2005 | | Massachusetts Financial Services Company, Senior Vice President | | N/A |
Robyn L. Griffin (age 37) | | Assistant Independent Chief Compliance Officer | | August 2008 | | Griffin Compliance LLC (provider of compliance services), Principal (since August 2008); State Street Corporation (financial services provider), Mutual Fund Administration Assistant Vice President (October 2006 – July 2008) | | N/A |
Brian E. Langenfeld (k) (age 40) | | Assistant Secretary and Assistant Clerk | | June 2006 | | Massachusetts Financial Services Company, Vice President and Senior Counsel | | N/A |
Susan S. Newton (k) (age 63) | | Assistant Secretary and Assistant Clerk | | May 2005 | | Massachusetts Financial Services Company, Senior Vice President and Associate General Counsel | | N/A |
30
Trustees and Officers – continued
| | | | | | | | |
Name, Age | | Position(s) Held with Fund | | Trustee/Officer Since (h) | | Principal
Occupations During the Past Five Years | | Other Directorships (j) |
Susan A. Pereira (k) (age 42) | | Assistant Secretary and Assistant Clerk | | July 2005 | | Massachusetts Financial Services Company, Vice President and Senior Counsel | | N/A |
Kasey L. Phillips (k) (age 42) | | Assistant Treasurer | | September 2012 | | Massachusetts Financial Services Company, Vice President; Wells Fargo Funds Management, LLC, Senior Vice President, Fund Treasurer (until 2012) | | N/A |
Mark N. Polebaum (k) (age 60) | | Secretary and Clerk | | January 2006 | | Massachusetts Financial Services Company, Executive Vice President, General Counsel and Secretary | | N/A |
Frank L. Tarantino (age 69) | | Independent Chief Compliance Officer | | June 2004 | | Tarantino LLC (provider of compliance services), Principal | | N/A |
Richard S. Weitzel (k) (age 42) | | Assistant Secretary and Assistant Clerk | | October 2007 | | Massachusetts Financial Services Company, Senior Vice President and Associate General Counsel | | N/A |
James O. Yost (k) (age 52) | | Deputy Treasurer | | September 1990 | | Massachusetts Financial Services Company, Senior Vice President | | N/A |
| (h) | Date first appointed to serve as Trustee/officer of an MFS fund. Each Trustee has served continuously since appointment unless indicated otherwise. For the period from December 15, 2004 until February 22, 2005, Mr. Manning served as Advisory Trustee. For the period October 2008, until January 2012, Mr. Corcoran served as Treasurer of the Funds. Prior to January 2012, Messrs. DiLorenzo and Yost served as Assistant Treasurers of the Funds. |
| (j) | Directorships or trusteeships of companies required to report to the Securities and Exchange Commission (i.e., “public companies”). |
| (k) | “Interested person” of the Trust within the meaning of the Investment Company Act of 1940 (referred to as the 1940 Act), which is the principal federal law governing investment companies like the fund, as a result of position with MFS. The address of MFS is 111 Huntington Avenue, Boston, Massachusetts 02199-7618. |
31
Trustees and Officers – continued
Each Trustee has been elected by shareholders and each Trustee and officer holds office until his or her successor is chosen and qualified or until his or her earlier death, resignation, retirement or removal. The Trust does not hold annual meetings for the purpose of electing Trustees, and Trustees are not elected for fixed terms. Messrs. Butler, Kavanaugh, Uek and Ms. Thomsen are members of the Trust’s Audit Committee.
Each of the Fund’s Trustees and officers holds comparable positions with certain other funds of which MFS or a subsidiary is the investment adviser or distributor, and, in the case of the officers, with certain affiliates of MFS. As of January 1, 2013, the Trustees served as board members of 143 funds within the MFS Family of Funds.
The Statement of Additional Information for the Fund includes further information about the Trustees and is available without charge upon request by calling 1-800-225-2606.
| | |
| Investment Adviser | | Custodian |
Massachusetts Financial Services Company
111 Huntington Avenue
Boston, MA 02199-7618 | | State Street Bank and Trust Company 1 Lincoln Street Boston, MA 02111-2900 |
| Distributor | | Independent Registered Public Accounting Firm |
MFS Fund Distributors, Inc.
111 Huntington Avenue
Boston, MA 02199-7618 | | Ernst & Young LLP 200 Clarendon Street
Boston, MA 02116 |
| Portfolio Manager | | |
| Richard Gable | | |
32
BOARD REVIEW OF INVESTMENT ADVISORY AGREEMENT
A discussion regarding the Board’s most recent review and renewal of the fund’s Investment Advisory Agreement with MFS is available by clicking on the fund’s name under “Mutual Funds” in the “Products” section of the MFS Web site (mfs.com).
PROXY VOTING POLICIES AND INFORMATION
A general description of the MFS funds’ proxy voting policies and procedures is available without charge, upon request, by calling 1-800-225-2606, by visiting the Proxy Voting section of mfs.com or by visiting the SEC’s Web site at http://www.sec.gov.
Information regarding how the fund voted proxies relating to portfolio securities during the most recent twelve-month period ended June 30 is available without charge by visiting the Proxy Voting section of mfs.com or by visiting the SEC’s Web site at http://www.sec.gov.
QUARTERLY PORTFOLIO DISCLOSURE
The fund will file a complete schedule of portfolio holdings with the Securities and Exchange Commission (the Commission) for the first and third quarters of each fiscal year on Form N-Q. A shareholder can obtain the quarterly portfolio holdings report at mfs.com. The fund’s Form N-Q is also available on the EDGAR database on the Commission’s Internet Web site at http://www.sec.gov, and may be reviewed and copied at the:
Public Reference Room
Securities and Exchange Commission
100 F Street, NE, Room 1580
Washington, D.C. 20549
Information on the operation of the Public Reference Room may be obtained by calling the Commission at 1-800-SEC-0330. Copies of the fund’s Form N-Q also may be obtained, upon payment of a duplicating fee, by electronic request at the following e-mail address: publicinfo@sec.gov or by writing the Public Reference Section at the above address.
FURTHER INFORMATION
From time to time, MFS may post important information about the fund or the MFS funds on the MFS web site (mfs.com). This information is available by visiting the “News & Commentary” section of mfs.com or by clicking on the fund’s name under “Mutual Funds” in the “Products” section of mfs.com.
FEDERAL TAX INFORMATION (unaudited)
The fund will notify shareholders of amounts for use in preparing 2013 income tax forms in January 2014. The following information is provided pursuant to provisions of the Internal Revenue Code.
The fund designates the maximum amount allowable as qualified dividend income eligible for the 15% tax rate.
The fund designates $6,144,000 as capital gain dividends paid during the fiscal year.
33
rev. 3/11
| | | | |
| | | |
FACTS | | WHAT DOES MFS DO WITH YOUR PERSONAL INFORMATION? | |  |
| | |
| Why? | | Financial companies choose how they share your personal information. Federal law gives consumers the right to limit some but not all sharing. Federal law also requires us to tell you how we collect, share, and protect your personal information. Please read this notice carefully to understand what we do. |
| | |
| What? | | The types of personal information we collect and share depend on the product or service you have with us. This information can include: •Social Security number and account balances •Account transactions and transaction history •Checking account information and wire transfer instructions When you are no longer our customer, we continue to share your information as described in this notice. |
| | |
| How? | | All financial companies need to share customers’ personal information to run their everyday business. In the section below, we list the reasons financial companies can share their customers’ personal information; the reasons MFS chooses to share; and whether you can limit this sharing. |
| | | | |
Reasons we can share your
personal information | | Does MFS
share? | | Can you limit
this sharing? |
For our everyday business purposes – such as to process your transactions, maintain your account(s), respond to court orders and legal investigations, or report to credit bureaus | | Yes | | No |
For our marketing purposes – to offer our products and services to you | | No | | We don’t share |
| For joint marketing with other financial companies | | No | | We don’t share |
For our affiliates’ everyday business purposes – information about your transactions and experiences | | No | | We don’t share |
For our affiliates’ everyday business purposes – information about your creditworthiness | | No | | We don’t share |
| For nonaffiliates to market to you | | No | | We don’t share |
| | |
| Questions? | | Call 800-225-2606 or go to mfs.com. |
34
| | |
| Who we are |
| Who is providing this notice? | | MFS Funds, MFS Investment Management, MFS Institutional Advisors, Inc., MFS Fund Distributors, Inc., MFS Heritage Trust Company, and MFS Service Center, Inc. |
| | |
| What we do |
| How does MFS protect my personal information? | | To protect your personal information from unauthorized access and use, we use security measures that comply with federal law. These measures include procedural, electronic, and physical safeguards for the protection of the personal information we collect about you. |
| How does MFS collect my personal information? | | We collect your personal information, for example, when you •open an account or provide account information •direct us to buy securities or direct us to sell your securities •make a wire transfer We also collect your personal information from others, such as credit bureaus, affiliates and other companies. |
| Why can’t I limit all sharing? | | Federal law gives you the right to limit only •sharing for affiliates’ everyday business purposes – information about your creditworthiness •affiliates from using your information to market to you •sharing for nonaffiliates to market to you State laws and individual companies may give you additional rights to limit sharing. |
| | |
| Definitions |
| Affiliates | | Companies related by common ownership or control. They can be financial and nonfinancial companies. •MFS does not share personal information with affiliates, except for everyday business purposes as described on page one of this notice. |
| Nonaffiliates | | Companies not related by common ownership or control. They can be financial and nonfinancial companies. •MFS does not share with nonaffiliates so they can market to you. |
| Joint Marketing | | A formal agreement between nonaffiliated financial companies that together market financial products or services to you. •MFS doesn’t jointly market. |
| | |
| Other important information |
| If you own an MFS product or receive an MFS service in the name of a third party such as a bank or broker-dealer, their privacy policy may apply to you instead of ours. |
35
Save paper with eDelivery.

| MFS® will send you prospectuses, |
reports, and proxies directly via e-mail so you will get information faster with less mailbox clutter.
To sign up:
1. Go to mfs.com.
2. Log in via MFS® Access.
3. Select eDelivery.
If you own your MFS fund shares through a financial institution or a retirement plan, MFS® TALK, MFS® Access, or eDelivery may not be available to you.
CONTACT
WEB SITE
mfs.com
MFS TALK
1-800-637-8255
24 hours a day
ACCOUNT SERVICE AND LITERATURE
Shareholders
1-800-225-2606
Financial advisors
1-800-343-2829
Retirement plan services
1-800-637-1255
MAILING ADDRESS
MFS Service Center, Inc.
P.O. Box 55824
Boston, MA 02205-5824
OVERNIGHT MAIL
MFS Service Center, Inc.
c/o Boston Financial Data Services
30 Dan Road
Canton, MA 02021-2809
ANNUAL REPORT
February 28, 2013

MFS® DIVERSIFIED INCOME FUND

DIF-ANN
MFS® DIVERSIFIED INCOME FUND
CONTENTS
The report is prepared for the general information of shareholders.
It is authorized for distribution to prospective investors only when preceded or accompanied by a current prospectus.
NOT FDIC INSURED Ÿ MAY LOSE VALUE Ÿ NO BANK GUARANTEE

LETTER FROM THE CHAIRMAN AND CEO
Dear Shareholders:
Global financial markets began 2013 with greater optimism. U.S. and Asian economic trends have turned more positive. Europe continues to struggle through its economic
slump. However, even there, sentiment has improved. The U.S. Congress averted its year-end fiscal cliff, but a degree of uncertainty remains regarding upcoming negotiations over spending cuts and the debt ceiling. The U.S. Federal Reserve Board is continuing its accommodative monetary easing, while the U.S. housing and job markets have made steady gains. Corporate profits have been resilient, and investors have demonstrated increased tolerance for risk.
Overseas, the eurozone remains in a broad contraction, with economic output receding in France as well as Italy and Spain.
However, large-scale early repayments of European Central Bank loans by banks and Germany’s strong rebound in manufacturing activity are encouraging signs. In Asia, both China and Japan appear to be in the early stages of a turnaround. China’s economic activity has picked up from last year’s relative slowdown, and Japan’s sharp devaluation of the yen, an important anti-deflationary measure, seems to be having its desired impact: Japanese stocks have soared, corporate profits are rising and confidence is returning among consumers, businesses and investors.
As always, managing risk in the face of uncertainty remains a top priority for investors. At MFS®, our uniquely collaborative investment process employs global research and active risk management. Our global team of investment professionals shares ideas and evaluates opportunities across continents, investment disciplines and asset classes — all with a goal of building better insights, and ultimately better results, for our clients.
We remain mindful of the many economic challenges investors face today, and believe it is more important than ever to maintain a long-term view and employ time-tested principles, such as asset allocation and diversification. We also remain confident that our unique approach can serve investors well as they work with their financial advisors to identify and pursue the most suitable opportunities.
Respectfully,

Robert J. Manning
Chairman and Chief Executive Officer
MFS Investment Management®
April 12, 2013
The opinions expressed in this letter are subject to change, may not be relied upon for investment advice, and no forecasts can be guaranteed.
1
PORTFOLIO COMPOSITION
Portfolio structure (i)
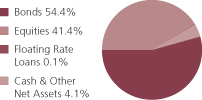
| | | | |
| Top ten holdings (i) | |
| U.S. Treasury Notes, 1.875%, 2014 | | | 2.6% | |
| U.S. Treasury Notes, 0.875%, 2016 | | | 2.0% | |
| Simon Property Group, Inc., REIT | | | 2.0% | |
| Public Storage, Inc., REIT | | | 1.5% | |
| Exxon Mobil Corp. | | | 1.4% | |
| Vornado Realty Trust, REIT | | | 1.0% | |
| U.S. Treasury Notes, 2.125%, 2015 | | | 1.0% | |
| Chevron Corp. | | | 0.9% | |
| Pfizer, Inc. | | | 0.9% | |
| JPMorgan Chase & Co. | | | 0.9% | |
| |
| Fixed income sectors (i) | | | | |
| High Yield Corporates | | | 19.4% | |
| Emerging Markets Bonds | | | 16.3% | |
| Mortgage-Backed Securities | | | 8.9% | |
| U.S. Treasury Securities | | | 7.0% | |
| High Grade Corporates | | | 1.3% | |
| U.S. Government Agencies | | | 1.0% | |
| Non-U.S. Government Bonds | | | 0.3% | |
| Commercial Mortgage-Backed Securities | | | 0.2% | |
| Floating Rate Loans | | | 0.1% | |
| Municipal Bonds (o) | | | 0.0% | |
| Collateralized Debt Obligations (o) | | | 0.0% | |
| | | | |
| Equity sectors (i) | |
| Financial Services | | | 24.0% | |
| Energy | | | 3.5% | |
| Health Care | | | 3.0% | |
| Utilities & Communications | | | 2.8% | |
| Leisure | | | 1.3% | |
| Technology | | | 1.3% | |
| Retailing | | | 1.2% | |
| Consumer Staples | | | 1.1% | |
| Industrial Goods & Services | | | 1.1% | |
| Basic Materials | | | 1.0% | |
| Autos & Housing | | | 0.7% | |
| Special Products & Services | | | 0.3% | |
| Transportation | | | 0.1% | |
|
| Composition including fixed income credit quality (a)(i) | |
| AAA (o) | | | 0.0% | |
| AA | | | 0.1% | |
| A | | | 1.3% | |
| BBB | | | 10.0% | |
| BB | | | 11.7% | |
| B | | | 11.5% | |
| CCC | | | 2.8% | |
| CC | | | 0.1% | |
| C (o) | | | 0.0% | |
| U.S. Government | | | 7.0% | |
| Federal Agencies | | | 9.9% | |
| Not Rated | | | 0.1% | |
| Non-Fixed Income | | | 41.4% | |
| Cash & Other | | | 4.1% | |
2
Portfolio Composition – continued
| (a) | For all securities other than those specifically described below, ratings are assigned to underlying securities utilizing ratings from Moody’s, Fitch, and Standard & Poor’s rating agencies and applying the following hierarchy: If all three agencies provide a rating, the middle rating (after dropping the highest and lowest ratings) is assigned; if two of the three agencies rate a security, the lower of the two is assigned. Ratings are shown in the S&P and Fitch scale (e.g., AAA). Securities rated BBB or higher are considered investment grade. All ratings are subject to change. U.S. Government includes securities issued by the U.S. Department of the Treasury. Federal Agencies includes rated and unrated U.S. Agency fixed-income securities, U.S. Agency mortgage-backed securities, and collateralized mortgage obligations of U.S. Agency mortgage-backed securities. Not Rated includes fixed income securities, including fixed income futures contracts, which have not been rated by any rating agency. Non-Fixed Income includes equity securities (including convertible bonds and equity derivatives) and commodities. Cash & Other includes cash, other assets less liabilities, offsets to derivative positions, and short-term securities. The fund may not hold all of these instruments. The fund is not rated by these agencies. |
| (i) | For purposes of this presentation, the components include the market value of securities, and reflect the impact of the equivalent exposure of derivative positions, if any. These amounts may be negative from time to time. The bond component will include any accrued interest amounts. Equivalent exposure is a calculated amount that translates the derivative position into a reasonable approximation of the amount of the underlying asset that the portfolio would have to hold at a given point in time to have the same price sensitivity that results from the portfolio’s ownership of the derivative contract. When dealing with derivatives, equivalent exposure is a more representative measure of the potential impact of a position on portfolio performance than market value. Where the fund holds convertible bonds, these are treated as part of the equity portion of the portfolio. |
Percentages are based on net assets as of 2/28/13.
The portfolio is actively managed and current holdings may be different.
3
MANAGEMENT REVIEW
Summary of Results
The MFS Diversified Income Fund includes investments in high yield corporate bonds, U.S. government securities, emerging markets debt, real estate investment trusts (“REITs”), and domestic equity securities.
For the twelve months ended February 28, 2013, Class A shares of the MFS Diversified Income Fund (“fund”) provided a total return of 10.56%, at net asset value. This compares with a return of 13.46% for the fund’s benchmark, the Standard & Poor’s 500 Stock Index. The fund’s other benchmark, the MFS Diversified Income Fund Blended Index (“Blended Index”), generated a return of 12.08%. The Blended Index reflects the blended returns of various equity and fixed income market indices, with percentage allocations to each index designed to resemble the allocations of the fund. The market indices and related percentage allocations used to compile the Blended Index are set forth in the Performance Summary.
Market Environment
The beginning of the period was characterized by a risk-on sentiment as a result of additional liquidity measures by the Federal Reserve Bank (“Fed”) and the European Central Bank (“ECB”) as well as a commensurate improvement in macroeconomic conditions. During this time, global equity valuations rose, credit spreads contracted, and high-quality sovereign yields increased modestly.
Within a couple of months, however, conditions worsened, driven by broadly weaker global macroeconomic indicators, as well as renewed concerns over the eurozone’s capacity and determination to address its ongoing crisis. Despite this deterioration, broad market sentiment remained relatively resilient as equity markets generally maintained gains and credit spreads did not indicate deterioration.
However, this renewed weakness in the fundamentals precipitated a further round of monetary easing by both the Fed (through a third round of quantitative easing) and the ECB (through a new bond purchase facility) in the middle of the period, which soon instilled additional confidence in risk markets. Nonetheless, towards the end of the calendar year, weaker equity earnings reports and declining forward guidance caused market sentiment to soften. In addition, year-end fiscal cliff negotiations between the Republicans in the U.S. Congress and President Obama were a particular source of market attention, where uncertainty surrounding the fiscal negotiations continued right up to the end-of-year deadline. A last minute political agreement averted the worst-case scenario and markets gravitated towards risk assets again, though the implementation of the U.S. budget sequester, combined with the uncertainty surrounding the Italian election results, inserted a greater degree of caution as the reporting period ended.
Factors affecting Performance
During the reporting period, bond selection within the emerging markets debt portion of the fund was a primary factor that detracted from relative performance since the fund’s holdings in this asset class generated lower returns than the JPMorgan Emerging Markets Bond Index Global, which is a component of the Blended Index. Security selection within both the high yield corporate bond and U.S. large cap value equity portions of the fund was another factor that hindered relative performance.
4
Management Review – continued
selection within both the high yield corporate bond and U.S. large cap value equity portions of the fund was another factor that hindered relative performance.
Strong security selection in the REITs portion of the fund, particularly during the middle of the reporting period, was a primary contributor to relative performance. In addition, an underweight allocation to U.S. government bonds boosted relative returns as this asset class underperformed the Blended Index during the period.
Respectfully,
| | | | | | |
| William Adams | | David Cole | | Richard Gable | | Matthew Ryan |
| Portfolio Manager | | Portfolio Manager | | Portfolio Manager | | Portfolio Manager |
| | | |
| Jonathan Sage | | Geoffrey Schechter | | James Swanson | | |
| Portfolio Manager | | Portfolio Manager | | Portfolio Manager | | |
The views expressed in this report are those of the portfolio managers only through the end of the period of the report as stated on the cover and do not necessarily reflect the views of MFS or any other person in the MFS organization. These views are subject to change at any time based on market or other conditions, and MFS disclaims any responsibility to update such views. These views may not be relied upon as investment advice or an indication of trading intent on behalf of any MFS portfolio. References to specific securities are not recommendations of such securities, and may not be representative of any MFS portfolio’s current or future investments.
5
PERFORMANCE SUMMARY THROUGH 2/28/13
The following chart illustrates a representative class of the fund’s historical performance in comparison to its benchmark(s). Performance results include the deduction of the maximum applicable sales charge and reflect the percentage change in net asset value, including reinvestment of dividends and capital gains distributions. The performance of other share classes will be greater than or less than that of the class depicted below. Benchmarks are unmanaged and may not be invested in directly. Benchmark returns do not reflect sales charges, commissions or expenses. (See Notes to Performance Summary.)
Performance data shown represents past performance and is no guarantee of future results. Investment return and principal value fluctuate so your shares, when sold, may be worth more or less than the original cost; current performance may be lower or higher than quoted. The performance shown does not reflect the deduction of taxes, if any, that a shareholder would pay on fund distributions or the redemption of fund shares.
Growth of a Hypothetical $10,000 Investment (t)
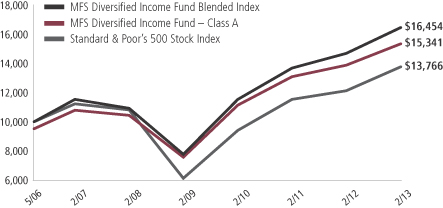
6
Performance Summary – continued
Total Returns through 2/28/13
Average annual without sales charge
| | | | | | | | | | | | |
| | | Share class | | Class inception date | | 1-yr | | 5-yr | | Life (t) | | |
| | | A | | 5/26/06 | | 10.56% | | 8.00% | | 7.30% | | |
| | | C | | 5/26/06 | | 9.84% | | 7.24% | | 6.53% | | |
| | | I | | 5/26/06 | | 10.83% | | 8.28% | | 7.59% | | |
| | | R1 | | 7/01/08 | | 9.75% | | N/A | | 7.90% | | |
| | | R2 | | 7/01/08 | | 10.39% | | N/A | | 8.46% | | |
| | | R3 | | 7/01/08 | | 10.65% | | N/A | | 8.72% | | |
| | | R4 | | 7/01/08 | | 10.83% | | N/A | | 8.97% | | |
| | | R5 | | 7/02/12 | | N/A | | N/A | | 8.47% | | |
| Comparative benchmarks | | | | | | | | |
| | | Standard & Poor’s 500 Stock Index (f) | | 13.46% | | 4.94% | | 4.83% | | |
| | | Barclays U.S. Government/Mortgage Bond Index (f) | | 1.95% | | 4.89% | | 5.87% | | |
| | | Barclays U.S. High-Yield Corporate Bond 2% Issuer Capped Index (f) | | 11.79% | | 11.47% | | 9.43% | | |
| | | JPMorgan Emerging Markets Bond Index Global (f) | | 11.38% | | 9.97% | | 9.94% | | |
| | | MFS Diversified Income Fund Blended
Index (f)(y) | | 12.08% | | 8.52% | | 7.63% | | |
| | | MSCI U.S. REIT Index (f) | | 17.44% | | 7.53% | | 5.60% | | |
| | | Russell 1000 Value Index (f) | | 17.63% | | 3.88% | | 3.77% | | |
| Average annual with sales charge | | | | |
| | | A
With Initial Sales Charge (4.75%) | | 5.31% | | 6.96% | | 6.53% | | |
| | | C
With CDSC (1% for 12 months) (x) | | 8.84% | | 7.24% | | 6.53% | | |
Class I, R1, R2, R3, R4 and R5 shares do not have a sales charge.
CDSC – Contingent Deferred Sales Charge.
| (f) | Source: FactSet Research Systems Inc. |
| (t) | For the period from the class inception date through the stated period end. The comparative benchmark performance information provided for the “life” period is from the inception date of the Class A shares. (See Notes to Performance Summary.) |
| (x) | Assuming redemption at the end of the applicable period. |
| (y) | MFS Diversified Income Fund Blended Index is at a point in time and allocations during the period can change. As of February 28, 2013 the blended index was comprised of 25% Barclays U.S. High-Yield Corporate Bond 2% Issuer Capped Index, 20% Barclays U.S. Government/Mortgage Bond Index, 20% Russell 1000 Value Index, 20% MSCI U.S. REIT Index, and 15% JPMorgan Emerging Markets Bond Index Global. |
7
Performance Summary – continued
Benchmark Definitions
Barclays U.S. Government/Mortgage Bond Index – measures debt issued by the U.S. Government, and its agencies, as well as mortgage-backed pass-through securities of Ginnie Mae (GNMA), Fannie Mae (FNMA), and Freddie Mac (FHLMC).
Barclays U.S. High-Yield Corporate Bond 2% Issuer Capped Index – a component of the Barclays U.S. High-Yield Corporate Bond Index, which measures performance of non-investment grade, fixed rate debt. The index limits the maximum exposure to any one issuer to 2%.
JPMorgan Emerging Markets Bond Index Global – measures the performance of U.S.-dollar-denominated debt instruments issued by emerging market sovereign and quasi-sovereign entities: Brady bonds, loans, Eurobonds.
MSCI U.S. REIT Index – a market capitalization-weighted index that is designed to measure equity market performance for real estate investment trusts (REITs) that generate a majority of their revenue and income from real estate rental and leasing operations.
Russell 1000 Value Index – constructed to provide a comprehensive barometer for the value securities in the large-cap segment of the U.S. equity universe. Companies in this index generally have lower price-to-book ratios and lower forecasted growth values.
Standard & Poor’s 500 Stock Index – a market capitalization-weighted index of 500 widely held equity securities, designed to measure broad U.S. equity performance.
It is not possible to invest directly in an index.
Notes to Performance Summary
Average annual total return represents the average annual change in value for each share class for the periods presented. Life returns are presented where the share class has less than 10 years of performance history and represent the average annual total return from the class inception date to the stated period end date. As the fund’s share classes may have different inception dates, the life returns may represent different time periods and may not be comparable.
Performance results reflect any applicable expense subsidies and waivers in effect during the periods shown. Without such subsidies and waivers the fund’s performance results would be less favorable. Please see the prospectus and financial statements for complete details.
Performance results do not include adjustments made for financial reporting purposes in accordance with U.S. generally accepted accounting principles and may differ from amounts reported in the financial highlights.
From time to time the fund may receive proceeds from litigation settlements, without which performance would be lower.
8
EXPENSE TABLE
Fund expenses borne by the shareholders during the period, September 1, 2012 through February 28, 2013
As a shareholder of the fund, you incur two types of costs: (1) transaction costs, including sales charges (loads) on certain purchase or redemption payments, and (2) ongoing costs, including management fees; distribution and service (12b-1) fees; and other fund expenses. This example is intended to help you understand your ongoing costs (in dollars) of investing in the fund and to compare these costs with the ongoing costs of investing in other mutual funds.
The example is based on an investment of $1,000 invested at the beginning of the period and held for the entire period September 1, 2012 through February 28, 2013.
Actual Expenses
The first line for each share class in the following table provides information about actual account values and actual expenses. You may use the information in this line, together with the amount you invested, to estimate the expenses that you paid over the period. Simply divide your account value by $1,000 (for example, an $8,600 account value divided by $1,000 = 8.6), then multiply the result by the number in the first line under the heading entitled “Expenses Paid During Period” to estimate the expenses you paid on your account during this period.
Hypothetical Example for Comparison Purposes
The second line for each share class in the following table provides information about hypothetical account values and hypothetical expenses based on the fund’s actual expense ratio and an assumed rate of return of 5% per year before expenses, which is not the fund’s actual return. The hypothetical account values and expenses may not be used to estimate the actual ending account balance or expenses you paid for the period. You may use this information to compare the ongoing costs of investing in the fund and other funds. To do so, compare this 5% hypothetical example with the 5% hypothetical examples that appear in the shareholder reports of the other funds.
Please note that the expenses shown in the table are meant to highlight your ongoing costs only and do not reflect any transactional costs, such as sales charges (loads). Therefore, the second line for each share class in the table is useful in comparing ongoing costs only, and will not help you determine the relative total costs of owning different funds. In addition, if these transactional costs were included, your costs would have been higher.
9
Expense Table – continued
| | | | | | | | | | | | | | | | | | |
Share
Class | | | | Annualized
Expense
Ratio | | | Beginning
Account Value
9/01/12 | | | Ending
Account Value
2/28/13 | | | Expenses
Paid During
Period (p) 9/01/12-2/28/13 | |
| A | | Actual | | | 1.10% | | | | $1,000.00 | | | | $1,052.19 | | | | $5.60 | |
| | Hypothetical (h) | | | 1.10% | | | | $1,000.00 | | | | $1,019.34 | | | | $5.51 | |
| C | | Actual | | | 1.85% | | | | $1,000.00 | | | | $1,048.27 | | | | $9.40 | |
| | Hypothetical (h) | | | 1.85% | | | | $1,000.00 | | | | $1,015.62 | | | | $9.25 | |
| I | | Actual | | | 0.85% | | | | $1,000.00 | | | | $1,053.50 | | | | $4.33 | |
| | Hypothetical (h) | | | 0.85% | | | | $1,000.00 | | | | $1,020.58 | | | | $4.26 | |
| R1 | | Actual | | | 1.86% | | | | $1,000.00 | | | | $1,048.30 | | | | $9.45 | |
| | Hypothetical (h) | | | 1.86% | | | | $1,000.00 | | | | $1,015.57 | | | | $9.30 | |
| R2 | | Actual | | | 1.35% | | | | $1,000.00 | | | | $1,050.88 | | | | $6.86 | |
| | Hypothetical (h) | | | 1.35% | | | | $1,000.00 | | | | $1,018.10 | | | | $6.76 | |
| R3 | | Actual | | | 1.11% | | | | $1,000.00 | | | | $1,053.08 | | | | $5.65 | |
| | Hypothetical (h) | | | 1.11% | | | | $1,000.00 | | | | $1,019.29 | | | | $5.56 | |
| R4 | | Actual | | | 0.85% | | | | $1,000.00 | | | | $1,052.57 | | | | $4.33 | |
| | Hypothetical (h) | | | 0.85% | | | | $1,000.00 | | | | $1,020.58 | | | | $4.26 | |
| R5 | | Actual | | | 0.79% | | | | $1,000.00 | | | | $1,053.84 | | | | $4.02 | |
| | Hypothetical (h) | | | 0.79% | | | | $1,000.00 | | | | $1,020.88 | | | | $3.96 | |
| (h) | 5% class return per year before expenses. |
| (p) | Expenses paid are equal to each class’s annualized expense ratio, as shown above, multiplied by the average account value over the period, multiplied by the number of days in the period, divided by the number of days in the year. Expenses paid do not include any applicable sales charges (loads). If these transaction costs had been included, your costs would have been higher. |
10
PORTFOLIO OF INVESTMENTS
2/28/13
The Portfolio of Investments is a complete list of all securities owned by your fund. It is categorized by broad-based asset classes.
| | | | | | | | |
| Bonds - 52.2% | |
| Issuer | | Shares/Par | | | Value ($) | |
| Aerospace - 0.7% | |
| Bombardier, Inc., 4.25%, 2016 (n) | | $ | 935,000 | | | $ | 970,063 | |
| Bombardier, Inc., 7.5%, 2018 (n) | | | 1,355,000 | | | | 1,539,619 | |
| Bombardier, Inc., 7.75%, 2020 (n) | | | 845,000 | | | | 961,188 | |
| CPI International, Inc., 8%, 2018 | | | 1,090,000 | | | | 1,125,424 | |
| Embraer Empresa Brasileria de Aeronaves, 5.15%, 2022 | | | 2,211,000 | | | | 2,424,361 | |
| Heckler & Koch GmbH, 9.5%, 2018 (z) | | EUR | 445,000 | | | | 517,063 | |
| Huntington Ingalls Industries, Inc., 7.125%, 2021 | | $ | 1,585,000 | | | | 1,727,649 | |
| Kratos Defense & Security Solutions, Inc., 10%, 2017 | | | 1,315,000 | | | | 1,451,430 | |
| | | | | | | | |
| | | | $ | 10,716,797 | |
| Agency - Other - 0.2% | | | | | | | | |
| Financing Corp., 9.4%, 2018 | | $ | 965,000 | | | $ | 1,353,969 | |
| Financing Corp., 10.35%, 2018 | | | 715,000 | | | | 1,059,426 | |
| Financing Corp., STRIPS, 0%, 2017 | | | 860,000 | | | | 809,655 | |
| | | | | | | | |
| | | | $ | 3,223,050 | |
| Agricultural Products - 0.1% | | | | | | | | |
| Corporacion Azucarera del Peru S.A., 6.375%, 2022 (n) | | $ | 1,951,000 | | | $ | 2,102,203 | |
| | |
| Airlines - 0.0% | | | | | | | | |
| Emirates Airlines, 4.5%, 2025 (n) | | $ | 722,000 | | | $ | 727,886 | |
| | |
| Apparel Manufacturers - 0.2% | | | | | | | | |
| Hanesbrands, Inc., 6.375%, 2020 | | $ | 785,000 | | | $ | 849,760 | |
| Jones Group, Inc., 6.875%, 2019 | | | 930,000 | | | | 988,125 | |
| PVH Corp., 7.375%, 2020 | | | 860,000 | | | | 964,275 | |
| PVH Corp., 4.5%, 2022 | | | 540,000 | | | | 532,575 | |
| | | | | | | | |
| | | | $ | 3,334,735 | |
| Asset-Backed & Securitized - 0.2% | | | | | | | | |
| Citigroup Commercial Mortgage Trust, FRN, 5.698%, 2049 | | $ | 198,555 | | | $ | 32,363 | |
| Citigroup/Deutsche Bank Commercial Mortgage Trust, 5.322%, 2049 | | | 100,000 | | | | 113,374 | |
| Commercial Mortgage Pass-Through Certificates, “A4”, 5.306%, 2046 | | | 199,556 | | | | 225,527 | |
| CWCapital Cobalt Ltd., “A4”, FRN, 5.792%, 2046 | | | 1,000,000 | | | | 1,162,190 | |
| G-Force LLC, CDO, “A2”, 4.83%, 2036 (z) | | | 124,346 | | | | 125,278 | |
| JPMorgan Chase Commercial Mortgage Securities Corp., “A3”, FRN, 5.93%, 2051 | | | 105,201 | | | | 111,025 | |
11
Portfolio of Investments – continued
| | | | | | | | |
| Issuer | | Shares/Par | | | Value ($) | |
| Bonds - continued | |
| Asset-Backed & Securitized - continued | | | | | | | | |
| JPMorgan Chase Commercial Mortgage Securities Corp., “A4”, FRN, 5.82%, 2049 | | $ | 1,124,877 | | | $ | 1,292,444 | |
| | | | | | | | |
| | | | $ | 3,062,201 | |
| Automotive - 1.0% | | | | | | | | |
| Accuride Corp., 9.5%, 2018 | | $ | 1,350,000 | | | $ | 1,323,000 | |
| Allison Transmission, Inc., 7.125%, 2019 (n) | | | 1,830,000 | | | | 1,948,950 | |
| Automotores Gildemeister S.A., 8.25%, 2021 (n) | | | 1,225,000 | | | | 1,349,031 | |
| Automotores Gildemeister S.A., 6.75%, 2023 (n) | | | 163,000 | | | | 167,890 | |
| Continental Rubber of America Corp., 4.5%, 2019 (n) | | | 185,000 | | | | 188,700 | |
| Delphi Corp., 5%, 2023 | | | 815,000 | | | | 848,617 | |
| Ford Motor Credit Co. LLC, 12%, 2015 | | | 1,030,000 | | | | 1,250,163 | |
| Ford Motor Credit Co. LLC, 8.125%, 2020 | | | 780,000 | | | | 982,656 | |
| General Motors Financial Co., Inc., 4.75%, 2017 (n) | | | 865,000 | | | | 904,323 | |
| General Motors Financial Co., Inc., 6.75%, 2018 | | | 610,000 | | | | 701,500 | |
| Goodyear Tire & Rubber Co., 8.25%, 2020 | | | 165,000 | | | | 178,613 | |
| Goodyear Tire & Rubber Co., 6.5%, 2021 | | | 1,090,000 | | | | 1,106,350 | |
| Goodyear Tire & Rubber Co., 7%, 2022 | | | 250,000 | | | | 260,625 | |
| Hyundai Capital America, 4%, 2017 (n) | | | 213,000 | | | | 229,991 | |
| Jaguar Land Rover PLC, 7.75%, 2018 (n) | | | 685,000 | | | | 749,219 | |
| Jaguar Land Rover PLC, 8.125%, 2021 (n) | | | 1,915,000 | | | | 2,130,438 | |
| Jaguar Land Rover PLC, 5.625%, 2023 (n) | | | 315,000 | | | | 322,088 | |
| Lear Corp., 8.125%, 2020 | | | 651,000 | | | | 725,865 | |
| Lear Corp., 4.75%, 2023 (n) | | | 230,000 | | | | 224,250 | |
| | | | | | | | |
| | | | $ | 15,592,269 | |
| Broadcasting - 1.3% | | | | | | | | |
| Allbritton Communications Co., 8%, 2018 | | $ | 320,000 | | | $ | 347,600 | |
| AMC Networks, Inc., 7.75%, 2021 | | | 949,000 | | | | 1,077,114 | |
| Clear Channel Communications, Inc., 9%, 2021 | | | 881,000 | | | | 797,304 | |
| Clear Channel Worldwide Holdings, Inc., 6.5%, 2022 (n) | | | 200,000 | | | | 209,000 | |
| Clear Channel Worldwide Holdings, Inc., 6.5%, 2022 (n) | | | 555,000 | | | | 584,138 | |
| Clear Channel Worldwide Holdings, Inc., “A”, 7.625%, 2020 | | | 30,000 | | | | 30,750 | |
| Clear Channel Worldwide Holdings, Inc., “B”, 7.625%, 2020 | | | 965,000 | | | | 998,775 | |
| Globo Comunicacoes e Participacoes S.A., 6.25% to 2015, 9.375% to 2049 (n) | | | 1,499,000 | | | | 1,600,183 | |
| Hughes Network Systems LLC, 7.625%, 2021 | | | 460,000 | | | | 524,400 | |
| IAC/InterActiveCorp, 4.75%, 2022 (n) | | | 260,000 | | | | 254,150 | |
| Inmarsat Finance PLC, 7.375%, 2017 (n) | | | 460,000 | | | | 492,200 | |
| Intelsat Bermuda Ltd., 11.25%, 2017 | | | 975,000 | | | | 1,035,936 | |
| Intelsat Bermuda Ltd., 11.5%, 2017 (p) | | | 2,650,000 | | | | 2,818,938 | |
| Intelsat Jackson Holdings Ltd., 6.625%, 2022 (n) | | | 610,000 | | | | 614,575 | |
| LBI Media, Inc., 13.5% to 2015, 11.5% to 2020 (p)(z) | | | 79,000 | | | | 32,785 | |
12
Portfolio of Investments – continued
| | | | | | | | |
| Issuer | | Shares/Par | | | Value ($) | |
| Bonds - continued | |
| Broadcasting - continued | | | | | | | | |
| Liberty Media Corp., 8.5%, 2029 | | $ | 605,000 | | | $ | 671,550 | |
| Liberty Media Corp., 8.25%, 2030 | | | 630,000 | | | | 697,725 | |
| Local TV Finance LLC, 9.25%, 2015 (p)(z) | | | 803,826 | | | | 809,855 | |
| Netflix, Inc., 5.375%, 2021 (n) | | | 995,000 | | | | 992,513 | |
| Nexstar Broadcasting Group, Inc., 8.875%, 2017 | | | 185,000 | | | | 203,500 | |
| Nexstar Broadcasting Group, Inc., 6.875%, 2020 (n) | | | 145,000 | | | | 151,525 | |
| Sinclair Broadcast Group, Inc., 9.25%, 2017 (n) | | | 395,000 | | | | 428,575 | |
| Sinclair Broadcast Group, Inc., 8.375%, 2018 | | | 30,000 | | | | 33,450 | |
| SIRIUS XM Radio, Inc., 8.75%, 2015 (n) | | | 405,000 | | | | 452,588 | |
| SIRIUS XM Radio, Inc., 7.625%, 2018 (n) | | | 1,110,000 | | | | 1,223,775 | |
| SIRIUS XM Radio, Inc., 5.25%, 2022 (n) | | | 425,000 | | | | 433,500 | |
| Univision Communications, Inc., 6.875%, 2019 (n) | | | 1,220,000 | | | | 1,311,499 | |
| Univision Communications, Inc., 7.875%, 2020 (n) | | | 690,000 | | | | 763,312 | |
| Univision Communications, Inc., 8.5%, 2021 (n) | | | 840,000 | | | | 916,649 | |
| | | | | | | | |
| | | | $ | 20,507,864 | |
| Brokerage & Asset Managers - 0.1% | | | | | | | | |
| E*TRADE Financial Corp., 6.375%, 2019 | | $ | 1,760,000 | | | $ | 1,834,800 | |
| | |
| Building - 0.9% | | | | | | | | |
| Boise Cascade LLC/Finance Corp., 6.375%, 2020 (n) | | $ | 605,000 | | | $ | 639,788 | |
| Building Materials Holding Corp., 6.875%, 2018 (n) | | | 420,000 | | | | 449,400 | |
| Building Materials Holding Corp., 7%, 2020 (n) | | | 460,000 | | | | 497,950 | |
| Building Materials Holding Corp., 6.75%, 2021 (n) | | | 645,000 | | | | 692,569 | |
| CEMEX Finance LLC, 9.5%, 2016 (n) | | | 435,000 | | | | 471,975 | |
| CEMEX S.A.B. de C.V., 9%, 2018 (n) | | | 1,064,000 | | | | 1,179,710 | |
| CEMEX S.A.B. de C.V., FRN, 5.311%, 2015 (n) | | | 1,155,000 | | | | 1,186,763 | |
| Gibraltar Industries, Inc., 6.25%, 2021 (n) | | | 130,000 | | | | 137,313 | |
| HD Supply, Inc., 8.125%, 2019 (n) | | | 615,000 | | | | 692,644 | |
| HD Supply, Inc., 11.5%, 2020 (n) | | | 305,000 | | | | 351,513 | |
| HD Supply, Inc., 10.5%, 2021 (n) | | | 60,000 | | | | 61,950 | |
| Masonite International Corp., 8.25%, 2021 (n) | | | 700,000 | | | | 778,750 | |
| Nortek, Inc., 8.5%, 2021 | | | 1,045,000 | | | | 1,152,111 | |
| Odebrecht Finance Ltd., 5.125%, 2022 (n) | | | 223,000 | | | | 237,495 | |
| Odebrecht Finance Ltd., 6%, 2023 (n) | | | 1,645,000 | | | | 1,867,075 | |
| Odebrecht Finance Ltd., 7.125%, 2042 (n) | | | 1,706,000 | | | | 1,966,165 | |
Roofing Supply Group LLC/Roofing Supply Finance, Inc.,
10%, 2020 (n) | | | 315,000 | | | | 355,950 | |
| USG Corp., 6.3%, 2016 | | | 1,175,000 | | | | 1,236,688 | |
| USG Corp., 7.875%, 2020 (n) | | | 310,000 | | | | 354,949 | |
| | | | | | | | |
| | | | | | | $ | 14,310,758 | |
13
Portfolio of Investments – continued
| | | | | | | | |
| Issuer | | Shares/Par | | | Value ($) | |
| Bonds - continued | |
| Business Services - 0.6% | | | | | | | | |
| Ceridian Corp., 12.25%, 2015 (p) | | $ | 320,000 | | | $ | 327,200 | |
| Ceridian Corp., 8.875%, 2019 (n) | | | 160,000 | | | | 180,400 | |
| Cielo S.A., 3.75%, 2022 (n) | | | 2,056,000 | | | | 1,956,284 | |
| Equinix, Inc., 4.875%, 2020 | | | 135,000 | | | | 135,000 | |
| Fidelity National Information Services, Inc., 7.625%, 2017 | | | 265,000 | | | | 285,204 | |
| Fidelity National Information Services, Inc., 5%, 2022 | | | 1,015,000 | | | | 1,075,900 | |
| iGate Corp., 9%, 2016 | | | 1,205,000 | | | | 1,311,942 | |
| Iron Mountain, Inc., 8.375%, 2021 | | | 1,050,000 | | | | 1,152,373 | |
| Legend Acquisition Sub, Inc., 10.75%, 2020 (n) | | | 550,000 | | | | 473,000 | |
| Lender Processing Services, Inc., 5.75%, 2023 | | | 920,000 | | | | 963,700 | |
| Neustar, Inc., 4.5%, 2023 (n) | | | 355,000 | | | | 340,800 | |
| SunGard Data Systems, Inc., 7.375%, 2018 | | | 190,000 | | | | 204,011 | |
| Tencent Holdings Ltd., 3.375%, 2018 (n) | | | 1,326,000 | | | | 1,370,616 | |
| | | | | | | | |
| | | | | | | $ | 9,776,430 | |
| Cable TV - 0.9% | | | | | | | | |
| Bresnan Broadband Holdings LLC, 8%, 2018 (n) | | $ | 55,000 | | | $ | 60,225 | |
| CCO Holdings LLC, 7.875%, 2018 | | | 1,855,000 | | | | 1,980,211 | |
| CCO Holdings LLC, 8.125%, 2020 | | | 1,415,000 | | | | 1,575,956 | |
| CCO Holdings LLC, 7.375%, 2020 | | | 280,000 | | | | 309,750 | |
| CCO Holdings LLC, 5.125%, 2023 | | | 300,000 | | | | 292,500 | |
| Cequel Communications Holdings, 6.375%, 2020 (n) | | | 585,000 | | | | 604,744 | |
| DISH DBS Corp., 6.75%, 2021 | | | 525,000 | | | | 584,063 | |
| DISH DBS Corp., 5%, 2023 (n) | | | 355,000 | | | | 352,338 | |
| EchoStar Corp., 7.125%, 2016 | | | 1,430,000 | | | | 1,590,875 | |
| Lynx I Corp., 5.375%, 2021 (z) | | | 430,000 | | | | 440,750 | |
| Lynx II Corp., 6.375%, 2023 (z) | | | 285,000 | | | | 295,331 | |
| Telenet Finance Luxembourg, 6.375%, 2020 (n) | | EUR | 600,000 | | | | 814,662 | |
| UPC Holding B.V., 9.875%, 2018 (n) | | $ | 1,580,000 | | | | 1,769,599 | |
| UPCB Finance III Ltd., 6.625%, 2020 (n) | | | 1,270,000 | | | | 1,362,074 | |
| Virgin Media Finance PLC, 8.375%, 2019 | | | 67,000 | | | | 74,705 | |
| Virgin Media Finance PLC, 4.875%, 2022 | | | 200,000 | | | | 202,250 | |
| Virgin Media Finance PLC, 5.25%, 2022 | | | 600,000 | | | | 607,500 | |
| Ziggo Bond Co. B.V., 8%, 2018 (n) | | EUR | 440,000 | | | | 620,396 | |
| | | | | | | | |
| | | | | | | $ | 13,537,929 | |
| Chemicals - 0.6% | | | | | | | | |
| Celanese U.S. Holdings LLC, 6.625%, 2018 | | $ | 820,000 | | | $ | 885,600 | |
Flash Dutch 2 B.V./U.S. Coatings Acquisition,
7.375%, 2021 (n) | | | 155,000 | | | | 160,425 | |
| Hexion U.S. Finance Corp./Hexion Nova Scotia Finance, 8.875%, 2018 | | | 1,210,000 | | | | 1,216,050 | |
14
Portfolio of Investments – continued
| | | | | | | | |
| Issuer | | Shares/Par | | | Value ($) | |
| Bonds - continued | |
| Chemicals - continued | | | | | | | | |
Hexion U.S. Finance Corp./Hexion Nova Scotia Finance,
9%, 2020 | | $ | 545,000 | | | $ | 493,225 | |
| Huntsman International LLC, 8.625%, 2021 | | | 1,080,000 | | | | 1,220,400 | |
| INEOS Finance PLC, 8.375%, 2019 (n) | | | 1,055,000 | | | | 1,155,225 | |
| INEOS Group Holdings PLC, 8.5%, 2016 (n) | | | 515,000 | | | | 523,369 | |
| LyondellBasell Industries N.V., 5%, 2019 | | | 790,000 | | | | 880,850 | |
| LyondellBasell Industries N.V., 6%, 2021 | | | 575,000 | | | | 675,625 | |
| Polypore International, Inc., 7.5%, 2017 | | | 355,000 | | | | 381,625 | |
| Sociedad Quimica y Minera de Chile S.A., 5.5%, 2020 (n) | | | 859,000 | | | | 979,412 | |
| | | | | | | | |
| | | | | | | $ | 8,571,806 | |
| Computer Software - 0.2% | | | | | | | | |
| Infor U.S., Inc., 11.5%, 2018 | | $ | 655,000 | | | $ | 766,350 | |
| Nuance Communications, Inc., 5.375%, 2020 (n) | | | 780,000 | | | | 789,750 | |
| Syniverse Holdings, Inc., 9.125%, 2019 | | | 1,300,000 | | | | 1,417,000 | |
| TransUnion Holding Co., Inc., 9.625%, 2018 | | | 250,000 | | | | 266,563 | |
| TransUnion LLC/TransUnion Financing Corp., 11.375%, 2018 | | | 515,000 | | | | 593,538 | |
| | | | | | | | |
| | | | | | | $ | 3,833,201 | |
| Computer Software - Systems - 0.2% | | | | | | | | |
| Audatex North America, Inc., 6.75%, 2018 (n) | | $ | 1,015,000 | | | $ | 1,083,513 | |
| CDW LLC/CDW Finance Corp., 12.535%, 2017 | | | 419,000 | | | | 449,901 | |
| CDW LLC/CDW Finance Corp., 8.5%, 2019 | | | 965,000 | | | | 1,063,913 | |
| | | | | | | | |
| | | | | | | $ | 2,597,327 | |
| Conglomerates - 0.2% | | | | | | | | |
| Amsted Industries, Inc., 8.125%, 2018 (n) | | $ | 1,090,000 | | | $ | 1,171,750 | |
| BC Mountain LLC, 7%, 2021 (n) | | | 300,000 | | | | 309,000 | |
| Dynacast International LLC, 9.25%, 2019 | | | 375,000 | | | | 403,125 | |
| Griffon Corp., 7.125%, 2018 | | | 1,055,000 | | | | 1,142,038 | |
| Grupo KUO S.A.B de C.V., 6.25%, 2022 (n) | | | 232,000 | | | | 247,660 | |
| Silver II Borrower, 7.75%, 2020 (n) | | | 375,000 | | | | 390,000 | |
| | | | | | | | |
| | | | | | | $ | 3,663,573 | |
| Construction - 0.1% | | | | | | | | |
| Country Garden Holdings Co. Ltd., 7.5%, 2023 (z) | | $ | 223,000 | | | $ | 231,363 | |
| Empresas ICA, S.A.B. de C.V., 8.375%, 2017 (n) | | | 1,409,000 | | | | 1,497,063 | |
| | | | | | | | |
| | | | | | | $ | 1,728,426 | |
| Consumer Products - 0.2% | | | | | | | | |
| Easton-Bell Sports, Inc., 9.75%, 2016 | | $ | 245,000 | | | $ | 264,296 | |
| Elizabeth Arden, Inc., 7.375%, 2021 | | | 805,000 | | | | 893,550 | |
| Jarden Corp., 7.5%, 2020 | | | 870,000 | | | | 950,475 | |
| Libbey Glass, Inc., 6.875%, 2020 | | | 215,000 | | | | 230,588 | |
15
Portfolio of Investments – continued
| | | | | | | | |
| Issuer | | Shares/Par | | | Value ($) | |
| Bonds - continued | |
| Consumer Products - continued | | | | | | | | |
| Prestige Brands, Inc., 8.125%, 2020 | | $ | 50,000 | | | $ | 56,250 | |
| Spectrum Brands Escrow Corp., 6.375%, 2020 (n) | | | 755,000 | | | | 803,131 | |
| Spectrum Brands Escrow Corp., 6.625%, 2022 (n) | | | 60,000 | | | | 64,650 | |
| | | | | | | | |
| | | | | | | $ | 3,262,940 | |
| Consumer Services - 0.2% | | | | | | | | |
| QVC, Inc., 7.375%, 2020 (n) | | $ | 680,000 | | | $ | 753,739 | |
| Service Corp. International, 6.75%, 2015 | | | 60,000 | | | | 65,250 | |
| Service Corp. International, 7%, 2017 | | | 1,125,000 | | | | 1,272,656 | |
| Service Corp. International, 7%, 2019 | | | 325,000 | | | | 352,625 | |
| | | | | | | | |
| | | | | | | $ | 2,444,270 | |
| Containers - 0.6% | | | | | | | | |
| Ardagh Packaging Finance PLC , 7%, 2020 (n) | | $ | 200,000 | | | $ | 200,500 | |
| Ardagh Packaging Finance PLC, 7.375%, 2017 (n) | | | 530,000 | | | | 577,038 | |
| Ardagh Packaging Finance PLC, 9.125%, 2020 (n) | | | 1,170,000 | | | | 1,275,300 | |
| Ardagh Packaging Finance PLC, 9.125%, 2020 (n) | | | 400,000 | | | | 438,000 | |
| Ball Corp., 5%, 2022 | | | 307,000 | | | | 320,048 | |
| Berry Plastics Group, Inc., 9.5%, 2018 | | | 290,000 | | | | 322,625 | |
| Crown Americas LLC, 4.5%, 2023 (n) | | | 515,000 | | | | 503,413 | |
| Greif, Inc., 6.75%, 2017 | | | 775,000 | | | | 864,125 | |
| Greif, Inc., 7.75%, 2019 | | | 680,000 | | | | 792,200 | |
| Reynolds Group, 7.125%, 2019 | | | 845,000 | | | | 907,319 | |
| Reynolds Group, 9.875%, 2019 | | | 695,000 | | | | 761,025 | |
| Reynolds Group, 5.75%, 2020 | | | 900,000 | | | | 929,250 | |
| Reynolds Group, 8.25%, 2021 | | | 1,020,000 | | | | 1,053,150 | |
| | | | | | | | |
| | | | | | | $ | 8,943,993 | |
| Defense Electronics - 0.1% | | | | | | | | |
| Ducommun, Inc., 9.75%, 2018 | | $ | 705,000 | | | $ | 771,975 | |
| MOOG, Inc., 7.25%, 2018 | | | 585,000 | | | | 614,250 | |
| | | | | | | | |
| | | | | | | $ | 1,386,225 | |
| Electrical Equipment - 0.0% | | | | | | | | |
| Avaya, Inc., 9.75%, 2015 | | $ | 335,000 | | | $ | 329,556 | |
| Avaya, Inc., 7%, 2019 (n) | | | 170,000 | | | | 162,350 | |
| | | | | | | | |
| | | | | | | $ | 491,906 | |
| Electronics - 0.2% | | | | | | | | |
| Freescale Semiconductor, Inc., 9.25%, 2018 (n) | | $ | 1,055,000 | | | $ | 1,160,500 | |
| Nokia Corp., 5.375%, 2019 | | | 220,000 | | | | 212,300 | |
| Nokia Corp., 6.625%, 2039 | | | 190,000 | | | | 176,225 | |
| NXP B.V., 5.75%, 2021 (z) | | | 225,000 | | | | 230,063 | |
16
Portfolio of Investments – continued
| | | | | | | | |
| Issuer | | Shares/Par | | | Value ($) | |
| Bonds - continued | |
| Electronics - continued | | | | | | | | |
| Sensata Technologies B.V., 6.5%, 2019 (n) | | $ | 1,035,000 | | | $ | 1,110,038 | |
| | | | | | | | |
| | | | | | | $ | 2,889,126 | |
| Emerging Market Quasi-Sovereign - 4.8% | | | | | | | | |
| Abu Dhabi National Energy Co. PJSC (TAQA), 5.875%, 2021 (n) | | $ | 955,000 | | | $ | 1,131,675 | |
| Banco do Brasil S.A., 3.875%, 2017 | | | 1,472,000 | | | | 1,550,016 | |
| Banco do Brasil S.A., 5.875%, 2023 (n) | | | 528,000 | | | | 572,880 | |
| Banco do Brasil S.A., FRN, 6.25%, 2049 (n) | | | 3,705,000 | | | | 3,695,738 | |
| Banco do Estado Rio Grande do Sul S.A., 7.375%, 2022 (n) | | | 1,685,000 | | | | 1,840,863 | |
| Banco do Nordeste do Brasil (BNB), 3.625%, 2015 (n) | | | 1,236,000 | | | | 1,273,080 | |
| Banco do Nordeste do Brasil (BNB), 4.375%, 2019 (n) | | | 2,097,000 | | | | 2,159,910 | |
| Biz Finance PLC, 8.375%, 2015 | | | 1,153,000 | | | | 1,168,854 | |
| CNOOC Finance (2012) Ltd., 3.875%, 2022 (n) | | | 1,123,000 | | | | 1,177,448 | |
| CNPC (HK) Overseas Capital Ltd., 4.5%, 2021 (n) | | | 540,000 | | | | 595,348 | |
| Comision Federal de Electricidad, 5.75%, 2042 (n) | | | 1,575,000 | | | | 1,708,875 | |
| Corporacion Financiera de Desarrollo S.A., 4.75%, 2022 (n) | | | 2,106,000 | | | | 2,258,685 | |
| Corporacion Nacional del Cobre de Chile, 3.75%, 2020 (n) | | | 349,000 | | | | 366,597 | |
| Corporacion Nacional del Cobre de Chile, 4.25%, 2042 (n) | | | 1,234,000 | | | | 1,172,754 | |
| Development Bank of Kazakhstan, 4.125%, 2022 (n) | | | 1,435,000 | | | | 1,411,610 | |
| Dolphin Energy Ltd., 5.5%, 2021 (n) | | | 2,363,000 | | | | 2,723,358 | |
| Ecopetrol S.A., 7.625%, 2019 | | | 1,852,000 | | | | 2,338,150 | |
| El Fondo Mivivienda S.A., 3.5%, 2023 (z) | | | 216,000 | | | | 210,600 | |
| Empresa Nacional del Petroleo, 4.75%, 2021 (n) | | | 1,290,000 | | | | 1,347,401 | |
| Gaz Capital S.A., 9.25%, 2019 | | | 1,434,000 | | | | 1,857,030 | |
| Gaz Capital S.A., 3.85%, 2020 (n) | | | 996,000 | | | | 1,003,769 | |
| Gaz Capital S.A., 5.999%, 2021 (n) | | | 2,212,000 | | | | 2,494,030 | |
| Gaz Capital S.A., 4.95%, 2022 (n) | | | 627,000 | | | | 660,733 | |
| Gaz Capital S.A., 4.95%, 2028 (n) | | | 2,246,000 | | | | 2,242,631 | |
| Gazprom Neft, 4.375%, 2022 (n) | | | 1,107,000 | | | | 1,104,233 | |
| Georgian Oil & Gas Corp., 6.875%, 2017 (n) | | | 272,000 | | | | 283,220 | |
| JSC Georgian Railway, 7.75%, 2022 (n) | | | 1,203,000 | | | | 1,413,525 | |
| Kazakhstan Temir Zholy Co., 6.95%, 2042 (n) | | | 2,711,000 | | | | 3,257,267 | |
| Magyar Export-Import Bank, 5.5%, 2018 (n) | | | 1,329,000 | | | | 1,347,775 | |
| Naftogaz Ukraine, 9.5%, 2014 | | | 753,000 | | | | 779,355 | |
| OJSC Russian Agricultural Bank, 5.298%, 2017 (n) | | | 494,000 | | | | 524,258 | |
| Pemex Project Funding Master Trust, 6.625%, 2035 | | | 1,446,000 | | | | 1,735,200 | |
| Pertamina PT, 4.875%, 2022 (n) | | | 2,381,000 | | | | 2,523,860 | |
| Pertamina PT, 6%, 2042 (n) | | | 486,000 | | | | 509,085 | |
| Petrobras International Finance Co., 7.875%, 2019 | | | 566,000 | | | | 692,894 | |
| Petrobras International Finance Co., 5.375%, 2021 | | | 2,500,000 | | | | 2,729,220 | |
| Petroleos Mexicanos, 5.5%, 2021 | | | 2,395,000 | | | | 2,737,485 | |
| Petroleos Mexicanos, 3.5%, 2023 (n) | | | 573,000 | | | | 561,540 | |
| Petroleos Mexicanos, 5.5%, 2044 | | | 467,000 | | | | 479,843 | |
17
Portfolio of Investments – continued
| | | | | | | | |
| Issuer | | Shares/Par | | | Value ($) | |
| Bonds - continued | |
| Emerging Market Quasi-Sovereign - continued | |
| Petroleos Mexicanos, 5.5%, 2044 (n) | | $ | 299,000 | | | $ | 307,223 | |
| Petroleum Co. of Trinidad & Tobago Ltd., 6%, 2022 | | | 885,875 | | | | 976,677 | |
| PT Perusahaan Listrik Negara, 5.5%, 2021 (n) | | | 642,000 | | | | 706,200 | |
| PT Perusahaan Listrik Negara, 5.25%, 2042 (n) | | | 250,000 | | | | 243,750 | |
| PTT PLC, 4.5%, 2042 (n) | | | 381,000 | | | | 362,542 | |
| Rosneft, 3.149%, 2017 (n) | | | 472,000 | | | | 476,130 | |
| Rosneft, 4.199%, 2022 (n) | | | 1,997,000 | | | | 1,992,008 | |
| Sberbank of Russia, 6.125%, 2022 (n) | | | 3,590,000 | | | | 4,052,392 | |
Sinopec Group Overseas Development (2012) Ltd.,
3.9%, 2022 (n) | | | 1,445,000 | | | | 1,532,346 | |
| Turkiye Halk Bankasi A.S., 4.875%, 2017 (n) | | | 975,000 | | | | 1,036,424 | |
| Turkiye Halk Bankasi A.S., 3.875%, 2020 (n) | | | 383,000 | | | | 381,084 | |
| Turkiye Ihracat Kredi Bankasi A.S., 5.875%, 2019 (n) | | | 2,725,000 | | | | 3,041,780 | |
| Turkiye Vakiflar Bankasi, 6%, 2022 (n) | | | 627,000 | | | | 653,797 | |
| Vnesheconombank, 6.025%, 2022 (n) | | | 294,000 | | | | 331,852 | |
| | | | | | | | |
| | | | | | | $ | 73,735,000 | |
| Emerging Market Sovereign - 4.1% | | | | | | | | |
| Dominican Republic, 7.5%, 2021 (n) | | $ | 1,270,000 | | | $ | 1,423,670 | |
| Dominican Republic, 8.625%, 2027 | | | 833,000 | | | | 1,032,920 | |
| Government of Ukraine, 9.25%, 2017 (n) | | | 375,000 | | | | 414,375 | |
| Republic of Argentina, 7%, 2015 | | | 2,952,000 | | | | 2,525,846 | |
| Republic of Argentina, 8.75%, 2017 | | | 1,397,000 | | | | 988,378 | |
| Republic of Argentina, 8.28%, 2033 | | | 1,980,138 | | | | 1,064,324 | |
| Republic of Colombia, 6.125%, 2041 | | | 562,000 | | | | 717,955 | |
| Republic of Guatemala, 5.75%, 2022 (n) | | | 1,764,000 | | | | 1,955,394 | |
| Republic of Guatemala, 4.875%, 2028 (z) | | | 2,255,000 | | | | 2,215,538 | |
| Republic of Hungary, 5.375%, 2023 | | | 1,100,000 | | | | 1,083,789 | |
| Republic of Indonesia, 6.875%, 2018 | | | 1,100,000 | | | | 1,307,625 | |
| Republic of Indonesia, 4.875%, 2021 (n) | | | 2,623,000 | | | | 2,911,530 | |
| Republic of Latvia, 5.25%, 2017 (n) | | | 1,133,000 | | | | 1,254,798 | |
| Republic of Lithuania, 6.625%, 2022 (n) | | | 1,794,000 | | | | 2,215,590 | |
| Republic of Mongolia, 5.125%, 2022 (n) | | | 268,000 | | | | 253,260 | |
| Republic of Paraguay, 4.625%, 2023 (n) | | | 277,000 | | | | 275,615 | |
| Republic of Peru, 7.35%, 2025 | | | 787,000 | | | | 1,109,670 | |
| Republic of Philippines, 5.5%, 2026 | | | 1,293,000 | | | | 1,587,158 | |
| Republic of Philippines, 7.75%, 2031 | | | 389,000 | | | | 569,399 | |
| Republic of Philippines, 6.375%, 2034 | | | 1,396,000 | | | | 1,847,955 | |
| Republic of Romania, 6.75%, 2022 (n) | | | 1,362,000 | | | | 1,614,242 | |
| Republic of Romania, 4.375%, 2023 (z) | | | 796,000 | | | | 788,040 | |
| Republic of Serbia, 4.875%, 2020 (z) | | | 587,000 | | | | 575,508 | |
| Republic of Serbia, 7.25%, 2021 (n) | | | 281,000 | | | | 312,894 | |
| Republic of Slovakia, 4.375%, 2022 (n) | | | 4,190,000 | | | | 4,441,400 | |
18
Portfolio of Investments – continued
| | | | | | | | |
| Issuer | | Shares/Par | | | Value ($) | |
| Bonds - continued | |
| Emerging Market Sovereign - continued | |
| Republic of Sri Lanka, 5.875%, 2022 (n) | | $ | 214,000 | | | $ | 222,025 | |
| Republic of Turkey, 5.625%, 2021 | | | 1,594,000 | | | | 1,847,765 | |
| Republic of Turkey, 6.25%, 2022 | | | 2,021,000 | | | | 2,450,463 | |
| Republic of Turkey, 3.25%, 2023 | | | 2,211,000 | | | | 2,139,143 | |
| Republic of Turkey, 6%, 2041 | | | 350,000 | | | | 406,875 | |
| Republic of Uruguay, 7.625%, 2036 | | | 974,000 | | | | 1,418,388 | |
| Republic of Venezuela, 7.75%, 2019 | | | 2,212,000 | | | | 2,134,580 | |
| Republic of Venezuela, 12.75%, 2022 | | | 2,753,000 | | | | 3,317,365 | |
| Republic of Venezuela, 9.25%, 2027 | | | 1,659,000 | | | | 1,701,305 | |
| Republic of Venezuela, 7%, 2038 | | | 2,450,000 | | | | 2,037,175 | |
| Republic of Vietnam, 6.875%, 2016 | | | 497,000 | | | | 544,712 | |
| Russian Federation, 4.5%, 2022 (n) | | | 1,800,000 | | | | 1,991,700 | |
| Russian Federation, 7.5%, 2030 | | | 1,264,025 | | | | 1,573,850 | |
| Russian Federation, 5.625%, 2042 (n) | | | 1,200,000 | | | | 1,395,000 | |
| United Mexican States, 5.125%, 2020 | | | 1,672,000 | | | | 1,966,272 | |
| United Mexican States, 3.625%, 2022 | | | 3,416,000 | | | | 3,641,456 | |
| | | | | | | | |
| | | | | | | $ | 63,274,947 | |
| Energy - Independent - 1.9% | |
| Berry Petroleum Corp., 6.75%, 2020 | | $ | 210,000 | | | $ | 223,650 | |
| BreitBurn Energy Partners LP, 8.625%, 2020 | | | 230,000 | | | | 253,000 | |
| BreitBurn Energy Partners LP, 7.875%, 2022 | | | 880,000 | | | | 935,000 | |
| Carrizo Oil & Gas, Inc., 8.625%, 2018 | | | 305,000 | | | | 330,925 | |
| Chaparral Energy, Inc., 7.625%, 2022 | | | 750,000 | | | | 813,750 | |
| Chesapeake Energy Corp., 6.875%, 2020 | | | 1,075,000 | | | | 1,182,500 | |
| Concho Resources, Inc., 8.625%, 2017 | | | 670,000 | | | | 720,250 | |
| Concho Resources, Inc., 6.5%, 2022 | | | 930,000 | | | | 1,013,700 | |
| Continental Resources, Inc., 8.25%, 2019 | | | 1,005,000 | | | | 1,123,088 | |
| Continental Resources, Inc., 7.375%, 2020 | | | 340,000 | | | | 383,350 | |
| Denbury Resources, Inc., 8.25%, 2020 | | | 1,330,000 | | | | 1,492,925 | |
| Denbury Resources, Inc., 4.625%, 2023 | | | 325,000 | | | | 318,906 | |
| Energy XXI Gulf Coast, Inc., 9.25%, 2017 | | | 1,235,000 | | | | 1,395,550 | |
| EP Energy LLC, 9.375%, 2020 | | | 2,690,000 | | | | 3,066,600 | |
| EPL Oil & Gas, Inc., 8.25%, 2018 (n) | | | 470,000 | | | | 489,975 | |
| EXCO Resources, Inc., 7.5%, 2018 | | | 315,000 | | | | 299,250 | |
| Harvest Operations Corp., 6.875%, 2017 | | | 920,000 | | | | 1,021,200 | |
| Hilcorp Energy I/Hilcorp Finance Co., 8%, 2020 (n) | | | 470,000 | | | | 515,825 | |
| Laredo Petroleum, Inc., 9.5%, 2019 | | | 880,000 | | | | 994,400 | |
| LINN Energy LLC, 6.5%, 2019 | | | 145,000 | | | | 150,075 | |
| LINN Energy LLC, 8.625%, 2020 | | | 605,000 | | | | 669,281 | |
| LINN Energy LLC, 7.75%, 2021 | | | 1,285,000 | | | | 1,387,800 | |
| MEG Energy Corp., 6.5%, 2021 (n) | | | 725,000 | | | | 764,875 | |
| Newfield Exploration Co., 6.875%, 2020 | | | 480,000 | | | | 514,800 | |
19
Portfolio of Investments – continued
| | | | | | | | |
| Issuer | | Shares/Par | | | Value ($) | |
| Bonds - continued | |
| Energy - Independent - continued | |
| Plains Exploration & Production Co., 6.125%, 2019 | | $ | 1,195,000 | | | $ | 1,320,475 | |
| Plains Exploration & Production Co., 8.625%, 2019 | | | 1,100,000 | | | | 1,256,750 | |
| Plains Exploration & Production Co., 6.5%, 2020 | | | 285,000 | | | | 318,488 | |
| Plains Exploration & Production Co., 6.75%, 2022 | | | 540,000 | | | | 612,900 | |
| QEP Resources, Inc., 6.875%, 2021 | | | 1,490,000 | | | | 1,709,775 | |
| Range Resources Corp., 8%, 2019 | | | 420,000 | | | | 462,000 | |
| Range Resources Corp., 5%, 2022 | | | 725,000 | | | | 741,313 | |
| Samson Investment Co., 9.75%, 2020 (n) | | | 630,000 | | | | 670,163 | |
| SandRidge Energy, Inc., 8%, 2018 (n) | | | 735,000 | | | | 776,013 | |
| SandRidge Energy, Inc., 8.125%, 2022 | | | 345,000 | | | | 371,306 | |
| SM Energy Co., 6.5%, 2021 | | | 830,000 | | | | 902,625 | |
| Whiting Petroleum Corp., 6.5%, 2018 | | | 440,000 | | | | 473,000 | |
| | | | | | | | |
| | | | | | | $ | 29,675,483 | |
| Energy - Integrated - 0.2% | | | | | | | | |
| Pacific Rubiales Energy Corp., 7.25%, 2021 (n) | | $ | 2,137,000 | | | $ | 2,446,865 | |
| | |
| Engineering - Construction - 0.0% | | | | | | | | |
| BakerCorp International, Inc., 8.25%, 2019 | | $ | 730,000 | | | $ | 740,950 | |
| | |
| Entertainment - 0.3% | | | | | | | | |
| AMC Entertainment, Inc., 8.75%, 2019 | | $ | 405,000 | | | $ | 443,981 | |
| AMC Entertainment, Inc., 9.75%, 2020 | | | 242,000 | | | | 278,905 | |
| Cedar Fair LP, 9.125%, 2018 | | | 370,000 | | | | 414,400 | |
| Cedar Fair LP, 5.25%, 2021 (z) | | | 210,000 | | | | 210,000 | |
| Cinemark USA, Inc., 8.625%, 2019 | | | 955,000 | | | | 1,058,856 | |
| Cinemark USA, Inc., 5.125%, 2022 (n) | | | 160,000 | | | | 160,800 | |
| NAI Entertainment Holdings LLC, 8.25%, 2017 (n) | | | 310,000 | | | | 337,900 | |
| Six Flags Entertainment Corp., 5.25%, 2021 (n) | | | 1,260,000 | | | | 1,234,800 | |
| | | | | | | | |
| | | | | | | $ | 4,139,642 | |
| Financial Institutions - 1.1% | | | | | | | | |
| Aviation Capital Group, 4.625%, 2018 (n) | | $ | 535,000 | | | $ | 543,328 | |
| CIT Group, Inc., 5.25%, 2014 (n) | | | 1,340,000 | | | | 1,391,925 | |
| CIT Group, Inc., 5.25%, 2018 | | | 665,000 | | | | 714,875 | |
| CIT Group, Inc., 6.625%, 2018 (n) | | | 1,624,000 | | | | 1,843,240 | |
| CIT Group, Inc., 5.5%, 2019 (n) | | | 1,125,000 | | | | 1,223,438 | |
| Credit Acceptance Corp., 9.125%, 2017 | | | 680,000 | | | | 741,200 | |
| Icahn Enterprises LP, 7.75%, 2016 | | | 205,000 | | | | 213,456 | |
| Icahn Enterprises LP, 8%, 2018 | | | 1,291,000 | | | | 1,382,984 | |
| International Lease Finance Corp., 4.875%, 2015 | | | 255,000 | | | | 266,156 | |
| International Lease Finance Corp., 8.625%, 2015 | | | 270,000 | | | | 307,125 | |
| International Lease Finance Corp., 7.125%, 2018 (n) | | | 1,402,000 | | | | 1,638,588 | |
20
Portfolio of Investments – continued
| | | | | | | | |
| Issuer | | Shares/Par | | | Value ($) | |
| Bonds - continued | |
| Financial Institutions - continued | | | | | | | | |
| Nationstar Mortgage LLC/Capital Corp., 10.875%, 2015 | | $ | 720,000 | | | $ | 763,200 | |
| Nationstar Mortgage LLC/Capital Corp., 9.625%, 2019 (n) | | | 400,000 | | | | 456,000 | |
| Nationstar Mortgage LLC/Capital Corp., 7.875%, 2020 (n) | | | 695,000 | | | | 759,288 | |
| PHH Corp., 9.25%, 2016 | | | 380,000 | | | | 443,650 | |
| PHH Corp., 7.375%, 2019 | | | 960,000 | | | | 1,080,000 | |
| SLM Corp., 8.45%, 2018 | | | 595,000 | | | | 703,588 | |
| SLM Corp., 8%, 2020 | | | 1,750,000 | | | | 2,025,625 | |
| SLM Corp., 7.25%, 2022 | | | 810,000 | | | | 892,215 | |
| | | | | | | | |
| | | | | | | $ | 17,389,881 | |
| Food & Beverages - 0.6% | | | | | | | | |
| Ajecorp B.V., 6.5%, 2022 (n) | | $ | 1,956,000 | | | $ | 2,127,150 | |
| ARAMARK Corp., 8.5%, 2015 | | | 160,000 | | | | 160,802 | |
| ARAMARK Corp., 5.75%, 2020 (z) | | | 275,000 | | | | 280,500 | |
| B&G Foods, Inc., 7.625%, 2018 | | | 713,000 | | | | 764,693 | |
| Corporacion Jose R Lindey S.A., 6.75%, 2021 (n) | | | 630,000 | | | | 726,705 | |
| Grupo Bimbo S.A.B. de C.V., 4.5%, 2022 (n) | | | 1,185,000 | | | | 1,283,479 | |
| Marfrig Holding Europe B.V., 9.875%, 2017 (n) | | | 1,450,000 | | | | 1,515,250 | |
| Minerva Luxembourg S.A., 7.75%, 2023 (n) | | | 555,000 | | | | 595,931 | |
| Pinnacle Foods Finance LLC, 8.25%, 2017 | | | 585,000 | | | | 625,950 | |
| TreeHouse Foods, Inc., 7.75%, 2018 | | | 485,000 | | | | 524,406 | |
| | | | | | | | |
| | | | | | | $ | 8,604,866 | |
| Forest & Paper Products - 0.4% | | | | | | | | |
| Boise, Inc., 8%, 2020 | | $ | 735,000 | | | $ | 810,338 | |
| Fibria Overseas Finance Ltd., 7.5%, 2020 | | | 1,953,000 | | | | 2,187,360 | |
| Graphic Packaging Holding Co., 7.875%, 2018 | | | 630,000 | | | | 693,000 | |
| Inversiones CMPC S.A., 4.75%, 2018 (n) | | | 525,000 | | | | 552,892 | |
| Sappi Papier Holding GmbH, 7.75%, 2017 (n) | | | 225,000 | | | | 248,625 | |
| Smurfit Kappa Group PLC, 4.875%, 2018 (n) | | | 960,000 | | | | 984,000 | |
| Smurfit Kappa Group PLC, 7.75%, 2019 (n) | | EUR | 225,000 | | | | 322,389 | |
| Tembec Industries, Inc., 11.25%, 2018 | | $ | 340,000 | | | | 374,000 | |
| | | | | | | | |
| | | | | | | $ | 6,172,604 | |
| Gaming & Lodging - 0.7% | | | | | | | | |
| Boyd Gaming Corp., 9%, 2020 (n) | | $ | 490,000 | | | $ | 502,250 | |
| Caesars Entertainment Operating Co., Inc., 8.5%, 2020 | | | 840,000 | | | | 819,000 | |
| Choice Hotels International, Inc., 5.75%, 2022 | | | 105,000 | | | | 116,550 | |
| CityCenter Holdings LLC, 10.75%, 2017 (p) | | | 310,000 | | | | 342,550 | |
| FelCor Lodging LP, 5.625%, 2023 (n) | | | 120,000 | | | | 120,750 | |
Fontainebleau Las Vegas Holdings LLC,
10.25%, 2015 (a)(d)(n) | | | 505,000 | | | | 316 | |
| GWR Operating Partnership LLP, 10.875%, 2017 | | | 145,000 | | | | 164,303 | |
| Host Hotels & Resorts, Inc., REIT, 5.25%, 2022 | | | 345,000 | | | | 383,005 | |
21
Portfolio of Investments – continued
| | | | | | | | |
| Issuer | | Shares/Par | | | Value ($) | |
| Bonds - continued | |
| Gaming & Lodging - continued | | | | | | | | |
| Isle of Capri Casinos, Inc., 8.875%, 2020 | | $ | 785,000 | | | $ | 859,575 | |
| MGM Mirage, 6.625%, 2015 | | | 585,000 | | | | 631,800 | |
| MGM Resorts International, 11.375%, 2018 | | | 1,000,000 | | | | 1,257,500 | |
| MGM Resorts International, 6.625%, 2021 | | | 820,000 | | | | 848,700 | |
| NCL Corp., 5%, 2018 (z) | | | 130,000 | | | | 130,650 | |
| Penn National Gaming, Inc., 8.75%, 2019 | | | 1,053,000 | | | | 1,195,155 | |
| Pinnacle Entertainment, Inc., 8.75%, 2020 | | | 295,000 | | | | 317,494 | |
| Seven Seas Cruises S. DE R.L., 9.125%, 2019 | | | 930,000 | | | | 997,425 | |
| Viking Cruises Ltd., 8.5%, 2022 (n) | | | 705,000 | | | | 774,618 | |
| Wynn Las Vegas LLC, 7.75%, 2020 | | | 965,000 | | | | 1,078,388 | |
| | | | | | | | |
| | | | | | | $ | 10,540,029 | |
| Industrial - 0.2% | | | | | | | | |
| Dematic S.A., 7.75%, 2020 (z) | | $ | 810,000 | | | $ | 828,225 | |
| Hyva Global B.V., 8.625%, 2016 (n) | | | 400,000 | | | | 398,000 | |
| Mueller Water Products, Inc., 8.75%, 2020 | | | 211,000 | | | | 238,958 | |
| Rexel S.A., 6.125%, 2019 (n) | | | 645,000 | | | | 677,250 | |
| SPL Logistics Escrow LLC, 8.875%, 2020 (n) | | | 525,000 | | | | 560,437 | |
| | | | | | | | |
| | | | | | | $ | 2,702,870 | |
| Insurance - 0.1% | | | | | | | | |
| American International Group, Inc., 8.25%, 2018 | | $ | 485,000 | | | $ | 632,103 | |
| MetLife, Inc., 9.25% to 2038, FRN to 2068 (n) | | | 300,000 | | | | 414,000 | |
| | | | | | | | |
| | | | | | | $ | 1,046,103 | |
| Insurance - Property & Casualty - 0.2% | | | | | | | | |
| Liberty Mutual Group, Inc., 10.75% to 2038, FRN to 2088 (n) | | $ | 700,000 | | | $ | 1,069,250 | |
| XL Group PLC, 6.5% to 2017, FRN to 2049 | | | 1,320,000 | | | | 1,287,000 | |
| | | | | | | | |
| | | | | | | $ | 2,356,250 | |
| International Market Quasi-Sovereign - 0.0% | | | | | | | | |
| Electricite de France, FRN, 5.25%, 2049 (n) | | $ | 101,000 | | | $ | 99,435 | |
| Israel Electric Corp. Ltd., 6.7%, 2017 (n) | | | 402,000 | | | | 446,220 | |
| | | | | | | | |
| | | | | | | $ | 545,655 | |
| International Market Sovereign - 0.3% | | | | | | | | |
| Republic of Iceland, 4.875%, 2016 (n) | | $ | 1,933,000 | | | $ | 2,062,623 | |
| Republic of Iceland, 5.875%, 2022 (n) | | | 1,865,000 | | | | 2,112,113 | |
| | | | | | | | |
| | | | | | | $ | 4,174,736 | |
| Internet - 0.0% | | | | | | | | |
| Baidu, Inc., 3.5%, 2022 | | $ | 383,000 | | | $ | 380,237 | |
22
Portfolio of Investments – continued
| | | | | | | | |
| Issuer | | Shares/Par | | | Value ($) | |
| Bonds - continued | |
| Local Authorities - 0.1% | | | | | | | | |
Nashville & Davidson County, TN, Metropolitan Government Convention Center Authority (Build America Bonds),
6.731%, 2043 | | $ | 115,000 | | | $ | 145,201 | |
| Port Authority NY & NJ (168th Series), 4.926%, 2051 | | | 395,000 | | | | 443,127 | |
| San Francisco, CA, City & County Public Utilities Commission, Water Rev. (Build America Bonds), 6%, 2040 | | | 15,000 | | | | 18,843 | |
| State of California (Build America Bonds), 7.625%, 2040 | | | 65,000 | | | | 94,816 | |
| University of California Rev. (Build America Bonds), 5.77%, 2043 | | | 60,000 | | | | 74,257 | |
| | | | | | | | |
| | | | | | | $ | 776,244 | |
| Machinery & Tools - 0.5% | | | | | | | | |
| Case New Holland, Inc., 7.875%, 2017 | | $ | 1,700,000 | | | $ | 1,995,375 | |
| CNH America LLC, 7.25%, 2016 | | | 335,000 | | | | 375,200 | |
| CNH Capital LLC, 3.875%, 2015 | | | 905,000 | | | | 929,888 | |
| CNH Capital LLC, 6.25%, 2016 | | | 140,000 | | | | 154,700 | |
| H&E Equipment Services LLC, 7%, 2022 (n) | | | 960,000 | | | | 1,051,200 | |
| NESCO LLC/NESCO Holdings Corp., 11.75%, 2017 (n) | | | 975,000 | | | | 1,070,063 | |
| RSC Equipment Rental, Inc., 8.25%, 2021 | | | 830,000 | | | | 941,013 | |
| United Rentals North America, Inc., 5.75%, 2018 | | | 265,000 | | | | 285,206 | |
| United Rentals North America, Inc., 7.625%, 2022 | | | 767,000 | | | | 849,453 | |
| | | | | | | | |
| | | | | | | $ | 7,652,098 | |
| Major Banks - 0.3% | | | | | | | | |
| Bank of America Corp., 5.65%, 2018 | | $ | 530,000 | | | $ | 615,220 | |
| Barclays Bank PLC, 7.625%, 2022 | | | 600,000 | | | | 598,500 | |
| DBS Bank Ltd., 3.625% to 2017, FRN to 2022 (n) | | | 1,801,000 | | | | 1,899,309 | |
Royal Bank of Scotland Group PLC, 6.99% to 2017,
FRN to 2049 (n) | | | 100,000 | | | | 95,000 | |
Royal Bank of Scotland Group PLC, 7.648% to 2031,
FRN to 2049 | | | 1,610,000 | | | | 1,698,550 | |
| | | | | | | | |
| | | | | | | $ | 4,906,579 | |
| Medical & Health Technology & Services - 1.1% | | | | | | | | |
| AmSurg Corp., 5.625%, 2020 (n) | | $ | 410,000 | | | $ | 430,500 | |
| Catholic Health Initiatives, 2.95%, 2022 | | | 569,000 | | | | 571,799 | |
| CDRT Holding Corp., 9.25%, 2017 (n)(p) | | | 190,000 | | | | 195,462 | |
| Davita, Inc., 6.375%, 2018 | | | 2,000,000 | | | | 2,132,500 | |
| Davita, Inc., 6.625%, 2020 | | | 645,000 | | | | 703,050 | |
| Fresenius Medical Care AG & Co. KGaA, 9%, 2015 (n) | | | 175,000 | | | | 200,813 | |
| Fresenius Medical Care Capital Trust III, 5.625%, 2019 (n) | | | 615,000 | | | | 665,738 | |
| Fresenius Medical Care Capital Trust III, 5.875%, 2022 (n) | | | 405,000 | | | | 444,488 | |
| HCA, Inc., 8.5%, 2019 | | | 1,640,000 | | | | 1,816,300 | |
| HCA, Inc., 7.5%, 2022 | | | 1,975,000 | | | | 2,271,250 | |
23
Portfolio of Investments – continued
| | | | | | | | |
| Issuer | | Shares/Par | | | Value ($) | |
| Bonds - continued | |
| Medical & Health Technology & Services - continued | |
| HCA, Inc., 5.875%, 2022 | | $ | 935,000 | | | $ | 1,007,463 | |
| HealthSouth Corp., 8.125%, 2020 | | | 1,415,000 | | | | 1,552,963 | |
| IASIS Healthcare LLC/IASIS Capital Corp., 8.375%, 2019 | | | 825,000 | | | | 849,750 | |
| Select Medical Corp., 7.625%, 2015 | | | 89,000 | | | | 89,000 | |
| Tenet Healthcare Corp., 9.25%, 2015 | | | 980,000 | | | | 1,109,850 | |
| Tenet Healthcare Corp., 8%, 2020 | | | 550,000 | | | | 600,875 | |
| Tenet Healthcare Corp., 4.5%, 2021 (n) | | | 465,000 | | | | 458,605 | |
| Universal Health Services, Inc., 7%, 2018 | | | 1,030,000 | | | | 1,130,425 | |
| Universal Health Services, Inc., 7.625%, 2020 | | | 560,000 | | | | 597,800 | |
| Universal Hospital Services, Inc., 7.625%, 2020 (z) | | | 700,000 | | | | 746,375 | |
| Universal Hospital Services, Inc., FRN, 3.902%, 2015 | | | 65,000 | | | | 64,675 | |
| | | | | | | | |
| | | | | | | $ | 17,639,681 | |
| Medical Equipment - 0.1% | | | | | | | | |
| Biomet, Inc., 6.5%, 2020 (n) | | $ | 1,175,000 | | | $ | 1,242,563 | |
| Hologic, Inc., 6.25%, 2020 (n) | | | 230,000 | | | | 242,650 | |
| Physio-Control International, Inc., 9.875%, 2019 (n) | | | 330,000 | | | | 372,075 | |
| Teleflex, Inc., 6.875%, 2019 | | | 365,000 | | | | 396,938 | |
| | | | | | | | |
| | | | | | | $ | 2,254,226 | |
| Metals & Mining - 1.1% | | | | | | | | |
| Arch Coal, Inc., 7.25%, 2020 | | $ | 690,000 | | | $ | 591,675 | |
| Cloud Peak Energy, Inc., 8.25%, 2017 | | | 950,000 | | | | 1,014,125 | |
| Cloud Peak Energy, Inc., 8.5%, 2019 | | | 410,000 | | | | 442,800 | |
| Consol Energy, Inc., 8%, 2017 | | | 415,000 | | | | 451,313 | |
| Consol Energy, Inc., 8.25%, 2020 | | | 970,000 | | | | 1,069,425 | |
| First Quantum Minerals Ltd., 7.25%, 2019 (n) | | | 875,000 | | | | 877,188 | |
| Fortescue Metals Group Ltd., 8.25%, 2019 (n) | | | 1,025,000 | | | | 1,132,625 | |
| Indo Energy Finance II B.V., 6.375%, 2023 (n) | | | 210,000 | | | | 217,350 | |
| Novolipetsk Iron & Steel Corp., 4.45%, 2018 (z) | | | 1,247,000 | | | | 1,250,429 | |
| Peabody Energy Corp., 6%, 2018 | | | 1,230,000 | | | | 1,306,875 | |
| Peabody Energy Corp., 6.25%, 2021 | | | 230,000 | | | | 239,200 | |
| PhosAgro Bond Funding Ltd., 4.204%, 2018 (z) | | | 2,978,000 | | | | 3,011,503 | |
| Southern Copper Corp., 6.75%, 2040 | | | 1,656,000 | | | | 1,917,814 | |
| Southern Copper Corp., 5.25%, 2042 | | | 453,000 | | | | 437,902 | |
| Vale Overseas Ltd., 5.625%, 2019 | | | 1,134,000 | | | | 1,293,258 | |
| Vale Overseas Ltd., 4.375%, 2022 | | | 2,046,000 | | | | 2,129,256 | |
| Vale Overseas Ltd., 6.875%, 2039 | | | 273,000 | | | | 324,827 | |
| | | | | | | | |
| | | | | | | $ | 17,707,565 | |
| Mortgage-Backed - 8.9% | | | | | | | | |
| Fannie Mae, 2.97%, 2018 | | $ | 259,864 | | | $ | 279,903 | |
| Fannie Mae, 4.374%, 2013 | | | 67,658 | | | | 67,866 | |
| Fannie Mae, 4.518%, 2013 | | | 8,476 | | | | 8,476 | |
24
Portfolio of Investments – continued
| | | | | | | | |
| Issuer | | Shares/Par | | | Value ($) | |
| Bonds - continued | |
| Mortgage-Backed - continued | | | | | | | | |
| Fannie Mae, 5.138%, 2013 | | $ | 33,980 | | | $ | 33,903 | |
| Fannie Mae, 4.606%, 2014 | | | 111,014 | | | | 113,530 | |
| Fannie Mae, 4.629%, 2014 | | | 49,521 | | | | 50,948 | |
| Fannie Mae, 4.855%, 2014 | | | 109,988 | | | | 110,724 | |
| Fannie Mae, 4.935%, 2014 | | | 152,821 | | | | 155,441 | |
| Fannie Mae, 5.1%, 2014 - 2019 | | | 328,460 | | | | 357,817 | |
| Fannie Mae, 4.56%, 2015 | | | 69,650 | | | | 74,305 | |
| Fannie Mae, 4.57%, 2015 | | | 246,554 | | | | 255,384 | |
| Fannie Mae, 4.6%, 2015 - 2019 | | | 154,679 | | | | 176,439 | |
| Fannie Mae, 4.7%, 2015 | | | 80,837 | | | | 86,917 | |
| Fannie Mae, 4.78%, 2015 | | | 78,018 | | | | 83,579 | |
| Fannie Mae, 4.79%, 2015 | | | 118,584 | | | | 127,156 | |
| Fannie Mae, 4.81%, 2015 | | | 175,935 | | | | 188,531 | |
| Fannie Mae, 4.815%, 2015 | | | 105,762 | | | | 112,803 | |
| Fannie Mae, 4.85%, 2015 | | | 169,829 | | | | 179,718 | |
| Fannie Mae, 4.856%, 2015 | | | 61,506 | | | | 65,831 | |
| Fannie Mae, 4.86%, 2015 | | | 148,790 | | | | 156,943 | |
| Fannie Mae, 4.907%, 2015 | | | 192,866 | | | | 207,470 | |
| Fannie Mae, 5.034%, 2015 | | | 122,706 | | | | 133,812 | |
| Fannie Mae, 5.275%, 2015 | | | 121,391 | | | | 130,493 | |
| Fannie Mae, 5.464%, 2015 | | | 453,831 | | | | 496,274 | |
| Fannie Mae, 5.5%, 2015 - 2040 | | | 11,206,211 | | | | 12,253,673 | |
| Fannie Mae, 5.09%, 2016 | | | 62,800 | | | | 68,393 | |
| Fannie Mae, 5.135%, 2016 | | | 256,333 | | | | 284,394 | |
| Fannie Mae, 5.273%, 2016 | | | 308,956 | | | | 343,154 | |
| Fannie Mae, 5.35%, 2016 | | | 97,863 | | | | 108,730 | |
| Fannie Mae, 5.395%, 2016 | | | 103,826 | | | | 115,371 | |
| Fannie Mae, 5.424%, 2016 | | | 117,699 | | | | 131,603 | |
| Fannie Mae, 5.45%, 2016 | | | 110,000 | | | | 124,065 | |
| Fannie Mae, 5.725%, 2016 | | | 225,419 | | | | 254,298 | |
| Fannie Mae, 5.845%, 2016 | | | 33,300 | | | | 35,754 | |
| Fannie Mae, 5.93%, 2016 | | | 109,394 | | | | 121,558 | |
| Fannie Mae, 1.114%, 2017 | | | 1,200,000 | | | | 1,212,372 | |
| Fannie Mae, 1.9%, 2017 | | | 197,478 | | | | 203,145 | |
| Fannie Mae, 2.71%, 2017 | | | 56,646 | | | | 60,479 | |
| Fannie Mae, 3.308%, 2017 | | | 483,263 | | | | 526,751 | |
| Fannie Mae, 5.05%, 2017 - 2019 | | | 119,778 | | | | 133,514 | |
| Fannie Mae, 5.478%, 2017 | | | 196,299 | | | | 226,874 | |
| Fannie Mae, 5.508%, 2017 | | | 62,380 | | | | 69,820 | |
| Fannie Mae, 6%, 2017 - 2038 | | | 1,715,088 | | | | 1,897,016 | |
| Fannie Mae, 6.5%, 2017 - 2037 | | | 494,702 | | | | 554,422 | |
| Fannie Mae, 2.578%, 2018 | | | 900,000 | | | | 960,467 | |
| Fannie Mae, 3.8%, 2018 | | | 89,516 | | | | 99,251 | |
25
Portfolio of Investments – continued
| | | | | | | | |
| Issuer | | Shares/Par | | | Value ($) | |
| Bonds - continued | |
| Mortgage-Backed - continued | | | | | | | | |
| Fannie Mae, 3.849%, 2018 | | $ | 294,334 | | | $ | 328,848 | |
| Fannie Mae, 3.91%, 2018 | | | 116,921 | | | | 129,944 | |
| Fannie Mae, 3.99%, 2018 | | | 150,000 | | | | 168,193 | |
| Fannie Mae, 4%, 2018 - 2041 | | | 4,961,194 | | | | 5,299,443 | |
| Fannie Mae, 4.19%, 2018 | | | 107,480 | | | | 121,028 | |
| Fannie Mae, 5.16%, 2018 | | | 212,836 | | | | 232,393 | |
| Fannie Mae, 5.34%, 2018 | | | 372,741 | | | | 436,631 | |
| Fannie Mae, 4.45%, 2019 | | | 90,171 | | | | 103,498 | |
| Fannie Mae, 4.5%, 2019 - 2041 | | | 1,714,353 | | | | 1,864,867 | |
| Fannie Mae, 4.67%, 2019 | | | 28,000 | | | | 32,387 | |
| Fannie Mae, 4.83%, 2019 | | | 71,679 | | | | 82,582 | |
| Fannie Mae, 4.876%, 2019 | | | 112,562 | | | | 129,831 | |
| Fannie Mae, 5%, 2019 - 2041 | | | 6,301,730 | | | | 6,868,164 | |
| Fannie Mae, 5.08%, 2019 | | | 23,775 | | | | 27,015 | |
| Fannie Mae, 5.51%, 2019 | | | 114,693 | | | | 131,250 | |
| Fannie Mae, 3.87%, 2020 | | | 70,378 | | | | 78,694 | |
| Fannie Mae, 4.14%, 2020 | | | 42,563 | | | | 48,243 | |
| Fannie Mae, 5.19%, 2020 | | | 108,059 | | | | 123,406 | |
| Fannie Mae, 4.5%, 2025 | | | 91,956 | | | | 99,209 | |
| Fannie Mae, 3%, 2027 | | | 112,650 | | | | 118,775 | |
| Fannie Mae, 3.5%, 2042 | | | 676,751 | | | | 719,699 | |
| Fannie Mae, TBA, 2.5%, 2028 | | | 5,873,000 | | | | 6,099,661 | |
| Fannie Mae, TBA, 3%, 2028 - 2043 | | | 14,774,818 | | | | 15,288,770 | |
| Fannie Mae, TBA, 3.5%, 2043 | | | 11,090,000 | | | | 11,716,474 | |
| Fannie Mae, TBA, 4.5%, 2043 | | | 3,500,000 | | | | 3,757,305 | |
| Freddie Mac, 1.655%, 2016 | | | 1,277,929 | | | | 1,314,634 | |
| Freddie Mac, 3.882%, 2017 | | | 555,000 | | | | 618,585 | |
| Freddie Mac, 6%, 2017 - 2038 | | | 895,270 | | | | 994,652 | |
| Freddie Mac, 2.303%, 2018 | | | 1,515,000 | | | | 1,588,168 | |
| Freddie Mac, 2.323%, 2018 | | | 1,765,000 | | | | 1,852,322 | |
| Freddie Mac, 2.412%, 2018 | | | 1,000,000 | | | | 1,048,361 | |
| Freddie Mac, 2.699%, 2018 | | | 1,300,000 | | | | 1,389,447 | |
| Freddie Mac, 3.154%, 2018 | | | 514,000 | | | | 558,732 | |
| Freddie Mac, 5%, 2018 - 2040 | | | 713,286 | | | | 768,182 | |
| Freddie Mac, 1.883%, 2019 | | | 1,000,000 | | | | 1,022,035 | |
| Freddie Mac, 2.086%, 2019 | | | 1,175,000 | | | | 1,217,056 | |
| Freddie Mac, 2.13%, 2019 | | | 1,200,000 | | | | 1,246,331 | |
| Freddie Mac, 4.186%, 2019 | | | 146,000 | | | | 167,174 | |
| Freddie Mac, 5.085%, 2019 | | | 162,000 | | | | 190,465 | |
| Freddie Mac, 2.757%, 2020 | | | 275,149 | | | | 291,884 | |
| Freddie Mac, 3.32%, 2020 | | | 251,213 | | | | 271,708 | |
| Freddie Mac, 4.224%, 2020 | | | 99,963 | | | | 114,981 | |
| Freddie Mac, 4.251%, 2020 | | | 230,000 | | | | 264,736 | |
26
Portfolio of Investments – continued
| | | | | | | | |
| Issuer | | Shares/Par | | | Value ($) | |
| Bonds - continued | |
| Mortgage-Backed - continued | | | | | | | | |
| Freddie Mac, 4.5%, 2024 - 2041 | | $ | 1,066,323 | | | $ | 1,141,105 | |
| Freddie Mac, 5.5%, 2024 - 2041 | | | 3,853,008 | | | | 4,209,782 | |
| Freddie Mac, 4%, 2025 | | | 225,357 | | | | 239,530 | |
| Freddie Mac, 6.5%, 2037 - 2038 | | | 141,871 | | | | 158,130 | |
| Freddie Mac, 3.5%, 2041 - 2042 | | | 1,038,058 | | | | 1,099,976 | |
| Freddie Mac, TBA, 2.5%, 2028 | | | 8,730,000 | | | | 9,034,006 | |
| Freddie Mac, TBA, 3%, 2043 | | | 1,850,000 | | | | 1,900,875 | |
| Freddie Mac, TBA, 3.5%, 2043 | | | 3,790,000 | | | | 3,989,567 | |
| Ginnie Mae, 4.5%, 2033 - 2041 | | | 2,147,221 | | | | 2,366,788 | |
| Ginnie Mae, 5.5%, 2033 - 2042 | | | 880,956 | | | | 970,289 | |
| Ginnie Mae, 4%, 2039 - 2040 | | | 379,917 | | | | 415,268 | |
| Ginnie Mae, 3.5%, 2041 - 2042 | | | 760,611 | | | | 827,464 | |
| Ginnie Mae, 3%, 2043 | | | 4,650,000 | | | | 4,869,422 | |
| Ginnie Mae, 5.612%, 2058 | | | 228,633 | | | | 243,047 | |
| Ginnie Mae, 6.357%, 2058 | | | 168,065 | | | | 181,046 | |
| Ginnie Mae, TBA, 3%, 2043 | | | 6,200,000 | | | | 6,480,562 | |
| Ginnie Mae, TBA, 3.5%, 2043 | | | 7,000,000 | | | | 7,496,876 | |
| | | | | | | | |
| | | | | | | $ | 137,988,863 | |
| Municipals - 0.0% | | | | | | | | |
New Jersey Tobacco Settlement Financing Corp., “1-A”,
4.5%, 2023 | | $ | 595,000 | | | $ | 590,627 | |
| | |
| Natural Gas - Distribution - 0.1% | | | | | | | | |
| AmeriGas Finance LLC, 6.75%, 2020 | | $ | 685,000 | | | $ | 738,088 | |
| Ferrellgas LP/Ferrellgas Finance Corp., 6.5%, 2021 | | | 570,000 | | | | 577,838 | |
| | | | | | | | |
| | | | | | | $ | 1,315,926 | |
| Natural Gas - Pipeline - 0.6% | | | | | | | | |
| Access Midstream Partners Co., 4.875%, 2023 | | $ | 300,000 | | | $ | 297,000 | |
| Crosstex Energy, Inc., 8.875%, 2018 | | | 1,500,000 | | | | 1,616,250 | |
| El Paso Corp., 7%, 2017 | | | 1,545,000 | | | | 1,757,865 | |
| El Paso Corp., 7.75%, 2032 | | | 1,370,000 | | | | 1,545,111 | |
| Energy Transfer Equity LP, 7.5%, 2020 | | | 1,090,000 | | | | 1,245,325 | |
| Enterprise Products Partners LP, 8.375% to 2016, FRN to 2066 | | | 537,000 | | | | 613,523 | |
| Enterprise Products Partners LP, 7.034% to 2018, FRN to 2068 | | | 71,000 | | | | 81,118 | |
| Inergy Midstream LP, 6%, 2020 (n) | | | 995,000 | | | | 1,029,825 | |
| MarkWest Energy Partners LP, 5.5%, 2023 | | | 465,000 | | | | 488,250 | |
| Rockies Express Pipeline LLC, 5.625%, 2020 (n) | | | 176,000 | | | | 164,120 | |
| Sabine Pass Liquefaction, 5.625%, 2021 (n) | | | 430,000 | | | | 443,975 | |
| | | | | | | | |
| | | | | | | $ | 9,282,362 | |
| Network & Telecom - 0.5% | | | | | | | | |
| Centurylink, Inc., 7.65%, 2042 | | $ | 1,245,000 | | | $ | 1,215,515 | |
| Cincinnati Bell, Inc., 8.25%, 2017 | | | 260,000 | | | | 275,600 | |
27
Portfolio of Investments – continued
| | | | | | | | |
| Issuer | | Shares/Par | | | Value ($) | |
| Bonds - continued | |
| Network & Telecom - continued | | | | | | | | |
| Citizens Communications Co., 9%, 2031 | | $ | 260,000 | | | $ | 267,800 | |
| Eileme 2 AB, 11.625%, 2020 (n) | | | 400,000 | | | | 462,000 | |
| Frontier Communications Corp., 8.125%, 2018 | | | 1,295,000 | | | | 1,466,588 | |
| Qwest Communications International, Inc., 7.125%, 2018 (n) | | | 780,000 | | | | 810,629 | |
| Telefonica Celular del Paraguay S.A., 6.75%, 2022 (n) | | | 1,333,000 | | | | 1,429,642 | |
| TW Telecom Holdings, Inc., 5.375%, 2022 | | | 300,000 | | | | 312,750 | |
| Windstream Corp., 8.125%, 2018 | | | 150,000 | | | | 164,250 | |
| Windstream Corp., 7.75%, 2020 | | | 640,000 | | | | 688,000 | |
| Windstream Corp., 7.75%, 2021 | | | 825,000 | | | | 888,938 | |
| | | | | | | | |
| | | | | | | $ | 7,981,712 | |
| Oil Services - 0.4% | | | | | | | | |
| Afren PLC, 11.5%, 2016 (n) | | $ | 200,000 | | | $ | 234,500 | |
| Afren PLC, 10.25%, 2019 (n) | | | 216,000 | | | | 254,761 | |
| Bristow Group, Inc., 6.25%, 2022 | | | 295,000 | | | | 317,125 | |
| Chesapeake Energy Corp., 6.625%, 2019 (n) | | | 175,000 | | | | 180,688 | |
| Dresser-Rand Group, Inc., 6.5%, 2021 | | | 215,000 | | | | 227,900 | |
| Edgen Murray Corp., 8.75%, 2020 (n) | | | 605,000 | | | | 620,125 | |
| Pioneer Energy Services Corp., 9.875%, 2018 | | | 535,000 | | | | 584,488 | |
| Qgog Constellation S.A., 6.25%, 2019 (n) | | | 1,982,000 | | | | 2,066,235 | |
| Shale-Inland Holdings LLC/Finance Co., 8.75%, 2019 (n) | | | 705,000 | | | | 742,013 | |
| Unit Corp., 6.625%, 2021 | | | 1,395,000 | | | | 1,450,800 | |
| | | | | | | | |
| | | | | | | $ | 6,678,635 | |
| Other Banks & Diversified Financials - 2.0% | | | | | | | | |
| Alfa Bank, 7.5%, 2019 (n) | | $ | 1,274,000 | | | $ | 1,375,041 | |
| Ally Financial, Inc., 5.5%, 2017 | | | 2,480,000 | | | | 2,688,752 | |
| Ally Financial, Inc., 6.25%, 2017 | | | 430,000 | | | | 480,206 | |
| Banco de Credito del Peru, 6.125% to 2022, FRN to 2027 (n) | | | 1,874,000 | | | | 2,008,928 | |
| Banco de Credito e Inversiones, 4%, 2023 (z) | | | 651,000 | | | | 639,565 | |
| Banco de Reservas de La Republica Dominicana, 7%, 2023 (n) | | | 1,705,000 | | | | 1,696,475 | |
| Banco Santander S.A., 4.125%, 2022 (n) | | | 1,607,000 | | | | 1,594,144 | |
| Bancolombia S.A., 5.95%, 2021 | | | 1,374,000 | | | | 1,569,795 | |
| Bancolombia S.A., 5.125%, 2022 | | | 407,000 | | | | 413,105 | |
| Bangkok Bank (Hong Kong), 3.875%, 2022 (n) | | | 581,000 | | | | 599,615 | |
| BBVA Banco Continental S.A., 5%, 2022 (n) | | | 1,265,000 | | | | 1,325,720 | |
| BBVA Bancomer S.A. de C.V., 6.5%, 2021 (n) | | | 1,770,000 | | | | 2,000,100 | |
| BBVA Bancomer S.A. de C.V., 6.75%, 2022 (n) | | | 1,788,000 | | | | 2,049,495 | |
| BBVA Continental, 5.75%, 2017 (n) | | | 500,000 | | | | 544,000 | |
| CorpBanca, 3.125%, 2018 | | | 629,000 | | | | 620,128 | |
| Groupe BPCE S.A., 12.5% to 2019, FRN to 2049 (n) | | | 665,000 | | | | 817,444 | |
| Grupo Aval Ltd., 4.75%, 2022 (n) | | | 2,092,000 | | | | 2,102,460 | |
| Industrial Senior Trust, 5.5%, 2022 (n) | | | 2,082,000 | | | | 2,071,590 | |
| LBG Capital No. 1 PLC, 7.875%, 2020 (n) | | | 1,390,000 | | | | 1,525,247 | |
28
Portfolio of Investments – continued
| | | | | | | | |
| Issuer | | Shares/Par | | | Value ($) | |
| Bonds - continued | |
| Other Banks & Diversified Financials - continued | |
| PKO Finance AB, 4.63%, 2022 (n) | | $ | 590,000 | | | $ | 612,125 | |
| Santander UK PLC, 8.963% to 2030, FRN to 2049 | | | 1,674,000 | | | | 1,941,840 | |
| Turkiye Is Bankasi A.S., 3.875%, 2017 (n) | | | 380,000 | | | | 389,024 | |
| Turkiye Is Bankasi A.S., 6%, 2022 (n) | | | 284,000 | | | | 299,974 | |
| UBS AG, 7.625%, 2022 | | | 310,000 | | | | 345,968 | |
| Yapi Ve Kredi Bankasi, 5.5%, 2022 (n) | | | 671,000 | | | | 676,870 | |
| | | | | | | | |
| | | | | | | $ | 30,387,611 | |
| Pharmaceuticals - 0.2% | | | | | | | | |
| Capsugel FinanceCo. SCA, 9.875%, 2019 (n) | | EUR | 325,000 | | | $ | 477,342 | |
| Valeant Pharmaceuticals International, Inc., 7%, 2020 (n) | | $ | 760,000 | | | | 829,349 | |
| Valeant Pharmaceuticals International, Inc., 7.25%, 2022 (n) | | | 1,450,000 | | | | 1,600,437 | |
| | | | | | | | |
| | | | | | | $ | 2,907,128 | |
| Pollution Control - 0.1% | | | | | | | | |
| Heckmann Corp., 9.875%, 2018 | | $ | 1,005,000 | | | $ | 1,048,969 | |
| Heckmann Corp., 9.875%, 2018 (z) | | | 185,000 | | | | 191,706 | |
| | | | | | | | |
| | | | | | | $ | 1,240,675 | |
| Precious Metals & Minerals - 0.1% | | | | | | | | |
| Eldorado Gold Corp., 6.125%, 2020 (n) | | $ | 485,000 | | | $ | 504,400 | |
| IAMGOLD Corp., 6.75%, 2020 (n) | | | 1,070,000 | | | | 1,035,225 | |
| | | | | | | | |
| | | | | | | $ | 1,539,625 | |
| Printing & Publishing - 0.1% | | | | | | | | |
| American Media, Inc., 13.5%, 2018 (z) | | $ | 26,083 | | | $ | 19,823 | |
| Nielsen Finance LLC, 7.75%, 2018 | | | 385,000 | | | | 426,388 | |
| Nielsen Finance LLC, 4.5%, 2020 (n) | | | 845,000 | | | | 834,438 | |
| | | | | | | | |
| | | | | | | $ | 1,280,649 | |
| Railroad & Shipping - 0.1% | | | | | | | | |
| Brunswick Rail Finance Ltd., 6.5%, 2017 (n) | | $ | 2,005,000 | | | $ | 2,146,152 | |
| Kansas City Southern de Mexico S.A. de C.V., 6.125%, 2021 | | | 145,000 | | | | 162,763 | |
| | | | | | | | |
| | | | | | | $ | 2,308,915 | |
| Real Estate - 0.3% | | | | | | | | |
| CB Richard Ellis Group, Inc., 11.625%, 2017 | | $ | 235,000 | | | $ | 254,681 | |
| CNL Lifestyle Properties, Inc., REIT, 7.25%, 2019 | | | 640,000 | | | | 636,800 | |
| DuPont Fabros Technology, Inc., REIT, 8.5%, 2017 | | | 685,000 | | | | 744,081 | |
| Entertainment Properties Trust, REIT, 7.75%, 2020 | | | 715,000 | | | | 849,908 | |
| Kennedy Wilson, Inc., 8.75%, 2019 | | | 210,000 | | | | 224,438 | |
| MPT Operating Partnership LP, REIT, 6.875%, 2021 | | | 940,000 | | | | 1,014,025 | |
| MPT Operating Partnership LP, REIT, 6.375%, 2022 | | | 515,000 | | | | 549,119 | |
| | | | | | | | |
| | | | | | | $ | 4,273,052 | |
29
Portfolio of Investments – continued
| | | | | | | | |
| Issuer | | Shares/Par | | | Value ($) | |
| Bonds - continued | |
| Retailers - 0.7% | | | | | | | | |
| Academy Ltd., 9.25%, 2019 (n) | | $ | 330,000 | | | $ | 369,600 | |
| Burlington Coat Factory Warehouse Corp., 10%, 2019 | | | 885,000 | | | | 975,713 | |
| Cencosud S.A., 4.875%, 2023 (n) | | | 1,999,000 | | | | 2,013,807 | |
| J. Crew Group, Inc., 8.125%, 2019 | | | 885,000 | | | | 949,163 | |
| Limited Brands, Inc., 6.9%, 2017 | | | 1,110,000 | | | | 1,273,725 | |
| Limited Brands, Inc., 6.95%, 2033 | | | 60,000 | | | | 61,200 | |
| Pantry, Inc., 8.375%, 2020 (n) | | | 275,000 | | | | 295,281 | |
| Rite Aid Corp., 9.5%, 2017 | | | 340,000 | | | | 357,425 | |
| Rite Aid Corp., 9.25%, 2020 | | | 1,140,000 | | | | 1,276,800 | |
| Sally Beauty Holdings, Inc., 6.875%, 2019 | | | 225,000 | | | | 250,875 | |
| Toys “R” Us Property Co. II LLC, 8.5%, 2017 | | | 1,125,000 | | | | 1,184,063 | |
| Toys “R” Us, Inc., 10.75%, 2017 | | | 580,000 | | | | 622,775 | |
| YCC Holdings LLC/Yankee Finance, Inc., 10.25%, 2016 (p) | | | 470,000 | | | | 484,692 | |
| | | | | | | | |
| | | | | | | $ | 10,115,119 | |
| Specialty Chemicals - 0.2% | | | | | | | | |
| Eagle Spinco, Inc., 4.625%, 2021 (n) | | $ | 160,000 | | | $ | 162,600 | |
| Georgia Gulf Corp., 4.875%, 2023 (n) | | | 60,000 | | | | 60,900 | |
| Koppers, Inc., 7.875%, 2019 | | | 465,000 | | | | 511,500 | |
| Mexichem S.A.B. de C.V., 4.875%, 2022 (n) | | | 1,402,000 | | | | 1,479,110 | |
| SIBUR Securities Ltd., 3.914%, 2018 (n) | | | 659,000 | | | | 655,705 | |
| | | | | | | | |
| | | | | | | $ | 2,869,815 | |
| Specialty Stores - 0.1% | | | | | | | | |
| Gymboree Corp., 9.125%, 2018 | | $ | 177,000 | | | $ | 165,274 | |
| Michaels Stores, Inc., 11.375%, 2016 | | | 81,000 | | | | 84,646 | |
| Michaels Stores, Inc., 7.75%, 2018 | | | 675,000 | | | | 736,594 | |
| | | | | | | | |
| | | | | | | $ | 986,514 | |
| Steel - 0.0% | | | | | | | | |
| Severstal, 5.9%, 2022 (n) | | $ | 403,000 | | | $ | 412,672 | |
| | |
| Supermarkets - 0.0% | | | | | | | | |
| SMU S.A., 7.75%, 2020 (z) | | $ | 716,000 | | | $ | 732,109 | |
| | |
| Supranational - 0.1% | | | | | | | | |
| Eurasian Development Bank, 4.767%, 2022 (n) | | $ | 1,352,000 | | | $ | 1,395,940 | |
| | |
| Telecommunications - Wireless - 1.3% | | | | | | | | |
| America Movil S.A.B. de C.V., 5%, 2020 | | $ | 877,000 | | | $ | 997,661 | |
| America Movil S.A.B. de C.V., 3.125%, 2022 | | | 2,248,000 | | | | 2,236,558 | |
| Clearwire Corp., 12%, 2015 (n) | | | 760,000 | | | | 822,700 | |
| Cricket Communications, Inc., 7.75%, 2016 | | | 500,000 | | | | 525,600 | |
30
Portfolio of Investments – continued
| | | | | | | | |
| Issuer | | Shares/Par | | | Value ($) | |
| Bonds - continued | |
| Telecommunications - Wireless - continued | | | | | | | | |
| Cricket Communications, Inc., 7.75%, 2020 | | $ | 620,000 | | | $ | 632,400 | |
| Crown Castle International Corp., 7.125%, 2019 | | | 1,235,000 | | | | 1,352,325 | |
| Crown Castle International Corp., 5.25%, 2023 | | | 700,000 | | | | 717,500 | |
| Digicel Group Ltd., 8.25%, 2017 (n) | | | 856,000 | | | | 903,080 | |
| Digicel Group Ltd., 10.5%, 2018 (n) | | | 895,000 | | | | 984,500 | |
| Digicel Group Ltd., 8.25%, 2020 (n) | | | 396,000 | | | | 422,334 | |
| Digicel Group Ltd., 6%, 2021 (z) | | | 1,389,000 | | | | 1,385,527 | |
| MetroPCS Wireless, Inc., 7.875%, 2018 | | | 1,030,000 | | | | 1,111,113 | |
| Sprint Capital Corp., 6.875%, 2028 | | | 770,000 | | | | 777,700 | |
| Sprint Nextel Corp., 6%, 2016 | | | 2,280,000 | | | | 2,462,400 | |
| Sprint Nextel Corp., 8.375%, 2017 | | | 870,000 | | | | 1,009,200 | |
| Sprint Nextel Corp., 9%, 2018 (n) | | | 235,000 | | | | 291,399 | |
| Sprint Nextel Corp., 6%, 2022 | | | 885,000 | | | | 893,850 | |
| VimpelCom Ltd., 5.95%, 2023 (z) | | | 414,000 | | | | 413,482 | |
| Wind Acquisition Finance S.A., 11.75%, 2017 (n) | | | 820,000 | | | | 863,049 | |
| Wind Acquisition Finance S.A., 7.25%, 2018 (n) | | | 1,465,000 | | | | 1,508,949 | |
| | | | | | | | |
| | | | | | | $ | 20,311,327 | |
| Telephone Services - 0.1% | | | | | | | | |
| Cogent Communications Group, Inc., 8.375%, 2018 (n) | | $ | 105,000 | | | $ | 116,550 | |
| Level 3 Financing, Inc., 9.375%, 2019 | | | 920,000 | | | | 1,031,550 | |
| Level 3 Financing, Inc., 7%, 2020 (n) | | | 170,000 | | | | 178,500 | |
| Level 3 Financing, Inc., 8.625%, 2020 | | | 550,000 | | | | 610,500 | |
| | | | | | | | |
| | | | | | | $ | 1,937,100 | |
| Transportation - 0.0% | | | | | | | | |
| Navios South American Logistics, Inc., 9.25%, 2019 | | $ | 623,000 | | | $ | 654,150 | |
| | |
| Transportation - Services - 0.6% | | | | | | | | |
| ACL I Corp., 10.625%, 2016 (p) | | $ | 956,791 | | | $ | 996,192 | |
| Aguila American Resources Ltd., 7.875%, 2018 (n) | | | 845,000 | | | | 895,700 | |
| Avis Budget Car Rental LLC, 8.25%, 2019 | | | 405,000 | | | | 442,463 | |
| Avis Budget Car Rental LLC, 9.75%, 2020 | | | 185,000 | | | | 213,213 | |
| CEVA Group PLC, 8.375%, 2017 (n) | | | 1,445,000 | | | | 1,495,575 | |
| Commercial Barge Line Co., 12.5%, 2017 | | | 1,586,000 | | | | 1,736,670 | |
| HDTFS, Inc., 5.875%, 2020 (n) | | | 135,000 | | | | 140,400 | |
| Navios Maritime Acquisition Corp., 8.625%, 2017 | | | 555,000 | | | | 555,000 | |
| Navios Maritime Holdings, Inc., 8.875%, 2017 | | | 1,094,000 | | | | 1,113,145 | |
| Swift Services Holdings, Inc., 10%, 2018 | | | 1,505,000 | | | | 1,723,225 | |
| | | | | | | | |
| | | | | | | $ | 9,311,583 | |
| U.S. Government Agencies and Equivalents - 0.7% | |
| Aid-Egypt, 4.45%, 2015 | | $ | 170,000 | | | $ | 187,963 | |
| Fannie Mae, 1.125%, 2017 | | | 5,500,000 | | | | 5,604,720 | |
31
Portfolio of Investments – continued
| | | | | | | | |
| Issuer | | Shares/Par | | | Value ($) | |
| Bonds - continued | |
| U.S. Government Agencies and Equivalents - continued | |
| Freddie Mac, 2.375%, 2022 | | $ | 4,680,000 | | | $ | 4,861,336 | |
| Small Business Administration, 6.34%, 2021 | | | 117,179 | | | | 129,906 | |
| Small Business Administration, 6.07%, 2022 | | | 117,043 | | | | 129,875 | |
| Small Business Administration, 5.16%, 2028 | | | 195,192 | | | | 223,703 | |
| Small Business Administration, 2.21%, 2033 | | | 428,000 | | | | 433,808 | |
| | | | | | | | |
| | | | | | | $ | 11,571,311 | |
| U.S. Treasury Obligations - 7.0% | | | | | | | | |
| U.S. Treasury Bonds, 9.25%, 2016 | | $ | 47,000 | | | $ | 59,290 | |
| U.S. Treasury Bonds, 6.375%, 2027 | | | 106,000 | | | | 157,609 | |
| U.S. Treasury Bonds, 5.25%, 2029 | | | 86,000 | | | | 116,530 | |
| U.S. Treasury Bonds, 4.5%, 2036 | | | 70,000 | | | | 89,316 | |
| U.S. Treasury Bonds, 4.375%, 2038 | | | 638,000 | | | | 801,687 | |
| U.S. Treasury Bonds, 4.5%, 2039 | | | 8,172,000 | | | | 10,490,805 | |
| U.S. Treasury Notes, 3.125%, 2013 | | | 305,000 | | | | 310,278 | |
| U.S. Treasury Notes, 4%, 2014 | | | 18,000 | | | | 18,659 | |
| U.S. Treasury Notes, 1.875%, 2014 | | | 40,392,000 | | | | 41,072,040 | |
| U.S. Treasury Notes, 1.875%, 2014 | | | 417,000 | | | | 425,128 | |
| U.S. Treasury Notes, 4%, 2015 | | | 1,397,000 | | | | 1,499,319 | |
| U.S. Treasury Notes, 2.125%, 2015 | | | 14,254,000 | | | | 14,845,313 | |
| U.S. Treasury Notes, 0.875%, 2016 | | | 30,586,000 | | | | 30,999,400 | |
| U.S. Treasury Notes, 2.625%, 2018 | | | 955,000 | | | | 1,043,114 | |
| U.S. Treasury Notes, 2.75%, 2019 | | | 1,590,000 | | | | 1,752,479 | |
| U.S. Treasury Notes, 3.125%, 2019 | | | 454,000 | | | | 511,459 | |
| U.S. Treasury Notes, 3.5%, 2020 | | | 1,584,000 | | | | 1,827,046 | |
| U.S. Treasury Notes, 1.75%, 2022 | | | 2,053,000 | | | | 2,051,074 | |
| | | | | | | | |
| | | | | | | $ | 108,070,546 | |
| Utilities - Electric Power - 1.1% | | | | | | | | |
| AES Corp., 8%, 2017 | | $ | 1,260,000 | | | $ | 1,455,300 | |
| AES Corp., 7.375%, 2021 | | | 320,000 | | | | 361,600 | |
| Calpine Corp., 8%, 2016 (n) | | | 675,000 | | | | 712,125 | |
| Calpine Corp., 7.875%, 2020 (n) | | | 1,272,000 | | | | 1,402,380 | |
| Covanta Holding Corp., 7.25%, 2020 | | | 1,455,000 | | | | 1,596,083 | |
| Covanta Holding Corp., 6.375%, 2022 | | | 165,000 | | | | 178,915 | |
| EDP Finance B.V., 6%, 2018 (n) | | | 1,365,000 | | | | 1,426,425 | |
| Empresa de Energia de Bogota S.A., 6.125%, 2021 (n) | | | 200,000 | | | | 223,500 | |
| Energy Future Holdings Corp., 10%, 2020 (n) | | | 905,000 | | | | 1,020,388 | |
| Energy Future Holdings Corp., 10%, 2020 | | | 3,200,000 | | | | 3,632,000 | |
| Energy Future Holdings Corp., 11.75%, 2022 (n) | | | 480,000 | | | | 554,400 | |
| GenOn Energy, Inc., 9.5%, 2018 | | | 1,295,000 | | | | 1,541,050 | |
| GenOn Energy, Inc., 9.875%, 2020 | | | 625,000 | | | | 718,750 | |
| NRG Energy, Inc., 8.25%, 2020 | | | 1,160,000 | | | | 1,312,250 | |
32
Portfolio of Investments – continued
| | | | | | | | |
| Issuer | | Shares/Par | | | Value ($) | |
| Bonds - continued | |
| Utilities - Electric Power - continued | | | | | | | | |
| Texas Competitive Electric Holdings Co. LLC, 11.5%, 2020 (n) | | $ | 195,000 | | | $ | 146,249 | |
| | | | | | | | |
| | | | | | | $ | 16,281,415 | |
| Total Bonds (Identified Cost, $782,925,704) | | | | | | $ | 809,827,607 | |
| | |
| Common Stocks - 41.4% | | | | | | | | |
| Aerospace - 0.4% | | | | | | | | |
| L-3 Communications Holdings, Inc. | | | 23,620 | | | $ | 1,801,497 | |
| Lockheed Martin Corp. | | | 50,570 | | | | 4,450,160 | |
| | | | | | | | |
| | | | | | | $ | 6,251,657 | |
| Automotive - 0.3% | | | | | | | | |
| Accuride Corp. (a) | | | 5,511 | | | $ | 22,320 | |
| Delphi Automotive PLC | | | 72,221 | | | | 3,022,449 | |
| Johnson Controls, Inc. | | | 58,664 | | | | 1,846,156 | |
| | | | | | | | |
| | | | | | | $ | 4,890,925 | |
| Broadcasting - 0.1% | | | | | | | | |
| CBS Corp., “B” | | | 44,067 | | | $ | 1,912,067 | |
| New Young Broadcasting Holding Co., Inc. (a) | | | 19 | | | | 70,300 | |
| | | | | | | | |
| | | | | | | $ | 1,982,367 | |
| Brokerage & Asset Managers - 0.2% | | | | | | | | |
| BlackRock, Inc. | | | 10,664 | | | $ | 2,556,694 | |
| Prospect Capital Corp. | | | 61,740 | | | | 688,401 | |
| | | | | | | | |
| | | | | | | $ | 3,245,095 | |
| Cable TV - 0.5% | | | | | | | | |
| Comcast Corp., “A” | | | 47,067 | | | $ | 1,872,796 | |
| Time Warner Cable, Inc. | | | 59,870 | | | | 5,172,169 | |
| | | | | | | | |
| | | | | | | $ | 7,044,965 | |
| Chemicals - 0.5% | | | | | | | | |
| CF Industries Holdings, Inc. | | | 17,653 | | | $ | 3,545,252 | |
| Huntsman Corp. | | | 242,588 | | | | 4,179,791 | |
| | | | | | | | |
| | | | | | | $ | 7,725,043 | |
| Computer Software - 0.2% | | | | | | | | |
| Microsoft Corp. | | | 109,034 | | | $ | 3,031,145 | |
| | |
| Computer Software - Systems - 0.5% | | | | | | | | |
| Hewlett-Packard Co. | | | 264,807 | | | $ | 5,333,213 | |
| Western Digital Corp. | | | 49,000 | | | | 2,310,840 | |
| | | | | | | | |
| | | | | | | $ | 7,644,053 | |
33
Portfolio of Investments – continued
| | | | | | | | |
| Issuer | | Shares/Par | | | Value ($) | |
| Common Stocks - continued | | | | | | | | |
| Construction - 0.1% | | | | | | | | |
| Stanley Black & Decker, Inc. | | | 23,327 | | | $ | 1,835,835 | |
| | |
| Consumer Products - 0.4% | | | | | | | | |
| Newell Rubbermaid, Inc. | | | 77,636 | | | $ | 1,812,024 | |
| Nu Skin Enterprises, Inc., “A” | | | 98,354 | | | | 4,052,185 | |
| Procter & Gamble Co. | | | 13,856 | | | | 1,055,550 | |
| | | | | | | | |
| | | | | | | $ | 6,919,759 | |
| Containers - 0.1% | | | | | | | | |
| Packaging Corp. of America | | | 44,170 | | | $ | 1,845,423 | |
| | |
| Electrical Equipment - 0.2% | | | | | | | | |
| General Electric Co. | | | 108,308 | | | $ | 2,514,912 | |
| | |
| Electronics - 0.5% | | | | | | | | |
| Intel Corp. | | | 130,501 | | | $ | 2,720,946 | |
| KLA-Tencor Corp. | | | 67,725 | | | | 3,708,621 | |
| Microchip Technology, Inc. | | | 26,045 | | | | 949,861 | |
| | | | | | | | |
| | | | | | | $ | 7,379,428 | |
| Energy - Independent - 1.1% | | | | | | | | |
| Energy XXI (Bermuda) Ltd. | | | 35,710 | | | $ | 1,061,658 | |
| HollyFrontier Corp. | | | 87,716 | | | | 4,929,639 | |
| Marathon Oil Corp. | | | 74,540 | | | | 2,497,090 | |
| Marathon Petroleum Corp. | | | 65,111 | | | | 5,396,400 | |
| Occidental Petroleum Corp. | | | 14,296 | | | | 1,176,990 | |
| Valero Energy Corp. | | | 38,633 | | | | 1,761,278 | |
| WPX Energy, Inc. (a) | | | 41,719 | | | | 591,993 | |
| | | | | | | | |
| | | | | | | $ | 17,415,048 | |
| Energy - Integrated - 2.4% | | | | | | | | |
| Chevron Corp. | | | 125,100 | | | $ | 14,655,465 | |
| Exxon Mobil Corp. | | | 246,315 | | | | 22,057,508 | |
| | | | | | | | |
| | | | | | | $ | 36,712,973 | |
| Entertainment - 0.2% | | | | | | | | |
| Regal Entertainment Group, “A” (l) | | | 157,939 | | | $ | 2,474,904 | |
| | |
| Food & Beverages - 0.3% | | | | | | | | |
| Coca-Cola Enterprises, Inc. | | | 97,257 | | | $ | 3,479,855 | |
| General Mills, Inc. | | | 36,717 | | | | 1,698,161 | |
| | | | | | | | |
| | | | | | | $ | 5,178,016 | |
34
Portfolio of Investments – continued
| | | | | | | | |
| Issuer | | Shares/Par | | | Value ($) | |
| Common Stocks - continued | | | | | | | | |
| Food & Drug Stores - 0.7% | | | | | | | | |
| CVS Caremark Corp. | | | 131,702 | | | $ | 6,732,606 | |
| Kroger Co. | | | 104,190 | | | | 3,043,390 | |
| Walgreen Co. | | | 42,620 | | | | 1,744,863 | |
| | | | | | | | |
| | | | | | | $ | 11,520,859 | |
| Forest & Paper Products - 0.2% | | | | | | | | |
| International Paper Co. | | | 58,582 | | | $ | 2,578,194 | |
| | |
| Furniture & Appliances - 0.3% | | | | | | | | |
| Whirlpool Corp. | | | 35,640 | | | $ | 4,025,538 | |
| | |
| General Merchandise - 0.3% | | | | | | | | |
| Macy’s, Inc. | | | 121,998 | | | $ | 5,014,118 | |
| | |
| Health Maintenance Organizations - 0.3% | | | | | | | | |
| Aetna, Inc. | | | 111,509 | | | $ | 5,262,110 | |
| | |
| Insurance - 2.1% | | | | | | | | |
| Aflac, Inc. | | | 30,399 | | | $ | 1,518,430 | |
| American International Group, Inc. (a) | | | 74,754 | | | | 2,841,400 | |
| Everest Re Group Ltd. | | | 46,046 | | | | 5,737,792 | |
| Hartford Financial Services Group, Inc. | | | 116,388 | | | | 2,747,921 | |
| MetLife, Inc. | | | 127,734 | | | | 4,526,893 | |
| Prudential Financial, Inc. | | | 86,395 | | | | 4,800,970 | |
| Travelers Cos., Inc. | | | 67,361 | | | | 5,417,172 | |
| Validus Holdings Ltd. | | | 130,175 | | | | 4,638,135 | |
| | | | | | | | |
| | | | | | | $ | 32,228,713 | |
| Leisure & Toys - 0.4% | | | | | | | | |
| Activision Blizzard, Inc. | | | 107,986 | | | $ | 1,544,200 | |
| Mattel, Inc. | | | 100,923 | | | | 4,112,612 | |
| | | | | | | | |
| | | | | | | $ | 5,656,812 | |
| Machinery & Tools - 0.5% | | | | | | | | |
| Eaton Corp. PLC | | | 127,308 | | | $ | 7,889,277 | |
| | |
| Major Banks - 2.6% | | | | | | | | |
| Goldman Sachs Group, Inc. | | | 62,588 | | | $ | 9,373,179 | |
| JPMorgan Chase & Co. | | | 292,382 | | | | 14,303,327 | |
| KeyCorp | | | 372,632 | | | | 3,499,014 | |
| PNC Financial Services Group, Inc. | | | 105,514 | | | | 6,583,018 | |
| Wells Fargo & Co. | | | 176,450 | | | | 6,189,866 | |
| | | | | | | | |
| | | | | | | $ | 39,948,404 | |
35
Portfolio of Investments – continued
| | | | | | | | |
| Issuer | | Shares/Par | | | Value ($) | |
| Common Stocks - continued | | | | | | | | |
| Medical & Health Technology & Services - 0.4% | | | | | | | | |
| HCA Holdings, Inc. | | | 174,523 | | | $ | 6,473,058 | |
| | |
| Medical Equipment - 0.2% | | | | | | | | |
| Medtronic, Inc. | | | 26,978 | | | $ | 1,212,931 | |
| Thermo Fisher Scientific, Inc. | | | 27,790 | | | | 2,050,902 | |
| | | | | | | | |
| | | | | | | $ | 3,263,833 | |
| Metals & Mining - 0.2% | | | | | | | | |
| Cliffs Natural Resources, Inc. (l) | | | 152,083 | | | $ | 3,872,033 | |
| | |
| Natural Gas - Distribution - 0.2% | | | | | | | | |
| NiSource, Inc. | | | 134,692 | | | $ | 3,730,968 | |
| | |
| Other Banks & Diversified Financials - 1.0% | | | | | | | | |
| Citigroup, Inc. | | | 113,933 | | | $ | 4,781,768 | |
| Discover Financial Services | | | 156,370 | | | | 6,024,936 | |
| SunTrust Banks, Inc. | | | 152,304 | | | | 4,202,067 | |
| | | | | | | | |
| | | | | | | $ | 15,008,771 | |
| Pharmaceuticals - 2.1% | | | | | | | | |
| AbbVie, Inc. | | | 51,669 | | | $ | 1,907,619 | |
| Johnson & Johnson | | | 137,949 | | | | 10,499,298 | |
| Merck & Co., Inc. | | | 149,807 | | | | 6,401,253 | |
| Pfizer, Inc. | | | 524,580 | | | | 14,357,755 | |
| | | | | | | | |
| | | | | | | $ | 33,165,925 | |
| Printing & Publishing - 0.1% | | | | | | | | |
| American Media Operations, Inc. (a) | | | 6,684 | | | $ | 35,091 | |
| Gannett Co. Inc. | | | 47,290 | | | | 949,110 | |
| | | | | | | | |
| | | | | | | $ | 984,201 | |
| Railroad & Shipping - 0.1% | | | | | | | | |
| Kansas City Southern Co. | | | 14,126 | | | $ | 1,454,554 | |
| | |
| Real Estate - 18.5% | | | | | | | | |
| Alexandria Real Estate Equities, Inc., REIT | | | 126,693 | | | $ | 9,012,940 | |
| Atrium European Real Estate Ltd. | | | 451,359 | | | | 2,706,525 | |
| AvalonBay Communities, Inc., REIT | | | 95,375 | | | | 11,905,661 | |
| Big Yellow Group PLC, REIT | | | 461,400 | | | | 2,613,676 | |
| BioMed Realty Trust, Inc., REIT | | | 486,676 | | | | 10,278,597 | |
| Boston Properties, Inc., REIT | | | 99,085 | | | | 10,292,950 | |
| Corporate Office Properties Trust, REIT | | | 229,740 | | | | 5,943,374 | |
| DDR Corp., REIT | | | 387,970 | | | | 6,700,242 | |
36
Portfolio of Investments – continued
| | | | | | | | |
| Issuer | | Shares/Par | | | Value ($) | |
| Common Stocks - continued | | | | | | | | |
| Real Estate - continued | | | | | | | | |
| Digital Realty Trust, Inc., REIT | | | 84,178 | | | $ | 5,638,242 | |
| EastGroup Properties, Inc., REIT | | | 159,990 | | | | 9,089,032 | |
| EPR Properties, REIT | | | 130,970 | | | | 6,390,026 | |
| Equity Lifestyle Properties, Inc., REIT | | | 161,256 | | | | 11,882,955 | |
| Federal Realty Investment Trust, REIT | | | 72,227 | | | | 7,671,230 | |
| Home Properties, Inc., REIT | | | 148,880 | | | | 9,293,090 | |
| Host Hotels & Resorts, Inc., REIT | | | 785,448 | | | | 13,093,418 | |
| Medical Properties Trust, Inc., REIT | | | 680,327 | | | | 9,878,348 | |
| Mid-America Apartment Communities, Inc., REIT | | | 177,167 | | | | 12,302,476 | |
| National Health Investors, Inc., REIT | | | 133,000 | | | | 8,618,400 | |
| National Retail Properties, Inc., REIT | | | 242,310 | | | | 8,347,580 | |
| Plum Creek Timber Co. Inc., REIT | | | 257,116 | | | | 12,470,126 | |
| Public Storage, Inc., REIT | | | 154,472 | | | | 23,357,711 | |
| Retail Opportunity Investment Corp., REIT | | | 464,450 | | | | 5,996,050 | |
| Simon Property Group, Inc., REIT | | | 194,551 | | | | 30,906,372 | |
| Spirit Realty Capital, Inc., REIT | | | 207,250 | | | | 4,128,420 | |
| Tanger Factory Outlet Centers, Inc., REIT | | | 277,118 | | | | 9,779,494 | |
| Ventas, Inc., REIT | | | 177,102 | | | | 12,535,280 | |
| Vornado Realty Trust, REIT | | | 191,373 | | | | 15,350,028 | |
| Weyerhaeuser Co., REIT | | | 346,136 | | | | 10,179,860 | |
| | | | | | | | |
| | | | | | | $ | 286,362,103 | |
| Specialty Stores - 0.2% | | | | | | | | |
| American Eagle Outfitters, Inc. | | | 125,805 | | | $ | 2,601,647 | |
| | |
| Telecommunications - Wireless - 0.1% | | | | | | | | |
| American Tower Corp., REIT | | | 29,530 | | | $ | 2,291,528 | |
| | |
| Telephone Services - 0.9% | | | | | | | | |
| AT&T, Inc. | | | 197,593 | | | $ | 7,095,565 | |
| CenturyLink, Inc. | | | 119,550 | | | | 4,144,799 | |
| Verizon Communications, Inc. | | | 57,740 | | | | 2,686,642 | |
| | | | | | | | |
| | | | | | | $ | 13,927,006 | |
| Tobacco - 0.4% | | | | | | | | |
| Altria Group, Inc. | | | 21,129 | | | $ | 708,878 | |
| Lorillard, Inc. | | | 99,504 | | | | 3,834,884 | |
| Philip Morris International, Inc. | | | 24,989 | | | | 2,292,741 | |
| | | | | | | | |
| | | | | | | $ | 6,836,503 | |
| Utilities - Electric Power - 1.6% | | | | | | | | |
| AES Corp. | | | 114,128 | | | $ | 1,326,167 | |
| Alliant Energy Corp. | | | 77,866 | | | | 3,713,430 | |
| American Electric Power Co., Inc. | | | 130,398 | | | | 6,101,322 | |
37
Portfolio of Investments – continued
| | | | | | | | | | | | |
| Issuer | | | | | | Shares/Par | | | Value ($) | |
| Common Stocks - continued | | | | | | | | |
| Utilities - Electric Power - continued | | | | | | | | |
| FirstEnergy Corp. | | | 42,690 | | | $ | 1,685,401 | |
| NRG Energy, Inc. | | | 157,280 | | | | 3,774,720 | |
| PG&E Corp. | | | 82,741 | | | | 3,528,076 | |
| PPL Corp. | | | 136,257 | | | | 4,199,441 | |
| | | | | | | | | | | | |
| | | | | | | | | | | $ | 24,328,557 | |
| Total Common Stocks (Identified Cost, $569,338,667) | | | | | | $ | 642,516,260 | |
| | |
| Floating Rate Loans (g)(r) - 0.1% | | | | | | | | |
| Aerospace - 0.0% | | | | | | | | |
| Transdigm Inc., New Term Loan C, 2020 (o) | | $ | 110,361 | | | $ | 110,582 | |
| | |
| Conglomerates - 0.1% | | | | | | | | |
| Silver II Borrower SCA, New Term Loan B, 2019 (o) | | $ | 493,052 | | | $ | 494,284 | |
| | |
| Energy - Independent - 0.0% | | | | | | | | |
| Meg Energy Corp., New Term Loan B, 3.75%, 2020 | | $ | 460,814 | | | $ | 461,774 | |
| | |
| Financial Institutions - 0.0% | | | | | | | | |
| Springleaf Finance Corp., Term Loan, 5.5%, 2017 | | $ | 147,839 | | | $ | 148,670 | |
| | |
| Food & Beverages - 0.0% | | | | | | | | |
| ARAMARK Corp., Term Loan D, 2019 (o) | | $ | 110,367 | | | $ | 110,643 | |
| Total Floating Rate Loans (Identified Cost, $1,322,595) | | | | | | $ | 1,325,953 | |
| | |
| Convertible Preferred Stocks - 0.1% | | | | | | | | |
| Automotive - 0.1% | | | | | | | | |
| General Motors Co., 4.75% (Identified Cost, $684,947) | | $ | 15,010 | | | $ | 626,968 | |
| | |
| Preferred Stocks - 0.1% | | | | | | | | |
| Other Banks & Diversified Financials - 0.1% | | | | | | | | |
| Ally Financial, Inc., 7% (z) | | | 620 | | | $ | 603,241 | |
| GMAC Capital Trust I, 8.125% | | | 22,075 | | | | 585,871 | |
| Total Preferred Stocks (Identified Cost, $1,134,696) | | | | | | $ | 1,189,112 | |
| | | | | | | | | | | | | | | | |
| | | | |
| | | Strike Price | | | First Exercise | | | | | | | |
| Warrants - 0.0% | | | | | | | | | | | | | | | | |
| Broadcasting - 0.0% | | | | | | | | | | | | | | | | |
| New Young Broadcasting Holding Co., Inc. (1 share for 1 warrant) (Identified Cost, $102,195) (a) | | $ | 0.01 | | | | 7/14/10 | | | | 54 | | | $ | 199,800 | |
38
Portfolio of Investments – continued
| | | | | | | | | | | | |
| Convertible Bonds - 0.1% | |
| Issuer | | | | | | Shares/Par | | | Value ($) | |
| Network & Telecom - 0.1% | |
Nortel Networks Corp., 2.125%, 2014
(Identified Cost, $927,975) (a)(d) | | $ | 940,000 | | | $ | 909,450 | |
| | |
| Issuer/Expiration Date/Strike Price | | Number
of Contracts | | | | |
| Put Options Purchased - 0.0% | | | | | | | | |
| iShares Dow Jones U.S. Real Estate - March 2013 @ $57 | | | 1,725 | | | $ | 87,975 | |
| iShares Dow Jones U.S. Real Estate - June 2013 @ $55 | | | 4,100 | | | | 69,700 | |
| iShares Dow Jones U.S. Real Estate - June 2013 @ $62 | | | 2,500 | | | | 142,500 | |
| iShares Dow Jones U.S. Real Estate - September 2013 @ $60 | | | 2,200 | | | | 213,400 | |
| Total Put Options Purchased (Premiums Paid, $1,104,725) | | | $ | 513,575 | |
|
| Call Options Purchased - 0.0% | |
Russell 2000 Index - June 2013 @ 950
(Premiums Paid, $176,318) | | | 148 | | | $ | 223,480 | |
| | |
| Issuer | | Shares/Par | | | | |
| Money Market Funds - 10.0% | |
MFS Institutional Money Market Portfolio, 0.13%,
at Cost and Net Asset Value (v) | | | 154,459,260 | | | $ | 154,459,260 | |
|
| Collateral for Securities Loaned - 0.3% | |
| Morgan Stanley Repurchase Agreement, 0.17%, dated 2/28/13, due 3/01/13, total to be received $4,916,669 (secured by U.S. Treasury and Federal Agency obligations valued at $5,015,026, in an individually traded account), at Cost and Net Asset Value | | | 4,916,646 | | | $ | 4,916,646 | |
| Total Investments (Identified Cost, $1,517,093,728) | | | | | | $ | 1,616,708,111 | |
| | |
| Other Assets, Less Liabilities - (4.3)% | | | | | | | (66,154,311 | ) |
| Net Assets - 100.0% | | | | | | $ | 1,550,553,800 | |
| (a) | Non-income producing security. |
| (d) | In default. Interest and/or scheduled principal payment(s) have been missed. |
| (g) | The rate shown represents a weighted average coupon rate on settled positions at period end, unless otherwise indicated. |
| (l) | A portion of this security is on loan. |
| (n) | Securities exempt from registration under Rule 144A of the Securities Act of 1933. These securities may be sold in the ordinary course of business in transactions exempt from registration, normally to qualified institutional buyers. At period end, the aggregate value of these securities was $241,238,374, representing 15.6% of net assets. |
| (o) | All or a portion of this position has not settled. Upon settlement date, interest rates for unsettled amounts will be determined. The rate shown represents the weighted average coupon rate for settled amounts. |
| (p) | Payment-in-kind security. |
39
Portfolio of Investments – continued
| (r) | Remaining maturities of floating rate loans may be less than stated maturities shown as a result of contractual or optional prepayments by the borrower. Such prepayments cannot be predicted with certainty. These loans may be subject to restrictions on resale. Floating rate loans generally have rates of interest which are determined periodically by reference to a base lending rate plus a premium. |
| (v) | Underlying affiliated fund that is available only to investment companies managed by MFS. The rate quoted for the MFS Institutional Money Market Portfolio is the annualized seven-day yield of the fund at period end. |
| (z) | Restricted securities are not registered under the Securities Act of 1933 and are subject to legal restrictions on resale. These securities generally may be resold in transactions exempt from registration or to the public if the securities are subsequently registered. Disposal of these securities may involve time-consuming negotiations and prompt sale at an acceptable price may be difficult. The fund holds the following restricted securities: |
| | | | | | | | | | |
| Restricted Securities | | Acquisition
Date | | Cost | | | Value | |
| ARAMARK Corp., 5.75%, 2020 | | 2/22/13 | | | $275,000 | | | | $280,500 | |
| Ally Financial, Inc., 7% (Preferred Stock) | | 4/13/11-11/27/12 | | | 597,000 | | | | 603,241 | |
| American Media, Inc., 13.5%, 2018 | | 12/28/10 | | | 26,417 | | | | 19,823 | |
| Banco de Credito e Inversiones, 4%, 2023 | | 2/06/13 | | | 646,299 | | | | 639,565 | |
| Cedar Fair LP, 5.25%, 2021 | | 2/28/13 | | | 210,000 | | | | 210,000 | |
| Country Garden Holdings Co. Ltd., 7.5%, 2023 | | 1/03/13 | | | 223,000 | | | | 231,363 | |
| Dematic S.A., 7.75%, 2020 | | 12/13/12-1/15/13 | | | 816,799 | | | | 828,225 | |
| Digicel Group Ltd., 6%, 2021 | | 2/19/13 | | | 1,389,000 | | | | 1,385,527 | |
| El Fondo Mivivienda S.A., 3.5%, 2023 | | 1/24/13 | | | 214,176 | | | | 210,600 | |
| G-Force LLC, CDO, “A2”, 4.83%, 2036 | | 1/20/11 | | | 120,774 | | | | 125,278 | |
| Heckler & Koch GmbH, 9.5%, 2018 | | 5/06/11-1/02/13 | | | 573,676 | | | | 517,063 | |
| Heckmann Corp., 9.875%, 2018 | | 10/26/12 | | | 185,442 | | | | 191,706 | |
| LBI Media, Inc., 13.5% to 2015, 11.5% to 2020 | | 1/02/13 | | | 33,417 | | | | 32,785 | |
| Local TV Finance LLC, 9.25%, 2015 | | 11/09/07-2/06/13 | | | 803,736 | | | | 809,855 | |
| Lynx I Corp., 5.375%, 2021 | | 2/07/13 | | | 430,000 | | | | 440,750 | |
| Lynx II Corp., 6.375%, 2023 | | 2/07/13 | | | 285,000 | | | | 295,331 | |
| NCL Corp., 5%, 2018 | | 2/01/13 | | | 129,294 | | | | 130,650 | |
| NXP B.V., 5.75%, 2021 | | 1/31/13 | | | 225,000 | | | | 230,063 | |
| Novolipetsk Iron & Steel Corp., 4.45%, 2018 | | 2/11/13 | | | 1,247,000 | | | | 1,250,429 | |
| PhosAgro Bond Funding Ltd., 4.204%, 2018 | | 2/06/13-2/08/13 | | | 2,996,050 | | | | 3,011,503 | |
| Republic of Guatemala, 4.875%, 2028 | | 2/06/13-2/08/13 | | | 2,247,255 | | | | 2,215,538 | |
| Republic of Romania, 4.375%, 2023 | | 2/14/13 | | | 787,757 | | | | 788,040 | |
| Republic of Serbia, 4.875%, 2020 | | 2/14/13 | | | 577,626 | | | | 575,508 | |
| SMU S.A., 7.75%, 2020 | | 2/05/13 | | | 716,000 | | | | 732,109 | |
| Universal Hospital Services, Inc., 7.625%, 2020 | | 2/07/13 | | | 744,408 | | | | 746,375 | |
| VimpelCom Ltd., 5.95%, 2023 | | 2/06/13 | | | 414,000 | | | | 413,482 | |
| Total Restricted Securities | | | | $16,915,309 | |
| % of Net assets | | | | 1.1% | |
40
Portfolio of Investments – continued
The following abbreviations are used in this report and are defined:
| CDO | | Collateralized Debt Obligation |
| FRN | | Floating Rate Note. Interest rate resets periodically and may not be the rate reported at period end. |
| PLC | | Public Limited Company |
| REIT | | Real Estate Investment Trust |
| STRIPS | | Separate Trading of Registered Interest and Principal of Securities |
Abbreviations indicate amounts shown in currencies other than the U.S. dollar. All amounts are stated in U.S. dollars unless otherwise indicated. A list of abbreviations is shown below:
Derivative Contracts at 2/28/13
Forward Foreign Currency Exchange Contracts at 2/28/13
| | | | | | | | | | | | | | | | | | | | | | | | |
| Type | | Currency | | Counterparty | | Contracts
to
Deliver/
Receive | | | Settlement
Date Range | | | In
Exchange
For | | | Contracts
at Value | | | Net
Unrealized
Appreciation
(Depreciation) | |
| Asset Derivatives | | | | | | | | | | | | | |
| SELL | | EUR | | Barclays Bank PLC | | | 160,000 | | | | 4/15/13 | | | | $213,695 | | | | $208,955 | | | | $4,740 | |
| SELL | | EUR | | Deutsche Bank AG | | | 1,011,098 | | | | 4/15/13 | | | | 1,322,681 | | | | 1,320,462 | | | | 2,219 | |
| SELL | | EUR | | JPMorgan Chase Bank | | | 1,011,098 | | | | 4/15/13 | | | | 1,322,574 | | | | 1,320,462 | | | | 2,112 | |
| | | | | | | | | | | | | | | | | | | | | | | | |
| | | | | | | | | | | | | | | | | | | | | | | $9,071 | |
| | | | | | | | | | | | | | | | | | | | | | | | |
Swap Agreements at 2/28/13
| | | | | | | | | | | | | | | | | | |
| Expiration | | | | | Notional
Amount | | | Counterparty | | Cash Flows
to Receive | | Cash Flows
to Pay | | Fair
Value | |
| Liability Derivatives ` | |
| Credit Default Swap Agreements | |
| 3/20/23 | | | USD | | | | 4,573,000 | | | Citibank(a) | | 1% (fixed rate) | | (1) | | | $(186,523 | ) |
| 3/20/23 | | | USD | | | | 6,148,000 | | | Barclays Bank(b) | | 1% (fixed rate) | | (2) | | | (364,477 | ) |
| 3/20/23 | | | USD | | | | 4,716,000 | | | Citibank(c) | | 1% (fixed rate) | | (3) | | | (382,856 | ) |
| 3/20/23 | | | USD | | | | 5,570,000 | | | Merrill Lynch International(d) | | 1% (fixed rate) | | (4) | | | (418,264 | ) |
| 3/20/23 | | | USD | | | | 5,250,000 | | | Citibank(e) | | 1% (fixed rate) | | (5) | | | (182,090 | ) |
| | | | | | | | | | | | | | | | | | |
| | | | | | | | | | | | | | | | | $(1,534,210 | ) |
| | | | | | | | | | | | | | | | | | |
| (1) | Fund, as protection seller, to pay notional amount upon a defined credit event by Republic of Philippines, 10.625%, 3/16/25, a BB+ rated bond. The fund entered into the contract to gain issuer exposure. |
| (2) | Fund, as protection seller, to pay notional amount upon a defined credit event by Federal Republic of Brazil, 12.25%, 3/6/30, a BBB rated bond. The fund entered into the contract to gain issuer exposure. |
| (3) | Fund, as protection seller, to pay notional amount upon a defined credit event by Russian Federation, 7.5%, 3/31/30, a BBB rated bond. The fund entered into the contract to gain issuer exposure. |
41
Portfolio of Investments – continued
| (4) | Fund, as protection seller, to pay notional amount upon a defined credit event by Republic of Indonesia, 6.875%,3/9/17, a BB+ rated bond. The fund entered into the contract to gain issuer exposure. |
| (5) | Fund, as protection seller, to pay notional amount upon a defined credit event by Republic of Mexico, 5.95%, 3/19/19, a BBB rated bond. The fund entered into the contract to gain issuer exposure. |
| (a) | Net unamortized premiums received by the fund amounted to $184,801. |
| (b) | Net unamortized premiums received by the fund amounted to $295,133. |
| (c) | Net unamortized premiums received by the fund amounted to $349,221. |
| (d) | Net unamortized premiums received by the fund amounted to $429,345. |
| (e) | Net unamortized premiums received by the fund amounted to $128,313. |
The credit ratings presented here are an indicator of the current payment/performance risk of the related swap agreement, the reference obligation for which may be either a single security or, in the case of a credit default index, a basket of securities issued by corporate or sovereign issuers. Ratings are assigned to each reference security, including each individual security within a reference basket of securities, utilizing ratings from Moody’s, Fitch, and Standard & Poor’s rating agencies and applying the following hierarchy: If all three agencies provide a rating, the middle rating (after dropping the highest and lowest ratings) is assigned; if two of the three agencies rate a security, the lower of the two is assigned. Ratings are shown in the S&P and Fitch scale (e.g., AAA). The ratings for a credit default index are calculated by MFS as a weighted average of the external credit ratings of the individual securities that compose the index’s reference basket of securities.
At February 28, 2013, the fund had cash collateral of $1,280,000 to cover any commitments for certain derivative contracts. Cash collateral is comprised of “Restricted cash“ in the Statement of Assets and Liabilities.
See Notes to Financial Statements
42
Financial Statements
STATEMENT OF ASSETS AND LIABILITIES
At 2/28/13
This statement represents your fund’s balance sheet, which details the assets and liabilities comprising the total value of the fund.
| | | | |
| Assets | | | | |
Investments- | | | | |
Non-affiliated issuers, at value (identified cost, $1,362,634,468) | | | $1,462,248,851 | |
Underlying affiliated funds, at cost and value | | | 154,459,260 | |
Total investments, at value, including $4,758,965 of securities on loan
(identified cost, $1,517,093,728) | | | $1,616,708,111 | |
Cash | | | 591,098 | |
Restricted cash | | | 1,280,000 | |
Receivables for | | | | |
Forward foreign currency exchange contracts | | | 9,071 | |
Investments sold | | | 7,119,237 | |
Fund shares sold | | | 17,119,795 | |
Interest and dividends | | | 10,662,265 | |
Other assets | | | 8,959 | |
Total assets | | | $1,653,498,536 | |
| Liabilities | | | | |
Payables for | | | | |
Distributions | | | $633,308 | |
Investments purchased | | | 57,414,749 | |
TBA purchase commitments | | | 31,991,087 | |
Fund shares reacquired | | | 5,578,192 | |
Swaps, at value (net unamortized premiums received, $1,386,813) | | | 1,534,210 | |
Collateral for securities loaned, at value | | | 4,916,646 | |
Payable to affiliates | | | | |
Investment adviser | | | 73,027 | |
Shareholder servicing costs | | | 503,846 | |
Distribution and service fees | | | 42,316 | |
Payable for independent Trustees’ compensation | | | 21 | |
Accrued expenses and other liabilities | | | 257,334 | |
Total liabilities | | | $102,944,736 | |
Net assets | | | $1,550,553,800 | |
| Net assets consist of | | | | |
Paid-in capital | | | $1,456,832,535 | |
Unrealized appreciation (depreciation) on investments and translation of assets and liabilities in foreign currencies | | | 99,475,496 | |
Accumulated distributions in excess of net realized gain on investments and foreign currency | | | (3,759,023 | ) |
Accumulated distributions in excess of net investment income | | | (1,995,208 | ) |
Net assets | | | $1,550,553,800 | |
Shares of beneficial interest outstanding | | | 131,170,007 | |
43
Statement of Assets and Liabilities – continued
| | | | | | | | | | | | |
| | | Net assets | | | Shares
outstanding | | | Net asset value
per share (a) | |
Class A | | | $797,338,161 | | | | 67,441,800 | | | | $11.82 | |
Class C | | | 466,360,663 | | | | 39,466,904 | | | | 11.82 | |
Class I | | | 280,443,354 | | | | 23,718,958 | | | | 11.82 | |
Class R1 | | | 374,902 | | | | 31,748 | | | | 11.81 | |
Class R2 | | | 701,771 | | | | 59,390 | | | | 11.82 | |
Class R3 | | | 2,782,955 | | | | 235,345 | | | | 11.83 | |
Class R4 | | | 1,159,435 | | | | 98,061 | | | | 11.82 | |
Class R5 | | | 1,392,559 | | | | 117,801 | | | | 11.82 | |
| (a) | Maximum offering price per share was equal to the net asset value per share for all share classes, except for Class A, for which the maximum offering price per share was $12.41 [100 / 95.25 x $11.82]. On sales of $50,000 or more, the maximum offering price of Class A shares is reduced. A contingent deferred sales charge may be imposed on redemptions of Class A and Class C shares. Redemption price per share was equal to the net asset value per share for Classes I, R1, R2, R3, R4, and R5. |
See Notes to Financial Statements
44
Financial Statements
STATEMENT OF OPERATIONS
Year ended 2/28/13
This statement describes how much your fund earned in investment income and accrued in expenses. It also describes any gains and/or losses generated by fund operations.
| | | | |
| Net investment income | |
Income | | | | |
Interest | | | $29,884,731 | |
Dividends | | | 14,441,966 | |
Dividends from underlying affiliated funds | | | 136,496 | |
Foreign taxes withheld | | | (21,577 | ) |
Total investment income | | | $44,441,616 | |
Expenses | | | | |
Management fee | | | $7,332,981 | |
Distribution and service fees | | | 4,925,307 | |
Shareholder servicing costs | | | 1,113,187 | |
Administrative services fee | | | 163,428 | |
Independent Trustees’ compensation | | | 20,773 | |
Custodian fee | | | 191,610 | |
Shareholder communications | | | 90,838 | |
Audit and tax fees | | | 62,059 | |
Legal fees | | | 13,118 | |
Miscellaneous | | | 396,069 | |
Total expenses | | | $14,309,370 | |
Fees paid indirectly | | | (78 | ) |
Reduction of expenses by investment adviser | | | (3,406 | ) |
Net expenses | | | $14,305,886 | |
Net investment income | | | $30,135,730 | |
| Realized and unrealized gain (loss) on investments and foreign currency | |
Realized gain (loss) (identified cost basis) | | | | |
Investments | | | $19,487,630 | |
Futures contracts | | | 20,597 | |
Swap agreements | | | (20,949 | ) |
Foreign currency | | | (28,616 | ) |
Net realized gain (loss) on investments and foreign currency | | | $19,458,662 | |
Change in unrealized appreciation (depreciation) | | | | |
Investments | | | $64,615,920 | |
Futures contracts | | | 340 | |
Swap agreements | | | (147,397 | ) |
Translation of assets and liabilities in foreign currencies | | | 70,394 | |
Net unrealized gain (loss) on investments and foreign currency translation | | | $64,539,257 | |
Net realized and unrealized gain (loss) on investments and foreign currency | | | $83,997,919 | |
Change in net assets from operations | | | $114,133,649 | |
See Notes to Financial Statements
45
Financial Statements
STATEMENTS OF CHANGES IN NET ASSETS
These statements describe the increases and/or decreases in net assets resulting from operations, any distributions, and any shareholder transactions.
| | | | | | | | |
| | | Years ended 2/28, 2/29 | |
| Change in net assets | | 2013 | | | 2012 | |
| From operations | | | | | | | | |
Net investment income | | | $30,135,730 | | | | $17,169,078 | |
Net realized gain (loss) on investments and foreign currency | | | 19,458,662 | | | | 28,630,687 | |
Net unrealized gain (loss) on investments and foreign currency translation | | | 64,539,257 | | | | (5,388,630 | ) |
Change in net assets from operations | | | $114,133,649 | | | | $40,411,135 | |
| Distributions declared to shareholders | | | | | | | | |
From net investment income | | | $(34,119,558 | ) | | | $(19,225,635 | ) |
From net realized gain on investments | | | (1,043,035 | ) | | | — | |
Total distributions declared to shareholders | | | $(35,162,593 | ) | | | $(19,225,635 | ) |
Change in net assets from fund share transactions | | | $688,808,285 | | | | $334,441,555 | |
Total change in net assets | | | $767,779,341 | | | | $355,627,055 | |
| Net assets | | | | | | | | |
At beginning of period | | | 782,774,459 | | | | 427,147,404 | |
At end of period (including accumulated distributions in excess of net investment income of $1,995,208 and $888,948, respectively) | | | $1,550,553,800 | | | | $782,774,459 | |
See Notes to Financial Statements
46
Financial Statements
FINANCIAL HIGHLIGHTS
The financial highlights table is intended to help you understand the fund’s financial performance for the past 5 years (or life of a particular share class, if shorter). Certain information reflects financial results for a single fund share. The total returns in the table represent the rate by which an investor would have earned (or lost) on an investment in the fund share class (assuming reinvestment of all distributions) held for the entire period.
| | | | | | | | | | | | | | | | | | | | |
| Class A | | Years ended 2/28, 2/29 | |
| | | 2013 | | | 2012 | | | 2011 | | | 2010 | | | 2009 | |
Net asset value, beginning of period | | | $11.05 | | | | $10.79 | | | | $9.60 | | | | $6.88 | | | | $10.04 | |
| Income (loss) from investment operations | | | | | | | | | | | | | | | | | | | | |
Net investment income (d) | | | $0.33 | | | | $0.34 | | | | $0.40 | | | | $0.43 | | | | $0.47 | |
Net realized and unrealized gain (loss)
on investments and foreign currency | | | 0.82 | | | | 0.30 | | | | 1.23 | | | | 2.75 | | | | (3.13 | ) |
Total from investment operations | | | $1.15 | | | | $0.64 | | | | $1.63 | | | | $3.18 | | | | $(2.66 | ) |
| Less distributions declared to shareholders | | | | | | | | | | | | | | | | | | | | |
From net investment income | | | $(0.37 | ) | | | $(0.38 | ) | | | $(0.44 | ) | | | $(0.46 | ) | | | $(0.49 | ) |
From net realized gain on investments | | | (0.01 | ) | | | — | | | | — | | | | — | | | | (0.01 | ) |
Total distributions declared to shareholders | | | $(0.38 | ) | | | $(0.38 | ) | | | $(0.44 | ) | | | $(0.46 | ) | | | $(0.50 | ) |
Net asset value, end of period (x) | | | $11.82 | | | | $11.05 | | | | $10.79 | | | | $9.60 | | | | $6.88 | |
Total return (%) (r)(s)(t)(x) | | | 10.56 | | | | 6.09 | | | | 17.36 | | | | 47.12 | | | | (27.43 | ) |
Ratios (%) (to average net assets)
and Supplemental data: | | | | | | | | | | | | | | | | | | | | |
Expenses before expense reductions (f) | | | 1.08 | | | | 1.10 | | | | 1.15 | | | | 1.20 | | | | 1.23 | |
Expenses after expense reductions (f) | | | 1.08 | | | | 1.10 | | | | 1.06 | | | | 0.94 | | | | 0.95 | |
Net investment income | | | 2.86 | | | | 3.18 | | | | 3.95 | | | | 5.02 | | | | 5.23 | |
Portfolio turnover | | | 64 | | | | 64 | | | | 59 | | | | 79 | | | | 80 | |
Net assets at end of period (000 omitted) | | | $797,338 | | | | $447,034 | | | | $257,247 | | | | $116,318 | | | | $91,445 | |
See Notes to Financial Statements
47
Financial Highlights – continued
| | | | | | | | | | | | | | | | | | | | |
| Class C | | Years ended 2/28, 2/29 | |
| | | 2013 | | | 2012 | | | 2011 | | | 2010 | | | 2009 | |
Net asset value, beginning of period | | | $11.04 | | | | $10.78 | | | | $9.59 | | | | $6.88 | | | | $10.03 | |
| Income (loss) from investment operations | | | | | | | | | | | | | | | | | | | | |
Net investment income (d) | | | $0.24 | | | | $0.26 | | | | $0.33 | | | | $0.37 | | | | $0.41 | |
Net realized and unrealized gain (loss)
on investments and foreign currency | | | 0.83 | | | | 0.30 | | | | 1.22 | | | | 2.74 | | | | (3.13 | ) |
Total from investment operations | | | $1.07 | | | | $0.56 | | | | $1.55 | | | | $3.11 | | | | $(2.72 | ) |
| Less distributions declared to shareholders | | | | | | | | | | | | | | | | | | | | |
From net investment income | | | $(0.28 | ) | | | $(0.30 | ) | | | $(0.36 | ) | | | $(0.40 | ) | | | $(0.42 | ) |
From net realized gain on investments | | | (0.01 | ) | | | — | | | | — | | | | — | | | | (0.01 | ) |
Total distributions declared to shareholders | | | $(0.29 | ) | | | $(0.30 | ) | | | $(0.36 | ) | | | $(0.40 | ) | | | $(0.43 | ) |
Net asset value, end of period (x) | | | $11.82 | | | | $11.04 | | | | $10.78 | | | | $9.59 | | | | $6.88 | |
Total return (%) (r)(s)(t)(x) | | | 9.84 | | | | 5.31 | | | | 16.51 | | | | 45.90 | | | | (27.88 | ) |
Ratios (%) (to average net assets)
and Supplemental data: | | | | | | | | | | | | | | | | | | | | |
Expenses before expense reductions (f) | | | 1.83 | | | | 1.85 | | | | 1.90 | | | | 1.95 | | | | 1.93 | |
Expenses after expense reductions (f) | | | 1.83 | | | | 1.85 | | | | 1.81 | | | | 1.69 | | | | 1.65 | |
Net investment income | | | 2.11 | | | | 2.43 | | | | 3.20 | | | | 4.27 | | | | 4.54 | |
Portfolio turnover | | | 64 | | | | 64 | | | | 59 | | | | 79 | | | | 80 | |
Net assets at end of period (000 omitted) | | | $466,361 | | | | $238,332 | | | | $138,344 | | | | $63,377 | | | | $46,617 | |
| |
| Class I | | Years ended 2/28, 2/29 | |
| | | 2013 | | | 2012 | | | 2011 | | | 2010 | | | 2009 | |
Net asset value, beginning of period | | | $11.05 | | | | $10.79 | | | | $9.60 | | | | $6.88 | | | | $10.04 | |
| Income (loss) from investment operations | | | | | | | | | | | | | | | | | | | | |
Net investment income (d) | | | $0.35 | | | | $0.36 | | | | $0.41 | | | | $0.45 | | | | $0.50 | |
Net realized and unrealized gain (loss)
on investments and foreign currency | | | 0.83 | | | | 0.30 | | | | 1.25 | | | | 2.75 | | | | (3.14 | ) |
Total from investment operations | | | $1.18 | | | | $0.66 | | | | $1.66 | | | | $3.20 | | | | $(2.64 | ) |
| Less distributions declared to shareholders | | | | | | | | | | | | | | | | | | | | |
From net investment income | | | $(0.40 | ) | | | $(0.40 | ) | | | $(0.47 | ) | | | $(0.48 | ) | | | $(0.51 | ) |
From net realized gain on investments | | | (0.01 | ) | | | — | | | | — | | | | — | | | | (0.01 | ) |
Total distributions declared to shareholders | | | $(0.41 | ) | | | $(0.40 | ) | | | $(0.47 | ) | | | $(0.48 | ) | | | $(0.52 | ) |
Net asset value, end of period (x) | | | $11.82 | | | | $11.05 | | | | $10.79 | | | | $9.60 | | | | $6.88 | |
Total return (%) (r)(s)(x) | | | 10.83 | | | | 6.35 | | | | 17.65 | | | | 47.47 | | | | (27.21 | ) |
Ratios (%) (to average net assets)
and Supplemental data: | | | | | | | | | | | | | | | | | | | | |
Expenses before expense reductions (f) | | | 0.83 | | | | 0.85 | | | | 0.89 | | | | 0.93 | | | | 0.93 | |
Expenses after expense reductions (f) | | | 0.83 | | | | 0.85 | | | | 0.83 | | | | 0.69 | | | | 0.65 | |
Net investment income | | | 3.09 | | | | 3.43 | | | | 3.94 | | | | 4.95 | | | | 5.56 | |
Portfolio turnover | | | 64 | | | | 64 | | | | 59 | | | | 79 | | | | 80 | |
Net assets at end of period (000 omitted) | | | $280,443 | | | | $96,323 | | | | $30,993 | | | | $3,835 | | | | $1,036 | |
See Notes to Financial Statements
48
Financial Highlights – continued
| | | | | | | | | | | | | | | | | | | | |
| Class R1 | | Years ended 2/28, 2/29 | |
| | | 2013 | | | 2012 | | | 2011 | | | 2010 | | | 2009 (i) | |
Net asset value, beginning of period | | | $11.04 | | | | $10.78 | | | | $9.59 | | | | $6.87 | | | | $9.83 | |
| Income (loss) from investment operations | | | | | | | | | | | | | | | | | | | | |
Net investment income (d) | | | $0.23 | | | | $0.26 | | | | $0.34 | | | | $0.37 | | | | $0.27 | |
Net realized and unrealized gain (loss)
on investments and foreign currency | | | 0.83 | | | | 0.30 | | | | 1.21 | | | | 2.75 | | | | (2.94 | ) |
Total from investment operations | | | $1.06 | | | | $0.56 | | | | $1.55 | | | | $3.12 | | | | $(2.67 | ) |
| Less distributions declared to shareholders | | | | | | | | | | | | | | | | | | | | |
From net investment income | | | $(0.28 | ) | | | $(0.30 | ) | | | $(0.36 | ) | | | $(0.40 | ) | | | $(0.29 | ) |
From net realized gain on investments | | | (0.01 | ) | | | — | | | | — | | | | — | | | | — | |
Total distributions declared to shareholders | | | $(0.29 | ) | | | $(0.30 | ) | | | $(0.36 | ) | | | $(0.40 | ) | | | $(0.29 | ) |
Net asset value, end of period (x) | | | $11.81 | | | | $11.04 | | | | $10.78 | | | | $9.59 | | | | $6.87 | |
Total return (%) (r)(s)(x) | | | 9.75 | | | | 5.31 | | | | 16.51 | | | | 46.11 | | | | (27.52 | )(n) |
Ratios (%) (to average net assets)
and Supplemental data: | | | | | | | | | | | | | | | | | | | | |
Expenses before expense reductions (f) | | | 1.84 | | | | 1.85 | | | | 1.90 | | | | 1.94 | | | | 1.97 | (a) |
Expenses after expense reductions (f) | | | 1.84 | | | | 1.85 | | | | 1.80 | | | | 1.69 | | | | 1.65 | (a) |
Net investment income | | | 2.04 | | | | 2.44 | | | | 3.32 | | | | 4.24 | | | | 4.76 | (a) |
Portfolio turnover | | | 64 | | | | 64 | | | | 59 | | | | 79 | | | | 80 | (n) |
Net assets at end of period (000 omitted) | | | $375 | | | | $142 | | | | $126 | | | | $106 | | | | $73 | |
| |
| Class R2 | | Years ended 2/28, 2/29 | |
| | | 2013 | | | 2012 | | | 2011 | | | 2010 | | | 2009 (i) | |
Net asset value, beginning of period | | | $11.04 | | | | $10.78 | | | | $9.59 | | | | $6.87 | | | | $9.83 | |
| Income (loss) from investment operations | | | | | | | | | | | | | | | | | | | | |
Net investment income (d) | | | $0.30 | | | | $0.31 | | | | $0.39 | | | | $0.41 | | | | $0.29 | |
Net realized and unrealized gain (loss)
on investments and foreign currency | | | 0.83 | | | | 0.30 | | | | 1.21 | | | | 2.75 | | | | (2.93 | ) |
Total from investment operations | | | $1.13 | | | | $0.61 | | | | $1.60 | | | | $3.16 | | | | $(2.64 | ) |
| Less distributions declared to shareholders | | | | | | | | | | | | | | | | | | | | |
From net investment income | | | $(0.34 | ) | | | $(0.35 | ) | | | $(0.41 | ) | | | $(0.44 | ) | | | $(0.32 | ) |
From net realized gain on investments | | | (0.01 | ) | | | — | | | | — | | | | — | | | | — | |
Total distributions declared to shareholders | | | $(0.35 | ) | | | $(0.35 | ) | | | $(0.41 | ) | | | $(0.44 | ) | | | $(0.32 | ) |
Net asset value, end of period (x) | | | $11.82 | | | | $11.04 | | | | $10.78 | | | | $9.59 | | | | $6.87 | |
Total return (%) (r)(s)(x) | | | 10.39 | | | | 5.83 | | | | 17.09 | | | | 46.82 | | | | (27.27 | )(n) |
Ratios (%) (to average net assets)
and Supplemental data: | | | | | | | | | | | | | | | | | | | | |
Expenses before expense reductions (f) | | | 1.34 | | | | 1.35 | | | | 1.40 | | | | 1.45 | | | | 1.48 | (a) |
Expenses after expense reductions (f) | | | 1.34 | | | | 1.35 | | | | 1.30 | | | | 1.19 | | | | 1.15 | (a) |
Net investment income | | | 2.59 | | | | 2.93 | | | | 3.83 | | | | 4.74 | | | | 5.26 | (a) |
Portfolio turnover | | | 64 | | | | 64 | | | | 59 | | | | 79 | | | | 80 | (n) |
Net assets at end of period (000 omitted) | | | $702 | | | | $212 | | | | $125 | | | | $107 | | | | $73 | |
See Notes to Financial Statements
49
Financial Highlights – continued
| | | | | | | | | | | | | | | | | | | | |
| Class R3 | | Years ended 2/28, 2/29 | |
| | | 2013 | | | 2012 | | | 2011 | | | 2010 | | | 2009 (i) | |
Net asset value, beginning of period | | | $11.05 | | | | $10.79 | | | | $9.59 | | | | $6.88 | | | | $9.84 | |
| Income (loss) from investment operations | | | | | | | | | | | | | | | | | | | | |
Net investment income (d) | | | $0.31 | | | | $0.34 | | | | $0.41 | | | | $0.43 | | | | $0.31 | |
Net realized and unrealized gain (loss)
on investments and foreign currency | | | 0.85 | | | | 0.30 | | | | 1.23 | | | | 2.74 | | | | (2.93 | ) |
Total from investment operations | | | $1.16 | | | | $0.64 | | | | $1.64 | | | | $3.17 | | | | $(2.62 | ) |
| Less distributions declared to shareholders | | | | | | | | | | | | | | | | | | | | |
From net investment income | | | $(0.37 | ) | | | $(0.38 | ) | | | $(0.44 | ) | | | $(0.46 | ) | | | $(0.34 | ) |
From net realized gain on investments | | | (0.01 | ) | | | — | | | | — | | | | — | | | | — | |
Total distributions declared to shareholders | | | $(0.38 | ) | | | $(0.38 | ) | | | $(0.44 | ) | | | $(0.46 | ) | | | $(0.34 | ) |
Net asset value, end of period (x) | | | $11.83 | | | | $11.05 | | | | $10.79 | | | | $9.59 | | | | $6.88 | |
Total return (%) (r)(s)(x) | | | 10.65 | | | | 6.09 | | | | 17.48 | | | | 46.96 | | | | (27.12 | )(n) |
Ratios (%) (to average net assets)
and Supplemental data: | | | | | | | | | | | | | | | | | | | | |
Expenses before expense reductions (f) | | | 1.10 | | | | 1.10 | | | | 1.15 | | | | 1.20 | | | | 1.22 | (a) |
Expenses after expense reductions (f) | | | 1.10 | | | | 1.10 | | | | 1.06 | | | | 0.94 | | | | 0.90 | (a) |
Net investment income | | | 2.70 | | | | 3.17 | | | | 3.99 | | | | 4.99 | | | | 5.49 | (a) |
Portfolio turnover | | | 64 | | | | 64 | | | | 59 | | | | 79 | | | | 80 | (n) |
Net assets at end of period (000 omitted) | | | $2,783 | | | | $186 | | | | $185 | | | | $107 | | | | $73 | |
| |
| Class R4 | | Years ended 2/28, 2/29 | |
| | | 2013 | | | 2012 | | | 2011 | | | 2010 | | | 2009 (i) | |
Net asset value, beginning of period | | | $11.05 | | | | $10.79 | | | | $9.59 | | | | $6.88 | | | | $9.84 | |
| Income (loss) from investment operations | | | | | | | | | | | | | | | | | | | | |
Net investment income (d) | | | $0.36 | | | | $0.36 | | | | $0.44 | | | | $0.46 | | | | $0.32 | |
Net realized and unrealized gain (loss)
on investments and foreign currency | | | 0.82 | | | | 0.30 | | | | 1.23 | | | | 2.73 | | | | (2.93 | ) |
Total from investment operations | | | $1.18 | | | | $0.66 | | | | $1.67 | | | | $3.19 | | | | $(2.61 | ) |
| Less distributions declared to shareholders | | | | | | | | | | | | | | | | | | | | |
From net investment income | | | $(0.40 | ) | | | $(0.40 | ) | | | $(0.47 | ) | | | $(0.48 | ) | | | $(0.35 | ) |
From net realized gain on investments | | | (0.01 | ) | | | — | | | | — | | | | — | | | | — | |
Total distributions declared to shareholders | | | $(0.41 | ) | | | $(0.40 | ) | | | $(0.47 | ) | | | $(0.48 | ) | | | $(0.35 | ) |
Net asset value, end of period (x) | | | $11.82 | | | | $11.05 | | | | $10.79 | | | | $9.59 | | | | $6.88 | |
Total return (%) (r)(s)(x) | | | 10.83 | | | | 6.35 | | | | 17.78 | | | | 47.32 | | | | (26.99 | )(n) |
Ratios (%) (to average net assets)
and Supplemental data: | | | | | | | | | | | | | | | | | | | | |
Expenses before expense reductions (f) | | | 0.84 | | | | 0.85 | | | | 0.90 | | | | 0.95 | | | | 0.97 | (a) |
Expenses after expense reductions (f) | | | 0.84 | | | | 0.85 | | | | 0.80 | | | | 0.69 | | | | 0.65 | (a) |
Net investment income | | | 3.12 | | | | 3.40 | | | | 4.32 | | | | 5.24 | | | | 5.76 | (a) |
Portfolio turnover | | | 64 | | | | 64 | | | | 59 | | | | 79 | | | | 80 | (n) |
Net assets at end of period (000 omitted) | | | $1,159 | | | | $546 | | | | $127 | | | | $108 | | | | $73 | |
See Notes to Financial Statements
50
Financial Highlights – continued
| | | | |
| Class R5 | | Period ended
2/28/13 (i) | |
Net asset value, beginning of period | | | $11.16 | |
| Income (loss) from investment operations | | | | |
Net investment income (d) | | | $0.19 | |
Net realized and unrealized gain (loss) on investments and foreign currency | | | 0.75 | |
Total from investment operations | | | $0.94 | |
| Less distributions declared to shareholders | | | | |
From net investment income | | | $(0.27 | ) |
From net realized gain on investments | | | (0.01 | ) |
Total distributions declared to shareholders | | | $(0.28 | ) |
Net asset value, end of period (x) | | | $11.82 | |
Total return (%) (r)(s)(x) | | | 8.47 | (n) |
| Ratios (%) (to average net assets) and Supplemental data: | | | | |
Expenses before expense reductions (f) | | | 0.79 | (a) |
Expenses after expense reductions (f) | | | 0.79 | (a) |
Net investment income | | | 2.48 | (a) |
Portfolio turnover | | | 64 | (n) |
Net assets at end of period (000 omitted) | | | $1,393 | |
| (d) | Per share data is based on average shares outstanding. |
| (f) | Ratios do not reflect reductions from fees paid indirectly, if applicable. |
| (i) | For the period from the class’s inception, July 1, 2008 (Class R1, R2, R3, and R4) and July 2, 2012 (Class R5) through the stated period end. |
| (r) | Certain expenses have been reduced without which performance would have been lower. |
| (s) | From time to time the fund may receive proceeds from litigation settlements, without which performance would be lower. |
| (t) | Total returns do not include any applicable sales charges. |
| (x) | The net asset values per share and total returns have been calculated on net assets which include adjustments made in accordance with U.S. generally accepted accounting principles required at period end for financial reporting purposes. |
See Notes to Financial Statements
51
NOTES TO FINANCIAL STATEMENTS
(1) Business and Organization
MFS Diversified Income Fund (the fund) is a series of MFS Series Trust XIII (the “trust”). The trust is organized as a Massachusetts business trust and is registered under the Investment Company Act of 1940, as amended, as an open-end management investment company.
(2) Significant Accounting Policies
General – The preparation of financial statements in conformity with U.S. generally accepted accounting principles requires management to make estimates and assumptions that affect the reported amounts of assets and liabilities, and disclosure of contingent assets and liabilities at the date of the financial statements and the reported amounts of revenues and expenses during the reporting period. Actual results could differ from those estimates. In the preparation of these financial statements, management has evaluated subsequent events occurring after the date of the fund’s Statement of Assets and Liabilities through the date that the financial statements were issued. The fund invests in foreign securities, including securities of emerging market issuers. Investments in foreign securities are vulnerable to the effects of changes in the relative values of the local currency and the U.S. dollar and to the effects of changes in each country’s legal, political, and economic environment. The markets of emerging markets countries are generally more volatile than the markets of developed countries with more mature economies. All of the risks of investing in foreign securities previously described are heightened when investing in emerging markets countries.
In this reporting period the fund adopted Financial Accounting Standards Board (FASB) Accounting Standards Update 2011-04, Fair Value Measurement (Topic 820) – Amendments to Achieve Common Fair Value Measurement and Disclosure Requirements in U.S. GAAP and IFRSs (“ASU 2011-04”). ASU 2011-04 seeks to improve the comparability of fair value measurements as presented and disclosed in financial statements prepared in accordance with U.S. GAAP and International Financial Reporting Standards (IFRS) by providing common requirements for fair value measurement and disclosure.
In January 2013, the FASB issued Accounting Standards Update 2013-01 (“ASU 2013-01”) entitled Balance Sheet (Topic 210) – Clarifying the Scope of Disclosures about Offsetting Assets and Liabilities which is intended to clarify the scope of Accounting Standards Update 2011-11 (“ASU 2011-11”), Balance Sheet (Topic 210) – Disclosures about Offsetting Assets and Liabilities. Consistent with the effective date for ASU 2011-11, ASU 2013-01 is effective for annual reporting periods beginning on or after January 1, 2013, and interim periods within those annual periods. ASU 2013-01 limits the scope of ASU 2011-11’s disclosure requirements on offsetting to financial assets and financial liabilities related to derivatives, repurchase and reverse repurchase agreements, and securities lending and securities borrowing transactions. Although still evaluating the potential impact of these two ASUs to the fund, management expects that the impact of the fund’s adoption will be limited to additional financial statement disclosures.
Investment Valuations – Equity securities, including restricted equity securities, are generally valued at the last sale or official closing price as provided by a third-party
52
Notes to Financial Statements – continued
pricing service on the market or exchange on which they are primarily traded. Equity securities, for which there were no sales reported that day, are generally valued at the last quoted daily bid quotation as provided by a third-party pricing service on the market or exchange on which such securities are primarily traded. Debt instruments and floating rate loans (other than short-term instruments), including restricted debt instruments, are generally valued at an evaluated or composite bid as provided by a third-party pricing service. Short-term instruments with a maturity at issuance of 60 days or less generally are valued at amortized cost, which approximates market value. Exchange-traded options are generally valued at the last sale or official closing price as provided by a third-party pricing service on the exchange on which such options are primarily traded. Exchange-traded options for which there were no sales reported that day are generally valued at the last daily bid quotation as provided by a third-party pricing service on the exchange on which such options are primarily traded. Options not traded on an exchange are generally valued at a broker/dealer bid quotation. Foreign currency options are generally valued at valuations provided by a third-party pricing service. Futures contracts are generally valued at last posted settlement price as provided by a third-party pricing service on the market on which they are primarily traded. Futures contracts for which there were no trades that day for a particular position are generally valued at the closing bid quotation as provided by a third-party pricing service on the market on which such futures contracts are primarily traded. Forward foreign currency exchange contracts are generally valued at the mean of bid and asked prices for the time period interpolated from rates provided by a third-party pricing service for proximate time periods. Swap agreements are generally valued at valuations provided by a third-party pricing service. Open-end investment companies are generally valued at net asset value per share. Securities and other assets generally valued on the basis of information from a third-party pricing service may also be valued at a broker/dealer bid quotation. Values obtained from third-party pricing services can utilize both transaction data and market information such as yield, quality, coupon rate, maturity, type of issue, trading characteristics, and other market data. The values of foreign securities and other assets and liabilities expressed in foreign currencies are converted to U.S. dollars using the mean of bid and asked prices for rates provided by a third-party pricing service.
The Board of Trustees has delegated primary responsibility for determining or causing to be determined the value of the fund’s investments (including any fair valuation) to the adviser pursuant to valuation policies and procedures approved by the Board. If the adviser determines that reliable market quotations are not readily available, investments are valued at fair value as determined in good faith by the adviser in accordance with such procedures under the oversight of the Board of Trustees. Under the fund’s valuation policies and procedures, market quotations are not considered to be readily available for most types of debt instruments and floating rate loans and many types of derivatives. These investments are generally valued at fair value based on information from third-party pricing services. In addition, investments may be valued at fair value if the adviser determines that an investment’s value has been materially affected by events occurring after the close of the exchange or market on which the investment is principally traded (such as foreign exchange or market) and prior to the determination of the fund’s net asset value, or after the halting of trading of a specific security where
53
Notes to Financial Statements – continued
trading does not resume prior to the close of the exchange or market on which the security is principally traded. Events that occur on a frequent basis after foreign markets close (such as developments in foreign markets and significant movements in the U.S. markets) and prior to the determination of the fund’s net asset value may be deemed to have a material effect on the value of securities traded in foreign markets. Accordingly, the fund’s foreign equity securities may often be valued at fair value. The adviser generally relies on third-party pricing services or other information (such as the correlation with price movements of similar securities in the same or other markets; the type, cost and investment characteristics of the security; the business and financial condition of the issuer; and trading and other market data) to assist in determining whether to fair value and at what value to fair value an investment. The value of an investment for purposes of calculating the fund’s net asset value can differ depending on the source and method used to determine value. When fair valuation is used, the value of an investment used to determine the fund’s net asset value may differ from quoted or published prices for the same investment. There can be no assurance that the fund could obtain the fair value assigned to an investment if it were to sell the investment at the same time at which the fund determines its net asset value per share.
Various inputs are used in determining the value of the fund’s assets or liabilities. These inputs are categorized into three broad levels. In certain cases, the inputs used to measure fair value may fall into different levels of the fair value hierarchy. In such cases, an investment’s level within the fair value hierarchy is based on the lowest level of input that is significant to the fair value measurement. The fund’s assessment of the significance of a particular input to the fair value measurement in its entirety requires judgment, and considers factors specific to the investment. Level 1 includes unadjusted quoted prices in active markets for identical assets or liabilities. Level 2 includes other significant observable market-based inputs (including quoted prices for similar securities, interest rates, prepayment speed, and credit risk). Level 3 includes unobservable inputs, which may include the adviser’s own assumptions in determining the fair value of investments. Other financial instruments are derivative instruments not reflected in total investments, such as forward foreign currency exchange contracts and swap agreements.
54
Notes to Financial Statements – continued
The following is a summary of the levels used as of February 28, 2013 in valuing the fund’s assets or liabilities:
| | | | | | | | | | | | | | | | |
| Investments at Value | | Level 1 | | | Level 2 | | | Level 3 | | | Total | |
| Equity Securities | | | | | | | | | | | | | | | | |
United States | | | $638,952,588 | | | | $961,316 | | | | $35,091 | | | | $639,948,995 | |
United Kingdom | | | 2,613,676 | | | | — | | | | — | | | | 2,613,676 | |
Austria | | | 2,706,525 | | | | — | | | | — | | | | 2,706,525 | |
| U.S. Treasury Bonds & U.S. Government Agency & Equivalents | | | — | | | | 122,864,910 | | | | — | | | | 122,864,910 | |
| Non-U.S. Sovereign Debt | | | — | | | | 143,126,271 | | | | — | | | | 143,126,271 | |
| Municipal Bonds | | | — | | | | 590,627 | | | | — | | | | 590,627 | |
| U.S. Corporate Bonds | | | — | | | | 263,809,734 | | | | — | | | | 263,809,734 | |
| Residential Mortgage-Backed Securities | | | — | | | | 137,988,850 | | | | — | | | | 137,988,850 | |
| Commercial Mortgage-Backed Securities | | | — | | | | 2,936,932 | | | | — | | | | 2,936,932 | |
| Asset-Backed Securities (including CDOs) | | | — | | | | 125,278 | | | | — | | | | 125,278 | |
| Foreign Bonds | | | — | | | | 139,294,453 | | | | — | | | | 139,294,453 | |
| Floating Rate Loans | | | — | | | | 1,325,954 | | | | — | | | | 1,325,954 | |
| Short Term Securities | | | — | | | | 4,916,646 | | | | — | | | | 4,916,646 | |
| Mutual Funds | | | 154,459,260 | | | | — | | | | — | | | | 154,459,260 | |
| Total Investments | | | $798,732,049 | | | | $817,940,971 | | | | $35,091 | | | | $1,616,708,111 | |
| Swap Agreements | | | $— | | | | $(1,534,210 | ) | | | $— | | | | $(1,534,210 | ) |
| Forward Foreign Currency Exchange Contracts | | | — | | | | 9,071 | | | | — | | | | 9,071 | |
For further information regarding security characteristics, see the Portfolio of Investments.
The following is a reconciliation of level 3 assets for which significant unobservable inputs were used to determine fair value. The fund’s policy is to recognize transfers between the levels as of the end of the period. The table presents the activity of level 3 securities held at the beginning and the end of the period.
| | | | |
| | | Equity Securities | |
| Balance as of 2/29/12 | | | $79,473 | |
Change in unrealized appreciation (depreciation) | | | (44,382 | ) |
| Balance as of 2/28/13 | | | $35,091 | |
The net change in unrealized appreciation (depreciation) from investments still held as level 3 at February 28, 2013 is $(44,382).
Repurchase Agreements – The fund entered into repurchase agreements with approved counterparties. Each repurchase agreement is recorded at cost. The fund requires that the securities collateral in a repurchase transaction be transferred to a
55
Notes to Financial Statements – continued
custodian. The fund monitors, on a daily basis, the value of the collateral to ensure that its value, including accrued interest, is greater than amounts owed to the fund under each such repurchase agreement.
Foreign Currency Translation – Purchases and sales of foreign investments, income, and expenses are converted into U.S. dollars based upon currency exchange rates prevailing on the respective dates of such transactions or on the reporting date for foreign denominated receivables and payables. Gains and losses attributable to foreign currency exchange rates on sales of securities are recorded for financial statement purposes as net realized gains and losses on investments. Gains and losses attributable to foreign exchange rate movements on receivables, payables, income and expenses are recorded for financial statement purposes as foreign currency transaction gains and losses. That portion of both realized and unrealized gains and losses on investments that results from fluctuations in foreign currency exchange rates is not separately disclosed.
Derivatives – The fund uses derivatives for different purposes, primarily to increase or decrease exposure to a particular market or segment of the market, or security, to increase or decrease interest rate or currency exposure, or as alternatives to direct investments. Derivatives are used for hedging or non-hedging purposes. While hedging can reduce or eliminate losses, it can also reduce or eliminate gains. When the fund uses derivatives as an investment to increase market exposure, or for hedging purposes, gains and losses from derivative instruments may be substantially greater than the derivative’s original cost.
The derivative instruments used by the fund were purchased options, futures contracts, forward foreign currency exchange contracts, and swap agreements. The fund’s period end derivatives, as presented in the Portfolio of Investments and the associated Derivative Contract tables, generally are indicative of the volume of its derivative activity during the period. The following table presents, by major type of derivative contract, the fair value, on a gross basis, of the asset and liability components of derivatives held by the fund at February 28, 2013 as reported in the Statement of Assets and Liabilities:
| | | | | | | | | | |
| | | | | Fair Value (a) | |
| Risk | | Derivative Contracts | | Asset Derivatives | | | Liability Derivatives | |
| Foreign Exchange | | Forward Foreign Currency Exchange | | | $9,071 | | | | $— | |
| Equity | | Purchased Equity Options | | | 737,055 | | | | — | |
| Credit | | Credit Default Swaps | | | — | | | | (1,534,210 | ) |
| Total | | | | | $746,126 | | | $ | (1,534,210 | ) |
| (a) | The value of purchased options outstanding is included in total investments, at value, within the fund’s Statement of Assets and Liabilities. |
56
Notes to Financial Statements – continued
The following table presents, by major type of derivative contract, the realized gain (loss) on derivatives held by the fund for the year ended February 28, 2013 as reported in the Statement of Operations:
| | | | | | | | | | | | | | | | |
| Risk | | Futures
Contracts | | | Swap
Agreements | | | Foreign
Currency | | | Investments
(Purchased
Options) | |
| Interest Rate | | | $20,597 | | | | $— | | | | $— | | | | $— | |
| Foreign Exchange | | | — | | | | — | | | | (35,040 | ) | | | — | |
| Equity | | | — | | | | — | | | | — | | | | (1,475,336 | ) |
| Credit | | | — | | | | (20,949 | ) | | | — | | | | — | |
| Total | | | $20,597 | | | | $(20,949 | ) | | | $(35,040 | ) | | | $(1,475,336 | ) |
The following table presents, by major type of derivative contract, the change in unrealized appreciation (depreciation) on derivatives held by the fund for the year ended February 28, 2013 as reported in the Statement of Operations:
| | | | | | | | | | | | | | | | |
| Risk | | Futures
Contracts | | | Swap
Agreements | | | Translation of Assets and Liabilities in Foreign
Currencies | | | Investments
(Purchased
Options) | |
| Interest Rate | | | $340 | | | | $— | | | | $— | | | | $— | |
| Foreign Exchange | | | — | | | | — | | | | 71,303 | | | | — | |
| Equity | | | — | | | | — | | | | — | | | | (494,264 | ) |
| Credit | | | — | | | | (147,397 | ) | | | — | | | | — | |
| Total | | | $340 | | | | $(147,397 | ) | | | $71,303 | | | | $(494,264 | ) |
Derivative counterparty credit risk is managed through formal evaluation of the creditworthiness of all potential counterparties. On certain over-the-counter derivatives, the fund attempts to reduce its exposure to counterparty credit risk whenever possible by entering into an International Swaps and Derivatives Association (ISDA) Master Agreement on a bilateral basis with each of the counterparties with whom it undertakes a significant volume of transactions. The ISDA Master Agreement gives each party to the agreement the right to terminate all transactions traded under such agreement if there is a certain deterioration in the credit quality of the other party. The ISDA Master Agreement gives the fund the right, upon an event of default by the applicable counterparty or a termination of the agreement, to close out all transactions traded under such agreement and to net amounts owed under each transaction to one net amount payable by one party to the other. This right to close out and net payments across all transactions traded under the ISDA Master Agreement could result in a reduction of the fund’s credit risk to such counterparty equal to any amounts payable by the fund under the applicable transactions, if any. However, absent an event of default by the counterparty or a termination of the agreement, the ISDA Master Agreement does not result in an offset of reported amounts of assets and liabilities in the Statement of Assets and Liabilities across transactions between the fund and the applicable counterparty.
Collateral requirements differ by type of derivative. Collateral or margin requirements are set by the broker or exchange clearing house for exchange traded derivatives (i.e., futures contracts and exchange-traded options) while collateral terms are contract
57
Notes to Financial Statements – continued
specific for over-the-counter traded derivatives (i.e., forward foreign currency exchange contracts, swap agreements and over-the-counter options). For derivatives traded under an ISDA Master Agreement, the collateral requirements are netted across all transactions traded under such agreement and one amount is posted from one party to the other to collateralize such obligations. Cash collateral that has been pledged to cover obligations of the fund under derivative contracts, if any, will be reported separately in the Statement of Assets and Liabilities as “Restricted cash” Securities collateral pledged for the same purpose, if any, is noted in the Portfolio of Investments.
Purchased Options – The fund purchased call and put options for a premium. Purchased call and put options entitle the holder to buy and sell a specified number of shares or units of a particular security, currency or index at a specified price at a specified date or within a specified period of time. Purchasing call options may hedge against an anticipated increase in the dollar cost of securities or currency to be acquired or increase the fund’s exposure to an underlying instrument. Purchasing put options may hedge against an anticipated decline in the value of portfolio securities or currency or decrease the fund’s exposure to an underlying instrument.
The premium paid is initially recorded as an investment in the Statement of Assets and Liabilities. That investment is subsequently marked-to-market daily with the difference between the premium paid and the market value of the purchased option being recorded as unrealized appreciation or depreciation. Premiums paid for purchased call and put options which have expired are treated as realized losses on investments in the Statement of Operations. Upon the exercise or closing of a purchased call option, the premium paid is added to the cost of the security or financial instrument purchased. Upon the exercise or closing of a purchased put option, the premium paid is offset against the proceeds on the sale of the underlying security or financial instrument in order to determine the realized gain or loss on investments.
Whether or not the option is exercised, the fund’s maximum risk of loss from purchasing an option is the amount of premium paid. All option contracts involve credit risk if the counterparty to the option contract fails to perform. For over-the-counter options, this risk is mitigated in cases where there is an ISDA Master Agreement between the fund and the counterparty providing for netting as described above and for posting of collateral by the counterparty to the fund to cover the fund’s exposure to the counterparty under such ISDA Master Agreement.
Futures Contracts – The fund entered into futures contracts which may be used to hedge against or obtain broad market exposure, interest rate exposure, currency exposure, or to manage duration. A futures contract represents a commitment for the future purchase or sale of an asset at a specified price on a specified date.
Upon entering into a futures contract, the fund is required to deposit with the broker, either in cash or securities, an initial margin in an amount equal to a certain percentage of the notional amount of the contract. Subsequent payments (variation margin) are made or received by the fund each day, depending on the daily fluctuations in the value of the contract, and are recorded for financial statement purposes as unrealized gain or loss by the fund until the contract is closed or expires at which point the gain or loss on futures contracts is realized.
58
Notes to Financial Statements – continued
The fund bears the risk of interest rates, exchange rates or securities prices moving unexpectedly, in which case, the fund may not achieve the anticipated benefits of the futures contracts and may realize a loss. While futures contracts may present less counterparty risk to the fund since the contracts are exchange traded and the exchange’s clearinghouse guarantees payments to the broker, there is still counterparty credit risk due to the insolvency of the broker. The fund’s maximum risk of loss due to counterparty credit risk is equal to the margin posted by the fund to the broker plus any gains or minus any losses on the outstanding futures contracts.
Forward Foreign Currency Exchange Contracts – The fund entered into forward foreign currency exchange contracts for the purchase or sale of a specific foreign currency at a fixed price on a future date. These contracts may be used to hedge the fund’s currency risk or for non-hedging purposes. For hedging purposes, the fund may enter into contracts to deliver or receive foreign currency that the fund will receive from or use in its normal investment activities. The fund may also use contracts to hedge against declines in the value of foreign currency denominated securities due to unfavorable exchange rate movements. For non-hedging purposes, the fund may enter into contracts with the intent of changing the relative exposure of the fund’s portfolio of securities to different currencies to take advantage of anticipated exchange rate changes.
Forward foreign currency exchange contracts are adjusted by the daily exchange rate of the underlying currency and any unrealized gains or losses are recorded as a receivable or payable for forward foreign currency exchange contracts until the contract settlement date. On contract settlement date, any gain or loss on the contract is recorded as realized gains or losses on foreign currency.
Risks may arise upon entering into these contracts from unanticipated movements in the value of the contract and from the potential inability of counterparties to meet the terms of their contracts. Generally, the fund’s maximum risk due to counterparty credit risk is the unrealized gain on the contract due to the use of Continuous Linked Settlement, an industry accepted settlement system. This risk is mitigated in cases where there is an ISDA Master Agreement between the fund and the counterparty providing for netting as described above and for posting of collateral by the counterparty to the fund to cover the fund’s exposure to the counterparty under such ISDA Master Agreement.
Swap Agreements – The fund entered into swap agreements. A swap agreement is generally an exchange of cash payments, at specified intervals or upon the occurrence of specified events, between the fund and a counterparty. The net cash payments exchanged are recorded as a realized gain or loss on swap agreements in the Statement of Operations. The value of the swap agreement, which is adjusted daily and includes any related interest accruals to be paid or received by the fund, is recorded in the Statement of Assets and Liabilities. The daily change in value, including any related interest accruals to be paid or received, is recorded as unrealized appreciation or depreciation on swap agreements in the Statement of Operations. Amounts paid or received at the inception of the swap agreement are reflected as premiums paid or received in the Statement of Assets and Liabilities and are amortized using the effective interest method over the term of the agreement. A liquidation payment received or made upon early termination is recorded as a realized gain or loss on swap agreements in the Statement of Operations.
59
Notes to Financial Statements – continued
Risks related to swap agreements include the possible lack of a liquid market, unfavorable market and interest rate movements of the underlying instrument and the failure of the counterparty to perform under the terms of the agreements. To address counterparty risk, swap agreements are limited to only highly-rated counterparties. The risk is further mitigated by having an ISDA Master Agreement between the fund and the counterparty providing for netting as described above and by the posting of collateral by the counterparty to the fund to cover the fund’s exposure to the counterparty under such ISDA Master Agreement.
The fund entered into credit default swap agreements in order to manage its exposure to the market or certain sectors of the market, to reduce its credit risk exposure to defaults of corporate and sovereign issuers or to create exposure to corporate or sovereign issuers to which it is not otherwise exposed. In a credit default swap agreement, the protection buyer can make an upfront payment and will make a stream of payments based on a fixed percentage applied to the agreement notional amount to the protection seller in exchange for the right to receive a specified return upon the occurrence of a defined credit event on the reference obligation (which may be either a single security or a basket of securities issued by corporate or sovereign issuers) and, with respect to the rare cases where physical settlement applies, the delivery by the buyer to the seller of a defined deliverable obligation. Although agreement-specific, credit events generally consist of a combination of the following: bankruptcy, failure to pay, restructuring, obligation acceleration, obligation default, or repudiation/moratorium, each as defined in the 2003 ISDA Credit Derivatives Definitions as amended by the relevant agreement. Restructuring is generally not applicable when the reference obligation is issued by a North American corporation and obligation acceleration, obligation default, or repudiation/moratorium are generally only applicable when the reference obligation is issued by a sovereign entity or an entity in an emerging country. Upon determination of the final price for the deliverable obligation (or upon delivery of the deliverable obligation in the case of physical settlement), the difference between the value of the deliverable obligation and the swap agreement’s notional amount is recorded as realized gain or loss on swap agreements in the Statement of Operations.
Credit default swap agreements are considered to have credit-risk-related contingent features since they trigger payment by the protection seller to the protection buyer upon the occurrence of a defined credit event. The aggregate fair value of credit default swap agreements in a net liability position as of February 28, 2013 is disclosed in the footnotes to the Portfolio of Investments. As discussed earlier in this note, collateral requirements for these swap agreements are based generally on the market value of the swap agreement netted against collateral requirements for other types of over-the-counter derivatives traded under each counterparty’s ISDA Master Agreement. The maximum amount of future, undiscounted payments that the fund, as protection seller, could be required to make is equal to the swap agreement’s notional amount. The protection seller’s payment obligation would be offset to the extent of the value of the agreement’s deliverable obligation. If a defined credit event had occurred as of February 28, 2013, the swap agreement’s credit-risk-related contingent features would have been triggered and, for those swap agreements in a net liability position for which the fund is the protection seller, the fund in order to settle these swap agreements
60
Notes to Financial Statements – continued
would have been required to either (1) pay the swap agreement’s notional value of $26,257,000 less the value of the agreements’ related deliverable obligations as decided through an ISDA auction or (2) pay the notional value of the swap agreements in return for physical receipt of the deliverable obligations.
The fund’s maximum risk of loss from counterparty risk, either as the protection seller or as the protection buyer, is the fair value of the agreement. This risk is mitigated by having an ISDA Master Agreement between the fund and the counterparty providing for netting as described above and by the posting of collateral by the counterparty to the fund to cover the fund’s exposure to the counterparty under such ISDA Master Agreement.
Security Loans – JPMorgan Chase and Co. (“Chase”), as lending agent, loans the securities of the fund to certain qualified institutions (the “Borrowers”) approved by the fund. The loans are collateralized by cash and/or U.S. Treasury and federal agency obligations in an amount typically at least equal to the market value of the securities loaned. The market value of the loaned securities is determined at the close of business of the fund and any additional required collateral is delivered to the fund on the next business day. Chase provides the fund with indemnification against Borrower default. The fund bears the risk of loss with respect to the investment of cash collateral. On loans collateralized by cash, the cash collateral is invested in short-term securities. A portion of the income generated upon investment of the collateral is remitted to the Borrowers, and the remainder is allocated between the fund and the lending agent. On loans collateralized by U.S. Treasury and/or federal agency obligations, a fee is received from the Borrower, and is allocated between the fund and the lending agent. Income from securities lending is included in “Interest” income in the Statement of Operations. The dividend and interest income earned on the securities loaned is accounted for in the same manner as other dividend and interest income.
Loans and Other Direct Debt Instruments – The fund invests in loans and loan participations or other receivables. These investments may include standby financing commitments, including revolving credit facilities, which obligate the fund to supply additional cash to the borrower on demand. Loan participations involve a risk of insolvency of the lending bank or other financial intermediary.
Indemnifications – Under the fund’s organizational documents, its officers and Trustees may be indemnified against certain liabilities and expenses arising out of the performance of their duties to the fund. Additionally, in the normal course of business, the fund enters into agreements with service providers that may contain indemnification clauses. The fund’s maximum exposure under these agreements is unknown as this would involve future claims that may be made against the fund that have not yet occurred.
Investment Transactions and Income – Investment transactions are recorded on the trade date. Interest income is recorded on the accrual basis. All premium and discount is amortized or accreted for financial statement purposes in accordance with U.S. generally accepted accounting principles. The fund earns certain fees in connection with its floating rate loan purchasing activities. These fees are in addition to interest payments earned and may include amendment fees, commitment fees, facility fees, consent fees, and prepayment fees. Commitment fees are recorded on an accrual basis
61
Notes to Financial Statements – continued
as income in the accompanying financial statements. Dividends received in cash are recorded on the ex-dividend date. Certain dividends from foreign securities will be recorded when the fund is informed of the dividend if such information is obtained subsequent to the ex-dividend date. Dividend and interest payments received in additional securities are recorded on the ex-dividend or ex-interest date in an amount equal to the value of the security on such date. Debt obligations may be placed on non-accrual status or set to accrue at a rate of interest less than the contractual coupon when the collection of all or a portion of interest has become doubtful. Interest income for those debt obligations may be further reduced by the write-off of the related interest receivables when deemed uncollectible.
The fund may receive proceeds from litigation settlements. Any proceeds received from litigation involving portfolio holdings are reflected in the Statement of Operations in realized gain/loss if the security has been disposed of by the fund or in unrealized gain/loss if the security is still held by the fund. Any other proceeds from litigation not related to portfolio holdings are reflected as other income in the Statement of Operations.
The fund purchased or sold debt securities on a when-issued or delayed delivery basis, or in a “To Be Announced” (TBA) or “forward commitment” transaction with delivery or payment to occur at a later date beyond the normal settlement period. TBA securities resulting from these transactions are included in the Portfolio of Investments. At the time a fund enters into a commitment to purchase or sell a security, the transaction is recorded and the value of the security acquired is reflected in the fund’s net asset value. The price of such security and the date that the security will be delivered and paid for are fixed at the time the transaction is negotiated. The value of the security may vary with market fluctuations. No interest accrues to the fund until payment takes place. At the time that a fund enters into this type of transaction, the fund is required to have sufficient cash and/or liquid securities to cover its commitments. Losses may arise due to changes in the value of the underlying securities or if the counterparty does not perform under the contract’s terms, or if the issuer does not issue the securities due to political, economic or other factors. Additionally, losses may arise due to declines in the value of the securities prior to settlement date.
Fees Paid Indirectly – The fund’s custody fee may be reduced according to an arrangement that measures the value of cash deposited with the custodian by the fund. This amount, for the year ended February 28, 2013, is shown as a reduction of total expenses in the Statement of Operations.
Tax Matters and Distributions – The fund intends to qualify as a regulated investment company, as defined under Subchapter M of the Internal Revenue Code, and to distribute all of its taxable income, including realized capital gains. As a result, no provision for federal income tax is required. The fund’s federal tax returns, when filed, will remain subject to examination by the Internal Revenue Service for a three year period. Foreign taxes have been accrued by the fund in the accompanying financial statements.
Distributions to shareholders are recorded on the ex-dividend date. Income and capital gain distributions are determined in accordance with income tax regulations, which may differ from U.S. generally accepted accounting principles. Certain capital accounts
62
Notes to Financial Statements – continued
in the financial statements are periodically adjusted for permanent differences in order to reflect their tax character. These adjustments have no impact on net assets or net asset value per share. Temporary differences which arise from recognizing certain items of income, expense, gain or loss in different periods for financial statement and tax purposes will reverse at some time in the future. Distributions in excess of net investment income or net realized gains are temporary overdistributions for financial statement purposes resulting from differences in the recognition or classification of income or distributions for financial statement and tax purposes.
Book/tax differences primarily relate to amortization and accretion of debt securities, wash sale loss deferrals, and treating a portion of the proceeds from redemptions as a distribution for tax purposes.
The tax character of distributions declared to shareholders for the last two fiscal years is as follows:
| | | | | | | | |
| | | 2/28/13 | | | 2/29/12 | |
| Ordinary income (including any short-term capital gains) | | | $34,119,558 | | | | $19,225,635 | |
| Long-term capital gains | | | 1,043,035 | | | | — | |
| Total distributions | | | $35,162,593 | | | | $19,225,635 | |
The federal tax cost and the tax basis components of distributable earnings were as follows:
| | | | |
| As of 2/28/2013 | | | |
| Cost of investments | | | $1,524,953,096 | |
| Gross appreciation | | | 100,727,014 | |
| Gross depreciation | | | (8,971,999 | ) |
| Net unrealized appreciation (depreciation) | | | $91,755,015 | |
| Undistributed ordinary income | | | 1,318,305 | |
| Undistributed long-term capital gain | | | 4,199,580 | |
| Other temporary differences | | | (3,551,635 | ) |
Multiple Classes of Shares of Beneficial Interest – The fund offers multiple classes of shares, which differ in their respective distribution and/or service fees. The fund’s income and common expenses are allocated to shareholders based on the value of settled shares outstanding of each class. The fund’s realized and unrealized gain (loss) are allocated to shareholders based on the daily net assets of each class. Dividends are declared separately for each class. Differences in per share dividend rates are generally
63
Notes to Financial Statements – continued
due to differences in separate class expenses. The fund’s distributions declared to shareholders as reported in the Statements of Changes in Net Assets are presented by class as follows:
| | | | | | | | | | | | | | | | |
| | | From net investment
income | | | From net realized gain on
investments | |
| | | Year
ended
2/28/13 (i) | | | Year
ended
2/29/12 | | | Year
ended
2/28/13 (i) | | | Year
ended
2/29/12 | |
| Class A | | | $19,218,114 | | | | $11,734,259 | | | | $541,503 | | | | $— | |
| Class C | | | 8,439,963 | | | | 5,043,685 | | | | 319,214 | | | | — | |
| Class I | | | 6,376,885 | | | | 2,427,158 | | | | 179,492 | | | | — | |
| Class R1 | | | 4,540 | | | | 3,641 | | | | 123 | | | | — | |
| Class R2 | | | 13,081 | | | | 5,164 | | | | 562 | | | | — | |
| Class R3 | | | 27,427 | | | | 5,881 | | | | 1,315 | | | | — | |
| Class R4 | | | 26,771 | | | | 5,847 | | | | 743 | | | | — | |
| Class R5 | | | 12,777 | | | | — | | | | 83 | | | | — | |
| Total | | | $34,119,558 | | | | $19,225,635 | | | | $1,043,035 | | | | $— | |
| (i) | For Class R5, the period is from inception, July 2, 2012, through the stated period end. |
(3) Transactions with Affiliates
Investment Adviser – The fund has an investment advisory agreement with MFS to provide overall investment management and related administrative services and facilities to the fund.
The management fee is computed daily and paid monthly at an annual rate of 0.65% of the fund’s average daily net assets. The investment adviser has agreed in writing to pay a portion of the fund’s total annual operating expenses, exclusive of interest, taxes, extraordinary expenses, brokerage and transaction costs, and investment-related expense, such that total fund operating expenses do not exceed the following rates annually of each class’s average daily net assets.
| | | | | | | | | | | | | | | | | | | | | | | | | | | | | | |
| Class A | | | Class C | | | Class I | | | Class R1 | | | Class R2 | | | Class R3 | | | Class R4 | | | Class R5 | |
| | 1.10% | | | | 1.85 | % | | | 0.85 | % | | | 1.85 | % | | | 1.35 | % | | | 1.10 | % | | | 0.85 | % | | | 0.79 | % |
This written agreement will continue until modified by the fund’s Board of Trustees, but such agreement will continue at least until June 30, 2014. For the year ended February 28, 2013, the fund’s actual operating expenses did not exceed the limit and therefore, the investment adviser did not pay any portion of the fund’s expenses related to this agreement.
Distributor – MFS Fund Distributors, Inc. (MFD), a wholly-owned subsidiary of MFS, as distributor, received $1,456,607 for the year ended February 28, 2013, as its portion of the initial sales charge on sales of Class A shares of the fund.
The Board of Trustees has adopted a distribution plan for certain class shares pursuant to Rule 12b-1 of the Investment Company Act of 1940.
The fund’s distribution plan provides that the fund will pay MFD for services provided by MFD and financial intermediaries in connection with the distribution and servicing of certain share classes. One component of the plan is a distribution fee paid to MFD and another component of the plan is a service fee paid to MFD. MFD may subsequently pay all, or a portion, of the distribution and/or service fees to financial intermediaries.
64
Notes to Financial Statements – continued
Distribution Plan Fee Table:
| | | | | | | | | | | | | | | | | | | | |
| | | Distribution
Fee Rate (d) | | | Service
Fee Rate (d) | | | Total
Distribution
Plan (d) | | | Annual
Effective
Rate (e) | | | Distribution
and Service
Fee | |
| Class A | | | — | | | | 0.25% | | | | 0.25% | | | | 0.25% | | | | $1,491,729 | |
| Class C | | | 0.75% | | | | 0.25% | | | | 1.00% | | | | 1.00% | | | | 3,427,348 | |
| Class R1 | | | 0.75% | | | | 0.25% | | | | 1.00% | | | | 1.00% | | | | 1,854 | |
| Class R2 | | | 0.25% | | | | 0.25% | | | | 0.50% | | | | 0.50% | | | | 2,210 | |
| Class R3 | | | — | | | | 0.25% | | �� | | 0.25% | | | | 0.25% | | | | 2,166 | |
| Total Distribution and Service Fees | | | | | | | | | | | | $4,925,307 | |
| (d) | In accordance with the distribution plan for certain classes, the fund pays distribution and/or service fees equal to these annual percentage rates of each class’s average daily net assets. The distribution and service fee rates disclosed by class represent the current rates in effect at the end of the reporting period. |
| (e) | The annual effective rates represent actual fees incurred under the distribution plan for the year ended February 28, 2013 based on each class’s average daily net assets. |
Certain Class A shares are subject to a contingent deferred sales charge (CDSC) in the event of a shareholder redemption within 18 months of purchase for shares purchased on or after August 1, 2012, and within 24 months of purchase for shares purchased prior to August 1, 2012. Class C shares are subject to a CDSC in the event of a shareholder redemption within 12 months of purchase. All contingent deferred sales charges are paid to MFD and during the year ended February 28, 2013, were as follows:
| | | | |
| | | Amount | |
| Class A | | | $4,753 | |
| Class C | | | 12,934 | |
Shareholder Servicing Agent – MFS Service Center, Inc. (MFSC), a wholly-owned subsidiary of MFS, receives a fee from the fund for its services as shareholder servicing agent calculated as a percentage of the average daily net assets of the fund as determined periodically under the supervision of the fund’s Board of Trustees. For the year ended February 28, 2013, the fee was $170,957, which equated to 0.0152% annually of the fund’s average daily net assets. MFSC also receives payment from the fund for out-of-pocket expenses, sub-accounting and other shareholder servicing costs which may be paid to affiliated and unaffiliated service providers. Class R5 shares do not incur sub-accounting fees. For the year ended February 28, 2013, these out-of-pocket expenses, sub-accounting and other shareholder servicing costs amounted to $942,230.
Administrator – MFS provides certain financial, legal, shareholder communications, compliance, and other administrative services to the fund. Under an administrative services agreement, the fund partially reimburses MFS the costs incurred to provide these services. The fund is charged an annual fixed amount of $17,500 plus a fee based on average daily net assets. The administrative services fee incurred for the year ended February 28, 2013 was equivalent to an annual effective rate of 0.0145% of the fund’s average daily net assets.
65
Notes to Financial Statements – continued
Trustees’ and Officers’ Compensation – The fund pays compensation to independent Trustees in the form of a retainer, attendance fees, and additional compensation to Board and Committee chairpersons. The fund does not pay compensation directly to Trustees or officers of the fund who are also officers of the investment adviser, all of whom receive remuneration for their services to the fund from MFS. Certain officers and Trustees of the fund are officers or directors of MFS, MFD, and MFSC.
Other – This fund and certain other funds managed by MFS (the funds) have entered into services agreements (the Agreements) which provide for payment of fees by the funds to Tarantino LLC and Griffin Compliance LLC in return for the provision of services of an Independent Chief Compliance Officer (ICCO) and Assistant ICCO, respectively, for the funds. The ICCO and Assistant ICCO are officers of the funds and the sole members of Tarantino LLC and Griffin Compliance LLC, respectively. The funds can terminate the Agreements with Tarantino LLC and Griffin Compliance LLC at any time under the terms of the Agreements. For the year ended February 28, 2013, the aggregate fees paid by the fund to Tarantino LLC and Griffin Compliance LLC were $8,099 and are included in “Miscellaneous” expense in the Statement of Operations. MFS has agreed to reimburse the fund for a portion of the payments made by the fund in the amount of $3,406, which is shown as a reduction of total expenses in the Statement of Operations. Additionally, MFS has agreed to bear all expenses associated with office space, other administrative support, and supplies provided to the ICCO and Assistant ICCO.
The fund invests in the MFS Institutional Money Market Portfolio which is managed by MFS and seeks current income consistent with preservation of capital and liquidity. Income earned on this investment is included in “Dividends from underlying affiliated funds” in the Statement of Operations. This money market fund does not pay a management fee to MFS.
On June 29, 2012, MFS purchased 8,961 shares of Class R5 for an aggregate amount of $100,000.
(4) Portfolio Securities
Purchases and sales of investments, other than purchased option transactions and short-term obligations, were as follows:
| | | | | | | | |
| | | Purchases | | | Sales | |
| U.S. Government securities | | | $447,898,101 | | | | $292,833,818 | |
| Investments (non-U.S. Government securities) | | | $888,509,805 | | | | $388,512,393 | |
66
Notes to Financial Statements – continued
(5) Shares of Beneficial Interest
The fund’s Declaration of Trust permits the Trustees to issue an unlimited number of full and fractional shares of beneficial interest. Transactions in fund shares were as follows:
| | | | | | | | | | | | | | | | |
| | | Year ended
2/28/13 (i) | | | Year ended
2/29/12 | |
| | | Shares | | | Amount | | | Shares | | | Amount | |
| Shares sold | | | | | | | | | | | | | | | | |
Class A | | | 39,010,733 | | | | $445,021,889 | | | | 24,496,866 | | | | $261,103,830 | |
Class C | | | 20,912,199 | | | | 238,437,602 | | | | 10,945,785 | | | | 116,827,058 | |
Class I | | | 18,750,518 | | | | 214,021,509 | | | | 8,203,883 | | | | 87,535,336 | |
Class R1 | | | 18,494 | | | | 215,264 | | | | 774 | | | | 7,808 | |
Class R2 | | | 49,668 | | | | 564,782 | | | | 7,167 | | | | 77,286 | |
Class R3 | | | 256,335 | | | | 2,952,073 | | | | 2,090 | | | | 22,621 | |
Class R4 | | | 76,267 | | | | 861,319 | | | | 37,178 | | | | 408,303 | |
Class R5 | | | 167,077 | | | | 1,921,929 | | | | — | | | | — | |
| | | 79,241,291 | | | | $903,996,367 | | | | 43,693,743 | | | | $465,982,242 | |
| | | | |
| Shares issued to shareholders in reinvestment of distributions | | | | | | | | | | | | | | | | |
Class A | | | 1,563,324 | | | | $17,887,514 | | | | 939,008 | | | | $10,043,440 | |
Class C | | | 563,309 | | | | 6,443,965 | | | | 316,030 | | | | 3,378,617 | |
Class I | | | 357,156 | | | | 4,093,307 | | | | 118,669 | | | | 1,266,876 | |
Class R1 | | | 407 | | | | 4,663 | | | | 341 | | | | 3,641 | |
Class R2 | | | 1,189 | | | | 13,643 | | | | 482 | | | | 5,164 | |
Class R3 | | | 2,469 | | | | 28,633 | | | | 549 | | | | 5,881 | |
Class R4 | | | 2,335 | | | | 26,783 | | | | 544 | | | | 5,847 | |
Class R5 | | | 1,097 | | | | 12,854 | | | | — | | | | — | |
| | | 2,491,286 | | | | $28,511,362 | | | | 1,375,623 | | | | $14,709,466 | |
| | | | |
| Shares reacquired | | | | | | | | | | | | | | | | |
Class A | | | (13,592,609 | ) | | | $(154,248,250 | ) | | | (8,818,888 | ) | | | $(93,363,115 | ) |
Class C | | | (3,590,428 | ) | | | (40,947,374 | ) | | | (2,508,643 | ) | | | (26,575,246 | ) |
Class I | | | (4,105,545 | ) | | | (46,987,667 | ) | | | (2,477,765 | ) | | | (26,278,443 | ) |
Class R1 | | | (2 | ) | | | (26 | ) | | | (1 | ) | | | (7 | ) |
Class R2 | | | (10,691 | ) | | | (123,251 | ) | | | (23 | ) | | | (250 | ) |
Class R3 | | | (40,264 | ) | | | (465,152 | ) | | | (2,990 | ) | | | (32,716 | ) |
Class R4 | | | (29,968 | ) | | | (335,648 | ) | | | (34 | ) | | | (376 | ) |
Class R5 | | | (50,373 | ) | | | (592,076 | ) | | | — | | | | — | |
| | | (21,419,880 | ) | | | $(243,699,444 | ) | | | (13,808,344 | ) | | | $(146,250,153 | ) |
| Net change | | | | | | | | | | | | | | | | |
Class A | | | 26,981,448 | | | | $308,661,153 | | | | 16,616,986 | | | | $177,784,155 | |
Class C | | | 17,885,080 | | | | 203,934,193 | | | | 8,753,172 | | | | 93,630,429 | |
Class I | | | 15,002,129 | | | | 171,127,149 | | | | 5,844,787 | | | | 62,523,769 | |
Class R1 | | | 18,899 | | | | 219,901 | | | | 1,114 | | | | 11,442 | |
Class R2 | | | 40,166 | | | | 455,174 | | | | 7,626 | | | | 82,200 | |
Class R3 | | | 218,540 | | | | 2,515,554 | | | | (351 | ) | | | (4,214 | ) |
Class R4 | | | 48,634 | | | | 552,454 | | | | 37,688 | | | | 413,774 | |
Class R5 | | | 117,801 | | | | 1,342,707 | | | | — | | | | — | |
| | | 60,312,697 | | | | $688,808,285 | | | | 31,261,022 | | | | $334,441,555 | |
| (i) | For Class R5, the period is from inception, July 2, 2012, through the stated period end. |
67
Notes to Financial Statements – continued
(6) Line of Credit
The fund and certain other funds managed by MFS participate in a $1.1 billion unsecured committed line of credit, subject to a $1 billion sublimit, provided by a syndication of banks under a credit agreement. Borrowings may be made for temporary financing needs. Interest is charged to each fund, based on its borrowings, generally at a rate equal to the higher of the Federal Reserve funds rate or one month LIBOR plus an agreed upon spread. A commitment fee, based on the average daily, unused portion of the committed line of credit, is allocated among the participating funds at the end of each calendar quarter. In addition, the fund and other funds managed by MFS have established unsecured uncommitted borrowing arrangements with certain banks for temporary financing needs. Interest is charged to each fund, based on its borrowings, at a rate equal to the Federal Reserve funds rate plus an agreed upon spread. For the year ended February 28, 2013, the fund’s commitment fee and interest expense were $6,055 and $0, respectively, and are included in “Miscellaneous” expense in the Statement of Operations.
(7) Transactions in Underlying Affiliated Funds-Affiliated Issuers
An affiliated issuer may be considered one in which the fund owns 5% or more of the outstanding voting securities, or a company which is under common control. For the purposes of this report, the fund assumes the following to be an affiliated issuer:
| | | | | | | | | | | | | | | | |
| Underlying Affiliated Fund | | Beginning
Shares/Par
Amount | | | Acquisitions
Shares/Par
Amount | | | Dispositions
Shares/Par
Amount | | | Ending
Shares/Par
Amount | |
MFS Institutional Money
Market Portfolio | | | 34,744,532 | | | | 551,367,265 | | | | (431,652,537 | ) | | | 154,459,260 | |
| | | | |
| Underlying Affiliated Fund | | Realized
Gain (Loss) | | | Capital Gain
Distributions | | | Dividend
Income | | | Ending
Value | |
MFS Institutional Money
Market Portfolio | | | $— | | | | $— | | | | $136,496 | | | | $154,459,260 | |
(8) Subsequent Event
At a meeting held June 19, 2012, the Board of Trustees of the fund approved investing some or all of the fund’s assets currently invested in high income dept instruments in the MFS High Yield Pooled Portfolio, a mutual fund advised by MFS that normally invests at least 80% of its assets in high income debt instruments (the “High Yield Pooled Portfolio”). The High Yield Pooled Portfolio does not charge a management fee, distribution and/or service fee, or sales charge. The investment in the MFS High Yield Pooled Portfolio occurred on March 22, 2013.
68
REPORT OF INDEPENDENT REGISTERED PUBLIC ACCOUNTING FIRM
To the Trustees and Shareholders of
MFS Diversified Income Fund:
We have audited the accompanying statement of assets and liabilities of MFS Diversified Income Fund (the Fund), including the portfolio of investments, as of February 28, 2013, and the related statement of operations for the year then ended, the statements of changes in net assets for each of the two years in the period then ended, and the financial highlights for each of the periods indicated therein. These financial statements and financial highlights are the responsibility of the Fund’s management. Our responsibility is to express an opinion on these financial statements and financial highlights based on our audits.
We conducted our audits in accordance with the standards of the Public Company Accounting Oversight Board (United States). Those standards require that we plan and perform the audit to obtain reasonable assurance about whether the financial statements and financial highlights are free of material misstatement. We were not engaged to perform an audit of the Fund’s internal control over financial reporting. Our audits included consideration of internal control over financial reporting as a basis for designing audit procedures that are appropriate in the circumstances, but not for the purpose of expressing an opinion on the effectiveness of the Fund’s internal control over financial reporting. Accordingly, we express no such opinion. An audit also includes examining, on a test basis, evidence supporting the amounts and disclosures in the financial statements and financial highlights, assessing the accounting principles used and significant estimates made by management, and evaluating the overall financial statement presentation. Our procedures included confirmation of securities owned as of February 28, 2013, by correspondence with the Fund’s custodian and brokers or by other appropriate auditing procedures when replies from brokers were not received. We believe that our audits provide a reasonable basis for our opinion.
In our opinion, the financial statements and financial highlights referred to above present fairly, in all material respects, the financial position of MFS Diversified Income Fund at February 28, 2013, the results of its operations for the year then ended, the changes in its net assets for each of the two years in the period then ended, and its financial highlights for the periods indicated therein, in conformity with U.S. generally accepted accounting principles.

Boston, Massachusetts
April 12, 2013
69
TRUSTEES AND OFFICERS — IDENTIFICATION AND BACKGROUND
The Trustees and officers of the Trust, as of April 1, 2013, are listed below, together with their principal occupations during the past five years. (Their titles may have varied during that period.) The address of each Trustee and officer is 111 Huntington Avenue, Boston, Massachusetts 02199-7618.
| | | | | | | | |
Name, Age | | Position(s) Held with Fund | | Trustee/Officer Since (h) | | Principal
Occupations During the Past Five Years | | Other Directorships (j) |
| INTERESTED TRUSTEES |
Robert J. Manning (k) (age 49) | | Trustee | | February 2004 | | Massachusetts Financial Services Company, Chairman, Chief Executive Officer and Director; President (until December 2009); Chief Investment Officer (until July 2010) | | N/A |
| INDEPENDENT TRUSTEES |
David H. Gunning (age 70) | | Trustee and Chair of Trustees | | January 2004 | | Private investor | | Lincoln Electric Holdings, Inc. (welding equipment manufacturer), Director; Development Alternatives, Inc. (consulting), Director/Non-Executive Chairman; Portman Limited (mining), Director (until 2008) |
Robert E. Butler (age 71) | | Trustee | | January 2006 | | Consultant – investment company industry regulatory and compliance matters | | N/A |
Maureen R. Goldfarb (age 57) | | Trustee | | January 2009 | | Private investor | | N/A |
William R. Gutow (age 71) | | Trustee | | December 1993 | | Private investor and real estate consultant; Capitol Entertainment Management Company (video franchise), Vice Chairman | | Texas Donuts (donut franchise), Vice Chairman (until 2010) |
70
Trustees and Officers – continued
| | | | | | | | |
Name, Age | | Position(s) Held with Fund | | Trustee/Officer Since (h) | | Principal
Occupations During the Past Five Years | | Other Directorships (j) |
Michael Hegarty (age 68) | | Trustee | | December 2004 | | Private investor; Rouse Properties Inc. (real estate), Director | | Brookfield Office Properties, Inc. (real estate), Director; Rouse Properties Inc.
(real estate), Director; Capmark Financial Group Inc. (real estate), Director |
John P. Kavanaugh (age 58) | | Trustee | | January 2009 | | Private investor | | N/A |
J. Dale Sherratt (age 74) | | Trustee | | June 1989 | | Insight Resources, Inc. (acquisition planning specialists), President; Wellfleet Investments (investor in health care companies), Managing General Partner | | N/A |
Laurie J. Thomsen (age 55) | | Trustee | | March 2005 | | Private investor; New Profit, Inc. (venture philanthropy), Executive Partner
(until 2010) | | The Travelers Companies (insurance), Director |
Robert W. Uek (age 71) | | Trustee | | January 2006 | | Consultant to investment company industry | | N/A |
| OFFICERS |
John M. Corcoran (k) (age 47) | | President | | October 2008 | | Massachusetts Financial Services Company, Senior Vice President (since October 2008); State Street Bank and Trust (financial services provider), Senior Vice President, (until September 2008) | | N/A |
Christopher R. Bohane (k) (age 39) | | Assistant Secretary and Assistant Clerk | | July 2005 | | Massachusetts Financial Services Company, Vice President and Senior Counsel | | N/A |
Kino Clark (k) (age 44) | | Assistant Treasurer | | January 2012 | | Massachusetts Financial Services Company, Vice President | | N/A |
71
Trustees and Officers – continued
| | | | | | | | |
Name, Age | | Position(s) Held with Fund | | Trustee/Officer Since (h) | | Principal
Occupations During the Past Five Years | | Other Directorships (j) |
Thomas H. Connors (k) (age 53) | | Assistant Secretary and Assistant Clerk | | September 2012 | | Massachusetts Financial Services Company, Vice President and Senior Counsel; Deutsche Investment Management Americas Inc. (financial service provider), Director and Senior Counsel (until 2012) | | N/A |
Ethan D. Corey (k) (age 49) | | Assistant Secretary and Assistant Clerk | | July 2005 | | Massachusetts Financial Services Company, Senior Vice President and Associate General Counsel | | N/A |
David L. DiLorenzo (k) (age 44) | | Treasurer | | July 2005 | | Massachusetts Financial Services Company, Senior Vice President | | N/A |
Robyn L. Griffin (age 37) | | Assistant Independent Chief Compliance Officer | | August 2008 | | Griffin Compliance LLC (provider of compliance services), Principal (since August 2008); State Street Corporation (financial services provider), Mutual Fund Administration Assistant Vice President (October 2006 – July 2008) | | N/A |
Brian E. Langenfeld (k) (age 40) | | Assistant Secretary and Assistant Clerk | | June 2006 | | Massachusetts Financial Services Company, Vice President and Senior Counsel | | N/A |
Susan S. Newton (k) (age 63) | | Assistant Secretary and Assistant Clerk | | May 2005 | | Massachusetts Financial Services Company, Senior Vice President and Associate General Counsel | | N/A |
72
Trustees and Officers – continued
| | | | | | | | |
Name, Age | | Position(s) Held with Fund | | Trustee/Officer Since (h) | | Principal
Occupations During the Past Five Years | | Other Directorships (j) |
Susan A. Pereira (k) (age 42) | | Assistant Secretary and Assistant Clerk | | July 2005 | | Massachusetts Financial Services Company, Vice President and Senior Counsel | | N/A |
Kasey L. Phillips (k) (age 42) | | Assistant Treasurer | | September 2012 | | Massachusetts Financial Services Company, Vice President; Wells Fargo Funds Management, LLC, Senior Vice President, Fund Treasurer (until 2012) | | N/A |
Mark N. Polebaum (k) (age 60) | | Secretary and Clerk | | January 2006 | | Massachusetts Financial Services Company, Executive Vice President, General Counsel and Secretary | | N/A |
Frank L. Tarantino (age 69) | | Independent Chief Compliance Officer | | June 2004 | | Tarantino LLC (provider of compliance services), Principal | | N/A |
Richard S. Weitzel (k) (age 42) | | Assistant Secretary and Assistant Clerk | | October 2007 | | Massachusetts Financial Services Company, Senior Vice President and Associate General Counsel | | N/A |
James O. Yost (k) (age 52) | | Deputy Treasurer | | September 1990 | | Massachusetts Financial Services Company, Senior Vice President | | N/A |
| (h) | Date first appointed to serve as Trustee/officer of an MFS fund. Each Trustee has served continuously since appointment unless indicated otherwise. For the period from December 15, 2004 until February 22, 2005, Mr. Manning served as Advisory Trustee. For the period October 2008, until January 2012, Mr. Corcoran served as Treasurer of the Funds. Prior to January 2012, Messrs. DiLorenzo and Yost served as Assistant Treasurers of the Funds. |
| (j) | Directorships or trusteeships of companies required to report to the Securities and Exchange Commission (i.e., “public companies”). |
| (k) | “Interested person” of the Trust within the meaning of the Investment Company Act of 1940 (referred to as the 1940 Act), which is the principal federal law governing investment companies like the fund, as a result of position with MFS. The address of MFS is 111 Huntington Avenue, Boston, Massachusetts 02199-7618. |
73
Trustees and Officers – continued
Each Trustee has been elected by shareholders and each Trustee and officer holds office until his or her successor is chosen and qualified or until his or her earlier death, resignation, retirement or removal. The Trust does not hold annual meetings for the purpose of electing Trustees, and Trustees are not elected for fixed terms. Messrs. Butler, Kavanaugh, Uek and Ms. Thomsen are members of the Trust’s Audit Committee.
Each of the Fund’s Trustees and officers holds comparable positions with certain other funds of which MFS or a subsidiary is the investment adviser or distributor, and, in the case of the officers, with certain affiliates of MFS. As of January 1, 2013, the Trustees served as board members of 143 funds within the MFS Family of Funds.
The Statement of Additional Information for the Fund includes further information about the Trustees and is available without charge upon request by calling 1-800-225-2606.
| | |
| Investment Adviser | | Custodian |
Massachusetts Financial Services Company
111 Huntington Avenue
Boston, MA 02199-7618 | | JPMorgan Chase Bank One Chase Manhattan Plaza New York, NY 10081 |
| Distributor | | Independent Registered Public Accounting Firm |
MFS Fund Distributors, Inc.
111 Huntington Avenue
Boston, MA 02199-7618 | | Ernst & Young LLP 200 Clarendon Street
Boston, MA 02116 |
| Portfolio Managers | | |
William Adams David Cole Richard Gable Matthew Ryan Jonathan Sage Geoffrey Schechter James Swanson | | |
74
BOARD REVIEW OF INVESTMENT ADVISORY AGREEMENT
A discussion regarding the Board’s most recent review and renewal of the fund’s Investment Advisory Agreement with MFS is available by clicking on the fund’s name under “Mutual Funds” in the “Products” section of the MFS Web site (mfs.com).
PROXY VOTING POLICIES AND INFORMATION
A general description of the MFS funds’ proxy voting policies and procedures is available without charge, upon request, by calling 1-800-225-2606, by visiting the Proxy Voting section of mfs.com or by visiting the SEC’s Web site at http://www.sec.gov.
Information regarding how the fund voted proxies relating to portfolio securities during the most recent twelve-month period ended June 30 is available without charge by visiting the Proxy Voting section of mfs.com or by visiting the SEC’s Web site at http://www.sec.gov.
QUARTERLY PORTFOLIO DISCLOSURE
The fund will file a complete schedule of portfolio holdings with the Securities and Exchange Commission (the Commission) for the first and third quarters of each fiscal year on Form N-Q. A shareholder can obtain the quarterly portfolio holdings report at mfs.com. The fund’s Form N-Q is also available on the EDGAR database on the Commission’s Internet Web site at http://www.sec.gov, and may be reviewed and copied at the:
Public Reference Room
Securities and Exchange Commission
100 F Street, NE, Room 1580
Washington, D.C. 20549
Information on the operation of the Public Reference Room may be obtained by calling the Commission at 1-800-SEC-0330. Copies of the fund’s Form N-Q also may be obtained, upon payment of a duplicating fee, by electronic request at the following e-mail address: publicinfo@sec.gov or by writing the Public Reference Section at the above address.
FURTHER INFORMATION
From time to time, MFS may post important information about the fund or the MFS funds on the MFS web site (mfs.com). This information is available by visiting the “News & Commentary” section of mfs.com or by clicking on the fund’s name under “Mutual Funds” in the “Products” section of mfs.com.
FEDERAL TAX INFORMATION (unaudited)
The fund will notify shareholders of amounts for use in preparing 2013 income tax forms in January 2014. The following information is provided pursuant to provisions of the Internal Revenue Code.
The fund designates the maximum amount allowable as qualified dividend income eligible for the 15% tax rate.
The fund designates $1,964,000 as capital gain dividends paid during the fiscal year.
For corporate shareholders, 21.63% of the ordinary income dividends paid during the fiscal year qualify for the corporate dividends received deduction.
75
rev. 3/11
| | | | |
| | | |
FACTS | | WHAT DOES MFS DO WITH YOUR PERSONAL INFORMATION? | |  |
| | |
| Why? | | Financial companies choose how they share your personal information. Federal law gives consumers the right to limit some but not all sharing. Federal law also requires us to tell you how we collect, share, and protect your personal information. Please read this notice carefully to understand what we do. |
| | |
| What? | | The types of personal information we collect and share depend on the product or service you have with us. This information can include: •Social Security number and account balances •Account transactions and transaction history •Checking account information and wire transfer instructions When you are no longer our customer, we continue to share your information as described in this notice. |
| | |
| How? | | All financial companies need to share customers’ personal information to run their everyday business. In the section below, we list the reasons financial companies can share their customers’ personal information; the reasons MFS chooses to share; and whether you can limit this sharing. |
| | | | |
Reasons we can share your
personal information | | Does MFS
share? | | Can you limit
this sharing? |
For our everyday business purposes – such as to process your transactions, maintain your account(s), respond to court orders and legal investigations, or report to credit bureaus | | Yes | | No |
For our marketing purposes – to offer our products and services to you | | No | | We don’t share |
| For joint marketing with other financial companies | | No | | We don’t share |
For our affiliates’ everyday business purposes – information about your transactions and experiences | | No | | We don’t share |
For our affiliates’ everyday business purposes – information about your creditworthiness | | No | | We don’t share |
| For nonaffiliates to market to you | | No | | We don’t share |
| | |
| Questions? | | Call 800-225-2606 or go to mfs.com. |
76
| | |
| Who we are |
| Who is providing this notice? | | MFS Funds, MFS Investment Management, MFS Institutional Advisors, Inc., MFS Fund Distributors, Inc., MFS Heritage Trust Company, and MFS Service Center, Inc. |
| | |
| What we do |
| How does MFS protect my personal information? | | To protect your personal information from unauthorized access and use, we use security measures that comply with federal law. These measures include procedural, electronic, and physical safeguards for the protection of the personal information we collect about you. |
| How does MFS collect my personal information? | | We collect your personal information, for example, when you •open an account or provide account information •direct us to buy securities or direct us to sell your securities •make a wire transfer We also collect your personal information from others, such as credit bureaus, affiliates and other companies. |
| Why can’t I limit all sharing? | | Federal law gives you the right to limit only •sharing for affiliates’ everyday business purposes – information about your creditworthiness •affiliates from using your information to market to you •sharing for nonaffiliates to market to you State laws and individual companies may give you additional rights to limit sharing. |
| | |
| Definitions |
| Affiliates | | Companies related by common ownership or control. They can be financial and nonfinancial companies. •MFS does not share personal information with affiliates, except for everyday business purposes as described on page one of this notice. |
| Nonaffiliates | | Companies not related by common ownership or control. They can be financial and nonfinancial companies. •MFS does not share with nonaffiliates so they can market to you. |
| Joint Marketing | | A formal agreement between nonaffiliated financial companies that together market financial products or services to you. •MFS doesn’t jointly market. |
| | |
| Other important information |
| If you own an MFS product or receive an MFS service in the name of a third party such as a bank or broker-dealer, their privacy policy may apply to you instead of ours. |
77
Save paper with eDelivery.

| MFS® will send you prospectuses, |
reports, and proxies directly via e-mail so you will get information faster with less mailbox clutter.
To sign up:
1. Go to mfs.com.
2. Log in via MFS® Access.
3. Select eDelivery.
If you own your MFS fund shares through a financial institution or a retirement plan, MFS® TALK, MFS® Access, or eDelivery may not be available to you.
CONTACT
WEB SITE
mfs.com
MFS TALK
1-800-637-8255
24 hours a day
ACCOUNT SERVICE AND LITERATURE
Shareholders
1-800-225-2606
Financial advisors
1-800-343-2829
Retirement plan services
1-800-637-1255
MAILING ADDRESS
MFS Service Center, Inc.
P.O. Box 55824
Boston, MA 02205-5824
OVERNIGHT MAIL
MFS Service Center, Inc.
c/o Boston Financial Data Services
30 Dan Road
Canton, MA 02021-2809
ANNUAL REPORT
February 28, 2013

MFS® GOVERNMENT SECURITIES FUND

MFG-ANN
MFS® GOVERNMENT SECURITIES FUND
CONTENTS
The report is prepared for the general information of shareholders.
It is authorized for distribution to prospective investors only when preceded or accompanied by a current prospectus.
NOT FDIC INSURED Ÿ MAY LOSE VALUE Ÿ NO BANK GUARANTEE

LETTER FROM THE CHAIRMAN AND CEO
Dear Shareholders:
Global financial markets began 2013 with greater optimism. U.S. and Asian economic trends have turned more positive. Europe continues to struggle through its economic
slump. However, even there, sentiment has improved. The U.S. Congress averted its year-end fiscal cliff, but a degree of uncertainty remains regarding upcoming negotiations over spending cuts and the debt ceiling. The U.S. Federal Reserve Board is continuing its accommodative monetary easing, while the U.S. housing and job markets have made steady gains. Corporate profits have been resilient, and investors have demonstrated increased tolerance for risk.
Overseas, the eurozone remains in a broad contraction, with economic output receding in France as well as Italy and Spain.
However, large-scale early repayments of European Central Bank loans by banks and Germany’s strong rebound in manufacturing activity are encouraging signs. In Asia, both China and Japan appear to be in the early stages of a turnaround. China’s economic activity has picked up from last year’s relative slowdown, and Japan’s sharp devaluation of the yen, an important anti-deflationary measure, seems to be having its desired impact: Japanese stocks have soared, corporate profits are rising and confidence is returning among consumers, businesses and investors.
As always, managing risk in the face of uncertainty remains a top priority for investors. At MFS®, our uniquely collaborative investment process employs global research and active risk management. Our global team of investment professionals shares ideas and evaluates opportunities across continents, investment disciplines and asset classes — all with a goal of building better insights, and ultimately better results, for our clients.
We remain mindful of the many economic challenges investors face today, and believe it is more important than ever to maintain a long-term view and employ time-tested principles, such as asset allocation and diversification. We also remain confident that our unique approach can serve investors well as they work with their financial advisors to identify and pursue the most suitable opportunities.
Respectfully,

Robert J. Manning
Chairman and Chief Executive Officer
MFS Investment Management®
April 12, 2013
The opinions expressed in this letter are subject to change, may not be relied upon for investment advice, and no forecasts can be guaranteed.
1
PORTFOLIO COMPOSITION
Portfolio structure (i)
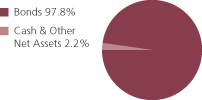
| | | | |
| Fixed income sectors (i) | | | | |
| Mortgage-Backed Securities | | | 54.3% | |
| U.S. Treasury Securities | | | 33.7% | |
| U.S. Government Agencies | | | 6.9% | |
| Commercial Mortgage-Backed Securities | | | 1.7% | |
| High Grade Corporates | | | 1.2% | |
| | | | |
| Composition including fixed income credit quality (a)(i) | |
| AAA | | | 1.0% | |
| AA | | | 0.8% | |
| A | | | 0.4% | |
| BBB | | | 0.7% | |
| U.S. Government | | | 33.7% | |
| Federal Agencies | | | 61.2% | |
| Cash & Other | | | 2.2% | |
| |
| Portfolio facts (i) | | | | |
| Average Duration (d) | | | 4.2 | |
| Average Effective Maturity (m) | | | 5.6 yrs. | |
| (a) | For all securities other than those specifically described below, ratings are assigned to underlying securities utilizing ratings from Moody’s, Fitch, and Standard & Poor’s rating agencies and applying the following hierarchy: If all three agencies provide a rating, the middle rating (after dropping the highest and lowest ratings) is assigned; if two of the three agencies rate a security, the lower of the two is assigned. Ratings are shown in the S&P and Fitch scale (e.g., AAA). Securities rated BBB or higher are considered investment grade. All ratings are subject to change. U.S. Government includes securities issued by the U.S. Department of the Treasury. Federal Agencies includes rated and unrated U.S. Agency fixed-income securities, U.S. Agency mortgage-backed securities, and collateralized mortgage obligations of U.S. Agency mortgage-backed securities. Cash & Other includes cash, other assets less liabilities, offsets to derivative positions, and short-term securities. The fund may not hold all of these instruments. The fund is not rated by these agencies. |
| (d) | Duration is a measure of how much a bond’s price is likely to fluctuate with general changes in interest rates, e.g., if rates rise 1.00%, a bond with a 5-year duration is likely to lose about 5.00% of its value due to the interest rate move. |
2
Portfolio Composition – continued
| (i) | For purposes of this presentation, the components include the market value of securities, and reflect the impact of the equivalent exposure of derivative positions, if any. These amounts may be negative from time to time. The bond component will include any accrued interest amounts. Equivalent exposure is a calculated amount that translates the derivative position into a reasonable approximation of the amount of the underlying asset that the portfolio would have to hold at a given point in time to have the same price sensitivity that results from the portfolio’s ownership of the derivative contract. When dealing with derivatives, equivalent exposure is a more representative measure of the potential impact of a position on portfolio performance than market value. Where the fund holds convertible bonds, these are treated as part of the equity portion of the portfolio. |
| (m) | In determining an instrument’s effective maturity for purposes of calculating the fund’s dollar-weighted average effective maturity, MFS uses the instrument’s stated maturity or, if applicable, an earlier date on which MFS believes it is probable that a maturity-shortening device (such as a put, pre-refunding or prepayment) will cause the instrument to be repaid. Such an earlier date can be substantially shorter than the instrument’s stated maturity. |
Percentages are based on net assets as of 2/28/13.
The portfolio is actively managed and current holdings may be different.
3
MANAGEMENT REVIEW
Summary of Results
For the twelve months ended February 28, 2013, Class A shares of the MFS Government Securities Fund (“fund”) provided a total return of 1.74%, at net asset value. This compares with a return of 1.95% for the fund’s benchmark, the Barclays U.S. Government/Mortgage Bond Index.
Market Environment
The beginning of the period was characterized by a risk-on sentiment as a result of additional liquidity measures by the Federal Reserve Bank (“Fed”) and the European Central Bank (“ECB”) as well as a commensurate improvement in macroeconomic conditions. During this time, global equity valuations rose, credit spreads contracted, and high-quality sovereign yields increased modestly.
Within a couple of months, however, conditions worsened, driven by broadly weaker global macroeconomic indicators, as well as renewed concerns over the eurozone’s capacity and determination to address its ongoing crisis. Despite this deterioration, broad market sentiment remained relatively resilient as equity markets generally maintained gains and credit spreads did not indicate deterioration.
However, this renewed weakness in the fundamentals precipitated a further round of monetary easing by both the Fed (through a third round of quantitative easing) and the ECB (through a new bond purchase facility) in the middle of the period, which soon instilled additional confidence in risk markets. Nonetheless, towards the end of the calendar year, weaker equity earnings reports and declining forward guidance caused market sentiment to soften. In addition, year-end fiscal cliff negotiations between the Republicans in the U.S. Congress and President Obama were a particular source of market attention, where uncertainty surrounding the fiscal negotiations continued right up to the end-of-year deadline. A last minute political agreement averted the worst-case scenario and markets gravitated towards risk assets again, though the implementation of the U.S. budget sequester, combined with the uncertainty surrounding the Italian election results, inserted a greater degree of caution as the reporting period ended.
Factors Affecting Performance
Relative to the Barclays U.S. Government/Mortgage Bond Index, the fund’s shorter duration stance during the month of January 2013 held back relative performance.
The fund’s return from yield, which was greater than that of the benchmark, was a positive factor for relative performance.
Additionally, the fund’s yield curve (y) positioning, particularly its exposure to shifts in the long end (centered around maturities of 10 or more years) of the yield curve was an area of relative strength. This was largely due to the fund’s relatively greater exposure to this part of the yield curve in the beginning of the period as yields flattened, and a relatively lesser exposure in the latter half of the period when yields increased.
4
Management Review – continued
The fund’s greater exposure to the financial sector contributed to performance as this market segment outperformed the benchmark over the reporting period.
Respectfully,
Geoffrey Schechter
Portfolio Manager
| (y) | A yield curve graphically depicts the yields of different maturity bonds of the same credit quality and type; a normal yield curve is upward sloping, with short-term rates lower than long-term rates. |
The views expressed in this report are those of the portfolio manager only through the end of the period of the report as stated on the cover and do not necessarily reflect the views of MFS or any other person in the MFS organization. These views are subject to change at any time based on market or other conditions, and MFS disclaims any responsibility to update such views. These views may not be relied upon as investment advice or an indication of trading intent on behalf of any MFS portfolio. References to specific securities are not recommendations of such securities, and may not be representative of any MFS portfolio’s current or future investments.
5
PERFORMANCE SUMMARY THROUGH 2/28/13
The following chart illustrates a representative class of the fund’s historical performance in comparison to its benchmark(s). Performance results include the deduction of the maximum applicable sales charge and reflect the percentage change in net asset value, including reinvestment of dividends and capital gains distributions. The performance of other share classes will be greater than or less than that of the class depicted below. Benchmarks are unmanaged and may not be invested in directly. Benchmark returns do not reflect sales charges, commissions or expenses. (See Notes to Performance Summary.)
Performance data shown represents past performance and is no guarantee of future results. Investment return and principal value fluctuate so your shares, when sold, may be worth more or less than the original cost; current performance may be lower or higher than quoted. The performance shown does not reflect the deduction of taxes, if any, that a shareholder would pay on fund distributions or the redemption of fund shares.
Growth of a Hypothetical $10,000 Investment
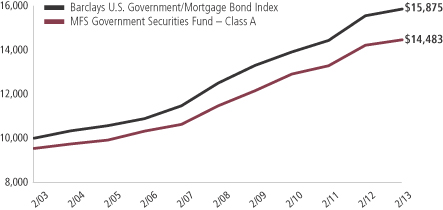
6
Performance Summary – continued
Total Returns through 2/28/13
Average annual without sales charge
| | | | | | | | | | | | | | |
| | | Share class | | Class inception date | | 1-yr | | 5-yr | | 10-yr | | Life (t) | | |
| | | A | | 7/25/84 | | 1.74% | | 4.78% | | 4.28% | | N/A | | |
| | | B | | 8/30/93 | | 0.88% | | 3.98% | | 3.51% | | N/A | | |
| | | C | | 4/01/96 | | 0.88% | | 3.97% | | 3.51% | | N/A | | |
| | | I | | 1/02/97 | | 1.99% | | 5.04% | | 4.56% | | N/A | | |
| | | R1 | | 4/01/05 | | 0.98% | | 4.00% | | N/A | | 4.14% | | |
| | | R2 | | 10/31/03 | | 1.48% | | 4.52% | | N/A | | 4.30% | | |
| | | R3 | | 4/01/05 | | 1.64% | | 4.76% | | N/A | | 4.89% | | |
| | | R4 | | 4/01/05 | | 1.89% | | 5.04% | | N/A | | 5.19% | | |
| | | R5 | | 7/02/12 | | N/A | | N/A | | N/A | | 0.62% | | |
| Comparative benchmark | | | | | | | | | | |
| | | Barclays U.S. Government/Mortgage Bond
Index (f) | | 1.95% | | 4.89% | | 4.73% | | N/A | | |
| Average annual with sales charge | | | | | | | | | | |
| | | A
With Initial Sales Charge (4.75%) | | (3.10)% | | 3.76% | | 3.77% | | N/A | | |
| | | B
With CDSC (Declining over six years from 4% to 0%) (x) | | (3.07)% | | 3.63% | | 3.51% | | N/A | | |
| | | C
With CDSC (1% for 12 months) (x) | | (0.10)% | | 3.97% | | 3.51% | | N/A | | |
Class I, R1, R2, R3, R4 and R5 shares do not have a sales charge.
CDSC – Contingent Deferred Sales Charge.
| (f) | Source: FactSet Research Systems Inc. |
| (t) | For the period from the class inception date through the stated period end (for those share classes with less than 10 years of performance history). No comparative benchmark performance information is provided for “life” periods. (See Notes to Performance Summary.) |
| (x) | Assuming redemption at the end of the applicable period. |
Benchmark Definition
Barclays U.S. Government/Mortgage Bond Index – measures debt issued by the U.S. Government, and its agencies, as well as mortgage-backed pass-through securities of Ginnie Mae (GNMA), Fannie Mae (FNMA), and Freddie Mac (FHLMC).
It is not possible to invest directly in an index.
Notes to Performance Summary
Average annual total return represents the average annual change in value for each share class for the periods presented. Life returns are presented where the share class has less than 10 years of performance history and represent the average annual total return from the class inception date to the stated period end date. As the fund’s share
7
Performance Summary – continued
classes may have different inception dates, the life returns may represent different time periods and may not be comparable. As a result, no comparative benchmark performance information is provided for life periods.
Performance results reflect any applicable expense subsidies and waivers in effect during the periods shown. Without such subsidies and waivers the fund’s performance results would be less favorable. Please see the prospectus and financial statements for complete details.
Performance results do not include adjustments made for financial reporting purposes in accordance with U.S. generally accepted accounting principles and may differ from amounts reported in the financial highlights.
From time to time the fund may receive proceeds from litigation settlements, without which performance would be lower.
8
EXPENSE TABLE
Fund expenses borne by the shareholders during the period,
September 1, 2012 through February 28, 2013
As a shareholder of the fund, you incur two types of costs: (1) transaction costs, including sales charges (loads) on certain purchase or redemption payments, and (2) ongoing costs, including management fees; distribution and service (12b-1) fees; and other fund expenses. This example is intended to help you understand your ongoing costs (in dollars) of investing in the fund and to compare these costs with the ongoing costs of investing in other mutual funds.
The example is based on an investment of $1,000 invested at the beginning of the period and held for the entire period September 1, 2012 through February 28, 2013.
The expenses include the payment of a portion of the transfer-agent-related expenses of MFS funds that invest in the fund. For further information, please see the Notes to the Financial Statements.
Actual Expenses
The first line for each share class in the following table provides information about actual account values and actual expenses. You may use the information in this line, together with the amount you invested, to estimate the expenses that you paid over the period. Simply divide your account value by $1,000 (for example, an $8,600 account value divided by $1,000 = 8.6), then multiply the result by the number in the first line under the heading entitled “Expenses Paid During Period” to estimate the expenses you paid on your account during this period.
Hypothetical Example for Comparison Purposes
The second line for each share class in the following table provides information about hypothetical account values and hypothetical expenses based on the fund’s actual expense ratio and an assumed rate of return of 5% per year before expenses, which is not the fund’s actual return. The hypothetical account values and expenses may not be used to estimate the actual ending account balance or expenses you paid for the period. You may use this information to compare the ongoing costs of investing in the fund and other funds. To do so, compare this 5% hypothetical example with the 5% hypothetical examples that appear in the shareholder reports of the other funds.
Please note that the expenses shown in the table are meant to highlight your ongoing costs only and do not reflect any transactional costs, such as sales charges (loads). Therefore, the second line for each share class in the table is useful in comparing ongoing costs only, and will not help you determine the relative total costs of owning different funds. In addition, if these transactional costs were included, your costs would have been higher.
9
Expense Table – continued
| | | | | | | | | | | | | | | | | | |
Share
Class | | | | Annualized Expense Ratio | | | Beginning Account Value 9/01/12 | | | Ending Account Value 2/28/13 | | | Expenses Paid During Period (p) 9/01/12-2/28/13 | |
| A | | Actual | | | 0.89% | | | | $1,000.00 | | | | $995.81 | | | | $4.40 | |
| | Hypothetical (h) | | | 0.89% | | | | $1,000.00 | | | | $1,020.38 | | | | $4.46 | |
| B | | Actual | | | 1.64% | | | | $1,000.00 | | | | $992.06 | | | | $8.10 | |
| | Hypothetical (h) | | | 1.64% | | | | $1,000.00 | | | | $1,016.66 | | | | $8.20 | |
| C | | Actual | | | 1.64% | | | | $1,000.00 | | | | $992.12 | | | | $8.10 | |
| | Hypothetical (h) | | | 1.64% | | | | $1,000.00 | | | | $1,016.66 | | | | $8.20 | |
| I | | Actual | | | 0.64% | | | | $1,000.00 | | | | $998.00 | | | | $3.17 | |
| | Hypothetical (h) | | | 0.64% | | | | $1,000.00 | | | | $1,021.62 | | | | $3.21 | |
| R1 | | Actual | | | 1.64% | | | | $1,000.00 | | | | $993.01 | | | | $8.10 | |
| | Hypothetical (h) | | | 1.64% | | | | $1,000.00 | | | | $1,016.66 | | | | $8.20 | |
| R2 | | Actual | | | 1.14% | | | | $1,000.00 | | | | $995.49 | | | | $5.64 | |
| | Hypothetical (h) | | | 1.14% | | | | $1,000.00 | | | | $1,019.14 | | | | $5.71 | |
| R3 | | Actual | | | 0.89% | | | | $1,000.00 | | | | $995.80 | | | | $4.40 | |
| | Hypothetical (h) | | | 0.89% | | | | $1,000.00 | | | | $1,020.38 | | | | $4.46 | |
| R4 | | Actual | | | 0.65% | | | | $1,000.00 | | | | $997.06 | | | | $3.22 | |
| | Hypothetical (h) | | | 0.65% | | | | $1,000.00 | | | | $1,021.57 | | | | $3.26 | |
| R5 | | Actual | | | 0.54% | | | | $1,000.00 | | | | $997.54 | | | | $2.67 | |
| | Hypothetical (h) | | | 0.54% | | | | $1,000.00 | | | | $1,022.12 | | | | $2.71 | |
| (h) | 5% class return per year before expenses. |
| (p) | Expenses paid are equal to each class’s annualized expense ratio, as shown above, multiplied by the average account value over the period, multiplied by the number of days in the period, divided by the number of days in the year. Expenses paid do not include any applicable sales charges (loads). If these transaction costs had been included, your costs would have been higher. |
10
PORTFOLIO OF INVESTMENTS
2/28/13
The Portfolio of Investments is a complete list of all securities owned by your fund. It is categorized by broad-based asset classes.
| | | | | | | | |
| Bonds - 97.5% | | | | | | | | |
| Issuer | | Shares/Par | | | Value ($) | |
| Agency - Other - 4.7% | | | | | | | | |
| Financing Corp., 10.7%, 2017 | | $ | 14,360,000 | | | $ | 20,662,052 | |
| Financing Corp., 9.4%, 2018 | | | 11,750,000 | | | | 16,486,167 | |
| Financing Corp., 9.8%, 2018 | | | 14,975,000 | | | | 21,433,732 | |
| Financing Corp., 10.35%, 2018 | | | 15,165,000 | | | | 22,470,223 | |
| Financing Corp., STRIPS, 0%, 2017 | | | 18,780,000 | | | | 17,680,638 | |
| | | | | | | | |
| | | | | | | $ | 98,732,812 | |
| Asset-Backed & Securitized - 1.7% | | | | | | | | |
| Citigroup/Deutsche Bank Commercial Mortgage Trust, 5.322%, 2049 | | $ | 4,260,000 | | | $ | 4,829,788 | |
| Commercial Mortgage Pass-Through Certificates, “A4”, 5.306%, 2046 | | | 9,314,763 | | | | 10,527,079 | |
| CWCapital Cobalt Ltd., “A4”, FRN, 5.792%, 2046 | | | 3,800,000 | | | | 4,416,333 | |
| JPMorgan Chase Commercial Mortgage Securities Corp., “A3”, FRN, 5.93%, 2051 | | | 5,341,614 | | | | 5,637,331 | |
| JPMorgan Chase Commercial Mortgage Securities Corp., “A4”, FRN, 5.82%, 2049 | | | 9,056,290 | | | | 10,405,360 | |
| | | | | | | | |
| | | | | | | $ | 35,815,891 | |
| Local Authorities - 1.0% | | | | | | | | |
| Nashville & Davidson County, TN, Metropolitan Government Convention Center Authority (Build America Bonds), 6.731%, 2043 | | $ | 4,855,000 | | | $ | 6,130,020 | |
| Port Authority NY & NJ (168th Series), 4.926%, 2051 | | | 7,130,000 | | | | 7,998,719 | |
| San Francisco, CA, City & County Public Utilities Commission, Water Rev. (Build America Bonds), 6%, 2040 | | | 840,000 | | | | 1,055,191 | |
| State of California (Build America Bonds), 7.625%, 2040 | | | 1,225,000 | | | | 1,786,908 | |
| University of California Rev. (Build America Bonds), 5.77%, 2043 | | | 2,750,000 | | | | 3,403,428 | |
| | | | | | | | |
| | | | | | | $ | 20,374,266 | |
| Medical & Health Technology & Services - 0.2% | | | | | | | | |
| Catholic Health Initiatives, 2.95%, 2022 | | $ | 4,861,000 | | | $ | 4,884,911 | |
| | |
| Mortgage-Backed - 54.2% | | | | | | | | |
| Fannie Mae, 4.374%, 2013 | | $ | 1,285,502 | | | $ | 1,289,448 | |
| Fannie Mae, 4.518%, 2013 | | | 41,026 | | | | 41,022 | |
| Fannie Mae, 4.7%, 2013 - 2015 | | | 1,015,206 | | | | 1,032,554 | |
| Fannie Mae, 5.06%, 2013 - 2017 | | | 3,120,711 | | | | 3,309,917 | |
| Fannie Mae, 5.138%, 2013 | | | 1,396,948 | | | | 1,393,770 | |
11
Portfolio of Investments – continued
| | | | | | | | |
| Issuer | | Shares/Par | | | Value ($) | |
| Bonds - continued | | | | | | | | |
| Mortgage-Backed - continued | | | | | | | | |
| Fannie Mae, 4.6%, 2014 | | $ | 1,638,015 | | | $ | 1,674,764 | |
| Fannie Mae, 4.606%, 2014 | | | 5,069,126 | | | | 5,184,002 | |
| Fannie Mae, 4.629%, 2014 | | | 1,355,987 | | | | 1,395,061 | |
| Fannie Mae, 4.77%, 2014 | | | 1,405,231 | | | | 1,455,825 | |
| Fannie Mae, 4.82%, 2014 - 2015 | | | 4,762,793 | | | | 5,039,751 | |
| Fannie Mae, 4.858%, 2014 | | | 4,584,807 | | | | 4,600,739 | |
| Fannie Mae, 4.92%, 2014 | | | 338,533 | | | | 347,127 | |
| Fannie Mae, 4.935%, 2014 | | | 709,767 | | | | 721,940 | |
| Fannie Mae, 5.1%, 2014 - 2019 | | | 3,687,080 | | | | 3,940,738 | |
| Fannie Mae, 8.41%, 2014 | | | 7,316,817 | | | | 7,586,296 | |
| Fannie Mae, 4.558%, 2015 | | | 655,495 | | | | 678,969 | |
| Fannie Mae, 4.56%, 2015 | | | 2,124,623 | | | | 2,266,636 | |
| Fannie Mae, 4.62%, 2015 | | | 3,035,425 | | | | 3,194,888 | |
| Fannie Mae, 4.665%, 2015 | | | 1,436,800 | | | | 1,521,654 | |
| Fannie Mae, 4.74%, 2015 | | | 1,636,106 | | | | 1,740,515 | |
| Fannie Mae, 4.78%, 2015 | | | 1,773,384 | | | | 1,899,777 | |
| Fannie Mae, 4.79%, 2015 | | | 1,840,783 | | | | 1,973,847 | |
| Fannie Mae, 4.81%, 2015 | | | 1,706,574 | | | | 1,828,751 | |
| Fannie Mae, 4.815%, 2015 | | | 1,892,175 | | | | 2,018,145 | |
| Fannie Mae, 4.85%, 2015 | | | 1,315,302 | | | | 1,391,889 | |
| Fannie Mae, 4.87%, 2015 | | | 1,253,006 | | | | 1,336,885 | |
| Fannie Mae, 4.89%, 2015 | | | 1,160,810 | | | | 1,232,330 | |
| Fannie Mae, 4.921%, 2015 | | | 2,525,219 | | | | 2,716,433 | |
| Fannie Mae, 5.464%, 2015 | | | 4,973,960 | | | | 5,439,125 | |
| Fannie Mae, 5.08%, 2016 - 2019 | | | 1,977,436 | | | | 2,189,547 | |
| Fannie Mae, 5.09%, 2016 | | | 598,850 | | | | 661,762 | |
| Fannie Mae, 5.135%, 2016 | | | 952,094 | | | | 1,056,320 | |
| Fannie Mae, 5.27%, 2016 | | | 632,185 | | | | 728,574 | |
| Fannie Mae, 5.273%, 2016 | | | 1,302,921 | | | | 1,447,140 | |
| Fannie Mae, 5.35%, 2016 | | | 1,740,490 | | | | 1,933,776 | |
| Fannie Mae, 5.424%, 2016 | | | 4,113,366 | | | | 4,599,287 | |
| Fannie Mae, 5.45%, 2016 | | | 690,000 | | | | 778,227 | |
| Fannie Mae, 5.725%, 2016 | | | 3,606,700 | | | | 4,068,776 | |
| Fannie Mae, 6.5%, 2016 - 2037 | | | 9,416,929 | | | | 10,566,021 | |
| Fannie Mae, 1.963%, 2017 | | | 819,535 | | | | 843,053 | |
| Fannie Mae, 3.308%, 2017 | | | 4,832,626 | | | | 5,267,506 | |
| Fannie Mae, 4.992%, 2017 | | | 4,252,428 | | | | 4,510,139 | |
| Fannie Mae, 5.05%, 2017 | | | 2,254,861 | | | | 2,498,711 | |
| Fannie Mae, 5.3%, 2017 | | | 734,489 | | | | 818,277 | |
| Fannie Mae, 5.38%, 2017 | | | 1,940,500 | | | | 2,169,454 | |
| Fannie Mae, 5.5%, 2017 - 2038 | | | 99,157,442 | | | | 108,625,931 | |
| Fannie Mae, 5.505%, 2017 | | | 1,354,536 | | | | 1,516,094 | |
| Fannie Mae, 6%, 2017 - 2037 | | | 23,771,048 | | | | 26,415,029 | |
12
Portfolio of Investments – continued
| | | | | | | | |
| Issuer | | Shares/Par | | | Value ($) | |
| Bonds - continued | | | | | | | | |
| Mortgage-Backed - continued | | | | | | | | |
| Fannie Mae, 2.578%, 2018 | | $ | 9,100,000 | | | $ | 9,711,393 | |
| Fannie Mae, 3.926%, 2018 | | | 1,701,784 | | | | 1,886,850 | |
| Fannie Mae, 4.04%, 2018 | | | 1,621,173 | | | | 1,801,733 | |
| Fannie Mae, 4.123%, 2018 | | | 1,600,000 | | | | 1,794,062 | |
| Fannie Mae, 4.133%, 2018 | | | 1,592,080 | | | | 1,780,610 | |
| Fannie Mae, 4.329%, 2018 | | | 894,035 | | | | 1,006,736 | |
| Fannie Mae, 5.16%, 2018 | | | 793,625 | | | | 866,550 | |
| Fannie Mae, 5.37%, 2018 | | | 1,880,000 | | | | 2,131,107 | |
| Fannie Mae, 5.68%, 2018 | | | 1,100,711 | | | | 1,249,923 | |
| Fannie Mae, 2.511%, 2019 | | | 1,303,167 | | | | 1,378,026 | |
| Fannie Mae, 4.5%, 2019 - 2041 | | | 33,634,239 | | | | 36,568,674 | |
| Fannie Mae, 4.825%, 2019 | | | 1,180,000 | | | | 1,364,873 | |
| Fannie Mae, 4.84%, 2019 | | | 601,928 | | | | 690,571 | |
| Fannie Mae, 4.876%, 2019 | | | 5,202,929 | | | | 6,001,171 | |
| Fannie Mae, 4.991%, 2019 | | | 1,579,064 | | | | 1,819,433 | |
| Fannie Mae, 5%, 2019 - 2041 | | | 64,255,734 | | | | 69,874,704 | |
| Fannie Mae, 5.104%, 2019 | | | 418,665 | | | | 479,083 | |
| Fannie Mae, 5.218%, 2019 | | | 721,356 | | | | 822,906 | |
| Fannie Mae, 5.28%, 2019 | | | 570,599 | | | | 653,555 | |
| Fannie Mae, 5.47%, 2019 | | | 380,632 | | | | 431,158 | |
| Fannie Mae, 5.6%, 2019 | | | 1,289,724 | | | | 1,451,036 | |
| Fannie Mae, 3.999%, 2020 | | | 1,839,480 | | | | 2,056,834 | |
| Fannie Mae, 4.278%, 2020 | | | 1,428,831 | | | | 1,619,482 | |
| Fannie Mae, 4.88%, 2020 | | | 855,498 | | | | 955,152 | |
| Fannie Mae, 5.19%, 2020 | | | 1,950,888 | | | | 2,227,954 | |
| Fannie Mae, 7.5%, 2024 - 2031 | | | 363,469 | | | | 442,301 | |
| Fannie Mae, 4.5%, 2025 | | | 1,567,394 | | | | 1,691,010 | |
| Fannie Mae, 3%, 2027 | | | 1,702,889 | | | | 1,795,484 | |
| Fannie Mae, 4%, 2041 | | | 29,509,027 | | | | 31,485,078 | |
| Fannie Mae, 3.5%, 2042 | | | 11,237,827 | | | | 11,951,025 | |
| Fannie Mae, TBA, 2.5%, 2028 | | | 2,070,000 | | | | 2,149,889 | |
| Fannie Mae, TBA, 3%, 2028 - 2043 | | | 103,220,292 | | | | 106,836,585 | |
| Fannie Mae, TBA, 3.5%, 2043 | | | 55,920,000 | | | | 59,042,150 | |
| Fannie Mae, TBA, 4.5%, 2043 | | | 8,724,000 | | | | 9,365,350 | |
| Freddie Mac, 1.655%, 2016 | | | 8,873,478 | | | | 9,128,342 | |
| Freddie Mac, 5%, 2016 - 2040 | | | 20,015,302 | | | | 21,517,715 | |
| Freddie Mac, 6.5%, 2016 - 2038 | | | 2,898,151 | | | | 3,221,233 | |
| Freddie Mac, 6%, 2017 - 2038 | | | 21,107,301 | | | | 23,289,211 | |
| Freddie Mac, 2.303%, 2018 | | | 2,438,882 | | | | 2,556,670 | |
| Freddie Mac, 2.323%, 2018 | | | 4,783,000 | | | | 5,019,634 | |
| Freddie Mac, 2.412%, 2018 | | | 7,000,000 | | | | 7,338,527 | |
| Freddie Mac, 3.154%, 2018 | | | 5,293,000 | | | | 5,753,639 | |
| Freddie Mac, 1.883%, 2019 | | | 1,100,000 | | | | 1,124,239 | |
13
Portfolio of Investments – continued
| | | | | | | | |
| Issuer | | Shares/Par | | | Value ($) | |
| Bonds - continued | | | | | | | | |
| Mortgage-Backed - continued | | | | | | | | |
| Freddie Mac, 2.13%, 2019 | | $ | 10,400,000 | | | $ | 10,801,534 | |
| Freddie Mac, 4.186%, 2019 | | | 2,800,000 | | | | 3,206,070 | |
| Freddie Mac, 5.085%, 2019 | | | 6,865,000 | | | | 8,071,242 | |
| Freddie Mac, 2.757%, 2020 | | | 7,262,288 | | | | 7,703,988 | |
| Freddie Mac, 3.32%, 2020 | | | 7,397,245 | | | | 8,000,764 | |
| Freddie Mac, 4.224%, 2020 | | | 4,281,146 | | | | 4,924,345 | |
| Freddie Mac, 4.251%, 2020 | | | 3,106,000 | | | | 3,575,090 | |
| Freddie Mac, 5.5%, 2021 - 2038 | | | 25,181,079 | | | | 27,672,608 | |
| Freddie Mac, 4.5%, 2022 - 2041 | | | 17,525,456 | | | | 18,740,218 | |
| Freddie Mac, 4%, 2025 | | | 5,536,738 | | | | 5,884,946 | |
| Freddie Mac, 3.5%, 2041 - 2042 | | | 14,827,867 | | | | 15,711,323 | |
| Freddie Mac, 3.882%, 2048 | | | 5,323,000 | | | | 5,932,845 | |
| Freddie Mac, TBA, 2.5%, 2028 | | | 65,880,000 | | | | 68,205,122 | |
| Freddie Mac, TBA, 3%, 2043 | | | 20,260,000 | | | | 20,817,150 | |
| Freddie Mac, TBA, 3.5%, 2043 | | | 40,890,000 | | | | 43,043,112 | |
| Ginnie Mae, 4.5%, 2033 - 2041 | | | 36,308,336 | | | | 40,038,134 | |
| Ginnie Mae, 5.5%, 2033 - 2042 | | | 17,874,994 | | | | 19,679,987 | |
| Ginnie Mae, 4%, 2039 - 2040 | | | 4,188,054 | | | | 4,577,755 | |
| Ginnie Mae, 3.5%, 2041 - 2042 | | | 10,733,585 | | | | 11,675,982 | |
| Ginnie Mae, 3%, 2043 | | | 35,030,000 | | | | 36,682,978 | |
| Ginnie Mae, 5.612%, 2058 | | | 8,533,374 | | | | 9,071,360 | |
| Ginnie Mae, 6.357%, 2058 | | | 3,981,367 | | | | 4,288,864 | |
| Ginnie Mae, TBA, 3%, 2043 | | | 35,220,000 | | | | 36,831,944 | |
| Ginnie Mae, TBA, 3.5%, 2043 | | | 19,480,000 | | | | 20,874,038 | |
| | | | | | | | |
| | | | | | | $ | 1,139,289,479 | |
| U.S. Government Agencies and Equivalents - 2.2% | | | | | | | | |
| Aid-Egypt, 4.45%, 2015 | | $ | 6,204,000 | | | $ | 6,859,552 | |
| Freddie Mac, 2.375%, 2022 | | | 11,320,000 | | | | 11,758,616 | |
| Small Business Administration, 6.35%, 2021 | | | 775,315 | | | | 862,613 | |
| Small Business Administration, 6.34%, 2021 | | | 761,661 | | | | 844,391 | |
| Small Business Administration, 6.44%, 2021 | | | 782,021 | | | | 874,230 | |
| Small Business Administration, 6.625%, 2021 | | | 817,853 | | | | 918,305 | |
| Small Business Administration, 6.07%, 2022 | | | 849,395 | | | | 942,518 | |
| Small Business Administration, 4.98%, 2023 | | | 1,112,874 | | | | 1,235,066 | |
| Small Business Administration, 4.89%, 2023 | | | 2,754,709 | | | | 3,054,608 | |
| Small Business Administration, 4.77%, 2024 | | | 2,404,226 | | | | 2,619,453 | |
| Small Business Administration, 5.52%, 2024 | | | 1,655,205 | | | | 1,870,620 | |
| Small Business Administration, 4.99%, 2024 | | | 2,292,111 | | | | 2,570,026 | |
| Small Business Administration, 4.86%, 2024 | | | 1,647,066 | | | | 1,840,818 | |
| Small Business Administration, 4.86%, 2025 | | | 2,506,239 | | | | 2,799,292 | |
| Small Business Administration, 5.11%, 2025 | | | 2,303,885 | | | | 2,584,281 | |
| Small Business Administration, 2.21%, 2033 | | | 3,406,000 | | | | 3,452,222 | |
14
Portfolio of Investments – continued
| | | | | | | | |
| Issuer | | Shares/Par | | | Value ($) | |
| Bonds - continued | | | | | | | | |
| U.S. Government Agencies and Equivalents - continued | |
| U.S. Department of Housing & Urban Development, 6.36%, 2016 | | $ | 486,000 | | | $ | 490,233 | |
| U.S. Department of Housing & Urban Development, 6.59%, 2016 | | | 201,000 | | | | 202,400 | |
| | | | | | | | |
| | | | | | | $ | 45,779,244 | |
| U.S. Treasury Obligations - 33.5% | | | | | | | | |
| U.S. Treasury Bonds, 7.5%, 2016 | | $ | 3,421,000 | | | $ | 4,299,236 | |
| U.S. Treasury Bonds, 6.25%, 2023 | | | 1,445,000 | | | | 2,044,900 | |
| U.S. Treasury Bonds, 6%, 2026 | | | 5,933,000 | | | | 8,439,693 | |
| U.S. Treasury Bonds, 6.75%, 2026 | | | 6,811,000 | | | | 10,339,949 | |
| U.S. Treasury Bonds, 6.375%, 2027 | | | 2,309,000 | | | | 3,433,194 | |
| U.S. Treasury Bonds, 5.25%, 2029 | | | 2,438,000 | | | | 3,303,490 | |
| U.S. Treasury Bonds, 4.5%, 2036 | | | 2,662,000 | | | | 3,396,547 | |
| U.S. Treasury Bonds, 5%, 2037 | | | 4,133,000 | | | | 5,655,105 | |
| U.S. Treasury Bonds, 4.375%, 2038 | | | 3,297,000 | | | | 4,142,885 | |
| U.S. Treasury Bonds, 4.5%, 2039 | | | 57,581,300 | | | | 73,919,994 | |
| U.S. Treasury Notes, 3.625%, 2013 | | | 5,523,000 | | | | 5,562,915 | |
| U.S. Treasury Notes, 3.375%, 2013 | | | 2,594,000 | | | | 2,629,162 | |
| U.S. Treasury Notes, 4%, 2014 | | | 2,232,000 | | | | 2,313,696 | |
| U.S. Treasury Notes, 1.875%, 2014 | | | 167,789,000 | | | | 170,613,896 | |
| U.S. Treasury Notes, 1.875%, 2014 | | | 16,258,000 | | | | 16,574,901 | |
| U.S. Treasury Notes, 2.625%, 2014 | | | 16,750,000 | | | | 17,287,826 | |
| U.S. Treasury Notes, 4%, 2015 | | | 13,740,000 | | | | 14,746,345 | |
| U.S. Treasury Notes, 2.125%, 2015 | | | 161,986,000 | | | | 168,705,827 | |
| U.S. Treasury Notes, 2.625%, 2016 | | | 4,787,000 | | | | 5,122,090 | |
| U.S. Treasury Notes, 0.875%, 2016 | | | 104,653,000 | | | | 106,067,490 | |
| U.S. Treasury Notes, 4.75%, 2017 | | | 11,447,000 | | | | 13,516,400 | |
| U.S. Treasury Notes, 2.625%, 2018 | | | 2,713,000 | | | | 2,963,318 | |
| U.S. Treasury Notes, 2.75%, 2019 | | | 1,746,600 | | | | 1,925,082 | |
| U.S. Treasury Notes, 3.125%, 2019 | | | 12,026,000 | | | | 13,548,035 | |
| U.S. Treasury Notes, 3.5%, 2020 | | | 6,007,000 | | | | 6,928,702 | |
| U.S. Treasury Notes, 2.625%, 2020 | | | 1,329,000 | | | | 1,449,441 | |
| U.S. Treasury Notes, 3.125%, 2021 | | | 30,808,000 | | | | 34,634,939 | |
| U.S. Treasury Notes, 1.75%, 2022 | | | 1,660,000 | | | | 1,658,443 | |
| | | | | | | | |
| | | | | | | $ | 705,223,501 | |
| Total Bonds (Identified Cost, $1,957,308,620) | | | | | | $ | 2,050,100,104 | |
15
Portfolio of Investments – continued
| | | | | | | | |
| Money Market Funds - 22.6% | | | | | | | | |
| Issuer | | Shares/Par | | | Value ($) | |
MFS Institutional Money Market Portfolio, 0.13%,
at Cost and Net Asset Value (v) | | | 473,727,945 | | | $ | 473,727,945 | |
| Total Investments (Identified Cost, $2,431,036,565) | | | | | | $ | 2,523,828,049 | |
| | |
| Other Assets, Less Liabilities - (20.1)% | | | | | | | (421,874,760 | ) |
| Net Assets - 100.0% | | | | | | $ | 2,101,953,289 | |
| (v) | Underlying affiliated fund that is available only to investment companies managed by MFS. The rate quoted for the MFS Institutional Money Market Portfolio is the annualized seven-day yield of the fund at period end. |
The following abbreviations are used in this report and are defined:
| FRN | | Floating Rate Note. Interest rate resets periodically and may not be the rate reported at period end. |
| STRIPS | | Separate Trading of Registered Interest and Principal of Securities |
See Notes to Financial Statements
16
Financial Statements
STATEMENT OF ASSETS AND LIABILITIES
At 2/28/13
This statement represents your fund’s balance sheet, which details the assets and liabilities comprising the total value of the fund.
| | | | |
| Assets | | | | |
Investments- | | | | |
Non-affiliated issuers, at value (identified cost, $1,957,308,620) | | | $2,050,100,104 | |
Underlying affiliated funds, at cost and value | | | 473,727,945 | |
Total investments, at value (identified cost, $2,431,036,565) | | | $2,523,828,049 | |
Receivables for | | | | |
Investments sold | | | 31,583,253 | |
Fund shares sold | | | 15,859,914 | |
Interest | | | 7,534,564 | |
Other assets | | | 13,697 | |
Total assets | | | $2,578,819,477 | |
| Liabilities | | | | |
Payables for | | | | |
Distributions | | | $586,873 | |
Investments purchased | | | 109,956,916 | |
TBA purchase commitments | | | 357,844,084 | |
Fund shares reacquired | | | 7,194,732 | |
Payable to affiliates | | | | |
Investment adviser | | | 47,429 | |
Shareholder servicing costs | | | 882,450 | |
Distribution and service fees | | | 28,756 | |
Payable for independent Trustees’ compensation | | | 62,845 | |
Accrued expenses and other liabilities | | | 262,103 | |
Total liabilities | | | $476,866,188 | |
Net assets | | | $2,101,953,289 | |
| Net assets consist of | | | | |
Paid-in capital | | | $2,034,169,208 | |
Unrealized appreciation (depreciation) on investments | | | 92,791,484 | |
Accumulated distributions in excess of net realized gain on investments | | | (24,084,897 | ) |
Accumulated distributions in excess of net investment income | | | (922,506 | ) |
Net assets | | | $2,101,953,289 | |
Shares of beneficial interest outstanding | | | 202,024,838 | |
17
Statement of Assets and Liabilities – continued
| | | | | | | | | | | | |
| | | Net assets | | | Shares
outstanding | | | Net asset value
per share (a) | |
| Class A | | | $847,275,781 | | | | 81,411,756 | | | | $10.41 | |
| Class B | | | 44,012,416 | | | | 4,234,269 | | | | 10.39 | |
| Class C | | | 101,229,156 | | | | 9,706,916 | | | | 10.43 | |
| Class I | | | 40,628,401 | | | | 3,904,058 | | | | 10.41 | |
| Class R1 | | | 6,646,940 | | | | 639,312 | | | | 10.40 | |
| Class R2 | | | 165,864,933 | | | | 15,953,437 | | | | 10.40 | |
| Class R3 | | | 104,515,218 | | | | 10,044,782 | | | | 10.40 | |
| Class R4 | | | 70,661,756 | | | | 6,787,340 | | | | 10.41 | |
| Class R5 | | | 721,118,688 | | | | 69,342,968 | | | | 10.40 | |
| (a) | Maximum offering price per share was equal to the net asset value per share for all share classes, except for Class A, for which the maximum offering price per share was $10.93 [100 / 95.25 x $10.41]. On sales of $50,000 or more, the maximum offering price of Class A shares is reduced. A contingent deferred sales charge may be imposed on redemptions of Class A, Class B, and Class C shares. Redemption price per share was equal to the net asset value per share for Classes I, R1, R2, R3, R4, and R5. |
See Notes to Financial Statements
18
Financial Statements
STATEMENT OF OPERATIONS
Year ended 2/28/13
This statement describes how much your fund earned in investment income and accrued in expenses. It also describes any gains and/or losses generated by fund operations.
| | | | |
| Net investment income | | | | |
Income | | | | |
Interest | | | $56,117,359 | |
Dividends from underlying affiliated funds | | | 339,340 | |
Total investment income | | | $56,456,699 | |
Expenses | | | | |
Management fee | | | $8,367,143 | |
Distribution and service fees | | | 5,160,127 | |
Shareholder servicing costs | | | 3,074,082 | |
Administrative services fee | | | 297,896 | |
Independent Trustees’ compensation | | | 44,496 | |
Custodian fee | | | 226,164 | |
Shareholder communications | | | 235,623 | |
Audit and tax fees | | | 58,057 | |
Legal fees | | | 25,734 | |
Miscellaneous | | | 273,598 | |
Total expenses | | | $17,762,920 | |
Fees paid indirectly | | | (42 | ) |
Reduction of expenses by investment adviser | | | (6,926 | ) |
Net expenses | | | $17,755,952 | |
Net investment income | | | $38,700,747 | |
| Realized and unrealized gain (loss) on investments | | | | |
Realized gain (loss) (identified cost basis) | | | | |
Investments | | | $11,420,268 | |
Futures contracts | | | 358,708 | |
Net realized gain (loss) on investments | | | $11,778,976 | |
Change in unrealized appreciation (depreciation) | | | | |
Investments | | | $(15,028,666 | ) |
Futures contracts | | | 5,908 | |
Net unrealized gain (loss) on investments | | | $(15,022,758 | ) |
Net realized and unrealized gain (loss) on investments | | | $(3,243,782 | ) |
Change in net assets from operations | | | $35,456,965 | |
See Notes to Financial Statements
19
Financial Statements
STATEMENTS OF CHANGES IN NET ASSETS
These statements describe the increases and/or decreases in net assets resulting from operations, any distributions, and any shareholder transactions.
| | | | | | | | |
| | | Years ended 2/28, 2/29 | |
| | | 2013 | | | 2012 | |
| Change in net assets | | | | | | |
| From operations | | | | | | | | |
Net investment income | | | $38,700,747 | | | | $44,036,877 | |
Net realized gain (loss) on investments | | | 11,778,976 | | | | 33,675,568 | |
Net unrealized gain (loss) on investments | | | (15,022,758 | ) | | | 47,813,743 | |
Change in net assets from operations | | | $35,456,965 | | | | $125,526,188 | |
| Distributions declared to shareholders | | | | | | | | |
From net investment income | | | $(53,090,312 | ) | | | $(52,285,367 | ) |
From net realized gain on investments | | | (9,521,417 | ) | | | — | |
Total distributions declared to shareholders | | | $(62,611,729 | ) | | | $(52,285,367 | ) |
Change in net assets from fund share transactions | | | $89,399,813 | | | | $222,403,035 | |
Total change in net assets | | | $62,245,049 | | | | $295,643,856 | |
| Net assets | | | | | | | | |
At beginning of period | | | 2,039,708,240 | | | | 1,744,064,384 | |
At end of period (including accumulated distributions in excess of net investment income of $922,506 and undistributed net investment income of $1,226,190, respectively) | | | $2,101,953,289 | | | | $2,039,708,240 | |
See Notes to Financial Statements
20
Financial Statements
FINANCIAL HIGHLIGHTS
The financial highlights table is intended to help you understand the fund’s financial performance for the past 5 years (or life of a particular share class, if shorter). Certain information reflects financial results for a single fund share. The total returns in the table represent the rate by which an investor would have earned (or lost) on an investment in the fund share class (assuming reinvestment of all distributions) held for the entire period.
| | | | | | | | | | | | | | | | | | | | |
| Class A | | Years ended 2/29, 2/28 | |
| | | 2013 | | | 2012 | | | 2011 | | | 2010 | | | 2009 | |
Net asset value, beginning of period | | | $10.54 | | | | $10.13 | | | | $10.15 | | | | $9.92 | | | | $9.78 | |
| Income (loss) from investment operations | | | | | | | | | | | | | |
Net investment income (d) | | | $0.20 | | | | $0.25 | | | | $0.30 | | | | $0.35 | | | | $0.39 | |
Net realized and unrealized gain (loss)
on investments | | | (0.02 | ) | | | 0.46 | | | | (0.00 | )(w) | | | 0.27 | | | | 0.17 | |
Total from investment operations | | | $0.18 | | | | $0.71 | | | | $0.30 | | | | $0.62 | | | | $0.56 | |
| Less distributions declared to shareholders | | | | | | | | | | | | | |
From net investment income | | | $(0.26 | ) | | | $(0.30 | ) | | | $(0.32 | ) | | | $(0.39 | ) | | | $(0.42 | ) |
From net realized gain on investments | | | (0.05 | ) | | | — | | | | — | | | | — | | | | — | |
Total distributions declared to shareholders | | | $(0.31 | ) | | | $(0.30 | ) | | | $(0.32 | ) | | | $(0.39 | ) | | | $(0.42 | ) |
Net asset value, end of period (x) | | | $10.41 | | | | $10.54 | | | | $10.13 | | | | $10.15 | | | | $9.92 | |
Total return (%) (r)(s)(t)(x) | | | 1.74 | | | | 7.04 | | | | 2.96 | | | | 6.31 | | | | 5.95 | |
Ratios (%) (to average net assets)
and Supplemental data: | | | | | | | | | | | | | | | | | | | | |
Expenses before expense reductions (f) | | | 0.87 | | | | 0.86 | | | | 0.87 | | | | 0.88 | | | | 0.91 | |
Expenses after expense reductions (f) | | | 0.87 | | | | 0.86 | | | | 0.87 | | | | 0.88 | | | | 0.80 | |
Net investment income | | | 1.88 | | | | 2.39 | | | | 2.88 | | | | 3.49 | | | | 3.98 | |
Portfolio turnover | | | 81 | | | | 49 | | | | 34 | | | | 32 | | | | 57 | |
Net assets at end of period (000 omitted) | | | $847,276 | | | | $981,980 | | | | $915,576 | | | | $923,918 | | | | $888,523 | |
See Notes to Financial Statements
21
Financial Highlights – continued
| | | | | | | | | | | | | | | | | | | | |
| Class B | | Years ended 2/29, 2/28 | |
| | | 2013 | | | 2012 | | | 2011 | | | 2010 | | | 2009 | |
Net asset value, beginning of period | | | $10.53 | | | | $10.11 | | | | $10.14 | | | | $9.91 | | | | $9.77 | |
| Income (loss) from investment operations | | | | | | | | | | | | | |
Net investment income (d) | | | $0.12 | | | | $0.17 | | | | $0.22 | | | | $0.28 | | | | $0.32 | |
Net realized and unrealized gain (loss)
on investments | | | (0.03 | ) | | | 0.47 | | | | (0.01 | ) | | | 0.26 | | | | 0.17 | |
Total from investment operations | | | $0.09 | | | | $0.64 | | | | $0.21 | | | | $0.54 | | | | $0.49 | |
| Less distributions declared to shareholders | | | | | | | | | | | | | |
From net investment income | | | $(0.18 | ) | | | $(0.22 | ) | | | $(0.24 | ) | | | $(0.31 | ) | | | $(0.35 | ) |
From net realized gain on investments | | | (0.05 | ) | | | — | | | | — | | | | — | | | | — | |
Total distributions declared to shareholders | | | $(0.23 | ) | | | $(0.22 | ) | | | $(0.24 | ) | | | $(0.31 | ) | | | $(0.35 | ) |
Net asset value, end of period (x) | | | $10.39 | | | | $10.53 | | | | $10.11 | | | | $10.14 | | | | $9.91 | |
Total return (%) (r)(s)(t)(x) | | | 0.88 | | | | 6.35 | | | | 2.09 | | | | 5.52 | | | | 5.16 | |
Ratios (%) (to average net assets)
and Supplemental data: | | | | | | | | | | | | | | | | | | | | |
Expenses before expense reductions (f) | | | 1.62 | | | | 1.61 | | | | 1.62 | | | | 1.63 | | | | 1.66 | |
Expenses after expense reductions (f) | | | 1.62 | | | | 1.61 | | | | 1.62 | | | | 1.63 | | | | 1.55 | |
Net investment income | | | 1.13 | | | | 1.66 | | | | 2.15 | | | | 2.75 | | | | 3.25 | |
Portfolio turnover | | | 81 | | | | 49 | | | | 34 | | | | 32 | | | | 57 | |
Net assets at end of period (000 omitted) | | | $44,012 | | | | $46,645 | | | | $53,577 | | | | $74,842 | | | | $102,852 | |
| |
| Class C | | Years ended 2/29, 2/28 | |
| | | 2013 | | | 2012 | | | 2011 | | | 2010 | | | 2009 | |
Net asset value, beginning of period | | | $10.57 | | | | $10.15 | | | | $10.17 | | | | $9.95 | | | | $9.81 | |
| Income (loss) from investment operations | | | | | | | | | | | | | | | | | |
Net investment income (d) | | | $0.12 | | | | $0.17 | | | | $0.22 | | | | $0.27 | | | | $0.31 | |
Net realized and unrealized gain (loss)
on investments | | | (0.02 | ) | | | 0.47 | | | | (0.00 | )(w) | | | 0.26 | | | | 0.18 | |
Total from investment operations | | | $0.10 | | | | $0.64 | | | | $0.22 | | | | $0.53 | | | | $0.49 | |
| Less distributions declared to shareholders | | | | | | | | | | | | | | | | | |
From net investment income | | | $(0.19 | ) | | | $(0.22 | ) | | | $(0.24 | ) | | | $(0.31 | ) | | | $(0.35 | ) |
From net realized gain on investments | | | (0.05 | ) | | | — | | | | — | | | | — | | | | — | |
Total distributions declared to shareholders | | | $(0.24 | ) | | | $(0.22 | ) | | | $(0.24 | ) | | | $(0.31 | ) | | | $(0.35 | ) |
Net asset value, end of period (x) | | | $10.43 | | | | $10.57 | | | | $10.15 | | | | $10.17 | | | | $9.95 | |
Total return (%) (r)(s)(t)(x) | | | 0.88 | | | | 6.33 | | | | 2.19 | | | | 5.40 | | | | 5.16 | |
Ratios (%) (to average net assets)
and Supplemental data: | | | | | | | | | | | | | | | | | | | | |
Expenses before expense reductions (f) | | | 1.62 | | | | 1.61 | | | | 1.62 | | | | 1.62 | | | | 1.66 | |
Expenses after expense reductions (f) | | | 1.62 | | | | 1.61 | | | | 1.62 | | | | 1.62 | | | | 1.55 | |
Net investment income | | | 1.13 | | | | 1.64 | | | | 2.12 | | | | 2.71 | | | | 3.21 | |
Portfolio turnover | | | 81 | | | | 49 | | | | 34 | | | | 32 | | | | 57 | |
Net assets at end of period (000 omitted) | | | $101,229 | | | | $112,961 | | | | $111,328 | | | | $116,622 | | | | $92,046 | |
See Notes to Financial Statements
22
Financial Highlights – continued
| | | | | | | | | | | | | | | | | | | | |
| Class I | | Years ended 2/29, 2/28 | |
| | | 2013 | | | 2012 | | | 2011 | | | 2010 | | | 2009 | |
Net asset value, beginning of period | | | $10.54 | | | | $10.12 | | | | $10.15 | | | | $9.92 | | | | $9.78 | |
| Income (loss) from investment operations | | | | | | | | | | | | | |
Net investment income (d) | | | $0.25 | | | | $0.27 | | | | $0.32 | | | | $0.38 | | | | $0.41 | |
Net realized and unrealized gain (loss)
on investments | | | (0.04 | ) | | | 0.47 | | | | (0.00 | )(w) | | | 0.26 | | | | 0.18 | |
Total from investment operations | | | $0.21 | | | | $0.74 | | | | $0.32 | | | | $0.64 | | | | $0.59 | |
| Less distributions declared to shareholders | | | | | | | | | | | | | |
From net investment income | | | $(0.29 | ) | | | $(0.32 | ) | | | $(0.35 | ) | | | $(0.41 | ) | | | $(0.45 | ) |
From net realized gain on investments | | | (0.05 | ) | | | — | | | | — | | | | — | | | | — | |
Total distributions declared to shareholders | | | $(0.34 | ) | | | $(0.32 | ) | | | $(0.35 | ) | | | $(0.41 | ) | | | $(0.45 | ) |
Net asset value, end of period (x) | | | $10.41 | | | | $10.54 | | | | $10.12 | | | | $10.15 | | | | $9.92 | |
Total return (%) (r)(s)(x) | | | 1.99 | | | | 7.41 | | | | 3.11 | | | | 6.57 | | | | 6.21 | |
Ratios (%) (to average net assets)
and Supplemental data: | | | | | | | | | | | | | | | | | | | | |
Expenses before expense reductions (f) | | | 0.59 | | | | 0.61 | | | | 0.62 | | | | 0.63 | | | | 0.66 | |
Expenses after expense reductions (f) | | | 0.59 | | | | 0.60 | | | | 0.62 | | | | 0.63 | | | | 0.55 | |
Net investment income | | | 2.33 | | | | 2.64 | | | | 3.13 | | | | 3.73 | | | | 4.26 | |
Portfolio turnover | | | 81 | | | | 49 | | | | 34 | | | | 32 | | | | 57 | |
Net assets at end of period (000 omitted) | | | $40,628 | | | | $562,634 | | | | $434,682 | | | | $318,667 | | | | $286,371 | |
| |
| Class R1 | | Years ended 2/29, 2/28 | |
| | | 2013 | | | 2012 | | | 2011 | | | 2010 | | | 2009 | |
Net asset value, beginning of period | | | $10.53 | | | | $10.11 | | | | $10.14 | | | | $9.91 | | | | $9.77 | |
| Income (loss) from investment operations | | | | | | | | | | | | | |
Net investment income (d) | | | $0.12 | | | | $0.17 | | | | $0.22 | | | | $0.28 | | | | $0.32 | |
Net realized and unrealized gain (loss)
on investments | | | (0.02 | ) | | | 0.47 | | | | (0.01 | ) | | | 0.26 | | | | 0.17 | |
Total from investment operations | | | $0.10 | | | | $0.64 | | | | $0.21 | | | | $0.54 | | | | $0.49 | |
| Less distributions declared to shareholders | | | | | | | | | | | | | |
From net investment income | | | $(0.18 | ) | | | $(0.22 | ) | | | $(0.24 | ) | | | $(0.31 | ) | | | $(0.35 | ) |
From net realized gain on investments | | | (0.05 | ) | | | — | | | | — | | | | — | | | | — | |
Total distributions declared to shareholders | | | $(0.23 | ) | | | $(0.22 | ) | | | $(0.24 | ) | | | $(0.31 | ) | | | $(0.35 | ) |
Net asset value, end of period (x) | | | $10.40 | | | | $10.53 | | | | $10.11 | | | | $10.14 | | | | $9.91 | |
Total return (%) (r)(s)(x) | | | 0.98 | | | | 6.35 | | | | 2.09 | | | | 5.52 | | | | 5.16 | |
Ratios (%) (to average net assets)
and Supplemental data: | | | | | | | | | | | | | | | | | | | | |
Expenses before expense reductions (f) | | | 1.62 | | | | 1.61 | | | | 1.62 | | | | 1.63 | | | | 1.66 | |
Expenses after expense reductions (f) | | | 1.62 | | | | 1.61 | | | | 1.62 | | | | 1.63 | | | | 1.55 | |
Net investment income | | | 1.14 | | | | 1.64 | | | | 2.14 | | | | 2.74 | | | | 3.24 | |
Portfolio turnover | | | 81 | | | | 49 | | | | 34 | | | | 32 | | | | 57 | |
Net assets at end of period (000 omitted) | | | $6,647 | | | | $7,902 | | | | $7,219 | | | | $6,246 | | | | $5,713 | |
See Notes to Financial Statements
23
Financial Highlights – continued
| | | | | | | | | | | | | | | | | | | | |
| Class R2 | | Years ended 2/29, 2/28 | |
| | | 2013 | | | 2012 | | | 2011 | | | 2010 | | | 2009 | |
Net asset value, beginning of period | | | $10.53 | | | | $10.11 | | | | $10.14 | | | | $9.91 | | | | $9.77 | |
| Income (loss) from investment operations | | | | | | | | | | | | | |
Net investment income (d) | | | $0.17 | | | | $0.22 | | | | $0.27 | | | | $0.32 | | | | $0.36 | |
Net realized and unrealized gain (loss)
on investments | | | (0.01 | ) | | | 0.47 | | | | (0.01 | ) | | | 0.27 | | | | 0.18 | |
Total from investment operations | | | $0.16 | | | | $0.69 | | | | $0.26 | | | | $0.59 | | | | $0.54 | |
| Less distributions declared to shareholders | | | | | | | | | | | | | |
From net investment income | | | $(0.24 | ) | | | $(0.27 | ) | | | $(0.29 | ) | | | $(0.36 | ) | | | $(0.40 | ) |
From net realized gain on investments | | | (0.05 | ) | | | — | | | | — | | | | — | | | | — | |
Total distributions declared to shareholders | | | $(0.29 | ) | | | $(0.27 | ) | | | $(0.29 | ) | | | $(0.36 | ) | | | $(0.40 | ) |
Net asset value, end of period (x) | | | $10.40 | | | | $10.53 | | | | $10.11 | | | | $10.14 | | | | $9.91 | |
Total return (%) (r)(s)(x) | | | 1.48 | | | | 6.88 | | | | 2.60 | | | | 6.04 | | | | 5.69 | |
Ratios (%) (to average net assets)
and Supplemental data: | | | | | | | | | | | | | | | | | | | | |
Expenses before expense reductions (f) | | | 1.12 | | | | 1.11 | | | | 1.12 | | | | 1.13 | | | | 1.16 | |
Expenses after expense reductions (f) | | | 1.12 | | | | 1.11 | | | | 1.12 | | | | 1.12 | | | | 1.05 | |
Net investment income | | | 1.63 | | | | 2.13 | | | | 2.62 | | | | 3.22 | | | | 3.74 | |
Portfolio turnover | | | 81 | | | | 49 | | | | 34 | | | | 32 | | | | 57 | |
Net assets at end of period (000 omitted) | | | $165,865 | | | | $168,809 | | | | $123,672 | | | | $73,052 | | | | $35,616 | |
| |
| Class R3 | | Years ended 2/29, 2/28 | |
| | | 2013 | | | 2012 | | | 2011 | | | 2010 | | | 2009 | |
Net asset value, beginning of period | | | $10.54 | | | | $10.12 | | | | $10.15 | | | | $9.92 | | | | $9.78 | |
| Income (loss) from investment operations | | | | | | | | | | | | | |
Net investment income (d) | | | $0.20 | | | | $0.25 | | | | $0.29 | | | | $0.35 | | | | $0.39 | |
Net realized and unrealized gain (loss)
on investments | | | (0.03 | ) | | | 0.46 | | | | (0.00 | )(w) | | | 0.27 | | | | 0.17 | |
Total from investment operations | | | $0.17 | | | | $0.71 | | | | $0.29 | | | | $0.62 | | | | $0.56 | |
| Less distributions declared to shareholders | | | | | | | | | | | | | |
From net investment income | | | $(0.26 | ) | | | $(0.29 | ) | | | $(0.32 | ) | | | $(0.39 | ) | | | $(0.42 | ) |
From net realized gain on investments | | | (0.05 | ) | | | — | | | | — | | | | — | | | | — | |
Total distributions declared to shareholders | | | $(0.31 | ) | | | $(0.29 | ) | | | $(0.32 | ) | | | $(0.39 | ) | | | $(0.42 | ) |
Net asset value, end of period (x) | | | $10.40 | | | | $10.54 | | | | $10.12 | | | | $10.15 | | | | $9.92 | |
Total return (%) (r)(s)(x) | | | 1.64 | | | | 7.14 | | | | 2.86 | | | | 6.31 | | | | 5.95 | |
Ratios (%) (to average net assets)
and Supplemental data: | | | | | | | | | | | | | | | | | | | | |
Expenses before expense reductions (f) | | | 0.87 | | | | 0.86 | | | | 0.87 | | | | 0.88 | | | | 0.91 | |
Expenses after expense reductions (f) | | | 0.87 | | | | 0.86 | | | | 0.87 | | | | 0.87 | | | | 0.80 | |
Net investment income | | | 1.88 | | | | 2.36 | | | | 2.87 | | | | 3.47 | | | | 3.98 | |
Portfolio turnover | | | 81 | | | | 49 | | | | 34 | | | | 32 | | | | 57 | |
Net assets at end of period (000 omitted) | | | $104,515 | | | | $107,150 | | | | $70,988 | | | | $46,780 | | | | $25,009 | |
See Notes to Financial Statements
24
Financial Highlights – continued
| | | | | | | | | | | | | | | | | | | | |
| Class R4 | | Years ended 2/29, 2/28 | |
| | | 2013 | | | 2012 | | | 2011 | | | 2010 | | | 2009 | |
Net asset value, beginning of period | | | $10.55 | | | | $10.13 | | | | $10.15 | | | | $9.93 | | | | $9.78 | |
| Income (loss) from investment operations | | | | | | | | | | | | | |
Net investment income (d) | | | $0.22 | | | | $0.27 | | | | $0.32 | | | | $0.37 | | | | $0.41 | |
Net realized and unrealized gain (loss)
on investments | | | (0.02 | ) | | | 0.47 | | | | 0.01 | (g) | | | 0.26 | | | | 0.19 | |
Total from investment operations | | | $0.20 | | | | $0.74 | | | | $0.33 | | | | $0.63 | | | | $0.60 | |
| Less distributions declared to shareholders | | | | | | | | | | | | | |
From net investment income | | | $(0.29 | ) | | | $(0.32 | ) | | | $(0.35 | ) | | | $(0.41 | ) | | | $(0.45 | ) |
From net realized gain on investments | | | (0.05 | ) | | | — | | | | — | | | | — | | | | — | |
Total distributions declared to shareholders | | | $(0.34 | ) | | | $(0.32 | ) | | | $(0.35 | ) | | | $(0.41 | ) | | | $(0.45 | ) |
Net asset value, end of period (x) | | | $10.41 | | | | $10.55 | | | | $10.13 | | | | $10.15 | | | | $9.93 | |
Total return (%) (r)(s)(x) | | | 1.89 | | | | 7.40 | | | | 3.22 | | | | 6.46 | | | | 6.32 | |
Ratios (%) (to average net assets)
and Supplemental data: | | | | | | | | | | | | | | | | | | | | |
Expenses before expense reductions (f) | | | 0.62 | | | | 0.60 | | | | 0.63 | | | | 0.63 | | | | 0.66 | |
Expenses after expense reductions (f) | | | 0.62 | | | | 0.60 | | | | 0.63 | | | | 0.62 | | | | 0.55 | |
Net investment income | | | 2.10 | | | | 2.61 | | | | 3.10 | | | | 3.71 | | | | 4.23 | |
Portfolio turnover | | | 81 | | | | 49 | | | | 34 | | | | 32 | | | | 57 | |
Net assets at end of period (000 omitted) | | | $70,662 | | | | $51,626 | | | | $27,022 | | | | $11,337 | | | | $4,361 | |
| | | | |
| Class R5 | | Period ended
2/28/13 (i) | |
Net asset value, beginning of period | | | $10.53 | |
| Income (loss) from investment operations | | | | |
Net investment income (d) | | | $0.13 | |
Net realized and unrealized gain (loss) on investments and foreign currency | | | (0.06 | ) |
Total from investment operations | | | $0.07 | |
| Less distributions declared to shareholders | | | | |
From net investment income | | | $(0.20 | ) |
Net asset value, end of period (x) | | | $10.40 | |
Total return (%) (r)(s)(x) | | | 0.62 | (n) |
Ratios (%) (to average net assets)
and Supplemental data: | | | | |
Expenses before expense reductions (f) | | | 0.54 | (a) |
Expenses after expense reductions (f) | | | 0.54 | (a) |
Net investment income | | | 1.81 | (a) |
Portfolio turnover | | | 81 | (n) |
Net assets at end of period (000 omitted) | | | $721,119 | |
See Notes to Financial Statements
25
Financial Highlights – continued
| (d) | Per share data is based on average shares outstanding. |
| (f) | Ratios do not reflect reductions from fees paid indirectly, if applicable. |
| (g) | The per share amount varies from the net realized and unrealized gain/loss for the period because of the timing of sales of fund shares and the per share amount of realized and unrealized gains and losses at such time. |
| (i) | For the period from the class inception, July 2, 2012, through the stated period end. |
| (r) | Certain expenses have been reduced without which performance would have been lower. |
| (s) | From time to time the fund may receive proceeds from litigation settlements, without which performance would be lower. |
| (t) | Total returns do not include any applicable sales charges. |
| (w) | Per share amount was less than $0.01. |
| (x) | The net asset values per share and total returns have been calculated on net assets which include adjustments made in accordance with U.S. generally accepted accounting principles required at period end for financial reporting purposes. |
See Notes to Financial Statements
26
NOTES TO FINANCIAL STATEMENTS
(1) Business and Organization
MFS Government Securities Fund (the fund) is a series of MFS Series Trust XIII (the trust). The trust is organized as a Massachusetts business trust and is registered under the Investment Company Act of 1940, as amended, as an open-end management investment company.
(2) Significant Accounting Policies
General – The preparation of financial statements in conformity with U.S. generally accepted accounting principles requires management to make estimates and assumptions that affect the reported amounts of assets and liabilities, and disclosure of contingent assets and liabilities at the date of the financial statements and the reported amounts of revenues and expenses during the reporting period. Actual results could differ from those estimates. In the preparation of these financial statements, management has evaluated subsequent events occurring after the date of the fund’s Statement of Assets and Liabilities through the date that the financial statements were issued. The fund invests a significant portion of its assets in asset-backed and/or mortgage-backed securities. The value of these securities may depend, in part, on the issuer’s or borrower’s credit quality or ability to pay principal and interest when due and may fall if an issuer or borrower defaults on its obligation to pay principal or interest or if the instrument’s credit rating is downgraded by a credit rating agency. U.S. Government securities not supported as to the payment of principal or interest by the U.S. Treasury, such as those issued by Fannie Mae, Freddie Mac, and the Federal Home Loan Banks, are subject to greater credit risk than are U.S. Government securities supported by the U.S. Treasury, such as those issued by Ginnie Mae.
In this reporting period the fund adopted Financial Accounting Standards Board (FASB) Accounting Standards Update 2011-04, Fair Value Measurement (Topic 820) – Amendments to Achieve Common Fair Value Measurement and Disclosure Requirements in U.S. GAAP and IFRSs (“ASU 2011-04”). ASU 2011-04 seeks to improve the comparability of fair value measurements as presented and disclosed in financial statements prepared in accordance with U.S. GAAP and International Financial Reporting Standards (IFRS) by providing common requirements for fair value measurement and disclosure.
In January 2013, the FASB issued Accounting Standards Update 2013-01 (“ASU 2013-01”) entitled Balance Sheet (Topic 210) – Clarifying the Scope of Disclosures about Offsetting Assets and Liabilities which is intended to clarify the scope of Accounting Standards Update 2011-11 (“ASU 2011-11”), Balance Sheet (Topic 210) – Disclosures about Offsetting Assets and Liabilities. Consistent with the effective date for ASU 2011-11, ASU 2013-01 is effective for annual reporting periods beginning on or after January 1, 2013, and interim periods within those annual periods. ASU 2013-01 limits the scope of ASU 2011-11’s disclosure requirements on offsetting to financial assets and financial liabilities related to derivatives, repurchase and reverse repurchase agreements, and securities lending and securities borrowing transactions. Although still evaluating the potential impact of these two ASUs to the fund, management expects that the impact of the fund’s adoption will be limited to additional financial statement disclosures.
27
Notes to Financial Statements – continued
Investment Valuations – Debt instruments and floating rate loans (other than short-term instruments), including restricted debt instruments, are generally valued at an evaluated or composite bid as provided by a third-party pricing service. Short-term instruments with a maturity at issuance of 60 days or less generally are valued at amortized cost, which approximates market value. Open-end investment companies are generally valued at net asset value per share. Securities and other assets generally valued on the basis of information from a third-party pricing service may also be valued at a broker/dealer bid quotation. Values obtained from third-party pricing services can utilize both transaction data and market information such as yield, quality, coupon rate, maturity, type of issue, trading characteristics, and other market data.
The Board of Trustees has delegated primary responsibility for determining or causing to be determined the value of the fund’s investments (including any fair valuation) to the adviser pursuant to valuation policies and procedures approved by the Board. If the adviser determines that reliable market quotations are not readily available, investments are valued at fair value as determined in good faith by the adviser in accordance with such procedures under the oversight of the Board of Trustees. Under the fund’s valuation policies and procedures, market quotations are not considered to be readily available for most types of debt instruments and floating rate loans and many types of derivatives. These investments are generally valued at fair value based on information from third-party pricing services. In addition, investments may be valued at fair value if the adviser determines that an investment’s value has been materially affected by events occurring after the close of the exchange or market on which the investment is principally traded (such as foreign exchange or market) and prior to the determination of the fund’s net asset value, or after the halting of trading of a specific security where trading does not resume prior to the close of the exchange or market on which the security is principally traded. The adviser generally relies on third-party pricing services or other information (such as the correlation with price movements of similar securities in the same or other markets; the type, cost and investment characteristics of the security; the business and financial condition of the issuer; and trading and other market data) to assist in determining whether to fair value and at what value to fair value an investment. The value of an investment for purposes of calculating the fund’s net asset value can differ depending on the source and method used to determine value. When fair valuation is used, the value of an investment used to determine the fund’s net asset value may differ from quoted or published prices for the same investment. There can be no assurance that the fund could obtain the fair value assigned to an investment if it were to sell the investment at the same time at which the fund determines its net asset value per share.
Various inputs are used in determining the value of the fund’s assets or liabilities. These inputs are categorized into three broad levels. In certain cases, the inputs used to measure fair value may fall into different levels of the fair value hierarchy. In such cases, an investment’s level within the fair value hierarchy is based on the lowest level of input that is significant to the fair value measurement. The fund’s assessment of the significance of a particular input to the fair value measurement in its entirety requires judgment, and considers factors specific to the investment. Level 1 includes unadjusted quoted prices in active markets for identical assets or liabilities. Level 2 includes other significant observable market-based inputs (including quoted prices for similar
28
Notes to Financial Statements – continued
securities, interest rates, prepayment speed, and credit risk). Level 3 includes unobservable inputs, which may include the adviser’s own assumptions in determining the fair value of investments. The following is a summary of the levels used as of February 28, 2013 in valuing the fund’s assets or liabilities:
| | | | | | | | | | | | | | | | |
| Investments at Value | | Level 1 | | | Level 2 | | | Level 3 | | | Total | |
| U.S. Treasury Bonds & U.S. Government Agency & Equivalents | | | $— | | | | $849,735,557 | | | | $— | | | | $849,735,557 | |
| U.S. Corporate Bonds | | | — | | | | 25,259,177 | | | | — | | | | 25,259,177 | |
| Residential Mortgage-Backed Securities | | | — | | | | 1,139,289,479 | | | | — | | | | 1,139,289,479 | |
| Commercial Mortgage-Backed Securities | | | — | | | | 35,815,891 | | | | — | | | | 35,815,891 | |
| Mutual Funds | | | 473,727,945 | | | | — | | | | — | | | | 473,727,945 | |
| Total Investments | | | $473,727,945 | | | | $2,050,100,104 | | | | $— | | | | $2,523,828,049 | |
For further information regarding security characteristics, see the Portfolio of Investments.
Derivatives – The fund uses derivatives for different purposes, primarily to increase or decrease exposure to a particular market or segment of the market, or security, to increase or decrease interest rate exposure, or as alternatives to direct investments. Derivatives are used for hedging or non-hedging purposes. While hedging can reduce or eliminate losses, it can also reduce or eliminate gains. When the fund uses derivatives as an investment to increase market exposure, or for hedging purposes, gains and losses from derivative instruments may be substantially greater than the derivative’s original cost.
The derivative instruments used by the fund were futures contracts. At February 28, 2013, the fund did not have any outstanding derivative instruments.
The following table presents, by major type of derivative contract, the realized gain (loss) on derivatives held by the fund for the year ended February 28, 2013 as reported in the Statement of Operations:
| | | | |
| Risk | | Futures Contracts | |
| Interest Rate | | | $358,708 | |
The following table presents, by major type of derivative contract, the change in unrealized appreciation (depreciation) on derivatives held by the fund for the year ended February 28, 2013 as reported in the Statement of Operations:
| | | | |
| Risk | | Futures Contracts | |
| Interest Rate | | | $5,908 | |
Derivative counterparty credit risk is managed through formal evaluation of the creditworthiness of all potential counterparties. On certain over-the-counter derivatives, the fund attempts to reduce its exposure to counterparty credit risk whenever possible by entering into an International Swaps and Derivatives Association (ISDA) Master Agreement on a bilateral basis with each of the counterparties with whom it undertakes a significant volume of transactions. The ISDA Master Agreement gives each party to the agreement the right to terminate all transactions traded under such agreement if there is a certain deterioration in the credit quality of the other party. The
29
Notes to Financial Statements – continued
ISDA Master Agreement gives the fund the right, upon an event of default by the applicable counterparty or a termination of the agreement, to close out all transactions traded under such agreement and to net amounts owed under each transaction to one net amount payable by one party to the other. This right to close out and net payments across all transactions traded under the ISDA Master Agreement could result in a reduction of the fund’s credit risk to such counterparty equal to any amounts payable by the fund under the applicable transactions, if any. However, absent an event of default by the counterparty or a termination of the agreement, the ISDA Master Agreement does not result in an offset of reported amounts of assets and liabilities in the Statement of Assets and Liabilities across transactions between the fund and the applicable counterparty.
Collateral requirements differ by type of derivative. Collateral or margin requirements are set by the broker or exchange clearing house for exchange traded derivatives (i.e., futures contracts and exchange-traded options) while collateral terms are contract specific for over-the-counter traded derivatives (i.e., forward foreign currency exchange contracts, swap agreements and over-the-counter options). For derivatives traded under an ISDA Master Agreement, the collateral requirements are netted across all transactions traded under such agreement and one amount is posted from one party to the other to collateralize such obligations. Cash collateral that has been pledged to cover obligations of the fund under derivative contracts, if any, will be reported separately in the Statement of Assets and Liabilities as restricted cash. Securities collateral pledged for the same purpose, if any, is noted in the Portfolio of Investments.
Futures Contracts – The fund entered into futures contracts which may be used to hedge against or obtain broad market exposure, interest rate exposure, or to manage duration. A futures contract represents a commitment for the future purchase or sale of an asset at a specified price on a specified date.
Upon entering into a futures contract, the fund is required to deposit with the broker, either in cash or securities, an initial margin in an amount equal to a certain percentage of the notional amount of the contract. Subsequent payments (variation margin) are made or received by the fund each day, depending on the daily fluctuations in the value of the contract, and are recorded for financial statement purposes as unrealized gain or loss by the fund until the contract is closed or expires at which point the gain or loss on futures contracts is realized.
The fund bears the risk of interest rates or securities prices moving unexpectedly, in which case, the fund may not achieve the anticipated benefits of the futures contracts and may realize a loss. While futures contracts may present less counterparty risk to the fund since the contracts are exchange traded and the exchange’s clearinghouse guarantees payments to the broker, there is still counterparty credit risk due to the insolvency of the broker. The fund’s maximum risk of loss due to counterparty credit risk is equal to the margin posted by the fund to the broker plus any gains or minus any losses on the outstanding futures contracts.
Indemnifications – Under the fund’s organizational documents, its officers and Trustees may be indemnified against certain liabilities and expenses arising out of the performance of their duties to the fund. Additionally, in the normal course of business, the fund enters into agreements with service providers that may contain indemnification
30
Notes to Financial Statements – continued
clauses. The fund’s maximum exposure under these agreements is unknown as this would involve future claims that may be made against the fund that have not yet occurred.
Investment Transactions and Income – Investment transactions are recorded on the trade date. Interest income is recorded on the accrual basis. All premium and discount is amortized or accreted for financial statement purposes in accordance with U.S. generally accepted accounting principles. Interest payments received in additional securities are recorded on the ex-interest date in an amount equal to the value of the security on such date.
The fund may receive proceeds from litigation settlements. Any proceeds received from litigation involving portfolio holdings are reflected in the Statement of Operations in realized gain/loss if the security has been disposed of by the fund or in unrealized gain/loss if the security is still held by the fund. Any other proceeds from litigation not related to portfolio holdings are reflected as other income in the Statement of Operations.
The fund purchased or sold debt securities on a when-issued or delayed delivery basis, or in a “To Be Announced” (TBA) or “forward commitment” transaction with delivery or payment to occur at a later date beyond the normal settlement period. TBA securities resulting from these transactions are included in the Portfolio of Investments. At the time a fund enters into a commitment to purchase or sell a security, the transaction is recorded and the value of the security acquired is reflected in the fund’s net asset value. The price of such security and the date that the security will be delivered and paid for are fixed at the time the transaction is negotiated. The value of the security may vary with market fluctuations. TBA purchase commitments are held at carrying amount, which approximates fair value and are categorized as Level 2 within the fair value hierarchy disclosure. No interest accrues to the fund until payment takes place. At the time that a fund enters into this type of transaction, the fund is required to have sufficient cash and/or liquid securities to cover its commitments. Losses may arise due to changes in the value of the underlying securities or if the counterparty does not perform under the contract’s terms, or if the issuer does not issue the securities due to political, economic or other factors. Additionally, losses may arise due to declines in the value of the securities prior to settlement date.
Fees Paid Indirectly – The fund’s custody fee may be reduced according to an arrangement that measures the value of cash deposited with the custodian by the fund. This amount, for the year ended February 28, 2013, is shown as a reduction of total expenses in the Statement of Operations.
Tax Matters and Distributions – The fund intends to qualify as a regulated investment company, as defined under Subchapter M of the Internal Revenue Code, and to distribute all of its taxable income, including realized capital gains. As a result, no provision for federal income tax is required. The fund’s federal tax returns, when filed, will remain subject to examination by the Internal Revenue Service for a three year period.
Distributions to shareholders are recorded on the ex-dividend date. Income and capital gain distributions are determined in accordance with income tax regulations, which may differ from U.S. generally accepted accounting principles. Certain capital accounts
31
Notes to Financial Statements – continued
in the financial statements are periodically adjusted for permanent differences in order to reflect their tax character. These adjustments have no impact on net assets or net asset value per share. Temporary differences which arise from recognizing certain items of income, expense, gain or loss in different periods for financial statement and tax purposes will reverse at some time in the future. Distributions in excess of net investment income or net realized gains are temporary overdistributions for financial statement purposes resulting from differences in the recognition or classification of income or distributions for financial statement and tax purposes.
Book/tax differences primarily relate to amortization and accretion of debt securities.
The tax character of distributions declared to shareholders for the last two fiscal years is as follows:
| | | | | | | | |
| | | 2/28/13 | | | 2/29/12 | |
| Ordinary income (including any short-term capital gains) | | | $54,540,894 | | | | $52,285,367 | |
| Long-term capital gain | | | 8,070,835 | | | | — | |
| Total distributions | | | $62,611,729 | | | | $52,285,367 | |
The federal tax cost and the tax basis components of distributable earnings were as follows:
| | | | |
| As of 2/28/13 | | | |
| Cost of investments | | | $2,458,003,349 | |
| Gross appreciation | | | 73,284,093 | |
| Gross depreciation | | | (7,459,393 | ) |
| Net unrealized appreciation (depreciation) | | | $65,824,700 | |
| Undistributed ordinary income | | | 9,876,951 | |
| Post-October capital loss deferral | | | (2,988,073 | ) |
| Other temporary differences | | | (4,929,497 | ) |
Multiple Classes of Shares of Beneficial Interest – The fund offers multiple classes of shares, which differ in their respective distribution and service fees. The fund’s income and common expenses are allocated to shareholders based on the value of settled shares outstanding of each class. The fund’s realized and unrealized gain (loss) are allocated to shareholders based on the daily net assets of each class. Dividends are declared separately for each class. Differences in per share dividend rates are generally due to differences in separate class expenses. Class B shares will convert to Class A
32
Notes to Financial Statements – continued
shares approximately eight years after purchase. The fund’s distributions declared to shareholders as reported in the Statements of Changes in Net Assets are presented by class as follows:
| | | | | | | | | | | | | | | | |
| | | From net investment
income | | | From net realized gain on
investments | |
| | | Year
ended
2/28/13 (i) | | | Year
ended
2/29/12 | | | Year
ended
2/28/13 (i) | | | Year
ended
2/29/12 | |
| Class A | | | $23,727,857 | | | | $26,706,371 | | | | $4,419,398 | | | | $— | |
| Class B | | | 827,611 | | | | 1,008,331 | | | | 216,076 | �� | | | — | |
| Class C | | | 1,965,696 | | | | 2,234,815 | | | | 520,156 | | | | — | |
| Class I | | | 6,811,018 | | | | 14,786,741 | | | | 2,769,801 | | | | — | |
| Class R1 | | | 129,706 | | | | 151,598 | | | | 33,904 | | | | — | |
| Class R2 | | | 3,957,416 | | | | 3,778,589 | | | | 801,446 | | | | — | |
| Class R3 | | | 2,789,529 | | | | 2,448,948 | | | | 516,221 | | | | — | |
| Class R4 | | | 1,489,916 | | | | 1,169,974 | | | | 244,415 | | | | — | |
| Class R5 | | | 11,391,563 | | | | — | | | | — | | | | — | |
| Total | | | $53,090,312 | | | | $52,285,367 | | | | $9,521,417 | | | | $— | |
| (i) | For Class R5, the period is from inception, July 2, 2012, through the stated period end. |
(3) Transactions with Affiliates
Investment Adviser – The fund has an investment advisory agreement with MFS to provide overall investment management and related administrative services and facilities to the fund. The management fee is computed daily and paid monthly at an annual rate of 0.40% of the fund’s average daily net assets.
Distributor – MFS Fund Distributors, Inc. (MFD), a wholly-owned subsidiary of MFS, as distributor, received $352,321 for the year ended February 28, 2013, as its portion of the initial sales charge on sales of Class A shares of the fund.
The Board of Trustees has adopted a distribution plan for certain class shares pursuant to Rule 12b-1 of the Investment Company Act of 1940.
The fund’s distribution plan provides that the fund will pay MFD for services provided by MFD and financial intermediaries in connection with the distribution and servicing of certain share classes. One component of the plan is a distribution fee paid to MFD and another component of the plan is a service fee paid to MFD. MFD may subsequently pay all, or a portion, of the distribution and/or service fees to financial intermediaries.
Distribution Plan Fee Table:
| | | | | | | | | | | | | | | | | | | | |
| | | Distribution Fee Rate (d) | | | Service
Fee Rate (d) | | | Total
Distribution
Plan (d) | | | Annual
Effective
Rate (e) | | | Distribution
and Service
Fee | |
| Class A | | | — | | | | 0.25% | | | | 0.25% | | | | 0.25% | | | | $2,351,826 | |
| Class B | | | 0.75% | | | | 0.25% | | | | 1.00% | | | | 1.00% | | | | 469,783 | |
| Class C | | | 0.75% | | | | 0.25% | | | | 1.00% | | | | 1.00% | | | | 1,114,969 | |
| Class R1 | | | 0.75% | | | | 0.25% | | | | 1.00% | | | | 1.00% | | | | 73,399 | |
| Class R2 | | | 0.25% | | | | 0.25% | | | | 0.50% | | | | 0.50% | | | | 873,060 | |
| Class R3 | | | — | | | | 0.25% | | | | 0.25% | | | | 0.25% | | | | 277,090 | |
| Total Distribution and Service Fees | | | | $5,160,127 | |
33
Notes to Financial Statements – continued
| (d) | In accordance with the distribution plan for certain classes, the fund pays distribution and/or service fees equal to these annual percentage rates of each class’s average daily net assets. The distribution and service fee rates disclosed by class represent the current rates in effect at the end of the reporting period. |
| (e) | The annual effective rates represent actual fees incurred under the distribution plan for the year ended February 28, 2013 based on each class’s average daily net assets. |
Certain Class A shares are subject to a contingent deferred sales charge (CDSC) in the event of a shareholder redemption within 18 months of purchase for shares purchased on or after August 1, 2012, and within 24 months of purchase for shares purchased prior to August 1, 2012. Class C shares are subject to a CDSC in the event of a shareholder redemption within 12 months of purchase. Class B shares are subject to a CDSC in the event of a shareholder redemption within six years of purchase. All contingent deferred sales charges are paid to MFD and during the year ended February 28, 2013, were as follows:
| | | | |
| | | Amount | |
| Class A | | | $62,265 | |
| Class B | | | 78,082 | |
| Class C | | | 20,446 | |
Shareholder Servicing Agent – MFS Service Center, Inc. (MFSC), a wholly-owned subsidiary of MFS, receives a fee from the fund for its services as shareholder servicing agent calculated as a percentage of the average daily net assets of the fund as determined periodically under the supervision of the fund’s Board of Trustees. For the year ended February 28, 2013, the fee was $570,571, which equated to 0.0272% annually of the fund’s average daily net assets. MFSC also receives payment from the fund for out-of-pocket expenses, sub-accounting and other shareholder servicing costs which may be paid to affiliated and unaffiliated service providers. Class R5 shares do not incur sub-accounting fees. For the year ended February 28, 2013, these out-of-pocket expenses, sub-accounting and other shareholder servicing costs amounted to $1,934,370.
Under a Special Servicing Agreement among MFS, each MFS fund which invests in other MFS funds (“MFS fund-of-funds”) and certain underlying funds in which a MFS fund-of-funds invests (“underlying funds”), each underlying fund may pay a portion of each MFS fund-of-fund’s transfer agent-related expenses, including sub-accounting fees payable to financial intermediaries, to the extent such payments do not exceed the benefits realized or expected to be realized by the underlying fund from the investment in the underlying fund by the MFS fund-of-fund. For the year ended February 28, 2013, these costs for the fund amounted to $569,141 and are reflected in the “Shareholder servicing costs” in the Statement of Operations.
Administrator – MFS provides certain financial, legal, shareholder communications, compliance, and other administrative services to the fund. Under an administrative services agreement, the fund partially reimburses MFS the costs incurred to provide these services. The fund is charged an annual fixed amount of $17,500 plus a fee based on average daily net assets. The administrative services fee incurred for the year ended February 28, 2013 was equivalent to an annual effective rate of 0.0142% of the fund’s average daily net assets.
34
Notes to Financial Statements – continued
Trustees’ and Officers’ Compensation – The fund pays compensation to independent Trustees in the form of a retainer, attendance fees, and additional compensation to Board and Committee chairpersons. The fund does not pay compensation directly to Trustees or officers of the fund who are also officers of the investment adviser, all of whom receive remuneration for their services to the fund from MFS. Certain officers and Trustees of the fund are officers or directors of MFS, MFD, and MFSC.
Prior to December 31, 2001, the fund had an unfunded defined benefit plan (“DB plan”) for independent Trustees. As of December 31, 2001, the Board took action to terminate the DB plan with respect to then-current and any future independent Trustees, such that the DB plan covers only certain of those former independent Trustees who retired on or before December 31, 2001. Effective January 1, 2002, accrued benefits under the DB plan for then-current independent Trustees who continued were credited to an unfunded retirement deferral plan (the “Retirement Deferral plan”), which was established for and exists solely with respect to these credited amounts, and is not available for other deferrals by these or other independent Trustees. Although the Retirement Deferral plan is unfunded, amounts deferred under the plan are periodically adjusted for investment experience as if they had been invested in shares of the fund. The DB plan resulted in a pension expense of $2,978 and the Retirement Deferral plan resulted in an expense of $463. Both amounts are included in independent Trustees’ compensation for the year ended February 28, 2013. The liability for deferred retirement benefits payable to certain independent Trustees under both plans amounted to $62,833 at February 28, 2013, and is included in “Payable for independent Trustees’ compensation” in the Statement of Assets and Liabilities.
Other – This fund and certain other funds managed by MFS (the funds) have entered into services agreements (the Agreements) which provide for payment of fees by the funds to Tarantino LLC and Griffin Compliance LLC in return for the provision of services of an Independent Chief Compliance Officer (ICCO) and Assistant ICCO, respectively, for the funds. The ICCO and Assistant ICCO are officers of the funds and the sole members of Tarantino LLC and Griffin Compliance LLC, respectively. The funds can terminate the Agreements with Tarantino LLC and Griffin Compliance LLC at any time under the terms of the Agreements. For the year ended February 28, 2013, the aggregate fees paid by the fund to Tarantino LLC and Griffin Compliance LLC were $16,752 and are included in “Miscellaneous” expense in the Statement of Operations. MFS has agreed to reimburse the fund for a portion of the payments made by the fund in the amount of $6,926, which is shown as a reduction of total expenses in the Statement of Operations. Additionally, MFS has agreed to bear all expenses associated with office space, other administrative support, and supplies provided to the ICCO and Assistant ICCO.
The fund invests in the MFS Institutional Money Market Portfolio which is managed by MFS and seeks current income consistent with preservation of capital and liquidity. Income earned on this investment is included in “Dividends from underlying affiliated funds” in the Statement of Operations. This money market fund does not pay a management fee to MFS.
35
Notes to Financial Statements – continued
On June 29, 2012, MFS purchased 9,497 shares of class R5 for an aggregate amount of $100,000.
(4) Portfolio Securities
Purchases and sales of investments, other than short-term obligations, were as follows:
| | | | | | | | |
| | | Purchases | | | Sales | |
| U.S. Government securities | | | $1,907,217,957 | | | | $1,581,478,626 | |
| Investments (non-U.S. Government securities) | | | $91,344,119 | | | | $69,583,156 | |
(5) Shares of Beneficial Interest
The fund’s Declaration of Trust permits the Trustees to issue an unlimited number of full and fractional shares of beneficial interest. Transactions in fund shares were as follows:
| | | | | | | | | | | | | | | | |
| | | Year ended
2/28/13 (i) | | | Year ended
2/29/12 | |
| | | Shares | | | Amount | | | Shares | | | Amount | |
| Shares sold | | | | | | | | | | | | | | | | |
Class A | | | 19,324,791 | | | | $203,271,251 | | | | 25,550,792 | | | | $266,477,303 | |
Class B | | | 1,107,143 | | | | 11,637,204 | | | | 1,140,672 | | | | 11,895,317 | |
Class C | | | 2,965,801 | | | | 31,274,468 | | | | 3,801,616 | | | | 39,819,353 | |
Class I | | | 7,517,986 | | | | 79,192,395 | | | | 14,668,623 | | | | 152,989,083 | |
Class R1 | | | 187,327 | | | | 1,967,965 | | | | 315,425 | | | | 3,287,027 | |
Class R2 | | | 4,803,800 | | | | 50,439,705 | | | | 7,049,493 | | | | 73,270,147 | |
Class R3 | | | 3,674,269 | | | | 38,608,698 | | | | 5,732,513 | | | | 59,767,495 | |
Class R4 | | | 5,137,378 | | | | 53,893,566 | | | | 3,870,673 | | | | 40,296,186 | |
Class R5 | | | 68,774,393 | | | | 725,004,633 | | | | — | | | | — | |
| | | 113,492,888 | | | | $1,195,289,885 | | | | 62,129,807 | | | | $647,801,911 | |
| | | | |
| Shares issued to shareholders in reinvestment of distributions | | | | | | | | | | | | | | | | |
Class A | | | 1,947,717 | | | | $20,509,344 | | | | 1,849,457 | | | | $19,243,720 | |
Class B | | | 87,264 | | | | 917,581 | | | | 80,675 | | | | 837,638 | |
Class C | | | 172,413 | | | | 1,819,446 | | | | 139,019 | | | | 1,449,343 | |
Class I | | | 808,136 | | | | 8,518,305 | | | | 1,366,817 | | | | 14,226,652 | |
Class R1 | | | 15,504 | | | | 163,124 | | | | 14,495 | | | | 150,646 | |
Class R2 | | | 420,973 | | | | 4,427,835 | | | | 329,937 | | | | 3,433,554 | |
Class R3 | | | 313,790 | | | | 3,302,614 | | | | 234,603 | | | | 2,444,983 | |
Class R4 | | | 136,578 | | | | 1,436,753 | | | | 100,109 | | | | 1,044,017 | |
Class R5 | | | 1,085,283 | | | | 11,391,532 | | | | — | | | | — | |
| | | 4,987,658 | | | | $52,486,534 | | | | 4,115,112 | | | | $42,830,553 | |
36
Notes to Financial Statements – continued
| | | | | | | | | | | | | | | | |
| | | Year ended
2/28/13 (i) | | | Year ended
2/29/12 | |
| | | Shares | | | Amount | | | Shares | | | Amount | |
| Shares reacquired | | | | | | | | | | | | | | | | |
Class A | | | (32,984,988 | ) | | | $(346,824,129 | ) | | | (24,703,093 | ) | | | $(256,721,654 | ) |
Class B | | | (1,389,242 | ) | | | (14,570,937 | ) | | | (2,090,450 | ) | | | (21,594,046 | ) |
Class C | | | (4,121,907 | ) | | | (43,376,063 | ) | | | (4,221,833 | ) | | | (43,755,041 | ) |
Class I | | | (57,786,744 | ) | | | (610,566,814 | ) | | | (5,608,475 | ) | | | (58,567,892 | ) |
Class R1 | | | (313,640 | ) | | | (3,295,793 | ) | | | (293,501 | ) | | | (3,037,095 | ) |
Class R2 | | | (5,296,892 | ) | | | (55,615,422 | ) | | | (3,581,347 | ) | | | (37,219,533 | ) |
Class R3 | | | (4,107,019 | ) | | | (43,124,948 | ) | | | (2,815,966 | ) | | | (29,235,485 | ) |
Class R4 | | | (3,381,281 | ) | | | (35,521,097 | ) | | | (1,743,740 | ) | | | (18,098,683 | ) |
Class R5 | | | (516,708 | ) | | | (5,481,403 | ) | | | — | | | | — | |
| | | (109,898,421 | ) | | | $(1,158,376,606 | ) | | | (45,058,405 | ) | | | $(468,229,429 | ) |
| | | | |
| Net change | | | | | | | | | | | | | | | | |
Class A | | | (11,712,480 | ) | | | $(123,043,534 | ) | | | 2,697,156 | | | | $28,999,369 | |
Class B | | | (194,835 | ) | | | (2,016,152 | ) | | | (869,103 | ) | | | (8,861,091 | ) |
Class C | | | (983,693 | ) | | | (10,282,149 | ) | | | (281,198 | ) | | | (2,486,345 | ) |
Class I | | | (49,460,622 | ) | | | (522,856,114 | ) | | | 10,426,965 | | | | 108,647,843 | |
Class R1 | | | (110,809 | ) | | | (1,164,704 | ) | | | 36,419 | | | | 400,578 | |
Class R2 | | | (72,119 | ) | | | (747,882 | ) | | | 3,798,083 | | | | 39,484,168 | |
Class R3 | | | (118,960 | ) | | | (1,213,636 | ) | | | 3,151,150 | | | | 32,976,993 | |
Class R4 | | | 1,892,675 | | | | 19,809,222 | | | | 2,227,042 | | | | 23,241,520 | |
Class R5 | | | 69,342,968 | | | | 730,914,762 | | | | — | | | | — | |
| | | 8,582,125 | | | | $89,399,813 | | | | 21,186,514 | | | | $222,403,035 | |
| (i) | For Class R5, the period is from inception, July 2, 2012, through the stated period end. |
The fund is one of several mutual funds in which the MFS funds-of-funds may invest. The MFS funds-of-funds do not invest in the underlying MFS funds for the purpose of exercising management or control. At the end of the period, the MFS Moderate Allocation Fund, the MFS Conservative Allocation Fund, the MFS Lifetime 2020 Fund, and the MFS Lifetime Retirement Income Fund were the owners of record of approximately 20%, 11%, 1%, and 1%, respectively, of the value of outstanding voting shares of the fund. In addition, the MFS Lifetime 2010 Fund, the MFS Lifetime 2015 Fund, and the MFS Lifetime 2025 Fund were each the owners of record of less than 1% of the value of outstanding voting shares of the fund.
(6) Line of Credit
The fund and certain other funds managed by MFS participate in a $1.1 billion unsecured committed line of credit, subject to a $1 billion sublimit, provided by a syndication of banks under a credit agreement. Borrowings may be made for temporary financing needs. Interest is charged to each fund, based on its borrowings, generally at a rate equal to the higher of the Federal Reserve funds rate or one month LIBOR plus an agreed upon spread. A commitment fee, based on the average daily, unused portion of the committed line of credit, is allocated among the participating funds at the end of each calendar quarter. In addition, the fund and other funds managed by MFS have established unsecured uncommitted borrowing arrangements
37
Notes to Financial Statements – continued
with certain banks for temporary financing needs. Interest is charged to each fund, based on its borrowings, at a rate equal to the Federal Reserve funds rate plus an agreed upon spread. For the year ended February 28, 2013, the fund’s commitment fee and interest expense were $13,383 and $0, respectively, and are included in “Miscellaneous” expense in the Statement of Operations.
(7) Transactions in Underlying Affiliated Funds-Affiliated Issuers
An affiliated issuer may be considered one in which the fund owns 5% or more of the outstanding voting securities, or a company which is under common control. For the purposes of this report, the fund assumes the following to be an affiliated issuer:
| | | | | | | | | | | | | | | | |
| Underlying Affiliated Fund | | Beginning
Shares/Par
Amount | | | Acquisitions
Shares/Par
Amount | | | Dispositions
Shares/Par
Amount | | | Ending
Shares/Par
Amount | |
MFS Institutional Money
Market Portfolio | | | 116,572,471 | | | | 846,671,072 | | | | (489,515,598 | ) | | | 473,727,945 | |
| | | | |
| Underlying Affiliated Fund | | Realized
Gain (Loss) | | | Capital Gain
Distributions | | | Dividend
Income | | | Ending
Value | |
MFS Institutional Money
Market Portfolio | | | $— | | | | $— | | | | $339,340 | | | | $473,727,945 | |
38
REPORT OF INDEPENDENT REGISTERED PUBLIC ACCOUNTING FIRM
To the Board of Trustees and the Shareholders of MFS Government Securities Fund:
We have audited the accompanying statement of assets and liabilities, including the portfolio of investments, of MFS Government Securities Fund (the “Fund”) as of February 28, 2013, and the related statement of operations for the year then ended, the statements of changes in net assets for each of the two years in the period then ended, and the financial highlights for the periods presented. These financial statements and financial highlights are the responsibility of the Fund’s management. Our responsibility is to express an opinion on these financial statements and financial highlights based on our audits.
We conducted our audits in accordance with the standards of the Public Company Accounting Oversight Board (United States). Those standards require that we plan and perform the audit to obtain reasonable assurance about whether the financial statements and financial highlights are free of material misstatement. The Fund is not required to have, nor were we engaged to perform, an audit of its internal control over financial reporting. Our audits included consideration of internal control over financial reporting as a basis for designing audit procedures that are appropriate in the circumstances, but not for the purpose of expressing an opinion on the effectiveness of the Fund’s internal control over financial reporting. Accordingly, we express no such opinion. An audit also includes examining, on a test basis, evidence supporting the amounts and disclosures in the financial statements, assessing the accounting principles used and significant estimates made by management, as well as evaluating the overall financial statement presentation. Our procedures included confirmation of securities owned as of February 28, 2013, by correspondence with the custodian and brokers; where replies were not received from brokers, we performed other auditing procedures. We believe that our audits provide a reasonable basis for our opinion.
In our opinion, the financial statements and financial highlights referred to above present fairly, in all material respects, the financial position of MFS Government Securities Fund as of February 28, 2013, the results of its operations for the year then ended, the changes in its net assets for each of the two years in the period then ended, and the financial highlights for the periods presented, in conformity with accounting principles generally accepted in the United States of America.
DELOITTE & TOUCHE LLP
Boston, Massachusetts
April 12, 2013
39
TRUSTEES AND OFFICERS — IDENTIFICATION AND BACKGROUND
The Trustees and officers of the Trust, as of April 1, 2013, are listed below, together with their principal occupations during the past five years. (Their titles may have varied during that period.) The address of each Trustee and officer is 111 Huntington Avenue, Boston, Massachusetts 02199-7618.
| | | | | | | | |
Name, Age | | Position(s) Held with Fund | | Trustee/Officer Since (h) | | Principal
Occupations During the Past Five Years | | Other Directorships (j) |
| INTERESTED TRUSTEES |
Robert J. Manning (k) (age 49) | | Trustee | | February 2004 | | Massachusetts Financial Services Company, Chairman, Chief Executive Officer and Director; President (until December 2009); Chief Investment Officer (until July 2010) | | N/A |
| INDEPENDENT TRUSTEES |
David H. Gunning (age 70) | | Trustee and Chair of Trustees | | January 2004 | | Private investor | | Lincoln Electric Holdings, Inc. (welding equipment manufacturer), Director; Development Alternatives, Inc. (consulting), Director/Non-Executive Chairman; Portman Limited (mining), Director (until 2008) |
Robert E. Butler (age 71) | | Trustee | | January 2006 | | Consultant – investment company industry regulatory and compliance matters | | N/A |
Maureen R. Goldfarb (age 57) | | Trustee | | January 2009 | | Private investor | | N/A |
William R. Gutow (age 71) | | Trustee | | December 1993 | | Private investor and real estate consultant; Capitol Entertainment Management Company (video franchise), Vice Chairman | | Texas Donuts (donut franchise), Vice Chairman (until 2010) |
40
Trustees and Officers – continued
| | | | | | | | |
Name, Age | | Position(s) Held with Fund | | Trustee/Officer Since (h) | | Principal
Occupations During the Past Five Years | | Other Directorships (j) |
Michael Hegarty (age 68) | | Trustee | | December 2004 | | Private investor; Rouse Properties Inc. (real estate), Director | | Brookfield Office Properties, Inc. (real estate), Director; Rouse Properties Inc.
(real estate), Director; Capmark Financial Group Inc. (real estate), Director |
John P. Kavanaugh (age 58) | | Trustee | | January 2009 | | Private investor | | N/A |
J. Dale Sherratt (age 74) | | Trustee | | June 1989 | | Insight Resources, Inc. (acquisition planning specialists), President; Wellfleet Investments (investor in health care companies), Managing General Partner | | N/A |
Laurie J. Thomsen (age 55) | | Trustee | | March 2005 | | Private investor; New Profit, Inc. (venture philanthropy), Executive Partner
(until 2010) | | The Travelers Companies (insurance), Director |
Robert W. Uek (age 71) | | Trustee | | January 2006 | | Consultant to investment company industry | | N/A |
| OFFICERS |
John M. Corcoran (k) (age 47) | | President | | October 2008 | | Massachusetts Financial Services Company, Senior Vice President (since October 2008); State Street Bank and Trust (financial services provider), Senior Vice President, (until September 2008) | | N/A |
Christopher R. Bohane (k) (age 39) | | Assistant Secretary and Assistant Clerk | | July 2005 | | Massachusetts Financial Services Company, Vice President and Senior Counsel | | N/A |
Kino Clark (k) (age 44) | | Assistant Treasurer | | January 2012 | | Massachusetts Financial Services Company, Vice President | | N/A |
41
Trustees and Officers – continued
| | | | | | | | |
Name, Age | | Position(s) Held with Fund | | Trustee/Officer Since (h) | | Principal
Occupations During the Past Five Years | | Other Directorships (j) |
Thomas H. Connors (k) (age 53) | | Assistant Secretary and Assistant Clerk | | September 2012 | | Massachusetts Financial Services Company, Vice President and Senior Counsel; Deutsche Investment Management Americas Inc. (financial service provider), Director and Senior Counsel (until 2012) | | N/A |
Ethan D. Corey (k) (age 49) | | Assistant Secretary and Assistant Clerk | | July 2005 | | Massachusetts Financial Services Company, Senior Vice President and Associate General Counsel | | N/A |
David L. DiLorenzo (k) (age 44) | | Treasurer | | July 2005 | | Massachusetts Financial Services Company, Senior Vice President | | N/A |
Robyn L. Griffin (age 37) | | Assistant Independent Chief Compliance Officer | | August 2008 | | Griffin Compliance LLC (provider of compliance services), Principal (since August 2008); State Street Corporation (financial services provider), Mutual Fund Administration Assistant Vice President (October 2006 – July 2008) | | N/A |
Brian E. Langenfeld (k) (age 40) | | Assistant Secretary and Assistant Clerk | | June 2006 | | Massachusetts Financial Services Company, Vice President and Senior Counsel | | N/A |
Susan S. Newton (k) (age 63) | | Assistant Secretary and Assistant Clerk | | May 2005 | | Massachusetts Financial Services Company, Senior Vice President and Associate General Counsel | | N/A |
42
Trustees and Officers – continued
| | | | | | | | |
Name, Age | | Position(s) Held with Fund | | Trustee/Officer Since (h) | | Principal
Occupations During the Past Five Years | | Other Directorships (j) |
Susan A. Pereira (k) (age 42) | | Assistant Secretary and Assistant Clerk | | July 2005 | | Massachusetts Financial Services Company, Vice President and Senior Counsel | | N/A |
Kasey L. Phillips (k) (age 42) | | Assistant Treasurer | | September 2012 | | Massachusetts Financial Services Company, Vice President; Wells Fargo Funds Management, LLC, Senior Vice President, Fund Treasurer (until 2012) | | N/A |
Mark N. Polebaum (k) (age 60) | | Secretary and Clerk | | January 2006 | | Massachusetts Financial Services Company, Executive Vice President, General Counsel and Secretary | | N/A |
Frank L. Tarantino (age 69) | | Independent Chief Compliance Officer | | June 2004 | | Tarantino LLC (provider of compliance services), Principal | | N/A |
Richard S. Weitzel (k) (age 42) | | Assistant Secretary and Assistant Clerk | | October 2007 | | Massachusetts Financial Services Company, Senior Vice President and Associate General Counsel | | N/A |
James O. Yost (k) (age 52) | | Deputy Treasurer | | September 1990 | | Massachusetts Financial Services Company, Senior Vice President | | N/A |
| (h) | Date first appointed to serve as Trustee/officer of an MFS fund. Each Trustee has served continuously since appointment unless indicated otherwise. For the period from December 15, 2004 until February 22, 2005, Mr. Manning served as Advisory Trustee. For the period October 2008, until January 2012, Mr. Corcoran served as Treasurer of the Funds. Prior to January 2012, Messrs. DiLorenzo and Yost served as Assistant Treasurers of the Funds. |
| (j) | Directorships or trusteeships of companies required to report to the Securities and Exchange Commission (i.e., “public companies”). |
| (k) | “Interested person” of the Trust within the meaning of the Investment Company Act of 1940 (referred to as the 1940 Act), which is the principal federal law governing investment companies like the fund, as a result of position with MFS. The address of MFS is 111 Huntington Avenue, Boston, Massachusetts 02199-7618. |
43
Trustees and Officers – continued
Each Trustee has been elected by shareholders and each Trustee and officer holds office until his or her successor is chosen and qualified or until his or her earlier death, resignation, retirement or removal. The Trust does not hold annual meetings for the purpose of electing Trustees, and Trustees are not elected for fixed terms. Messrs. Butler, Kavanaugh, Uek and Ms. Thomsen are members of the Trust’s Audit Committee.
Each of the Fund’s Trustees and officers holds comparable positions with certain other funds of which MFS or a subsidiary is the investment adviser or distributor, and, in the case of the officers, with certain affiliates of MFS. As of January 1, 2013, the Trustees served as board members of 143 funds within the MFS Family of Funds.
The Statement of Additional Information for the Fund includes further information about the Trustees and is available without charge upon request by calling 1-800-225-2606.
| | |
| Investment Adviser | | Custodian |
Massachusetts Financial Services Company
111 Huntington Avenue
Boston, MA 02199-7618 | | JPMorgan Chase Bank One Chase Manhattan Plaza New York, NY 10081 |
| Distributor | | Independent Registered Public Accounting Firm |
MFS Fund Distributors, Inc.
111 Huntington Avenue
Boston, MA 02199-7618 | | Deloitte & Touche LLP 200 Berkeley Street
Boston, MA 02116 |
| Portfolio Manager | | |
| Geoffrey Schechter | | |
44
BOARD REVIEW OF INVESTMENT ADVISORY AGREEMENT
A discussion regarding the Board’s most recent review and renewal of the fund’s Investment Advisory Agreement with MFS is available by clicking on the fund’s name under “Mutual Funds” in the “Products” section of the MFS Web site (mfs.com).
PROXY VOTING POLICIES AND INFORMATION
A general description of the MFS funds’ proxy voting policies and procedures is available without charge, upon request, by calling 1-800-225-2606, by visiting the Proxy Voting section of mfs.com or by visiting the SEC’s Web site at http://www.sec.gov.
Information regarding how the fund voted proxies relating to portfolio securities during the most recent twelve-month period ended June 30 is available without charge by visiting the Proxy Voting section of mfs.com or by visiting the SEC’s Web site at http://www.sec.gov.
QUARTERLY PORTFOLIO DISCLOSURE
The fund will file a complete schedule of portfolio holdings with the Securities and Exchange Commission (the Commission) for the first and third quarters of each fiscal year on Form N-Q. A shareholder can obtain the quarterly portfolio holdings report at mfs.com. The fund’s Form N-Q is also available on the EDGAR database on the Commission’s Internet Web site at http://www.sec.gov, and may be reviewed and copied at the:
Public Reference Room
Securities and Exchange Commission
100 F Street, NE, Room 1580
Washington, D.C. 20549
Information on the operation of the Public Reference Room may be obtained by calling the Commission at 1-800-SEC-0330. Copies of the fund’s Form N-Q also may be obtained, upon payment of a duplicating fee, by electronic request at the following e-mail address: publicinfo@sec.gov or by writing the Public Reference Section at the above address.
FURTHER INFORMATION
From time to time, MFS may post important information about the fund or the MFS funds on the MFS web site (mfs.com). This information is available by visiting the “News & Commentary” section of mfs.com or by clicking on the fund’s name under “Mutual Funds” in the “Products” section of mfs.com.
FEDERAL TAX INFORMATION (unaudited)
The fund will notify shareholders of amounts for use in preparing 2013 income tax forms in January 2014. The following information is provided pursuant to provisions of the Internal Revenue Code.
The fund designates $11,890,000 as capital gain dividends paid during the fiscal year.
45
rev. 3/11
| | | | |
| | | |
FACTS | | WHAT DOES MFS DO WITH YOUR PERSONAL INFORMATION? | |  |
| | |
| Why? | | Financial companies choose how they share your personal information. Federal law gives consumers the right to limit some but not all sharing. Federal law also requires us to tell you how we collect, share, and protect your personal information. Please read this notice carefully to understand what we do. |
| | |
| What? | | The types of personal information we collect and share depend on the product or service you have with us. This information can include: •Social Security number and account balances •Account transactions and transaction history •Checking account information and wire transfer instructions When you are no longer our customer, we continue to share your information as described in this notice. |
| | |
| How? | | All financial companies need to share customers’ personal information to run their everyday business. In the section below, we list the reasons financial companies can share their customers’ personal information; the reasons MFS chooses to share; and whether you can limit this sharing. |
| | | | |
Reasons we can share your
personal information | | Does MFS
share? | | Can you limit
this sharing? |
For our everyday business purposes – such as to process your transactions, maintain your account(s), respond to court orders and legal investigations, or report to credit bureaus | | Yes | | No |
For our marketing purposes – to offer our products and services to you | | No | | We don’t share |
| For joint marketing with other financial companies | | No | | We don’t share |
For our affiliates’ everyday business purposes – information about your transactions and experiences | | No | | We don’t share |
For our affiliates’ everyday business purposes – information about your creditworthiness | | No | | We don’t share |
| For nonaffiliates to market to you | | No | | We don’t share |
| | |
| Questions? | | Call 800-225-2606 or go to mfs.com. |
46
| | |
| Who we are |
| Who is providing this notice? | | MFS Funds, MFS Investment Management, MFS Institutional Advisors, Inc., MFS Fund Distributors, Inc., MFS Heritage Trust Company, and MFS Service Center, Inc. |
| | |
| What we do |
| How does MFS protect my personal information? | | To protect your personal information from unauthorized access and use, we use security measures that comply with federal law. These measures include procedural, electronic, and physical safeguards for the protection of the personal information we collect about you. |
| How does MFS collect my personal information? | | We collect your personal information, for example, when you •open an account or provide account information •direct us to buy securities or direct us to sell your securities •make a wire transfer We also collect your personal information from others, such as credit bureaus, affiliates and other companies. |
| Why can’t I limit all sharing? | | Federal law gives you the right to limit only •sharing for affiliates’ everyday business purposes – information about your creditworthiness •affiliates from using your information to market to you •sharing for nonaffiliates to market to you State laws and individual companies may give you additional rights to limit sharing. |
| | |
| Definitions |
| Affiliates | | Companies related by common ownership or control. They can be financial and nonfinancial companies. •MFS does not share personal information with affiliates, except for everyday business purposes as described on page one of this notice. |
| Nonaffiliates | | Companies not related by common ownership or control. They can be financial and nonfinancial companies. •MFS does not share with nonaffiliates so they can market to you. |
| Joint Marketing | | A formal agreement between nonaffiliated financial companies that together market financial products or services to you. •MFS doesn’t jointly market. |
| | |
| Other important information |
| If you own an MFS product or receive an MFS service in the name of a third party such as a bank or broker-dealer, their privacy policy may apply to you instead of ours. |
47
Save paper with eDelivery.

| MFS® will send you prospectuses, |
reports, and proxies directly via e-mail so you will get information faster with less mailbox clutter.
To sign up:
1. Go to mfs.com.
2. Log in via MFS® Access.
3. Select eDelivery.
If you own your MFS fund shares through a financial institution or a retirement plan, MFS® TALK, MFS® Access, or eDelivery may not be available to you.
CONTACT
WEB SITE
mfs.com
MFS TALK
1-800-637-8255
24 hours a day
ACCOUNT SERVICE AND LITERATURE
Shareholders
1-800-225-2606
Financial advisors
1-800-343-2829
Retirement plan services
1-800-637-1255
MAILING ADDRESS
MFS Service Center, Inc.
P.O. Box 55824
Boston, MA 02205-5824
OVERNIGHT MAIL
MFS Service Center, Inc.
c/o Boston Financial Data Services
30 Dan Road
Canton, MA 02021-2809
ANNUAL REPORT
February 28, 2013

MFS® NEW DISCOVERY VALUE FUND

NDV-ANN
MFS® NEW DISCOVERY VALUE FUND
CONTENTS
The report is prepared for the general information of shareholders.
It is authorized for distribution to prospective investors only when preceded or accompanied by a current prospectus.
NOT FDIC INSURED Ÿ MAY LOSE VALUE Ÿ NO BANK GUARANTEE

LETTER FROM THE CHAIRMAN AND CEO
Dear Shareholders:
Global financial markets began 2013 with greater optimism. U.S. and Asian economic trends have turned more positive. Europe continues to struggle through its economic
slump. However, even there, sentiment has improved. The U.S. Congress averted its year-end fiscal cliff, but a degree of uncertainty remains regarding upcoming negotiations over spending cuts and the debt ceiling. The U.S. Federal Reserve Board is continuing its accommodative monetary easing, while the U.S. housing and job markets have made steady gains. Corporate profits have been resilient, and investors have demonstrated increased tolerance for risk.
Overseas, the eurozone remains in a broad contraction, with economic output receding in France as well as Italy and Spain.
However, large-scale early repayments of European Central Bank loans by banks and Germany’s strong rebound in manufacturing activity are encouraging signs. In Asia, both China and Japan appear to be in the early stages of a turnaround. China’s economic activity has picked up from last year’s relative slowdown, and Japan’s sharp devaluation of the yen, an important anti-deflationary measure, seems to be having its desired impact: Japanese stocks have soared, corporate profits are rising and confidence is returning among consumers, businesses and investors.
As always, managing risk in the face of uncertainty remains a top priority for investors. At MFS®, our uniquely collaborative investment process employs global research and active risk management. Our global team of investment professionals shares ideas and evaluates opportunities across continents, investment disciplines and asset classes — all with a goal of building better insights, and ultimately better results, for our clients.
We remain mindful of the many economic challenges investors face today, and believe it is more important than ever to maintain a long-term view and employ time-tested principles, such as asset allocation and diversification. We also remain confident that our unique approach can serve investors well as they work with their financial advisors to identify and pursue the most suitable opportunities.
Respectfully,

Robert J. Manning
Chairman and Chief Executive Officer
MFS Investment Management®
April 12, 2013
The opinions expressed in this letter are subject to change, may not be relied upon for investment advice, and no forecasts can be guaranteed.
1
PORTFOLIO COMPOSITION
Portfolio structure
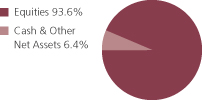
| | | | |
| Top ten holdings | | | | |
| CAI International, Inc. | | | 1.8% | |
| Express, Inc. | | | 1.4% | |
| Tesco Corp. | | | 1.4% | |
| Hanesbrands, Inc. | | | 1.4% | |
| Herman Miller, Inc. | | | 1.3% | |
| Guess?, Inc. | | | 1.3% | |
| TMS International Corp., “A” | | | 1.3% | |
| BioMed Realty Trust, Inc., REIT | | | 1.2% | |
| Hanover Insurance Group, Inc. | | | 1.2% | |
| Huntington Bancshares, Inc. | | | 1.2% | |
| | | | |
| Equity sectors | | | | |
| Financial Services | | | 25.8% | |
| Technology | | | 10.1% | |
| Industrial Goods & Services | | | 9.2% | |
| Retailing | | | 8.2% | |
| Basic Materials | | | 7.5% | |
| Health Care | | | 7.1% | |
| Energy | | | 5.4% | |
| Utilities & Communications | | | 4.9% | |
| Leisure | | | 3.8% | |
| Special Products & Services | | | 4.3% | |
| Transportation | | | 3.5% | |
| Consumer Staples | | | 2.3% | |
| Autos & Housing | | | 1.5% | |
Percentages are based on net assets as of 2/28/13.
The portfolio is actively managed and current holdings may be different.
2
MANAGEMENT REVIEW
Summary of Results
For the twelve months ended February 28, 2013, Class A shares of the MFS New Discovery Value Fund (“fund”) provided a total return of 18.04%, at net asset value. This compares with a return of 16.89% for the fund’s benchmark, the Russell 2000 Value Index.
Market Environment
The beginning of the period was characterized by a risk-on sentiment as a result of additional liquidity measures by the Federal Reserve Bank (“Fed”) and the European Central Bank (“ECB”) as well as a commensurate improvement in macroeconomic conditions. During this time, global equity valuations rose, credit spreads contracted, and high-quality sovereign yields increased modestly.
Within a couple of months, however, conditions worsened, driven by broadly weaker global macroeconomic indicators, as well as renewed concerns over the eurozone’s capacity and determination to address its ongoing crisis. Despite this deterioration, broad market sentiment remained relatively resilient as equity markets generally maintained gains and credit spreads did not indicate deterioration.
However, this renewed weakness in the fundamentals precipitated a further round of monetary easing by both the Fed (through a third round of quantitative easing) and the ECB (through a new bond purchase facility) in the middle of the period, which soon instilled additional confidence in risk markets. Nonetheless, towards the end of the calendar year, weaker equity earnings reports and declining forward guidance caused market sentiment to soften. In addition, year-end fiscal cliff negotiations between the Republicans in the U.S. Congress and President Obama were a particular source of market attention, where uncertainty surrounding the fiscal negotiations continued right up to the end-of-year deadline. A last minute political agreement averted the worst-case scenario and markets gravitated towards risk assets again, though the implementation of the U.S. budget sequester, combined with the uncertainty surrounding the Italian election results, inserted a greater degree of caution as the reporting period ended.
Contributors to Performance
Security selection in the special products & services sector was a primary factor in the fund’s outperformance relative to the Russell 2000 Value Index. Holdings of specialty insurance provider First American (b)(h) and business services company Portfolio Recovery Associates (b) strongly benefited relative performance. Shares of First American rose steadily throughout the reporting period due to increased premiums, lower personnel costs, and improved order volumes. Additionally, the stock appreciated late in the period as the company announced a fifty percent dividend increase.
Stock selection in the health care sector was another positive factor for relative performance. Holdings of health care provider Health Management Associates (b) supported relative results. Additionally, the fund’s overweight position in shares of health care solutions provider Centene contributed to relative performance as the stock outperformed the broader market. Shares of Centene appreciated during the reporting period due to increased membership from contract wins in Louisiana and Texas.
3
Management Review – continued
Management’s decision to exit the Kentucky market, prior to the end of their contract, also benefitted shares as this market had been a drag on performance.
Favorable security selection in the autos & housing sector also strengthened results relative to the benchmark. Holdings of residential home builder M/I Homes (h) and heating and air conditioning company Lennox International (b) aided relative performance. Shares of M/I Homes spiked as the company reported strong operating margins in their Homebuilding and Financial Services divisions primarily due to better-than-expected home sales volume and higher margins on loans.
Elsewhere, holdings of specialty apparel retailer American Eagle Outfitter (b)(h), clothing retailer Express (b), restaurant operator P.F. Changs (h), and financial services provider Viewpoint Financial Group (h) also helped.
Detractors from Performance
A combination of security selection and an overweight position in the energy sector detracted from relative performance. Holdings of poor-performing energy companies Lone Pine Resources (b)(h), SM Energy (b), and WPX Energy (b) held back performance. Shares of Lone Pine Resources plummeted during the reporting period due to decreased liquid volumes, increased costs, and reduced oil production.
Stock selection and an overweight position in the basic materials sector also held back relative performance. The fund’s holdings of specialty chemicals and materials company Ferro (h) dampened relative performance as the stock underperformed the benchmark during the reporting period. Shares of Ferro declined as the company reported weak sales from their Electronic and Specialty Chemical segments. Additionally, poor earnings results from the company’s solar franchise and uncertainty surrounding the resignation of Jim Kirsch, the company’s CEO, further held back performance.
In other sectors, holdings of technology company CEVA and optical components supplier Oclaro (h) weighed on performance. The fund’s holdings of appliance company h.h.gregg (h) and semiconductor company M/A-COM Technology Solutions Holdings also held back relative performance. Not holding shares of strong-performing loan operator Ocwen Financial was another detractor from relative performance as the stock outperformed the benchmark during the reporting period.
The fund’s cash and/or cash equivalents position weakened relative performance. The fund strives to be fully invested and only holds cash to buy new holdings and to provide liquidity during the reporting period. In a period when equity markets rose, as measured by the fund’s benchmark, holding cash hurt performance versus the benchmark, which has no cash position.
Respectfully,
Kevin Schmitz
Portfolio Manager
| (b) | Security is not a benchmark constituent. |
| (h) | Security was not held in the portfolio at period end. |
The views expressed in this report are those of the portfolio manager only through the end of the period of the report as stated on the cover and do not necessarily reflect the views of MFS or any other person in the MFS organization. These views are subject to change at any
4
Management Review – continued
time based on market or other conditions, and MFS disclaims any responsibility to update such views. These views may not be relied upon as investment advice or an indication of trading intent on behalf of any MFS portfolio. References to specific securities are not recommendations of such securities, and may not be representative of any MFS portfolio’s current or future investments.
5
PERFORMANCE SUMMARY THROUGH 2/28/13
The following chart illustrates a representative class of the fund’s historical performance in comparison to its benchmark(s). Performance results include the deduction of the maximum applicable sales charge and reflect the percentage change in net asset value, including reinvestment of dividends and capital gains distributions. The performance of other share classes will be greater than or less than that of the class depicted below. Benchmarks are unmanaged and may not be invested in directly. Benchmark returns do not reflect sales charges, commissions or expenses. (See Notes to Performance Summary.)
Performance data shown represents past performance and is no guarantee of future results. Investment return and principal value fluctuate so your shares, when sold, may be worth more or less than the original cost; current performance may be lower or higher than quoted. The performance shown does not reflect the deduction of taxes, if any, that a shareholder would pay on fund distributions or the redemption of fund shares.
Growth of a Hypothetical $10,000 Investment (t)
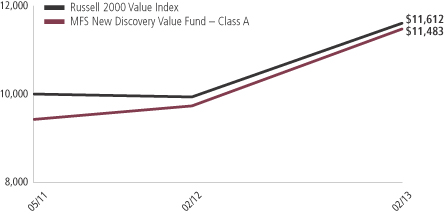
6
Performance Summary – continued
Total Returns through 2/28/13
Average annual without sales charge
| | | | | | | | | | |
| | | Share class | | Class inception date | | 1-yr | | Life (t) | | |
| | | A | | 5/26/11 | | 18.04% | | 11.85% | | |
| | | B | | 5/26/11 | | 17.24% | | 11.01% | | |
| | | C | | 5/26/11 | | 17.22% | | 11.04% | | |
| | | I | | 5/26/11 | | 18.35% | | 12.12% | | |
| | | R1 | | 5/26/11 | | 17.14% | | 11.02% | | |
| | | R2 | | 5/26/11 | | 17.82% | | 11.58% | | |
| | | R3 | | 5/26/11 | | 18.08% | | 11.88% | | |
| | | R4 | | 5/26/11 | | 18.36% | | 12.12% | | |
| | | R5 | | 7/02/12 | | N/A | | 17.94% | | |
| Comparative benchmark | | | | | | |
| | | Russell 2000 Value Index (f) | | 16.89% | | 8.82% | | |
| Average annual with sales charge | | | | | | |
| | | A
With Initial Sales Charge (5.75%) | | 11.25% | | 8.16% | | |
| | | B
With CDSC (Declining over six years from 4% to 0%) (x) | | 13.24% | | 8.91% | | |
| | | C
With CDSC (1% for 12 months) (x) | | 16.22% | | 11.04% | | |
Class I, R1, R2, R3, R4 and R5 shares do not have a sales charge.
CDSC – Contingent Deferred Sales Charge.
| (f) | Source: FactSet Research Systems Inc. |
| (t) | For the period from the class inception date through the stated period end. The comparative benchmark performance information provided for the “life” period is from the inception date of the Class A shares. (See Notes to Performance Summary.) |
| (x) | Assuming redemption at the end of the applicable period. |
Periods less than one year are actual, not annualized.
Benchmark Definition
Russell 2000 Value Index – a market-capitalization-weighted, value-oriented index that measures the performance of small-capitalization stocks that have relatively low price-to-book ratios and lower forecasted growth values.
It is not possible to invest directly in an index.
Notes to Performance Summary
Average annual total return represents the average annual change in value for each share class for the periods presented. Life returns are presented where the share class has less than 10 years of performance history and represent the average annual total return from the class inception date to the stated period end date. As the fund’s share
7
Performance Summary – continued
classes may have different inception dates, the life returns may represent different time periods and may not be comparable.
Performance results reflect any applicable expense subsidies and waivers in effect during the periods shown. Without such subsidies and waivers the fund’s performance results would be less favorable. Please see the prospectus and financial statements for complete details.
Performance results do not include adjustments made for financial reporting purposes in accordance with U.S. generally accepted accounting principles and may differ from amounts reported in the financial highlights.
From time to time the fund may receive proceeds from litigation settlements, without which performance would be lower.
8
EXPENSE TABLE
Fund expenses borne by the shareholders during the period, September 1, 2012 through February 28, 2013
As a shareholder of the fund, you incur two types of costs: (1) transaction costs, including sales charges (loads) on certain purchase or redemption payments, and (2) ongoing costs, including management fees; distribution and service (12b-1) fees; and other fund expenses. This example is intended to help you understand your ongoing costs (in dollars) of investing in the fund and to compare these costs with the ongoing costs of investing in other mutual funds.
The example is based on an investment of $1,000 invested at the beginning of the period and held for the entire period September 1, 2012 through February 28, 2013.
The expenses include the payment of a portion of the transfer-agent-related expenses of MFS funds that invest in the fund. For further information, please see the Notes to the Financial Statements.
Actual Expenses
The first line for each share class in the following table provides information about actual account values and actual expenses. You may use the information in this line, together with the amount you invested, to estimate the expenses that you paid over the period. Simply divide your account value by $1,000 (for example, an $8,600 account value divided by $1,000 = 8.6), then multiply the result by the number in the first line under the heading entitled “Expenses Paid During Period” to estimate the expenses you paid on your account during this period.
Hypothetical Example for Comparison Purposes
The second line for each share class in the following table provides information about hypothetical account values and hypothetical expenses based on the fund’s actual expense ratio and an assumed rate of return of 5% per year before expenses, which is not the fund’s actual return. The hypothetical account values and expenses may not be used to estimate the actual ending account balance or expenses you paid for the period. You may use this information to compare the ongoing costs of investing in the fund and other funds. To do so, compare this 5% hypothetical example with the 5% hypothetical examples that appear in the shareholder reports of the other funds.
Please note that the expenses shown in the table are meant to highlight your ongoing costs only and do not reflect any transactional costs, such as sales charges (loads). Therefore, the second line for each share class in the table is useful in comparing ongoing costs only, and will not help you determine the relative total costs of owning different funds. In addition, if these transactional costs were included, your costs would have been higher.
9
Expense Table – continued
| | | | | | | | | | | | | | | | | | |
Share
Class | | | | Annualized
Expense
Ratio | | | Beginning
Account Value
9/01/12 | | | Ending
Account Value
2/28/13 | | | Expenses
Paid During
Period (p)
9/01/12-2/28/13 | |
| A | | Actual | | | 1.38% | | | | $1,000.00 | | | | $1,174.93 | | | | $7.44 | |
| | Hypothetical (h) | | | 1.38% | | | | $1,000.00 | | | | $1,017.95 | | | | $6.90 | |
| B | | Actual | | | 2.13% | | | | $1,000.00 | | | | $1,170.40 | | | | $11.46 | |
| | Hypothetical (h) | | | 2.13% | | | | $1,000.00 | | | | $1,014.23 | | | | $10.64 | |
| C | | Actual | | | 2.12% | | | | $1,000.00 | | | | $1,171.40 | | | | $11.41 | |
| | Hypothetical (h) | | | 2.12% | | | | $1,000.00 | | | | $1,014.28 | | | | $10.59 | |
| I | | Actual | | | 1.13% | | | | $1,000.00 | | | | $1,176.92 | | | | $6.10 | |
| | Hypothetical (h) | | | 1.13% | | | | $1,000.00 | | | | $1,019.19 | | | | $5.66 | |
| R1 | | Actual | | | 2.12% | | | | $1,000.00 | | | | $1,170.59 | | | | $11.41 | |
| | Hypothetical (h) | | | 2.12% | | | | $1,000.00 | | | | $1,014.28 | | | | $10.59 | |
| R2 | | Actual | | | 1.62% | | | | $1,000.00 | | | | $1,173.90 | | | | $8.73 | |
| | Hypothetical (h) | | | 1.62% | | | | $1,000.00 | | | | $1,016.76 | | | | $8.10 | |
| R3 | | Actual | | | 1.38% | | | | $1,000.00 | | | | $1,175.32 | | | | $7.44 | |
| | Hypothetical (h) | | | 1.38% | | | | $1,000.00 | | | | $1,017.95 | | | | $6.90 | |
| R4 | | Actual | | | 1.12% | | | | $1,000.00 | | | | $1,175.80 | | | | $6.04 | |
| | Hypothetical (h) | | | 1.12% | | | | $1,000.00 | | | | $1,019.24 | | | | $5.61 | |
| R5 | | Actual | | | 1.10% | | | | $1,000.00 | | | | $1,175.95 | | | | $5.93 | |
| | Hypothetical (h) | | | 1.10% | | | | $1,000.00 | | | | $1,019.34 | | | | $5.51 | |
| (h) | 5% class return per year before expenses. |
| (p) | Expenses paid are equal to each class’s annualized expense ratio, as shown above, multiplied by the average account value over the period, multiplied by the number of days in the period, divided by the number of days in the year. Expenses paid do not include any applicable sales charges (loads). If these transaction costs had been included, your costs would have been higher. |
Expense Changes Impacting the Table
Changes to the fund’s fee arrangements occurred during the six month period. Had these fee changes been in effect throughout the entire six month period, the annualized expense ratios would have been 1.45%, 2.20%, 2.20%, 1.20%, 2.20%, 1.70%, 1.45%, 1.20%, and 1.20%, for Classes A, B, C, I, R1, R2, R3, R4, and R5, respectively; the actual expenses paid during the period would have been approximately $7.82, $11.84, $11.85, $6.48, $11.84, $9.16, $7.82, $6.47, and $6.47 for Classes A, B, C, I, R1, R2, R3, R4, and R5, respectively; and the hypothetical expenses paid during the period would have been approximately $7.25, $10.99, $10.99, $6.01, $10.99, $8.50, $7.25, $6.01, and $6.01 for Classes A, B, C, I, R1, R2, R3, R4, and R5, respectively. For further information about the fund’s fee arrangements and changes to those fee arrangements, please see Note 3 in the Notes to Financial Statements.
10
PORTFOLIO OF INVESTMENTS
2/28/13
The Portfolio of Investments is a complete list of all securities owned by your fund. It is categorized by broad-based asset classes.
| | | | | | | | |
| Common Stocks - 93.6% | | | | | | | | |
| Issuer | | Shares/Par | | | Value ($) | |
| Aerospace - 0.7% | | | | | | | | |
| Kaman Corp. | | | 42,990 | | | $ | 1,500,351 | |
| | |
| Apparel Manufacturers - 2.6% | | | | | | | | |
| Guess?, Inc. | | | 99,610 | | | $ | 2,758,201 | |
| Hanesbrands, Inc. (a) | | | 72,777 | | | | 2,884,880 | |
| | | | | | | | |
| | | | | | | $ | 5,643,081 | |
| Broadcasting - 0.6% | | | | | | | | |
| Stroer Out-of-Home Media AG (a) | | | 122,900 | | | $ | 1,361,275 | |
| | |
| Brokerage & Asset Managers - 2.9% | | | | | | | | |
| FXCM, Inc., “A” | | | 179,700 | | | $ | 2,363,055 | |
| GFI Group, Inc. | | | 426,684 | | | | 1,497,661 | |
| NASDAQ OMX Group, Inc. | | | 72,623 | | | | 2,299,244 | |
| | | | | | | | |
| | | | | | | $ | 6,159,960 | |
| Business Services - 3.3% | | | | | | | | |
| G&K Services, Inc. | | | 47,679 | | | $ | 1,986,784 | |
| Global Payments, Inc. | | | 45,030 | | | | 2,170,896 | |
| Performant Financial Corp. (a) | | | 140,240 | | | | 1,858,180 | |
| Portfolio Recovery Associates, Inc. (a) | | | 8,880 | | | | 1,038,294 | |
| | | | | | | | |
| | | | | | | $ | 7,054,154 | |
| Computer Software - 1.1% | | | | | | | | |
| OBIC Co. Ltd. | | | 11,540 | | | $ | 2,445,200 | |
| | |
| Computer Software - Systems - 2.2% | | | | | | | | |
| Ingram Micro, Inc., “A” (a) | | | 131,159 | | | $ | 2,473,659 | |
| NICE Systems Ltd., ADR (a) | | | 62,379 | | | | 2,202,602 | |
| | | | | | | | |
| | | | | | | $ | 4,676,261 | |
| Construction - 1.5% | | | | | | | | |
| Beacon Roofing Supply, Inc. (a) | | | 25,107 | | | $ | 926,448 | |
| Lennox International, Inc. | | | 37,332 | | | | 2,205,201 | |
| | | | | | | | |
| | | | | | | $ | 3,131,649 | |
| Consumer Products - 1.1% | | | | | | | | |
| Sensient Technologies Corp. | | | 62,560 | | | $ | 2,309,090 | |
11
Portfolio of Investments – continued
| | | | | | | | |
| Issuer | | Shares/Par | | | Value ($) | |
| Common Stocks - continued | | | | | | | | |
| Consumer Services - 1.0% | | | | | | | | |
| Grand Canyon Education, Inc. (a) | | | 43,710 | | | $ | 1,046,855 | |
| H&R Block, Inc. | | | 41,865 | | | | 1,040,764 | |
| | | | | | | | |
| | | | | | | $ | 2,087,619 | |
| Containers - 1.6% | | | | | | | | |
| Greif, Inc., “A” | | | 50,046 | | | $ | 2,545,840 | |
| Packaging Corp. of America | | | 22,220 | | | | 928,352 | |
| | | | | | | | |
| | | | | | | $ | 3,474,192 | |
| Electronics - 6.8% | | | | | | | | |
| CEVA, Inc. (a) | | | 68,130 | | | $ | 1,030,807 | |
| Entegris, Inc. (a) | | | 135,610 | | | | 1,289,651 | |
| Entropic Communications, Inc. (a) | | | 288,778 | | | | 1,273,511 | |
| Lattice Semiconductor Corp. (a) | | | 264,910 | | | | 1,239,779 | |
| M/A-COM Technology Solutions Holdings, Inc. (a) | | | 144,440 | | | | 2,339,928 | |
| MaxLinear, Inc., “A” (a) | | | 303,937 | | | | 1,787,150 | |
| Micrel, Inc. | | | 138,120 | | | | 1,453,022 | |
| MKS Instruments, Inc. | | | 44,460 | | | | 1,206,644 | |
| Ultratech, Inc. (a) | | | 26,920 | | | | 1,103,182 | |
| Veeco Instruments, Inc. (a) | | | 53,483 | | | | 1,706,643 | |
| | | | | | | | |
| | | | | | | $ | 14,430,317 | |
| Energy - Independent - 2.2% | | | | | | | | |
| SM Energy Co. | | | 41,220 | | | $ | 2,385,814 | |
| Unit Corp. (a) | | | 29,140 | | | | 1,325,287 | |
| WPX Energy, Inc. (a) | | | 64,740 | | | | 918,661 | |
| | | | | | | | |
| | | | | | | $ | 4,629,762 | |
| Engineering - Construction - 1.0% | | | | | | | | |
| Foster Wheeler AG (a) | | | 87,225 | | | $ | 2,098,634 | |
| | |
| Entertainment - 1.0% | | | | | | | | |
| Cinemark Holdings, Inc. | | | 75,745 | | | $ | 2,105,711 | |
| | |
| Health Maintenance Organizations - 1.5% | | | | | | | | |
| Centene Corp. (a) | | | 34,120 | | | $ | 1,536,082 | |
| Molina Healthcare, Inc. (a) | | | 49,270 | | | | 1,572,206 | |
| | | | | | | | |
| | | | | | | $ | 3,108,288 | |
| Insurance - 5.9% | | | | | | | | |
| Allied World Assurance Co. | | | 24,663 | | | $ | 2,165,658 | |
| Aspen Insurance Holdings Ltd. | | | 68,199 | | | | 2,445,616 | |
| Everest Re Group Ltd. | | | 20,032 | | | | 2,496,187 | |
| Hanover Insurance Group, Inc. | | | 61,060 | | | | 2,606,041 | |
12
Portfolio of Investments – continued
| | | | | | | | |
| Issuer | | Shares/Par | | | Value ($) | |
| Common Stocks - continued | | | | | | | | |
| Insurance - continued | | | | | | | | |
| Symetra Financial Corp. | | | 142,479 | | | $ | 1,876,448 | |
| Willis Group Holdings PLC | | | 28,120 | | | | 1,070,810 | |
| | | | | | | | |
| | | | | | | $ | 12,660,760 | |
| Leisure & Toys - 2.2% | | | | | | | | |
| Brunswick Corp. | | | 63,920 | | | $ | 2,329,245 | |
| Callaway Golf Co. | | | 345,601 | | | | 2,322,439 | |
| | | | | | | | |
| | | | | | | $ | 4,651,684 | |
| Machinery & Tools - 6.5% | | | | | | | | |
| Columbus McKinnon Corp. (a) | | | 123,810 | | | $ | 2,429,152 | |
| Douglas Dynamics, Inc. | | | 151,735 | | | | 2,157,672 | |
| EnPro Industries, Inc. (a) | | | 36,810 | | | | 1,712,769 | |
| Herman Miller, Inc. | | | 119,085 | | | | 2,858,040 | |
| Kennametal, Inc. | | | 53,500 | | | | 2,165,680 | |
| Polypore International, Inc. (a) | | | 40,240 | | | | 1,540,387 | |
| Regal Beloit Corp. | | | 14,330 | | | | 1,107,422 | |
| | | | | | | | |
| | | | | | | $ | 13,971,122 | |
| Major Banks - 1.2% | | | | | | | | |
| Huntington Bancshares, Inc. | | | 369,090 | | | $ | 2,594,703 | |
| | |
| Medical & Health Technology & Services - 4.4% | | | | | | | | |
| Almost Family, Inc. | | | 90,425 | | | $ | 1,861,851 | |
| Community Health Systems, Inc. | | | 40,512 | | | | 1,712,037 | |
| Cross Country Healthcare, Inc. (a) | | | 343,041 | | | | 1,955,334 | |
| Health Management Associates, Inc., “A” (a) | | | 146,940 | | | | 1,614,871 | |
| MEDNAX, Inc. (a) | | | 26,410 | | | | 2,261,224 | |
| | | | | | | | |
| | | | | | | $ | 9,405,317 | |
| Medical Equipment - 1.2% | | | | | | | | |
| Teleflex, Inc. | | | 31,903 | | | $ | 2,550,964 | |
| | |
| Metals & Mining - 3.1% | | | | | | | | |
| GrafTech International Ltd. (a) | | | 275,740 | | | $ | 2,037,719 | |
| Iluka Resources Ltd. | | | 170,605 | | | | 1,825,228 | |
| TMS International Corp., “A” (a) | | | 193,890 | | | | 2,671,804 | |
| | | | | | | | |
| | | | | | | $ | 6,534,751 | |
| Natural Gas - Distribution - 3.0% | | | | | | | | |
| AGL Resources, Inc. | | | 46,867 | | | $ | 1,872,805 | |
| NorthWestern Corp. | | | 53,260 | | | | 2,076,075 | |
| UGI Corp. | | | 71,341 | | | | 2,555,435 | |
| | | | | | | | |
| | | | | | | $ | 6,504,315 | |
13
Portfolio of Investments – continued
| | | | | | | | |
| Issuer | | Shares/Par | | | Value ($) | |
| Common Stocks - continued | | | | | | | | |
| Oil Services - 3.2% | | | | | | | | |
| C&J Energy Services, Inc. (a) | | | 87,970 | | | $ | 2,128,874 | |
| Superior Energy Services, Inc. (a) | | | 63,170 | | | | 1,670,846 | |
| Tesco Corp. (a) | | | 234,240 | | | | 2,977,190 | |
| | | | | | | | |
| | | | | | | $ | 6,776,910 | |
| Other Banks & Diversified Financials - 10.7% | | | | | | | | |
| Berkshire Hills Bancorp, Inc. | | | 93,700 | | | $ | 2,276,910 | |
| Brookline Bancorp, Inc. | | | 240,075 | | | | 2,184,682 | |
| CAI International, Inc. (a) | | | 142,510 | | | | 3,933,276 | |
| CapitalSource, Inc. | | | 231,448 | | | | 2,083,032 | |
| Cathay General Bancorp, Inc. | | | 107,736 | | | | 2,099,775 | |
| First Interstate BancSystem, Inc. | | | 105,570 | | | | 1,928,764 | |
| Glacier Bancorp, Inc. | | | 135,360 | | | | 2,360,678 | |
| PrivateBancorp, Inc. | | | 127,070 | | | | 2,275,824 | |
| Regional Management Corp. (a) | | | 88,790 | | | | 1,594,668 | |
| Sandy Spring Bancorp, Inc. | | | 108,118 | | | | 2,093,164 | |
| | | | | | | | |
| | | | | | | $ | 22,830,773 | |
| Pollution Control - 1.0% | | | | | | | | |
| Progressive Waste Solutions Ltd. | | | 105,286 | | | $ | 2,189,949 | |
| | |
| Railroad & Shipping - 1.0% | | | | | | | | |
| Diana Shipping, Inc. (a) | | | 258,324 | | | $ | 2,193,171 | |
| | |
| Real Estate - 5.1% | | | | | | | | |
| BioMed Realty Trust, Inc., REIT | | | 125,620 | | | $ | 2,653,094 | |
| Capstead Mortgage Corp., REIT | | | 146,152 | | | | 1,832,746 | |
| EPR Properties, REIT | | | 47,328 | | | | 2,309,133 | |
| Hatteras Financial Corp., REIT | | | 69,780 | | | | 1,862,428 | |
| Select Income, REIT | | | 77,040 | | | | 2,142,482 | |
| | | | | | | | |
| | | | | | | $ | 10,799,883 | |
| Specialty Chemicals - 2.8% | | | | | | | | |
| A. Schulman, Inc. | | | 46,572 | | | $ | 1,460,032 | |
| Cabot Corp. | | | 27,500 | | | | 1,011,450 | |
| Koppers Holdings, Inc. | | | 45,706 | | | | 1,895,885 | |
| Tronox Ltd., “A” | | | 78,230 | | | | 1,606,844 | |
| | | | | | | | |
| | | | | | | $ | 5,974,211 | |
| Specialty Stores - 5.6% | | | | | | | | |
| ANN, Inc. (a) | | | 73,340 | | | $ | 2,074,789 | |
| Children’s Place Retail Store, Inc. (a) | | | 49,180 | | | | 2,235,723 | |
| Express, Inc. (a) | | | 165,030 | | | | 3,053,055 | |
| Gordmans Stores, Inc. (a) | | | 60,532 | | | | 805,681 | |
14
Portfolio of Investments – continued
| | | | | | | | |
| Issuer | | Shares/Par | | | Value ($) | |
| Common Stocks - continued | | | | | | | | |
| Specialty Stores - continued | | | | | | | | |
| Kirkland’s, Inc. (a) | | | 76,260 | | | $ | 887,666 | |
| rue21, Inc. (a) | | | 50,870 | | | | 1,373,490 | |
| Tilly’s, Inc. (a) | | | 107,490 | | | | 1,427,467 | |
| | | | | | | | |
| | | | | | | $ | 11,857,871 | |
| Tobacco - 1.2% | | | | | | | | |
| Schweitzer-Mauduit International, Inc. | | | 68,180 | | | $ | 2,512,433 | |
| | |
| Trucking - 2.5% | | | | | | | | |
| Atlas Air Worldwide Holdings, Inc. (a) | | | 44,030 | | | $ | 2,077,776 | |
| Celadon Group, Inc. | | | 67,390 | | | | 1,343,083 | |
| Marten Transport Ltd. | | | 94,830 | | | | 1,962,981 | |
| | | | | | | | |
| | | | | | | $ | 5,383,840 | |
| Utilities - Electric Power - 1.9% | | | | | | | | |
| El Paso Electric Co. | | | 58,650 | | | $ | 1,955,977 | |
| Great Plains Energy, Inc. | | | 96,277 | | | | 2,101,727 | |
| | | | | | | | |
| | | | | | | $ | 4,057,704 | |
| Total Common Stocks (Identified Cost, $174,790,332) | | | | | | $ | 199,665,905 | |
| | |
| Money Market Funds - 4.6% | | | | | | | | |
MFS Institutional Money Market Portfolio, 0.13%,
at Cost and Net Asset Value (v) | | | 9,711,634 | | | $ | 9,711,634 | |
| Total Investments (Identified Cost, $184,501,966) | | | | | | $ | 209,377,539 | |
| | |
| Other Assets, Less Liabilities - 1.8% | | | | | | | 3,818,902 | |
| Net Assets - 100.0% | | | | | | $ | 213,196,441 | |
| (a) | Non-income producing security. |
| (v) | Underlying affiliated fund that is available only to investment companies managed by MFS. The rate quoted for the MFS Institutional Money Market Portfolio is the annualized seven-day yield of the fund at period end. |
The following abbreviations are used in this report and are defined:
| ADR | | American Depositary Receipt |
| PLC | | Public Limited Company |
| REIT | | Real Estate Investment Trust |
See Notes to Financial Statements
15
Financial Statements
STATEMENT OF ASSETS AND LIABILITIES
At 2/28/13
This statement represents your fund’s balance sheet, which details the assets and liabilities comprising the total value of the fund.
| | | | |
| Assets | | | | |
Investments- | | | | |
Non-affiliated issuers, at value (identified cost, $174,790,332) | | | $199,665,905 | |
Underlying affiliated funds, at cost and value | | | 9,711,634 | |
Total investments, at value (identified cost, $184,501,966) | | | $209,377,539 | |
Receivables for | | | | |
Investments sold | | | 2,182,801 | |
Fund shares sold | | | 4,689,397 | |
Dividends | | | 147,706 | |
Receivable from investment adviser | | | 28,717 | |
Other assets | | | 1,482 | |
Total assets | | | $216,427,642 | |
| Liabilities | | | | |
Payables for | | | | |
Investments purchased | | | $3,040,843 | |
Fund shares reacquired | | | 87,741 | |
Payable to affiliates | | | | |
Shareholder servicing costs | | | 52,627 | |
Distribution and service fees | | | 132 | |
Payable for independent Trustees’ compensation | | | 13 | |
Accrued expenses and other liabilities | | | 49,845 | |
Total liabilities | | | $3,231,201 | |
Net assets | | | $213,196,441 | |
| Net assets consist of | | | | |
Paid-in capital | | | $187,596,056 | |
Unrealized appreciation (depreciation) on investments | | | 24,875,573 | |
Accumulated net realized gain (loss) on investments and foreign currency | | | 848,288 | |
Accumulated distributions in excess of net investment income | | | (123,476 | ) |
Net assets | | | $213,196,441 | |
Shares of beneficial interest outstanding | | | 18,709,661 | |
16
Statement of Assets and Liabilities – continued
| | | | | | | | | | | | |
| | | Net assets | | | Shares
outstanding | | | Net asset value
per share (a) | |
Class A | | | $4,595,714 | | | | 404,070 | | | | $11.37 | |
Class B | | | 352,526 | | | | 31,102 | | | | 11.33 | |
Class C | | | 691,268 | | | | 61,111 | | | | 11.31 | |
Class I | | | 1,632,758 | | | | 143,299 | | | | 11.39 | |
Class R1 | | | 148,160 | | | | 13,070 | | | | 11.34 | |
Class R2 | | | 137,116 | | | | 12,043 | | | | 11.39 | |
Class R3 | | | 215,085 | | | | 18,882 | | | | 11.39 | |
Class R4 | | | 122,467 | | | | 10,744 | | | | 11.40 | |
Class R5 | | | 205,301,347 | | | | 18,015,340 | | | | 11.40 | |
| (a) | Maximum offering price per share was equal to the net asset value per share for all share classes, except for Class A, for which the maximum offering price per share was $12.06 [100 / 94.25 x $11.37]. On sales of $50,000 or more, the maximum offering price of Class A shares is reduced. A contingent deferred sales charge may be imposed on redemptions of Class A, Class B, and Class C shares. Redemption price per share was equal to the net asset value per share for Classes I, R1, R2, R3, R4, and R5. |
See Notes to Financial Statements
17
Financial Statements
STATEMENT OF OPERATIONS
Year ended 2/28/13
This statement describes how much your fund earned in investment income and accrued in expenses. It also describes any gains and/or losses generated by fund operations.
| | | | |
| Net investment income | | | | |
Income | | | | |
Dividends | | | $3,475,855 | |
Interest | | | 2,977 | |
Dividends from underlying affiliated funds | | | 12,066 | |
Foreign taxes withheld | | | (10,141 | ) |
Total investment income | | | $3,480,757 | |
Expenses | | | | |
Management fee | | | $1,631,606 | |
Distribution and service fees | | | 15,930 | |
Shareholder servicing costs | | | 88,835 | |
Administrative services fee | | | 35,437 | |
Independent Trustees’ compensation | | | 5,328 | |
Custodian fee | | | 28,375 | |
Shareholder communications | | | 12,474 | |
Audit and tax fees | | | 41,120 | |
Legal fees | | | 2,143 | |
Registration fees | | | 111,041 | |
Miscellaneous | | | 16,725 | |
Total expenses | | | $1,989,014 | |
Fees paid indirectly | | | (11 | ) |
Reduction of expenses by investment adviser | | | (39,837 | ) |
Net expenses | | | $1,949,166 | |
Net investment income | | | $1,531,591 | |
| Realized and unrealized gain (loss) on investments and foreign currency | |
Realized gain (loss) (identified cost basis) | | | | |
Investments | | | $10,120,875 | |
Swap agreements | | | 462,053 | |
Foreign currency | | | 2,879 | |
Net realized gain (loss) on investments and foreign currency | | | $10,585,807 | |
Change in unrealized appreciation (depreciation) | | | | |
Investments | | | $21,108,383 | |
Swap agreements | | | 842 | |
Net unrealized gain (loss) on investments | | | $21,109,225 | |
Net realized and unrealized gain (loss) on investments | | | $31,695,032 | |
Change in net assets from operations | | | $33,226,623 | |
See Notes to Financial Statements
18
Financial Statements
STATEMENTS OF CHANGES IN NET ASSETS
These statements describe the increases and/or decreases in net assets resulting from operations, any distributions, and any shareholder transactions.
| | | | | | | | |
| Change in net assets | | Year ended
2/28/13 | | | Period ended
2/29/12 (c) | |
| From operations | | | | | | | | |
Net investment income | | | $1,531,591 | | | | $502,426 | |
Net realized gain (loss) on investments and foreign currency | | | 10,585,807 | | | | 3,556,656 | |
Net unrealized gain (loss) on investments | | | 21,109,225 | | | | 3,766,348 | |
Change in net assets from operations | | | $33,226,623 | | | | $7,825,430 | |
| Distributions declared to shareholders | | | | | | | | |
From net investment income | | | $(1,600,024 | ) | | | $(604,075 | ) |
From net realized gain on investments | | | (10,275,610 | ) | | | (232,152 | ) |
Total distributions declared to shareholders | | | $(11,875,634 | ) | | | $(836,227 | ) |
Change in net assets from fund share transactions | | | $25,592,968 | | | | $159,263,281 | |
Total change in net assets | | | $46,943,957 | | | | $166,252,484 | |
| Net assets | | | | | | | | |
At beginning of period | | | 166,252,484 | | | | — | |
At end of period (including accumulated distributions in excess of net investment income of $123,476 and $55,629, respectively) | | | $213,196,441 | | | | $166,252,484 | |
| (c) | For the period from the commencement of the fund’s investment operations, May 26, 2011, through the stated period end. |
See Notes to Financial Statements
19
Financial Statements
FINANCIAL HIGHLIGHTS
The financial highlights table is intended to help you understand the fund’s financial performance for the past 5 years (or life of a particular share class, if shorter). Certain information reflects financial results for a single fund share. The total returns in the table represent the rate by which an investor would have earned (or lost) on an investment in the fund share class (assuming reinvestment of all distributions) held for the entire period.
| | | | | | | | |
| Class A | | Year ended
2/28/13 | | | Period ended
2/29/12 (c) | |
Net asset value, beginning of period | | | $10.27 | | | | $10.00 | |
| Income (loss) from investment operations | | | | | | | | |
Net investment income (d) | | | $0.06 | | | | $0.01 | |
Net realized and unrealized gain (loss) on investments and foreign
currency | | | 1.69 | | | | 0.30 | |
Total from investment operations | | | $1.75 | | | | $0.31 | |
| Less distributions declared to shareholders | | | | | | | | |
From net investment income | | | $(0.07 | ) | | | $(0.03 | ) |
From net realized gain on investments | | | (0.58 | ) | | | (0.01 | ) |
Total distributions declared to shareholders | | | $(0.65 | ) | | | $(0.04 | ) |
Net asset value, end of period (x) | | | $11.37 | | | | $10.27 | |
Total return (%) (r)(s)(t)(x) | | | 18.04 | | | | 3.22 | (n) |
Ratios (%) (to average net assets)
and Supplemental data: | | | | | | | | |
Expenses before expense reductions (f) | | | 1.39 | | | | 1.25 | (a) |
Expenses after expense reductions (f) | | | 1.34 | | | | 1.25 | (a) |
Net investment income | | | 0.53 | | | | 0.17 | (a) |
Portfolio turnover | | | 67 | | | | 56 | (n) |
Net assets at end of period (000 omitted) | | | $4,596 | | | | $1,872 | |
See Notes to Financial Statements
20
Financial Highlights – continued
| | | | | | | | |
| Class B | | Year ended
2/28/13 | | | Period ended
2/29/12 (c) | |
Net asset value, beginning of period | | | $10.24 | | | | $10.00 | |
| Income (loss) from investment operations | | | | | | | | |
Net investment loss (d) | | | $(0.02 | ) | | | $(0.04 | ) |
Net realized and unrealized gain (loss) on investments and foreign
currency | | | 1.69 | | | | 0.29 | |
Total from investment operations | | | $1.67 | | | | $0.25 | |
| Less distributions declared to shareholders | | | | | | | | |
From net realized gain on investments | | | $(0.58 | ) | | | $(0.01 | ) |
Net asset value, end of period (x) | | | $11.33 | | | | $10.24 | |
Total return (%) (r)(s)(t)(x) | | | 17.24 | | | | 2.56 | (n) |
Ratios (%) (to average net assets)
and Supplemental data: | | | | | |
Expenses before expense reductions (f) | | | 2.14 | | | | 2.01 | (a) |
Expenses after expense reductions (f) | | | 2.08 | | | | 2.01 | (a) |
Net investment loss | | | (0.17 | ) | | | (0.57 | )(a) |
Portfolio turnover | | | 67 | | | | 56 | (n) |
Net assets at end of period (000 omitted) | | | $353 | | | | $200 | |
| | | | | | | | |
| Class C | | Year ended
2/28/13 | | | Period ended
2/29/12 (c) | |
Net asset value, beginning of period | | | $10.24 | | | | $10.00 | |
| Income (loss) from investment operations | | | | | | | | |
Net investment loss (d) | | | $(0.02 | ) | | | $(0.04 | ) |
Net realized and unrealized gain (loss) on investments and foreign
currency | | | 1.69 | | | | 0.29 | |
Total from investment operations | | | $1.67 | | | | $0.25 | |
| Less distributions declared to shareholders | | | | | | | | |
From net investment income | | | $(0.02 | ) | | | $(0.00 | )(w) |
From net realized gain on investments | | | (0.58 | ) | | | (0.01 | ) |
Total distributions declared to shareholders | | | $(0.60 | ) | | | $(0.01 | ) |
Net asset value, end of period (x) | | | $11.31 | | | | $10.24 | |
Total return (%) (r)(s)(t)(x) | | | 17.22 | | | | 2.62 | (n) |
Ratios (%) (to average net assets)
and Supplemental data: | | | | | |
Expenses before expense reductions (f) | | | 2.15 | | | | 2.01 | (a) |
Expenses after expense reductions (f) | | | 2.09 | | | | 2.01 | (a) |
Net investment loss | | | (0.22 | ) | | | (0.53 | )(a) |
Portfolio turnover | | | 67 | | | | 56 | (n) |
Net assets at end of period (000 omitted) | | | $691 | | | | $182 | |
See Notes to Financial Statements
21
Financial Highlights – continued
| | | | | | | | |
| Class I | | Year ended
2/28/13 | | | Period ended
2/29/12 (c) | |
Net asset value, beginning of period | | | $10.28 | | | | $10.00 | |
| Income (loss) from investment operations | | | | | | | | |
Net investment income (d) | | | $0.11 | | | | $0.03 | |
Net realized and unrealized gain (loss) on investments and foreign
currency | | | 1.67 | | | | 0.30 | |
Total from investment operations | | | $1.78 | | | | $0.33 | |
| Less distributions declared to shareholders | | | | | | | | |
From net investment income | | | $(0.09 | ) | | | $(0.04 | ) |
From net realized gain on investments | | | (0.58 | ) | | | (0.01 | ) |
Total distributions declared to shareholders | | | $(0.67 | ) | | | $(0.05 | ) |
Net asset value, end of period (x) | | | $11.39 | | | | $10.28 | |
Total return (%) (r)(s)(x) | | | 18.35 | | | | 3.39 | (n) |
Ratios (%) (to average net assets)
and Supplemental data: | | | | | | | | |
Expenses before expense reductions (f) | | | 1.02 | | | | 1.01 | (a) |
Expenses after expense reductions (f) | | | 1.02 | | | | 1.01 | (a) |
Net investment income | | | 1.04 | | | | 0.47 | (a) |
Portfolio turnover | | | 67 | | | | 56 | (n) |
Net assets at end of period (000 omitted) | | | $1,633 | | | | $163,585 | |
| | |
| Class R1 | | Year ended
2/28/13 | | | Period ended
2/29/12 (c) | |
Net asset value, beginning of period | | | $10.25 | | | | $10.00 | |
| Income (loss) from investment operations | | | | | | | | |
Net investment loss (d) | | | $(0.01 | ) | | | $(0.04 | ) |
Net realized and unrealized gain (loss) on investments and foreign
currency | | | 1.68 | | | | 0.30 | |
Total from investment operations | | | $1.67 | | | | $0.26 | |
| Less distributions declared to shareholders | | | | | | | | |
From net investment income | | | $(0.00 | )(w) | | | $— | |
From net realized gain on investments | | | (0.58 | ) | | | (0.01 | ) |
Total distributions declared to shareholders | | | $(0.58 | ) | | | $(0.01 | ) |
Net asset value, end of period (x) | | | $11.34 | | | | $10.25 | |
Total return (%) (r)(s)(x) | | | 17.25 | | | | 2.66 | (n) |
Ratios (%) (to average net assets)
and Supplemental data: | | | | | | | | |
Expenses before expense reductions (f) | | | 2.13 | | | | 2.01 | (a) |
Expenses after expense reductions (f) | | | 2.08 | | | | 2.01 | (a) |
Net investment loss | | | (0.14 | ) | | | (0.56 | )(a) |
Portfolio turnover | | | 67 | | | | 56 | (n) |
Net assets at end of period (000 omitted) | | | $148 | | | | $103 | |
See Notes to Financial Statements
22
Financial Highlights – continued
| | | | | | | | |
| Class R2 | | Year ended
2/28/13 | | | Period ended
2/29/12 (c) | |
Net asset value, beginning of period | | | $10.27 | | | | $10.00 | |
| Income (loss) from investment operations | | | | | | | | |
Net investment income (loss) (d) | | | $0.04 | | | | $(0.00 | )(w) |
Net realized and unrealized gain (loss) on investments and foreign
currency | | | 1.70 | | | | 0.29 | |
Total from investment operations | | | $1.74 | | | | $0.29 | |
| Less distributions declared to shareholders | | | | | | | | |
From net investment income | | | $(0.04 | ) | | | $(0.01 | ) |
From net realized gain on investments | | | (0.58 | ) | | | (0.01 | ) |
Total distributions declared to shareholders | | | $(0.62 | ) | | | $(0.02 | ) |
Net asset value, end of period (x) | | | $11.39 | | | | $10.27 | |
Total return (%) (r)(s)(x) | | | 17.92 | | | | 2.98 | (n) |
Ratios (%) (to average net assets)
and Supplemental data: | | | | | |
Expenses before expense reductions (f) | | | 1.63 | | | | 1.51 | (a) |
Expenses after expense reductions (f) | | | 1.58 | | | | 1.51 | (a) |
Net investment income (loss) | | | 0.34 | | | | (0.06 | )(a) |
Portfolio turnover | | | 67 | | | | 56 | (n) |
Net assets at end of period (000 omitted) | | | $137 | | | | $105 | |
| | |
| Class R3 | | Year ended
2/28/13 | | | Period ended
2/29/12(c) | |
Net asset value, beginning of period | | | $10.28 | | | | $10.00 | |
| Income (loss) from investment operations | | | | | | | | |
Net investment income (d) | | | $0.05 | | | | $0.01 | |
Net realized and unrealized gain (loss) on investments and foreign
currency | | | 1.70 | | | | 0.30 | |
Total from investment operations | | | $1.75 | | | | $0.31 | |
| Less distributions declared to shareholders | | | | | | | | |
From net investment income | | | $(0.06 | ) | | | $(0.02 | ) |
From net realized gain on investments | | | (0.58 | ) | | | (0.01 | ) |
Total distributions declared to shareholders | | | $(0.64 | ) | | | $(0.03 | ) |
Net asset value, end of period (x) | | | $11.39 | | | | $10.28 | |
Total return (%) (r)(s)(x) | | | 18.08 | | | | 3.23 | (n) |
Ratios (%) (to average net assets)
and Supplemental data: | | | | | |
Expenses before expense reductions (f) | | | 1.40 | | | | 1.26 | (a) |
Expenses after expense reductions (f) | | | 1.34 | | | | 1.26 | (a) |
Net investment income | | | 0.47 | | | | 0.19 | (a) |
Portfolio turnover | | | 67 | | | | 56 | (n) |
Net assets at end of period (000 omitted) | | | $215 | | | | $103 | |
See Notes to Financial Statements
23
Financial Highlights – continued
| | | | | | | | |
| Class R4 | | Year ended
2/28/13 | | | Period ended
2/29/12 (c) | |
Net asset value, beginning of period | | | $10.28 | | | | $10.00 | |
| Income (loss) from investment operations | | | | | | | | |
Net investment income (d) | | | $0.09 | | | | $0.03 | |
Net realized and unrealized gain (loss) on investments and foreign
currency | | | 1.70 | | | | 0.30 | |
Total from investment operations | | | $1.79 | | | | $0.33 | |
| Less distributions declared to shareholders | | | | | | | | |
From net investment income | | | $(0.09 | ) | | | $(0.04 | ) |
From net realized gain on investments | | | (0.58 | ) | | | (0.01 | ) |
Total distributions declared to shareholders | | | $(0.67 | ) | | | $(0.05 | ) |
Net asset value, end of period (x) | | | $11.40 | | | | $10.28 | |
Total return (%) (r)(s)(x) | | | 18.46 | | | | 3.39 | (n) |
Ratios (%) (to average net assets)
and Supplemental data: | | | | | | | | |
Expenses before expense reductions (f) | | | 1.12 | | | | 1.01 | (a) |
Expenses after expense reductions (f) | | | 1.08 | | | | 1.01 | (a) |
Net investment income | | | 0.85 | | | | 0.44 | (a) |
Portfolio turnover | | | 67 | | | | 56 | (n) |
Net assets at end of period (000 omitted) | | | $122 | | | | $103 | |
| | | | |
| Class R5 | | Period ended
2/28/13 (i) | |
Net asset value, beginning of period | | | $10.10 | |
| Income (loss) from investment operations | | | | |
Net investment income (d) | | | $0.05 | |
Net realized and unrealized gain (loss) on investments and foreign
currency | | | 1.71 | |
Total from investment operations | | | $1.76 | |
| Less distributions declared to shareholders | | | | |
From net investment income | | | $(0.09 | ) |
From net realized gain on investments | | | (0.37 | ) |
Total distributions declared to shareholders | | | $(0.46 | ) |
Net asset value, end of period (x) | | | $11.40 | |
Total return (%) (r)(s)(x) | | | 18.05 | (n) |
Ratios (%) (to average net assets)
and Supplemental data: | | | | |
Expenses before expense reductions (f) | | | 1.12 | (a) |
Expenses after expense reductions (f) | | | 1.09 | (a) |
Net investment income | | | 0.76 | (a) |
Portfolio turnover | | | 67 | |
Net assets at end of period (000 omitted) | | | $205,301 | |
See Notes to Financial Statements
24
Financial Highlights – continued
| (c) | For the period from the commencement of the fund’s investment operations, May 26, 2011, through the stated period end. |
| (d) | Per share data is based on average shares outstanding. |
| (f) | Ratios do not reflect reductions from fees paid indirectly, if applicable. |
| (i) | For the period from the class inception, July 2, 2012, through the stated period end. |
| (r) | Certain expenses have been reduced without which performance would have been lower. |
| (s) | From time to time the fund may receive proceeds from litigation settlements, without which performance would be lower. |
| (t) | Total returns do not include any applicable sales charges. |
| (w) | Per share amount was less than $0.01. |
| (x) | The net asset values per share and total returns have been calculated on net asset values which include adjustments made in accordance with U.S. generally accepted accounting principles required at period end for financial reporting purposes. |
See Notes to Financial Statements
25
NOTES TO FINANCIAL STATEMENTS
(1) Business and Organization
MFS New Discovery Value Fund (the fund) is a series of MFS Series Trust XIII (the trust). The trust is organized as a Massachusetts business trust and is registered under the Investment Company Act of 1940, as amended, as an open-end management investment company.
(2) Significant Accounting Policies
General – The preparation of financial statements in conformity with U.S. generally accepted accounting principles requires management to make estimates and assumptions that affect the reported amounts of assets and liabilities, and disclosure of contingent assets and liabilities at the date of the financial statements and the reported amounts of revenues and expenses during the reporting period. Actual results could differ from those estimates. In the preparation of these financial statements, management has evaluated subsequent events occurring after the date of the fund’s Statement of Assets and Liabilities through the date that the financial statements were issued. The fund will generally focus on securities of small size companies which may be more volatile than those of larger companies.
In this reporting period the fund adopted Financial Accounting Standards Board (FASB) Accounting Standards Update 2011-04, Fair Value Measurement (Topic 820) – Amendments to Achieve Common Fair Value Measurement and Disclosure Requirements in U.S. GAAP and IFRSs (“ASU 2011-04”). ASU 2011-04 seeks to improve the comparability of fair value measurements as presented and disclosed in financial statements prepared in accordance with U.S. GAAP and International Financial Reporting Standards (IFRS) by providing common requirements for fair value measurement and disclosure.
In January 2013, the FASB issued Accounting Standards Update 2013-01 (“ASU 2013-01”) entitled Balance Sheet (Topic 210) – Clarifying the Scope of Disclosures about Offsetting Assets and Liabilities which is intended to clarify the scope of Accounting Standards Update 2011-11 (“ASU 2011-11”), Balance Sheet (Topic 210) – Disclosures about Offsetting Assets and Liabilities. Consistent with the effective date for ASU 2011-11, ASU 2013-01 is effective for annual reporting periods beginning on or after January 1, 2013, and interim periods within those annual periods. ASU 2013-01 limits the scope of ASU 2011-11’s disclosure requirements on offsetting to financial assets and financial liabilities related to derivatives, repurchase and reverse repurchase agreements, and securities lending and securities borrowing transactions. Although still evaluating the potential impact of these two ASUs to the fund, management expects that the impact of the fund’s adoption will be limited to additional financial statement disclosures.
Investment Valuations – Equity securities, including restricted equity securities, are generally valued at the last sale or official closing price as provided by a third-party pricing service on the market or exchange on which they are primarily traded. Equity securities, for which there were no sales reported that day, are generally valued at the last quoted daily bid quotation as provided by a third-party pricing service on the market or exchange on which such securities are primarily traded. Short-term instruments with a maturity at issuance of 60 days or less generally are valued at
26
Notes to Financial Statements – continued
amortized cost, which approximates market value. Swap agreements are generally valued at valuations provided by a third-party pricing service. Open-end investment companies are generally valued at net asset value per share. Securities and other assets generally valued on the basis of information from a third-party pricing service may also be valued at a broker/dealer bid quotation. Values obtained from third-party pricing services can utilize both transaction data and market information such as yield, quality, coupon rate, maturity, type of issue, trading characteristics, and other market data. The values of foreign securities and other assets and liabilities expressed in foreign currencies are converted to U.S. dollars using the mean of bid and asked prices for rates provided by a third-party pricing service.
The Board of Trustees has delegated primary responsibility for determining or causing to be determined the value of the fund’s investments (including any fair valuation) to the adviser pursuant to valuation policies and procedures approved by the Board. If the adviser determines that reliable market quotations are not readily available, investments are valued at fair value as determined in good faith by the adviser in accordance with such procedures under the oversight of the Board of Trustees. Under the fund’s valuation policies and procedures, market quotations are not considered to be readily available for most types of debt instruments and floating rate loans and many types of derivatives. These investments are generally valued at fair value based on information from third-party pricing services. In addition, investments may be valued at fair value if the adviser determines that an investment’s value has been materially affected by events occurring after the close of the exchange or market on which the investment is principally traded (such as foreign exchange or market) and prior to the determination of the fund’s net asset value, or after the halting of trading of a specific security where trading does not resume prior to the close of the exchange or market on which the security is principally traded. Events that occur on a frequent basis after foreign markets close (such as developments in foreign markets and significant movements in the U.S. markets) and prior to the determination of the fund’s net asset value may be deemed to have a material effect on the value of securities traded in foreign markets. Accordingly, the fund’s foreign equity securities may often be valued at fair value. The adviser generally relies on third-party pricing services or other information (such as the correlation with price movements of similar securities in the same or other markets; the type, cost and investment characteristics of the security; the business and financial condition of the issuer; and trading and other market data) to assist in determining whether to fair value and at what value to fair value an investment. The value of an investment for purposes of calculating the fund’s net asset value can differ depending on the source and method used to determine value. When fair valuation is used, the value of an investment used to determine the fund’s net asset value may differ from quoted or published prices for the same investment. There can be no assurance that the fund could obtain the fair value assigned to an investment if it were to sell the investment at the same time at which the fund determines its net asset value per share.
Various inputs are used in determining the value of the fund’s assets or liabilities. These inputs are categorized into three broad levels. In certain cases, the inputs used to measure fair value may fall into different levels of the fair value hierarchy. In such cases, an investment’s level within the fair value hierarchy is based on the lowest level of input that is significant to the fair value measurement. The fund’s assessment of the
27
Notes to Financial Statements – continued
significance of a particular input to the fair value measurement in its entirety requires judgment, and considers factors specific to the investment. Level 1 includes unadjusted quoted prices in active markets for identical assets or liabilities. Level 2 includes other significant observable market-based inputs (including quoted prices for similar securities, interest rates, prepayment speed, and credit risk). Level 3 includes unobservable inputs, which may include the adviser’s own assumptions in determining the fair value of investments. The following is a summary of the levels used as of February 28, 2013 in valuing the fund’s assets or liabilities:
| | | | | | | | | | | | | | | | |
| Investments at Value | | Level 1 | | | Level 2 | | | Level 3 | | | Total | |
| Equity Securities: | | | | | | | | | | | | | | | | |
United States | | | $187,448,480 | | | | $— | | | | $— | | | | $187,448,480 | |
Japan | | | 2,445,200 | | | | — | | | | — | | | | 2,445,200 | |
Israel | | | 2,202,602 | | | | — | | | | — | | | | 2,202,602 | |
Greece | | | 2,193,171 | | | | — | | | | — | | | | 2,193,171 | |
Canada | | | 2,189,949 | | | | — | | | | — | | | | 2,189,949 | |
Australia | | | — | | | | 1,825,228 | | | | — | | | | 1,825,228 | |
Germany | | | 1,361,275 | | | | — | | | | — | | | | 1,361,275 | |
| Mutual Funds | | | 9,711,634 | | | | — | | | | — | | | | 9,711,634 | |
| Total Investments | | | $207,552,311 | | | | $1,825,228 | | | | $— | | | | $209,377,539 | |
For further information regarding security characteristics, see the Portfolio of Investments.
Of the level 1 investments presented above, equity investments amounting to $2,445,200 were considered level 2 investments at the beginning of the period. The primary reason for changes in the classifications between levels 1 and 2 occurs when foreign equity securities are fair valued using other observable market-based inputs in place of the closing exchange price due to events occurring after the close of the exchange or market on which the investment is principally traded. The fund’s policy is to recognize transfers between the levels as of the end of the period.
Foreign Currency Translation – Purchases and sales of foreign investments, income, and expenses are converted into U.S. dollars based upon currency exchange rates prevailing on the respective dates of such transactions or on the reporting date for foreign denominated receivables and payables. Gains and losses attributable to foreign currency exchange rates on sales of securities are recorded for financial statement purposes as net realized gains and losses on investments. Gains and losses attributable to foreign exchange rate movements on receivables, payables, income and expenses are recorded for financial statement purposes as foreign currency transaction gains and losses. That portion of both realized and unrealized gains and losses on investments that results from fluctuations in foreign currency exchange rates is not separately disclosed.
Derivatives – The fund uses derivatives for different purposes, primarily to increase or decrease exposure to a particular market or segment of the market, or security, to increase or decrease interest rate or currency exposure, or as alternatives to direct investments. Derivatives are used for hedging or non-hedging purposes. While hedging can reduce or eliminate losses, it can also reduce or eliminate gains. When the fund
28
Notes to Financial Statements – continued
uses derivatives as an investment to increase market exposure, or for hedging purposes, gains and losses from derivative instruments may be substantially greater than the derivative’s original cost.
The derivative instruments used by the fund were swap agreements. At February 28, 2013, the fund did not have any outstanding derivative instruments.
The following table presents, by major type of derivative contract, the realized gain (loss) on derivatives held by the fund for the year ended February 28, 2013 as reported in the Statement of Operations:
| | | | |
| Risk | | Swap Agreements | |
| Equity | | | $462,053 | |
The following table presents, by major type of derivative contract, the change in unrealized appreciation (depreciation) on derivatives held by the fund for the year ended February 28, 2013 as reported in the Statement of Operations:
| | | | |
| Risk | | Swap Agreements | |
| Equity | | | $842 | |
Derivative counterparty credit risk is managed through formal evaluation of the creditworthiness of all potential counterparties. On certain over-the-counter derivatives, the fund attempts to reduce its exposure to counterparty credit risk whenever possible by entering into an International Swaps and Derivatives Association (ISDA) Master Agreement on a bilateral basis with each of the counterparties with whom it undertakes a significant volume of transactions. The ISDA Master Agreement gives each party to the agreement the right to terminate all transactions traded under such agreement if there is a certain deterioration in the credit quality of the other party. The ISDA Master Agreement gives the fund the right, upon an event of default by the applicable counterparty or a termination of the agreement, to close out all transactions traded under such agreement and to net amounts owed under each transaction to one net amount payable by one party to the other. This right to close out and net payments across all transactions traded under the ISDA Master Agreement could result in a reduction of the fund’s credit risk to such counterparty equal to any amounts payable by the fund under the applicable transactions, if any. However, absent an event of default by the counterparty or a termination of the agreement, the ISDA Master Agreement does not result in an offset of reported amounts of assets and liabilities in the Statement of Assets and Liabilities across transactions between the fund and the applicable counterparty.
Collateral requirements differ by type of derivative. Collateral or margin requirements are set by the broker or exchange clearing house for exchange traded derivatives (i.e., futures contracts and exchange-traded options) while collateral terms are contract specific for over-the-counter traded derivatives (i.e., forward foreign currency exchange contracts, swap agreements and over-the-counter options). For derivatives traded under an ISDA Master Agreement, the collateral requirements are netted across all transactions traded under such agreement and one amount is posted from one party to the other to collateralize such obligations. Cash collateral that has been pledged to cover obligations of the fund under derivative contracts, if any, will be reported
29
Notes to Financial Statements – continued
separately in the Statement of Assets and Liabilities as restricted cash. Securities collateral pledged for the same purpose, if any, is noted in the Portfolio of Investments.
Swap Agreements – The fund entered into swap agreements. A swap agreement is generally an exchange of cash payments, at specified intervals or upon the occurrence of specified events, between the fund and a counterparty. The net cash payments exchanged are recorded as a realized gain or loss on swap agreements in the Statement of Operations. The value of the swap agreement, which is adjusted daily and includes any related interest accruals to be paid or received by the fund, is recorded in the Statement of Assets and Liabilities. The daily change in value, including any related interest accruals to be paid or received, is recorded as unrealized appreciation or depreciation on swap agreements in the Statement of Operations. Amounts paid or received at the inception of the swap agreement are reflected as premiums paid or received in the Statement of Assets and Liabilities and are amortized using the effective interest method over the term of the agreement. A liquidation payment received or made upon early termination is recorded as a realized gain or loss on swap agreements in the Statement of Operations.
Risks related to swap agreements include the possible lack of a liquid market, unfavorable market and interest rate movements of the underlying instrument and the failure of the counterparty to perform under the terms of the agreements. To address counterparty risk, swap agreements are limited to only highly-rated counterparties. The risk is further mitigated by having an ISDA Master Agreement between the fund and the counterparty providing for netting as described above and by the posting of collateral by the counterparty to the fund to cover the fund’s exposure to the counterparty under such ISDA Master Agreement.
The fund entered into total return swaps which involve commitments to pay interest in exchange for a market-linked return based on a notional amount. To the extent the total return of the security or index underlying the transaction exceeds or falls short of the offsetting interest rate obligation, the fund will receive a payment from or make a payment to the counterparty, respectively. The fund may enter into total return swap agreements on a particular security, or a basket or index of securities, in order to gain exposure to the underlying security or securities.
Security Loans – State Street Bank and Trust Company (“State Street”), as lending agent, loans the securities of the fund to certain qualified institutions (the “Borrowers”) approved by the fund. The loans are collateralized by cash and/or U.S. Treasury and federal agency obligations in an amount typically at least equal to the market value of the securities loaned. The market value of the loaned securities is determined at the close of business of the fund and any additional required collateral is delivered to the fund on the next business day. State Street provides the fund with indemnification against Borrower default. The fund bears the risk of loss with respect to the investment of cash collateral. On loans collateralized by cash, the cash collateral is invested in a money market fund or short-term securities. A portion of the income generated upon investment of the collateral is remitted to the Borrowers, and the remainder is allocated between the fund and the lending agent. On loans collateralized by U.S. Treasury and/or federal agency obligations, a fee is received from the Borrower, and is allocated between the fund and the lending agent. Income from securities lending is included in
30
Notes to Financial Statements – continued
“Interest” income in the Statement of Operations. The dividend and interest income earned on the securities loaned is accounted for in the same manner as other dividend and interest income.
Indemnifications – Under the fund’s organizational documents, its officers and Trustees may be indemnified against certain liabilities and expenses arising out of the performance of their duties to the fund. Additionally, in the normal course of business, the fund enters into agreements with service providers that may contain indemnification clauses. The fund’s maximum exposure under these agreements is unknown as this would involve future claims that may be made against the fund that have not yet occurred.
Investment Transactions and Income – Investment transactions are recorded on the trade date. Interest income is recorded on the accrual basis. Dividends received in cash are recorded on the ex-dividend date. Certain dividends from foreign securities will be recorded when the fund is informed of the dividend if such information is obtained subsequent to the ex-dividend date. Dividend and interest payments received in additional securities are recorded on the ex-dividend or ex-interest date in an amount equal to the value of the security on such date.
The fund may receive proceeds from litigation settlements. Any proceeds received from litigation involving portfolio holdings are reflected in the Statement of Operations in realized gain/loss if the security has been disposed of by the fund or in unrealized gain/loss if the security is still held by the fund. Any other proceeds from litigation not related to portfolio holdings are reflected as other income in the Statement of Operations.
Fees Paid Indirectly – The fund’s custody fee may be reduced according to an arrangement that measures the value of cash deposited with the custodian by the fund. This amount, for the year ended February 28, 2013, is shown as a reduction of total expenses in the Statement of Operations.
Tax Matters and Distributions – The fund intends to qualify as a regulated investment company, as defined under Subchapter M of the Internal Revenue Code, and to distribute all of its taxable income, including realized capital gains. As a result, no provision for federal income tax is required. The fund’s federal tax returns, when filed, will remain subject to examination by the Internal Revenue Service for a three year period. Foreign taxes have been accrued by the fund in the accompanying financial statements.
Distributions to shareholders are recorded on the ex-dividend date. Income and capital gain distributions are determined in accordance with income tax regulations, which may differ from U.S. generally accepted accounting principles. Certain capital accounts in the financial statements are periodically adjusted for permanent differences in order to reflect their tax character. These adjustments have no impact on net assets or net asset value per share. Temporary differences which arise from recognizing certain items of income, expense, gain or loss in different periods for financial statement and tax purposes will reverse at some time in the future. Distributions in excess of net investment income or net realized gains are temporary overdistributions for financial statement purposes resulting from differences in the recognition or classification of income or distributions for financial statement and tax purposes.
31
Notes to Financial Statements – continued
Book/tax differences primarily relate to wash sale loss deferrals and treating a portion of the proceeds from redemptions as a distribution for tax purposes.
The tax character of distributions declared to shareholders for the last two fiscal years is as follows:
| | | | | | | | |
| | | 2/28/13 | | | 2/29/12 | |
Ordinary income (including any
short-term capital gains) | | | $11,875,634 | | | | $836,227 | |
The federal tax cost and the tax basis components of distributable earnings were as follows:
| | | | |
| As of 2/28/13 | | | |
| Cost of investments | | | $185,217,426 | |
| Gross appreciation | | | 27,967,634 | |
| Gross depreciation | | | (3,807,521 | ) |
| Net unrealized appreciation (depreciation) | | | $24,160,113 | |
| Undistributed ordinary income | | | 1,594,533 | |
| Late year ordinary loss deferral | | | (154,261 | ) |
Multiple Classes of Shares of Beneficial Interest – The fund offers multiple classes of shares, which differ in their respective distribution and service fees. The fund’s income, realized and unrealized gain (loss), and common expenses are allocated to shareholders based on the daily net assets of each class. Dividends are declared separately for each class. Differences in per share dividend rates are generally due to differences in separate class expenses. Class B shares will convert to Class A shares approximately eight years after purchase. The fund’s distributions declared to shareholders as reported in the Statements of Changes in Net Assets are presented by class as follows:
| | | | | | | | | | | | | | | | |
| | | From net investment
income | | | From net realized gain on
investments | |
| | | Year
ended
2/28/13 (i) | | | Period
ended
2/29/12 (c) | | | Year
ended
2/28/13 (i) | | | Period
ended
2/29/12 (c) | |
| Class A | | | $19,095 | | | | $3,257 | | | | $158,761 | | | | $1,501 | |
| Class B | | | — | | | | — | | | | 13,586 | | | | 171 | |
| Class C | | | 841 | | | | 85 | | | | 25,995 | | | | 259 | |
| Class I | | | 10,699 | | | | 600,039 | | | | 3,479,620 | | | | 229,659 | |
| Class R1 | | | 21 | | | | — | | | | 6,785 | | | | 140 | |
| Class R2 | | | 421 | | | | 99 | | | | 6,339 | | | | 142 | |
| Class R3 | | | 690 | | | | 230 | | | | 6,208 | | | | 140 | |
| Class R4 | | | 900 | | | | 365 | | | | 5,926 | | | | 140 | |
| Class R5 | | | 1,567,357 | | | | — | | | | 6,572,390 | | | | — | |
| Total | | | $1,600,024 | | | | $604,075 | | | | $10,275,610 | | | | $232,152 | |
| (c) | For the period from the commencement of the fund’s investment operations, May 26, 2011, through the stated period end. |
| (i) | For Class R5, the period is from inception, July 2, 2012, through the stated period end. |
32
Notes to Financial Statements – continued
(3) Transactions with Affiliates
Investment Adviser – The fund has an investment advisory agreement with MFS to provide overall investment management and related administrative services and facilities to the fund. The management fee is computed daily and paid monthly at the following annual rates:
| | | | |
| First $1 billion of average daily net assets | | | 0.90 | % |
| Next $1.5 billion of average daily net assets | | | 0.80 | % |
| Average daily net assets in excess of $2.5 billion | | | 0.75 | % |
The management fee incurred for the year ended February 28, 2013 was equivalent to an annual effective rate of 0.90% of the fund’s average daily net assets.
The investment adviser has agreed in writing to pay a portion of the fund’s total annual operating expenses, exclusive of interest, taxes, extraordinary expenses, brokerage and transaction costs, and investment-related expenses, such that total fund operating expenses do not exceed the following rates annually of each class’s average daily net assets:
| | | | | | | | | | | | | | | | | | | | | | | | | | | | | | | | |
| Classes | |
| A | | B | | | C | | | I | | | R1 | | | R2 | | | R3 | | | R4 | | | R5 | |
| 1.45% | | | 2.20% | | | | 2.20% | | | | 1.20% | | | | 2.20% | | | | 1.70% | | | | 1.45% | | | | 1.20% | | | | 1.20% | |
This written agreement will continue until modified by the fund’s Board of Trustees, but such agreement will continue at least until June 30, 2013. For the year ended February 28, 2013, this reduction amounted to $39,248 and is reflected as a reduction of total expenses in the Statement of Operations.
Distributor – MFS Fund Distributors, Inc. (MFD), a wholly-owned subsidiary of MFS, as distributor, received $9,289 for the year ended February 28, 2013, as its portion of the initial sales charge on sales of Class A shares of the fund.
The Board of Trustees has adopted a distribution plan for certain class shares pursuant to Rule 12b-1 of the Investment Company Act of 1940.
The fund’s distribution plan provides that the fund will pay MFD for services provided by MFD and financial intermediaries in connection with the distribution and servicing of certain share classes. One component of the plan is a distribution fee paid to MFD and another component of the plan is a service fee paid to MFD. MFD may subsequently pay all, or a portion, of the distribution and/or service fees to financial intermediaries.
Distribution Plan Fee Table:
| | | | | | | | | | | | | | | | | | | | |
| | | Distribution
Fee Rate (d) | | | Service
Fee Rate (d) | | | Total
Distribution
Plan (d) | | | Annual
Effective
Rate (e) | | | Distribution
and Service
Fee | |
| Class A | | | — | | | | 0.25% | | | | 0.25% | | | | 0.25% | | | | $6,978 | |
| Class B | | | 0.75% | | | | 0.25% | | | | 1.00% | | | | 1.00% | | | | 2,375 | |
| Class C | | | 0.75% | | | | 0.25% | | | | 1.00% | | | | 1.00% | | | | 4,536 | |
| Class R1 | | | 0.75% | | | | 0.25% | | | | 1.00% | | | | 1.00% | | | | 1,159 | |
| Class R2 | | | 0.25% | | | | 0.25% | | | | 0.50% | | | | 0.50% | | | | 568 | |
| Class R3 | | | — | | | | 0.25% | | | | 0.25% | | | | 0.25% | | | | 314 | |
| Total Distribution and Service Fees | | | | | | | | | | | | $15,930 | |
33
Notes to Financial Statements – continued
| (d) | In accordance with the distribution plan for certain classes, the fund pays distribution and/or service fees equal to these annual percentage rates of each class’s average daily net assets. The distribution and service fee rates disclosed by class represent the current rates in effect at the end of the reporting period. |
| (e) | The annual effective rates represent actual fees incurred under the distribution plan for the year ended February 28, 2013 based on each class’s average daily net assets. |
Certain Class A shares are subject to a contingent deferred sales charge (CDSC) in the event of a shareholder redemption within 18 months of purchase for shares purchased on or after August 1, 2012, and within 24 months of purchase for shares purchased prior to August 1, 2012. Class C shares are subject to a CDSC in the event of a shareholder redemption within 12 months of purchase. Class B shares are subject to a CDSC in the event of a shareholder redemption within six years of purchase. All contingent deferred sales charges are paid to MFD. There were no contingent deferred sales charges imposed during the year ended February 28, 2013.
Shareholder Servicing Agent – MFS Service Center, Inc. (MFSC), a wholly-owned subsidiary of MFS, receives a fee from the fund for its services as shareholder servicing agent calculated as a percentage of the average daily net assets of the fund as determined periodically under the supervision of the fund’s Board of Trustees. For the year ended February 28, 2013, the fee was $2,440, which equated to 0.0013% annually of the fund’s average daily net assets. MFSC also receives payment from the fund for out-of-pocket expenses, sub-accounting and other shareholder servicing costs which may be paid to affiliated and unaffiliated service providers. Class R5 shares do not incur sub-accounting fees. For the year ended February 28, 2013, these out-of-pocket expenses, sub-accounting and other shareholder servicing costs amounted to $5,850.
Effective January 1, 2013, the fund was added to a Special Servicing Agreement among MFS, each MFS fund which invests in other MFS funds (“MFS fund-of-funds”) and certain underlying funds in which a MFS fund-of-funds invests (“underlying funds”), under which each underlying fund may pay a portion of each MFS fund-of-fund’s transfer agent-related expenses, including sub-accounting fees payable to financial intermediaries, to the extent such payments do not exceed the benefits realized or expected to be realized by the underlying fund from the investment in the underlying fund by the MFS fund-of-fund. For the period January 1, 2013 through February 28, 2013, these costs for the fund amounted to $80,545 and are reflected in the “Shareholder servicing costs” in the Statement of Operations.
Administrator – MFS provides certain financial, legal, shareholder communications, compliance, and other administrative services to the fund. Under an administrative services agreement, the fund partially reimburses MFS the costs incurred to provide these services. The fund is charged an annual fixed amount of $17,500 plus a fee based on average daily net assets. The administrative services fee incurred for the year ended February 28, 2013 was equivalent to an annual effective rate of 0.0195% of the fund’s average daily net assets.
Trustees’ and Officers’ Compensation – The fund pays compensation to independent Trustees in the form of a retainer, attendance fees, and additional compensation to Board and Committee chairpersons. The fund does not pay compensation directly to Trustees or officers of the fund who are also officers of the
34
Notes to Financial Statements – continued
investment adviser, all of whom receive remuneration for their services to the fund from MFS. Certain officers and Trustees of the fund are officers or directors of MFS, MFD, and MFSC.
Other – This fund and certain other funds managed by MFS (the funds) have entered into services agreements (the Agreements) which provide for payment of fees by the funds to Tarantino LLC and Griffin Compliance LLC in return for the provision of services of an Independent Chief Compliance Officer (ICCO) and Assistant ICCO, respectively, for the funds. The ICCO and Assistant ICCO are officers of the funds and the sole members of Tarantino LLC and Griffin Compliance LLC, respectively. The funds can terminate the Agreements with Tarantino LLC and Griffin Compliance LLC at any time under the terms of the Agreements. For the year ended February 28, 2013, the aggregate fees paid by the fund to Tarantino LLC and Griffin Compliance LLC were $1,414 and are included in “Miscellaneous” expense in the Statement of Operations. MFS has agreed to reimburse the fund for a portion of the payments made by the fund in the amount of $589, which is shown as a reduction of total expenses in the Statement of Operations. Additionally, MFS has agreed to bear all expenses associated with office space, other administrative support, and supplies provided to the ICCO and Assistant ICCO.
The fund invests in the MFS Institutional Money Market Portfolio which is managed by MFS and seeks current income consistent with preservation of capital and liquidity. Income earned on this investment is included in “Dividends from underlying affiliated funds” in the Statement of Operations. This money market fund does not pay a management fee to MFS.
(4) Portfolio Securities
Purchases and sales of investments, other than short-term obligations, aggregated $128,149,779 and $117,370,643, respectively.
(5) Shares of Beneficial Interest
The fund’s Declaration of Trust permits the Trustees to issue an unlimited number of full and fractional shares of beneficial interest. Transactions in fund shares were as follows:
| | | | | | | | | | | | | | | | |
| | | Year ended
2/28/13 (i) | | | Year ended
2/29/12 (c) | |
| | | Shares | | | Amount | | | Shares | | | Amount | |
| Shares sold | | | | | | | | | | | | | | | | |
Class A | | | 470,145 | | | | $4,935,450 | | | | 242,990 | | | | $2,247,490 | |
Class B | | | 17,843 | | | | 185,668 | | | | 19,798 | | | | 194,551 | |
Class C | | | 46,852 | | | | 480,959 | | | | 25,318 | | | | 245,371 | |
Class I | | | 1,028,623 | | | | 10,375,139 | | | | 17,071,139 | | | | 167,710,202 | |
Class R1 | | | 2,367 | | | | 24,532 | | | | 10,000 | | | | 100,000 | |
Class R2 | | | 1,180 | | | | 12,039 | | | | 10,154 | | | | 101,250 | |
Class R3 | | | 11,239 | | | | 119,762 | | | | 10,000 | | | | 100,000 | |
Class R4 | | | — | | | | — | | | | 10,000 | | | | 100,000 | |
Class R5 | | | 18,470,131 | | | | 187,876,080 | | | | — | | | | — | |
| | | 20,048,380 | | | | $204,009,629 | | | | 17,399,399 | | | | $170,798,864 | |
35
Notes to Financial Statements – continued
| | | | | | | | | | | | | | | | |
| | | Year ended
2/28/13 (i) | | | Year ended
2/29/12 (c) | |
| | | Shares | | | Amount | | | Shares | | | Amount | |
Shares issued to shareholders in
reinvestment of distributions | | | | | | | | | | | | | |
Class A | | | 17,288 | | | | $171,856 | | | | 525 | | | | $4,586 | |
Class B | | | 1,241 | | | | 12,281 | | | | 19 | | | | 164 | |
Class C | | | 2,706 | | | | 26,836 | | | | 39 | | | | 344 | |
Class I | | | 360,340 | | | | 3,490,278 | | | | 94,820 | | | | 829,674 | |
Class R1 | | | 687 | | | | 6,806 | | | | 16 | | | | 140 | |
Class R2 | | | 681 | | | | 6,760 | | | | 28 | | | | 241 | |
Class R3 | | | 694 | | | | 6,898 | | | | 42 | | | | 370 | |
Class R4 | | | 686 | | | | 6,815 | | | | 58 | | | | 505 | |
Class R5 | | | 808,316 | | | | 8,139,747 | | | | — | | | | — | |
| | | 1,192,639 | | | | $11,868,277 | | | | 95,547 | | | | $836,024 | |
| | | |
| Shares reacquired | | | | | | | | | | | | | |
Class A | | | (265,719 | ) | | | $(2,671,266 | ) | | | (61,159 | ) | | | $(615,710 | ) |
Class B | | | (7,507 | ) | | | (73,632 | ) | | | (292 | ) | | | (2,440 | ) |
Class C | | | (6,219 | ) | | | (65,424 | ) | | | (7,585 | ) | | | (71,813 | ) |
Class I | | | (17,162,199 | ) | | | (173,917,452 | ) | | | (1,249,424 | ) | | | (11,681,644 | ) |
Class R3 | | | (3,093 | ) | | | (30,760 | ) | | | — | | | | — | |
Class R5 | | | (1,263,107 | ) | | | (13,526,404 | ) | | | — | | | | — | |
| | | (18,707,844 | ) | | | $(190,284,938 | ) | | | (1,318,460 | ) | | | $(12,371,607 | ) |
| | | | |
| Net change | | | | | | | | | | | | | | | | |
Class A | | | 221,714 | | | | $2,436,040 | | | | 182,356 | | | | $1,636,366 | |
Class B | | | 11,577 | | | | 124,317 | | | | 19,525 | | | | 192,275 | |
Class C | | | 43,339 | | | | 442,371 | | | | 17,772 | | | | 173,902 | |
Class I | | | (15,773,236 | ) | | | (160,052,035 | ) | | | 15,916,535 | | | | 156,858,232 | |
Class R1 | | | 3,054 | | | | 31,338 | | | | 10,016 | | | | 100,140 | |
Class R2 | | | 1,861 | | | | 18,799 | | | | 10,182 | | | | 101,491 | |
Class R3 | | | 8,840 | | | | 95,900 | | | | 10,042 | | | | 100,370 | |
Class R4 | | | 686 | | | | 6,815 | | | | 10,058 | | | | 100,505 | |
Class R5 | | | 18,015,340 | | | | 182,489,423 | | | | — | | | | — | |
| | | 2,533,175 | | | | $25,592,968 | | | | 16,176,486 | | | | $159,263,281 | |
| (c) | For the period from the commencement of the fund’s investment operations, May 26, 2011, through the stated period end. |
| (i) | For Class R5, the period is from inception, July 2, 2012, through the stated period end. |
The fund is one of several mutual funds in which the MFS funds-of-funds may invest. The MFS funds-of-funds do not invest in the underlying MFS funds for the purpose of exercising management or control. At the end of the period, the MFS Growth Allocation Fund, MFS Moderate Allocation Fund, MFS Aggressive Growth Allocation Fund, MFS Conservative Allocation Fund, MFS Lifetime 2020 Fund, MFS Lifetime 2030 Fund, MFS Lifetime 2040 Fund, and MFS Lifetime Retirement Income Fund were the owners of record of approximately 33%, 30%, 14%, 11%, 2%, 2%, 2%, and 1%, respectively, of the value of outstanding voting shares of the fund. In addition, the
36
Notes to Financial Statements – continued
MFS Lifetime 2010 Fund, MFS Lifetime 2015 Fund, MFS Lifetime 2025 Fund, MFS Lifetime 2035 Fund, MFS Lifetime 2045 Fund, MFS Lifetime 2050 Fund, and MFS Lifetime 2055 Fund were each the owners of record of less than 1% of the value of outstanding voting shares of the fund.
(6) Line of Credit
The fund and certain other funds managed by MFS participate in a $1.1 billion unsecured committed line of credit, subject to a $1 billion sublimit, provided by a syndication of banks under a credit agreement. Borrowings may be made for temporary financing needs. Interest is charged to each fund, based on its borrowings, generally at a rate equal to the higher of the Federal Reserve funds rate or one month LIBOR plus an agreed upon spread. A commitment fee, based on the average daily, unused portion of the committed line of credit, is allocated among the participating funds at the end of each calendar quarter. In addition, the fund and other funds managed by MFS have established unsecured uncommitted borrowing arrangements with certain banks for temporary financing needs. Interest is charged to each fund, based on its borrowings, at a rate equal to the Federal Reserve funds rate plus an agreed upon spread. For the year ended February 28, 2013, the fund’s commitment fee and interest expense were $865 and $0, respectively, and are included in “Miscellaneous” expense in the Statement of Operations.
(7) Transactions in Underlying Affiliated Funds-Affiliated Issuers
An affiliated issuer may be considered one in which the fund owns 5% or more of the outstanding voting securities, or a company which is under common control. For the purposes of this report, the fund assumes the following to be an affiliated issuer:
| | | | | | | | | | | | | | | | |
| Underlying Affiliated Fund | | Beginning
Shares/Par
Amount | | | Acquisitions
Shares/Par
Amount | | | Dispositions
Shares/Par
Amount | | | Ending
Shares/Par
Amount | |
MFS Institutional Money
Market Portfolio | | | 6,717,269 | | | | 54,014,183 | | | | (51,019,818 | ) | | | 9,711,634 | |
| | | | |
| Underlying Affiliated Fund | | Realized
Gain (Loss) | | | Capital Gain
Distributions | | | Dividend
Income | | | Ending
Value | |
MFS Institutional Money
Market Portfolio | | | $— | | | | $— | | | | $12,066 | | | | $9,711,634 | |
37
REPORT OF INDEPENDENT REGISTERED PUBLIC ACCOUNTING FIRM
To the Trustees and Shareholders of MFS New Discovery Value Fund:
We have audited the accompanying statement of assets and liabilities of MFS New Discovery Value Fund (the Fund), including the portfolio of investments, as of February 28, 2013, the related statement of operations for the year then ended, and the statements of changes in net assets and the financial highlights for the periods indicated therein. These financial statements and financial highlights are the responsibility of the Fund’s management. Our responsibility is to express an opinion on these financial statements and financial highlights based on our audits.
We conducted our audits in accordance with the standards of the Public Company Accounting Oversight Board (United States). Those standards require that we plan and perform the audit to obtain reasonable assurance about whether the financial statements and financial highlights are free of material misstatement. We were not engaged to perform an audit of the Fund’s internal control over financial reporting. Our audit included consideration of internal control over financial reporting as a basis for designing audit procedures that are appropriate in the circumstances, but not for the purpose of expressing an opinion on the effectiveness of the Fund’s internal control over financial reporting. Accordingly, we express no such opinion. An audit also includes examining, on a test basis, evidence supporting the amounts and disclosures in the financial statements and financial highlights, assessing the accounting principles used and significant estimates made by management, and evaluating the overall financial statement presentation. Our procedures included confirmation of securities owned as of February 28, 2013, by correspondence with the Fund’s custodian and brokers or by other appropriate auditing procedures when replies from brokers were not received. We believe that our audits provide a reasonable basis for our opinion.
In our opinion, the financial statements and financial highlights referred to above present fairly, in all material respects, the financial position of MFS New Discovery Value Fund at February 28, 2013, the results of its operations for the year then ended, and the changes in its net assets and its financial highlights for the period indicated therein, in conformity with U.S. generally accepted accounting principles.

Boston, Massachusetts
April 12, 2013
38
TRUSTEES AND OFFICERS — IDENTIFICATION AND BACKGROUND
The Trustees and officers of the Trust, as of April 1, 2013, are listed below, together with their principal occupations during the past five years. (Their titles may have varied during that period.) The address of each Trustee and officer is 111 Huntington Avenue, Boston, Massachusetts 02199-7618.
| | | | | | | | |
Name, Age | | Position(s) Held with Fund | | Trustee/Officer Since (h) | | Principal
Occupations During the Past Five Years | | Other Directorships (j) |
| INTERESTED TRUSTEES |
Robert J. Manning (k) (age 49) | | Trustee | | February 2004 | | Massachusetts Financial Services Company, Chairman, Chief Executive Officer and Director; President (until December 2009); Chief Investment Officer (until July 2010) | | N/A |
| INDEPENDENT TRUSTEES |
David H. Gunning (age 70) | | Trustee and Chair of Trustees | | January 2004 | | Private investor | | Lincoln Electric Holdings, Inc. (welding equipment manufacturer), Director; Development Alternatives, Inc. (consulting), Director/Non-Executive Chairman; Portman Limited (mining), Director (until 2008) |
Robert E. Butler (age 71) | | Trustee | | January 2006 | | Consultant – investment company industry regulatory and compliance matters | | N/A |
Maureen R. Goldfarb (age 57) | | Trustee | | January 2009 | | Private investor | | N/A |
William R. Gutow (age 71) | | Trustee | | December 1993 | | Private investor and real estate consultant; Capitol Entertainment Management Company (video franchise), Vice Chairman | | Texas Donuts (donut franchise), Vice Chairman (until 2010) |
39
Trustees and Officers – continued
| | | | | | | | |
Name, Age | | Position(s) Held with Fund | | Trustee/Officer Since (h) | | Principal
Occupations During the Past Five Years | | Other Directorships (j) |
Michael Hegarty (age 68) | | Trustee | | December 2004 | | Private investor; Rouse Properties Inc. (real estate), Director | | Brookfield Office Properties, Inc. (real estate), Director; Rouse Properties Inc.
(real estate), Director; Capmark Financial Group Inc. (real estate), Director |
John P. Kavanaugh (age 58) | | Trustee | | January 2009 | | Private investor | | N/A |
J. Dale Sherratt (age 74) | | Trustee | | June 1989 | | Insight Resources, Inc. (acquisition planning specialists), President; Wellfleet Investments (investor in health care companies), Managing General Partner | | N/A |
Laurie J. Thomsen (age 55) | | Trustee | | March 2005 | | Private investor; New Profit, Inc. (venture philanthropy), Executive Partner
(until 2010) | | The Travelers Companies (insurance), Director |
Robert W. Uek (age 71) | | Trustee | | January 2006 | | Consultant to investment company industry | | N/A |
| OFFICERS |
John M. Corcoran (k) (age 47) | | President | | October 2008 | | Massachusetts Financial Services Company, Senior Vice President (since October 2008); State Street Bank and Trust (financial services provider), Senior Vice President, (until September 2008) | | N/A |
Christopher R. Bohane (k) (age 39) | | Assistant Secretary and Assistant Clerk | | July 2005 | | Massachusetts Financial Services Company, Vice President and Senior Counsel | | N/A |
Kino Clark (k) (age 44) | | Assistant Treasurer | | January 2012 | | Massachusetts Financial Services Company, Vice President | | N/A |
40
Trustees and Officers – continued
| | | | | | | | |
Name, Age | | Position(s) Held with Fund | | Trustee/Officer Since (h) | | Principal
Occupations During the Past Five Years | | Other Directorships (j) |
Thomas H. Connors (k) (age 53) | | Assistant Secretary and Assistant Clerk | | September 2012 | | Massachusetts Financial Services Company, Vice President and Senior Counsel; Deutsche Investment Management Americas Inc. (financial service provider), Director and Senior Counsel (until 2012) | | N/A |
Ethan D. Corey (k) (age 49) | | Assistant Secretary and Assistant Clerk | | July 2005 | | Massachusetts Financial Services Company, Senior Vice President and Associate General Counsel | | N/A |
David L. DiLorenzo (k) (age 44) | | Treasurer | | July 2005 | | Massachusetts Financial Services Company, Senior Vice President | | N/A |
Robyn L. Griffin (age 37) | | Assistant Independent Chief Compliance Officer | | August 2008 | | Griffin Compliance LLC (provider of compliance services), Principal (since August 2008); State Street Corporation (financial services provider), Mutual Fund Administration Assistant Vice President (October 2006 – July 2008) | | N/A |
Brian E. Langenfeld (k) (age 40) | | Assistant Secretary and Assistant Clerk | | June 2006 | | Massachusetts Financial Services Company, Vice President and Senior Counsel | | N/A |
Susan S. Newton (k) (age 63) | | Assistant Secretary and Assistant Clerk | | May 2005 | | Massachusetts Financial Services Company, Senior Vice President and Associate General Counsel | | N/A |
41
Trustees and Officers – continued
| | | | | | | | |
Name, Age | | Position(s) Held with Fund | | Trustee/Officer Since (h) | | Principal
Occupations During the Past Five Years | | Other Directorships (j) |
Susan A. Pereira (k) (age 42) | | Assistant Secretary and Assistant Clerk | | July 2005 | | Massachusetts Financial Services Company, Vice President and Senior Counsel | | N/A |
Kasey L. Phillips (k) (age 42) | | Assistant Treasurer | | September 2012 | | Massachusetts Financial Services Company, Vice President; Wells Fargo Funds Management, LLC, Senior Vice President, Fund Treasurer (until 2012) | | N/A |
Mark N. Polebaum (k) (age 60) | | Secretary and Clerk | | January 2006 | | Massachusetts Financial Services Company, Executive Vice President, General Counsel and Secretary | | N/A |
Frank L. Tarantino (age 69) | | Independent Chief Compliance Officer | | June 2004 | | Tarantino LLC (provider of compliance services), Principal | | N/A |
Richard S. Weitzel (k) (age 42) | | Assistant Secretary and Assistant Clerk | | October 2007 | | Massachusetts Financial Services Company, Senior Vice President and Associate General Counsel | | N/A |
James O. Yost (k) (age 52) | | Deputy Treasurer | | September 1990 | | Massachusetts Financial Services Company, Senior Vice President | | N/A |
| (h) | Date first appointed to serve as Trustee/officer of an MFS fund. Each Trustee has served continuously since appointment unless indicated otherwise. For the period from December 15, 2004 until February 22, 2005, Mr. Manning served as Advisory Trustee. For the period October 2008, until January 2012, Mr. Corcoran served as Treasurer of the Funds. Prior to January 2012, Messrs. DiLorenzo and Yost served as Assistant Treasurers of the Funds. |
| (j) | Directorships or trusteeships of companies required to report to the Securities and Exchange Commission (i.e., “public companies”). |
| (k) | “Interested person” of the Trust within the meaning of the Investment Company Act of 1940 (referred to as the 1940 Act), which is the principal federal law governing investment companies like the fund, as a result of position with MFS. The address of MFS is 111 Huntington Avenue, Boston, Massachusetts 02199-7618. |
Each Trustee has been elected by shareholders and each Trustee and officer holds office until his or her successor is chosen and qualified or until his or her earlier death, resignation, retirement or removal. The Trust does not hold annual meetings for the
42
Trustees and Officers – continued
purpose of electing Trustees, and Trustees are not elected for fixed terms. Messrs. Butler, Kavanaugh, Uek and Ms. Thomsen are members of the Trust’s Audit Committee.
Each of the Fund’s Trustees and officers holds comparable positions with certain other funds of which MFS or a subsidiary is the investment adviser or distributor, and, in the case of the officers, with certain affiliates of MFS. As of January 1, 2013, the Trustees served as board members of 143 funds within the MFS Family of Funds.
The Statement of Additional Information for the Fund includes further information about the Trustees and is available without charge upon request by calling 1-800-225-2606.
| | |
| Investment Adviser | | Custodian |
Massachusetts Financial Services Company
111 Huntington Avenue
Boston, MA 02199-7618 | | State Street Bank and Trust Company 1 Lincoln Street Boston, MA 02111-2900 |
| Distributor | | Independent Registered Public Accounting Firm |
MFS Fund Distributors, Inc.
111 Huntington Avenue
Boston, MA 02199-7618 | | Ernst & Young LLP 200 Clarendon Street Boston, MA 02116 |
| Portfolio Manager | | |
| Kevin Schmitz | | |
43
BOARD REVIEW OF INVESTMENT ADVISORY AGREEMENT
A discussion regarding the Board’s most recent review and renewal of the fund’s Investment Advisory Agreement with MFS is available by clicking on the fund’s name under “Mutual Funds” in the “Products” section of the MFS Web site (mfs.com).
PROXY VOTING POLICIES AND INFORMATION
A general description of the MFS funds’ proxy voting policies and procedures is available without charge, upon request, by calling 1-800-225-2606, by visiting the Proxy Voting section of mfs.com or by visiting the SEC’s Web site at http://www.sec.gov.
Information regarding how the fund voted proxies relating to portfolio securities during the most recent twelve-month period ended June 30 is available without charge by visiting the Proxy Voting section of mfs.com or by visiting the SEC’s Web site at http://www.sec.gov.
QUARTERLY PORTFOLIO DISCLOSURE
The fund will file a complete schedule of portfolio holdings with the Securities and Exchange Commission (the Commission) for the first and third quarters of each fiscal year on Form N-Q. A shareholder can obtain the quarterly portfolio holdings report at mfs.com. The fund’s Form N-Q is also available on the EDGAR database on the Commission’s Internet Web site at http://www.sec.gov, and may be reviewed and copied at the:
Public Reference Room
Securities and Exchange Commission
100 F Street, NE, Room 1580
Washington, D.C. 20549
Information on the operation of the Public Reference Room may be obtained by calling the Commission at 1-800-SEC-0330. Copies of the fund’s Form N-Q also may be obtained, upon payment of a duplicating fee, by electronic request at the following e-mail address: publicinfo@sec.gov or by writing the Public Reference Section at the above address.
FURTHER INFORMATION
From time to time, MFS may post important information about the fund or the MFS funds on the MFS web site (mfs.com). This information is available by visiting the “News & Commentary” section of mfs.com or by clicking on the fund’s name under “Mutual Funds” in the “Products” section of mfs.com.
FEDERAL TAX INFORMATION (unaudited)
The fund will notify shareholders of amounts for use in preparing 2013 income tax forms in January 2014. The following information is provided pursuant to provisions of the Internal Revenue Code.
The fund designates the maximum amount allowable as qualified dividend income eligible for the 15% tax rate.
The fund designates $3,813,774 as capital gain dividends paid during the fiscal year.
For corporate shareholders, 26.15% of the ordinary income dividends paid during the fiscal year qualify for the corporate dividends received deduction.
44
rev. 3/11
| | | | |
| | | |
FACTS | | WHAT DOES MFS DO WITH YOUR PERSONAL INFORMATION? | |  |
| | |
| Why? | | Financial companies choose how they share your personal information. Federal law gives consumers the right to limit some but not all sharing. Federal law also requires us to tell you how we collect, share, and protect your personal information. Please read this notice carefully to understand what we do. |
| | |
| What? | | The types of personal information we collect and share depend on the product or service you have with us. This information can include: •Social Security number and account balances •Account transactions and transaction history •Checking account information and wire transfer instructions When you are no longer our customer, we continue to share your information as described in this notice. |
| | |
| How? | | All financial companies need to share customers’ personal information to run their everyday business. In the section below, we list the reasons financial companies can share their customers’ personal information; the reasons MFS chooses to share; and whether you can limit this sharing. |
| | | | |
Reasons we can share your
personal information | | Does MFS
share? | | Can you limit
this sharing? |
For our everyday business purposes – such as to process your transactions, maintain your account(s), respond to court orders and legal investigations, or report to credit bureaus | | Yes | | No |
For our marketing purposes – to offer our products and services to you | | No | | We don’t share |
| For joint marketing with other financial companies | | No | | We don’t share |
For our affiliates’ everyday business purposes – information about your transactions and experiences | | No | | We don’t share |
For our affiliates’ everyday business purposes – information about your creditworthiness | | No | | We don’t share |
| For nonaffiliates to market to you | | No | | We don’t share |
| | |
| Questions? | | Call 800-225-2606 or go to mfs.com. |
45
| | |
| Who we are |
| Who is providing this notice? | | MFS Funds, MFS Investment Management, MFS Institutional Advisors, Inc., MFS Fund Distributors, Inc., MFS Heritage Trust Company, and MFS Service Center, Inc. |
| | |
| What we do |
| How does MFS protect my personal information? | | To protect your personal information from unauthorized access and use, we use security measures that comply with federal law. These measures include procedural, electronic, and physical safeguards for the protection of the personal information we collect about you. |
| How does MFS collect my personal information? | | We collect your personal information, for example, when you •open an account or provide account information •direct us to buy securities or direct us to sell your securities •make a wire transfer We also collect your personal information from others, such as credit bureaus, affiliates and other companies. |
| Why can’t I limit all sharing? | | Federal law gives you the right to limit only •sharing for affiliates’ everyday business purposes – information about your creditworthiness •affiliates from using your information to market to you •sharing for nonaffiliates to market to you State laws and individual companies may give you additional rights to limit sharing. |
| | |
| Definitions |
| Affiliates | | Companies related by common ownership or control. They can be financial and nonfinancial companies. •MFS does not share personal information with affiliates, except for everyday business purposes as described on page one of this notice. |
| Nonaffiliates | | Companies not related by common ownership or control. They can be financial and nonfinancial companies. •MFS does not share with nonaffiliates so they can market to you. |
| Joint Marketing | | A formal agreement between nonaffiliated financial companies that together market financial products or services to you. •MFS doesn’t jointly market. |
| | |
| Other important information |
| If you own an MFS product or receive an MFS service in the name of a third party such as a bank or broker-dealer, their privacy policy may apply to you instead of ours. |
46
Save paper with eDelivery.

| MFS® will send you prospectuses, |
reports, and proxies directly via e-mail so you will get information faster with less mailbox clutter.
To sign up:
1. Go to mfs.com.
2. Log in via MFS® Access.
3. Select eDelivery.
If you own your MFS fund shares through a financial institution or a retirement plan, MFS® TALK, MFS® Access, or eDelivery may not be available to you.
CONTACT
WEB SITE
mfs.com
MFS TALK
1-800-637-8255
24 hours a day
ACCOUNT SERVICE AND LITERATURE
Shareholders
1-800-225-2606
Financial advisors
1-800-343-2829
Retirement plan services
1-800-637-1255
MAILING ADDRESS
MFS Service Center, Inc.
P.O. Box 55824
Boston, MA 02205-5824
OVERNIGHT MAIL
MFS Service Center, Inc.
c/o Boston Financial Data Services
30 Dan Road
Canton, MA 02021-2809
The Registrant has adopted a Code of Ethics pursuant to Section 406 of the Sarbanes-Oxley Act and as defined in Form N-CSR that applies to the Registrant’s principal executive officer and principal financial and accounting officer. During the period covered by this report, the Registrant has not amended any provision in its Code of Ethics (the “Code”) that relates to an element of the Code’s definitions enumerated in paragraph (b) of Item 2 of this Form N-CSR. During the period covered by this report, the Registrant did not grant a waiver, including an implicit waiver, from any provision of the Code.
A copy of the Code of Ethics is filed as an exhibit to this Form N-CSR.
| ITEM 3. | AUDIT COMMITTEE FINANCIAL EXPERT. |
Messrs. Robert E. Butler, John P. Kavanaugh and Robert W. Uek and Ms. Laurie J. Thomsen, members of the Audit Committee, have been determined by the Board of Trustees in their reasonable business judgment to meet the definition of “audit committee financial expert” as such term is defined in Form N-CSR. In addition, Messrs. Butler, Kavanaugh and Uek and Ms. Thomsen are “independent” members of the Audit Committee (as such term has been defined by the Securities and Exchange Commission in regulations implementing Section 407 of the Sarbanes-Oxley Act of 2002). The Securities and Exchange Commission has stated that the designation of a person as an audit committee financial expert pursuant to this Item 3 on the Form N-CSR does not impose on such a person any duties, obligations or liability that are greater than the duties, obligations or liability imposed on such person as a member of the Audit Committee and the Board of Trustees in the absence of such designation or identification.
| ITEM 4. | PRINCIPAL ACCOUNTANT FEES AND SERVICES. |
Items 4(a) through 4(d) and 4(g):
The Board of Trustees has appointed Deloitte & Touche LLP (“Deloitte”) to serve as independent accountants to certain series of the Registrant and Ernst & Young LLP (“E&Y”) to serve in the same capacity to certain other series of the Registrant (the series referred to collectively as the “Funds” and singularly as a “Fund”). The tables below set forth the audit fees billed to the Funds as well as fees for non-audit services provided to the Funds and/or to the Funds’ investment adviser, Massachusetts Financial Services Company (“MFS”), and to various entities either controlling, controlled by, or under common control with MFS that provide ongoing services to the Funds (“MFS Related Entities”).
For the fiscal years ended February 28, 2013 and February 29, 2012, respectively, audit fees billed to the Funds by Deloitte and E&Y were as follows:
| | | | | | | | |
| | | Audit Fees | |
Fees billed by Deloitte: | | 2013 | | | 2012 | |
MFS Government Securities Fund | | | 50,003 | | | | 46,097 | |
| |
| | | Audit Fees | |
Fees billed by E&Y: | | 2013 | | | 2012 | |
MFS Diversified Income Fund | | | 53,118 | | | | 50,377 | |
MFS Global Real Estate Fund | | | 43,889 | | | | 42,554 | |
MFS New Discovery Value Fund | | | 31,900 | | | | 20,800 | |
Total | | | 128,907 | | | | 113,731 | |
For the fiscal years ended February 28, 2013 and February 29, 2012, respectively, fees billed by Deloitte and E&Y for audit-related, tax and other services provided to the Funds and for audit-related, tax and other services provided to MFS and MFS Related Entities were as follows:
| | | | | | | | | | | | | | | | | | | | | | | | |
| | | Audit-Related Fees1 | | | Tax Fees2 | | | All Other Fees3 | |
Fees billed by Deloitte: | | 2013 | | | 2012 | | | 2013 | | | 2012 | | | 2013 | | | 2012 | |
To MFS Government Securities Fund | | | 0 | | | | 0 | | | | 6,597 | | | | 6,468 | | | | 1,191 | | | | 1,331 | |
| | | |
| | | Audit-Related Fees1 | | | Tax Fees2 | | | All Other Fees3 | |
Fees billed by Deloitte: | | 2013 | | | 2012 | | | 2013 | | | 2012 | | | 2013 | | | 2012 | |
To MFS and MFS Related Entities of MFS Government Securities
Fund * | | | 1,322,413 | | | | 1,213,300 | | | | 0 | | | | 0 | | | | 0 | | | | 0 | |
| | | | | | | | |
Aggregate fees for non-audit services: | | 2013 | | | 2012 | |
To MFS Government Securities Fund, MFS and MFS Related Entities# | | | 1,474,771 | | | | 1,621,814 | |
| | | | | | | | | | | | | | | | | | | | | | | | |
| | | Audit-Related Fees1 | | | Tax Fees2 | | | All Other Fees4 | |
Fees billed by E&Y: | | 2013 | | | 2012 | | | 2013 | | | 2012 | | | 2013 | | | 2012 | |
To MFS Diversified Income Fund | | | 0 | | | | 0 | | | | 7,934 | | | | 7,673 | | | | 0 | | | | 0 | |
To MFS Global Real Estate Fund | | | 0 | | | | 0 | | | | 9,746 | | | | 9,450 | | | | 0 | | | | 0 | |
To MFS New Discovery Value Fund | | | 0 | | | | 0 | | | | 7,982 | | | | 7,200 | | | | 0 | | | | 0 | |
Total fees billed by E&Y To above Funds | | | 0 | | | | 0 | | | | 25,662 | | | | 24,323 | | | | 0 | | | | 0 | |
| | | | | | | | | | | | | | | | | | | | | | | | |
| | | Audit-Related Fees1 | | | Tax Fees2 | | | All Other Fees4 | |
Fees billed by E&Y: | | 2013 | | | 2012 | | | 2013 | | | 2012 | | | 2013 | | | 2012 | |
To MFS and MFS Related Entities of MFS Diversified Income Fund* | | | 0 | | | | 0 | | | | 0 | | | | 0 | | | | 0 | | | | 0 | |
To MFS and MFS Related Entities of MFS Global Real Estate Fund * | | | 0 | | | | 0 | | | | 0 | | | | 0 | | | | 0 | | | | 0 | |
To MFS and MFS Related Entities of MFS New Discovery Value Fund * | | | 0 | | | | 0 | | | | 0 | | | | 0 | | | | 0 | | | | 0 | |
| | | | | | | | |
Aggregate fees for non-audit services: | | 2013 | | | 2012 | |
To MFS Diversified Income Fund, MFS and MFS Related Entities# | | | 52,934 | | | | 142,673 | |
To MFS Global Real Estate Fund, MFS and MFS Related Entities# | | | 54,746 | | | | 144,450 | |
To MFS New Discovery Value Fund, MFS and MFS Related Entities# | | | 52,982 | | | | 142,200 | |
| * | This amount reflects the fees billed to MFS and MFS Related Entities for non-audit services relating directly to the operations and financial reporting of the Funds (portions of which services also related to the operations and financial reporting of other funds within the MFS Funds complex). |
| # | This amount reflects the aggregate fees billed by Deloitte or E&Y, as the case may be, for non-audit services rendered to the Funds and for non-audit services rendered to MFS and the MFS Related Entities. |
| 1 | The fees included under “Audit-Related Fees” are fees related to assurance and related services that are reasonably related to the performance of the audit or review of financial statements, but not reported under ‘‘Audit Fees,’’ including accounting consultations, agreed-upon procedure reports, attestation reports, comfort letters and internal control reviews. |
| 2 | The fees included under “Tax Fees” are fees associated with tax compliance, tax advice and tax planning, including services relating to the filing or amendment of federal, state or local income tax returns, regulated investment company qualification reviews and tax distribution and analysis. |
| 3 | The fees included under “All Other Fees” are fees for products and services provided by Deloitte other than those reported under “Audit Fees,” “Audit-Related Fees” and “Tax Fees,” including fees for services related to reviews of internal controls and review of Rule 38a-1 compliance program. |
| 4 | The fees under “All Other Fees” are fees for products and services provided by E&Y other than those reported under “Audit Fees,” “Audit-Related Fees” and “Tax Fees”. |
Item 4(e)(1):
Set forth below are the policies and procedures established by the Audit Committee of the Board of Trustees relating to the pre-approval of audit and non-audit related services:
To the extent required by applicable law, pre-approval by the Audit Committee of the Board is needed for all audit and permissible non-audit services rendered to the Funds and all permissible non-audit services rendered to MFS or MFS Related Entities if the services relate directly to the operations and financial reporting of the Registrant. Pre-approval is currently on an engagement-by-engagement basis. In the event pre-approval of such services is necessary between regular meetings of the Audit Committee and it is not practical to wait to seek pre-approval at the next regular meeting of the Audit Committee, pre-approval of such services may be referred to the Chair of the Audit Committee for approval; provided that the Chair may not pre-approve any individual engagement for such services exceeding $50,000 or multiple engagements for such services in the aggregate exceeding $100,000 in each period between regular meetings of the Audit Committee. Any engagement pre-approved by the Chair between regular meetings of the Audit Committee shall be presented for ratification by the entire Audit Committee at its next regularly scheduled meeting.
Item 4(e)(2):
None, or 0%, of the services relating to the Audit-Related Fees, Tax Fees and All Other Fees paid by the Fund and MFS and MFS Related Entities relating directly to the operations and financial reporting of the Registrant disclosed above were approved by the audit committee pursuant to paragraphs (c)(7)(i)(C) of Rule 2-01 of Regulation S-X (which permits audit committee approval after the start of the engagement with respect to services other than audit, review or attest services, if certain conditions are satisfied).
Item 4(f): Not applicable.
Item 4(h): The Registrant’s Audit Committee has considered whether the provision by a Registrant’s independent registered public accounting firm of non-audit services to MFS and MFS Related Entities that were not pre-approved by the Committee (because such services did not relate directly to the operations and financial reporting of the Registrant) was compatible with maintaining the independence of the independent registered public accounting firm as the Registrant’s principal auditors.
| ITEM 5. | AUDIT COMMITTEE OF LISTED REGISTRANTS. |
Not applicable to the Registrant.
A schedule of investments of the Registrant is included as part of the report to shareholders of such series under Item 1 of this
Form N-CSR.
| ITEM 7. | DISCLOSURE OF PROXY VOTING POLICIES AND PROCEDURES FOR CLOSED-END MANAGEMENT INVESTMENT COMPANIES. |
Not applicable to the Registrant.
| ITEM 8. | PORTFOLIO MANAGERS OF CLOSED-END MANAGEMENT INVESTMENT COMPANIES. |
Not applicable to the Registrant.
| ITEM 9. | PURCHASES OF EQUITY SECURITIES BY CLOSED-END MANAGEMENT INVESTMENT COMPANY AND AFFILIATED PURCHASERS. |
Not applicable to the Registrant.
| ITEM 10. | SUBMISSION OF MATTERS TO A VOTE OF SECURITY HOLDERS. |
There were no material changes to the procedures by which shareholders may send recommendations to the Board for nominees to the Registrant’s Board since the Registrant last provided disclosure as to such procedures in response to the requirements of Item 407 (c)(2)(iv) of Regulation S-K or this Item.
| ITEM 11. | CONTROLS AND PROCEDURES. |
| (a) | Based upon their evaluation of the effectiveness of the registrant’s disclosure controls and procedures (as defined in Rule 30a-3(c) under the Investment Company Act of 1940 (the “Act”)) as conducted within 90 days of the filing date of this report on Form N-CSR, the registrant’s principal financial officer and principal executive officer have concluded that those disclosure controls and procedures provide reasonable assurance that the material information required to be disclosed by the registrant on this report is recorded, processed, summarized and reported within the time periods specified in the Securities and Exchange Commission’s rules and forms. |
| (b) | There were no changes in the registrant’s internal controls over financial reporting (as defined in Rule 30a-3(d) under the Act) that occurred during the second fiscal quarter of the period covered by the report that have materially affected, or are reasonably likely to materially affect, the registrant’s internal control over financial reporting. |
| (a) | File the exhibits listed below as part of this form. Letter or number the exhibits in the sequence indicated. |
| | (1) | Any code of ethics, or amendment thereto, that is the subject of the disclosure required by Item 2, to the extent that the registrant intends to satisfy the Item 2 requirements through filing of an exhibit: Code of Ethics attached hereto. |
| | (2) | A separate certification for each principal executive officer and principal financial officer of the registrant as required by Rule 30a-2(a) under the Act (17 CFR 270.30a-2): Attached hereto. |
| (b) | If the report is filed under Section 13(a) or 15(d) of the Exchange Act, provide the certifications required by Rule 30a-2(b) under the Act (17 CFR 270.30a-2(b)), Rule 13a-14(b) or Rule 15d-14(b) under the Exchange Act (17 CFR 240.13a-14(b) or 240.15d-14(b)) and Section 1350 of Chapter 63 of Title 18 of the United States Code (18 U.S.C. 1350) as an exhibit. A certification furnished pursuant to this paragraph will not be deemed “filed” for the purposes of Section 18 of the Exchange Act (15 U.S.C. 78r), or otherwise subject to the liability of that section. Such certification will not be deemed to be incorporated by reference into any filing under the Securities Act of 1933 or the Exchange Act, except to the extent that the registrant specifically incorporates it by reference: Attached hereto. |
Notice
A copy of the Amended and Restated Declaration of Trust, as amended, of the Registrant is on file with the Secretary of State of The Commonwealth of Massachusetts and notice is hereby given that this instrument is executed on behalf of the Registrant by an officer of the Registrant as an officer and not individually and the obligations of or arising out of this instrument are not binding upon any of the Trustees or shareholders individually, but are binding only upon the assets and property of the respective constituent series of the Registrant.
SIGNATURES
Pursuant to the requirements of the Securities Exchange Act of 1934 and the Investment Company Act of 1940, the registrant has duly caused this report to be signed on its behalf by the undersigned, thereunto duly authorized.
(Registrant) MFS SERIES TRUST XIIII
| | |
| By (Signature and Title)* | | JOHN M. CORCORAN |
| | John M. Corcoran, President |
Date: June 19, 2013
Pursuant to the requirements of the Securities Exchange Act of 1934 and the Investment Company Act of 1940, this report has been signed below by the following persons on behalf of the registrant and in the capacities and on the dates indicated.
| | |
| By (Signature and Title)* | | JOHN M. CORCORAN |
| | John M. Corcoran, President (Principal Executive Officer) |
Date: June 19, 2013
| | |
| By (Signature and Title)* | | DAVID L. DILORENZO |
| | David L. DiLorenzo, Treasurer (Principal Financial Officer and Accounting Officer) |
Date: June 19, 2013
| * | Print name and title of each signing officer under his or her signature. |