UNITED STATES
SECURITIES AND EXCHANGE COMMISSION
Washington, D.C. 20549
FORM N-CSR
CERTIFIED SHAREHOLDER REPORT OF
REGISTERED MANAGEMENT INVESTMENT COMPANIES
Investment Company Act file number 811-3327
MFS SERIES TRUST XIII
(Exact name of registrant as specified in charter)
111 Huntington Avenue, Boston, Massachusetts 02199
(Address of principal executive offices) (Zip code)
Susan S. Newton
Massachusetts Financial Services Company
111 Huntington Avenue
Boston, Massachusetts 02199
(Name and address of agents for service)
Registrant’s telephone number, including area code: (617) 954-5000
Date of fiscal year end: February 28
Date of reporting period: August 31, 2013
| ITEM 1. | REPORTS TO STOCKHOLDERS. |
SEMIANNUAL REPORT
August 31, 2013

MFS® DIVERSIFIED INCOME FUND

DIF-SEM
MFS® DIVERSIFIED INCOME FUND
CONTENTS
The report is prepared for the general information of shareholders.
It is authorized for distribution to prospective investors only when preceded or accompanied by a current prospectus.
NOT FDIC INSURED Ÿ MAY LOSE VALUE Ÿ NO BANK GUARANTEE

LETTER FROM THE CHAIRMAN AND CEO
Dear Shareholders:
Global economic trends appear to favor growth again despite risks created by the U.S. government’s gridlock. The U.S. economy’s slow but steady expansion is no longer the
exception. The eurozone has emerged from its 18-month-long recession, with Germany leading the way. China’s monthly gauges of economic activity once again point toward expansion. And Japan is picking up momentum in response to its government’s and central bank’s aggressive program of monetary easing.
However, geopolitical risks have risen, with violence erupting in Egypt and Syria and the possibility of further unrest in the Middle East. The U.S. Federal Reserve’s expected tapering of its bond-buying stimulus program has weighed on global markets
since May. Emerging markets, including Brazil and India, have borne much of the brunt, as their currency values have dropped and nervous investors have fled to safety elsewhere. In Europe, unemployment persists at historically high levels. The trend towards a pickup in global growth, while encouraging, appears tenuous, particularly with the risk of a U.S. debt default.
As always, managing risk in the face of uncertainty remains a top priority for investors. At MFS®, our uniquely collaborative investment process employs integrated, global research and active risk management. Our global team of investment professionals shares ideas and evaluates opportunities across continents, investment disciplines and asset classes — all with a goal of building better insights, and ultimately better results, for our clients.
We are mindful of the many economic challenges investors face, and believe it is more important than ever to maintain a long-term view and employ time-tested principles, such as asset allocation and diversification. We remain confident that our unique approach can serve investors well as they work with their financial advisors to identify and pursue the most suitable opportunities.
Respectfully,

Robert J. Manning
Chairman and Chief Executive Officer
MFS Investment Management®
October 17, 2013
The opinions expressed in this letter are subject to change, may not be relied upon for investment advice, and no forecasts can be guaranteed.
1
PORTFOLIO COMPOSITION
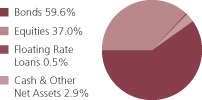
Portfolio structure (i)
| | | | |
| Top ten holdings (i) | | | | |
| U.S. Treasury Notes, 2.125%, 2015 | | | 2.9% | |
| Simon Property Group, Inc., REIT | | | 2.2% | |
| U.S. Treasury Notes, 0.875%, 2016 | | | 1.6% | |
| Public Storage, Inc., REIT | | | 1.5% | |
| Fannie Mae, 4.5%, 30 Years | | | 1.3% | |
| Vornado Realty Trust, REIT | | | 1.2% | |
| Exxon Mobil Corp. | | | 1.1% | |
| Host Hotels & Resorts, Inc., REIT | | | 1.0% | |
| U.S. Treasury Notes, 3.125%, 2021 | | | 1.0% | |
| AvalonBay Communities, Inc., REIT | | | 0.9% | |
| |
| Equity sectors (i) | | | | |
| Financial Services | | | 22.4% | |
| Energy | | | 2.8% | |
| Health Care | | | 2.7% | |
| Utilities & Communications | | | 2.4% | |
| Technology | | | 1.7% | |
| Industrial Goods & Services | | | 1.1% | |
| Autos & Housing | | | 0.9% | |
| Basic Materials | | | 0.8% | |
| Retailing | | | 0.7% | |
| Consumer Staples | | | 0.7% | |
| Leisure | | | 0.6% | |
| Transportation | | | 0.1% | |
| Special Products & Services | | | 0.1% | |
| | | | |
| Fixed income sectors (i) | | | | |
| High Yield Corporates | | | 24.0% | |
| Emerging Markets Bonds | | | 15.9% | |
| Mortgage-Backed Securities | | | 8.9% | |
| U.S. Treasury Securities | | | 7.6% | |
| Non-U.S. Government Bonds | | | 1.0% | |
| High Grade Corporates | | | 0.9% | |
| U.S. Government Agencies | | | 0.9% | |
| Floating Rate Loans | | | 0.5% | |
| Commercial Mortgage-Backed Securities | | | 0.3% | |
| Municipal Bonds | | | 0.1% | |
| Collateralized Debt Obligations (o) | | | 0.0% | |
|
| Composition including fixed income credit quality (a)(i) | |
| AAA (o) | | | 0.0% | |
| AA | | | 0.4% | |
| A | | | 1.7% | |
| BBB | | | 9.5% | |
| BB | | | 13.7% | |
| B | | | 13.4% | |
| CCC | | | 3.6% | |
| C (o) | | | 0.0% | |
| U.S. Government | | | 7.6% | |
| Federal Agencies | | | 9.8% | |
| Not Rated | | | 0.4% | |
| Non-Fixed Income | | | 37.0% | |
| Cash & Other | | | 2.9% | |
2
Portfolio Composition – continued
| (a) | For all securities other than those specifically described below, ratings are assigned to underlying securities utilizing ratings from Moody’s, Fitch, and Standard & Poor’s rating agencies and applying the following hierarchy: If all three agencies provide a rating, the middle rating (after dropping the highest and lowest ratings) is assigned; if two of the three agencies rate a security, the lower of the two is assigned. Ratings are shown in the S&P and Fitch scale (e.g., AAA). Securities rated BBB or higher are considered investment grade. All ratings are subject to change. U.S. Government includes securities issued by the U.S. Department of the Treasury. Federal Agencies includes rated and unrated U.S. Agency fixed-income securities, U.S. Agency mortgage-backed securities, and collateralized mortgage obligations of U.S. Agency mortgage-backed securities. Not Rated includes fixed income securities, including fixed income futures contracts, which have not been rated by any rating agency. Non-Fixed Income includes equity securities (including convertible bonds and equity derivatives) and commodities. Cash & Other includes cash, other assets less liabilities, offsets to derivative positions, and short-term securities. The fund may not hold all of these instruments. The fund is not rated by these agencies. |
| (i) | For purposes of this presentation, the components include the market value of securities, and reflect the impact of the equivalent exposure of derivative positions, if any. These amounts may be negative from time to time. Equivalent exposure is a calculated amount that translates the derivative position into a reasonable approximation of the amount of the underlying asset that the portfolio would have to hold at a given point in time to have the same price sensitivity that results from the portfolio’s ownership of the derivative contract. When dealing with derivatives, equivalent exposure is a more representative measure of the potential impact of a position on portfolio performance than market value. The bond component will include any accrued interest amounts. |
Where the fund holds convertible bonds, these are treated as part of the equity portion of the portfolio.
The fund invests a portion of its assets in the MFS High Yield Pooled Portfolio. Percentages reflect exposure to the underlying holdings of the MFS High Yield Pooled Portfolio and not to the exposure from investing directly in the MFS High Yield Pooled Portfolio itself.
Percentages are based on net assets as of 8/31/13.
The portfolio is actively managed and current holdings may be different.
3
EXPENSE TABLE
Fund expenses borne by the shareholders during the period, March 1, 2013 through August 31, 2013
As a shareholder of the fund, you incur two types of costs: (1) transaction costs, including sales charges (loads) on certain purchase or redemption payments, and (2) ongoing costs, including management fees; distribution and service (12b-1) fees; and other fund expenses. This example is intended to help you understand your ongoing costs (in dollars) of investing in the fund and to compare these costs with the ongoing costs of investing in other mutual funds.
In addition to the fees and expenses which the fund bears directly, the fund indirectly bears a pro rata share of the fees and expenses of the underlying MFS Pooled Portfolio in which the fund invests. MFS Pooled Portfolios are mutual funds advised by MFS that do not pay management fees to MFS but do incur investment and operating costs. If these transactional and indirect costs were included, your costs would have been higher.
The example is based on an investment of $1,000 invested at the beginning of the period and held for the entire period March 1, 2013 through August 31, 2013.
Actual Expenses
The first line for each share class in the following table provides information about actual account values and actual expenses. You may use the information in this line, together with the amount you invested, to estimate the expenses that you paid over the period. Simply divide your account value by $1,000 (for example, an $8,600 account value divided by $1,000 = 8.6), then multiply the result by the number in the first line under the heading entitled “Expenses Paid During Period” to estimate the expenses you paid on your account during this period.
Hypothetical Example for Comparison Purposes
The second line for each share class in the following table provides information about hypothetical account values and hypothetical expenses based on the fund’s actual expense ratio and an assumed rate of return of 5% per year before expenses, which is not the fund’s actual return. The hypothetical account values and expenses may not be used to estimate the actual ending account balance or expenses you paid for the period. You may use this information to compare the ongoing costs of investing in the fund and other funds. To do so, compare this 5% hypothetical example with the 5% hypothetical examples that appear in the shareholder reports of the other funds.
Please note that the expenses shown in the table are meant to highlight your ongoing costs only and do not reflect any transactional costs, such as sales charges (loads). Therefore, the second line for each share class in the table is useful in comparing ongoing costs only, and will not help you determine the relative total costs of owning different funds. In addition, if these transactional costs were included, your costs would have been higher.
4
Expense Table – continued
| | | | | | | | | | | | | | | | | | |
Share
Class | | | | Annualized
Expense
Ratio | | | Beginning
Account Value
3/01/13 | | | Ending
Account Value
8/31/13 | | | Expenses
Paid During
Period (p)
3/01/13-8/31/13 | |
| A | | Actual | | | 1.04% | | | | $1,000.00 | | | | $996.25 | | | | $5.23 | |
| | Hypothetical (h) | | | 1.04% | | | | $1,000.00 | | | | $1,019.96 | | | | $5.30 | |
| C | | Actual | | | 1.79% | | | | $1,000.00 | | | | $992.51 | | | | $8.99 | |
| | Hypothetical (h) | | | 1.79% | | | | $1,000.00 | | | | $1,016.18 | | | | $9.10 | |
| I | | Actual | | | 0.79% | | | | $1,000.00 | | | | $997.50 | | | | $3.98 | |
| | Hypothetical (h) | | | 0.79% | | | | $1,000.00 | | | | $1,021.22 | | | | $4.02 | |
| R1 | | Actual | | | 1.79% | | | | $1,000.00 | | | | $992.50 | | | | $8.99 | |
| | Hypothetical (h) | | | 1.79% | | | | $1,000.00 | | | | $1,016.18 | | | | $9.10 | |
| R2 | | Actual | | | 1.29% | | | | $1,000.00 | | | | $995.01 | | | | $6.49 | |
| | Hypothetical (h) | | | 1.29% | | | | $1,000.00 | | | | $1,018.70 | | | | $6.56 | |
| R3 | | Actual | | | 1.04% | | | | $1,000.00 | | | | $995.41 | | | | $5.23 | |
| | Hypothetical (h) | | | 1.04% | | | | $1,000.00 | | | | $1,019.96 | | | | $5.30 | |
| R4 | | Actual | | | 0.79% | | | | $1,000.00 | | | | $998.36 | | | | $3.98 | |
| | Hypothetical (h) | | | 0.79% | | | | $1,000.00 | | | | $1,021.22 | | | | $4.02 | |
| R5 | | Actual | | | 0.72% | | | | $1,000.00 | | | | $997.86 | | | | $3.63 | |
| | Hypothetical (h) | | | 0.72% | | | | $1,000.00 | | | | $1,021.58 | | | | $3.67 | |
| (h) | 5% class return per year before expenses. |
| (p) | Expenses paid are equal to each class’s annualized expense ratio, as shown above, multiplied by the average account value over the period, multiplied by the number of days in the period, divided by the number of days in the year. Expenses paid do not include any applicable sales charges (loads). If these transaction costs had been included, your costs would have been higher. In addition to the fees and expenses which the fund bears directly, the fund indirectly bears a pro rata share of the fees and expenses of the underlying funds in which the fund invests. If these indirect costs were included, your costs would have been higher. |
Notes to Expense Table
Changes to the fund’s fee arrangements occurred during the six month period. Had these fee changes been in effect throughout the entire six month period, the annualized expense ratios would have been 1.03%, 1.78%, 0.78%, 1.78%, 1.28%, 1.03%, 0.78%, and 0.71% for Classes A, C, I, R1, R2, R3, R4, and R5, respectively; the actual expenses paid during the period would have been approximately $5.18, $8.94, $3.93, $8.94, $6.44, $5.18, $3.93, and $3.58 for Classes A, C, I, R1, R2, R3, R4, and R5, respectively; and the hypothetical expenses paid during the period would have been approximately $5.24, $9.05, $3.97, $9.05, $6.51, $5.24, $3.97, and $3.62 for Classes A, C, I, R1, R2, R3, R4, and R5, respectively. For further information about the fund’s fee arrangements and changes to those fee arrangements, please see Note 3 in the Notes to Financial Statements.
5
PORTFOLIO OF INVESTMENTS
8/31/13 (unaudited)
The Portfolio of Investments is a complete list of all securities owned by your fund. It is categorized by broad-based asset classes.
| | | | | | | | |
| Bonds - 33.1% | | | | | | | | |
| Issuer | | Shares/Par | | | Value ($) | |
| Aerospace - 0.1% | | | | | | | | |
| Embraer Empresa Brasileria de Aeronaves, 5.15%, 2022 | | $ | 2,211,000 | | | $ | 2,199,945 | |
| | |
| Agency - Other - 0.2% | | | | | | | | |
| Financing Corp., 9.4%, 2018 | | $ | 965,000 | | | $ | 1,274,838 | |
| Financing Corp., 10.35%, 2018 | | | 715,000 | | | | 992,366 | |
| Financing Corp., STRIPS, 0%, 2017 | | | 860,000 | | | | 799,166 | |
| | | | | | | | |
| | | | | | | $ | 3,066,370 | |
| Asset-Backed & Securitized - 0.3% | | | | | | | | |
| Citigroup Commercial Mortgage Trust, FRN, 5.885%, 2049 | | $ | 198,555 | | | $ | 23,687 | |
| Citigroup/Deutsche Bank Commercial Mortgage Trust, 5.322%, 2049 | | | 100,000 | | | | 109,393 | |
| Commercial Mortgage Pass-Through Certificates, “A4”, 5.306%, 2046 | | | 199,556 | | | | 218,984 | |
| Credit Suisse Commercial Mortgage Trust, “A4”, FRN, 5.954%, 2039 | | | 918,488 | | | | 1,015,090 | |
| CWCapital Cobalt Ltd., “A4”, FRN, 5.966%, 2046 | | | 1,195,102 | | | | 1,332,547 | |
| G-Force LLC, CDO, “A2”, 4.83%, 2036 (z) | | | 31,160 | | | | 31,160 | |
| Goldman Sachs Mortgage Securities Corp., FRN, 5.993%, 2045 | | | 1,410,458 | | | | 1,552,837 | |
| JPMorgan Chase Commercial Mortgage Securities Corp., “A3”, FRN, 6.124%, 2051 | | | 105,201 | | | | 108,948 | |
| JPMorgan Chase Commercial Mortgage Securities Corp., “A4”, FRN, 6.003%, 2049 | | | 1,437,604 | | | | 1,601,294 | |
| | | | | | | | |
| | | | | | | $ | 5,993,940 | |
| Automotive - 0.0% | | | | | | | | |
| Automotores Gildemeister S.A., 8.25%, 2021 (n) | | $ | 667,000 | | | $ | 520,260 | |
| | |
| Broadcasting - 0.1% | | | | | | | | |
| Globo Comunicacoes e Participacoes S.A., 6.25% to 2015, 9.375% to 2049 (n) | | $ | 1,499,000 | | | $ | 1,558,960 | |
| | |
| Building - 0.4% | | | | | | | | |
| Cementos Pacasmayo S.A.A., 4.5%, 2023 | | $ | 1,214,000 | | | $ | 1,059,215 | |
| CEMEX Espana S.A., 9.25%, 2020 | | | 1,545,000 | | | | 1,614,525 | |
| CEMEX Finance LLC, 9.5%, 2016 (n) | | | 143,000 | | | | 150,865 | |
| CEMEX S.A.B. de C.V., 9%, 2018 (n) | | | 1,064,000 | | | | 1,122,520 | |
| CEMEX S.A.B. de C.V., 6.5%, 2019 (z) | | | 1,293,000 | | | | 1,254,210 | |
| CEMEX S.A.B. de C.V., FRN, 5.276%, 2015 (n) | | | 1,155,000 | | | | 1,183,875 | |
| Odebrecht Finance Ltd., 7.125%, 2042 (n) | | | 1,706,000 | | | | 1,484,220 | |
| | | | | | | | |
| | | | | | | $ | 7,869,430 | |
6
Portfolio of Investments (unaudited) – continued
| | | | | | | | |
| Issuer | | Shares/Par | | | Value ($) | |
| Bonds - continued | | | | | | | | |
| Business Services - 0.1% | | | | | | | | |
| Tencent Holdings Ltd., 3.375%, 2018 (n) | | $ | 1,326,000 | | | $ | 1,325,862 | |
| | |
| Cable TV - 0.2% | | | | | | | | |
| Myriad International Holdings B.V., 6%, 2020 (n) | | $ | 3,692,000 | | | $ | 3,761,410 | |
| | |
| Chemicals - 0.1% | | | | | | | | |
| Sociedad Quimica y Minera de Chile S.A., 5.5%, 2020 (n) | | $ | 1,594,000 | | | $ | 1,679,799 | |
| | |
| Conglomerates - 0.1% | | | | | | | | |
| Metalloinvest Finance Ltd., 5.625%, 2020 (n) | | $ | 1,764,000 | | | $ | 1,649,340 | |
| | |
| Construction - 0.1% | | | | | | | | |
| Empresas ICA S.A.B. de C.V., 8.375%, 2017 (n) | | $ | 1,409,000 | | | $ | 1,352,640 | |
| | |
| Emerging Market Quasi-Sovereign - 5.0% | | | | | | | | |
| Abu Dhabi National Energy Co. PJSC (TAQA), 5.875%, 2021 (n) | | $ | 955,000 | | | $ | 1,038,562 | |
| Banco de Costa Rica, 5.25%, 2018 (z) | | | 343,000 | | | | 346,430 | |
| Banco de Reservas de La Republica Dominicana, 7%, 2023 (n) | | | 1,705,000 | | | | 1,670,900 | |
| Banco do Brasil S.A., 3.875%, 2017 | | | 1,472,000 | | | | 1,503,280 | |
| Banco do Brasil S.A., FRN, 6.25%, 2049 (n) | | | 3,705,000 | | | | 2,889,900 | |
| Banco do Estado Rio Grande do Sul S.A., 7.375%, 2022 (n) | | | 2,497,000 | | | | 2,459,545 | |
| Banco do Nordeste do Brasil (BNB), 3.625%, 2015 (n) | | | 1,236,000 | | | | 1,242,180 | |
| Banco do Nordeste do Brasil (BNB), 4.375%, 2019 (n) | | | 2,097,000 | | | | 1,989,004 | |
| Biz Finance PLC, 8.375%, 2015 | | | 1,153,000 | | | | 1,115,527 | |
| Brazil Minas SPE, 5.333%, 2028 (z) | | | 536,000 | | | | 501,160 | |
| CNOOC Finance (2012) Ltd., 3.875%, 2022 (n) | | | 1,123,000 | | | | 1,084,874 | |
| CNOOC Finance (2013) Ltd., 3%, 2023 | | | 2,512,000 | | | | 2,231,824 | |
| CNPC (HK) Overseas Capital Ltd., 4.5%, 2021 (n) | | | 540,000 | | | | 547,683 | |
| CNPC General Capital Ltd., 3.4%, 2023 (n) | | | 3,618,000 | | | | 3,294,377 | |
| Comision Federal de Electricidad, 5.75%, 2042 (n) | | | 1,575,000 | | | | 1,409,625 | |
| Corporacion Financiera de Desarrollo S.A., 4.75%, 2022 (n) | | | 2,106,000 | | | | 2,027,025 | |
| Corporacion Nacional del Cobre de Chile, 3.75%, 2020 (n) | | | 349,000 | | | | 338,323 | |
| Corporacion Nacional del Cobre de Chile, 4.25%, 2042 (n) | | | 1,234,000 | | | | 973,959 | |
| Development Bank of Kazakhstan, 4.125%, 2022 | | | 4,494,000 | | | | 3,932,250 | |
| Dolphin Energy Ltd., 5.5%, 2021 (n) | | | 2,363,000 | | | | 2,510,687 | |
| Ecopetrol S.A., 7.625%, 2019 | | | 1,852,000 | | | | 2,120,540 | |
| Gaz Capital S.A., 3.85%, 2020 (n) | | | 996,000 | | | | 928,770 | |
| Gaz Capital S.A., 5.999%, 2021 (n) | | | 2,212,000 | | | | 2,245,180 | |
| Gaz Capital S.A., 4.95%, 2028 (n) | | | 3,446,000 | | | | 2,911,870 | |
| Gazprom Neft, 4.375%, 2022 (n) | | | 1,107,000 | | | | 982,463 | |
| Instituto Costarricense, 6.375%, 2043 (n) | | | 1,007,000 | | | | 845,880 | |
| JSC Georgian Railway, 7.75%, 2022 (n) | | | 1,203,000 | | | | 1,269,165 | |
| KazAgro National Management Holding, 4.625%, 2023 (n) | | | 5,564,000 | | | | 4,868,500 | |
7
Portfolio of Investments (unaudited) – continued
| | | | | | | | |
| Issuer | | Shares/Par | | | Value ($) | |
| Bonds - continued | | | | | | | | |
| Emerging Market Quasi-Sovereign - continued | | | | | | | | |
| Kazakhstan Temir Zholy Co., 6.95%, 2042 (n) | | $ | 2,711,000 | | | $ | 2,585,616 | |
| KazMunayGas National Co., 4.4%, 2023 (n) | | | 5,329,000 | | | | 4,729,488 | |
| Magyar Export-Import Bank, 5.5%, 2018 (n) | | | 2,580,000 | | | | 2,566,650 | |
| Naftogaz Ukraine, 9.5%, 2014 | | | 753,000 | | | | 739,822 | |
| OJSC Russian Agricultural Bank, 5.1%, 2018 (n) | | | 566,000 | | | | 563,095 | |
| Pemex Project Funding Master Trust, 6.625%, 2035 | | | 1,446,000 | | | | 1,485,765 | |
| Pertamina PT, 4.875%, 2022 (n) | | | 2,381,000 | | | | 2,071,470 | |
| Pertamina PT, 4.3%, 2023 (n) | | | 2,705,000 | | | | 2,204,575 | |
| Petrobras Global Finance Co., 4.375%, 2023 | | | 3,650,000 | | | | 3,193,724 | |
| Petrobras International Finance Co., 5.375%, 2021 | | | 2,500,000 | | | | 2,441,208 | |
| Petroleos Mexicanos, 2.286%, 2018 | | | 611,000 | | | | 628,414 | |
| Petroleos Mexicanos, 5.5%, 2021 | | | 2,395,000 | | | | 2,536,305 | |
| Petroleos Mexicanos, 4.875%, 2024 | | | 584,000 | | | | 575,240 | |
| Petroleum Co. of Trinidad & Tobago Ltd., 6%, 2022 | | | 839,250 | | | | 868,624 | |
| Ras Laffan Liquefied Natural Gas Co. Ltd. III, 6.75%, 2019 | | | 747,000 | | | | 866,520 | |
| Rosneft, 3.149%, 2017 (n) | | | 472,000 | | | | 464,920 | |
| Rosneft, 4.199%, 2022 (n) | | | 1,997,000 | | | | 1,787,315 | |
| Sberbank of Russia, 6.125%, 2022 (n) | | | 3,590,000 | | | | 3,670,775 | |
| Sinopec Capital (2013) Ltd., 3.125%, 2023 (n) | | | 3,060,000 | | | | 2,742,935 | |
| Sinopec Capital (2013) Ltd., 4.25%, 2043 (n) | | | 2,765,000 | | | | 2,302,736 | |
| Sinopec Group Overseas Development (2012) Ltd., 3.9%, 2022 (n) | | | 1,445,000 | | | | 1,402,413 | |
| State Grid Overseas Investment (2013) Ltd., 3.125%, 2023 (n) | | | 1,852,000 | | | | 1,705,753 | |
| Turkiye Ihracat Kredi Bankasi A.S., 5.875%, 2019 (n) | | | 2,725,000 | | | | 2,711,375 | |
| Vnesheconombank, 6.025%, 2022 (n) | | | 294,000 | | | | 296,058 | |
| | | | | | | | |
| | | | | | | $ | 94,420,279 | |
| Emerging Market Sovereign - 3.9% | | | | | | | | |
| Dominican Republic, 7.5%, 2021 (n) | | $ | 1,270,000 | | | $ | 1,358,900 | |
| Dominican Republic, 5.875%, 2024 (n) | | | 1,706,000 | | | | 1,586,580 | |
| Dominican Republic, 8.625%, 2027 | | | 2,335,000 | | | | 2,591,850 | |
| Government of Ukraine, 9.25%, 2017 (n) | | | 375,000 | | | | 366,154 | |
| Republic of Colombia, 6.125%, 2041 | | | 562,000 | | | | 589,397 | |
| Republic of Croatia, 5.5%, 2023 (n) | | | 1,586,000 | | | | 1,514,630 | |
| Republic of Guatemala, 5.75%, 2022 (n) | | | 1,764,000 | | | | 1,781,640 | |
| Republic of Guatemala, 4.875%, 2028 (n) | | | 2,255,000 | | | | 2,006,950 | |
| Republic of Hungary, 6.25%, 2020 | | | 2,470,000 | | | | 2,550,769 | |
| Republic of Hungary, 6.375%, 2021 | | | 2,502,000 | | | | 2,577,060 | |
| Republic of Hungary, 5.375%, 2023 | | | 2,930,000 | | | | 2,746,875 | |
| Republic of Indonesia, 6.875%, 2018 | | | 1,100,000 | | | | 1,188,000 | |
| Republic of Indonesia, 4.875%, 2021 (n) | | | 2,623,000 | | | | 2,419,718 | |
| Republic of Indonesia, 5.375%, 2023 (n) | | | 3,600,000 | | | | 3,384,000 | |
| Republic of Latvia, 5.25%, 2017 (n) | | | 1,133,000 | | | | 1,219,448 | |
8
Portfolio of Investments (unaudited) – continued
| | | | | | | | |
| Issuer | | Shares/Par | | | Value ($) | |
| Bonds - continued | | | | | | | | |
| Emerging Market Sovereign - continued | | | | | | | | |
| Republic of Lithuania, 6.625%, 2022 (n) | | $ | 1,794,000 | | | $ | 2,047,403 | |
| Republic of Nigeria, 6.375%, 2023 (n) | | | 1,978,000 | | | | 1,995,308 | |
| Republic of Paraguay, 4.625%, 2023 (n) | | | 2,559,000 | | | | 2,328,690 | |
| Republic of Peru, 7.35%, 2025 | | | 787,000 | | | | 975,880 | |
| Republic of Philippines, 5.5%, 2026 | | | 1,293,000 | | | | 1,377,045 | |
| Republic of Philippines, 6.375%, 2034 | | | 1,396,000 | | | | 1,580,970 | |
| Republic of Romania, 6.75%, 2022 (n) | | | 2,104,000 | | | | 2,335,861 | |
| Republic of Romania, 4.375%, 2023 (n) | | | 796,000 | | | | 743,766 | |
| Republic of Serbia, 4.875%, 2020 (n) | | | 587,000 | | | | 532,820 | |
| Republic of Slovakia, 4.375%, 2022 (n) | | | 4,190,000 | | | | 4,169,050 | |
| Republic of Turkey, 5.625%, 2021 | | | 1,594,000 | | | | 1,598,384 | |
| Republic of Turkey, 6.25%, 2022 | | | 2,021,000 | | | | 2,077,083 | |
| Republic of Turkey, 7.375%, 2025 | | | 1,983,000 | | | | 2,154,034 | |
| Republic of Uruguay, 4.5%, 2024 | | | 976,000 | | | | 939,400 | |
| Republic of Uruguay, 7.625%, 2036 | | | 974,000 | | | | 1,161,495 | |
| Republic of Venezuela, 7.75%, 2019 | | | 2,212,000 | | | | 1,808,310 | |
| Republic of Venezuela, 12.75%, 2022 | | | 3,629,000 | | | | 3,592,710 | |
| Republic of Venezuela, 9.25%, 2027 | | | 4,059,000 | | | | 3,247,200 | |
| Republic of Venezuela, 7%, 2038 | | | 2,450,000 | | | | 1,592,500 | |
| Republic of Vietnam, 6.875%, 2016 | | | 497,000 | | | | 524,335 | |
| Russian Federation, 4.5%, 2022 (n) | | | 1,800,000 | | | | 1,800,000 | |
| Russian Federation, 7.5%, 2030 | | | 1,215,095 | | | | 1,401,381 | |
| Russian Federation, 5.625%, 2042 (n) | | | 1,200,000 | | | | 1,194,000 | |
| United Mexican States, 5.125%, 2020 | | | 1,672,000 | | | | 1,837,528 | |
| United Mexican States, 3.625%, 2022 | | | 3,416,000 | | | | 3,328,892 | |
| | | | | | | | |
| | | | | | | $ | 74,226,016 | |
| Energy - Integrated - 0.2% | | | | | | | | |
| LUKOIL International Finance B.V., 3.416%, 2018 (n) | | $ | 823,000 | | | $ | 808,598 | |
| LUKOIL International Finance B.V., 4.563%, 2023 (n) | | | 1,278,000 | | | | 1,153,395 | |
| Pacific Rubiales Energy Corp., 7.25%, 2021 (n) | | | 1,503,000 | | | | 1,555,605 | |
| Pacific Rubiales Energy Corp., 5.125%, 2023 (n) | | | 705,000 | | | | 623,925 | |
| | | | | | | | |
| | | | | | | $ | 4,141,523 | |
| Financial Institutions - 0.2% | | | | | | | | |
| TMK Capital S.A., 6.75%, 2020 (n) | | $ | 4,065,000 | | | $ | 3,902,400 | |
| | |
| Food & Beverages - 0.4% | | | | | | | | |
| Ajecorp B.V., 6.5%, 2022 (n) | | $ | 1,956,000 | | | $ | 1,902,210 | |
| Corporacion Lindley S.A., 6.75%, 2021 (n) | | | 630,000 | | | | 670,950 | |
| Cosan Luxembourg S.A., 5%, 2023 (n) | | | 2,579,000 | | | | 2,288,862 | |
| Grupo Bimbo S.A.B. de C.V., 4.5%, 2022 (n) | | | 1,185,000 | | | | 1,172,787 | |
| Marfrig Holding Europe B.V., 9.875%, 2017 (n) | | | 1,985,000 | | | | 1,975,075 | |
| | | | | | | | |
| | | | | | | $ | 8,009,884 | |
9
Portfolio of Investments (unaudited) – continued
| | | | | | | | |
| Issuer | | Shares/Par | | | Value ($) | |
| Bonds - continued | | | | | | | | |
| Forest & Paper Products - 0.1% | | | | | | | | |
| Fibria Overseas Finance Ltd., 7.5%, 2020 | | $ | 698,000 | | | $ | 741,625 | |
| Inversiones CMPC S.A., 4.75%, 2018 (n) | | | 525,000 | | | | 546,022 | |
| | | | | | | | |
| | | | | | | $ | 1,287,647 | |
| Furniture & Appliances - 0.1% | | | | | | | | |
| Arcelik A.S., 5%, 2023 (n) | | $ | 1,698,000 | | | $ | 1,388,115 | |
| | |
| International Market Quasi-Sovereign - 0.7% | | | | | | | | |
| Israel Electric Corp. Ltd., 6.7%, 2017 (n) | | $ | 402,000 | | | $ | 428,130 | |
| Israel Electric Corp. Ltd., 5.625%, 2018 (n) | | | 6,440,000 | | | | 6,562,360 | |
| Israel Electric Corp. Ltd., 6.875%, 2023 (n) | | | 5,888,000 | | | | 5,998,400 | |
| | | | | | | | |
| | | | | | | $ | 12,988,890 | |
| International Market Sovereign - 0.2% | | | | | | | | |
| Republic of Iceland, 4.875%, 2016 (n) | | $ | 1,933,000 | | | $ | 2,010,320 | |
| Republic of Iceland, 5.875%, 2022 (n) | | | 1,865,000 | | | | 1,890,644 | |
| | | | | | | | |
| | | | | | | $ | 3,900,964 | |
| Internet - 0.3% | | | | | | | | |
| Baidu, Inc., 3.25%, 2018 | | $ | 4,956,000 | | | $ | 4,894,288 | |
| Baidu, Inc., 3.5%, 2022 | | | 383,000 | | | | 348,904 | |
| | | | | | | | |
| | | | | | | $ | 5,243,192 | |
| Local Authorities - 0.1% | | | | | | | | |
| Nashville & Davidson County, TN, Metropolitan Government Convention Center Authority (Build America Bonds), 6.731%, 2043 | | $ | 1,115,000 | | | $ | 1,241,463 | |
| Port Authority NY & NJ (168th Series), 4.926%, 2051 | | | 395,000 | | | | 370,941 | |
| San Francisco, CA, City & County Public Utilities Commission, Water Rev. (Build America Bonds), 6%, 2040 | | | 15,000 | | | | 16,421 | |
| University of California Rev. (Build America Bonds), 5.77%, 2043 | | | 60,000 | | | | 65,424 | |
| | | | | | | | |
| | | | | | | $ | 1,694,249 | |
| Machinery & Tools - 0.0% | | | | | | | | |
| Ferreycorp S.A.A., 4.875%, 2020 (n) | | $ | 1,031,000 | | | $ | 943,365 | |
| | |
| Major Banks - 0.1% | | | | | | | | |
| DBS Bank Ltd., 3.625% to 2017, FRN to 2022 (n) | | $ | 1,801,000 | | | $ | 1,821,112 | |
| | |
| Medical & Health Technology & Services - 0.0% | | | | | | | | |
| Catholic Health Initiatives, 2.95%, 2022 | | $ | 569,000 | | | $ | 524,033 | |
| | |
| Metals & Mining - 0.2% | | | | | | | | |
| Vale Overseas Ltd., 5.625%, 2019 | | $ | 1,134,000 | | | $ | 1,211,318 | |
| Vale Overseas Ltd., 4.375%, 2022 | | | 2,046,000 | | | | 1,903,911 | |
10
Portfolio of Investments (unaudited) – continued
| | | | | | | | |
| Issuer | | Shares/Par | | | Value ($) | |
| Bonds - continued | | | | | | | | |
| Metals & Mining - continued | | | | | | | | |
| Vale Overseas Ltd., 6.875%, 2039 | | $ | 1,468,000 | | | $ | 1,419,469 | |
| | | | | | | | |
| | | | | | | $ | 4,534,698 | |
| Mortgage-Backed - 8.9% | | | | | | | | |
| Fannie Mae, 5.259%, 2013 | | $ | 10,664 | | | $ | 10,692 | |
| Fannie Mae, 4.607%, 2014 | | | 109,618 | | | | 109,695 | |
| Fannie Mae, 4.629%, 2014 | | | 48,900 | | | | 49,359 | |
| Fannie Mae, 4.854%, 2014 | | | 33,610 | | | | 33,750 | |
| Fannie Mae, 5.1%, 2014 - 2019 | | | 326,321 | | | | 344,745 | |
| Fannie Mae, 4.56%, 2015 | | | 68,818 | | | | 72,116 | |
| Fannie Mae, 4.6%, 2015 - 2019 | | | 153,554 | | | | 167,125 | |
| Fannie Mae, 4.7%, 2015 | | | 79,905 | | | | 84,413 | |
| Fannie Mae, 4.78%, 2015 | | | 77,106 | | | | 81,156 | |
| Fannie Mae, 4.81%, 2015 | | | 173,923 | | | | 183,116 | |
| Fannie Mae, 4.815%, 2015 | | | 104,898 | | | | 109,853 | |
| Fannie Mae, 4.832%, 2015 | | | 131,369 | | | | 133,988 | |
| Fannie Mae, 4.85%, 2015 | | | 167,910 | | | | 174,350 | |
| Fannie Mae, 4.856%, 2015 | | | 60,797 | | | | 63,929 | |
| Fannie Mae, 4.86%, 2015 | | | 146,279 | | | | 151,431 | |
| Fannie Mae, 4.908%, 2015 | | | 190,462 | | | | 199,006 | |
| Fannie Mae, 5.034%, 2015 | | | 121,357 | | | | 128,581 | |
| Fannie Mae, 5.275%, 2015 | | | 120,063 | | | | 126,586 | |
| Fannie Mae, 5.463%, 2015 | | | 448,710 | | | | 481,551 | |
| Fannie Mae, 5.5%, 2015 - 2040 | | | 7,677,502 | | | | 8,350,249 | |
| Fannie Mae, 5.09%, 2016 | | | 62,151 | | | | 67,108 | |
| Fannie Mae, 5.134%, 2016 | | | 232,201 | | | | 250,037 | |
| Fannie Mae, 5.273%, 2016 | | | 305,825 | | | | 331,104 | |
| Fannie Mae, 5.395%, 2016 | | | 102,807 | | | | 111,796 | |
| Fannie Mae, 5.424%, 2016 | | | 113,919 | | | | 123,770 | |
| Fannie Mae, 5.45%, 2016 | | | 110,000 | | | | 122,389 | |
| Fannie Mae, 5.724%, 2016 | | | 223,495 | | | | 246,759 | |
| Fannie Mae, 5.845%, 2016 | | | 28,810 | | | | 30,546 | |
| Fannie Mae, 5.93%, 2016 | | | 107,876 | | | | 117,270 | |
| Fannie Mae, 1.114%, 2017 | | | 1,200,000 | | | | 1,179,866 | |
| Fannie Mae, 1.9%, 2017 | | | 195,498 | | | | 196,941 | |
| Fannie Mae, 2.71%, 2017 | | | 56,083 | | | | 58,128 | |
| Fannie Mae, 3.308%, 2017 | | | 479,589 | | | | 506,884 | |
| Fannie Mae, 5.05%, 2017 - 2019 | | | 118,830 | | | | 128,982 | |
| Fannie Mae, 5.478%, 2017 | | | 194,701 | | | | 219,939 | |
| Fannie Mae, 5.508%, 2017 | | | 61,863 | | | | 67,549 | |
| Fannie Mae, 6%, 2017 - 2038 | | | 1,321,619 | | | | 1,446,081 | |
| Fannie Mae, 6.5%, 2017 - 2037 | | | 358,255 | | | | 398,363 | |
| Fannie Mae, 2.578%, 2018 | | | 1,415,000 | | | | 1,443,955 | |
| Fannie Mae, 3.8%, 2018 | | | 88,829 | | | | 94,394 | |
11
Portfolio of Investments (unaudited) – continued
| | | | | | | | |
| Issuer | | Shares/Par | | | Value ($) | |
| Bonds - continued | | | | | | | | |
| Mortgage-Backed - continued | | | | | | | | |
| Fannie Mae, 3.849%, 2018 | | $ | 292,131 | | | $ | 314,020 | |
| Fannie Mae, 3.91%, 2018 | | | 116,022 | | | | 124,746 | |
| Fannie Mae, 3.99%, 2018 | | | 150,000 | | | | 161,792 | |
| Fannie Mae, 4%, 2018 - 2041 | | | 4,205,982 | | | | 4,365,797 | |
| Fannie Mae, 4.19%, 2018 | | | 106,732 | | | | 115,934 | |
| Fannie Mae, 5.16%, 2018 | | | 210,872 | | | | 228,353 | |
| Fannie Mae, 5.34%, 2018 | | | 370,175 | | | | 418,344 | |
| Fannie Mae, 4.45%, 2019 | | | 89,499 | | | | 97,402 | |
| Fannie Mae, 4.5%, 2019 - 2041 | | | 1,354,854 | | | | 1,436,859 | |
| Fannie Mae, 4.67%, 2019 | | | 28,000 | | | | 30,749 | |
| Fannie Mae, 4.83%, 2019 | | | 71,115 | | | | 78,574 | |
| Fannie Mae, 4.864%, 2019 | | | 108,419 | | | | 120,202 | |
| Fannie Mae, 5%, 2019 - 2041 | | | 5,774,891 | | | | 6,225,230 | |
| Fannie Mae, 5.08%, 2019 | | | 23,586 | | | | 25,679 | |
| Fannie Mae, 5.51%, 2019 | | | 113,861 | | | | 124,935 | |
| Fannie Mae, 3.87%, 2020 | | | 69,778 | | | | 73,575 | |
| Fannie Mae, 4.14%, 2020 | | | 42,230 | | | | 45,085 | |
| Fannie Mae, 5.19%, 2020 | | | 106,227 | | | | 115,716 | |
| Fannie Mae, 4.5%, 2025 | | | 68,449 | | | | 72,573 | |
| Fannie Mae, 3%, 2027 | | | 1,347,371 | | | | 1,380,373 | |
| Fannie Mae, 3.5%, 2042 | | | 429,783 | | | | 430,285 | |
| Fannie Mae, TBA, 3%, 2028 | | | 7,207,000 | | | | 7,337,626 | |
| Fannie Mae, TBA, 3.5%, 2043 | | | 7,328,000 | | | | 7,325,710 | |
| Fannie Mae, TBA, 4%, 2043 | | | 9,971,000 | | | | 10,232,739 | |
| Fannie Mae, TBA, 4.5%, 2043 | | | 23,079,000 | | | | 24,250,349 | |
| Fannie Mae, TBA, 5%, 2043 | | | 4,000,000 | | | | 4,280,000 | |
| Freddie Mac, 1.655%, 2016 | | | 1,277,929 | | | | 1,289,124 | |
| Freddie Mac, 1.426%, 2017 | | | 1,656,000 | | | | 1,640,031 | |
| Freddie Mac, 3.882%, 2017 | | | 555,000 | | | | 595,729 | |
| Freddie Mac, 6%, 2017 - 2038 | | | 687,327 | | | | 754,920 | |
| Freddie Mac, 2.303%, 2018 | | | 1,515,000 | | | | 1,519,613 | |
| Freddie Mac, 2.323%, 2018 | | | 1,765,000 | | | | 1,769,748 | |
| Freddie Mac, 2.412%, 2018 | | | 2,578,000 | | | | 2,604,654 | |
| Freddie Mac, 2.699%, 2018 | | | 1,300,000 | | | | 1,333,151 | |
| Freddie Mac, 3.154%, 2018 | | | 514,000 | | | | 537,547 | |
| Freddie Mac, 5%, 2018 - 2040 | | | 945,005 | | | | 1,014,053 | |
| Freddie Mac, 1.883%, 2019 | | | 1,000,000 | | | | 973,081 | |
| Freddie Mac, 2.086%, 2019 | | | 1,175,000 | | | | 1,158,068 | |
| Freddie Mac, 2.13%, 2019 | | | 1,750,000 | | | | 1,731,503 | |
| Freddie Mac, 4.186%, 2019 | | | 1,346,000 | | | | 1,455,262 | |
| Freddie Mac, 5.085%, 2019 | | | 1,410,000 | | | | 1,591,138 | |
| Freddie Mac, 2.757%, 2020 | | | 266,723 | | | | 275,666 | |
| Freddie Mac, 3.32%, 2020 | | | 243,856 | | | | 256,224 | |
12
Portfolio of Investments (unaudited) – continued
| | | | | | | | |
| Issuer | | Shares/Par | | | Value ($) | |
| Bonds - continued | | | | | | | | |
| Mortgage-Backed - continued | | | | | | | | |
| Freddie Mac, 4.224%, 2020 | | $ | 99,963 | | | $ | 107,328 | |
| Freddie Mac, 4.251%, 2020 | | | 230,000 | | | | 249,058 | |
| Freddie Mac, 4.5%, 2024 - 2041 | | | 2,624,087 | | | | 2,761,519 | |
| Freddie Mac, 5.5%, 2024 - 2041 | | | 3,263,960 | | | | 3,528,018 | |
| Freddie Mac, 4%, 2025 | | | 178,294 | | | | 187,739 | |
| Freddie Mac, 2.5%, 2028 | | | 9,242,645 | | | | 9,181,109 | |
| Freddie Mac, 6.5%, 2037 - 2038 | | | 96,407 | | | | 105,948 | |
| Freddie Mac, 3.5%, 2041 - 2043 | | | 12,458,561 | | | | 12,431,640 | |
| Freddie Mac, 3%, 2043 | | | 5,214,268 | | | | 4,994,893 | |
| Freddie Mac, 3.25%, 2023 | | | 1,700,000 | | | | 1,668,208 | |
| Freddie Mac, 3.32%, 2023 | | | 677,000 | | | | 666,029 | |
| Freddie Mac, 3.3%, 2046 | | | 1,045,940 | | | | 1,028,575 | |
| Ginnie Mae, 4.5%, 2033 - 2041 | | | 3,499,163 | | | | 3,747,868 | |
| Ginnie Mae, 5.5%, 2033 - 2042 | | | 721,327 | | | | 786,781 | |
| Ginnie Mae, 4%, 2039 - 2041 | | | 769,287 | | | | 805,545 | |
| Ginnie Mae, 3.5%, 2041 - 2043 | | | 14,753,260 | | | | 14,930,028 | |
| Ginnie Mae, 3%, 2043 | | | 1,982,558 | | | | 1,925,752 | |
| Ginnie Mae, 5.612%, 2058 | | | 186,499 | | | | 195,711 | |
| Ginnie Mae, 6.357%, 2058 | | | 147,028 | | | | 155,565 | |
| Ginnie Mae, TBA, 4.5%, 2043 | | | 1,750,000 | | | | 1,863,750 | |
| | | | | | | | |
| | | | | | | $ | 169,430,775 | |
| Municipals - 0.0% | | | | | | | | |
| South Carolina Public Service Authority Rev., “A”, 5.125%, 2043 | | $ | 185,000 | | | $ | 182,604 | |
| South Carolina Public Service Authority Rev., “B”, 5.125%, 2043 | | | 450,000 | | | | 444,173 | |
| | | | | | | | |
| | | | | | | $ | 626,777 | |
| Network & Telecom - 0.1% | | | | | | | | |
| Telefonica Celular del Paraguay S.A., 6.75%, 2022 (n) | | $ | 1,333,000 | | | $ | 1,326,335 | |
| | |
| Oil Services - 0.4% | | | | | | | | |
| Afren PLC, 11.5%, 2016 (n) | | $ | 200,000 | | | $ | 228,500 | |
| Odebrecht Offshore Drilling Finance Ltd., 6.75%, 2022 (n) | | | 4,599,000 | | | | 4,484,025 | |
| Qgog Constellation S.A., 6.25%, 2019 (n) | | | 2,447,000 | | | | 2,226,770 | |
| | | | | | | | |
| | | | | | | $ | 6,939,295 | |
| Other Banks & Diversified Financials - 1.0% | | | | | | | | |
| Alfa Bank, 7.5%, 2019 (n) | | $ | 1,274,000 | | | $ | 1,337,700 | |
| Banco de Credito del Peru, 6.125% to 2022, FRN to 2027 (n) | | | 1,874,000 | | | | 1,841,205 | |
| Banco de Credito e Inversiones, 4%, 2023 (n) | | | 326,000 | | | | 295,544 | |
| Banco GNB Sudameris S.A., 3.875%, 2018 (n) | | | 1,797,000 | | | | 1,644,255 | |
| Banco Santander S.A., 4.125%, 2022 (n) | | | 1,607,000 | | | | 1,458,352 | |
| Bancolombia S.A., 5.95%, 2021 | | | 1,374,000 | | | | 1,392,893 | |
13
Portfolio of Investments (unaudited) – continued
| | | | | | | | |
| Issuer | | Shares/Par | | | Value ($) | |
| Bonds - continued | | | | | | | | |
| Other Banks & Diversified Financials - continued | | | | | | | | |
| Bancolombia S.A., 5.125%, 2022 | | $ | 407,000 | | | $ | 362,230 | |
| BBVA Banco Continental S.A., 5%, 2022 (n) | | | 1,265,000 | | | | 1,189,100 | |
| BBVA Bancomer S.A. de C.V., 6.5%, 2021 (n) | | | 1,770,000 | | | | 1,792,125 | |
| BBVA Bancomer S.A. de C.V., 6.75%, 2022 (n) | | | 1,788,000 | | | | 1,829,124 | |
| BBVA Continental, 5.75%, 2017 (n) | | | 500,000 | | | | 527,500 | |
| CorpBanca, 3.125%, 2018 | | | 629,000 | | | | 557,200 | |
| Grupo Aval Ltd., 4.75%, 2022 (n) | | | 2,092,000 | | | | 1,835,730 | |
| Industrial Senior Trust, 5.5%, 2022 (n) | | | 2,082,000 | | | | 1,873,800 | |
| PKO Finance AB, 4.63%, 2022 (n) | | | 590,000 | | | | 554,659 | |
| | | | | | | | |
| | | | | | | $ | 18,491,417 | |
| Retailers - 0.1% | | | | | | | | |
| Cencosud S.A., 4.875%, 2023 (n) | | $ | 1,999,000 | | | $ | 1,832,781 | |
| | |
| Specialty Chemicals - 0.1% | | | | | | | | |
| SIBUR Securities Ltd., 3.914%, 2018 (n) | | $ | 2,690,000 | | | $ | 2,535,325 | |
| | |
| Supranational - 0.1% | | | | | | | | |
| Eurasian Development Bank, 4.767%, 2022 (n) | | $ | 1,352,000 | | | $ | 1,257,630 | |
| | |
| Telecommunications - Wireless - 0.4% | | | | | | | | |
| America Movil S.A.B. de C.V., 5%, 2020 | | $ | 877,000 | | | $ | 930,368 | |
| Bharti Airtel International Co., 5.125%, 2023 (n) | | | 730,000 | | | | 611,375 | |
| Digicel Group Ltd., 10.5%, 2018 (n) | | | 385,000 | | | | 414,837 | |
| Digicel Group Ltd., 8.25%, 2020 (n) | | | 396,000 | | | | 419,760 | |
| Digicel Group Ltd., 6%, 2021 (n) | | | 2,253,000 | | | | 2,174,145 | |
| Millicom International Cellular S.A., 4.75%, 2020 (n) | | | 600,000 | | | | 567,750 | |
| MTS International Funding Ltd., 5%, 2023 (n) | | | 748,000 | | | | 665,720 | |
| VimpelCom Ltd., 5.95%, 2023 (n) | | | 1,709,000 | | | | 1,528,478 | |
| | | | | | | | |
| | | | | | | $ | 7,312,433 | |
| Transportation - 0.2% | | | | | | | | |
| Far Eastern Shipping Co., 8%, 2018 (n) | | $ | 2,253,000 | | | $ | 2,010,802 | |
| Far Eastern Shipping Co., 8.75%, 2020 (n) | | | 1,700,000 | | | | 1,521,500 | |
| | | | | | | | |
| | | | | | | $ | 3,532,302 | |
| Transportation - Services - 0.0% | | | | | | | | |
| Navios South American Logistics, Inc., 9.25%, 2019 | | $ | 149,000 | | | $ | 160,920 | |
| | |
| U.S. Government Agencies and Equivalents - 0.7% | | | | | | | | |
| Aid-Egypt, 4.45%, 2015 | | $ | 170,000 | | | $ | 183,267 | |
| Fannie Mae, 1.125%, 2017 | | | 5,500,000 | | | | 5,481,707 | |
| Fannie Mae, 0.875%, 2018 | | | 4,000,000 | | | | 3,842,448 | |
| Private Export Funding Corp., 1.875%, 2018 | | | 850,000 | | | | 846,239 | |
14
Portfolio of Investments (unaudited) – continued
| | | | | | | | |
| Issuer | | Shares/Par | | | Value ($) | |
| Bonds - continued | | | | | | | | |
| U.S. Government Agencies and Equivalents - continued | | | | | |
| Small Business Administration, 6.34%, 2021 | | $ | 104,302 | | | $ | 114,059 | |
| Small Business Administration, 6.07%, 2022 | | | 95,802 | | | | 104,779 | |
| Small Business Administration, 5.16%, 2028 | | | 183,003 | | | | 200,743 | |
| Small Business Administration, 2.21%, 2033 | | | 417,240 | | | | 390,815 | |
| Small Business Administration, 2.22%, 2033 | | | 791,000 | | | | 744,304 | |
| Small Business Administration, 3.15%, 2033 | | | 851,000 | | | | 847,227 | |
| Small Business Administration, 3.16%, 2033 | | | 1,000,000 | | | | 997,050 | |
| | | | | | | | |
| | | | | | | $ | 13,752,638 | |
| U.S. Treasury Obligations - 7.6% | | | | | | | | |
| U.S. Treasury Bonds, 9.25%, 2016 | | $ | 47,000 | | | $ | 56,914 | |
| U.S. Treasury Bonds, 6.375%, 2027 | | | 106,000 | | | | 144,756 | |
| U.S. Treasury Bonds, 5.25%, 2029 | | | 86,000 | | | | 106,627 | |
| U.S. Treasury Bonds, 4.5%, 2036 | | | 70,000 | | | | 80,828 | |
| U.S. Treasury Bonds, 4.375%, 2038 | | | 638,000 | | | | 722,834 | |
| U.S. Treasury Bonds, 4.5%, 2039 | | | 13,646,000 | | | | 15,773,930 | |
| U.S. Treasury Bonds, 3.125%, 2043 | | | 776,700 | | | | 697,695 | |
| U.S. Treasury Notes, 3.125%, 2013 | | | 305,000 | | | | 305,691 | |
| U.S. Treasury Notes, 4%, 2014 | | | 18,000 | | | | 18,316 | |
| U.S. Treasury Notes, 1.875%, 2014 | | | 9,250,000 | | | | 9,331,659 | |
| U.S. Treasury Notes, 1.875%, 2014 | | | 417,000 | | | | 421,838 | |
| U.S. Treasury Notes, 4%, 2015 | | | 1,397,000 | | | | 1,472,198 | |
| U.S. Treasury Notes, 2.125%, 2015 | | | 52,319,000 | | | | 53,937,645 | |
| U.S. Treasury Notes, 0.875%, 2016 | | | 29,464,000 | | | | 29,397,235 | |
| U.S. Treasury Notes, 2.625%, 2018 | | | 1,752,000 | | | | 1,841,927 | |
| U.S. Treasury Notes, 3.125%, 2019 | | | 454,000 | | | | 486,312 | |
| U.S. Treasury Notes, 3.5%, 2020 | | | 1,584,000 | | | | 1,725,446 | |
| U.S. Treasury Notes, 2.625%, 2020 | | | 2,260,000 | | | | 2,326,564 | |
| U.S. Treasury Notes, 3.125%, 2021 | | | 17,642,000 | | | | 18,602,660 | |
| U.S. Treasury Notes, 1.75%, 2022 | | | 6,349,000 | | | | 5,928,379 | |
| | | | | | | | |
| | | | | | | $ | 143,379,454 | |
| Utilities - Electric Power - 0.2% | | | | | | | | |
| E-CL S.A., 5.625%, 2021 | | $ | 2,177,000 | | | $ | 2,232,953 | |
| Empresa de Energia de Bogota S.A., 6.125%, 2021 (n) | | | 200,000 | | | | 203,000 | |
| Transelec S.A., 4.625%, 2023 (n) | | | 1,507,000 | | | | 1,446,301 | |
| | | | | | | | |
| | | | | | | $ | 3,882,254 | |
| Utilities - Gas - 0.1% | | | | | | | | |
| Transport de Gas Peru, 4.25%, 2028 (n) | | $ | 3,039,000 | | | $ | 2,643,930 | |
| Total Bonds (Identified Cost, $649,477,652) | | | | | | $ | 627,108,589 | |
15
Portfolio of Investments (unaudited) – continued
| | | | | | | | |
| Common Stocks - 38.3% | | | | | | | | |
| Issuer | | Shares/Par | | | Value ($) | |
| Aerospace - 0.5% | | | | | | | | |
| L-3 Communications Holdings, Inc. | | | 22,410 | | | $ | 2,024,295 | |
| Lockheed Martin Corp. | | | 37,720 | | | | 4,617,682 | |
| Northrop Grumman Corp. | | | 25,500 | | | | 2,352,885 | |
| | | | | | | | |
| | | | | | | $ | 8,994,862 | |
| Automotive - 0.5% | | | | | | | | |
| Delphi Automotive PLC | | | 85,001 | | | $ | 4,676,755 | |
| General Motors Co. (a) | | | 91,720 | | | | 3,125,818 | |
| Johnson Controls, Inc. | | | 34,344 | | | | 1,391,962 | |
| TRW Automotive Holdings Corp. (a) | | | 14,600 | | | | 1,008,422 | |
| | | | | | | | |
| | | | | | | $ | 10,202,957 | |
| Brokerage & Asset Managers - 0.0% | | | | | | | | |
| Prospect Capital Corp. | | | 58,550 | | | $ | 648,149 | |
| | |
| Cable TV - 0.4% | | | | | | | | |
| Comcast Corp., “A” | | | 44,637 | | | $ | 1,878,771 | |
| Time Warner Cable, Inc. | | | 56,800 | | | | 6,097,480 | |
| | | | | | | | |
| | | | | | | $ | 7,976,251 | |
| Chemicals - 0.4% | | | | | | | | |
| CF Industries Holdings, Inc. | | | 16,743 | | | $ | 3,186,863 | |
| LyondellBasell Industries N.V., “A” | | | 65,030 | | | | 4,561,854 | |
| | | | | | | | |
| | | | | | | $ | 7,748,717 | |
| Computer Software - 0.3% | | | | | | | | |
| CA, Inc. | | | 77,830 | | | $ | 2,276,527 | |
| Symantec Corp. | | | 153,130 | | | | 3,921,659 | |
| | | | | | | | |
| | | | | | | $ | 6,198,186 | |
| Computer Software - Systems - 0.7% | | | | | | | | |
| Hewlett-Packard Co. | | | 301,807 | | | $ | 6,742,368 | |
| Lexmark International, Inc., “A” | | | 43,300 | | | | 1,479,128 | |
| Western Digital Corp. | | | 66,020 | | | | 4,093,240 | |
| | | | | | | | |
| | | | | | | $ | 12,314,736 | |
| Construction - 0.1% | | | | | | | | |
| Stanley Black & Decker, Inc. | | | 22,117 | | | $ | 1,885,695 | |
| | |
| Consumer Products - 0.3% | | | | | | | | |
| Nu Skin Enterprises, Inc., “A” | | | 47,374 | | | $ | 3,965,678 | |
| Procter & Gamble Co. | | | 13,156 | | | | 1,024,721 | |
| | | | | | | | |
| | | | | | | $ | 4,990,399 | |
16
Portfolio of Investments (unaudited) – continued
| | | | | | | | |
| Issuer | | Shares/Par | | | Value ($) | |
| Common Stocks - continued | | | | | | | | |
| Containers - 0.2% | | | | | | | | |
| Packaging Corp. of America | | | 83,730 | | | $ | 4,441,039 | |
| | |
| Electrical Equipment - 0.1% | | | | | | | | |
| General Electric Co. | | | 102,708 | | | $ | 2,376,663 | |
| | |
| Electronics - 0.4% | | | | | | | | |
| Intel Corp. | | | 123,761 | | | $ | 2,720,267 | |
| Microchip Technology, Inc. | | | 104,985 | | | | 4,074,468 | |
| | | | | | | | |
| | | | | | | $ | 6,794,735 | |
| Energy - Independent - 0.9% | | | | | | | | |
| HollyFrontier Corp. | | | 58,256 | | | $ | 2,591,227 | |
| Marathon Oil Corp. | | | 37,170 | | | | 1,279,763 | |
| Marathon Petroleum Corp. | | | 61,751 | | | | 4,477,565 | |
| Occidental Petroleum Corp. | | | 66,736 | | | | 5,886,783 | |
| Valero Energy Corp. | | | 75,493 | | | | 2,682,266 | |
| | | | | | | | |
| | | | | | | $ | 16,917,604 | |
| Energy - Integrated - 1.9% | | | | | | | | |
| Chevron Corp. | | | 126,941 | | | $ | 15,287,505 | |
| Exxon Mobil Corp. | | | 242,855 | | | | 21,167,242 | |
| | | | | | | | |
| | | | | | | $ | 36,454,747 | |
| Entertainment - 0.1% | | | | | | | | |
| Regal Entertainment Group, “A” (l) | | | 149,799 | | | $ | 2,679,904 | |
| | |
| Food & Beverages - 0.1% | | | | | | | | |
| Coca-Cola Enterprises, Inc. | | | 18,197 | | | $ | 680,568 | |
| General Mills, Inc. | | | 34,827 | | | | 1,717,668 | |
| | | | | | | | |
| | | | | | | $ | 2,398,236 | |
| Food & Drug Stores - 0.4% | | | | | | | | |
| CVS Caremark Corp. | | | 31,642 | | | $ | 1,836,818 | |
| Kroger Co. | | | 140,460 | | | | 5,140,836 | |
| Safeway, Inc. | | | 55,070 | | | | 1,426,313 | |
| | | | | | | | |
| | | | | | | $ | 8,403,967 | |
| Forest & Paper Products - 0.1% | | | | | | | | |
| International Paper Co. | | | 55,572 | | | $ | 2,623,554 | |
| | |
| Furniture & Appliances - 0.2% | | | | | | | | |
| Whirlpool Corp. | | | 24,926 | | | $ | 3,206,730 | |
| | |
| General Merchandise - 0.3% | | | | | | | | |
| Macy’s, Inc. | | | 115,698 | | | $ | 5,140,462 | |
17
Portfolio of Investments (unaudited) – continued
| | | | | | | | |
| Issuer | | Shares/Par | | | Value ($) | |
| Common Stocks - continued | | | | | | | | |
| Health Maintenance Organizations - 0.5% | | | | | | | | |
| Aetna, Inc. | | | 56,679 | | | $ | 3,592,882 | |
| WellPoint, Inc. | | | 58,280 | | | | 4,961,959 | |
| | | | | | | | |
| | | | | | | $ | 8,554,841 | |
| Insurance - 1.9% | | | | | | | | |
| Aflac, Inc. | | | 22,159 | | | $ | 1,280,569 | |
| American International Group, Inc. | | | 70,884 | | | | 3,293,271 | |
| Everest Re Group Ltd. | | | 43,668 | | | | 5,980,333 | |
| Hartford Financial Services Group, Inc. | | | 25,978 | | | | 768,949 | |
| MetLife, Inc. | | | 162,104 | | | | 7,487,584 | |
| Prudential Financial, Inc. | | | 81,945 | | | | 6,136,042 | |
| Travelers Cos., Inc. | | | 75,061 | | | | 5,997,374 | |
| Validus Holdings Ltd. | | | 166,605 | | | | 5,766,199 | |
| | | | | | | | |
| | | | | | | $ | 36,710,321 | |
| Internet - 0.4% | | | | | | | | |
| Yahoo!, Inc. (a) | | | 252,650 | | | $ | 6,851,868 | |
| | |
| Machinery & Tools - 0.4% | | | | | | | | |
| Eaton Corp. PLC | | | 120,738 | | | $ | 7,645,130 | |
| Joy Global, Inc. | | | 17,060 | | | | 837,987 | |
| | | | | | | | |
| | | | | | | $ | 8,483,117 | |
| Major Banks - 2.2% | | | | | | | | |
| Goldman Sachs Group, Inc. | | | 22,333 | | | $ | 3,397,519 | |
| JPMorgan Chase & Co. | | | 277,302 | | | | 14,012,070 | |
| KeyCorp | | | 353,382 | | | | 4,123,968 | |
| PNC Financial Services Group, Inc. | | | 100,074 | | | | 7,232,348 | |
| Wells Fargo & Co. | | | 332,010 | | | | 13,638,971 | |
| | | | | | | | |
| | | | | | | $ | 42,404,876 | |
| Medical Equipment - 0.3% | | | | | | | | |
| Medtronic, Inc. | | | 25,578 | | | $ | 1,323,662 | |
| St. Jude Medical, Inc. | | | 35,050 | | | | 1,766,871 | |
| Thermo Fisher Scientific, Inc. | | | 26,350 | | | | 2,340,671 | |
| | | | | | | | |
| | | | | | | $ | 5,431,204 | |
| Natural Gas - Distribution - 0.1% | | | | | | | | |
| NiSource, Inc. | | | 47,712 | | | $ | 1,396,053 | |
| | |
| Other Banks & Diversified Financials - 1.4% | | | | | | | | |
| Citigroup, Inc. | | | 215,283 | | | $ | 10,404,627 | |
| Discover Financial Services | | | 148,290 | | | | 7,006,702 | |
| New York Community Bancorp, Inc. | | | 274,610 | | | | 4,023,037 | |
18
Portfolio of Investments (unaudited) – continued
| | | | | | | | |
| Issuer | | Shares/Par | | | Value ($) | |
| Common Stocks - continued | | | | | | | | |
| Other Banks & Diversified Financials - continued | | | | | | | | |
| SLM Corp. | | | 60,170 | | | $ | 1,443,478 | |
| Western Union Co. | | | 180,620 | | | | 3,166,269 | |
| | | | | | | | |
| | | | | | | $ | 26,044,113 | |
| Pharmaceuticals - 2.0% | | | | | | | | |
| AbbVie, Inc. | | | 48,999 | | | $ | 2,087,847 | |
| Bristol-Myers Squibb Co. | | | 91,790 | | | | 3,826,725 | |
| Eli Lilly & Co. | | | 69,830 | | | | 3,589,262 | |
| Johnson & Johnson | | | 150,459 | | | | 13,001,162 | |
| Merck & Co., Inc. | | | 29,807 | | | | 1,409,573 | |
| Pfizer, Inc. | | | 497,500 | | | | 14,034,475 | |
| | | | | | | | |
| | | | | | | $ | 37,949,044 | |
| Printing & Publishing - 0.1% | | | | | | | | |
| American Media Operations, Inc. (a) | | | 6,684 | | | $ | 34,824 | |
| Gannett Co. Inc. | | | 44,830 | | | | 1,079,955 | |
| | | | | | | | |
| | | | | | | $ | 1,114,779 | |
| Railroad & Shipping - 0.1% | | | | | | | | |
| Kansas City Southern Co. | | | 13,385 | | | $ | 1,411,047 | |
| | |
| Real Estate - 18.3% | | | | | | | | |
| Alexandria Real Estate Equities, Inc., REIT | | | 175,513 | | | $ | 10,823,887 | |
| Atrium European Real Estate Ltd. | | | 531,129 | | | | 3,074,614 | |
| AvalonBay Communities, Inc., REIT | | | 137,565 | | | | 17,044,303 | |
| Big Yellow Group PLC, REIT | | | 542,950 | | | | 3,407,709 | |
| Boston Properties, Inc., REIT | | | 142,915 | | | | 14,648,787 | |
| Corporate Office Properties Trust, REIT | | | 331,350 | | | | 7,548,153 | |
| DDR Corp., REIT | | | 559,530 | | | | 8,683,906 | |
| Digital Realty Trust, Inc., REIT | | | 185,918 | | | | 10,337,041 | |
| EastGroup Properties, Inc., REIT | | | 172,380 | | | | 9,687,756 | |
| Equity Lifestyle Properties, Inc., REIT | | | 465,122 | | | | 16,162,989 | |
| Equity Residential, REIT | | | 162,380 | | | | 8,425,898 | |
| Federal Realty Investment Trust, REIT | | | 104,187 | | | | 10,138,437 | |
| Home Properties, Inc., REIT | | | 214,710 | | | | 12,388,767 | |
| Host Hotels & Resorts, Inc., REIT | | | 1,132,798 | | | | 19,291,550 | |
| Medical Properties Trust, Inc., REIT | | | 772,347 | | | | 8,920,608 | |
| Mid-America Apartment Communities, Inc., REIT | | | 255,507 | | | | 15,754,562 | |
| National Health Investors, Inc., REIT | | | 191,810 | | | | 10,530,369 | |
| Plum Creek Timber Co. Inc., REIT | | | 370,806 | | | | 16,430,414 | |
| Public Storage, Inc., REIT | | | 187,302 | | | | 28,595,396 | |
| Retail Opportunity Investment Corp., REIT | | | 669,850 | | | | 8,667,859 | |
| Simon Property Group, Inc., REIT | | | 280,581 | | | | 40,861,011 | |
| Tanger Factory Outlet Centers, Inc., REIT | | | 399,668 | | | | 12,329,758 | |
19
Portfolio of Investments (unaudited) – continued
| | | | | | | | |
| Issuer | | Shares/Par | | | Value ($) | |
| Common Stocks - continued | | | | | | | | |
| Real Estate - continued | | | | | | | | |
| Ventas, Inc., REIT | | | 255,422 | | | $ | 15,902,574 | |
| Vornado Realty Trust, REIT | | | 275,993 | | | | 22,438,231 | |
| Weyerhaeuser Co., REIT | | | 553,116 | | | | 15,144,316 | |
| | | | | | | | |
| | | | | | | $ | 347,238,895 | |
| Telecommunications - Wireless - 0.4% | | | | | | | | |
| American Tower Corp., REIT | | | 99,390 | | | $ | 6,906,611 | |
| | |
| Telephone Services - 0.7% | | | | | | | | |
| AT&T, Inc. | | | 82,143 | | | $ | 2,778,898 | |
| CenturyLink, Inc. | | | 113,380 | | | | 3,755,146 | |
| Frontier Communications Corp. (l) | | | 769,920 | | | | 3,333,754 | |
| Windstream Corp. (a) | | | 368,850 | | | | 2,976,620 | |
| | | | | | | | |
| | | | | | | $ | 12,844,418 | |
| Tobacco - 0.3% | | | | | | | | |
| Altria Group, Inc. | | | 20,049 | | | $ | 679,260 | |
| Lorillard, Inc. | | | 122,564 | | | | 5,184,457 | |
| | | | | | | | |
| | | | | | | $ | 5,863,717 | |
| Utilities - Electric Power - 1.3% | | | | | | | | |
| AES Corp. | | | 108,248 | | | $ | 1,375,832 | |
| Alliant Energy Corp. | | | 73,856 | | | | 3,663,996 | |
| American Electric Power Co., Inc. | | | 123,658 | | | | 5,292,562 | |
| Entergy Corp. | | | 40,640 | | | | 2,569,667 | |
| FirstEnergy Corp. | | | 21,090 | | | | 790,242 | |
| PG&E Corp. | | | 144,701 | | | | 5,984,833 | |
| PPL Corp. | | | 151,027 | | | | 4,636,529 | |
| | | | | | | | |
| | | | | | | $ | 24,313,661 | |
| Total Common Stocks (Identified Cost, $670,724,435) | | | | | | $ | 725,916,158 | |
| | |
| Issuer/Expiration Date/Strike Price | | Number
of
Contracts | | | | |
| Put Options Purchased - 0.1% | | | | | | | | |
| iShares Dow Jones U.S. Real Estate - December 2013 @ $60 | | | 6,000 | | | $ | 1,236,000 | |
| iShares Dow Jones U.S. Real Estate - January 2014 @ $59 | | | 5,000 | | | | 1,165,000 | |
| iShares Dow Jones U.S. Real Estate - September 2013 @ $60 | | | 2,200 | | | | 105,600 | |
Total Put Options Purchased
(Premiums Paid, $1,785,400) | | | $ | 2,506,600 | |
20
Portfolio of Investments (unaudited) – continued
| | | | | | | | |
| Underlying Affiliated Funds - 25.7% | | | | | | | | |
| Issuer | | Shares/Par | | | Value ($) | |
MFS High Yield Pooled Portfolio
(Identified Cost, $487,293,652) (v) | | | 50,279,554 | | | $ | 488,214,471 | |
| | |
| Money Market Funds - 5.5% | | | | | | | | |
MFS Institutional Money Market Portfolio, 0.09%,
at Cost and Net Asset Value (v) | | | 104,274,645 | | | $ | 104,274,645 | |
| | |
| Collateral for Securities Loaned - 0.3% | | | | | | | | |
| Goldman Sachs repurchase Agreement, 0.05%, dated 8/30/13, due 9/03/13, total to be received $772,318 (secured by U.S. Treasury and Federal Agency obligations valued at $787,761 in an individually traded account) | | | 772,314 | | | $ | 772,314 | |
| Morgan Stanley Repurchase Agreement, 0.05%, dated 8/30/13, due 9/03/13, total to be received $4,000,022 (secured by U.S. Treasury and Federal Agency obligations valued at $4,080,040 in an individually traded account) | | | 4,000,000 | | | | 4,000,000 | |
| Total Collateral for Securities Loaned, at Identified Cost and Value | | | | | | $ | 4,772,314 | |
| Total Investments (Identified Cost, $1,918,328,098) | | | | | | $ | 1,952,792,777 | |
| | |
| Other Assets, Less Liabilities - (3.0)% | | | | | | | (56,299,356 | ) |
| Net Assets - 100.0% | | | | | | $ | 1,896,493,421 | |
| (a) | Non-income producing security. |
| (l) | A portion of this security is on loan. |
| (n) | Securities exempt from registration under Rule 144A of the Securities Act of 1933. These securities may be sold in the ordinary course of business in transactions exempt from registration, normally to qualified institutional buyers. At period end, the aggregate value of these securities was $199,828,648, representing 10.5% of net assets. |
| (v) | Underlying affiliated fund that is available only to investment companies managed by MFS. The rate quoted for the MFS Institutional Money Market Portfolio is the annualized seven-day yield of the fund at period end. |
| (z) | Restricted securities are not registered under the Securities Act of 1933 and are subject to legal restrictions on resale. These securities generally may be resold in transactions exempt from registration or to the public if the securities are subsequently registered. Disposal of these securities may involve time-consuming negotiations and prompt sale at an acceptable price may be difficult. The fund holds the following restricted securities: |
| | | | | | | | | | |
| Restricted Securities | | Acquisition
Date | | Cost | | | Value | |
| Banco de Costa Rica, 5.25%, 2018 | | 8/05/13 | | | $343,000 | | | | $346,430 | |
| Brazil Minas SPE, 5.333%, 2028 | | 3/22/13 | | | 584,216 | | | | 501,160 | |
| CEMEX S.A.B. de C.V., 6.5%, 2019 | | 8/05/13 | | | 1,293,000 | | | | 1,254,210 | |
| G-Force LLC, CDO, “A2”, 4.83%, 2036 | | 1/20/11 | | | 30,275 | | | | 31,160 | |
| Total Restricted Securities | | | | | | | | | $2,132,960 | |
| % of Net assets | | | | | | | | | 0.1% | |
21
Portfolio of Investments (unaudited) – continued
The following abbreviations are used in this report and are defined:
| CDO | | Collateralized Debt Obligation |
| FRN | | Floating Rate Note. Interest rate resets periodically and may not be the rate reported at period end. |
| PLC | | Public Limited Company |
| REIT | | Real Estate Investment Trust |
| STRIPS | | Separate Trading of Registered Interest and Principal of Securities |
Derivative Contracts at 8/31/13
Swap Agreements at 8/31/13
| | | | | | | | | | | | | | | | | | |
| Expiration | | | | | Notional
Amount | | | Counterparty | | Cash Flows
to Receive | | Cash Flows
to Pay | | Fair
Value | |
| Liability Derivatives | |
| Credit Default Swap Agreements | |
| 9/20/23 | | | USD | | | | 6,148,000 | | | Barclays Bank (a) | | 1% (fixed rate) | | (1) | | | $(725,488 | ) |
| 9/20/23 | | | USD | | | | 4,716,000 | | | Citibank (b) | | 1% (fixed rate) | | (2) | | | (564,054 | ) |
| 9/20/23 | | | USD | | | | 5,570,000 | | | Merrill Lynch (c) | | 1% (fixed rate) | | (3) | | | (974,689 | ) |
| 6/20/23 | | | USD | | | | 5,250,000 | | | Citibank (d) | | 1% (fixed rate) | | (4) | | | (332,046 | ) |
| | | | | | | | | | | | | | | | | | |
| | | | | | | | | | | | | | | | | $(2,596,277 | ) |
| | | | | | | | | | | | | | | | | | |
| (1) | Fund, as protection seller, to pay notional amount upon a defined credit event by Federal Republic of Brazil, 12.25%, 3/6/30, a BBB rated bond. The fund entered into the contract to gain issuer exposure. |
| (2) | Fund, as protection seller, to pay notional amount upon a defined credit event by Russian Federation, 7.5%, 3/31/30, a BBB rated bond. The fund entered into the contract to gain issuer exposure. |
| (3) | Fund, as protection seller, to pay notional amount upon a defined credit event by Republic of Indonesia, 6.875%, 3/9/17, a BB+ rated bond. The fund entered into the contract to gain issuer exposure. |
| (4) | Fund, as protection seller, to pay notional amount upon a defined credit event by Republic of Mexico, 5.95%, 3/19/19, a BBB rated bond. The fund entered into the contract to gain issuer exposure. |
| (a) | Net unamortized premiums received by the fund amounted to $668,680. |
| (b) | Net unamortized premiums received by the fund amounted to $550,353. |
| (c) | Net unamortized premiums received by the fund amounted to $729,908. |
| (d) | Net unamortized premiums received by the fund amounted to $155,922. |
The credit ratings presented here are an indicator of the current payment/performance risk of the related swap agreement, the reference obligation for which may be either a single security or, in the case of a credit default index, a basket of securities issued by corporate or sovereign issuers. Ratings are assigned to each reference security, including each individual security within a reference basket of securities, utilizing ratings from Moody’s, Fitch, and Standard & Poor’s rating agencies and applying the following hierarchy: If all three agencies provide a rating, the middle rating (after dropping the highest and lowest ratings) is assigned; if two of the three agencies rate a security, the lower of the two is assigned. Ratings are shown in the S&P and Fitch scale (e.g., AAA). The ratings for a credit default index are calculated by MFS as a weighted average of the external credit ratings of the individual securities that compose the index’s reference basket of securities.
22
Portfolio of Investments (unaudited) – continued
At August 31, 2013, the fund had cash collateral of $2,062,847 to cover any commitments for certain derivative contracts. Cash collateral is comprised of “Restricted cash” in the Statement of Assets and Liabilities.
See Notes to Financial Statements
23
Financial Statements
STATEMENT OF ASSETS AND LIABILITIES
At 8/31/13 (unaudited)
This statement represents your fund’s balance sheet, which details the assets and liabilities comprising the total value of the fund.
| | | | |
| Assets | | | | |
Investments- | | | | |
Non-affiliated issuers, at value (identified cost, $1,326,759,801) | | | $1,360,303,661 | |
Underlying affiliated funds, at value (identified cost, $591,568,297) | | | 592,489,116 | |
Total investments, at value, including $4,464,409 of securities on loan (identified cost, $1,918,328,098) | | | $1,952,792,777 | |
Restricted cash | | | 2,062,847 | |
Receivables for | | | | |
Investments sold | | | 825,056 | |
TBA sale commitments | | | 45,758,329 | |
Fund shares sold | | | 7,636,215 | |
Interest and dividends | | | 9,712,380 | |
Other assets | | | 2,232 | |
Total assets | | | $2,018,789,836 | |
| Liabilities | | | | |
Payables for | | | | |
Distributions | | | $683,977 | |
Investments purchased | | | 6,744,536 | |
TBA purchase commitments | | | 101,598,708 | |
Fund shares reacquired | | | 4,997,408 | |
Swaps, at value (net unamortized premiums received, $2,104,863) | | | 2,596,277 | |
Collateral for securities loaned, at value | | | 4,772,314 | |
Payable to affiliates | | | | |
Investment adviser | | | 100,689 | |
Shareholder servicing costs | | | 706,234 | |
Distribution and service fees | | | 66,440 | |
Payable for independent Trustees’ compensation | | | 12 | |
Accrued expenses and other liabilities | | | 29,820 | |
Total liabilities | | | $122,296,415 | |
Net assets | | | $1,896,493,421 | |
| Net assets consist of | | | | |
Paid-in capital | | | $1,848,689,620 | |
Unrealized appreciation (depreciation) on investments and translation of assets and liabilities in foreign currencies | | | 33,973,265 | |
Accumulated net realized gain (loss) on investments and foreign currency | | | 17,224,148 | |
Accumulated distributions in excess of net investment income | | | (3,393,612 | ) |
Net assets | | | $1,896,493,421 | |
Shares of beneficial interest outstanding | | | 163,761,630 | |
24
Statement of Assets and Liabilities (unaudited) – continued
| | | | | | | | | | | | |
| | | Net assets | | | Shares
outstanding | | | Net asset value
per share (a) | |
Class A | | | $970,361,450 | | | | 83,777,853 | | | | $11.58 | |
Class C | | | 568,797,254 | | | | 49,135,220 | | | | 11.58 | |
Class I | | | 348,505,079 | | | | 30,086,239 | | | | 11.58 | |
Class R1 | | | 625,572 | | | | 54,075 | | | | 11.57 | |
Class R2 | | | 857,402 | | | | 74,060 | | | | 11.58 | |
Class R3 | | | 3,609,480 | | | | 311,561 | | | | 11.59 | |
Class R4 | | | 2,021,540 | | | | 174,488 | | | | 11.59 | |
Class R5 | | | 1,715,644 | | | | 148,134 | | | | 11.58 | |
| (a) | Maximum offering price per share was equal to the net asset value per share for all share classes, except for Class A, for which the maximum offering price per share was $12.16 [100 / 95.25 x $11.58]. On sales of $50,000 or more, the maximum offering price of Class A shares is reduced. A contingent deferred sales charge may be imposed on redemptions of Class A and Class C shares. Redemption price per share was equal to the net asset value per share for Classes I, R1, R2, R3, R4, and R5. |
See Notes to Financial Statements
25
Financial Statements
STATEMENT OF OPERATIONS
Six months ended 8/31/13 (unaudited)
This statement describes how much your fund earned in investment income and accrued in expenses. It also describes any gains and/or losses generated by fund operations.
| | | | |
| Net investment income | | | | |
Income | | | | |
Interest | | | $11,037,266 | |
Dividends | | | 9,712,062 | |
Dividends from underlying affiliated funds | | | 12,797,443 | |
Total investment income | | | $33,546,771 | |
Expenses | | | | |
Management fee | | | $5,852,944 | |
Distribution and service fees | | | 3,855,384 | |
Shareholder servicing costs | | | 776,430 | |
Administrative services fee | | | 116,851 | |
Independent Trustees’ compensation | | | 12,943 | |
Custodian fee | | | 120,373 | |
Shareholder communications | | | 47,773 | |
Audit and tax fees | | | 31,899 | |
Legal fees | | | 6,525 | |
Miscellaneous | | | 167,755 | |
Total expenses | | | $10,988,877 | |
Fees paid indirectly | | | (377 | ) |
Reduction of expenses by investment adviser and distributor | | | (27,562 | ) |
Net expenses | | | $10,960,938 | |
Net investment income | | | $22,585,833 | |
| Realized and unrealized gain (loss) on investments and foreign currency | |
Realized gain (loss) (identified cost basis) | | | | |
Investments | | | $26,842,943 | |
Underlying affiliated funds | | | (837,198 | ) |
Swap agreements | | | (866,274 | ) |
Foreign currency | | | 92,163 | |
Net realized gain (loss) on investments and foreign currency | | | $25,231,634 | |
Change in unrealized appreciation (depreciation) | | | | |
Investments | | | $(65,149,704 | ) |
Swap agreements | | | (344,017 | ) |
Translation of assets and liabilities in foreign currencies | | | (8,510 | ) |
Net unrealized gain (loss) on investments and foreign currency translation | | | $(65,502,231 | ) |
Net realized and unrealized gain (loss) on investments and foreign currency | | | $(40,270,597 | ) |
Change in net assets from operations | | | $(17,684,764 | ) |
See Notes to Financial Statements
26
Financial Statements
STATEMENTS OF CHANGES IN NET ASSETS
These statements describe the increases and/or decreases in net assets resulting from operations, any distributions, and any shareholder transactions.
| | | | | | | | |
| | | Six months ended
8/31/13 | | | Year ended
2/28/13 | |
| Change in net assets | | (unaudited) | | | | |
| From operations | | | | | | | | |
Net investment income | | | $22,585,833 | | | | $30,135,730 | |
Net realized gain (loss) on investments and foreign currency | | | 25,231,634 | | | | 19,458,662 | |
Net unrealized gain (loss) on investments and foreign currency translation | | | (65,502,231 | ) | | | 64,539,257 | |
Change in net assets from operations | | | $(17,684,764 | ) | | | $114,133,649 | |
| Distributions declared to shareholders | | | | | | | | |
From net investment income | | | $(23,984,237 | ) | | | $(34,119,558 | ) |
From net realized gain on investments | | | (4,248,463 | ) | | | (1,043,035 | ) |
Total distributions declared to shareholders | | | $(28,232,700 | ) | | | $(35,162,593 | ) |
Change in net assets from fund share transactions | | | $391,857,085 | | | | $688,808,285 | |
Total change in net assets | | | $345,939,621 | | | | $767,779,341 | |
| Net assets | | | | | | | | |
At beginning of period | | | 1,550,553,800 | | | | 782,774,459 | |
At end of period (including accumulated distributions in excess of net investment income of $3,393,612 and $1,995,208, respectively) | | | $1,896,493,421 | | | | $1,550,553,800 | |
See Notes to Financial Statements
27
Financial Statements
FINANCIAL HIGHLIGHTS
The financial highlights table is intended to help you understand the fund’s financial performance for the semiannual period and the past 5 fiscal years (or life of a particular share class, if shorter). Certain information reflects financial results for a single fund share. The total returns in the table represent the rate by which an investor would have earned (or lost) on an investment in the fund share class (assuming reinvestment of all distributions) held for the entire period.
| | | | | | | | | | | | | | | | | | | | | | | | |
| | | Six months
ended
8/31/13 (unaudited) | | | Years ended 2/28, 2/29 | |
| Class A | | | 2013 | | | 2012 | | | 2011 | | | 2010 | | | 2009 | |
| | | | | | | | | | | | | | | | | |
Net asset value, beginning of period | | | $11.82 | | | | $11.05 | | | | $10.79 | | | | $9.60 | | | | $6.88 | | | | $10.04 | |
| Income (loss) from investment operations | | | | | |
Net investment income (d) | | | $0.16 | | | | $0.33 | | | | $0.34 | | | | $0.40 | | | | $0.43 | | | | $0.47 | |
Net realized and unrealized
gain (loss) on investments
and foreign currency | | | (0.20) | | | | 0.82 | | | | 0.30 | | | | 1.23 | | | | 2.75 | | | | (3.13) | |
Total from investment operations | | | $(0.04) | | | | $1.15 | | | | $0.64 | | | | $1.63 | | | | $3.18 | | | | $(2.66) | |
| Less distributions declared to shareholders | | | | | |
From net investment income | | | $(0.17) | | | | $(0.37) | | | | $(0.38) | | | | $(0.44) | | | | $(0.46) | | | | $(0.49) | |
From net realized gain on
investments | | | (0.03) | | | | (0.01) | | | | — | | | | — | | | | — | | | | (0.01) | |
Total distributions declared to
shareholders | | | $(0.20) | | | | $(0.38) | | | | $(0.38) | | | | $(0.44) | | | | $(0.46) | | | | $(0.50) | |
Net asset value, end of period (x) | | | $11.58 | | | | $11.82 | | | | $11.05 | | | | $10.79 | | | | $9.60 | | | | $6.88 | |
Total return (%) (r)(s)(t)(x) | | | (0.37) | (n) | | | 10.56 | | | | 6.09 | | | | 17.36 | | | | 47.12 | | | | (27.43) | |
Ratios (%) (to average net assets)
and Supplemental data: | |
Expenses before expense
reductions (f)(h) | | | 1.04 | (a) | | | 1.08 | | | | 1.10 | | | | 1.15 | | | | 1.20 | | | | 1.23 | |
Expenses after expense
reductions (f)(h) | | | 1.04 | (a) | | | 1.08 | | | | 1.10 | | | | 1.06 | | | | 0.94 | | | | 0.95 | |
Net investment income | | | 2.69 | (a) | | | 2.86 | | | | 3.18 | | | | 3.95 | | | | 5.02 | | | | 5.23 | |
Portfolio turnover | | | 38 | (n) | | | 64 | | | | 64 | | | | 59 | | | | 79 | | | | 80 | |
Net assets at end of period
(000 omitted) | | | $970,361 | | | | $797,338 | | | | $447,034 | | | | $257,247 | | | | $116,318 | | | | $91,445 | |
See Notes to Financial Statements
28
Financial Highlights – continued
| | | | | | | | | | | | | | | | | | | | | | | | |
| | | Six months
ended
8/31/13 (unaudited) | | | Years ended 2/28, 2/29 | |
| Class C | | | 2013 | | | 2012 | | | 2011 | | | 2010 | | | 2009 | |
| | | | | | | | | | | | | | | | | |
Net asset value, beginning of period | | | $11.82 | | | | $11.04 | | | | $10.78 | | | | $9.59 | | | | $6.88 | | | | $10.03 | |
| Income (loss) from investment operations | | | | | |
Net investment income (d) | | | $0.12 | | | | $0.24 | | | | $0.26 | | | | $0.33 | | | | $0.37 | | | | $0.41 | |
Net realized and unrealized
gain (loss) on investments
and foreign currency | | | (0.20) | | | | 0.83 | | | | 0.30 | | | | 1.22 | | | | 2.74 | | | | (3.13) | |
Total from investment operations | | | $(0.08) | | | | $1.07 | | | | $0.56 | | | | $1.55 | | | | $3.11 | | | | $(2.72) | |
| Less distributions declared to shareholders | | | | | |
From net investment income | | | $(0.13) | | | | $(0.28) | | | | $(0.30) | | | | $(0.36) | | | | $(0.40) | | | | $(0.42) | |
From net realized gain on
investments | | | (0.03) | | | | (0.01) | | | | — | | | | — | | | | — | | | | (0.01) | |
Total distributions declared to
shareholders | | | $(0.16) | | | | $(0.29) | | | | $(0.30) | | | | $(0.36) | | | | $(0.40) | | | | $(0.43) | |
Net asset value, end of period (x) | | | $11.58 | | | | $11.82 | | | | $11.04 | | | | $10.78 | | | | $9.59 | | | | $6.88 | |
Total return (%) (r)(s)(t)(x) | | | (0.75) | (n) | | | 9.84 | | | | 5.31 | | | | 16.51 | | | | 45.90 | | | | (27.88) | |
Ratios (%) (to average net assets)
and Supplemental data: | |
Expenses before expense
reductions (f)(h) | | | 1.79 | (a) | | | 1.83 | | | | 1.85 | | | | 1.90 | | | | 1.95 | | | | 1.93 | |
Expenses after expense
reductions (f)(h) | | | 1.79 | (a) | | | 1.83 | | | | 1.85 | | | | 1.81 | | | | 1.69 | | | | 1.65 | |
Net investment income | | | 1.94 | (a) | | | 2.11 | | | | 2.43 | | | | 3.20 | | | | 4.27 | | | | 4.54 | |
Portfolio turnover | | | 38 | (n) | | | 64 | | | | 64 | | | | 59 | | | | 79 | | | | 80 | |
Net assets at end of period
(000 omitted) | | | $568,797 | | | | $466,361 | | | | $238,332 | | | | $138,344 | | | | $63,377 | | | | $46,617 | |
See Notes to Financial Statements
29
Financial Highlights – continued
| | | | | | | | | | | | | | | | | | | | | | | | |
| | | Six months
ended
8/31/13 (unaudited) | | | Years ended 2/28, 2/29 | |
| Class I | | | 2013 | | | 2012 | | | 2011 | | | 2010 | | | 2009 | |
| | | | | | | | | | | | | | | | | |
Net asset value, beginning of period | | | $11.82 | | | | $11.05 | | | | $10.79 | | | | $9.60 | | | | $6.88 | | | | $10.04 | |
| Income (loss) from investment operations | | | | | |
Net investment income (d) | | | $0.18 | | | | $0.35 | | | | $0.36 | | | | $0.41 | | | | $0.45 | | | | $0.50 | |
Net realized and unrealized
gain (loss) on investments
and foreign currency | | | (0.20) | | | | 0.83 | | | | 0.30 | | | | 1.25 | | | | 2.75 | | | | (3.14) | |
Total from investment operations | | | $(0.02) | | | | $1.18 | | | | $0.66 | | | | $1.66 | | | | $3.20 | | | | $(2.64) | |
| Less distributions declared to shareholders | | | | | |
From net investment income | | | $(0.19) | | | | $(0.40) | | | | $(0.40) | | | | $(0.47) | | | | $(0.48) | | | | $(0.51) | |
From net realized gain on
investments | | | (0.03) | | | | (0.01) | | | | — | | | | — | | | | — | | | | (0.01) | |
Total distributions declared to
shareholders | | | $(0.22) | | | | $(0.41) | | | | $(0.40) | | | | $(0.47) | | | | $(0.48) | | | | $(0.52) | |
Net asset value, end of period (x) | | | $11.58 | | | | $11.82 | | | | $11.05 | | | | $10.79 | | | | $9.60 | | | | $6.88 | |
Total return (%) (r)(s)(x) | | | (0.25) | (n) | | | 10.83 | | | | 6.35 | | | | 17.65 | | | | 47.47 | | | | (27.21) | |
Ratios (%) (to average net assets)
and Supplemental data: | |
Expenses before expense
reductions (f)(h) | | | 0.79 | (a) | | | 0.83 | | | | 0.85 | | | | 0.89 | | | | 0.93 | | | | 0.93 | |
Expenses after expense
reductions (f)(h) | | | 0.79 | (a) | | | 0.83 | | | | 0.85 | | | | 0.83 | | | | 0.69 | | | | 0.65 | |
Net investment income | | | 2.93 | (a) | | | 3.09 | | | | 3.43 | | | | 3.94 | | | | 4.95 | | | | 5.56 | |
Portfolio turnover | | | 38 | (n) | | | 64 | | | | 64 | | | | 59 | | | | 79 | | | | 80 | |
Net assets at end of period
(000 omitted) | | | $348,505 | | | | $280,443 | | | | $96,323 | | | | $30,993 | | | | $3,835 | | | | $1,036 | |
See Notes to Financial Statements
30
Financial Highlights – continued
| | | | | | | | | | | | | | | | | | | | | | | | |
| | | Six months
ended
8/31/13 (unaudited) | | | Years ended 2/28, 2/29 | |
| Class R1 | | | 2013 | | | 2012 | | | 2011 | | | 2010 | | | 2009 (i) | |
| | | | | | | | | | | | | | | | | |
Net asset value, beginning of period | | | $11.81 | | | | $11.04 | | | | $10.78 | | | | $9.59 | | | | $6.87 | | | | $9.83 | |
| Income (loss) from investment operations | | | | | |
Net investment income (d) | | | $0.12 | | | | $0.23 | | | | $0.26 | | | | $0.34 | | | | $0.37 | | | | $0.27 | |
Net realized and unrealized
gain (loss) on investments
and foreign currency | | | (0.20) | | | | 0.83 | | | | 0.30 | | | | 1.21 | | | | 2.75 | | | | (2.94) | |
Total from investment operations | | | $(0.08) | | | | $1.06 | | | | $0.56 | | | | $1.55 | | | | $3.12 | | | | $(2.67) | |
| Less distributions declared to shareholders | | | | | |
From net investment income | | | $(0.13) | | | | $(0.28) | | | | $(0.30) | | | | $(0.36) | | | | $(0.40) | | | | $(0.29) | |
From net realized gain on
investments | | | (0.03) | | | | (0.01) | | | | — | | | | — | | | | — | | | | — | |
Total distributions declared to
shareholders | | | $(0.16) | | | | $(0.29) | | | | $(0.30) | | | | $(0.36) | | | | $(0.40) | | | | $(0.29) | |
Net asset value, end of period (x) | | | $11.57 | | | | $11.81 | | | | $11.04 | | | | $10.78 | | | | $9.59 | | | | $6.87 | |
Total return (%) (r)(s)(x) | | | (0.75) | (n) | | | 9.75 | | | | 5.31 | | | | 16.51 | | | | 46.11 | | | | (27.52) | (n) |
Ratios (%) (to average net assets)
and Supplemental data: | |
Expenses before expense
reductions (f)(h) | | | 1.79 | (a) | | | 1.84 | | | | 1.85 | | | | 1.90 | | | | 1.94 | | | | 1.97 | (a) |
Expenses after expense
reductions (f)(h) | | | 1.79 | (a) | | | 1.84 | | | | 1.85 | | | | 1.80 | | | | 1.69 | | | | 1.65 | (a) |
Net investment income | | | 1.94 | (a) | | | 2.04 | | | | 2.44 | | | | 3.32 | | | | 4.24 | | | | 4.76 | (a) |
Portfolio turnover | | | 38 | (n) | | | 64 | | | | 64 | | | | 59 | | | | 79 | | | | 80 | (n) |
Net assets at end of period
(000 omitted) | | | $626 | | | | $375 | | | | $142 | | | | $126 | | | | $106 | | | | $73 | |
See Notes to Financial Statements
31
Financial Highlights – continued
| | | | | | | | | | | | | | | | | | | | | | | | |
| | | Six months
ended
8/31/13 (unaudited) | | | Years ended 2/28, 2/29 | |
| Class R2 | | | 2013 | | | 2012 | | | 2011 | | | 2010 | | | 2009 (i) | |
| | | | | | | | | | | | | | | | | |
Net asset value, beginning of period | | | $11.82 | | | | $11.04 | | | | $10.78 | | | | $9.59 | | | | $6.87 | | | | $9.83 | |
| Income (loss) from investment operations | | | | | |
Net investment income (d) | | | $0.15 | | | | $0.30 | | | | $0.31 | | | | $0.39 | | | | $0.41 | | | | $0.29 | |
Net realized and unrealized
gain (loss) on investments
and foreign currency | | | (0.20) | | | | 0.83 | | | | 0.30 | | | | 1.21 | | | | 2.75 | | | | (2.93) | |
Total from investment operations | | | $(0.05) | | | | $1.13 | | | | $0.61 | | | | $1.60 | | | | $3.16 | | | | $(2.64) | |
| Less distributions declared to shareholders | | | | | |
From net investment income | | | $(0.16) | | | | $(0.34) | | | | $(0.35) | | | | $(0.41) | | | | $(0.44) | | | | $(0.32) | |
From net realized gain on
investments | | | (0.03) | | | | (0.01) | | | | — | | | | — | | | | — | | | | — | |
Total distributions declared to
shareholders | | | $(0.19) | | | | $(0.35) | | | | $(0.35) | | | | $(0.41) | | | | $(0.44) | | | | $(0.32) | |
Net asset value, end of period (x) | | | $11.58 | | | | $11.82 | | | | $11.04 | | | | $10.78 | | | | $9.59 | | | | $6.87 | |
Total return (%) (r)(s)(x) | | | (0.50) | (n) | | | 10.39 | | | | 5.83 | | | | 17.09 | | | | 46.82 | | | | (27.27) | (n) |
Ratios (%) (to average net assets)
and Supplemental data: | |
Expenses before expense
reductions (f)(h) | | | 1.29 | (a) | | | 1.34 | | | | 1.35 | | | | 1.40 | | | | 1.45 | | | | 1.48 | (a) |
Expenses after expense
reductions (f)(h) | | | 1.29 | (a) | | | 1.34 | | | | 1.35 | | | | 1.30 | | | | 1.19 | | | | 1.15 | (a) |
Net investment income | | | 2.45 | (a) | | | 2.59 | | | | 2.93 | | | | 3.83 | | | | 4.74 | | | | 5.26 | (a) |
Portfolio turnover | | | 38 | (n) | | | 64 | | | | 64 | | | | 59 | | | | 79 | | | | 80 | (n) |
Net assets at end of period
(000 omitted) | | | $857 | | | | $702 | | | | $212 | | | | $125 | | | | $107 | | | | $73 | |
See Notes to Financial Statements
32
Financial Highlights – continued
| | | | | | | | | | | | | | | | | | | | | | | | |
| | | Six months
ended
8/31/13 (unaudited) | | | Years ended 2/28, 2/29 | |
| Class R3 | | | 2013 | | | 2012 | | | 2011 | | | 2010 | | | 2009 (i) | |
| | | | | | | | | | | | | | | | | |
Net asset value, beginning of period | | | $11.83 | | | | $11.05 | | | | $10.79 | | | | $9.59 | | | | $6.88 | | | | $9.84 | |
| Income (loss) from investment operations | | | | | |
Net investment income (d) | | | $0.16 | | | | $0.31 | | | | $0.34 | | | | $0.41 | | | | $0.43 | | | | $0.31 | |
Net realized and unrealized
gain (loss) on investments
and foreign currency | | | (0.20) | | | | 0.85 | | | | 0.30 | | | | 1.23 | | | | 2.74 | | | | (2.93) | |
Total from investment operations | | | $(0.04) | | | | $1.16 | | | | $0.64 | | | | $1.64 | | | | $3.17 | | | | $(2.62) | |
| Less distributions declared to shareholders | | | | | |
From net investment income | | | $(0.17) | | | | $(0.37) | | | | $(0.38) | | | | $(0.44) | | | | $(0.46) | | | | $(0.34) | |
From net realized gain on
investments | | | (0.03) | | | | (0.01) | | | | — | | | | — | | | | — | | | | — | |
Total distributions declared to
shareholders | | | $(0.20) | | | | $(0.38) | | | | $(0.38) | | | | $(0.44) | | | | $(0.46) | | | | $(0.34) | |
Net asset value, end of period (x) | | | $11.59 | | | | $11.83 | | | | $11.05 | | | | $10.79 | | | | $9.59 | | | | $6.88 | |
Total return (%) (r)(s)(x) | | | (0.37) | (n) | | | 10.65 | | | | 6.09 | | | | 17.48 | | | | 46.96 | | | | (27.12) | (n) |
Ratios (%) (to average net assets)
and Supplemental data: | |
Expenses before expense
reductions (f)(h) | | | 1.04 | (a) | | | 1.10 | | | | 1.10 | | | | 1.15 | | | | 1.20 | | | | 1.22 | (a) |
Expenses after expense
reductions (f)(h) | | | 1.04 | (a) | | | 1.10 | | | | 1.10 | | | | 1.06 | | | | 0.94 | | | | 0.90 | (a) |
Net investment income | | | 2.69 | (a) | | | 2.70 | | | | 3.17 | | | | 3.99 | | | | 4.99 | | | | 5.49 | (a) |
Portfolio turnover | | | 38 | (n) | | | 64 | | | | 64 | | | | 59 | | | | 79 | | | | 80 | (n) |
Net assets at end of period
(000 omitted) | | | $3,609 | | | | $2,783 | | | | $186 | | | | $185 | | | | $107 | | | | $73 | |
See Notes to Financial Statements
33
Financial Highlights – continued
| | | | | | | | | | | | | | | | | | | | | | | | |
| | | Six months
ended
8/31/13 (unaudited) | | | Years ended 2/28, 2/29 | |
| Class R4 | | | 2013 | | | 2012 | | | 2011 | | | 2010 | | | 2009 (i) | |
| | | | | | | | | | | | | | | | | |
Net asset value, beginning of period | | | $11.82 | | | | $11.05 | | | | $10.79 | | | | $9.59 | | | | $6.88 | | | | $9.84 | |
| Income (loss) from investment operations | | | | | |
Net investment income (d) | | | $0.18 | | | | $0.36 | | | | $0.36 | | | | $0.44 | | | | $0.46 | | | | $0.32 | |
Net realized and unrealized
gain (loss) on investments
and foreign currency | | | (0.19) | | | | 0.82 | | | | 0.30 | | | | 1.23 | | | | 2.73 | | | | (2.93) | |
Total from investment operations | | | $(0.01) | | | | $1.18 | | | | $0.66 | | | | $1.67 | | | | $3.19 | | | | $(2.61) | |
| Less distributions declared to shareholders | | | | | |
From net investment income | | | $(0.19) | | | | $(0.40) | | | | $(0.40) | | | | $(0.47) | | | | $(0.48) | | | | $(0.35) | |
From net realized gain on
investments | | | (0.03) | | | | (0.01) | | | | — | | | | — | | | | — | | | | — | |
Total distributions declared to
shareholders | | | $(0.22) | | | | $(0.41) | | | | $(0.40) | | | | $(0.47) | | | | $(0.48) | | | | $(0.35) | |
Net asset value, end of period (x) | | | $11.59 | | | | $11.82 | | | | $11.05 | | | | $10.79 | | | | $9.59 | | | | $6.88 | |
Total return (%) (r)(s)(x) | | | (0.16) | (n) | | | 10.83 | | | | 6.35 | | | | 17.78 | | | | 47.32 | | | | (26.99) | (n) |
Ratios (%) (to average net assets)
and Supplemental data: | |
Expenses before expense
reductions (f)(h) | | | 0.80 | (a) | | | 0.84 | | | | 0.85 | | | | 0.90 | | | | 0.95 | | | | 0.97 | (a) |
Expenses after expense
reductions (f)(h) | | | 0.79 | (a) | | | 0.84 | | | | 0.85 | | | | 0.80 | | | | 0.69 | | | | 0.65 | (a) |
Net investment income | | | 2.94 | (a) | | | 3.12 | | | | 3.40 | | | | 4.32 | | | | 5.24 | | | | 5.76 | (a) |
Portfolio turnover | | | 38 | (n) | | | 64 | | | | 64 | | | | 59 | | | | 79 | | | | 80 | (n) |
Net assets at end of period
(000 omitted) | | | $2,022 | | | | $1,159 | | | | $546 | | | | $127 | | | | $108 | | | | $73 | |
See Notes to Financial Statements
34
Financial Highlights – continued
| | | | | | | | |
| | | Six months
ended
8/31/13 (unaudited) | | | Period ended
2/28/13 (i) | |
| Class R5 | | |
| | | | | |
Net asset value, beginning of period | | | $11.82 | | | | $11.16 | |
| Income (loss) from investment operations | |
Net investment income (d) | | | $0.18 | | | | $0.19 | |
Net realized and unrealized gain (loss) on investments
and foreign currency | | | (0.20) | | | | 0.75 | |
Total from investment operations | | | $(0.02) | | | | $0.94 | |
| Less distributions declared to shareholders | |
From net investment income | | | $(0.19) | | | | $(0.27) | |
From net realized gain on investments | | | (0.03) | | | | (0.01) | |
Total distributions declared to shareholders | | | $(0.22) | | | | $(0.28) | |
Net asset value, end of period (x) | | | $11.58 | | | | $11.82 | |
Total return (%) (r)(s)(x) | | | (0.21) | (n) | | | 8.47 | (n) |
Ratios (%) (to average net assets)
and Supplemental data: | |
Expenses before expense reductions (f)(h) | | | 0.72 | (a) | | | 0.79 | (a) |
Expenses after expense reductions (f)(h) | | | 0.72 | (a) | | | 0.79 | (a) |
Net investment income | | | 3.01 | (a) | | | 2.48 | (a) |
Portfolio turnover | | | 38 | (n) | | | 64 | (n) |
Net assets at end of period (000 omitted) | | | $1,716 | | | | $1,393 | |
| (d) | Per share data is based on average shares outstanding. |
| (f) | Ratios do not reflect reductions from fees paid indirectly, if applicable. |
| (h) | For the six months ended August 31, 2013, in addition to the fees and expenses which the fund bears directly, the fund indirectly bears a pro rata share of the fees and expenses of the underlying affiliated funds in which the fund invests. Accordingly, the expense ratio for the fund reflects only those fees and expenses borne directly by the fund. Because the underlying affiliated funds have varied expense and fee levels and the fund may own different proportions of the underlying affiliated funds at different times, the amount of fees and expenses incurred indirectly by the fund will vary. |
| (i) | For the period from the class’s inception, July 1, 2008 (Class R1, R2, R3, and R4) and July 2, 2012 (Class R5) through the stated period end. |
| (r) | Certain expenses have been reduced without which performance would have been lower. |
| (s) | From time to time the fund may receive proceeds from litigation settlements, without which performance would be lower. |
| (t) | Total returns do not include any applicable sales charges. |
| (x) | The net asset values per share and total returns have been calculated on net assets which include adjustments made in accordance with U.S. generally accepted accounting principles required at period end for financial reporting purposes. |
See Notes to Financial Statements
35
NOTES TO FINANCIAL STATEMENTS
(unaudited)
(1) Business and Organization
MFS Diversified Income Fund (the fund) is a series of MFS Series Trust XIII (the trust). The trust is organized as a Massachusetts business trust and is registered under the Investment Company Act of 1940, as amended, as an open-end management investment company.
(2) Significant Accounting Policies
General – The preparation of financial statements in conformity with U.S. generally accepted accounting principles requires management to make estimates and assumptions that affect the reported amounts of assets and liabilities, and disclosure of contingent assets and liabilities at the date of the financial statements and the reported amounts of revenues and expenses during the reporting period. Actual results could differ from those estimates. In the preparation of these financial statements, management has evaluated subsequent events occurring after the date of the fund’s Statement of Assets and Liabilities through the date that the financial statements were issued. The accounting policies of the underlying funds in which the fund invests are outlined in the underlying funds’ shareholder reports, which are available without charge by calling 1-800-225-2606, at mfs.com and on the Securities and Exchange Commission (SEC) web site at http://www.sec.gov or at the SEC’s public reference room in Washington, D.C. The underlying funds’ shareholder reports are not covered by this report. The fund invests in high-yield securities rated below investment grade. Investments in high-yield securities involve greater degrees of credit and market risk than investments in higher-rated securities and tend to be more sensitive to economic conditions. The fund invests in foreign securities, including securities of emerging market issuers. Investments in foreign securities are vulnerable to the effects of changes in the relative values of the local currency and the U.S. dollar and to the effects of changes in each country’s legal, political, and economic environment. The markets of emerging markets countries are generally more volatile than the markets of developed countries with more mature economies. All of the risks of investing in foreign securities previously described are heightened when investing in emerging markets countries.
In this reporting period, the fund adopted the disclosure provisions of the Financial Accounting Standards Board (FASB) Accounting Standards Update 2011-11 (“ASU 2011-11”), Balance Sheet (Topic 210) – Disclosures about Offsetting Assets and Liabilities along with the related scope clarification provisions of FASB Accounting Standards Update 2013-01 (“ASU 2013-01”) entitled Balance Sheet (Topic 210) – Clarifying the Scope of Disclosures about Offsetting Assets and Liabilities. ASU 2011-11 is intended to enhance disclosures on the offsetting of financial assets and liabilities by requiring entities to disclose both gross and net information about financial instruments and transactions that are either offset in the statement of financial position or subject to a Master Netting Agreement or similar arrangement. ASU 2013-01 limits the scope of ASU 2011-11’s disclosure requirements on offsetting to financial assets and financial liabilities related to derivatives, repurchase and reverse repurchase agreements, and securities lending and securities borrowing transactions. The disclosures required by ASU 2011-11, to the extent applicable to the fund, have been included in the fund’s Significant Accounting Policies note under the captions for each of the fund’s in-scope financial instruments and transactions.
36
Notes to Financial Statements (unaudited) – continued
In June 2013, FASB issued Accounting Standards Update 2013-08 Financial Services – Investment Companies (Topic 946) – Amendments to the Scope, Measurement, and Disclosure Requirements (“ASU 2013-08”) which is effective for interim and annual reporting periods in fiscal years that begin after December 15, 2013. ASU 2013-08 sets forth a methodology for determining whether an entity should be characterized as an investment company and prescribes fair value accounting for an investment company’s non-controlling ownership interest in another investment company. FASB has determined that a fund registered under the Investment Company Act of 1940 automatically meets ASU 2013-08’s criteria for an investment company. Although still evaluating the potential impacts of ASU 2013-08 to the fund, management expects that the impact of the fund’s adoption will be limited to additional financial statement disclosures.
Investment Valuations – Equity securities, including restricted equity securities, are generally valued at the last sale or official closing price as provided by a third-party pricing service on the market or exchange on which they are primarily traded. Equity securities, for which there were no sales reported that day, are generally valued at the last quoted daily bid quotation as provided by a third-party pricing service on the market or exchange on which such securities are primarily traded. Debt instruments and floating rate loans (other than short-term instruments), including restricted debt instruments, are generally valued at an evaluated or composite bid as provided by a third-party pricing service. Short-term instruments with a maturity at issuance of 60 days or less generally are valued at amortized cost, which approximates market value. Exchange-traded options are generally valued at the last sale or official closing price as provided by a third-party pricing service on the exchange on which such options are primarily traded. Exchange-traded options for which there were no sales reported that day are generally valued at the last daily bid quotation as provided by a third-party pricing service on the exchange on which such options are primarily traded. Options not traded on an exchange are generally valued at a broker/dealer bid quotation. Foreign currency options are generally valued at valuations provided by a third-party pricing service. Forward foreign currency exchange contracts are generally valued at the mean of bid and asked prices for the time period interpolated from rates provided by a third-party pricing service for proximate time periods. Swap agreements are generally valued at valuations provided by a third-party pricing service, which for cleared swaps includes an evaluation of any trading activity at the clearinghouses. Open-end investment companies are generally valued at net asset value per share. Securities and other assets generally valued on the basis of information from a third-party pricing service may also be valued at a broker/dealer bid quotation. Values obtained from third-party pricing services can utilize both transaction data and market information such as yield, quality, coupon rate, maturity, type of issue, trading characteristics, and other market data. The values of foreign securities and other assets and liabilities expressed in foreign currencies are converted to U.S. dollars using the mean of bid and asked prices for rates provided by a third-party pricing service.
37
Notes to Financial Statements (unaudited) – continued
The Board of Trustees has delegated primary responsibility for determining or causing to be determined the value of the fund’s investments (including any fair valuation) to the adviser pursuant to valuation policies and procedures approved by the Board. If the adviser determines that reliable market quotations are not readily available, investments are valued at fair value as determined in good faith by the adviser in accordance with such procedures under the oversight of the Board of Trustees. Under the fund’s valuation policies and procedures, market quotations are not considered to be readily available for most types of debt instruments and floating rate loans and many types of derivatives. These investments are generally valued at fair value based on information from third-party pricing services. In addition, investments may be valued at fair value if the adviser determines that an investment’s value has been materially affected by events occurring after the close of the exchange or market on which the investment is principally traded (such as foreign exchange or market) and prior to the determination of the fund’s net asset value, or after the halting of trading of a specific security where trading does not resume prior to the close of the exchange or market on which the security is principally traded. Events that occur on a frequent basis after foreign markets close (such as developments in foreign markets and significant movements in the U.S. markets) and prior to the determination of the fund’s net asset value may be deemed to have a material effect on the value of securities traded in foreign markets. Accordingly, the fund’s foreign equity securities may often be valued at fair value. The adviser generally relies on third-party pricing services or other information (such as the correlation with price movements of similar securities in the same or other markets; the type, cost and investment characteristics of the security; the business and financial condition of the issuer; and trading and other market data) to assist in determining whether to fair value and at what value to fair value an investment. The value of an investment for purposes of calculating the fund’s net asset value can differ depending on the source and method used to determine value. When fair valuation is used, the value of an investment used to determine the fund’s net asset value may differ from quoted or published prices for the same investment. There can be no assurance that the fund could obtain the fair value assigned to an investment if it were to sell the investment at the same time at which the fund determines its net asset value per share.
Various inputs are used in determining the value of the fund’s assets or liabilities. These inputs are categorized into three broad levels. In certain cases, the inputs used to measure fair value may fall into different levels of the fair value hierarchy. In such cases, an investment’s level within the fair value hierarchy is based on the lowest level of input that is significant to the fair value measurement. The fund’s assessment of the significance of a particular input to the fair value measurement in its entirety requires judgment, and considers factors specific to the investment. Level 1 includes unadjusted quoted prices in active markets for identical assets or liabilities. Level 2 includes other significant observable market-based inputs (including quoted prices for similar securities, interest rates, prepayment speed, and credit risk). Level 3 includes unobservable inputs, which may include the adviser’s own assumptions in determining the fair value of investments. Other financial instruments are derivative instruments not
38
Notes to Financial Statements (unaudited) – continued
reflected in total investments, such as swap agreements. The following is a summary of the levels used as of August 31, 2013 in valuing the fund’s assets or liabilities:
| | | | | | | | | | | | | | | | |
| Investments at Value | | Level 1 | | | Level 2 | | | Level 3 | | | Total | |
| Equity Securities | | | | | | | | | | | | | | | | |
United States | | | $721,905,609 | | | | $— | | | | $34,824 | | | | $721,940,433 | |
United Kingdom | | | 3,407,709 | | | | — | | | | — | | | | 3,407,709 | |
Austria | | | 3,074,614 | | | | — | | | | — | | | | 3,074,614 | |
| U.S. Treasury Bonds & U.S. Government Agency & Equivalents | | | — | | | | 160,198,463 | | | | — | | | | 160,198,463 | |
| Non-U.S. Sovereign Debt | | | — | | | | 186,292,618 | | | | — | | | | 186,292,618 | |
| Municipal Bonds | | | — | | | | 626,777 | | | | — | | | | 626,777 | |
| U.S. Corporate Bonds | | | — | | | | 2,218,281 | | | | — | | | | 2,218,281 | |
| Residential Mortgage-Backed Securities | | | — | | | | 169,430,775 | | | | — | | | | 169,430,775 | |
| Commercial Mortgage-Backed Securities | | | — | | | | 5,962,781 | | | | — | | | | 5,962,781 | |
| Asset-Backed Securities (including CDOs) | | | — | | | | 31,160 | | | | — | | | | 31,160 | |
| Foreign Bonds | | | — | | | | 102,347,736 | | | | — | | | | 102,347,736 | |
| Short Term Securities | | | — | | | | 4,772,314 | | | | — | | | | 4,772,314 | |
| Mutual Funds | | | 592,489,116 | | | | — | | | | — | | | | 592,489,116 | |
| Total Investments | | | $1,320,877,048 | | | | $631,880,905 | | | | $34,824 | | | | $1,952,792,777 | |
| | | | |
| Other Financial Instruments | | | | | | | | | | | | |
| Swap Agreements | | | $— | | | | $(2,596,277 | ) | | | $— | | | | $(2,596,277 | ) |
For further information regarding security characteristics, see the Portfolio of Investments.
The following is a reconciliation of level 3 assets for which significant unobservable inputs were used to determine fair value. The fund’s policy is to recognize transfers between the levels as of the end of the period. The table presents the activity of level 3 securities held at the beginning and the end of the period.
| | | | |
| | | Investments
in Securities | |
| Balance as of 2/28/13 | | | $35,091 | |
Change in unrealized appreciation (depreciation) | | | (267 | ) |
| Balance as of 8/31/13 | | | $34,824 | |
The net change in unrealized appreciation (depreciation) from investments still held as level 3 at August 31, 2013 is $(267).
Repurchase Agreements – The fund enters into repurchase agreements under the terms of Master Repurchase Agreements with approved counterparties. Each repurchase agreement is recorded at cost. The fund requires that the securities collateral in a repurchase transaction be transferred to a custodian. The fund monitors, on a daily basis, the value of the collateral to ensure that its value, including accrued interest, is greater than amounts owed to the fund under each such repurchase agreement. Upon an event of default under a Master Repurchase Agreement, the non-defaulting party may close out all transactions traded under such agreement and net amounts owed under each transaction to one net amount payable by one party to
39
Notes to Financial Statements (unaudited) – continued
the other. Absent an event of default, the Master Repurchase Agreement does not result in an offset of reported amounts of assets and liabilities in the Statement of Assets and Liabilities across transactions between the fund and the applicable counterparty.
At period end, the fund had investments in repurchase agreements with a gross value of $4,772,314 included in “Investments” in the Statement of Assets and Liabilities. The value of the related collateral exceeded the value of the repurchase agreements at period end.
Foreign Currency Translation – Purchases and sales of foreign investments, income, and expenses are converted into U.S. dollars based upon currency exchange rates prevailing on the respective dates of such transactions or on the reporting date for foreign denominated receivables and payables. Gains and losses attributable to foreign currency exchange rates on sales of securities are recorded for financial statement purposes as net realized gains and losses on investments. Gains and losses attributable to foreign exchange rate movements on receivables, payables, income and expenses are recorded for financial statement purposes as foreign currency transaction gains and losses. That portion of both realized and unrealized gains and losses on investments that results from fluctuations in foreign currency exchange rates is not separately disclosed.
Derivatives – The fund uses derivatives for different purposes, primarily to increase or decrease exposure to a particular market or segment of the market, or security, to increase or decrease interest rate or currency exposure, or as alternatives to direct investments. Derivatives are used for hedging or non-hedging purposes. While hedging can reduce or eliminate losses, it can also reduce or eliminate gains. When the fund uses derivatives as an investment to increase market exposure, or for hedging purposes, gains and losses from derivative instruments may be substantially greater than the derivative’s original cost.
The derivative instruments used by the fund were purchased options, forward foreign currency exchange contracts, and swap agreements. The fund’s period end derivatives, as presented in the Portfolio of Investments and the associated Derivative Contract tables, generally are indicative of the volume of its derivative activity during the period. The following table presents, by major type of derivative contract, the fair value, on a gross basis, of the asset and liability components of derivatives held by the fund at August 31, 2013 as reported in the Statement of Assets and Liabilities:
| | | | | | | | | | |
| | | | | Fair Value (a) | |
| Risk | | Derivative Contracts | | Asset Derivatives | | | Liability Derivatives | |
| Equity | | Purchased Equity Options | | | $2,506,600 | | | | $— | |
| Credit | | Credit Default Swaps | | | — | | | | (2,596,277 | ) |
| Total | | | | | $2,506,600 | | | | $(2,596,277) | |
| (a) | The value of purchased options outstanding is included in total investments, at value, within the fund’s Statement of Assets and Liabilities. |
40
Notes to Financial Statements (unaudited) – continued
The following table presents, by major type of derivative contract, the realized gain (loss) on derivatives held by the fund for the six months ended August 31, 2013 as reported in the Statement of Operations:
| | | | | | | | | | | | |
| Risk | | Swap
Agreements | | | Foreign
Currency | | | Investments
(Purchased
Options) | |
| Foreign Exchange | | | $— | | | | $25,018 | | | | $— | |
| Equity | | | — | | | | — | | | | (647,487 | ) |
| Credit | | | (866,274 | ) | | | — | | | | — | |
| Total | | | $(866,274 | ) | | | $25,018 | | | | $(647,487 | ) |
The following table presents, by major type of derivative contract, the change in unrealized appreciation (depreciation) on derivatives held by the fund for the six months ended August 31, 2013 as reported in the Statement of Operations:
| | | | | | | | | | | | |
| Risk | | Swap
Agreements | | | Translation
of Assets
and
Liabilities in
Foreign
Currencies | | | Investments
(Purchased
Options) | |
| Foreign Exchange | | | $— | | | | $(9,071 | ) | | | $— | |
| Equity | | | — | | | | — | | | | 1,265,189 | |
| Credit | | | (344,017 | ) | | | — | | | | — | |
| Total | | | $(344,017 | ) | | | $(9,071 | ) | | | $1,265,189 | |
Derivative counterparty credit risk is managed through formal evaluation of the creditworthiness of all potential counterparties. On certain, but not all, over-the-counter derivatives, the fund attempts to reduce its exposure to counterparty credit risk whenever possible by entering into an International Swaps and Derivatives Association (ISDA) Master Agreement on a bilateral basis with each of the counterparties with whom it undertakes a significant volume of transactions. The ISDA Master Agreement gives each party to the agreement the right to terminate all transactions traded under such agreement if there is a certain deterioration in the credit quality of the other party. Upon an event of default or a termination of the ISDA Master Agreement, the non-defaulting party has the right to close out all transactions traded under such agreement and to net amounts owed under each transaction to one net amount payable by one party to the other. This right to close out and net payments across all transactions traded under the ISDA Master Agreement could result in a reduction of the fund’s credit risk to such counterparty equal to any amounts payable by the fund under the applicable transactions, if any.
Collateral and margin requirements differ by type of derivative. Margin requirements are set by the broker or clearing house for cleared derivatives (i.e., futures contracts, cleared swaps, and exchange-traded options) while collateral terms are contract specific for over-the-counter traded derivatives (i.e., forward foreign currency exchange contracts, uncleared swap agreements, and over-the-counter options). For derivatives traded under an ISDA Master Agreement, the collateral requirements are netted across all transactions traded under such agreement and one amount is posted from one party to the other to collateralize such obligations. Cash that has been segregated to
41
Notes to Financial Statements (unaudited) – continued
cover the fund’s collateral or margin obligations under derivative contracts, if any, will be reported separately in the Statement of Assets and Liabilities as “Restricted cash”. Securities pledged as collateral or margin for the same purpose, if any, is noted in the Portfolio of Investments.
The fund’s accounting policy with respect to balance sheet offsetting is that, absent an event of default by the counterparty or a termination of the agreement, the ISDA Master Agreement does not result in an offset of reported amounts of financial assets and financial liabilities in the Statement of Assets and Liabilities across transactions between the fund and the applicable counterparty.
Purchased Options – The fund purchased call and put options for a premium. Purchased call and put options entitle the holder to buy and sell a specified number of shares or units of a particular security, currency or index at a specified price at a specified date or within a specified period of time. Purchasing call options may hedge against an anticipated increase in the dollar cost of securities or currency to be acquired or increase the fund’s exposure to an underlying instrument. Purchasing put options may hedge against an anticipated decline in the value of portfolio securities or currency or decrease the fund’s exposure to an underlying instrument.
The premium paid is initially recorded as an investment in the Statement of Assets and Liabilities. That investment is subsequently marked-to-market daily with the difference between the premium paid and the market value of the purchased option being recorded as unrealized appreciation or depreciation. Premiums paid for purchased call and put options which have expired are treated as realized losses on investments in the Statement of Operations. Upon the exercise or closing of a purchased call option, the premium paid is added to the cost of the security or financial instrument purchased. Upon the exercise or closing of a purchased put option, the premium paid is offset against the proceeds on the sale of the underlying security or financial instrument in order to determine the realized gain or loss on investments.
Whether or not the option is exercised, the fund’s maximum risk of loss from purchasing an option is the amount of premium paid. All option contracts involve credit risk if the counterparty to the option contract fails to perform. For over-the-counter options, this risk is mitigated in cases where there is an ISDA Master Agreement between the fund and the counterparty providing for netting as described above and for posting of collateral by the counterparty to the fund to cover the fund’s exposure to the counterparty under such ISDA Master Agreement.
Forward Foreign Currency Exchange Contracts – The fund entered into forward foreign currency exchange contracts for the purchase or sale of a specific foreign currency at a fixed price on a future date. These contracts may be used to hedge the fund’s currency risk or for non-hedging purposes. For hedging purposes, the fund may enter into contracts to deliver or receive foreign currency that the fund will receive from or use in its normal investment activities. The fund may also use contracts to hedge against declines in the value of foreign currency denominated securities due to unfavorable exchange rate movements. For non-hedging purposes, the fund may enter into contracts with the intent of changing the relative exposure of the fund’s portfolio of securities to different currencies to take advantage of anticipated exchange rate changes.
42
Notes to Financial Statements (unaudited) – continued
Forward foreign currency exchange contracts are adjusted by the daily exchange rate of the underlying currency and any unrealized gains or losses are recorded as a receivable or payable for forward foreign currency exchange contracts until the contract settlement date. On contract settlement date, any gain or loss on the contract is recorded as realized gains or losses on foreign currency.
Risks may arise upon entering into these contracts from unanticipated movements in the value of the contract and from the potential inability of counterparties to meet the terms of their contracts. Generally, the fund’s maximum risk due to counterparty credit risk is the unrealized gain on the contract due to the use of Continuous Linked Settlement, an industry accepted settlement system. This risk is mitigated in cases where there is an ISDA Master Agreement between the fund and the counterparty providing for netting as described above and for posting of collateral by the counterparty to the fund to cover the fund’s exposure to the counterparty under such ISDA Master Agreement.
Swap Agreements – During the period the fund entered into swap agreements. Effective June 10, 2013, certain types of swaps (“cleared swaps”) are required to be centrally cleared under provisions of the Dodd-Frank Regulatory Reform Bill. In a cleared swap transaction, the swap agreement is novated to a central counterparty (the “clearinghouse”) immediately following execution of the swap contract with an executing broker. Thereafter, throughout the term of the cleared swap, the fund interfaces indirectly with the clearinghouse through a clearing broker.
A swap agreement is generally an exchange of cash payments, at specified intervals or upon the occurrence of specified events, between the fund and a counterparty. The net cash payments exchanged are recorded as a realized gain or loss on swap agreements in the Statement of Operations. The value of the swap agreement, which is adjusted daily and includes any related interest accruals to be paid or received by the fund, is recorded in the Statement of Assets and Liabilities. The daily change in value, including any related interest accruals to be paid or received, is recorded as unrealized appreciation or depreciation on swap agreements in the Statement of Operations. The daily change in valuation of centrally cleared swaps is recorded as a receivable or payable for variation margin in the Statement of Assets and Liabilities. Amounts paid or received at the inception of the swap agreement are reflected as premiums paid or received in the Statement of Assets and Liabilities and are amortized using the effective interest method over the term of the agreement. A liquidation payment received or made upon early termination is recorded as a realized gain or loss on swap agreements in the Statement of Operations.
Risks related to swap agreements include the possible lack of a liquid market, unfavorable market and interest rate movements of the underlying instrument and the failure of the counterparty to perform under the terms of the agreements. To address counterparty risk, swap agreements are limited to only highly-rated counterparties. For uncleared swaps, that risk is further reduced by having an ISDA Master Agreement between the fund and the counterparty providing for netting as described above and by the posting of collateral by the counterparty to the fund to cover the fund’s exposure to the counterparty under such ISDA Master Agreement. Although not
43
Notes to Financial Statements (unaudited) – continued
covered by an ISDA Master Agreement, the fund’s counterparty risk due to cleared swaps is mitigated by the clearinghouses’ margining requirements and financial safeguards in the event of a clearing broker default.
The fund entered into credit default swap agreements in order to manage its exposure to the market or certain sectors of the market, to reduce its credit risk exposure to defaults of corporate and sovereign issuers or to create exposure to corporate or sovereign issuers to which it is not otherwise exposed. In a credit default swap agreement, the protection buyer can make an upfront payment and will make a stream of payments based on a fixed percentage applied to the agreement notional amount to the protection seller in exchange for the right to receive a specified return upon the occurrence of a defined credit event on the reference obligation (which may be either a single security or a basket of securities issued by corporate or sovereign issuers) and, with respect to the rare cases where physical settlement applies, the delivery by the buyer to the seller of a defined deliverable obligation. Although agreement-specific, credit events generally consist of a combination of the following: bankruptcy, failure to pay, restructuring, obligation acceleration, obligation default, or repudiation/moratorium, each as defined in the 2003 ISDA Credit Derivatives Definitions as amended by the relevant agreement. Restructuring is generally not applicable when the reference obligation is issued by a North American corporation and obligation acceleration, obligation default, or repudiation/moratorium are generally only applicable when the reference obligation is issued by a sovereign entity or an entity in an emerging country. Upon determination of the final price for the deliverable obligation (or upon delivery of the deliverable obligation in the case of physical settlement), the difference between the value of the deliverable obligation and the swap agreement’s notional amount is recorded as realized gain or loss on swap agreements in the Statement of Operations.
Credit default swap agreements are considered to have credit-risk-related contingent features since they trigger payment by the protection seller to the protection buyer upon the occurrence of a defined credit event. The aggregate fair value of credit default swap agreements in a net liability position as of August 31, 2013 is disclosed in the footnotes to the Portfolio of Investments. The maximum amount of future, undiscounted payments that the fund, as protection seller, could be required to make is equal to the swap agreement’s notional amount. The protection seller’s payment obligation would be offset to the extent of the value of the agreement’s deliverable obligation. If a defined credit event had occurred as of August 31, 2013, the swap agreement’s credit-risk-related contingent features would have been triggered and, for those swap agreements in a net liability position for which the fund is the protection seller, the fund in order to settle these swap agreements would have been required to either (1) pay the swap agreement’s notional value of $21,684,000 less the value of the agreements’ related deliverable obligations as decided through an auction or (2) pay the notional value of the swap agreements in return for physical receipt of the deliverable obligations.
The fund’s maximum risk of loss from counterparty risk, either as the protection seller or as the protection buyer, is the fair value of the agreement. For uncleared swaps, counterparty risk is reduced by having an ISDA Master Agreement between the fund and the counterparty providing for netting as described above and by the posting of
44
Notes to Financial Statements (unaudited) – continued
collateral by the counterparty to the fund to cover the fund’s exposure to the counterparty under such ISDA Master Agreement. For cleared swaps, the fund’s counterparty risk is mitigated by the clearinghouses’ margining requirements and financial safeguards in the event of a clearing broker default.
Security Loans – Under its Securities Lending Agency Agreement with the fund, JPMorgan Chase and Co. (“Chase”), as lending agent, loans the securities of the fund to certain qualified institutions (the “Borrowers”) approved by the fund. The loans are collateralized by cash and/or U.S. Treasury and federal agency obligations in an amount typically at least equal to the market value of the securities loaned. The market value of the loaned securities is determined at the close of business of the fund and any additional required collateral is delivered to the fund on the next business day. Chase provides the fund with indemnification against Borrower default. In the event of Borrower default, Chase will for the benefit of the fund either purchase securities identical to those loaned or, when such purchase is commercially impracticable, pay the fund the market value of the loaned securities. In return, Chase assumes the fund’s rights to the related collateral. If the collateral value is less than the cost to purchase identical securities, Chase is responsible for the shortfall, but only to the extent that such shortfall is not due to a decline in collateral value resulting from collateral reinvestment for which the fund bears the risk of loss. On loans collateralized by cash, the cash collateral is invested in repurchase agreements with approved counterparties. At period end, the fund had investment securities on loan with a fair value of $4,464,409 and a related liability of $4,772,314 for collateral received on securities loaned, both of which are presented gross on the Statement of Assets and Liabilities. A portion of the income generated upon investment of the collateral is remitted to the Borrowers, and the remainder is allocated between the fund and the lending agent. On loans collateralized by U.S. Treasury and/or federal agency obligations, a fee is received from the Borrower, and is allocated between the fund and the lending agent. Income from securities lending is included in “Interest” income in the Statement of Operations. The dividend and interest income earned on the securities loaned is accounted for in the same manner as other dividend and interest income.
Loans and Other Direct Debt Instruments – The fund invests in loans and loan participations or other receivables. These investments may include standby financing commitments, including revolving credit facilities, which obligate the fund to supply additional cash to the borrower on demand. Loan participations involve a risk of insolvency of the lending bank or other financial intermediary.
Indemnifications – Under the fund’s organizational documents, its officers and Trustees may be indemnified against certain liabilities and expenses arising out of the performance of their duties to the fund. Additionally, in the normal course of business, the fund enters into agreements with service providers that may contain indemnification clauses. The fund’s maximum exposure under these agreements is unknown as this would involve future claims that may be made against the fund that have not yet occurred.
Investment Transactions and Income – Investment transactions are recorded on the trade date. Interest income is recorded on the accrual basis. All premium and discount is amortized or accreted for financial statement purposes in accordance with U.S. generally accepted accounting principles. The fund earns certain fees in connection
45
Notes to Financial Statements (unaudited) – continued
with its floating rate loan purchasing activities. These fees are in addition to interest payments earned and may include amendment fees, commitment fees, facility fees, consent fees, and prepayment fees. Commitment fees are recorded on an accrual basis as income in the accompanying financial statements. Dividends received in cash are recorded on the ex-dividend date. Certain dividends from foreign securities will be recorded when the fund is informed of the dividend if such information is obtained subsequent to the ex-dividend date. Dividend and interest payments received in additional securities are recorded on the ex-dividend or ex-interest date in an amount equal to the value of the security on such date.
The fund may receive proceeds from litigation settlements. Any proceeds received from litigation involving portfolio holdings are reflected in the Statement of Operations in realized gain/loss if the security has been disposed of by the fund or in unrealized gain/loss if the security is still held by the fund. Any other proceeds from litigation not related to portfolio holdings are reflected as other income in the Statement of Operations.
The fund purchased or sold debt securities on a when-issued or delayed delivery basis, or in a “To Be Announced” (TBA) or “forward commitment” transaction with delivery or payment to occur at a later date beyond the normal settlement period. TBA securities resulting from these transactions are included in the Portfolio of Investments. At the time a fund enters into a commitment to purchase or sell a security, the transaction is recorded and the value of the security acquired is reflected in the fund’s net asset value. The price of such security and the date that the security will be delivered and paid for are fixed at the time the transaction is negotiated. The value of the security may vary with market fluctuations. TBA purchase commitments are held at carrying amount, which approximates fair value and are categorized as level 2 within the fair value hierarchy disclosure. No interest accrues to the fund until payment takes place. At the time that a fund enters into this type of transaction, the fund is required to have sufficient cash and/or liquid securities to cover its commitments. Losses may arise due to changes in the value of the underlying securities or if the counterparty does not perform under the contract’s terms, or if the issuer does not issue the securities due to political, economic or other factors. Additionally, losses may arise due to declines in the value of the securities prior to settlement date.
Fees Paid Indirectly – The fund’s custody fee may be reduced according to an arrangement that measures the value of cash deposited with the custodian by the fund. This amount, for the six months ended August 31, 2013, is shown as a reduction of total expenses in the Statement of Operations.
Tax Matters and Distributions – The fund intends to qualify as a regulated investment company, as defined under Subchapter M of the Internal Revenue Code, and to distribute all of its taxable income, including realized capital gains. As a result, no provision for federal income tax is required. The fund’s federal tax returns, when filed, will remain subject to examination by the Internal Revenue Service for a three year period.
Distributions to shareholders are recorded on the ex-dividend date. Income and capital gain distributions are determined in accordance with income tax regulations, which may differ from U.S. generally accepted accounting principles. Certain capital accounts
46
Notes to Financial Statements (unaudited) – continued
in the financial statements are periodically adjusted for permanent differences in order to reflect their tax character. These adjustments have no impact on net assets or net asset value per share. Temporary differences which arise from recognizing certain items of income, expense, gain or loss in different periods for financial statement and tax purposes will reverse at some time in the future. Distributions in excess of net investment income or net realized gains are temporary overdistributions for financial statement purposes resulting from differences in the recognition or classification of income or distributions for financial statement and tax purposes.
Book/tax differences primarily relate amortization and accretion of debt securities, wash sale loss deferrals and treating a portion of the proceeds from redemptions as a distribution for tax purposes.
The tax character of distributions made during the current period will be determined at fiscal year end. The tax character of distributions declared to shareholders for the last fiscal year is as follows:
| | | | |
| | | 2/28/13 | |
Ordinary income (including any
short-term capital gains) | | | $34,119,558 | |
| Long-term capital gains | | | 1,043,035 | |
| Total distributions | | | $35,162,593 | |
The federal tax cost and the tax basis components of distributable earnings were as follows:
| | | | |
| As of 8/31/13 | | | |
| Cost of investments | | | $1,923,912,126 | |
| Gross appreciation | | | 66,850,699 | |
| Gross depreciation | | | (37,970,048 | ) |
| Net unrealized appreciation (depreciation) | | | $28,880,651 | |
| |
| As of 2/28/13 | | | |
| Undistributed ordinary income | | | 1,318,305 | |
| Undistributed long-term capital gain | | | 4,199,580 | |
| Other temporary differences | | | (3,551,635 | ) |
| Net unrealized appreciation (depreciation) | | | 91,755,015 | |
The aggregate cost above includes prior fiscal year end tax adjustments, if applicable.
Multiple Classes of Shares of Beneficial Interest – The fund offers multiple classes of shares, which differ in their respective distribution and service fees. The fund’s income and common expenses are allocated to shareholders based on the value of settled shares outstanding of each class. The fund’s realized and unrealized gain (loss) are allocated to shareholders based on the daily net assets of each class. Dividends are declared separately for each class. Differences in per share dividend rates are generally
47
Notes to Financial Statements (unaudited) – continued
due to differences in separate class expenses. The fund’s distributions declared to shareholders as reported in the Statements of Changes in Net Assets are presented by class as follows:
| | | | | | | | | | | | | | | | |
| | | From net investment
income | | | From net realized gain
on investments | |
| | | Six months
ended
8/31/13 | | | Year
ended
2/28/13 (i) | | | Six months
ended
8/31/13 | | | Year
ended
2/28/13 (i) | |
| Class A | | | $13,113,327 | | | | $19,218,114 | | | | $2,179,994 | | | | $541,503 | |
| Class C | | | 5,642,601 | | | | 8,439,963 | | | | 1,262,029 | | | | 319,214 | |
| Class I | | | 5,114,636 | | | | 6,376,885 | | | | 789,363 | | | | 179,492 | |
| Class R1 | | | 5,018 | | | | 4,540 | | | | 923 | | | | 123 | |
| Class R2 | | | 9,840 | | | | 13,081 | | | | 1,725 | | | | 562 | |
| Class R3 | | | 47,219 | | | | 27,427 | | | | 6,998 | | | | 1,315 | |
| Class R4 | | | 25,907 | | | | 26,771 | | | | 3,857 | | | | 743 | |
| Class R5 | | | 25,689 | | | | 12,777 | | | | 3,574 | | | | 83 | |
| Total | | | $23,984,237 | | | | $34,119,558 | | | | $4,248,463 | | | | $1,043,035 | |
| (i) | For Class R5, the period is from inception, July 2, 2012, through the stated period end. |
(3) Transactions with Affiliates
Investment Adviser – The fund has an investment advisory agreement with MFS to provide overall investment management and related administrative services and facilities to the fund.
The management fee is computed daily and paid monthly at an annual rate of 0.65% of the fund’s average daily net assets. Effective August 1, 2013, the investment adviser has agreed in writing to reduce its management fee to 0.60% of average daily net assets in excess of $1.5 billion up to $2.5 billion, and 0.55% of average daily net assets in excess of $2.5 billion. This written agreement will continue until modified by the fund’s Board of Trustees, but such agreement will continue at least until June 30, 2015. For the period August 1, 2013 through August 31, 2013, this management fee reduction amounted to $17,361, which is shown as a reduction of total expenses in the Statement of Operations. Effective April 1, 2013, MFS has agreed in writing to reduce its management fee by a specified amount if certain MFS mutual fund assets exceed thresholds agreed to by MFS and the fund’s Board of Trustees. For the period April 1, 2013 through August 31, 2013, this management fee reduction amounted to $4,130, which is shown as a reduction of total expenses in the Statement of Operations. The management fee incurred for the six months ended August 31, 2013 was equivalent to an annual effective rate of 0.65% of the fund’s average daily net assets.
The investment adviser has agreed in writing to pay a portion of the fund’s total annual operating expenses, exclusive of interest, taxes, extraordinary expenses, brokerage and transaction costs, and investment-related expenses (including fees and expenses associated with investments in investment companies and other similar investment vehicles), such that total fund operating expenses do not exceed the following rates annually of each class’s average daily net assets:
| | | | | | | | | | | | | | | | | | | | | | | | | | | | | | |
| Class A | | | Class C | | | Class I | | | Class R1 | | | Class R2 | | | Class R3 | | | Class R4 | | | Class R5 | |
| | 1.10% | | | | 1.85 | % | | | 0.85 | % | | | 1.85 | % | | | 1.35 | % | | | 1.10 | % | | | 0.85 | % | | | 0.79 | % |
48
Notes to Financial Statements (unaudited) – continued
This written agreement will continue until modified by the fund’s Board of Trustees, but such agreement will continue at least until June 30, 2015. For the six months ended August 31, 2013, the fund’s actual operating expenses did not exceed the limit and therefore, the investment adviser did not pay any portion of the fund’s expenses related to this agreement.
Distributor – MFS Fund Distributors, Inc. (MFD), a wholly-owned subsidiary of MFS, as distributor, received $856,491 for the six months ended August 31, 2013, as its portion of the initial sales charge on sales of Class A shares of the fund.
The Board of Trustees has adopted a distribution plan for certain class shares pursuant to Rule 12b-1 of the Investment Company Act of 1940.
The fund’s distribution plan provides that the fund will pay MFD for services provided by MFD and financial intermediaries in connection with the distribution and servicing of certain share classes. One component of the plan is a distribution fee paid to MFD and another component of the plan is a service fee paid to MFD. MFD may subsequently pay all, or a portion, of the distribution and/or service fees to financial intermediaries.
Distribution Plan Fee Table:
| | | | | | | | | | | | | | | | | | | | |
| | | Distribution
Fee Rate (d) | | | Service
Fee Rate (d) | | | Total
Distribution
Plan (d) | | | Annual
Effective
Rate (e) | | | Distribution
and Service
Fee | |
| Class A | | | — | | | | 0.25% | | | | 0.25% | | | | 0.25% | | | | $1,153,824 | |
| Class C | | | 0.75% | | | | 0.25% | | | | 1.00% | | | | 1.00% | | | | 2,693,117 | |
| Class R1 | | | 0.75% | | | | 0.25% | | | | 1.00% | | | | 1.00% | | | | 2,397 | |
| Class R2 | | | 0.25% | | | | 0.25% | | | | 0.50% | | | | 0.50% | | | | 1,894 | |
| Class R3 | | | — | | | | 0.25% | | | | 0.25% | | | | 0.25% | | | | 4,152 | |
| Total Distribution and Service Fees | | | | $3,855,384 | |
| (d) | In accordance with the distribution plan for certain classes, the fund pays distribution and/or service fees equal to these annual percentage rates of each class’s average daily net assets. The distribution and service fee rates disclosed by class represent the current rates in effect at the end of the reporting period. |
| (e) | The annual effective rates represent actual fees incurred under the distribution plan for the six months ended August 31, 2013 based on each class’s average daily net assets. MFD has voluntarily agreed to rebate a portion of each class’s 0.25% service fee attributable to accounts for which MFD retains the 0.25% service fee except for accounts attributable to MFS or its subsidiaries’ seed money. For the six months ended August 31, 2013, this rebate amounted to $2,783 and $121 for Class A and Class C, respectively, and is reflected as a reduction of total expenses in the Statement of Operations. |
Certain Class A shares are subject to a contingent deferred sales charge (CDSC) in the event of a shareholder redemption within 18 months of purchase for shares purchased on or after August 1, 2012, and within 24 months of purchase for shares purchased prior to August 1, 2012. Class C shares are subject to a CDSC in the event of a shareholder redemption within 12 months of purchase. All contingent deferred sales charges are paid to MFD and during the six months ended August 31, 2013, were as follows:
| | | | |
| | | Amount | |
| Class A | | | $9,044 | |
| Class C | | | 59,910 | |
49
Notes to Financial Statements (unaudited) – continued
Shareholder Servicing Agent – MFS Service Center, Inc. (MFSC), a wholly-owned subsidiary of MFS, receives a fee from the fund for its services as shareholder servicing agent calculated as a percentage of the average daily net assets of the fund as determined periodically under the supervision of the fund’s Board of Trustees. For the six months ended August 31, 2013, the fee was $101,348, which equated to 0.0113% annually of the fund’s average daily net assets. MFSC also receives payment from the fund for out-of-pocket expenses, sub-accounting and other shareholder servicing costs which may be paid to affiliated and unaffiliated service providers. Class R5 shares do not incur sub-accounting fees. For the six months ended August 31, 2013, these out-of-pocket expenses, sub-accounting and other shareholder servicing costs amounted to $675,082.
Administrator – MFS provides certain financial, legal, shareholder communications, compliance, and other administrative services to the fund. Under an administrative services agreement, the fund partially reimburses MFS the costs incurred to provide these services. The fund is charged an annual fixed amount of $17,500 plus a fee based on average daily net assets. The administrative services fee incurred for the six months ended August 31, 2013 was equivalent to an annual effective rate of 0.0130% of the fund’s average daily net assets.
Trustees’ and Officers’ Compensation – The fund pays compensation to independent Trustees in the form of a retainer, attendance fees, and additional compensation to Board and Committee chairpersons. The fund does not pay compensation directly to Trustees or officers of the fund who are also officers of the investment adviser, all of whom receive remuneration for their services to the fund from MFS. Certain officers and Trustees of the fund are officers or directors of MFS, MFD, and MFSC.
Other – This fund and certain other funds managed by MFS (the funds) have entered into services agreements (the Agreements) which provide for payment of fees by the funds to Tarantino LLC and Griffin Compliance LLC in return for the provision of services of an Independent Chief Compliance Officer (ICCO) and Assistant ICCO, respectively, for the funds. The ICCO and Assistant ICCO are officers of the funds and the sole members of Tarantino LLC and Griffin Compliance LLC, respectively. The funds can terminate the Agreements with Tarantino LLC and Griffin Compliance LLC at any time under the terms of the Agreements. For the six months ended August 31, 2013, the aggregate fees paid by the fund to Tarantino LLC and Griffin Compliance LLC were $6,244 and are included in “Miscellaneous” expense in the Statement of Operations. MFS has agreed to reimburse the fund for a portion of the payments made by the fund in the amount of $3,167, which is shown as a reduction of total expenses in the Statement of Operations. Additionally, MFS has agreed to bear all expenses associated with office space, other administrative support, and supplies provided to the ICCO and Assistant ICCO.
The fund invests in the MFS Institutional Money Market Portfolio which is managed by MFS and seeks current income consistent with preservation of capital and liquidity. Income earned on this investment is included in “Dividends from underlying affiliated funds” in the Statement of Operations. This money market fund does not pay a management fee to MFS.
50
Notes to Financial Statements (unaudited) – continued
The fund invests in the MFS High Yield Pooled Portfolio (the “High Yield Pooled Portfolio”). MFS Pooled Portfolios are mutual funds advised by MFS that do not pay management fees to MFS but do incur investment and operating costs. MFS Pooled Portfolios are designed to be used by MFS funds to invest in a particular security type rather than invest in the security type directly. The fund invests in the High Yield Pooled Portfolio to gain exposure to high income debt instruments, rather than investing in high income debt instruments directly.
At close of business on March 22, 2013, the fund and certain other MFS funds transferred high income debt instruments, accrued interest and cash to the High Yield Pooled Portfolio, a series of MFS Series Trust III, in exchange for shares of the High Yield Pooled Portfolio. The purpose of the transaction was to pool the portion of the assets of the fund and certain other MFS funds invested in high income debt instruments in the High Yield Pooled Portfolio. The transfer was accomplished by a tax-free exchange by the fund of investments valued at approximately $330,270,781 with a cost basis of approximately $336,367,600, accrued interest of approximately $6,096,819 and cash of approximately $17,836,705 for approximately 35,420,430 shares of the High Yield Pooled Portfolio (valued at approximately $354,204,304). For financial reporting purposes, investments transferred and shares received by the fund were recorded at fair value; however, the cost basis of the investments delivered to the High Yield Pooled Portfolio was carried forward to the shares received. Income earned on this investment is included in “Dividends from underlying affiliated funds” in the Statement of Operations. The High Yield Pooled Portfolio does not charge a management fee, distribution and/or service fee, or sales charge.
(4) Portfolio Securities
Purchases and sales of investments, other than purchased option transactions, and short-term obligations, were as follows:
| | | | | | | | |
| | | Purchases | | | Sales | |
| U.S. Government securities | | | $422,211,824 | | | | $334,728,242 | |
| Investments (non-U.S. Government securities) | | | $631,039,972 | | | | $315,717,292 | |
51
Notes to Financial Statements (unaudited) – continued
(5) Shares of Beneficial Interest
The fund’s Declaration of Trust permits the Trustees to issue an unlimited number of full and fractional shares of beneficial interest. Transactions in fund shares were as follows:
| | | | | | | | | | | | | | | | |
| | | Six months ended
8/31/13 | | | Year ended
2/28/13 (i) | |
| | | Shares | | | Amount | | | Shares | | | Amount | |
| Shares sold | | | | | | | | | | | | | | | | |
Class A | | | 24,064,022 | | | | $288,373,259 | | | | 39,010,733 | | | | $445,021,889 | |
Class C | | | 12,603,666 | | | | 151,123,172 | | | | 20,912,199 | | | | 238,437,602 | |
Class I | | | 11,434,337 | | | | 137,197,453 | | | | 18,750,518 | | | | 214,021,509 | |
Class R1 | | | 22,601 | | | | 269,343 | | | | 18,494 | | | | 215,264 | |
Class R2 | | | 20,847 | | | | 247,414 | | | | 49,668 | | | | 564,782 | |
Class R3 | | | 120,054 | | | | 1,425,496 | | | | 256,335 | | | | 2,952,073 | |
Class R4 | | | 159,693 | | | | 1,914,636 | | | | 76,267 | | | | 861,319 | |
Class R5 | | | 35,558 | | | | 424,208 | | | | 167,077 | | | | 1,921,929 | |
| | | 48,460,778 | | | | $580,974,981 | | | | 79,241,291 | | | | $903,996,367 | |
| | | | |
| Shares issued to shareholders in reinvestment of distributions | | | | | | | | | | | | | | | | |
Class A | | | 1,193,887 | | | | $14,231,699 | | | | 1,563,324 | | | | $17,887,514 | |
Class C | | | 441,823 | | | | 5,266,355 | | | | 563,309 | | | | 6,443,965 | |
Class I | | | 311,754 | | | | 3,716,316 | | | | 357,156 | | | | 4,093,307 | |
Class R1 | | | 499 | | | | 5,933 | | | | 407 | | | | 4,663 | |
Class R2 | | | 971 | | | | 11,565 | | | | 1,189 | | | | 13,643 | |
Class R3 | | | 4,548 | | | | 54,202 | | | | 2,469 | | | | 28,633 | |
Class R4 | | | 2,497 | | | | 29,759 | | | | 2,335 | | | | 26,783 | |
Class R5 | | | 2,455 | | | | 29,263 | | | | 1,097 | | | | 12,854 | |
| | | 1,958,434 | | | | $23,345,092 | | | | 2,491,286 | | | | $28,511,362 | |
| | | | |
| Shares reacquired | | | | | | | | | | | | | | | | |
Class A | | | (8,921,856 | ) | | | $(106,335,433 | ) | | | (13,592,609 | ) | | | $(154,248,250 | ) |
Class C | | | (3,377,173 | ) | | | (40,323,703 | ) | | | (3,590,428 | ) | | | (40,947,374 | ) |
Class I | | | (5,378,810 | ) | | | (64,010,990 | ) | | | (4,105,545 | ) | | | (46,987,667 | ) |
Class R1 | | | (773 | ) | | | (9,379 | ) | | | (2 | ) | | | (26 | ) |
Class R2 | | | (7,148 | ) | | | (84,967 | ) | | | (10,691 | ) | | | (123,251 | ) |
Class R3 | | | (48,386 | ) | | | (575,250 | ) | | | (40,264 | ) | | | (465,152 | ) |
Class R4 | | | (85,763 | ) | | | (1,030,062 | ) | | | (29,968 | ) | | | (335,648 | ) |
Class R5 | | | (7,680 | ) | | | (93,204 | ) | | | (50,373 | ) | | | (592,076 | ) |
| | | (17,827,589 | ) | | | $(212,462,988 | ) | | | (21,419,880 | ) | | | $(243,699,444 | ) |
52
Notes to Financial Statements (unaudited) – continued
| | | | | | | | | | | | | | | | |
| | | Six months ended
8/31/13 | | | Year ended
2/28/13 (i) | |
| | | Shares | | | Amount | | | Shares | | | Amount | |
| Net change | | | | | | | | | | | | | | | | |
Class A | | | 16,336,053 | | | | $196,269,525 | | | | 26,981,448 | | | | $308,661,153 | |
Class C | | | 9,668,316 | | | | 116,065,824 | | | | 17,885,080 | | | | 203,934,193 | |
Class I | | | 6,367,281 | | | | 76,902,779 | | | | 15,002,129 | | | | 171,127,149 | |
Class R1 | | | 22,327 | | | | 265,897 | | | | 18,899 | | | | 219,901 | |
Class R2 | | | 14,670 | | | | 174,012 | | | | 40,166 | | | | 455,174 | |
Class R3 | | | 76,216 | | | | 904,448 | | | | 218,540 | | | | 2,515,554 | |
Class R4 | | | 76,427 | | | | 914,333 | | | | 48,634 | | | | 552,454 | |
Class R5 | | | 30,333 | | | | 360,267 | | | | 117,801 | | | | 1,342,707 | |
| | | 32,591,623 | | | | $391,857,085 | | | | 60,312,697 | | | | $688,808,285 | |
| (i) | For Class R5, the period is from inception, July 2, 2012, through the stated period end. |
(6) Line of Credit
The fund and certain other funds managed by MFS participate in a $1.1 billion unsecured committed line of credit, subject to a $1 billion sublimit, provided by a syndication of banks under a credit agreement. Borrowings may be made for temporary financing needs. Interest is charged to each fund, based on its borrowings, generally at a rate equal to the higher of the Federal Reserve funds rate or one month LIBOR plus an agreed upon spread. A commitment fee, based on the average daily, unused portion of the committed line of credit, is allocated among the participating funds at the end of each calendar quarter. In addition, the fund and other funds managed by MFS have established unsecured uncommitted borrowing arrangements with certain banks for temporary financing needs. Interest is charged to each fund, based on its borrowings, at a rate equal to the Federal Reserve funds rate plus an agreed upon spread. For the six months ended August 31, 2013, the fund’s commitment fee and interest expense were $3,809 and $0, respectively, and are included in “Miscellaneous” expense in the Statement of Operations.
(7) Transactions in Underlying Affiliated Funds-Affiliated Issuers
An affiliated issuer may be considered one in which the fund owns 5% or more of the outstanding voting securities, or a company which is under common control. For the purposes of this report, the fund assumes the following to be affiliated issuers:
| | | | | | | | | | | | | | | | |
| Underlying Affiliated Funds | | Beginning
Shares/Par
Amount | | | Acquisitions
Shares/Par Amount | | | Dispositions
Shares/Par
Amount | | | Ending
Shares/Par
Amount | |
| MFS High Yield Pooled Portfolio | | | — | | | | 50,558,619 | | | | (279,065 | ) | | | 50,279,554 | |
MFS Institutional Money
Market Portfolio | | | 154,459,260 | | | | 246,894,855 | | | | (297,079,470 | ) | | | 104,274,645 | |
| | | | |
| Underlying Affiliated Funds | | Realized
Gain (Loss) | | | Capital Gain
Distributions | | | Dividend
Income | | | Ending
Value | |
| MFS High Yield Pooled Portfolio | | | $(837,198 | ) | | | $— | | | | $12,717,749 | | | | $488,214,471 | |
MFS Institutional Money
Market Portfolio | | | — | | | | — | | | | 79,694 | | | | 104,274,645 | |
| | | $(837,198 | ) | | | $— | | | | $12,797,443 | | | | $592,489,116 | |
53
BOARD REVIEW OF INVESTMENT ADVISORY AGREEMENT
The Investment Company Act of 1940 requires that both the full Board of Trustees and a majority of the non-interested (“independent”) Trustees, voting separately, annually approve the continuation of the Fund’s investment advisory agreement with MFS. The Trustees consider matters bearing on the Fund and its advisory arrangements at their meetings throughout the year, including a review of performance data at each regular meeting. In addition, the independent Trustees met several times over the course of three months beginning in May and ending in July, 2013 (“contract review meetings”) for the specific purpose of considering whether to approve the continuation of the investment advisory agreement for the Fund and the other investment companies that the Board oversees (the “MFS Funds”). The independent Trustees were assisted in their evaluation of the Fund’s investment advisory agreement by independent legal counsel, from whom they received separate legal advice and with whom they met separately from MFS during various contract review meetings. The independent Trustees were also assisted in this process by the MFS Funds’ Independent Chief Compliance Officer, a full-time senior officer appointed by and reporting to the independent Trustees.
Effective May 1, 2011, the Board of Trustees terminated the Fund’s sub-advisory investment agreement among MFS Series Trust XIII, on behalf of the Fund, MFS and Sun Capital Advisers LLC (“Sun Capital”) and MFS assumed responsibility for day-to-day management of the Fund. The Sun Capital portfolio manager who was responsible for the day-to-day management of the Fund became an employee of MFS on or about May 1, 2011 and continues to manage the Fund.
In connection with their deliberations regarding the continuation of the investment advisory agreement, the Trustees, including the independent Trustees, considered such information and factors as they believed, in light of the legal advice furnished to them and their own business judgment, to be relevant. The investment advisory agreement for the Fund was considered separately, although the Trustees also took into account the common interests of all MFS Funds in their review. As described below, the Trustees considered the nature, quality, and extent of the various investment advisory, administrative, and shareholder services performed by MFS under the existing investment advisory agreement and other arrangements with the Fund.
In connection with their contract review meetings, the Trustees received and relied upon materials that included, among other items: (i) information provided by Lipper Inc., an independent third party, on the investment performance of the Fund for various time periods ended December 31, 2012 and the investment performance of a group of funds with substantially similar investment classifications/objectives (the “Lipper performance universe”), (ii) information provided by Lipper Inc. on the Fund’s advisory fees and other expenses and the advisory fees and other expenses of comparable funds identified by Lipper Inc. (the “Lipper expense group”), (iii) information provided by MFS on the advisory fees of comparable portfolios of other clients of MFS, including institutional separate accounts and other clients, (iv) information as to whether and to what extent applicable expense waivers, reimbursements or fee “breakpoints” are observed for the Fund, (v) information regarding MFS’ financial results and financial condition, including MFS’ and certain of its affiliates’ estimated profitability from services performed for the Fund and the MFS
54
Board Review of Investment Advisory Agreement – continued
Funds as a whole, and compared to MFS’ institutional business, (vi) MFS’ views regarding the outlook for the mutual fund industry and the strategic business plans of MFS, (vii) descriptions of various functions performed by MFS for the Funds, such as compliance monitoring and portfolio trading practices, and (viii) information regarding the overall organization of MFS, including information about MFS’ senior management and other personnel providing investment advisory, administrative and other services to the Fund and the other MFS Funds. The comparative performance, fee and expense information prepared and provided by Lipper Inc. was not independently verified and the independent Trustees did not independently verify any information provided to them by MFS.
The Trustees’ conclusion as to the continuation of the investment advisory agreement was based on a comprehensive consideration of all information provided to the Trustees and not the result of any single factor. Some of the factors that figured particularly in the Trustees’ deliberations are described below, although individual Trustees may have evaluated the information presented differently from one another, giving different weights to various factors. It is also important to recognize that the fee arrangements for the Fund and other MFS Funds are the result of years of review and discussion between the independent Trustees and MFS, that certain aspects of such arrangements may receive greater scrutiny in some years than in others, and that the Trustees’ conclusions may be based, in part, on their consideration of these same arrangements during the course of the year and in prior years.
Based on information provided by Lipper Inc. and MFS, the Trustees reviewed the Fund’s total return investment performance as well as the performance of peer groups of funds over various time periods. The Trustees placed particular emphasis on the total return performance of the Fund’s Class A shares in comparison to the performance of funds in its Lipper performance universe over the three-year period ended December 31, 2012, which the Trustees believed was a long enough period to reflect differing market conditions. The total return performance of the Fund’s Class A shares was in the 1st quintile relative to the other funds in the universe for this three-year period (the 1st quintile being the best performers and the 5th quintile being the worst performers). The total return performance of the Fund’s Class A shares was in the 1st quintile for each of the one- and five-year periods ended December 31, 2012 relative to the Lipper performance universe. Because of the passage of time, these performance results may differ from the performance results for more recent periods, including those shown elsewhere in this report.
In the course of their deliberations, the Trustees took into account information provided by MFS in connection with the contract review meetings, as well as during investment review meetings conducted with portfolio management personnel during the course of the year regarding the Fund’s performance. After reviewing these and related factors, the Trustees concluded, within the context of their overall conclusions regarding the investment advisory agreement, that they were satisfied with MFS’ responses and efforts relating to investment performance.
In assessing the reasonableness of the Fund’s advisory fee, the Trustees considered, among other information, the Fund’s advisory fee and the total expense ratio of the Fund’s Class A shares as a percentage of average daily net assets and the advisory fee and total expense ratios of peer groups of funds based on information provided by
55
Board Review of Investment Advisory Agreement – continued
Lipper Inc. The Trustees considered that MFS currently observes an expense limitation for the Fund, which may not be changed without the Trustees’ approval. The Trustees also considered that, according to the Lipper data (which takes into account any fee reductions or expense limitations that were in effect during the Fund’s last fiscal year), the Fund’s effective advisory fee rate was higher than the Lipper expense group median, and the Fund’s total expense ratio was approximately at the Lipper expense group median.
The Trustees also considered the advisory fees charged by MFS to any comparable institutional accounts. In comparing these fees, the Trustees considered information provided by MFS as to the generally broader scope of services provided by MFS to the Fund in comparison to institutional accounts, the higher demands placed on MFS’ investment personnel and trading infrastructure as a result of the daily cash in-flows and out-flows of the Fund, and the impact on MFS and expenses associated with the more extensive regulatory regime to which the Fund is subject in comparison to institutional accounts.
The Trustees also considered whether the Fund may benefit from any economies of scale in the management of the Fund in the event of growth in assets of the Fund and/or growth in assets of the MFS Funds as a whole. They noted that MFS has agreed in writing to reduce its advisory fee on the Fund’s average daily net assets over $1.5 billion and $2.5 billion, which may not be changed without the Trustees’ approval. The Trustees also noted that MFS has agreed in writing to waive a portion of the management fees of certain MFS Funds, including the Fund, if the total combined assets of certain funds within the MFS Funds’ complex increase above agreed upon thresholds (the “group fee waiver”), enabling the Fund’s shareholders to share in the benefits from any economies of scale at the complex level. The group fee waiver is reviewed and renewed annually between the Board and MFS. The Trustees concluded that the breakpoints and the group fee waiver were sufficient to allow the Fund to benefit from economies of scale as its assets and overall complex assets grow.
The Trustees also considered information prepared by MFS relating to MFS’ costs and profits with respect to the Fund, the MFS Funds considered as a group, and other investment companies and accounts advised by MFS, as well as MFS’ methodologies used to determine and allocate its costs to the MFS Funds, the Fund and other accounts and products for purposes of estimating profitability.
After reviewing these and other factors described herein, the Trustees concluded, within the context of their overall conclusions regarding the investment advisory agreement, that the advisory fees charged to the Fund represent reasonable compensation in light of the services being provided by MFS to the Fund.
In addition, the Trustees considered MFS’ resources and related efforts to continue to retain, attract and motivate capable personnel to serve the Fund. The Trustees also considered current and developing conditions in the financial services industry, including the presence of large and well-capitalized companies which are spending, and appear to be prepared to continue to spend, substantial sums to engage personnel and to provide services to competing investment companies. In this regard, the Trustees also considered the financial resources of MFS and its ultimate parent, Sun Life Financial Inc. The Trustees also considered the advantages and possible disadvantages to the Fund of having an adviser that also serves other investment companies as well as other accounts.
56
Board Review of Investment Advisory Agreement – continued
The Trustees also considered the nature, quality, cost, and extent of administrative, transfer agency, and distribution services provided to the Fund by MFS and its affiliates under agreements and plans other than the investment advisory agreement, including any 12b-1 fees the Fund pays to MFS Fund Distributors, Inc., an affiliate of MFS. The Trustees also considered the nature, extent and quality of certain other services MFS performs or arranges for on the Fund’s behalf, which may include securities lending programs, directed expense payment programs, class action recovery programs, and MFS’ interaction with third-party service providers, principally custodians and sub-custodians. The Trustees concluded that the various non-advisory services provided by MFS and its affiliates on behalf of the Fund were satisfactory.
The Trustees also considered benefits to MFS from the use of the Fund’s portfolio brokerage commissions, if applicable, to pay for investment research and various other factors. Additionally, the Trustees considered so-called “fall-out benefits” to MFS such as reputational value derived from serving as investment manager to the Fund.
Based on their evaluation of factors that they deemed to be material, including those factors described above, the Board of Trustees, including the independent Trustees, concluded that the Fund’s investment advisory agreement with MFS should be continued for an additional one-year period, commencing August 1, 2013.
A discussion regarding the Board’s most recent review and renewal of the fund’s Investment Advisory Agreement with MFS is available by clicking on the fund’s name under “Mutual Funds” in the “Products” section of the MFS Web site (mfs.com).
57
PROXY VOTING POLICIES AND INFORMATION
A general description of the MFS funds’ proxy voting policies and procedures is available without charge, upon request, by calling 1-800-225-2606, by visiting the Proxy Voting section of mfs.com or by visiting the SEC’s Web site at http://www.sec.gov.
Information regarding how the fund voted proxies relating to portfolio securities during the most recent twelve-month period ended June 30 is available without charge by visiting the Proxy Voting section of mfs.com or by visiting the SEC’s Web site at http://www.sec.gov.
QUARTERLY PORTFOLIO DISCLOSURE
The fund will file a complete schedule of portfolio holdings with the Securities and Exchange Commission (the Commission) for the first and third quarters of each fiscal year on Form N-Q. A shareholder can obtain the quarterly portfolio holdings report at mfs.com. The fund’s Form N-Q is also available on the EDGAR database on the Commission’s Internet Web site at http://www.sec.gov, and may be reviewed and copied at the:
Public Reference Room
Securities and Exchange Commission
100 F Street, NE, Room 1580
Washington, D.C. 20549
Information on the operation of the Public Reference Room may be obtained by calling the Commission at 1-800-SEC-0330. Copies of the fund’s Form N-Q also may be obtained, upon payment of a duplicating fee, by electronic request at the following e-mail address: publicinfo@sec.gov, or by writing the Public Reference Section at the above address.
FURTHER INFORMATION
From time to time, MFS may post important information about the fund or the MFS funds on the MFS web site (mfs.com). This information is available by visiting the “News & Commentary” section of mfs.com or by clicking on the fund’s name under “Mutual Funds” in the “Products” section of mfs.com.
PROVISION OF FINANCIAL REPORTS AND SUMMARY PROSPECTUSES
The fund produces financial reports every six months and updates its summary prospectus and prospectus annually. To avoid sending duplicate copies of materials to households, only one copy of the fund’s annual and semiannual report and summary prospectus may be mailed to shareholders having the same last name and residential address on the fund’s records. However, any shareholder may contact MFSC (please see back cover for address and telephone number) to request that copies of these reports and summary prospectuses be sent personally to that shareholder.
58
Save paper with eDelivery.

| MFS® will send you prospectuses, |
reports, and proxies directly via e-mail so you will get information faster with less mailbox clutter.
To sign up:
1. Go to mfs.com.
2. Log in via MFS® Access.
3. Select eDelivery.
If you own your MFS fund shares through a financial institution or a retirement plan, MFS® TALK, MFS® Access, or eDelivery may not be available to you.
CONTACT
WEB SITE
mfs.com
MFS TALK
1-800-637-8255
24 hours a day
ACCOUNT SERVICE AND LITERATURE
Shareholders
1-800-225-2606
Financial advisors
1-800-343-2829
Retirement plan services
1-800-637-1255
MAILING ADDRESS
MFS Service Center, Inc.
P.O. Box 55824
Boston, MA 02205-5824
OVERNIGHT MAIL
MFS Service Center, Inc.
c/o Boston Financial Data Services
30 Dan Road
Canton, MA 02021-2809
SEMIANNUAL REPORT
August 31, 2013

MFS® GOVERNMENT SECURITIES FUND

MFG-SEM
MFS® GOVERNMENT SECURITIES FUND
CONTENTS
The report is prepared for the general information of shareholders.
It is authorized for distribution to prospective investors only when preceded or accompanied by a current prospectus.
NOT FDIC INSURED Ÿ MAY LOSE VALUE Ÿ NO BANK GUARANTEE

LETTER FROM THE CHAIRMAN AND CEO
Dear Shareholders:
Global economic trends appear to favor growth again despite risks created by the U.S. government’s gridlock. The U.S. economy’s slow but steady expansion is no longer the
exception. The eurozone has emerged from its 18-month-long recession, with Germany leading the way. China’s monthly gauges of economic activity once again point toward expansion. And Japan is picking up momentum in response to its government’s and central bank’s aggressive program of monetary easing.
However, geopolitical risks have risen, with violence erupting in Egypt and Syria and the possibility of further unrest in the Middle East. The U.S. Federal Reserve’s expected tapering of its bond-buying stimulus program has weighed on global markets
since May. Emerging markets, including Brazil and India, have borne much of the brunt, as their currency values have dropped and nervous investors have fled to safety elsewhere. In Europe, unemployment persists at historically high levels. The trend towards a pickup in global growth, while encouraging, appears tenuous, particularly with the risk of a U.S. debt default.
As always, managing risk in the face of uncertainty remains a top priority for investors. At MFS®, our uniquely collaborative investment process employs integrated, global research and active risk management. Our global team of investment professionals shares ideas and evaluates opportunities across continents, investment disciplines and asset classes — all with a goal of building better insights, and ultimately better results, for our clients.
We are mindful of the many economic challenges investors face, and believe it is more important than ever to maintain a long-term view and employ time-tested principles, such as asset allocation and diversification. We remain confident that our unique approach can serve investors well as they work with their financial advisors to identify and pursue the most suitable opportunities.
Respectfully,

Robert J. Manning
Chairman and Chief Executive Officer
MFS Investment Management®
October 17, 2013
The opinions expressed in this letter are subject to change, may not be relied upon for investment advice, and no forecasts can be guaranteed.
1
PORTFOLIO COMPOSITION
Portfolio structure (i)
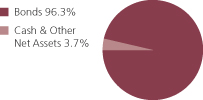
| | | | |
| Fixed income sectors (i) | | | | |
| Mortgage-Backed Securities | | | 52.6% | |
| U.S. Treasury Securities | | | 32.4% | |
| U.S. Government Agencies | | | 7.1% | |
| Commercial Mortgage-Backed Securities | | | 2.7% | |
| High Grade Corporates | | | 1.0% | |
| Municipal Bonds | | | 0.5% | |
| | | | |
| Composition including fixed income credit quality (a)(i) | |
| AAA | | | 1.1% | |
| AA | | | 1.1% | |
| A | | | 0.8% | |
| BBB | | | 1.2% | |
| U.S. Government | | | 32.4% | |
| Federal Agencies | | | 59.7% | |
| Cash & Other | | | 3.7% | |
| |
| Portfolio facts (i) | | | | |
| Average Duration (d) | | | 4.8 | |
| Average Effective Maturity (m) | | | 6.2 yrs. | |
| (a) | For all securities other than those specifically described below, ratings are assigned to underlying securities utilizing ratings from Moody’s, Fitch, and Standard & Poor’s rating agencies and applying the following hierarchy: If all three agencies provide a rating, the middle rating (after dropping the highest and lowest ratings) is assigned; if two of the three agencies rate a security, the lower of the two is assigned. Ratings are shown in the S&P and Fitch scale (e.g., AAA). Securities rated BBB or higher are considered investment grade. All ratings are subject to change. U.S. Government includes securities issued by the U.S. Department of the Treasury. Federal Agencies includes rated and unrated U.S. Agency fixed-income securities, U.S. Agency mortgage-backed securities, and collateralized mortgage obligations of U.S. Agency mortgage-backed securities. Cash & Other includes cash, other assets less liabilities, offsets to derivative positions, and short-term securities. The fund may not hold all of these instruments. The fund is not rated by these agencies. |
| (d) | Duration is a measure of how much a bond’s price is likely to fluctuate with general changes in interest rates, e.g., if rates rise 1.00%, a bond with a 5-year duration is likely to lose about 5.00% of its value due to the interest rate move. |
| (i) | For purposes of this presentation, the components include the market value of securities, and reflect the impact of the equivalent exposure of derivative positions, if any. These amounts may be negative from time to time. Equivalent exposure is a calculated amount that translates the derivative position into a reasonable approximation of the amount of the underlying asset that the portfolio would have to hold at a given point in time to have the same price sensitivity that results from the portfolio’s ownership of the derivative contract. When dealing with derivatives, equivalent exposure is a more representative measure of the potential impact of a position on portfolio performance than market value. The bond component will include any accrued interest amounts. |
2
Portfolio Composition – continued
| (m) | In determining an instrument’s effective maturity for purposes of calculating the fund’s dollar-weighted average effective maturity, MFS uses the instrument’s stated maturity or, if applicable, an earlier date on which MFS believes it is probable that a maturity-shortening device (such as a put, pre-refunding or prepayment) will cause the instrument to be repaid. Such an earlier date can be substantially shorter than the instrument’s stated maturity. |
Where the fund holds convertible bonds, these are treated as part of the equity portion of the portfolio.
Percentages are based on net assets as of 8/31/13.
The portfolio is actively managed and current holdings may be different.
3
EXPENSE TABLE
Fund expenses borne by the shareholders during the period, March 1, 2013 through August 31, 2013
As a shareholder of the fund, you incur two types of costs: (1) transaction costs, including sales charges (loads) on certain purchase or redemption payments, and (2) ongoing costs, including management fees; distribution and service (12b-1) fees; and other fund expenses. This example is intended to help you understand your ongoing costs (in dollars) of investing in the fund and to compare these costs with the ongoing costs of investing in other mutual funds.
The example is based on an investment of $1,000 invested at the beginning of the period and held for the entire period March 1, 2013 through August 31, 2013.
The expenses include the payment of a portion of the transfer-agent-related expenses of MFS funds that invest in the fund. For further information, please see the Notes to the Financial Statements.
Actual Expenses
The first line for each share class in the following table provides information about actual account values and actual expenses. You may use the information in this line, together with the amount you invested, to estimate the expenses that you paid over the period. Simply divide your account value by $1,000 (for example, an $8,600 account value divided by $1,000 = 8.6), then multiply the result by the number in the first line under the heading entitled “Expenses Paid During Period” to estimate the expenses you paid on your account during this period.
Hypothetical Example for Comparison Purposes
The second line for each share class in the following table provides information about hypothetical account values and hypothetical expenses based on the fund’s actual expense ratio and an assumed rate of return of 5% per year before expenses, which is not the fund’s actual return. The hypothetical account values and expenses may not be used to estimate the actual ending account balance or expenses you paid for the period. You may use this information to compare the ongoing costs of investing in the fund and other funds. To do so, compare this 5% hypothetical example with the 5% hypothetical examples that appear in the shareholder reports of the other funds.
Please note that the expenses shown in the table are meant to highlight your ongoing costs only and do not reflect any transactional costs, such as sales charges (loads). Therefore, the second line for each share class in the table is useful in comparing ongoing costs only, and will not help you determine the relative total costs of owning different funds. In addition, if these transactional costs were included, your costs would have been higher.
4
Expense Table – continued
| | | | | | | | | | | | | | | | | | |
Share
Class | | | | Annualized
Expense Ratio | | | Beginning
Account Value
3/01/13 | | | Ending Account Value
8/31/13 | | | Expenses Paid During
Period (p) 3/01/13-8/31/13 | |
| A | | Actual | | | 0.88% | | | | $1,000.00 | | | | $971.67 | | | | $4.37 | |
| | Hypothetical (h) | | | 0.88% | | | | $1,000.00 | | | | $1,020.77 | | | | $4.48 | |
| B | | Actual | | | 1.63% | | | | $1,000.00 | | | | $968.90 | | | | $8.09 | |
| | Hypothetical (h) | | | 1.63% | | | | $1,000.00 | | | | $1,016.99 | | | | $8.29 | |
| C | | Actual | | | 1.63% | | | | $1,000.00 | | | | $968.08 | | | | $8.09 | |
| | Hypothetical (h) | | | 1.63% | | | | $1,000.00 | | | | $1,016.99 | | | | $8.29 | |
| I | | Actual | | | 0.63% | | | | $1,000.00 | | | | $972.89 | | | | $3.13 | |
| | Hypothetical (h) | | | 0.63% | | | | $1,000.00 | | | | $1,022.03 | | | | $3.21 | |
| R1 | | Actual | | | 1.63% | | | | $1,000.00 | | | | $967.96 | | | | $8.09 | |
| | Hypothetical (h) | | | 1.63% | | | | $1,000.00 | | | | $1,016.99 | | | | $8.29 | |
| R2 | | Actual | | | 1.13% | | | | $1,000.00 | | | | $970.41 | | | | $5.61 | |
| | Hypothetical (h) | | | 1.13% | | | | $1,000.00 | | | | $1,019.51 | | | | $5.75 | |
| R3 | | Actual | | | 0.88% | | | | $1,000.00 | | | | $972.60 | | | | $4.38 | |
| | Hypothetical (h) | | | 0.88% | | | | $1,000.00 | | | | $1,020.77 | | | | $4.48 | |
| R4 | | Actual | | | 0.63% | | | | $1,000.00 | | | | $972.89 | | | | $3.13 | |
| | Hypothetical (h) | | | 0.63% | | | | $1,000.00 | | | | $1,022.03 | | | | $3.21 | |
| R5 | | Actual | | | 0.51% | | | | $1,000.00 | | | | $973.46 | | | | $2.54 | |
| | Hypothetical (h) | | | 0.51% | | | | $1,000.00 | | | | $1,022.63 | | | | $2.60 | |
| (h) | 5% class return per year before expenses. |
| (p) | Expenses paid are equal to each class’s annualized expense ratio, as shown above, multiplied by the average account value over the period, multiplied by the number of days in the period, divided by the number of days in the year. Expenses paid do not include any applicable sales charges (loads). If these transaction costs had been included, your costs would have been higher. |
Notes to Expense Table
Each class with a Rule 12b-1 service fee is subject to a rebate of a portion of such fee. Such rebates are included in the expense ratios above. For Class A shares, this rebate reduced the expense ratio above by 0.01%. See Note 3 in the Notes to Financial Statements for additional information.
5
PORTFOLIO OF INVESTMENTS
8/31/13 (unaudited)
The Portfolio of Investments is a complete list of all securities owned by your fund. It is categorized by broad-based asset classes.
| | | | | | | | |
| Bonds - 95.9% | | | | | | | | |
| Issuer | | Shares/Par | | | Value ($) | |
| Agency - Other - 4.6% | | | | | | | | |
| Financing Corp., 10.7%, 2017 | | $ | 14,360,000 | | | $ | 19,454,166 | |
| Financing Corp., 9.4%, 2018 | | | 11,750,000 | | | | 15,522,643 | |
| Financing Corp., 9.8%, 2018 | | | 14,975,000 | | | | 20,149,806 | |
| Financing Corp., 10.35%, 2018 | | | 15,165,000 | | | | 21,047,867 | |
| Financing Corp., STRIPS, 0%, 2017 | | | 18,780,000 | | | | 17,451,559 | |
| | | | | | | | |
| | | | $ | 93,626,041 | |
| Asset-Backed & Securitized - 2.7% | | | | | | | | |
| Citigroup/Deutsche Bank Commercial Mortgage Trust, 5.322%, 2049 | | $ | 4,260,000 | | | $ | 4,660,159 | |
| Commercial Mortgage Pass-Through Certificates, “A4”, 5.306%, 2046 | | | 9,314,763 | | | | 10,221,620 | |
| Credit Suisse Commercial Mortgage Trust, “A4”, FRN, 5.954%, 2039 | | | 5,869,762 | | | | 6,487,114 | |
| CWCapital Cobalt Ltd., “A4”, FRN, 5.966%, 2046 | | | 5,976,734 | | | | 6,664,100 | |
| Goldman Sachs Mortgage Securities Corp., FRN, 5.995%, 2045 | | | 9,064,670 | | | | 9,979,703 | |
| JPMorgan Chase Commercial Mortgage Securities Corp., “A3”, FRN, 6.124%, 2051 | | | 5,341,614 | | | | 5,531,872 | |
| JPMorgan Chase Commercial Mortgage Securities Corp., “A4”, FRN, 6.003%, 2049 | | | 9,239,502 | | | | 10,291,539 | |
| | | | | | | | |
| | | | $ | 53,836,107 | |
| Local Authorities - 1.0% | | | | | | | | |
| Catholic Health Initiatives, 2.95%, 2022 | | $ | 4,861,000 | | | $ | 4,476,846 | |
| Nashville & Davidson County, TN, Metropolitan Government Convention Center Authority (Build America Bonds), 6.731%, 2043 | | | 4,855,000 | | | | 5,405,654 | |
| Port Authority NY & NJ (168th Series), 4.926%, 2051 | | | 7,130,000 | | | | 6,695,712 | |
| San Francisco, CA, City & County Public Utilities Commission, Water Rev. (Build America Bonds), 6%, 2040 | | | 840,000 | | | | 919,556 | |
| University of California Rev. (Build America Bonds), 5.77%, 2043 | | | 2,750,000 | | | | 2,998,600 | |
| | | | | | | | |
| | | | $ | 20,496,368 | |
| Mortgage-Backed - 52.4% | | | | | | | | |
| Fannie Mae, 5.138%, 2013 | | $ | 438,392 | | | $ | 439,576 | |
| Fannie Mae, 4.61%, 2014 | | | 5,005,407 | | | | 5,008,920 | |
| Fannie Mae, 4.77%, 2014 | | | 1,387,266 | | | | 1,409,616 | |
| Fannie Mae, 4.783%, 2014 | | | 1,338,972 | | | | 1,351,543 | |
| Fannie Mae, 4.82%, 2014 - 2015 | | | 4,711,214 | | | | 4,891,115 | |
6
Portfolio of Investments (unaudited) – continued
| | | | | | | | |
| Issuer | | Shares/Par | | | Value ($) | |
| Bonds - continued | | | | | | | | |
| Mortgage-Backed - continued | | | | | | | | |
| Fannie Mae, 4.839%, 2014 | | $ | 7,202,950 | | | $ | 7,320,814 | |
| Fannie Mae, 4.902%, 2014 | | | 3,469,634 | | | | 3,469,862 | |
| Fannie Mae, 4.92%, 2014 | | | 232,134 | | | | 235,103 | |
| Fannie Mae, 5.1%, 2014 - 2019 | | | 3,662,080 | | | | 3,814,732 | |
| Fannie Mae, 4.56%, 2015 | | | 2,099,254 | | | | 2,199,863 | |
| Fannie Mae, 4.564%, 2015 | | | 349,262 | | | | 356,223 | |
| Fannie Mae, 4.62%, 2015 | | | 2,998,992 | | | | 3,099,428 | |
| Fannie Mae, 4.665%, 2015 | | | 1,419,901 | | | | 1,476,164 | |
| Fannie Mae, 4.7%, 2015 | | | 208,885 | | | | 216,207 | |
| Fannie Mae, 4.74%, 2015 | | | 1,618,663 | | | | 1,689,437 | |
| Fannie Mae, 4.78%, 2015 | | | 1,752,651 | | | | 1,844,695 | |
| Fannie Mae, 4.81%, 2015 | | | 1,687,053 | | | | 1,776,223 | |
| Fannie Mae, 4.815%, 2015 | | | 1,876,712 | | | | 1,965,375 | |
| Fannie Mae, 4.85%, 2015 | | | 1,300,440 | | | | 1,350,318 | |
| Fannie Mae, 4.87%, 2015 | | | 1,238,668 | | | | 1,297,293 | |
| Fannie Mae, 4.89%, 2015 | | | 1,147,596 | | | | 1,195,381 | |
| Fannie Mae, 4.925%, 2015 | | | 2,493,748 | | | | 2,605,613 | |
| Fannie Mae, 5.471%, 2015 | | | 4,917,833 | | | | 5,277,761 | |
| Fannie Mae, 5.08%, 2016 - 2019 | | | 1,953,394 | | | | 2,103,178 | |
| Fannie Mae, 5.09%, 2016 | | | 594,876 | | | | 643,499 | |
| Fannie Mae, 5.27%, 2016 | | | 627,552 | | | | 708,982 | |
| Fannie Mae, 5.273%, 2016 | | | 1,289,715 | | | | 1,396,323 | |
| Fannie Mae, 5.305%, 2016 | | | 862,460 | | | | 928,710 | |
| Fannie Mae, 5.45%, 2016 | | | 690,000 | | | | 767,711 | |
| Fannie Mae, 5.605%, 2016 | | | 3,981,248 | | | | 4,325,544 | |
| Fannie Mae, 5.915%, 2016 | | | 3,575,924 | | | | 3,948,147 | |
| Fannie Mae, 6.5%, 2016 - 2037 | | | 7,441,341 | | | | 8,257,436 | |
| Fannie Mae, 1.9%, 2017 | | | 811,318 | | | | 817,305 | |
| Fannie Mae, 3.308%, 2017 | | | 4,795,891 | | | | 5,068,842 | |
| Fannie Mae, 5.05%, 2017 - 2019 | | | 2,952,731 | | | | 3,205,809 | |
| Fannie Mae, 5.06%, 2017 | | | 1,769,130 | | | | 1,918,248 | |
| Fannie Mae, 5.158%, 2017 | | | 4,204,453 | | | | 4,385,810 | |
| Fannie Mae, 5.3%, 2017 | | | 727,497 | | | | 791,653 | |
| Fannie Mae, 5.38%, 2017 | | | 1,922,354 | | | | 2,097,906 | |
| Fannie Mae, 5.5%, 2017 - 2038 | | | 68,028,438 | | | | 74,034,547 | |
| Fannie Mae, 5.505%, 2017 | | | 1,343,304 | | | | 1,466,783 | |
| Fannie Mae, 6%, 2017 - 2037 | | | 19,030,994 | | | | 20,763,292 | |
| Fannie Mae, 2.578%, 2018 | | | 9,100,000 | | | | 9,286,213 | |
| Fannie Mae, 3.8%, 2018 | | | 1,688,724 | | | | 1,794,503 | |
| Fannie Mae, 3.91%, 2018 | | | 1,608,710 | | | | 1,729,663 | |
| Fannie Mae, 3.99%, 2018 | | | 1,600,000 | | | | 1,725,777 | |
| Fannie Mae, 4%, 2018 - 2041 | | | 26,494,173 | | | | 27,537,141 | |
| Fannie Mae, 4.19%, 2018 | | | 887,812 | | | | 964,360 | |
7
Portfolio of Investments (unaudited) – continued
| | | | | | | | |
| Issuer | | Shares/Par | | | Value ($) | |
| Bonds - continued | | | | | | | | |
| Mortgage-Backed - continued | | | | | | | | |
| Fannie Mae, 5.16%, 2018 | | $ | 786,302 | | | $ | 851,485 | |
| Fannie Mae, 5.37%, 2018 | | | 1,875,069 | | | | 2,120,882 | |
| Fannie Mae, 5.68%, 2018 | | | 1,091,824 | | | | 1,200,047 | |
| Fannie Mae, 2.43%, 2019 | | | 1,291,357 | | | | 1,306,880 | |
| Fannie Mae, 4.5%, 2019 - 2041 | | | 27,495,528 | | | | 29,161,472 | |
| Fannie Mae, 4.67%, 2019 | | | 1,180,000 | | | | 1,295,841 | |
| Fannie Mae, 4.83%, 2019 | | | 1,566,615 | | | | 1,731,171 | |
| Fannie Mae, 4.84%, 2019 | | | 594,542 | | | | 657,097 | |
| Fannie Mae, 4.94%, 2019 | | | 415,524 | | | | 461,554 | |
| Fannie Mae, 5%, 2019 - 2041 | | | 51,685,374 | | | | 55,631,135 | |
| Fannie Mae, 5.039%, 2019 | | | 5,011,446 | | | | 5,556,070 | |
| Fannie Mae, 5.28%, 2019 | | | 566,074 | | | | 621,122 | |
| Fannie Mae, 5.47%, 2019 | | | 377,748 | | | | 410,159 | |
| Fannie Mae, 5.6%, 2019 | | | 1,248,187 | | | | 1,361,573 | |
| Fannie Mae, 3.87%, 2020 | | | 1,823,780 | | | | 1,923,031 | |
| Fannie Mae, 4.14%, 2020 | | | 1,417,628 | | | | 1,513,474 | |
| Fannie Mae, 4.88%, 2020 | | | 805,034 | | | | 877,540 | |
| Fannie Mae, 5.19%, 2020 | | | 1,917,810 | | | | 2,089,118 | |
| Fannie Mae, 7.5%, 2024 - 2031 | | | 307,140 | | | | 354,257 | |
| Fannie Mae, 4.5%, 2025 | | | 1,166,717 | | | | 1,237,003 | |
| Fannie Mae, 3%, 2027 | | | 10,984,014 | | | | 11,253,046 | |
| Fannie Mae, 2.5%, 2028 | | | 3,018,315 | | | | 3,001,093 | |
| Fannie Mae, 3.5%, 2042 | | | 7,138,723 | | | | 7,147,065 | |
| Fannie Mae, TBA, 3%, 2028 | | | 11,407,000 | | | | 11,613,751 | |
| Fannie Mae, TBA, 3.5%, 2043 | | | 20,000,000 | | | | 19,993,750 | |
| Fannie Mae, TBA, 4%, 2043 | | | 53,973,000 | | | | 55,389,794 | |
| Fannie Mae, TBA, 4.5%, 2043 | | | 58,088,000 | | | | 61,003,747 | |
| Freddie Mac, 1.655%, 2016 | | | 8,873,478 | | | | 8,951,210 | |
| Freddie Mac, 5%, 2016 - 2040 | | | 14,356,978 | | | | 15,424,522 | |
| Freddie Mac, 6.5%, 2016 - 2038 | | | 2,061,183 | | | | 2,264,238 | |
| Freddie Mac, 3.882%, 2017 | | | 5,323,000 | | | | 5,713,634 | |
| Freddie Mac, 6%, 2017 - 2038 | | | 16,809,419 | | | | 18,348,110 | |
| Freddie Mac, 2.303%, 2018 | | | 2,438,882 | | | | 2,446,308 | |
| Freddie Mac, 2.323%, 2018 | | | 4,783,000 | | | | 4,795,866 | |
| Freddie Mac, 2.412%, 2018 | | | 7,000,000 | | | | 7,072,373 | |
| Freddie Mac, 3.154%, 2018 | | | 5,293,000 | | | | 5,535,478 | |
| Freddie Mac, 1.883%, 2019 | | | 1,100,000 | | | | 1,070,389 | |
| Freddie Mac, 2.13%, 2019 | | | 10,400,000 | | | | 10,290,072 | |
| Freddie Mac, 4.186%, 2019 | | | 2,800,000 | | | | 3,027,290 | |
| Freddie Mac, 5.085%, 2019 | | | 6,865,000 | | | | 7,746,926 | |
| Freddie Mac, 2.313%, 2020 | | | 6,978,000 | | | | 6,841,461 | |
| Freddie Mac, 2.757%, 2020 | | | 7,039,907 | | | | 7,275,934 | |
| Freddie Mac, 3.32%, 2020 | | | 7,180,630 | | | | 7,544,796 | |
8
Portfolio of Investments (unaudited) – continued
| | | | | | | | |
| Issuer | | Shares/Par | | | Value ($) | |
| Bonds - continued | | | | | | | | |
| Mortgage-Backed - continued | | | | | | | | |
| Freddie Mac, 4.224%, 2020 | | $ | 4,281,146 | | | $ | 4,596,568 | |
| Freddie Mac, 4.251%, 2020 | | | 3,106,000 | | | | 3,363,369 | |
| Freddie Mac, 5.5%, 2021 - 2038 | | | 19,786,293 | | | | 21,379,968 | |
| Freddie Mac, 4.5%, 2022 - 2041 | | | 15,186,010 | | | | 15,989,194 | |
| Freddie Mac, 3.25%, 2023 | | | 9,000,000 | | | | 8,831,691 | |
| Freddie Mac, 3.32%, 2023 | | | 4,605,000 | | | | 4,530,376 | |
| Freddie Mac, 4%, 2025 | | | 4,395,322 | | | | 4,628,192 | |
| Freddie Mac, 2.5%, 2028 | | | 69,912,697 | | | | 69,431,900 | |
| Freddie Mac, 3.5%, 2041 - 2043 | | | 93,799,952 | | | | 93,596,783 | |
| Freddie Mac, 3%, 2043 | | | 29,729,377 | | | | 28,478,601 | |
| Freddie Mac, 3.3%, 2046 | | | 4,629,861 | | | | 4,552,996 | |
| Ginnie Mae, 4.5%, 2033 - 2042 | | | 31,895,192 | | | | 34,217,377 | |
| Ginnie Mae, 5.5%, 2033 - 2042 | | | 14,776,109 | | | | 16,143,367 | |
| Ginnie Mae, 4%, 2039 - 2041 | | | 6,763,746 | | | | 7,083,269 | |
| Ginnie Mae, 3.5%, 2041 - 2043 | | | 84,951,642 | | | | 85,975,984 | |
| Ginnie Mae, 3%, 2043 | | | 14,155,286 | | | | 13,749,693 | |
| Ginnie Mae, 5.612%, 2058 | | | 6,960,788 | | | | 7,304,637 | |
| Ginnie Mae, 6.357%, 2058 | | | 3,483,012 | | | | 3,685,250 | |
| | | | | | | | |
| | | | $ | 1,056,609,623 | |
| Municipals - 0.5% | | | | | | | | |
| Florida Hurricane Catastrophe Fund Finance Corp. Rev., “A”, 1.298%, 2016 | | $ | 45,000 | | | $ | 44,502 | |
| Massachusetts School Building Authority, Dedicated Sales Tax Rev., “A”, 5%, 2023 | | | 605,000 | | | | 698,944 | |
| New York Environmental Facilities Corp., Clean Water and Drinking Revolving Funds Rev. (NYC Municipal Water Finance Authority Projects), “A”, 5%, 2023 | | | 760,000 | | | | 880,962 | |
| New York, NY, Transitional Finance Authority Rev., “I”, 5%, 2022 | | | 605,000 | | | | 694,129 | |
| New York, NY, Transitional Finance Authority Rev., “I”, 5%, 2023 | | | 1,205,000 | | | | 1,378,508 | |
| Riverside County, CA, Transportation Commission, Sales Tax Rev., “A”, 5%, 2021 | | | 1,035,000 | | | | 1,198,644 | |
| Riverside County, CA, Transportation Commission, Sales Tax Rev., “A”, 5%, 2023 | | | 1,065,000 | | | | 1,226,188 | |
| South Carolina Public Service Authority Rev., “A”, 5.125%, 2043 | | | 1,105,000 | | | | 1,090,690 | |
| South Carolina Public Service Authority Rev., “B”, 5.125%, 2043 | | | 2,650,000 | | | | 2,615,683 | |
| | | | | | | | |
| | | | $ | 9,828,250 | |
| U.S. Government Agencies and Equivalents - 2.4% | | | | | | | | |
| Aid-Egypt, 4.45%, 2015 | | $ | 6,204,000 | | | $ | 6,688,166 | |
| Private Export Funding Corp., 1.875%, 2018 | | | 5,330,000 | | | | 5,306,415 | |
9
Portfolio of Investments (unaudited) – continued
| | | | | | | | |
| Issuer | | Shares/Par | | | Value ($) | |
| Bonds - continued | | | | | | | | |
| U.S. Government Agencies and Equivalents - continued | | | | | |
| Small Business Administration, 6.35%, 2021 | | $ | 703,092 | | | $ | 771,778 | |
| Small Business Administration, 6.34%, 2021 | | | 677,962 | | | | 741,386 | |
| Small Business Administration, 6.44%, 2021 | | | 651,487 | | | | 721,819 | |
| Small Business Administration, 6.625%, 2021 | | | 636,074 | | | | 703,649 | |
| Small Business Administration, 6.07%, 2022 | | | 695,252 | | | | 760,398 | |
| Small Business Administration, 4.98%, 2023 | | | 916,374 | | | | 997,309 | |
| Small Business Administration, 4.89%, 2023 | | | 2,335,488 | | | | 2,537,888 | |
| Small Business Administration, 4.77%, 2024 | | | 2,123,712 | | | | 2,265,309 | |
| Small Business Administration, 5.52%, 2024 | | | 1,381,840 | | | | 1,512,200 | |
| Small Business Administration, 4.99%, 2024 | | | 2,036,197 | | | | 2,195,121 | |
| Small Business Administration, 4.86%, 2024 | | | 1,361,620 | | | | 1,462,661 | |
| Small Business Administration, 4.86%, 2025 | | | 2,214,496 | | | | 2,367,717 | |
| Small Business Administration, 5.11%, 2025 | | | 1,996,008 | | | | 2,146,447 | |
| Small Business Administration, 2.21%, 2033 | | | 3,320,374 | | | | 3,110,085 | |
| Small Business Administration, 2.22%, 2033 | | | 6,032,000 | | | | 5,675,904 | |
| Small Business Administration, 3.15%, 2033 | | | 5,329,000 | | | | 5,305,374 | |
| Small Business Administration, 3.16%, 2033 | | | 2,000,000 | | | | 1,994,100 | |
| U.S. Department of Housing & Urban Development, 6.36%, 2016 | | | 310,000 | | | | 312,660 | |
| U.S. Department of Housing & Urban Development, 6.59%, 2016 | | | 138,000 | | | | 138,945 | |
| | | | | | | | |
| | | | $ | 47,715,331 | |
| U.S. Treasury Obligations - 32.3% | | | | | | | | |
| U.S. Treasury Bonds, 7.5%, 2016 | | $ | 3,421,000 | | | $ | 4,133,796 | |
| U.S. Treasury Bonds, 6.25%, 2023 | | | 1,445,000 | | | | 1,893,853 | |
| U.S. Treasury Bonds, 6%, 2026 | | | 5,933,000 | | | | 7,775,013 | |
| U.S. Treasury Bonds, 6.75%, 2026 | | | 981,000 | | | | 1,370,641 | |
| U.S. Treasury Bonds, 6.375%, 2027 | | | 2,309,000 | | | | 3,153,228 | |
| U.S. Treasury Bonds, 5.25%, 2029 | | | 2,438,000 | | | | 3,022,740 | |
| U.S. Treasury Bonds, 4.5%, 2036 | | | 2,662,000 | | | | 3,073,779 | |
| U.S. Treasury Bonds, 5%, 2037 | | | 4,133,000 | | | | 5,108,777 | |
| U.S. Treasury Bonds, 4.375%, 2038 | | | 3,297,000 | | | | 3,735,399 | |
| U.S. Treasury Bonds, 4.5%, 2039 | | | 64,440,300 | | | | 74,488,992 | |
| U.S. Treasury Bonds, 3.125%, 2043 | | | 5,266,000 | | | | 4,730,348 | |
| U.S. Treasury Notes, 4%, 2014 | | | 2,232,000 | | | | 2,271,234 | |
| U.S. Treasury Notes, 1.875%, 2014 | | | 16,258,000 | | | | 16,446,625 | |
| U.S. Treasury Notes, 2.625%, 2014 | | | 16,750,000 | | | | 17,092,203 | |
| U.S. Treasury Notes, 4%, 2015 | | | 13,740,000 | | | | 14,479,597 | |
| U.S. Treasury Notes, 2.125%, 2015 | | | 161,986,000 | | | | 166,997,523 | |
| U.S. Treasury Notes, 0.375%, 2016 | | | 29,280,100 | | | | 29,152,000 | |
| U.S. Treasury Notes, 2.625%, 2016 | | | 4,787,000 | | | | 5,036,824 | |
| U.S. Treasury Notes, 0.875%, 2016 | | | 97,481,000 | | | | 97,260,108 | |
10
Portfolio of Investments (unaudited) – continued
| | | | | | | | |
| Issuer | | Shares/Par | | | Value ($) | |
| Bonds - continued | | | | | | | | |
| U.S. Treasury Obligations - continued | | | | | |
| U.S. Treasury Notes, 4.75%, 2017 | | $ | 11,447,000 | | | $ | 13,018,284 | |
| U.S. Treasury Notes, 2.625%, 2018 | | | 26,085,000 | | | | 27,423,891 | |
| U.S. Treasury Notes, 2.75%, 2019 | | | 19,471,600 | | | | 20,481,689 | |
| U.S. Treasury Notes, 3.125%, 2019 | | | 12,026,000 | | | | 12,881,914 | |
| U.S. Treasury Notes, 3.5%, 2020 | | | 6,007,000 | | | | 6,543,407 | |
| U.S. Treasury Notes, 2.625%, 2020 | | | 15,874,000 | | | | 16,341,537 | |
| U.S. Treasury Notes, 3.125%, 2021 | | | 25,810,000 | | | | 27,215,432 | |
| U.S. Treasury Notes, 1.75%, 2022 | | | 70,944,000 | | | | 66,243,960 | |
| | | | | | | | |
| | | | $ | 651,372,794 | |
| Total Bonds (Identified Cost, $1,910,384,269) | | | $ | 1,933,484,514 | |
| | |
| Money Market Funds - 11.4% | | | | | | | | |
MFS Institutional Money Market Portfolio, 0.09%,
at Cost and Net Asset Value (v) | | | 229,881,589 | | | $ | 229,881,589 | |
| Total Investments (Identified Cost, $2,140,265,858) | | | $ | 2,163,366,103 | |
| |
| Other Assets, Less Liabilities - (7.3)% | | | | (146,386,619 | ) |
| Net Assets - 100.0% | | | $ | 2,016,979,484 | |
| (v) | Underlying affiliated fund that is available only to investment companies managed by MFS. The rate quoted for the MFS Institutional Money Market Portfolio is the annualized seven-day yield of the fund at period end. |
The following abbreviations are used in this report and are defined:
| FRN | | Floating Rate Note. Interest rate resets periodically and may not be the rate reported at period end. |
| STRIPS | | Separate Trading of Registered Interest and Principal of Securities |
See Notes to Financial Statements
11
Financial Statements
STATEMENT OF ASSETS AND LIABILITIES
At 8/31/13 (unaudited)
This statement represents your fund’s balance sheet, which details the assets and liabilities comprising the total value of the fund.
| | | | |
| Assets | | | | |
Investments- | | | | |
Non-affiliated issuers, at value (identified cost, $1,910,384,269) | | | $1,933,484,514 | |
Underlying affiliated funds, at cost and value | | | 229,881,589 | |
Total investments, at value (identified cost, $2,140,265,858) | | | $2,163,366,103 | |
Receivables for | | | | |
Investments sold | | | 136,432,890 | |
Fund shares sold | | | 1,448,529 | |
Interest | | | 8,447,041 | |
Other assets | | | 3,409 | |
Total assets | | | $2,309,697,972 | |
| Liabilities | | | | |
Payables for | | | | |
Distributions | | | $460,889 | |
TBA purchase commitments | | | 286,827,743 | |
Fund shares reacquired | | | 3,918,268 | |
Payable to affiliates | | | | |
Investment adviser | | | 67,369 | |
Shareholder servicing costs | | | 1,169,951 | |
Distribution and service fees | | | 28,784 | |
Payable for independent Trustees’ compensation | | | 60,960 | |
Accrued expenses and other liabilities | | | 184,524 | |
Total liabilities | | | $292,718,488 | |
Net assets | | | $2,016,979,484 | |
| Net assets consist of | | | | |
Paid-in capital | | | $2,037,085,096 | |
Unrealized appreciation (depreciation) on investments | | | 23,100,245 | |
Accumulated distributions in excess of net realized gain on investments | | | (38,424,021 | ) |
Accumulated distributions in excess of net investment income | | | (4,781,836 | ) |
Net assets | | | $2,016,979,484 | |
Shares of beneficial interest outstanding | | | 202,216,735 | |
12
Statement of Assets and Liabilities (unaudited) – continued
| | | | | | | | | | | | |
| | | Net assets | | | Shares
outstanding | | | Net asset value
per share (a) | |
Class A | | | $737,611,618 | | | | 73,924,095 | | | | $9.98 | |
Class B | | | 34,008,886 | | | | 3,412,750 | | | | 9.97 | |
Class C | | | 72,303,421 | | | | 7,231,965 | | | | 10.00 | |
Class I | | | 29,083,222 | | | | 2,915,380 | | | | 9.98 | |
Class R1 | | | 5,372,496 | | | | 538,967 | | | | 9.97 | |
Class R2 | | | 145,548,681 | | | | 14,602,136 | | | | 9.97 | |
Class R3 | | | 102,072,199 | | | | 10,232,424 | | | | 9.98 | |
Class R4 | | | 67,152,985 | | | | 6,728,073 | | | | 9.98 | |
Class R5 | | | 823,825,976 | | | | 82,630,945 | | | | 9.97 | |
| (a) | Maximum offering price per share was equal to the net asset value per share for all share classes, except for Class A, for which the maximum offering price per share was $10.48 [100 / 95.25 x $9.98]. On sales of $50,000 or more, the maximum offering price of Class A shares is reduced. A contingent deferred sales charge may be imposed on redemptions of Class A, Class B, and Class C shares. Redemption price per share was equal to the net asset value per share for Classes I, R1, R2, R3, R4, and R5. |
See Notes to Financial Statements
13
Financial Statements
STATEMENT OF OPERATIONS
Six months ended 8/31/13 (unaudited)
This statement describes how much your fund earned in investment income and accrued in expenses. It also describes any gains and/or losses generated by fund operations.
| | | | |
| Net investment income | | | | |
Income | | | | |
Interest | | | $26,546,211 | |
Dividends from underlying affiliated funds | | | 214,110 | |
Total investment income | | | $26,760,321 | |
Expenses | | | | |
Management fee | | | $4,201,192 | |
Distribution and service fees | | | 2,216,175 | |
Shareholder servicing costs | | | 1,417,667 | |
Administrative services fee | | | 135,442 | |
Independent Trustees’ compensation | | | 21,672 | |
Custodian fee | | | 113,529 | |
Shareholder communications | | | 112,306 | |
Audit and tax fees | | | 29,153 | |
Legal fees | | | 12,917 | |
Miscellaneous | | | 119,035 | |
Total expenses | | | $8,379,088 | |
Fees paid indirectly | | | (13 | ) |
Reduction of expenses by investment adviser and distributor | | | (35,026 | ) |
Net expenses | | | $8,344,049 | |
Net investment income | | | $18,416,272 | |
| Realized and unrealized gain (loss) on investments | | | | |
Realized gain (loss) on investments (identified cost basis) | | | $(7,719,670 | ) |
Change in unrealized appreciation (depreciation) on investments | | | $(69,691,239 | ) |
Net realized and unrealized gain (loss) on investments | | | $(77,410,909 | ) |
Change in net assets from operations | | | $(58,994,637 | ) |
See Notes to Financial Statements
14
Financial Statements
STATEMENTS OF CHANGES IN NET ASSETS
These statements describe the increases and/or decreases in net assets resulting from operations, any distributions, and any shareholder transactions.
| | | | | | | | |
| | | Six months ended
8/31/13 | | | Year ended
2/28/13 | |
| Change in net assets | | (unaudited) | | | | |
| From operations | | | | | | | | |
Net investment income | | | $18,416,272 | | | | $38,700,747 | |
Net realized gain (loss) on investments | | | (7,719,670 | ) | | | 11,778,976 | |
Net unrealized gain (loss) on investments | | | (69,691,239 | ) | | | (15,022,758 | ) |
Change in net assets from operations | | | $(58,994,637 | ) | | | $35,456,965 | |
| Distributions declared to shareholders | | | | | | | | |
From net investment income | | | $(22,275,602 | ) | | | $(53,090,312 | ) |
From net realized gain on investments | | | (6,619,454 | ) | | | (9,521,417 | ) |
Total distributions declared to shareholders | | | $(28,895,056 | ) | | | $(62,611,729 | ) |
Change in net assets from fund share transactions | | | $2,915,888 | | | | $89,399,813 | |
Total change in net assets | | | $(84,973,805 | ) | | | $62,245,049 | |
| Net assets | | | | | | | | |
At beginning of period | | | 2,101,953,289 | | | | 2,039,708,240 | |
At end of period (including accumulated distributions in excess of net investment income of $4,781,836 and $922,506, respectively) | | | $2,016,979,484 | | | | $2,101,953,289 | |
See Notes to Financial Statements
15
Financial Statements
FINANCIAL HIGHLIGHTS
The financial highlights table is intended to help you understand the fund’s financial performance for the semiannual period and the past 5 fiscal years (or life of a particular share class, if shorter). Certain information reflects financial results for a single fund share. The total returns in the table represent the rate by which an investor would have earned (or lost) on an investment in the fund share class (assuming reinvestment of all distributions) held for the entire period.
| | | | | | | | | | | | | | | | | | | | | | | | |
| | | Six months ended 8/31/13 | | | Years ended 2/28, 2/29 | |
| Class A | | | 2013 | | | 2012 | | | 2011 | | | 2010 | | | 2009 | |
| | | (unaudited) | | | | | | | | | | | | | | | | |
Net asset value, beginning of period | | | $10.41 | | | | $10.54 | | | | $10.13 | | | | $10.15 | | | | $9.92 | | | | $9.78 | |
| Income (loss) from investment operations | | | | | |
Net investment income (d) | | | $0.09 | | | | $0.20 | | | | $0.25 | | | | $0.30 | | | | $0.35 | | | | $0.39 | |
Net realized and unrealized gain
(loss) on investments | | | (0.39 | ) | | | (0.02 | ) | | | 0.46 | | | | (0.00 | )(w) | | | 0.27 | | | | 0.17 | |
Total from investment operations | | | $(0.30 | ) | | | $0.18 | | | | $0.71 | | | | $0.30 | | | | $0.62 | | | | $0.56 | |
| Less distributions declared to shareholders | | | | | |
From net investment income | | | $(0.10 | ) | | | $(0.26 | ) | | | $(0.30 | ) | | | $(0.32 | ) | | | $(0.39 | ) | | | $(0.42 | ) |
From net realized gain on
investments | | | (0.03 | ) | | | (0.05 | ) | | | — | | | | — | | | | — | | | | — | |
Total distributions declared to
shareholders | | | $(0.13 | ) | | | $(0.31 | ) | | | $(0.30 | ) | | | $(0.32 | ) | | | $(0.39 | ) | | | $(0.42 | ) |
Net asset value, end of period (x) | | | $9.98 | | | | $10.41 | | | | $10.54 | | | | $10.13 | | | | $10.15 | | | | $9.92 | |
Total return (%) (r)(s)(t)(x) | | | (2.83 | )(n) | | | 1.74 | | | | 7.04 | | | | 2.96 | | | | 6.31 | | | | 5.95 | |
Ratios (%) (to average net assets)
and Supplemental data: | |
Expenses before expense reductions (f) | | | 0.88 | (a) | | | 0.87 | | | | 0.86 | | | | 0.87 | | | | 0.88 | | | | 0.91 | |
Expenses after expense reductions (f) | | | 0.88 | (a) | | | 0.87 | | | | 0.86 | | | | 0.87 | | | | 0.88 | | | | 0.80 | |
Net investment income | | | 1.67 | (a) | | | 1.88 | | | | 2.39 | | | | 2.88 | | | | 3.49 | | | | 3.98 | |
Portfolio turnover | | | 76 | (n) | | | 81 | | | | 49 | | | | 34 | | | | 32 | | | | 57 | |
Net assets at end of period
(000 omitted) | | | $737,612 | | | | $847,276 | | | | $981,980 | | | | $915,576 | | | | $923,918 | | | | $888,523 | |
See Notes to Financial Statements
16
Financial Highlights – continued
| | | | | | | | | | | | | | | | | | | | | | | | |
| | | Six months ended 8/31/13 (unaudited) | | | Years ended 2/28, 2/29 | |
| Class B | | | 2013 | | | 2012 | | | 2011 | | | 2010 | | | 2009 | |
| | | | | | | | | | | | | | | | | |
Net asset value, beginning of period | | | $10.39 | | | | $10.53 | | | | $10.11 | | | | $10.14 | | | | $9.91 | | | | $9.77 | |
| Income (loss) from investment operations | | | | | |
Net investment income (d) | | | $0.05 | | | | $0.12 | | | | $0.17 | | | | $0.22 | | | | $0.28 | | | | $0.32 | |
Net realized and unrealized gain
(loss) on investments | | | (0.37 | ) | | | (0.03 | ) | | | 0.47 | | | | (0.01 | ) | | | 0.26 | | | | 0.17 | |
Total from investment operations | | | $(0.32 | ) | | | $0.09 | | | | $0.64 | | | | $0.21 | | | | $0.54 | | | | $0.49 | |
| Less distributions declared to shareholders | | | | | |
From net investment income | | | $(0.07 | ) | | | $(0.18 | ) | | | $(0.22 | ) | | | $(0.24 | ) | | | $(0.31 | ) | | | $(0.35 | ) |
From net realized gain on
investments | | | (0.03 | ) | | | (0.05 | ) | | | — | | | | — | | | | — | | | | — | |
Total distributions declared to
shareholders | | | $(0.10 | ) | | | $(0.23 | ) | | | $(0.22 | ) | | | $(0.24 | ) | | | $(0.31 | ) | | | $(0.35 | ) |
Net asset value, end of period (x) | | | $9.97 | | | | $10.39 | | | | $10.53 | | | | $10.11 | | | | $10.14 | | | | $9.91 | |
Total return (%) (r)(s)(t)(x) | | | (3.11 | )(n) | | | 0.88 | | | | 6.35 | | | | 2.09 | | | | 5.52 | | | | 5.16 | |
Ratios (%) (to average net assets)
and Supplemental data: | |
Expenses before expense reductions (f) | | | 1.63 | (a) | | | 1.62 | | | | 1.61 | | | | 1.62 | | | | 1.63 | | | | 1.66 | |
Expenses after expense reductions (f) | | | 1.63 | (a) | | | 1.62 | | | | 1.61 | | | | 1.62 | | | | 1.63 | | | | 1.55 | |
Net investment income | | | 0.91 | (a) | | | 1.13 | | | | 1.66 | | | | 2.15 | | | | 2.75 | | | | 3.25 | |
Portfolio turnover | | | 76 | (n) | | | 81 | | | | 49 | | | | 34 | | | | 32 | | | | 57 | |
Net assets at end of period
(000 omitted) | | | $34,009 | | | | $44,012 | | | | $46,645 | | | | $53,577 | | | | $74,842 | | | | $102,852 | |
See Notes to Financial Statements
17
Financial Highlights – continued
| | | | | | | | | | | | | | | | | | | | | | | | |
| | | Six months
ended
8/31/13 (unaudited) | | | Years ended 2/28, 2/29 | |
| Class C | | | 2013 | | | 2012 | | | 2011 | | | 2010 | | | 2009 | |
| | | | | | | | | | | | | | | | | |
Net asset value, beginning of period | | | $10.43 | | | | $10.57 | | | | $10.15 | | | | $10.17 | | | | $9.95 | | | | $9.81 | |
| Income (loss) from investment operations | | | | | |
Net investment income (d) | | | $0.05 | | | | $0.12 | | | | $0.17 | | | | $0.22 | | | | $0.27 | | | | $0.31 | |
Net realized and unrealized gain
(loss) on investments | | | (0.38 | ) | | | (0.02 | ) | | | 0.47 | | | | (0.00 | )(w) | | | 0.26 | | | | 0.18 | |
Total from investment operations | | | $(0.33 | ) | | | $0.10 | | | | $0.64 | | | | $0.22 | | | | $0.53 | | | | $0.49 | |
| Less distributions declared to shareholders | | | | | |
From net investment income | | | $(0.07 | ) | | | $(0.19 | ) | | | $(0.22 | ) | | | $(0.24 | ) | | | $(0.31 | ) | | | $(0.35 | ) |
From net realized gain on
investments | | | (0.03 | ) | | | (0.05 | ) | | | — | | | | — | | | | — | | | | — | |
Total distributions declared to
shareholders | | | $(0.10 | ) | | | $(0.24 | ) | | | $(0.22 | ) | | | $(0.24 | ) | | | $(0.31 | ) | | | $(0.35 | ) |
Net asset value, end of period (x) | | | $10.00 | | | | $10.43 | | | | $10.57 | | | | $10.15 | | | | $10.17 | | | | $9.95 | |
Total return (%) (r)(s)(t)(x) | | | (3.19 | )(n) | | | 0.88 | | | | 6.33 | | | | 2.19 | | | | 5.40 | | | | 5.16 | |
Ratios (%) (to average net assets)
and Supplemental data: | |
Expenses before expense reductions (f) | | | 1.63 | (a) | | | 1.62 | | | | 1.61 | | | | 1.62 | | | | 1.62 | | | | 1.66 | |
Expenses after expense reductions (f) | | | 1.63 | (a) | | | 1.62 | | | | 1.61 | | | | 1.62 | | | | 1.62 | | | | 1.55 | |
Net investment income | | | 0.90 | (a) | | | 1.13 | | | | 1.64 | | | | 2.12 | | | | 2.71 | | | | 3.21 | |
Portfolio turnover | | | 76 | (n) | | | 81 | | | | 49 | | | | 34 | | | | 32 | | | | 57 | |
Net assets at end of period
(000 omitted) | | | $72,303 | | | | $101,229 | | | | $112,961 | | | | $111,328 | | | | $116,622 | | | | $92,046 | |
See Notes to Financial Statements
18
Financial Highlights – continued
| | | | | | | | | | | | | | | | | | | | | | | | |
| | | Six months
ended
8/31/13 (unaudited) | | | Years ended 2/28, 2/29 | |
| Class I | | | 2013 | | | 2012 | | | 2011 | | | 2010 | | | 2009 | |
| | | | | | | | | | | | | | | | | |
Net asset value, beginning of period | | | $10.41 | | | | $10.54 | | | | $10.12 | | | | $10.15 | | | | $9.92 | | | | $9.78 | |
| Income (loss) from investment operations | | | | | |
Net investment income (d) | | | $0.10 | | | | $0.25 | | | | $0.27 | | | | $0.32 | | | | $0.38 | | | | $0.41 | |
Net realized and unrealized gain
(loss) on investments | | | (0.38 | ) | | | (0.04 | ) | | | 0.47 | | | | (0.00 | )(w) | | | 0.26 | | | | 0.18 | |
Total from investment operations | | | $(0.28 | ) | | | $0.21 | | | | $0.74 | | | | $0.32 | | | | $0.64 | | | | $0.59 | |
| Less distributions declared to shareholders | | | | | |
From net investment income | | | $(0.12 | ) | | | $(0.29 | ) | | | $(0.32 | ) | | | $(0.35 | ) | | | $(0.41 | ) | | | $(0.45 | ) |
From net realized gain on
investments | | | (0.03 | ) | | | (0.05 | ) | | | — | | | | — | | | | — | | | | — | |
Total distributions declared to
shareholders | | | $(0.15 | ) | | | $(0.34 | ) | | | $(0.32 | ) | | | $(0.35 | ) | | | $(0.41 | ) | | | $(0.45 | ) |
Net asset value, end of period (x) | | | $9.98 | | | | $10.41 | | | | $10.54 | | | | $10.12 | | | | $10.15 | | | | $9.92 | |
Total return (%) (r)(s)(x) | | | (2.71 | )(n) | | | 1.99 | | | | 7.41 | | | | 3.11 | | | | 6.57 | | | | 6.21 | |
Ratios (%) (to average net assets)
and Supplemental data: | |
Expenses before expense reductions (f) | | | 0.63 | (a) | | | 0.59 | | | | 0.61 | | | | 0.62 | | | | 0.63 | | | | 0.66 | |
Expenses after expense reductions (f) | | | 0.63 | (a) | | | 0.59 | | | | 0.60 | | | | 0.62 | | | | 0.63 | | | | 0.55 | |
Net investment income | | | 1.89 | (a) | | | 2.33 | | | | 2.64 | | | | 3.13 | | | | 3.73 | | | | 4.26 | |
Portfolio turnover | | | 76 | (n) | | | 81 | | | | 49 | | | | 34 | | | | 32 | | | | 57 | |
Net assets at end of period
(000 omitted) | | | $29,083 | | | | $40,628 | | | | $562,634 | | | | $434,682 | | | | $318,667 | | | | $286,371 | |
See Notes to Financial Statements
19
Financial Highlights – continued
| | | | | | | | | | | | | | | | | | | | | | | | |
| | | Six months ended
8/31/13 (unaudited) | | | Years ended 2/28, 2/29 | |
| Class R1 | | | 2013 | | | 2012 | | | 2011 | | | 2010 | | | 2009 | |
| | | | | | | | | | | | | | | | | |
Net asset value, beginning of period | | | $10.40 | | | | $10.53 | | | | $10.11 | | | | $10.14 | | | | $9.91 | | | | $9.77 | |
| Income (loss) from investment operations | | | | | |
Net investment income (d) | | | $0.05 | | | | $0.12 | | | | $0.17 | | | | $0.22 | | | | $0.28 | | | | $0.32 | |
Net realized and unrealized gain
(loss) on investments | | | (0.38 | ) | | | (0.02 | ) | | | 0.47 | | | | (0.01 | ) | | | 0.26 | | | | 0.17 | |
Total from investment operations | | | $(0.33 | ) | | | $0.10 | | | | $0.64 | | | | $0.21 | | | | $0.54 | | | | $0.49 | |
| Less distributions declared to shareholders | | | | | |
From net investment income | | | $(0.07 | ) | | | $(0.18 | ) | | | $(0.22 | ) | | | $(0.24 | ) | | | $(0.31 | ) | | | $(0.35 | ) |
From net realized gain on
investments | | | (0.03 | ) | | | (0.05 | ) | | | — | | | | — | | | | — | | | | — | |
Total distributions declared to
shareholders | | | $(0.10 | ) | | | $(0.23 | ) | | | $(0.22 | ) | | | $(0.24 | ) | | | $(0.31 | ) | | | $(0.35 | ) |
Net asset value, end of period (x) | | | $9.97 | | | | $10.40 | | | | $10.53 | | | | $10.11 | | | | $10.14 | | | | $9.91 | |
Total return (%) (r)(s)(x) | | | (3.20 | )(n) | | | 0.98 | | | | 6.35 | | | | 2.09 | | | | 5.52 | | | | 5.16 | |
Ratios (%) (to average net assets)
and Supplemental data: | |
Expenses before expense reductions (f) | | | 1.63 | (a) | | | 1.62 | | | | 1.61 | | | | 1.62 | | | | 1.63 | | | | 1.66 | |
Expenses after expense reductions (f) | | | 1.63 | (a) | | | 1.62 | | | | 1.61 | | | | 1.62 | | | | 1.63 | | | | 1.55 | |
Net investment income | | | 0.91 | (a) | | | 1.14 | | | | 1.64 | | | | 2.14 | | | | 2.74 | | | | 3.24 | |
Portfolio turnover | | | 76 | (n) | | | 81 | | | | 49 | | | | 34 | | | | 32 | | | | 57 | |
Net assets at end of period
(000 omitted) | | | $5,372 | | | | $6,647 | | | | $7,902 | | | | $7,219 | | | | $6,246 | | | | $5,713 | |
See Notes to Financial Statements
20
Financial Highlights – continued
| | | | | | | | | | | | | | | | | | | | | | | | |
| | | Six months ended
8/31/13 (unaudited) | | | Years ended 2/28, 2/29 | |
| Class R2 | | | 2013 | | | 2012 | | | 2011 | | | 2010 | | | 2009 | |
| | | | | | | | | | | | | | | | | |
Net asset value, beginning of period | | | $10.40 | | | | $10.53 | | | | $10.11 | | | | $10.14 | | | | $9.91 | | | | $9.77 | |
| Income (loss) from investment operations | | | | | |
Net investment income (d) | | | $0.07 | | | | $0.17 | | | | $0.22 | | | | $0.27 | | | | $0.32 | | | | $0.36 | |
Net realized and unrealized gain
(loss) on investments | | | (0.38 | ) | | | (0.01 | ) | | | 0.47 | | | | (0.01 | ) | | | 0.27 | | | | 0.18 | |
Total from investment operations | | | $(0.31 | ) | | | $0.16 | | | | $0.69 | | | | $0.26 | | | | $0.59 | | | | $0.54 | |
| Less distributions declared to shareholders | | | | | |
From net investment income | | | $(0.09 | ) | | | $(0.24 | ) | | | $(0.27 | ) | | | $(0.29 | ) | | | $(0.36 | ) | | | $(0.40 | ) |
From net realized gain on
investments | | | (0.03 | ) | | | (0.05 | ) | | | — | | | | — | | | | — | | | | — | |
Total distributions declared to
shareholders | | | $(0.12 | ) | | | $(0.29 | ) | | | $(0.27 | ) | | | $(0.29 | ) | | | $(0.36 | ) | | | $(0.40 | ) |
Net asset value, end of period (x) | | | $9.97 | | | | $10.40 | | | | $10.53 | | | | $10.11 | | | | $10.14 | | | | $9.91 | |
Total return (%) (r)(s)(x) | | | (2.96 | )(n) | | | 1.48 | | | | 6.88 | | | | 2.60 | | | | 6.04 | | | | 5.69 | |
Ratios (%) (to average net assets)
and Supplemental data: | |
Expenses before expense reductions (f) | | | 1.13 | (a) | | | 1.12 | | | | 1.11 | | | | 1.12 | | | | 1.13 | | | | 1.16 | |
Expenses after expense reductions (f) | | | 1.13 | (a) | | | 1.12 | | | | 1.11 | | | | 1.12 | | | | 1.12 | | | | 1.05 | |
Net investment income | | | 1.42 | (a) | | | 1.63 | | | | 2.13 | | | | 2.62 | | | | 3.22 | | | | 3.74 | |
Portfolio turnover | | | 76 | (n) | | | 81 | | | | 49 | | | | 34 | | | | 32 | | | | 57 | |
Net assets at end of period
(000 omitted) | | | $145,549 | | | | $165,865 | | | | $168,809 | | | | $123,672 | | | | $73,052 | | | | $35,616 | |
See Notes to Financial Statements
21
Financial Highlights – continued
| | | | | | | | | | | | | | | | | | | | | | | | |
| | | Six months
ended
8/31/13 (unaudited) | | | Years ended 2/28, 2/29 | |
| Class R3 | | | 2013 | | | 2012 | | | 2011 | | | 2010 | | | 2009 | |
| | | | | | | | | | | | | | | | | |
Net asset value, beginning of period | | | $10.40 | | | | $10.54 | | | | $10.12 | | | | $10.15 | | | | $9.92 | | | | $9.78 | |
| Income (loss) from investment operations | | | | | |
Net investment income (d) | | | $0.09 | | | | $0.20 | | | | $0.25 | | | | $0.29 | | | | $0.35 | | | | $0.39 | |
Net realized and unrealized gain
(loss) on investments | | | (0.38 | ) | | | (0.03 | ) | | | 0.46 | | | | (0.00 | )(w) | | | 0.27 | | | | 0.17 | |
Total from investment operations | | | $(0.29 | ) | | | $0.17 | | | | $0.71 | | | | $0.29 | | | | $0.62 | | | | $0.56 | |
| Less distributions declared to shareholders | | | | | |
From net investment income | | | $(0.10 | ) | | | $(0.26 | ) | | | $(0.29 | ) | | | $(0.32 | ) | | | $(0.39 | ) | | | $(0.42 | ) |
From net realized gain on
investments | | | (0.03 | ) | | | (0.05 | ) | | | — | | | | — | | | | — | | | | — | |
Total distributions declared to
shareholders | | | $(0.13 | ) | | | $(0.31 | ) | | | $(0.29 | ) | | | $(0.32 | ) | | | $(0.39 | ) | | | $(0.42 | ) |
Net asset value, end of period (x) | | | $9.98 | | | | $10.40 | | | | $10.54 | | | | $10.12 | | | | $10.15 | | | | $9.92 | |
Total return (%) (r)(s)(x) | | | (2.74 | )(n) | | | 1.64 | | | | 7.14 | | | | 2.86 | | | | 6.31 | | | | 5.95 | |
Ratios (%) (to average net assets)
and Supplemental data: | |
Expenses before expense reductions (f) | | | 0.88 | (a) | | | 0.87 | | | | 0.86 | | | | 0.87 | | | | 0.88 | | | | 0.91 | |
Expenses after expense reductions (f) | | | 0.88 | (a) | | | 0.87 | | | | 0.86 | | | | 0.87 | | | | 0.87 | | | | 0.80 | |
Net investment income | | | 1.67 | (a) | | | 1.88 | | | | 2.36 | | | | 2.87 | | | | 3.47 | | | | 3.98 | |
Portfolio turnover | | | 76 | (n) | | | 81 | | | | 49 | | | | 34 | | | | 32 | | | | 57 | |
Net assets at end of period
(000 omitted) | | | $102,072 | | | | $104,515 | | | | $107,150 | | | | $70,988 | | | | $46,780 | | | | $25,009 | |
See Notes to Financial Statements
22
Financial Highlights – continued
| | | | | | | | | | | | | | | | | | | | | | | | |
| | | Six months
ended
8/31/13 (unaudited) | | | Years ended 2/28, 2/29 | |
| Class R4 | | | 2013 | | | 2012 | | | 2011 | | | 2010 | | | 2009 | |
| | | | | | | | | | | | | | | | | |
Net asset value, beginning of period | | | $10.41 | | | | $10.55 | | | | $10.13 | | | | $10.15 | | | | $9.93 | | | | $9.78 | |
| Income (loss) from investment operations | | | | | |
Net investment income (d) | | | $0.10 | | | | $0.22 | | | | $0.27 | | | | $0.32 | | | | $0.37 | | | | $0.41 | |
Net realized and unrealized gain
(loss) on investments | | | (0.38 | ) | | | (0.02 | ) | | | 0.47 | | | | 0.01 | (g) | | | 0.26 | | | | 0.19 | |
Total from investment operations | | | $(0.28 | ) | | | $0.20 | | | | $0.74 | | | | $0.33 | | | | $0.63 | | | | $0.60 | |
| Less distributions declared to shareholders | | | | | |
From net investment income | | | $(0.12 | ) | | | $(0.29 | ) | | | $(0.32 | ) | | | $(0.35 | ) | | | $(0.41 | ) | | | $(0.45 | ) |
From net realized gain on
investments | | | (0.03 | ) | | | (0.05 | ) | | | — | | | | — | | | | — | | | | — | |
Total distributions declared to
shareholders | | | $(0.15 | ) | | | $(0.34 | ) | | | $(0.32 | ) | | | $(0.35 | ) | | | $(0.41 | ) | | | $(0.45 | ) |
Net asset value, end of period (x) | | | $9.98 | | | | $10.41 | | | | $10.55 | | | | $10.13 | | | | $10.15 | | | | $9.93 | |
Total return (%) (r)(s)(x) | | | (2.71 | )(n) | | | 1.89 | | | | 7.40 | | | | 3.22 | | | | 6.46 | | | | 6.32 | |
Ratios (%) (to average net assets)
and Supplemental data: | |
Expenses before expense reductions (f) | | | 0.63 | (a) | | | 0.62 | | | | 0.60 | | | | 0.63 | | | | 0.63 | | | | 0.66 | |
Expenses after expense reductions (f) | | | 0.63 | (a) | | | 0.62 | | | | 0.60 | | | | 0.63 | | | | 0.62 | | | | 0.55 | |
Net investment income | | | 1.92 | (a) | | | 2.10 | | | | 2.61 | | | | 3.10 | | | | 3.71 | | | | 4.23 | |
Portfolio turnover | | | 76 | (n) | | | 81 | | | | 49 | | | | 34 | | | | 32 | | | | 57 | |
Net assets at end of period
(000 omitted) | | | $67,153 | | | | $70,662 | | | | $51,626 | | | | $27,022 | | | | $11,337 | | | | $4,361 | |
See Notes to Financial Statements
23
Financial Highlights – continued
| | | | | | | | |
| Class R5 | | Six months ended
8/31/13 | | | Years ended
2/28/13 (i) | |
| | | (unaudited) | | | | |
Net asset value, beginning of period | | | $10.40 | | | | $10.53 | |
| Income (loss) from investment operations | | | | | | | | |
Net investment income (d) | | | $0.11 | | | | $0.13 | |
Net realized and unrealized gain (loss)
on investments and foreign currency | | | (0.39 | ) | | | (0.06 | ) |
Total from investment operations | | | $(0.28 | ) | | | $0.07 | |
| Less distributions declared to shareholders | | | | | | | | |
From net investment income | | | $(0.12 | ) | | | $(0.20 | ) |
From net realized gain on investments | | | (0.03 | ) | | | — | |
Total distributions declared to shareholders | | | $(0.15 | ) | | | $(0.20 | ) |
Net asset value, end of period (x) | | | $9.97 | | | | $10.40 | |
Total return (%) (r)(s)(x) | | | (2.65 | )(n) | | | 0.62 | (n) |
Ratios (%) (to average net assets)
and Supplemental data: | | | | | | | | |
Expenses before expense reductions (f) | | | 0.51 | (a) | | | 0.54 | (a) |
Expenses after expense reductions (f) | | | 0.51 | (a) | | | 0.54 | (a) |
Net investment income | | | 2.05 | (a) | | | 1.81 | (a) |
Portfolio turnover | | | 76 | (n) | | | 81 | |
Net assets at end of period (000 omitted) | | | $823,826 | | | | $721,119 | |
| (d) | Per share data is based on average shares outstanding. |
| (f) | Ratios do not reflect reductions from fees paid indirectly, if applicable. |
| (g) | The per share amount varies from the net realized and unrealized gain/loss for the period because of the timing of sales of fund shares and the per share amount of realized and unrealized gains and losses at such time. |
| (i) | For the period from the class inception, July 2, 2012, through the stated period end. |
| (r) | Certain expenses have been reduced without which performance would have been lower. |
| (s) | From time to time the fund may receive proceeds from litigation settlements, without which performance would be lower. |
| (t) | Total returns do not include any applicable sales charges. |
| (w) | Per share amount was less than $0.01. |
| (x) | The net asset values per share and total returns have been calculated on net assets which include adjustments made in accordance with U.S. generally accepted accounting principles required at period end for financial reporting purposes. |
See Notes to Financial Statements
24
NOTES TO FINANCIAL STATEMENTS
(unaudited)
(1) Business and Organization
MFS Government Securities Fund (the fund) is a series of MFS Series Trust XIII (the trust). The trust is organized as a Massachusetts business trust and is registered under the Investment Company Act of 1940, as amended, as an open-end management investment company.
(2) Significant Accounting Policies
General – The preparation of financial statements in conformity with U.S. generally accepted accounting principles requires management to make estimates and assumptions that affect the reported amounts of assets and liabilities, and disclosure of contingent assets and liabilities at the date of the financial statements and the reported amounts of revenues and expenses during the reporting period. Actual results could differ from those estimates. In the preparation of these financial statements, management has evaluated subsequent events occurring after the date of the fund’s Statement of Assets and Liabilities through the date that the financial statements were issued. The fund invests a significant portion of its assets in asset-backed and/or mortgage-backed securities. The value of these securities may depend, in part, on the issuer’s or borrower’s credit quality or ability to pay principal and interest when due and may fall if an issuer or borrower defaults on its obligation to pay principal or interest or if the instrument’s credit rating is downgraded by a credit rating agency. U.S. Government securities not supported as to the payment of principal or interest by the U.S. Treasury, such as those issued by Fannie Mae, Freddie Mac, and the Federal Home Loan Banks, are subject to greater credit risk than are U.S. Government securities supported by the U.S. Treasury, such as those issued by Ginnie Mae.
In this reporting period, the fund adopted the disclosure provisions of the Financial Accounting Standards Board (FASB) Accounting Standards Update 2011-11 (“ASU 2011-11”), Balance Sheet (Topic 210) – Disclosures about Offsetting Assets and Liabilities along with the related scope clarification provisions of FASB Accounting Standards Update 2013-01 (“ASU 2013-01”) entitled Balance Sheet (Topic 210) – Clarifying the Scope of Disclosures about Offsetting Assets and Liabilities. ASU 2011-11 is intended to enhance disclosures on the offsetting of financial assets and liabilities by requiring entities to disclose both gross and net information about financial instruments and transactions that are either offset in the statement of financial position or subject to a Master Netting Agreement or similar arrangement. ASU 2013-01 limits the scope of ASU 2011-11’s disclosure requirements on offsetting to financial assets and financial liabilities related to derivatives, repurchase and reverse repurchase agreements, and securities lending and securities borrowing transactions. The disclosures required by ASU 2011-11, to the extent applicable to the fund, have been included in the fund’s Significant Accounting Policies note under the captions for each of the fund’s in-scope financial instruments and transactions.
In June 2013, FASB issued Accounting Standards Update 2013-08 Financial Services – Investment Companies (Topic 946) – Amendments to the Scope, Measurement, and Disclosure Requirements (“ASU 2013-08”) which is effective for interim and annual reporting periods in fiscal years that begin after December 15, 2013. ASU 2013-08 sets forth a methodology for determining whether an entity
25
Notes to Financial Statements (unaudited) – continued
should be characterized as an investment company and prescribes fair value accounting for an investment company’s non-controlling ownership interest in another investment company. FASB has determined that a fund registered under the Investment Company Act of 1940 automatically meets ASU 2013-08’s criteria for an investment company. Although still evaluating the potential impacts of ASU 2013-08 to the fund, management expects that the impact of the fund’s adoption will be limited to additional financial statement disclosures.
Investment Valuations – Debt instruments and floating rate loans (other than short-term instruments), including restricted debt instruments, are generally valued at an evaluated or composite bid as provided by a third-party pricing service. Short-term instruments with a maturity at issuance of 60 days or less generally are valued at amortized cost, which approximates market value. Open-end investment companies are generally valued at net asset value per share. Securities and other assets generally valued on the basis of information from a third-party pricing service may also be valued at a broker/dealer bid quotation. Values obtained from third-party pricing services can utilize both transaction data and market information such as yield, quality, coupon rate, maturity, type of issue, trading characteristics, and other market data.
The Board of Trustees has delegated primary responsibility for determining or causing to be determined the value of the fund’s investments (including any fair valuation) to the adviser pursuant to valuation policies and procedures approved by the Board. If the adviser determines that reliable market quotations are not readily available, investments are valued at fair value as determined in good faith by the adviser in accordance with such procedures under the oversight of the Board of Trustees. Under the fund’s valuation policies and procedures, market quotations are not considered to be readily available for most types of debt instruments and floating rate loans and many types of derivatives. These investments are generally valued at fair value based on information from third-party pricing services. In addition, investments may be valued at fair value if the adviser determines that an investment’s value has been materially affected by events occurring after the close of the exchange or market on which the investment is principally traded (such as foreign exchange or market) and prior to the determination of the fund’s net asset value, or after the halting of trading of a specific security where trading does not resume prior to the close of the exchange or market on which the security is principally traded. The adviser generally relies on third-party pricing services or other information (such as the correlation with price movements of similar securities in the same or other markets; the type, cost and investment characteristics of the security; the business and financial condition of the issuer; and trading and other market data) to assist in determining whether to fair value and at what value to fair value an investment. The value of an investment for purposes of calculating the fund’s net asset value can differ depending on the source and method used to determine value. When fair valuation is used, the value of an investment used to determine the fund’s net asset value may differ from quoted or published prices for the same investment. There can be no assurance that the fund could obtain the fair value assigned to an investment if it were to sell the investment at the same time at which the fund determines its net asset value per share.
Various inputs are used in determining the value of the fund’s assets or liabilities. These inputs are categorized into three broad levels. In certain cases, the inputs used to
26
Notes to Financial Statements (unaudited) – continued
measure fair value may fall into different levels of the fair value hierarchy. In such cases, an investment’s level within the fair value hierarchy is based on the lowest level of input that is significant to the fair value measurement. The fund’s assessment of the significance of a particular input to the fair value measurement in its entirety requires judgment, and considers factors specific to the investment. Level 1 includes unadjusted quoted prices in active markets for identical assets or liabilities. Level 2 includes other significant observable market-based inputs (including quoted prices for similar securities, interest rates, prepayment speed, and credit risk). Level 3 includes unobservable inputs, which may include the adviser’s own assumptions in determining the fair value of investments. The following is a summary of the levels used as of August 31, 2013 in valuing the fund’s assets or liabilities:
| | | | | | | | | | | | | | | | |
| Investments at Value | | Level 1 | | | Level 2 | | | Level 3 | | | Total | |
| U.S. Treasury Bonds & U.S. Government Agency & Equivalents | | | $— | | | | $792,714,166 | | | | $— | | | | $792,714,166 | |
| Municipal Bonds | | | — | | | | 9,828,250 | | | | — | | | | 9,828,250 | |
| U.S. Corporate Bonds | | | — | | | | 20,496,368 | | | | — | | | | 20,496,368 | |
| Residential Mortgage-Backed Securities | | | — | | | | 1,056,609,623 | | | | — | | | | 1,056,609,623 | |
| Commercial Mortgage-Backed Securities | | | — | | | | 53,836,107 | | | | — | | | | 53,836,107 | |
| Mutual Funds | | | 229,881,589 | | | | — | | | | — | | | | 229,881,589 | |
| Total Investments | | | $229,881,589 | | | | $1,933,484,514 | | | | $— | | | | $2,163,366,103 | |
For further information regarding security characteristics, see the Portfolio of Investments.
Indemnifications – Under the fund’s organizational documents, its officers and Trustees may be indemnified against certain liabilities and expenses arising out of the performance of their duties to the fund. Additionally, in the normal course of business, the fund enters into agreements with service providers that may contain indemnification clauses. The fund’s maximum exposure under these agreements is unknown as this would involve future claims that may be made against the fund that have not yet occurred.
Investment Transactions and Income – Investment transactions are recorded on the trade date. Interest income is recorded on the accrual basis. All premium and discount is amortized or accreted for financial statement purposes in accordance with U.S. generally accepted accounting principles. Interest payments received in additional securities are recorded on the ex-interest date in an amount equal to the value of the security on such date.
The fund may receive proceeds from litigation settlements. Any proceeds received from litigation involving portfolio holdings are reflected in the Statement of Operations in realized gain/loss if the security has been disposed of by the fund or in unrealized gain/loss if the security is still held by the fund. Any other proceeds from litigation not related to portfolio holdings are reflected as other income in the Statement of Operations.
The fund purchased or sold debt securities on a when-issued or delayed delivery basis, or in a “To Be Announced” (TBA) or “forward commitment” transaction with delivery
27
Notes to Financial Statements (unaudited) – continued
or payment to occur at a later date beyond the normal settlement period. TBA securities resulting from these transactions are included in the Portfolio of Investments. At the time a fund enters into a commitment to purchase or sell a security, the transaction is recorded and the value of the security acquired is reflected in the fund’s net asset value. The price of such security and the date that the security will be delivered and paid for are fixed at the time the transaction is negotiated. The value of the security may vary with market fluctuations. TBA purchase commitments are held at carrying amount, which approximates fair value and are categorized as level 2 within the fair value hierarchy disclosure. No interest accrues to the fund until payment takes place. At the time that a fund enters into this type of transaction, the fund is required to have sufficient cash and/or liquid securities to cover its commitments. Losses may arise due to changes in the value of the underlying securities or if the counterparty does not perform under the contract’s terms, or if the issuer does not issue the securities due to political, economic or other factors. Additionally, losses may arise due to declines in the value of the securities prior to settlement date.
Fees Paid Indirectly – The fund’s custody fee may be reduced according to an arrangement that measures the value of cash deposited with the custodian by the fund. This amount, for the six months ended August 31, 2013, is shown as a reduction of total expenses in the Statement of Operations.
Tax Matters and Distributions – The fund intends to qualify as a regulated investment company, as defined under Subchapter M of the Internal Revenue Code, and to distribute all of its taxable income, including realized capital gains. As a result, no provision for federal income tax is required. The fund’s federal tax returns, when filed, will remain subject to examination by the Internal Revenue Service for a three year period.
Distributions to shareholders are recorded on the ex-dividend date. Income and capital gain distributions are determined in accordance with income tax regulations, which may differ from U.S. generally accepted accounting principles. Certain capital accounts in the financial statements are periodically adjusted for permanent differences in order to reflect their tax character. These adjustments have no impact on net assets or net asset value per share. Temporary differences which arise from recognizing certain items of income, expense, gain or loss in different periods for financial statement and tax purposes will reverse at some time in the future. Distributions in excess of net investment income or net realized gains are temporary overdistributions for financial statement purposes resulting from differences in the recognition or classification of income or distributions for financial statement and tax purposes.
Book/tax differences primarily relate to amortization and accretion of debt securities.
The tax character of distributions made during the current period will be determined at fiscal year end. The tax character of distributions declared to shareholders for the last fiscal year is as follows:
| | | | |
| | | 2/28/13 | |
| Ordinary income (including any short-term capital gains) | | | $54,540,894 | |
| Long-term capital gains | | | 8,070,835 | |
| Total distributions | | | $62,611,729 | |
28
Notes to Financial Statements (unaudited) – continued
The federal tax cost and the tax basis components of distributable earnings were as follows:
| | | | |
| As of 8/31/13 | | | |
| Cost of investments | | | $2,167,609,848 | |
| Gross appreciation | | | 37,218,065 | |
| Gross depreciation | | | (41,461,810 | ) |
| Net unrealized appreciation (depreciation) | | | $(4,243,745 | ) |
| |
| As of 2/28/13 | | | |
| Undistributed ordinary income | | | 9,876,951 | |
| Post-October capital loss deferral | | | (2,988,073 | ) |
| Other temporary differences | | | (4,929,497 | ) |
| Net unrealized appreciation (depreciation) | | | 65,824,700 | |
The aggregate cost above includes prior fiscal year end tax adjustments, if applicable.
Multiple Classes of Shares of Beneficial Interest – The fund offers multiple classes of shares, which differ in their respective distribution and service fees. The fund’s income and common expenses are allocated to shareholders based on the value of settled shares outstanding of each class. The fund’s realized and unrealized gain (loss) are allocated to shareholders based on the daily net assets of each class. Dividends are declared separately for each class. Differences in per share dividend rates are generally due to differences in separate class expenses. Class B shares will convert to Class A shares approximately eight years after purchase. The fund’s distributions declared to shareholders as reported in the Statements of Changes in Net Assets are presented by class as follows:
| | | | | | | | | | | | | | | | |
| | | From net investment
income | | | From net realized gain on
investments | |
| | | Six months
ended
8/31/13 | | | Year
ended
2/28/13 (i) | | | Six months
ended
8/31/13 | | | Year
ended
2/28/13 (i) | |
| Class A | | | $8,235,523 | | | | $23,727,857 | | | | $2,545,083 | | | | $4,419,398 | |
| Class B | | | 257,228 | | | | 827,611 | | | | 126,410 | | | | 216,076 | |
| Class C | | | 576,765 | | | | 1,965,696 | | | | 285,650 | | | | 520,156 | |
| Class I | | | 427,751 | | | | 6,811,018 | | | | 119,771 | | | | 2,769,801 | |
| Class R1 | | | 39,160 | | | | 129,706 | | | | 18,634 | | | | 33,904 | |
| Class R2 | | | 1,419,809 | | | | 3,957,416 | | | | 493,835 | | | | 801,446 | |
| Class R3 | | | 1,093,575 | | | | 2,789,529 | | | | 340,540 | | | | 516,221 | |
| Class R4 | | | 797,725 | | | | 1,489,916 | | | | 218,191 | | | | 244,415 | |
| Class R5 | | | 9,428,066 | | | | 11,391,563 | | | | 2,471,340 | | | | — | |
| Total | | | $22,275,602 | | | | $53,090,312 | | | | $6,619,454 | | | | $9,521,417 | |
| (i) | For Class R5, the period is from inception, July 2, 2012, through the stated period end. |
(3) Transactions with Affiliates
Investment Adviser – The fund has an investment advisory agreement with MFS to provide overall investment management and related administrative services and facilities to the fund. The management fee is computed daily and paid monthly at an annual rate of 0.40% of the fund’s average daily net assets.
29
Notes to Financial Statements (unaudited) – continued
Effective April 1, 2013, MFS has agreed in writing to reduce its management fee by a specified amount if certain MFS mutual fund assets exceed thresholds agreed to by MFS and the fund’s Board of Trustees. For the period April 1, 2013 through August 31, 2013, this management fee reduction amounted to $4,709, which is shown as a reduction of total expenses in the Statement of Operations. The management fee incurred for the six months ended August 31, 2013 was equivalent to an annual effective rate of 0.40% of the fund’s average daily net assets.
Distributor – MFS Fund Distributors, Inc. (MFD), a wholly-owned subsidiary of MFS, as distributor, received $124,189 for the six months ended August 31, 2013, as its portion of the initial sales charge on sales of Class A shares of the fund.
The Board of Trustees has adopted a distribution plan for certain class shares pursuant to Rule 12b-1 of the Investment Company Act of 1940.
The fund’s distribution plan provides that the fund will pay MFD for services provided by MFD and financial intermediaries in connection with the distribution and servicing of certain share classes. One component of the plan is a distribution fee paid to MFD and another component of the plan is a service fee paid to MFD. MFD may subsequently pay all, or a portion, of the distribution and/or service fees to financial intermediaries.
Distribution Plan Fee Table:
| | | | | | | | | | | | | | | | | | | | |
| | | Distribution
Fee Rate (d) | | | Service
Fee Rate (d) | | | Total
Distribution
Plan (d) | | | Annual
Effective
Rate (e) | | | Distribution
and Service
Fee | |
| Class A | | | — | | | | 0.25% | | | | 0.25% | | | | 0.24% | | | | $1,010,080 | |
| Class B | | | 0.75% | | | | 0.25% | | | | 1.00% | | | | 1.00% | | | | 199,121 | |
| Class C | | | 0.75% | | | | 0.25% | | | | 1.00% | | | | 1.00% | | | | 445,436 | |
| Class R1 | | | 0.75% | | | | 0.25% | | | | 1.00% | | | | 1.00% | | | | 30,324 | |
| Class R2 | | | 0.25% | | | | 0.25% | | | | 0.50% | | | | 0.50% | | | | 396,912 | |
| Class R3 | | | — | | | | 0.25% | | | | 0.25% | | | | 0.25% | | | | 134,302 | |
| Total Distribution and Service Fees | | | | | | | | | | | | $2,216,175 | |
| (d) | In accordance with the distribution plan for certain classes, the fund pays distribution and/or service fees equal to these annual percentage rates of each class’s average daily net assets. The distribution and service fee rates disclosed by class represent the current rates in effect at the end of the reporting period. |
| (e) | The annual effective rates represent actual fees incurred under the distribution plan for the six months ended August 31, 2013 based on each class’s average daily net assets. MFD has voluntarily agreed to rebate a portion of each class’s 0.25% service fee attributable to accounts for which MFD retains the 0.25% service fee except for accounts attributable to MFS or its subsidiaries’ seed money. For the six months ended August 31, 2013, this rebate amounted to $26,055, $272, $147, and $48 for Class A, Class B, Class C, and Class R2, respectively, and is reflected as a reduction of total expenses in the Statement of Operations. |
Certain Class A shares are subject to a contingent deferred sales charge (CDSC) in the event of a shareholder redemption within 18 months of purchase for shares purchased on or after August 1, 2012, and within 24 months of purchase for shares purchased prior to August 1, 2012. Class C shares are subject to a CDSC in the event of a shareholder redemption within 12 months of purchase. Class B shares are subject to a
30
Notes to Financial Statements (unaudited) – continued
CDSC in the event of a shareholder redemption within six years of purchase. All contingent deferred sales charges are paid to MFD and during the six months ended August 31, 2013, were as follows:
| | | | |
| | | Amount | |
| Class A | | | $14,574 | |
| Class B | | | 60,556 | |
| Class C | | | 14,263 | |
Shareholder Servicing Agent – MFS Service Center, Inc. (MFSC), a wholly-owned subsidiary of MFS, receives a fee from the fund for its services as shareholder servicing agent calculated as a percentage of the average daily net assets of the fund as determined periodically under the supervision of the fund’s Board of Trustees. For the six months ended August 31, 2013, the fee was $208,050, which equated to 0.0198% annually of the fund’s average daily net assets. MFSC also receives payment from the fund for out-of-pocket expenses, sub-accounting and other shareholder servicing costs which may be paid to affiliated and unaffiliated service providers. Class R5 shares do not incur sub-accounting fees. For the six months ended August 31, 2013, these out-of-pocket expenses, sub-accounting and other shareholder servicing costs amounted to $920,350.
Under a Special Servicing Agreement among MFS, each MFS fund which invests in other MFS funds (“MFS fund-of-funds”) and certain underlying funds in which a MFS fund-of-funds invests (“underlying funds”), each underlying fund may pay a portion of each MFS fund-of-fund’s transfer agent-related expenses, including sub-accounting fees payable to financial intermediaries, to the extent such payments do not exceed the benefits realized or expected to be realized by the underlying fund from the investment in the underlying fund by the MFS fund-of-fund. For the six months ended August 31, 2013, these costs for the fund amounted to $289,267 and are reflected in the “Shareholder servicing costs” in the Statement of Operations.
Administrator – MFS provides certain financial, legal, shareholder communications, compliance, and other administrative services to the fund. Under an administrative services agreement, the fund partially reimburses MFS the costs incurred to provide these services. The fund is charged an annual fixed amount of $17,500 plus a fee based on average daily net assets. The administrative services fee incurred for the six months ended August 31, 2013 was equivalent to an annual effective rate of 0.0129% of the fund’s average daily net assets.
Trustees’ and Officers’ Compensation – The fund pays compensation to independent Trustees in the form of a retainer, attendance fees, and additional compensation to Board and Committee chairpersons. The fund does not pay compensation directly to Trustees or officers of the fund who are also officers of the investment adviser, all of whom receive remuneration for their services to the fund from MFS. Certain officers and Trustees of the fund are officers or directors of MFS, MFD, and MFSC.
Prior to December 31, 2001, the fund had an unfunded defined benefit plan (“DB plan”) for independent Trustees. As of December 31, 2001, the Board took action to terminate the DB plan with respect to then-current and any future independent Trustees, such that the DB plan covers only certain of those former independent
31
Notes to Financial Statements (unaudited) – continued
Trustees who retired on or before December 31, 2001. Effective January 1, 2002, accrued benefits under the DB plan for then-current independent Trustees who continued were credited to an unfunded retirement deferral plan (the “Retirement Deferral plan”), which was established for and exists solely with respect to these credited amounts, and is not available for other deferrals by these or other independent Trustees. Although the Retirement Deferral plan is unfunded, amounts deferred under the plan are periodically adjusted for investment experience as if they had been invested in shares of the fund. The DB plan resulted in a pension expense of $1,604 and the Retirement Deferral plan resulted in a net decrease in expense of $836. Both amounts are included in independent Trustees’ compensation for the six months ended August 31, 2013. The liability for deferred retirement benefits payable to certain independent Trustees under both plans amounted to $60,484 at August 31, 2013, and is included in “Payable for independent Trustees’ compensation” in the Statement of Assets and Liabilities.
Other – This fund and certain other funds managed by MFS (the funds) have entered into services agreements (the Agreements) which provide for payment of fees by the funds to Tarantino LLC and Griffin Compliance LLC in return for the provision of services of an Independent Chief Compliance Officer (ICCO) and Assistant ICCO, respectively, for the funds. The ICCO and Assistant ICCO are officers of the funds and the sole members of Tarantino LLC and Griffin Compliance LLC, respectively. The funds can terminate the Agreements with Tarantino LLC and Griffin Compliance LLC at any time under the terms of the Agreements. For the six months ended August 31, 2013, the aggregate fees paid by the fund to Tarantino LLC and Griffin Compliance LLC were $7,835 and are included in “Miscellaneous” expense in the Statement of Operations. MFS has agreed to reimburse the fund for a portion of the payments made by the fund in the amount of $3,795, which is shown as a reduction of total expenses in the Statement of Operations. Additionally, MFS has agreed to bear all expenses associated with office space, other administrative support, and supplies provided to the ICCO and Assistant ICCO.
The fund invests in the MFS Institutional Money Market Portfolio which is managed by MFS and seeks current income consistent with preservation of capital and liquidity. Income earned on this investment is included in “Dividends from underlying affiliated funds” in the Statement of Operations. This money market fund does not pay a management fee to MFS.
On June 29, 2012, MFS purchased 9,497 shares of Class R5 for an aggregate amount of $100,000.
(4) Portfolio Securities
Purchases and sales of investments, other than short-term obligations, were as follows:
| | | | | | | | |
| | | Purchases | | | Sales | |
| U.S. Government securities | | | $1,502,880,265 | | | | $1,593,231,688 | |
| Investments (non-U.S. Government securities) | | | $73,121,610 | | | | $18,385,253 | |
32
Notes to Financial Statements (unaudited) – continued
(5) Shares of Beneficial Interest
The fund’s Declaration of Trust permits the Trustees to issue an unlimited number of full and fractional shares of beneficial interest. Transactions in fund shares were as follows:
| | | | | | | | | | | | | | | | |
| | | Six months ended
8/31/13 | | | Year ended
2/28/13 (i) | |
| | | Shares | | | Amount | | | Shares | | | Amount | |
| Shares sold | | | | | | | | | | | | | | | | |
Class A | | | 7,428,918 | | | | $76,019,617 | | | | 19,324,791 | | | | $203,271,251 | |
Class B | | | 203,461 | | | | 2,096,873 | | | | 1,107,143 | | | | 11,637,204 | |
Class C | | | 553,172 | | | | 5,708,664 | | | | 2,965,801 | | | | 31,274,468 | |
Class I | | | 745,781 | | | | 7,646,670 | | | | 7,517,986 | | | | 79,192,395 | |
Class R1 | | | 45,982 | | | | 471,155 | | | | 187,327 | | | | 1,967,965 | |
Class R2 | | | 1,282,074 | | | | 13,138,408 | | | | 4,803,800 | | | | 50,439,705 | |
Class R3 | | | 2,038,069 | | | | 21,009,765 | | | | 3,674,269 | | | | 38,608,698 | |
Class R4 | | | 915,346 | | | | 9,378,386 | | | | 5,137,378 | | | | 53,893,566 | |
Class R5 | | | 12,544,122 | | | | 128,304,531 | | | | 68,774,393 | | | | 725,004,633 | |
| | | 25,756,925 | | | | $263,774,069 | | | | 113,492,888 | | | | $1,195,289,885 | |
Shares issued to shareholders in
reinvestment of distributions | | | | | | | | | |
Class A | | | 759,007 | | | | $7,745,056 | | | | 1,947,717 | | | | $20,509,344 | |
Class B | | | 34,202 | | | | 348,718 | | | | 87,264 | | | | 917,581 | |
Class C | | | 62,867 | | | | 643,453 | | | | 172,413 | | | | 1,819,446 | |
Class I | | | 24,552 | | | | 250,480 | | | | 808,136 | | | | 8,518,305 | |
Class R1 | | | 5,652 | | | | 57,666 | | | | 15,504 | | | | 163,124 | |
Class R2 | | | 174,815 | | | | 1,782,102 | | | | 420,973 | | | | 4,427,835 | |
Class R3 | | | 140,632 | | | | 1,433,963 | | | | 313,790 | | | | 3,302,614 | |
Class R4 | | | 82,863 | | | | 845,345 | | | | 136,578 | | | | 1,436,753 | |
Class R5 | | | 1,168,425 | | | | 11,899,365 | | | | 1,085,283 | | | | 11,391,532 | |
| | | 2,453,015 | | | | $25,006,148 | | | | 4,987,658 | | | | $52,486,534 | |
| | | | |
| Shares reacquired | | | | | | | | | | | | | | | | |
Class A | | | (15,675,586 | ) | | | $(159,834,805 | ) | | | (32,984,988 | ) | | | $(346,824,129 | ) |
Class B | | | (1,059,182 | ) | | | (10,795,477 | ) | | | (1,389,242 | ) | | | (14,570,937 | ) |
Class C | | | (3,090,990 | ) | | | (31,584,780 | ) | | | (4,121,907 | ) | | | (43,376,063 | ) |
Class I | | | (1,759,011 | ) | | | (17,862,817 | ) | | | (57,786,744 | ) | | | (610,566,814 | ) |
Class R1 | | | (151,979 | ) | | | (1,559,309 | ) | | | (313,640 | ) | | | (3,295,793 | ) |
Class R2 | | | (2,808,190 | ) | | | (28,703,428 | ) | | | (5,296,892 | ) | | | (55,615,422 | ) |
Class R3 | | | (1,991,059 | ) | | | (20,353,449 | ) | | | (4,107,019 | ) | | | (43,124,948 | ) |
Class R4 | | | (1,057,476 | ) | | | (10,832,454 | ) | | | (3,381,281 | ) | | | (35,521,097 | ) |
Class R5 | | | (424,570 | ) | | | (4,337,810 | ) | | | (516,708 | ) | | | (5,481,403 | ) |
| | | (28,018,043 | ) | | | $(285,864,329 | ) | | | (109,898,421 | ) | | | $(1,158,376,606 | ) |
33
Notes to Financial Statements (unaudited) – continued
| | | | | | | | | | | | | | | | |
| | | Six months ended
8/31/13 | | | Year ended
2/28/13 (i) | |
| | | Shares | | | Amount | | | Shares | | | Amount | |
| Net change | | | | | | | | | | | | | | | | |
Class A | | | (7,487,661 | ) | | | $(76,070,132 | ) | | | (11,712,480 | ) | | | $(123,043,534 | ) |
Class B | | | (821,519 | ) | | | (8,349,886 | ) | | | (194,835 | ) | | | (2,016,152 | ) |
Class C | | | (2,474,951 | ) | | | (25,232,663 | ) | | | (983,693 | ) | | | (10,282,149 | ) |
Class I | | | (988,678 | ) | | | (9,965,667 | ) | | | (49,460,622 | ) | | | (522,856,114 | ) |
Class R1 | | | (100,345 | ) | | | (1,030,488 | ) | | | (110,809 | ) | | | (1,164,704 | ) |
Class R2 | | | (1,351,301 | ) | | | (13,782,918 | ) | | | (72,119 | ) | | | (747,882 | ) |
Class R3 | | | 187,642 | | | | 2,090,279 | | | | (118,960 | ) | | | (1,213,636 | ) |
Class R4 | | | (59,267 | ) | | | (608,723 | ) | | | 1,892,675 | | | | 19,809,222 | |
Class R5 | | | 13,287,977 | | | | 135,866,086 | | | | 69,342,968 | | | | 730,914,762 | |
| | | 191,897 | | | | $2,915,888 | | | | 8,582,125 | | | | $89,399,813 | |
| (i) | For Class R5, the period is from inception, July 2, 2012, through the stated period end. |
The fund is one of several mutual funds in which the MFS funds-of-funds may invest. The MFS funds-of-funds do not invest in the underlying MFS funds for the purpose of exercising management or control. At the end of the period, the MFS Moderate Allocation Fund, the MFS Conservative Allocation Fund, MFS Lifetime 2020 Fund, MFS Lifetime Retirement Income Fund, and the MFS Lifetime 2010 Fund were the owners of record of approximately 25%, 12%, 2%, 1%, and 1% respectively, of the value of outstanding voting shares of the fund. In addition, the MFS Lifetime 2015 Fund and the MFS Lifetime 2025 Fund were each the owners of record of less than 1% of the value of outstanding voting shares of the fund.
(6) Line of Credit
The fund and certain other funds managed by MFS participate in a $1.1 billion unsecured committed line of credit, subject to a $1 billion sublimit, provided by a syndication of banks under a credit agreement. Borrowings may be made for temporary financing needs. Interest is charged to each fund, based on its borrowings, generally at a rate equal to the higher of the Federal Reserve funds rate or one month LIBOR plus an agreed upon spread. A commitment fee, based on the average daily, unused portion of the committed line of credit, is allocated among the participating funds at the end of each calendar quarter. In addition, the fund and other funds managed by MFS have established unsecured uncommitted borrowing arrangements with certain banks for temporary financing needs. Interest is charged to each fund, based on its borrowings, at a rate equal to the Federal Reserve funds rate plus an agreed upon spread. For the six months ended August 31, 2013, the fund’s commitment fee and interest expense were $5,366 and $0, respectively, and are included in “Miscellaneous” expense in the Statement of Operations.
34
Notes to Financial Statements (unaudited) – continued
(7) Transactions in Underlying Affiliated Funds-Affiliated Issuers
An affiliated issuer may be considered one in which the fund owns 5% or more of the outstanding voting securities, or a company which is under common control. For the purposes of this report, the fund assumes the following to be an affiliated issuer:
| | | | | | | | | | | | | | | | |
| Underlying Affiliated Fund | | Beginning
Shares/Par
Amount | | | Acquisitions
Shares/Par
Amount | | | Dispositions
Shares/Par
Amount | | | Ending
Shares/Par
Amount | |
MFS Institutional Money
Market Portfolio | | | 473,727,945 | | | | 364,173,090 | | | | (608,019,446 | ) | | | 229,881,589 | |
| | | | |
| Underlying Affiliated Fund | | Realized
Gain (Loss) | | | Capital Gain
Distributions | | | Dividend
Income | | | Ending
Value | |
MFS Institutional Money
Market Portfolio | | | $— | | | | $— | | | | $214,110 | | | | $229,881,589 | |
35
BOARD REVIEW OF INVESTMENT ADVISORY AGREEMENT
The Investment Company Act of 1940 requires that both the full Board of Trustees and a majority of the non-interested (“independent”) Trustees, voting separately, annually approve the continuation of the Fund’s investment advisory agreement with MFS. The Trustees consider matters bearing on the Fund and its advisory arrangements at their meetings throughout the year, including a review of performance data at each regular meeting. In addition, the independent Trustees met several times over the course of three months beginning in May and ending in July, 2013 (“contract review meetings”) for the specific purpose of considering whether to approve the continuation of the investment advisory agreement for the Fund and the other investment companies that the Board oversees (the “MFS Funds”). The independent Trustees were assisted in their evaluation of the Fund’s investment advisory agreement by independent legal counsel, from whom they received separate legal advice and with whom they met separately from MFS during various contract review meetings. The independent Trustees were also assisted in this process by the MFS Funds’ Independent Chief Compliance Officer, a full-time senior officer appointed by and reporting to the independent Trustees.
In connection with their deliberations regarding the continuation of the investment advisory agreement, the Trustees, including the independent Trustees, considered such information and factors as they believed, in light of the legal advice furnished to them and their own business judgment, to be relevant. The investment advisory agreement for the Fund was considered separately, although the Trustees also took into account the common interests of all MFS Funds in their review. As described below, the Trustees considered the nature, quality, and extent of the various investment advisory, administrative, and shareholder services performed by MFS under the existing investment advisory agreement and other arrangements with the Fund.
In connection with their contract review meetings, the Trustees received and relied upon materials that included, among other items: (i) information provided by Lipper Inc., an independent third party, on the investment performance of the Fund for various time periods ended December 31, 2012 and the investment performance of a group of funds with substantially similar investment classifications/objectives (the “Lipper performance universe”), (ii) information provided by Lipper Inc. on the Fund’s advisory fees and other expenses and the advisory fees and other expenses of comparable funds identified by Lipper Inc. (the “Lipper expense group”), (iii) information provided by MFS on the advisory fees of comparable portfolios of other clients of MFS, including institutional separate accounts and other clients, (iv) information as to whether and to what extent applicable expense waivers, reimbursements or fee “breakpoints” are observed for the Fund, (v) information regarding MFS’ financial results and financial condition, including MFS’ and certain of its affiliates’ estimated profitability from services performed for the Fund and the MFS Funds as a whole, and compared to MFS’ institutional business, (vi) MFS’ views regarding the outlook for the mutual fund industry and the strategic business plans of MFS, (vii) descriptions of various functions performed by MFS for the Funds, such as compliance monitoring and portfolio trading practices, and (viii) information regarding the overall organization of MFS, including information about MFS’ senior management and other personnel providing investment advisory, administrative and other services to
36
Board Review of Investment Advisory Agreement – continued
the Fund and the other MFS Funds. The comparative performance, fee and expense information prepared and provided by Lipper Inc. was not independently verified and the independent Trustees did not independently verify any information provided to them by MFS.
The Trustees’ conclusion as to the continuation of the investment advisory agreement was based on a comprehensive consideration of all information provided to the Trustees and not the result of any single factor. Some of the factors that figured particularly in the Trustees’ deliberations are described below, although individual Trustees may have evaluated the information presented differently from one another, giving different weights to various factors. It is also important to recognize that the fee arrangements for the Fund and other MFS Funds are the result of years of review and discussion between the independent Trustees and MFS, that certain aspects of such arrangements may receive greater scrutiny in some years than in others, and that the Trustees’ conclusions may be based, in part, on their consideration of these same arrangements during the course of the year and in prior years.
Based on information provided by Lipper Inc. and MFS, the Trustees reviewed the Fund’s total return investment performance as well as the performance of peer groups of funds over various time periods. The Trustees placed particular emphasis on the total return performance of the Fund’s Class A shares in comparison to the performance of funds in its Lipper performance universe over the three-year period ended December 31, 2012, which the Trustees believed was a long enough period to reflect differing market conditions. The total return performance of the Fund’s Class A shares was in the 3rd quintile relative to the other funds in the universe for this three-year period (the 1st quintile being the best performers and the 5th quintile being the worst performers). The total return performance of the Fund’s Class A shares was in the 4th quintile for the one-year period and the 2nd quintile for the five-year period ended December 31, 2012 relative to the Lipper performance universe. Because of the passage of time, these performance results may differ from the performance results for more recent periods, including those shown elsewhere in this report.
In the course of their deliberations, the Trustees took into account information provided by MFS in connection with the contract review meetings, as well as during investment review meetings conducted with portfolio management personnel during the course of the year regarding the Fund’s performance. After reviewing these and related factors, the Trustees concluded, within the context of their overall conclusions regarding the investment advisory agreement, that they were satisfied with MFS’ responses and efforts relating to investment performance.
In assessing the reasonableness of the Fund’s advisory fee, the Trustees considered, among other information, the Fund’s advisory fee and the total expense ratio of the Fund’s Class A shares as a percentage of average daily net assets and the advisory fee and total expense ratios of peer groups of funds based on information provided by Lipper Inc. The Trustees considered that, according to the Lipper data (which takes into account any fee reductions or expense limitations that were in effect during the Fund’s last fiscal year), the Fund’s effective advisory fee rate was lower than the Lipper expense group median, and the Fund’s total expense ratio was approximately at the Lipper expense group median.
37
Board Review of Investment Advisory Agreement – continued
The Trustees also considered the advisory fees charged by MFS to any comparable institutional accounts. In comparing these fees, the Trustees considered information provided by MFS as to the generally broader scope of services provided by MFS to the Fund in comparison to institutional accounts, the higher demands placed on MFS’ investment personnel and trading infrastructure as a result of the daily cash in-flows and out-flows of the Fund, and the impact on MFS and expenses associated with the more extensive regulatory regime to which the Fund is subject in comparison to institutional accounts.
The Trustees also considered whether the Fund may benefit from any economies of scale in the management of the Fund in the event of growth in assets of the Fund and/or growth in assets of the MFS Funds as a whole. They noted that the Fund’s advisory fee rate schedule is not subject to any breakpoints. Taking into account that the Fund’s effective advisory fee rate was lower than the Lipper expense group median described above, the Trustees determined not to recommend any advisory fee breakpoints for the Fund at this time. The Trustees also noted that MFS has agreed in writing to waive a portion of the management fees of certain MFS Funds, including the Fund, if the total combined assets of certain funds within the MFS Funds’ complex increase above agreed upon thresholds (the “group fee waiver”), enabling the Fund’s shareholders to share in the benefits from any economies of scale at the complex level. The group fee waiver is reviewed and renewed annually between the Board and MFS. The Trustees concluded that the group fee waiver was sufficient to allow the Fund to benefit from economies of scale as its assets and overall complex assets grow.
The Trustees also considered information prepared by MFS relating to MFS’ costs and profits with respect to the Fund, the MFS Funds considered as a group, and other investment companies and accounts advised by MFS, as well as MFS’ methodologies used to determine and allocate its costs to the MFS Funds, the Fund and other accounts and products for purposes of estimating profitability.
After reviewing these and other factors described herein, the Trustees concluded, within the context of their overall conclusions regarding the investment advisory agreement, that the advisory fees charged to the Fund represent reasonable compensation in light of the services being provided by MFS to the Fund.
In addition, the Trustees considered MFS’ resources and related efforts to continue to retain, attract and motivate capable personnel to serve the Fund. The Trustees also considered current and developing conditions in the financial services industry, including the presence of large and well-capitalized companies which are spending, and appear to be prepared to continue to spend, substantial sums to engage personnel and to provide services to competing investment companies. In this regard, the Trustees also considered the financial resources of MFS and its ultimate parent, Sun Life Financial Inc. The Trustees also considered the advantages and possible disadvantages to the Fund of having an adviser that also serves other investment companies as well as other accounts.
The Trustees also considered the nature, quality, cost, and extent of administrative, transfer agency, and distribution services provided to the Fund by MFS and its affiliates under agreements and plans other than the investment advisory agreement, including any 12b-1 fees the Fund pays to MFS Fund Distributors, Inc., an affiliate of MFS. The
38
Board Review of Investment Advisory Agreement – continued
Trustees also considered the nature, extent and quality of certain other services MFS performs or arranges for on the Fund’s behalf, which may include securities lending programs, directed expense payment programs, class action recovery programs, and MFS’ interaction with third-party service providers, principally custodians and sub-custodians. The Trustees concluded that the various non-advisory services provided by MFS and its affiliates on behalf of the Fund were satisfactory.
The Trustees also considered benefits to MFS from the use of the Fund’s portfolio brokerage commissions, if applicable, to pay for investment research and various other factors. Additionally, the Trustees considered so-called “fall-out benefits” to MFS such as reputational value derived from serving as investment manager to the Fund.
Based on their evaluation of factors that they deemed to be material, including those factors described above, the Board of Trustees, including the independent Trustees, concluded that the Fund’s investment advisory agreement with MFS should be continued for an additional one-year period, commencing August 1, 2013.
A discussion regarding the Board’s most recent review and renewal of the fund’s Investment Advisory Agreement with MFS is available by clicking on the fund’s name under “Mutual Funds” in the “Products” section of the MFS Web site (mfs.com).
39
PROXY VOTING POLICIES AND INFORMATION
A general description of the MFS funds’ proxy voting policies and procedures is available without charge, upon request, by calling 1-800-225-2606, by visiting the Proxy Voting section of mfs.com or by visiting the SEC’s Web site at http://www.sec.gov.
Information regarding how the fund voted proxies relating to portfolio securities during the most recent twelve-month period ended June 30 is available without charge by visiting the Proxy Voting section of mfs.com or by visiting the SEC’s Web site at http://www.sec.gov.
QUARTERLY PORTFOLIO DISCLOSURE
The fund will file a complete schedule of portfolio holdings with the Securities and Exchange Commission (the Commission) for the first and third quarters of each fiscal year on Form N-Q. A shareholder can obtain the quarterly portfolio holdings report at mfs.com. The fund’s Form N-Q is also available on the EDGAR database on the Commission’s Internet Web site at http://www.sec.gov, and may be reviewed and copied at the:
Public Reference Room
Securities and Exchange Commission
100 F Street, NE, Room 1580
Washington, D.C. 20549
Information on the operation of the Public Reference Room may be obtained by calling the Commission at 1-800-SEC-0330. Copies of the fund’s Form N-Q also may be obtained, upon payment of a duplicating fee, by electronic request at the following e-mail address: publicinfo@sec.gov, or by writing the Public Reference Section at the above address.
FURTHER INFORMATION
From time to time, MFS may post important information about the fund or the MFS funds on the MFS web site (mfs.com). This information is available by visiting the “News & Commentary” section of mfs.com or by clicking on the fund’s name under “Mutual Funds” in the “Products” section of mfs.com.
PROVISION OF FINANCIAL REPORTS AND SUMMARY PROSPECTUSES
The fund produces financial reports every six months and updates its summary prospectus and prospectus annually. To avoid sending duplicate copies of materials to households, only one copy of the fund’s annual and semiannual report and summary prospectus may be mailed to shareholders having the same last name and residential address on the fund’s records. However, any shareholder may contact MFSC (please see back cover for address and telephone number) to request that copies of these reports and summary prospectuses be sent personally to that shareholder.
40
Save paper with eDelivery.

| MFS® will send you prospectuses, |
reports, and proxies directly via e-mail so you will get information faster with less mailbox clutter.
To sign up:
1. Go to mfs.com.
2. Log in via MFS® Access.
3. Select eDelivery.
If you own your MFS fund shares through a financial institution or a retirement plan, MFS® TALK, MFS® Access, or eDelivery may not be available to you.
CONTACT
WEB SITE
mfs.com
MFS TALK
1-800-637-8255
24 hours a day
ACCOUNT SERVICE AND LITERATURE
Shareholders
1-800-225-2606
Financial advisors
1-800-343-2829
Retirement plan services
1-800-637-1255
MAILING ADDRESS
MFS Service Center, Inc.
P.O. Box 55824
Boston, MA 02205-5824
OVERNIGHT MAIL
MFS Service Center, Inc.
c/o Boston Financial Data Services
30 Dan Road
Canton, MA 02021-2809
SEMIANNUAL REPORT
August 31, 2013

MFS® GLOBAL REAL ESTATE FUND

GRE-SEM
MFS® GLOBAL REAL ESTATE FUND
CONTENTS
The report is prepared for the general information of shareholders.
It is authorized for distribution to prospective investors only when preceded or accompanied by a current prospectus.
NOT FDIC INSURED Ÿ MAY LOSE VALUE Ÿ NO BANK GUARANTEE

LETTER FROM THE CHAIRMAN AND CEO
Dear Shareholders:
Global economic trends appear to favor growth again despite risks created by the U.S. government’s gridlock. The U.S. economy’s slow but steady expansion is no longer the
exception. The eurozone has emerged from its 18-month-long recession, with Germany leading the way. China’s monthly gauges of economic activity once again point toward expansion. And Japan is picking up momentum in response to its government’s and central bank’s aggressive program of monetary easing.
However, geopolitical risks have risen, with violence erupting in Egypt and Syria and the possibility of further unrest in the Middle East. The U.S. Federal Reserve’s expected tapering of its bond-buying stimulus program has weighed on global markets
since May. Emerging markets, including Brazil and India, have borne much of the brunt, as their currency values have dropped and nervous investors have fled to safety elsewhere. In Europe, unemployment persists at historically high levels. The trend towards a pickup in global growth, while encouraging, appears tenuous, particularly with the risk of a U.S. debt default.
As always, managing risk in the face of uncertainty remains a top priority for investors. At MFS®, our uniquely collaborative investment process employs integrated, global research and active risk management. Our global team of investment professionals shares ideas and evaluates opportunities across continents, investment disciplines and asset classes — all with a goal of building better insights, and ultimately better results, for our clients.
We are mindful of the many economic challenges investors face, and believe it is more important than ever to maintain a long-term view and employ time-tested principles, such as asset allocation and diversification. We remain confident that our unique approach can serve investors well as they work with their financial advisors to identify and pursue the most suitable opportunities.
Respectfully,

Robert J. Manning
Chairman and Chief Executive Officer
MFS Investment Management®
October 17, 2013
The opinions expressed in this letter are subject to change, may not be relied upon for investment advice, and no forecasts can be guaranteed.
1
PORTFOLIO COMPOSITION
Portfolio structure
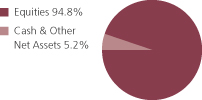
| | | | |
| Top ten holdings | | | | |
| Simon Property Group, Inc., REIT | | | 4.6% | |
| Mitsui Fudosan Co. Ltd. | | | 4.2% | |
| Mitsubishi Estate Co. Ltd. | | | 3.7% | |
| Public Storage, Inc., REIT | | | 3.6% | |
| Hang Lung Properties Ltd. | | | 3.5% | |
| Corio N.V., REIT | | | 3.3% | |
| Unibail-Rodamco, REIT | | | 3.1% | |
| Vornado Realty Trust, REIT | | | 2.8% | |
| Link REIT | | | 2.7% | |
| SEGRO PLC, REIT | | | 2.7% | |
| | | | |
| Equity industries | | | | |
| Real Estate | | | 94.0% | |
| Telecommunications-wireless | | | 0.8% | |
| |
| Issuer country weightings (x) | | | | |
| United States | | | 49.5% | |
| Japan | | | 11.9% | |
| Hong Kong | | | 9.8% | |
| United Kingdom | | | 6.2% | |
| Australia | | | 5.9% | |
| Singapore | | | 3.5% | |
| Netherlands | | | 3.3% | |
| France | | | 3.1% | |
| Germany | | | 2.2% | |
| Other Countries | | | 4.6% | |
|
| Currency exposure weightings (y) | |
| United States Dollar | | | 49.5% | |
| Japanese Yen | | | 11.9% | |
| Euro | | | 10.5% | |
| Hong Kong Dollar | | | 9.8% | |
| British Pound Sterling | | | 6.2% | |
| Australian Dollar | | | 5.9% | |
| Singapore Dollar | | | 3.5% | |
| Brazilian Real | | | 1.8% | |
| Mexican Peso | | | 0.9% | |
| (x) | Represents the portfolio’s exposure to issuer countries as a percentage of a portfolio’s net assets. |
| (y) | Represents the portfolio’s exposure to a particular currency as a percentage of a portfolio’s net assets. |
Percentages are based on net assets as of 8/31/13.
The portfolio is actively managed and current holdings may be different.
2
EXPENSE TABLE
Fund expenses borne by the shareholders during the period,
March 1, 2013 through August 31, 2013
As a shareholder of the fund, you incur two types of costs: (1) transaction costs, including sales charges (loads) on certain purchase or redemption payments, and (2) ongoing costs, including management fees; distribution and service (12b-1) fees; and other fund expenses. This example is intended to help you understand your ongoing costs (in dollars) of investing in the fund and to compare these costs with the ongoing costs of investing in other mutual funds.
The example is based on an investment of $1,000 invested at the beginning of the period and held for the entire period March 1, 2013 through August 31, 2013.
Actual Expenses
The first line for each share class in the following table provides information about actual account values and actual expenses. You may use the information in this line, together with the amount you invested, to estimate the expenses that you paid over the period. Simply divide your account value by $1,000 (for example, an $8,600 account value divided by $1,000 = 8.6), then multiply the result by the number in the first line under the heading entitled “Expenses Paid During Period” to estimate the expenses you paid on your account during this period.
Hypothetical Example for Comparison Purposes
The second line for each share class in the following table provides information about hypothetical account values and hypothetical expenses based on the fund’s actual expense ratio and an assumed rate of return of 5% per year before expenses, which is not the fund’s actual return. The hypothetical account values and expenses may not be used to estimate the actual ending account balance or expenses you paid for the period. You may use this information to compare the ongoing costs of investing in the fund and other funds. To do so, compare this 5% hypothetical example with the 5% hypothetical examples that appear in the shareholder reports of the other funds.
Please note that the expenses shown in the table are meant to highlight your ongoing costs only and do not reflect any transactional costs, such as sales charges (loads). Therefore, the second line for each share class in the table is useful in comparing ongoing costs only, and will not help you determine the relative total costs of owning different funds. In addition, if these transactional costs were included, your costs would have been higher.
3
Expense Table – continued
| | | | | | | | | | | | | | | | | | |
Share Class | | | | Annualized Expense Ratio | | | Beginning Account Value 3/01/13 | | | Ending Account Value 8/31/13 | | | Expenses Paid During Period (p) 3/01/13-8/31/13 | |
| A | | Actual | | | 1.22% | | | | $1,000.00 | | | | $950.99 | | | | $6.00 | |
| | Hypothetical (h) | | | 1.22% | | | | $1,000.00 | | | | $1,019.06 | | | | $6.21 | |
| I | | Actual | | | 0.97% | | | | $1,000.00 | | | | $952.73 | | | | $4.77 | |
| | Hypothetical (h) | | | 0.97% | | | | $1,000.00 | | | | $1,020.32 | | | | $4.94 | |
| R5 | | Actual | | | 0.97% | | | | $1,000.00 | | | | $952.73 | | | | $4.77 | |
| | Hypothetical (h) | | | 0.97% | | | | $1,000.00 | | | | $1,020.32 | | | | $4.94 | |
| (h) | 5% class return per year before expenses. |
| (p) | Expenses paid are equal to each class’s annualized expense ratio, as shown above, multiplied by the average account value over the period, multiplied by the number of days in the period, divided by the number of days in the year. Expenses paid do not include any applicable sales charges (loads). If these transaction costs had been included, your costs would have been higher. |
4
PORTFOLIO OF INVESTMENTS
8/31/13 (unaudited)
The Portfolio of Investments is a complete list of all securities owned by your fund. It is categorized by broad-based asset classes.
| | | | | | | | |
| Common Stocks - 94.8% | | | | | | | | |
| Issuer | | Shares/Par | | | Value ($) | |
| Real Estate - 94.0% | | | | | | | | |
| Advance Residence Investment Corp., REIT | | | 1,647 | | | $ | 3,340,089 | |
| Alexandria Real Estate Equities, Inc., REIT | | | 76,978 | | | | 4,747,233 | |
| alstria office AG, REIT | | | 235,210 | | | | 2,779,136 | |
| Ascendas India Trust, IEU | | | 10,702,000 | | | | 5,033,866 | |
| Asesor de Activos Prisma S.A.P.I. de C.V., REIT | | | 1,253,900 | | | | 1,504,380 | |
| Atrium European Real Estate Ltd. | | | 1,108,310 | | | | 6,415,815 | |
| AvalonBay Communities, Inc., REIT | | | 60,220 | | | | 7,461,258 | |
| Big Yellow Group PLC, REIT | | | 1,067,240 | | | | 6,698,304 | |
| Boston Properties, Inc., REIT | | | 58,513 | | | | 5,997,583 | |
| BR Malls Participacoes S.A. | | | 370,871 | | | | 2,813,456 | |
| British Land Co. PLC, REIT | | | 591,186 | | | | 5,112,180 | |
| CFS Retail Property Trust Group, REIT | | | 3,236,553 | | | | 5,798,473 | |
| Corio N.V., REIT | | | 285,146 | | | | 11,196,606 | |
| Corporate Office Properties Trust, REIT | | | 130,330 | | | | 2,968,917 | |
| DDR Corp., REIT | | | 251,240 | | | | 3,899,245 | |
| Digital Realty Trust, Inc., REIT | | | 78,961 | | | | 4,390,232 | |
| EastGroup Properties, Inc., REIT | | | 99,100 | | | | 5,569,420 | |
| Equity Lifestyle Properties, Inc., REIT | | | 210,652 | | | | 7,320,157 | |
| Equity Residential, REIT | | | 72,700 | | | | 3,772,403 | |
| Federal Realty Investment Trust, REIT | | | 45,885 | | | | 4,465,069 | |
| Global Logistic Properties Ltd. | | | 3,217,901 | | | | 6,784,930 | |
| Hang Lung Properties Ltd. | | | 3,803,256 | | | | 11,823,187 | |
| Henderson Land Development Co. Ltd. | | | 1,237,339 | | | | 7,225,127 | |
| Home Properties, Inc., REIT | | | 97,153 | | | | 5,605,728 | |
| Host Hotels & Resorts, Inc., REIT | | | 462,166 | | | | 7,870,687 | |
| Kenedix Realty Investment Corp., REIT | | | 867 | | | | 3,262,566 | |
| LEG Immobilien AG | | | 42,680 | | | | 2,295,242 | |
| Link REIT | | | 2,043,405 | | | | 9,326,408 | |
| Macquarie Mexico Real Estate S.A. de C.V., REIT | | | 807,700 | | | | 1,470,799 | |
| Medical Properties Trust, Inc., REIT | | | 408,663 | | | | 4,720,058 | |
| Mid-America Apartment Communities, Inc., REIT | | | 113,651 | | | | 7,007,721 | |
| Mitsubishi Estate Co. Ltd. | | | 483,135 | | | | 12,496,795 | |
| Mitsui Fudosan Co. Ltd. | | | 458,274 | | | | 14,355,057 | |
| Multiplan Empreendimentos Imobiliarios S.A. | | | 174,600 | | | | 3,508,172 | |
| National Health Investors, Inc., REIT | | | 81,260 | | | | 4,461,174 | |
| NTT Urban Development Corp. | | | 6,048 | | | | 7,104,990 | |
| Plum Creek Timber Co. Inc., REIT | | | 160,254 | | | | 7,100,855 | |
| Public Storage, Inc., REIT | | | 80,332 | | | | 12,264,286 | |
| Retail Opportunity Investment Corp., REIT | | | 292,820 | | | | 3,789,091 | |
5
Portfolio of Investments (unaudited) – continued
| | | | | | | | |
| Issuer | | Shares/Par | | | Value ($) | |
| Common Stocks - continued | | | | | | | | |
| Real Estate - continued | | | | | | | | |
| SEGRO PLC, REIT | | | 2,055,652 | | | $ | 9,302,083 | |
| Simon Property Group, Inc., REIT | | | 108,219 | | | | 15,759,933 | |
| Stockland, IEU | | | 2,387,505 | | | | 7,884,492 | |
| Sun Hung Kai Properties Ltd. | | | 396,661 | | | | 5,119,933 | |
| TAG Immobilien AG | | | 213,320 | | | | 2,493,991 | |
| Tanger Factory Outlet Centers, Inc., REIT | | | 174,272 | | | | 5,376,291 | |
| Unibail-Rodamco, REIT | | | 47,009 | | | | 10,568,218 | |
| Ventas, Inc., REIT | | | 122,693 | | | | 7,638,866 | |
| Vornado Realty Trust, REIT | | | 117,213 | | | | 9,529,417 | |
| Westfield Group, REIT | | | 666,871 | | | | 6,547,767 | |
| Weyerhaeuser Co., REIT | | | 247,569 | | | | 6,778,439 | |
| | | | | | | | |
| | | | | | | $ | 320,756,125 | |
| Telecommunications - Wireless - 0.8% | | | | | | | | |
| American Tower Corp., REIT | | | 41,700 | | | $ | 2,897,733 | |
| Total Common Stocks (Identified Cost, $273,483,301) | | | | | | $ | 323,653,858 | |
| | |
| Money Market Funds - 4.8% | | | | | | | | |
MFS Institutional Money Market Portfolio, 0.09%,
at Cost and Net Asset Value (v) | | | 16,418,429 | | | $ | 16,418,429 | |
| Total Investments (Identified Cost, $289,901,730) | | | | | | $ | 340,072,287 | |
| | |
| Other Assets, Less Liabilities - 0.4% | | | | | | | 1,336,637 | |
| Net Assets - 100.0% | | | | | | $ | 341,408,924 | |
| (v) | Underlying affiliated fund that is available only to investment companies managed by MFS. The rate quoted for the MFS Institutional Money Market Portfolio is the annualized seven-day yield of the fund at period end. |
The following abbreviations are used in this report and are defined:
| IEU | | International Equity Unit |
| PLC | | Public Limited Company |
| REIT | | Real Estate Investment Trust |
See Notes to Financial Statements
6
Financial Statements
STATEMENT OF ASSETS AND LIABILITIES
At 8/31/13 (unaudited)
This statement represents your fund’s balance sheet, which details the assets and liabilities comprising the total value of the fund.
| | | | |
| Assets | | | | |
Investments- | | | | |
Non-affiliated issuers, at value (identified cost, $273,483,301) | | | $323,653,858 | |
Underlying affiliated funds, at cost and value | | | 16,418,429 | |
Total investments, at value (identified cost, $289,901,730) | | | $340,072,287 | |
Foreign currency, at value (identified cost, $512,621) | | | 506,185 | |
Receivables for | | | | |
Fund shares sold | | | 735,839 | |
Interest and dividends | | | 173,663 | |
Other assets | | | 537 | |
Total assets | | | $341,488,511 | |
| Liabilities | | | | |
Payable for fund shares reacquired | | | $19,536 | |
Payable to affiliates | | | | |
Investment adviser | | | 25,635 | |
Shareholder servicing costs | | | 73 | |
Distribution and service fees | | | 5 | |
Payable for independent Trustees’ compensation | | | 58 | |
Accrued expenses and other liabilities | | | 34,280 | |
Total liabilities | | | $79,587 | |
Net assets | | | $341,408,924 | |
| Net assets consist of | | | | |
Paid-in capital | | | $288,222,471 | |
Unrealized appreciation (depreciation) on investments and translation of assets and liabilities in foreign currencies | | | 50,164,120 | |
Accumulated distributions in excess of net realized gain on investments and foreign currency | | | (3,602,104 | ) |
Undistributed net investment income | | | 6,624,437 | |
Net assets | | | $341,408,924 | |
Shares of beneficial interest outstanding | | | 24,027,998 | |
| | | | | | | | | | | | |
| | | Net assets | | | Shares outstanding | | | Net asset value per share (a) | |
Class A | | | $265,154 | | | | 18,691 | | | | $14.19 | |
Class I | | | 111,001 | | | | 7,812 | | | | 14.21 | |
Class R5 | | | 341,032,769 | | | | 24,001,495 | | | | 14.21 | |
| (a) | Maximum offering price per share was equal to the net asset value per share for all share classes, except for Class A, for which the maximum offering price per share was $15.06 [100 / 94.25 x $14.19]. On sales of $50,000 or more, the maximum offering price of Class A shares is reduced. A contingent deferred sales charge may be imposed on redemptions of Class A shares. Redemption price per share was equal to the net asset value per share for Classes I and R5. |
See Notes to Financial Statements
7
Financial Statements
STATEMENT OF OPERATIONS
Six months ended 8/31/13 (unaudited)
This statement describes how much your fund earned in investment income and accrued in expenses. It also describes any gains and/or losses generated by fund operations.
| | | | |
| Net investment income | | | | |
Income | | | | |
Dividends | | | $5,620,245 | |
Dividends from underlying affiliated funds | | | 2,778 | |
Foreign taxes withheld | | | (253,256 | ) |
Total investment income | | | $5,369,767 | |
Expenses | | | | |
Management fee | | | $1,486,714 | |
Distribution and service fees | | | 361 | |
Shareholder servicing costs | | | 126 | |
Administrative services fee | | | 26,094 | |
Independent Trustees’ compensation | | | 4,570 | |
Custodian fee | | | 37,542 | |
Shareholder communications | | | 3,020 | |
Audit and tax fees | | | 27,360 | |
Legal fees | | | 1,549 | |
Miscellaneous | | | 13,183 | |
Total expenses | | | $1,600,519 | |
Fees paid indirectly | | | (11 | ) |
Reduction of expenses by investment adviser | | | (1,330 | ) |
Net expenses | | | $1,599,178 | |
Net investment income | | | $3,770,589 | |
| Realized and unrealized gain (loss) on investments and foreign currency | |
Realized gain (loss) (identified cost basis) | | | | |
Investments | | | $9,146,744 | |
Foreign currency | | | (38,603 | ) |
Net realized gain (loss) on investments and foreign currency | | | $9,108,141 | |
Change in unrealized appreciation (depreciation) | | | | |
Investments | | | $(29,683,224 | ) |
Translation of assets and liabilities in foreign currencies | | | 1,211 | |
Net unrealized gain (loss) on investments and foreign currency translation | | | $(29,682,013 | ) |
Net realized and unrealized gain (loss) on investments and foreign currency | | | $(20,573,872 | ) |
Change in net assets from operations | | | $(16,803,283 | ) |
See Notes to Financial Statements
8
Financial Statements
STATEMENTS OF CHANGES IN NET ASSETS
These statements describe the increases and/or decreases in net assets resulting from operations, any distributions, and any shareholder transactions.
| | | | | | | | |
| | | Six months ended 8/31/13 | | | Year ended 2/28/13 | |
| Change in net assets | | (unaudited) | | | | |
| From operations | | | | | | | | |
Net investment income | | | $3,770,589 | | | | $5,464,776 | |
Net realized gain (loss) on investments and foreign currency | | | 9,108,141 | | | | 15,386,959 | |
Net unrealized gain (loss) on investments and foreign currency translation | | | (29,682,013 | ) | | | 28,333,599 | |
Change in net assets from operations | | | $(16,803,283 | ) | | | $49,185,334 | |
| Distributions declared to shareholders | | | | | | | | |
From net investment income | | | $(538,093 | ) | | | $(9,892,136 | ) |
From net realized gain on investments | | | (3,690,194 | ) | | | (9,487,195 | ) |
Total distributions declared to shareholders | | | $(4,228,287 | ) | | | $(19,379,331 | ) |
Change in net assets from fund share transactions | | | $59,144,855 | | | | $30,737,340 | |
Total change in net assets | | | $38,113,285 | | | | $60,543,343 | |
| Net assets | | | | | | | | |
At beginning of period | | | 303,295,639 | | | | 242,752,296 | |
At end of period (including undistributed net investment income of $6,624,437 and $3,391,941, respectively) | | | $341,408,924 | | | | $303,295,639 | |
See Notes to Financial Statements
9
Financial Statements
FINANCIAL HIGHLIGHTS
The financial highlights table is intended to help you understand the fund’s financial performance for the semiannual period and the past 5 fiscal years (or life of a particular share class, if shorter). Certain information reflects financial results for a single fund share. The total returns in the table represent the rate by which an investor would have earned (or lost) on an investment in the fund share class (assuming reinvestment of all distributions) held for the entire period.
| | | | | | | | | | | | | | | | | | | | |
| | | Six months ended 8/31/13 (unaudited) | | | Years ended 2/28, 2/29 | |
| Class A | | | 2013 | | | 2012 | | | 2011 | | | 2010 (c) | |
| | | | | | | | | | | | | | |
Net asset value, beginning of period | | | $15.12 | | | | $13.51 | | | | $14.57 | | | | $14.02 | | | | $10.00 | |
| Income (loss) from investment operations | | | | | | | | | |
Net investment income (d) | | | $0.16 | | | | $0.26 | | | | $0.23 | | | | $0.49 | | | | $0.42 | |
Net realized and unrealized gain (loss)
on investments and foreign currency | | | (0.89 | ) | | | 2.38 | | | | (0.55 | ) | | | 2.46 | | | | 8.68 | |
Total from investment operations | | | $(0.73 | ) | | | $2.64 | | | | $(0.32 | ) | | | $2.95 | | | | $9.10 | |
| Less distributions declared to shareholders | | | | | | | | | |
From net investment income | | | $(0.02 | ) | | | $(0.51 | ) | | | $(0.30 | ) | | | $(0.77 | ) | | | $(2.00 | ) |
From net realized gain on investments | | | (0.18 | ) | | | (0.52 | ) | | | (0.44 | ) | | | (1.63 | ) | | | (3.08 | ) |
Total distributions declared to shareholders | | | $(0.20 | ) | | | $(1.03 | ) | | | $(0.74 | ) | | | $(2.40 | ) | | | $(5.08 | ) |
Net asset value, end of period (x) | | | $14.19 | | | | $15.12 | | | | $13.51 | | | | $14.57 | | | | $14.02 | |
Total return (%) (r)(s)(t)(x) | | | (4.90 | )(n) | | | 20.14 | | | | (1.81 | ) | | | 23.61 | | | | 91.24 | (n) |
Ratios (%) (to average net assets)
and Supplemental data: | | | | | | | | | | | | | | | | | | | | |
Expenses before expense reductions (f) | | | 1.22 | (a) | | | 1.23 | | | | 1.24 | | | | 1.25 | | | | 1.28 | (a) |
Expenses after expense reductions (f) | | | 1.22 | (a) | | | 1.23 | | | | 1.24 | | | | 1.25 | | | | 1.28 | (a) |
Net investment income | | | 2.08 | (a) | | | 1.85 | | | | 1.74 | | | | 3.45 | | | | 2.89 | (a) |
Portfolio turnover | | | 15 | (n) | | | 46 | | | | 37 | | | | 33 | | | | 91 | |
Net assets at end of period (000 omitted) | | | $265 | | | | $279 | | | | $232 | | | | $236 | | | | $191 | |
See Notes to Financial Statements
10
Financial Highlights – continued
| | | | | | | | | | | | | | | | | | | | |
| | | Six months ended 8/31/13 (unaudited) | | | Years ended 2/28, 2/29 | |
| Class I | | | 2013 | | | 2012 | | | 2011 | | | 2010 (c) | |
| | | | | | | | | | | | | | |
Net asset value, beginning of period | | | $15.13 | | | | $13.52 | | | | $14.58 | | | | $14.03 | | | | $10.00 | |
| Income (loss) from investment operations | | | | | | | | | |
Net investment income (d) | | | $0.18 | | | | $0.44 | | | | $0.27 | | | | $0.54 | | | | $0.47 | |
Net realized and unrealized gain (loss)
on investments and foreign currency | | | (0.89 | ) | | | 2.23 | | | | (0.56 | ) | | | 2.45 | | | | 8.67 | |
Total from investment operations | | | $(0.71 | ) | | | $2.67 | | | | $(0.29 | ) | | | $2.99 | | | | $9.14 | |
| Less distributions declared to shareholders | | | | | | | | | |
From net investment income | | | $(0.03 | ) | | | $(0.54 | ) | | | $(0.33 | ) | | | $(0.81 | ) | | | $(2.03 | ) |
From net realized gain on investments | | | (0.18 | ) | | | (0.52 | ) | | | (0.44 | ) | | | (1.63 | ) | | | (3.08 | ) |
Total distributions declared to shareholders | | | $(0.21 | ) | | | $(1.06 | ) | | | $(0.77 | ) | | | $(2.44 | ) | | | $(5.11 | ) |
Net asset value, end of period (x) | | | $14.21 | | | | $15.13 | | | | $13.52 | | | | $14.58 | | | | $14.03 | |
Total return (%) (r)(s)(x) | | | (4.79 | )(n) | | | 20.41 | | | | (1.54 | ) | | | 23.89 | | | | 91.71 | (n) |
Ratios (%) (to average net assets)
and Supplemental data: | | | | | | | | | | | | | | | | | | | | |
Expenses before expense reductions (f) | | | 0.97 | (a) | | | 0.98 | | | | 0.99 | | | | 1.00 | | | | 1.03 | (a) |
Expenses after expense reductions (f) | | | 0.97 | (a) | | | 0.98 | | | | 0.99 | | | | 1.00 | | | | 1.03 | (a) |
Net investment income | | | 2.33 | (a) | | | 3.30 | | | | 1.98 | | | | 3.77 | | | | 3.22 | (a) |
Portfolio turnover | | | 15 | (n) | | | 46 | | | | 37 | | | | 33 | | | | 91 | |
Net assets at end of period (000 omitted) | | | $111 | | | | $117 | | | | $242,520 | | | | $216,082 | | | | $164,347 | |
See Notes to Financial Statements
11
Financial Highlights – continued
| | | | | | | | |
| Class R5 | | Six months ended 8/31/13 | | | Period ended 2/28/13 (i) | |
| | | (unaudited) | | | | |
Net asset value, beginning of period | | | $15.13 | | | | $13.74 | |
| Income (loss) from investment operations | | | | | | | | |
Net investment income (d) | | | $0.18 | | | | $0.14 | |
Net realized and unrealized gain (loss)
on investments and foreign currency | | | (0.89 | ) | | | 2.10 | |
Total from investment operations | | | $(0.71 | ) | | | $2.24 | |
| Less distributions declared to shareholders | | | | | | | | |
From net investment income | | | $(0.03 | ) | | | $(0.50 | ) |
From net realized gain on investments | | | (0.18 | ) | | | (0.35 | ) |
Total distributions declared to shareholders | | | $(0.21 | ) | | | $(0.85 | ) |
Net asset value, end of period (x) | | | $14.21 | | | | $15.13 | |
Total return (%) (r)(s)(x) | | | (4.79 | )(n) | | | 16.56 | (n) |
Ratios (%) (to average net assets)
and Supplemental data: | | | | | | | | |
Expenses before expense reductions (f) | | | 0.97 | (a) | | | 0.98 | (a) |
Expenses after expense reductions (f) | | | 0.97 | (a) | | | 0.98 | (a) |
Net investment income | | | 2.28 | (a) | | | 1.48 | (a) |
Portfolio turnover | | | 15 | (n) | | | 46 | (n) |
Net assets at end of period (000 omitted) | | | $341,033 | | | | $302,900 | |
| (c) | For the period from the commencement of the fund’s investment operations, March 11, 2009, through the stated period end. |
| (d) | Per share data is based on average shares outstanding. |
| (f) | Ratios do not reflect reductions from fees paid indirectly, if applicable. |
| (i) | For the period from the class inception, July 2, 2012, through the stated period end. |
| (r) | Certain expenses have been reduced without which performance would have been lower. |
| (s) | From time to time the fund may receive proceeds from litigation settlements, without which performance would be lower. |
| (t) | Total returns do not include any applicable sales charges. |
| (x) | The net asset values per share and total returns have been calculated on net assets which include adjustments made in accordance with U.S. generally accepted accounting principles required at period end for financial reporting purposes. |
See Notes to Financial Statements
12
NOTES TO FINANCIAL STATEMENTS
(unaudited)
(1) Business and Organization
MFS Global Real Estate Fund (the fund) is a series of MFS Series Trust XIII (the trust). The trust is organized as a Massachusetts business trust and is registered under the Investment Company Act of 1940, as amended, as an open-end management investment company.
(2) Significant Accounting Policies
General – The preparation of financial statements in conformity with U.S. generally accepted accounting principles requires management to make estimates and assumptions that affect the reported amounts of assets and liabilities, and disclosure of contingent assets and liabilities at the date of the financial statements and the reported amounts of revenues and expenses during the reporting period. Actual results could differ from those estimates. In the preparation of these financial statements, management has evaluated subsequent events occurring after the date of the fund’s Statement of Assets and Liabilities through the date that the financial statements were issued. The fund invests a significant amount of its net assets in U.S. and foreign real estate related investments and as a result is subject to certain risks associated with the direct ownership of real estate and the real estate industry in general. These include risks related to general, regional and local economic conditions; fluctuations in interest rates; property tax rates, zoning laws, environmental regulations and other governmental action; cash flow dependency; increased operating expenses; lack of availability of mortgage funds; losses due to natural disasters; changes in property values and rental rates; and other factors. The fund invests in foreign securities. Investments in foreign securities are vulnerable to the effects of changes in the relative values of the local currency and the U.S. dollar and to the effects of changes in each country’s legal, political, and economic environment.
In this reporting period, the fund adopted the disclosure provisions of the Financial Accounting Standards Board (FASB) Accounting Standards Update 2011-11 (“ASU 2011-11”), Balance Sheet (Topic 210) – Disclosures about Offsetting Assets and Liabilities along with the related scope clarification provisions of FASB Accounting Standards Update 2013-01 (“ASU 2013-01”) entitled Balance Sheet (Topic 210) – Clarifying the Scope of Disclosures about Offsetting Assets and Liabilities. ASU 2011-11 is intended to enhance disclosures on the offsetting of financial assets and liabilities by requiring entities to disclose both gross and net information about financial instruments and transactions that are either offset in the statement of financial position or subject to a Master Netting Agreement or similar arrangement. ASU 2013-01 limits the scope of ASU 2011-11’s disclosure requirements on offsetting to financial assets and financial liabilities related to derivatives, repurchase and reverse repurchase agreements, and securities lending and securities borrowing transactions. The disclosures required by ASU 2011-11, to the extent applicable to the fund, have been included in the fund’s Significant Accounting Policies note under the captions for each of the fund’s in-scope financial instruments and transactions.
In June 2013, FASB issued Accounting Standards Update 2013-08 Financial Services – Investment Companies (Topic 946) – Amendments to the Scope, Measurement, and Disclosure Requirements (“ASU 2013-08”) which is effective for
13
Notes to Financial Statements (unaudited) – continued
interim and annual reporting periods in fiscal years that begin after December 15, 2013. ASU 2013-08 sets forth a methodology for determining whether an entity should be characterized as an investment company and prescribes fair value accounting for an investment company’s non-controlling ownership interest in another investment company. FASB has determined that a fund registered under the Investment Company Act of 1940 automatically meets ASU 2013-08’s criteria for an investment company. Although still evaluating the potential impacts of ASU 2013-08 to the fund, management expects that the impact of the fund’s adoption will be limited to additional financial statement disclosures.
Investment Valuations – Equity securities, including restricted equity securities, are generally valued at the last sale or official closing price as provided by a third-party pricing service on the market or exchange on which they are primarily traded. Equity securities, for which there were no sales reported that day, are generally valued at the last quoted daily bid quotation as provided by a third-party pricing service on the market or exchange on which such securities are primarily traded. Short-term instruments with a maturity at issuance of 60 days or less generally are valued at amortized cost, which approximates market value. Open-end investment companies are generally valued at net asset value per share. Securities and other assets generally valued on the basis of information from a third-party pricing service may also be valued at a broker/dealer bid quotation. Values obtained from third-party pricing services can utilize both transaction data and market information such as yield, quality, coupon rate, maturity, type of issue, trading characteristics, and other market data. The values of foreign securities and other assets and liabilities expressed in foreign currencies are converted to U.S. dollars using the mean of bid and asked prices for rates provided by a third-party pricing service.
The Board of Trustees has delegated primary responsibility for determining or causing to be determined the value of the fund’s investments (including any fair valuation) to the adviser pursuant to valuation policies and procedures approved by the Board. If the adviser determines that reliable market quotations are not readily available, investments are valued at fair value as determined in good faith by the adviser in accordance with such procedures under the oversight of the Board of Trustees. Under the fund’s valuation policies and procedures, market quotations are not considered to be readily available for most types of debt instruments and floating rate loans and many types of derivatives. These investments are generally valued at fair value based on information from third-party pricing services. In addition, investments may be valued at fair value if the adviser determines that an investment’s value has been materially affected by events occurring after the close of the exchange or market on which the investment is principally traded (such as foreign exchange or market) and prior to the determination of the fund’s net asset value, or after the halting of trading of a specific security where trading does not resume prior to the close of the exchange or market on which the security is principally traded. Events that occur on a frequent basis after foreign markets close (such as developments in foreign markets and significant movements in the U.S. markets) and prior to the determination of the fund’s net asset value may be deemed to have a material effect on the value of securities traded in foreign markets. Accordingly, the fund’s foreign equity securities may often be valued at fair value. The adviser generally relies on third-party pricing services or other information (such as the
14
Notes to Financial Statements (unaudited) – continued
correlation with price movements of similar securities in the same or other markets; the type, cost and investment characteristics of the security; the business and financial condition of the issuer; and trading and other market data) to assist in determining whether to fair value and at what value to fair value an investment. The value of an investment for purposes of calculating the fund’s net asset value can differ depending on the source and method used to determine value. When fair valuation is used, the value of an investment used to determine the fund’s net asset value may differ from quoted or published prices for the same investment. There can be no assurance that the fund could obtain the fair value assigned to an investment if it were to sell the investment at the same time at which the fund determines its net asset value per share.
Various inputs are used in determining the value of the fund’s assets or liabilities. These inputs are categorized into three broad levels. In certain cases, the inputs used to measure fair value may fall into different levels of the fair value hierarchy. In such cases, an investment’s level within the fair value hierarchy is based on the lowest level of input that is significant to the fair value measurement. The fund’s assessment of the significance of a particular input to the fair value measurement in its entirety requires judgment, and considers factors specific to the investment. Level 1 includes unadjusted quoted prices in active markets for identical assets or liabilities. Level 2 includes other significant observable market-based inputs (including quoted prices for similar securities, interest rates, prepayment speed, and credit risk). Level 3 includes unobservable inputs, which may include the adviser’s own assumptions in determining the fair value of investments. The following is a summary of the levels used as of August 31, 2013 in valuing the fund’s assets or liabilities:
| | | | | | | | | | | | | | | | |
| Investments at Value | | Level 1 | | | Level 2 | | | Level 3 | | | Total | |
| Equity Securities: | | | | | | | | | | | | | | | | |
United States | | | $151,391,796 | | | | $— | | | | $— | | | | $151,391,796 | |
Japan | | | — | | | | 40,559,497 | | | | — | | | | 40,559,497 | |
Hong Kong | | | — | | | | 33,494,655 | | | | — | | | | 33,494,655 | |
United Kingdom | | | 21,112,567 | | | | — | | | | — | | | | 21,112,567 | |
Australia | | | — | | | | 20,230,732 | | | | — | | | | 20,230,732 | |
Singapore | | | 5,033,866 | | | | 6,784,930 | | | | — | | | | 11,818,796 | |
Netherlands | | | 11,196,606 | | | | — | | | | — | | | | 11,196,606 | |
France | | | 10,568,218 | | | | — | | | | — | | | | 10,568,218 | |
Germany | | | 7,568,369 | | | | — | | | | — | | | | 7,568,369 | |
Other Countries | | | 15,712,622 | | | | — | | | | — | | | | 15,712,622 | |
| Mutual Funds | | | 16,418,429 | | | | — | | | | — | | | | 16,418,429 | |
| Total Investments | | | $239,002,473 | | | | $101,069,814 | | | | $— | | | | $340,072,287 | |
For further information regarding security characteristics, see the Portfolio of Investments.
Of the level 2 investments presented above, equity investments amounting to $74,054,152 would have been considered level 1 investments at the beginning of the period. Of the level 1 investments presented above, equity investments amounting to $21,342,652 would have been considered level 2 investments at the beginning of the period. The primary reason for changes in the classifications between levels 1 and 2 occurs when foreign equity securities are fair valued using other observable market-based inputs in place of the closing exchange price due to events occurring
15
Notes to Financial Statements (unaudited) – continued
after the close of the exchange or market on which the investment is principally traded. The fund’s foreign equity securities may often be valued at fair value. The fund’s policy is to recognize transfers between the levels as of the end of the period.
Foreign Currency Translation – Purchases and sales of foreign investments, income, and expenses are converted into U.S. dollars based upon currency exchange rates prevailing on the respective dates of such transactions or on the reporting date for foreign denominated receivables and payables. Gains and losses attributable to foreign currency exchange rates on sales of securities are recorded for financial statement purposes as net realized gains and losses on investments. Gains and losses attributable to foreign exchange rate movements on receivables, payables, income and expenses are recorded for financial statement purposes as foreign currency transaction gains and losses. That portion of both realized and unrealized gains and losses on investments that results from fluctuations in foreign currency exchange rates is not separately disclosed.
Indemnifications – Under the fund’s organizational documents, its officers and Trustees may be indemnified against certain liabilities and expenses arising out of the performance of their duties to the fund. Additionally, in the normal course of business, the fund enters into agreements with service providers that may contain indemnification clauses. The fund’s maximum exposure under these agreements is unknown as this would involve future claims that may be made against the fund that have not yet occurred.
Investment Transactions and Income – Investment transactions are recorded on the trade date. Dividends received in cash are recorded on the ex-dividend date. Certain dividends from foreign securities will be recorded when the fund is informed of the dividend if such information is obtained subsequent to the ex-dividend date. Dividend payments received in additional securities are recorded on the ex-dividend date in an amount equal to the value of the security on such date.
The fund may receive proceeds from litigation settlements. Any proceeds received from litigation involving portfolio holdings are reflected in the Statement of Operations in realized gain/loss if the security has been disposed of by the fund or in unrealized gain/loss if the security is still held by the fund. Any other proceeds from litigation not related to portfolio holdings are reflected as other income in the Statement of Operations.
Fees Paid Indirectly – The fund’s custody fee may be reduced according to an arrangement that measures the value of cash deposited with the custodian by the fund. This amount, for the six months ended August 31, 2013, is shown as a reduction of total expenses in the Statement of Operations.
Tax Matters and Distributions – The fund intends to qualify as a regulated investment company, as defined under Subchapter M of the Internal Revenue Code, and to distribute all of its taxable income, including realized capital gains. As a result, no provision for federal income tax is required. The fund’s federal tax returns, when filed, will remain subject to examination by the Internal Revenue Service for a three year period. Foreign taxes have been accrued by the fund in the accompanying financial statements in accordance with the applicable foreign tax law. Foreign income taxes may be withheld by certain countries in which the fund invests.
16
Notes to Financial Statements (unaudited) – continued
Distributions to shareholders are recorded on the ex-dividend date. Income and capital gain distributions are determined in accordance with income tax regulations, which may differ from U.S. generally accepted accounting principles. Certain capital accounts in the financial statements are periodically adjusted for permanent differences in order to reflect their tax character. These adjustments have no impact on net assets or net asset value per share. Temporary differences which arise from recognizing certain items of income, expense, gain or loss in different periods for financial statement and tax purposes will reverse at some time in the future. Distributions in excess of net investment income or net realized gains are temporary overdistributions for financial statement purposes resulting from differences in the recognition or classification of income or distributions for financial statement and tax purposes.
Book/tax differences primarily relate to passive foreign investment companies, wash sale loss deferrals, and treating a portion of the proceeds from redemptions as a distribution for tax purposes.
The tax character of distributions made during the current period will be determined at fiscal year end. The tax character of distributions declared to shareholders for the last fiscal year is as follows:
| | | | |
| | | 2/28/13 | |
| Ordinary income (including any short-term capital gains) | | | $13,925,927 | |
| Long-term capital gains | | | 5,453,404 | |
| Total distributions | | | $19,379,331 | |
The federal tax cost and the tax basis components of distributable earnings were as follows:
| | | | |
| As of 8/31/13 | | | |
| Cost of investments | | | $302,611,627 | |
| Gross appreciation | | | 46,250,346 | |
| Gross depreciation | | | (8,789,686 | ) |
| Net unrealized appreciation (depreciation) | | | $37,460,660 | |
| |
| As of 2/28/13 | | | |
| Undistributed ordinary income | | | 4,779,703 | |
| Undistributed long-term capital gain | | | 2,302,084 | |
| Other temporary differences | | | (7,648 | ) |
| Net unrealized appreciation (depreciation) | | | 67,143,884 | |
The aggregate cost above includes prior fiscal year end tax adjustments, if applicable.
Multiple Classes of Shares of Beneficial Interest – The fund offers multiple classes of shares, which differ in their respective distribution and/or service fees. The fund’s income, realized and unrealized gain (loss), and common expenses are allocated to shareholders based on the daily net assets of each class. Dividends are declared separately for each class. Differences in per share dividend rates are generally due to
17
Notes to Financial Statements (unaudited) – continued
differences in separate class expenses. The fund’s distributions declared to shareholders as reported in the Statements of Changes in Net Assets are presented by class as follows:
| | | | | | | | | | | | | | | | |
| | | From net investment
income | | | From net realized gain
on investments | |
| | | Six months
ended
8/31/13 | | | Year
ended
2/28/13 (i) | | | Six months
ended
8/31/13 | | | Year
ended
2/28/13 (i) | |
| Class A | | | $376 | | | | $8,821 | | | | $3,340 | | | | $8,986 | |
| Class I | | | 204 | | | | 745,043 | | | | 1,395 | | | | 3,157,110 | |
| Class R5 | | | 537,513 | | | | 9,138,272 | | | | 3,685,459 | | | | 6,321,099 | |
| Total | | | $538,093 | | | | $9,892,136 | | | | $3,690,194 | | | | $9,487,195 | |
| (i) | For Class R5, the period is from inception, July 2, 2012, through the stated period end. |
(3) Transactions with Affiliates
Investment Adviser – The fund has an investment advisory agreement with MFS to provide overall investment management and related administrative services and facilities to the fund. The management fee is computed daily and paid monthly at the following annual rates:
| | | | |
| First $1 billion of average daily net assets | | | 0.90 | % |
| Next $1.5 billion of average daily net assets | | | 0.75 | % |
| Average daily net assets in excess of $2.5 billion | | | 0.65 | % |
Effective April 1, 2013, MFS has agreed in writing to reduce its management fee by a specified amount if certain MFS mutual fund assets exceed thresholds agreed to by MFS and the fund’s Board of Trustees. For the period April 1, 2013 through August 31, 2013, this management fee reduction amounted to $749, which is shown as a reduction of total expenses in the Statement of Operations. The management fee incurred for the six months ended August 31, 2013 was equivalent to an annual effective rate of 0.90% of the fund’s average daily net assets.
Distributor – MFS Fund Distributors, Inc. (MFD), a wholly-owned subsidiary of MFS, as distributor, received $0 for the six months ended August 31, 2013, as its portion of the initial sales charge on sales of Class A shares of the fund.
The Board of Trustees has adopted a distribution plan for certain class shares pursuant to Rule 12b-1 of the Investment Company Act of 1940.
The fund’s distribution plan provides that the fund will pay MFD for services provided by MFD and financial intermediaries in connection with the distribution and servicing of certain share classes. One component of the plan is a distribution fee paid to MFD and another component of the plan is a service fee paid to MFD. MFD may subsequently pay all, or a portion, of the distribution and/or service fees to financial intermediaries.
Distribution Plan Fee Table:
| | | | | | | | | | | | | | | | | | | | |
| | | Distribution
Fee Rate (d) | | | Service
Fee Rate (d) | | | Total
Distribution
Plan (d) | | | Annual
Effective
Rate (e) | | | Distribution
and Service
Fee | |
| Class A | | | — | | | | 0.25% | | | | 0.25% | | | | 0.25% | | | | $361 | |
18
Notes to Financial Statements (unaudited) – continued
| (d) | In accordance with the distribution plan for certain classes, the fund pays distribution and/or service fees equal to these annual percentage rates of each class’s average daily net assets. The distribution and service fee rates disclosed by class represent the current rates in effect at the end of the reporting period. |
| (e) | The annual effective rates represent actual fees incurred under the distribution plan for the six months ended August 31, 2013 based on each class’s average daily net assets. |
Certain Class A shares are subject to a contingent deferred sales charge (CDSC) in the event of a shareholder redemption within 18 months of purchase for shares purchased on or after August 1, 2012, and within 24 months of purchase for shares purchased prior to August 1, 2012. There were no contingent deferred sales charges imposed during the six months ended August 31, 2013.
Shareholder Servicing Agent – MFS Service Center, Inc. (MFSC), a wholly-owned subsidiary of MFS, provides transfer agent and recordkeeping functions in connection with the issuance, transfer, and redemption of shares of the fund under a Shareholder Servicing Agent Agreement. MFSC is not paid a fee for providing these services. MFSC receives payment from the fund for out-of-pocket expenses, sub-accounting and other shareholder servicing costs which may be paid to affiliated and unaffiliated service providers. Class R5 shares do not incur sub-accounting fees. For the six months ended August 31, 2013, out-of-pocket expenses amounted to $126. The fund may also pay shareholder servicing related costs to non-related parties.
Administrator – MFS provides certain financial, legal, shareholder communications, compliance, and other administrative services to the fund. Under an administrative services agreement, the fund partially reimburses MFS the costs incurred to provide these services. The fund is charged an annual fixed amount of $17,500 plus a fee based on average daily net assets. The administrative services fee incurred for the six months ended August 31, 2013 was equivalent to an annual effective rate of 0.0158% of the fund’s average daily net assets.
Trustees’ and Officers’ Compensation – The fund pays compensation to independent Trustees in the form of a retainer, attendance fees, and additional compensation to Board and Committee chairpersons. The fund does not pay compensation directly to Trustees or to officers of the fund who are also officers of the investment adviser, all of whom receive remuneration for their services to the fund from MFS. Certain officers and Trustees of the fund are officers or directors of MFS, MFS Fund Distributors, Inc. (MFD), and MFSC.
Other – This fund and certain other funds managed by MFS (the funds) have entered into services agreements (the Agreements) which provide for payment of fees by the funds to Tarantino LLC and Griffin Compliance LLC in return for the provision of services of an Independent Chief Compliance Officer (ICCO) and Assistant ICCO, respectively, for the funds. The ICCO and Assistant ICCO are officers of the funds and the sole members of Tarantino LLC and Griffin Compliance LLC, respectively. The funds can terminate the Agreements with Tarantino LLC and Griffin Compliance LLC at any time under the terms of the Agreements. For the six months ended August 31, 2013, the aggregate fees paid by the fund to Tarantino LLC and Griffin Compliance LLC were $1,153 and are included in “Miscellaneous” expense in the Statement of Operations. MFS has agreed to reimburse the fund for a portion of the payments made by the fund
19
Notes to Financial Statements (unaudited) – continued
in the amount of $581, which is shown as a reduction of total expenses in the Statement of Operations. Additionally, MFS has agreed to bear all expenses associated with office space, other administrative support, and supplies provided to the ICCO and Assistant ICCO.
The fund invests in the MFS Institutional Money Market Portfolio which is managed by MFS and seeks current income consistent with preservation of capital and liquidity. Income earned on this investment is included in “Dividends from underlying affiliated funds” in the Statement of Operations. This money market fund does not pay a management fee to MFS.
On June 29, 2012, MFS purchased 7,278 shares of Class R5 for an aggregate amount of $100,000. At August 31, 2013, MFS held 100% and 100% of the outstanding shares of Class A and Class I, respectively.
(4) Portfolio Securities
Purchases and sales of investments, other than short-term obligations, aggregated $95,876,138 and $46,504,975, respectively.
(5) Shares of Beneficial Interest
The fund’s Declaration of Trust permits the Trustees to issue an unlimited number of full and fractional shares of beneficial interest. Transactions in fund shares were as follows:
| | | | | | | | | | | | | | | | |
| | | Six months ended
8/31/13 | | | Year ended
2/28/13 (i) | |
| | | Shares | | | Amount | | | Shares | | | Amount | |
| Shares sold | | | | | | | | | | | | | | | | |
Class I | | | — | | | | $— | | | | 696,721 | | | | $9,351,221 | |
Class R5 | | | 4,343,950 | | | | 65,276,480 | | | | 20,161,300 | | | | 280,296,080 | |
| | | 4,343,950 | | | | $65,276,480 | | | | 20,858,021 | | | | $289,647,301 | |
| | | | |
| Shares issued to shareholders in reinvestment of distributions | | | | | | | | | | | | | | | | |
Class A | | | 247 | | | | $3,716 | | | | 1,262 | | | | $17,807 | |
Class I | | | 106 | | | | 1,599 | | | | 303,616 | | | | 3,902,153 | |
Class R5 | | | 279,667 | | | | 4,222,972 | | | | 1,069,113 | | | | 15,459,371 | |
| | | 280,020 | | | | $4,228,287 | | | | 1,373,991 | | | | $19,379,331 | |
| | | | |
| Shares reacquired | | | | | | | | | | | | | | | | |
Class I | | | — | | | | $— | | | | (18,934,608 | ) | | | $(260,810,383 | ) |
Class R5 | | | (647,621 | ) | | | (10,359,912 | ) | | | (1,204,914 | ) | | | (17,478,909 | ) |
| | | (647,621 | ) | | | $(10,359,912 | ) | | | (20,139,522 | ) | | | $(278,289,292 | ) |
| | | | |
| Net change | | | | | | | | | | | | | | | | |
Class A | | | 247 | | | | $3,716 | | | | 1,262 | | | | $17,807 | |
Class I | | | 106 | | | | 1,599 | | | | (17,934,271 | ) | | | (247,557,009 | ) |
Class R5 | | | 3,975,996 | | | | 59,139,540 | | | | 20,025,499 | | | | 278,276,542 | |
| | | 3,976,349 | | | | $59,144,855 | | | | 2,092,490 | | | | $30,737,340 | |
| (i) | For Class R5, the period is from inception, July 2, 2012, through the stated period end. |
20
Notes to Financial Statements (unaudited) – continued
Class A, Class B, Class C, Class R1, Class R2, Class R3, and Class R4 shares were not available for sale during the period. During the period, the fund’s Class I and Class R5 shares were available for sale only to funds distributed by MFD that invest primarily in shares of other MFS funds (“MFS fund-of-funds”). Please see the fund’s prospectus for details.
The fund is solely invested in by MFS and the MFS funds-of-funds. The MFS funds-of-funds do not invest in the underlying MFS funds for the purpose of exercising management or control. At the end of the period, the MFS Growth Allocation Fund, MFS Moderate Allocation Fund, MFS Aggressive Growth Allocation Fund, MFS Conservative Allocation Fund, MFS Liftetime 2040 Fund, MFS Liftetime 2030 Fund, and MFS Liftetime 2020 Fund were the owners of record of approximately 35%, 29%, 19%, 7%, 3%, 3%, and 1%, respectively, of the value of outstanding voting shares of the fund. In addition, the MFS Lifetime Retirement Income Fund, MFS Lifetime 2055 Fund, MFS Lifetime 2050 Fund, MFS Lifetime 2045 Fund, MFS Lifetime 2035 Fund, MFS Lifetime 2025 Fund, MFS Lifetime 2015 Fund, and the MFS Lifetime 2010 Fund were each the owners of record of less than 1% of the value of outstanding voting shares of the fund.
(6) Line of Credit
The fund and certain other funds managed by MFS participate in a $1.1 billion unsecured committed line of credit, subject to a $1 billion sublimit, provided by a syndication of banks under a credit agreement. Borrowings may be made for temporary financing needs. Interest is charged to each fund, based on its borrowings, generally at a rate equal to the higher of the Federal Reserve funds rate or one month LIBOR plus an agreed upon spread. A commitment fee, based on the average daily, unused portion of the committed line of credit, is allocated among the participating funds at the end of each calendar quarter. In addition, the fund and other funds managed by MFS have established unsecured uncommitted borrowing arrangements with certain banks for temporary financing needs. Interest is charged to each fund, based on its borrowings, at a rate equal to the Federal Reserve funds rate plus an agreed upon spread. For the six months ended August 31, 2013, the fund’s commitment fee and interest expense were $751 and $0, respectively, and are included in “Miscellaneous” expense in the Statement of Operations.
(7) Transactions in Underlying Affiliated Funds-Affiliated Issuers
An affiliated issuer may be considered one in which the fund owns 5% or more of the outstanding voting securities, or a company which is under common control. For the purposes of this report, the fund assumes the following to be an affiliated issuer:
| | | | | | | | | | | | | | | | |
| Underlying Affiliated Fund | | Beginning
Shares/Par
Amount | | | Acquisitions
Shares/Par
Amount | | | Dispositions
Shares/Par
Amount | | | Ending
Shares/Par
Amount | |
| MFS Institutional Money Market Portfolio | | | 4,064,702 | | | | 74,296,523 | | | | (61,942,796 | ) | | | 16,418,429 | |
| | | | |
| Underlying Affiliated Fund | | Realized
Gain (Loss) | | | Capital Gain
Distributions | | | Dividend
Income | | | Ending
Value | |
| MFS Institutional Money Market Portfolio | | | $— | | | | $— | | | | $2,778 | | | | $16,418,429 | |
21
BOARD REVIEW OF INVESTMENT ADVISORY AGREEMENT
The Investment Company Act of 1940 requires that both the full Board of Trustees and a majority of the non-interested (“independent”) Trustees, voting separately, annually approve the continuation of the Fund’s investment advisory agreement with MFS. The Trustees consider matters bearing on the Fund and its advisory arrangements at their meetings throughout the year, including a review of performance data at each regular meeting. In addition, the independent Trustees met several times over the course of three months beginning in May and ending in July, 2013 (“contract review meetings”) for the specific purpose of considering whether to approve the continuation of the investment advisory agreement for the Fund and the other investment companies that the Board oversees (the “MFS Funds”). The independent Trustees were assisted in their evaluation of the Fund’s investment advisory agreement by independent legal counsel, from whom they received separate legal advice and with whom they met separately from MFS during various contract review meetings. The independent Trustees were also assisted in this process by the MFS Funds’ Independent Chief Compliance Officer, a full-time senior officer appointed by and reporting to the independent Trustees.
In connection with their deliberations regarding the continuation of the investment advisory agreement, the Trustees, including the independent Trustees, considered such information and factors as they believed, in light of the legal advice furnished to them and their own business judgment, to be relevant. The investment advisory agreement for the Fund was considered separately, although the Trustees also took into account the common interests of all MFS Funds in their review. As described below, the Trustees considered the nature, quality, and extent of the various investment advisory, administrative, and shareholder services performed by MFS under the existing investment advisory agreement and other arrangements with the Fund.
In connection with their contract review meetings, the Trustees received and relied upon materials that included, among other items: (i) information provided by Lipper Inc., an independent third party, on the investment performance of the Fund for various time periods ended December 31, 2012 and the investment performance of a group of funds with substantially similar investment classifications/objectives (the “Lipper performance universe”), (ii) information provided by Lipper Inc. on the Fund’s advisory fees and other expenses and the advisory fees and other expenses of comparable funds identified by Lipper Inc. (the “Lipper expense group”), (iii) information provided by MFS on the advisory fees of comparable portfolios of other clients of MFS, including institutional separate accounts and other clients, (iv) information as to whether and to what extent applicable expense waivers, reimbursements or fee “breakpoints” are observed for the Fund, (v) information regarding MFS’ financial results and financial condition, including MFS’ and certain of its affiliates’ estimated profitability from services performed for the Fund and the MFS Funds as a whole, and compared to MFS’ institutional business, (vi) MFS’ views regarding the outlook for the mutual fund industry and the strategic business plans of MFS, (vii) descriptions of various functions performed by MFS for the Funds, such as compliance monitoring and portfolio trading practices, and (viii) information regarding the overall organization of MFS, including information about MFS’ senior management and other personnel providing investment advisory, administrative and other services to
22
Board Review of Investment Advisory Agreement – continued
the Fund and the other MFS Funds. The comparative performance, fee and expense information prepared and provided by Lipper Inc. was not independently verified and the independent Trustees did not independently verify any information provided to them by MFS.
The Trustees’ conclusion as to the continuation of the investment advisory agreement was based on a comprehensive consideration of all information provided to the Trustees and not the result of any single factor. Some of the factors that figured particularly in the Trustees’ deliberations are described below, although individual Trustees may have evaluated the information presented differently from one another, giving different weights to various factors. It is also important to recognize that the fee arrangements for the Fund and other MFS Funds are the result of years of review and discussion between the independent Trustees and MFS, that certain aspects of such arrangements may receive greater scrutiny in some years than in others, and that the Trustees’ conclusions may be based, in part, on their consideration of these same arrangements during the course of the year and in prior years.
Effective May 1, 2011, the Board of Trustees terminated the Fund’s subadvisory investment agreement among MFS Series Trust XIII, on behalf of the Fund, MFS and Sun Capital Advisers LLC (“Sun Capital”), and MFS assumed responsibility for day-to-day management of the Fund. The Sun Capital portfolio manager who was responsible for the day-to-day management of the Fund became an employee of MFS on or about May 1, 2011 and continues to manage the Fund.
Based on information provided by Lipper Inc. and MFS, the Trustees reviewed the Fund’s total return investment performance as well as the performance of peer groups of funds over various time periods. The Trustees placed particular emphasis on the total return performance of the Fund’s Class A shares in comparison to the performance of funds in its Lipper performance universe over the three-year period ended December 31, 2012, which the Trustees believed was a long enough period to reflect differing market conditions. The total return performance of the Fund’s Class A shares was in the 4th quintile relative to the other funds in the universe for this three-year period (the 1st quintile being the best performers and the 5th quintile being the worst performers). The total return performance of the Fund’s Class A shares was in the 2nd quintile for the one-year period ended December 31, 2012 relative to the Lipper performance universe. The Fund commenced operations on March 11, 2009; therefore no performance data for the five-year period was available. Because of the passage of time, these performance results may differ from the performance results for more recent periods, including those shown elsewhere in this report.
The Trustees expressed concern to MFS about the substandard investment performance of the Fund. In the course of their deliberations, the Trustees took into account information provided by MFS in connection with the contract review meetings, as well as during investment review meetings conducted with portfolio management personnel during the course of the year, as to MFS’ efforts to improve the Fund’s performance, including the termination of the sub-advisory relationship with Sun Capital in 2011 and the availability of MFS’ global resources to the Fund’s portfolio management team since that time. In addition, the Trustees requested that they receive a separate update on the Fund’s performance at each of their regular meetings. After reviewing these and related factors, the Trustees concluded, within the context of their
23
Board Review of Investment Advisory Agreement – continued
overall conclusions regarding the investment advisory agreement, that MFS’ responses and efforts and plans to improve investment performance were sufficient to support approval of the continuance of the investment advisory agreement for an additional one-year period, but that they would continue to closely monitor the performance of the Fund.
In assessing the reasonableness of the Fund’s advisory fee, the Trustees considered, among other information, the Fund’s advisory fee and the total expense ratio of the Fund’s Class A shares as a percentage of average daily net assets and the advisory fee and total expense ratios of peer groups of funds based on information provided by Lipper Inc. The Trustees considered that, according to the Lipper data (which takes into account any fee reductions or expense limitations that were in effect during the Fund’s last fiscal year), the Fund’s effective advisory fee rate was higher than the Lipper expense group median, and the Fund’s total expense ratio was lower than the Lipper expense group median.
The Trustees also considered the advisory fees charged by MFS to any comparable institutional accounts. In comparing these fees, the Trustees considered information provided by MFS as to the generally broader scope of services provided by MFS to the Fund in comparison to institutional accounts, the higher demands placed on MFS’ investment personnel and trading infrastructure as a result of the daily cash in-flows and out-flows of the Fund, and the impact on MFS and expenses associated with the more extensive regulatory regime to which the Fund is subject in comparison to institutional accounts.
The Trustees also considered whether the Fund may benefit from any economies of scale in the management of the Fund in the event of growth in assets of the Fund and/or growth in assets of the MFS Funds as a whole. They noted that the Fund’s advisory fee rate schedule is subject to contractual breakpoints that reduce the Fund’s advisory fee rate on average daily net assets over $1 billion and $2.5 billion. The Trustees also noted that MFS has agreed in writing to waive a portion of the management fees of certain MFS Funds, including the Fund, if the total combined assets of certain funds within the MFS Funds’ complex increase above agreed upon thresholds (the “group fee waiver”), enabling the Fund’s shareholders to share in the benefits from any economies of scale at the complex level. The group fee waiver is reviewed and renewed annually between the Board and MFS. The Trustees concluded that the existing breakpoints and the group fee waiver were sufficient to allow the Fund to benefit from economies of scale as its assets and overall complex assets grow.
The Trustees also considered information prepared by MFS relating to MFS’ costs and profits with respect to the Fund, the MFS Funds considered as a group, and other investment companies and accounts advised by MFS, as well as MFS’ methodologies used to determine and allocate its costs to the MFS Funds, the Fund and other accounts and products for purposes of estimating profitability.
After reviewing these and other factors described herein, the Trustees concluded, within the context of their overall conclusions regarding the investment advisory agreement, that the advisory fees charged to the Fund represent reasonable compensation in light of the services being provided by MFS to the Fund.
24
Board Review of Investment Advisory Agreement – continued
In addition, the Trustees considered MFS’ resources and related efforts to continue to retain, attract and motivate capable personnel to serve the Fund. The Trustees also considered current and developing conditions in the financial services industry, including the presence of large and well-capitalized companies which are spending, and appear to be prepared to continue to spend, substantial sums to engage personnel and to provide services to competing investment companies. In this regard, the Trustees also considered the financial resources of MFS and its ultimate parent, Sun Life Financial Inc. The Trustees also considered the advantages and possible disadvantages to the Fund of having an adviser that also serves other investment companies as well as other accounts.
The Trustees also considered the nature, quality, cost, and extent of administrative, transfer agency, and distribution services provided to the Fund by MFS and its affiliates under agreements and plans other than the investment advisory agreement, including any 12b-1 fees the Fund pays to MFS Fund Distributors, Inc., an affiliate of MFS. The Trustees also considered the nature, extent and quality of certain other services MFS performs or arranges for on the Fund’s behalf, which may include securities lending programs, directed expense payment programs, class action recovery programs, and MFS’ interaction with third-party service providers, principally custodians and sub-custodians. The Trustees concluded that the various non-advisory services provided by MFS and its affiliates on behalf of the Fund were satisfactory.
The Trustees also considered benefits to MFS from the use of the Fund’s portfolio brokerage commissions, if applicable, to pay for investment research and various other factors. Additionally, the Trustees considered so-called “fall-out benefits” to MFS such as reputational value derived from serving as investment manager to the Fund.
Based on their evaluation of factors that they deemed to be material, including those factors described above, the Board of Trustees, including the independent Trustees, concluded that the Fund’s investment advisory agreement with MFS should be continued for an additional one-year period, commencing August 1, 2013.
A discussion regarding the Board’s most recent review and renewal of the fund’s Investment Advisory Agreement with MFS is available by clicking on the fund’s name under “Mutual Funds” in the “Products” section of the MFS Web site (mfs.com).
25
PROXY VOTING POLICIES AND INFORMATION
A general description of the MFS funds’ proxy voting policies and procedures is available without charge, upon request, by calling 1-800-225-2606, by visiting the Proxy Voting section of mfs.com or by visiting the SEC’s Web site at http://www.sec.gov.
Information regarding how the fund voted proxies relating to portfolio securities during the most recent twelve-month period ended June 30 is available without charge by visiting the Proxy Voting section of mfs.com or by visiting the SEC’s Web site at http://www.sec.gov.
QUARTERLY PORTFOLIO DISCLOSURE
The fund will file a complete schedule of portfolio holdings with the Securities and Exchange Commission (the Commission) for the first and third quarters of each fiscal year on Form N-Q. A shareholder can obtain the quarterly portfolio holdings report at mfs.com. The fund’s Form N-Q is also available on the EDGAR database on the Commission’s Internet Web site at http://www.sec.gov, and may be reviewed and copied at the:
Public Reference Room
Securities and Exchange Commission
100 F Street, NE, Room 1580
Washington, D.C. 20549
Information on the operation of the Public Reference Room may be obtained by calling the Commission at 1-800-SEC-0330. Copies of the fund’s Form N-Q also may be obtained, upon payment of a duplicating fee, by electronic request at the following e-mail address: publicinfo@sec.gov, or by writing the Public Reference Section at the above address.
FURTHER INFORMATION
From time to time, MFS may post important information about the fund or the MFS funds on the MFS web site (mfs.com). This information is available by visiting the “News & Commentary” section of mfs.com or by clicking on the fund’s name under “Mutual Funds” in the “Products” section of mfs.com.
PROVISION OF FINANCIAL REPORTS AND SUMMARY PROSPECTUSES
The fund produces financial reports every six months and updates its summary prospectus and prospectus annually. To avoid sending duplicate copies of materials to households, only one copy of the fund’s annual and semiannual report and summary prospectus may be mailed to shareholders having the same last name and residential address on the fund’s records. However, any shareholder may contact MFSC (please see back cover for address and telephone number) to request that copies of these reports and summary prospectuses be sent personally to that shareholder.
26
Save paper with eDelivery.

| MFS® will send you prospectuses, |
reports, and proxies directly via e-mail so you will get information faster with less mailbox clutter.
To sign up:
1. Go to mfs.com.
2. Log in via MFS® Access.
3. Select eDelivery.
If you own your MFS fund shares through a financial institution or a retirement plan, MFS® TALK, MFS® Access, or eDelivery may not be available to you.
CONTACT
WEB SITE
mfs.com
MFS TALK
1-800-637-8255
24 hours a day
ACCOUNT SERVICE AND LITERATURE
Shareholders
1-800-225-2606
Financial advisors
1-800-343-2829
Retirement plan services
1-800-637-1255
MAILING ADDRESS
MFS Service Center, Inc.
P.O. Box 55824
Boston, MA 02205-5824
OVERNIGHT MAIL
MFS Service Center, Inc.
c/o Boston Financial Data Services
30 Dan Road
Canton, MA 02021-2809
SEMIANNUAL REPORT
August 31, 2013

MFS® NEW DISCOVERY
VALUE FUND

NDV-SEM
MFS® NEW DISCOVERY VALUE FUND
CONTENTS
The report is prepared for the general information of shareholders.
It is authorized for distribution to prospective investors only when preceded or accompanied by a current prospectus.
NOT FDIC INSURED Ÿ MAY LOSE VALUE Ÿ NO BANK GUARANTEE

LETTER FROM THE CHAIRMAN AND CEO
Dear Shareholders:
Global economic trends appear to favor growth again despite risks created by the U.S. government’s gridlock. The U.S. economy’s slow but steady expansion is no longer the
exception. The eurozone has emerged from its 18-month-long recession, with Germany leading the way. China’s monthly gauges of economic activity once again point toward expansion. And Japan is picking up momentum in response to its government’s and central bank’s aggressive program of monetary easing.
However, geopolitical risks have risen, with violence erupting in Egypt and Syria and the possibility of further unrest in the Middle East. The U.S. Federal Reserve’s expected tapering of its bond-buying stimulus program has weighed on global markets
since May. Emerging markets, including Brazil and India, have borne much of the brunt, as their currency values have dropped and nervous investors have fled to safety elsewhere. In Europe, unemployment persists at historically high levels. The trend towards a pickup in global growth, while encouraging, appears tenuous, particularly with the risk of a U.S. debt default.
As always, managing risk in the face of uncertainty remains a top priority for investors. At MFS®, our uniquely collaborative investment process employs integrated, global research and active risk management. Our global team of investment professionals shares ideas and evaluates opportunities across continents, investment disciplines and asset classes — all with a goal of building better insights, and ultimately better results, for our clients.
We are mindful of the many economic challenges investors face, and believe it is more important than ever to maintain a long-term view and employ time-tested principles, such as asset allocation and diversification. We remain confident that our unique approach can serve investors well as they work with their financial advisors to identify and pursue the most suitable opportunities.
Respectfully,

Robert J. Manning
Chairman and Chief Executive Officer
MFS Investment Management®
October 17, 2013
The opinions expressed in this letter are subject to change, may not be relied upon for investment advice, and no forecasts can be guaranteed.
1
PORTFOLIO COMPOSITION
Portfolio structure
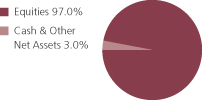
| | | | |
| Top ten holdings | | | | |
| CAI International, Inc. | | | 1.6% | |
| Global Payments, Inc. | | | 1.5% | |
| Huntington Bancshares, Inc. | | | 1.4% | |
| Foster Wheeler AG | | | 1.4% | |
| PrivateBancorp, Inc. | | | 1.4% | |
| GrafTech International Ltd. | | | 1.3% | |
| SM Energy Co. | | | 1.3% | |
| Diana Shipping, Inc. | | | 1.3% | |
| TCF Financial Corp. | | | 1.3% | |
| Ingram Micro, Inc., “A” | | | 1.3% | |
| | | | |
| Equity sectors | | | | |
| Financial Services | | | 28.2% | |
| Technology | | | 12.2% | |
| Industrial Goods & Services | | | 11.6% | |
| Basic Materials | | | 7.8% | |
| Retailing | | | 6.6% | |
| Energy | | | 6.5% | |
| Leisure | | | 5.1% | |
| Health Care | | | 4.6% | |
| Transportation | | | 4.2% | |
| Utilities & Communications | | | 3.6% | |
| Special Products & Services | | | 3.5% | |
| Consumer Staples | | | 2.0% | |
| Autos & Housing | | | 1.1% | |
Percentages are based on net assets as of 8/31/13.
The portfolio is actively managed and current holdings may be different.
2
EXPENSE TABLE
Fund expenses borne by the shareholders during the period,
March 1, 2013 through August 31, 2013
As a shareholder of the fund, you incur two types of costs: (1) transaction costs, including sales charges (loads) on certain purchase or redemption payments, and (2) ongoing costs, including management fees; distribution and service (12b-1) fees; and other fund expenses. This example is intended to help you understand your ongoing costs (in dollars) of investing in the fund and to compare these costs with the ongoing costs of investing in other mutual funds.
The example is based on an investment of $1,000 invested at the beginning of the period and held for the entire period March 1, 2013 through August 31, 2013.
The expenses include the payment of a portion of the transfer-agent-related expenses of MFS funds that invest in the fund. For further information, please see the Notes to the Financial Statements.
Actual Expenses
The first line for each share class in the following table provides information about actual account values and actual expenses. You may use the information in this line, together with the amount you invested, to estimate the expenses that you paid over the period. Simply divide your account value by $1,000 (for example, an $8,600 account value divided by $1,000 = 8.6), then multiply the result by the number in the first line under the heading entitled “Expenses Paid During Period” to estimate the expenses you paid on your account during this period.
Hypothetical Example for Comparison Purposes
The second line for each share class in the following table provides information about hypothetical account values and hypothetical expenses based on the fund’s actual expense ratio and an assumed rate of return of 5% per year before expenses, which is not the fund’s actual return. The hypothetical account values and expenses may not be used to estimate the actual ending account balance or expenses you paid for the period. You may use this information to compare the ongoing costs of investing in the fund and other funds. To do so, compare this 5% hypothetical example with the 5% hypothetical examples that appear in the shareholder reports of the other funds.
Please note that the expenses shown in the table are meant to highlight your ongoing costs only and do not reflect any transactional costs, such as sales charges (loads). Therefore, the second line for each share class in the table is useful in comparing ongoing costs only, and will not help you determine the relative total costs of owning different funds. In addition, if these transactional costs were included, your costs would have been higher.
3
Expense Table – continued
| | | | | | | | | | | | | | | | | | |
Share
Class | | | | Annualized
Expense Ratio | | | Beginning
Account Value
3/01/13 | | | Ending Account Value
8/31/13 | | | Expenses Paid During Period (p) 3/01/13-8/31/13 | |
| A | | Actual | | | 1.45% | | | | $1,000.00 | | | | $1,102.14 | | | | $7.68 | |
| | Hypothetical (h) | | | 1.45% | | | | $1,000.00 | | | | $1,017.90 | | | | $7.38 | |
| B | | Actual | | | 2.20% | | | | $1,000.00 | | | | $1,098.07 | | | | $11.63 | |
| | Hypothetical (h) | | | 2.20% | | | | $1,000.00 | | | | $1,014.12 | | | | $11.17 | |
| C | | Actual | | | 2.20% | | | | $1,000.00 | | | | $1,098.25 | | | | $11.64 | |
| | Hypothetical (h) | | | 2.20% | | | | $1,000.00 | | | | $1,014.12 | | | | $11.17 | |
| I | | Actual | | | 1.20% | | | | $1,000.00 | | | | $1,103.74 | | | | $6.36 | |
| | Hypothetical (h) | | | 1.20% | | | | $1,000.00 | | | | $1,019.16 | | | | $6.11 | |
| R1 | | Actual | | | 2.20% | | | | $1,000.00 | | | | $1,098.07 | | | | $11.63 | |
| | Hypothetical (h) | | | 2.20% | | | | $1,000.00 | | | | $1,014.12 | | | | $11.17 | |
| R2 | | Actual | | | 1.70% | | | | $1,000.00 | | | | $1,101.16 | | | | $9.00 | |
| | Hypothetical (h) | | | 1.70% | | | | $1,000.00 | | | | $1,016.64 | | | | $8.64 | |
| R3 | | Actual | | | 1.45% | | | | $1,000.00 | | | | $1,101.96 | | | | $7.68 | |
| | Hypothetical (h) | | | 1.45% | | | | $1,000.00 | | | | $1,017.90 | | | | $7.38 | |
| R4 | | Actual | | | 1.20% | | | | $1,000.00 | | | | $1,104.60 | | | | $6.37 | |
| | Hypothetical (h) | | | 1.20% | | | | $1,000.00 | | | | $1,019.16 | | | | $6.11 | |
| R5 | | Actual | | | 1.18% | | | | $1,000.00 | | | | $1,103.87 | | | | $6.26 | |
| | Hypothetical (h) | | | 1.18% | | | | $1,000.00 | | | | $1,019.26 | | | | $6.01 | |
| (h) | 5% class return per year before expenses. |
| (p) | Expenses paid are equal to each class’s annualized expense ratio, as shown above, multiplied by the average account value over the period, multiplied by the number of days in the period, divided by the number of days in the year. Expenses paid do not include any applicable sales charges (loads). If these transaction costs had been included, your costs would have been higher. |
Notes to Expense Table
Changes to the fund’s fee arrangements occurred during the six month period. Had these fee changes been in effect throughout the entire six month period, the annualized expense ratios would have been 1.16% for Class R5; the actual expenses paid during the period would have been approximately $6.15 for Class R5; and the hypothetical expenses paid during the period would have been approximately $5.90 for Class R5. For further information about the fund’s fee arrangements and changes to those fee arrangements, please see Note 3 in the Notes to Financial Statements.
4
PORTFOLIO OF INVESTMENTS
8/31/13 (unaudited)
The Portfolio of Investments is a complete list of all securities owned by your fund. It is categorized by broad-based asset classes.
| | | | | | | | |
| Common Stocks - 97.0% | | | | | | | | |
| Issuer | | Shares/Par | | | Value ($) | |
| Aerospace - 0.6% | | | | | | | | |
| Kaman Corp. | | | 46,660 | | | $ | 1,642,427 | |
| | |
| Apparel Manufacturers - 2.1% | | | | | | | | |
| Guess?, Inc. | | | 76,380 | | | $ | 2,329,590 | |
| Hanesbrands, Inc. | | | 50,467 | | | | 3,001,777 | |
| | | | | | | | |
| | | | | | | $ | 5,331,367 | |
| Broadcasting - 0.8% | | | | | | | | |
| Stroer Out-of-Home Media AG (a) | | | 143,790 | | | $ | 2,088,540 | |
| | |
| Brokerage & Asset Managers - 2.8% | | | | | | | | |
| FXCM, Inc., “A” | | | 141,800 | | | $ | 2,692,782 | |
| GFI Group, Inc. | | | 454,524 | | | | 1,822,641 | |
| NASDAQ OMX Group, Inc. | | | 84,972 | | | | 2,537,264 | |
| | | | | | | | |
| | | | | | | $ | 7,052,687 | |
| Business Services - 2.8% | | | | | | | | |
| Forrester Research, Inc. | | | 62,410 | | | $ | 2,058,282 | |
| G&K Services, Inc., “A” | | | 23,969 | | | | 1,232,965 | |
| Global Payments, Inc. | | | 82,530 | | | | 3,932,555 | |
| | | | | | | | |
| | | | | | | $ | 7,223,802 | |
| Chemicals - 0.9% | | | | | | | | |
| Intrepid Potash, Inc. | | | 177,560 | | | $ | 2,208,846 | |
| | |
| Computer Software - 1.2% | | | | | | | | |
| OBIC Co. Ltd. | | | 10,550 | | | $ | 3,086,705 | |
| | |
| Computer Software - Systems - 2.5% | | | | | | | | |
| Ingram Micro, Inc., “A” (a) | | | 147,459 | | | $ | 3,258,844 | |
| NICE Systems Ltd., ADR | | | 82,009 | | | | 3,116,342 | |
| | | | | | | | |
| | | | | | | $ | 6,375,186 | |
| Construction - 1.1% | | | | | | | | |
| Lennox International, Inc. | | | 40,042 | | | $ | 2,748,883 | |
| | |
| Consumer Products - 1.2% | | | | | | | | |
| Sensient Technologies Corp. | | | 73,220 | | | $ | 3,035,701 | |
5
Portfolio of Investments (unaudited) – continued
| | | | | | | | |
| Issuer | | Shares/Par | | | Value ($) | |
| Common Stocks - continued | | | | | | | | |
| Consumer Services - 0.7% | | | | | | | | |
| Grand Canyon Education, Inc. (a) | | | 51,140 | | | $ | 1,764,841 | |
| | |
| Containers - 1.8% | | | | | | | | |
| Greif, Inc., “A” | | | 58,566 | | | $ | 3,154,950 | |
| Packaging Corp. of America | | | 25,990 | | | | 1,378,510 | |
| | | | | | | | |
| | | | | | | $ | 4,533,460 | |
| Electronics - 7.9% | | | | | | | | |
| CEVA, Inc. (a) | | | 96,010 | | | $ | 1,740,661 | |
| Entegris, Inc. (a) | | | 158,650 | | | | 1,491,310 | |
| Entropic Communications, Inc. (a) | | | 462,098 | | | | 1,931,570 | |
| Lattice Semiconductor Corp. (a) | | | 309,960 | | | | 1,475,410 | |
| M/A-COM Technology Solutions Holdings, Inc. (a) | | | 189,740 | | | | 3,104,146 | |
| MaxLinear, Inc., “A” (a) | | | 352,017 | | | | 2,963,983 | |
| Micrel, Inc. | | | 161,600 | | | | 1,486,720 | |
| MKS Instruments, Inc. | | | 52,010 | | | | 1,302,851 | |
| Ultratech, Inc. (a) | | | 86,840 | | | | 2,455,835 | |
| Veeco Instruments, Inc. (a) | | | 62,573 | | | | 2,197,564 | |
| | | | | | | | |
| | | | | | | $ | 20,150,050 | |
| Energy - Independent - 2.5% | | | | | | | | |
| Energen Corp. | | | 27,000 | | | $ | 1,790,370 | |
| Rosetta Resources, Inc. (a) | | | 27,720 | | | | 1,289,812 | |
| SM Energy Co. | | | 48,240 | | | | 3,295,757 | |
| | | | | | | | |
| | | | | | | $ | 6,375,939 | |
| Engineering - Construction - 1.4% | | | | | | | | |
| Foster Wheeler AG (a) | | | 151,625 | | | $ | 3,514,668 | |
| | |
| Entertainment - 2.1% | | | | | | | | |
| Carmike Cinemas, Inc. (a) | | | 154,520 | | | $ | 2,708,736 | |
| Cinemark Holdings, Inc. | | | 88,625 | | | | 2,611,779 | |
| | | | | | | | |
| | | | | | | $ | 5,320,515 | |
| Food & Beverages - 0.8% | | | | | | | | |
| Pinnacle Foods, Inc. | | | 78,780 | | | $ | 2,134,938 | |
| | |
| Health Maintenance Organizations - 1.0% | | | | | | | | |
| Centene Corp. (a) | | | 25,830 | | | $ | 1,476,185 | |
| Molina Healthcare, Inc. (a) | | | 35,220 | | | | 1,175,996 | |
| | | | | | | | |
| | | | | | | $ | 2,652,181 | |
6
Portfolio of Investments (unaudited) – continued
| | | | | | | | |
| Issuer | | Shares/Par | | | Value ($) | |
| Common Stocks - continued | | | | | | | | |
| Insurance - 6.8% | | | | | | | | |
| Allied World Assurance Co. | | | 28,853 | | | $ | 2,646,686 | |
| Aspen Insurance Holdings Ltd. | | | 66,429 | | | | 2,362,880 | |
| Everest Re Group Ltd. | | | 23,447 | | | | 3,211,067 | |
| Hanover Insurance Group, Inc. | | | 52,050 | | | | 2,772,704 | |
| Symetra Financial Corp. | | | 166,729 | | | | 2,879,410 | |
| Third Point Reinsurance Ltd. (a) | | | 155,880 | | | | 2,056,057 | |
| Willis Group Holdings PLC | | | 32,910 | | | | 1,358,525 | |
| | | | | | | | |
| | | | | | | $ | 17,287,329 | |
| Leisure & Toys - 2.2% | | | | | | | | |
| Brunswick Corp. | | | 76,760 | | | $ | 2,790,994 | |
| Callaway Golf Co. | | | 404,371 | | | | 2,798,247 | |
| | | | | | | | |
| | | | | | | $ | 5,589,241 | |
| Machinery & Tools - 8.4% | | | | | | | | |
| Columbus McKinnon Corp. (a) | | | 144,850 | | | $ | 3,099,790 | |
| Douglas Dynamics, Inc. | | | 177,545 | | | | 2,496,283 | |
| EnPro Industries, Inc. (a) | | | 43,090 | | | | 2,455,268 | |
| Herman Miller, Inc. | | | 91,815 | | | | 2,338,528 | |
| Joy Global, Inc. | | | 51,520 | | | | 2,530,662 | |
| Kennametal, Inc. | | | 69,420 | | | | 2,951,738 | |
| Polypore International, Inc. (a) | | | 66,500 | | | | 2,842,875 | |
| Regal Beloit Corp. | | | 39,580 | | | | 2,521,246 | |
| | | | | | | | |
| | | | | | | $ | 21,236,390 | |
| Major Banks - 2.5% | | | | | | | | |
| Comerica, Inc. | | | 69,340 | | | $ | 2,831,846 | |
| Huntington Bancshares, Inc. | | | 431,860 | | | | 3,558,526 | |
| | | | | | | | |
| | | | | | | $ | 6,390,372 | |
| Medical & Health Technology & Services - 2.6% | | | | | | | | |
| Almost Family, Inc. | | | 72,125 | | | $ | 1,360,999 | |
| Cross Country Healthcare, Inc. (a) | | | 401,381 | | | | 2,267,803 | |
| MEDNAX, Inc. (a) | | | 30,910 | | | | 3,009,707 | |
| | | | | | | | |
| | | | | | | $ | 6,638,509 | |
| Medical Equipment - 0.9% | | | | | | | | |
| Teleflex, Inc. | | | 30,073 | | | $ | 2,318,027 | |
| | |
| Metals & Mining - 4.1% | | | | | | | | |
| GrafTech International Ltd. (a) | | | 425,720 | | | $ | 3,329,130 | |
| Horsehead Holding Corp. (a) | | | 135,300 | | | | 1,606,011 | |
| Iluka Resources Ltd. | | | 285,530 | | | | 2,704,184 | |
7
Portfolio of Investments (unaudited) – continued
| | | | | | | | |
| Issuer | | Shares/Par | | | Value ($) | |
| Common Stocks - continued | | | | | | | | |
| Metals & Mining - continued | | | | | | | | |
| TMS International Corp., “A” | | | 155,950 | | | $ | 2,715,090 | |
| | | | | | | | |
| | | | | | | $ | 10,354,415 | |
| Natural Gas - Distribution - 1.8% | | | | | | | | |
| AGL Resources, Inc. | | | 51,097 | | | $ | 2,245,713 | |
| UGI Corp. | | | 57,601 | | | | 2,257,959 | |
| | | | | | | | |
| | | | | | | $ | 4,503,672 | |
| Network & Telecom - 0.6% | | | | | | | | |
| Polycom, Inc. (a) | | | 147,840 | | | $ | 1,468,051 | |
| | |
| Oil Services - 4.0% | | | | | | | | |
| C&J Energy Services, Inc. (a) | | | 125,770 | | | $ | 2,582,058 | |
| Superior Energy Services, Inc. (a) | | | 101,410 | | | | 2,490,630 | |
| Tesco Corp. (a) | | | 159,400 | | | | 2,462,730 | |
| Tidewater, Inc. | | | 46,140 | | | | 2,489,714 | |
| | | | | | | | |
| | | | | | | $ | 10,025,132 | |
| Other Banks & Diversified Financials - 11.8% | | | | | | | | |
| Aaron’s, Inc. | | | 105,300 | | | $ | 2,850,471 | |
| Berkshire Hills Bancorp, Inc. | | | 72,580 | | | | 1,803,613 | |
| Brookline Bancorp, Inc. | | | 309,425 | | | | 2,800,296 | |
| CAI International, Inc. (a) | | | 184,320 | | | | 4,040,294 | |
| Cathay General Bancorp, Inc. | | | 126,046 | | | | 2,775,533 | |
| First Interstate BancSystem, Inc. | | | 94,720 | | | | 2,152,986 | |
| PrivateBancorp, Inc. | | | 157,760 | | | | 3,442,323 | |
| Regional Management Corp. (a) | | | 44,350 | | | | 1,218,738 | |
| Sandy Spring Bancorp, Inc. | | | 126,498 | | | | 2,827,230 | |
| TCF Financial Corp. | | | 232,750 | | | | 3,270,138 | |
| Textainer Group Holdings Ltd. | | | 75,910 | | | | 2,646,223 | |
| | | | | | | | |
| | | | | | | $ | 29,827,845 | |
| Pollution Control - 1.2% | | | | | | | | |
| Progressive Waste Solutions Ltd. | | | 123,196 | | | $ | 2,982,575 | |
| | |
| Railroad & Shipping - 1.3% | | | | | | | | |
| Diana Shipping, Inc. (a) | | | 302,264 | | | $ | 3,282,587 | |
| | |
| Real Estate - 4.3% | | | | | | | | |
| BioMed Realty Trust, Inc., REIT | | | 133,820 | | | $ | 2,463,626 | |
| Capstead Mortgage Corp., REIT | | | 164,312 | | | | 1,929,023 | |
| EPR Properties, REIT | | | 59,638 | | | | 2,921,069 | |
| Hatteras Financial Corp., REIT | | | 81,630 | | | | 1,493,829 | |
8
Portfolio of Investments (unaudited) – continued
| | | | | | | | |
| Issuer | | Shares/Par | | | Value ($) | |
| Common Stocks - continued | | | | | | | | |
| Real Estate - continued | | | | | | | | |
| Select Income, REIT | | | 90,150 | | | $ | 2,193,350 | |
| | | | | | | | |
| | | | | | | $ | 11,000,897 | |
| Specialty Chemicals - 1.1% | | | | | | | | |
| Tronox Ltd., “A” | | | 125,960 | | | $ | 2,690,506 | |
| | |
| Specialty Stores - 4.5% | | | | | | | | |
| ANN, Inc. (a) | | | 92,590 | | | $ | 3,212,873 | |
| Children’s Place Retail Store, Inc. (a) | | | 57,530 | | | | 3,059,445 | |
| Gordmans Stores, Inc. (a) | | | 127,552 | | | | 1,762,769 | |
| Kirkland’s, Inc. (a) | | | 89,220 | | | | 1,740,682 | |
| Tilly’s, Inc. (a) | | | 125,770 | | | | 1,736,884 | |
| | | | | | | | |
| | | | | | | $ | 11,512,653 | |
| Trucking - 2.9% | | | | | | | | |
| Atlas Air Worldwide Holdings, Inc. (a) | | | 62,690 | | | $ | 2,896,278 | |
| Celadon Group, Inc. | | | 78,840 | | | | 1,430,158 | |
| Marten Transport Ltd. | | | 166,440 | | | | 2,944,324 | |
| | | | | | | | |
| | | | | | | $ | 7,270,760 | |
| Utilities - Electric Power - 1.8% | | | | | | | | |
| El Paso Electric Co. | | | 66,000 | | | $ | 2,270,400 | |
| Great Plains Energy, Inc. | | | 101,607 | | | | 2,227,225 | |
| | | | | | | | |
| | | | | | | $ | 4,497,625 | |
| Total Common Stocks (Identified Cost, $215,118,297) | | | | | | $ | 246,117,322 | |
| | |
| Money Market Funds - 4.2% | | | | | | | | |
MFS Institutional Money Market Portfolio, 0.09%,
at Cost and Net Asset Value (v) | | | 10,665,700 | | | $ | 10,665,700 | |
| Total Investments (Identified Cost, $225,783,997) | | | | | | $ | 256,783,022 | |
| | |
| Other Assets, Less Liabilities - (1.2)% | | | | | | | (2,921,547 | ) |
| Net Assets - 100.0% | | | | | | $ | 253,861,475 | |
| (a) | Non-income producing security. |
| (v) | Underlying affiliated fund that is available only to investment companies managed by MFS. The rate quoted for the MFS Institutional Money Market Portfolio is the annualized seven-day yield of the fund at period end. |
The following abbreviations are used in this report and are defined:
| ADR | | American Depositary Receipt |
| PLC | | Public Limited Company |
| REIT | | Real Estate Investment Trust |
See Notes to Financial Statements
9
Financial Statements
STATEMENT OF ASSETS AND LIABILITIES
At 8/31/13 (unaudited)
This statement represents your fund’s balance sheet, which details the assets and liabilities comprising the total value of the fund.
| | | | |
| Assets | | | | |
Investments- | | | | |
Non-affiliated issuers, at value (identified cost, $215,118,297) | | | $246,117,322 | |
Underlying affiliated funds, at cost and value | | | 10,665,700 | |
Total investments, at value (identified cost, $225,783,997) | | | $256,783,022 | |
Receivables for | | | | |
Investments sold | | | 760,101 | |
Fund shares sold | | | 223,989 | |
Dividends | | | 251,636 | |
Other assets | | | 51,232 | |
Total assets | | | $258,069,980 | |
| Liabilities | | | | |
Payables for | | | | |
Investments purchased | | | $3,806,856 | |
Fund shares reacquired | | | 220,025 | |
Payable to affiliates | | | | |
Investment adviser | | | 6,661 | |
Shareholder servicing costs | | | 144,486 | |
Distribution and service fees | | | 447 | |
Payable for independent Trustees’ compensation | | | 22 | |
Accrued expenses and other liabilities | | | 30,008 | |
Total liabilities | | | $4,208,505 | |
Net assets | | | $253,861,475 | |
| Net assets consist of | | | | |
Paid-in capital | | | $206,592,871 | |
Unrealized appreciation (depreciation) on investments and translation of assets and liabilities in foreign currencies | | | 30,998,989 | |
Accumulated net realized gain (loss) on investments and foreign currency | | | 15,976,627 | |
Undistributed net investment income | | | 292,988 | |
Net assets | | | $253,861,475 | |
Shares of beneficial interest outstanding | | | 20,322,915 | |
10
Statement of Assets and Liabilities (unaudited) – continued
| | | | | | | | | | | | |
| | | Net assets | | | Shares
outstanding | | | Net asset value
per share (a) | |
Class A | | | $11,912,842 | | | | 956,497 | | | | $12.45 | |
Class B | | | 620,284 | | | | 50,167 | | | | 12.36 | |
Class C | | | 1,619,040 | | | | 131,215 | | | | 12.34 | |
Class I | | | 4,450,478 | | | | 356,280 | | | | 12.49 | |
Class R1 | | | 233,604 | | | | 18,894 | | | | 12.36 | |
Class R2 | | | 423,749 | | | | 34,027 | | | | 12.45 | |
Class R3 | | | 365,092 | | | | 29,270 | | | | 12.47 | |
Class R4 | | | 135,156 | | | | 10,814 | | | | 12.50 | |
Class R5 | | | 234,101,230 | | | | 18,735,751 | | | | 12.49 | |
| (a) | Maximum offering price per share was equal to the net asset value per share for all share classes, except for Class A, for which the maximum offering price per share was $13.21 [100 / 94.25 x $12.45]. On sales of $50,000 or more, the maximum offering price of Class A shares is reduced. A contingent deferred sales charge may be imposed on redemptions of Class A, Class B, and Class C shares. Redemption price per share was equal to the net asset value per share for Classes I, R1, R2, R3, R4, and R5. |
See Notes to Financial Statements
11
Financial Statements
STATEMENT OF OPERATIONS
Six months ended 8/31/13 (unaudited)
This statement describes how much your fund earned in investment income and accrued in expenses. It also describes any gains and/or losses generated by fund operations.
| | | | |
| Net investment income | | | | |
Income | | | | |
Dividends | | | $1,894,329 | |
Dividends from underlying affiliated funds | | | 5,915 | |
Foreign taxes withheld | | | (11,610 | ) |
Total investment income | | | $1,888,634 | |
Expenses | | | | |
Management fee | | | $1,083,814 | |
Distribution and service fees | | | 19,733 | |
Shareholder servicing costs | | | 276,350 | |
Administrative services fee | | | 20,573 | |
Independent Trustees’ compensation | | | 2,372 | |
Custodian fee | | | 16,605 | |
Shareholder communications | | | 6,264 | |
Audit and tax fees | | | 25,453 | |
Legal fees | | | 1,082 | |
Miscellaneous | | | 65,347 | |
Total expenses | | | $1,517,593 | |
Fees paid indirectly | | | (7 | ) |
Reduction of expenses by investment adviser and distributor | | | (76,571 | ) |
Net expenses | | | $1,441,015 | |
Net investment income | | | $447,619 | |
| Realized and unrealized gain (loss) on investments and foreign currency | |
Realized gain (loss) (identified cost basis) | | | | |
Investments | | | $16,699,675 | |
Foreign currency | | | (4,936 | ) |
Net realized gain (loss) on investments and foreign currency | | | $16,694,739 | |
Change in unrealized appreciation (depreciation) | | | | |
Investments | | | $6,123,452 | |
Translation of assets and liabilities in foreign currencies | | | (36 | ) |
Net unrealized gain (loss) on investments and foreign currency translation | | | $6,123,416 | |
Net realized and unrealized gain (loss) on investments and foreign currency | | | $22,818,155 | |
Change in net assets from operations | | | $23,265,774 | |
See Notes to Financial Statements
12
Financial Statements
STATEMENTS OF CHANGES IN NET ASSETS
These statements describe the increases and/or decreases in net assets resulting from operations, any distributions, and any shareholder transactions.
| | | | | | | | |
| | | Six months ended
8/31/13 | | | Year ended
2/28/13 | |
| Change in net assets | | (unaudited) | | | | |
| From operations | | | | | | | | |
Net investment income | | | $447,619 | | | | $1,531,591 | |
Net realized gain (loss) on investments and foreign currency | | | 16,694,739 | | | | 10,585,807 | |
Net unrealized gain (loss) on investments and foreign currency translation | | | 6,123,416 | | | | 21,109,225 | |
Change in net assets from operations | | | $23,265,774 | | | | $33,226,623 | |
| Distributions declared to shareholders | | | | | | | | |
From net investment income | | | $(31,155 | ) | | | $(1,600,024 | ) |
From net realized gain on investments | | | (1,566,400 | ) | | | (10,275,610 | ) |
Total distributions declared to shareholders | | | $(1,597,555 | ) | | | $(11,875,634 | ) |
Change in net assets from fund share transactions | | | $18,996,815 | | | | $25,592,968 | |
Total change in net assets | | | $40,665,034 | | | | $46,943,957 | |
| Net assets | | | | | | | | |
At beginning of period | | | 213,196,441 | | | | 166,252,484 | |
At end of period (including undistributed net investment income of $292,988 and accumulated distributions in excess of net investment income of $123,476, respectively) | | | $253,861,475 | | | | $213,196,441 | |
See Notes to Financial Statements
13
Financial Statements
FINANCIAL HIGHLIGHTS
The financial highlights table is intended to help you understand the fund’s financial performance for the semiannual period and the past 5 fiscal years (or life of a particular share class, if shorter). Certain information reflects financial results for a single fund share. The total returns in the table represent the rate by which an investor would have earned (or lost) on an investment in the fund share class (assuming reinvestment of all distributions) held for the entire period.
| | | | | | | | | | | | |
| Class A | | Six months
ended
8/31/13 | | | Year ended
2/28/13 | | | Period ended
2/29/12 (c) | |
| | | (unaudited) | | | | | | | |
Net asset value, beginning of period | | | $11.37 | | | | $10.27 | | | | $10.00 | |
| Income (loss) from investment operations | | | | | | | | | |
Net investment income (d) | | | $0.00 | (w) | | | $0.06 | | | | $0.01 | |
Net realized and unrealized gain (loss)
on investments and foreign currency | | | 1.16 | | | | 1.69 | | | | 0.30 | |
Total from investment operations | | | $1.16 | | | | $1.75 | | | | $0.31 | |
| Less distributions declared to shareholders | | | | | | | | | |
From net investment income | | | $— | | | | $(0.07 | ) | | | $(0.03 | ) |
From net realized gain on investments | | | (0.08 | ) | | | (0.58 | ) | | | (0.01 | ) |
Total distributions declared to shareholders | | | $(0.08 | ) | | | $(0.65 | ) | | | $(0.04 | ) |
Net asset value, end of period (x) | | | $12.45 | | | | $11.37 | | | | $10.27 | |
Total return (%) (r)(s)(t)(x) | | | 10.21 | (n) | | | 18.04 | | | | 3.22 | (n) |
Ratios (%) (to average net assets)
and Supplemental data: | | | | | | | | | | | | |
Expenses before expense reductions (f) | | | 1.53 | (a) | | | 1.39 | | | | 1.25 | (a) |
Expenses after expense reductions (f) | | | 1.45 | (a) | | | 1.34 | | | | 1.25 | (a) |
Net investment income | | | 0.06 | (a)(l) | | | 0.53 | | | | 0.17 | (a) |
Portfolio turnover | | | 28 | (n) | | | 67 | | | | 56 | (n) |
Net assets at end of period (000 omitted) | | | $11,913 | | | | $4,596 | | | | $1,872 | |
See Notes to Financial Statements
14
Financial Highlights – continued
| | | | | | | | | | | | |
| Class B | | Six months
ended
8/31/13 | | | Year ended
2/28/13 | | | Period ended
2/29/12 (c) | |
| | | (unaudited) | | | | | | | |
Net asset value, beginning of period | | | $11.33 | | | | $10.24 | | | | $10.00 | |
| Income (loss) from investment operations | | | | | | | | | |
Net investment loss (d) | | | $(0.04 | ) | | | $(0.02 | ) | | | $(0.04 | ) |
Net realized and unrealized gain (loss)
on investments and foreign currency | | | 1.15 | | | | 1.69 | | | | 0.29 | |
Total from investment operations | | | $1.11 | | | | $1.67 | | | | $0.25 | |
| Less distributions declared to shareholders | | | | | | | | | |
From net realized gain on investments | | | $(0.08 | ) | | | $(0.58 | ) | | | $(0.01 | ) |
Net asset value, end of period (x) | | | $12.36 | | | | $11.33 | | | | $10.24 | |
Total return (%) (r)(s)(t)(x) | | | 9.81 | (n) | | | 17.24 | | | | 2.56 | (n) |
Ratios (%) (to average net assets)
and Supplemental data: | | | | | | | | | | | | |
Expenses before expense reductions (f) | | | 2.28 | (a) | | | 2.14 | | | | 2.01 | (a) |
Expenses after expense reductions (f) | | | 2.20 | (a) | | | 2.08 | | | | 2.01 | (a) |
Net investment loss | | | (0.65 | )(a)(l) | | | (0.17 | ) | | | (0.57 | )(a) |
Portfolio turnover | | | 28 | (n) | | | 67 | | | | 56 | (n) |
Net assets at end of period (000 omitted) | | | $620 | | | | $353 | | | | $200 | |
| | | |
| Class C | | Six months
ended
8/31/13 | | | Year ended 2/28/13 | | | Period ended 2/29/12 (c) | |
| | | (unaudited) | | | | | | | |
Net asset value, beginning of period | | | $11.31 | | | | $10.24 | | | | $10.00 | |
| Income (loss) from investment operations | | | | | | | | | |
Net investment loss (d) | | | $(0.04 | ) | | | $(0.02 | ) | | | $(0.04 | ) |
Net realized and unrealized gain (loss)
on investments and foreign currency | | | 1.15 | | | | 1.69 | | | | 0.29 | |
Total from investment operations | | | $1.11 | | | | $1.67 | | | | $0.25 | |
| Less distributions declared to shareholders | | | | | | | | | |
From net investment income | �� | | $— | | | | $(0.02 | ) | | | $(0.00 | )(w) |
From net realized gain on investments | | | (0.08 | ) | | | (0.58 | ) | | | (0.01 | ) |
Total distributions declared to shareholders | | | $(0.08 | ) | | | $(0.60 | ) | | | $(0.01 | ) |
Net asset value, end of period (x) | | | $12.34 | | | | $11.31 | | | | $10.24 | |
Total return (%) (r)(s)(t)(x) | | | 9.82 | (n) | | | 17.22 | | | | 2.62 | (n) |
Ratios (%) (to average net assets)
and Supplemental data: | | | | | | | | | | | | |
Expenses before expense reductions (f) | | | 2.28 | (a) | | | 2.15 | | | | 2.01 | (a) |
Expenses after expense reductions (f) | | | 2.20 | (a) | | | 2.09 | | | | 2.01 | (a) |
Net investment loss | | | (0.65 | )(a)(l) | | | (0.22 | ) | | | (0.53 | )(a) |
Portfolio turnover | | | 28 | (n) | | | 67 | | | | 56 | (n) |
Net assets at end of period (000 omitted) | | | $1,619 | | | | $691 | | | | $182 | |
See Notes to Financial Statements
15
Financial Highlights – continued
| | | | | | | | | | | | |
| Class I | | Six months
ended
8/31/13 | | | Year ended 2/28/13 | | | Period ended
2/29/12 (c) | |
| | | (unaudited) | | | | | | | |
Net asset value, beginning of period | | | $11.39 | | | | $10.28 | | | | $10.00 | |
| Income (loss) from investment operations | | | | | | | | | |
Net investment income (d) | | | $0.02 | | | | $0.11 | | | | $0.03 | |
Net realized and unrealized gain (loss)
on investments and foreign currency | | | 1.16 | | | | 1.67 | | | | 0.30 | |
Total from investment operations | | | $1.18 | | | | $1.78 | | | | $0.33 | |
| Less distributions declared to shareholders | | | | | | | | | |
From net investment income | | | $(0.00 | )(w) | | | $(0.09 | ) | | | $(0.04 | ) |
From net realized gain on investments | | | (0.08 | ) | | | (0.58 | ) | | | (0.01 | ) |
Total distributions declared to shareholders | | | $(0.08 | ) | | | $(0.67 | ) | | | $(0.05 | ) |
Net asset value, end of period (x) | | | $12.49 | | | | $11.39 | | | | $10.28 | |
Total return (%) (r)(s)(x) | | | 10.37 | (n) | | | 18.35 | | | | 3.39 | (n) |
Ratios (%) (to average net assets)
and Supplemental data: | | | | | | | | | | | | |
Expenses before expense reductions (f) | | | 1.28 | (a) | | | 1.02 | | | | 1.01 | (a) |
Expenses after expense reductions (f) | | | 1.20 | (a) | | | 1.02 | | | | 1.01 | (a) |
Net investment income | | | 0.33 | (a)(l) | | | 1.04 | | | | 0.47 | (a) |
Portfolio turnover | | | 28 | (n) | | | 67 | | | | 56 | (n) |
Net assets at end of period (000 omitted) | | | $4,450 | | | | $1,633 | | | | $163,585 | |
See Notes to Financial Statements
16
Financial Highlights – continued
| | | | | | | | | | | | |
| Class R1 | | Six months
ended
8/31/13 | | | Year ended 2/28/13 | | | Period ended 2/29/12 (c) | |
| | | (unaudited) | | | | | | | |
Net asset value, beginning of period | | | $11.34 | | | | $10.25 | | | | $10.00 | |
| Income (loss) from investment operations | | | | | | | | | |
Net investment loss (d) | | | $(0.04 | ) | | | $(0.01 | ) | | | $(0.04 | ) |
Net realized and unrealized gain (loss)
on investments and foreign currency | | | 1.14 | | | | 1.68 | | | | 0.30 | |
Total from investment operations | | | $1.10 | | | | $1.67 | | | | $0.26 | |
| Less distributions declared to shareholders | | | | | | | | | |
From net investment income | | | $— | | | | $(0.00 | )(w) | | | $— | |
From net realized gain on investments | | | (0.08 | ) | | | (0.58 | ) | | | (0.01 | ) |
Total distributions declared to shareholders | | | $(0.08 | ) | | | $(0.58 | ) | | | $(0.01 | ) |
Net asset value, end of period (x) | | | $12.36 | | | | $11.34 | | | | $10.25 | |
Total return (%) (r)(s)(x) | | | 9.71 | (n) | | | 17.25 | | | | 2.66 | (n) |
Ratios (%) (to average net assets)
and Supplemental data: | | | | | | | | | | | | |
Expenses before expense reductions (f) | | | 2.28 | (a) | | | 2.13 | | | | 2.01 | (a) |
Expenses after expense reductions (f) | | | 2.20 | (a) | | | 2.08 | | | | 2.01 | (a) |
Net investment loss | | | (0.67 | )(a)(l) | | | (0.14 | ) | | | (0.56 | )(a) |
Portfolio turnover | | | 28 | (n) | | | 67 | | | | 56 | (n) |
Net assets at end of period (000 omitted) | | | $234 | | | | $148 | | | | $103 | |
See Notes to Financial Statements
17
Financial Highlights – continued
| | | | | | | | | | | | |
| Class R2 | | Six months
ended
8/31/13 | | | Year ended 2/28/13 | | | Period ended 2/29/12 (c) | |
| | | (unaudited) | | | | | | | |
Net asset value, beginning of period | | | $11.39 | | | | $10.27 | | | | $10.00 | |
| Income (loss) from investment operations | | | | | | | | | |
Net investment income (loss) (d) | | | $(0.01 | ) | | | $0.04 | | | | $(0.00 | )(w) |
Net realized and unrealized gain (loss)
on investments and foreign currency | | | 1.15 | | | | 1.70 | | | | 0.29 | |
Total from investment operations | | | $1.14 | | | | $1.74 | | | | $0.29 | |
| Less distributions declared to shareholders | | | | | | | | | |
From net investment income | | | $— | | | | $(0.04 | ) | | | $(0.01 | ) |
From net realized gain on investments | | | (0.08 | ) | | | (0.58 | ) | | | (0.01 | ) |
Total distributions declared to shareholders | | | $(0.08 | ) | | | $(0.62 | ) | | | $(0.02 | ) |
Net asset value, end of period (x) | | | $12.45 | | | | $11.39 | | | | $10.27 | |
Total return (%) (r)(s)(x) | | | 10.02 | (n) | | | 17.92 | | | | 2.98 | (n) |
Ratios (%) (to average net assets)
and Supplemental data: | | | | | | | | | |
Expenses before expense reductions (f) | | | 1.78 | (a) | | | 1.63 | | | | 1.51 | (a) |
Expenses after expense reductions (f) | | | 1.70 | (a) | | | 1.58 | | | | 1.51 | (a) |
Net investment income (loss) | | | (0.20 | )(a)(l) | | | 0.34 | | | | (0.06 | )(a) |
Portfolio turnover | | | 28 | (n) | | | 67 | | | | 56 | (n) |
Net assets at end of period (000 omitted) | | | $424 | | | | $137 | | | | $105 | |
See Notes to Financial Statements
18
Financial Highlights – continued
| | | | | | | | | | | | |
| Class R3 | | Six months
ended
8/31/13 | | | Year ended 2/28/13 | | | Period ended 2/29/12 (c) | |
| | | (unaudited) | | | | | | | |
Net asset value, beginning of period | | | $11.39 | | | | $10.28 | | | | $10.00 | |
| Income (loss) from investment operations | | | | | | | | | |
Net investment income (d) | | | $0.01 | | | | $0.05 | | | | $0.01 | |
Net realized and unrealized gain (loss)
on investments and foreign currency | | | 1.15 | | | | 1.70 | | | | 0.30 | |
Total from investment operations | | | $1.16 | | | | $1.75 | | | | $0.31 | |
| Less distributions declared to shareholders | | | | | | | | | |
From net investment income | | | $— | | | | $(0.06 | ) | | | $(0.02 | ) |
From net realized gain on investments | | | (0.08 | ) | | | (0.58 | ) | | | (0.01 | ) |
Total distributions declared to shareholders | | | $(0.08 | ) | | | $(0.64 | ) | | | $(0.03 | ) |
Net asset value, end of period (x) | | | $12.47 | | | | $11.39 | | | | $10.28 | |
Total return (%) (r)(s)(x) | | | 10.20 | (n) | | | 18.08 | | | | 3.23 | (n) |
Ratios (%) (to average net assets)
and Supplemental data: | | | | | | | | | |
Expenses before expense reductions (f) | | | 1.53 | (a) | | | 1.40 | | | | 1.26 | (a) |
Expenses after expense reductions (f) | | | 1.45 | (a) | | | 1.34 | | | | 1.26 | (a) |
Net investment income | | | 0.10 | (a)(l) | | | 0.47 | | | | 0.19 | (a) |
Portfolio turnover | | | 28 | (n) | | | 67 | | | | 56 | (n) |
Net assets at end of period (000 omitted) | | | $365 | | | | $215 | | | | $103 | |
See Notes to Financial Statements
19
Financial Highlights – continued
| | | | | | | | | | | | |
| Class R4 | | Six months
ended
8/31/13 | | | Year ended 2/28/13 | | | Period ended 2/29/12 (c) | |
| | | (unaudited) | | | | | | | |
Net asset value, beginning of period | | | $11.40 | | | | $10.28 | | | | $10.00 | |
| Income (loss) from investment operations | | | | | | | | | |
Net investment income (d) | | | $0.02 | | | | $0.09 | | | | $0.03 | |
Net realized and unrealized gain (loss)
on investments and foreign currency | | | 1.16 | | | | 1.70 | | | | 0.30 | |
Total from investment operations | | | $1.18 | | | | $1.79 | | | | $0.33 | |
| Less distributions declared to shareholders | | | | | | | | | |
From net investment income | | | $— | | | | $(0.09 | ) | | | $(0.04 | ) |
From net realized gain on investments | | | (0.08 | ) | | | (0.58 | ) | | | (0.01 | ) |
Total distributions declared to shareholders | | | $(0.08 | ) | | | $(0.67 | ) | | | $(0.05 | ) |
Net asset value, end of period (x) | | | $12.50 | | | | $11.40 | | | | $10.28 | |
Total return (%) (r)(s)(x) | | | 10.36 | (n) | | | 18.46 | | | | 3.39 | (n) |
Ratios (%) (to average net assets)
and Supplemental data: | | | | | | | | | | | | |
Expenses before expense reductions (f) | | | 1.28 | (a) | | | 1.12 | | | | 1.01 | (a) |
Expenses after expense reductions (f) | | | 1.20 | (a) | | | 1.08 | | | | 1.01 | (a) |
Net investment income | | | 0.37 | (a)(l) | | | 0.85 | | | | 0.44 | (a) |
Portfolio turnover | | | 28 | (n) | | | 67 | | | | 56 | (n) |
Net assets at end of period (000 omitted) | | | $135 | | | | $122 | | | | $103 | |
See Notes to Financial Statements
20
Financial Highlights – continued
| | | | | | | | |
| Class R5 | | Six months
ended
8/31/13 | | | Period ended 2/28/13 (i) | |
| | | (unaudited) | | | | |
Net asset value, beginning of period | | | $11.40 | | | | $10.10 | |
| Income (loss) from investment operations | | | | | | | | |
Net investment income (d) | | | $0.02 | | | | $0.05 | |
Net realized and unrealized gain (loss)
on investments and foreign currency | | | 1.15 | | | | 1.71 | |
Total from investment operations | | | $1.17 | | | | $1.76 | |
| Less distributions declared to shareholders | | | | | | | | |
From net investment income | | | $(0.00 | )(w) | | | $(0.09 | ) |
From net realized gain on investments | | | (0.08 | ) | | | (0.37 | ) |
Total distributions declared to shareholders | | | $(0.08 | ) | | | $(0.46 | ) |
Net asset value, end of period (x) | | | $12.49 | | | | $11.40 | |
Total return (%) (r)(s)(x) | | | 10.29 | (n) | | | 18.05 | (n) |
Ratios (%) (to average net assets)
and Supplemental data: | | | | | | | | |
Expenses before expense reductions (f) | | | 1.24 | (a) | | | 1.12 | (a) |
Expenses after expense reductions (f) | | | 1.18 | (a) | | | 1.09 | (a) |
Net investment income | | | 0.39 | (a)(l) | | | 0.76 | (a) |
Portfolio turnover | | | 28 | (n) | | | 67 | |
Net assets at end of period (000 omitted) | | | $234,101 | | | | $205,301 | |
| (c) | For the period from the commencement of the fund’s investment operations, May 26, 2011, through the stated period end. |
| (d) | Per share data is based on average shares outstanding. |
| (f) | Ratios do not reflect reductions from fees paid indirectly, if applicable. |
| (i) | For the period from the class inception, July 2, 2012, through the stated period end. |
| (l) | Recognition of net investment income by the fund may be affected by the timing of the declaration of dividends by companies in which the fund invests and the actual annual net investment income ratio may differ. |
| (r) | Certain expenses have been reduced without which performance would have been lower. |
| (s) | From time to time the fund may receive proceeds from litigation settlements, without which performance would be lower. |
| (t) | Total returns do not include any applicable sales charges. |
| (w) | Per share amount was less than $0.01. |
| (x) | The net asset values per share and total returns have been calculated on net asset values which include adjustments made in accordance with U.S. generally accepted accounting principles required at period end for financial reporting purposes. |
See Notes to Financial Statements
21
NOTES TO FINANCIAL STATEMENTS
(unaudited)
(1) Business and Organization
MFS New Discovery Value Fund (the fund) is a series of MFS Series Trust XIII (the trust). The trust is organized as a Massachusetts business trust and is registered under the Investment Company Act of 1940, as amended, as an open-end management investment company.
(2) Significant Accounting Policies
General – The preparation of financial statements in conformity with U.S. generally accepted accounting principles requires management to make estimates and assumptions that affect the reported amounts of assets and liabilities, and disclosure of contingent assets and liabilities at the date of the financial statements and the reported amounts of revenues and expenses during the reporting period. Actual results could differ from those estimates. In the preparation of these financial statements, management has evaluated subsequent events occurring after the date of the fund’s Statement of Assets and Liabilities through the date that the financial statements were issued. The fund will generally focus on securities of small size companies which may be more volatile than those of larger companies.
In this reporting period, the fund adopted the disclosure provisions of the Financial Accounting Standards Board (FASB) Accounting Standards Update 2011-11 (“ASU 2011-11”), Balance Sheet (Topic 210) – Disclosures about Offsetting Assets and Liabilities along with the related scope clarification provisions of FASB Accounting Standards Update 2013-01 (“ASU 2013-01”) entitled Balance Sheet (Topic 210) – Clarifying the Scope of Disclosures about Offsetting Assets and Liabilities. ASU 2011-11 is intended to enhance disclosures on the offsetting of financial assets and liabilities by requiring entities to disclose both gross and net information about financial instruments and transactions that are either offset in the statement of financial position or subject to a Master Netting Agreement or similar arrangement. ASU 2013-01 limits the scope of ASU 2011-11’s disclosure requirements on offsetting to financial assets and financial liabilities related to derivatives, repurchase and reverse repurchase agreements, and securities lending and securities borrowing transactions. The disclosures required by ASU 2011-11, to the extent applicable to the fund, have been included in the fund’s Significant Accounting Policies note under the captions for each of the fund’s in-scope financial instruments and transactions.
In June 2013, FASB issued Accounting Standards Update 2013-08 Financial Services – Investment Companies (Topic 946) – Amendments to the Scope, Measurement, and Disclosure Requirements (“ASU 2013-08”) which is effective for interim and annual reporting periods in fiscal years that begin after December 15, 2013. ASU 2013-08 sets forth a methodology for determining whether an entity should be characterized as an investment company and prescribes fair value accounting for an investment company’s non-controlling ownership interest in another investment company. FASB has determined that a fund registered under the Investment Company Act of 1940 automatically meets ASU 2013-08’s criteria for an investment company. Although still evaluating the potential impacts of ASU 2013-08 to the fund, management expects that the impact of the fund’s adoption will be limited to additional financial statement disclosures.
22
Notes to Financial Statements (unaudited) – continued
Investment Valuations – Equity securities, including restricted equity securities, are generally valued at the last sale or official closing price as provided by a third-party pricing service on the market or exchange on which they are primarily traded. Equity securities, for which there were no sales reported that day, are generally valued at the last quoted daily bid quotation as provided by a third-party pricing service on the market or exchange on which such securities are primarily traded. Short-term instruments with a maturity at issuance of 60 days or less generally are valued at amortized cost, which approximates market value. Open-end investment companies are generally valued at net asset value per share. Securities and other assets generally valued on the basis of information from a third-party pricing service may also be valued at a broker/dealer bid quotation. Values obtained from third-party pricing services can utilize both transaction data and market information such as yield, quality, coupon rate, maturity, type of issue, trading characteristics, and other market data. The values of foreign securities and other assets and liabilities expressed in foreign currencies are converted to U.S. dollars using the mean of bid and asked prices for rates provided by a third-party pricing service.
The Board of Trustees has delegated primary responsibility for determining or causing to be determined the value of the fund’s investments (including any fair valuation) to the adviser pursuant to valuation policies and procedures approved by the Board. If the adviser determines that reliable market quotations are not readily available, investments are valued at fair value as determined in good faith by the adviser in accordance with such procedures under the oversight of the Board of Trustees. Under the fund’s valuation policies and procedures, market quotations are not considered to be readily available for most types of debt instruments and floating rate loans and many types of derivatives. These investments are generally valued at fair value based on information from third-party pricing services. In addition, investments may be valued at fair value if the adviser determines that an investment’s value has been materially affected by events occurring after the close of the exchange or market on which the investment is principally traded (such as foreign exchange or market) and prior to the determination of the fund’s net asset value, or after the halting of trading of a specific security where trading does not resume prior to the close of the exchange or market on which the security is principally traded. Events that occur on a frequent basis after foreign markets close (such as developments in foreign markets and significant movements in the U.S. markets) and prior to the determination of the fund’s net asset value may be deemed to have a material effect on the value of securities traded in foreign markets. Accordingly, the fund’s foreign equity securities may often be valued at fair value. The adviser generally relies on third-party pricing services or other information (such as the correlation with price movements of similar securities in the same or other markets; the type, cost and investment characteristics of the security; the business and financial condition of the issuer; and trading and other market data) to assist in determining whether to fair value and at what value to fair value an investment. The value of an investment for purposes of calculating the fund’s net asset value can differ depending on the source and method used to determine value. When fair valuation is used, the value of an investment used to determine the fund’s net asset value may differ from quoted or published prices for the same investment. There can be no assurance that
23
Notes to Financial Statements (unaudited) – continued
the fund could obtain the fair value assigned to an investment if it were to sell the investment at the same time at which the fund determines its net asset value per share.
Various inputs are used in determining the value of the fund’s assets or liabilities. These inputs are categorized into three broad levels. In certain cases, the inputs used to measure fair value may fall into different levels of the fair value hierarchy. In such cases, an investment’s level within the fair value hierarchy is based on the lowest level of input that is significant to the fair value measurement. The fund’s assessment of the significance of a particular input to the fair value measurement in its entirety requires judgment, and considers factors specific to the investment. Level 1 includes unadjusted quoted prices in active markets for identical assets or liabilities. Level 2 includes other significant observable market-based inputs (including quoted prices for similar securities, interest rates, prepayment speed, and credit risk). Level 3 includes unobservable inputs, which may include the adviser’s own assumptions in determining the fair value of investments. The following is a summary of the levels used as of August 31, 2013 in valuing the fund’s assets or liabilities:
| | | | | | | | | | | | | | | | |
| Investments at Value | | Level 1 | | | Level 2 | | | Level 3 | | | Total | |
| Equity Securities: | | | | | | | | | | | | | | | | |
United States | | | $226,800,332 | | | | $— | | | | $— | | | | $226,800,332 | |
Greece | | | 3,282,587 | | | | — | | | | — | | | | 3,282,587 | |
Israel | | | 3,116,342 | | | | — | | | | — | | | | 3,116,342 | |
Japan | | | — | | | | 3,086,705 | | | | — | | | | 3,086,705 | |
Canada | | | 2,982,575 | | | | — | | | | — | | | | 2,982,575 | |
Australia | | | — | | | | 2,704,184 | | | | — | | | | 2,704,184 | |
Germany | | | 2,088,540 | | | | — | | | | — | | | | 2,088,540 | |
Bermuda | | | 2,056,057 | | | | — | | | | — | | | | 2,056,057 | |
| Mutual Funds | | | 10,665,700 | | | | — | | | | — | | | | 10,665,700 | |
| Total Investments | | | $250,992,133 | | | | $5,790,889 | | | | $— | | | | $256,783,022 | |
For further information regarding security characteristics, see the Portfolio of Investments.
Of the level 2 investments presented above, equity investments amounting to $3,086,705 would have been considered level 1 investments at the beginning of the period. The primary reason for changes in the classifications between levels 1 and 2 occurs when foreign equity securities are fair valued using other observable market-based inputs in place of the closing exchange price due to events occurring after the close of the exchange or market on which the investment is principally traded. The fund’s foreign equity securities may often be valued at fair value. The fund’s policy is to recognize transfers between the levels as of the end of the period.
Foreign Currency Translation – Purchases and sales of foreign investments, income, and expenses are converted into U.S. dollars based upon currency exchange rates prevailing on the respective dates of such transactions or on the reporting date for foreign denominated receivables and payables. Gains and losses attributable to foreign currency exchange rates on sales of securities are recorded for financial statement purposes as net realized gains and losses on investments. Gains and losses attributable to foreign exchange rate movements on receivables, payables, income and expenses are recorded for financial statement purposes as foreign currency transaction gains and
24
Notes to Financial Statements (unaudited) – continued
losses. That portion of both realized and unrealized gains and losses on investments that results from fluctuations in foreign currency exchange rates is not separately disclosed.
Indemnifications – Under the fund’s organizational documents, its officers and Trustees may be indemnified against certain liabilities and expenses arising out of the performance of their duties to the fund. Additionally, in the normal course of business, the fund enters into agreements with service providers that may contain indemnification clauses. The fund’s maximum exposure under these agreements is unknown as this would involve future claims that may be made against the fund that have not yet occurred.
Investment Transactions and Income – Investment transactions are recorded on the trade date. Dividends received in cash are recorded on the ex-dividend date. Certain dividends from foreign securities will be recorded when the fund is informed of the dividend if such information is obtained subsequent to the ex-dividend date. Dividend payments received in additional securities are recorded on the ex-dividend date in an amount equal to the value of the security on such date.
The fund may receive proceeds from litigation settlements. Any proceeds received from litigation involving portfolio holdings are reflected in the Statement of Operations in realized gain/loss if the security has been disposed of by the fund or in unrealized gain/loss if the security is still held by the fund. Any other proceeds from litigation not related to portfolio holdings are reflected as other income in the Statement of Operations.
Fees Paid Indirectly – The fund’s custody fee may be reduced according to an arrangement that measures the value of cash deposited with the custodian by the fund. This amount, for the six months ended August 31, 2013, is shown as a reduction of total expenses in the Statement of Operations.
Tax Matters and Distributions – The fund intends to qualify as a regulated investment company, as defined under Subchapter M of the Internal Revenue Code, and to distribute all of its taxable income, including realized capital gains. As a result, no provision for federal income tax is required. The fund’s federal tax returns, when filed, will remain subject to examination by the Internal Revenue Service for a three year period. Foreign taxes have been accrued by the fund in the accompanying financial statements in accordance with the applicable foreign tax law. Foreign income taxes may be withheld by certain countries in which the fund invests.
Distributions to shareholders are recorded on the ex-dividend date. Income and capital gain distributions are determined in accordance with income tax regulations, which may differ from U.S. generally accepted accounting principles. Certain capital accounts in the financial statements are periodically adjusted for permanent differences in order to reflect their tax character. These adjustments have no impact on net assets or net asset value per share. Temporary differences which arise from recognizing certain items of income, expense, gain or loss in different periods for financial statement and tax purposes will reverse at some time in the future. Distributions in excess of net investment income or net realized gains are temporary overdistributions for financial statement purposes resulting from differences in the recognition or classification of income or distributions for financial statement and tax purposes.
25
Notes to Financial Statements (unaudited) – continued
Book/tax differences primarily relate to wash sale loss deferrals and treating a portion of the proceeds from redemptions as a distribution for tax purposes.
The tax character of distributions made during the current period will be determined at fiscal year end. The tax character of distributions declared to shareholders for the last fiscal year is as follows:
| | | | |
| | | 2/28/13 | |
Ordinary income (including any
short-term capital gains) | | | $11,875,634 | |
The federal tax cost and the tax basis components of distributable earnings were as follows:
| | | | |
| As of 8/31/13 | | | |
| Cost of investments | | | $226,517,474 | |
| Gross appreciation | | | 34,526,574 | |
| Gross depreciation | | | (4,261,026 | ) |
| Net unrealized appreciation (depreciation) | | | $30,265,548 | |
| |
| As of 2/28/13 | | | |
| Undistributed ordinary income | | | 1,594,533 | |
| Late year ordinary loss deferral | | | (154,261 | ) |
| Net unrealized appreciation (depreciation) | | | 24,160,113 | |
The aggregate cost above includes prior fiscal year end tax adjustments, if applicable.
Multiple Classes of Shares of Beneficial Interest – The fund offers multiple classes of shares, which differ in their respective distribution and service fees. The fund’s income, realized and unrealized gain (loss), and common expenses are allocated to shareholders based on the daily net assets of each class. Dividends are declared separately for each class. Differences in per share dividend rates are generally due to differences in separate class expenses. Class B shares will convert to Class A shares approximately eight years after purchase. The fund’s distributions declared to shareholders as reported in the Statements of Changes in Net Assets are presented by class as follows:
| | | | | | | | | | | | | | | | |
| | | From net investment
income | | | From net realized gain on
investments | |
| | | Six months
ended
8/31/13 | | | Year
ended
2/28/13 (i) | | | Six months
ended
8/31/13 | | | Year
ended
2/28/13 (i) | |
| Class A | | | $— | | | | $19,095 | | | | $40,425 | | | | $158,761 | |
| Class B | | | — | | | | — | | | | 2,806 | | | | 13,586 | |
| Class C | | | — | | | | 841 | | | | 7,050 | | | | 25,995 | |
| Class I | | | 68 | | | | 10,699 | | | | 19,826 | | | | 3,479,620 | |
| Class R1 | | | — | | | | 21 | | | | 1,414 | | | | 6,785 | |
| Class R2 | | | — | | | | 421 | | | | 1,706 | | | | 6,339 | |
| Class R3 | | | — | | | | 690 | | | | 2,212 | | | | 6,208 | |
| Class R4 | | | — | | | | 900 | | | | 850 | | | | 5,926 | |
| Class R5 | | | 31,087 | | | | 1,567,357 | | | | 1,490,111 | | | | 6,572,390 | |
| Total | | | $31,155 | | | | $1,600,024 | | | | $1,566,400 | | | | $10,275,610 | |
| (i) | For Class R5, the period is from inception, July 2, 2012, through the stated period end. |
26
Notes to Financial Statements (unaudited) – continued
(3) Transactions with Affiliates
Investment Adviser – The fund has an investment advisory agreement with MFS to provide overall investment management and related administrative services and facilities to the fund. The management fee is computed daily and paid monthly at the following annual rates:
| | | | |
| First $1 billion of average daily net assets | | | 0.90 | % |
| Next $1.5 billion of average daily net assets | | | 0.80 | % |
| Average daily net assets in excess of $2.5 billion | | | 0.75 | % |
Effective April 1, 2013, MFS has agreed in writing to reduce its management fee by a specified amount if certain MFS mutual fund assets exceed thresholds agreed to by MFS and the fund’s Board of Trustees. For the period April 1, 2013 through August 31, 2013, this management fee reduction amounted to $550, which is shown as a reduction of total expenses in the Statement of Operations. The management fee incurred for the six months ended August 31, 2013 was equivalent to an annual effective rate of 0.90% of the fund’s average daily net assets.
The investment adviser has agreed in writing to pay a portion of the fund’s total annual operating expenses, exclusive of interest, taxes, extraordinary expenses, brokerage and transaction costs, and investment-related expenses such that total fund operating expenses do not exceed the following rates annually of each class’s average daily net assets:
| | | | | | | | | | | | | | | | | | | | | | | | | | | | | | | | | | |
| Classes | |
| A | | | B | | | C | | | I | | | R1 | | | R2 | | | R3 | | | R4 | | | R5 | |
| | 1.45% | | | | 2.20% | | | | 2.20% | | | | 1.20% | | | | 2.20% | | | | 1.70% | | | | 1.45% | | | | 1.20% | | | | 1.16% | |
Effective July 1, 2013, Class R5 total annual operating expenses were reduced from 1.20% to 1.16% under the expense limitation agreement. This written agreement will continue until modified by the fund’s Board of Trustees, but such agreement will continue at least until June 30, 2015. For the six months ended August 31, 2013, this reduction amounted to $75,459 and is reflected as a reduction of total expenses in the Statement of Operations.
Distributor – MFS Fund Distributors, Inc. (MFD), a wholly-owned subsidiary of MFS, as distributor, received $8,555 for the six months ended August 31, 2013, as its portion of the initial sales charge on sales of Class A shares of the fund.
The Board of Trustees has adopted a distribution plan for certain class shares pursuant to Rule 12b-1 of the Investment Company Act of 1940.
The fund’s distribution plan provides that the fund will pay MFD for services provided by MFD and financial intermediaries in connection with the distribution and servicing of certain share classes. One component of the plan is a distribution fee paid to MFD and another component of the plan is a service fee paid to MFD. MFD may subsequently pay all, or a portion, of the distribution and/or service fees to financial intermediaries.
27
Notes to Financial Statements (unaudited) – continued
Distribution Plan Fee Table:
| | | | | | | | | | | | | | | | | | | | |
| | | Distribution
Fee Rate (d) | | | Service Fee Rate (d) | | | Total
Distribution
Plan (d) | | | Annual
Effective
Rate (e) | | | Distribution and Service
Fee | |
| Class A | | | — | | | | 0.25% | | | | 0.25% | | | | 0.25% | | | | $9,512 | |
| Class B | | | 0.75% | | | | 0.25% | | | | 1.00% | | | | 1.00% | | | | 2,399 | |
| Class C | | | 0.75% | | | | 0.25% | | | | 1.00% | | | | 1.00% | | | | 5,733 | |
| Class R1 | | | 0.75% | | | | 0.25% | | | | 1.00% | | | | 1.00% | | | | 1,045 | |
| Class R2 | | | 0.25% | | | | 0.25% | | | | 0.50% | | | | 0.50% | | | | 652 | |
| Class R3 | | | — | | | | 0.25% | | | | 0.25% | | | | 0.25% | | | | 392 | |
| Total Distribution and Service Fees | | | | $19,733 | |
| (d) | In accordance with the distribution plan for certain classes, the fund pays distribution and/or service fees equal to these annual percentage rates of each class’s average daily net assets. The distribution and service fee rates disclosed by class represent the current rates in effect at the end of the reporting period. |
| (e) | The annual effective rates represent actual fees incurred under the distribution plan for the six months ended August 31, 2013 based on each class’s average daily net assets. MFD has voluntarily agreed to rebate a portion of each class’s 0.25% service fee attributable to accounts for which MFD retains the 0.25% service fee except for accounts attributable to MFS or its subsidiaries’ seed money. For the six months ended August 31, 2013, this rebate amounted to $137 and $1 for Class A and Class C, respectively, and is reflected as a reduction of total expenses in the Statement of Operations. |
Certain Class A shares are subject to a contingent deferred sales charge (CDSC) in the event of a shareholder redemption within 18 months of purchase for shares purchased on or after August 1, 2012, and within 24 months of purchase for shares purchased prior to August 1, 2012. Class C shares are subject to a CDSC in the event of a shareholder redemption within 12 months of purchase. Class B shares are subject to a CDSC in the event of a shareholder redemption within six years of purchase. All contingent deferred sales charges are paid to MFD and during the six months ended August 31, 2013, were as follows:
| | | | |
| | | Amount | |
| Class A | | | $— | |
| Class B | | | — | |
| Class C | | | 40 | |
Shareholder Servicing Agent – MFS Service Center, Inc. (MFSC), a wholly-owned subsidiary of MFS, receives a fee from the fund for its services as shareholder servicing agent calculated as a percentage of the average daily net assets of the fund as determined periodically under the supervision of the fund’s Board of Trustees. For the six months ended August 31, 2013, the fee was $2,320, which equated to 0.0019% annually of the fund’s average daily net assets. MFSC also receives payment from the fund for out-of-pocket expenses, sub-accounting and other shareholder servicing costs which may be paid to affiliated and unaffiliated service providers. Class R5 shares do not incur sub-accounting fees. For the six months ended August 31, 2013, these out-of-pocket expenses, sub-accounting and other shareholder servicing costs amounted to $4,312.
28
Notes to Financial Statements (unaudited) – continued
Under a Special Servicing Agreement among MFS, each MFS fund which invests in other MFS funds (“MFS fund-of-funds”) and certain underlying funds in which a MFS fund-of-funds invests (“underlying funds”), each underlying fund may pay a portion of each MFS fund-of-fund’s transfer agent-related expenses, including sub-accounting fees payable to financial intermediaries, to the extent such payments do not exceed the benefits realized or expected to be realized by the underlying fund from the investment in the underlying fund by the MFS fund-of-fund. For the six months ended August 31, 2013, these costs for the fund amounted to $269,718 and are reflected in the “Shareholder servicing costs” in the Statement of Operations.
Administrator – MFS provides certain financial, legal, shareholder communications, compliance, and other administrative services to the fund. Under an administrative services agreement, the fund partially reimburses MFS the costs incurred to provide these services. The fund is charged an annual fixed amount of $17,500 plus a fee based on average daily net assets. The administrative services fee incurred for the six months ended August 31, 2013 was equivalent to an annual effective rate of 0.0171% of the fund’s average daily net assets.
Trustees’ and Officers’ Compensation – The fund pays compensation to independent Trustees in the form of a retainer, attendance fees, and additional compensation to Board and Committee chairpersons. The fund does not pay compensation directly to Trustees or officers of the fund who are also officers of the investment adviser, all of whom receive remuneration for their services to the fund from MFS. Certain officers and Trustees of the fund are officers or directors of MFS, MFD, and MFSC.
Other – This fund and certain other funds managed by MFS (the funds) have entered into services agreements (the Agreements) which provide for payment of fees by the funds to Tarantino LLC and Griffin Compliance LLC in return for the provision of services of an Independent Chief Compliance Officer (ICCO) and Assistant ICCO, respectively, for the funds. The ICCO and Assistant ICCO are officers of the funds and the sole members of Tarantino LLC and Griffin Compliance LLC, respectively. The funds can terminate the Agreements with Tarantino LLC and Griffin Compliance LLC at any time under the terms of the Agreements. For the six months ended August 31, 2013, the aggregate fees paid by the fund to Tarantino LLC and Griffin Compliance LLC were $832 and are included in “Miscellaneous” expense in the Statement of Operations. MFS has agreed to reimburse the fund for a portion of the payments made by the fund in the amount of $424, which is shown as a reduction of total expenses in the Statement of Operations. Additionally, MFS has agreed to bear all expenses associated with office space, other administrative support, and supplies provided to the ICCO and Assistant ICCO.
The fund invests in the MFS Institutional Money Market Portfolio which is managed by MFS and seeks current income consistent with preservation of capital and liquidity. Income earned on this investment is included in “Dividends from underlying affiliated funds” in the Statement of Operations. This money market fund does not pay a management fee to MFS.
On June 29, 2012, MFS purchased 9,901 shares of Class R5 for an aggregate amount of $100,000. On April 2, 2012, MFS redeemed 10,048 shares of Class A and 30,171 shares
29
Notes to Financial Statements (unaudited) – continued
of Class I for an aggregate amount of $431,852. At August 31, 2013, MFS held 57% and 100% of the outstanding shares of Class R1 and Class R4, respectively.
(4) Portfolio Securities
Purchases and sales of investments, other than short-term obligations, aggregated $87,461,561 and $63,833,272, respectively.
(5) Shares of Beneficial Interest
The fund’s Declaration of Trust permits the Trustees to issue an unlimited number of full and fractional shares of beneficial interest. Transactions in fund shares were as follows:
| | | | | | | | | | | | | | | | |
| | | Six months ended
8/31/13 | | | Year ended
2/28/13 (i) | |
| | | Shares | | | Amount | | | Shares | | | Amount | |
| Shares sold | | | | | | | | | | | | | | | | |
Class A | | | 631,042 | | | | $7,747,614 | | | | 470,145 | | | | $4,935,450 | |
Class B | | | 22,450 | | | | 271,153 | | | | 17,843 | | | | 185,668 | |
Class C | | | 87,296 | | | | 1,046,215 | | | | 46,852 | | | | 480,959 | |
Class I | | | 229,582 | | | | 2,765,789 | | | | 1,028,623 | | | | 10,375,139 | |
Class R1 | | | 6,025 | | | | 70,069 | | | | 2,367 | | | | 24,532 | |
Class R2 | | | 23,980 | | | | 299,655 | | | | 1,180 | | | | 12,039 | |
Class R3 | | | 10,662 | | | | 127,316 | | | | 11,239 | | | | 119,762 | |
Class R5 | | | 1,324,795 | | | | 15,543,630 | | | | 18,470,131 | | | | 187,876,080 | |
| | | 2,335,832 | | | | $27,871,441 | | | | 20,048,380 | | | | $204,009,629 | |
| | | | |
| Shares issued to shareholders in reinvestment of distributions | | | | | | | | | | | | | | | | |
Class A | | | 3,316 | | | | $40,155 | | | | 17,288 | | | | $171,856 | |
Class B | | | 219 | | | | 2,635 | | | | 1,241 | | | | 12,281 | |
Class C | | | 587 | | | | 7,050 | | | | 2,706 | | | | 26,836 | |
Class I | | | 1,585 | | | | 19,250 | | | | 360,340 | | | | 3,490,278 | |
Class R1 | | | 117 | | | | 1,414 | | | | 687 | | | | 6,806 | |
Class R2 | | | 141 | | | | 1,706 | | | | 681 | | | | 6,760 | |
Class R3 | | | 182 | | | | 2,212 | | | | 694 | | | | 6,898 | |
Class R4 | | | 70 | | | | 850 | | | | 686 | | | | 6,815 | |
Class R5 | | | 125,304 | | | | 1,521,198 | | | | 808,316 | | | | 8,139,747 | |
| | | 131,521 | | | | $1,596,470 | | | | 1,192,639 | | | | $11,868,277 | |
| | | | |
| Shares reacquired | | | | | | | | | | | | | | | | |
Class A | | | (81,931 | ) | | | $(992,549 | ) | | | (265,719 | ) | | | $(2,671,266 | ) |
Class B | | | (3,604 | ) | | | (43,647 | ) | | | (7,507 | ) | | | (73,632 | ) |
Class C | | | (17,779 | ) | | | (209,357 | ) | | | (6,219 | ) | | | (65,424 | ) |
Class I | | | (18,186 | ) | | | (215,718 | ) | | | (17,162,199 | ) | | | (173,917,452 | ) |
Class R1 | | | (318 | ) | | | (3,890 | ) | | | — | | | | — | |
Class R2 | | | (2,137 | ) | | | (27,007 | ) | | | — | | | | — | |
Class R3 | | | (456 | ) | | | (5,543 | ) | | | (3,093 | ) | | | (30,760 | ) |
Class R5 | | | (729,688 | ) | | | (8,973,385 | ) | | | (1,263,107 | ) | | | (13,526,404 | ) |
| | | (854,099 | ) | | | $(10,471,096 | ) | | | (18,707,844 | ) | | | $(190,284,938 | ) |
30
Notes to Financial Statements (unaudited) – continued
| | | | | | | | | | | | | | | | |
| | | Six months ended
8/31/13 | | | Year ended
2/28/13 (i) | |
| | | Shares | | | Amount | | | Shares | | | Amount | |
| Net change | | | | | | | | | | | | | | | | |
Class A | | | 552,427 | | | | $6,795,220 | | | | 221,714 | | | | $2,436,040 | |
Class B | | | 19,065 | | | | 230,141 | | | | 11,577 | | | | 124,317 | |
Class C | | | 70,104 | | | | 843,908 | | | | 43,339 | | | | 442,371 | |
Class I | | | 212,981 | | | | 2,569,321 | | | | (15,773,236 | ) | | | (160,052,035 | ) |
Class R1 | | | 5,824 | | | | 67,593 | | | | 3,054 | | | | 31,338 | |
Class R2 | | | 21,984 | | | | 274,354 | | | | 1,861 | | | | 18,799 | |
Class R3 | | | 10,388 | | | | 123,985 | | | | 8,840 | | | | 95,900 | |
Class R4 | | | 70 | | | | 850 | | | | 686 | | | | 6,815 | |
Class R5 | | | 720,411 | | | | 8,091,443 | | | | 18,015,340 | | | | 182,489,423 | |
| | | 1,613,254 | | | | $18,996,815 | | | | 2,533,175 | | | | $25,592,968 | |
| (i) | For Class R5, the period is from inception, July 2, 2012, through the stated period end. |
The fund is one of several mutual funds in which the MFS funds-of-funds may invest. The MFS funds-of-funds do not invest in the underlying MFS funds for the purpose of exercising management or control. At the end of the period, the MFS Growth Allocation Fund, MFS Moderate Allocation Fund, MFS Aggressive Growth Allocation Fund, MFS Conservative Allocation Fund, MFS Lifetime 2030 Fund, MFS Lifetime 2040 Fund, MFS Lifetime 2020 Fund, and MFS Lifetime Retirement Income Fund were the owners of record of approximately 31%, 29%, 13%, 10%, 2%, 2%, 1%, and 1%, respectively, of the value of outstanding voting shares of the fund. In addition, the MFS Lifetime 2010 Fund, MFS Lifetime 2015 Fund, MFS Lifetime 2025 Fund, MFS Lifetime 2035 Fund, MFS Lifetime 2045 Fund, MFS Lifetime 2050 Fund, and MFS Lifetime 2055 Fund were each the owners of record of less than 1% of the value of outstanding voting shares of the fund.
(6) Line of Credit
The fund and certain other funds managed by MFS participate in a $1.1 billion unsecured committed line of credit, subject to a $1 billion sublimit, provided by a syndication of banks under a credit agreement. Borrowings may be made for temporary financing needs. Interest is charged to each fund, based on its borrowings, generally at a rate equal to the higher of the Federal Reserve funds rate or one month LIBOR plus an agreed upon spread. A commitment fee, based on the average daily, unused portion of the committed line of credit, is allocated among the participating funds at the end of each calendar quarter. In addition, the fund and other funds managed by MFS have established unsecured uncommitted borrowing arrangements with certain banks for temporary financing needs. Interest is charged to each fund, based on its borrowings, at a rate equal to the Federal Reserve funds rate plus an agreed upon spread. For the six months ended August 31, 2013, the fund’s commitment fee and interest expense were $505 and $0, respectively, and are included in “Miscellaneous” expense in the Statement of Operations.
31
Notes to Financial Statements (unaudited) – continued
(7) Transactions in Underlying Affiliated Funds-Affiliated Issuers
An affiliated issuer may be considered one in which the fund owns 5% or more of the outstanding voting securities, or a company which is under common control. For the purposes of this report, the fund assumes the following to be an affiliated issuer:
| | | | | | | | | | | | | | | | |
| Underlying Affiliated Fund | | Beginning
Shares/Par
Amount | | | Acquisitions
Shares/Par
Amount | | | Dispositions
Shares/Par
Amount | | | Ending
Shares/Par
Amount | |
MFS Institutional Money
Market Portfolio | | | 9,711,634 | | | | 33,817,394 | | | | (32,863,328 | ) | | | 10,665,700 | |
| | | | |
| Underlying Affiliated Fund | | Realized
Gain (Loss) | | | Capital Gain
Distributions | | | Dividend
Income | | | Ending
Value | |
MFS Institutional Money
Market Portfolio | | | $— | | | | $— | | | | $5,915 | | | | $10,665,700 | |
32
BOARD REVIEW OF INVESTMENT ADVISORY AGREEMENT
The Investment Company Act of 1940 requires that both the full Board of Trustees and a majority of the non-interested (“independent”) Trustees, voting separately, annually approve the continuation of the Fund’s investment advisory agreement with MFS. The Trustees consider matters bearing on the Fund and its advisory arrangements at their meetings throughout the year, including a review of performance data at each regular meeting. In addition, the independent Trustees met several times over the course of three months beginning in May and ending in July, 2013 (“contract review meetings”) for the specific purpose of considering whether to approve the continuation of the investment advisory agreement for the Fund and the other investment companies that the Board oversees (the “MFS Funds”). The independent Trustees were assisted in their evaluation of the Fund’s investment advisory agreement by independent legal counsel, from whom they received separate legal advice and with whom they met separately from MFS during various contract review meetings. The independent Trustees were also assisted in this process by the MFS Funds’ Independent Chief Compliance Officer, a full-time senior officer appointed by and reporting to the independent Trustees.
In connection with their deliberations regarding the continuation of the investment advisory agreement, the Trustees, including the independent Trustees, considered such information and factors as they believed, in light of the legal advice furnished to them and their own business judgment, to be relevant. The investment advisory agreement for the Fund was considered separately, although the Trustees also took into account the common interests of all MFS Funds in their review. As described below, the Trustees considered the nature, quality, and extent of the various investment advisory, administrative, and shareholder services performed by MFS under the existing investment advisory agreement and other arrangements with the Fund.
In connection with their contract review meetings, the Trustees received and relied upon materials that included, among other items: (i) information provided by Lipper Inc., an independent third party, on the investment performance of the Fund for the one-year period ended December 31, 2012 and the investment performance of a group of funds with substantially similar investment classifications/objectives (the “Lipper performance universe”), (ii) information provided by Lipper Inc. on the Fund’s advisory fees and other expenses and the advisory fees and other expenses of comparable funds identified by Lipper Inc. (the “Lipper expense group”), (iii) information provided by MFS on the advisory fees of comparable portfolios of other clients of MFS, including institutional separate accounts and other clients, (iv) information as to whether and to what extent applicable expense waivers, reimbursements or fee “breakpoints” are observed for the Fund, (v) information regarding MFS’ financial results and financial condition, including MFS’ and certain of its affiliates’ estimated profitability from services performed for the Fund and the MFS Funds as a whole, and compared to MFS’ institutional business, (vi) MFS’ views regarding the outlook for the mutual fund industry and the strategic business plans of MFS, (vii) descriptions of various functions performed by MFS for the Funds, such as compliance monitoring and portfolio trading practices, and (viii) information regarding the overall organization of MFS, including information about MFS’ senior management and other personnel providing investment advisory, administrative and other services to
33
Board Review of Investment Advisory Agreement – continued
the Fund and the other MFS Funds. The comparative performance, fee and expense information prepared and provided by Lipper Inc. was not independently verified and the independent Trustees did not independently verify any information provided to them by MFS.
The Trustees’ conclusion as to the continuation of the investment advisory agreement was based on a comprehensive consideration of all information provided to the Trustees and not the result of any single factor. Some of the factors that figured particularly in the Trustees’ deliberations are described below, although individual Trustees may have evaluated the information presented differently from one another, giving different weights to various factors. It is also important to recognize that the fee arrangements for the Fund and other MFS Funds are the result of years of review and discussion between the independent Trustees and MFS, that certain aspects of such arrangements may receive greater scrutiny in some years than in others, and that the Trustees’ conclusions may be based, in part, on their consideration of these same arrangements during the course of the year and in prior years.
Based on information provided by Lipper Inc. and MFS, the Trustees reviewed the Fund’s total return investment performance as well as the performance of peer groups of funds for the one-year period ended December 31, 2012. The total return performance of the Fund’s Class A shares was in the 1st quintile relative to the other funds in the universe for this one-year period (the 1st quintile being the best performers and the 5th quintile being the worst performers). The Fund commenced operations on May 26, 2011 and has a limited operating history and performance record; therefore no performance data for the three- or five-year periods was available. Because of the passage of time, these performance results may differ from the performance results for more recent periods, including those shown elsewhere in this report.
In the course of their deliberations, the Trustees took into account information provided by MFS in connection with the contract review meetings, as well as during investment review meetings conducted with portfolio management personnel during the course of the year regarding the Fund’s performance. After reviewing these and related factors, the Trustees concluded, within the context of their overall conclusions regarding the investment advisory agreement, that they were satisfied with MFS’ responses and efforts relating to investment performance.
In assessing the reasonableness of the Fund’s advisory fee, the Trustees considered, among other information, the Fund’s advisory fee and the total expense ratio of the Fund’s Class A shares as a percentage of average daily net assets and the advisory fee and total expense ratios of peer groups of funds based on information provided by Lipper Inc. The Trustees considered that MFS currently observes an expense limitation for the Fund, which may not be changed without the Trustees’ approval. The Trustees also considered that, according to the Lipper data (which takes into account any fee reductions or expense limitations that were in effect during the Fund’s last fiscal year), the Fund’s effective advisory fee rate was higher than the Lipper expense group median, and the Fund’s total expense ratio was lower than the Lipper expense group median.
The Trustees also considered the advisory fees charged by MFS to any comparable institutional accounts. In comparing these fees, the Trustees considered information
34
Board Review of Investment Advisory Agreement – continued
provided by MFS as to the generally broader scope of services provided by MFS to the Fund in comparison to institutional accounts, the higher demands placed on MFS’ investment personnel and trading infrastructure as a result of the daily cash in-flows and out-flows of the Fund, and the impact on MFS and expenses associated with the more extensive regulatory regime to which the Fund is subject in comparison to institutional accounts.
The Trustees also considered whether the Fund may benefit from any economies of scale in the management of the Fund in the event of growth in assets of the Fund and/or growth in assets of the MFS Funds as a whole. They noted that the Fund’s advisory fee rate schedule is subject to contractual breakpoints that reduce the Fund’s advisory fee rate on average daily net assets over $1 billion and $2.5 billion. The Trustees also noted that MFS has agreed in writing to waive a portion of the management fees of certain MFS Funds, including the Fund, if the total combined assets of certain funds within the MFS Funds’ complex increase above agreed upon thresholds (the “group fee waiver”), enabling the Fund’s shareholders to share in the benefits from any economies of scale at the complex level. The group fee waiver is reviewed and renewed annually between the Board and MFS. The Trustees concluded that the existing breakpoints and the group fee waiver were sufficient to allow the Fund to benefit from economies of scale as its assets and overall complex assets grow.
The Trustees also considered information prepared by MFS relating to MFS’ costs and profits with respect to the Fund, the MFS Funds considered as a group, and other investment companies and accounts advised by MFS, as well as MFS’ methodologies used to determine and allocate its costs to the MFS Funds, the Fund and other accounts and products for purposes of estimating profitability.
After reviewing these and other factors described herein, the Trustees concluded, within the context of their overall conclusions regarding the investment advisory agreement, that the advisory fees charged to the Fund represent reasonable compensation in light of the services being provided by MFS to the Fund.
In addition, the Trustees considered MFS’ resources and related efforts to continue to retain, attract and motivate capable personnel to serve the Fund. The Trustees also considered current and developing conditions in the financial services industry, including the presence of large and well-capitalized companies which are spending, and appear to be prepared to continue to spend, substantial sums to engage personnel and to provide services to competing investment companies. In this regard, the Trustees also considered the financial resources of MFS and its ultimate parent, Sun Life Financial Inc. The Trustees also considered the advantages and possible disadvantages to the Fund of having an adviser that also serves other investment companies as well as other accounts.
The Trustees also considered the nature, quality, cost, and extent of administrative, transfer agency, and distribution services provided to the Fund by MFS and its affiliates under agreements and plans other than the investment advisory agreement, including any 12b-1 fees the Fund pays to MFS Fund Distributors, Inc., an affiliate of MFS. The Trustees also considered the nature, extent and quality of certain other services MFS performs or arranges for on the Fund’s behalf, which may include securities lending programs, directed expense payment programs, class action recovery programs, and
35
Board Review of Investment Advisory Agreement – continued
MFS’ interaction with third-party service providers, principally custodians and sub-custodians. The Trustees concluded that the various non-advisory services provided by MFS and its affiliates on behalf of the Fund were satisfactory.
The Trustees also considered benefits to MFS from the use of the Fund’s portfolio brokerage commissions, if applicable, to pay for investment research and various other factors. Additionally, the Trustees considered so-called “fall-out benefits” to MFS such as reputational value derived from serving as investment manager to the Fund.
Based on their evaluation of factors that they deemed to be material, including those factors described above, the Board of Trustees, including the independent Trustees, concluded that the Fund’s investment advisory agreement with MFS should be continued for an additional one-year period, commencing August 1, 2013.
A discussion regarding the Board’s most recent review and renewal of the fund’s Investment Advisory Agreement with MFS is available by clicking on the fund’s name under “Mutual Funds” in the “Products” section of the MFS Web site (mfs.com).
36
PROXY VOTING POLICIES AND INFORMATION
A general description of the MFS funds’ proxy voting policies and procedures is available without charge, upon request, by calling 1-800-225-2606, by visiting the Proxy Voting section of mfs.com or by visiting the SEC’s Web site at http://www.sec.gov.
Information regarding how the fund voted proxies relating to portfolio securities during the most recent twelve-month period ended June 30 is available without charge by visiting the Proxy Voting section of mfs.com or by visiting the SEC’s Web site at http://www.sec.gov.
QUARTERLY PORTFOLIO DISCLOSURE
The fund will file a complete schedule of portfolio holdings with the Securities and Exchange Commission (the Commission) for the first and third quarters of each fiscal year on Form N-Q. A shareholder can obtain the quarterly portfolio holdings report at mfs.com. The fund’s Form N-Q is also available on the EDGAR database on the Commission’s Internet Web site at http://www.sec.gov, and may be reviewed and copied at the:
Public Reference Room
Securities and Exchange Commission
100 F Street, NE, Room 1580
Washington, D.C. 20549
Information on the operation of the Public Reference Room may be obtained by calling the Commission at 1-800-SEC-0330. Copies of the fund’s Form N-Q also may be obtained, upon payment of a duplicating fee, by electronic request at the following e-mail address: publicinfo@sec.gov, or by writing the Public Reference Section at the above address.
FURTHER INFORMATION
From time to time, MFS may post important information about the fund or the MFS funds on the MFS web site (mfs.com). This information is available by visiting the “News & Commentary” section of mfs.com or by clicking on the fund’s name under “Mutual Funds” in the “Products” section of mfs.com.
PROVISION OF FINANCIAL REPORTS AND SUMMARY PROSPECTUSES
The fund produces financial reports every six months and updates its summary prospectus and prospectus annually. To avoid sending duplicate copies of materials to households, only one copy of the fund’s annual and semiannual report and summary prospectus may be mailed to shareholders having the same last name and residential address on the fund’s records. However, any shareholder may contact MFSC (please see back cover for address and telephone number) to request that copies of these reports and summary prospectuses be sent personally to that shareholder.
37
Save paper with eDelivery.

| MFS® will send you prospectuses, |
reports, and proxies directly via e-mail so you will get information faster with less mailbox clutter.
To sign up:
1. Go to mfs.com.
2. Log in via MFS® Access.
3. Select eDelivery.
If you own your MFS fund shares through a financial institution or a retirement plan, MFS® TALK, MFS® Access, or eDelivery may not be available to you.
CONTACT
WEB SITE
mfs.com
MFS TALK
1-800-637-8255
24 hours a day
ACCOUNT SERVICE AND LITERATURE
Shareholders
1-800-225-2606
Financial advisors
1-800-343-2829
Retirement plan services
1-800-637-1255
MAILING ADDRESS
MFS Service Center, Inc.
P.O. Box 55824
Boston, MA 02205-5824
OVERNIGHT MAIL
MFS Service Center, Inc.
c/o Boston Financial Data Services
30 Dan Road
Canton, MA 02021-2809
During the period covered by this report, the Registrant has not amended any provision in its Code of Ethics (the “Code”) that relates to an element of the Code’s definitions enumerated in paragraph (b) of Item 2 of this Form N-CSR. During the period covered by this report, the Registrant did not grant a waiver, including an implicit waiver, from any provision of the Code.
| ITEM 3. | AUDIT COMMITTEE FINANCIAL EXPERT. |
Not applicable for semi-annual reports.
| ITEM 4. | PRINCIPAL ACCOUNTANT FEES AND SERVICES. |
Not applicable for semi-annual reports.
| ITEM 5. | AUDIT COMMITTEE OF LISTED REGISTRANTS. |
Not applicable to the Registrant.
A schedule of investments for each series of the Registrant is included as part of the report to shareholders of such series under Item 1 of this Form N-CSR.
| ITEM 7. | DISCLOSURE OF PROXY VOTING POLICIES AND PROCEDURES FOR CLOSED-END MANAGEMENT INVESTMENT COMPANIES. |
Not applicable to the Registrant.
| ITEM 8. | PORTFOLIO MANAGERS OF CLOSED-END MANAGEMENT INVESTMENT COMPANIES. |
Not applicable to the Registrant.
| ITEM 9. | PURCHASES OF EQUITY SECURITIES BY CLOSED-END MANAGEMENT INVESTMENT COMPANY AND AFFILIATED PURCHASERS. |
Not applicable to the Registrant.
| ITEM 10. | SUBMISSION OF MATTERS TO A VOTE OF SECURITY HOLDERS. |
There were no material changes to the procedures by which shareholders may send recommendations to the Board for nominees to the Registrant’s Board since the Registrant last provided disclosure as to such procedures in response to the requirements of Item 407 (c)(2)(iv) of Regulation S-K or this Item.
| ITEM 11. | CONTROLS AND PROCEDURES. |
| (a) | Based upon their evaluation of the effectiveness of the registrant’s disclosure controls and procedures (as defined in Rule 30a-3(c) under the Investment Company Act of 1940 (the “Act”)) as conducted within 90 days of the filing date of this report on Form N-CSR, the registrant’s principal financial officer and principal executive officer have concluded that those disclosure controls and procedures provide reasonable assurance that the material information required to be disclosed by the registrant on this report is recorded, processed, summarized and reported within the time periods specified in the Securities and Exchange Commission’s rules and forms. |
| (b) | There were no changes in the registrant’s internal controls over financial reporting (as defined in Rule 30a-3(d) under the Act) that occurred during the second fiscal quarter of the period covered by the report that have materially affected, or are reasonably likely to materially affect, the registrant’s internal control over financial reporting. |
| (a) | File the exhibits listed below as part of this form. Letter or number the exhibits in the sequence indicated. |
| | (1) | Any code of ethics, or amendment thereto, that is the subject of the disclosure required by Item 2, to the extent that the registrant intends to satisfy the Item 2 requirements through filing of an exhibit. |
| | (2) | A separate certification for each principal executive officer and principal financial officer of the registrant as required by Rule 30a-2 under the Act (17 CFR 270.30a-2): Attached hereto. |
| (b) | If the report is filed under Section 13(a) or 15(d) of the Exchange Act, provide the certifications required by Rule 30a-2(b) under the Act (17 CFR 270.30a-2(b)), Rule 13a-14(b) or Rule 15d-14(b) under the Exchange Act (17 CFR 240.13a-14(b) or 240.15d-14(b)) and Section 1350 of Chapter 63 of Title 18 of the United States Code (18 U.S.C. 1350) as an exhibit. A certification furnished pursuant to this paragraph will not be deemed “filed” for the purposes of Section 18 of the Exchange Act (15 U.S.C. 78r), or otherwise subject to the liability of that section. Such certification will not be deemed to be incorporated by reference into any filing under the Securities Act of 1933 or the Exchange Act, except to the extent that the registrant specifically incorporates it by reference: Attached hereto. |
Notice
A copy of the Amended and Restated Declaration of Trust, as amended, of the Registrant is on file with the Secretary of State of The Commonwealth of Massachusetts and notice is hereby given that this instrument is executed on behalf of the Registrant by an officer of the Registrant as an officer and not individually and the obligations of or arising out of this instrument are not binding upon any of the Trustees or shareholders individually, but are binding only upon the assets and property of the respective constituent series of the Registrant.
SIGNATURES
Pursuant to the requirements of the Securities Exchange Act of 1934 and the Investment Company Act of 1940, the registrant has duly caused this report to be signed on its behalf by the undersigned, thereunto duly authorized.
(Registrant) MFS SERIES TRUST XIII
| | |
| By (Signature and Title)* | | JOHN M. CORCORAN |
| | John M. Corcoran, President |
Date: October 17, 2013
Pursuant to the requirements of the Securities Exchange Act of 1934 and the Investment Company Act of 1940, this report has been signed below by the following persons on behalf of the registrant and in the capacities and on the dates indicated.
| | |
| By (Signature and Title)* | | JOHN M. CORCORAN |
| | John M. Corcoran, President (Principal Executive Officer) |
Date: October 17, 2013
| | |
| By (Signature and Title)* | | DAVID L. DILORENZO |
| | David L. DiLorenzo, Treasurer (Principal Financial Officer and Accounting Officer) |
Date: October 17, 2013
| * | Print name and title of each signing officer under his or her signature. |