Table of Contents
UNITED STATES
SECURITIES AND EXCHANGE COMMISSION
Washington, D.C. 20549
FORM N-CSR
CERTIFIED SHAREHOLDER REPORT OF
REGISTERED MANAGEMENT INVESTMENT COMPANIES
Investment Company Act file number 811-3327
MFS SERIES TRUST XIII
(Exact name of registrant as specified in charter)
111 Huntington Avenue, Boston, Massachusetts 02199
(Address of principal executive offices) (Zip code)
Christopher R. Bohane
Massachusetts Financial Services Company
111 Huntington Avenue
Boston, Massachusetts 02199
(Name and address of agents for service)
Registrant’s telephone number, including area code: (617) 954-5000
Date of fiscal year end: August 31*
Date of reporting period: February 28, 2018
| * | This Form N-CSR pertains only to the following series of the Registrant: MFS Global Real Estate Fund. The remaining series of the Registrant have a fiscal year end other than August 31. |
Table of Contents
| ITEM 1. | REPORTS TO STOCKHOLDERS. |
Table of Contents
Semiannual Report
February 28, 2018

MFS® Global Real Estate Fund

GRE-SEM
Table of Contents
MFS® Global Real Estate Fund
The report is prepared for the general information of shareholders.
It is authorized for distribution to prospective investors only when preceded or accompanied by a current prospectus.
NOT FDIC INSURED • MAY LOSE VALUE • NO BANK GUARANTEE
Table of Contents

LETTER FROM THE EXECUTIVE CHAIRMAN
Dear Shareholders:
Rising bond yields have led to a measurable uptick in market volatility — a departure from the low-volatility environment that prevailed for much of 2017. In spite of this,
global markets remain elevated amid synchronized economic growth. Although the U.S. Federal Reserve continues to gradually raise interest rates and shrink its balance sheet, monetary policy remains accommodative around the world, with many central banks taking only tentative steps toward tighter policies.
Newly enacted U.S. tax reforms have been welcomed by equity markets, while emerging market economies have benefited from a weaker U.S. dollar. Around the world, inflation remains largely subdued, but tight labor markets and solid global demand have investors on the lookout for its potential resurgence. Increased
U.S. protectionism is also a growing concern, as investors fear that trade friction could disrupt the synchronized uptick in global growth.
At MFS®, we believe having a disciplined, long-term investment approach through a full market cycle is essential to capturing the best opportunities while also managing risk. In our view, such a strategy, along with the professional guidance of a financial advisor, will help you reach your investment objectives.
Respectfully,

Robert J. Manning
Executive Chairman
MFS Investment Management
April 13, 2018
The opinions expressed in this letter are subject to change and may not be relied upon for investment advice. No forecasts can be guaranteed.
1
Table of Contents
Portfolio structure
| Top ten holdings | ||||
| Simon Property Group, Inc., REIT | 5.2% | |||
| Public Storage, Inc., REIT | 4.2% | |||
| Unibail-Rodamco, REIT | 3.9% | |||
| Mitsui Fudosan Co. Ltd. | 3.5% | |||
| Link REIT | 3.0% | |||
| Gateway Lifestyle Stapled Security | 2.7% | |||
| Hang Lung Properties Ltd. | 2.6% | |||
| Sun Communities, Inc., REIT | 2.6% | |||
| Boardwalk, REIT | 2.5% | |||
| Medical Properties Trust, Inc., REIT | 2.5% | |||
| Equity industries | ||||
| Real Estate | 93.7% | |||
| Telecommunications - Wireless | 1.6% | |||
| Business Services | 0.5% | |||
| Issuer country weightings (x) | ||||
| United States | 52.9% | |||
| Japan | 9.2% | |||
| United Kingdom | 7.5% | |||
| Hong Kong | 6.7% | |||
| Australia | 5.1% | |||
| Singapore | 4.0% | |||
| France | 3.9% | |||
| Germany | 3.3% | |||
| Canada | 2.5% | |||
| Other Countries | 4.9% | |||
| Currency exposure weightings (y) | ||||
| United States Dollar | 52.9% | |||
| Euro | 10.3% | |||
| Japanese Yen | 9.2% | |||
| British Pound Sterling | 7.5% | |||
| Hong Kong Dollar | 6.7% | |||
| Australian Dollar | 5.1% | |||
| Singapore Dollar | 4.0% | |||
| Canadian Dollar | 2.5% | |||
| Norwegian Krone | 1.3% | |||
| Other Currencies | 0.5% | |||
| (x) | Represents the portfolio’s exposure to issuer countries as a percentage of a portfolio’s net assets. For purposes of this presentation, United States includes Cash & Cash Equivalents. |
| (y) | Represents the portfolio’s exposure to a particular currency as a percentage of a portfolio’s net assets. For purposes of this presentation, United States Dollar includes Cash & Cash Equivalents. |
Cash & Cash Equivalents includes any cash, investments in money market funds, short-term securities, and other assets less liabilities. Please see the Statement of Assets and Liabilities for additional information related to the fund’s cash position and other assets and liabilities.
Percentages are based on net assets as of February 28, 2018.
The portfolio is actively managed and current holdings may be different.
2
Table of Contents
Fund expenses borne by the shareholders during the period, September 1, 2017 through February 28, 2018
As a shareholder of the fund, you incur two types of costs: (1) transaction costs, including sales charges (loads) on certain purchase or redemption payments, and (2) ongoing costs, including management fees; distribution and service (12b-1) fees; and other fund expenses. This example is intended to help you understand your ongoing costs (in dollars) of investing in the fund and to compare these costs with the ongoing costs of investing in other mutual funds.
The example is based on an investment of $1,000 invested at the beginning of the period and held for the entire period September 1, 2017 through February 28, 2018.
The expenses include the payment of a portion of the transfer-agent-related expenses of MFS funds that invest in the fund. For further information, please see the Notes to Financial Statements.
Actual Expenses
The first line for each share class in the following table provides information about actual account values and actual expenses. You may use the information in this line, together with the amount you invested, to estimate the expenses that you paid over the period. Simply divide your account value by $1,000 (for example, an $8,600 account value divided by $1,000 = 8.6), then multiply the result by the number in the first line under the heading entitled “Expenses Paid During Period” to estimate the expenses you paid on your account during this period.
Hypothetical Example for Comparison Purposes
The second line for each share class in the following table provides information about hypothetical account values and hypothetical expenses based on the fund’s actual expense ratio and an assumed rate of return of 5% per year before expenses, which is not the fund’s actual return. The hypothetical account values and expenses may not be used to estimate the actual ending account balance or expenses you paid for the period. You may use this information to compare the ongoing costs of investing in the fund and other funds. To do so, compare this 5% hypothetical example with the 5% hypothetical examples that appear in the shareholder reports of the other funds.
Please note that the expenses shown in the table are meant to highlight your ongoing
costs only and do not reflect any transactional costs, such as sales charges (loads). Therefore, the second line for each share class in the table is useful in comparing ongoing costs only, and will not help you determine the relative total costs of owning different funds. In addition, if these transactional costs were included, your costs would have been higher.
3
Table of Contents
Expense Table – continued
| Share Class | Annualized Ratio | Beginning Account Value 9/01/17 | Ending Account Value | Expenses Paid During 9/01/17-2/28/18 | ||||||||||||||
| A | Actual | 1.35% | $1,000.00 | $966.00 | $6.58 | |||||||||||||
| Hypothetical (h) | 1.35% | $1,000.00 | $1,018.10 | $6.76 | ||||||||||||||
| B | Actual | 2.10% | $1,000.00 | $963.20 | $10.22 | |||||||||||||
| Hypothetical (h) | 2.10% | $1,000.00 | $1,014.38 | $10.49 | ||||||||||||||
| C | Actual | 2.10% | $1,000.00 | $962.90 | $10.22 | |||||||||||||
| Hypothetical (h) | 2.10% | $1,000.00 | $1,014.38 | $10.49 | ||||||||||||||
| I | Actual | 1.10% | $1,000.00 | $967.59 | $5.37 | |||||||||||||
| Hypothetical (h) | 1.10% | $1,000.00 | $1,019.34 | $5.51 | ||||||||||||||
| R1 | Actual | 2.10% | $1,000.00 | $962.17 | $10.22 | |||||||||||||
| Hypothetical (h) | 2.10% | $1,000.00 | $1,014.38 | $10.49 | ||||||||||||||
| R2 | Actual | 1.60% | $1,000.00 | $964.70 | $7.79 | |||||||||||||
| Hypothetical (h) | 1.60% | $1,000.00 | $1,016.86 | $8.00 | ||||||||||||||
| R3 | Actual | 1.35% | $1,000.00 | $967.29 | $6.59 | |||||||||||||
| Hypothetical (h) | 1.35% | $1,000.00 | $1,018.10 | $6.76 | ||||||||||||||
| R4 | Actual | 1.10% | $1,000.00 | $966.74 | $5.36 | |||||||||||||
| Hypothetical (h) | 1.10% | $1,000.00 | $1,019.34 | $5.51 | ||||||||||||||
| R6 | Actual | 1.03% | $1,000.00 | $968.14 | $5.03 | |||||||||||||
| Hypothetical (h) | 1.03% | $1,000.00 | $1,019.69 | $5.16 | ||||||||||||||
| (h) | 5% class return per year before expenses. |
| (p) | “Expenses Paid During Period” are equal to each class’s annualized expense ratio, as shown above, multiplied by the average account value over the period, multiplied by 181/365 (to reflect the one-half year period). Expenses paid do not include any applicable sales charges (loads). If these transaction costs had been included, your costs would have been higher. |
4
Table of Contents
2/28/18 (unaudited)
The Portfolio of Investments is a complete list of all securities owned by your fund. It is categorized by broad-based asset classes.
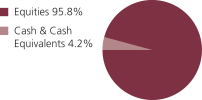
| Common Stocks - 95.8% | ||||||||
| Issuer | Shares/Par | Value ($) | ||||||
| Business Services - 0.5% | ||||||||
| Equinix, Inc., REIT | 8,807 | $ | 3,453,225 | |||||
| Real Estate - 93.7% | ||||||||
| Advance Residence Investment Corp., REIT | 6,507 | $ | 16,270,234 | |||||
| Alexandria Real Estate Equities, Inc., REIT | 138,723 | 16,828,487 | ||||||
| American Homes 4 Rent, “A”, REIT | 587,825 | 11,280,362 | ||||||
| Ascendas India Trust, REIT | 17,400,200 | 13,134,705 | ||||||
| Atrium European Real Estate Ltd. | 2,833,368 | 14,116,880 | ||||||
| AvalonBay Communities, Inc., REIT | 105,514 | 16,462,294 | ||||||
| Big Yellow Group PLC, REIT | 1,205,260 | 13,740,225 | ||||||
| Boardwalk, REIT | 511,102 | 18,146,670 | ||||||
| Boston Properties, Inc., REIT | 30,557 | 3,632,311 | ||||||
| Brixmor Property Group Inc., REIT | 1,134,350 | 17,627,799 | ||||||
| Derwent London PLC, REIT | 383,118 | 15,123,602 | ||||||
| Entra ASA | 680,221 | 9,435,171 | ||||||
| Equity Lifestyle Properties, Inc., REIT | 170,638 | 14,437,681 | ||||||
| Fortune REIT | 6,338,000 | 7,534,010 | ||||||
| Gateway Lifestyle Stapled Security | 12,887,940 | 19,469,438 | ||||||
| Grainger PLC | 934,142 | 3,492,876 | ||||||
| Gramercy Property Trust, REIT | 604,587 | 13,089,309 | ||||||
| Grand City Properties S.A. | 578,632 | 12,967,955 | ||||||
| Hang Lung Properties Ltd. | 7,980,256 | 18,936,878 | ||||||
| Japan Logistics Fund, Inc., REIT | 5,565 | 11,077,478 | ||||||
| Kenedix Office Investment Corp., REIT | 2,161 | 13,642,657 | ||||||
| LEG Immobilien AG | 101,134 | 10,536,792 | ||||||
| Life Storage, Inc., REIT | 190,500 | 14,965,680 | ||||||
| Link REIT | 2,524,905 | 21,517,010 | ||||||
| LondonMetric Property PLC, REIT | 4,347,521 | 10,608,005 | ||||||
| Mapletree Logistics Trust, REIT | 17,413,193 | 15,735,572 | ||||||
| Medical Properties Trust, Inc., REIT | 1,457,108 | 17,864,144 | ||||||
| Mid-America Apartment Communities, Inc., REIT | 196,531 | 16,866,290 | ||||||
| Mitsui Fudosan Co. Ltd. | 1,061,974 | 25,378,665 | ||||||
| National Storage, REIT | 14,535,017 | 17,209,035 | ||||||
| OUTFRONT Media, Inc., REIT | 231,177 | 4,741,440 | ||||||
| Prologis Property Mexico S.A. de C.V., REIT | 1,921,509 | 3,605,381 | ||||||
| Public Storage, Inc., REIT | 155,772 | 30,288,308 | ||||||
| Ramco-Gershenson Properties Trust, REIT | 971,820 | 11,448,040 | ||||||
| Rexford Industrial Realty, Inc., REIT | 195,919 | 5,289,813 | ||||||
| Shaftesbury PLC, REIT | 804,150 | 10,609,064 | ||||||
5
Table of Contents
Portfolio of Investments (unaudited) – continued
| Issuer | Shares/Par | Value ($) | ||||||
| Common Stocks - continued | ||||||||
| Real Estate - continued | ||||||||
| Simon Property Group, Inc., REIT | 241,773 | $ | 37,114,573 | |||||
| STAG Industrial, Inc., REIT | 579,490 | 13,194,987 | ||||||
| Starwood Property Trust, Inc., REIT | 571,341 | 11,569,655 | ||||||
| Store Capital Corp., REIT | 531,352 | 12,667,432 | ||||||
| Sun Communities, Inc., REIT | 210,429 | 18,425,163 | ||||||
| Unibail-Rodamco, REIT | 120,593 | 28,102,767 | ||||||
| Urban Edge Properties, REIT | 461,135 | 9,951,293 | ||||||
| Warehouses De Pauw S.C.A. | 66,770 | 7,945,276 | ||||||
| Washington Prime Group, Inc., REIT | 2,282,020 | 14,947,231 | ||||||
| Welltower, Inc., REIT | 325,121 | 17,068,853 | ||||||
| Weyerhaeuser Co., REIT | 157,605 | 5,520,903 | ||||||
|
| |||||||
| $ | 673,618,394 | |||||||
| Telecommunications - Wireless - 1.6% | ||||||||
| American Tower Corp., REIT | 81,640 | $ | 11,374,901 | |||||
| Total Common Stocks (Identified Cost, $630,184,265) | $ | 688,446,520 | ||||||
| Investment Companies (h) - 4.0% | ||||||||
| Money Market Funds - 4.0% | ||||||||
| MFS Institutional Money Market Portfolio, 1.52% (v) (Identified Cost, $28,609,001) | 28,612,513 | $ | 28,609,652 | |||||
| Other Assets, Less Liabilities - 0.2% | 1,579,680 | |||||||
| Net Assets - 100.0% | $ | 718,635,852 | ||||||
| (h) | An affiliated issuer may be considered one in which the fund owns 5% or more of the outstanding voting securities, or a company which is under common control. At period end, the aggregate values of the fund’s investments in affiliated issuers and in unaffiliated issuers were $28,609,652 and $688,446,520, respectively. |
| (v) | Affiliated issuer that is available only to investment companies managed by MFS. The rate quoted for the MFS Institutional Money Market Portfolio is the annualized seven-day yield of the fund at period end. |
The following abbreviations are used in this report and are defined:
| PLC | Public Limited Company |
| REIT | Real Estate Investment Trust |
See Notes to Financial Statements
6
Table of Contents
Financial Statements
STATEMENT OF ASSETS AND LIABILITIES
At 2/28/18 (unaudited)
This statement represents your fund’s balance sheet, which details the assets and liabilities comprising the total value of the fund.
| Assets | ||||
Investments in unaffiliated issuers, at value (identified cost, $630,184,265) | $688,446,520 | |||
Investments in affiliated issuers, at value (identified cost, $28,609,001) | 28,609,652 | |||
Foreign currency, at value (identified cost, $264,436) | 264,192 | |||
Receivables for | ||||
Fund shares sold | 1,906,641 | |||
Dividends | 1,419,455 | |||
Other assets | 3,000 | |||
Total assets | $720,649,460 | |||
| Liabilities | ||||
Payables for | ||||
Investments purchased | $373,541 | |||
Fund shares reacquired | 1,406,987 | |||
Payable to affiliates | ||||
Investment adviser | 4,000 | |||
Shareholder servicing costs | 200,680 | |||
Distribution and service fees | 1,391 | |||
Payable for independent Trustees’ compensation | 73 | |||
Accrued expenses and other liabilities | 26,936 | |||
Total liabilities | $2,013,608 | |||
Net assets | $718,635,852 | |||
| Net assets consist of | ||||
Paid-in capital | $669,496,831 | |||
Unrealized appreciation (depreciation) | 58,277,308 | |||
Accumulated distributions in excess of net realized gain | (10,781,869 | ) | ||
Undistributed net investment income | 1,643,582 | |||
Net assets | $718,635,852 | |||
Shares of beneficial interest outstanding | 49,962,668 |
7
Table of Contents
Statement of Assets and Liabilities (unaudited) – continued
| Net assets | Shares outstanding | Net asset value per share (a) | ||||||||||
Class A | $63,303,218 | 4,339,606 | $14.59 | |||||||||
Class B | 1,027,918 | 128,530 | 8.00 | |||||||||
Class C | 7,271,803 | 915,575 | 7.94 | |||||||||
Class I | 143,653,810 | 9,820,456 | 14.63 | |||||||||
Class R1 | 91,129 | 11,290 | 8.07 | |||||||||
Class R2 | 1,340,742 | 166,988 | 8.03 | |||||||||
Class R3 | 2,373,367 | 294,986 | 8.05 | |||||||||
Class R4 | 3,538,232 | 439,438 | 8.05 | |||||||||
Class R6 | 496,035,633 | 33,845,799 | 14.66 | |||||||||
| (a) | Maximum offering price per share was equal to the net asset value per share for all share classes, except for Class A, for which the maximum offering price per share was $15.48 [100 / 94.25 x $14.59]. On sales of $50,000 or more, the maximum offering price of Class A shares is reduced. A contingent deferred sales charge may be imposed on redemptions of Class A, Class B, and Class C shares. Redemption price per share was equal to the net asset value per share for Classes I, R1, R2, R3, R4, and R6. Net asset value per share is calculated using actual net assets and shares outstanding rather than amounts that have been rounded for presentation purposes. |
See Notes to Financial Statements
8
Table of Contents
Financial Statements
Six months ended 2/28/18 (unaudited)
This statement describes how much your fund earned in investment income and accrued in expenses. It also describes any gains and/or losses generated by fund operations.
| Net investment income (loss) | ||||
Income | ||||
Dividends | $10,926,323 | |||
Dividends from affiliated issuers | 94,290 | |||
Foreign taxes withheld | (278,727 | ) | ||
Total investment income | $10,741,886 | |||
Expenses | ||||
Management fee | $3,178,678 | |||
Distribution and service fees | 117,956 | |||
Shareholder servicing costs | 423,849 | |||
Administrative services fee | 57,979 | |||
Independent Trustees’ compensation | 7,760 | |||
Custodian fee | 39,174 | |||
Shareholder communications | 12,875 | |||
Audit and tax fees | 30,526 | |||
Legal fees | 3,306 | |||
Miscellaneous | 97,000 | |||
Total expenses | $3,969,103 | |||
Reduction of expenses by investment adviser and distributor | (147,565 | ) | ||
Net expenses | $3,821,538 | |||
Net investment income (loss) | $6,920,348 | |||
| Realized and unrealized gain (loss) | ||||
Realized gain (loss) (identified cost basis) | ||||
Unaffiliated issuers | $8,326,026 | |||
Affiliated issuers | (1,738 | ) | ||
Foreign currency | 9,708 | |||
Net realized gain (loss) | $8,333,996 | |||
Change in unrealized appreciation (depreciation) | ||||
Unaffiliated issuers | $(39,455,849 | ) | ||
Affiliated issuers | 149 | |||
Translation of assets and liabilities in foreign currencies | (429 | ) | ||
Net unrealized gain (loss) | $(39,456,129 | ) | ||
Net realized and unrealized gain (loss) | $(31,122,133 | ) | ||
Change in net assets from operations | $(24,201,785 | ) |
See Notes to Financial Statements
9
Table of Contents
Financial Statements
STATEMENTS OF CHANGES IN NET ASSETS
These statements describe the increases and/or decreases in net assets resulting from operations, any distributions, and any shareholder transactions.
| Change in net assets | Six months ended (unaudited) | Year ended 8/31/17 | ||||||
| From operations | ||||||||
Net investment income (loss) | $6,920,348 | $15,121,830 | ||||||
Net realized gain (loss) | 8,333,996 | 10,592,329 | ||||||
Net unrealized gain (loss) | (39,456,129 | ) | 282,516 | |||||
Change in net assets from operations | $(24,201,785 | ) | $25,996,675 | |||||
| Distributions declared to shareholders | ||||||||
From net investment income | $(17,500,010 | ) | $(20,300,161 | ) | ||||
From net realized gain | (13,728,314 | ) | (26,655,408 | ) | ||||
Total distributions declared to shareholders | $(31,228,324 | ) | $(46,955,569 | ) | ||||
Change in net assets from fund share transactions | $111,693,152 | $157,027,885 | ||||||
Total change in net assets | $56,263,035 | $136,068,991 | ||||||
| Net assets | ||||||||
At beginning of period | 662,372,809 | 526,303,818 | ||||||
At end of period (including undistributed net investment income of $1,643,582 and $12,223,244, respectively) | $718,635,852 | $662,372,809 | ||||||
See Notes to Financial Statements
10
Table of Contents
Financial Statements
The financial highlights table is intended to help you understand the fund’s financial performance for the semiannual period and the past 5 fiscal years (or life of a particular share class, if shorter). Certain information reflects financial results for a single fund share. The total returns in the table represent the rate that an investor would have earned (or lost) on an investment in the fund share class (assuming reinvestment of all distributions) held for the entire period.
Six months 2/28/18 | Year ended | |||||||||||||||||||||||||||
| Class A | 8/31/17 | 8/31/16 | 8/31/15 (z) | 2/28/15 | 2/28/14 | 2/28/13 | ||||||||||||||||||||||
| (unaudited) | ||||||||||||||||||||||||||||
Net asset value, beginning | $15.73 | $16.72 | $14.84 | $16.36 | $14.72 | $15.12 | $13.51 | |||||||||||||||||||||
| Income (loss) from investment operations | ||||||||||||||||||||||||||||
Net investment income | $0.13 | $0.38 | (c) | $0.31 | $0.13 | $0.22 | $0.26 | $0.26 | ||||||||||||||||||||
Net realized and unrealized gain (loss) | (0.63 | ) | 0.04 | (g) | 2.41 | (1.41 | ) | 2.08 | 0.33 | 2.38 | ||||||||||||||||||
Total from investment | $(0.50 | ) | $0.42 | $2.72 | $(1.28 | ) | $2.30 | $0.59 | $2.64 | |||||||||||||||||||
| Less distributions declared to shareholders | ||||||||||||||||||||||||||||
From net investment | $(0.35 | ) | $(0.59 | ) | $(0.25 | ) | $(0.08 | ) | $(0.41 | ) | $(0.38 | ) | $(0.51 | ) | ||||||||||||||
From net realized gain | (0.29 | ) | (0.82 | ) | (0.59 | ) | (0.16 | ) | (0.25 | ) | (0.61 | ) | (0.52 | ) | ||||||||||||||
Total distributions | $(0.64 | ) | $(1.41 | ) | $(0.84 | ) | $(0.24 | ) | $(0.66 | ) | $(0.99 | ) | $(1.03 | ) | ||||||||||||||
Net asset value, end of | $14.59 | $15.73 | $16.72 | $14.84 | $16.36 | $14.72 | $15.12 | |||||||||||||||||||||
Total return (%) (r)(s)(t)(x) | (3.40 | )(n) | 3.32 | (c) | 19.14 | (7.94 | )(n) | 15.83 | 4.24 | 20.14 | ||||||||||||||||||
| Ratios (%) (to average net assets) and Supplemental data: | ||||||||||||||||||||||||||||
Expenses before expense | 1.39 | (a) | 1.43 | (c) | 1.42 | 1.26 | (a) | 1.25 | 1.22 | 1.23 | ||||||||||||||||||
Expenses after expense | 1.35 | (a) | 1.35 | (c) | 1.33 | 1.24 | (a) | 1.25 | 1.22 | 1.23 | ||||||||||||||||||
Net investment income | 1.67 | (a) | 2.49 | (c) | 1.97 | 1.69 | (a) | 1.37 | 1.74 | 1.85 | ||||||||||||||||||
Portfolio turnover | 9 | (n) | 29 | 53 | 14 | (n) | 37 | 30 | 46 | |||||||||||||||||||
Net assets at end of period | $63,303 | $35,503 | $15,981 | $3,529 | $962 | $291 | $279 | |||||||||||||||||||||
See Notes to Financial Statements
11
Table of Contents
Financial Highlights – continued
Six months 2/28/18 | Year ended | |||||||||||||||||||
| Class B | 8/31/17 | 8/31/16 | 8/31/15 (z) | 2/28/15 (i) | ||||||||||||||||
| (unaudited) | ||||||||||||||||||||
Net asset value, beginning of | $8.88 | $10.09 | $9.30 | $10.38 | $10.00 | |||||||||||||||
| Income (loss) from investment operations | ||||||||||||||||||||
Net investment income (loss) (d) | $0.04 | $0.14 | (c) | $0.12 | $0.05 | (0.00 | )(w) | |||||||||||||
Net realized and unrealized | (0.35 | )(g) | 0.00 | (g)(w) | 1.47 | (g) | (0.90 | )(g) | 0.38 | (g) | ||||||||||
Total from investment operations | $(0.31 | ) | $0.14 | $1.59 | $(0.85 | ) | $0.38 | |||||||||||||
| Less distributions declared to shareholders | ||||||||||||||||||||
From net investment income | $(0.28 | ) | $(0.53 | ) | $(0.21 | ) | $(0.07 | ) | $— | |||||||||||
From net realized gain | (0.29 | ) | (0.82 | ) | (0.59 | ) | (0.16 | ) | — | |||||||||||
Total distributions declared to | $(0.57 | ) | $(1.35 | ) | $(0.80 | ) | $(0.23 | ) | $— | |||||||||||
Net asset value, end of period (x) | $8.00 | $8.88 | $10.09 | $9.30 | $10.38 | |||||||||||||||
Total return (%) (r)(s)(t)(x) | (3.79 | )(n) | 2.58 | (c) | 18.25 | (8.31 | )(n) | 3.80 | (n) | |||||||||||
| Ratios (%) (to average net assets) and Supplemental data: | ||||||||||||||||||||
Expenses before expense | 2.14 | (a) | 2.18 | (c) | 2.16 | 2.01 | (a) | 2.07 | (a) | |||||||||||
Expenses after expense | 2.10 | (a) | 2.09 | (c) | 2.07 | 2.00 | (a) | 2.06 | (a) | |||||||||||
Net investment income (loss) | 0.95 | (a) | 1.63 | (c) | 1.31 | 0.97 | (a) | (0.14 | )(a) | |||||||||||
Portfolio turnover | 9 | (n) | 29 | 53 | 14 | (n) | 37 | |||||||||||||
Net assets at end of period | $1,028 | $1,098 | $1,116 | $676 | $317 | |||||||||||||||
See Notes to Financial Statements
12
Table of Contents
Financial Highlights – continued
Six months 2/28/18 | Year ended | |||||||||||||||||||
| Class C | 8/31/17 | 8/31/16 | 8/31/15 (z) | 2/28/15 (i) | ||||||||||||||||
| (unaudited) | ||||||||||||||||||||
Net asset value, beginning of | $8.85 | $10.09 | $9.29 | $10.38 | $10.00 | |||||||||||||||
| Income (loss) from investment operations | ||||||||||||||||||||
Net investment income (loss) (d) | $0.04 | $0.14 | (c) | $0.11 | $0.04 | (0.00 | )(w) | |||||||||||||
Net realized and unrealized | (0.35 | )(g) | (0.01 | )(g) | 1.49 | (g) | (0.90 | )(g) | 0.38 | (g) | ||||||||||
Total from investment operations | $(0.31 | ) | $0.13 | $1.60 | $(0.86 | ) | $0.38 | |||||||||||||
| Less distributions declared to shareholders | ||||||||||||||||||||
From net investment income | $(0.31 | ) | $(0.55 | ) | $(0.21 | ) | $(0.07 | ) | $— | |||||||||||
From net realized gain | (0.29 | ) | (0.82 | ) | (0.59 | ) | (0.16 | ) | — | |||||||||||
Total distributions declared to | $(0.60 | ) | $(1.37 | ) | $(0.80 | ) | $(0.23 | ) | $— | |||||||||||
Net asset value, end of period (x) | $7.94 | $8.85 | $10.09 | $9.29 | $10.38 | |||||||||||||||
Total return (%) (r)(s)(t)(x) | (3.82 | )(n) | 2.56 | (c) | 18.32 | (8.41 | )(n) | 3.80 | (n) | |||||||||||
| Ratios (%) (to average net assets) and Supplemental data: | ||||||||||||||||||||
Expenses before expense | 2.14 | (a) | 2.18 | (c) | 2.17 | 2.01 | (a) | 2.07 | (a) | |||||||||||
Expenses after expense | 2.10 | (a) | 2.10 | (c) | 2.08 | 2.00 | (a) | 2.06 | (a) | |||||||||||
Net investment income (loss) | 0.95 | (a) | 1.64 | (c) | 1.19 | 0.89 | (a) | (0.10 | )(a) | |||||||||||
Portfolio turnover | 9 | (n) | 29 | 53 | 14 | (n) | 37 | |||||||||||||
Net assets at end of period | $7,272 | $6,483 | $2,676 | $836 | $330 | |||||||||||||||
See Notes to Financial Statements
13
Table of Contents
Financial Highlights – continued
Six months 2/28/18 | Year ended | |||||||||||||||||||||||||||
| Class I | 8/31/17 | 8/31/16 | 8/31/15 (z) | 2/28/15 | 2/28/14 | 2/28/13 | ||||||||||||||||||||||
| (unaudited) | ||||||||||||||||||||||||||||
Net asset value, beginning | $15.78 | $16.76 | $14.86 | $16.38 | $14.73 | $15.13 | $13.52 | |||||||||||||||||||||
| Income (loss) from investment operations | ||||||||||||||||||||||||||||
Net investment income | $0.15 | $0.41 | (c) | $0.32 | $0.16 | $0.27 | $0.30 | $0.44 | ||||||||||||||||||||
Net realized and unrealized gain (loss) | (0.64 | ) | 0.05 | (g) | 2.44 | (1.44 | ) | 2.08 | 0.33 | 2.23 | ||||||||||||||||||
Total from investment | $(0.49 | ) | $0.46 | $2.76 | $(1.28 | ) | $2.35 | $0.63 | $2.67 | |||||||||||||||||||
| Less distributions declared to shareholders | ||||||||||||||||||||||||||||
From net investment | $(0.37 | ) | $(0.62 | ) | $(0.27 | ) | $(0.08 | ) | $(0.45 | ) | $(0.42 | ) | $(0.54 | ) | ||||||||||||||
From net realized gain | (0.29 | ) | (0.82 | ) | (0.59 | ) | (0.16 | ) | (0.25 | ) | (0.61 | ) | (0.52 | ) | ||||||||||||||
Total distributions | $(0.66 | ) | $(1.44 | ) | $(0.86 | ) | $(0.24 | ) | $(0.70 | ) | $(1.03 | ) | $(1.06 | ) | ||||||||||||||
Net asset value, end of | $14.63 | $15.78 | $16.76 | $14.86 | $16.38 | $14.73 | $15.13 | |||||||||||||||||||||
Total return (%) (r)(s)(t)(x) | (3.30 | )(n) | 3.58 | (c) | 19.38 | (7.93 | )(n) | 16.17 | 4.50 | 20.41 | ||||||||||||||||||
| Ratios (%) (to average net assets) and Supplemental data: | ||||||||||||||||||||||||||||
Expenses before expense | 1.14 | (a) | 1.18 | (c) | 1.17 | 1.00 | (a) | 1.00 | 0.97 | 0.98 | ||||||||||||||||||
Expenses after expense | 1.10 | (a) | 1.10 | (c) | 1.09 | 1.00 | (a) | 1.00 | 0.97 | 0.98 | ||||||||||||||||||
Net investment income | 1.94 | (a) | 2.65 | (c) | 1.99 | 2.05 | (a) | 1.67 | 1.99 | 3.30 | ||||||||||||||||||
Portfolio turnover | 9 | (n) | 29 | 53 | 14 | (n) | 37 | 30 | 46 | |||||||||||||||||||
Net assets at end of period | $143,654 | $121,357 | $41,108 | $1,248 | $477 | $122 | $117 | |||||||||||||||||||||
See Notes to Financial Statements
14
Table of Contents
Financial Highlights – continued
Six months 2/28/18 | Year ended | |||||||||||||||||||
| Class R1 | 8/31/17 | 8/31/16 | 8/31/15 (z) | 2/28/15 (i) | ||||||||||||||||
| (unaudited) | ||||||||||||||||||||
Net asset value, beginning of | $8.96 | $10.17 | $9.31 | $10.38 | $10.00 | |||||||||||||||
| Income (loss) from investment operations | ||||||||||||||||||||
Net investment income (loss) (d) | $0.04 | $0.14 | (c) | $0.13 | $0.05 | $0.01 | ||||||||||||||
Net realized and unrealized | (0.35 | )(g) | (0.01 | )(g) | 1.48 | (g) | (0.90 | )(g) | 0.37 | (g) | ||||||||||
Total from investment operations | $(0.31 | ) | $0.13 | $1.61 | $(0.85 | ) | $0.38 | |||||||||||||
| Less distributions declared to shareholders | ||||||||||||||||||||
From net investment income | $(0.29 | ) | $(0.52 | ) | $(0.16 | ) | $(0.06 | ) | $— | |||||||||||
From net realized gain | (0.29 | ) | (0.82 | ) | (0.59 | ) | (0.16 | ) | — | |||||||||||
Total distributions declared to | $(0.58 | ) | $(1.34 | ) | $(0.75 | ) | $(0.22 | ) | $— | |||||||||||
Net asset value, end of period (x) | $8.07 | $8.96 | $10.17 | $9.31 | $10.38 | |||||||||||||||
Total return (%) (r)(s)(t)(x) | (3.78 | )(n) | 2.51 | (c) | 18.32 | (8.31 | )(n) | 3.80 | (n) | |||||||||||
| Ratios (%) (to average net assets) and Supplemental data: | ||||||||||||||||||||
Expenses before expense | 2.14 | (a) | 2.18 | (c) | 2.15 | 2.01 | (a) | 2.06 | (a) | |||||||||||
Expenses after expense | 2.10 | (a) | 2.09 | (c) | 2.07 | 2.00 | (a) | 2.06 | (a) | |||||||||||
Net investment income (loss) | 0.90 | (a) | 1.61 | (c) | 1.32 | 0.99 | (a) | 0.28 | (a) | |||||||||||
Portfolio turnover | 9 | (n) | 29 | 53 | 14 | (n) | 37 | |||||||||||||
Net assets at end of period | $91 | $78 | $67 | $105 | $104 | |||||||||||||||
See Notes to Financial Statements
15
Table of Contents
Financial Highlights – continued
Six months 2/28/18 | Year ended | |||||||||||||||||||
| Class R2 | 8/31/17 | 8/31/16 | 8/31/15 (z) | 2/28/15 (i) | ||||||||||||||||
| (unaudited) | ||||||||||||||||||||
Net asset value, beginning of | $8.95 | $10.19 | $9.33 | $10.39 | $10.00 | |||||||||||||||
| Income (loss) from investment operations | ||||||||||||||||||||
Net investment income (loss) (d) | $0.06 | $0.20 | (c) | $0.17 | $0.08 | $0.02 | ||||||||||||||
Net realized and unrealized | (0.34 | )(g) | (0.02 | )(g) | 1.49 | (g) | (0.91 | )(g) | 0.37 | (g) | ||||||||||
Total from investment operations | $(0.28 | ) | $0.18 | $1.66 | $(0.83 | ) | $0.39 | |||||||||||||
| Less distributions declared to shareholders | ||||||||||||||||||||
From net investment income | $(0.35 | ) | $(0.60 | ) | $(0.21 | ) | $(0.07 | ) | $— | |||||||||||
From net realized gain | (0.29 | ) | (0.82 | ) | (0.59 | ) | (0.16 | ) | — | |||||||||||
Total distributions declared to | $(0.64 | ) | $(1.42 | ) | $(0.80 | ) | $(0.23 | ) | $— | |||||||||||
Net asset value, end of period (x) | $8.03 | $8.95 | $10.19 | $9.33 | $10.39 | |||||||||||||||
Total return (%) (r)(s)(t)(x) | (3.53 | )(n) | 3.10 | (c) | 18.92 | (8.15 | )(n) | 3.90 | (n) | |||||||||||
| Ratios (%) (to average net assets) and Supplemental data: | ||||||||||||||||||||
Expenses before expense | 1.64 | (a) | 1.68 | (c) | 1.65 | 1.51 | (a) | 1.56 | (a) | |||||||||||
Expenses after expense | 1.60 | (a) | 1.60 | (c) | 1.57 | 1.50 | (a) | 1.56 | (a) | |||||||||||
Net investment income (loss) | 1.48 | (a) | 2.23 | (c) | 1.77 | 1.53 | (a) | 0.78 | (a) | |||||||||||
Portfolio turnover | 9 | (n) | 29 | 53 | 14 | (n) | 37 | |||||||||||||
Net assets at end of period | $1,341 | $1,268 | $84 | $95 | $104 | |||||||||||||||
See Notes to Financial Statements
16
Table of Contents
Financial Highlights – continued
Six months 2/28/18 | Year ended | |||||||||||||||||||
| Class R3 | 8/31/17 | 8/31/16 | 8/31/15 (z) | 2/28/15 (i) | ||||||||||||||||
| (unaudited) | ||||||||||||||||||||
Net asset value, beginning of | $8.97 | $10.20 | $9.35 | $10.39 | $10.00 | |||||||||||||||
| Income (loss) from investment operations | ||||||||||||||||||||
Net investment income (loss) (d) | $0.06 | $0.22 | (c) | $0.18 | $0.09 | $0.02 | ||||||||||||||
Net realized and unrealized | (0.32 | )(g) | (0.03 | )(g) | 1.50 | (g) | (0.90 | )(g) | 0.37 | (g) | ||||||||||
Total from investment operations | $(0.26 | ) | $0.19 | $1.68 | $(0.81 | ) | $0.39 | |||||||||||||
| Less distributions declared to shareholders | ||||||||||||||||||||
From net investment income | $(0.37 | ) | $(0.60 | ) | $(0.24 | ) | $(0.07 | ) | $— | |||||||||||
From net realized gain | (0.29 | ) | (0.82 | ) | (0.59 | ) | (0.16 | ) | — | |||||||||||
Total distributions declared to | $(0.66 | ) | $(1.42 | ) | $(0.83 | ) | $(0.23 | ) | $— | |||||||||||
Net asset value, end of period (x) | $8.05 | $8.97 | $10.20 | $9.35 | $10.39 | |||||||||||||||
Total return (%) (r)(s)(t)(x) | (3.27 | )(n) | 3.24 | (c) | 19.18 | (7.92 | )(n) | 3.90 | (n) | |||||||||||
| Ratios (%) (to average net assets) and Supplemental data: | ||||||||||||||||||||
Expenses before expense | 1.39 | (a) | 1.43 | (c) | 1.41 | 1.26 | (a) | 1.31 | (a) | |||||||||||
Expenses after expense | 1.35 | (a) | 1.35 | (c) | 1.33 | 1.25 | (a) | 1.31 | (a) | |||||||||||
Net investment income (loss) | 1.43 | (a) | 2.52 | (c) | 1.89 | 1.78 | (a) | 1.03 | (a) | |||||||||||
Portfolio turnover | 9 | (n) | 29 | 53 | 14 | (n) | 37 | |||||||||||||
Net assets at end of period | $2,373 | $509 | $226 | $96 | $104 | |||||||||||||||
See Notes to Financial Statements
17
Table of Contents
Financial Highlights – continued
| Six months ended 2/28/18 | Year ended | |||||||||||||||||||
| Class R4 | 8/31/17 | 8/31/16 | 8/31/15 (z) | 2/28/15 (i) | ||||||||||||||||
| (unaudited) | ||||||||||||||||||||
Net asset value, beginning of | $8.98 | $10.20 | $9.36 | $10.40 | $10.00 | |||||||||||||||
| Income (loss) from investment operations | ||||||||||||||||||||
Net investment income (loss) (d) | $0.08 | $0.23 | (c) | $0.21 | $0.10 | $0.03 | ||||||||||||||
Net realized and unrealized | (0.34 | )(g) | (0.01 | )(g) | 1.49 | (g) | (0.90 | )(g) | 0.37 | (g) | ||||||||||
Total from investment operations | $(0.26 | ) | $0.22 | $1.70 | $(0.80 | ) | $0.40 | |||||||||||||
| Less distributions declared to shareholders | ||||||||||||||||||||
From net investment income | $(0.38 | ) | $(0.62 | ) | $(0.27 | ) | $(0.08 | ) | $— | |||||||||||
From net realized gain | (0.29 | ) | (0.82 | ) | (0.59 | ) | (0.16 | ) | — | |||||||||||
Total distributions declared to | $(0.67 | ) | $(1.44 | ) | $(0.86 | ) | $(0.24 | ) | $— | |||||||||||
Net asset value, end of period (x) | $8.05 | $8.98 | $10.20 | $9.36 | $10.40 | |||||||||||||||
Total return (%) (r)(s)(t)(x) | (3.33 | )(n) | 3.54 | (c) | 19.47 | (7.87 | )(n) | 4.00 | (n) | |||||||||||
| Ratios (%) (to average net assets) and Supplemental data: | ||||||||||||||||||||
Expenses before expense | 1.14 | (a) | 1.18 | (c) | 1.16 | 1.01 | (a) | 1.06 | (a) | |||||||||||
Expenses after expense | 1.10 | (a) | 1.09 | (c) | 1.08 | 1.00 | (a) | 1.06 | (a) | |||||||||||
Net investment income (loss) | 1.77 | (a) | 2.63 | (c) | 2.14 | 2.03 | (a) | 1.28 | (a) | |||||||||||
Portfolio turnover | 9 | (n) | 29 | 53 | 14 | (n) | 37 | |||||||||||||
Net assets at end of period | $3,538 | $1,296 | $763 | $96 | $104 | |||||||||||||||
See Notes to Financial Statements
18
Table of Contents
Financial Highlights – continued
| Six months ended 2/28/18 | Year ended | |||||||||||||||||||||||||||
| Class R6 | 8/31/17 | 8/31/16 | 8/31/15 (z) | 2/28/15 | 2/28/14 | 2/28/13 (i) | ||||||||||||||||||||||
| (unaudited) | ||||||||||||||||||||||||||||
Net asset value, | $15.81 | $16.78 | $14.86 | $16.38 | $14.73 | $15.13 | $13.74 | |||||||||||||||||||||
| Income (loss) from investment operations | ||||||||||||||||||||||||||||
Net investment | $0.16 | $0.41 | (c) | $0.37 | $0.16 | $0.29 | $0.29 | $0.14 | ||||||||||||||||||||
Net realized and | (0.64 | ) | 0.06 | (g) | 2.41 | (1.44 | ) | 2.06 | 0.34 | 2.10 | ||||||||||||||||||
Total from investment | $(0.48 | ) | $0.47 | $2.78 | $(1.28 | ) | $2.35 | $0.63 | $2.24 | |||||||||||||||||||
| Less distributions declared to shareholders | ||||||||||||||||||||||||||||
From net investment | $(0.38 | ) | $(0.62 | ) | $(0.27 | ) | $(0.08 | ) | $(0.45 | ) | $(0.42 | ) | $(0.50 | ) | ||||||||||||||
From net realized | (0.29 | ) | (0.82 | ) | (0.59 | ) | (0.16 | ) | (0.25 | ) | (0.61 | ) | (0.35 | ) | ||||||||||||||
Total distributions | $(0.67 | ) | $(1.44 | ) | $(0.86 | ) | $(0.24 | ) | $(0.70 | ) | $(1.03 | ) | $(0.85 | ) | ||||||||||||||
Net asset value, end of | $14.66 | $15.81 | $16.78 | $14.86 | $16.38 | $14.73 | $15.13 | |||||||||||||||||||||
Total return (%) | (3.25 | )(n) | 3.68 | (c) | 19.54 | (7.93 | )(n) | 16.17 | 4.50 | 16.56 | (n) | |||||||||||||||||
| Ratios (%) (to average net assets) and Supplemental data: | ||||||||||||||||||||||||||||
Expenses before | 1.07 | (a) | 1.11 | (c) | 1.10 | 1.00 | (a) | 0.99 | 0.97 | 0.98 | (a) | |||||||||||||||||
Expenses after expense | 1.03 | (a) | 1.02 | (c) | 1.03 | 0.99 | (a) | 0.99 | 0.97 | 0.98 | (a) | |||||||||||||||||
Net investment income | 2.02 | (a) | 2.68 | (c) | 2.39 | 2.04 | (a) | 1.81 | 1.94 | 1.48 | (a) | |||||||||||||||||
Portfolio turnover | 9 | (n) | 29 | 53 | 14 | (n) | 37 | 30 | 46 | |||||||||||||||||||
Net assets at end of | $496,036 | $494,781 | $464,282 | $438,517 | $450,828 | $409,923 | $302,900 | |||||||||||||||||||||
See Notes to Financial Statements
19
Table of Contents
Financial Highlights – continued
| (a) | Annualized. |
| (c) | Amount reflects a one-time reimbursement of expenses by the custodian (or former custodian) without which net investment income and performance would be lower and expenses would be higher. |
| (d) | Per share data is based on average shares outstanding. |
| (f) | Ratios do not reflect reductions from fees paid indirectly, if applicable. |
| (g) | The per share amount varies from the net realized and unrealized gain/loss for the period because of the timing of sales of fund shares and the per share amount of realized and unrealized gains and losses at such time. |
| (i) | For the period from the class inception, July 2, 2012 (Class R6) and December 19, 2014 (Class B, Class C, Class R1, Class R2, Class R3, and Class R4), through the stated period end. |
| (n) | Not annualized. |
| (r) | Certain expenses have been reduced without which performance would have been lower. |
| (s) | From time to time the fund may receive proceeds from litigation settlements, without which performance would be lower. |
| (t) | Total returns do not include any applicable sales charges. |
| (w) | Per share amount was less than $0.01. |
| (x) | The net asset values and total returns have been calculated on net assets which include adjustments made in accordance with U.S. generally accepted accounting principles required at period end for financial reporting purposes. |
| (z) | For the period March 1, 2015 through August 31, 2015. Effective March 1, 2015, the fund changed its fiscal year-end from February 28 to August 31. |
See Notes to Financial Statements
20
Table of Contents
(unaudited)
(1) Business and Organization
MFS Global Real Estate Fund (the fund) is a diversified series of MFS Series Trust XIII (the trust). The trust is organized as a Massachusetts business trust and is registered under the Investment Company Act of 1940, as amended, as an open-end management investment company.
The fund is an investment company and accordingly follows the investment company accounting and reporting guidance of the Financial Accounting Standards Board (FASB) Accounting Standards Codification Topic 946 Financial Services – Investment Companies.
(2) Significant Accounting Policies
General – The preparation of financial statements in conformity with U.S. generally accepted accounting principles requires management to make estimates and assumptions that affect the reported amounts of assets and liabilities, and disclosure of contingent assets and liabilities at the date of the financial statements and the reported amounts of increases and decreases in net assets from operations during the reporting period. Actual results could differ from those estimates. In the preparation of these financial statements, management has evaluated subsequent events occurring after the date of the fund’s Statement of Assets and Liabilities through the date that the financial statements were issued. The fund invests a significant amount of its net assets in U.S. and foreign real estate related investments and as a result is subject to certain risks associated with the direct ownership of real estate and the real estate industry in general. These include risks related to general, regional and local economic conditions; difficulties in valuing and disposing of real estate; fluctuations in interest rates and property tax rates, shifts in zoning laws, environmental regulations and other governmental action; cash flow dependency; increased operating expenses; lack of availability of mortgage funds; losses due to natural disasters; overbuilding; losses due to casualty or condemnation; changes in property values and rental rates; the management skill and creditworthiness of the manager; and other factors. The fund invests in foreign securities. Investments in foreign securities are vulnerable to the effects of changes in the relative values of the local currency and the U.S. dollar and to the effects of changes in each country’s market, economic, industry, political, regulatory, geopolitical, and other conditions.
Balance Sheet Offsetting – The fund’s accounting policy with respect to balance sheet offsetting is that, absent an event of default by the counterparty or a termination of the agreement, the International Swaps and Derivatives Association (ISDA) Master Agreement, or similar agreement, does not result in an offset of reported amounts of financial assets and financial liabilities in the Statement of Assets and Liabilities across transactions between the fund and the applicable counterparty. The fund’s right to setoff may be restricted or prohibited by the bankruptcy or insolvency laws of the particular jurisdiction to which a specific master netting agreement counterparty is subject. Balance sheet offsetting disclosures, to the extent applicable to the fund, have been included in the fund’s Significant Accounting Policies note under the captions for each of the fund’s in-scope financial instruments and transactions.
21
Table of Contents
Notes to Financial Statements (unaudited) – continued
Investment Valuations – Equity securities, including restricted equity securities, are generally valued at the last sale or official closing price on their primary market or exchange as provided by a third-party pricing service. Equity securities, for which there were no sales reported that day, are generally valued at the last quoted daily bid quotation on their primary market or exchange as provided by a third-party pricing service. Short-term instruments with a maturity at issuance of 60 days or less may be valued at amortized cost, which approximates market value. Open-end investment companies are generally valued at net asset value per share. Securities and other assets generally valued on the basis of information from a third-party pricing service may also be valued at a broker/dealer bid quotation. Values obtained from third-party pricing services can utilize both transaction data and market information such as yield, quality, coupon rate, maturity, type of issue, trading characteristics, and other market data. The values of foreign securities and other assets and liabilities expressed in foreign currencies are converted to U.S. dollars using the mean of bid and asked prices for rates provided by a third-party pricing service.
The Board of Trustees has delegated primary responsibility for determining or causing to be determined the value of the fund’s investments (including any fair valuation) to the adviser pursuant to valuation policies and procedures approved by the Board. If the adviser determines that reliable market quotations are not readily available, investments are valued at fair value as determined in good faith by the adviser in accordance with such procedures under the oversight of the Board of Trustees. Under the fund’s valuation policies and procedures, market quotations are not considered to be readily available for most types of debt instruments and floating rate loans and many types of derivatives. These investments are generally valued at fair value based on information from third-party pricing services. In addition, investments may be valued at fair value if the adviser determines that an investment’s value has been materially affected by events occurring after the close of the exchange or market on which the investment is principally traded (such as foreign exchange or market) and prior to the determination of the fund’s net asset value, or after the halting of trading of a specific security where trading does not resume prior to the close of the exchange or market on which the security is principally traded. Events that occur on a frequent basis after foreign markets close (such as developments in foreign markets and significant movements in the U.S. markets) and prior to the determination of the fund’s net asset value may be deemed to have a material effect on the value of securities traded in foreign markets. Accordingly, the fund’s foreign equity securities may often be valued at fair value. The adviser generally relies on third-party pricing services or other information (such as the correlation with price movements of similar securities in the same or other markets; the type, cost and investment characteristics of the security; the business and financial condition of the issuer; and trading and other market data) to assist in determining whether to fair value and at what value to fair value an investment. The value of an investment for purposes of calculating the fund’s net asset value can differ depending on the source and method used to determine value. When fair valuation is used, the value of an investment used to determine the fund’s net asset value may differ from quoted or published prices for the same investment. There can be no assurance that the fund could obtain the fair value assigned to an investment if it were to sell the investment at the same time at which the fund determines its net asset value per share.
22
Table of Contents
Notes to Financial Statements (unaudited) – continued
Various inputs are used in determining the value of the fund’s assets or liabilities. These inputs are categorized into three broad levels. In certain cases, the inputs used to measure fair value may fall into different levels of the fair value hierarchy. In such cases, an investment’s level within the fair value hierarchy is based on the lowest level of input that is significant to the fair value measurement. The fund’s assessment of the significance of a particular input to the fair value measurement in its entirety requires judgment, and considers factors specific to the investment. Level 1 includes unadjusted quoted prices in active markets for identical assets or liabilities. Level 2 includes other significant observable market-based inputs (including quoted prices for similar securities, interest rates, prepayment speed, and credit risk). Level 3 includes unobservable inputs, which may include the adviser’s own assumptions in determining the fair value of investments. The following is a summary of the levels used as of February 28, 2018 in valuing the fund’s assets or liabilities:
| Financial Instruments | Level 1 | Level 2 | Level 3 | Total | ||||||||||||
| Equity Securities: | ||||||||||||||||
United States | $350,110,173 | $— | $— | $350,110,173 | ||||||||||||
Japan | — | 66,369,034 | — | 66,369,034 | ||||||||||||
United Kingdom | — | 53,573,772 | — | 53,573,772 | ||||||||||||
Hong Kong | — | 47,987,898 | — | 47,987,898 | ||||||||||||
Australia | — | 36,678,474 | — | 36,678,474 | ||||||||||||
Singapore | 13,134,705 | 15,735,572 | — | 28,870,277 | ||||||||||||
France | — | 28,102,767 | — | 28,102,767 | ||||||||||||
Germany | 12,967,955 | 10,536,792 | — | 23,504,747 | ||||||||||||
Canada | 18,146,670 | — | — | 18,146,670 | ||||||||||||
Other Countries | 3,605,381 | 31,497,327 | — | 35,102,708 | ||||||||||||
| Mutual Funds | 28,609,652 | — | — | 28,609,652 | ||||||||||||
| Total | $426,574,536 | $290,481,636 | $— | $717,056,172 | ||||||||||||
For further information regarding security characteristics, see the Portfolio of Investments.
Of the level 2 investments presented above, equity investments amounting to $279,043,483 would have been considered level 1 investments at the beginning of the period. The primary reason for changes in the classifications between levels 1 and 2 occurs when foreign equity securities are fair valued using other observable market-based inputs in place of the closing exchange price due to events occurring after the close of the exchange or market on which the investment is principally traded. The fund’s foreign equity securities may often be valued using other observable market-based inputs. The fund’s policy is to recognize transfers between the levels as of the end of the period.
Foreign Currency Translation – Purchases and sales of foreign investments, income, and expenses are converted into U.S. dollars based upon currency exchange rates prevailing on the respective dates of such transactions or on the reporting date for foreign denominated receivables and payables. Gains and losses attributable to foreign currency exchange rates on sales of securities are recorded for financial statement purposes as net realized gains and losses on investments. Gains and losses attributable
to foreign exchange rate movements on receivables, payables, income and expenses are recorded for financial statement purposes as foreign currency transaction gains and
23
Table of Contents
Notes to Financial Statements (unaudited) – continued
losses. That portion of both realized and unrealized gains and losses on investments that results from fluctuations in foreign currency exchange rates is not separately disclosed.
Indemnifications – Under the fund’s organizational documents, its officers and Trustees may be indemnified against certain liabilities and expenses arising out of the performance of their duties to the fund. Additionally, in the normal course of business, the fund enters into agreements with service providers that may contain indemnification clauses. The fund’s maximum exposure under these agreements is unknown as this would involve future claims that may be made against the fund that have not yet occurred.
Investment Transactions and Income – Investment transactions are recorded on the trade date. Dividends received in cash are recorded on the ex-dividend date. Certain dividends from foreign securities will be recorded when the fund is informed of the dividend if such information is obtained subsequent to the ex-dividend date. Dividend payments received in additional securities are recorded on the ex-dividend date in an amount equal to the value of the security on such date.
The fund may receive proceeds from litigation settlements. Any proceeds received from litigation involving portfolio holdings are reflected in the Statement of Operations in realized gain/loss if the security has been disposed of by the fund or in unrealized gain/loss if the security is still held by the fund. Any other proceeds from litigation not related to portfolio holdings are reflected as other income in the Statement of Operations.
Tax Matters and Distributions – The fund intends to qualify as a regulated investment company, as defined under Subchapter M of the Internal Revenue Code, and to distribute all of its taxable income, including realized capital gains. As a result, no provision for federal income tax is required. The fund’s federal tax returns, when filed, will remain subject to examination by the Internal Revenue Service for a three year period. Management has analyzed the fund’s tax positions taken on federal and state tax returns for all open tax years and does not believe that there are any uncertain tax positions that require recognition of a tax liability. Foreign taxes, if any, have been accrued by the fund in the accompanying financial statements in accordance with the applicable foreign tax law. Foreign income taxes may be withheld by certain countries in which the fund invests. Additionally, capital gains realized by the fund on securities issued in or by certain foreign countries may be subject to capital gains tax imposed by those countries.
Distributions to shareholders are recorded on the ex-dividend date. Income and capital gain distributions are determined in accordance with income tax regulations, which may differ from U.S. generally accepted accounting principles. Certain capital accounts in the financial statements are periodically adjusted for permanent differences in order to reflect their tax character. These adjustments have no impact on net assets or net asset value per share. Temporary differences which arise from recognizing certain items of income, expense, gain or loss in different periods for financial statement and tax purposes will reverse at some time in the future. Distributions in excess of net investment income or net realized gains are temporary overdistributions for financial statement purposes resulting from differences in the recognition or classification of income or distributions for financial statement and tax purposes.
24
Table of Contents
Notes to Financial Statements (unaudited) – continued
Book/tax differences primarily relate to passive foreign investment companies, wash sale loss deferrals, and treating a portion of the proceeds from redemptions as a distribution for tax purposes.
The tax character of distributions made during the current period will be determined at fiscal year end. The tax character of distributions declared to shareholders for the last fiscal year is as follows:
| Year ended 8/31/17 | ||||
| Ordinary income (including any short-term capital gains) | $24,252,418 | |||
| Long-term capital gains | 22,703,151 | |||
| Total distributions | $46,955,569 | |||
The federal tax cost and the tax basis components of distributable earnings were as follows:
| As of 2/28/18 | ||||
| Cost of investments | $658,793,266 | |||
| Gross appreciation | 88,952,206 | |||
| Gross depreciation | (30,689,300 | ) | ||
| Net unrealized appreciation (depreciation) | $58,262,906 | |||
| As of 8/31/17 | ||||
| Undistributed ordinary income | 15,494,908 | |||
| Undistributed long-term capital gain | 6,404,883 | |||
| Other temporary differences | 14,831 | |||
| Net unrealized appreciation (depreciation) | 82,654,508 | |||
The aggregate cost above includes prior fiscal year end tax adjustments, if applicable.
Multiple Classes of Shares of Beneficial Interest – The fund offers multiple classes of shares, which differ in their respective distribution and service fees. The fund’s income, realized and unrealized gain (loss), and common expenses are allocated to shareholders based on the daily net assets of each class. Dividends are declared separately for each class. Differences in per share dividend rates are generally due to differences in separate class expenses. Class B shares will convert to Class A shares approximately eight years after purchase. Effective April 23, 2018, Class C shares will
25
Table of Contents
Notes to Financial Statements (unaudited) – continued
convert to Class A shares approximately ten years after purchase. The fund’s distributions declared to shareholders as reported in the Statements of Changes in Net Assets are presented by class as follows:
| From net investment income | From net realized gain | |||||||||||||||
| Six months ended 2/28/18 | Year ended 8/31/17 | Six months ended 2/28/18 | Year ended 8/31/17 | |||||||||||||
| Class A | $1,464,004 | $647,366 | $1,236,203 | $895,916 | ||||||||||||
| Class B | 34,679 | 58,757 | 35,994 | 90,730 | ||||||||||||
| Class C | 266,266 | 162,376 | 249,534 | 239,244 | ||||||||||||
| Class I | 3,224,078 | 1,870,859 | 2,542,638 | 2,466,592 | ||||||||||||
| Class R1 | 2,647 | 3,685 | 2,669 | 5,738 | ||||||||||||
| Class R2 | 59,568 | 16,658 | 50,420 | 22,626 | ||||||||||||
| Class R3 | 95,837 | 13,735 | 76,060 | 18,565 | ||||||||||||
| Class R4 | 60,867 | 50,810 | 47,568 | 66,760 | ||||||||||||
| Class R6 | 12,292,064 | 17,475,915 | 9,487,228 | 22,849,237 | ||||||||||||
| Total | $17,500,010 | $20,300,161 | $13,728,314 | $26,655,408 | ||||||||||||
(3) Transactions with Affiliates
Investment Adviser – The fund has an investment advisory agreement with MFS to provide overall investment management and related administrative services and facilities to the fund. The management fee is computed daily and paid monthly at the following annual rates based on the fund’s average daily net assets:
| Up to $1 billion | 0.90 | % | ||
| In excess of $1 billion and up to $2.5 billion | 0.75 | % | ||
| In excess of $2.5 billion | 0.65 | % |
MFS has agreed in writing to reduce its management fee by a specified amount if certain MFS mutual fund assets exceed thresholds agreed to by MFS and the fund’s Board of Trustees. For the six months ended February 28, 2018, this management fee reduction amounted to $30,378, which is included in the reduction of total expenses in the Statement of Operations. The management fee incurred for the six months ended February 28, 2018 was equivalent to an annual effective rate of 0.89% of the fund’s average daily net assets.
The investment adviser has agreed in writing to pay a portion of the fund’s total annual operating expenses, excluding interest, taxes, extraordinary expenses, brokerage and transaction costs, and investment-related expenses, such that total fund operating expenses do not exceed the following rates annually of each class’s average daily net assets:
| Classes | ||||||||||||||||||||||||||||||||
| A | B | C | I | R1 | R2 | R3 | R4 | R6 | ||||||||||||||||||||||||
| 1.35% | 2.10% | 2.10% | 1.10% | 2.10% | 1.60% | 1.35% | 1.10% | 1.05% | ||||||||||||||||||||||||
This written agreement will continue until modified by the fund’s Board of Trustees, but such agreement will continue at least until December 31, 2018. For the six months ended February 28, 2018, this reduction amounted to $117,006, which is included in the reduction of total expenses in the Statement of Operations.
26
Table of Contents
Notes to Financial Statements (unaudited) – continued
Distributor – MFS Fund Distributors, Inc. (MFD), a wholly-owned subsidiary of MFS, as distributor, received $16,608 for the six months ended February 28, 2018, as its portion of the initial sales charge on sales of Class A shares of the fund.
The Board of Trustees has adopted a distribution plan for certain share classes pursuant to Rule 12b-1 of the Investment Company Act of 1940.
The fund’s distribution plan provides that the fund will pay MFD for services provided by MFD and financial intermediaries in connection with the distribution and servicing of certain share classes. One component of the plan is a distribution fee paid to MFD and another component of the plan is a service fee paid to MFD. MFD may subsequently pay all, or a portion, of the distribution and/or service fees to financial intermediaries.
Distribution Plan Fee Table:
| Distribution Fee Rate (d) | Service Fee Rate (d) | Total Distribution Plan (d) | Annual Effective Rate (e) | Distribution and Service Fee | ||||||||||||||||
| Class A | — | 0.25% | 0.25% | 0.25% | $70,199 | |||||||||||||||
| Class B | 0.75% | 0.25% | 1.00% | 1.00% | 5,441 | |||||||||||||||
| Class C | 0.75% | 0.25% | 1.00% | 1.00% | 35,919 | |||||||||||||||
| Class R1 | 0.75% | 0.25% | 1.00% | 1.00% | 421 | |||||||||||||||
| Class R2 | 0.25% | 0.25% | 0.50% | 0.50% | 3,492 | |||||||||||||||
| Class R3 | — | 0.25% | 0.25% | 0.25% | 2,484 | |||||||||||||||
| Total Distribution and Service Fees | $117,956 | |||||||||||||||||||
| (d) | In accordance with the distribution plan for certain classes, the fund pays distribution and/or service fees equal to these annual percentage rates of each class’s average daily net assets. The distribution and service fee rates disclosed by class represent the current rates in effect at the end of the reporting period. Any rate changes, if applicable, are detailed below. |
| (e) | The annual effective rates represent actual fees incurred under the distribution plan for the six months ended February 28, 2018 based on each class’s average daily net assets. MFD has voluntarily agreed to rebate a portion of each class’s 0.25% service fee attributable to accounts for which MFD retains the 0.25% service fee except for accounts attributable to MFS or its affiliates’ seed money. For the six months ended February 28, 2018, this rebate amounted to $176 and $5 for Class A and Class C, respectively, and is included in the reduction of total expenses in the Statement of Operations. |
Certain Class A shares are subject to a contingent deferred sales charge (CDSC) in the event of a shareholder redemption within 18 months of purchase. Class C shares are subject to a CDSC in the event of a shareholder redemption within 12 months of purchase. Class B shares are subject to a CDSC in the event of a shareholder redemption within six years of purchase. All contingent deferred sales charges are paid to MFD and during the six months ended February 28, 2018, were as follows:
| Amount | ||||
| Class A | $307 | |||
| Class B | 711 | |||
| Class C | 751 | |||
Shareholder Servicing Agent – MFS Service Center, Inc. (MFSC), a wholly-owned subsidiary of MFS, receives a fee from the fund for its services as shareholder servicing agent calculated as a percentage of the average daily net assets of the fund as
27
Table of Contents
Notes to Financial Statements (unaudited) – continued
determined periodically under the supervision of the fund’s Board of Trustees. For the six months ended February 28, 2018, the fee was $9,302, which equated to 0.0026% annually of the fund’s average daily net assets. MFSC also receives payment from the fund for out-of-pocket expenses, sub-accounting and other shareholder servicing costs which may be paid to affiliated and unaffiliated service providers. Class R6 shares do not incur sub-accounting fees. For the six months ended February 28, 2018, these out-of-pocket expenses, sub-accounting and other shareholder servicing costs amounted to $80,439.
Under a Special Servicing Agreement among MFS, certain MFS funds which invest in other MFS funds (“MFS fund-of-funds”) and certain underlying funds in which a MFS fund-of-funds invests (“underlying funds”), each underlying fund may pay a portion of each MFS fund-of-funds’ transfer agent-related expenses, including sub-accounting fees payable to financial intermediaries, to the extent such payments do not exceed the benefits realized or expected to be realized by the underlying fund from the investment in the underlying fund by the MFS fund-of-funds. For the six months ended February 28, 2018, these costs for the fund amounted to $334,108 and are included in “Shareholder servicing costs” in the Statement of Operations.
Administrator – MFS provides certain financial, legal, shareholder communications, compliance, and other administrative services to the fund. Under an administrative services agreement, the fund reimburses MFS the costs incurred to provide these services. The fund is charged an annual fixed amount of $17,500 plus a fee based on average daily net assets. The administrative services fee incurred for the six months ended February 28, 2018 was equivalent to an annual effective rate of 0.0164% of the fund’s average daily net assets.
Trustees’ and Officers’ Compensation – The fund pays compensation to independent Trustees in the form of a retainer, attendance fees, and additional compensation to Board and Committee chairpersons. The fund does not pay compensation directly to Trustees or officers of the fund who are also officers of the investment adviser, all of whom receive remuneration for their services to the fund from MFS. Certain officers and Trustees of the fund are officers or directors of MFS, MFD, and MFSC.
Other – This fund and certain other funds managed by MFS (the funds) have entered into a service agreement (the ISO Agreement) which provides for payment of fees solely by the funds to Tarantino LLC in return for the provision of services of an Independent Senior Officer (ISO) for the funds. Frank L. Tarantino serves as the ISO and is an officer of the funds and the sole member of Tarantino LLC. The funds can terminate the ISO Agreement with Tarantino LLC at any time under the terms of the ISO Agreement. For the six months ended February 28, 2018, the fee paid by the fund under this agreement was $572 and is included in “Miscellaneous” expense in the Statement of Operations. MFS has agreed to bear all expenses associated with office space, other administrative support, and supplies provided to the ISO.
The fund invests in the MFS Institutional Money Market Portfolio which is managed by MFS and seeks current income consistent with preservation of capital and liquidity. This money market fund does not pay a management fee to MFS.
28
Table of Contents
Notes to Financial Statements (unaudited) – continued
On August 15, 2017, MFS redeemed 6,100 and 6,086 shares each of Class B and Class R2 for an aggregate amount of $106,938.
At February 28, 2018, MFS held approximately 57% of Class R1.
The fund is permitted to engage in purchase and sale transactions with funds and accounts for which MFS serves as investment adviser or sub-adviser (“cross-trades”) pursuant to a policy adopted by the Board of Trustees. This policy has been designed to ensure that cross-trades conducted by the fund comply with Rule 17a-7 under the Investment Company Act of 1940. During the six months ended February 28, 2018, the fund engaged in purchase transactions pursuant to this policy, which amounted to $841,555.
Effective January 3, 2018, the adviser has voluntarily undertaken to reimburse the fund from its own resources on a quarterly basis for the cost of investment research embedded in the cost of the fund’s securities trades. This agreement may be rescinded at any time. This reimbursement, if any, will be determined in arrears on a quarterly basis beginning with the quarter ending March 31, 2018.
(4) Portfolio Securities
For the six months ended February 28, 2018, purchases and sales of investments, other than short-term obligations, aggregated $128,986,012 and $63,152,865, respectively.
(5) Shares of Beneficial Interest
The fund’s Declaration of Trust permits the Trustees to issue an unlimited number of full and fractional shares of beneficial interest. Transactions in fund shares were as follows:
| Six months ended 2/28/18 | Year ended 8/31/17 | |||||||||||||||
| Shares | Amount | Shares | Amount | |||||||||||||
| Shares sold | ||||||||||||||||
Class A | 2,676,496 | $41,599,300 | 2,861,027 | $42,859,101 | ||||||||||||
Class B | 6,719 | 57,025 | 31,025 | 273,551 | ||||||||||||
Class C | 224,970 | 1,959,930 | 591,057 | 5,109,843 | ||||||||||||
Class I | 3,408,660 | 52,689,505 | 7,341,636 | 112,042,171 | ||||||||||||
Class R1 | 2,659 | 23,174 | 1,513 | 13,389 | ||||||||||||
Class R2 | 47,651 | 419,013 | 160,687 | 1,407,484 | ||||||||||||
Class R3 | 250,457 | 2,221,281 | 44,370 | 386,774 | ||||||||||||
Class R4 | 315,371 | 2,691,450 | 71,147 | 629,998 | ||||||||||||
Class R6 | 2,982,321 | 46,526,364 | 4,279,156 | 65,047,460 | ||||||||||||
| 9,915,304 | $148,187,042 | 15,381,618 | $227,769,771 | |||||||||||||
29
Table of Contents
Notes to Financial Statements (unaudited) – continued
| Six months ended 2/28/18 | Year ended 8/31/17 | |||||||||||||||
| Shares | Amount | Shares | Amount | |||||||||||||
| Shares issued to shareholders in reinvestment of distributions | ||||||||||||||||
Class A | 106,997 | $1,655,243 | 107,853 | $1,541,220 | ||||||||||||
Class B | 8,324 | 70,667 | 18,432 | 149,480 | ||||||||||||
Class C | 59,863 | 504,645 | 49,659 | 401,248 | ||||||||||||
Class I | 367,086 | 5,689,837 | 299,408 | 4,284,527 | ||||||||||||
Class R1 | 620 | 5,316 | 1,152 | 9,423 | ||||||||||||
Class R2 | 12,909 | 109,988 | 4,826 | 39,284 | ||||||||||||
Class R3 | 20,152 | 171,897 | 3,963 | 32,300 | ||||||||||||
Class R4 | 12,697 | 108,435 | 14,426 | 117,570 | ||||||||||||
Class R6 | 1,381,474 | 21,454,292 | 2,814,037 | 40,325,152 | ||||||||||||
| 1,970,122 | $29,770,320 | 3,313,756 | $46,900,204 | |||||||||||||
| Shares reacquired | ||||||||||||||||
Class A | (700,911 | ) | $(10,825,272 | ) | (1,667,666 | ) | $(25,830,621 | ) | ||||||||
Class B | (10,231 | ) | (86,587 | ) | (36,368 | ) | (318,692 | ) | ||||||||
Class C | (102,075 | ) | (868,806 | ) | (173,139 | ) | (1,502,619 | ) | ||||||||
Class I | (1,647,738 | ) | (25,141,177 | ) | (2,401,663 | ) | (36,403,406 | ) | ||||||||
Class R1 | (715 | ) | (6,437 | ) | (571 | ) | (4,966 | ) | ||||||||
Class R2 | (35,235 | ) | (304,714 | ) | (32,133 | ) | (280,551 | ) | ||||||||
Class R3 | (32,324 | ) | (278,953 | ) | (13,840 | ) | (119,297 | ) | ||||||||
Class R4 | (32,936 | ) | (278,482 | ) | (16,038 | ) | (140,856 | ) | ||||||||
Class R6 | (1,819,770 | ) | (28,473,782 | ) | (3,456,948 | ) | (53,041,082 | ) | ||||||||
| (4,381,935 | ) | $(66,264,210 | ) | (7,798,366 | ) | $(117,642,090 | ) | |||||||||
| Net change | ||||||||||||||||
Class A | 2,082,582 | $32,429,271 | 1,301,214 | $18,569,700 | ||||||||||||
Class B | 4,812 | 41,105 | 13,089 | 104,339 | ||||||||||||
Class C | 182,758 | 1,595,769 | 467,577 | 4,008,472 | ||||||||||||
Class I | 2,128,008 | 33,238,165 | 5,239,381 | 79,923,292 | ||||||||||||
Class R1 | 2,564 | 22,053 | 2,094 | 17,846 | ||||||||||||
Class R2 | 25,325 | 224,287 | 133,380 | 1,166,217 | ||||||||||||
Class R3 | 238,285 | 2,114,225 | 34,493 | 299,777 | ||||||||||||
Class R4 | 295,132 | 2,521,403 | 69,535 | 606,712 | ||||||||||||
Class R6 | 2,544,025 | 39,506,874 | 3,636,245 | 52,331,530 | ||||||||||||
| 7,503,491 | $111,693,152 | 10,897,008 | $157,027,885 | |||||||||||||
Class T shares were not publicly available for sale during the period. Please see the fund’s prospectus for details.
The fund is one of several mutual funds in which certain MFS funds may invest. The MFS funds do not invest in the underlying funds for the purpose of exercising management or control. At the end of the period, the MFS Growth Allocation Fund, the MFS Moderate Allocation Fund, the MFS Aggressive Growth Allocation Fund, the MFS Conservative Allocation Fund, the MFS Lifetime 2040 Fund, the MFS Lifetime 2030
30
Table of Contents
Notes to Financial Statements (unaudited) – continued
Fund, the MFS Lifetime 2050 Fund, the MFS Lifetime 2035 Fund, and the MFS Lifetime 2045 Fund were the owners of record of approximately 20%, 15%, 12%, 4%, 3%, 2%, 1%, 1%, and 1%, respectively, of the value of outstanding voting shares of the fund. In addition, the MFS Global Multi-Asset Fund, the MFS Lifetime Income Fund, the MFS Lifetime 2060 Fund, the MFS Lifetime 2055 Fund, the MFS Lifetime 2025 Fund, and the MFS Lifetime 2020 Fund were each the owners of record of less than 1% of the value of outstanding voting shares of the fund.
(6) Line of Credit
The fund and certain other funds managed by MFS participate in a $1.25 billion unsecured committed line of credit, subject to a $1 billion sublimit, provided by a syndication of banks under a credit agreement. Borrowings may be made for temporary financing needs. Interest is charged to each fund, based on its borrowings, generally at a rate equal to the higher of the Overnight Federal Reserve funds rate or daily one month LIBOR plus an agreed upon spread. A commitment fee, based on the average daily, unused portion of the committed line of credit, is allocated among the participating funds at the end of each calendar quarter. In addition, the fund and other funds managed by MFS have established unsecured uncommitted borrowing arrangements with certain banks for temporary financing needs. Interest is charged to each fund, based on its borrowings, at a rate equal to the Overnight Federal Reserve funds rate plus an agreed upon spread. For the six months ended February 28, 2018, the fund’s commitment fee and interest expense were $2,143 and $0, respectively, and are included in “Miscellaneous” expense in the Statement of Operations.
(7) Investments in Affiliated Issuers
An affiliated issuer may be considered one in which the fund owns 5% or more of the outstanding voting securities, or a company which is under common control. For the purposes of this report, the fund assumes the following to be affiliated issuers:
| Affiliated Issuers | Beginning Shares/Par Amount | Acquisitions Shares/Par Amount | Dispositions Shares/Par Amount | Ending Shares/Par Amount | ||||||||||||||||
| MFS Institutional Money Market Portfolio | 5,283,674 | 126,009,863 | (102,681,024 | ) | 28,612,513 | |||||||||||||||
| Affiliated Issuers | Realized Gain (Loss) | Change in Unrealized Appreciation (Depreciation) | Capital Gain Distributions | Dividend Income | Ending Value | |||||||||||||||
| MFS Institutional Money Market Portfolio | $(1,738 | ) | $149 | $— | $94,290 | $28,609,652 | ||||||||||||||
31
Table of Contents
PROXY VOTING POLICIES AND INFORMATION
MFS votes proxies on behalf of the fund pursuant to proxy voting policies and procedures that are available without charge, upon request, by calling 1-800-225-2606, by visiting mfs.com/proxyvoting, or by visiting the SEC’s Web site at http://www.sec.gov.
Information regarding how the fund voted proxies relating to portfolio securities during the most recent twelve-month period ended June 30 is available by August 31 of each year without charge by visiting mfs.com/proxyvoting, or by visiting the SEC’s Web site at http://www.sec.gov.
QUARTERLY PORTFOLIO DISCLOSURE
The fund will file a complete schedule of portfolio holdings with the Securities and Exchange Commission (the Commission) for the first and third quarters of each fiscal year on Form N-Q. A shareholder can obtain the quarterly portfolio holdings report at mfs.com. The fund’s Form N-Q is also available on the EDGAR database on the Commission’s Internet Web site at http://www.sec.gov, and may be reviewed and copied at the:
Public Reference Room
Securities and Exchange Commission
100 F Street, NE, Room 1580
Washington, D.C. 20549
Information on the operation of the Public Reference Room may be obtained by calling the Commission at 1-800-SEC-0330. Copies of the fund’s Form N-Q also may be obtained, upon payment of a duplicating fee, by electronic request at the following e-mail address: publicinfo@sec.gov or by writing the Public Reference Section at the above address.
From time to time, MFS may post important information about the fund or the MFS funds on the MFS web site (mfs.com). This information is available at https://www.mfs.com/en-us/what-we-do/announcements.html or at mfs.com/openendfunds by choosing the fund’s name.
32
Table of Contents
INFORMATION ABOUT FUND CONTRACTS AND LEGAL CLAIMS
The fund has entered into contractual arrangements with an investment adviser, administrator, distributor, shareholder servicing agent, 529 program manager (if applicable), and custodian who each provide services to the fund. Unless expressly stated otherwise, shareholders are not parties to, or intended beneficiaries of these contractual arrangements, and these contractual arrangements are not intended to create any shareholder right to enforce them against the service providers or to seek any remedy under them against the service providers, either directly or on behalf of the fund.
Under the Trust’s By-Laws and Declaration of Trust, any claims asserted against or on behalf of the MFS Funds, including claims against Trustees and Officers, must be brought in state and federal courts located within the Commonwealth of Massachusetts.
PROVISION OF FINANCIAL REPORTS AND SUMMARY PROSPECTUSES
The fund produces financial reports every six months and updates its summary prospectus and prospectus annually. To avoid sending duplicate copies of materials to households, only one copy of the fund’s annual and semiannual report and summary prospectus may be mailed to shareholders having the same last name and residential address on the fund’s records. However, any shareholder may contact MFSC (please see back cover for address and telephone number) to request that copies of these reports and summary prospectuses be sent personally to that shareholder.
33
Table of Contents
Save paper with eDelivery.
| MFS® will send you prospectuses, |

reports, and proxies directly via e-mail so you will get information faster with less mailbox clutter.
To sign up:
1. Go to mfs.com.
2. Log in via MFS® Access.
3. Select eDelivery.
If you own your MFS fund shares through a financial institution or a retirement plan, MFS® TALK, MFS® Access, or eDelivery may not be available to you.
WEB SITE
mfs.com
MFS TALK
1-800-637-8255
24 hours a day
ACCOUNT SERVICE AND LITERATURE
Shareholders
1-800-225-2606
Financial advisors
1-800-343-2829
Retirement plan services
1-800-637-1255
MAILING ADDRESS
MFS Service Center, Inc.
P.O. Box 55824
Boston, MA 02205-5824
OVERNIGHT MAIL
MFS Service Center, Inc.
c/o DST Asset Manager Solutions, Inc.
30 Dan Road
Canton, MA 02021-2809
Table of Contents
| ITEM 2. | CODE OF ETHICS. |
During the period covered by this report, the Registrant has not amended any provision in its Code of Ethics (the “Code”) that relates to an element of the Code’s definitions enumerated in paragraph (b) of Item 2 of this Form N-CSR. During the period covered by this report, the Registrant did not grant a waiver, including an implicit waiver, from any provision of the Code.
| ITEM 3. | AUDIT COMMITTEE FINANCIAL EXPERT. |
Not applicable for semi-annual reports.
| ITEM 4. | PRINCIPAL ACCOUNTANT FEES AND SERVICES. |
Not applicable for semi-annual reports.
| ITEM 5. | AUDIT COMMITTEE OF LISTED REGISTRANTS. |
Not applicable to the Registrant.
| ITEM 6. | INVESTMENTS |
A schedule of investments for the applicable series of the Registrant is included as part of the report to shareholders of such series under Item 1 of this Form N-CSR.
| ITEM 7. | DISCLOSURE OF PROXY VOTING POLICIES AND PROCEDURES FOR CLOSED-END MANAGEMENT INVESTMENT COMPANIES. |
Not applicable to the Registrant.
| ITEM 8. | PORTFOLIO MANAGERS OF CLOSED-END MANAGEMENT INVESTMENT COMPANIES. |
Not applicable to the Registrant.
| ITEM 9. | PURCHASES OF EQUITY SECURITIES BY CLOSED-END MANAGEMENT INVESTMENT COMPANY AND AFFILIATED PURCHASERS. |
Not applicable to the Registrant.
| ITEM 10. | SUBMISSION OF MATTERS TO A VOTE OF SECURITY HOLDERS. |
There were no material changes to the procedures by which shareholders may send recommendations to the Board for nominees to the Registrant’s Board since the Registrant last provided disclosure as to such procedures in response to the requirements of Item 407 (c)(2)(iv) of Regulation S-K or this Item.
Table of Contents
| ITEM 11. | CONTROLS AND PROCEDURES. |
| (a) | Based upon their evaluation of the effectiveness of the registrant’s disclosure controls and procedures (as defined in Rule 30a-3(c) under the Investment Company Act of 1940 (the “Act”)) as conducted within 90 days of the filing date of this report on Form N-CSR, the registrant’s principal financial officer and principal executive officer have concluded that those disclosure controls and procedures provide reasonable assurance that the material information required to be disclosed by the registrant on this report is recorded, processed, summarized and reported within the time periods specified in the Securities and Exchange Commission’s rules and forms. |
| (b) | There were no changes in the registrant’s internal controls over financial reporting (as defined in Rule 30a-3(d) under the Act) that occurred during the second fiscal quarter of the period covered by the report that have materially affected, or are reasonably likely to materially affect, the registrant’s internal control over financial reporting. |
| ITEM 12. | DISCLOSURE OF SECURITIES LENDING ACTIVITIES FOR CLOSED-END MANAGEMENT INVESTMENT COMPANIES. |
Not applicable to the Registrant.
| ITEM 13. | EXHIBITS. |
| (a) | File the exhibits listed below as part of this form. Letter or number the exhibits in the sequence indicated. |
| (1) | Any code of ethics, or amendment thereto, that is the subject of the disclosure required by Item 2, to the extent that the registrant intends to satisfy the Item 2 requirements through filing of an exhibit. |
| (2) | A separate certification for each principal executive officer and principal financial officer of the registrant as required by Rule 30a-2 under the Act (17 CFR 270.30a-2): Attached hereto. |
| (b) | If the report is filed under Section 13(a) or 15(d) of the Exchange Act, provide the certifications required by Rule 30a-2(b) under the Act (17 CFR 270.30a-2(b)), Rule 13a-14(b) or Rule 15d-14(b) under the Exchange Act (17 CFR 240.13a-14(b) or 240.15d-14(b)) and Section 1350 of Chapter 63 of Title 18 of the United States Code (18 U.S.C. 1350) as an exhibit. A certification furnished pursuant to this paragraph will not be deemed “filed” for the purposes of Section 18 of the Exchange Act (15 U.S.C. 78r), or otherwise subject to the liability of that section. Such certification will not be deemed to be incorporated by reference into any filing under the Securities Act of 1933 or the Exchange Act, except to the extent that the registrant specifically incorporates it by reference: Attached hereto. |
Table of Contents
Notice
A copy of the Amended and Restated Declaration of Trust, as amended, of the Registrant is on file with the Secretary of State of The Commonwealth of Massachusetts and notice is hereby given that this instrument is executed on behalf of the Registrant by an officer of the Registrant as an officer and not individually and the obligations of or arising out of this instrument are not binding upon any of the Trustees or shareholders individually, but are binding only upon the assets and property of the respective constituent series of the Registrant.
Table of Contents
SIGNATURES
Pursuant to the requirements of the Securities Exchange Act of 1934 and the Investment Company Act of 1940, the registrant has duly caused this report to be signed on its behalf by the undersigned, thereunto duly authorized.
(Registrant) MFS SERIES TRUST XIII
| By (Signature and Title)* | DAVID L. DILORENZO | |
| David L. DiLorenzo, President |
Date: April 13, 2018
Pursuant to the requirements of the Securities Exchange Act of 1934 and the Investment Company Act of 1940, this report has been signed below by the following persons on behalf of the registrant and in the capacities and on the dates indicated.
| By (Signature and Title)* | DAVID L. DILORENZO | |
| David L. DiLorenzo, President (Principal Executive Officer) |
Date: April 13, 2018
| By (Signature and Title)* | JAMES O. YOST | |
| James O. Yost, Treasurer (Principal Financial Officer and Accounting Officer) |
Date: April 13, 2018
| * | Print name and title of each signing officer under his or her signature. |