UNITED STATES
SECURITIES AND EXCHANGE COMMISSION
Washington, D.C. 20549
Washington, D.C. 20549
FORM N-CSR
CERTIFIED SHAREHOLDER REPORT OF REGISTERED
MANAGEMENT INVESTMENT COMPANIES
MANAGEMENT INVESTMENT COMPANIES
Investment Company Act file number: 811-03364
EMPOWER FUNDS, INC.
(Exact name of registrant as specified in charter)
8515 E. Orchard Road, Greenwood Village, Colorado 80111
(Address of principal executive offices)
(Address of principal executive offices)
Jonathan Kreider
President and Chief Executive Officer
Empower Funds, Inc.
Empower Funds, Inc.
8515 E. Orchard Road
Greenwood Village, Colorado 80111
(Name and address of agent for service)
Registrant's telephone number, including area code: (866) 831-7129
Date of fiscal year end: December 31
Date of reporting period: December 31, 2022
Item 1. REPORTS TO STOCKHOLDERS
EMPOWER FUNDS, INC.
Empower Multi-Sector Bond Fund (Formerly Great-West Multi-Sector Bond Fund)
(Institutional Class and Investor Class)
(Institutional Class and Investor Class)
Annual Report
December 31, 2022
This report and the financial statements attached are submitted for general information and are not authorized for distribution to prospective investors unless preceded or accompanied by an effective prospectus. Nothing herein is to be considered an offer of the sale of shares of the Fund. Such offering is made only by the prospectus of the Fund, which includes details as to offering price and other information.
Management Discussion
The Fund’s sub-advisers are Loomis, Sayles & Company, L.P. (“Loomis”) and Virtus Fixed Income Advisers, LLC (“Virtus”), formerly Newfleet Asset Management, LLC
Fund Performance
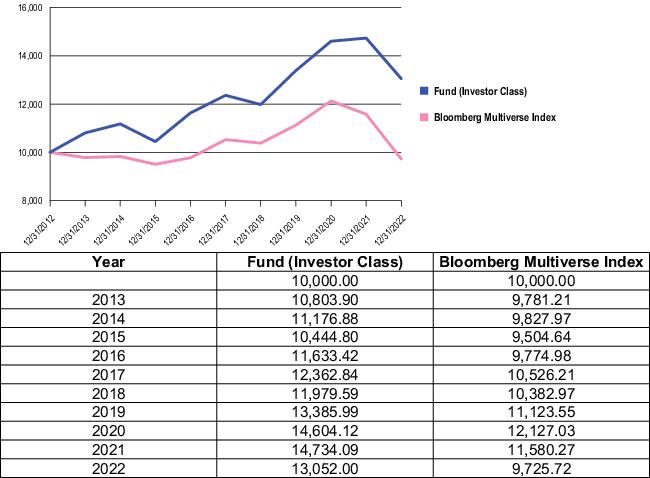
For the twelve-month period ended December 31, 2022, the Fund (Investor Class shares) returned -11.42%, relative to a -16.01% return for the Bloomberg Multiverse Index, the Fund’s benchmark index.
Loomis Commentary
The global bond market suffered pronounced weakness in 2022. Coming into the year, investors were already on edge as the investment community slowly began to understand that inflation would not be as “transitory” as initially expected. The outlook grew even more challenging after Russia’s invasion of Ukraine caused a jump in commodity prices and additional disruptions in global supply chains. Consumer price inflation (“CPI”) further increased as a result, with year-over-year gains of more than 8% in each monthly report of the second quarter. Inflation stayed elevated for the rest of the year before showing signs of cooling in the fourth quarter. Still, CPI remained above 7% in both the October and November reports, well above the Federal Reserve’s (the “Fed”) 2% target.
These developments prompted the Fed and other major central banks to tighten monetary policy aggressively. The Fed, in addition to ending its stimulative quantitative easing policy, raised interest rates at seven consecutive meetings from March onward. The benchmark fed funds rate, which stood in a range of 0% to 0.25% at the start of 2022, finished the year at 4.25% - 4.50%. This represented the most aggressive increase in short-term rates since the early 1980s.
The backdrop of high inflation and rising rates weighed heavily on U.S. Treasurys. The yield on the two-year note surged from 0.39% to 4.41% over the course of 2022, while the 10-year yield climbed from 1.44% to 3.88%. The Treasury market suffered its second consecutive year of negative returns in 2022 - the first time this has happened since 1958-59. One result of these moves was that the yield curve inverted significantly (meaning that short-term yields traded above those on longer-term debt), an unusual event that typically precedes a recession.
Investment grade corporate bonds posted a double-digit loss and lagged Treasurys. In addition to suffering from the uptrend in prevailing yields, corporates experienced a large increase in yield spreads relative to government debt. Rising spreads were the result of investors’ declining appetite for risk and concerns about the impact slowing economic growth could have on corporations’ earnings and balance sheets.
High yield bonds, while finishing 2022 in the red, outperformed U.S. Treasurys and other segments of the investment grade market. The category was helped by its higher income, lower interest rate sensitivity, and a relatively large representation of the energy sector. Senior loans, which experienced elevated demand due to their floating rate feature, were the best performing segment of the fixed income market for the year with a return just below the break-even mark.
Securitized assets - including agency mortgage-backed securities (“MBS”), asset-backed securities (“ABS”), and commercial mortgage-backed securities (“CMBS”) - posted negative total returns but
outperformed the broader U.S. bond market due to the category’s shorter duration (lower interest rate sensitivity). ABS, particularly credit card and auto ABS, were the strongest performer among securitized assets due to their higher quality, better liquidity, and shorter duration.
Emerging market bonds underperformed the U.S. due to the combination of growth fears, investors’ increased aversion to risk, the conflict in Ukraine, and negative headlines out of China. U.S.-based investors were also hurt by a meaningful decline in emerging market currencies in relation to the U.S. dollar.
Our shorter-than-benchmark duration stance boosted excess performance as yields rose throughout the year. Securitized, convertibles, and non-U.S. dollar sectors were the top contributors.
On an excess basis, securitized markets positively contributed to performance as the sector generated the greatest returns within the strategy. Exposure across the ABS other, car loan, and home equity names moderately aided excess return.
Our allocation to convertibles positively impacted performance during the year. Select exposure to consumer non-cyclical names modestly helped excess return.
The exposure to non-U.S. dollar denominated issues generated positive return during the year. Our holdings denominated in the Brazilian real, Mexican peso, and Indian rupee were the best performers within the allocation.
Our overweight exposure to emerging market credit detracted from overall performance for the period. Security selection subtracted most in this sector.
Our exposure within investment grade credit reduced return in the sector. Security selection subtracted most in this sector.
The overweight allocation to high yield credit limited performance for the year. On an absolute basis, performance in the sector had the greatest negative impact in the strategy. Security selection had the most negative effect in this sector.
Virtus Commentary
Central banks embarked on the first meaningful tightening of monetary policy in several years in response to elevated inflation during the period. Their messaging has been consistent: they will stay focused on returning high inflation levels to target. The backdrop clouded the outlook for global and regional economies, with the probability of recession rising. This has resulted in negative total returns for most assets. The pandemic is still a global issue, with China’s zero-Covid policy continuing to delay the normalization of supply chains, though the rigid policy is expected to ease in the coming months. Meanwhile, the war between Russia and Ukraine is an ongoing economic shock to food and energy prices. These unresolved issues make economic forecasting and modeling a challenge and will likely contribute to a volatile investing environment for the next several quarters.
The Fed and other major central bank rhetoric shifted sharply hawkish in response to elevated inflation measures. The Fed raised its main policy rate 425 basis points (“bps”) during the fiscal year including four jumbo moves of 75 bps each and indicated its resolve to restore price stability. The Fed began to shrink its $8.9 trillion dollar balance sheet and increased the pace of run-off in September. While we still expect this to be a largely passive exercise, the market is watching for signs that the Fed may be open to selling off its MBS when caps are not met. The European Central Bank (“ECB”) also joined the
inflation fight and raised its policy rate to 250 bps over four meetings, marking the first increases off zero since 2016. In addition to managing the start of its own balance sheet run-off, the ECB will have to manage the complex task of preventing financial fragmentation among its member countries. The Bank of Japan is still a relative dove given local economic conditions, but it remains to be seen how much yen weakness will be tolerated, given the policy divergences. Global central banks have a complicated task ahead, but we are confident in their ability to contain inflation.
In the twelve-month period ended December 31, 2022, volatility in the fixed income markets increased both due to a more hawkish Fed policy and the Russian invasion of Ukraine. U.S. Treasuries generally outperformed spread sectors on an excess return basis. With the spike in U.S. Treasury yields, less interest rate-sensitive sectors such as high yield bank loans, and other shorter-duration asset classes, including ABS, generally outperformed on a total return basis.
Over the last twelve months the U.S Treasury curve shifted higher with the largest increase on the front end, resulting in an inverted yield curve.
Positive contributors included:
| • | Underweight Foreign Currencies: The Virtus sub-advised portion of the Fund’s (“Virtus portfolio”) underweight to foreign currencies relative to the benchmark index had the largest magnitude of positive impact to the Virtus portfolio’s outperformance in the 1-year period. |
| • | Shorter Duration: The Virtus portfolio’s shorter duration versus the Bloomberg Barclays Multiverse unhedged Index had a positive impact during the period of rising rates and widening spreads across all sectors. |
| • | High Yield Bank Loans: Issue selection within high yield bank loans had a positive impact on performance. As investor angst increases around slowing growth and its impact on credit markets, our current up-in-quality position has performed well. |
| • | ABS: Allocation to and issue selection within ABS had a positive impact on performance during the period. We’ve seen some softening in consumer fundamentals. However, low unemployment and a high number of job openings mitigate the effects of higher rates on the consumer. Workers continued to benefit from wage gains, especially for the lower quintile of earners. Our emphasis continues to be on the front end of the yield curve, where we look to put dollars to work in investment grade amortizing assets and in deal structures that lead to de-leveraging. |
Detractors included:
| • | Underweight U.S. Treasuries: The Virtus portfolio’s underweight to U.S. Treasuries had a negative impact during the year as most sectors underperformed U.S. Treasuries on an excess return basis. |
| • | Emerging Markets (“EM”) High Yield: Positioning within EM high yield had a negative impact on performance during the period. The drivers, still very much macro in nature, included the Fed’s inflation fighting path, China easing its zero-Covid stance, and, to a lesser extent, the war in Ukraine. |
| • | Corporate High Yield: Allocation and issue selection within corporate high yield had a negative impact on performance. Factors that have plagued the market throughout the year causing spreads to widen include the war in Ukraine, supply chain issues, and rising U.S. Treasury yields as the market tries to handicap levers the Fed will pull to quell inflation. |
Sector Changes: Over the year, we primarily reduced exposure to high yield bank loans, corporate high yield, and emerging markets high yield securities. We redeployed the sale proceeds primarily into corporate investment grade and U.S. Treasury securities.
EM Debt and Non-U.S. Exposure: Our exposure was lower over the year. Within the space, high yield EM outperformed investment grade. We continued to execute relative value swaps within curves, credit buckets, and between sovereigns and quasi-sovereigns as relative value dictates. While we feel as though U.S. dollar strength has peaked, we have not yet added non-U.S. dollar exposure to the Virtus portfolio. Our exposure to EM has stayed at historically low levels.
Corporate Investment Grade: After declining more than 20% at the lows, the investment grade market rallied in the fourth quarter of 2022, with total returns of 3.63%. The full year total return of -15.76% is still the worst on record. Spreads rallied 25 bps up to the 130s, a level that hits the 75th percentile over a five-year range, but just 10 bps north of the five-year average. Yields are still at post-global financial crisis (“GFC”) highs, though they compressed more than 80 bps off the year-to-date highs. As fundamentals improved throughout the post-Covid period and interest coverage levels stay at decade highs, we are constructive on the asset class. Higher rates will have minimal immediate impact to issuer fundamentals because the average maturity is over eleven years in length. We are overweight financials and commodities and find banks to be the most attractive industry. We are positioned with an overweight to the BBB segment of the market because we are constructive on the market’s fundamentals, and view fallen angel risk as broadly low.
Corporate High Yield: While maintaining a meaningful allocation, we reduced high yield exposure over the year. The high yield market finished the year -11.2% with CCC’s significantly lagging. Our 2023 outlook for high yield is cautious, we view recession risk as material given the Fed continues its hawkish path to reduce inflation. Parts of the economy are already slowing due to interest rate hikes, with housing being the main example. Despite credit spreads being wide of average levels, they remain well inside of recessionary levels, so we remain cautious on the asset class. The largest meaningful counterpoint to a cautious view would be the resilience of credit fundamentals, which remain at strong levels. Aggregate leverage is below pre-Covid levels for high yield bonds, with net leverage in an even stronger position as companies hold onto cash raised during Covid. The technical environment remains neutral. 2022 saw large outflows, but very limited new issuance. Our allocation remains below our long-term average. In 2023, we will stay responsive to developments on the macro side, since data on inflation, growth and housing will continue to play key roles in the overall direction of the market. Beyond the macro, there are many storylines across several industries that offer opportunities to generate outperformance.
Securitized: We see yield opportunities not seen in many years. In the near term, low unemployment, strong consumer savings, and real wage growth suggest that the U.S. consumer will stay timely with its debt service payments. However, we are selective with our transactions, as we believe unemployment will tick higher, which may result in higher consumer delinquencies. We believe the risk/reward of higher quality, short duration securitized products is extremely attractive. Most securitized products we invest in are being scrutinized using the GFC as a measure, and our thesis continues to be driven by good fundamentals. On the mortgage side, delinquencies are at historical lows, with limited to no affordability products compared to the market in the last housing crisis. With higher mortgage rates and a subsequent fall in housing activity, we will see less supply for the new year. This should set up a favorable technical for the MBS market. As a result, the Virtus portfolio has an overweight to the sector.
The views and opinions in this report were current as of December 31, 2022 and are subject to change at any time. They are not guarantees of performance or investment results and should not be taken as investment advice. Fund holdings are subject to change at any time. Fund returns are net of fees unless otherwise noted.
Growth of $10,000 (unaudited)
This graph compares the value of a hypothetical $10,000 investment in the Fund over the past 10 fiscal year periods or since inception (for funds lacking 10-year records) with the performance of the Fund’s benchmark index. Results include the reinvestment of all dividends and capital gains distributions. Past performance is no guarantee of future results. The graph does not reflect the deduction of taxes that a shareholder would pay on Fund distributions or the redemption of Fund shares. Performance does not include any fees or expenses of variable insurance contracts, individual retirement accounts (“IRA(s)”), qualified retirement plans or college savings programs. If such fees and expenses were included, returns would be lower.
Note: Performance for the Institutional Class shares may vary due to their differing fee structure. See returns table below.
Average Annual Total Returns for the Periods Ended December 31, 2022 (unaudited)
| One Year | Five Year | Ten Year / Since Inception(a) | |
| Institutional Class | -11.06% | 1.44% | 2.28% |
| Investor Class | -11.42% | 1.09% | 2.70% |
| (a) Institutional Class inception date was May 1, 2015. |
Results include the reinvestment of all dividends and capital gains distributions. Past performance is no guarantee of future results. The table does not reflect the deduction of taxes that a shareholder would pay on Fund distributions or the redemption of Fund shares. Performance does not include any fees or expenses of variable insurance contracts, IRAs, qualified retirement plans or college savings programs. If such fees and expenses were included, returns would be lower.
Summary of Investments by Ratings as of December 31, 2022 (unaudited)
| Rating | Percentage of Fund Investments |
| Aaa | 16.84% |
| Aa1 | 0.48 |
| Aa2 | 0.66 |
| Aa3 | 0.91 |
| A1 | 1.95 |
| A2 | 1.54 |
| A3 | 1.10 |
| Baa1 | 2.48 |
| Baa2 | 10.16 |
| Baa3 | 11.28 |
| Ba1 | 4.67 |
| Ba2 | 4.14 |
| Ba3 | 3.26 |
| B1 | 2.65 |
| B2 | 2.39 |
| B3 | 2.59 |
| CCC, CC, C | 3.10 |
| Equities | 0.80 |
| Not Rated | 14.64 |
| Short Term Investments | 14.36 |
| Total | 100.00% |
Shareholder Expense Example (unaudited)
As a shareholder of the Fund, you incur two types of costs: (1) transaction costs, and (2) ongoing costs, including management fees and other Fund expenses. This Example is intended to help you understand your ongoing costs (in dollars) of investing in the Fund and to compare these costs with the ongoing costs of investing in other mutual funds.
The Example is based on an investment of $1,000 invested at the beginning of the period and held for the entire period (July 1, 2022 to December 31, 2022).
Actual Expenses
The first row of the table below provides information about actual account values and actual expenses. You may use the information in this row, together with the amount you invested, to estimate the expenses that you paid over the period. Simply divide your account value by $1,000 (for example, an $8,600 account value divided by $1,000 = 8.6), then multiply the result by the number in the first row under the heading entitled “Expenses Paid During Period” to estimate the expenses you paid on your account during this period.
Hypothetical Example for Comparison Purposes
The second row of the table below provides information about hypothetical account values and hypothetical expenses based on the Fund’s actual expense ratio and an assumed rate of return of 5% per year before expenses, which is not the Fund’s actual return. The hypothetical account values and expenses may not be used to estimate the actual ending account balance or expenses you paid for the period. You may use this information to compare the ongoing costs of investing in the Fund and other funds. To do so, compare this 5% hypothetical example with the 5% hypothetical examples that appear in the shareholder reports of the other funds.
Please note that the expenses shown in the table are meant to highlight your ongoing costs only and do not reflect any transactional costs. Therefore, the second row of the table is useful in comparing ongoing costs only, and will not help you determine the relative total costs of owning different funds. In addition, if these transactional costs were included, your costs would have been higher.
| Beginning Account Value | Ending Account Value | Expenses Paid During Period* | |||
| (07/01/22) | (12/31/22) | (07/01/22 – 12/31/22) | |||
| Institutional Class | |||||
| Actual | $1,000.00 | $ 997.98 | $2.77 | ||
| Hypothetical (5% return before expenses) | $1,000.00 | $1,022.43 | $2.80 | ||
| Investor Class | |||||
| Actual | $1,000.00 | $ 995.83 | $4.53 | ||
| Hypothetical (5% return before expenses) | $1,000.00 | $1,020.67 | $4.58 |
| * Expenses are equal to the Fund's annualized expense ratio of 0.55% for the Institutional Class shares and 0.90% for the Investor Class shares, multiplied by the average account value over the period, multiplied by 184/365 days to reflect the one-half year period. Performance does not include any fees or expenses of variable insurance contracts, IRAs, qualified retirement plans or college savings programs, if applicable. If such fees or expenses were included, returns would be lower. |
EMPOWER FUNDS, INC.
EMPOWER MULTI-SECTOR BOND FUND
Schedule of Investments
As of December 31, 2022
| Principal Amount(a) | Fair Value | |
| ASSET-BACKED SECURITIES | ||
| Non-Agency — 12.65% | ||
| ACC Trust(b) | ||
| Series 2021-1 Class C | ||
| $ 830,000 | 2.08%, 12/20/2024 | $ 813,416 |
| Series 2022-1 Class C | ||
| 1,015,000 | 3.24%, 10/20/2025 | 968,117 |
| 100,000 | Affirm Asset Securitization Trust(b) Series 2021-B Class C 1.40%, 08/17/2026 | 90,894 |
| 455,000 | Aimco Ltd(b)(c) Series 2020-12A Class AR 5.03%, 01/17/2032 3-mo. SOFR + 1.17% | 446,243 |
| American Credit Acceptance Receivables Trust(b) | ||
| Series 2019-3 Class D | ||
| 170,886 | 2.89%, 09/12/2025 | 169,901 |
| Series 2022-1 Class D | ||
| 200,000 | 2.46%, 03/13/2028 | 179,949 |
| Series 2022-1 Class E | ||
| 855,000 | 3.64%, 03/13/2028 | 701,997 |
| Series 2022-4 Class C | ||
| 100,000 | 7.86%, 02/15/2029 | 101,265 |
| AmeriCredit Automobile Receivables Trust | ||
| Series 2019-2 Class D | ||
| 720,000 | 2.99%, 06/18/2025 | 701,091 |
| Series 2019-3 Class D | ||
| 330,000 | 2.58%, 09/18/2025 | 317,277 |
| Series 2020-3 Class D | ||
| 85,000 | 1.49%, 09/18/2026 | 78,537 |
| AMSR Trust(b) | ||
| Series 2020-SFR2 Class D | ||
| 540,000 | 3.28%, 07/17/2037 | 492,250 |
| Series 2021-SFR2 Class C | ||
| 150,000 | 1.88%, 08/17/2038 | 126,762 |
| Series 2021-SFR3 Class D | ||
| 520,000 | 2.18%, 10/17/2038 | 435,338 |
| Aqua Finance Trust(b) | ||
| Series 2019-A Class A | ||
| 207,611 | 3.14%, 07/16/2040 | 195,471 |
| Series 2019-A Class C | ||
| 970,000 | 4.01%, 07/16/2040 | 891,728 |
| Series 2020-AA Class D | ||
| 620,000 | 7.15%, 07/17/2046 | 533,093 |
| Series 2021-A Class B | ||
| 110,000 | 2.40%, 07/17/2046 | 92,595 |
| 752,675 | Arbys Funding LLC(b) Series 2020-1A Class A2 3.24%, 07/30/2050 | 636,135 |
| 865,000 | Avant Credit Card Master Trust(b) Series 2021-1A Class A 1.37%, 04/15/2027 | 791,366 |
| Avid Automobile Receivables Trust(b) | ||
| Series 2019-1 Class C | ||
| 1,013,229 | 3.14%, 07/15/2026 | 1,008,096 |
| Principal Amount(a) | Fair Value | |
| Non-Agency — (continued) | ||
| Series 2019-1 Class D | ||
| $ 715,000 | 4.03%, 07/15/2026 | $ 709,523 |
| Series 2021-1 Class E | ||
| 345,000 | 3.39%, 04/17/2028 | 305,754 |
| Avis Budget Rental Car Funding AESOP LLC(b) | ||
| Series 2019-2A Class A | ||
| 105,000 | 3.35%, 09/22/2025 | 101,449 |
| Series 2019-2A Class D | ||
| 1,130,000 | 3.04%, 09/22/2025 | 1,030,130 |
| Series 2020-1A Class B | ||
| 105,000 | 2.68%, 08/20/2026 | 94,986 |
| Series 2020-2A Class A | ||
| 495,000 | 2.02%, 02/20/2027 | 448,584 |
| Series 2020-2A Class B | ||
| 205,000 | 2.96%, 02/20/2027 | 183,959 |
| Series 2020-2A Class C | ||
| 145,000 | 4.25%, 02/20/2027 | 129,453 |
| Series 2021-2A Class C | ||
| 160,000 | 2.35%, 02/20/2028 | 132,311 |
| 615,000 | BHG Securitization Trust(b) Series 2022-A Class B 2.70%, 02/20/2035 | 534,541 |
| 190,000 | Brex Commercial Charge Card Master Trust(b) Series 2021-1 Class A 2.09%, 07/15/2024 | 187,939 |
| Business Jet Securities LLC(b) | ||
| Series 2020-1A Class A | ||
| 66,283 | 2.98%, 11/15/2035 | 60,373 |
| Series 2021-1A Class B | ||
| 74,594 | 2.92%, 04/15/2036 | 63,222 |
| 856,950 | Cajun Global LLC(b) Series 2021-1 Class A2 3.93%, 11/20/2051 | 725,764 |
| 372,025 | CAL Funding IV Ltd(b) Series 2020-1A Class A 2.22%, 09/25/2045 | 321,455 |
| CarMax Auto Owner Trust | ||
| Series 2019-3 Class D | ||
| 320,000 | 2.85%, 01/15/2026 | 310,632 |
| Series 2020-1 Class D | ||
| 240,000 | 2.64%, 07/15/2026 | 230,954 |
| Series 2020-3 Class D | ||
| 200,000 | 2.53%, 01/15/2027 | 187,428 |
| Series 2020-4 Class D | ||
| 175,000 | 1.75%, 04/15/2027 | 159,718 |
| Series 2022-1 Class D | ||
| 100,000 | 2.47%, 07/17/2028 | 87,027 |
| Carvana Auto Receivables Trust | ||
| Series 2019-3A Class E | ||
| 815,000 | 4.60%, 07/15/2026(b) | 782,474 |
| Series 2021-P4 Class C | ||
| 135,000 | 2.33%, 02/10/2028 | 110,974 |
| 549,523 | CF Hippolyta LLC(b) Series 2020-1 Class A1 1.69%, 07/15/2060 | 490,500 |
See Notes to Financial Statements.
Annual Report - December 31, 2022
EMPOWER FUNDS, INC.
EMPOWER MULTI-SECTOR BOND FUND
Schedule of Investments
As of December 31, 2022
| Principal Amount(a) | Fair Value | |
| Non-Agency — (continued) | ||
| $ 331,525 | CLI Funding VI LLC(b) Series 2020-3A Class A 2.07%, 10/18/2045 | $ 287,740 |
| 174,769 | CLI Funding VIII LLC(b) Series 2021-1A Class A 1.64%, 02/18/2046 | 149,021 |
| College Ave Student Loans LLC(b) | ||
| Series 2021-A Class C | ||
| 110,000 | 2.92%, 07/25/2051 | 98,688 |
| Series 2021-C Class D | ||
| 100,000 | 4.11%, 07/26/2055 | 77,875 |
| Commonbond Student Loan Trust(b) | ||
| Series 2019-AGS Class B | ||
| 127,004 | 3.04%, 01/25/2047 | 106,567 |
| Series 2020-1 Class A | ||
| 144,538 | 1.69%, 10/25/2051 | 128,196 |
| Conn's Receivables Funding LLC(b) | ||
| Series 2021-A Class B | ||
| 952,000 | 2.87%, 05/15/2026 | 935,119 |
| Series 2022-A Class B | ||
| 800,000 | 9.52%, 12/15/2026 | 793,351 |
| CoreVest American Finance Trust(b) | ||
| Series 2019-3 Class A | ||
| 199,411 | 2.71%, 10/15/2052 | 186,742 |
| Series 2019-3 Class B | ||
| 145,000 | 3.16%, 10/15/2052 | 122,766 |
| Series 2019-3 Class C | ||
| 235,000 | 3.27%, 10/15/2052 | 193,505 |
| Series 2020-2 Class C | ||
| 100,000 | 4.60%, 05/15/2052(d) | 92,071 |
| Series 2021-1 Class C | ||
| 105,000 | 2.80%, 04/15/2053 | 80,773 |
| Series 2021-2 Class C | ||
| 205,000 | 2.48%, 07/15/2054 | 149,873 |
| Series 2021-3 Class D | ||
| 105,000 | 3.47%, 10/15/2054 | 79,394 |
| 30,084 | CPS Auto Receivables Trust(b) Series 2020-C Class C 1.71%, 08/17/2026 | 29,893 |
| Credit Acceptance Auto Loan Trust(b) | ||
| Series 2019-3A Class C | ||
| 275,000 | 3.06%, 03/15/2029 | 273,395 |
| Series 2020-2A Class C | ||
| 250,000 | 2.73%, 11/15/2029 | 242,522 |
| Series 2020-3A Class C | ||
| 290,000 | 2.28%, 02/15/2030 | 273,280 |
| Series 2021-2A Class C | ||
| 250,000 | 1.64%, 06/17/2030 | 225,705 |
| Series 2021-3A Class C | ||
| 250,000 | 1.63%, 09/16/2030 | 225,394 |
| DB Master Finance LLC(b) | ||
| Series 2017-1A Class A2II | ||
| 157,163 | 4.03%, 11/20/2047 | 142,859 |
| Series 2019-1A Class A23 | ||
| 261,225 | 4.35%, 05/20/2049 | 238,181 |
| Principal Amount(a) | Fair Value | |
| Non-Agency — (continued) | ||
| Series 2021-1A Class A2II | ||
| $ 475,200 | 2.49%, 11/20/2051 | $ 390,580 |
| Dell Equipment Finance Trust(b) | ||
| Series 2020-2 Class C | ||
| 100,000 | 1.37%, 01/22/2024 | 98,018 |
| Series 2020-2 Class D | ||
| 105,000 | 1.92%, 03/23/2026 | 103,054 |
| 610,000 | Dext LLC(b) Series 2020-1 Class D 7.21%, 02/15/2028 | 570,526 |
| 273,000 | Diamond Resorts Owner Trust(b) Series 2021-1A Class B 2.05%, 11/21/2033 | 247,576 |
| Domino's Pizza Master Issuer LLC(b) | ||
| Series 2017-1A Class A23 | ||
| 328,612 | 4.12%, 07/25/2047 | 301,149 |
| Series 2018-1A Class A2II | ||
| 67,200 | 4.33%, 07/25/2048 | 62,133 |
| Series 2019-1A Class A2 | ||
| 334,540 | 3.67%, 10/25/2049 | 288,989 |
| Series 2021-1A Class A2I | ||
| 783,075 | 2.66%, 04/25/2051 | 651,269 |
| DT Auto Owner Trust(b) | ||
| Series 2019-3A Class D | ||
| 134,572 | 2.96%, 04/15/2025 | 132,814 |
| Series 2021-2A Class D | ||
| 155,000 | 1.50%, 02/16/2027 | 142,262 |
| Series 2022-1A Class D | ||
| 545,000 | 3.40%, 12/15/2027 | 496,015 |
| 157,213 | Education Funding Trust Trust(b) Series 2020-A Class A 2.79%, 07/25/2041 | 145,017 |
| 116,684 | EDvestinU Private Education Loan Issue No 3 LLC(b) Series 2021-A Class A 1.80%, 11/25/2045 | 98,484 |
| 71,324 | Elara HGV Timeshare Issuer LLC(b) Series 2021-A Class C 2.09%, 08/27/2035 | 62,432 |
| ELFI Graduate Loan Program LLC(b) | ||
| Series 2019-A Class A | ||
| 146,200 | 2.54%, 03/25/2044 | 133,336 |
| Series 2021-A Class B | ||
| 84,388 | 2.09%, 12/26/2046(d) | 72,234 |
| Exeter Automobile Receivables Trust | ||
| Series 2019-1A Class D | ||
| 284,316 | 4.13%, 12/16/2024(b) | 283,930 |
| Series 2019-4A Class D | ||
| 776,037 | 2.58%, 09/15/2025(b) | 763,012 |
| Series 2020-2A Class D | ||
| 305,000 | 4.73%, 04/15/2026(b) | 301,928 |
| Series 2022-2A Class D | ||
| 100,000 | 4.56%, 07/17/2028 | 93,711 |
See Notes to Financial Statements.
Annual Report - December 31, 2022
EMPOWER FUNDS, INC.
EMPOWER MULTI-SECTOR BOND FUND
Schedule of Investments
As of December 31, 2022
| Principal Amount(a) | Fair Value | |
| Non-Agency — (continued) | ||
| Series 2022-6A Class C | ||
| $ 110,000 | 6.32%, 05/15/2028 | $ 110,050 |
| 820,000 | FAT Brands Royalty LLC(b) Series 2021-1A Class A2 4.75%, 04/25/2051 | 795,243 |
| First Investors Auto Owner Trust(b) | ||
| Series 2019-2A Class D | ||
| 120,000 | 2.80%, 12/15/2025 | 116,611 |
| Series 2022-1A Class D | ||
| 200,000 | 3.79%, 06/15/2028 | 181,014 |
| Series 2022-2A Class D | ||
| 145,000 | 8.71%, 10/16/2028 | 145,955 |
| FirstKey Homes Trust(b) | ||
| Series 2020-SFR1 Class B | ||
| 270,000 | 1.74%, 08/17/2037 | 241,207 |
| Series 2020-SFR1 Class D | ||
| 200,000 | 2.24%, 08/17/2037 | 177,926 |
| Series 2020-SFR1 Class E | ||
| 100,000 | 2.79%, 08/17/2037 | 89,276 |
| Series 2020-SFR2 Class D | ||
| 775,000 | 1.97%, 10/19/2037 | 678,814 |
| Series 2021-SFR1 Class D | ||
| 1,015,000 | 2.19%, 08/17/2038 | 852,048 |
| Series 2021-SFR1 Class E1 | ||
| 335,000 | 2.39%, 08/17/2038 | 279,323 |
| Series 2021-SFR2 Class E1 | ||
| 180,000 | 2.26%, 09/17/2038 | 149,148 |
| Series 2021-SFR2 Class E2 | ||
| 140,000 | 2.36%, 09/17/2038 | 115,029 |
| Series 2022-SFR2 Class D | ||
| 205,000 | 4.50%, 07/17/2039 | 179,623 |
| Flagship Credit Auto Trust(b) | ||
| Series 2019-3 Class D | ||
| 210,000 | 2.86%, 12/15/2025 | 201,961 |
| Series 2019-4 Class D | ||
| 385,000 | 3.12%, 01/15/2026 | 369,114 |
| Series 2020-1 Class D | ||
| 645,000 | 2.48%, 03/16/2026 | 606,541 |
| Series 2020-4 Class D | ||
| 240,000 | 2.18%, 02/16/2027 | 224,823 |
| Series 2021-2 Class D | ||
| 210,000 | 1.59%, 06/15/2027 | 187,034 |
| 230,000 | Foursight Capital Automobile Receivables Trust(b) Series 2021-2 Class D 1.92%, 09/15/2027 | 212,553 |
| Freedom Financial Trust(b) | ||
| Series 2021-2 Class C | ||
| 100,000 | 1.94%, 06/19/2028 | 97,075 |
| Series 2021-3FP Class D | ||
| 255,000 | 2.37%, 11/20/2028 | 232,001 |
| Series 2022-1FP Class D | ||
| 165,000 | 3.35%, 03/19/2029 | 152,750 |
| FRTKL Trust(b) | ||
| Series 2021-SFR1 Class E1 | ||
| 100,000 | 2.37%, 09/17/2038 | 83,167 |
| Series 2021-SFR1 Class E2 | ||
| 100,000 | 2.52%, 09/17/2038 | 82,936 |
| Principal Amount(a) | Fair Value | |
| Non-Agency — (continued) | ||
| GLS Auto Receivables Issuer Trust(b) | ||
| Series 2019-4A Class C | ||
| $ 841,124 | 3.06%, 08/15/2025 | $ 829,325 |
| Series 2019-4A Class D | ||
| 1,545,000 | 4.09%, 08/17/2026 | 1,482,521 |
| Series 2020-1A Class C | ||
| 340,000 | 2.72%, 11/17/2025 | 335,005 |
| Series 2020-3A Class E | ||
| 1,705,000 | 4.31%, 07/15/2027 | 1,626,334 |
| Series 2021-1A Class D | ||
| 965,000 | 1.68%, 01/15/2027 | 911,305 |
| Series 2021-2A Class D | ||
| 345,000 | 1.42%, 04/15/2027 | 312,990 |
| Series 2022-2A Class D | ||
| 770,000 | 6.15%, 04/17/2028 | 738,106 |
| 374,724 | GM Financial Consumer Automobile Receivables Trust Series 2021-1 Class A3 0.35%, 10/16/2025 | 362,521 |
| 100,000 | GMF Floorplan Owner Revolving Trust(b) Series 2020-1 Class C 1.48%, 08/15/2025 | 96,813 |
| 1,151,500 | Hardee's Funding LLC(b) Series 2020-1A Class A2 3.98%, 12/20/2050 | 986,099 |
| Hertz Vehicle Financing III LLC(b) | ||
| Series 2022-1A Class D | ||
| 655,000 | 4.85%, 06/25/2026 | 578,410 |
| Series 2022-3A Class D | ||
| 400,000 | 6.31%, 03/25/2025 | 384,215 |
| 1,175,000 | Hertz Vehicle Financing LLC(b) Series 2022-4A Class D 6.56%, 09/25/2026 | 1,085,486 |
| 1,028,699 | Hilton Grand Vacations Trust(b) Series 2022-2A Class C 5.57%, 01/25/2037 | 988,876 |
| 486,716 | HIN Timeshare Trust(b) Series 2020-A Class C 3.42%, 10/09/2039 | 446,127 |
| Home Partners of America Trust(b) | ||
| Series 2019-1 Class D | ||
| 161,893 | 3.41%, 09/17/2039 | 139,217 |
| Series 2019-2 Class D | ||
| 124,715 | 3.12%, 10/19/2039 | 103,656 |
| Series 2021-1 Class E | ||
| 87,360 | 2.58%, 09/17/2041 | 66,702 |
| 516,082 | Horizon Aircraft Finance III Ltd(b) Series 2019-2 Class A 3.43%, 11/15/2039 | 397,903 |
| 1,050,000 | Hotwire Funding LLC(b) Series 2021-1 Class C 4.46%, 11/20/2051 | 856,017 |
| HPEFS Equipment Trust(b) | ||
| Series 2020-1A Class D | ||
| 315,000 | 2.26%, 02/20/2030 | 311,783 |
See Notes to Financial Statements.
Annual Report - December 31, 2022
EMPOWER FUNDS, INC.
EMPOWER MULTI-SECTOR BOND FUND
Schedule of Investments
As of December 31, 2022
| Principal Amount(a) | Fair Value | |
| Non-Agency — (continued) | ||
| Series 2020-2A Class C | ||
| $ 89,859 | 2.00%, 07/22/2030 | $ 89,351 |
| Series 2021-1A Class D | ||
| 150,000 | 1.03%, 03/20/2031 | 141,247 |
| Series 2022-1A Class D | ||
| 165,000 | 2.40%, 11/20/2029 | 149,475 |
| 817,550 | Jack in the Box Funding LLC(b) Series 2022-1A Class A2I 3.45%, 02/26/2052 | 708,770 |
| 636,192 | Jersey Mike's Funding(b) Series 2019-1A Class A2 4.43%, 02/15/2050 | 571,320 |
| 92,573 | JPMorgan Chase Bank NA(b) Series 2021-1 Class D 1.17%, 09/25/2028 | 88,989 |
| 925,430 | LAD Auto Receivables Trust(b) Series 2022-1A Class A 5.21%, 06/15/2027 | 910,607 |
| 257,226 | Laurel Road Prime Student Loan Trust(b) Series 2020-A Class A2FX 1.40%, 11/25/2050 | 232,859 |
| 869,059 | Lendbuzz Securitization Trust(b) Series 2022-1A Class A 4.22%, 05/17/2027 | 831,710 |
| MAPS Ltd(b) | ||
| Series 2018-1A Class A | ||
| 390,346 | 4.21%, 05/15/2043 | 348,417 |
| Series 2021-1A Class A | ||
| 737,791 | 2.52%, 06/15/2046 | 612,169 |
| Mariner Finance Issuance Trust(b) | ||
| Series 2019-AA Class A | ||
| 540,239 | 2.96%, 07/20/2032 | 532,959 |
| Series 2020-AA Class A | ||
| 770,000 | 2.19%, 08/21/2034 | 732,803 |
| Marlette Funding Trust(b) | ||
| Series 2021-2A Class C | ||
| 100,000 | 1.50%, 09/15/2031 | 92,424 |
| Series 2021-3A Class C | ||
| 145,000 | 1.81%, 12/15/2031 | 129,834 |
| 1,150,000 | Mercury Financial Credit Card Master Trust(b) Series 2021-1A Class A 1.54%, 03/20/2026 | 1,097,163 |
| 86,912 | Merlin Aviation Holdings Designated Activity Co(b)(e) Series 2016-1 Class A 4.50%, 12/15/2032 | 66,490 |
| Mission Lane Credit Card Master Trust(b) | ||
| Series 2021-A Class A | ||
| 1,100,000 | 1.59%, 09/15/2026 | 1,065,285 |
| Series 2021-A Class B | ||
| 100,000 | 2.24%, 09/15/2026 | 96,831 |
| MVW Owner Trust(b) | ||
| Series 2019-1A Class C | ||
| 25,517 | 3.33%, 11/20/2036 | 23,586 |
| Series 2021-2A Class C | ||
| 542,023 | 2.23%, 05/20/2039 | 479,466 |
| Principal Amount(a) | Fair Value | |
| Non-Agency — (continued) | ||
| Navient Private Education Refi Loan Trust(b) | ||
| Series 2019-GA Class B | ||
| $ 100,000 | 3.08%, 10/15/2068 | $ 78,149 |
| Series 2020-HA Class A | ||
| 47,765 | 1.31%, 01/15/2069 | 42,868 |
| Series 2021-A Class A | ||
| 177,827 | 0.84%, 05/15/2069 | 153,751 |
| Series 2021-EA Class B | ||
| 115,000 | 2.03%, 12/16/2069 | 73,269 |
| Series 2021-FA Class B | ||
| 265,000 | 2.12%, 02/18/2070 | 170,753 |
| 694,750 | NBC Funding LLC(b) Series 2021-1 Class A2 2.99%, 07/30/2051 | 584,205 |
| 74,371 | Oasis Securitization Funding LLC(b) Series 2021-1A Class A 2.58%, 02/15/2033 | 73,284 |
| OneMain Financial Issuance Trust(b) | ||
| Series 2018-2A Class A | ||
| 120,000 | 3.57%, 03/14/2033 | 117,641 |
| Series 2020-1A Class B | ||
| 290,000 | 4.83%, 05/14/2032 | 288,033 |
| Series 2020-2A Class A | ||
| 355,000 | 1.75%, 09/14/2035 | 310,117 |
| Series 2021-1A Class D | ||
| 270,000 | 2.47%, 06/16/2036 | 206,825 |
| Series 2022-3A Class A | ||
| 894,000 | 5.94%, 05/15/2034 | 890,034 |
| Series 2022-S1 Class D | ||
| 270,000 | 5.20%, 05/14/2035 | 244,109 |
| 890,000 | Pawneee Equipment Receivables LLC(b) Series 2022-1 Class B 5.40%, 07/17/2028 | 860,459 |
| Planet Fitness Master Issuer LLC(b) | ||
| Series 2018-1A Class A2II | ||
| 191,500 | 4.67%, 09/05/2048 | 179,323 |
| Series 2019-1A Class A2 | ||
| 324,950 | 3.86%, 12/05/2049 | 266,927 |
| Prestige Auto Receivables Trust(b) | ||
| Series 2018-1A Class D | ||
| 802,798 | 4.14%, 10/15/2024 | 801,474 |
| Series 2020-1A Class E | ||
| 235,000 | 3.67%, 02/15/2028 | 228,973 |
| Series 2022-1A Class D | ||
| 420,000 | 8.08%, 08/15/2028 | 418,366 |
| Progress Residential Trust(b) | ||
| Series 2019-SFR4 Class D | ||
| 275,000 | 3.14%, 10/17/2036 | 257,539 |
| Series 2020-SFR3 Class E | ||
| 145,000 | 2.30%, 10/17/2027 | 126,506 |
| Series 2021-SFR2 Class D | ||
| 805,000 | 2.20%, 04/19/2038 | 689,061 |
| Series 2021-SFR2 Class E1 | ||
| 345,000 | 2.55%, 04/19/2038 | 291,884 |
See Notes to Financial Statements.
Annual Report - December 31, 2022
EMPOWER FUNDS, INC.
EMPOWER MULTI-SECTOR BOND FUND
Schedule of Investments
As of December 31, 2022
| Principal Amount(a) | Fair Value | |
| Non-Agency — (continued) | ||
| Series 2021-SFR3 Class E1 | ||
| $ 125,000 | 2.54%, 05/17/2026 | $ 105,758 |
| Series 2021-SFR3 Class E2 | ||
| 105,000 | 2.69%, 05/17/2026 | 88,608 |
| Series 2021-SFR4 Class E1 | ||
| 100,000 | 2.41%, 05/17/2038 | 83,498 |
| Series 2021-SFR4 Class E2 | ||
| 100,000 | 2.56%, 05/17/2038 | 83,415 |
| Series 2021-SFR5 Class E1 | ||
| 145,000 | 2.21%, 07/17/2038 | 120,743 |
| Series 2021-SFR5 Class E2 | ||
| 100,000 | 2.36%, 07/17/2038 | 82,805 |
| Series 2021-SFR6 Class C | ||
| 505,000 | 1.86%, 07/17/2038 | 429,288 |
| Series 2021-SFR6 Class E1 | ||
| 185,000 | 2.43%, 07/17/2038 | 153,361 |
| Series 2021-SFR6 Class E2 | ||
| 100,000 | 2.53%, 07/17/2038 | 81,862 |
| Series 2021-SFR7 Class E1 | ||
| 205,000 | 2.59%, 08/17/2040 | 157,783 |
| Series 2021-SFR7 Class E2 | ||
| 100,000 | 2.64%, 08/17/2040 | 76,577 |
| Series 2021-SFR9 Class E1 | ||
| 100,000 | 2.81%, 11/17/2040 | 77,652 |
| 980,000 | Purchasing Power Funding LLC(b) Series 2021-A Class B 1.92%, 10/15/2025 | 932,859 |
| 1,110,000 | Republic Finance Issuance Trust(b) Series 2020-A Class A 2.47%, 11/20/2030 | 1,048,047 |
| 645,000 | Rockford Tower Ltd(b)(c) Series 2018-1A Class A 5.78%, 05/20/2031 3-mo. LIBOR + 1.10% | 634,177 |
| Santander Drive Auto Receivables Trust | ||
| Series 2019-3 Class D | ||
| 188,247 | 2.68%, 10/15/2025 | 187,374 |
| Series 2020-1 Class C | ||
| 71,070 | 4.11%, 12/15/2025 | 70,729 |
| Series 2020-1 Class D | ||
| 200,000 | 5.35%, 03/15/2028 | 199,673 |
| Series 2020-2 Class D | ||
| 95,000 | 2.22%, 09/15/2026 | 92,527 |
| SCF Equipment Leasing LLC(b) | ||
| Series 2022-1A Class D | ||
| 135,000 | 3.79%, 11/20/2031 | 116,724 |
| Series 2022-2A Class C | ||
| 210,000 | 6.50%, 08/20/2032 | 204,798 |
| 347,045 | Shackleton Ltd(b)(c) Series 2017-10A Class AR2 5.13%, 04/20/2029 3-mo. LIBOR + 0.89% | 341,802 |
| 59,186 | Shenton Aircraft Investment I Ltd(b) Series 2015-1A Class A 4.75%, 10/15/2042 | 45,278 |
| Principal Amount(a) | Fair Value | |
| Non-Agency — (continued) | ||
| Sierra Timeshare Receivables Funding LLC(b) | ||
| Series 2019-2A Class C | ||
| $ 71,699 | 3.12%, 05/20/2036 | $ 66,821 |
| Series 2019-3A Class C | ||
| 47,690 | 3.00%, 08/20/2036 | 44,891 |
| Series 2021-1A Class C | ||
| 42,111 | 1.79%, 11/20/2037 | 38,496 |
| 350,000 | Signal Peak Ltd(b)(c) Series 2014-1A Class AR3 5.24%, 04/17/2034 3-mo. LIBOR + 1.16% | 341,370 |
| 574,778 | S-Jets Ltd(b) Series 2017-1 Class A 3.97%, 08/15/2042 | 445,459 |
| 611,685 | Slam Ltd(b) Series 2021-1A Class A 2.43%, 06/15/2046 | 506,071 |
| SMB Private Education Loan Trust(b) | ||
| Series 2015-C Class B | ||
| 100,000 | 3.50%, 09/15/2043 | 94,024 |
| Series 2018-C Class B | ||
| 100,000 | 4.00%, 11/17/2042 | 87,523 |
| Series 2019-B Class A2A | ||
| 554,806 | 2.84%, 06/15/2037 | 518,630 |
| Series 2020-A Class A2A | ||
| 69,207 | 2.23%, 09/15/2037 | 63,142 |
| Series 2021-A Class A2A2 | ||
| 160,096 | 5.05%, 01/15/2053(c) 1-mo. LIBOR + 0.73% | 153,174 |
| Series 2021-D Class B | ||
| 200,000 | 2.31%, 03/17/2053 | 148,548 |
| 100,000 | SoFi Consumer Loan Program Trust(b) Series 2021-1 Class D 2.04%, 09/25/2030 | 90,617 |
| 100,000 | SoFi Professional Loan Program LLC(b)(d) Series 2017-A Class C 4.43%, 03/26/2040 | 89,018 |
| Taco Bell Funding LLC(b) | ||
| Series 2016-1A Class A23 | ||
| 538,650 | 4.97%, 05/25/2046 | 516,654 |
| Series 2021-1A Class A2II | ||
| 598,950 | 2.29%, 08/25/2051 | 481,177 |
| 315,040 | TIF Funding II LLC(b) Series 2021-1A Class A 1.65%, 02/20/2046 | 261,277 |
| Tricon American Homes Trust(b) | ||
| Series 2019-SFR1 Class C | ||
| 1,740,000 | 3.15%, 03/17/2038 | 1,567,948 |
| Series 2019-SFR1 Class D | ||
| 115,000 | 3.20%, 03/17/2038 | 103,330 |
| Series 2020-SFR1 Class D | ||
| 230,000 | 2.55%, 07/17/2038 | 199,494 |
| Series 2020-SFR2 Class D | ||
| 895,000 | 2.28%, 11/17/2039 | 737,227 |
See Notes to Financial Statements.
Annual Report - December 31, 2022
EMPOWER FUNDS, INC.
EMPOWER MULTI-SECTOR BOND FUND
Schedule of Investments
As of December 31, 2022
| Principal Amount(a) | Fair Value | |
| Non-Agency — (continued) | ||
| Series 2020-SFR2 Class E1 | ||
| $ 225,000 | 2.73%, 11/17/2039 | $ 184,015 |
| 490,000 | Tricon Residential Trust(b) Series 2021-SFR1 Class B 2.24%, 07/17/2038 | 422,468 |
| VCAT LLC(b)(e) | ||
| Series 2021-NPL1 Class A1 | ||
| 61,650 | 2.29%, 12/26/2050 | 58,195 |
| Series 2021-NPL3 Class A1 | ||
| 335,721 | 1.74%, 05/25/2051 | 290,720 |
| Series 2021-NPL4 Class A1 | ||
| 688,307 | 1.87%, 08/25/2051 | 623,213 |
| Series 2021-NPL5 Class A1 | ||
| 424,886 | 1.87%, 08/25/2051 | 374,346 |
| Series 2021-NPL6 Class A1 | ||
| 687,179 | 1.92%, 09/25/2051 | 598,235 |
| 305,000 | VERDE Ltd(b)(c) Series 2019-1A Class AR 5.18%, 04/15/2032 3-mo. LIBOR + 1.10% | 299,477 |
| 1,100,000 | VFI LLC(b) Series 2022-1A Class B 3.04%, 07/24/2028 | 1,036,200 |
| 237,368 | VOLT C LLC(b)(e) Series 2021-NPL9 Class A1 1.99%, 05/25/2051 | 211,943 |
| 315,952 | VOLT CVI LLC(b)(e) Series 2021-NP12 Class A1 2.73%, 12/26/2051 | 291,898 |
| 147,936 | VOLT XCII LLC(b)(e) Series 2021-NPL1 Class A1 1.89%, 02/27/2051 | 127,651 |
| 379,221 | VOLT XCIII LLC(b)(e) Series 2021-NPL2 Class A1 1.89%, 02/27/2051 | 341,152 |
| 324,878 | VOLT XCIV LLC(b)(e) Series 2021-NPL3 Class A1 2.24%, 02/27/2051 | 293,694 |
| 223,683 | VOLT XCV LLC(b)(e) Series 2021-NPL4 Class A1 2.24%, 03/27/2051 | 204,394 |
| 224,077 | VOLT XCVI LLC(b)(e) Series 2021-NPL5 Class A1 2.12%, 03/27/2051 | 203,138 |
| 521,820 | VOLT XCVII LLC(b)(e) Series 2021-NPL6 Class A1 2.24%, 04/25/2051 | 459,002 |
| 335,647 | WAVE Trust(b) Series 2017-1A Class A 3.84%, 11/15/2042 | 253,417 |
| Wendy's Funding LLC(b) | ||
| Series 2018-1A Class A2II | ||
| 128,250 | 3.88%, 03/15/2048 | 115,521 |
| Series 2021-1A Class A2I | ||
| 334,900 | 2.37%, 06/15/2051 | 270,373 |
| Westlake Automobile Receivables Trust(b) | ||
| Series 2021-1A Class D | ||
| 785,000 | 1.23%, 04/15/2026 | 728,213 |
| Series 2021-2A Class D | ||
| 345,000 | 1.23%, 12/15/2026 | 314,201 |
| Principal Amount(a) | Fair Value | |
| Non-Agency — (continued) | ||
| $ 1,026,999 | Zaxby's Funding LLC(b) Series 2021-1A Class A2 3.24%, 07/30/2051 | $ 826,609 |
| TOTAL ASSET-BACKED SECURITIES — 12.65% (Cost $92,204,249) | $ 84,186,292 | |
| BANK LOANS | ||
| 567,054 | Agiliti Health Inc(c) 6.88%, 01/04/2026 1-mo. LIBOR + 2.49% | 554,296 |
| 122,340 | Air Canada(c) 8.13%, 08/11/2028 3-mo. LIBOR + 3.36% | 120,556 |
| 273,115 | Alliance Laundry Systems LLC(c) 7.41%, 10/08/2027 3-mo. LIBOR + 2.64% | 267,312 |
| 249,375 | Amentum Government Services Holdings LLC(c) 8.76%, 02/15/2029 3-mo. SOFR + 2.97% | 243,141 |
| 465,000 | American Axle & Manufacturing Inc(c) 7.90%, 12/13/2029 1-mo. SOFR + 3.54% | 455,700 |
| 220,920 | Anchor Glass Container Corp(c) 6.53%, 12/07/2023 3-mo. LIBOR + 1.76% | 159,461 |
| 255,536 | Apex Group Treasury LLC(c) 8.26%, 07/27/2028 3-mo. LIBOR + 3.49% | 241,801 |
| 375,896 | Applied Systems Inc(c) 12.00%, 09/19/2025 1-mo. LIBOR + 5.45% | 372,607 |
| Arcline FM Holdings LLC(c) | ||
| 370,479 | 8.39%,06/23/2028 1-mo. LIBOR + 4.00% | 351,029 |
| 140,000 | 7.35%,06/25/2029 1-mo. LIBOR + 8.20% | 123,200 |
| 334,917 | Aruba Investments Holdings LLC(c) 8.14%, 11/24/2027 1-mo. LIBOR + 3.75% | 324,590 |
| 356,083 | Asurion LLC(c) 7.63%, 07/31/2027 1-mo. LIBOR + 3.24% | 352,523 |
| 315,664 | Blackhawk Network Holdings Inc(c) 7.08%, 06/15/2025 3-mo. SOFR + 2.49% | 306,852 |
| 337,253 | BrightView Landscapes LLC(c) 7.57%, 04/20/2029 1-mo. SOFR + 3.21% | 324,184 |
| 1,046,798 | Brookfield WEC Holdings Inc(c) 7.13%, 08/01/2025 1-mo. LIBOR + 2.74% | 1,030,311 |
| 272,113 | Brown Group Holding LLC(c) 6.88%, 06/07/2028 1-mo. LIBOR + 2.49% | 266,913 |
See Notes to Financial Statements.
Annual Report - December 31, 2022
EMPOWER FUNDS, INC.
EMPOWER MULTI-SECTOR BOND FUND
Schedule of Investments
As of December 31, 2022
| Principal Amount(a) | Fair Value | |
| Bank Loans — (continued) | ||
| $ 435,153 | Caesars Resort Collection LLC(c) 7.13%, 12/23/2024 1-mo. LIBOR + 2.74% | $ 433,793 |
| 571,448 | Carlisle Foodservice Products Inc(c) 6.57%, 03/20/2025 3-mo. LIBOR + 1.80% | 508,113 |
| 116,998 | Carnival Corp(c) 7.38%, 06/30/2025 1-mo. LIBOR + 2.99% | 111,660 |
| 318,392 | CCC Intelligent Solutions Inc(c) 6.63%, 09/21/2028 1-mo. LIBOR + 2.24% | 316,004 |
| 175,000 | CDK Global Inc(c) 9.08%, 07/06/2029 3-mo. SOFR + 4.49% | 173,332 |
| 285,000 | Chart Industries(c)(f) 8.15%, 12/08/2029 1-mo. LIBOR + 3.76% | 281,437 |
| 491,269 | CHG Healthcare Services(c) 7.63%, 09/29/2028 1-mo. LIBOR + 3.24% | 479,874 |
| 361,736 | Cinemark USA Inc(c) 6.14%, 03/31/2025 1-mo. LIBOR + 1.75% | 347,116 |
| 179,000 | Citadel Securities LP(c) 7.20%, 02/02/2028 1-mo. SOFR + 2.84% | 176,628 |
| 291,417 | Clarios Global LP(c) 7.63%, 04/30/2026 1-mo. LIBOR + 3.24% | 284,981 |
| 244,484 | CNT Holdings I Corp(c) 7.24%, 11/08/2027 3-mo. SOFR + 2.65% | 236,130 |
| 255,758 | ConnectWise LLC(c) 7.88%, 09/29/2028 3-mo. LIBOR + 3.11% | 242,651 |
| 196,351 | Consolidated Communications Inc(c) 7.88%, 10/02/2027 1-mo. LIBOR + 3.49% | 172,830 |
| 490,954 | Cooper-Standard Automotive Inc(c) 6.38%, 11/02/2023 1-mo. LIBOR + 1.99% | 480,031 |
| 560,000 | Covia Holdings LLC(c) 7.75%, 07/31/2026 3-mo. LIBOR + 2.98% | 540,000 |
| 450,769 | DirectV Financing LLC(c) 9.38%, 08/02/2027 1-mo. LIBOR + 4.99% | 437,176 |
| 346,500 | DS Parent Inc(c) 9.92%, 12/08/2028 3-mo. LIBOR + 5.15% | 328,309 |
| 444,906 | Dun & Bradstreet Corp(c) 7.64%, 02/06/2026 1-mo. LIBOR + 3.25% | 439,901 |
| 254,800 | DXP Enterprises Inc(c) 9.95%, 12/23/2027 3-mo. SOFR + 5.36% | 242,060 |
| Principal Amount(a) | Fair Value | |
| Bank Loans — (continued) | ||
| $ 316,875 | ECL Entertainment LLC(c) 11.88%, 05/01/2028 1-mo. LIBOR + 7.49% | $ 315,819 |
| 330,303 | Epicor Software Corp(c) 7.32%, 07/30/2027 1-mo. LIBOR + 2.93% | 317,032 |
| 442,694 | Filtration Group Corp(c) 7.38%, 03/31/2025 1-mo. LIBOR + 2.99% | 437,368 |
| 286,513 | Gainwell Acquisition Corp(c) 8.73%, 10/01/2027 3-mo. LIBOR + 3.96% | 270,397 |
| 185,000 | Garda World Security Corp(c) 8.93%, 10/30/2026 3-mo. LIBOR + 4.16% | 179,566 |
| Generation Bridge II LLC(c) | ||
| 197,517 | 9.44%,02/22/2029 1-mo. SOFR + 5.08% | 195,839 |
| 24,050 | 9.44%,02/23/2029 1-mo. SOFR + 5.08% | 23,845 |
| 331,567 | Grab Holdings Inc(c) 8.89%, 01/29/2026 1-mo. LIBOR + 4.50% | 326,732 |
| 321,514 | Great Outdoors Group LLC(c) 8.13%, 03/06/2028 1-mo. LIBOR + 3.74% | 308,720 |
| 343,875 | Greeneden Holdings II LLC(c) 8.38%, 12/01/2027 1-mo. LIBOR + 3.99% | 329,432 |
| 355,230 | Hamilton Projects Acquiror LLC(c) 9.23%, 06/17/2027 3-mo. LIBOR + 4.46% | 349,162 |
| 1,338 | Heartland Dental LLC(c) 8.38%, 04/30/2025 1-mo. LIBOR + 3.99% | 1,336 |
| 336,731 | H-Food Holdings LLC(c) 8.07%, 05/23/2025 1-mo. LIBOR + 3.68% | 298,054 |
| 348,051 | Horizon Therapeutics USA Inc(c) 6.19%, 03/15/2028 1-mo. LIBOR + 1.80% | 347,703 |
| 274,866 | Hunter Holdco 3 Ltd(c) 8.98%, 08/19/2028 3-mo. LIBOR + 4.21% | 268,681 |
| 981,411 | Hyland Software Inc(c) 7.88%, 07/01/2024 1-mo. LIBOR + 3.49% | 966,339 |
| 828,718 | Ineos US Finance LLC(c) 8.17%, 11/08/2027 1-mo. SOFR + 3.81% | 827,854 |
| 309,010 | Infinite Bidco LLC(c) 7.98%, 03/02/2028 3-mo. LIBOR + 3.21% | 295,362 |
| 300,418 | J&J Ventures Gaming LLC(c) 8.73%, 04/26/2028 3-mo. LIBOR + 3.96% | 286,900 |
| Lightstone HoldCo LLC(c) | ||
| 17,907 | 7.28%,01/30/2027 1-mo. SOFR + 5.75% | 16,358 |
| 315,277 | 10.07%,02/01/2027 1-mo. SOFR + 5.71% | 288,005 |
See Notes to Financial Statements.
Annual Report - December 31, 2022
EMPOWER FUNDS, INC.
EMPOWER MULTI-SECTOR BOND FUND
Schedule of Investments
As of December 31, 2022
| Principal Amount(a) | Fair Value | |
| Bank Loans — (continued) | ||
| $ 550,700 | Mauser Packaging Solutions Holding Co(c) 7.37%, 04/03/2024 1-mo. LIBOR + 2.98% | $ 536,736 |
| 325,054 | McGraw-Hill Education Inc(c) 8.32%, 07/28/2028 3-mo. LIBOR + 3.55% | 305,307 |
| 308,371 | Medallion Midland Acquisition LLC(c) 5.42%, 10/18/2028 3-mo. SOFR + 4.00% | 305,057 |
| 409,500 | Mileage Plus Holdings Inc(c) 10.00%, 06/21/2027 3-mo. LIBOR + 5.23% | 420,818 |
| 287,100 | NAB Holdings LLC(c) 7.73%, 11/23/2028 3-mo. SOFR + 3.14% | 278,666 |
| 350,000 | Neptune Bidco US Inc(c) 6.75%, 04/11/2029 3-mo. SOFR + 0.91% | 314,125 |
| 360,000 | Open Text Corp(c)(f) 4.85%, 11/16/2029 1-mo. LIBOR + 0.46% | 350,775 |
| 509,872 | Oryx Midstream Services Permian Basin LLC(c) 7.92%, 10/05/2028 3-mo. LIBOR + 3.15% | 503,020 |
| 252,929 | Packaging Coordinators Midco Inc(c) 8.23%, 11/30/2027 3-mo. LIBOR + 3.46% | 248,060 |
| 157,349 | PAI Holdco Inc(c) 8.16%, 10/28/2027 3-mo. LIBOR + 3.39% | 138,205 |
| 384,756 | Parfums Holding Co Inc(c) 8.38%, 06/30/2024 1-mo. LIBOR + 3.99% | 355,322 |
| 1,194 | Peabody Energy Corp(c) 6.33%, 03/31/2025 3-mo. LIBOR + 2.71% | 1,183 |
| 290,000 | Pegasus BidCo(c) 8.52%, 07/12/2029 3-mo. SOFR + 3.93% | 279,487 |
| 291,743 | Peraton Corp(c) 8.13%, 02/01/2028 1-mo. LIBOR + 3.74% | 284,502 |
| 536,265 | Perrigo Investments LLC(c) 6.92%, 04/20/2029 1-mo. SOFR + 2.56% | 526,880 |
| 246,091 | PetsMart LLC(c) 8.13%, 02/11/2028 1-mo. LIBOR + 3.74% | 240,708 |
| 480,582 | PetVet Care Centers LLC(c) 7.57%, 02/14/2025 1-mo. LIBOR + 3.18% | 448,743 |
| 509,434 | Phoenix Guarantor Inc(c) 7.63%, 03/05/2026 1-mo. LIBOR + 3.24% | 476,639 |
| 259,872 | Phoenix Newco Inc(c) 7.32%, 11/15/2028 1-mo. LIBOR + 2.93% | 249,838 |
| Principal Amount(a) | Fair Value | |
| Bank Loans — (continued) | ||
| $ 355,000 | Pike Corp(c) 7.39%, 01/21/2028 1-mo. LIBOR + 3.00% | $ 349,182 |
| 1,142,584 | Playa Resorts Holding BV(c) 7.14%, 04/29/2024 1-mo. LIBOR + 2.75% | 1,139,728 |
| 298,532 | Playtika Holding Corp(c) 7.13%, 03/13/2028 1-mo. LIBOR + 2.74% | 284,351 |
| 309,564 | Pods LLC(c) 7.38%, 03/31/2028 1-mo. LIBOR + 2.99% | 292,847 |
| 317,260 | Project Ruby Ultimate Parent Corp(c) 7.63%, 03/10/2028 1-mo. LIBOR + 3.24% | 299,335 |
| 256,678 | Proofpoint Inc(c) 7.98%, 08/31/2028 3-mo. LIBOR + 3.21% | 246,171 |
| 402,975 | Quikrete Holdings Inc(c) 7.38%, 06/09/2028 1-mo. LIBOR + 2.99% | 399,281 |
| 344,137 | R1 RCM INC(c) 7.32%, 06/21/2029 1-mo. SOFR + 2.96% | 339,262 |
| 159,600 | Raptor Acquisition Corp(c) 7.60%, 11/01/2026 3-mo. LIBOR + 3.98% | 156,541 |
| 288,153 | Realpage Inc(c) 7.38%, 04/24/2028 1-mo. LIBOR + 2.99% | 273,637 |
| 261,025 | Rising Tide Holdings Inc(c) 9.48%, 06/01/2028 3-mo. LIBOR + 4.71% | 117,461 |
| 129,350 | Safe Fleet Holdings LLC(c) 8.17%, 02/23/2029 1-mo. SOFR + 3.81% | 124,741 |
| 342,228 | Scientific Games International Inc(c) 7.42%, 04/13/2029 1-mo. SOFR + 3.06% | 336,951 |
| 315,050 | Shearers Foods(c) 7.88%, 09/23/2027 1-mo. LIBOR + 3.49% | 299,593 |
| 371,111 | Sophia LP(c) 7.87%, 10/07/2027 1-mo. LIBOR + 3.48% | 357,659 |
| 333,882 | Spectrum Holdings III Corp(c) 7.63%, 01/31/2025 1-mo. LIBOR + 3.24% | 304,389 |
| SRS Distribution Inc(c) | ||
| 227,125 | 7.88%,06/02/2028 1-mo. LIBOR + 3.49% | 215,996 |
| 54,588 | 7.92%,06/02/2028 1-mo. SOFR + 3.56% | 52,040 |
| 303,148 | St. George's University Scholastic Services LLC(c) 7.63%, 02/10/2029 1-mo. LIBOR + 3.24% | 294,559 |
| 307,687 | Star US Bidco LLC(c) 8.98%, 03/17/2027 3-mo. LIBOR + 4.21% | 291,918 |
See Notes to Financial Statements.
Annual Report - December 31, 2022
EMPOWER FUNDS, INC.
EMPOWER MULTI-SECTOR BOND FUND
Schedule of Investments
As of December 31, 2022
| Principal Amount(a) | Fair Value | |
| Bank Loans — (continued) | ||
| $ 240,713 | Sunshine Luxembourg VII SARL(c) 8.48%, 10/01/2026 3-mo. LIBOR + 3.71% | $ 230,148 |
| Transdigm Inc(c) | ||
| 285,595 | 6.98%,05/30/2025 3-mo. LIBOR + 2.21% | 282,233 |
| 240,816 | 6.98%,12/09/2025 3-mo. LIBOR + 2.21% | 237,389 |
| 783,001 | Traverse Midstream Partners LLC(c) 8.80%, 09/27/2024 3-mo. SOFR + 4.21% | 780,065 |
| 262,958 | TricorBraun Inc(c) 7.63%, 03/03/2028 1-mo. LIBOR + 3.24% | 250,467 |
| 269,015 | Triton Water Holdings Inc(c) 8.23%, 03/31/2028 3-mo. LIBOR + 3.46% | 249,175 |
| 330,531 | UFC Holdings LLC(c) 7.11%, 04/29/2026 3-mo. LIBOR + 2.34% | 325,883 |
| UKG Inc(c) | ||
| 24,041 | 7.00%,05/03/2026 3-mo. LIBOR + 2.23% | 22,797 |
| 25,000 | 9.00%,05/03/2027 3-mo. LIBOR + 4.23% | 22,891 |
| 376,762 | Upstream Newco Inc(c) 9.09%, 11/20/2026 3-mo. SOFR + 4.50% | 325,429 |
| 496,168 | Viant Medical Holdings Inc(c) 8.13%, 07/02/2025 1-mo. LIBOR + 3.74% | 435,904 |
| 366,972 | Weld North Education LLC(c) 8.13%, 12/21/2027 1-mo. LIBOR + 3.74% | 359,403 |
| 315,944 | William Morris Endeavor Entertainment LLC(c) 7.14%, 05/18/2025 1-mo. LIBOR + 2.75% | 307,888 |
| 474,167 | Zep Inc(c) 8.58%, 08/12/2024 3-mo. LIBOR + 3.81% | 407,784 |
| TOTAL BANK LOANS — 5.27% (Cost $36,061,873) | $ 35,054,175 | |
| CORPORATE BONDS AND NOTES | ||
| Basic Materials — 2.72% | ||
| 830,000 | Albemarle Corp 5.05%, 06/01/2032 | 782,265 |
| 200,000 | Alpek SAB de CV(b) 3.25%, 02/25/2031 | 166,650 |
| Anglo American Capital PLC(b) | ||
| 620,000 | 2.63%, 09/10/2030 | 503,865 |
| 400,000 | 2.88%, 03/17/2031 | 326,604 |
| ArcelorMittal SA | ||
| 730,000 | 6.80%, 11/29/2032 | 725,872 |
| 590,000 | 6.75%, 03/01/2041 | 568,937 |
| 525,000 | Ashland LLC(b) 3.38%, 09/01/2031 | 419,617 |
| Principal Amount(a) | Fair Value | |
| Basic Materials — (continued) | ||
| $ 500,000 | ATI Inc 5.88%, 12/01/2027 | $ 478,143 |
| 128,000 | Avient Corp(b) 7.13%, 08/01/2030 | 125,124 |
| 870,000 | Bayport Polymers LLC(b) 5.14%, 04/14/2032 | 785,621 |
| Braskem Netherlands Finance BV(b) | ||
| 600,000 | 4.50%, 01/31/2030 | 510,275 |
| 400,000 | 5.88%, 01/31/2050(g) | 309,867 |
| Celanese US Holdings LLC | ||
| 275,000 | 5.90%, 07/05/2024 | 274,911 |
| 235,000 | 6.17%, 07/15/2027 | 231,787 |
| 215,000 | 6.33%, 07/15/2029 | 208,903 |
| 160,000 | 6.38%, 07/15/2032(g) | 152,152 |
| 516,000 | Cleveland-Cliffs Inc(b) 6.75%, 03/15/2026 | 517,290 |
| First Quantum Minerals Ltd(b) | ||
| 1,815,000 | 7.50%, 04/01/2025 | 1,766,612 |
| 200,000 | 6.88%, 03/01/2026 | 189,404 |
| 285,000 | 6.88%, 10/15/2027 | 267,394 |
| 170,000 | FMC Corp 3.45%, 10/01/2029 | 149,841 |
| 550,000 | FMG Resources Pty Ltd(b) 4.38%, 04/01/2031 | 457,426 |
| Freeport-McMoRan Inc | ||
| 295,000 | 4.13%, 03/01/2028 | 272,876 |
| 155,000 | 4.38%, 08/01/2028 | 144,672 |
| 305,000 | 4.25%, 03/01/2030 | 276,913 |
| 180,000 | 4.63%, 08/01/2030 | 167,651 |
| Glencore Funding LLC(b) | ||
| 1,945,000 | 4.88%, 03/12/2029 | 1,864,122 |
| 165,000 | 2.85%, 04/27/2031 | 135,024 |
| 905,000 | International Flavors & Fragrances Inc(b)(g) 2.30%, 11/01/2030 | 718,002 |
| 740,000 | Inversiones CMPC SA(b) 3.85%, 01/13/2030 | 669,888 |
| 310,000 | Newcrest Finance Pty Ltd(b) 3.25%, 05/13/2030 | 258,709 |
| 151,000 | NOVA Chemicals Corp(b) 5.00%, 05/01/2025 | 142,165 |
| 165,000 | Novelis Corp(b) 4.75%, 01/30/2030 | 146,283 |
| 645,000 | Orbia Advance Corp SAB de CV(b) 2.88%, 05/11/2031 | 503,906 |
| 100,000 | Reliance Steel & Aluminum Co 2.15%, 08/15/2030 | 78,746 |
| Suzano Austria GmbH | ||
| 690,000 | 2.50%, 09/15/2028 | 580,545 |
| 555,000 | 3.75%, 01/15/2031 | 465,604 |
| 1,047,000 | Taseko Mines Ltd(b) 7.00%, 02/15/2026 | 920,668 |
| 545,000 | Teck Resources Ltd 6.13%, 10/01/2035 | 538,493 |
| 105,000 | Volcan Cia Minera SAA(b) 4.38%, 02/11/2026 | 90,462 |
See Notes to Financial Statements.
Annual Report - December 31, 2022
EMPOWER FUNDS, INC.
EMPOWER MULTI-SECTOR BOND FUND
Schedule of Investments
As of December 31, 2022
| Principal Amount(a) | Fair Value | |
| Basic Materials — (continued) | ||
| $ 226,000 | WR Grace Holdings LLC(b) 5.63%, 08/15/2029 | $ 182,443 |
| 18,075,732 | ||
| Communications — 4.35% | ||
| 410,000 | Altice France Holding SA(b)(g) 6.00%, 02/15/2028 | 242,020 |
| 200,000 | Altice France SA(b) 5.13%, 01/15/2029 | 150,382 |
| 200,000 | Block Communications Inc(b) 4.88%, 03/01/2028 | 174,500 |
| 770,000 | Cable Onda SA(b) 4.50%, 01/30/2030 | 691,653 |
| CCO Holdings LLC / CCO Holdings Capital Corp(b) | ||
| 60,000 | 5.38%, 06/01/2029 | 54,256 |
| 703,000 | 4.75%, 03/01/2030 | 606,278 |
| 554,000 | 4.50%, 08/15/2030 | 457,690 |
| 465,000 | 4.25%, 02/01/2031 | 372,983 |
| 585,000 | 4.25%, 01/15/2034 | 431,756 |
| Charter Communications Operating LLC / Charter Communications Operating Capital | ||
| 450,000 | 2.80%, 04/01/2031 | 350,329 |
| 90,000 | 2.30%, 02/01/2032 | 66,289 |
| 115,000 | 4.40%, 04/01/2033 | 98,401 |
| 765,000 | 5.13%, 07/01/2049 | 578,464 |
| 2,220,000 | 4.80%, 03/01/2050 | 1,611,607 |
| 695,000 | 4.40%, 12/01/2061 | 444,573 |
| 870,000 | 3.95%, 06/30/2062 | 513,213 |
| CommScope Inc(b) | ||
| 530,000 | 7.13%, 07/01/2028 | 378,880 |
| 490,000 | 4.75%, 09/01/2029 | 395,038 |
| 215,000 | CommScope Technologies LLC(b) 5.00%, 03/15/2027 | 146,028 |
| CSC Holdings LLC(b) | ||
| 680,000 | 5.38%, 02/01/2028 | 548,250 |
| 640,000 | 7.50%, 04/01/2028 | 435,200 |
| 2,435,000 | 4.63%, 12/01/2030 | 1,345,664 |
| 690,000 | CT Trust(b)(g) 5.13%, 02/03/2032 | 605,884 |
| DISH DBS Corp | ||
| 473,000 | 7.75%, 07/01/2026 | 381,422 |
| 1,505,000 | 5.25%, 12/01/2026(b) | 1,267,714 |
| 495,000 | 5.13%, 06/01/2029 | 319,329 |
| Expedia Group Inc | ||
| 920,000 | 3.25%, 02/15/2030 | 780,432 |
| 430,000 | 2.95%, 03/15/2031(g) | 345,776 |
| 600,000 | Go Daddy Operating Co LLC / GD Finance Co Inc(b) 3.50%, 03/01/2029 | 502,315 |
| iHeartCommunications Inc | ||
| 320,000 | 8.38%, 05/01/2027(g) | 272,137 |
| 525,000 | 5.25%, 08/15/2027(b) | 444,719 |
| 535,000 | 4.75%, 01/15/2028(b) | 435,672 |
| Lamar Media Corp | ||
| 70,000 | 3.75%, 02/15/2028 | 62,657 |
| Principal Amount(a) | Fair Value | |
| Communications — (continued) | ||
| $ 70,000 | 4.00%, 02/15/2030(g) | $ 61,180 |
| Level 3 Financing Inc(b) | ||
| 90,000 | 4.63%, 09/15/2027 | 74,925 |
| 257,000 | 3.63%, 01/15/2029 | 188,186 |
| 544,000 | McGraw-Hill Education Inc(b) 8.00%, 08/01/2029 | 449,870 |
| 420,000 | Millennium Escrow Corp(b) 6.63%, 08/01/2026 | 268,821 |
| 525,000 | Motorola Solutions Inc 4.60%, 05/23/2029 | 499,657 |
| Netflix Inc | ||
| 300,000 | EUR, 3.63%, 05/15/2027 | 308,150 |
| 210,000 | 4.88%, 04/15/2028 | 202,773 |
| 490,000 | 5.88%, 11/15/2028 | 496,630 |
| 395,000 | 6.38%, 05/15/2029 | 406,569 |
| 100,000 | 5.38%, 11/15/2029(b) | 97,000 |
| 1,215,000 | 4.88%, 06/15/2030(b)(g) | 1,133,108 |
| 289,000 | Northwest Fiber LLC / Northwest Fiber Finance Sub Inc(b) 10.75%, 06/01/2028 | 268,734 |
| 25,000 | Sirius XM Radio Inc(b) 5.50%, 07/01/2029 | 22,820 |
| SoftBank Group Corp | ||
| 400,000 | 4.63%, 07/06/2028 | 328,416 |
| 200,000 | 5.25%, 07/06/2031 | 160,000 |
| 70,000 | Sprint Capital Corp 6.88%, 11/15/2028 | 72,656 |
| 349,000 | Telesat Canada / Telesat LLC(b) 6.50%, 10/15/2027 | 100,949 |
| Time Warner Cable LLC | ||
| 35,000 | 5.88%, 11/15/2040 | 30,493 |
| 235,000 | 5.50%, 09/01/2041 | 195,021 |
| 245,000 | 4.50%, 09/15/2042 | 179,366 |
| T-Mobile USA Inc | ||
| 110,000 | 2.40%, 03/15/2029 | 92,832 |
| 755,000 | 3.88%, 04/15/2030 | 683,890 |
| 1,220,000 | 3.50%, 04/15/2031 | 1,053,835 |
| 195,000 | 2.70%, 03/15/2032 | 157,549 |
| Uber Technologies Inc(b) | ||
| 640,000 | 8.00%, 11/01/2026 | 642,203 |
| 600,000 | 7.50%, 09/15/2027 | 600,420 |
| 3,965,000 | 4.50%, 08/15/2029 | 3,454,526 |
| 238,000 | ViaSat Inc(b) 5.63%, 09/15/2025 | 220,813 |
| 475,000 | Virgin Media Finance PLC(b) 5.00%, 07/15/2030 | 380,979 |
| 705,000 | VZ Secured Financing BV(b) 5.00%, 01/15/2032 | 572,898 |
| 28,916,780 | ||
| Consumer, Cyclical — 3.71% | ||
| 1011778 BC Unlimited Liability Co / New Red Finance Inc(b) | ||
| 120,000 | 3.88%, 01/15/2028 | 107,345 |
| 210,000 | 4.38%, 01/15/2028 | 188,035 |
| 150,000 | 4.00%, 10/15/2030 | 121,472 |
See Notes to Financial Statements.
Annual Report - December 31, 2022
EMPOWER FUNDS, INC.
EMPOWER MULTI-SECTOR BOND FUND
Schedule of Investments
As of December 31, 2022
| Principal Amount(a) | Fair Value | |
| Consumer, Cyclical — (continued) | ||
| $ 1,218,458 | Alaska Airlines Pass Through Trust(b) Series 2020-1 Class A 4.80%, 08/15/2027 | $ 1,158,166 |
| 445,000 | Allison Transmission Inc(b) 3.75%, 01/30/2031 | 366,013 |
| American Airlines Pass Through Trust | ||
| Series 2016-1 Class B | ||
| 621,323 | 5.25%, 01/15/2024 | 605,357 |
| Series 2017-2 Class B | ||
| 280,686 | 3.70%, 10/15/2025 | 252,213 |
| Series 2016-3 Class B | ||
| 798,058 | 3.75%, 10/15/2025 | 711,778 |
| 562,000 | At Home Group Inc(b) 7.13%, 07/15/2029 | 326,016 |
| 140,000 | AutoNation Inc 4.75%, 06/01/2030 | 124,907 |
| 322,000 | BlueLinx Holdings Inc(b) 6.00%, 11/15/2029 | 267,260 |
| 229,230 | British Airways Pass Through Trust(b) Series 2019-1 Class A 3.35%, 06/15/2029 | 198,406 |
| 377,000 | Brunswick Corp 2.40%, 08/18/2031 | 277,169 |
| Caesars Entertainment Inc(b) | ||
| 327,000 | 6.25%, 07/01/2025 | 317,738 |
| 322,000 | 8.13%, 07/01/2027 | 316,381 |
| Carnival Corp(b) | ||
| 425,000 | 5.75%, 03/01/2027 | 303,467 |
| 255,000 | 6.00%, 05/01/2029 | 169,927 |
| 477,000 | Clarios Global LP / Clarios US Finance Co(b) 8.50%, 05/15/2027 | 465,789 |
| 160,000 | Cooper-Standard Automotive Inc(b) 13.00%, 06/01/2024 | 166,400 |
| 609,000 | Dick's Sporting Goods Inc 3.15%, 01/15/2032 | 475,318 |
| 1,070,000 | Dillard's Inc 7.75%, 07/15/2026 | 1,111,316 |
| 315,000 | Dornoch Debt Merger Sub Inc(b) 6.63%, 10/15/2029 | 220,990 |
| 745,000 | eG Global Finance PLC(b) 8.50%, 10/30/2025 | 694,059 |
| 200,000 | Ferguson Finance PLC(b) 3.25%, 06/02/2030 | 169,572 |
| Ferrellgas LP / Ferrellgas Finance Corp(b) | ||
| 164,000 | 5.38%, 04/01/2026 | 149,182 |
| 452,000 | 5.88%, 04/01/2029 | 371,734 |
| Ford Motor Co | ||
| 863,000 | 3.25%, 02/12/2032 | 647,200 |
| 191,000 | 4.75%, 01/15/2043 | 137,098 |
| 360,000 | Ford Motor Credit Co LLC 4.13%, 08/17/2027 | 322,200 |
| General Motors Co | ||
| 90,000 | 5.20%, 04/01/2045 | 73,149 |
| 525,000 | 5.40%, 04/01/2048 | 429,095 |
| Principal Amount(a) | Fair Value | |
| Consumer, Cyclical — (continued) | ||
| $ 810,000 | 5.95%, 04/01/2049 | $ 705,927 |
| General Motors Financial Co Inc(g)(h) | ||
| 50,000 | 5.70%, Perpetual | 42,319 |
| 30,000 | 5.75%, Perpetual | 25,257 |
| 765,000 | GENM Capital Labuan Ltd(b) 3.88%, 04/19/2031 | 569,579 |
| 765,000 | Goodyear Tire & Rubber Co(g) 4.88%, 03/15/2027 | 699,768 |
| Hilton Domestic Operating Co Inc(b) | ||
| 515,000 | 4.00%, 05/01/2031 | 430,864 |
| 140,000 | 3.63%, 02/15/2032 | 112,112 |
| Hilton Grand Vacations Borrower Escrow LLC / Hilton Grand Vacations Borrower Esc(b) | ||
| 330,000 | 5.00%, 06/01/2029 | 283,800 |
| 105,000 | 4.88%, 07/01/2031 | 85,696 |
| 50,000 | Hyatt Hotels Corp 5.63%, 04/23/2025 | 49,614 |
| 627,000 | Jacobs Entertainment Inc(b) 6.75%, 02/15/2029 | 565,950 |
| 583,000 | M/I Homes Inc 4.95%, 02/01/2028 | 517,972 |
| Marriott International Inc | ||
| 190,000 | 4.63%, 06/15/2030 | 177,292 |
| 305,000 | 2.85%, 04/15/2031 | 246,984 |
| 255,000 | Marriott Ownership Resorts Inc(b) 4.50%, 06/15/2029 | 211,555 |
| 935,000 | Mclaren Finance PLC(b) 7.50%, 08/01/2026 | 687,225 |
| NCL Corp Ltd(b) | ||
| 375,000 | 5.88%, 03/15/2026 | 294,551 |
| 350,000 | 5.88%, 02/15/2027 | 303,205 |
| 140,000 | NCL Finance Ltd(b) 6.13%, 03/15/2028 | 103,351 |
| 739,000 | NMG Holding Co Inc / Neiman Marcus Group LLC(b) 7.13%, 04/01/2026 | 692,641 |
| 875,000 | Nordstrom Inc 4.25%, 08/01/2031 | 625,712 |
| 683,000 | Premier Entertainment Sub LLC / Premier Entertainment Finance Corp(b) 5.63%, 09/01/2029 | 503,644 |
| PulteGroup Inc | ||
| 705,000 | 7.88%, 06/15/2032 | 783,467 |
| 415,000 | 6.38%, 05/15/2033 | 413,985 |
| Royal Caribbean Cruises Ltd(b) | ||
| 50,000 | 4.25%, 07/01/2026 | 40,417 |
| 725,000 | 5.50%, 04/01/2028(g) | 578,583 |
| 27,000 | 9.25%, 01/15/2029(g) | 27,745 |
| Scientific Games International Inc(b) | ||
| 215,000 | 7.00%, 05/15/2028 | 205,091 |
| 15,000 | 7.25%, 11/15/2029 | 14,400 |
| 170,000 | Tapestry Inc 3.05%, 03/15/2032 | 132,312 |
See Notes to Financial Statements.
Annual Report - December 31, 2022
EMPOWER FUNDS, INC.
EMPOWER MULTI-SECTOR BOND FUND
Schedule of Investments
As of December 31, 2022
| Principal Amount(a) | Fair Value | |
| Consumer, Cyclical — (continued) | ||
| Travel + Leisure Co | ||
| $ 155,000 | 6.63%, 07/31/2026(b) | $ 151,631 |
| 50,000 | 6.00%, 04/01/2027 | 47,455 |
| 540,000 | 4.50%, 12/01/2029(b) | 440,008 |
| 395,000 | 4.63%, 03/01/2030(b) | 327,562 |
| US Airways Pass Through Trust | ||
| Series 2011-1 Class A | ||
| 115,414 | 7.13%, 10/22/2023 | 115,981 |
| Series 2012-1 Class A | ||
| 279,127 | 5.90%, 10/01/2024 | 269,968 |
| Warnermedia Holdings Inc(b) | ||
| 215,000 | 4.05%, 03/15/2029 | 186,001 |
| 820,000 | 4.28%, 03/15/2032 | 675,487 |
| Yum! Brands Inc | ||
| 450,000 | 4.75%, 01/15/2030(b) | 412,875 |
| 555,000 | 3.63%, 03/15/2031 | 465,367 |
| 255,000 | 4.63%, 01/31/2032 | 225,401 |
| 24,693,506 | ||
| Consumer, Non-Cyclical — 4.22% | ||
| 136,000 | 1375209 BC Ltd(b) 9.00%, 01/30/2028 | 132,430 |
| 525,000 | Adani Ports & Special Economic Zone Ltd(b) 4.20%, 08/04/2027 | 460,831 |
| 788,000 | Akumin Inc(b) 7.00%, 11/01/2025 | 564,332 |
| 505,000 | Albertsons Cos Inc / Safeway Inc / New Albertsons LP / Albertsons LLC(b) 3.25%, 03/15/2026 | 460,588 |
| 270,000 | Alcon Finance Corp(b)(g) 5.38%, 12/06/2032 | 271,371 |
| Ashtead Capital Inc(b) | ||
| 1,070,000 | 4.38%, 08/15/2027 | 999,967 |
| 400,000 | 5.50%, 08/11/2032(g) | 382,588 |
| 1,016,000 | BAT Capital Corp 7.75%, 10/19/2032 | 1,092,784 |
| Bausch Health Cos Inc(b) | ||
| 55,000 | 6.13%, 02/01/2027 | 37,930 |
| 45,000 | 7.00%, 01/15/2028 | 21,751 |
| 245,000 | 5.00%, 01/30/2028 | 117,599 |
| 380,000 | 4.88%, 06/01/2028 | 241,696 |
| 242,000 | 11.00%, 09/30/2028 | 188,722 |
| 25,000 | 5.00%, 02/15/2029 | 11,981 |
| 30,000 | 6.25%, 02/15/2029 | 14,443 |
| 200,000 | 5.25%, 01/30/2030 | 95,932 |
| 47,000 | 14.00%, 10/15/2030 | 27,901 |
| 315,000 | 5.25%, 02/15/2031 | 152,640 |
| 1,025,000 | Bio-Rad Laboratories Inc 3.70%, 03/15/2032 | 877,934 |
| 350,000 | Block Inc 3.50%, 06/01/2031 | 279,274 |
| 929,000 | Carriage Services Inc(b) 4.25%, 05/15/2029 | 737,717 |
| 325,000 | Catalent Pharma Solutions Inc(b) 3.13%, 02/15/2029 | 258,773 |
| Principal Amount(a) | Fair Value | |
| Consumer, Non-Cyclical — (continued) | ||
| Centene Corp | ||
| $ 60,000 | 4.63%, 12/15/2029 | $ 54,830 |
| 260,000 | 3.00%, 10/15/2030 | 213,135 |
| 1,165,000 | 2.50%, 03/01/2031 | 911,581 |
| 510,000 | 2.63%, 08/01/2031 | 400,758 |
| 350,000 | Central American Bottling Corp / CBC Bottling Holdco SL / Beliv Holdco SL(b) 5.25%, 04/27/2029 | 326,277 |
| Charles River Laboratories International Inc(b) | ||
| 115,000 | 3.75%, 03/15/2029 | 101,706 |
| 120,000 | 4.00%, 03/15/2031 | 103,800 |
| 945,000 | Cheplapharm Arzneimittel GmbH(b) 5.50%, 01/15/2028 | 790,209 |
| CHS / Community Health Systems Inc(b) | ||
| 378,000 | 6.88%, 04/15/2029 | 194,278 |
| 378,000 | 6.13%, 04/01/2030 | 187,177 |
| 886,000 | 4.75%, 02/15/2031 | 643,254 |
| 1,012,000 | CoStar Group Inc(b) 2.80%, 07/15/2030 | 826,490 |
| 45,000 | Darling Ingredients Inc(b) 6.00%, 06/15/2030 | 43,987 |
| 866,000 | DaVita Inc(b) 3.75%, 02/15/2031 | 646,339 |
| 254,000 | Deluxe Corp(b)(g) 8.00%, 06/01/2029 | 208,915 |
| 1,170,000 | DENTSPLY SIRONA Inc 3.25%, 06/01/2030 | 971,289 |
| 75,000 | Encompass Health Corp 4.75%, 02/01/2030 | 65,861 |
| Gartner Inc(b) | ||
| 45,000 | 3.63%, 06/15/2029 | 39,542 |
| 360,000 | 3.75%, 10/01/2030 | 310,308 |
| 740,000 | GE HealthCare Technologies Inc(b) 5.86%, 03/15/2030 | 757,288 |
| Global Payments Inc(g) | ||
| 220,000 | 5.30%, 08/15/2029 | 212,689 |
| 105,000 | 2.90%, 11/15/2031 | 82,800 |
| 460,000 | 5.40%, 08/15/2032 | 438,081 |
| 875,000 | HCA Inc 4.13%, 06/15/2029 | 798,780 |
| 795,000 | HLF Financing SARL LLC / Herbalife International Inc(b) 4.88%, 06/01/2029 | 547,572 |
| 860,000 | Hologic Inc(b) 3.25%, 02/15/2029 | 738,479 |
| JBS USA LUX SA / JBS USA Food Co / JBS USA Finance Inc(b) | ||
| 260,000 | 3.00%, 02/02/2029 | 215,188 |
| 275,000 | 3.75%, 12/01/2031(g) | 224,648 |
| 205,000 | Lannett Co Inc(b) 7.75%, 04/15/2026 | 53,300 |
| 477,000 | Legacy LifePoint Health LLC(b) 6.75%, 04/15/2025 | 448,900 |
| 327,000 | Metis Merger Sub LLC(b) 6.50%, 05/15/2029 | 274,511 |
See Notes to Financial Statements.
Annual Report - December 31, 2022
EMPOWER FUNDS, INC.
EMPOWER MULTI-SECTOR BOND FUND
Schedule of Investments
As of December 31, 2022
| Principal Amount(a) | Fair Value | |
| Consumer, Non-Cyclical — (continued) | ||
| $ 335,000 | Molina Healthcare Inc(b) 3.88%, 05/15/2032 | $ 278,197 |
| 365,000 | Natura Cosmeticos SA(b) 4.13%, 05/03/2028 | 297,844 |
| 45,000 | Neptune Bidco US Inc(b)(g) 9.29%, 04/15/2029 | 42,412 |
| 327,000 | Par Pharmaceutical Inc(b)(i) 7.50%, 04/01/2027 | 248,512 |
| 850,000 | Pfizer Inc 3.00%, 12/15/2026 | 804,233 |
| Pilgrim's Pride Corp(b) | ||
| 185,000 | 4.25%, 04/15/2031 | 157,353 |
| 840,000 | 3.50%, 03/01/2032 | 657,300 |
| 100,000 | Smithfield Foods Inc(b) 3.00%, 10/15/2030 | 76,139 |
| 652,000 | Surgery Center Holdings Inc(b) 6.75%, 07/01/2025 | 642,715 |
| 516,000 | Team Health Holdings Inc(b) 6.38%, 02/01/2025 | 297,340 |
| Tenet Healthcare Corp(b) | ||
| 140,000 | 4.88%, 01/01/2026 | 132,390 |
| 175,000 | 6.25%, 02/01/2027 | 168,089 |
| 40,000 | 6.13%, 10/01/2028 | 35,813 |
| Teva Pharmaceutical Finance Netherlands III BV | ||
| 1,624,000 | 3.15%, 10/01/2026 | 1,420,188 |
| 210,000 | 4.75%, 05/09/2027 | 189,819 |
| 2,550,000 | 4.10%, 10/01/2046 | 1,559,134 |
| 545,000 | TriNet Group Inc(b) 3.50%, 03/01/2029 | 448,099 |
| 769,000 | Turning Point Brands Inc(b) 5.63%, 02/15/2026 | 663,270 |
| 900,000 | Universal Health Services Inc 2.65%, 01/15/2032 | 687,303 |
| 28,067,306 | ||
| Energy — 5.55% | ||
| Aker BP ASA(b) | ||
| 530,000 | 2.00%, 07/15/2026 | 468,155 |
| 615,000 | 3.75%, 01/15/2030 | 541,011 |
| 730,000 | 4.00%, 01/15/2031 | 639,770 |
| 380,000 | 3.10%, 07/15/2031 | 311,647 |
| 757,000 | Alliance Resource Operating Partners LP / Alliance Resource Finance Corp(b) 7.50%, 05/01/2025 | 751,323 |
| 509,780 | Alta Wind Holdings LLC(b) 7.00%, 06/30/2035 | 503,811 |
| 742,000 | Antero Midstream Partners LP / Antero Midstream Finance Corp(b) 5.75%, 01/15/2028 | 688,287 |
| 559,000 | Ascent Resources Utica Holdings LLC / ARU Finance Corp(b) 8.25%, 12/31/2028 | 547,932 |
| 955,000 | BP Capital Markets PLC(h) 4.88%, Perpetual | 835,625 |
| 245,000 | Callon Petroleum Co(b)(g) 7.50%, 06/15/2030 | 224,175 |
| Principal Amount(a) | Fair Value | |
| Energy — (continued) | ||
| $ 1,035,000 | Cheniere Corpus Christi Holdings LLC 3.70%, 11/15/2029 | $ 935,558 |
| 472,000 | CITGO Petroleum Corp(b) 7.00%, 06/15/2025 | 460,370 |
| Continental Resources Inc | ||
| 300,000 | 4.38%, 01/15/2028 | 274,878 |
| 2,090,000 | 5.75%, 01/15/2031(b) | 1,945,498 |
| 995,000 | 2.88%, 04/01/2032(b)(g) | 736,985 |
| 644,000 | Coronado Finance Pty Ltd(b) 10.75%, 05/15/2026 | 658,490 |
| CrownRock LP / CrownRock Finance Inc(b) | ||
| 168,000 | 5.63%, 10/15/2025 | 162,120 |
| 284,000 | 5.00%, 05/01/2029 | 255,178 |
| DCP Midstream Operating LP | ||
| 5,000 | 5.13%, 05/15/2029 | 4,819 |
| 355,000 | 3.25%, 02/15/2032 | 293,631 |
| 395,000 | 6.45%, 11/03/2036(b) | 387,070 |
| 250,000 | Diamondback Energy Inc 3.13%, 03/24/2031 | 207,015 |
| 1,445,000 | Ecopetrol SA 4.63%, 11/02/2031 | 1,103,749 |
| 805,000 | Enbridge Inc 7.63%, 01/15/2083 | 793,980 |
| Energean Israel Finance Ltd(b) | ||
| 360,000 | 5.38%, 03/30/2028 | 322,200 |
| 470,000 | 5.88%, 03/30/2031 | 409,488 |
| Energy Transfer LP | ||
| 828,000 | 6.50%, Perpetual(h) | 712,080 |
| 110,000 | 3.75%, 05/15/2030(g) | 96,985 |
| 655,000 | 5.75%, 02/15/2033 | 640,826 |
| EQT Corp | ||
| 565,000 | 3.90%, 10/01/2027 | 521,588 |
| 110,000 | 5.70%, 04/01/2028 | 109,409 |
| 135,000 | 5.00%, 01/15/2029 | 126,732 |
| 505,000 | 3.63%, 05/15/2031(b)(g) | 427,955 |
| 630,000 | Flex Intermediate Holdco LLC(b) 3.36%, 06/30/2031 | 491,664 |
| 75,000 | Gray Oak Pipeline LLC(b) 3.45%, 10/15/2027 | 66,328 |
| 395,000 | Hess Midstream Operations LP(b) 4.25%, 02/15/2030 | 337,694 |
| 655,000 | HF Sinclair Corp 5.88%, 04/01/2026 | 655,550 |
| Hilcorp Energy I LP / Hilcorp Finance Co(b) | ||
| 796,000 | 5.75%, 02/01/2029 | 708,493 |
| 353,000 | 6.00%, 02/01/2031 | 304,483 |
| 320,000 | International Petroleum Corp(b) 7.25%, 02/01/2027 | 294,400 |
| 545,000 | KazMunayGas National Co JSC(b) 4.75%, 04/19/2027 | 501,945 |
| 920,000 | Kinder Morgan Inc 7.75%, 01/15/2032 | 1,034,355 |
| 255,000 | Leviathan Bond Ltd(b) 6.13%, 06/30/2025 | 249,263 |
See Notes to Financial Statements.
Annual Report - December 31, 2022
EMPOWER FUNDS, INC.
EMPOWER MULTI-SECTOR BOND FUND
Schedule of Investments
As of December 31, 2022
| Principal Amount(a) | Fair Value | |
| Energy — (continued) | ||
| $ 420,000 | Magnolia Oil & Gas Operating LLC / Magnolia Oil & Gas Finance Corp(b) 6.00%, 08/01/2026 | $ 403,200 |
| 630,000 | Nabors Industries Ltd(b) 7.25%, 01/15/2026 | 593,711 |
| 401,000 | Northriver Midstream Finance LP(b) 5.63%, 02/15/2026 | 379,778 |
| Occidental Petroleum Corp | ||
| 10,000 | 5.55%, 03/15/2026 | 9,963 |
| 135,000 | 8.88%, 07/15/2030 | 152,416 |
| 25,000 | 6.63%, 09/01/2030 | 25,835 |
| 903,000 | 6.13%, 01/01/2031 | 911,298 |
| 15,000 | 7.50%, 05/01/2031 | 16,027 |
| 255,000 | 7.88%, 09/15/2031 | 281,520 |
| Ovintiv Inc | ||
| 90,000 | 8.13%, 09/15/2030 | 98,762 |
| 20,000 | 7.20%, 11/01/2031 | 20,992 |
| 80,000 | 7.38%, 11/01/2031 | 85,151 |
| 680,000 | 6.50%, 08/15/2034(g) | 684,248 |
| 160,000 | 6.63%, 08/15/2037 | 160,919 |
| 30,000 | 6.50%, 02/01/2038 | 29,722 |
| 430,000 | Parsley Energy LLC / Parsley Finance Corp(b) 4.13%, 02/15/2028 | 394,890 |
| 1,800,000 | Petroleos de Venezuela SA(b)(i) 6.00%, 05/16/2024 | 85,500 |
| Petroleos Mexicanos | ||
| 1,180,000 | 6.50%, 03/13/2027 | 1,076,257 |
| 1,475,000 | 6.70%, 02/16/2032 | 1,158,239 |
| 600,000 | 7.69%, 01/23/2050 | 415,139 |
| 800,000 | Petronas Capital Ltd(b) 3.50%, 04/21/2030 | 729,263 |
| 195,000 | Plains All American Pipeline LP / PAA Finance Corp 3.80%, 09/15/2030 | 169,471 |
| 900,000 | Reliance Industries Ltd(b) 2.88%, 01/12/2032 | 729,661 |
| 700,000 | Sabine Pass Liquefaction LLC 4.20%, 03/15/2028 | 657,980 |
| 500,000 | Sanchez Energy Corp(i)(j) 0.00%, 02/15/2023 | 6,875 |
| 1,020,000 | Saudi Arabian Oil Co(b) 2.25%, 11/24/2030 | 838,766 |
| Southwestern Energy Co | ||
| 656,000 | 5.38%, 02/01/2029 | 608,151 |
| 90,000 | 4.75%, 02/01/2032 | 76,913 |
| 515,000 | State Oil Co of the Azerbaijan Republic 6.95%, 03/18/2030 | 530,699 |
| 35,000 | Targa Resources Corp 5.20%, 07/01/2027 | 34,305 |
| Targa Resources Partners LP / Targa Resources Partners Finance Corp | ||
| 80,000 | 5.50%, 03/01/2030 | 75,274 |
| 230,000 | 4.88%, 02/01/2031 | 207,679 |
| 195,000 | 4.00%, 01/15/2032 | 164,071 |
| Principal Amount(a) | Fair Value | |
| Energy — (continued) | ||
| $ 473,000 | Teine Energy Ltd(b) 6.88%, 04/15/2029 | $ 424,518 |
| 549,000 | USA Compression Partners LP / USA Compression Finance Corp 6.88%, 04/01/2026 | 526,650 |
| Var Energi ASA(b) | ||
| 640,000 | 7.50%, 01/15/2028 | 651,905 |
| 470,000 | 8.00%, 11/15/2032 | 485,377 |
| Venture Global Calcasieu Pass LLC(b) | ||
| 60,000 | 3.88%, 08/15/2029 | 52,500 |
| 844,000 | 4.13%, 08/15/2031 | 719,084 |
| Western Midstream Operating LP | ||
| 120,000 | 4.30%, 02/01/2030 | 104,750 |
| 55,000 | 5.45%, 04/01/2044 | 45,690 |
| 280,000 | 5.30%, 03/01/2048 | 230,224 |
| 35,000 | 5.50%, 08/15/2048 | 29,049 |
| 150,000 | 5.50%, 02/01/2050 | 123,570 |
| 36,948,507 | ||
| Financial — 14.56% | ||
| 962,000 | Acrisure LLC / Acrisure Finance Inc(b) 7.00%, 11/15/2025 | 883,898 |
| AerCap Ireland Capital Designated Activity Co / AerCap Global Aviation Trust | ||
| 730,000 | 2.45%, 10/29/2026 | 638,342 |
| 425,000 | 3.00%, 10/29/2028 | 356,055 |
| 535,000 | 3.30%, 01/30/2032 | 418,242 |
| 100,000 | AGFC Capital Trust I(b)(c) 5.83%, 01/15/2067 3-mo. LIBOR + 1.75% | 55,081 |
| 430,000 | Agile Group Holdings Ltd 6.05%, 10/13/2025 | 195,188 |
| Air Lease Corp | ||
| 640,000 | 4.65%, Perpetual(h) | 534,861 |
| 595,000 | 3.38%, 07/01/2025 | 562,763 |
| 10,000 | 4.63%, 10/01/2028 | 9,353 |
| 95,000 | 3.25%, 10/01/2029 | 80,890 |
| 380,000 | 3.00%, 02/01/2030 | 316,910 |
| 1,275,000 | 3.13%, 12/01/2030 | 1,056,588 |
| Aircastle Ltd | ||
| 215,000 | 5.25%, Perpetual(b)(h) | 165,550 |
| 1,210,000 | 4.25%, 06/15/2026 | 1,137,922 |
| 1,020,000 | Allstate Corp 5.75%, 08/15/2053 | 958,800 |
| Ally Financial Inc | ||
| 2,524,000 | 4.70%, Perpetual(h) | 1,659,238 |
| 280,000 | 2.20%, 11/02/2028(g) | 218,308 |
| 120,000 | American Homes 4 Rent LP REIT 2.38%, 07/15/2031 | 92,559 |
| Antares Holdings LP(b) | ||
| 1,125,000 | 6.00%, 08/15/2023 | 1,108,990 |
| 250,000 | 2.75%, 01/15/2027 | 200,269 |
| 250,000 | 3.75%, 07/15/2027 | 202,099 |
See Notes to Financial Statements.
Annual Report - December 31, 2022
EMPOWER FUNDS, INC.
EMPOWER MULTI-SECTOR BOND FUND
Schedule of Investments
As of December 31, 2022
| Principal Amount(a) | Fair Value | |
| Financial — (continued) | ||
| Ares Capital Corp | ||
| $ 555,000 | 2.88%, 06/15/2028 | $ 445,015 |
| 785,000 | 3.20%, 11/15/2031(g) | 576,072 |
| 755,000 | Ascot Group Ltd(b) 4.25%, 12/15/2030 | 649,415 |
| Athene Global Funding(b) | ||
| 620,000 | 1.61%, 06/29/2026 | 534,794 |
| 1,150,000 | 2.55%, 11/19/2030 | 888,816 |
| 385,000 | Athene Holding Ltd 3.50%, 01/15/2031 | 316,121 |
| Aviation Capital Group LLC(b) | ||
| 910,000 | 5.50%, 12/15/2024 | 893,833 |
| 365,000 | 1.95%, 01/30/2026 | 317,761 |
| 438,000 | Avolon Holdings Funding Ltd(b) 4.38%, 05/01/2026 | 399,082 |
| 935,000 | Banco Mercantil del Norte SA(b)(h) 6.63%, Perpetual | 774,480 |
| 1,110,000 | Banco Santander Chile(b)(g) 3.18%, 10/26/2031 | 944,888 |
| 545,000 | Banco Santander Mexico SA Institucion de Banca Multiple Grupo Financiero Santand(b) 5.38%, 04/17/2025 | 539,278 |
| 2,600,000 | Banco Santander SA 5.18%, 11/19/2025 | 2,557,562 |
| Bank of America Corp | ||
| 750,000 | 2.69%, 04/22/2032 | 600,288 |
| 1,470,000 | 2.48%, 09/21/2036 | 1,080,098 |
| Bank of New York Mellon Corp | ||
| 665,000 | 4.70%, Perpetual(h) | 638,486 |
| 870,000 | 5.83%, 10/25/2033 | 901,837 |
| Barclays PLC | ||
| 760,000 | 4.38%, Perpetual(h) | 579,500 |
| 1,315,000 | 2.28%, 11/24/2027 | 1,136,655 |
| 200,000 | 5.09%, 06/20/2030 | 184,212 |
| 695,000 | 7.44%, 11/02/2033 | 728,222 |
| 985,000 | 3.56%, 09/23/2035 | 749,530 |
| 445,000 | Barings BDC Inc 3.30%, 11/23/2026 | 377,172 |
| BBVA Bancomer SA(b) | ||
| 200,000 | 1.88%, 09/18/2025 | 181,250 |
| 570,000 | 5.13%, 01/18/2033 | 511,633 |
| 678,000 | Blackstone Private Credit Fund 2.63%, 12/15/2026 | 561,197 |
| 1,530,000 | Blackstone Secured Lending Fund 2.13%, 02/15/2027 | 1,266,865 |
| 640,000 | Blue Owl Finance LLC(b) 3.13%, 06/10/2031 | 475,337 |
| 775,000 | BNP Paribas SA(b) 2.59%, 01/20/2028 | 681,614 |
| 608,000 | Brighthouse Financial Inc(g) 5.63%, 05/15/2030 | 578,254 |
| 75,000 | Brixmor Operating Partnership LP REIT 4.05%, 07/01/2030 | 65,610 |
| 610,000 | BroadStreet Partners Inc(b) 5.88%, 04/15/2029 | 519,160 |
| 425,000 | Capital Farm Credit ACA(b)(h) 5.00%, Perpetual | 369,750 |
| Principal Amount(a) | Fair Value | |
| Financial — (continued) | ||
| Central China Real Estate Ltd | ||
| $ 200,000 | 7.25%, 04/24/2023 | $ 86,000 |
| 205,000 | 7.50%, 07/14/2025 | 56,375 |
| 200,000 | CIFI Holdings Group Co Ltd 6.00%, 07/16/2025 | 51,558 |
| 905,000 | Citadel LP(b) 4.88%, 01/15/2027 | 841,122 |
| 325,000 | Citigroup Inc(h) 6.25%, Perpetual | 315,250 |
| 480,000 | CNO Financial Group Inc 5.25%, 05/30/2029 | 457,298 |
| 452,000 | Cobra AcquisitionCo LLC(b) 6.38%, 11/01/2029 | 266,680 |
| 626,000 | Corebridge Financial Inc(b) 6.88%, 12/15/2052 | 578,446 |
| 110,000 | Corporate Office Properties LP REIT 2.75%, 04/15/2031 | 82,324 |
| 400,000 | Country Garden Holdings Co Ltd 3.30%, 01/12/2031 | 208,616 |
| Credit Suisse Group AG(b) | ||
| 250,000 | 2.19%, 06/05/2026 | 213,523 |
| 695,000 | 6.37%, 07/15/2026 | 652,500 |
| 675,000 | 6.44%, 08/11/2028 | 614,720 |
| 250,000 | 6.54%, 08/12/2033 | 219,348 |
| 940,000 | 9.02%, 11/15/2033 | 962,435 |
| Crown Castle Inc REIT | ||
| 460,000 | 3.30%, 07/01/2030 | 402,405 |
| 1,130,000 | 2.25%, 01/15/2031 | 906,522 |
| 25,000 | 2.50%, 07/15/2031 | 20,146 |
| Deutsche Bank AG | ||
| 290,000 | 3.55%, 09/18/2031 | 232,490 |
| 1,004,000 | 3.73%, 01/14/2032 | 736,147 |
| 200,000 | 3.74%, 01/07/2033 | 142,035 |
| 629,000 | Discover Financial Services(g) 6.70%, 11/29/2032 | 639,364 |
| 288,929 | Doric Nimrod Air Alpha Pass Through Trust(b) Series 2013-1 Class A 5.25%, 05/30/2023 | 286,730 |
| 970,000 | Drawbridge Special Opportunities Fund LP / Drawbridge Special Opportunities Fin(b) 3.88%, 02/15/2026 | 874,262 |
| EPR Properties REIT | ||
| 700,000 | 4.75%, 12/15/2026 | 628,962 |
| 185,000 | 3.60%, 11/15/2031 | 134,033 |
| Equinix Inc REIT | ||
| 880,000 | 3.20%, 11/18/2029 | 765,971 |
| 615,000 | 2.15%, 07/15/2030 | 489,257 |
| 525,000 | Fidelity National Financial Inc 3.40%, 06/15/2030 | 443,141 |
| FS KKR Capital Corp | ||
| 318,000 | 3.40%, 01/15/2026 | 281,988 |
| 535,000 | 3.13%, 10/12/2028 | 431,301 |
| 510,000 | Global Atlantic Finance Co(b) 4.40%, 10/15/2029 | 426,916 |
See Notes to Financial Statements.
Annual Report - December 31, 2022
EMPOWER FUNDS, INC.
EMPOWER MULTI-SECTOR BOND FUND
Schedule of Investments
As of December 31, 2022
| Principal Amount(a) | Fair Value | |
| Financial — (continued) | ||
| GLP Capital LP / GLP Financing II Inc REIT | ||
| $ 440,000 | 5.25%, 06/01/2025 | $ 432,526 |
| 108,000 | 5.75%, 06/01/2028 | 105,897 |
| 355,000 | 3.25%, 01/15/2032 | 283,782 |
| Goldman Sachs Group Inc | ||
| 880,000 | 1.54%, 09/10/2027 | 759,112 |
| 1,410,000 | 4.48%, 08/23/2028 | 1,351,365 |
| Icahn Enterprises LP / Icahn Enterprises Finance Corp | ||
| 198,000 | 6.25%, 05/15/2026 | 190,257 |
| 811,000 | 5.25%, 05/15/2027 | 742,552 |
| 65,000 | 4.38%, 02/01/2029 | 54,967 |
| 725,000 | Intercorp Peru Ltd(b) 3.88%, 08/15/2029 | 596,670 |
| Iron Mountain Inc REIT(b) | ||
| 380,000 | 5.25%, 07/15/2030 | 330,220 |
| 686,000 | 4.50%, 02/15/2031 | 563,851 |
| 1,205,000 | Itau Unibanco Holding SA(b)(g) 3.88%, 04/15/2031 | 1,095,875 |
| 355,000 | Jefferies Financial Group Inc 6.45%, 06/08/2027 | 370,460 |
| JPMorgan Chase & Co | ||
| 343,000 | 4.60%, Perpetual(h) | 302,269 |
| 1,215,000 | 1.95%, 02/04/2032 | 929,383 |
| 610,000 | 5.72%, 09/14/2033 | 595,393 |
| Kaisa Group Holdings Ltd(i) | ||
| 1,015,000 | 9.38%, 06/30/2024 | 137,512 |
| 1,200,000 | 11.25%, 04/16/2025 | 162,914 |
| 1,000,000 | KeyCorp Capital III 7.75%, 07/15/2029 | 1,064,381 |
| 815,000 | Kite Realty Group Trust REIT 4.75%, 09/15/2030 | 717,474 |
| Ladder Capital Finance Holdings LLLP / Ladder Capital Finance Corp REIT(b) | ||
| 125,000 | 5.25%, 10/01/2025 | 117,443 |
| 1,117,000 | 4.25%, 02/01/2027 | 938,313 |
| 660,000 | Liberty Mutual Group Inc(b) 4.13%, 12/15/2051 | 537,636 |
| 715,000 | Lincoln National Corp(c) 6.28%, 04/20/2067 3-mo. LIBOR + 2.04% | 514,800 |
| 200,000 | Logan Group Co Ltd 4.25%, 07/12/2025 | 44,000 |
| 600,000 | MBIA Insurance Corp(b)(c)(i) 15.34%, 01/15/2033 3-mo. LIBOR + 11.26% | 45,348 |
| MetLife Inc | ||
| 1,045,000 | 3.85%, Perpetual(h) | 970,544 |
| 340,000 | 5.88%, Perpetual(g)(h) | 323,295 |
| 245,000 | 9.25%, 04/08/2038(b) | 285,410 |
| 915,000 | 10.75%, 08/01/2039 | 1,213,921 |
| 840,000 | Midcap Financial Issuer Trust(b) 6.50%, 05/01/2028 | 722,400 |
| 1,154,000 | Mitsubishi UFJ Financial Group Inc 3.85%, 03/01/2026 | 1,104,054 |
| 835,000 | Morgan Stanley 6.34%, 10/18/2033 | 874,917 |
| Principal Amount(a) | Fair Value | |
| Financial — (continued) | ||
| MPT Operating Partnership LP / MPT Finance Corp REIT | ||
| $ 175,000 | 4.63%, 08/01/2029(g) | $ 133,452 |
| 346,000 | 3.50%, 03/15/2031 | 237,177 |
| 1,410,000 | Mutual of Omaha Insurance Co(b) 6.80%, 06/15/2036 | 1,467,146 |
| 355,000 | NatWest Group PLC 5.52%, 09/30/2028 | 350,627 |
| Navient Corp | ||
| 5,000 | 6.13%, 03/25/2024 | 4,898 |
| 10,000 | 5.88%, 10/25/2024 | 9,676 |
| 273,000 | 6.75%, 06/15/2026 | 258,746 |
| 790,000 | 5.00%, 03/15/2027 | 691,576 |
| 840,000 | Northern Trust Corp 6.13%, 11/02/2032 | 885,731 |
| 385,000 | Oaktree Specialty Lending Corp 2.70%, 01/15/2027 | 326,913 |
| 433,000 | Office Properties Income Trust REIT 2.65%, 06/15/2026 | 335,574 |
| 405,000 | OneMain Finance Corp 6.88%, 03/15/2025 | 389,073 |
| 322,000 | Ontario Teachers' Cadillac Fairview Properties Trust(b) 2.50%, 10/15/2031 | 245,457 |
| Owl Rock Capital Corp | ||
| 522,000 | 2.63%, 01/15/2027 | 430,614 |
| 545,000 | 2.88%, 06/11/2028 | 427,920 |
| 659,000 | OWL Rock Core Income Corp 4.70%, 02/08/2027 | 594,226 |
| 295,000 | Owl Rock Technology Finance Corp 2.50%, 01/15/2027 | 240,481 |
| 535,000 | Penn Mutual Life Insurance Co(b) 6.65%, 06/15/2034 | 545,171 |
| 740,000 | Phillips Edison Grocery Center Operating Partnership I LP REIT 2.63%, 11/15/2031 | 541,511 |
| Prudential Financial Inc | ||
| 860,000 | 5.63%, 06/15/2043 | 844,950 |
| 226,000 | 5.13%, 03/01/2052 | 205,660 |
| 171,000 | 6.00%, 09/01/2052 | 165,267 |
| 585,000 | Regency Centers LP REIT 2.95%, 09/15/2029 | 491,000 |
| Rocket Mortgage LLC / Rocket Mortgage Co-Issuer Inc(b) | ||
| 1,890,000 | 2.88%, 10/15/2026(g) | 1,620,037 |
| 900,000 | 3.63%, 03/01/2029(g) | 713,194 |
| 1,355,000 | 3.88%, 03/01/2031 | 1,034,238 |
| 1,045,000 | 4.00%, 10/15/2033 | 780,469 |
| 380,000 | Santander Holdings USA Inc 4.40%, 07/13/2027 | 362,394 |
| 905,000 | SBA Communications Corp REIT 3.13%, 02/01/2029 | 752,498 |
See Notes to Financial Statements.
Annual Report - December 31, 2022
EMPOWER FUNDS, INC.
EMPOWER MULTI-SECTOR BOND FUND
Schedule of Investments
As of December 31, 2022
| Principal Amount(a) | Fair Value | |
| Financial — (continued) | ||
| $ 920,000 | Service Properties Trust REIT(g) 4.95%, 02/15/2027 | $ 724,592 |
| Shimao Group Holdings Ltd(i) | ||
| 235,000 | 5.60%, 07/15/2026 | 42,883 |
| 400,000 | 3.45%, 01/11/2031 | 70,805 |
| 400,000 | Sino-Ocean Land Treasure IV Ltd 4.75%, 01/14/2030 | 202,872 |
| 150,000 | Sirius International Group Ltd(b) 4.60%, 11/01/2026 | 128,888 |
| Societe Generale SA(b) | ||
| 1,740,000 | 4.75%, 11/24/2025 | 1,670,128 |
| 2,475,000 | 4.25%, 08/19/2026 | 2,306,520 |
| 850,000 | Spirit Realty LP REIT 3.40%, 01/15/2030 | 708,120 |
| Standard Chartered PLC(b) | ||
| 1,145,000 | 4.64%, 04/01/2031 | 1,028,939 |
| 895,000 | 3.27%, 02/18/2036 | 661,782 |
| 765,000 | Stewart Information Services Corp 3.60%, 11/15/2031 | 586,240 |
| 531,000 | Sumitomo Mitsui Financial Group Inc 1.47%, 07/08/2025 | 483,830 |
| Sunac China Holdings Ltd(i) | ||
| 200,000 | 6.50%, 01/10/2025 | 42,834 |
| 200,000 | 7.00%, 07/09/2025 | 41,000 |
| 235,000 | 6.50%, 01/26/2026 | 47,620 |
| Synchrony Bank | ||
| 275,000 | 5.40%, 08/22/2025 | 269,899 |
| 550,000 | 5.63%, 08/23/2027 | 535,938 |
| 843,000 | Texas Capital Bancshares Inc 4.00%, 05/06/2031 | 748,108 |
| 405,000 | Times China Holdings Ltd(i) 6.20%, 03/22/2026 | 65,647 |
| 705,000 | Toronto-Dominion Bank 8.13%, 10/31/2082 | 733,200 |
| 1,070,000 | Truist Financial Corp(h) 5.10%, Perpetual | 989,750 |
| 200,000 | UniCredit SpA(b) 5.86%, 06/19/2032 | 175,575 |
| VICI Properties LP / VICI Note Co Inc REIT(b) | ||
| 215,000 | 5.63%, 05/01/2024 | 212,906 |
| 350,000 | 4.63%, 06/15/2025 | 335,563 |
| 295,000 | 4.50%, 09/01/2026 | 277,618 |
| 365,000 | 4.25%, 12/01/2026 | 340,517 |
| 195,000 | 5.75%, 02/01/2027 | 190,078 |
| 660,000 | 3.88%, 02/15/2029 | 578,447 |
| VICI Properties LP REIT | ||
| 595,000 | 4.95%, 02/15/2030 | 566,391 |
| 205,000 | 5.13%, 05/15/2032 | 189,820 |
| Wells Fargo & Co | ||
| 1,215,000 | 3.90%, Perpetual(h) | 1,063,447 |
| 325,000 | 2.39%, 06/02/2028 | 286,841 |
| Yuzhou Group Holdings Co Ltd(i) | ||
| 315,000 | 7.70%, 02/20/2025 | 27,859 |
| Principal Amount(a) | Fair Value | |
| Financial — (continued) | ||
| $ 200,000 | 8.30%, 05/27/2025 | $ 17,558 |
| 200,000 | 7.85%, 08/12/2026 | 17,628 |
| 765,000 | Zions Bancorp NA 3.25%, 10/29/2029 | 625,158 |
| 96,883,176 | ||
| Industrial — 3.20% | ||
| 1,043,322 | ARD Finance SA(b)(k) 6.50%, 06/30/2027 PIK rate, 7.25% | 725,664 |
| 740,000 | Avnet Inc 5.50%, 06/01/2032 | 683,316 |
| Boeing Co | ||
| 150,000 | 3.20%, 03/01/2029 | 131,533 |
| 220,000 | 2.95%, 02/01/2030(g) | 186,323 |
| 995,000 | 5.15%, 05/01/2030 | 970,761 |
| 555,000 | 3.63%, 02/01/2031(g) | 486,273 |
| 115,000 | 3.50%, 03/01/2039 | 82,868 |
| 490,000 | 3.38%, 06/15/2046 | 318,377 |
| 105,000 | 3.65%, 03/01/2047 | 70,436 |
| 285,000 | 3.63%, 03/01/2048 | 186,466 |
| 35,000 | 3.85%, 11/01/2048 | 24,024 |
| 695,000 | 3.75%, 02/01/2050 | 477,158 |
| 530,000 | 5.93%, 05/01/2060 | 482,800 |
| Cemex SAB de CV(b) | ||
| 375,000 | 5.13%, Perpetual(h) | 346,504 |
| 400,000 | 5.45%, 11/19/2029 | 383,998 |
| 885,000 | 5.20%, 09/17/2030 | 825,605 |
| 1,400,000 | 3.88%, 07/11/2031 | 1,181,649 |
| Chart Industries Inc(b) | ||
| 10,000 | 7.50%, 01/01/2030 | 10,053 |
| 410,000 | 9.50%, 01/01/2031 | 420,500 |
| Embraer Netherlands Finance BV | ||
| 185,000 | 5.05%, 06/15/2025 | 179,544 |
| 950,000 | 5.40%, 02/01/2027 | 909,625 |
| 1,480,000 | General Electric Co(c)(h) 8.10%, Perpetual 3-mo. LIBOR + 3.33% | 1,454,015 |
| 846,000 | Global Infrastructure Solutions Inc(b) 7.50%, 04/15/2032 | 669,668 |
| 235,000 | Huntington Ingalls Industries Inc 4.20%, 05/01/2030 | 213,292 |
| 400,000 | IHS Holding Ltd(b) 5.63%, 11/29/2026 | 330,200 |
| 540,000 | Jabil Inc 3.00%, 01/15/2031 | 446,990 |
| 749,000 | LSB Industries Inc(b) 6.25%, 10/15/2028 | 685,298 |
| 876,000 | New Enterprise Stone & Lime Co Inc(b) 9.75%, 07/15/2028 | 809,371 |
| 230,000 | OT Merger Corp(b) 7.88%, 10/15/2029 | 121,900 |
| 502,000 | Owens Corning 7.00%, 12/01/2036 | 531,259 |
| 900,000 | Pentair Finance SARL 5.90%, 07/15/2032 | 882,065 |
See Notes to Financial Statements.
Annual Report - December 31, 2022
EMPOWER FUNDS, INC.
EMPOWER MULTI-SECTOR BOND FUND
Schedule of Investments
As of December 31, 2022
| Principal Amount(a) | Fair Value | |
| Industrial — (continued) | ||
| $ 300,000 | Sensata Technologies BV(b) 4.00%, 04/15/2029 | $ 258,750 |
| TD SYNNEX Corp | ||
| 750,000 | 1.75%, 08/09/2026 | 637,476 |
| 885,000 | 2.38%, 08/09/2028 | 713,955 |
| 1,320,000 | Textron Inc 3.00%, 06/01/2030 | 1,121,772 |
| 792,000 | Titan Acquisition Ltd / Titan Co-Borrower LLC(b) 7.75%, 04/15/2026 | 713,266 |
| 265,000 | TopBuild Corp(b) 4.13%, 02/15/2032 | 215,342 |
| TransDigm Inc | ||
| 285,000 | 6.25%, 03/15/2026(b) | 281,064 |
| 671,000 | 5.50%, 11/15/2027 | 630,103 |
| Trident TPI Holdings Inc(b) | ||
| 516,000 | 9.25%, 08/01/2024 | 490,399 |
| 566,000 | 6.63%, 11/01/2025 | 490,513 |
| 210,000 | Vulcan Materials Co 3.50%, 06/01/2030 | 184,975 |
| 409,000 | Weekley Homes LLC / Weekley Finance Corp(b) 4.88%, 09/15/2028 | 343,658 |
| 21,308,808 | ||
| Technology — 2.33% | ||
| Broadcom Inc | ||
| 609,000 | 4.15%, 11/15/2030 | 545,757 |
| 220,000 | 4.30%, 11/15/2032 | 193,895 |
| 285,000 | 3.14%, 11/15/2035(b) | 209,551 |
| 24,000 | 3.19%, 11/15/2036(b) | 17,239 |
| 261,000 | 4.93%, 05/15/2037(b) | 227,687 |
| CDW LLC / CDW Finance Corp | ||
| 130,000 | 2.67%, 12/01/2026 | 115,416 |
| 35,000 | 4.25%, 04/01/2028 | 32,212 |
| 150,000 | 3.25%, 02/15/2029 | 127,754 |
| 2,305,000 | 3.57%, 12/01/2031 | 1,899,403 |
| Consensus Cloud Solutions Inc(b) | ||
| 118,000 | 6.00%, 10/15/2026 | 110,358 |
| 181,000 | 6.50%, 10/15/2028 | 166,478 |
| 752,000 | Dell International LLC / EMC Corp 8.10%, 07/15/2036 | 842,705 |
| 1,687,000 | Entegris Escrow Corp(b) 4.75%, 04/15/2029 | 1,538,438 |
| 235,000 | Fidelity National Information Services Inc(g) 5.10%, 07/15/2032 | 226,358 |
| 920,000 | HP Inc 5.50%, 01/15/2033 | 864,292 |
| 850,000 | Kyndryl Holdings Inc 3.15%, 10/15/2031 | 566,503 |
| 1,215,000 | Leidos Inc 2.30%, 02/15/2031 | 930,757 |
| Marvell Technology Inc | ||
| 390,000 | 2.45%, 04/15/2028 | 330,112 |
| 330,000 | 2.95%, 04/15/2031 | 265,432 |
| Principal Amount(a) | Fair Value | |
| Technology — (continued) | ||
| Micron Technology Inc | ||
| $ 170,000 | 5.33%, 02/06/2029 | $ 163,186 |
| 1,065,000 | 6.75%, 11/01/2029(g) | 1,081,802 |
| 740,000 | 4.66%, 02/15/2030 | 671,161 |
| 200,000 | MSCI Inc(b) 3.25%, 08/15/2033 | 154,452 |
| 100,000 | NXP BV / NXP Funding LLC / NXP USA Inc 4.40%, 06/01/2027 | 95,839 |
| Open Text Corp(b) | ||
| 215,000 | 6.90%, 12/01/2027 | 215,000 |
| 115,000 | 3.88%, 02/15/2028 | 98,685 |
| 110,000 | Open Text Holdings Inc(b) 4.13%, 02/15/2030 | 88,238 |
| Oracle Corp | ||
| 1,295,000 | 6.15%, 11/09/2029 | 1,344,166 |
| 855,000 | 3.95%, 03/25/2051 | 609,136 |
| 380,000 | Qorvo Inc(b) 3.38%, 04/01/2031 | 305,307 |
| 631,000 | Rackspace Technology Global Inc(b) 5.38%, 12/01/2028 | 275,029 |
| 396,000 | Science Applications International Corp(b) 4.88%, 04/01/2028 | 366,299 |
| Seagate HDD Cayman | ||
| 40,000 | 4.09%, 06/01/2029 | 33,162 |
| 30,600 | 9.63%, 12/01/2032(b) | 33,562 |
| Western Digital Corp | ||
| 530,000 | 4.75%, 02/15/2026 | 499,112 |
| 350,000 | 2.85%, 02/01/2029 | 270,784 |
| 15,515,267 | ||
| Utilities — 1.18% | ||
| AES Corp | ||
| 260,000 | 3.95%, 07/15/2030(b) | 229,320 |
| 370,000 | 2.45%, 01/15/2031 | 294,343 |
| 725,000 | Calpine Corp(b) 3.75%, 03/01/2031 | 583,738 |
| 740,000 | CMS Energy Corp 4.75%, 06/01/2050 | 640,070 |
| 455,000 | Enel Finance International NV(b) 7.50%, 10/14/2032 | 480,829 |
| 1,220,000 | Eskom Holdings SOC Ltd(b) 7.13%, 02/11/2025 | 1,107,662 |
| 200,000 | IPALCO Enterprises Inc 4.25%, 05/01/2030 | 177,675 |
| 390,000 | NRG Energy Inc(b) 4.45%, 06/15/2029 | 344,896 |
| Pacific Gas & Electric Co | ||
| 100,000 | 5.45%, 06/15/2027 | 98,611 |
| 320,000 | 3.25%, 06/01/2031 | 260,113 |
| 290,000 | 4.30%, 03/15/2045 | 205,606 |
| 1,125,000 | Perusahaan Perseroan Persero PT Perusahaan Listrik Negara(b) 4.13%, 05/15/2027 | 1,080,000 |
| 909,000 | Sempra Global(b) 3.25%, 01/15/2032 | 724,705 |
See Notes to Financial Statements.
Annual Report - December 31, 2022
EMPOWER FUNDS, INC.
EMPOWER MULTI-SECTOR BOND FUND
Schedule of Investments
As of December 31, 2022
| Principal Amount(a) | Fair Value | |
| Utilities — (continued) | ||
| $ 1,072,000 | Southern Co 3.75%, 09/15/2051 | $ 865,588 |
| 304,000 | Vistra Corp(b)(h) 8.00%, Perpetual | 290,340 |
| 505,000 | Vistra Operations Co LLC(b) 3.70%, 01/30/2027 | 460,470 |
| 7,843,966 | ||
| TOTAL CORPORATE BONDS AND NOTES — 41.82% (Cost $319,754,863) | $278,253,048 | |
| CONVERTIBLE BONDS | ||
| Communications — 0.48% | ||
| 10,000 | Cable One Inc(j) 8.51%, 03/15/2026 | 7,855 |
| DISH Network Corp | ||
| 795,000 | 19.18%, 12/15/2025(j) | 507,210 |
| 2,080,000 | 3.38%, 08/15/2026 | 1,303,120 |
| 425,000 | Snap Inc(j) 9.96%, 05/01/2027 | 296,863 |
| 370,000 | Spotify USA Inc(j) 7.55%, 03/15/2026 | 297,850 |
| 895,000 | Uber Technologies Inc(j) 6.33%, 12/15/2025 | 753,819 |
| 3,166,717 | ||
| Consumer, Cyclical — 0.29% | ||
| 210,000 | JetBlue Airways Corp 0.50%, 04/01/2026 | 153,106 |
| 770,000 | NCL Corp Ltd 1.13%, 02/15/2027 | 522,676 |
| 55,000 | Peloton Interactive Inc(j) 13.15%, 02/15/2026 | 38,985 |
| 155,000 | Penn Entertainment Inc 2.75%, 05/15/2026 | 228,470 |
| 835,000 | Southwest Airlines Co(g) 1.25%, 05/01/2025 | 1,002,835 |
| 1,946,072 | ||
| Consumer, Non-Cyclical — 0.55% | ||
| 1,675,000 | BioMarin Pharmaceutical Inc(g) 1.25%, 05/15/2027 | 1,799,889 |
| 215,000 | Guardant Health Inc(j) 12.47%, 11/15/2027 | 133,709 |
| 295,000 | Ionis Pharmaceuticals Inc(j) 2.56%, 04/01/2026 | 272,322 |
| 265,000 | Livongo Health Inc 0.88%, 06/01/2025 | 231,557 |
| 1,580,000 | Teladoc Health Inc(g) 1.25%, 06/01/2027 | 1,213,748 |
| 3,651,225 | ||
| Technology — 0.13% | ||
| 25,000 | Bentley Systems Inc 0.38%, 07/01/2027 | 20,350 |
| Principal Amount(a) | Fair Value | |
| Technology — (continued) | ||
| $ 330,000 | RingCentral Inc(j) 8.54%, 03/15/2026 | $ 259,050 |
| 335,000 | Splunk Inc(g) 1.13%, 06/15/2027 | 282,673 |
| 430,000 | Unity Software Inc(j) 8.67%, 11/15/2026 | 321,855 |
| 883,928 | ||
| TOTAL CONVERTIBLE BONDS — 1.45% (Cost $10,977,042) | $ 9,647,942 | |
| FOREIGN GOVERNMENT BONDS AND NOTES | ||
| 465,000 | Abu Dhabi Government International Bond(b) 3.13%, 04/16/2030 | 431,172 |
| 1,025,000 | Angolan Government International Bond(b) 8.25%, 05/09/2028 | 931,520 |
| 1,775,000 | Argentine Republic Government International Bond(e) 3.50%, 07/09/2041 | 500,708 |
| Colombia Government International Bond | ||
| 410,000 | 4.50%, 03/15/2029 | 354,260 |
| 370,000 | 3.13%, 04/15/2031 | 274,619 |
| 1,335,000 | Dominican Republic International Bond(b) 4.88%, 09/23/2032 | 1,108,132 |
| Ecuador Government International Bond(b)(e) | ||
| 345,000 | 5.50%, 07/31/2030 | 219,463 |
| 455,000 | 2.50%, 07/31/2035 | 209,181 |
| Egypt Government International Bond(b) | ||
| 715,000 | 7.60%, 03/01/2029 | 580,830 |
| 365,000 | 5.88%, 02/16/2031 | 253,347 |
| 1,410,000 | Emirate of Dubai Government International Bonds(g) 5.25%, 01/30/2043 | 1,276,044 |
| 575,000 | Guatemala Government Bond(b) 5.25%, 08/10/2029 | 551,943 |
| 765,000 | Indonesia Government International Bond(b) 4.35%, 01/08/2027 | 755,985 |
| 515,000 | Ivory Coast Government International Bond(b) 6.38%, 03/03/2028 | 497,387 |
| Mexico Government International Bond | ||
| 430,000 | 2.66%, 05/24/2031 | 346,807 |
| 200,000 | 3.50%, 02/12/2034 | 160,054 |
| 710,000 | 4.50%, 01/31/2050(g) | 539,016 |
| Morocco Government International Bond(b) | ||
| 430,000 | 3.00%, 12/15/2032 | 341,676 |
| 355,000 | 5.50%, 12/11/2042 | 304,279 |
See Notes to Financial Statements.
Annual Report - December 31, 2022
EMPOWER FUNDS, INC.
EMPOWER MULTI-SECTOR BOND FUND
Schedule of Investments
As of December 31, 2022
| Principal Amount(a) | Fair Value | |
| Foreign Government Bonds and Notes — (continued) | ||
| $ 455,000 | Nigeria Government International Bond(b) 7.38%, 09/28/2033 | $ 323,250 |
| Panama Government International Bond | ||
| 345,000 | 3.30%, 01/19/2033(g) | 279,137 |
| 200,000 | 4.30%, 04/29/2053 | 144,361 |
| 315,000 | 3.87%, 07/23/2060 | 202,903 |
| 1,150,000 | Philippine Government International Bond 3.70%, 03/01/2041 | 937,894 |
| 215,000 | Qatar Government International Bond(b) 3.75%, 04/16/2030 | 208,013 |
| 1,015,000 | Republic of South Africa Government International Bond(g) 5.88%, 04/20/2032 | 913,500 |
| Saudi Government International Bond(b) | ||
| 1,035,000 | 5.50%, 10/25/2032 | 1,093,475 |
| 490,000 | 4.50%, 10/26/2046 | 434,263 |
| Turkey Government International Bond | ||
| 280,000 | 9.88%, 01/15/2028 | 289,731 |
| 1,185,000 | 7.63%, 04/26/2029 | 1,114,919 |
| 1,700,000 | Venezuela Government International Bond(i) 7.65%, 04/21/2025 | 119,000 |
| TOTAL FOREIGN GOVERNMENT BONDS AND NOTES — 2.36% (Cost $18,339,859) | $ 15,696,869 | |
| MORTGAGE-BACKED SECURITIES | ||
| Non-Agency — 7.13% | ||
| Ajax Mortgage Loan Trust(b) | ||
| Series 2019-D Class A1 | ||
| 168,141 | 2.96%, 09/25/2065(e) | 156,185 |
| Series 2021-A Class A1 | ||
| 468,105 | 1.07%, 09/25/2065(d) | 408,071 |
| Angel Oak Mortgage Trust(b) | ||
| Series 2021-3 Class A2 | ||
| 383,374 | 1.31%, 05/25/2066(d) | 311,964 |
| Series 2022-5 Class A1 | ||
| 903,325 | 4.50%, 05/25/2067(e) | 860,902 |
| 318,219 | Angel Oak SB Commercial Mortgage Trust(b)(d) Series 2020-SBC1 Class A1 2.07%, 05/25/2050 | 302,882 |
| Arroyo Mortgage Trust(b)(d) | ||
| Series 2019-1 Class A1 | ||
| 172,397 | 3.81%, 01/25/2049 | 158,350 |
| Series 2019-2 Class A1 | ||
| 676,751 | 3.35%, 04/25/2049 | 625,991 |
| 480,000 | BANK Series 2021-BN35 Class AS 2.46%, 06/15/2064 | 370,468 |
| Principal Amount(a) | Fair Value | |
| Non-Agency — (continued) | ||
| $ 38,736 | BB-UBS Trust(b) Series 2012-TFT Class A 2.89%, 06/05/2030 | $ 37,693 |
| BPR Trust(b)(c) | ||
| Series 2021-NRD Class B | ||
| 130,000 | 6.45%, 12/15/2038 1-mo. SOFR + 2.12% | 119,800 |
| Series 2021-NRD Class C | ||
| 145,000 | 6.75%, 12/15/2038 1-mo. SOFR + 2.42% | 132,533 |
| Series 2021-NRD Class D | ||
| 90,000 | 8.05%, 12/15/2038 1-mo. SOFR + 3.72% | 81,892 |
| Series 2022-OANA Class A | ||
| 480,000 | 6.23%, 04/15/2037 1-mo. SOFR + 1.90% | 468,479 |
| Series 2022-STAR Class A | ||
| 480,000 | 7.57%, 08/15/2024 1-mo. SOFR + 3.23% | 472,357 |
| 202,547 | Bunker Hill Loan Depositary Trust(b)(e) Series 2019-2 Class A1 2.88%, 07/25/2049 | 186,225 |
| 730,000 | BX Commercial Mortgage Trust(b)(c) Series 2022-AHP Class B 6.18%, 01/17/2039 1-mo. SOFR + 1.84% | 691,239 |
| BX Trust(b) | ||
| Series 2019-OC11 Class D | ||
| 985,000 | 3.94%, 12/09/2041(d) | 784,962 |
| Series 2022-CLS Class A | ||
| 564,000 | 5.76%, 10/13/2027 | 552,039 |
| 492,960 | CIM Trust(b)(e) Series 2021-NR4 Class A1 2.82%, 10/25/2061 | 455,657 |
| 185,000 | Citigroup Mortgage Loan Trust(b)(d) Series 2019-RP1 Class M2 4.00%, 01/25/2066 | 158,898 |
| COLT Mortgage Loan Trust(b) | ||
| Series 2021-2R Class A1 | ||
| 57,028 | 0.80%, 07/27/2054 | 48,149 |
| Series 2022-4 Class A1 | ||
| 1,497,854 | 4.30%, 03/25/2067(d) | 1,431,044 |
| COMM Mortgage Trust | ||
| Series 2012-CR3 Class AM | ||
| 96,865 | 3.42%, 10/15/2045(b) | 87,079 |
| Series 2012-LC4 Class B | ||
| 75,474 | 4.93%, 12/10/2044(d) | 75,333 |
| 95,288 | Commercial Mortgage Pass Through Certificates(b) Series 2012-LTRT Class A2 3.40%, 10/05/2030 | 81,699 |
| 570,000 | CoreVest American Finance Trust(b)(e) Series 2021-RTL1 Class A1 2.24%, 03/28/2029 | 518,327 |
| Credit Suisse Mortgage Trust(b) | ||
| Series 2014-USA Class B | ||
| 285,000 | 4.18%, 09/15/2037 | 241,919 |
See Notes to Financial Statements.
Annual Report - December 31, 2022
EMPOWER FUNDS, INC.
EMPOWER MULTI-SECTOR BOND FUND
Schedule of Investments
As of December 31, 2022
| Principal Amount(a) | Fair Value | |
| Non-Agency — (continued) | ||
| Series 2014-USA Class D | ||
| $ 100,000 | 4.37%, 09/15/2037 | $ 73,549 |
| Series 2020-RPL3 Class A1 | ||
| 177,387 | 2.69%, 03/25/2060(d) | 169,099 |
| Series 2021-RPL1 Class A1 | ||
| 272,567 | 1.67%, 09/27/2060(d) | 257,145 |
| 235,000 | DBUBS Mortgage Trust(b)(d) Series 2017-BRBK Class D 3.53%, 10/10/2034 | 209,849 |
| 1,040,000 | Dominion Mortgage Trust(b)(e) Series 2021-RTL1 Class A1 2.49%, 07/25/2027 | 935,296 |
| Ellington Financial Mortgage Trust(b)(d) | ||
| Series 2019-2 Class A3 | ||
| 66,348 | 3.05%, 11/25/2059 | 62,133 |
| Series 2021-2 Class A3 | ||
| 606,544 | 1.29%, 06/25/2066 | 456,594 |
| Series 2022-1 Class A1 | ||
| 1,127,242 | 2.21%, 01/25/2067 | 943,024 |
| Extended Stay America Trust(b)(c) | ||
| Series 2021-ESH Class C | ||
| 190,357 | 6.02%, 07/15/2038 1-mo. LIBOR + 1.70% | 182,717 |
| Series 2021-ESH Class D | ||
| 126,905 | 6.57%, 07/15/2038 1-mo. LIBOR + 2.25% | 121,493 |
| GCAT Trust(b) | ||
| Series 2019-RPL1 Class A1 | ||
| 188,237 | 2.65%, 10/25/2068(d) | 176,538 |
| Series 2020-NQM1 Class A1 | ||
| 66,445 | 2.25%, 01/25/2060(e) | 62,551 |
| GS Mortgage Securities Trust(d) | ||
| Series 2013-G1 Class B | ||
| 175,000 | 3.65%, 04/10/2031(b) | 169,270 |
| Series 2013-PEMB Class A | ||
| 130,000 | 3.55%, 03/05/2033(b) | 117,923 |
| Series 2013-PEMB Class D | ||
| 430,000 | 3.55%, 03/05/2033(b) | 336,424 |
| Series 2014-GC18 Class B | ||
| 275,000 | 4.89%, 01/10/2047 | 251,759 |
| 1,524,214 | Imperial Fund Mortgage Trust(b)(d) Series 2021-NQM4 Class A1 2.09%, 01/25/2057 | 1,255,532 |
| 430,000 | JPMorgan Chase Commercial Mortgage Securities Trust(b)(d) Series 2012-LC9 Class C 4.06%, 12/15/2047 | 406,292 |
| 209,787 | JPMorgan Mortgage Trust(b)(d) Series 2014-2 Class 2A2 3.50%, 06/25/2029 | 196,022 |
| Legacy Mortgage Asset Trust(b) | ||
| Series 2019-GS7 Class A1 | ||
| 302,262 | 6.25%, 11/25/2059(e) | 301,724 |
| Principal Amount(a) | Fair Value | |
| Non-Agency — (continued) | ||
| Series 2020-GS1 Class A1 | ||
| $ 313,462 | 2.88%, 10/25/2059(e) | $ 311,127 |
| Series 2020-GS5 Class A1 | ||
| 83,892 | 3.25%, 06/25/2060(e) | 82,527 |
| Series 2020-RPL1 Class A2 | ||
| 200,000 | 3.25%, 09/25/2059(d) | 169,647 |
| Series 2021-GS4 Class A1 | ||
| 117,070 | 1.65%, 11/25/2060(e) | 104,648 |
| LHOME Mortgage Trust(b) | ||
| Series 2021-RTL1 Class A1 | ||
| 515,000 | 2.09%, 02/25/2026(d) | 487,535 |
| Series 2021-RTL2 Class A1 | ||
| 350,000 | 2.09%, 06/25/2026(e) | 329,074 |
| Med Trust(b)(c) | ||
| Series 2021-MDLN Class B | ||
| 105,000 | 5.77%, 11/15/2038 1-mo. LIBOR + 1.45% | 99,997 |
| Series 2021-MDLN Class C | ||
| 270,000 | 6.12%, 11/15/2038 1-mo. LIBOR + 1.80% | 256,514 |
| Series 2021-MDLN Class D | ||
| 130,000 | 6.32%, 11/15/2038 1-mo. LIBOR + 2.00% | 122,828 |
| 900,000 | MetLife Securitization Trust(b)(d) Series 2017-1A Class M1 3.44%, 04/25/2055 | 782,905 |
| MFA Trust(b) | ||
| Series 2020-NQM3 Class A1 | ||
| 1,032,634 | 1.01%, 01/26/2065(d) | 941,885 |
| Series 2022-NQM2 Class A1 | ||
| 316,508 | 4.00%, 05/25/2067(e) | 301,823 |
| Mill City Mortgage Loan Trust(b)(d) | ||
| Series 2017-3 Class B1 | ||
| 644,138 | 3.25%, 01/25/2061 | 522,790 |
| Series 2017-3 Class M2 | ||
| 497,385 | 3.25%, 01/25/2061 | 446,540 |
| Series 2019-1 Class M2 | ||
| 603,888 | 3.50%, 10/25/2069 | 512,792 |
| Series 2019-GS1 Class A1 | ||
| 229,104 | 2.75%, 07/25/2059 | 212,875 |
| Morgan Stanley Bank of America Merrill Lynch Trust | ||
| Series 2012-CKSV Class A2 | ||
| 97,564 | 3.28%, 10/15/2030(b) | 78,611 |
| Series 2013-C11 Class B | ||
| 80,000 | 4.40%, 08/15/2046(d) | 59,041 |
| Series 2013-C12 Class C | ||
| 75,000 | 4.76%, 10/15/2046(d) | 71,083 |
| Series 2015-C25 Class A4 | ||
| 915,000 | 3.37%, 10/15/2048 | 866,224 |
| New Residential Mortgage Loan Trust(b) | ||
| Series 2016-4A Class B1A | ||
| 695,239 | 4.50%, 11/25/2056(d) | 638,443 |
| Series 2019-RPL2 Class M2 | ||
| 670,000 | 3.75%, 02/25/2059(d) | 559,915 |
| Series 2021-NQ2R Class A1 | ||
| 271,511 | 0.94%, 10/25/2058(d) | 234,711 |
See Notes to Financial Statements.
Annual Report - December 31, 2022
EMPOWER FUNDS, INC.
EMPOWER MULTI-SECTOR BOND FUND
Schedule of Investments
As of December 31, 2022
| Principal Amount(a) | Fair Value | |
| Non-Agency — (continued) | ||
| Series 2022-RTL1 Class A1F | ||
| $ 1,177,000 | 4.34%, 12/25/2026 | $ 1,116,795 |
| 54,644 | Onslow Bay Mortgage Loan Trust(b)(d) Series 2019-INV1 Class A3 4.50%, 11/25/2048 | 52,233 |
| 490,000 | Palisades Mortgage Loan Trust(b)(e) Series 2021-RTL1 Class A1 2.86%, 06/25/2026 | 455,660 |
| Preston Ridge Partners Mortgage LLC(b) | ||
| Series 2020-4 Class A1 | ||
| 221,255 | 2.95%, 10/25/2025(e) | 213,460 |
| Series 2020-6 Class A1 | ||
| 509,177 | 2.36%, 11/25/2025(e) | 469,842 |
| Series 2021-1 Class A1 | ||
| 444,913 | 2.12%, 01/25/2026(d) | 415,997 |
| Series 2021-2 Class A1 | ||
| 543,357 | 2.12%, 03/25/2026(d) | 500,258 |
| Series 2021-8 Class A1 | ||
| 321,401 | 1.74%, 09/25/2026(d) | 287,956 |
| Series 2021-9 Class A1 | ||
| 385,935 | 2.36%, 10/25/2026(e) | 347,423 |
| Series 2021-RPL1 Class A1 | ||
| 188,937 | 1.32%, 07/25/2051(e) | 168,084 |
| Series 2022-5 Class A1 | ||
| 672,294 | 6.90%, 09/27/2027(e) | 667,204 |
| 323,877 | Provident Funding Mortgage Trust(b)(d) Series 2019-1 Class A2 3.00%, 12/25/2049 | 269,366 |
| 255,000 | RBS Commercial Funding Inc Trust(b)(d) Series 2013-GSP Class A 3.83%, 01/15/2032 | 245,431 |
| 128,837 | RCKT Mortgage Trust(b)(d) Series 2020-1 Class A1 3.00%, 02/25/2050 | 107,241 |
| 489,585 | RCO VI Mortgage LLC(b)(e) Series 2022-1 Class A1 3.00%, 01/25/2027 | 459,326 |
| 9,882 | Sequoia Mortgage Trust(b)(d) Series 2019-CH2 Class A1 4.50%, 08/25/2049 | 9,647 |
| 308,032 | SG Residential Mortgage Trust(b)(d) Series 2021-1 Class A1 1.16%, 07/25/2061 | 247,717 |
| Starwood Mortgage Residential Trust(b)(d) | ||
| Series 2021-1 Class A1 | ||
| 189,367 | 1.22%, 05/25/2065 | 171,057 |
| Series 2021-3 Class A3 | ||
| 187,561 | 1.52%, 06/25/2056 | 149,123 |
| 500,000 | Toorak Mortgage Corp Ltd(b)(e) Series 2021-1 Class A1 2.24%, 06/25/2024 | 472,847 |
| Principal Amount(a) | Fair Value | |
| Non-Agency — (continued) | ||
| Towd Point Mortgage Trust(b)(d) | ||
| Series 2016-4 Class B1 | ||
| $ 615,000 | 3.89%, 07/25/2056 | $ 562,132 |
| Series 2017-1 Class A2 | ||
| 525,000 | 3.50%, 10/25/2056 | 502,682 |
| Series 2017-1 Class M1 | ||
| 635,000 | 3.75%, 10/25/2056 | 591,939 |
| Series 2017-4 Class A2 | ||
| 1,685,000 | 3.00%, 06/25/2057 | 1,511,237 |
| Series 2017-4 Class M2 | ||
| 325,000 | 3.25%, 06/25/2057 | 263,105 |
| Series 2017-6 Class A2 | ||
| 780,000 | 3.00%, 10/25/2057 | 699,315 |
| Series 2018-4 Class A2 | ||
| 100,000 | 3.00%, 06/25/2058 | 80,456 |
| Series 2018-5 Class M1 | ||
| 170,000 | 3.25%, 07/25/2058 | 133,324 |
| Series 2018-6 Class A1B | ||
| 300,000 | 3.75%, 03/25/2058 | 271,974 |
| Series 2018-6 Class A2 | ||
| 1,590,000 | 3.75%, 03/25/2058 | 1,358,696 |
| Series 2019-2 Class A2 | ||
| 670,000 | 3.75%, 12/25/2058 | 584,166 |
| Series 2019-2 Class M1 | ||
| 945,000 | 3.75%, 12/25/2058 | 752,646 |
| Series 2019-4 Class A1 | ||
| 235,332 | 2.90%, 10/25/2059 | 218,515 |
| Series 2019-4 Class A2 | ||
| 615,000 | 3.25%, 10/25/2059 | 517,096 |
| Series 2020-1 Class A2B | ||
| 100,000 | 3.25%, 01/25/2060 | 79,650 |
| Series 2020-1 Class M1 | ||
| 335,000 | 3.50%, 01/25/2060 | 261,469 |
| Series 2021-1 Class A2 | ||
| 1,050,000 | 2.75%, 11/25/2061 | 821,520 |
| Series 2022-1 Class A1 | ||
| 1,845,071 | 3.75%, 07/25/2062 | 1,689,945 |
| 840,000 | TVC Mortgage Trust(b)(e) Series 2020-RTL1 Class M 5.19%, 09/25/2024 | 802,051 |
| 109,138 | UBS Commercial Mortgage Trust(b)(d) Series 2012-C1 Class D 6.45%, 05/10/2045 | 99,202 |
| Verus Securitization Trust(b) | ||
| Series 2019-4 Class M1 | ||
| 310,000 | 3.21%, 11/25/2059(d) | 261,558 |
| Series 2021-R3 Class A1 | ||
| 114,472 | 1.02%, 04/25/2064(d) | 98,654 |
| Series 2022-5 Class A1 | ||
| 1,038,929 | 3.80%, 04/25/2067(e) | 951,004 |
| Series 2022-7 Class A1 | ||
| 1,055,595 | 5.15%, 07/25/2067(e) | 1,026,511 |
| Visio Trust(b) | ||
| Series 2019-2 Class A1 | ||
| 336,067 | 2.72%, 11/25/2054(d) | 311,630 |
| Series 2020-1R Class A2 | ||
| 155,546 | 1.57%, 11/25/2055 | 140,127 |
See Notes to Financial Statements.
Annual Report - December 31, 2022
EMPOWER FUNDS, INC.
EMPOWER MULTI-SECTOR BOND FUND
Schedule of Investments
As of December 31, 2022
| Principal Amount(a) | Fair Value | |
| Non-Agency — (continued) | ||
| Wells Fargo Commercial Mortgage Trust(d) | ||
| Series 2013-LC12 Class B | ||
| $ 195,000 | 4.30%, 07/15/2046 | $ 184,890 |
| Series 2016-C36 Class B | ||
| 135,000 | 3.67%, 11/15/2059 | 112,252 |
| WFRBS Commercial Mortgage Trust | ||
| Series 2012-C7 Class C | ||
| 173,662 | 4.65%, 06/15/2045(d) | 123,298 |
| Series 2013-C15 Class B | ||
| 220,000 | 4.53%, 08/15/2046(d) | 187,656 |
| Series 2014-C20 Class B | ||
| 190,000 | 4.38%, 05/15/2047 | 163,497 |
| Series 2014-C24 Class AS | ||
| 390,000 | 3.93%, 11/15/2047 | 371,653 |
| Series 2014-C24 Class B | ||
| 70,000 | 4.20%, 11/15/2047(d) | 63,550 |
| Series 2014-C24 Class C | ||
| 90,000 | 4.29%, 11/15/2047(d) | 72,840 |
| 47,395,513 | ||
| U.S. Government Agency — 0.03% | ||
| 204,779 | Federal Home Loan Mortgage Corp Structured Agency Credit Risk Real Estate Mortgage Investment Conduit Trust(b)(c) Series 2022-DNA3 Class M1A 5.93%, 04/25/2042 1-mo. SOFR + 2.00% | 203,756 |
| TOTAL MORTGAGE-BACKED SECURITIES — 7.16% (Cost $52,543,813) | $ 47,599,269 | |
| MUNICIPAL BONDS AND NOTES | ||
| 560,000 | Broward County Water & Sewer Utility Revenue Series A 4.00%, 10/01/2047 | 529,301 |
| 810,000 | Metropolitan Transportation Authority Series A 5.00%, 11/15/2045 | 870,297 |
| 130,000 | Sales Tax Securitization Corp Series B 3.41%, 01/01/2043 | 95,506 |
| 2,310,000 | Tobacco Settlement Financing Corp Series A-1 6.71%, 06/01/2046 | 2,080,942 |
| TOTAL MUNICIPAL BONDS AND NOTES — 0.54% (Cost $3,995,495) | $ 3,576,046 | |
| Principal Amount(a) | Fair Value | |
| U.S. TREASURY BONDS AND NOTES | ||
| United States Treasury Note/Bond | ||
| $ 5,725,000 | 0.13%, 03/31/2023 | $ 5,666,369 |
| 3,025,000 | 0.13%, 05/31/2023 | 2,970,999 |
| 13,930,000 | 0.13%, 08/31/2023 | 13,509,379 |
| 6,945,000 | 0.25%, 09/30/2023(l) | 6,714,133 |
| 4,830,000 | 1.50%, 02/29/2024 | 4,655,667 |
| 10,110,000 | 2.50%, 04/30/2024 | 9,822,497 |
| 3,020,000 | 4.25%, 09/30/2024 | 3,004,546 |
| 7,235,000 | 0.25%, 05/31/2025 | 6,568,023 |
| 7,535,000 | 3.88%, 11/30/2027 | 7,493,793 |
| 12,985,000 | 0.63%, 12/31/2027 | 11,000,223 |
| 5,270,000 | 1.38%, 11/15/2031 | 4,289,286 |
| 1,685,000 | 1.88%, 02/15/2032 | 1,429,420 |
| 3,260,000 | 4.13%, 11/15/2032 | 3,326,728 |
| 10,260,000 | 3.25%, 05/15/2042 | 8,995,134 |
| 3,460,000 | 1.88%, 11/15/2051 | 2,191,424 |
| 3,060,000 | 2.88%, 05/15/2052 | 2,451,825 |
| TOTAL U.S. TREASURY BONDS AND NOTES — 14.14% (Cost $98,726,121) | $ 94,089,446 | |
| Shares | ||
| COMMON STOCK | ||
| Communications — 0.16% | ||
| 95,643 | Altice USA Inc Class A(m) | 439,958 |
| 4,739 | T-Mobile US Inc(m) | 663,460 |
| 1,103,418 | ||
| Consumer, Cyclical — 0.02% | ||
| 650 | NMG Parent LLC(m) | 113,750 |
| Consumer, Non-Cyclical — 0.00%(n) | ||
| 327 | Clarivate PLC(m) | 2,727 |
| TOTAL COMMON STOCK — 0.18% (Cost $2,096,284) | $ 1,219,895 | |
| CONVERTIBLE PREFERRED STOCK | ||
| Communications — 0.10% | ||
| 577 | 2020 Cash Mandatory Exchangeable Trust 5.25%(b) | 660,100 |
| Energy — 0.08% | ||
| 12,538 | El Paso Energy Capital Trust I 4.75% | 564,700 |
See Notes to Financial Statements.
Annual Report - December 31, 2022
EMPOWER FUNDS, INC.
EMPOWER MULTI-SECTOR BOND FUND
Schedule of Investments
As of December 31, 2022
| Shares | Fair Value | |
| Financial — 0.40% | ||
| 903 | Bank of America Corp 7.25% | $ 1,047,480 |
| 785,000 | Charles Schwab Corp Series H 4.00% | 625,998 |
| 811 | Wells Fargo & Co 7.50% | 961,003 |
| 2,634,481 | ||
| Technology — 0.04% | ||
| 7,075 | Clarivate PLC 5.25% | 267,589 |
| TOTAL CONVERTIBLE PREFERRED STOCK — 0.62% (Cost $5,020,015) | $ 4,126,870 | |
| GOVERNMENT MONEY MARKET MUTUAL FUNDS | ||
| 1,650,000 | Dreyfus Institutional Preferred Government Plus Money Market Fund Class SL(o), 4.36%(p) | 1,650,000 |
| TOTAL GOVERNMENT MONEY MARKET MUTUAL FUNDS — 0.25% (Cost $1,650,000) | $ 1,650,000 | |
| Principal Amount | ||
| SHORT TERM INVESTMENTS | ||
| U.S. Treasury Bonds and Notes — 9.90% | ||
| U.S. Treasury Bills(j) | ||
| $ 8,090,000 | 4.03%, 01/26/2023(g) | 8,066,499 |
| 2,670,000 | 4.07%, 02/02/2023(g) | 2,660,081 |
| 2,790,000 | 4.22%, 02/23/2023 | 2,772,439 |
| 20,315,000 | 4.19%, 03/09/2023 | 20,155,558 |
| 15,590,000 | 4.27%, 03/16/2023 | 15,452,643 |
| 6,310,000 | 4.26%, 03/23/2023 | 6,249,333 |
| 10,650,000 | 4.35%, 03/30/2023 | 10,540,423 |
| 65,896,976 | ||
| Repurchase Agreements — 4.59% | ||
| 7,639,428 | Undivided interest of 10.86% in a repurchase agreement (principal amount/value $70,517,679 with a maturity value of $70,551,371) with Citigroup Global Markets Inc, 4.30%, dated 12/31/22 to be repurchased at $7,639,428 on 1/3/23 collateralized by a U.S. Treasury security and various U.S. Government Agency securities, 0.00% - 5.50%, 8/28/23 - 12/1/52, with a value of $71,928,033.(o) | 7,639,428 |
| Principal Amount | Fair Value | |
| Repurchase Agreements — (continued) | ||
| $ 7,639,428 | Undivided interest of 6.98% in a repurchase agreement (principal amount/value $109,701,194 with a maturity value of $109,753,607) with RBC Capital Markets Corp, 4.30%, dated 12/31/22 to be repurchased at $7,639,428 on 1/3/23 collateralized by various U.S. Government Agency securities, 2.00% - 6.00%, 9/1/24 - 10/20/52, with a value of $111,895,218.(o) | $ 7,639,428 |
| 7,639,428 | Undivided interest of 7.03% in a repurchase agreement (principal amount/value $108,937,825 with a maturity value of $108,989,873) with Bank of America Securities Inc, 4.30%, dated 12/31/22 to be repurchased at $7,639,428 on 1/3/23 collateralized by Federal National Mortgage Association securities, 1.50% - 6.50%, 5/1/37 - 5/1/58, with a value of $111,116,581.(o) | 7,639,428 |
| 7,589,359 | Undivided interest of 9.30% in a repurchase agreement (principal amount/value $81,850,151 with a maturity value of $81,889,257) with Credit Agricole Securities (USA) Inc, 4.30%, dated 12/31/22 to be repurchased at $7,589,359 on 1/3/23 collateralized by Government National Mortgage Association securities, 3.00% - 4.00%, 11/20/48 - 8/20/52, with a value of $83,487,154.(o) | 7,589,359 |
| 30,507,643 | ||
| TOTAL SHORT TERM INVESTMENTS — 14.49% (Cost $96,404,619) | $ 96,404,619 | |
| TOTAL INVESTMENTS — 100.93% (Cost $737,774,233) | $671,504,471 | |
| OTHER ASSETS & LIABILITIES, NET — (0.93)% | $ (6,159,888) | |
| TOTAL NET ASSETS — 100.00% | $665,344,583 | |
See Notes to Financial Statements.
Annual Report - December 31, 2022
EMPOWER FUNDS, INC.
EMPOWER MULTI-SECTOR BOND FUND
Schedule of Investments
As of December 31, 2022
| (a) | Amount is stated in U.S. dollars unless otherwise noted. |
| (b) | Represents securities sold under Rule 144A, which are exempt from registration under the Securities Act of 1933, as amended. |
| (c) | Adjustable rate security; interest rate is subject to change. Interest rate shown reflects the rate in effect at December 31, 2022. |
| (d) | Certain variable rate securities are not based on a published reference rate and spread but are determined by the issuer or agent and are based on current market conditions. These securities do not indicate a reference rate and spread in their description above. |
| (e) | Step bond; a zero coupon bond that converts to a fixed rate or variable interest rate at a designated future date. Rate disclosed represents effective yield at December 31, 2022. Maturity date disclosed represents final maturity date. |
| (f) | All or a portion of this position has not settled as of December 31, 2022. The interest rate shown represents the stated spread over the LIBOR floor; the Fund will not accrue interest until the settlement date, at which point the LIBOR will be established. |
| (g) | All or a portion of the security is on loan at December 31, 2022. |
| (h) | Security has no contractual maturity date and pays an indefinite stream of interest. |
| (i) | Security in default. |
| (j) | Zero coupon bond; the interest rate shown is the effective yield on date of purchase. |
| (k) | Security is a payment-in-kind bond (PIK); income may be received in cash or additional securities at the discretion of the issuer. |
| (l) | All or a portion of the security has been segregated to cover initial margin requirements on open futures contracts. |
| (m) | Non-income producing security. |
| (n) | Represents less than 0.005% of net assets. |
| (o) | Collateral received for securities on loan. |
| (p) | Rate shown is the 7-day yield as of December 31, 2022. |
| LIBOR | London Interbank Offered Rate is the interest rate banks charge each other for short-term loans. |
| LP | Limited Partnership |
| REIT | Real Estate Investment Trust |
| SOFR | Secured Overnight Financing Rate is the secured interbank overnight interest rate and reference rate established as an alternative to LIBOR. |
| At December 31, 2022, the Fund held the following outstanding exchange traded futures contracts: | |||||
| Description | Number of Contracts | Notional Amount | Expiration Date | Fair Value and Net Unrealized Depreciation | |
| Long | |||||
| U.S. 10 Year Treasury Ultra Futures | 34 | USD | 4,089,563 | March 2022 | $ (77,788) |
| U.S. Ultra Bond Futures | 239 | USD | 32,100,688 | March 2022 | (663,324) |
| Net Depreciation | $(741,112) | ||||
| Currency Abbreviations | ||
| EUR | Euro Dollar | |
See Notes to Financial Statements.
Annual Report - December 31, 2022
EMPOWER FUNDS, INC.
Statement of Assets and Liabilities
As of December 31, 2022
| Empower Multi-Sector Bond Fund | |
| ASSETS: | |
| Investments in securities, fair value (including $31,091,455 of securities on loan)(a) | $640,996,828 |
| Repurchase agreements, fair value(b) | 30,507,643 |
| Cash | 30,551,191 |
| Cash pledged on futures contracts | 567 |
| Dividends and interest receivable | 5,606,439 |
| Subscriptions receivable | 3,884,449 |
| Receivable for investments sold | 16,552 |
| Total Assets | 711,563,669 |
| LIABILITIES: | |
| Payable for director fees | 8,131 |
| Payable for investments purchased | 12,610,293 |
| Payable for other accrued fees | 159,884 |
| Payable for shareholder services fees | 52,770 |
| Payable to investment adviser | 161,339 |
| Payable upon return of securities loaned | 32,157,643 |
| Redemptions payable | 947,401 |
| Variation margin on futures contracts | 121,625 |
| Total Liabilities | 46,219,086 |
| NET ASSETS | $665,344,583 |
| NET ASSETS REPRESENTED BY: | |
| Capital stock, $0.10 par value | $7,296,152 |
| Paid-in capital in excess of par | 746,596,751 |
| Undistributed/accumulated deficit | (88,548,320) |
| NET ASSETS | $665,344,583 |
| NET ASSETS BY CLASS | |
| Investor Class | $234,285,701 |
| Institutional Class | $431,058,882 |
| CAPITAL STOCK: | |
| Authorized | |
| Investor Class | 200,000,000 |
| Institutional Class | 295,000,000 |
| Issued and Outstanding | |
| Investor Class | 19,167,245 |
| Institutional Class | 53,794,278 |
| NET ASSET VALUE, REDEMPTION PRICE AND OFFERING PRICE PER SHARE: | |
| Investor Class | $12.22 |
| Institutional Class | $8.01 |
| (a) Cost of investments | $707,266,590 |
| (b) Cost of repurchase agreements | $30,507,643 |
See Notes to Financial Statements.
Annual Report - December 31, 2022
EMPOWER FUNDS, INC.
Statement of Operations
For the fiscal year ended December 31, 2022
| Empower Multi-Sector Bond Fund | |
| INVESTMENT INCOME: | |
| Interest | $28,225,981 |
| Income from securities lending | 86,082 |
| Dividends | 355,784 |
| Foreign withholding tax | (2,221) |
| Total Income | 28,665,626 |
| EXPENSES: | |
| Management fees | 3,262,872 |
| Shareholder services fees – Investor Class | 572,742 |
| Audit and tax fees | 70,106 |
| Custodian fees | 155,161 |
| Directors fees | 34,044 |
| Legal fees | 10,169 |
| Pricing fees | 169,474 |
| Registration fees | 88,391 |
| Shareholder report fees | 9,989 |
| Transfer agent fees | 9,986 |
| Other fees | 19,526 |
| Total Expenses | 4,402,460 |
| Less amount waived by investment adviser | 383,937 |
| Net Expenses | 4,018,523 |
| NET INVESTMENT INCOME | 24,647,103 |
| NET REALIZED AND UNREALIZED GAIN (LOSS): | |
| Net realized loss on investments and foreign currency transactions | (20,800,806) |
| Net realized loss on futures contracts | (1,542,630) |
| Net Realized Loss | (22,343,436) |
| Net change in unrealized depreciation on investments and foreign currency translations | (77,472,137) |
| Net change in unrealized depreciation on futures contracts | (741,112) |
| Net Change in Unrealized Depreciation | (78,213,249) |
| Net Realized and Unrealized Loss | (100,556,685) |
| NET DECREASE IN NET ASSETS RESULTING FROM OPERATIONS | $(75,909,582) |
See Notes to Financial Statements.
Annual Report - December 31, 2022
EMPOWER FUNDS, INC.
Statement of Changes in Net Assets
For the fiscal years ended December 31, 2022 and December 31, 2021
| Empower Multi-Sector Bond Fund | 2022 | 2021 | |
| OPERATIONS: | |||
| Net investment income | $24,647,103 | $20,732,944 | |
| Net realized gain (loss) | (22,343,436) | 17,769,146 | |
| Net change in unrealized depreciation | (78,213,249) | (30,806,293) | |
| Net Increase (Decrease) in Net Assets Resulting from Operations | (75,909,582) | 7,695,797 | |
| DISTRIBUTIONS TO SHAREHOLDERS: | |||
| From net investment income and net realized gains | |||
| Investor Class | (4,503,321) | (6,190,549) | |
| Institutional Class | (20,325,948) | (34,384,715) | |
| From Net Investment Income and Net Realized Gains | (24,829,269) | (40,575,264) | |
| CAPITAL SHARE TRANSACTIONS: | |||
| Shares sold | |||
| Investor Class | 323,750,125 | 41,442,945 | |
| Institutional Class | 61,684,672 | 136,139,389 | |
| Shares issued in reinvestment of distributions | |||
| Investor Class | 4,503,321 | 6,190,549 | |
| Institutional Class | 20,325,948 | 34,384,715 | |
| Shares redeemed | |||
| Investor Class | (234,082,338) | (56,346,837) | |
| Institutional Class | (100,750,850) | (79,514,793) | |
| Net Increase in Net Assets Resulting from Capital Share Transactions | 75,430,878 | 82,295,968 | |
| Total Increase (Decrease) in Net Assets | (25,307,973) | 49,416,501 | |
| NET ASSETS: | |||
| Beginning of year | 690,652,556 | 641,236,055 | |
| End of year | $665,344,583 | $690,652,556 | |
| CAPITAL SHARE TRANSACTIONS - SHARES: | |||
| Shares sold | |||
| Investor Class | 25,802,307 | 2,857,211 | |
| Institutional Class | 7,178,189 | 13,740,679 | |
| Shares issued in reinvestment of distributions | |||
| Investor Class | 365,412 | 433,753 | |
| Institutional Class | 2,497,298 | 3,592,886 | |
| Shares redeemed | |||
| Investor Class | (18,517,808) | (3,885,441) | |
| Institutional Class | (11,769,975) | (8,026,012) | |
| Net Increase | 5,555,423 | 8,713,076 |
See Notes to Financial Statements.
Annual Report - December 31, 2022
EMPOWER FUNDS, INC.
EMPOWER MULTI-SECTOR BOND FUND
Financial Highlights
Selected data for a share of capital stock of the Fund throughout the periods indicated.
| Income (Loss) from Investment Operations: | Less Distributions: | ||||||||
| Net asset value, beginning of year | Net investment income(a) | Net realized and unrealized gain (loss) | Total from investment operations | From net investment income | From net realized gains | Total Distributions | Net asset value, end of year | Total Return(b)(c) | |
| Investor Class | |||||||||
| 12/31/2022 | $14.15 | 0.47 | (2.08) | (1.61) | (0.30) | (0.02) | (0.32) | $12.22 | (11.42%) |
| 12/31/2021 | $14.57 | 0.41 | (0.28) | 0.13 | (0.34) | (0.21) | (0.55) | $14.15 | 0.89% |
| 12/31/2020 | $13.85 | 0.52 | 0.72 | 1.24 | (0.45) | (0.07) | (0.52) | $14.57 | 9.10% |
| 12/31/2019 | $12.62 | 0.56 | 0.91 | 1.47 | (0.22) | (0.02) | (0.24) | $13.85 | 11.74% |
| 12/31/2018 | $13.42 | 0.52 | (0.93) | (0.41) | (0.32) | (0.07) | (0.39) | $12.62 | (3.10%) |
| Institutional Class | |||||||||
| 12/31/2022 | $ 9.44 | 0.34 | (1.38) | (1.04) | (0.37) | (0.02) | (0.39) | $ 8.01 | (11.06%) |
| 12/31/2021 | $ 9.98 | 0.31 | (0.19) | 0.12 | (0.45) | (0.21) | (0.66) | $ 9.44 | 1.16% |
| 12/31/2020 | $ 9.69 | 0.39 | 0.51 | 0.90 | (0.54) | (0.07) | (0.61) | $ 9.98 | 9.49% |
| 12/31/2019 | $ 8.91 | 0.43 | 0.64 | 1.07 | (0.27) | (0.02) | (0.29) | $ 9.69 | 12.16% |
| 12/31/2018 | $ 9.68 | 0.41 | (0.67) | (0.26) | (0.44) | (0.07) | (0.51) | $ 8.91 | (2.80%) |
| Net assets, end of year (000) | Ratio of expenses to average net assets (before reimbursement and/or waiver, if applicable) | Ratio of expenses to average net assets (after reimbursement and/or waiver, if applicable) | Ratio of net investment income to average net assets (after reimbursement and/or waiver, if applicable) | Portfolio turnover rate(d) | ||
| Investor Class | ||||||
| 12/31/2022 | $234,286 | 0.99% | 0.90% | 3.65% | 67% | |
| 12/31/2021 | $162,932 | 0.93% | 0.90% | 2.83% | 67% | |
| 12/31/2020 | $176,480 | 0.93% | 0.90% | 3.69% | 102% | |
| 12/31/2019 | $185,209 | 0.92% | 0.90% | 4.18% | 81% | |
| 12/31/2018 | $195,275 | 0.91% | 0.90% | 3.93% | 61% | |
| Institutional Class | ||||||
| 12/31/2022 | $431,059 | 0.60% | 0.55% | 4.03% | 67% | |
| 12/31/2021 | $527,720 | 0.57% | 0.55% | 3.16% | 67% | |
| 12/31/2020 | $464,756 | 0.57% | 0.55% | 4.04% | 102% | |
| 12/31/2019 | $471,986 | 0.56% | 0.55% | 4.52% | 81% | |
| 12/31/2018 | $421,840 | 0.55% | 0.55% | 4.31% | 61% | |
| (a) | Per share amounts are based upon average shares outstanding. |
| (b) | Total return does not include any fees or expenses of variable insurance contracts, if applicable. If such fees or expenses were included, the return shown would have been lower. |
| (c) | Total return shown net of expenses reimbursed and/or waived, if applicable. Without the expense reimbursement and/or waiver, the return shown would have been lower. |
| (d) | Portfolio turnover is calculated at the Fund level. |
See Notes to Financial Statements.
Annual Report - December 31, 2022
EMPOWER FUNDS, INC.
EMPOWER MULTI-SECTOR BOND FUND
Notes to Financial Statements
1. ORGANIZATION AND SIGNIFICANT ACCOUNTING POLICIES
Empower Funds, Inc. (Empower Funds), a Maryland corporation, was organized on December 7, 1981 and is registered under the Investment Company Act of 1940 (the 1940 Act) as an open-end management investment company. Empower Funds presently consists of forty-five funds. Interests in the Empower Multi-Sector Bond Fund (the Fund) are included herein.
The investment objective of the Fund is to seek high total investment return through a combination of current income and capital appreciation. The Fund is diversified as defined in the 1940 Act. The Fund is available as an investment option to insurance company separate accounts for certain variable annuity contracts and variable life insurance policies, to individual retirement account custodians or trustees, to plan sponsors of qualified retirement plans, to college savings programs, and to asset allocation funds that are a series of Empower Funds.
The Fund offers two share classes, referred to as Investor Class and Institutional Class shares. All shares of the Fund represent an equal pro rata interest in the net assets of the class to which such shares belong, and have identical voting, dividend, liquidation and other rights and the same terms and conditions, except for class specific expenses and exclusive rights to vote on matters affecting only individual classes. Income, expenses (other than those attributable to a specific class) and realized and unrealized gains and losses are allocated daily to each class of shares based on the relative proportion of net assets represented by such class. Operating expenses directly attributable to a specific class are charged against operations of that class. Expenses incurred by Empower Funds, which are not Fund specific, are allocated based on relative net assets or other appropriate allocation methods.
The preparation of financial statements in conformity with accounting principles generally accepted in the United States of America (U.S. GAAP) requires management to make estimates and assumptions that affect the reported amounts of assets and liabilities and disclosure of contingent assets and liabilities at the date of the financial statements and the reported amounts of revenue and expenses during the reporting period. Actual results could differ from those estimates. The Fund is also an investment company and accordingly follows the investment company accounting and reporting guidance of the Financial Accounting Standards Board ("FASB") Accounting Standards Codification Topic 946, Financial Services - Investment Companies. The following is a summary of the significant accounting policies of the Fund.
Security Valuation
The Board of Directors of the Fund has adopted policies and procedures for the valuation of the Fund’s securities and assets, and has appointed the Fair Value Pricing Committee of the investment adviser, Empower Capital Management, LLC (ECM or the Adviser), to complete valuation determinations under those policies and procedures. Effective September 8, 2022, pursuant to Rule 2a-5 under the 1940 Act, the Board of Directors approved the Adviser as the Fund’s valuation designee to make all fair value determinations with respect to the Fund’s investments, subject to oversight by the Board of Directors.
The Fund generally values its securities based on market prices determined at the close of regular trading on the New York Stock Exchange (NYSE) on each day the NYSE is open for trading. The net asset value (NAV) of each class of the Fund's shares is determined by dividing the net assets attributable to each class of shares of the Fund by the number of issued and outstanding shares of each class of the Fund on each valuation date.
For securities that are traded on only one exchange, the last sale price as of the close of business of that exchange will be used. If the closing price is not available, the current bid as of the close of business will be used. For securities traded on more than one exchange, or upon one or more exchanges and in the over-the-counter (OTC) market, the last sale price as of the close of business on the market which the security is traded most extensively will be used. If the closing price is not available, the current bid as of the close of business will be used. For securities that principally trade on the NASDAQ National Market System, the NASDAQ official closing price will be used.
Annual Report - December 31, 2022
Short term securities purchased with less than 60 days remaining until maturity and all U.S. Treasury Bills are valued on the basis of amortized cost, which has been determined to approximate fair value. Short term securities purchased with more than 60 days remaining until maturity are valued using pricing services, or in the event a price is not available from a pricing service, may be priced using other methodologies approved by the Board of Directors, including model pricing or pricing on the basis of quotations from brokers or dealers, and will continue to be priced until final maturity.
Fixed income investments, including bank loans, are valued using evaluated bid prices from approved pricing services when available and appropriate based on the conditions of the market. If a price cannot be located from either the primary or secondary sources, or if the market is determined to be illiquid or inactive, other appropriate sources, which may include the use of an internally developed valuation model, another external pricing vendor or sourcing a price from a broker, may be used.
Investments in shares of the underlying mutual funds are valued at the net asset value as reported by the underlying mutual fund, which may be obtained from pricing services or other pricing sources.
Foreign equity securities are generally valued using an adjusted systematic fair value price from an independent pricing service. Foreign exchange rates are determined at a time that corresponds to the closing of the NYSE.
For derivatives that are traded on an exchange, the last sale price as of the close of business of the exchange will be used. For derivatives traded over-the-counter (OTC), independent pricing services will be utilized when possible. If a price cannot be located from the primary source, other appropriate sources, which may include the use of an internally developed valuation model, another external pricing vendor or sourcing a price from a broker, may be used.
Independent pricing services are approved by the Board of Directors and are utilized for all investment types when available. In some instances valuations from independent pricing services are not available or do not reflect events in the market between the time the market closed and the valuation time and therefore fair valuation procedures are implemented. The fair value for some securities may be obtained from pricing services or other pricing sources. The inputs used by the pricing services are reviewed quarterly or when the pricing vendor issues updates to its pricing methodologies. Broker quotes are analyzed through an internal review process, which includes a review of known market conditions and other relevant data. Developments that might trigger fair value pricing could be natural disasters, government actions or fluctuations in domestic and foreign markets.
The following table provides examples of the inputs that are commonly used for valuing particular classes of securities. These classifications are not exclusive, and any inputs may be used to value any other security class.
| Class | Inputs |
| Asset-Backed Securities | Benchmark yields, reported trades, broker/dealer quotes, issuer spreads, two-sided markets, benchmark securities, bids, evaluated bids, offers and reference data including market research publications. Inputs may also include new issue data, collateral performance, and monthly payment information. |
| Bank Loans | Broker quotes, Loan Syndications and Trading Association daily marks, loan analytics and market news. |
| Corporate Bonds and Notes | Benchmark yields, reported trades, broker/dealer quotes, issuer spreads, two-sided markets, benchmark securities, bids, evaluated bids, offers and reference data including market research publications. Inputs also may include observations of equity and credit default swap curves related to issuer. |
| Convertible Bonds, Convertible Preferred Stock | Benchmark yields, reported trades, broker/dealer quotes, issuer spreads, two-sided markets, benchmark securities, bids, evaluated bids, offers and reference data including market research publications. Inputs also may include exchange prices. |
| Foreign Government Bonds and Notes | Benchmark yields, executed trades, broker/dealer quotes, credit information, collateral attributes, issuer spreads, benchmark securities, treasury/swap maturity curves, issuer spread curves, evaluated bids, market corroborated inputs, offers and reference data including market research publications. |
| Mortgage-Backed Securities | Benchmark yields, reported trades, broker/dealer quotes, issuer spreads, two-sided markets, benchmark securities, bids, evaluated bids, offers and reference data including market |
Annual Report - December 31, 2022
| research publications. Inputs may also include new issue data, collateral performance, TBA prices, monthly payment information and third party real estate analysis. | |
| Municipal Bonds and Notes | Benchmark yields, reported trades, broker/dealer quotes, issuer spreads, two-sided markets, benchmark securities, bids, evaluated bids, offers and reference data including market research publications. Inputs also may include reported trades, benchmark yields, new issue data, and material event notices. |
| U.S. Treasury Bonds and Notes | Benchmark yields, reported trades, broker/dealer quotes, issuer spreads, two-sided markets, benchmark securities, bids, evaluated bids, offers and reference data including market research publications. |
| Common Stock | Exchange traded close price, bids, evaluated bids, open and close price of the local exchange, exchange rates, fair values based on significant market movement and various index data. |
| Government Money Market Mutual Funds | Net asset value of underlying mutual fund. |
| Short Term Investments | Maturity date, credit quality and interest rates. |
| Futures Contracts | Exchange traded close price. |
The Fund classifies its valuations into three levels based upon the observability of inputs to the valuation of the Fund’s investments. The valuation levels are not necessarily an indication of the risk or liquidity associated with the underlying investment. Classification is based on the lowest level of input significant to the fair value measurement. The three levels are defined as follows:
Level 1 – Unadjusted quoted prices for identical securities in active markets.
Level 2 – Inputs other than quoted prices included in Level 1 that are observable either directly or indirectly. These may include quoted prices for similar assets in active markets.
Level 3 – Unobservable inputs to the extent observable inputs are not available and may include prices obtained from single broker quotes. Unobservable inputs reflect the Fund’s own assumptions and would be based on the best information available under the circumstances.
As of December 31, 2022, the inputs used to value the Fund’s investments are detailed in the following table. More information regarding the sector classifications, as applicable, are included in the Schedule of Investments.
Annual Report - December 31, 2022
| Level 1 | Level 2 | Level 3 | Total | ||||
| Assets | |||||||
| Investments, at fair value: | |||||||
| Asset-Backed Securities | $ — | $ 84,186,292 | $ — | $ 84,186,292 | |||
| Bank Loans | — | 35,054,175 | — | 35,054,175 | |||
| Corporate Bonds and Notes | — | 278,253,048 | — | 278,253,048 | |||
| Convertible Bonds | — | 9,647,942 | — | 9,647,942 | |||
| Foreign Government Bonds and Notes | — | 15,696,869 | — | 15,696,869 | |||
| Mortgage-Backed Securities | — | 47,599,269 | — | 47,599,269 | |||
| Municipal Bonds and Notes | — | 3,576,046 | — | 3,576,046 | |||
| U.S. Treasury Bonds and Notes | — | 94,089,446 | — | 94,089,446 | |||
| Common Stock | 1,219,895 | — | — | 1,219,895 | |||
| Convertible Preferred Stock | |||||||
| Communications | 660,100 | — | — | 660,100 | |||
| Energy | 564,700 | — | — | 564,700 | |||
| Financial | 2,634,481 | — | — | 2,634,481 | |||
| Technology | — | 267,589 | — | 267,589 | |||
| 3,859,281 | 267,589 | — | 4,126,870 | ||||
| Government Money Market Mutual Funds | 1,650,000 | — | — | 1,650,000 | |||
| Short Term Investments | — | 96,404,619 | — | 96,404,619 | |||
| Total Assets | $ 6,729,176 | $ 664,775,295 | $ 0 | $ 671,504,471 | |||
| Liabilities | |||||||
| Other Financial Investments: | |||||||
| Futures Contracts(a) | $ (741,112) | $ — | $ — | $ (741,112) | |||
| Total Liabilities | $ (741,112) | $ 0 | $ — | $ (741,112) |
| (a) | Futures Contracts are reported at the security’s unrealized appreciation (depreciation), which represents the change in the contract’s value from trade date. |
Repurchase Agreements
The Fund may engage in repurchase agreement transactions with institutions that the Fund’s investment adviser has determined are creditworthy. The Fund will purchase securities at a specified price with an agreement to sell the securities to the same counterparty at a specified time, price and interest rate. The Fund’s custodian and/or securities lending agent receives delivery of the underlying securities collateralizing a repurchase agreement. Collateral is at least equal to the value of the repurchase obligation including interest. A repurchase agreement transaction involves certain risks in the event of default or insolvency of the counterparty. These risks include possible delays or restrictions upon a Fund’s ability to dispose of the underlying securities and a possible decline in the value of the underlying securities during the period while the Fund seeks to assert its rights.
Foreign Currency Translations and Transactions
The accounting records of the Fund are maintained in U.S. dollars. Investment securities, and other assets and liabilities denominated in a foreign currency are translated into U.S. dollars at the current exchange rate. Purchases and sales of securities, income receipts and expense payments are translated into U.S. dollars at the exchange rate on the dates of the transactions.
The Fund does not isolate the portion of the results of operations resulting from changes in foreign exchange rates on investments from the fluctuations arising from changes in market prices of securities held. Such fluctuations are included with the net realized and unrealized gain or loss.
Net realized foreign exchange gains or losses arise from sales of foreign currencies, currency gains or losses realized between the trade and settlement dates on securities transactions, and the difference between the amounts of dividends, interest, and foreign withholding taxes recorded by the Fund and the U.S. dollar equivalent of the amounts actually received
Annual Report - December 31, 2022
or paid. Net unrealized foreign exchange gains and losses arise from changes in the fair values of assets and liabilities, other than investments in securities at fiscal period end, resulting from changes in exchange rates. These gains and losses are included in net realized gain or loss and change in net unrealized appreciation or depreciation on the Statement of Operations.
Security Transactions
Security transactions are accounted for on the date the security is purchased or sold (trade date). Realized gains and losses from investments sold are determined on a specific lot selection. Dividend income for the Fund is accrued as of the ex-dividend date and interest income, including amortization of discounts and premiums, is recorded daily.
Federal Income Taxes and Distributions to Shareholders
The Fund intends to comply with provisions under Subchapter M of the Internal Revenue Code applicable to regulated investment companies and to distribute substantially all of its net taxable income, including any net realized gain on investments not offset by capital loss carryforwards, if any, to shareholders. Therefore, no federal income or excise tax provision is required. The Fund files income tax returns in U.S. federal and applicable state jurisdictions. The statute of limitations on the Fund’s tax return filings generally remains open for the three preceding fiscal reporting period ends. State tax returns may remain open for an additional fiscal year.
Distributions to shareholders from net investment income of the Fund, if any, are declared and paid semi-annually. Capital gain distributions of the Fund, if any, are declared and paid at least annually. Distributions are reinvested in additional shares of the Fund at net asset value and are declared separately for each class. Distributions are determined in accordance with income tax regulations, which may differ from U.S. generally accepted accounting principles.
The tax character of distributions paid during the years ended December 31, 2022 and 2021 were as follows:
| 2022 | 2021 | ||
| Ordinary income | $23,786,991 | $27,182,342 | |
| Long-term capital gain | 1,042,278 | 13,392,922 | |
| $24,829,269 | $40,575,264 |
Net investment income (loss) and net realized gain (loss) for federal income tax purposes may differ from those reported on the financial statements because of temporary and permanent book-tax basis differences. Book-tax differences may include but are not limited to the following: wash sales, distribution adjustments, market discount adjustments, real estate investment trust securities and foreign currency reclassifications.
Capital accounts within the financial statements are adjusted for permanent book-tax differences, and are not adjusted for temporary book-tax differences which will reverse in a subsequent period. Accordingly, the Fund has reclassified $3,020 from Undistributed/accumulated earnings to Paid-in capital for December 31, 2022. Net assets of the Fund were unaffected by the reclassifications.
The tax components of capital shown in the following table represent distribution requirements the Fund must satisfy under the income tax regulations, losses the Fund may be able to offset against income and gains realized in future years and unrealized appreciation or depreciation for federal income tax purposes. At December 31, 2022, the components of distributable earnings on a tax basis were as follows:
| Undistributed net investment income | $1,025,949 |
| Undistributed long-term capital gains | — |
| Capital loss carryforwards | (21,756,484) |
| Post-October losses | — |
| Net unrealized depreciation | (67,817,785) |
| Tax composition of capital | $(88,548,320) |
Annual Report - December 31, 2022
At December 31, 2022, the Fund had capital loss carryforwards available to offset future realized capital gains, if any, and thereby reduce future taxable gain distributions. Capital loss carryforwards with no expiration, if any, must be utilized prior to those with expiration dates. During the year ended December 31, 2022, the Fund did not utilize any capital loss carryforwards. Details of the capital loss carryforwards as of December 31, 2022, were as follows:
| No Expiration | $(21,756,484) |
| Total | (21,756,484) |
The aggregate cost of securities and other investments and the composition of unrealized appreciation and depreciation for federal income tax purposes as of December 31, 2022 were as follows:
| Federal tax cost of investments | $738,581,144 |
| Gross unrealized appreciation on investments | 1,888,779 |
| Gross unrealized depreciation on investments | (69,706,564) |
| Net unrealized depreciation on investments | $(67,817,785) |
2. DERIVATIVE FINANCIAL INSTRUMENTS
The Fund's investment objective allows the Fund to enter into various types of derivative contracts, including futures contracts. Derivatives are investments whose value is primarily derived from underlying assets, indices or reference rates.
In pursuit of the Fund's investment objectives, the Fund may seek to use derivatives to increase or decrease its exposure to the following market risks:
Interest Rate Risk - The risk that market value of a fixed income security is affected significantly by changes in interest rates. When interest rates rise, the security’s market value declines and when interest rates decline, market values rise. The longer a security’s maturity, the greater the risk and the higher its yield. Conversely, the shorter a security’s maturity, the lower the risk and the lower its yield.
The Fund is also exposed to additional risks from investing in derivatives, such as liquidity and counterparty credit risk. Liquidity risk is the risk that the Fund will be unable to sell or close out the derivative in the open market in a timely manner. Counterparty credit risk is the risk that the counterparty will not be able to fulfill its obligations to the Fund. Investing in derivatives may also involve greater risks than investing directly in the underlying assets, such as losses in excess of any initial investment and collateral received. In addition, there may be the risk that the change in value of the derivative contract does not correspond to the change in value of the underlying instrument.
Futures Contracts
The Fund uses futures contracts to capitalize on expected changes in the shape of the yield curve and to control overall interest rate exposure. A futures contract is an agreement between two parties to buy or sell a specified underlying investment for a fixed price at a specified future date. Futures contracts are generally entered into on a regulated futures exchange and cleared through a clearinghouse associated with the exchange.The use of futures contracts may involve risks such as the possibility of illiquid markets or imperfect correlation between the value of the contracts and the underlying securities that comprise the index, or that the clearinghouse will fail to perform its obligations.
Futures contracts are reported in a table following the Schedule of Investments. Upon entering into a futures contract, the Fund is required to pledge to the broker an amount of cash and/or other assets equal to a certain percentage of the contract amount (initial margin deposit). Receipts or payments, known as variation margin, are made or received by the Fund each day, depending on the daily fluctuations in the fair value of the underlying security. This is recorded as variation margin on futures contracts on the Statement of Assets and Liabilities. When the Fund enters into a closing transaction, it will realize, for book purposes, a gain or loss equal to the difference between the value of the futures contract at the time it was opened or purchased and its value at the time it was closed, and is reflected in net realized gain or loss on the Statement of Operations. The Fund held an average of 88 long futures contracts and an average of 14 short futures contracts for the reporting period.
Annual Report - December 31, 2022
Derivative Financial Instruments Categorized by Risk Exposure
Valuation of derivative investments as of December 31, 2022 is as follows:
| Liability Derivatives | ||||
| Risk Exposure | Statement of Assets and Liabilities Location | Fair Value | ||
| Interest contracts (futures contracts) | Net unrealized depreciation on futures contracts | $(741,112) (a) | ||
| (a)Includes cumulative depreciation of futures contracts as reported in the Fund’s Schedule of Investments. Only current day’s variation margin is reported within the Statement of Assets and Liabilities. |
The effect of derivative investments for the year ended December 31, 2022 is as follows:
| Realized Gain or (Loss) | Change in Unrealized Appreciation or (Depreciation) | |||||
| Risk Exposure | Statement of Operations Location | Statement of Operations Location | ||||
| Interest contracts (futures contracts) | Net realized loss on futures contracts | $(1,542,630) | Net change in unrealized depreciation on futures contracts | $(741,112) | ||
3. INVESTMENT ADVISORY AGREEMENT AND OTHER TRANSACTIONS WITH AFFILIATES
Empower Funds entered into an investment advisory agreement with ECM, a wholly-owned subsidiary of Empower Annuity Insurance Company of America (Empower of America). As compensation for its services to Empower Funds, the Adviser receives monthly compensation at the annual rate of 0.52% of the Fund’s average daily net assets up to $1 billion dollars, 0.47% of the Fund’s average daily net assets over $1 billion dollars and 0.42% of the Fund’s average daily net assets over $2 billion dollars. Certain administration and accounting services fees for the Fund are included in the investment advisory agreement.
The Adviser contractually agreed to waive fees or reimburse expenses that exceed an annual rate of 0.55% of the Fund’s average daily net assets attributable to each Class, including management fees and expenses paid directly by the Fund, excluding shareholder service fees and certain extraordinary expenses (the “Expense Limit”). The agreement’s current term ends on April 30, 2023 and automatically renews for one-year unless terminated upon written notice within 90 days of the end of the current term or upon termination of the investment advisory agreement. The amount waived or reimbursed, if any, is reflected in the Statement of Operations.
The Adviser is permitted upon approval by the Board of Directors to recoup amounts waived or reimbursed by the Fund in future periods, not exceeding three years following the particular waiver/reimbursement, provided the total annual operating expenses of each Class of the Fund plus such recoupment do not exceed the lesser of the Expense Limit that was in place at the time of the waiver/reimbursement or the Expense Limit in place at the time of recoupment. At December 31, 2022, the amounts subject to recoupment were as follows:
| Expires December 31, 2023 | Expires December 31, 2024 | Expires December 31, 2025 | Recoupment of Past Reimbursed Fees by the Adviser | |||
| $152,623 | $151,895 | $383,937 | $0 |
The Adviser and Empower Funds have entered into a sub-advisory agreement with Loomis, Sayles & Company, L.P. and Virtus Fixed Income Advisers, LLC. The Adviser is responsible for compensating the Sub-Advisers for their services.
Empower Funds entered into a shareholder services agreement with Empower Retirement, LLC (Empower), an affiliate of ECM and subsidiary of Empower of America. Pursuant to the shareholder services agreement, Empower provides various recordkeeping, administrative and shareholder services to shareholders and receives from the Investor Class shares of the Fund a fee equal to 0.35% of the average daily net asset value of the share class.
Empower Financial Services, Inc. (the Distributor), is a wholly-owned subsidiary of Empower of America and the principal underwriter to distribute and market the Fund.
Annual Report - December 31, 2022
Certain officers of Empower Funds are also directors and/or officers of Empower of America or its subsidiaries. No officer or interested director of Empower Funds receives any compensation directly from Empower Funds. The total compensation paid to the independent directors with respect to all forty-five funds for which they serve as directors was $1,258,500 for the fiscal year ended December 31, 2022.
4. PURCHASES AND SALES OF INVESTMENTS
For the year ended December 31, 2022, the aggregate cost of purchases and proceeds from sales of investments (excluding all U.S. Government securities and short-term securities) were $283,190,021 and $344,014,522, respectively. For the same period, the aggregate cost of purchases and proceeds from sales of long-term U.S. Government securities were $116,961,467 and $77,318,048, respectively.
5. SECURITIES LOANED
The Fund has entered into a securities lending agreement with its custodian as securities lending agent. Under the terms of the agreement the Fund receives income after deductions of other amounts payable to the securities lending agent or to the borrower from lending transactions. In exchange for such fees, the securities lending agent is authorized to loan securities on behalf of the Fund against receipt of cash collateral at least equal in value at all times to the value of the securities loaned plus accrued interest. The fair value of the loaned securities is determined daily at the close of business of the Fund and necessary collateral adjustments are made between the Fund and its counterparties on the next business day through the delivery or receipt of additional collateral. The Fund also continues to receive interest or dividends on the securities loaned. Cash collateral is invested in securities approved by the Board of Directors. The Fund bears the risk of any deficiency in the amount of collateral available for return to a borrower due to a loss in an approved investment. As of December 31, 2022, the Fund had securities on loan valued at $31,091,455 and received collateral as reported on the Statement of Assets and Liabilities of $32,157,643 for such loan which was invested in Repurchase Agreements collateralized by U.S. Government or U.S. Government Agency securities and Government Money Market Mutual Funds. The Repurchase Agreements can be jointly purchased with other lending agent clients and in the event of a default by the counterparty, all lending agent clients would share ratably in the collateral.
Under the securities lending agreement, the collateral pledged is, by definition, the securities loaned against the cash borrowed. The following table summarizes the cash collateral liability under the securities lending agreement by class of securities loaned as of December 31, 2022. Additional information regarding the Fund's securities on loan is included in the Schedule of Investments.
| Security lending transactions | Total (a) |
| Corporate Bonds and Notes | $14,717,678 |
| Convertible Bonds | 4,502,295 |
| Foreign Government Bonds and Notes | 1,989,370 |
| U.S. Treasury Bonds and Notes | 10,948,300 |
| Total secured borrowings | $32,157,643 |
| (a) | The remaining contractual maturity of all of the securities lending transactions is overnight and continuous. |
6. INDEMNIFICATIONS
The Fund’s organizational documents provide current and former officers and directors with a limited indemnification against liabilities arising in connection with the performance of their duties to the Fund. In the normal course of business, the Fund may also enter into contracts that provide general indemnifications. The Fund’s maximum exposure under these arrangements is unknown as this would be dependent on future claims that may be made against the Fund. The risk of material loss from such claims is considered remote.
7. SUBSEQUENT EVENTS
Management has reviewed all events subsequent to December 31, 2022, including the estimates inherent in the process of preparing these financial statements through the date the financial statements were issued. No subsequent events requiring adjustments or disclosures have occurred.
Annual Report - December 31, 2022
REPORT OF INDEPENDENT REGISTERED PUBLIC ACCOUNTING FIRM
To the Shareholders and the Board of Directors of Empower Funds, Inc.
Opinion on the Financial Statements and Financial Highlights
We have audited the accompanying statement of assets and liabilities, including the schedule of investments, of the Empower Multi-Sector Bond Fund (the “Fund”), one of the funds of Empower Funds, Inc., as of December 31, 2022, the related statement of operations for the year then ended, the statements of changes in net assets for each of the two years in the period then ended, the financial highlights for each of the five years in the period then ended, and the related notes. In our opinion, the financial statements and financial highlights present fairly, in all material respects, the financial position of the Fund as of December 31, 2022, and the results of its operations for the year then ended, the changes in its net assets for each of the two years in the period then ended, and the financial highlights for each of the five years in the period then ended in conformity with accounting principles generally accepted in the United States of America.
Basis for Opinion
These financial statements and financial highlights are the responsibility of the Fund's management. Our responsibility is to express an opinion on the Fund's financial statements and financial highlights based on our audits. We are a public accounting firm registered with the Public Company Accounting Oversight Board (United States) (PCAOB) and are required to be independent with respect to the Fund in accordance with the U.S. federal securities laws and the applicable rules and regulations of the Securities and Exchange Commission and the PCAOB.
We conducted our audits in accordance with the standards of the PCAOB. Those standards require that we plan and perform the audit to obtain reasonable assurance about whether the financial statements and financial highlights are free of material misstatement, whether due to error or fraud. The Fund is not required to have, nor were we engaged to perform, an audit of its internal control over financial reporting. As part of our audits we are required to obtain an understanding of internal control over financial reporting but not for the purpose of expressing an opinion on the effectiveness of the Fund’s internal control over financial reporting. Accordingly, we express no such opinion.
Our audits included performing procedures to assess the risks of material misstatement of the financial statements and financial highlights, whether due to error or fraud, and performing procedures that respond to those risks. Such procedures included examining, on a test basis, evidence regarding the amounts and disclosures in the financial statements and financial highlights. Our audits also included evaluating the accounting principles used and significant estimates made by management, as well as evaluating the overall presentation of the financial statements and financial highlights. Our procedures included confirmation of securities owned as of December 31, 2022, by correspondence with the custodian, agent banks, and brokers; when replies were not received from agent banks or brokers, we performed other auditing procedures. We believe that our audits provide a reasonable basis for our opinion.
DELOITTE & TOUCHE LLP
Denver, Colorado
February 23, 2023
We have served as the auditor of one or more Empower investment companies since 1982.
TAX INFORMATION (unaudited)
Dividends paid by the Fund from net investment income and distributions of net realized short-term capital gains are, for federal income tax purposes, taxable as ordinary income to shareholders. Of the ordinary income distributions declared for the year ended December 31, 2022, 2% qualifies for the dividend received deduction available to the Fund’s corporate shareholders.
Fund Directors and Officers
Empower Funds is organized under Maryland law, and is governed by the Board of Directors. The following table provides information about each of the Directors and executive officers of Empower Funds.
| Independent Directors* | |||||
| Name, Address, and Age | Positions(s) Held with Empower Funds | Term of Office and Length of Time Served** | Principal Occupation(s) During Past 5 Years | Number of Funds in Fund Complex Overseen by Director | Other Directorships Held by Director |
| Gail H. Klapper 8515 East Orchard Road, Greenwood Village, CO 80111 79 | Chair & Independent Director | Since 2016 (as Chair) Since 2007 (as Independent Director) | Managing Attorney, Klapper Law Firm; Member/Director, The Colorado Forum; Director, Gold, Inc; Member, Colorado State Fair Board Authority; Manager, 6K Ranch, LLC; and former Director, Guaranty Bancorp | 45 | N/A |
| James A. Hillary*** 8515 East Orchard Road, Greenwood Village, CO 80111 59 | Independent Director | Since 2017 | Principal and Founding Partner, Fios Capital, LLC; Member, Fios Partners LLC, Fios Holdings LLC; Sole Member, Fios Companies LLC, Resolute Capital Asset Partners LLC; Manager, Applejack Holdings, LLC; and Manager and Member, Prestige Land Holdings, LLC | 45 | N/A |
| R. Timothy Hudner**** 8515 East Orchard Road, Greenwood Village, CO 80111 63 | Independent Director | Since 2017 | Director, Colorado State Housing Board; and former Director, Grand Junction Housing Authority; Counseling and Education Center | 45 | N/A |
| Steven A. Lake 8515 East Orchard Road, Greenwood Village, CO 80111 68 | Independent Director | Since 2017 | Managing Member, Lake Advisors, LLC; Member, Gart Capital Partners, LLC; and Executive Member, Sage Enterprise Holdings, LLC | 45 | N/A |
| Independent Directors* | |||||
| Name, Address, and Age | Positions(s) Held with Empower Funds | Term of Office and Length of Time Served** | Principal Occupation(s) During Past 5 Years | Number of Funds in Fund Complex Overseen by Director | Other Directorships Held by Director |
| Stephen G. McConahey 8515 East Orchard Road, Greenwood Village, CO 80111 79 | Independent Director & Audit Committee Chair | Since 2011 (as Independent Director) Since 2015 (as Audit Committee Chair) | Chairman, SGM Capital, LLC; Partner, Iron Gate Capital, LLC; Director, The IMA Financial Group, Inc.; and former Director, Guaranty Bancorp | 45 | N/A |
| Interested Director***** | |||||
| Name, Address, and Age | Positions(s) Held with Empower Funds | Term of Office and Length of Time Served | Principal Occupation(s) During Past 5 Years | Number of Funds in Fund Complex Overseen by Director | Other Directorships Held by Director |
| Jonathan D. Kreider 8515 East Orchard Road, Greenwood Village, CO 80111 39 | Director, President & Chief Executive Officer | Since 2020 | Senior Vice President & Head of Empower Investments, Empower, Empower of America and Empower Life & Annuity Insurance Company of New York (“Empower of NY”); President, Chief Executive Officer & Manager, ECM; formerly, Vice President, Empower Funds Investment Products and Empower Advisory Group, LLC (“EAG”) | 45 | N/A |
| Officers | |||||
| Name, Address, and Age | Positions(s) Held with Empower Funds | Term of Office and Length of Time Served | Principal Occupation(s) During Past 5 Years | Number of Fund in Fund Complex Overseen by Director | Other Directorships Held by Director |
| Jonathan D. Kreider 8515 East Orchard Road, Greenwood Village, CO 80111 39 | Director, President & Chief Executive Officer | Since 2020 | Senior Vice President & Head of Empower Investments, Empower, Empower of America and Empower of NY; President, Chief Executive Officer & Manager, ECM; formerly, Vice President, Empower Funds Investment Products and Empower Advisory Group, LLC (“EAG”) | 45 | N/A |
| Katherine Stoner 8515 East Orchard Road, Greenwood Village, CO 80111 66 | Chief Compliance Officer | Since 2016 | Head of Compliance, Empower Investments, Empower; Chief Compliance Officer, ECM and EAG | N/A | N/A |
| Officers | |||||
| Name, Address, and Age | Positions(s) Held with Empower Funds | Term of Office and Length of Time Served | Principal Occupation(s) During Past 5 Years | Number of Fund in Fund Complex Overseen by Director | Other Directorships Held by Director |
| Ryan L. Logsdon 8515 East Orchard Road, Greenwood Village, CO 80111 48 | Chief Legal Officer & Secretary | Since 2010 (as Secretary) Since 2021 (as Chief Legal Officer) | Deputy General Counsel, Empower; Vice President and Counsel, ECM; Secretary, Empower of America; Corporate Secretary, Empower of NY; formerly, Vice President & Counsel, Empower Funds; Vice President, Counsel & Secretary, EAG & EFSI | N/A | N/A |
| Kelly B. New 8515 East Orchard Road, Greenwood Village, CO 80111 47 | Treasurer | Since 2016 (Assistant Treasurer) Since 2021 (as Treasurer) | Vice President, Fund Administration, Empower; Treasurer, ECM; Vice President & Treasurer, Empower Trust Company, LLC (“ETC”); formerly, Assistant Treasurer Empower Funds & ETC | N/A | N/A |
| John A. Clouthier 8515 East Orchard Road, Greenwood Village, CO 80111 55 | Assistant Treasurer | Since 2007 | Assistant Vice President, Investment Administration, Empower; Assistant Treasurer, ECM; Assistant Vice President and Assistant Treasurer, ETC | N/A | N/A |
| Abhijit Dande 8515 East Orchard Road, Greenwood Village, CO 80111 42 | Derivatives Risk Manager | Since 2022 | Assistant Vice President, Financial Risk Management, Empower; Derivatives Risk Manager, ECM | N/A | N/A |
* A Director who is not an “interested person” of Empower Funds (as defined in Section 2(a)(19) of the 1940 Act, as amended) is referred to as an “Independent Director.”
** Each Director serves until the next shareholders’ meeting (and until the election and qualification of a successor), or until death, resignation, removal or retirement which takes effect no later than May 1 following his or her 75th birthday unless otherwise determined by the remaining directors. The remaining Independent Directors determined that Ms. Klapper and Mr. McConahey should continue on the Board until at least May 1, 2024. Officers are elected by the Board on an annual basis to serve until their successors have been elected and qualified.
*** Mr. Hillary is the sole member of Resolute Capital Asset Partners LLC, which is the general partner for Resolute Capital Asset Partners Fund I LP. Goldman Sachs & Co. LLC, the clearing agent and custodian for Resolute Capital Asset Partners Fund I LP, is the parent company of Goldman Sachs Asset Management, LP, the Sub-Adviser of the Empower Core Strategies: Inflation-Protected
Securities, Empower Inflation-Protected Securities and Empower Mid Cap Value Funds; and a Sub-Adviser of the Empower Core Bond Fund. Mr. Hillary has personal banking accounts with an affiliate of J.P. Morgan Investment Management Inc., a Sub-Adviser of the Empower Core Strategies: U.S. Equity, Empower International Growth and Empower Large Cap Growth Funds. Mr. Hillary receives no special treatment due to the relationship.
**** Mr. Hudner’s daughter is employed by JP Morgan Chase, N.A., an affiliate of J.P. Morgan Investment Management Inc., a Sub-Adviser of the Empower Core Strategies: U.S. Equity, Empower International Growth and Empower Large Cap Growth Funds. Mr. Hudner has personal investments in the following: (1) a mutual fund advised by Massachusetts Financial Services Company, a Sub-Adviser of the Empower International Value Fund, (2) a mutual fund advised by Virtus Investment Advisers, Inc., an affiliate of Virtus Fixed Income Advisers, LLC, a Sub-Adviser of the Empower Multi-Sector Bond Fund, and (3) a mutual fund advised by Lazard Asset Management LLC, a Sub-Adviser of the Empower Emerging Markets Equity Fund. Mr. Hudner receives no special treatment due to his ownership of such mutual funds.
***** An “Interested Director” refers to a Director who is an “interested person” of Empower Funds (as defined in Section 2(a)(19) of the 1940 Act, as amended) by virtue of their affiliation with ECM.
There are no arrangements or understandings between any Director or officer and any other person(s) pursuant to which s/he was elected as Director or officer.
Additional information about Empower Funds and its Directors is available in the Empower Funds’ Statement of Additional Information (“SAI”), which can be obtained free of charge upon request to: Secretary, Empower Funds, Inc., 8525 East Orchard Road, Greenwood Village, Colorado 80111; (866) 831-7129. The SAI is also available on the Fund’s web site at https://www.greatwestinvestments.com.
Availability of Quarterly Portfolio Schedule
Empower Funds files its complete schedule of portfolio holdings with the Securities and Exchange Commission for the first and third quarters of each fiscal year as an exhibit on Form N-PORT. Empower Funds’ Forms N-PORT are available on the Commission’s website at http://www.sec.gov.
Availability of Proxy Voting Policies and Procedures
A description of the policies and procedures that Empower Funds uses to determine how to vote proxies relating to portfolio securities is available without charge, upon request, by calling (866) 831-7129, and of the Securities and Exchange Commission’s website at http://www.sec.gov.
Availability of Proxy Voting Record
Information regarding how Empower Funds voted proxies relating to portfolio securities during the most recent 12-month period ended June 30 is available without charge, upon request, by calling (866) 831-7129, and on the Securities and Exchange Commission’s website at http://www.sec.gov.
ITEM 2. CODE OF ETHICS.
(a) As of the end of the period covered by this report, the registrant has adopted a Code of Ethics (the “Code of Ethics”) that applies to the registrant's principal executive officer, principal financial officer, principal accounting officer or controller, or persons performing similar functions, regardless of whether these individuals are employed by the registrant or a third party.
(b) For purposes of this Item, "code of ethics" means written standards that are reasonably designed to deter wrongdoing and to promote:
(1) Honest and ethical conduct, including the ethical handling of actual or apparent conflicts of interest between personal and professional relationships;
(2) Full, fair, accurate, timely, and understandable disclosure in reports and documents that a registrant files with, or submits to, the Commission and in other public communications made by the registrant;
(3) Compliance with applicable governmental laws, rules, and regulations;
(4) The prompt internal reporting of violations of the code to an appropriate person or persons identified in the code; and
(5) Accountability for adherence to the code.
(c) During the period covered by this report, there have been no amendments to the registrant’s Code of Ethics.
(d) During the period covered by this report, the registrant has not granted any express or implicit waivers from the provisions of the Code of Ethics.
(e) Registrant’s Code of Ethics is attached hereto.
ITEM 3. AUDIT COMMITTEE FINANCIAL EXPERT.
Mr. Stephen A. Lake is the audit committee financial expert and is "independent," pursuant to general instructions on Form N-CSR, Item 3.
An “audit committee financial expert” is not an “expert” for any purpose, including for purposes of Section 11 of the Securities Act of 1933, as a result of being designated as an “audit committee financial expert.” Further, the designation of a person as an “audit committee financial expert” does not mean that the person has any greater duties, obligations, or liability than those imposed on the person without the “audit committee financial expert” designation. Similarly, the designation of a person as an “audit committee financial expert” does not affect the duties, obligations, or liability of any other member of the Audit Committee or Board of Directors.
ITEM 4. PRINCIPAL ACCOUNTANT FEES AND SERVICES.
(a) Audit Fees. The aggregate fees billed for each of the last two fiscal years for professional services rendered by the principal accountant for the audit of the registrant’s annual financial statements or services that are normally provided by the accountant in connection with statutory and regulatory filings or engagements for those fiscal years were: $996,300 for fiscal year 2021 and $1,031,500 for fiscal year 2022.
(b) Audit-Related Fees. The aggregate fees billed in each of the last two fiscal years for assurance and related services by the principal accountant that are reasonably related to the performance of the audit of the registrant’s financial statements and are not reported under paragraph (a) of this Item were: $40,000 for fiscal year 2021 and $42,000 for fiscal year 2022. The nature of the services comprising the fees disclosed under this category involved performance of 17f-2 (self-custody) audits and administrative services related to the audit.
(c) Tax Fees. The aggregate fees billed in each of the last two fiscal years for professional services rendered by the principal accountant for tax compliance, tax advice, and tax planning were: $0 for fiscal year 2021 and $0 for fiscal year 2022.
(d) All Other Fees. There were no fees billed in each of the last two fiscal years for products and services provided by the principal accountant, other than the services reported in paragraphs ((a) through (c) of this Item).
(e) (1) Audit Committee’s Pre-Approval Policies and Procedures.
Pre-Approval of Audit Services. The Audit Committee must approve prior to retention all audit, review or attest engagements required under the securities laws that are provided to Empower Funds by its independent auditors. The Audit Committee will not grant such approval to any auditors that are proposed to perform an audit for Empower Funds if a chief executive officer, controller, chief financial officer, chief accounting officer or any person serving in an equivalent position for Empower Funds that is responsible for the financial reporting or operations of Empower Funds was employed by those auditors and participated in any capacity in an audit of Empower Funds during the year period (or such other period proscribed under SEC rules) preceding the date of initiation of such audit.
Pre-Approval of Non-Audit Services. The Audit Committee must pre-approve any non-audit services, including tax services, to be provided to Empower Funds by its independent auditors (except those within applicable de minimis statutory or regulatory exceptions)1 provided that Empower Funds’ auditors will not provide the following non-audit services to Empower Funds: (a) bookkeeping or other services related to the accounting records or financial statements of Empower Funds; (b) financial information systems design and implementation; (c) appraisal or valuation services, fairness opinions, or contribution-in-kind reports; (d) actuarial services; (e) internal audit outsourcing services; (f) management functions or human resources; (g) broker-dealer, investment adviser, or investment banking services; (h) legal services; (i) expert services unrelated to the audit; and (j) any other service that the
1No pre-approval is required as to non-audit services provided to Empower Funds if: (a) the aggregate amount of all non-audit services provided to Empower Funds constitute not more than 5% of the total amount of revenues paid by Empower Funds to the independent auditors during the fiscal year in which the services are provided; (b) these services were not recognized by Empower Funds at the time of the engagement to be non-audit services; and (c) the services are promptly brought to the attention of the Audit Committee and approved by the Audit Committee prior to the completion of the audit.
Public Company Accounting Oversight Board determines, by regulation, is impermissible. 2
Pre-approval with respect to Non-Empower Funds Entities. The Audit Committee must pre-approve any non-audit services that relate directly to the operations and financial reporting of Empower Funds (except those within applicable de minimis statutory or regulatory exceptions)3 to be provided by Empower Funds’ auditors to (a) Empower Funds’ investment adviser; and (b) any entity controlling, controlled by, or under common control with the investment adviser if that entity provides ongoing services to Empower Funds.4 The Audit Committee may approve audit and non-audit services on a case-by-case basis or adopt pre-approval policies and procedures that are detailed as to a particular service, provided that the Audit Committee is informed promptly of each service, or use a combination of these approaches.
Delegation. The Audit Committee may delegate pre-approval authority to one or more of the Audit Committee's members. Any member or members to whom such pre-approval authority is delegated must report any pre-approval decisions to the Audit Committee at its next scheduled meeting.
(f) (2) 100% of the services described pursuant to paragraphs (b) through (d) of this Item 4 of Form N-CSR were approved by the Audit Committee, and no such services were approved by the Audit Committee pursuant to paragraph (c)(7)(i)(C) of Rule 2-01 of Regulation S-X.
(g) Not Applicable.
(h) The aggregate non-audit fees billed by the registrant’s accountant for services rendered to the registrant, and rendered to the registrant’s investment adviser (not including any sub-adviser whose role is primarily portfolio management and is subcontracted with or overseen by another investment adviser), and any entity controlling, controlled by, or under common control with the adviser that provides ongoing services to the registrant for fiscal year 2021 equaled $2,255,405 and for fiscal year 2022 equaled $1,022,840.
(i) The registrant’s Audit Committee of the Board of Directors has considered whether the provision of non-audit services that were rendered to the registrant’s investment adviser (not including any subadviser whose role is primarily portfolio management and is subcontracted with or overseen by
2With respect to the prohibitions on (a) bookkeeping; (b) financial information systems design and implementation; (c) appraisal, valuation, fairness opinions, or contribution-in-kind reports; (d) actuarial; and (e) internal audit outsourcing, such services are permitted to be provided if it is reasonable to conclude that the results of these services will not be subject to audit procedures during an audit of the audit client's financial statements.
3For non-audit services provided to the adviser and entities in a control relationship with the adviser, no pre-approval is required if: (a) the aggregate amount of all non-audit services provided constitute not more than 5% of the total amount of revenues paid to the independent auditors during the fiscal year in which the services are provided to Empower Funds, Empower Funds’ investment adviser, and any entity controlling, controlled by, or under common control with the investment adviser if that entity provides ongoing services to Empower Funds; (b) these services were not recognized by Empower Funds at the time of the engagement to be non-audit services; and (c) the services are promptly brought to the attention of the Audit Committee and approved by the Audit Committee prior to the completion of the audit.
4No pre-approval is required by the Audit Committee as to non-audit services provided to any Empower Funds sub-adviser that primarily provides portfolio management services and is under the direction of another investment adviser and is not affiliated with Empower Funds’ primary investment adviser.
another investment adviser), and any entity controlling, controlled by, or under common control with the investment adviser that provides ongoing services to the registrant that were not pre-approved pursuant to paragraph (c)(7)(ii) of Rule 2-01 of Regulation S-X is compatible with maintaining the principal accountant’s independence.
ITEM 5. AUDIT COMMITTEE OF LISTED REGISTRANTS.
Not applicable.
ITEM 6. INVESTMENTS.
(a) The schedule is included as part of the report to shareholders filed under Item 1 of this Form.
(b) Not applicable.
ITEM 7. DISCLOSURE OF PROXY VOTING POLICIES AND PROCEDURES FOR CLOSED-END MANAGEMENT INVESTMENT COMPANIES.
Not applicable.
ITEM 8. PORTFOLIO MANAGERS OF CLOSED-END MANAGEMENT INVESTMENT COMPANIES.
Not applicable.
ITEM 9. PURCHASE OF EQUITY SECURITIES BY CLOSED-END MANAGEMENT INVESTMENT COMPANY AND AFFILIATED PURCHASERS.
Not applicable.
ITEM 10. SUBMISSION OF MATTERS TO A VOTE OF SECURITY HOLDERS.
There have been no material changes to the procedures by which shareholders may recommend nominees to the registrant’s board of directors that were implemented after the registrant last provided disclosure in response to this Item.
ITEM 11. CONTROLS AND PROCEDURES.
(a) The registrant's principal executive officer and principal financial officer have concluded, based upon their evaluation of the registrant's disclosure controls and procedures as conducted within 90 days of the filing date of this report, that these disclosure controls and procedures provide reasonable assurance that material information required to be disclosed by the registrant in the report it files or submits on Form N-CSR is recorded, processed, summarized and reported, within the time periods specified in the commission's rules and forms and that such material information is accumulated and communicated to the registrant's management, including its principal executive officer and principal financial officer, as appropriate, in order to allow timely decisions regarding required disclosure.
(b) The registrant's principal executive officer and principal financial officer are aware of no changes in the registrant's internal control over financial reporting that occurred during the registrant's most recent fiscal half-year that has materially affected, or is reasonably likely to materially affect, the registrant's internal control over financial reporting.
ITEM 12. DISCLOSURE OF LENDING ACTIVITES FOR CLOSED-END MANAGEMENT INVESTMENT COMPANIES.
(a) Not applicable.
ITEM 13. EXHIBITS.
(3) Not applicable.
(4) Not applicable.
SIGNATURES
Pursuant to the requirements of the Securities Exchange Act of 1934 and the Investment Company Act of 1940, the registrant has duly caused this report to be signed on its behalf by the undersigned, thereunto duly authorized.
EMPOWER FUNDS, INC.
| By: | /s/ Jonathan D. Kreider |
Jonathan D. Kreider
President & Chief Executive Officer
President & Chief Executive Officer
Date:February 23, 2023
Pursuant to the requirements of the Securities Exchange Act of 1934 and the Investment Company Act of 1940, this report has been signed below by the following persons on behalf of the registrant and in the capacities and on the dates indicated.
| By: | /s/ Jonathan D. Kreider |
Jonathan D. Kreider
President & Chief Executive Officer
President & Chief Executive Officer
Date:February 23, 2023
| By: | /s/ Kelly B. New |
Kelly B. New
Treasurer
Treasurer
Date:February 23, 2023