UNITED STATES
SECURITIES AND EXCHANGE COMMISSION
Washington, D.C. 20549
Washington, D.C. 20549
FORM N-CSR
CERTIFIED SHAREHOLDER REPORT OF REGISTERED
MANAGEMENT INVESTMENT COMPANIES
MANAGEMENT INVESTMENT COMPANIES
Investment Company Act file number: 811-03364
EMPOWER FUNDS, INC.
(Exact name of registrant as specified in charter)
8515 E. Orchard Road, Greenwood Village, Colorado 80111
(Address of principal executive offices)
(Address of principal executive offices)
Jonathan D. Kreider
President & Chief Executive Officer
Empower Funds, Inc.
Empower Funds, Inc.
8515 E. Orchard Road
Greenwood Village, Colorado 80111
(Name and address of agent for service)
Registrant's telephone number, including area code: (866) 831-7129
Date of fiscal year end: December 31
Date of reporting period: December 31, 2023
Item 1. REPORTS TO STOCKHOLDERS
EMPOWER FUNDS, INC.
Empower Real Estate Index Fund
(Institutional Class and Investor Class)
Annual Report
December 31, 2023
This report and the financial statements attached are submitted for general information and are not authorized for distribution to prospective investors unless preceded or accompanied by an effective prospectus. Nothing herein is to be considered an offer of the sale of shares of the Fund. Such offering is made only by the prospectus of the Fund, which includes details as to offering price and other information.
Management Discussion
The Fund’s sub-adviser is Irish Life Investment Managers Limited (“ILIM”)
Fund Performance
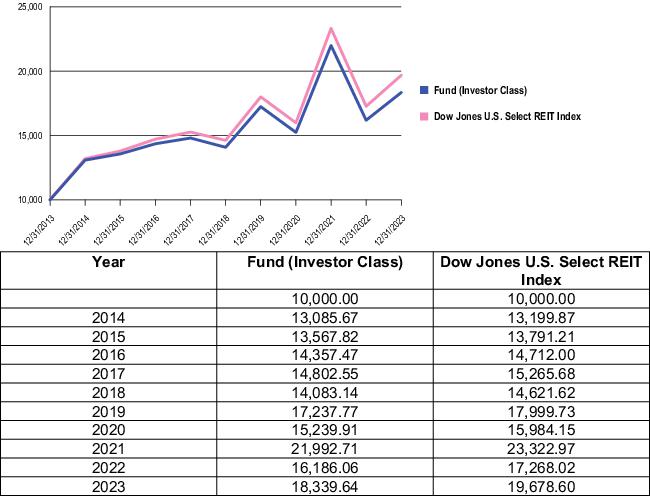
For the twelve-month period ended December 31, 2023, the Fund (Investor Class shares) returned 13.31%, relative to a 13.96% return for the Dow Jones U.S. Select REIT Index, the Fund’s benchmark index.
ILIM Commentary
Global equities rallied over the past twelve months, buoyed by hopes for a soft landing whereby while growth slows, a recession is avoided and inflation continues to fall, enabling central banks to begin cutting interest rates in 2024. The development and implementation of artificial intelligence was also supportive as it led investors to believe the technology had the potential to boost productivity and company profit margins significantly in the medium term.
Real estate investment trust (“REIT”) stocks underperformed the overall market in 2023, hampered by rising interest rates for most of the year, which pushed up funding costs. However, in November and December, REITs rallied sharply as the prospect of rate cuts in early 2024 acted as a tailwind. On a sector basis, hotel and lodging REITs outperformed the broader index, rising by 27.5% as strong demand in the tourism sector was supportive. Elsewhere, office REITs underperformed, falling by -0.6% as hybrid work models continued to act as a headwind for the office sector. Residential REITs also underperformed, rising by 8.3% and were hampered by rising interest rates.
The views and opinions in this report were current as of December 31, 2023 and are subject to change at any time. They are not guarantees of performance or investment results and should not be taken as investment advice. Fund holdings are subject to change at any time. Fund returns are net of fees unless otherwise noted.
Growth of $10,000 (unaudited)
This graph compares the value of a hypothetical $10,000 investment in the Fund over the past 10 fiscal year periods or since inception (for funds lacking 10-year records) with the performance of the Fund’s benchmark index. Results include the reinvestment of all dividends and capital gains distributions. Past performance is no guarantee of future results. The graph does not reflect the deduction of taxes that a shareholder would pay on Fund distributions or the redemption of Fund shares. Performance does not include any fees or expenses of variable insurance contracts, individual retirement accounts (“IRA(s)”), qualified retirement plans or college savings programs. If such fees and expenses were included, returns would be lower.
Note: Performance for the Institutional Class shares may vary due to their differing fee structure. See returns table below.
Average Annual Total Returns for the Periods Ended December 31, 2023 (unaudited)
| One Year | Five Year | Ten Year / Since Inception(a) | |
| Institutional Class | 13.64% | 5.79% | 4.52% |
| Investor Class | 13.31% | 5.42% | 6.25% |
| (a) Institutional Class inception date was May 1, 2015. |
Results include the reinvestment of all dividends and capital gains distributions. Past performance is no guarantee of future results. The table does not reflect the deduction of taxes that a shareholder would pay on Fund distributions or the redemption of Fund shares. Performance does not include any fees or expenses of variable insurance contracts, IRAs, qualified retirement plans or college savings programs. If such fees and expenses were included, returns would be lower.
Summary of Investments by Sector as of December 31, 2023 (unaudited)
| Sector | Percentage of Fund Investments |
| Financial | 99.18% |
| Short Term Investments | 0.82 |
| Total | 100.00% |
Shareholder Expense Example (unaudited)
As a shareholder of the Fund, you incur two types of costs: (1) transaction costs, and (2) ongoing costs, including management fees and other Fund expenses. This Example is intended to help you understand your ongoing costs (in dollars) of investing in the Fund and to compare these costs with the ongoing costs of investing in other mutual funds.
The Example is based on an investment of $1,000 invested at the beginning of the period and held for the entire period (July 1, 2023 to December 31, 2023).
Actual Expenses
The first row of the table below provides information about actual account values and actual expenses. You may use the information in this row, together with the amount you invested, to estimate the expenses that you paid over the period. Simply divide your account value by $1,000 (for example, an $8,600 account value divided by $1,000 = 8.6), then multiply the result by the number in the first row under the heading entitled “Expenses Paid During Period” to estimate the expenses you paid on your account during this period.
Hypothetical Example for Comparison Purposes
The second row of the table below provides information about hypothetical account values and hypothetical expenses based on the Fund’s actual expense ratio and an assumed rate of return of 5% per year before expenses, which is not the Fund’s actual return. The hypothetical account values and expenses may not be used to estimate the actual ending account balance or expenses you paid for the period. You may use this information to compare the ongoing costs of investing in the Fund and other funds. To do so, compare this 5% hypothetical example with the 5% hypothetical examples that appear in the shareholder reports of the other funds.
Please note that the expenses shown in the table are meant to highlight your ongoing costs only and do not reflect any transactional costs. Therefore, the second row of the table is useful in comparing ongoing costs only, and will not help you determine the relative total costs of owning different funds. In addition, if these transactional costs were included, your costs would have been higher.
| Empower Real Estate Index Fund | Beginning Account Value | Ending Account Value | Expenses Paid During Period* | ||
| (07/01/23) | (12/31/23) | (07/01/23 – 12/31/23) | |||
| Institutional Class | |||||
| Actual | $1,000.00 | $1,074.70 | $1.57 | ||
| Hypothetical (5% return before expenses) | $1,000.00 | $1,023.70 | $1.53 | ||
| Investor Class | |||||
| Actual | $1,000.00 | $1,073.50 | $3.40 | ||
| Hypothetical (5% return before expenses) | $1,000.00 | $1,021.90 | $3.31 |
| * Expenses are equal to the Fund's annualized expense ratio of 0.30% for the Institutional Class shares and 0.65% for the Investor Class shares, multiplied by the average account value over the period, multiplied by 184/365 days to reflect the one-half year period. Performance does not include any fees or expenses of variable insurance contracts, IRAs, qualified retirement plans or college savings programs, if applicable. If such fees or expenses were included, returns would be lower. |
EMPOWER FUNDS, INC.
EMPOWER REAL ESTATE INDEX FUND
Schedule of Investments
As of December 31, 2023
| Shares | Fair Value | |
| COMMON STOCK | ||
| Apartment REITS — 14.59% | ||
| 258,206 | American Homes 4 Rent Class A REIT | $ 9,285,088 |
| 118,487 | Apartment Income Corp REIT | 4,115,053 |
| 104,818 | Apartment Investment & Management Co Class A REIT(a) | 820,725 |
| 115,293 | AvalonBay Communities Inc REIT | 21,585,155 |
| 86,681 | Camden Property Trust REIT | 8,606,557 |
| 12,515 | Centerspace REIT | 728,373 |
| 73,108 | Elme Communities REIT | 1,067,377 |
| 280,531 | Equity Residential REIT | 17,157,276 |
| 52,108 | Essex Property Trust Inc REIT | 12,919,658 |
| 181,242 | Independence Realty Trust Inc REIT | 2,773,003 |
| 467,003 | Invitation Homes Inc REIT | 15,929,472 |
| 94,733 | Mid-America Apartment Communities Inc REIT | 12,737,799 |
| 19,556 | NexPoint Residential Trust Inc REIT | 673,313 |
| 245,675 | UDR Inc REIT | 9,406,896 |
| 117,805,745 | ||
| Diversified REITS — 14.35% | ||
| 39,772 | American Assets Trust Inc REIT | 895,268 |
| 151,791 | Broadstone Net Lease Inc REIT | 2,613,841 |
| 245,867 | Digital Realty Trust Inc REIT | 33,088,781 |
| 61,117 | EPR Properties REIT | 2,961,118 |
| 76,218 | Equinix Inc REIT | 61,385,215 |
| 161,402 | Global Net Lease Inc REIT | 1,605,950 |
| 48,293 | UMH Properties Inc REIT | 739,849 |
| 66,588 | Veris Residential Inc REIT | 1,047,429 |
| 177,527 | WP Carey Inc REIT | 11,505,525 |
| 115,842,976 | ||
| Health Care REITS — 10.62% | ||
| 95,567 | CareTrust Inc REIT | 2,138,789 |
| 21,011 | Community Healthcare Trust Inc REIT | 559,733 |
| 176,520 | Diversified Healthcare Trust REIT | 660,185 |
| 50,702 | Global Medical Inc REIT | 562,792 |
| 308,464 | Healthcare Realty Trust Inc REIT | 5,314,835 |
| 444,137 | Healthpeak Properties Inc REIT | 8,793,913 |
| 481,786 | Medical Properties Trust Inc REIT(b) | 2,365,569 |
| 35,926 | National Health Investors Inc REIT | 2,006,467 |
| 198,897 | Omega Healthcare Investors Inc REIT | 6,098,182 |
| 10,902 | Universal Health Realty Income Trust REIT | 471,512 |
| 326,670 | Ventas Inc REIT | 16,281,233 |
| Shares | Fair Value | |
| Health Care REITS — (continued) | ||
| 449,329 | Welltower Inc REIT | $ 40,515,995 |
| 85,769,205 | ||
| Hotels REITS — 3.93% | ||
| 172,675 | Apple Hospitality Inc REIT | 2,868,132 |
| 41,561 | Chatham Lodging Trust REIT | 445,534 |
| 174,100 | DiamondRock Hospitality Co REIT | 1,634,799 |
| 572,702 | Host Hotels & Resorts Inc REIT | 11,150,508 |
| 170,474 | Park Hotels & Resorts Inc REIT | 2,608,252 |
| 100,079 | Pebblebrook Hotel Trust REIT | 1,599,263 |
| 123,906 | RLJ Lodging Trust REIT | 1,452,178 |
| 48,364 | Ryman Hospitality Properties Inc REIT | 5,322,942 |
| 137,758 | Service Properties Trust REIT | 1,176,453 |
| 90,158 | Summit Hotel Properties Inc REIT | 605,862 |
| 164,380 | Sunstone Hotel Investors Inc REIT | 1,763,797 |
| 83,100 | Xenia Hotels & Resorts Inc REIT | 1,131,822 |
| 31,759,542 | ||
| Manufactured Homes REITS — 2.99% | ||
| 151,321 | Equity LifeStyle Properties Inc REIT | 10,674,183 |
| 101,030 | Sun Communities Inc REIT | 13,502,660 |
| 24,176,843 | ||
| Office Property REITS — 6.41% | ||
| 126,969 | Alexandria Real Estate Equities Inc REIT | 16,095,860 |
| 117,217 | Boston Properties Inc REIT | 8,225,117 |
| 144,449 | Brandywine Realty Trust REIT | 780,025 |
| 90,670 | COPT Defense Properties REIT | 2,323,872 |
| 123,128 | Cousins Properties Inc REIT | 2,998,167 |
| 133,133 | Douglas Emmett Inc REIT | 1,930,428 |
| 78,965 | Easterly Government Properties Inc REIT | 1,061,290 |
| 105,809 | Empire State Realty Trust Inc Class A REIT | 1,025,289 |
| 86,599 | Equity Commonwealth REIT | 1,662,701 |
| 84,238 | Highwoods Properties Inc REIT | 1,934,104 |
| 98,980 | Hudson Pacific Properties Inc REIT | 921,504 |
| 68,634 | JBG SMITH Properties REIT | 1,167,464 |
| 86,614 | Kilroy Realty Corp REIT | 3,450,702 |
| 12,062 | NET Lease Office Properties REIT | 222,906 |
| 33,786 | Office Properties Income Trust REIT | 247,314 |
| 48,277 | Orion Office Inc REIT | 276,144 |
| 139,846 | Paramount Group Inc REIT | 723,004 |
See Notes to Financial Statements.
Annual Report - December 31, 2023
EMPOWER FUNDS, INC.
EMPOWER REAL ESTATE INDEX FUND
Schedule of Investments
As of December 31, 2023
| Shares | Fair Value | |
| Office Property REITS — (continued) | ||
| 100,949 | Piedmont Office Realty Trust Inc Class A REIT | $ 717,747 |
| 51,877 | SL Green Realty Corp REIT | 2,343,284 |
| 130,781 | Vornado Realty Trust REIT(b) | 3,694,563 |
| 51,801,485 | ||
| Regional Malls REITS — 5.31% | ||
| 173,125 | Macerich Co REIT | 2,671,319 |
| 264,855 | Simon Property Group Inc REIT | 37,778,917 |
| 86,812 | Tanger Inc REIT | 2,406,429 |
| 42,856,665 | ||
| Shopping Centers REITS — 5.43% | ||
| 79,758 | Acadia Realty Trust REIT | 1,355,089 |
| 244,031 | Brixmor Property Group Inc REIT | 5,678,601 |
| 59,638 | Federal Realty Investment Trust REIT | 6,145,696 |
| 503,239 | Kimco Realty Corp REIT | 10,724,023 |
| 178,107 | Kite Realty Group Trust REIT | 4,071,526 |
| 54,744 | NETSTREIT Corp REIT | 977,180 |
| 133,367 | Regency Centers Corp REIT | 8,935,589 |
| 104,648 | Retail Opportunity Investments Corp REIT | 1,468,212 |
| 61,499 | RPT Realty REIT | 789,032 |
| 143,804 | SITE Centers Corp REIT | 1,960,047 |
| 93,337 | Urban Edge Properties REIT | 1,708,067 |
| 43,813,062 | ||
| Single Tenant REITS — 6.99% | ||
| 81,401 | Agree Realty Corp REIT | 5,124,193 |
| 126,666 | Essential Properties Realty Trust Inc REIT | 3,237,583 |
| 72,011 | Four Corners Property Trust Inc REIT | 1,821,878 |
| 38,230 | Getty Realty Corp REIT | 1,117,081 |
| 148,113 | NNN Inc REIT | 6,383,670 |
| 587,712 | Realty Income Corp REIT | 33,746,423 |
| 114,281 | Spirit Realty Capital Inc REIT | 4,992,937 |
| 56,423,765 | ||
| Storage REITS — 9.63% | ||
| 182,551 | CubeSmart REIT | 8,461,239 |
| 171,524 | Extra Space Storage Inc REIT | 27,500,443 |
| 62,453 | National Storage Affiliates Trust REIT | 2,589,926 |
| 128,476 | Public Storage REIT | 39,185,180 |
| 77,736,788 | ||
| Warehouse/Industry REITS — 17.85% | ||
| 216,362 | Americold Realty Trust Inc REIT | 6,549,278 |
| 37,612 | EastGroup Properties Inc REIT | 6,903,306 |
| 107,310 | First Industrial Realty Trust Inc REIT | 5,652,018 |
| Shares | Fair Value | |
| Warehouse/Industry REITS — (continued) | ||
| 22,479 | Innovative Industrial Properties Inc REIT(b) | $ 2,266,333 |
| 241,605 | LXP Industrial Trust REIT | 2,396,722 |
| 30,177 | Plymouth Industrial Inc REIT | 726,360 |
| 750,118 | Prologis Inc REIT | 99,990,729 |
| 171,378 | Rexford Industrial Realty Inc REIT | 9,614,306 |
| 147,407 | STAG Industrial Inc REIT | 5,787,199 |
| 68,123 | Terreno Realty Corp REIT | 4,269,268 |
| 144,155,519 | ||
| TOTAL COMMON STOCK — 98.10% (Cost $745,511,732) | $792,141,595 | |
| Principal Amount | ||
| SHORT TERM INVESTMENTS | ||
| U.S. Treasury Bonds and Notes — 0.30% | ||
| $2,459,400 | U.S. Treasury Bills(c) 5.26%, 02/22/2024 | 2,440,138 |
| Repurchase Agreements — 0.51% | ||
| 1,033,304 | Undivided interest of 1.24% in a repurchase agreement (principal amount/value $83,874,265 with a maturity value of $83,924,030) with Bank of Montreal, 5.34%, dated 12/31/23 to be repurchased at $1,033,304 on 1/2/24 collateralized by various U.S. Government Agency securities, 4.50% - 6.50%, 12/1/38 - 12/1/53, with a value of $85,551,750.(d) | 1,033,304 |
| 1,033,304 | Undivided interest of 1.11% in a repurchase agreement (principal amount/value $93,637,100 with a maturity value of $93,692,762) with Bank of America Securities Inc, 5.35%, dated 12/31/23 to be repurchased at $1,033,304 on 1/2/24 collateralized by various U.S. Government Agency securities, 0.00% - 7.00%, 11/1/28 - 12/20/63, with a value of $95,509,842.(d) | 1,033,304 |
See Notes to Financial Statements.
Annual Report - December 31, 2023
EMPOWER FUNDS, INC.
EMPOWER REAL ESTATE INDEX FUND
Schedule of Investments
As of December 31, 2023
| Principal Amount | Fair Value | |
| Repurchase Agreements — (continued) | ||
| $1,033,304 | Undivided interest of 0.87% in a repurchase agreement (principal amount/value $118,664,201 with a maturity value of $118,734,608) with Citigroup Global Markets Inc, 5.34%, dated 12/31/23 to be repurchased at $1,033,304 on 1/2/24 collateralized by Government National Mortgage Association securities, 2.00% - 7.50%, 7/20/37 - 12/20/53, with a value of $121,037,485.(d) | $ 1,033,304 |
| 1,033,306 | Undivided interest of 0.86% in a repurchase agreement (principal amount/value $120,466,826 with a maturity value of $120,538,303) with RBC Capital Markets Corp, 5.34%, dated 12/31/23 to be repurchased at $1,033,306 on 1/2/24 collateralized by U.S. Treasury securities and various U.S. Government Agency securities, 0.00% - 7.50%, 1/15/24 - 12/1/53, with a value of $122,876,165.(d) | 1,033,306 |
| Principal Amount | Fair Value | |
| Repurchase Agreements — (continued) | ||
| $ 2 | Undivided interest of 0.00% in a repurchase agreement (principal amount/value $7,826,153 with a maturity value of $7,830,805) with TD Securities (USA) LLC, 5.35%, dated 12/31/23 to be repurchased at $2 on 1/2/24 collateralized by various U.S. Government Agency securities, 2.50% - 7.00%, 7/1/37 - 1/1/54, with a value of $7,982,676.(d) | $ 2 |
| 4,133,220 | ||
| TOTAL SHORT TERM INVESTMENTS — 0.81% (Cost $6,573,358) | $ 6,573,358 | |
| TOTAL INVESTMENTS — 98.91% (Cost $752,085,090) | $798,714,953 | |
| OTHER ASSETS & LIABILITIES, NET — 1.09% | $ 8,800,293 | |
| TOTAL NET ASSETS — 100.00% | $807,515,246 | |
| (a) | Non-income producing security. |
| (b) | All or a portion of the security is on loan at December 31, 2023. |
| (c) | Zero coupon bond; the interest rate shown is the effective yield on date of purchase. |
| (d) | Collateral received for securities on loan. |
| REIT | Real Estate Investment Trust |
| At December 31, 2023 the Fund held the following outstanding exchange traded futures contracts: | |||||
| Description | Number of Contracts | Notional Amount (000) | Expiration Date | Fair Value and Net Unrealized Appreciation | |
| Long | |||||
| S&P 500® Emini Futures | 66 | USD | 15,906 | Mar 2024 | $181,175 |
| Net Appreciation | $181,175 | ||||
See Notes to Financial Statements.
Annual Report - December 31, 2023
EMPOWER FUNDS, INC.
Statement of Assets and Liabilities
As of December 31, 2023
| Empower Real Estate Index Fund | |
| ASSETS: | |
| Investments in securities, fair value(a)(b) | $794,581,733 |
| Repurchase agreements, fair value(c) | 4,133,220 |
| Cash | 9,250,779 |
| Cash pledged on futures contracts | 821,707 |
| Dividends receivable | 3,712,311 |
| Subscriptions receivable | 509,083 |
| Total Assets | 813,008,833 |
| LIABILITIES: | |
| Payable for director fees | 7,018 |
| Payable for other accrued fees | 68,960 |
| Payable for shareholder services fees | 152,268 |
| Payable to investment adviser | 187,408 |
| Payable upon return of securities loaned | 4,133,220 |
| Redemptions payable | 911,513 |
| Variation margin on futures contracts | 33,200 |
| Total Liabilities | 5,493,587 |
| NET ASSETS | $807,515,246 |
| NET ASSETS REPRESENTED BY: | |
| Capital stock, $0.10 par value | $7,717,544 |
| Paid-in capital in excess of par | 766,922,326 |
| Undistributed/accumulated earnings | 32,875,376 |
| NET ASSETS | $807,515,246 |
| NET ASSETS BY CLASS | |
| Investor Class | $525,757,942 |
| Institutional Class | $281,757,304 |
| CAPITAL STOCK: | |
| Authorized | |
| Investor Class | 185,000,000 |
| Institutional Class | 200,000,000 |
| Issued and Outstanding | |
| Investor Class | 43,809,158 |
| Institutional Class | 33,366,286 |
| NET ASSET VALUE, REDEMPTION PRICE AND OFFERING PRICE PER SHARE: | |
| Investor Class | $12.00 |
| Institutional Class | $8.44 |
| (a) Cost of investments | $747,951,870 |
| (b) Including fair value of securities on loan | $3,905,692 |
| (c) Cost of repurchase agreements | $4,133,220 |
See Notes to Financial Statements.
Annual Report - December 31, 2023
EMPOWER FUNDS, INC.
Statement of Operations
For the fiscal year ended December 31, 2023
| Empower Real Estate Index Fund | |
| INVESTMENT INCOME: | |
| Interest | $256,395 |
| Income from securities lending | 10,264 |
| Dividends | 22,769,551 |
| Total Income | 23,036,210 |
| EXPENSES: | |
| Management fees | 1,864,259 |
| Shareholder services fees – Investor Class | 1,423,569 |
| Audit and tax fees | 46,386 |
| Custodian fees | 22,064 |
| Directors fees | 31,396 |
| Legal fees | 9,915 |
| Pricing fees | 388 |
| Registration fees | 55,430 |
| Shareholder report fees | 45,544 |
| Transfer agent fees | 9,532 |
| Other fees | 17,572 |
| Total Expenses | 3,526,055 |
| Less amount waived by investment adviser | 174,566 |
| Net Expenses | 3,351,489 |
| NET INVESTMENT INCOME | 19,684,721 |
| NET REALIZED AND UNREALIZED GAIN (LOSS): | |
| Net realized gain on investments | 4,291,631 |
| Net realized gain on futures contracts | 248,183 |
| Net Realized Gain | 4,539,814 |
| Net change in unrealized appreciation on investments | 79,201,052 |
| Net change in unrealized appreciation on futures contracts | 211,358 |
| Net Change in Unrealized Appreciation | 79,412,410 |
| Net Realized and Unrealized Gain | 83,952,224 |
| NET INCREASE IN NET ASSETS RESULTING FROM OPERATIONS | $103,636,945 |
See Notes to Financial Statements.
Annual Report - December 31, 2023
EMPOWER FUNDS, INC.
Statement of Changes in Net Assets
For the fiscal years ended December 31, 2023 and December 31, 2022
| Empower Real Estate Index Fund | 2023 | 2022 | |
| OPERATIONS: | |||
| Net investment income | $19,684,721 | $11,068,765 | |
| Net realized gain | 4,539,814 | 7,842,101 | |
| Net change in unrealized appreciation (depreciation) | 79,412,410 | (182,809,961) | |
| Net Increase (Decrease) in Net Assets Resulting from Operations | 103,636,945 | (163,899,095) | |
| DISTRIBUTIONS TO SHAREHOLDERS: | |||
| From return of capital | |||
| Investor Class | - | (941,481) | |
| Institutional Class | - | (786,910) | |
| From return of capital | 0 | (1,728,391) | |
| From net investment income and net realized gains | |||
| Investor Class | (8,571,111) | (12,930,645) | |
| Institutional Class | (8,526,085) | (15,042,269) | |
| From net investment income and net realized gains | (17,097,196) | (27,972,914) | |
| Total Distributions | (17,097,196) | (29,701,305) | |
| CAPITAL SHARE TRANSACTIONS: | |||
| Shares sold | |||
| Investor Class | 244,101,540 | 169,266,999 | |
| Institutional Class | 94,192,938 | 72,072,135 | |
| Shares issued in reinvestment of distributions | |||
| Investor Class | 8,571,111 | 13,872,126 | |
| Institutional Class | 8,526,085 | 15,829,179 | |
| Shares redeemed | |||
| Investor Class | (107,087,987) | (66,492,526) | |
| Institutional Class | (74,388,218) | (76,585,923) | |
| Net Increase in Net Assets Resulting from Capital Share Transactions | 173,915,469 | 127,961,990 | |
| Total Increase (Decrease) in Net Assets | 260,455,218 | (65,638,410) | |
| NET ASSETS: | |||
| Beginning of year | 547,060,028 | 612,698,438 | |
| End of year | $807,515,246 | $547,060,028 | |
| CAPITAL SHARE TRANSACTIONS - SHARES: | |||
| Shares sold | |||
| Investor Class | 22,640,998 | 13,660,473 | |
| Institutional Class | 12,577,828 | 8,103,150 | |
| Shares issued in reinvestment of distributions | |||
| Investor Class | 760,868 | 1,276,339 | |
| Institutional Class | 1,067,496 | 2,024,130 | |
| Shares redeemed | |||
| Investor Class | (9,646,014) | (5,158,803) | |
| Institutional Class | (9,222,133) | (8,139,707) | |
| Net Increase | 18,179,043 | 11,765,582 |
See Notes to Financial Statements.
Annual Report - December 31, 2023
EMPOWER FUNDS, INC.
EMPOWER REAL ESTATE INDEX FUND
Financial Highlights
Selected data for a share of capital stock of the Fund throughout the periods indicated.
| Income (Loss) from Investment Operations: | Less Distributions: | ||||||||||
| Net asset value, beginning of year | Net investment income(a) | Net realized and unrealized gain (loss) | Total from investment operations | From return of capital | From net investment income | From net realized gains | Total Distributions | Net asset value, end of year | Total Return(b)(c) | ||
| Investor Class | |||||||||||
| 12/31/2023 | $10.80 | 0.29 | 1.13 | 1.42 | — | (0.20) | (0.02) | (0.22) | $12.00 | 13.31% | |
| 12/31/2022 | $15.36 | 0.24 | (4.29) | (4.05) | (0.04) | (0.18) | (0.29) | (0.51) | $10.80 | (26.40%) | |
| 12/31/2021 | $10.86 | 0.15 | 4.65 | 4.80 | — | (0.09) | (0.21) | (0.30) | $15.36 | 44.31% | |
| 12/31/2020 | $12.50 | 0.27 | (1.74) | (1.47) | — | (0.17) | — | (0.17) | $10.86 | (11.59%) | |
| 12/31/2019 | $10.68 | 0.15 | 2.24 | 2.39 | — | (0.12) | (0.45) | (0.57) | $12.50 | 22.40% | |
| Institutional Class | |||||||||||
| 12/31/2023 | $ 7.69 | 0.30 | 0.73 | 1.03 | — | (0.26) | (0.02) | (0.28) | $ 8.44 | 13.64% | |
| 12/31/2022 | $11.18 | 0.20 | (3.12) | (2.92) | (0.03) | (0.25) | (0.29) | (0.57) | $ 7.69 | (26.11%) | |
| 12/31/2021 | $ 7.96 | 0.11 | 3.43 | 3.54 | — | (0.11) | (0.21) | (0.32) | $11.18 | 44.73% | |
| 12/31/2020 | $ 9.26 | 0.23 | (1.29) | (1.06) | — | (0.24) | — | (0.24) | $ 7.96 | (11.23%) | |
| 12/31/2019 | $ 8.05 | 0.12 | 1.71 | 1.83 | — | (0.17) | (0.45) | (0.62) | $ 9.26 | 22.81% | |
| Net assets, end of year (000) | Ratio of expenses to average net assets (before reimbursement and/or waiver, if applicable) | Ratio of expenses to average net assets (after reimbursement and/or waiver, if applicable) | Ratio of net investment income to average net assets (after reimbursement and/or waiver, if applicable) | Portfolio turnover rate(d) | ||
| Investor Class | ||||||
| 12/31/2023 | $525,758 | 0.68% | 0.65% | 2.59% | 11% | |
| 12/31/2022 | $324,532 | 0.72% | 0.67% | 1.90% | 14% | |
| 12/31/2021 | $311,334 | 0.76% | 0.70% | 1.09% | 33% | |
| 12/31/2020 | $ 57,840 | 0.76% | 0.70% | 2.62% | 44% | |
| 12/31/2019 | $ 63,048 | 0.75% | 0.70% | 1.24% | 19% | |
| Institutional Class | ||||||
| 12/31/2023 | $281,757 | 0.31% | 0.30% | 3.87% | 11% | |
| 12/31/2022 | $222,528 | 0.34% | 0.32% | 2.16% | 14% | |
| 12/31/2021 | $301,365 | 0.37% | 0.35% | 1.17% | 33% | |
| 12/31/2020 | $295,220 | 0.37% | 0.35% | 3.01% | 44% | |
| 12/31/2019 | $291,797 | 0.36% | 0.35% | 1.33% | 19% | |
| (a) | Per share amounts are based upon average shares outstanding. |
| (b) | Total return does not include any fees or expenses of variable insurance contracts, if applicable. If such fees or expenses were included, the return shown would have been lower. |
| (c) | Total return shown net of expenses reimbursed and/or waived, if applicable. Without the expense reimbursement and/or waiver, the return shown would have been lower. |
| (d) | Portfolio turnover is calculated at the Fund level. |
See Notes to Financial Statements.
Annual Report - December 31, 2023
EMPOWER FUNDS, INC.
EMPOWER REAL ESTATE INDEX FUND
Notes to Financial Statements
1. ORGANIZATION AND SIGNIFICANT ACCOUNTING POLICIES
Empower Funds, Inc. (Empower Funds), a Maryland corporation, was organized on December 7, 1981 and is registered under the Investment Company Act of 1940 (the 1940 Act) as an open-end management investment company. Empower Funds presently consists of forty-five funds. Interests in the Empower Real Estate Index Fund (the Fund) are included herein.The investment objective of the Fund is to seek investment results, before fees and expenses, that track the total return of a benchmark index that measures the performance of publicly traded equity real estate investment trusts ("REITs"). The Fund is non-diversified as defined in the 1940 Act. The Fund is available as an investment option to insurance company separate accounts for certain variable annuity contracts and variable life insurance policies, to individual retirement account custodians or trustees, to plan sponsors of qualified retirement plans, to college savings programs, and to asset allocation funds that are a series of Empower Funds.
The Fund offers two share classes, referred to as Investor Class and Institutional Class shares. All shares of the Fund represent an equal pro rata interest in the net assets of the class to which such shares belong, and have identical voting, dividend, liquidation and other rights and the same terms and conditions, except for class specific expenses and exclusive rights to vote on matters affecting only individual classes. Income, expenses (other than those attributable to a specific class) and realized and unrealized gains and losses are allocated daily to each class of shares based on the relative proportion of net assets represented by such class. Operating expenses directly attributable to a specific class are charged against operations of that class. Expenses incurred by Empower Funds, which are not Fund specific, are allocated based on relative net assets or other appropriate allocation methods.
The preparation of financial statements in conformity with accounting principles generally accepted in the United States of America (U.S. GAAP) requires management to make estimates and assumptions that affect the reported amounts of assets and liabilities and disclosure of contingent assets and liabilities at the date of the financial statements and the reported amounts of revenue and expenses during the reporting period. Actual results could differ from those estimates. The Fund is also an investment company and accordingly follows the investment company accounting and reporting guidance of the Financial Accounting Standards Board ("FASB") Accounting Standards Codification Topic 946, Financial Services - Investment Companies. The following is a summary of the significant accounting policies of the Fund.
Security Valuation
The Board of Directors of the Fund has adopted policies and procedures for the valuation of the Fund’s securities and assets, and has appointed the Fair Value Pricing Committee of the investment adviser, Empower Capital Management, LLC (ECM or the Adviser), to complete valuation determinations under those policies and procedures. Pursuant to Rule 2a-5 under the 1940 Act, the Board of Directors approved the Adviser as the Fund’s valuation designee to make all fair value determinations with respect to the Fund’s investments, subject to oversight by the Board of Directors.
The Fund generally values its securities based on market prices determined at the close of regular trading on the New York Stock Exchange (NYSE) on each day the NYSE is open for trading. The net asset value (NAV) of each class of the Fund's shares is determined by dividing the net assets attributable to each class of shares of the Fund by the number of issued and outstanding shares of each class of the Fund on each valuation date.
For securities that are traded on only one exchange, the last sale price as of the close of business of that exchange will be used. If the closing price is not available, the current bid as of the close of business will be used. For securities traded on more than one exchange, or upon one or more exchanges and in the over-the-counter (OTC) market, the last sale price as of the close of business on the market which the security is traded most extensively will be used. If the closing price is not available, the current bid as of the close of business will be used. For securities that principally trade on the NASDAQ National Market System, the NASDAQ official closing price will be used.
Annual Report - December 31, 2023
Short term securities purchased with less than 60 days remaining until maturity and all U.S. Treasury Bills are valued on the basis of amortized cost, which has been determined to approximate fair value. Short term securities purchased with more than 60 days remaining until maturity are valued using pricing services, or in the event a price is not available from a pricing service, may be priced using other methodologies approved by the Board of Directors, including model pricing or pricing on the basis of quotations from brokers or dealers, and will continue to be priced until final maturity.
For derivatives that are traded on an exchange, the last sale price as of the close of business of the exchange will be used. For derivatives traded OTC, independent pricing services will be utilized when possible. If a price cannot be located from the primary source, other appropriate sources, which may include the use of an internally developed valuation model, another external pricing vendor or sourcing a price from a broker, may be used.
Independent pricing services are approved by the Board of Directors and are utilized for all investment types when available. In some instances valuations from independent pricing services are not available or do not reflect events in the market between the time the market closed and the valuation time and therefore fair valuation procedures are implemented. The fair value for some securities may be obtained from pricing services or other pricing sources. The inputs used by the pricing services are reviewed quarterly or when the pricing vendor issues updates to its pricing methodologies. Broker quotes are analyzed through an internal review process, which includes a review of known market conditions and other relevant data. Developments that might trigger fair value pricing could be natural disasters, government actions or fluctuations in domestic and foreign markets.
The following table provides examples of the inputs that are commonly used for valuing particular classes of securities. These classifications are not exclusive, and any inputs may be used to value any other security class.
| Class | Inputs |
| Common Stock | Exchange traded close price, bids, evaluated bids, open and close price of the local exchange, exchange rates, fair values based on significant market movement and various index data |
| Short Term Investments | Maturity date, credit quality and interest rates |
| Futures Contracts | Exchange traded close price |
The Fund classifies its valuations into three levels based upon the observability of inputs to the valuation of the Fund’s investments. The valuation levels are not necessarily an indication of the risk or liquidity associated with the underlying investment. Classification is based on the lowest level of input significant to the fair value measurement. The three levels are defined as follows:
Level 1 – Unadjusted quoted prices for identical securities in active markets.
Level 2 – Inputs other than quoted prices included in Level 1 that are observable either directly or indirectly. These may include quoted prices for similar assets in active markets.
Level 3 – Unobservable inputs to the extent observable inputs are not available and may include prices obtained from single broker quotes. Unobservable inputs reflect the Fund’s own assumptions and would be based on the best information available under the circumstances.
As of December 31, 2023, all of the Fund’s investments are valued using Level 1 inputs, except for Short Term Investments, which are valued using Level 2 inputs. More information regarding the sector classifications, as applicable, are included in the Schedule of Investments.
Repurchase Agreements
The Fund may engage in repurchase agreement transactions with institutions that the Fund’s investment adviser has determined are creditworthy. The Fund will purchase securities at a specified price with an agreement to sell the securities to the same counterparty at a specified time, price and interest rate. The Fund’s custodian and/or securities lending agent receives delivery of the underlying securities collateralizing a repurchase agreement. Collateral is at least equal to the value of the repurchase obligation including interest. A repurchase agreement transaction involves certain risks in the event of default or insolvency of the counterparty. These risks include possible delays or restrictions upon the Fund’s ability to dispose of the underlying securities and a possible decline in the value of the underlying securities during the period while the Fund seeks to assert its rights.
Annual Report - December 31, 2023
Security Transactions
Security transactions are accounted for on the date the security is purchased or sold (trade date). Realized gains and losses from investments sold are determined on a specific lot selection. Dividend income for the Fund is accrued as of the ex-dividend date and interest income, including amortization of discounts and premiums, is recorded daily.
The Fund recharacterizes distributions received from REIT investments based on information provided by the REIT into the following categories: ordinary income, long-term capital gains, and return of capital. If information is not available on a timely basis from the REIT, the recharacterization will be estimated based on available information which may include the previous year’s allocation. If new or additional information becomes available from the REIT at a later date, a recharacterization will be made in the following year.
Federal Income Taxes and Distributions to Shareholders
The Fund intends to comply with provisions under Subchapter M of the Internal Revenue Code applicable to regulated investment companies and to distribute substantially all of its net taxable income, including any net realized gain on investments not offset by capital loss carryforwards, if any, to shareholders. Therefore, no provision of federal income or excise tax is required. The Fund files income tax returns in U.S. federal and applicable state jurisdictions. The statute of limitations on the Fund’s tax return filings generally remains open for the three preceding fiscal reporting period ends. State tax returns may remain open for an additional fiscal year.
Distributions to shareholders from net investment income of the Fund, if any, are declared and paid semi-annually. Capital gain distributions of the Fund, if any, are declared and paid at least annually. Distributions are reinvested in additional shares of the Fund at net asset value and are declared separately for each class. Distributions are determined in accordance with income tax regulations, which may differ from U.S. generally accepted accounting principles.
The Fund makes investments in REITs which pay dividends to their shareholders based upon funds available from operations. It is common for these dividends to exceed the REITs’ taxable earnings and profits, resulting in the excess portion of such dividends being designated as a return of capital. If the Fund distributes such amounts, it may constitute a return of capital to shareholders for income tax purposes.
The tax character of distributions paid during the years ended December 31, 2023 and 2022 were as follows:
| 2023 | 2022 | ||
| Ordinary income | $15,507,037 | $13,376,331 | |
| Long-term capital gain | 1,590,159 | 14,596,583 | |
| Return of capital | - | 1,728,391 | |
| $17,097,196 | $29,701,305 |
Net investment income (loss) and net realized gain (loss) for federal income tax purposes may differ from those reported on the financial statements because of temporary and permanent book-tax basis differences. Book-tax differences may include but are not limited to the following: wash sales, distribution adjustments and adjustments for real estate investment trusts.
Capital accounts within the financial statements are adjusted for permanent book-tax differences, and are not adjusted for temporary book-tax differences which will reverse in a subsequent period. Accordingly, the Fund has reclassified $474,773 from Paid-in capital to Undistributed/accumulated earnings for December 31, 2023. Net assets of the Fund were unaffected by the reclassifications.
Annual Report - December 31, 2023
The tax components of capital shown in the following table represent distribution requirements the Fund must satisfy under the income tax regulations, losses the Fund may be able to offset against income and gains realized in future years and unrealized appreciation or depreciation for federal income tax purposes. At December 31, 2023, the components of distributable earnings on a tax basis were as follows:
| Undistributed net investment income | $3,994,062 |
| Undistributed long-term capital gains | 1,853,273 |
| Capital loss carryforwards | — |
| Post-October losses | — |
| Net unrealized appreciation | 27,028,041 |
| Tax composition of capital | $32,875,376 |
The aggregate cost of securities and other investments and the composition of unrealized appreciation and depreciation for federal income tax purposes as of December 31, 2023 were as follows:
| Federal tax cost of investments | $771,868,087 |
| Gross unrealized appreciation on investments | 94,568,447 |
| Gross unrealized depreciation on investments | (67,540,406) |
| Net unrealized appreciation on investments | $27,028,041 |
2. DERIVATIVE FINANCIAL INSTRUMENTS
The Fund's investment objective allows the Fund to enter into various types of derivative contracts, including futures contracts. Derivatives are investments whose value is primarily derived from underlying assets, indices or reference rates.
In pursuit of the Fund's investment objectives, the Fund may seek to use derivatives to increase or decrease its exposure to the following market risks:
Equity Risk - The risk that relates to the change in value of equity securities as they relate to increases or decreases in the general market.
The Fund is also exposed to additional risks from investing in derivatives, such as liquidity and counterparty credit risk. Liquidity risk is the risk that the Fund will be unable to sell or close out the derivative in the open market in a timely manner. Counterparty credit risk is the risk that the counterparty will not be able to fulfill its obligations to the Fund. Investing in derivatives may also involve greater risks than investing directly in the underlying assets, such as losses in excess of any initial investment and collateral received. In addition, there may be the risk that the change in value of the derivative contract does not correspond to the change in value of the underlying instrument.
Futures Contracts
The Fund uses futures contracts to equitize cash. A futures contract is an agreement between two parties to buy or sell a specified underlying investment for a fixed price at a specified future date. Futures contracts are generally entered into on a regulated futures exchange and cleared through a clearinghouse associated with the exchange. The use of futures contracts may involve risks such as the possibility of illiquid markets or imperfect correlation between the value of the contracts and the underlying securities that comprise the index, or that the clearinghouse will fail to perform its obligations.
Futures contracts are reported in a table following the Schedule of Investments. Upon entering into a futures contract, the Fund is required to pledge to the broker an amount of cash and/or other assets equal to a certain percentage of the contract amount (initial margin deposit). Receipts or payments, known as variation margin, are made or received by the Fund each day, depending on the daily fluctuations in the fair value of the underlying security. This is recorded as variation margin on futures contracts on the Statement of Assets and Liabilities. When the Fund enters into a closing transaction, it will realize, for book purposes, a gain or loss equal to the difference between the value of the futures contract at the time it was opened or purchased and its value at the time it was closed, and is reflected in net realized gain or loss on the Statement of Operations.
Annual Report - December 31, 2023
The following table represents the average month-end volume of the Fund's derivative transactions, during the reporting period:
| Empower Real Estate Index Fund | |
| Futures Contracts: | |
| Average long contracts | 31 |
| Average notional long | $6,776,481 |
Derivative Financial Instruments Categorized by Risk Exposure
| Asset Derivatives | ||||
| Risk Exposure | Statement of Assets and Liabilities Location | Fair Value | ||
| Equity contracts (futures contracts) | Net unrealized appreciation on futures contracts | $181,175 (a) | ||
| (a) | Includes cumulative appreciation of futures contracts as reported in the Fund’s Schedule of Investments. Only current day’s variation margin is reported within the Statement of Assets and Liabilities. |
The effect of derivative investments for the year ended December 31, 2023 is as follows:
| Realized Gain or (Loss) | Change in Unrealized Appreciation or (Depreciation) | |||||
| Risk Exposure | Statement of Operations Location | Statement of Operations Location | ||||
| Equity contracts (futures contracts) | Net realized gain on futures contracts | $248,183 | Net change in unrealized appreciation on futures contracts | $211,358 | ||
3. INVESTMENT ADVISORY AGREEMENT AND OTHER TRANSACTIONS WITH AFFILIATES
Empower Funds entered into an investment advisory agreement with ECM, a wholly-owned subsidiary of Empower Annuity Insurance Company of America (Empower of America). As compensation for its services to Empower Funds, the Adviser receives monthly compensation at the annual rate of 0.29% of the Fund’s average daily net assets up to $1 billion dollars, 0.24% of the Fund’s average daily net assets over $1 billion dollars and 0.19% of the Fund’s average daily net assets over $2 billion dollars. Certain administration and accounting services fees for the Fund are included in the investment advisory agreement.
The Adviser contractually agreed to waive fees or reimburse expenses that exceed an annual rate of 0.30% of the Fund's average daily net assets attributable to each Class, including management fees and expenses paid directly by the Fund, excluding shareholder service fees and certain extraordinary expenses (the "Expense Limit"). The agreement's current term ends on April 30, 2024 and automatically renews for one-year unless terminated upon written notice within 90 days of the end of the current term or upon termination of the investment advisory agreement. The amount waived or reimbursed, if any, is reflected in the Statement of Operations.
The Adviser is permitted upon approval by the Board of Directors to recoup amounts waived or reimbursed by the Fund in future periods, not exceeding three years following the particular waiver/reimbursement, provided the total annual operating expenses of each Class of the Fund plus such recoupment do not exceed the lesser of the Expense Limit that was in place at the time of the waiver/reimbursement or the Expense Limit in place at the time of recoupment. At December 31, 2023, the amounts subject to recoupment were as follows:
| Expires December 31, 2024 | Expires December 31, 2025 | Expires December 31, 2026 | Recoupment of Past Reimbursed Fees by the Adviser | |||
| $117,418 | $204,188 | $174,566 | $0 |
The Adviser and Empower Funds entered into a sub-advisory agreement with Irish Life Investment Managers Limited (ILIM), an affiliate of the Adviser and Empower of America. The Adviser is responsible for compensating the Sub-Adviser for its services.
Annual Report - December 31, 2023
The Adviser is responsible for compensating ILIM, which receives monthly compensation for its services at the annual rate of 0.02% of the Fund's net assets.
Empower Funds entered into a shareholder services agreement with Empower Retirement, LLC (Empower), an affiliate of ECM and subsidiary of Empower of America. Pursuant to the shareholder services agreement, Empower provides various recordkeeping, administrative and shareholder services to shareholders and receives from the Investor Class shares of each Fund a fee equal to 0.35% of the average daily net asset value of the applicable share class.
Empower Financial Services, Inc. (the Distributor), is a wholly-owned subsidiary of Empower of America and the principal underwriter to distribute and market each Fund.
Certain officers of Empower Funds are also directors and/or officers of Empower of America or its subsidiaries. No officer or interested director of Empower Funds receives any compensation directly from Empower Funds. The total compensation paid to the independent directors with respect to all forty-five funds for which they serve as directors was $1,223,500 for the fiscal year ended December 31, 2023.
4. PURCHASES AND SALES OF INVESTMENTS
For the year ended December 31, 2023, the aggregate cost of purchases and proceeds from sales of investments (excluding all U.S. Government securities and short-term securities) were $243,185,951 and $72,030,983, respectively. For the same period, there were no purchases or sales of long-term U.S. Government securities.
5. SECURITIES LOANED
The Fund has entered into a securities lending agreement with its custodian as securities lending agent. Under the terms of the agreement the Fund receives income after deductions of other amounts payable to the securities lending agent or to the borrower from lending transactions. In exchange for such fees, the securities lending agent is authorized to loan securities on behalf of the Fund against receipt of cash collateral at least equal in value at all times to the value of the securities loaned plus accrued interest. The fair value of the loaned securities is determined daily at the close of business of the Fund and necessary collateral adjustments are made between the Fund and its counterparties on the next business day through the delivery or receipt of additional collateral. The Fund also continues to receive interest or dividends on the securities loaned. Cash collateral is invested in securities approved by the Board of Directors. The Fund bears the risk of any deficiency in the amount of collateral available for return to a borrower due to a loss in an approved investment. As of December 31, 2023, the Fund had securities on loan valued at $3,905,692 and received collateral as reported on the Statement of Assets and Liabilities of $4,133,220 for such loan which was invested in Repurchase Agreements collateralized by U.S. Government or U.S. Government Agency securities. The Repurchase Agreements can be jointly purchased with other lending agent clients and in the event of a default by the counterparty, all lending agent clients would share ratably in the collateral.
Under the securities lending agreement, the cash collateral received represents a secured borrowing, and is collateralized by the securities loaned. At December 31, 2023, the class of securities loaned consisted entirely of common stock. The remaining contractual maturity of the secured borrowing related to each class of collateral is overnight and continuous. Additional information regarding the Fund's securities on loan is included in the Schedule of Investments.
6. INDEMNIFICATIONS
The Fund’s organizational documents provide current and former officers and directors with a limited indemnification against liabilities arising in connection with the performance of their duties to the Fund. In the normal course of business, the Fund may also enter into contracts that provide general indemnifications. The Fund’s maximum exposure under these arrangements is unknown as this would be dependent on future claims that may be made against the Fund. The risk of material loss from such claims is considered remote.
7. SUBSEQUENT EVENTS
Effective January 12, 2024, the Federal Income Taxes and Distributions to Shareholders section was amended and distributions to shareholders from net investment income of the Fund, if any, are declared and paid annually.
Management has reviewed all events subsequent to December 31, 2023, including the estimates inherent in the process of preparing these financial statements, through the date the financial statements were issued. No subsequent events requiring adjustment or disclosure have occurred other than what is disclosed above.
Annual Report - December 31, 2023
REPORT OF INDEPENDENT REGISTERED PUBLIC ACCOUNTING FIRM
To the Shareholders and the Board of Directors of Empower Funds, Inc.
Opinion on the Financial Statements and Financial Highlights
We have audited the accompanying statement of assets and liabilities, including the schedule of investments, of the Empower Real Estate Index Fund (the “Fund”), one of the funds comprising Empower Funds, Inc., as of December 31, 2023, the related statement of operations for the year then ended, the statements of changes in net assets for each of the two years in the period then ended, the financial highlights for each of the five years in the period then ended, and the related notes. In our opinion, the financial statements and financial highlights present fairly, in all material respects, the financial position of the Fund as of December 31, 2023, and the results of its operations for the year then ended, the changes in its net assets for each of the two years in the period then ended, and the financial highlights for each of the five years in the period then ended in conformity with accounting principles generally accepted in the United States of America.
Basis for Opinion
These financial statements and financial highlights are the responsibility of the Fund's management. Our responsibility is to express an opinion on the Fund's financial statements and financial highlights based on our audits. We are a public accounting firm registered with the Public Company Accounting Oversight Board (United States) (PCAOB) and are required to be independent with respect to the Fund in accordance with the U.S. federal securities laws and the applicable rules and regulations of the Securities and Exchange Commission and the PCAOB.
We conducted our audits in accordance with the standards of the PCAOB. Those standards require that we plan and perform the audit to obtain reasonable assurance about whether the financial statements and financial highlights are free of material misstatement, whether due to error or fraud. The Fund is not required to have, nor were we engaged to perform, an audit of its internal control over financial reporting. As part of our audits we are required to obtain an understanding of internal control over financial reporting but not for the purpose of expressing an opinion on the effectiveness of the Fund’s internal control over financial reporting. Accordingly, we express no such opinion.
Our audits included performing procedures to assess the risks of material misstatement of the financial statements and financial highlights, whether due to error or fraud, and performing procedures that respond to those risks. Such procedures included examining, on a test basis, evidence regarding the amounts and disclosures in the financial statements and financial highlights. Our audits also included evaluating the accounting principles used and significant estimates made by management, as well as evaluating the overall presentation of the financial statements and financial highlights. Our procedures included confirmation of securities owned as of December 31, 2023, by correspondence with the custodian and brokers; when replies were not received from brokers, we performed other auditing procedures. We believe that our audits provide a reasonable basis for our opinion.
DELOITTE & TOUCHE LLP
Denver, Colorado
February 23, 2024
February 23, 2024
We have served as the auditor of one or more Empower investment companies since 1982.
TAX INFORMATION (unaudited)
Dividends paid by the Fund from net investment income and distributions of net realized short-term capital gains are, for federal income tax purposes, taxable as ordinary income to shareholders. Of the ordinary income distributions declared for the year ended December 31, 2023, 0% qualifies for the dividend received deduction available to the Fund’s corporate shareholders.
Fund Directors and Officers
Empower Funds is organized under Maryland law, and is governed by the Board of Directors. The following table provides information about each of the Directors and executive officers of Empower Funds.
| Independent Directors* | |||||
| Name, Address, and Age | Positions(s) Held with Empower Funds | Term of Office and Length of Time Served** | Principal Occupation(s) During Past 5 Years | Number of Funds in Fund Complex Overseen by Director | Other Directorships Held by Director |
| Gail H. Klapper 8515 East Orchard Road, Greenwood Village, CO 80111 80 | Chair & Independent Director | Since 2016 (as Chair) Since 2007 (as Independent Director) | Managing Attorney, Klapper Law Firm; Member/Director, The Colorado Forum; Manager, 6K Ranch, LLC; and former Director, Guaranty Bancorp | 45 | Director, Gold, Inc. |
| James A. Hillary*** 8515 East Orchard Road, Greenwood Village, CO 80111 60 | Independent Director | Since 2017 | Principal and Founding Partner, Fios Capital, LLC; Member, Fios Partners LLC, Fios Holdings LLC; Sole Member, Fios Companies LLC, Resolute Capital Asset Partners; Manager, Applejack Holdings, LLC; and Manager and Member, Prestige Land Holdings, LLC | 45 | N/A |
| R. Timothy Hudner**** 8515 East Orchard Road, Greenwood Village, CO 80111 64 | Independent Director | Since 2017 | Director, Colorado State Housing Board; and former Director, Grand Junction Housing Authority; Counseling and Education Center | 45 | N/A |
| Steven A. Lake 8515 East Orchard Road, Greenwood Village, CO 80111 69 | Independent Director | Since 2017 | Managing Member, Lake Advisors, LLC; Member, Gart Capital Partners, LLC; and Executive Member, Sage Enterprise Holdings, LLC | 45 | N/A |
| Stephen G. McConahey 8515 East Orchard Road, Greenwood Village, CO 80111 80 | Independent Director & Audit Committee Chair | Since 2011 (as Independent Director) Since 2015 (as Audit Committee Chair) | Chairman, SGM Capital, LLC; Partner, Iron Gate Capital, LLC; Director, The IMA Financial Group, Inc.; and former Director, Guaranty Bancorp | 45 | N/A |
| Interested Director***** | |||||
| Name, Address, and Age | Positions(s) Held with Empower Funds | Term of Office and Length of Time Served | Principal Occupation(s) During Past 5 Years | Number of Funds in Fund Complex Overseen by Director | Other Directorships Held by Director |
| Jonathan D. Kreider 8515 East Orchard Road, Greenwood Village, CO 80111 40 | Director, President & Chief Executive Officer | Since 2020 | Executive Vice President & Head of Empower Investments, Empower, Empower of America and Empower Life & Annuity Insurance Company of New York (“Empower of NY”); President, Chief Executive Officer & Manager, ECM; formerly, Vice President, Empower Funds Investment Products and Empower Advisory Group, LLC (“EAG”) | 45 | N/A |
| Officers | |||||
| Name, Address, and Age | Positions(s) Held with Empower Funds | Term of Office and Length of Time Served | Principal Occupation(s) During Past 5 Years | Number of Fund in Fund Complex Overseen by Director | Other Directorships Held by Director |
| Jonathan D. Kreider 8515 East Orchard Road, Greenwood Village, CO 80111 40 | Director, President & Chief Executive Officer | Since 2020 | Executive Vice President & Head of Empower Investments, Empower, Empower of America and Empower of NY; President, Chief Executive Officer & Manager, ECM; formerly, Vice President, Empower Funds Investment Products and EAG | 45 | N/A |
| Katherine Stoner 8515 East Orchard Road, Greenwood Village, CO 80111 67 | Chief Compliance Officer | Since 2016 | Vice President, Compliance Empower Investments, Empower; Chief Compliance Officer, ECM and EAG | N/A | N/A |
| Ryan L. Logsdon 8515 East Orchard Road, Greenwood Village, CO 80111 49 | Chief Legal Officer & Secretary | Since 2010 (as Secretary) Since 2021 (as Chief Legal Officer) | Vice President, Deputy General Counsel & Corporate Secretary, Empower, Empower of America & Empower of NY; Vice President & Counsel, ECM; formerly, Vice President & Counsel, Empower Funds; Vice President, Counsel & Secretary, EAG & EFSI | N/A | N/A |
| Kelly B. New 8515 East Orchard Road, Greenwood Village, CO 80111 48 | Chief Financial Officer & Treasurer | Since 2021 | Vice President, Fund Administration, Empower; Chief Financial Officer & Treasurer, ECM; Vice President & Treasurer, CITs, Empower Trust Company, LLC (“ETC”); formerly, Assistant Treasurer Empower Funds, ECM & ETC | N/A | N/A |
| Officers | |||||
| Name, Address, and Age | Positions(s) Held with Empower Funds | Term of Office and Length of Time Served | Principal Occupation(s) During Past 5 Years | Number of Fund in Fund Complex Overseen by Director | Other Directorships Held by Director |
| John A. Clouthier 8515 East Orchard Road, Greenwood Village, CO 80111 56 | Assistant Treasurer | Since 2007 | Vice President, Fund Administration, Empower; Assistant Treasurer, ECM; Assistant Vice President and Assistant Treasurer, ETC | N/A | N/A |
| Abhijit Dande 8515 East Orchard Road, Greenwood Village, CO 80111 43 | Derivatives Risk Manager | Since 2022 | Vice President, Financial Risk Management, Empower; Derivatives Risk Manager, ECM | N/A | N/A |
* A Director who is not an “interested person” of Empower Funds (as defined in Section 2(a)(19) of the 1940 Act, as amended) is referred to as an “Independent Director.”
** Each Director serves until the next shareholders’ meeting (and until the election and qualification of a successor), or until death, resignation, removal or retirement which takes effect no later than May 1 following his or her 75th birthday unless otherwise determined by the remaining directors. The remaining Independent Directors determined that Ms. Klapper and Mr. McConahey should continue on the Board until at least May 1, 2024. Officers are elected by the Board on an annual basis to serve until their successors have been elected and qualified.
*** Mr. Hillary is the sole member of Resolute Capital Asset Partners LLC, which is the general partner for Resolute Capital Asset Partners Fund I LP. Goldman Sachs & Co. LLC, the clearing agent and custodian for Resolute Capital Asset Partners Fund I LP, is the parent company of Goldman Sachs Asset Management, LP, the Sub-Adviser of the Empower Inflation-Protected Securities Fund, Empower Mid Cap Value Fund and other series of Empower Funds; and a Sub-Adviser of the Empower Core Bond Fund. Mr. Hillary has personal banking accounts with an affiliate of J.P. Morgan Investment Management Inc., a Sub-Adviser of the Empower International Growth Fund, Empower Large Cap Growth Fund and other series of Empower Funds. Mr. Hillary receives no special treatment due to the relationship.
**** Mr. Hudner’s daughter is employed by JP Morgan Chase, N.A., an affiliate of J.P. Morgan Investment Management Inc., a Sub-Adviser of the Empower International Growth Fund, Empower Large Cap Growth Fund and other series of Empower Funds. Mr. Hudner has personal investments in the following: (1) a mutual fund advised by Lazard Asset Management LLC, a Sub-Adviser of the Empower Emerging Markets Equity Fund, (2) a mutual fund advised by Massachusetts Financial Services Company, a Sub-Adviser of the Empower International Value Fund, and (3) a mutual fund advised by Virtus Investment Advisers, Inc., an affiliate of Virtus Fixed Income Advisers, LLC, a Sub-Adviser of the Empower Multi-Sector Bond Fund. Mr. Hudner receives no special treatment due to his ownership of such mutual funds.
***** An “Interested Director” refers to a Director who is an “interested person” of Empower Funds (as defined in Section 2(a)(19) of the 1940 Act, as amended) by virtue of their affiliation with ECM.
There are no arrangements or understandings between any Director or officer and any other person(s) pursuant to which s/he was elected as Director or officer.
Additional information about Empower Funds and its Directors is available in the Empower Funds’ Statement of Additional Information (“SAI”), which can be obtained free of charge upon request to: Secretary, Empower Funds, Inc., 8525 East Orchard Road, Greenwood Village, Colorado 80111; (866) 831-7129. The SAI is also available on the Fund’s web site at https://www.empower.com.
Availability of Quarterly Portfolio Schedule
Empower Funds files its complete schedule of portfolio holdings with the Securities and Exchange Commission for the first and third quarters of each fiscal year as an exhibit to its reports on Form N-PORT. Empower Funds’ Form N-PORT reports are available on the Commission’s website at http://www.sec.gov.
Availability of Proxy Voting Policies and Procedures
A description of the policies and procedures that Empower Funds uses to determine how to vote proxies relating to portfolio securities is available without charge, upon request, by calling (866) 831-7129, and on the Securities and Exchange Commission’s website at http://www.sec.gov.
Availability of Proxy Voting Record
Information regarding how Empower Funds voted proxies relating to portfolio securities during the most recent 12-month period ended June 30 is available without charge, upon request, by calling (866) 831-7129, and on the Securities and Exchange Commission’s website at http://www.sec.gov.
ITEM 2. CODE OF ETHICS.
(a) As of the end of the period covered by this report, the registrant has adopted a Code of Ethics (the “Code of Ethics”) that applies to the registrant's principal executive officer, principal financial officer, principal accounting officer or controller, or persons performing similar functions, regardless of whether these individuals are employed by the registrant or a third party.
(b) For purposes of this Item, "code of ethics" means written standards that are reasonably designed to deter wrongdoing and to promote:
(1) Honest and ethical conduct, including the ethical handling of actual or apparent conflicts of interest between personal and professional relationships;
(2) Full, fair, accurate, timely, and understandable disclosure in reports and documents that a registrant files with, or submits to, the Commission and in other public communications made by the registrant;
(3) Compliance with applicable governmental laws, rules, and regulations;
(4) The prompt internal reporting of violations of the code to an appropriate person or persons identified in the code; and
(5) Accountability for adherence to the code.
(c) During the period covered by this report, there have been no amendments to the registrant’s Code of Ethics.
(d) During the period covered by this report, the registrant has not granted any express or implicit waivers from the provisions of the Code of Ethics.
(e) Registrant’s Code of Ethics is attached hereto.
ITEM 3. AUDIT COMMITTEE FINANCIAL EXPERT.
Mr. Stephen A. Lake is the audit committee financial expert and is "independent," pursuant to general instructions on Form N-CSR, Item 3.
An “audit committee financial expert” is not an “expert” for any purpose, including for purposes of Section 11 of the Securities Act of 1933, as a result of being designated as an “audit committee financial expert.” Further, the designation of a person as an “audit committee financial expert” does not mean that the person has any greater duties, obligations, or liability than those imposed on the person without the “audit committee financial expert” designation. Similarly, the designation of a person as an “audit committee financial expert” does not affect the duties, obligations, or liability of any other member of the Audit Committee or Board of Directors.
ITEM 4. PRINCIPAL ACCOUNTANT FEES AND SERVICES.
(a) Audit Fees. The aggregate fees billed for each of the last two fiscal years for professional services rendered by the principal accountant for the audit of the registrant’s annual financial statements or services that are normally provided by the accountant in connection with statutory and regulatory filings or engagements for those fiscal years were: $1,031,500 for fiscal year 2022 and $1,050,700 for fiscal year 2023.
(b) Audit-Related Fees. The aggregate fees billed in each of the last two fiscal years for assurance and related services by the principal accountant that are reasonably related to the performance of the audit of the registrant’s financial statements and are not reported under paragraph (a) of this Item were: $42,000 for fiscal year 2022 and $44,680 for fiscal year 2023. The nature of the services comprising the fees disclosed under this category involved performance of 17f-2 (self-custody) audits and administrative services related to the audit.
(c) Tax Fees. The aggregate fees billed in each of the last two fiscal years for professional services rendered by the principal accountant for tax compliance, tax advice, and tax planning were: $0 for fiscal year 2022 and $0 for fiscal year 2023.
(d) All Other Fees. There were no fees billed in each of the last two fiscal years for products and services provided by the principal accountant, other than the services reported in paragraphs ((a) through (c) of this Item).
(e) (1) Audit Committee’s Pre-Approval Policies and Procedures.
Pre-Approval of Audit Services. The Audit Committee must approve prior to retention all audit, review or attest engagements required under the securities laws that are provided to Empower Funds by its independent auditors. The Audit Committee will not grant such approval to any auditors that are proposed to perform an audit for Empower Funds if a chief executive officer, controller, chief financial officer, chief accounting officer or any person serving in an equivalent position for Empower Funds that is responsible for the financial reporting or operations of Empower Funds was employed by those auditors and participated in any capacity in an audit of Empower Funds during the year period (or such other period proscribed under Securities Exchange Commission rules) preceding the date of initiation of such audit.
Pre-Approval of Non-Audit Services. The Audit Committee must pre-approve any non-audit services, including tax services, to be provided to Empower Funds by its independent auditors (except those within applicable de minimis statutory or regulatory exceptions)1 provided that Empower Funds’ auditors will not provide the following non-audit services to Empower Funds: (a) bookkeeping or other services related to the accounting records or financial statements of Empower Funds; (b) financial information systems design and implementation; (c) appraisal or valuation services, fairness opinions, or contribution-in-kind reports; (d) actuarial services; (e) internal audit outsourcing services; (f) management functions or human resources; (g) broker-dealer, investment adviser, or investment banking services; (h) legal services; (i) expert services unrelated to the audit; and (j) any other service that the Public Company Accounting Oversight Board determines, by regulation, is impermissible. 2
Pre-approval with respect to Non-Empower Funds Entities. The Audit Committee must pre-approve any non-audit services that relate directly to the operations and financial reporting of Empower Funds (except those within applicable de minimis statutory or regulatory exceptions)3 to be provided by Empower Funds’ auditors to (a) Empower Funds’ investment adviser; and (b) any entity controlling, controlled by, or under common control with the investment adviser if that entity provides ongoing services to Empower Funds.4 The Audit Committee may approve audit and non-audit services on a case-by-case basis or adopt pre-approval policies and procedures that are detailed as to a particular service, provided that the Audit Committee is informed promptly of each service, or use a combination of these approaches.
Delegation . The Audit Committee may delegate pre-approval authority to one or more of the Audit Committee's members. Any member or members to whom such pre-approval authority is delegated
must report any pre-approval decisions to the Audit Committee at its next scheduled meeting.
(f) (2) 100% of the services described pursuant to paragraphs (b) through (d) of this Item 4 of Form N-CSR were approved by the Audit Committee, and no such services were approved by the Audit Committee pursuant to paragraph (c)(7)(i)(C) of Rule 2-01 of Regulation S-X.
(g) Not Applicable.
(h) The aggregate non-audit fees billed by the registrant’s accountant for services rendered to the registrant, and rendered to the registrant’s investment adviser (not including any sub-adviser whose role is primarily portfolio management and is subcontracted with or overseen by another investment adviser), and any entity controlling, controlled by, or under common control with the adviser that provides ongoing services to the registrant for fiscal year 2022 equaled $1,022,840 and for fiscal year 2023 equaled $1,795,449.
(i) The registrant’s Audit Committee of the Board of Directors has considered whether the provision of non-audit services that were rendered to the registrant’s investment adviser (not including any subadviser whose role is primarily portfolio management and is subcontracted with or overseen by another investment adviser), and any entity controlling, controlled by, or under common control with the investment adviser that provides ongoing services to the registrant that were not pre-approved pursuant to paragraph (c)(7)(ii) of Rule 2-01 of Regulation S-X is compatible with maintaining the principal accountant’s independence.
ITEM 5. AUDIT COMMITTEE OF LISTED REGISTRANTS.
Not applicable.
ITEM 6. INVESTMENTS.
(a) The schedule is included as part of the report to shareholders filed under Item 1 of this Form.
(b) Not applicable.
ITEM 7. DISCLOSURE OF PROXY VOTING POLICIES AND PROCEDURES FOR CLOSED-END MANAGEMENT INVESTMENT COMPANIES.
Not applicable.
ITEM 8. PORTFOLIO MANAGERS OF CLOSED-END MANAGEMENT INVESTMENT COMPANIES.
Not applicable.
ITEM 9. PURCHASE OF EQUITY SECURITIES BY CLOSED-END MANAGEMENT INVESTMENT COMPANY AND AFFILIATED PURCHASERS.
Not applicable.
ITEM 10. SUBMISSION OF MATTERS TO A VOTE OF SECURITY HOLDERS.
There have been no material changes to the procedures by which shareholders may recommend nominees to the registrant’s board of directors that were implemented after the registrant last provided disclosure in response to this Item.
ITEM 11. CONTROLS AND PROCEDURES.
(a) The registrant's principal executive officer and principal financial officer have concluded, based upon their evaluation of the registrant's disclosure controls and procedures as conducted within 90 days of the filing date of this report, that these disclosure controls and procedures provide reasonable assurance that material information required to be disclosed by the registrant in the report it files or submits on Form N-CSR is recorded, processed, summarized and reported, within the time periods specified in the commission's rules and forms and that such material information is accumulated and communicated to the registrant's management, including its principal executive officer and principal financial officer, as appropriate, in order to allow timely decisions regarding required disclosure.
(b) The registrant's principal executive officer and principal financial officer are aware of no changes in the registrant's internal control over financial reporting that occurred during the registrant's most recent fiscal half-year that has materially affected, or is reasonably likely to materially affect, the registrant's internal control over financial reporting.
ITEM 12. DISCLOSURE OF LENDING ACTIVITES FOR CLOSED-END MANAGEMENT INVESTMENT COMPANIES.
(a) Not applicable.
ITEM 13. EXHIBITS.
(3) Not applicable.
(4) Not applicable.
1No pre-approval is required as to non-audit services provided to Empower Funds if: (a) the aggregate amount of all non-audit services provided to Empower Funds constitute not more than 5% of the total amount of revenues paid by Empower Funds to the independent auditors during the fiscal year in which the services are provided; (b) these services were not recognized by Empower Funds at the time of the engagement to be non-audit services; and (c) the services are promptly brought to the attention of the Audit Committee and approved by the Audit Committee prior to the completion of the audit.
2With respect to the prohibitions on (a) bookkeeping; (b) financial information systems design and implementation; (c) appraisal, valuation, fairness opinions, or contribution-in-kind reports; (d) actuarial; and (e) internal audit outsourcing, such services are permitted to be provided if it is reasonable to conclude that the results of these services will not be subject to audit procedures during an audit of the audit client's financial statements.
3For non-audit services provided to the adviser and entities in a control relationship with the adviser, no pre-approval is required if: (a) the aggregate amount of all non-audit services provided constitute not more than 5% of the total amount of revenues paid to the independent auditors during the fiscal year in which the services are provided to Empower Funds, Empower Funds’ investment adviser, and any entity controlling, controlled by, or under common control with the investment adviser if that entity provides ongoing services to Empower Funds; (b) these services were not recognized by Empower Funds at the time of the engagement to be non-audit services; and (c) the services are promptly brought to the attention of the Audit Committee and approved by the Audit Committee prior to the completion of the audit.
4No pre-approval is required by the Audit Committee as to non-audit services provided to any Empower Funds sub-adviser that primarily provides portfolio management services and is under the direction of another investment adviser and is not affiliated with Empower Funds’ primary investment adviser.
SIGNATURES
Pursuant to the requirements of the Securities Exchange Act of 1934 and the Investment Company Act of 1940, the registrant has duly caused this report to be signed on its behalf by the undersigned, thereunto duly authorized.
EMPOWER FUNDS, INC.
| By: | /s/ Jonathan D. Kreider |
Jonathan D. Kreider
Director, President & Chief Executive Officer
Director, President & Chief Executive Officer
Date:February 23, 2024
Pursuant to the requirements of the Securities Exchange Act of 1934 and the Investment Company Act of 1940, this report has been signed below by the following persons on behalf of the registrant and in the capacities and on the dates indicated.
| By: | /s/ Jonathan D. Kreider |
Jonathan D. Kreider
Director, President & Chief Executive Officer
Director, President & Chief Executive Officer
Date:February 23, 2024
| By: | /s/ Kelly B. New |
Kelly B. New
Chief Financial Officer & Treasurer
Chief Financial Officer & Treasurer
Date:February 23, 2024