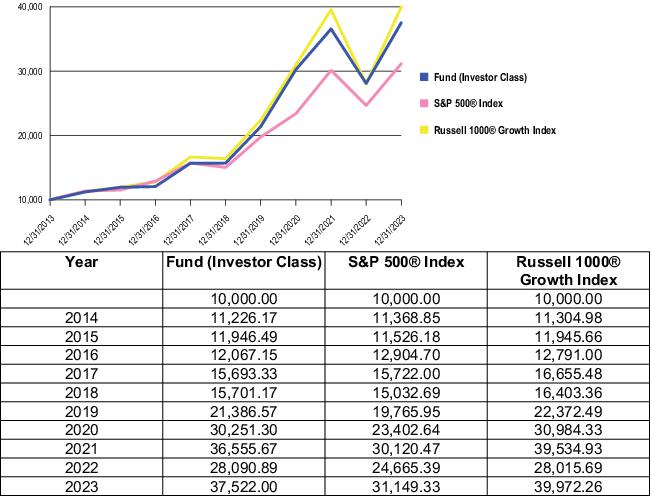
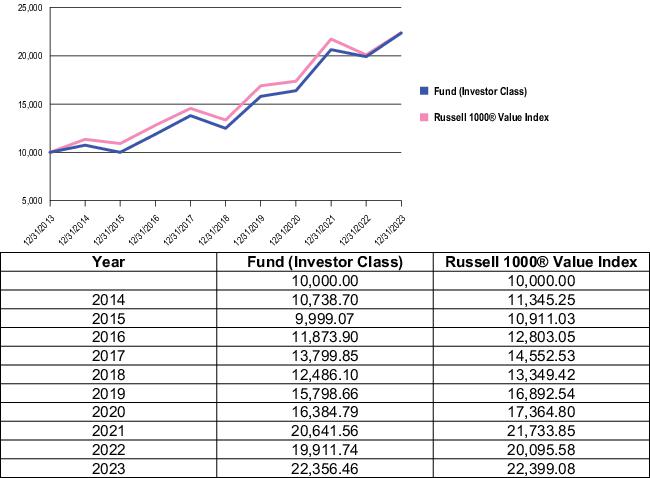
Empower Large Cap Value Fund
Investment Sub-Advisory Contract Approval
The Board of Directors (the “Board”) of Empower Funds, Inc. (the “Company”), including the Directors who are not interested persons of the Company (the “Independent Directors”), at a meeting held on October 5–6, 2023 (the “Meeting”), unanimously approved the investment sub-advisory agreement (the “Agreement”) between the Company, Empower Capital Management, LLC (“ECM”) and Putnam Investment Management, LLC (“Putnam” or the “Sub-Adviser”) with respect to the Fund.
Pursuant to the Agreement, the Sub-Adviser, subject to general supervision and oversight by ECM and the Board, will be responsible for the day-to-day management of the investment and reinvestment of the assets of its allocated portion of the Fund’s portfolio, which includes making decisions to buy, sell or hold any particular security.
In approving the Agreement, the Board considered such information as the Board deemed reasonably necessary to evaluate the terms of the Agreement. In its deliberations, the Board did not identify any single factor as being determinative. Rather, the Board’s approval was based on each Director’s business judgment after a comprehensive consideration of the information as a whole. Individual Directors may have weighed certain factors differently and assigned varying degrees of materiality to information considered by the Board. The Independent Directors were assisted in their deliberations by independent legal counsel.
The Board considered that the Sub-Adviser is a current sub-adviser of the Fund, and that its parent corporation, Great-West Lifeco Inc., intends to sell Putnam to Franklin Resources, Inc. on or about January 1, 2024 (the “Transaction”). The Board further considered that Putnam commenced management of its allocated portion of the Fund’s portfolio in June 2011 and that the Board most recently approved the continuation of the investment sub-advisory agreement between the Company, ECM and Putnam at its meeting held on April 20, 2023 (the “April Meeting”) as part of a multi-faceted annual review process.
Based upon its review of the Agreement and the information provided to it, the Board concluded that the Agreement was reasonable in light of the services to be performed, fees to be charged and such other matters as the Directors considered relevant in the exercise of their business judgment. The principal factors and conclusions that formed the basis for the Directors’ determinations to approve the Agreement are discussed below.
Nature, Extent and Quality of Services
The Board considered the nature, extent and quality of services to be provided to the Fund by the Sub-Adviser. Among other things, the Board considered the Sub-Adviser’s personnel, experience, resources and performance track record in managing its allocated portion of the Fund’s portfolio, its ability to provide or obtain such services as may be necessary in managing, acquiring and disposing of investments on behalf of the Fund, and its ability to provide research and obtain and evaluate the economic, statistical and financial data relevant to the investment policies of the Fund. The Board also reviewed the qualifications, education, experience and tenure of the portfolio managers to be responsible for the day-to-day management of the Fund. In addition, the Board considered the Sub-Adviser’s reputation for management of its investment strategies, its investment-decision making process, its disaster recovery procedures, including cybersecurity risk mitigation, its overall financial condition and ability to carry out its obligations to the Fund, its technical resources, operational capabilities and safeguards, and compliance policies and procedures, as well as the Sub-Adviser’s practices regarding the selection and compensation of brokers and dealers for the execution of portfolio transactions and the procedures it uses for obtaining best execution of portfolio transactions. As part of its assessment of the nature, extent and quality of services, the Board evaluated information regarding the Sub-Adviser’s regulatory and compliance environment and compliance policies and procedures. The Board noted the Chief Compliance Officer’s assessment that the Sub-Adviser’s compliance program appears to be reasonably designed to comply with the requirements of Rule 38a‑1 under the Investment Company Act of 1940, as amended.
The Board also considered Putnam’s representations that the Sub-Adviser personnel providing services to the Fund would remain the same after the Transaction, that the Transaction would not impact the nature or quality of services provided by the Sub-Adviser to the Fund and that the Transaction would not impact the resources, focus, culture or operations of the Sub-Adviser.
The Board concluded that it was satisfied with the nature, extent and quality of the services to be provided to the Fund by the Sub-Adviser.