UNITED STATES
SECURITIES AND EXCHANGE COMMISSION
Washington, D.C. 20549
FORM N-CSR
CERTIFIED SHAREHOLDER REPORT OF REGISTERED
MANAGEMENT INVESTMENT COMPANIES
Investment Company Act file number 811-3329
Variable Insurance Products Fund
(Exact name of registrant as specified in charter)
82 Devonshire St., Boston, Massachusetts 02109
(Address of principal executive offices) (Zip code)
Scott C. Goebel, Secretary
82 Devonshire St.
Boston, Massachusetts 02109
(Name and address of agent for service)
Registrant's telephone number, including area code: 617-563-7000
Date of fiscal year end: | December 31 |
| |
Date of reporting period: | December 31, 2010 |
Item 1. Reports to Stockholders
Fidelity® Variable Insurance Products:
Equity-Income Portfolio
Annual Report
December 31, 2010
(2_fidelity_logos) (Registered_Trademark)
Contents
Performance | <Click Here> | How the fund has done over time. |
Management's Discussion of Fund Performance | <Click Here> | The Portfolio Manager's review of fund performance and strategy. |
Shareholder Expense Example | <Click Here> | An example of shareholder expenses. |
Investment Changes | <Click Here> | A summary of major shifts in the fund's investments over the past six months. |
Investments | <Click Here> | A complete list of the fund's investments with their market values. |
Financial Statements | <Click Here> | Statements of assets and liabilities, operations, and changes in net assets, as well as financial highlights. |
Notes | <Click Here> | Notes to the financial statements. |
Report of Independent Registered Public Accounting Firm | <Click Here> | |
Trustees and Officers | <Click Here> | |
Distributions | <Click Here> | |
Board Approval of Investment Advisory Contracts and Management Fees | <Click Here> | |
To view a fund's proxy voting guidelines and proxy voting record for the 12-month period ended June 30, visit http://www.fidelity.com/proxyvotingresults or visit the Securities and Exchange Commission's (SEC) web site at http://www.sec.gov. You may also call 1-877-208-0098 to request a free copy of the proxy voting guidelines.
Fidelity Variable Insurance Products are separate account options which are purchased through a variable insurance contract.
Standard & Poor's, S&P and S&P 500 are registered service marks of The McGraw-Hill Companies, Inc. and have been licensed for use by Fidelity Distributors Corporation.
Other third party marks appearing herein are the property of their respective owners.
All other marks appearing herein are registered or unregistered trademarks or service marks of FMR LLC or an affiliated company.
The general research services agreement with Fidelity Research & Analysis Company has been terminated and is no longer in effect for the fund.
This report and the financial statements contained herein are submitted for the general information of the shareholders of the fund. This report is not authorized for distribution to prospective investors in the fund unless preceded or accompanied by an effective prospectus.
A fund files its complete schedule of portfolio holdings with the SEC for the first and third quarters of each fiscal year on Form N-Q. Forms N-Q are available on the SEC's web site at http://www.sec.gov. A fund's Forms N-Q may be reviewed and copied at the SEC's Public Reference Room in Washington, DC. Information regarding the operation of the SEC's Public Reference Room may be obtained by calling 1-800-SEC-0330. For a complete list of a fund's portfolio holdings, view the most recent holdings listing, semiannual report, or annual report on Fidelity's web site at http://www.fidelity.com, http://www.advisor.fidelity.com, or http://www.401k.com, as applicable.
NOT FDIC INSURED • MAY LOSE VALUE • NO BANK GUARANTEE
Neither the fund nor Fidelity Distributors Corporation is a bank.
Annual Report
Average annual total return reflects the change in the value of an investment, assuming reinvestment of a class' distributions from dividend income and capital gains (the profits earned upon the sale of securities that have grown in value, if any) and assuming a constant rate of performance each year. During periods of reimbursement by Fidelity, a fund's total return will be greater than it would be had the reimbursement not occurred. Performance numbers are net of all underlying fund operating expenses, but do not include any insurance charges imposed by your insurance company's separate account. If performance information included the effect of these additional charges, the total returns would have been lower. How a fund did yesterday is no guarantee of how it will do tomorrow.
Average Annual Total Returns
Periods ended December 31, 2010 | Past 1
year | Past 5
years | Past 10
years |
VIP Equity-Income PortfolioSM - Initial Class | 15.15% | 0.97% | 2.46% |
VIP Equity-Income Portfolio - Service Class | 15.09% | 0.87% | 2.35% |
VIP Equity-Income Portfolio - Service Class 2 | 14.92% | 0.72% | 2.20% |
VIP Equity-Income Portfolio - Investor Class A | 15.04% | 0.86% | 2.40% |
A The initial offering of Investor Class shares took place on July 21, 2005. Returns prior to July 21, 2005 are those of Initial Class. Had Investor Class's transfer agent fee been reflected, returns prior to July 21, 2005 would have been lower.
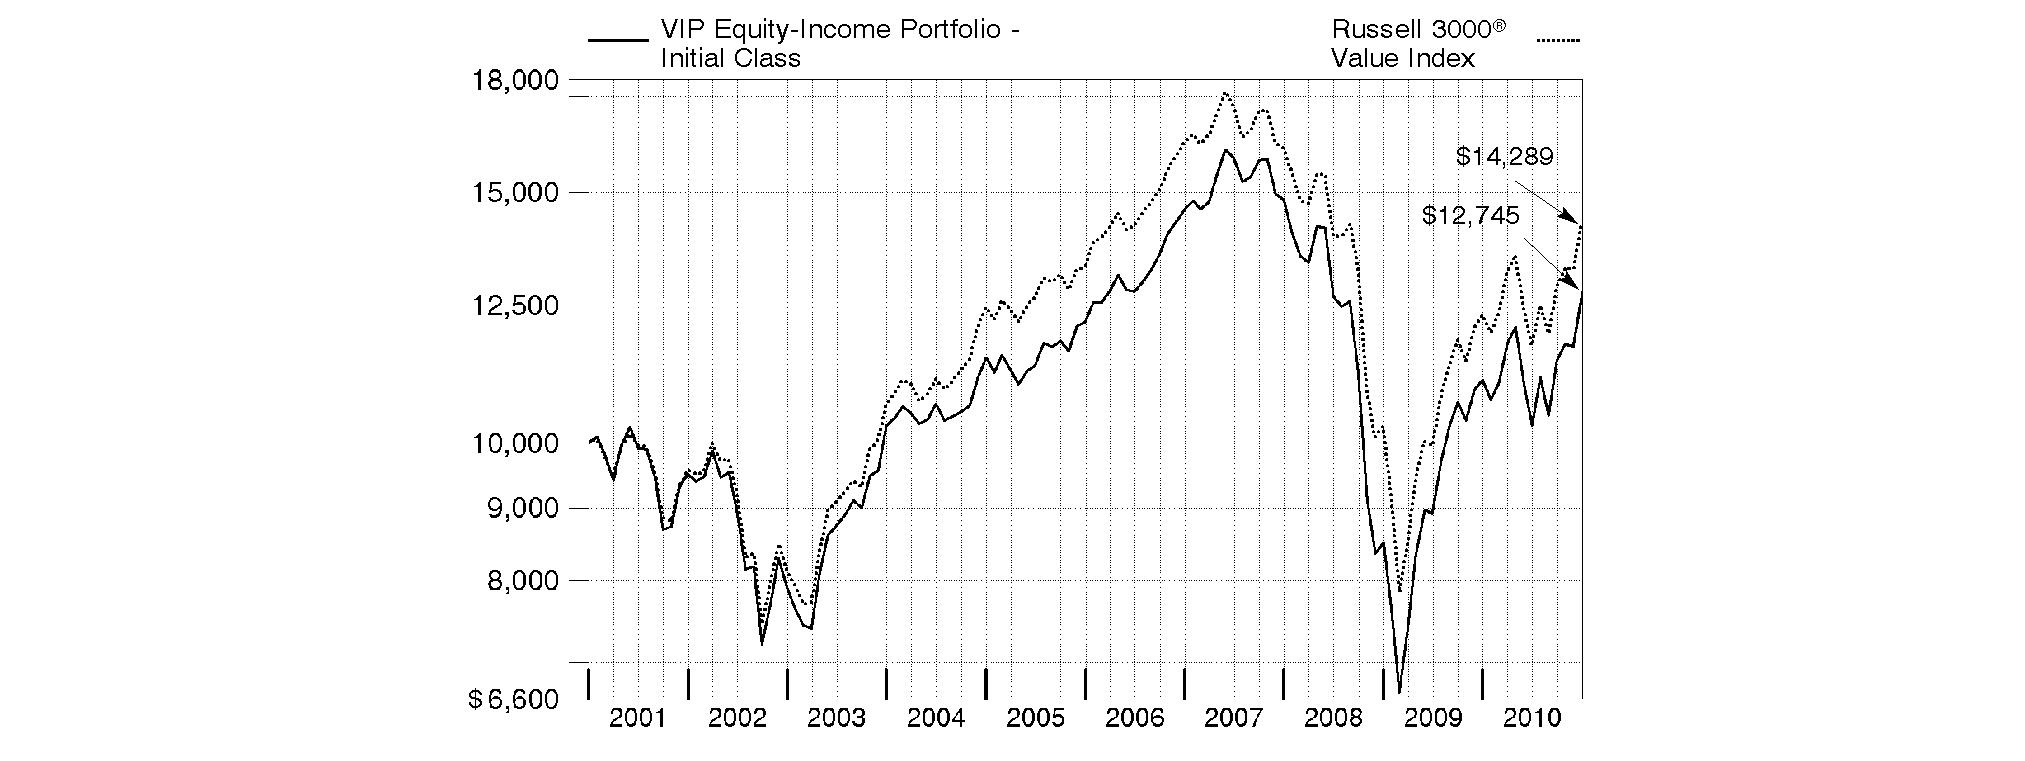
$10,000 Over 10 Years
Let's say hypothetically that $10,000 was invested in VIP Equity-Income PortfolioSM - Initial Class on December 31, 2000. The chart shows how the value of your investment would have changed, and also shows how the Russell 3000® Value Index performed over the same period.
Annual Report
Market Recap: While market improvements around the world hit a speed bump in the first half of the 12-month period ending December 31, 2010, world economies re-accelerated in August, supported by a broadening recovery and low inflation in the U.S. Domestic stock markets recorded solid gains for the year, lifted by a strong second-half rally fueled by economic optimism, encouraging earnings reports and a wave of corporate mergers. The large-cap S&P 500® Index rose 15.06%, the blue-chip-laden Dow Jones Industrial AverageSM added 14.06% and the technology-heavy Nasdaq Composite® Index climbed 18.02%. Meanwhile, international stocks, as represented by the MSCI® ACWI® (All Country World Index) ex USA Index, gained 11.29%, boosted in part by a depreciating U.S. dollar. In the fixed-income arena, U.S. taxable investment-grade bonds generated positive results during 2010, as the Barclays Capital® U.S. Aggregate Bond Index gained 6.54%. With ultra-low interest rates bolstering nearly all fixed-income securities for most of the year, sectors in the index with higher yields and more credit risk generally fared best, while most high-quality bonds generated more-moderate returns. Meanwhile, high-yield bonds, as represented by The BofA Merrill LynchSM US High Yield Constrained Index, returned 15.07%, a result of improved economic data and strengthening investor demand. Overseas, foreign bond markets showed mixed results, with a sizable disparity between the 3.97% return of the Citigroup® Non-U.S. Group of 7 Index - which measures the performance of sovereign debt of the major global economies outside the U.S. - and the 12.04% advance of the JPMorgan Emerging Markets Bond Index Global (EMBI Global), which benefited from the rising overall credit quality of emerging-markets debt issuers.
Comments from Stephen Petersen, Portfolio Manager of VIP Equity-Income PortfolioSM: For the 12 months ending December 31, 2010, the fund's share classes lagged the Russell 3000® Value Index, which returned 16.23%. (For specific portfolio results, please see the performance section of this report.) The fund's relative underperformance was due to security selection, primarily within consumer discretionary, with selections among auto-related names hurting the most. However, the negative impact was more than offset by the fund's overall overweighting in this strong-performing group. Security selection also was weak in energy, information technology and utilities. Unfavorable positioning within diversified financials detracted as well. On the upside, the fund was boosted by its industrials holdings - especially those in the capital goods area - as well as positioning in telecommunication services. Overweighting the energy and retailing segments also provided a boost, despite weak picks in each area. In terms of individual securities, tax-preparation firm H&R Block felt the impact of a reduction in the number of tax filers - a result of the recession and high unemployment in the U.S. Overweighting computer and peripherals maker Hewlett-Packard detracted when the stock fell after the CEO's forced resignation in August. Within financials, large positions in brokerage firm Morgan Stanley and financial services giant Bank of America hurt. Morgan Stanley lost ground due to a softening in the brokerage business, but still posted decent earnings. Bank of America saw its shares decline as investors grew concerned about both the impact of regulatory reform and the possibility that the company's mortgage underwriting business would suffer significant losses related to the ongoing foreclosure crisis. Conversely, global casino operator Las Vegas Sands was the top contributor. The company recently opened a new casino in Singapore, and its financial performance has already vastly outperformed expectations. Underweighting insurance-focused conglomerate Berkshire Hathaway was helpful, as its stock underperformed. The fund also benefited from timely ownership of oil giant Exxon Mobil. Shares of Cummins, a maker of truck engines, rose based on escalating demand. Within telecom, the stock of Qwest Communications International trended upward throughout the reporting period, bolstered in part by its announced merger with CenturyLink in April.
The views expressed above reflect those of the portfolio manager(s) only through the end of the period as stated on the cover of this report and do not necessarily represent the views of Fidelity or any other person in the Fidelity organization. Any such views are subject to change at any time based upon market or other conditions and Fidelity disclaims any responsibility to update such views. These views may not be relied on as investment advice and, because investment decisions for a Fidelity fund are based on numerous factors, may not be relied on as an indication of trading intent on behalf of any Fidelity fund.
Annual Report
As a shareholder of the Fund, you incur two types of costs: (1) transaction costs, including redemption fees, and (2) ongoing costs, including management fees, distribution and/or service (12b-1) fees and other Fund expenses. This Example is intended to help you understand your ongoing costs (in dollars) of investing in the Fund and to compare these costs with the ongoing costs of investing in other mutual funds.
The Example is based on an investment of $1,000 invested at the beginning of the period and held for the entire period (July 1, 2010 to December 31, 2010).
Actual Expenses
The first line of the accompanying table for each class of the Fund provides information about actual account values and actual expenses. You may use the information in this line, together with the amount you invested, to estimate the expenses that you paid over the period. Simply divide your account value by $1,000.00 (for example, an $8,600 account value divided by $1,000.00 = 8.6), then multiply the result by the number in the first line for a class of the Fund under the heading entitled "Expenses Paid During Period" to estimate the expenses you paid on your account during this period. The estimate of expenses does not include any fees or other expenses of any variable annuity or variable life insurance product. If they were, the estimate of expenses you paid during the period would be higher, and your ending account value would be lower. In addition, the Fund, as a shareholder in the underlying Fidelity Central Funds, will indirectly bear its pro-rata share of the fees and expenses incurred by the underlying Fidelity Central Funds. These fees and expenses are not included in the Fund's annualized expense ratio used to calculate the expense estimate in the table below.
Hypothetical Example for Comparison Purposes
The second line of the accompanying table for each class of the Fund provides information about hypothetical account values and hypothetical expenses based on a Class' actual expense ratio and an assumed rate of return of 5% per year before expenses, which is not the Class' actual return. The hypothetical account values and expenses may not be used to estimate the actual ending account balance or expenses you paid for the period. You may use this information to compare the ongoing costs of investing in the Fund and other funds. To do so, compare this 5% hypothetical example with the 5% hypothetical examples that appear in the shareholder reports of the other funds. The estimate of expenses does not include any fees or other expenses of any variable annuity or variable life insurance product. If they were, the estimate of expenses you paid during the period would be higher, and your ending account value would be lower. In addition, the Fund, as a shareholder in the underlying Fidelity Central Funds, will indirectly bear its pro-rata share of the fees and expenses incurred by the underlying Fidelity Central Funds. These fees and expenses are not included in the Fund's annualized expense ratio used to calculate the expense estimate in the table below.
Please note that the expenses shown in the table are meant to highlight your ongoing costs only and do not reflect any transaction costs. Therefore, the second line of the table is useful in comparing ongoing costs only, and will not help you determine the relative total costs of owning different funds. In addition, if these transactional costs were included, your costs would have been higher.
| Annualized
Expense Ratio | Beginning
Account Value
July 1, 2010 | Ending
Account Value
December 31, 2010 | Expenses Paid
During Period*
July 1, 2010 to
December 31, 2010 |
Initial Class | .55% | | | |
Actual | | $ 1,000.00 | $ 1,240.00 | $ 3.11 |
Hypothetical A | | $ 1,000.00 | $ 1,022.43 | $ 2.80 |
Service Class | .65% | | | |
Actual | | $ 1,000.00 | $ 1,239.70 | $ 3.67 |
Hypothetical A | | $ 1,000.00 | $ 1,021.93 | $ 3.31 |
Service Class 2 | .80% | | | |
Actual | | $ 1,000.00 | $ 1,238.90 | $ 4.51 |
Hypothetical A | | $ 1,000.00 | $ 1,021.17 | $ 4.08 |
Service Class 2R | .79% | | | |
Actual | | $ 1,000.00 | $ 1,239.20 | $ 4.46 |
Hypothetical A | | $ 1,000.00 | $ 1,021.22 | $ 4.02 |
Investor Class | .63% | | | |
Actual | | $ 1,000.00 | $ 1,239.90 | $ 3.56 |
Hypothetical A | | $ 1,000.00 | $ 1,022.03 | $ 3.21 |
A 5% return per year before expenses
* Expenses are equal to each Class' annualized expense ratio, multiplied by the average account value over the period, multiplied by 184/365 (to reflect the one-half year period).
Annual Report
Investment Changes (Unaudited)
Top Ten Stocks as of December 31, 2010 |
| % of fund's
net assets | % of fund's net assets
6 months ago |
JPMorgan Chase & Co. | 3.4 | 3.4 |
Wells Fargo & Co. | 3.2 | 3.3 |
Chevron Corp. | 2.5 | 2.3 |
Bank of America Corp. | 2.4 | 3.2 |
AT&T, Inc. | 2.3 | 2.4 |
Pfizer, Inc. | 2.2 | 2.1 |
PNC Financial Services Group, Inc. | 2.0 | 2.4 |
Exxon Mobil Corp. | 2.0 | 3.4 |
General Electric Co. | 1.7 | 1.4 |
Citigroup, Inc. | 1.6 | 0.9 |
| 23.3 | |
Top Five Market Sectors as of December 31, 2010 |
| % of fund's
net assets | % of fund's net assets
6 months ago |
Financials | 27.7 | 27.5 |
Consumer Discretionary | 14.4 | 15.3 |
Energy | 14.0 | 15.5 |
Industrials | 11.2 | 10.4 |
Health Care | 8.8 | 7.2 |
Asset Allocation (% of fund's net assets) |
As of December 31, 2010* | As of June 30, 2010** |
 | Stocks 97.3% | | | Stocks 97.3% | |
 | Bonds 1.9% | | | Bonds 2.4% | |
 | Short-Term
Investments and
Net Other Assets 0.8% | | | Short-Term
Investments and
Net Other Assets 0.3% | |
* Foreign investments | 11.8% | | ** Foreign investments | 11.9% | |

Annual Report
Investments December 31, 2010
Showing Percentage of Net Assets
Common Stocks - 95.5% |
| Shares | | Value |
CONSUMER DISCRETIONARY - 12.5% |
Auto Components - 1.2% |
Johnson Controls, Inc. | 989,967 | | $ 37,816,739 |
Michelin CGDE Series B | 216,474 | | 15,542,162 |
The Goodyear Tire & Rubber Co. (a) | 1,650,000 | | 19,552,500 |
| | 72,911,401 |
Automobiles - 1.5% |
Daimler AG (Germany) (a) | 197,718 | | 13,410,423 |
Ford Motor Co. (a) | 959,365 | | 16,107,738 |
Harley-Davidson, Inc. | 1,425,050 | | 49,406,484 |
Thor Industries, Inc. | 209,500 | | 7,114,620 |
Winnebago Industries, Inc. (a) | 407,511 | | 6,194,167 |
| | 92,233,432 |
Diversified Consumer Services - 0.4% |
H&R Block, Inc. | 1,782,786 | | 21,232,981 |
Hotels, Restaurants & Leisure - 0.3% |
Las Vegas Sands Corp. unit | 24,400 | | 18,986,128 |
Household Durables - 2.5% |
KB Home | 295,900 | | 3,991,691 |
Lennar Corp. Class A | 603,166 | | 11,309,363 |
Newell Rubbermaid, Inc. | 1,692,220 | | 30,764,560 |
PulteGroup, Inc. (a) | 1,665,768 | | 12,526,575 |
Stanley Black & Decker, Inc. | 695,153 | | 46,484,881 |
Techtronic Industries Co. Ltd. | 3,945,500 | | 5,147,298 |
Toll Brothers, Inc. (a) | 170,987 | | 3,248,753 |
Whirlpool Corp. | 375,434 | | 33,349,802 |
| | 146,822,923 |
Internet & Catalog Retail - 0.2% |
Liberty Media Corp. Interactive
Series A (a) | 844,241 | | 13,313,681 |
Leisure Equipment & Products - 0.3% |
Brunswick Corp. | 1,013,757 | | 18,997,806 |
Media - 2.3% |
Belo Corp. Series A (a) | 952,224 | | 6,741,746 |
CC Media Holdings, Inc. Class A (a) | 693,958 | | 6,245,622 |
Comcast Corp.: | | | |
Class A | 1,080,436 | | 23,737,179 |
Class A (special) (non-vtg.) | 911,000 | | 18,957,910 |
The Walt Disney Co. | 1,365,190 | | 51,208,277 |
Time Warner, Inc. | 964,383 | | 31,024,201 |
| | 137,914,935 |
Multiline Retail - 1.4% |
Kohl's Corp. (a) | 413,224 | | 22,454,592 |
Macy's, Inc. | 1,083,500 | | 27,412,550 |
Target Corp. | 520,190 | | 31,279,025 |
Tuesday Morning Corp. (a) | 508,423 | | 2,684,473 |
| | 83,830,640 |
Specialty Retail - 2.1% |
Home Depot, Inc. | 1,860,500 | | 65,229,130 |
Lowe's Companies, Inc. | 1,006,978 | | 25,255,008 |
OfficeMax, Inc. (a) | 598,000 | | 10,584,600 |
|
| Shares | | Value |
RadioShack Corp. | 569,500 | | $ 10,530,055 |
Staples, Inc. | 638,015 | | 14,527,602 |
| | 126,126,395 |
Textiles, Apparel & Luxury Goods - 0.3% |
Phillips-Van Heusen Corp. | 173,516 | | 10,933,243 |
Warnaco Group, Inc. (a) | 165,363 | | 9,106,540 |
| | 20,039,783 |
TOTAL CONSUMER DISCRETIONARY | | 752,410,105 |
CONSUMER STAPLES - 5.2% |
Beverages - 1.0% |
Carlsberg AS Series B | 139,662 | | 13,990,248 |
PepsiCo, Inc. | 257,830 | | 16,844,034 |
The Coca-Cola Co. | 475,329 | | 31,262,388 |
| | 62,096,670 |
Food & Staples Retailing - 1.2% |
CVS Caremark Corp. | 425,189 | | 14,783,822 |
Kroger Co. | 956,200 | | 21,380,632 |
Walgreen Co. | 752,662 | | 29,323,712 |
Winn-Dixie Stores, Inc. (a) | 587,020 | | 4,208,933 |
| | 69,697,099 |
Food Products - 0.4% |
Kraft Foods, Inc. Class A | 67,000 | | 2,111,170 |
Nestle SA | 391,594 | | 22,947,417 |
| | 25,058,587 |
Household Products - 1.5% |
Kimberly-Clark Corp. | 272,870 | | 17,201,725 |
Procter & Gamble Co. | 1,140,705 | | 73,381,553 |
| | 90,583,278 |
Personal Products - 0.3% |
Avon Products, Inc. | 534,971 | | 15,546,257 |
Tobacco - 0.8% |
Philip Morris International, Inc. | 787,105 | | 46,069,256 |
TOTAL CONSUMER STAPLES | | 309,051,147 |
ENERGY - 13.9% |
Energy Equipment & Services - 2.5% |
Baker Hughes, Inc. | 935,631 | | 53,490,024 |
Halliburton Co. | 760,701 | | 31,059,422 |
Noble Corp. | 1,188,302 | | 42,505,563 |
Pride International, Inc. (a) | 451,957 | | 14,914,581 |
Transocean Ltd. (a) | 124,016 | | 8,620,352 |
| | 150,589,942 |
Oil, Gas & Consumable Fuels - 11.4% |
Anadarko Petroleum Corp. | 471,860 | | 35,936,858 |
Apache Corp. | 205,880 | | 24,547,072 |
BP PLC sponsored ADR | 1,216,006 | | 53,710,985 |
Chevron Corp. | 1,630,329 | | 148,767,521 |
ConocoPhillips | 954,110 | | 64,974,891 |
CONSOL Energy, Inc. | 455,890 | | 22,220,079 |
Common Stocks - continued |
| Shares | | Value |
ENERGY - continued |
Oil, Gas & Consumable Fuels - continued |
Devon Energy Corp. | 199,500 | | $ 15,662,745 |
Exxon Mobil Corp. | 1,631,141 | | 119,269,030 |
Marathon Oil Corp. | 816,078 | | 30,219,368 |
Occidental Petroleum Corp. | 480,075 | | 47,095,358 |
Royal Dutch Shell PLC Class A sponsored ADR (d) | 1,439,900 | | 96,156,522 |
Southwestern Energy Co. (a) | 700,621 | | 26,224,244 |
| | 684,784,673 |
TOTAL ENERGY | | 835,374,615 |
FINANCIALS - 26.7% |
Capital Markets - 4.7% |
Bank of New York Mellon Corp. | 1,698,099 | | 51,282,590 |
Bank Sarasin & Co. Ltd. Series B (Reg.) | 252,692 | | 11,521,652 |
Goldman Sachs Group, Inc. | 370,694 | | 62,335,903 |
Morgan Stanley | 2,903,777 | | 79,011,772 |
State Street Corp. | 877,580 | | 40,667,057 |
UBS AG (a) | 640,888 | | 10,530,407 |
UBS AG (NY Shares) (a) | 1,595,121 | | 26,271,643 |
| | 281,621,024 |
Commercial Banks - 8.7% |
Associated Banc-Corp. | 2,093,457 | | 31,715,874 |
Barclays PLC | 5,476,874 | | 22,650,667 |
BB&T Corp. | 1,356,898 | | 35,672,848 |
BNP Paribas SA | 77,400 | | 4,926,864 |
Comerica, Inc. | 475,700 | | 20,093,568 |
Huntington Bancshares, Inc. | 2,786,200 | | 19,141,194 |
KeyCorp | 2,853,500 | | 25,253,475 |
Mitsubishi UFJ Financial Group, Inc. sponsored ADR | 3,449,325 | | 18,660,848 |
PNC Financial Services Group, Inc. | 1,988,230 | | 120,725,326 |
U.S. Bancorp, Delaware | 1,318,938 | | 35,571,758 |
Wells Fargo & Co. | 6,134,109 | | 190,096,038 |
| | 524,508,460 |
Consumer Finance - 1.6% |
American Express Co. | 521,105 | | 22,365,827 |
Capital One Financial Corp. | 300,750 | | 12,799,920 |
Discover Financial Services | 2,519,369 | | 46,683,908 |
SLM Corp. (a) | 904,032 | | 11,381,763 |
| | 93,231,418 |
Diversified Financial Services - 8.0% |
Bank of America Corp. | 10,733,336 | | 143,182,702 |
Citigroup, Inc. (a) | 21,269,761 | | 100,605,970 |
CME Group, Inc. | 38,534 | | 12,398,315 |
JPMorgan Chase & Co. | 4,779,562 | | 202,749,013 |
Moody's Corp. (d) | 883,429 | | 23,446,206 |
| | 482,382,206 |
Insurance - 1.5% |
Berkshire Hathaway, Inc. Class B (a) | 118,700 | | 9,509,057 |
|
| Shares | | Value |
First American Financial Corp. | 619,920 | | $ 9,261,605 |
Hartford Financial Services Group, Inc. | 539,061 | | 14,279,726 |
Marsh & McLennan Companies, Inc. | 503,576 | | 13,767,768 |
Unum Group | 1,268,597 | | 30,725,419 |
XL Capital Ltd. Class A | 418,777 | | 9,137,714 |
| | 86,681,289 |
Real Estate Investment Trusts - 1.7% |
Boston Properties, Inc. | 136,475 | | 11,750,498 |
Camden Property Trust (SBI) | 153,114 | | 8,265,094 |
HCP, Inc. | 823,532 | | 30,297,742 |
ProLogis Trust | 353,500 | | 5,104,540 |
Rayonier, Inc. | 176,815 | | 9,286,324 |
Segro PLC | 1,278,288 | | 5,711,735 |
Ventas, Inc. | 386,075 | | 20,261,216 |
Weyerhaeuser Co. | 687,780 | | 13,019,675 |
| | 103,696,824 |
Real Estate Management & Development - 0.5% |
CB Richard Ellis Group, Inc. Class A (a) | 834,075 | | 17,081,856 |
Indiabulls Real Estate Ltd. (a) | 2,750,085 | | 8,564,704 |
Unite Group PLC (a) | 683,979 | | 2,071,260 |
| | 27,717,820 |
TOTAL FINANCIALS | | 1,599,839,041 |
HEALTH CARE - 8.8% |
Biotechnology - 1.2% |
Amgen, Inc. (a) | 712,122 | | 39,095,498 |
Cephalon, Inc. (a) | 153,200 | | 9,455,504 |
Gilead Sciences, Inc. (a) | 674,065 | | 24,428,116 |
| | 72,979,118 |
Health Care Equipment & Supplies - 1.4% |
C. R. Bard, Inc. | 205,200 | | 18,831,204 |
CareFusion Corp. (a) | 1,109,900 | | 28,524,430 |
Covidien PLC | 268,900 | | 12,277,974 |
Stryker Corp. | 454,900 | | 24,428,130 |
| | 84,061,738 |
Health Care Providers & Services - 0.4% |
UnitedHealth Group, Inc. | 687,400 | | 24,822,014 |
Life Sciences Tools & Services - 0.5% |
Agilent Technologies, Inc. (a) | 662,181 | | 27,434,159 |
Pharmaceuticals - 5.3% |
GlaxoSmithKline PLC | 631,919 | | 12,263,020 |
GlaxoSmithKline PLC sponsored ADR | 43,700 | | 1,713,914 |
Johnson & Johnson | 929,766 | | 57,506,027 |
Merck & Co., Inc. | 2,380,872 | | 85,806,627 |
Pfizer, Inc. | 7,516,615 | | 131,615,929 |
Sanofi-Aventis | 487,372 | | 31,261,967 |
| | 320,167,484 |
TOTAL HEALTH CARE | | 529,464,513 |
Common Stocks - continued |
| Shares | | Value |
INDUSTRIALS - 11.0% |
Aerospace & Defense - 2.5% |
Goodrich Corp. | 128,142 | | $ 11,285,466 |
Honeywell International, Inc. | 925,025 | | 49,174,329 |
Spirit AeroSystems Holdings, Inc.
Class A (a) | 275,088 | | 5,724,581 |
The Boeing Co. | 406,784 | | 26,546,724 |
United Technologies Corp. | 724,789 | | 57,055,390 |
| | 149,786,490 |
Building Products - 0.4% |
Armstrong World Industries, Inc. | 120,914 | | 5,199,302 |
Masco Corp. | 1,569,300 | | 19,867,338 |
| | 25,066,640 |
Commercial Services & Supplies - 0.5% |
Pitney Bowes, Inc. | 459,700 | | 11,115,546 |
Republic Services, Inc. | 652,000 | | 19,468,720 |
| | 30,584,266 |
Construction & Engineering - 0.6% |
Fluor Corp. | 255,800 | | 16,949,308 |
KBR, Inc. | 635,239 | | 19,355,732 |
| | 36,305,040 |
Industrial Conglomerates - 3.8% |
General Electric Co. | 5,720,475 | | 104,627,488 |
Koninklijke Philips Electronics NV unit | 413,300 | | 12,688,310 |
Rheinmetall AG | 296,433 | | 23,847,231 |
Siemens AG sponsored ADR | 416,000 | | 51,688,000 |
Textron, Inc. | 823,200 | | 19,460,448 |
Tyco International Ltd. | 380,936 | | 15,785,988 |
| | 228,097,465 |
Machinery - 2.5% |
Briggs & Stratton Corp. | 1,203,409 | | 23,695,123 |
Caterpillar, Inc. | 101,800 | | 9,534,588 |
Cummins, Inc. | 340,500 | | 37,458,405 |
Harsco Corp. | 223,320 | | 6,324,422 |
Ingersoll-Rand Co. Ltd. | 673,888 | | 31,733,386 |
Kennametal, Inc. | 250,344 | | 9,878,574 |
Navistar International Corp. (a) | 292,170 | | 16,919,565 |
SPX Corp. | 145,800 | | 10,423,242 |
| | 145,967,305 |
Road & Rail - 0.7% |
CSX Corp. | 345,000 | | 22,290,450 |
Union Pacific Corp. | 228,400 | | 21,163,544 |
| | 43,453,994 |
TOTAL INDUSTRIALS | | 659,261,200 |
INFORMATION TECHNOLOGY - 6.0% |
Communications Equipment - 0.7% |
Cisco Systems, Inc. (a) | 1,134,453 | | 22,949,984 |
|
| Shares | | Value |
Comverse Technology, Inc. (a) | 1,623,693 | | $ 11,788,011 |
Motorola, Inc. (a) | 725,557 | | 6,580,802 |
| | 41,318,797 |
Computers & Peripherals - 0.9% |
Hewlett-Packard Co. | 1,287,050 | | 54,184,805 |
Electronic Equipment & Components - 1.2% |
Arrow Electronics, Inc. (a) | 704,900 | | 24,142,825 |
Avnet, Inc. (a) | 352,303 | | 11,636,568 |
Tyco Electronics Ltd. | 960,536 | | 34,002,974 |
| | 69,782,367 |
IT Services - 0.4% |
CoreLogic, Inc. (a) | 289,320 | | 5,358,206 |
MoneyGram International, Inc. (a) | 438,950 | | 1,189,555 |
Visa, Inc. Class A | 219,433 | | 15,443,695 |
| | 21,991,456 |
Office Electronics - 0.3% |
Xerox Corp. | 1,784,378 | | 20,556,035 |
Semiconductors & Semiconductor Equipment - 2.5% |
Applied Materials, Inc. | 1,707,400 | | 23,988,970 |
Intel Corp. | 2,738,600 | | 57,592,758 |
Micron Technology, Inc. (a) | 1,507,800 | | 12,092,556 |
National Semiconductor Corp. | 1,433,347 | | 19,722,855 |
Samsung Electronics Co. Ltd. | 12,977 | | 10,983,435 |
Teradyne, Inc. (a) | 1,435,900 | | 20,160,036 |
Varian Semiconductor Equipment Associates, Inc. (a) | 182,020 | | 6,729,279 |
| | 151,269,889 |
TOTAL INFORMATION TECHNOLOGY | | 359,103,349 |
MATERIALS - 2.8% |
Chemicals - 2.0% |
Celanese Corp. Class A | 471,412 | | 19,408,032 |
Clariant AG (Reg.) (a) | 1,331,205 | | 26,986,003 |
Dow Chemical Co. | 794,805 | | 27,134,643 |
E.I. du Pont de Nemours & Co. | 670,700 | | 33,454,516 |
PPG Industries, Inc. | 131,300 | | 11,038,391 |
| | 118,021,585 |
Construction Materials - 0.2% |
HeidelbergCement AG | 192,600 | | 12,077,041 |
Metals & Mining - 0.6% |
Alcoa, Inc. | 1,012,171 | | 15,577,312 |
Commercial Metals Co. | 442,971 | | 7,348,889 |
Freeport-McMoRan Copper & Gold, Inc. | 135,551 | | 16,278,320 |
| | 39,204,521 |
TOTAL MATERIALS | | 169,303,147 |
TELECOMMUNICATION SERVICES - 5.0% |
Diversified Telecommunication Services - 4.6% |
AT&T, Inc. | 4,610,452 | | 135,455,080 |
Common Stocks - continued |
| Shares | | Value |
TELECOMMUNICATION SERVICES - continued |
Diversified Telecommunication Services - continued |
Qwest Communications International,
Inc. | 5,608,200 | | $ 42,678,402 |
Verizon Communications, Inc. | 2,666,517 | | 95,407,978 |
| | 273,541,460 |
Wireless Telecommunication Services - 0.4% |
Sprint Nextel Corp. (a) | 6,011,178 | | 25,427,283 |
TOTAL TELECOMMUNICATION SERVICES | | 298,968,743 |
UTILITIES - 3.6% |
Electric Utilities - 2.2% |
Allegheny Energy, Inc. | 921,509 | | 22,337,378 |
American Electric Power Co., Inc. | 1,349,079 | | 48,539,862 |
Entergy Corp. | 296,459 | | 20,998,191 |
FirstEnergy Corp. (d) | 1,101,500 | | 40,777,530 |
| | 132,652,961 |
Independent Power Producers & Energy Traders - 0.6% |
AES Corp. (a) | 2,879,421 | | 35,071,348 |
Multi-Utilities - 0.8% |
Alliant Energy Corp. | 340,496 | | 12,520,038 |
PG&E Corp. | 298,392 | | 14,275,073 |
Public Service Enterprise Group, Inc. | 600,479 | | 19,101,237 |
Veolia Environnement | 132,700 | | 3,886,319 |
| | 49,782,667 |
TOTAL UTILITIES | | 217,506,976 |
TOTAL COMMON STOCKS (Cost $5,250,694,342) | 5,730,282,836 |
Preferred Stocks - 1.8% |
| | | |
Convertible Preferred Stocks - 1.6% |
CONSUMER DISCRETIONARY - 0.6% |
Automobiles - 0.6% |
General Motors Co. 4.75% | 656,400 | | 35,517,804 |
Household Durables - 0.0% |
Stanley Black & Decker, Inc. 4.75% (a) | 13,800 | | 1,494,713 |
TOTAL CONSUMER DISCRETIONARY | | 37,012,517 |
ENERGY - 0.1% |
Oil, Gas & Consumable Fuels - 0.1% |
Apache Corp. 6.00% | 111,700 | | 7,401,242 |
FINANCIALS - 0.8% |
Commercial Banks - 0.2% |
Huntington Bancshares, Inc. 8.50% | 9,000 | | 9,497,340 |
Diversified Financial Services - 0.2% |
Citigroup, Inc. 7.50% | 87,000 | | 11,892,030 |
|
| Shares | | Value |
Insurance - 0.4% |
Hartford Financial Services Group, Inc. Series F 7.25% | 310,900 | | $ 7,995,975 |
XL Capital Ltd. 10.75% | 494,600 | | 15,411,736 |
| | 23,407,711 |
TOTAL FINANCIALS | | 44,797,081 |
UTILITIES - 0.1% |
Electric Utilities - 0.1% |
PPL Corp. 9.50% | 121,900 | | 6,665,492 |
TOTAL CONVERTIBLE PREFERRED STOCKS | | 95,876,332 |
Nonconvertible Preferred Stocks - 0.2% |
CONSUMER DISCRETIONARY - 0.2% |
Automobiles - 0.2% |
Volkswagen AG | 82,700 | | 13,423,186 |
TOTAL PREFERRED STOCKS (Cost $93,391,048) | 109,299,518 |
Corporate Bonds - 1.9% |
| Principal Amount | | |
Convertible Bonds - 1.7% |
CONSUMER DISCRETIONARY - 1.1% |
Hotels, Restaurants & Leisure - 0.3% |
MGM Mirage, Inc. 4.25% 4/15/15 (e) | | $ 14,560,000 | | 15,852,200 |
Leisure Equipment & Products - 0.0% |
Eastman Kodak Co. 7% 4/1/17 | | 2,030,000 | | 2,117,696 |
Media - 0.8% |
Liberty Media Corp.: | | | | |
3.5% 1/15/31 | | 254,655 | | 184,425 |
4% 11/15/29 | | 4,750,000 | | 2,707,500 |
3.5% 1/15/31 (e) | | 9,306,795 | | 6,740,111 |
News America, Inc. liquid yield option note: | | | | |
0% 2/28/21 (e) | | 22,670,000 | | 15,879,202 |
0% 2/28/21 | | 3,490,000 | | 2,444,571 |
Virgin Media, Inc. 6.5% 11/15/16 | | 12,614,000 | | 20,867,340 |
| | 48,823,149 |
TOTAL CONSUMER DISCRETIONARY | | 66,793,045 |
FINANCIALS - 0.2% |
Thrifts & Mortgage Finance - 0.2% |
MGIC Investment Corp. 9% 4/1/63 (e) | | 10,438,000 | | 11,507,895 |
Corporate Bonds - continued |
| Principal Amount | | Value |
Convertible Bonds - continued |
INDUSTRIALS - 0.2% |
Airlines - 0.2% |
UAL Corp.: | | | | |
4.5% 6/30/21 (e) | | $ 8,490,000 | | $ 8,666,592 |
4.5% 6/30/21 | | 280,000 | | 285,824 |
| | 8,952,416 |
INFORMATION TECHNOLOGY - 0.2% |
Semiconductors & Semiconductor Equipment - 0.2% |
Advanced Micro Devices, Inc.: | | | | |
6% 5/1/15 (e) | | 6,316,000 | | 6,329,264 |
6% 5/1/15 | | 2,798,000 | | 2,803,876 |
Micron Technology, Inc. 1.875% 6/1/27 | | 3,933,000 | | 3,765,848 |
| | 12,898,988 |
TOTAL CONVERTIBLE BONDS | | 100,152,344 |
Nonconvertible Bonds - 0.2% |
MATERIALS - 0.2% |
Chemicals - 0.2% |
Hercules, Inc. 6.5% 6/30/29 unit | | 15,700,000 | | 12,462,660 |
TOTAL CORPORATE BONDS (Cost $100,580,725) | 112,615,004 |
Money Market Funds - 0.9% |
| Shares | | Value |
Fidelity Cash Central Fund, 0.19% (b) | 46,188,835 | | $ 46,188,835 |
Fidelity Securities Lending Cash Central Fund, 0.21% (b)(c) | 8,104,000 | | 8,104,000 |
TOTAL MONEY MARKET FUNDS (Cost $54,292,835) | 54,292,835 |
TOTAL INVESTMENT PORTFOLIO - 100.1% (Cost $5,498,958,950) | | 6,006,490,193 |
NET OTHER ASSETS (LIABILITIES) - (0.1)% | | (3,042,714) |
NET ASSETS - 100% | $ 6,003,447,479 |
Legend |
(a) Non-income producing |
(b) Affiliated fund that is available only to investment companies and other accounts managed by Fidelity Investments. The rate quoted is the annualized seven-day yield of the fund at period end. A complete unaudited listing of the fund's holdings as of its most recent quarter end is available upon request. In addition, each Fidelity Central Fund's financial statements, which are not covered by the Fund's Report of Independent Registered Public Accounting Firm, are available on the SEC's website or upon request. |
(c) Investment made with cash collateral received from securities on loan. |
(d) Security or a portion of the security is on loan at period end. |
(e) Security exempt from registration under Rule 144A of the Securities Act of 1933. These securities may be resold in transactions exempt from registration, normally to qualified institutional buyers. At the end of the period, the value of these securities amounted to $64,975,264 or 1.1% of net assets. |
Affiliated Central Funds |
Information regarding fiscal year to date income earned by the Fund from investments in Fidelity Central Funds is as follows: |
Fund | Income earned |
Fidelity Cash Central Fund | $ 39,921 |
Fidelity Securities Lending Cash Central Fund | 800,893 |
Total | $ 840,814 |
Other Information |
The following is a summary of the inputs used, as of December 31, 2010, involving the Fund's assets and liabilities carried at fair value. The inputs or methodology used for valuing securities may not be an indication of the risk associated with investing in those securities. For more information on valuation inputs, and their aggregation into the levels used in the table below, please refer to the Security Valuation section in the accompanying Notes to Financial Statements. |
Valuation Inputs at Reporting Date: |
Description | Total | Level 1 | Level 2 | Level 3 |
Investments in Securities: | | | | |
Equities: | | | | |
Consumer Discretionary | $ 802,845,808 | $ 782,364,967 | $ 20,480,841 | $ - |
Consumer Staples | 309,051,147 | 309,051,147 | - | - |
Energy | 842,775,857 | 842,775,857 | - | - |
Financials | 1,644,636,122 | 1,582,069,703 | 62,566,419 | - |
Health Care | 529,464,513 | 485,939,526 | 43,524,987 | - |
Industrials | 659,261,200 | 659,261,200 | - | - |
Information Technology | 359,103,349 | 359,103,349 | - | - |
Materials | 169,303,147 | 169,303,147 | - | - |
Telecommunication Services | 298,968,743 | 298,968,743 | - | - |
Utilities | 224,172,468 | 213,620,657 | 10,551,811 | - |
Corporate Bonds | 112,615,004 | - | 112,615,004 | - |
Money Market Funds | 54,292,835 | 54,292,835 | - | - |
Total Investments in Securities: | $ 6,006,490,193 | $ 5,756,751,131 | $ 249,739,062 | $ - |
Distribution of investments by country of issue, as a percentage of total net assets, is as follows: (Unaudited) |
United States of America | 88.2% |
Switzerland | 3.3% |
United Kingdom | 3.2% |
Germany | 1.9% |
Ireland | 1.2% |
France | 1.0% |
Others (Individually Less Than 1%) | 1.2% |
| 100.0% |
Income Tax Information |
At December 31, 2010, the Fund had a capital loss carryforward of approximately $168,007,461 all of which will expire in fiscal 2017. Capital loss carryforwards are only available to offset future capital gains of the Fund to the extent provided by regulations and may be limited. |
See accompanying notes which are an integral part of the financial statements.
Annual Report
Statement of Assets and Liabilities
| December 31, 2010 |
| | |
Assets | | |
Investment in securities, at value (including securities loaned of $7,895,710) - See accompanying schedule: Unaffiliated issuers (cost $5,444,666,115) | $ 5,952,197,358 | |
Fidelity Central Funds (cost $54,292,835) | 54,292,835 | |
Total Investments (cost $5,498,958,950) | | $ 6,006,490,193 |
Cash | | 255,113 |
Receivable for investments sold | | 7,846,729 |
Receivable for fund shares sold | | 929,418 |
Dividends receivable | | 6,209,156 |
Interest receivable | | 777,210 |
Distributions receivable from Fidelity Central Funds | | 5,998 |
Prepaid expenses | | 17,204 |
Other receivables | | 289,394 |
Total assets | | 6,022,820,415 |
| | |
Liabilities | | |
Payable for fund shares redeemed | $ 7,876,491 | |
Accrued management fee | 2,255,589 | |
Distribution and service plan fees payable | 367,554 | |
Other affiliated payables | 431,145 | |
Other payables and accrued expenses | 338,157 | |
Collateral on securities loaned, at value | 8,104,000 | |
Total liabilities | | 19,372,936 |
| | |
Net Assets | | $ 6,003,447,479 |
Net Assets consist of: | | |
Paid in capital | | $ 5,729,372,443 |
Distributions in excess of net investment income | | (1,868,429) |
Accumulated undistributed net realized gain (loss) on investments and foreign currency transactions | | (231,633,750) |
Net unrealized appreciation (depreciation) on investments and assets and liabilities in foreign currencies | | 507,577,215 |
Net Assets | | $ 6,003,447,479 |
Statement of Assets and Liabilities - continued
| December 31, 2010 |
| | |
Initial Class:
Net Asset Value, offering price and redemption price per share ($3,798,309,587 ÷ 199,689,311 shares) | | $ 19.02 |
| | |
Service Class:
Net Asset Value, offering price and redemption price per share ($414,431,332 ÷ 21,859,341 shares) | | $ 18.96 |
| | |
Service Class 2:
Net Asset Value, offering price and redemption price per share ($1,619,355,750 ÷ 86,388,600 shares) | | $ 18.75 |
| | |
Service Class 2R:
Net Asset Value, offering price and redemption price per share ($5,405,078 ÷ 289,707 shares) | | $ 18.66 |
| | |
Investor Class:
Net Asset Value, offering price and redemption price per share ($165,945,732 ÷ 8,745,541 shares) | | $ 18.97 |
See accompanying notes which are an integral part of the financial statements.
Annual Report
Financial Statements - continued
Statement of Operations
| Year ended December 31, 2010 |
| | |
Investment Income | | |
Dividends | | $ 120,053,669 |
Interest | | 8,740,142 |
Income from Fidelity Central Funds | | 840,814 |
Total income | | 129,634,625 |
| | |
Expenses | | |
Management fee | $ 26,340,116 | |
Transfer agent fees | 4,446,398 | |
Distribution and service plan fees | 4,243,891 | |
Accounting and security lending fees | 1,132,655 | |
Custodian fees and expenses | 170,669 | |
Independent trustees' compensation | 33,980 | |
Appreciation in deferred trustee compensation account | 95 | |
Audit | 78,093 | |
Legal | 33,320 | |
Interest | 7,056 | |
Miscellaneous | 82,578 | |
Total expenses before reductions | 36,568,851 | |
Expense reductions | (575,254) | 35,993,597 |
Net investment income (loss) | | 93,641,028 |
Realized and Unrealized Gain (Loss) Net realized gain (loss) on: | | |
Investment securities: | | |
Unaffiliated issuers (net of foreign taxes of $171,799) | 376,291,349 | |
Foreign currency transactions | (269,831) | |
Total net realized gain (loss) | | 376,021,518 |
Change in net unrealized appreciation (depreciation) on: Investment securities (net of decrease in deferred foreign taxes of $170,609) | 339,357,549 | |
Assets and liabilities in foreign currencies | 40,455 | |
Total change in net unrealized appreciation (depreciation) | | 339,398,004 |
Net gain (loss) | | 715,419,522 |
Net increase (decrease) in net assets resulting from operations | | $ 809,060,550 |
Statement of Changes in Net Assets
| Year ended
December 31, 2010 | Year ended
December 31, 2009 |
Increase (Decrease) in Net Assets | | |
Operations | | |
Net investment income (loss) | $ 93,641,028 | $ 115,365,664 |
Net realized gain (loss) | 376,021,518 | (309,873,827) |
Change in net unrealized appreciation (depreciation) | 339,398,004 | 1,591,452,108 |
Net increase (decrease) in net assets resulting from operations | 809,060,550 | 1,396,943,945 |
Distributions to shareholders from net investment income | (98,879,089) | (115,095,209) |
Share transactions - net increase (decrease) | (619,890,150) | (545,969,487) |
Redemption fees | 2,603 | 1,473 |
Total increase (decrease) in net assets | 90,293,914 | 735,880,722 |
| | |
Net Assets | | |
Beginning of period | 5,913,153,565 | 5,177,272,843 |
End of period (including distributions in excess of net investment income of $1,868,429 and undistributed net investment income of $3,552,237, respectively) | $ 6,003,447,479 | $ 5,913,153,565 |
See accompanying notes which are an integral part of the financial statements.
Annual Report
Financial Highlights - Initial Class
Years ended December 31, | 2010 | 2009 | 2008 | 2007 | 2006 |
Selected Per-Share Data | | | | | |
Net asset value, beginning of period | $ 16.81 | $ 13.18 | $ 23.91 | $ 26.20 | $ 25.49 |
Income from Investment Operations | | | | | |
Net investment income (loss) C | .30 | .33 | .47 | .47 | .45 |
Net realized and unrealized gain (loss) | 2.24 | 3.64 | (10.67) | (.05) | 4.37 |
Total from investment operations | 2.54 | 3.97 | (10.20) | .42 | 4.82 |
Distributions from net investment income | (.33) | (.34) | (.51) | (.50) | (.89) |
Distributions from net realized gain | - | - | (.02) | (2.21) | (3.22) |
Total distributions | (.33) | (.34) | (.53) | (2.71) | (4.11) |
Redemption fees added to paid in capital C,G | - | - | - | - | - |
Net asset value, end of period | $ 19.02 | $ 16.81 | $ 13.18 | $ 23.91 | $ 26.20 |
Total Return A,B | 15.15% | 30.21% | (42.65)% | 1.53% | 20.19% |
Ratios to Average Net Assets D,F | | | | | |
Expenses before reductions | .56% | .58% | .57% | .55% | .57% |
Expenses net of fee waivers, if any | .55% | .58% | .57% | .55% | .57% |
Expenses net of all reductions | .55% | .58% | .57% | .54% | .56% |
Net investment income (loss) | 1.71% | 2.29% | 2.37% | 1.71% | 1.76% |
Supplemental Data | | | | | |
Net assets, end of period (000 omitted) | $ 3,798,310 | $ 3,771,733 | $ 3,322,799 | $ 7,201,655 | $ 8,315,159 |
Portfolio turnover rate E | 29% | 29% | 34% | 20% | 22% |
A Total returns do not reflect charges attributable to your insurance company's separate account. Inclusion of these charges would reduce the total returns shown.
B Total returns would have been lower had certain expenses not been reduced during the periods shown.
C Calculated based on average shares outstanding during the period.
D Fees and expenses of the underlying Fidelity Central Funds are not included in the Fund's expense ratio. The Fund indirectly bears its proportionate share of the expenses of any underlying Fidelity Central Funds.
E Amount does not include the portfolio activity of any underlying Fidelity Central Funds.
F Expense ratios reflect operating expenses of the class. Expenses before reductions do not reflect amounts reimbursed by the investment adviser or reductions from brokerage service arrangements or reductions from other expense offset arrangements and do not represent the amount paid by the class during periods when reimbursements or reductions occur. Expenses net of fee waivers reflect expenses after reimbursement by the investment adviser but prior to reductions from brokerage service arrangements or other expense offset arrangements. Expenses net of all reductions represent the net expenses paid by the class.
G Amount represents less than $.01 per share.
Financial Highlights - Service Class
Years ended December 31, | 2010 | 2009 | 2008 | 2007 | 2006 |
Selected Per-Share Data | | | | | |
Net asset value, beginning of period | $ 16.75 | $ 13.14 | $ 23.82 | $ 26.11 | $ 25.39 |
Income from Investment Operations | | | | | |
Net investment income (loss) C | .28 | .31 | .44 | .44 | .43 |
Net realized and unrealized gain (loss) | 2.24 | 3.63 | (10.62) | (.05) | 4.35 |
Total from investment operations | 2.52 | 3.94 | (10.18) | .39 | 4.78 |
Distributions from net investment income | (.31) | (.33) | (.48) | (.47) | (.84) |
Distributions from net realized gain | - | - | (.02) | (2.21) | (3.22) |
Total distributions | (.31) | (.33) | (.50) | (2.68) | (4.06) |
Redemption fees added to paid in capital C,G | - | - | - | - | - |
Net asset value, end of period | $ 18.96 | $ 16.75 | $ 13.14 | $ 23.82 | $ 26.11 |
Total Return A,B | 15.09% | 30.03% | (42.70)% | 1.42% | 20.08% |
Ratios to Average Net Assets D,F | | | | | |
Expenses before reductions | .66% | .68% | .67% | .65% | .67% |
Expenses net of fee waivers, if any | .65% | .68% | .67% | .65% | .67% |
Expenses net of all reductions | .65% | .68% | .67% | .64% | .66% |
Net investment income (loss) | 1.61% | 2.19% | 2.27% | 1.61% | 1.66% |
Supplemental Data | | | | | |
Net assets, end of period (000 omitted) | $ 414,431 | $ 430,383 | $ 405,082 | $ 920,054 | $ 1,118,333 |
Portfolio turnover rate E | 29% | 29% | 34% | 20% | 22% |
A Total returns do not reflect charges attributable to your insurance company's separate account. Inclusion of these charges would reduce the total returns shown.
B Total returns would have been lower had certain expenses not been reduced during the periods shown.
C Calculated based on average shares outstanding during the period.
D Fees and expenses of the underlying Fidelity Central Funds are not included in the Fund's expense ratio. The Fund indirectly bears its proportionate share of the expenses of any underlying Fidelity Central Funds.
E Amount does not include the portfolio activity of any underlying Fidelity Central Funds.
F Expense ratios reflect operating expenses of the class. Expenses before reductions do not reflect amounts reimbursed by the investment adviser or reductions from brokerage service arrangements or reductions from other expense offset arrangements and do not represent the amount paid by the class during periods when reimbursements or reductions occur. Expenses net of fee waivers reflect expenses after reimbursement by the investment adviser but prior to reductions from brokerage service arrangements or other expense offset arrangements. Expenses net of all reductions represent the net expenses paid by the class.
G Amount represents less than $.01 per share.
See accompanying notes which are an integral part of the financial statements.
Annual Report
Financial Highlights - Service Class 2
Years ended December 31, | 2010 | 2009 | 2008 | 2007 | 2006 |
Selected Per-Share Data | | | | | |
Net asset value, beginning of period | $ 16.57 | $ 13.00 | $ 23.57 | $ 25.87 | $ 25.17 |
Income from Investment Operations | | | | | |
Net investment income (loss) C | .25 | .29 | .41 | .39 | .38 |
Net realized and unrealized gain (loss) | 2.21 | 3.58 | (10.50) | (.04) | 4.32 |
Total from investment operations | 2.46 | 3.87 | (10.09) | .35 | 4.70 |
Distributions from net investment income | (.28) | (.30) | (.46) | (.44) | (.78) |
Distributions from net realized gain | - | - | (.02) | (2.21) | (3.22) |
Total distributions | (.28) | (.30) | (.48) | (2.65) | (4.00) |
Redemption fees added to paid in capital C,G | - | - | - | - | - |
Net asset value, end of period | $ 18.75 | $ 16.57 | $ 13.00 | $ 23.57 | $ 25.87 |
Total Return A,B | 14.92% | 29.88% | (42.81)% | 1.27% | 19.93% |
Ratios to Average Net Assets D,F | | | | | |
Expenses before reductions | .81% | .83% | .82% | .80% | .82% |
Expenses net of fee waivers, if any | .80% | .83% | .82% | .80% | .82% |
Expenses net of all reductions | .80% | .83% | .82% | .80% | .82% |
Net investment income (loss) | 1.46% | 2.04% | 2.12% | 1.46% | 1.51% |
Supplemental Data | | | | | |
Net assets, end of period (000 omitted) | $ 1,619,356 | $ 1,558,421 | $ 1,321,569 | $ 2,583,129 | $ 2,373,059 |
Portfolio turnover rate E | 29% | 29% | 34% | 20% | 22% |
A Total returns do not reflect charges attributable to your insurance company's separate account. Inclusion of these charges would reduce the total returns shown.
B Total returns would have been lower had certain expenses not been reduced during the periods shown.
C Calculated based on average shares outstanding during the period.
D Fees and expenses of the underlying Fidelity Central Funds are not included in the Fund's expense ratio. The Fund indirectly bears its proportionate share of the expenses of any underlying Fidelity Central Funds.
E Amount does not include the portfolio activity of any underlying Fidelity Central Funds.
F Expense ratios reflect operating expenses of the class. Expenses before reductions do not reflect amounts reimbursed by the investment adviser or reductions from brokerage service arrangements or reductions from other expense offset arrangements and do not represent the amount paid by the class during periods when reimbursements or reductions occur. Expenses net of fee waivers reflect expenses after reimbursement by the investment adviser but prior to reductions from brokerage service arrangements or other expense offset arrangements. Expenses net of all reductions represent the net expenses paid by the class.
G Amount represents less than $.01 per share.
Financial Highlights - Service Class 2R
Years ended December 31, | 2010 | 2009 | 2008 | 2007 | 2006 |
Selected Per-Share Data | | | | | |
Net asset value, beginning of period | $ 16.49 | $ 12.93 | $ 23.44 | $ 25.73 | $ 25.08 |
Income from Investment Operations | | | | | |
Net investment income (loss) C | .25 | .28 | .41 | .39 | .38 |
Net realized and unrealized gain (loss) | 2.20 | 3.58 | (10.45) | (.04) | 4.29 |
Total from investment operations | 2.45 | 3.86 | (10.04) | .35 | 4.67 |
Distributions from net investment income | (.28) | (.30) | (.45) | (.43) | (.80) |
Distributions from net realized gain | - | - | (.02) | (2.21) | (3.22) |
Total distributions | (.28) | (.30) | (.47) | (2.64) | (4.02) |
Redemption fees added to paid in capital C,G | - | - | - | - | - |
Net asset value, end of period | $ 18.66 | $ 16.49 | $ 12.93 | $ 23.44 | $ 25.73 |
Total Return A,B | 14.90% | 29.95% | (42.82)% | 1.27% | 19.89% |
Ratios to Average Net Assets D,F | | | | | |
Expenses before reductions | .81% | .83% | .82% | .80% | .82% |
Expenses net of fee waivers, if any | .80% | .83% | .82% | .80% | .82% |
Expenses net of all reductions | .80% | .83% | .81% | .79% | .81% |
Net investment income (loss) | 1.46% | 2.04% | 2.12% | 1.46% | 1.51% |
Supplemental Data | | | | | |
Net assets, end of period (000 omitted) | $ 5,405 | $ 5,259 | $ 5,339 | $ 13,558 | $ 17,089 |
Portfolio turnover rate E | 29% | 29% | 34% | 20% | 22% |
A Total returns do not reflect charges attributable to your insurance company's separate account. Inclusion of these charges would reduce the total returns shown.
B Total returns would have been lower had certain expenses not been reduced during the periods shown.
C Calculated based on average shares outstanding during the period.
D Fees and expenses of the underlying Fidelity Central Funds are not included in the Fund's expense ratio. The Fund indirectly bears its proportionate share of the expenses of any underlying Fidelity Central Funds.
E Amount does not include the portfolio activity of any underlying Fidelity Central Funds.
F Expense ratios reflect operating expenses of the class. Expenses before reductions do not reflect amounts reimbursed by the investment adviser or reductions from brokerage service arrangements or reductions from other expense offset arrangements and do not represent the amount paid by the class during periods when reimbursements or reductions occur. Expenses net of fee waivers reflect expenses after reimbursement by the investment adviser but prior to reductions from brokerage service arrangements or other expense offset arrangements. Expenses net of all reductions represent the net expenses paid by the class.
G Amount represents less than $.01 per share.
See accompanying notes which are an integral part of the financial statements.
Annual Report
Financial Highlights - Investor Class
Years ended December 31, | 2010 | 2009 | 2008 | 2007 | 2006 |
Selected Per-Share Data | | | | | |
Net asset value, beginning of period | $ 16.77 | $ 13.15 | $ 23.85 | $ 26.15 | $ 25.48 |
Income from Investment Operations | | | | | |
Net investment income (loss) C | .28 | .31 | .44 | .44 | .42 |
Net realized and unrealized gain (loss) | 2.23 | 3.64 | (10.63) | (.05) | 4.36 |
Total from investment operations | 2.51 | 3.95 | (10.19) | .39 | 4.78 |
Distributions from net investment income | (.31) | (.33) | (.49) | (.48) | (.89) |
Distributions from net realized gain | - | - | (.02) | (2.21) | (3.22) |
Total distributions | (.31) | (.33) | (.51) | (2.69) | (4.11) |
Redemption fees added to paid in capital C,G | - | - | - | - | - |
Net asset value, end of period | $ 18.97 | $ 16.77 | $ 13.15 | $ 23.85 | $ 26.15 |
Total Return A,B | 15.04% | 30.09% | (42.71)% | 1.39% | 20.04% |
Ratios to Average Net Assets D,F | | | | | |
Expenses before reductions | .65% | .68% | .66% | .66% | .69% |
Expenses net of fee waivers, if any | .64% | .68% | .66% | .66% | .69% |
Expenses net of all reductions | .64% | .68% | .66% | .66% | .69% |
Net investment income (loss) | 1.62% | 2.19% | 2.28% | 1.60% | 1.63% |
Supplemental Data | | | | | |
Net assets, end of period (000 omitted) | $ 165,946 | $ 147,358 | $ 122,483 | $ 230,534 | $ 170,050 |
Portfolio turnover rate E | 29% | 29% | 34% | 20% | 22% |
A Total returns do not reflect charges attributable to your insurance company's separate account. Inclusion of these charges would reduce the total returns shown.
B Total returns would have been lower had certain expenses not been reduced during the periods shown.
C Calculated based on average shares outstanding during the period.
D Fees and expenses of the underlying Fidelity Central Funds are not included in the Fund's expense ratio. The Fund indirectly bears its proportionate share of the expenses of any underlying Fidelity Central Funds.
E Amount does not include the portfolio activity of any underlying Fidelity Central Funds.
F Expense ratios reflect operating expenses of the class. Expenses before reductions do not reflect amounts reimbursed by the investment adviser or reductions from brokerage service arrangements or reductions from other expense offset arrangements and do not represent the amount paid by the class during periods when reimbursements or reductions occur. Expenses net of fee waivers reflect expenses after reimbursement by the investment adviser but prior to reductions from brokerage service arrangements or other expense offset arrangements. Expenses net of all reductions represent the net expenses paid by the class.
G Amount represents less than $.01 per share.
See accompanying notes which are an integral part of the financial statements.
Annual Report
Notes to Financial Statements
For the period ended December 31, 2010
1. Organization.
VIP Equity-Income Portfolio (the Fund) is a fund of Variable Insurance Products Fund (the Trust) and is authorized to issue an unlimited number of shares. The Trust is registered under the Investment Company Act of 1940, as amended (the 1940 Act), as an open-end management investment company organized as a Massachusetts business trust. Shares of the Fund may only be purchased by insurance companies for the purpose of funding variable annuity or variable life insurance contracts. The Fund offers the following classes of shares: Initial Class shares, Service Class shares, Service Class 2 shares, Service Class 2R shares, and Investor Class shares. All classes have equal rights and voting privileges, except for matters affecting a single class. Investment income, realized and unrealized capital gains and losses, the common expenses of the Fund, and certain fund-level expense reductions, if any, are allocated on a pro-rata basis to each class based on the relative net assets of each class to the total net assets of the Fund. Each class differs with respect to transfer agent and distribution and service plan fees incurred. Certain expense reductions may also differ by class.
2. Investments in Fidelity Central Funds.
The Fund may invest in Fidelity Central Funds, which are open-end investment companies available only to other investment companies and accounts managed by Fidelity Management & Research Company (FMR) and its affiliates. The Fund's Schedule of Investments lists each of the Fidelity Central Funds held as of period end, if any, as an investment of the Fund, but does not include the underlying holdings of each Fidelity Central Fund. As an Investing Fund, the Fund indirectly bears its proportionate share of the expenses of the underlying Fidelity Central Funds.
The Money Market Central Funds seek preservation of capital and current income and are managed by Fidelity Investments Money Management, Inc. (FIMM), an affiliate of FMR.
A complete unaudited list of holdings for each Fidelity Central Fund is available upon request or at the Securities and Exchange Commission (the SEC) web site at www.sec.gov. In addition, the financial statements of the Fidelity Central Funds, which are not covered by the Fund's Report of Independent Registered Public Accounting Firm, are available on the SEC web site or upon request.
3. Significant Accounting Policies.
The financial statements have been prepared in conformity with accounting principles generally accepted in the United States of America (GAAP), which require management to make certain estimates and assumptions at the date of the financial statements. Actual results could differ from those estimates. Subsequent events, if any, through the date that the financial statements were issued have been evaluated in the preparation of the financial statements. The following summarizes the significant accounting policies of the Fund:
Security Valuation. Investments are valued as of 4:00 p.m. Eastern time on the last calendar day of the period. The Fund uses independent pricing services approved by the Board of Trustees to value its investments. When current market prices or quotations are not readily available or reliable, valuations may be determined in good faith in accordance with procedures adopted by the Board of Trustees. Factors used in determining value may include market or security specific events, changes in interest rates and credit quality. The frequency with which these procedures are used cannot be predicted and they may be utilized to a significant extent. The value used for net asset value (NAV) calculation under these procedures may differ from published prices for the same securities.
The Fund categorizes the inputs to valuation techniques used to value its investments into a disclosure hierarchy consisting of three levels as shown below.
Level 1 - quoted prices in active markets for identical investments
Level 2 - other significant observable inputs (including quoted prices for similar investments, interest rates, prepayment speeds, etc.)
Level 3 - unobservable inputs (including the Fund's own assumptions based on the best information available)
Changes in valuation techniques may result in transfers in or out of an assigned level within the disclosure hierarchy. The aggregate value of investments by input level, as of December 31, 2010, is included at the end of the Fund's Schedule of Investments. Valuation techniques used to value the Fund's investments by major category are as follows.
Equity securities, including restricted securities, for which market quotations are readily available, are valued at the last reported sale price or official closing price as reported by an independent pricing service on the primary market or exchange on which they are traded and are categorized as Level 1 in the hierarchy. In the event there were no sales during the day or closing prices are not available, securities are valued at the last quoted bid price or may be valued using the last available price and are generally categorized as Level 2 in the hierarchy. For foreign equity securities, when significant market or security specific events arise, comparisons to the valuation of American Depositary Receipts (ADRs), futures contracts, Exchange-traded funds (ETFs) and certain indexes as well as quoted prices for similar securities are used and are categorized as Level 2 in the hierarchy in these circumstances. Utilizing these techniques may result in transfers between Level 1 and Level 2. For restricted equity securities and private placements where observable inputs are limited, assumptions about market activity and risk are used and are categorized as Level 3 in the hierarchy.
Annual Report
3. Significant Accounting Policies - continued
Security Valuation - continued
Debt securities, including restricted securities, are valued based on evaluated prices received from independent pricing services or from dealers who make markets in such securities. For corporate bonds, pricing services utilize matrix pricing which considers yield or price of bonds of comparable quality, coupon, maturity and type as well as dealer supplied prices and are generally categorized as Level 2 in the hierarchy.
Investments in open-end mutual funds, including the Fidelity Central Funds, are valued at their closing net asset value each business day and are categorized as Level 1 in the hierarchy.
When independent prices are unavailable or unreliable, debt securities may be valued utilizing pricing matrices which consider similar factors that would be used by independent pricing services. These are generally categorized as Level 2 in the hierarchy but may be Level 3 depending on the circumstances.
Foreign Currency. The Fund uses foreign currency contracts to facilitate transactions in foreign-denominated securities. Gains and losses from these transactions may arise from changes in the value of the foreign currency or if the counterparties do not perform under the contracts' terms.
Foreign-denominated assets, including investment securities, and liabilities are translated into U.S. dollars at the exchange rate at period end. Purchases and sales of investment securities, income and dividends received and expenses denominated in foreign currencies are translated into U.S. dollars at the exchange rate in effect on the transaction date.
The effects of exchange rate fluctuations on investments are included with the net realized and unrealized gain (loss) on investment securities. Other foreign currency transactions resulting in realized and unrealized gain (loss) are disclosed separately.
Investment Transactions and Income. For financial reporting purposes, the Fund's investment holdings and NAV include trades executed through the end of the last business day of the period. The NAV per share for processing shareholder transactions is calculated as of the close of business of the New York Stock Exchange (NYSE), normally 4:00 p.m. Eastern time and includes trades executed through the end of the prior business day. Gains and losses on securities sold are determined on the basis of identified cost and may include proceeds received from litigation. Dividend income is recorded on the ex-dividend date, except for certain dividends from foreign securities where the ex-dividend date may have passed, which are recorded as soon as the Fund is informed of the ex-dividend date. Non-cash dividends included in dividend income, if any, are recorded at the fair market value of the securities received. Distributions received on securities that represent a return of capital or capital gain are recorded as a reduction of cost of investments and/or as a realized gain. The Fund estimates the components of distributions received that may be considered return of capital distributions or capital gain distributions. Interest income and distributions from the Fidelity Central Funds are accrued as earned. Interest income includes coupon interest and amortization of premium and accretion of discount on debt securities. Investment income is recorded net of foreign taxes withheld where recovery of such taxes is uncertain.
Expenses. Expenses directly attributable to a fund are charged to that fund. Expenses attributable to more than one fund are allocated among the respective funds on the basis of relative net assets or other appropriate methods. Expense estimates are accrued in the period to which they relate and adjustments are made when actual amounts are known.
Deferred Trustee Compensation. Under a Deferred Compensation Plan (the Plan), independent Trustees may elect to defer receipt of a portion of their annual compensation. Deferred amounts are invested in a cross-section of Fidelity funds, are marked-to-market and remain in the Fund until distributed in accordance with the Plan. The investment of deferred amounts and the offsetting payable to the Trustees are included in the accompanying Statement of Assets and Liabilities.
Income Tax Information and Distributions to Shareholders. Each year the Fund intends to qualify as a regulated investment company, including distributing substantially all of its taxable income and realized gains under Subchapter M of the Internal Revenue Code and filing its U.S. federal tax return. As a result, no provision for income taxes is required. As of December 31, 2010, the Fund did not have any unrecognized tax benefits in the accompanying financial statements. A fund's federal tax return is subject to examination by the Internal Revenue Service (IRS) for a period of three years. Foreign taxes are provided for based on the Fund's understanding of the tax rules and rates that exist in the foreign markets in which it invests.
Distributions are declared and recorded on the ex-dividend date. Income dividends and capital gain distributions are declared separately for each class. Income and capital gain distributions are determined in accordance with income tax regulations, which may differ from GAAP.
Capital accounts within the financial statements are adjusted for permanent book-tax differences. These adjustments have no impact on net assets or the results of operations. Temporary book-tax differences will reverse in a subsequent period.
Book-tax differences are primarily due to foreign currency transactions, certain foreign taxes, market discount, deferred trustees compensation, capital loss carryforwards and losses deferred due to wash sales.
Annual Report
Notes to Financial Statements - continued
3. Significant Accounting Policies - continued
Income Tax Information and Distributions to Shareholders - continued
The federal tax cost of investment securities and unrealized appreciation (depreciation) as of period end were as follows:
Gross unrealized appreciation | $ 1,311,972,907 |
Gross unrealized depreciation | (866,844,462) |
Net unrealized appreciation (depreciation) | $ 445,128,445 |
Tax Cost | $ 5,561,361,748 |
The tax-based components of distributable earnings as of period end were as follows:
Capital loss carryforward | $ (168,007,461) |
Net unrealized appreciation (depreciation) | $ 445,174,417 |
The tax character of distributions paid was as follows:
| December 31, 2010 | December 31, 2009 |
Ordinary Income | $ 98,879,089 | $ 115,095,209 |
Trading (Redemption) Fees. Service Class 2R shares held by investors less than 60 days are subject to a redemption fee equal to 1% of the net asset value of shares redeemed. All redemption fees, which reduce the proceeds of the shareholder redemption, are retained by the Fund and accounted for as an addition to paid in capital.
4. Operating Policies.
Restricted Securities. The Fund may invest in securities that are subject to legal or contractual restrictions on resale. These securities generally may be resold in transactions exempt from registration or to the public if the securities are registered. Disposal of these securities may involve time-consuming negotiations and expense, and prompt sale at an acceptable price may be difficult. Information regarding restricted securities is included at the end of the Fund's Schedule of Investments.
5. Purchases and Sales of Investments.
Purchases and sales of securities, other than short-term securities, aggregated $1,645,368,856 and $2,315,535,549, respectively.
6. Fees and Other Transactions with Affiliates.
Management Fee. FMR and its affiliates provide the Fund with investment management related services for which the Fund pays a monthly management fee. The management fee is the sum of an individual fund fee rate that is based on an annual rate of .20% of the Fund's average net assets and a group fee rate that averaged .26% during the period. The group fee rate is based upon the average net assets of all the mutual funds advised by FMR. The group fee rate decreases as assets under management increase and increases as assets under management decrease. For the period, the total annual management fee rate was .46% of the Fund's average net assets.
Distribution and Service Plan Fees. In accordance with Rule 12b-1 of the 1940 Act, the Fund has adopted separate 12b-1 Plans for each Service Class of shares. Each Service Class pays Fidelity Distributors Corporation (FDC), an affiliate of FMR, a service fee. For the period, the service fee is based on an annual rate of .10% of Service Class' average net assets and .25% of Service Class 2's and Service Class 2R's average net assets.
For the period, total fees, all of which were re-allowed to insurance companies for the distribution of shares and providing shareholder support services were as follows:
Service Class | $ 408,532 |
Service Class 2 | 3,821,620 |
Service Class 2R | 13,739 |
| $ 4,243,891 |
Annual Report
6. Fees and Other Transactions with Affiliates - continued
Transfer Agent Fees. Fidelity Investments Institutional Operations Company, Inc. (FIIOC), an affiliate of FMR, is the Fund's transfer, dividend disbursing, and shareholder servicing agent. FIIOC receives an asset-based fee with respect to each class. Each class (with the exception of Investor Class) pays a transfer agent fee, excluding out of pocket expenses, equal to an annual rate of .07% of average net assets. Investor Class pays a monthly asset-based transfer agent fee of .15% of average net assets. In addition, FIIOC receives an asset-based fee of .01% of average net assets for typesetting, printing and mailing of shareholder reports, except proxy statements. FIIOC has agreed to voluntarily waive this fee until December 31, 2010 (See Note 10: Expense Reductions.) For the period, transfer agent fees for each class, including printing and out of pocket expenses, were as follows:
Initial Class | $ 2,741,443 |
Service Class | 306,678 |
Service Class 2 | 1,152,436 |
Service Class 2R | 4,090 |
Investor Class | 241,751 |
| $ 4,446,398 |
Accounting and Security Lending Fees. Fidelity Service Company, Inc. (FSC), an affiliate of FMR, maintains the Fund's accounting records. The accounting fee is based on the level of average net assets for the month. Under a separate contract, FSC administers the security lending program. The security lending fee is based on the number and duration of lending transactions.
Brokerage Commissions. The Fund placed a portion of its portfolio transactions with brokerage firms which are affiliates of the investment adviser. The commissions paid to these affiliated firms were $21,052 for the period.
Interfund Lending Program. Pursuant to an Exemptive Order issued by the SEC, the Fund, along with other registered investment companies having management contracts with FMR, may participate in an interfund lending program. This program provides an alternative credit facility allowing the funds to borrow from, or lend money to, other participating affiliated funds. At period end, there were no interfund loans outstanding. The Fund's activity in this program during the period for which loans were outstanding was as follows:
Borrower or Lender | Average Daily
Loan Balance | Weighted Average Interest Rate | Interest
Expense |
Borrower | $ 10,269,037 | .45% | $ 6,877 |
7. Committed Line of Credit.
The Fund participates with other funds managed by FMR or an affiliate in a $3.75 billion credit facility (the "line of credit") to be utilized for temporary or emergency purposes to fund shareholder redemptions or for other short-term liquidity purposes. The Fund has agreed to pay commitment fees on its pro-rata portion of the line of credit, which amounted to $22,836 and is reflected in Miscellaneous expenses on the Statement of Operations. During the period, there were no borrowings on this line of credit.
8. Security Lending.
The Fund lends portfolio securities through a lending agent from time to time in order to earn additional income. The lending agent may loan securities to certain qualified borrowers, including Fidelity Capital Markets (FCM), a broker-dealer affiliated with the Fund. On the settlement date of the loan, the Fund receives collateral (in the form of U.S. Treasury obligations, letters of credit and/or cash) against the loaned securities and maintains collateral in an amount not less than 100% of the market value of the loaned securities during the period of the loan. The market value of the loaned securities is determined at the close of business of the Fund and any additional required collateral is delivered to the Fund on the next business day. If the borrower defaults on its obligation to return the securities loaned because of insolvency or other reasons, a fund could experience delays and costs in recovering the securities loaned or in gaining access to the collateral. Any cash collateral received is invested in the Fidelity Securities Lending Cash Central Fund. The value of loaned securities and cash collateral at period end are disclosed on the Fund's Statement of Assets and Liabilities. Security lending income represents the income earned on investing cash collateral, less rebates paid to borrowers and lending agent fees associated with the loan, plus any premium payments received for lending certain types of securities. Security lending income is presented in the Statement of Operations as a component of income from Fidelity Central Funds. Total security lending income during the period amounted to $800,893. During the period, there were no securities loaned to FCM.
9. Bank Borrowings.
The Fund is permitted to have bank borrowings for temporary or emergency purposes to fund shareholder redemptions. The Fund has established borrowing arrangements with certain banks. The interest rate on the borrowings is the bank's base rate, as revised from time to time. The average daily loan balance during the period for which loans were outstanding amounted to $9,231,000. The weighted average interest rate was .70%. The interest expense amounted to $179 under the bank borrowing program. At period end, there were no bank borrowings outstanding.
Annual Report
Notes to Financial Statements - continued
10. Expense Reductions.
FMR or its affiliates agreed to waive certain fees during the period as noted in the table below.
Initial Class | $ 264,507 |
Service Class | 29,610 |
Service Class 2 | 110,854 |
Service Class 2R | 399 |
Investor Class | 10,794 |
| $ 416,164 |
Many of the brokers with whom FMR places trades on behalf of the Fund provided services to the Fund in addition to trade execution. These services included payments of certain expenses on behalf of the Fund totaling $159,090 for the period.
11. Distributions to Shareholders.
Distributions to shareholders of each class were as follows:
Years ended December 31, | 2010 | 2009 |
From net investment income | | |
Initial Class | $ 64,973,877 | $ 75,517,681 |
Service Class | 6,737,480 | 8,350,109 |
Service Class 2 | 24,391,968 | 28,318,758 |
Service Class 2R | 80,537 | 96,589 |
Investor Class | 2,695,227 | 2,812,072 |
Total | $ 98,879,089 | $ 115,095,209 |
12. Share Transactions.
Transactions for each class of shares were as follows:
| Shares | Dollars |
Years ended December 31, | 2010 | 2009 | 2010 | 2009 |
Initial Class | | | | |
Shares sold | 4,740,512 | 8,717,811 | $ 82,331,514 | $ 119,199,048 |
Reinvestment of distributions | 3,504,835 | 4,649,155 | 64,973,877 | 75,517,681 |
Shares redeemed | (32,979,175) | (41,112,018) | (570,621,114) | (560,835,381) |
Net increase (decrease) | (24,733,828) | (27,745,052) | $ (423,315,723) | $ (366,118,652) |
Service Class | | | | |
Shares sold | 702,398 | 1,374,191 | $ 12,089,968 | $ 18,756,098 |
Reinvestment of distributions | 364,809 | 516,788 | 6,737,480 | 8,350,109 |
Shares redeemed | (4,898,823) | (7,035,493) | (84,563,059) | (95,421,754) |
Net increase (decrease) | (3,831,616) | (5,144,514) | $ (65,735,611) | $ (68,315,547) |
Service Class 2 | | | | |
Shares sold | 6,065,151 | 9,883,762 | $ 102,701,453 | $ 131,168,937 |
Reinvestment of distributions | 1,335,936 | 1,771,906 | 24,391,968 | 28,318,758 |
Shares redeemed | (15,068,707) | (19,265,158) | (257,524,680) | (264,471,751) |
Net increase (decrease) | (7,667,620) | (7,609,490) | $ (130,431,259) | $ (104,984,056) |
Service Class 2R | | | | |
Shares sold | 174,505 | 65,422 | $ 2,953,931 | $ 914,849 |
Reinvestment of distributions | 4,431 | 6,094 | 80,537 | 96,589 |
Shares redeemed | (208,193) | (165,320) | (3,392,012) | (2,222,121) |
Net increase (decrease) | (29,257) | (93,804) | $ (357,544) | $ (1,210,683) |
Investor Class | | | | |
Shares sold | 1,468,527 | 1,142,867 | $ 25,723,911 | $ 16,328,956 |
Reinvestment of distributions | 145,666 | 173,430 | 2,695,227 | 2,812,072 |
Shares redeemed | (1,656,459) | (1,842,484) | (28,469,151) | (24,481,577) |
Net increase (decrease) | (42,266) | (526,187) | $ (50,013) | $ (5,340,549) |
Annual Report
13. Other.
The Fund's organizational documents provide former and current trustees and officers with a limited indemnification against liabilities arising in connection with the performance of their duties to the Fund. In the normal course of business, the Fund may also enter into contracts that provide general indemnifications. The Fund's maximum exposure under these arrangements is unknown as this would be dependent on future claims that may be made against the Fund. The risk of material loss from such claims is considered remote.
At the end of the period, FMR or its affiliates were the owners of record of 12% of the total outstanding shares of the Fund and two otherwise unaffiliated shareholders were the owners of record of 31% of the total outstanding shares of the Fund.
Annual Report
Report of Independent Registered Public Accounting Firm
To the Trustees of Variable Insurance Products Fund and the Shareholders of VIP Equity-Income Portfolio:
In our opinion, the accompanying statement of assets and liabilities, including the schedule of investments, and the related statements of operations and of changes in net assets and the financial highlights present fairly, in all material respects, the financial position of VIP Equity-Income Portfolio (a fund of Variable Insurance Products Fund) at December 31, 2010, the results of its operations for the year then ended, the changes in its net assets for each of the two years in the period then ended and the financial highlights for each of the five years in the period then ended, in conformity with accounting principles generally accepted in the United States of America. These financial statements and financial highlights (hereafter referred to as "financial statements") are the responsibility of the VIP Equity-Income Portfolio's management. Our responsibility is to express an opinion on these financial statements based on our audits. We conducted our audits of these financial statements in accordance with the standards of the Public Company Accounting Oversight Board (United States). Those standards require that we plan and perform the audit to obtain reasonable assurance about whether the financial statements are free of material misstatement. An audit includes examining, on a test basis, evidence supporting the amounts and disclosures in the financial statements, assessing the accounting principles used and significant estimates made by management, and evaluating the overall financial statement presentation. We believe that our audits, which included confirmation of securities at December 31, 2010 by correspondence with the custodian and brokers, provide a reasonable basis for our opinion.
/s/ PricewaterhouseCoopers LLP
PricewaterhouseCoopers LLP
Boston, Massachusetts
February 15, 2011
Annual Report
The Trustees, Members of the Advisory Board, and executive officers of the trust and fund, as applicable, are listed below. The Board of Trustees governs the fund and is responsible for protecting the interests of shareholders. The Trustees are experienced executives who meet periodically throughout the year to oversee the fund's activities, review contractual arrangements with companies that provide services to the fund, oversee management of the risks associated with such activities and contractual arrangements, and review the fund's performance. Except for James C. Curvey, each of the Trustees oversees 219 funds advised by FMR or an affiliate. Mr. Curvey oversees 408 funds advised by FMR or an affiliate.
The Trustees hold office without limit in time except that (a) any Trustee may resign; (b) any Trustee may be removed by written instrument, signed by at least two-thirds of the number of Trustees prior to such removal; (c) any Trustee who requests to be retired or who has become incapacitated by illness or injury may be retired by written instrument signed by a majority of the other Trustees; and (d) any Trustee may be removed at any special meeting of shareholders by a two-thirds vote of the outstanding voting securities of the trust. Each Trustee who is not an interested person (as defined in the 1940 Act) (Independent Trustee), shall retire not later than the last day of the calendar year in which his or her 72nd birthday occurs. The Independent Trustees may waive this mandatory retirement age policy with respect to individual Trustees. The executive officers and Advisory Board Members hold office without limit in time, except that any officer and Advisory Board Member may resign or may be removed by a vote of a majority of the Trustees at any regular meeting or any special meeting of the Trustees. Except as indicated, each individual has held the office shown or other offices in the same company for the past five years.
Experience, Skills, Attributes, and Qualifications of the Fund's Trustees. The Governance and Nominating Committee has adopted a statement of policy that describes the experience, qualifications, attributes, and skills that are necessary and desirable for potential Independent Trustee candidates (Statement of Policy). The Board believes that each Trustee satisfied at the time he or she was initially elected or appointed a Trustee, and continues to satisfy, the standards contemplated by the Statement of Policy. The Governance and Nominating Committee also engages professional search firms to help identify potential Independent Trustee candidates who have the experience, qualifications, attributes, and skills consistent with the Statement of Policy. From time to time, additional criteria based on the composition and skills of the current Independent Trustees, as well as experience or skills that may be appropriate in light of future changes to board composition, business conditions, and regulatory or other developments, have also been considered by the professional search firms and the Governance and Nominating Committee. In addition, the Board takes into account the Trustees' commitment and participation in Board and committee meetings, as well as their leadership of standing and ad hoc committees throughout their tenure.
In determining that a particular Trustee was and continues to be qualified to serve as a Trustee, the Board has considered a variety of criteria, none of which, in isolation, was controlling. The Board believes that, collectively, the Trustees have balanced and diverse experience, qualifications, attributes, and skills, which allow the Board to operate effectively in governing the fund and protecting the interests of shareholders. Information about the specific experience, skills, attributes, and qualifications of each Trustee, which in each case led to the Board's conclusion that the Trustee should serve (or continue to serve) as a trustee of the fund, is provided below.
Board Structure and Oversight Function. James C. Curvey is an interested person (as defined in the 1940 Act) and currently serves as Acting Chairman. The Trustees have determined that an interested Chairman is appropriate and benefits shareholders because an interested Chairman has a personal and professional stake in the quality and continuity of services provided to the fund. Independent Trustees exercise their informed business judgment to appoint an individual of their choosing to serve as Chairman, regardless of whether the Trustee happens to be independent or a member of management. The Independent Trustees have determined that they can act independently and effectively without having an Independent Trustee serve as Chairman and that a key structural component for assuring that they are in a position to do so is for the Independent Trustees to constitute a substantial majority for the Board. The Independent Trustees also regularly meet in executive session. Ned C. Lautenbach serves as Chairman of the Independent Trustees and as such (i) acts as a liaison between the Independent Trustees and management with respect to matters important to the Independent Trustees and (ii) with management prepares agendas for Board meetings.
Fidelity funds are overseen by different Boards of Trustees. The fund's Board oversees Fidelity's equity and high income funds and another Board oversees Fidelity's investment-grade bond, money market, and asset allocation funds. The asset allocation funds may invest in Fidelity funds overseen by the fund's Board. The use of separate Boards, each with its own committee structure, allows the Trustees of each group of Fidelity funds to focus on the unique issues of the funds they oversee, including common research, investment, and operational issues. On occasion, the separate Boards establish joint committees to address issues of overlapping consequences for the Fidelity funds overseen by each Board.
The Trustees operate using a system of committees to facilitate the timely and efficient consideration of all matters of importance to the Trustees, the fund, and fund shareholders and to facilitate compliance with legal and regulatory requirements and oversight of the fund's activities and associated risks. The Board, acting through its committees, has charged FMR and its affiliates with (i) identifying events or circumstances the occurrence of which could have demonstrably adverse effects on the fund's business and/or reputation; (ii) implementing processes and controls to lessen the possibility that such events or circumstances occur or to mitigate the effects of such events or circumstances if they do occur; and (iii) creating and maintaining a system designed to evaluate continuously business and market conditions in order to facilitate the identification and implementation processes described in (i) and (ii) above. Because the day-to-day operations and activities of the fund are carried out by or through FMR, its affiliates and other service providers, the fund's exposure to risks is mitigated but not eliminated by the processes overseen by the Trustees. While each of the Board's committees has responsibility for overseeing different aspects of the fund's activities, oversight is exercised primarily through the Operations, Audit, and Compliance Committees. Appropriate personnel, including but not limited to the fund's Chief Compliance Officer (CCO), FMR's internal auditor, the independent accountants, the fund's Treasurer and portfolio management personnel, make periodic reports to the Board's committees, as appropriate. The responsibilities of each committee, including their oversight responsibilities, are described further under "Standing Committees of the Fund's Trustees."
Annual Report
Trustees and Officers - continued
The fund's Statement of Additional Information (SAI) includes more information about the Trustees. To request a free copy, call Fidelity at 1-877-208-0098.
Interested Trustees*:
Correspondence intended for each Trustee who is an interested person may be sent to Fidelity Investments, 82 Devonshire Street, Boston, Massachusetts 02109.
Name, Age; Principal Occupations and Other Relevant Experience+ |
James C. Curvey (75) |
| Year of Election or Appointment: 2007 Mr. Curvey is Trustee and Acting Chairman of the Board of Trustees of certain Trusts. Mr. Curvey also serves as Trustee (2007-present) of other investment companies advised by FMR. Mr. Curvey is a Director of Fidelity Investments Money Management, Inc. (2009-
present), Director of Fidelity Research & Analysis Co. (2009-present) and Director of FMR and FMR Co., Inc. (2007-present). Mr. Curvey is also Vice Chairman (2007-present) and Director of FMR LLC. In addition, Mr. Curvey serves as an Overseer for the Boston Symphony Orchestra and a member of the Trustees of Villanova University. Previously, Mr. Curvey was the Vice Chairman (2006-2007) and Director (2000-2007) of FMR Corp. |
Ronald P. O'Hanley (54) |
| Year of Election or Appointment: 2011 Mr. O'Hanley is President of Fidelity Asset Management and Corporate Services and a member of Fidelity's Executive Committee (2010-present). Previously, Mr. O'Hanley served as President and Chief Executive Officer of BNY Mellon Asset Management (2007-2010). Mr. O'Hanley also served as Vice Chairman of Bank New York Mellon Corp. and a member of that firm's Executive Committee. Prior to the 2007 merger of The Bank of New York and Mellon Financial Corporation, he was Vice Chairman of Mellon Financial Corporation and President and Chief Executive Officer of Mellon Asset Management. He joined Mellon in February 1997. Mr. O'Hanley currently serves as Chairman of the Boston Public Library Foundation Board of Directors and sits on the Board of Directors of Beth Israel Deaconess Medical Center, the Board of Trustees of the Marine Biological Laboratory and the Advisory Board of the Maxwell School of Citizenship and Public Administration at Syracuse University. Mr. O'Hanley also chairs the Council on Asset Management for the Financial Services Roundtable and is a member of the Board of Directors of Institutional Investor's U.S. Institute. |
* Trustees have been determined to be "Interested Trustees" by virtue of, among other things, their affiliation with the trust or various entities under common control with FMR.
+ The information above includes each Trustee's principal occupation during the last five years and other information relating to the experience, attributes, and skills relevant to each Trustee's qualifications to serve as a Trustee, which led to the conclusion that each Trustee should serve as a Trustee for the fund.
Independent Trustees:
Correspondence intended for each Independent Trustee (that is, the Trustees other than the Interested Trustees) may be sent to Fidelity Investments, P.O. Box 55235, Boston, Massachusetts 02205-5235.
Name, Age; Principal Occupations and Other Relevant Experience+ |
Dennis J. Dirks (62) |
| Year of Election or Appointment: 2005 Prior to his retirement in May 2003, Mr. Dirks was Chief Operating Officer and a member of the Board of The Depository Trust & Clearing Corporation (DTCC). He also served as President, Chief Operating Officer, and Board member of The Depository Trust Company (DTC) and President and Board member of the National Securities Clearing Corporation (NSCC). In addition, Mr. Dirks served as Chief Executive Officer and Board member of the Government Securities Clearing Corporation, Chief Executive Officer and Board member of the Mortgage-Backed Securities Clearing Corporation, as a Trustee and a member of the Finance Committee of Manhattan College (2005-2008), and as a Trustee and a member of the Finance Committee of AHRC of Nassau County (2006-2008). Mr. Dirks is a member of the Independent Directors Council (IDC) Governing Council (2010-Present) and Board of Directors for The Brookville Center for Children's Services, Inc. (2009-present). |
Alan J. Lacy (57) |
| Year of Election or Appointment: 2008 Mr. Lacy serves as Senior Adviser (2007-present) of Oak Hill Capital Partners, L.P. (private equity). Mr. Lacy also served as Chief Executive Officer (2000-2005) and Vice Chairman (2005-2006) of Sears Holdings Corporation and Sears, Roebuck and Co. (retail). In addition, Mr. Lacy serves as a member of the Board of Directors of The Western Union Company (global money transfer, 2006-present) and Bristol-Myers Squibb Company (global pharmaceuticals, 2007-present). Mr. Lacy is Chairman (2008-present) and a member (2006-present) of the Board of Trustees of The National Parks Conservation Association. |
Ned C. Lautenbach (66) |
| Year of Election or Appointment: 2000 Mr. Lautenbach is Chairman of the Independent Trustees of the Equity and High Income Funds (2006-present). Mr. Lautenbach currently serves as the Lead Director of the Eaton Corporation Board of Directors (diversified industrial, 1997-present). Mr. Lautenbach is also a member of the Board of Directors of the Philharmonic Center for the Arts in Naples, Florida (1999-
present); a member of the Board of Trustees of Fairfield University (2005-present); and a member of the Council on Foreign Relations (1994-present). Previously, Mr. Lautenbach was a Partner/Advisory Partner at Clayton, Dubilier & Rice, Inc. (private equity investment, 1998-2010), as well as a Director of Sony Corporation (2006-2007). |
Joseph Mauriello (66) |
| Year of Election or Appointment: 2008 Prior to his retirement in January 2006, Mr. Mauriello served in numerous senior management positions including Deputy Chairman and Chief Operating Officer (2004-2005), and Vice Chairman of Financial Services (2002-2004) of KPMG LLP US (professional services, 1965-2005). Mr. Mauriello currently serves as a member of the Board of Directors of XL Group plc. (global insurance and re-insurance, 2006-present) and of Arcadia Resources Inc. (health care services and products, 2007-present). Previously, Mr. Mauriello served as a Director of the Hamilton Funds of the Bank of New York (2006-2007). |
Cornelia M. Small (66) |
| Year of Election or Appointment: 2005 Ms. Small is a member of the Board of Directors of the Teagle Foundation (2009-present). Ms. Small is also a member of the Investment Committee, and Chair (2008-present) and a member of the Board of Trustees of Smith College. In addition, Ms. Small serves on the Investment Committee of the Berkshire Taconic Community Foundation (2008-present). Previously, Ms. Small served as Chairperson of the Investment Committee (2002-2008) of Smith College. In addition, Ms. Small served as Chief Investment Officer, Director of Global Equity Investments, and a member of the Board of Directors of Scudder, Stevens & Clark and Scudder Kemper Investments. |
William S. Stavropoulos (71) |
| Year of Election or Appointment: 2001 Mr. Stavropoulos is Vice Chairman of the Independent Trustees of the Equity and High Income Funds (2006-present). Mr. Stavropoulos serves as President and Founder of the Michigan Baseball Foundation, the Great Lakes Loons (2007-present). Mr. Stavropoulos is Chairman Emeritus of the Board of Directors of The Dow Chemical Company, where he previously served in numerous senior management positions, including President, CEO (1995-2000; 2002-2004), Chairman of the Executive Committee (2000-2006), and as a member of the Board of Directors (1990-2006). Currently, Mr. Stavropoulos is Chairman of Univar (global distributor of commodity and specialty chemicals, 2010-present), a Director of Teradata Corporation (data warehousing and technology solutions, 2008-present), Chemical Financial Corporation, Maersk Inc. (industrial conglomerate), Tyco International, Inc. (multinational manufacturing and services, 2007-present), and a member of the Advisory Board for Metalmark Capital (private equity investment, 2005-present). Mr. Stavropoulos is a special advisor to Clayton, Dubilier & Rice, LLC (private equity investment). In addition, Mr. Stavropoulos is a member of the University of Notre Dame Advisory Council for the College of Science. |
David M. Thomas (61) |
| Year of Election or Appointment: 2008 Previously, Mr. Thomas served as Executive Chairman (2005-2006) and Chairman and Chief Executive Officer (2000-2005) of IMS Health, Inc. (pharmaceutical and healthcare information solutions). In addition, Mr. Thomas serves as a member of the Board of Directors of Fortune Brands, Inc. (consumer products), and Interpublic Group of Companies, Inc. (marketing communication, 2004-present). |
Michael E. Wiley (60) |
| Year of Election or Appointment: 2008 Mr. Wiley also serves as a Director of Asia Pacific Exploration Consolidated (international oil and gas exploration and production, 2008-present). Mr. Wiley serves as a Director of Tesoro Corporation (independent oil refiner and marketer, 2005-present), and a Director of Bill Barrett Corporation (exploration and production, 2005-present). In addition, Mr. Wiley also serves as a Director of Post Oak Bank (privately-held bank, 2004-present). Previously, Mr. Wiley served as a member of the Board of Trustees of the University of Tulsa (2000-2006; 2007-2010), as a Senior Energy Advisor of Katzenbach Partners, LLC (consulting, 2006-2007), as an Advisory Director of Riverstone Holdings (private investment), Chairman, President, and CEO of Baker Hughes, Inc. (oilfield services, 2000-2004), and as Director of Spinnaker Exploration Company (exploration and production, 2001-2005). |
+ The information above includes each Trustee's principal occupation during the last five years and other information relating to the experience, attributes, and skills relevant to each Trustee's qualifications to serve as a Trustee, which led to the conclusion that each Trustee should serve as a Trustee for the fund.
Advisory Board Members and Executive Officers:
Correspondence intended for each executive officer, Edward C. Johnson 3d, and Peter S. Lynch may be sent to Fidelity Investments, 82 Devonshire Street, Boston, Massachusetts 02109.
Name, Age; Principal Occupation |
Edward C. Johnson 3d (80) |
| Year of Election or Appointment: 2011 Member of the Advisory Board of Fidelity's Equity and High Income Funds. Formerly Trustee and Chairman of the Board of Trustees of certain Trusts, Mr. Johnson serves as Chief Executive Officer, Chairman, and a Director of FMR LLC; Chairman and a Director of FMR; and Chairman and a Director of FMR Co., Inc. In addition, Mr. Johnson serves as Chairman and Director of FIL Limited. Previously, Mr. Johnson served as President of FMR LLC (2006-2007). |
Peter S. Lynch (66) |
| Year of Election or Appointment: 2003 Member of the Advisory Board of Fidelity's Equity and High Income Funds. Mr. Lynch is Vice Chairman and a Director of FMR and FMR Co., Inc. In addition, Mr. Lynch serves as a Trustee of Boston College and as the Chairman of the Inner-City Scholarship Fund. Previously, Mr. Lynch served on the Special Olympics International Board of Directors (1997-2006). |
Kenneth B. Robins (41) |
| Year of Election or Appointment: 2008 President and Treasurer of Fidelity's Equity and High Income Funds. Mr. Robins also serves as President and Treasurer (2010-
present) and Assistant Treasurer (2009-present) of other Fidelity funds and is an employee of Fidelity Investments (2004-present). Previously, Mr. Robins served as Deputy Treasurer of the Fidelity funds (2005-2008) and Treasurer and Chief Financial Officer of The North Carolina Capital Management Trust: Cash and Term Portfolios (2006-2008). |
Bruce T. Herring (45) |
| Year of Election or Appointment: 2006 Vice President of certain Equity Funds. Mr. Herring also serves as Chief Investment Officer and Director of Fidelity Management & Research (U.K.) Inc. (2010-present) and Group Chief Investments Officer of FMR. Previously, Mr. Herring served as Vice President (2005-2006) and Senior Vice President (2006-2007) of Fidelity Management & Research Company, Vice President of FMR Co., Inc. (2001-2007) and as a portfolio manager for Fidelity U.S. Equity Funds. |
Brian B. Hogan (46) |
| Year of Election or Appointment: 2009 Vice President of certain Equity Funds and Vice President of Sector Funds. Mr. Hogan also serves as President of FMR's Equity Division (2009-present). Previously, Mr. Hogan served as Senior Vice President, Equity Research of FMR (2006-2009) and as a portfolio manager. |
Scott C. Goebel (42) |
| Year of Election or Appointment: 2008 Secretary and Chief Legal Officer (CLO) of the Fidelity funds. Mr. Goebel also serves as Secretary and CLO of The North Carolina Capital Management Trust: Cash and Term Portfolio (2008-present); General Counsel, Secretary, and Senior Vice President of FMR (2008-present) and FMR Co., Inc. (2008-present); Deputy General Counsel of FMR LLC; Chief Legal Officer of Fidelity Management & Research (Hong Kong) Limited (2008-present) and Assistant Secretary of Fidelity Management & Research (Japan) Inc. (2008-present), Fidelity Investments Money Management, Inc. (2008-present), Fidelity Management & Research (U.K.) Inc. (2008-present), and Fidelity Research and Analysis Company (2008-present). Previously, Mr. Goebel served as Assistant Secretary of the Funds (2007-2008) and as Vice President and Secretary of Fidelity Distributors Corporation (FDC) (2005-2007). |
William C. Coffey (41) |
| Year of Election or Appointment: 2009 Assistant Secretary of Fidelity's Equity and High Income Funds. Mr. Coffey also serves as Senior Vice President and Deputy General Counsel of FMR LLC (2010-present), and is an employee of Fidelity Investments. Previously, Mr. Coffey served as Vice President and Associate General Counsel of FMR LLC (2005-2009). |
Holly C. Laurent (56) |
| Year of Election or Appointment: 2008 Anti-Money Laundering (AML) Officer of the Fidelity funds. Ms. Laurent also serves as AML Officer of The North Carolina Capital Management Trust: Cash and Term Portfolio (2008-present) and is an employee of Fidelity Investments. Previously, Ms. Laurent was Senior Vice President and Head of Legal for Fidelity Business Services India Pvt. Ltd. (2006-2008), and Senior Vice President, Deputy General Counsel and Group Head for FMR LLC (2005-2006). |
Christine Reynolds (52) |
| Year of Election or Appointment: 2008 Chief Financial Officer of the Fidelity funds. Ms. Reynolds became President of Fidelity Pricing and Cash Management Services (FPCMS) in August 2008. Ms. Reynolds served as Chief Operating Officer of FPCMS (2007-2008). Previously, Ms. Reynolds served as President, Treasurer, and Anti-Money Laundering officer of the Fidelity funds (2004-2007). |
Kenneth A. Rathgeber (63) |
| Year of Election or Appointment: 2004 Chief Compliance Officer of Fidelity's Equity and High Income Funds. Mr. Rathgeber is Chief Compliance Officer of Fidelity Management & Research (Hong Kong) Limited (2008-present), Fidelity Management & Research (Japan) Inc. (2008-present), FMR (2005-present), FMR Co., Inc. (2005-present), Fidelity Management & Research (U.K.) Inc. (2005-present), Fidelity Research & Analysis Company (2005-present), Fidelity Investments Money Management, Inc. (2005-present), Pyramis Global Advisors, LLC (2005-present), and Strategic Advisers, Inc. (2005-present). |
Jeffrey S. Christian (49) |
| Year of Election or Appointment: 2009 Deputy Treasurer of the Fidelity funds. Mr. Christian is an employee of Fidelity Investments. Previously, Mr. Christian served as Chief Financial Officer (2008-2009) of certain Fidelity funds and Senior Vice President of Fidelity Pricing and Cash Management Services (FPCMS) (2004-2009). |
Bryan A. Mehrmann (49) |
| Year of Election or Appointment: 2005 Deputy Treasurer of the Fidelity funds. Mr. Mehrmann is an employee of Fidelity Investments. |
Adrien E. Deberghes (43) |
| Year of Election or Appointment: 2008 Deputy Treasurer of Fidelity's Equity and High Income Funds. Mr. Deberghes also serves as Assistant Treasurer of other Fidelity funds (2010-present) and is an employee of Fidelity Investments (2008-present). Previously, Mr. Deberghes served as Senior Vice President of Mutual Fund Administration at State Street Corporation (2007-2008), Senior Director of Mutual Fund Administration at Investors Bank & Trust (2005-2007), and Director of Finance for Dunkin' Brands (2000-2005). |
Stephanie J. Dorsey (41) |
| Year of Election or Appointment: 2010 Assistant Treasurer of Fidelity's Equity and High Income Funds. Ms. Dorsey also serves as Deputy Treasurer of other Fidelity funds (2008-present) and is an employee of Fidelity Investments (2008-present). Previously, Ms. Dorsey served as Treasurer (2004-2008) of the JPMorgan Mutual Funds and Vice President (2004-2008) of JPMorgan Chase Bank. |
John R. Hebble (52) |
| Year of Election or Appointment: 2009 Assistant Treasurer of Fidelity's Equity and High Income Funds. Mr. Hebble also serves as Treasurer and Chief Financial Officer of The North Carolina Capital Management Trust: Cash and Term Portfolio (2008-present), President and Treasurer of other Fidelity funds (2008-present) and is an employee of Fidelity Investments. |
Gary W. Ryan (52) |
| Year of Election or Appointment: 2005 Assistant Treasurer of the Fidelity funds. Mr. Ryan is an employee of Fidelity Investments. Previously, Mr. Ryan served as Vice President of Fund Reporting in Fidelity Pricing and Cash Management Services (FPCMS) (1999-2005). |
Jonathan Davis (42) |
| Year of Election or Appointment: 2010 Assistant Treasurer of the Fidelity funds. Mr. Davis is an employee of Fidelity Investments. Previously, Mr. Davis served as Vice President and Associate General Counsel of FMR LLC (2003-2010). |
Annual Report
Initial Class designates 38% and 100%; Service Class designates 38% and 100%; Service Class 2 designates 38% and 100%; and Investor Class designates 38% and 100% of the dividends distributed in February and December respectively, during the fiscal year as qualifying for the dividends-received deduction for corporate shareholders.
Annual Report
Board Approval of Investment Advisory Contracts and Management Fees
VIP Equity-Income Portfolio
Each year, the Board of Trustees, including the Independent Trustees (together, the Board), votes on the renewal of the management contract and sub-advisory agreements (together, the Advisory Contracts) for the fund. The Board, assisted by the advice of fund counsel and Independent Trustees' counsel, requests and considers a broad range of information relevant to the renewal of the Advisory Contracts throughout the year.
The Board meets regularly and considers at each of its meetings factors that are relevant to its annual consideration of the renewal of the fund's Advisory Contracts, including the services and support provided to the fund and its shareholders. The Board has established various standing committees, each composed of Independent Trustees with varying backgrounds, to which the Board has assigned specific subject matter responsibilities in order to enhance effective decision-making by the Board. The Board, acting directly and through its Committees, requests and receives information concerning the annual consideration of the renewal of the fund's Advisory Contracts. The Board also meets as needed to consider matters specifically related to the Board's annual consideration of the renewal of Advisory Contracts. Members of the Board may also meet with trustees of other Fidelity funds through ad hoc joint committees to discuss certain matters relevant to the Fidelity funds.
At its July 2010 meeting, the Board of Trustees, including the Independent Trustees, unanimously determined to renew the fund's Advisory Contracts. In reaching its determination, the Board considered all factors it believed relevant, including (i) the nature, extent, and quality of the services to be provided to the fund and its shareholders (including the investment performance of the fund); (ii) the competitiveness of the fund's management fee and total expenses; (iii) the total costs of the services to be provided by and the profits to be realized by Fidelity from its relationship with the fund; (iv) the extent to which economies of scale would be realized as the fund grows; and (v) whether fee levels reflect these economies of scale, if any, for the benefit of fund shareholders.
In considering whether to renew the Advisory Contracts for the fund, the Board reached a determination, with the assistance of fund counsel and Independent Trustees' counsel and through the exercise of its business judgment, that the renewal of the Advisory Contracts is in the best interests of fund shareholders and that the compensation to be received by Fidelity under the management contract is fair and reasonable. The Board's decision to renew the Advisory Contracts was not based on any single factor noted above, but rather was based on a comprehensive consideration of all the information provided to the Board at its meetings throughout the year. The Board, in reaching its determination to renew the Advisory Contracts, is aware that shareholders in the fund have a broad range of investment choices available to them, including a wide choice among mutual funds offered by Fidelity's competitors, and that the fund's shareholders, with the opportunity to review and weigh the disclosure provided by the fund in its prospectus and other public disclosures, have chosen to invest in this fund, managed by Fidelity.
Nature, Extent, and Quality of Services Provided. The Board considered the staffing within the investment adviser, FMR, and the sub-advisers (together, the Investment Advisers), including the backgrounds of the fund's investment personnel and the fund's investment objective and discipline. The Independent Trustees also had discussions with senior management of Fidelity's investment operations and investment groups. The Board considered the structure of the portfolio manager compensation program and whether this structure provides appropriate incentives to act in the best interest of the fund.
Resources Dedicated to Investment Management and Support Services. The Board and the equity research subcommittee of the Board's Fund Oversight Committee reviewed the size, education, and experience of the Investment Advisers' investment staff, their use of technology, and the Investment Advisers' approach to recruiting, training, and retaining portfolio managers and other research, advisory, and management personnel. The Board noted that Fidelity's analysts have access to a variety of technological tools and market and securities data that enable them to perform both fundamental and quantitative analysis and to specialize in various disciplines. The Board considered Fidelity's extensive global research capabilities that enable the Investment Advisers to aggregate data from various sources in an effort to produce positive investment results. The Board also considered that Fidelity's portfolio managers and analysts have access to daily portfolio attribution that allows for monitoring of a fund's portfolio, as well as an electronic communication system that provides immediate real-time access to research concerning issuers and credit enhancers. The Board noted FMR's continued focus on strengthening the organization and discipline of equity portfolio management and research.
Shareholder and Administrative Services. The Board considered (i) the nature, extent, quality, and cost of advisory, administrative, and shareholder services performed by the Investment Advisers and their affiliates under the Advisory Contracts and under separate agreements covering transfer agency, pricing and bookkeeping, and securities lending services for the fund; (ii) the nature and extent of the investment adviser's supervision of third party service providers, principally custodians and subcustodians; and (iii) the resources devoted to, and the record of compliance with, the fund's compliance policies and procedures. The Board also reviewed the allocation of fund brokerage, including allocations to brokers affiliated with the Investment Advisers, the use of brokerage commissions to pay fund expenses, and the use of "soft" commission dollars to pay for research services.
The Board noted that the growth of fund assets over time across the complex allows Fidelity to reinvest in the development of services designed to enhance the value or convenience of the Fidelity funds as investment vehicles. These services include 24-hour access to account information and market information through phone representatives and over the Internet, and investor education materials and asset allocation tools.
Investment in a Large Fund Family. The Board considered the benefits to shareholders of investing in a Fidelity fund, including the benefits of investing in a fund that is part of a large family of funds offering a variety of investment disciplines and providing a large variety of mutual fund investor services. The Board noted that Fidelity had taken, or had made recommendations that resulted in the Fidelity funds taking, a number of actions over the previous year that benefited particular funds, including (i) dedicating additional resources to investment research and restructuring and broadening the focus of the investment research teams; (ii) bolstering the senior management team that oversees asset management; (iii) launching Class F of certain funds as a lower-fee class available to Freedom K and Freedom Index Funds; (iv) lowering the initial investment minimums and ongoing balance requirements for Real Estate High Income Fund; (v) eliminating subsequent purchase minimums for all funds and adding a waiver of the investment minimum requirement for new accounts opened with the proceeds of a systematic withdrawal plan; (vi) eliminating the withdrawal minimum and maximum limits for systematic withdrawals from Advisor funds; (vii) expanding sales load waivers on Class A shares for Destiny Planholders and expanding Institutional Class eligibility for Class O Destiny Planholders; and (viii) changing certain Class A and Class T sales charge structures to further align them with industry practices.
Annual Report
Investment Performance. The Board considered whether the fund has operated in accordance with its investment objective, as well as its record of compliance with its investment restrictions. It also reviewed the fund's absolute investment performance for each class, as well as the fund's relative investment performance for each class measured over multiple periods against (i) a broad-based securities market index, and (ii) a peer group of mutual funds deemed appropriate by Fidelity and reviewed by the Board. The following charts considered by the Board show, over the one-, three-, and five-year periods ended December 31, 2009, the cumulative total returns of Initial Class and Service Class 2 of the fund, the cumulative total returns of a broad-based securities market index ("benchmark"), and a range of cumulative total returns of a peer group of mutual funds identified by Lipper Inc. as having an investment objective similar to that of the fund. The returns of Initial Class and Service Class 2 show the performance of the highest and lowest performing classes, respectively (based on five-year performance). The box within each chart shows the 25th percentile return (bottom of box) and the 75th percentile return (top of box) of the peer group. Returns shown above the box are in the first quartile and returns shown below the box are in the fourth quartile. The percentage beaten numbers noted below each chart correspond to the percentile box and represent the percentage of funds in the peer group whose performance was equal to or lower than that of the class indicated.
VIP Equity-Income Portfolio

The Board reviewed the fund's relative investment performance against its peer group and noted that the performance of Initial Class of the fund was in the first quartile for the one-year period and the fourth quartile for the three- and five-year periods. The Board also noted that the investment performance of Initial Class of the fund compared favorably to its benchmark for the one- and three-year periods, although the fund's five-year cumulative total return was lower than its benchmark. The Board considered that the variations in performance among the fund's classes reflect the variations in class expenses, which result in lower performance for higher expense classes. The Board also reviewed the fund's performance since inception as well as performance in the current year.
Based on its review, and giving particular weight to the nature and quality of the resources dedicated by the Investment Advisers to maintain and improve relative performance and factoring in the unprecedented market events in recent years, the Board concluded that the nature, extent, and quality of investment management and support services and of shareholder and administrative services provided to the fund will benefit the fund's shareholders, particularly in light of the Board's view that the fund's shareholders benefit from investing in a fund that is part of a large family of funds offering a variety of investment disciplines and services.
Competitiveness of Management Fee and Total Fund Expenses. The Board considered the fund's management fee and total expenses compared to "mapped groups" of competitive funds and classes. Fidelity creates "mapped groups" by combining similar Lipper investment objective categories that have comparable management fee characteristics. Combining Lipper investment objective categories aids the Board's management fee and total expense comparisons by broadening the competitive group used for comparison and by reducing the number of universes to which various Fidelity funds are compared.
Annual Report
Board Approval of Investment Advisory Contracts and Management Fees - continued
Management Fee. The Board considered two proprietary management fee comparisons for the 12-month periods shown in the chart below. The group of Lipper funds used by the Board for management fee comparisons is referred to below as the "Total Mapped Group." The Total Mapped Group is broader than the Lipper peer group used by the Board for performance comparisons because the Total Mapped Group combines several Lipper investment objective categories while the Lipper peer group does not. The Total Mapped Group comparison focuses on a fund's standing relative to the total universe of comparable funds available to investors, in terms of gross management fees before expense reimbursements or caps. "TMG %" represents the percentage of funds in the Total Mapped Group that had management fees that were lower than the fund's. For example, a TMG % of 14% means that 86% of the funds in the Total Mapped Group had higher management fees than the fund. The "Asset-Size Peer Group" (ASPG) comparison focuses on a fund's standing relative to non-Fidelity funds similar in size to the fund within the Total Mapped Group. The ASPG represents at least 15% of the funds in the Total Mapped Group with comparable asset size and management fee characteristics, subject to a minimum of 50 funds (or all funds in the Total Mapped Group if fewer than 50). Additional information, such as the ASPG quartile in which the fund's management fee ranked, is also included in the chart and considered by the Board.
VIP Equity-Income Portfolio

The Board noted that the fund's management fee ranked below the median of its Total Mapped Group and below the median of its ASPG for 2009.
Based on its review, the Board concluded that the fund's management fee is fair and reasonable in light of the services that the fund receives and the other factors considered.
Total Expenses. In its review of each class's total expenses, the Board considered the fund's management fee as well as other fund or class expenses, as applicable, such as transfer agent fees, pricing and bookkeeping fees, fund-paid 12b-1 fees, and custodial, legal, and audit fees. The Board also noted the effects of any waivers and reimbursements on fees and expenses. As part of its review, the Board also considered current and historical total expenses of each class of the fund compared to competitive fund median expenses. Each class of the fund is compared to those funds and classes in the Total Mapped Group (used by the Board for management fee comparisons) that have a similar sales load structure.
The Board noted that the total expenses of each class ranked below its competitive median for 2009.
Fees Charged to Other Fidelity Clients. The Board also considered Fidelity fee structures and other information with respect to clients of FMR and its affiliates, such as other mutual funds advised or subadvised by FMR or its affiliates, pension plan clients, and other institutional clients. In March 2010, the Board created an ad hoc joint committee with the board of other Fidelity funds (the Committee) to review and compare Fidelity's institutional investment advisory business with its business of providing services to the Fidelity funds, including the differences in services provided, fees charged, and costs incurred, as well as competition in their respective marketplaces.
Based on its review of total expenses and fees charged to other Fidelity clients, the Board concluded that the total expenses of each class of the fund were reasonable in light of the services that the fund and its shareholders receive and the other factors considered, including the findings of the Committee.
Annual Report
Costs of the Services and Profitability. The Board considered the revenues earned and the expenses incurred by Fidelity in conducting the business of developing, marketing, distributing, managing, administering and servicing the fund and its shareholders. The Board also considered the level of Fidelity's profits in respect of all the Fidelity funds.
On an annual basis, FMR presents to the Board Fidelity's profitability for the fund. Fidelity calculates the profitability for each fund, as well as aggregate profitability for groups of Fidelity funds and all Fidelity funds, using a series of detailed revenue and cost allocation methodologies which originate with the audited books and records of Fidelity. The Audit Committee of the Board reviews any significant changes from the prior year's methodologies.
PricewaterhouseCoopers LLP (PwC), independent registered public accounting firm and auditor to Fidelity and certain Fidelity funds, has been engaged annually by the Board as part of the Board's assessment of Fidelity's profitability analysis. PwC's engagement includes the review and assessment of Fidelity's methodologies used in determining the revenues and expenses attributable to Fidelity's mutual fund business, and completion of agreed-upon procedures surrounding the mathematical accuracy of fund profitability and its conformity to allocation methodologies. After considering PwC's reports issued under the engagement and information provided by Fidelity, the Board believes that while other allocation methods may also be reasonable, Fidelity's profitability methodologies are reasonable in all material respects.
The Board has also reviewed Fidelity's non-fund businesses and fall-out benefits related to the mutual fund business as well as cases where Fidelity's affiliates may benefit from or be related to the fund's business.
The Board considered the costs of the services provided by and the profits realized by Fidelity in connection with the operation of the fund and were satisfied that the profitability was not excessive in the circumstances.
Economies of Scale. The Board considered whether there have been economies of scale in respect of the management of the Fidelity funds, whether the Fidelity funds (including the fund) have appropriately benefited from any such economies of scale, and whether there is potential for realization of any further economies of scale. The Board considered the extent to which the fund will benefit from economies of scale through increased services to the fund, through waivers or reimbursements, or through fee or expense reductions.
In February 2009, the Board and the board of other Fidelity funds created an ad hoc committee (the Economies of Scale Committee) to analyze whether FMR attains economies of scale in respect of the management and servicing of the Fidelity funds, whether the Fidelity funds have appropriately benefited from such economies of scale, and whether there is potential for realization of any further economies of scale.
The Board recognized that the fund's management contract incorporates a "group fee" structure, which provides for lower group fee rates as total fund assets under FMR's management increase, and for higher group fee rates as total fund assets under FMR's management decrease. FMR calculates the group fee rates based on a tiered asset "breakpoint" schedule that varies based on asset class. The Board considered that the group fee is designed to deliver the benefits of economies of scale to fund shareholders when total Fidelity fund assets increase, even if assets of any particular fund are unchanged or have declined, because some portion of Fidelity's costs are attributable to services provided to all Fidelity funds, and all funds benefit if those costs can be allocated among more assets. The Board concluded that, given the group fee structure, fund shareholders will benefit from lower management fees as assets under FMR's management increase at the fund complex level, regardless of whether Fidelity achieves any such economies of scale.
The Board concluded, considering the findings of the Economies of Scale Committee, that any potential economies of scale are being appropriately shared between fund shareholders and Fidelity.
Additional Information Requested by the Board. In order to develop fully the factual basis for consideration of the Fidelity funds' Advisory Contracts, the Board requested and received additional information on certain topics, including (i) fund performance trends, actions to be taken by FMR to improve certain funds' overall performance, and Fidelity's long-term strategies for certain funds; (ii) portfolio manager changes that have occurred during the past year and length of portfolio manager tenure for different categories of funds over time; (iii) Fidelity's compensation structure for portfolio managers, research analysts, and other key personnel, the rationale for the compensation structure, and how the compensation structure provides appropriate performance incentives; (iv) the amount of the investment that each portfolio manager has made in the Fidelity fund(s) that he or she manages; (v) management and other fees paid by FMR to affiliated sub-advisers on behalf of the Fidelity funds; (vi) Fidelity's fee structures and rationale for recommending different fees among different categories of funds; (vii) Fidelity's rationale for recommending which funds should have a performance adjustment component as part of their management fees; (viii) the rationale for any differences between fund fee structures and fee structures in place for other Fidelity clients; and (ix) explanations regarding the relative total expenses borne by certain funds and classes, total expense competitive trends, and actions that might be taken by FMR to reduce total expenses for certain funds and classes.
Based on its evaluation of all of the conclusions noted above, and after considering all factors it believed relevant, the Board ultimately concluded that the advisory fee structures are fair and reasonable, and that the fund's Advisory Contracts should be renewed.
Annual Report
Investment Adviser
Fidelity Management & Research Company
Boston, MA
Investment Sub-Advisers
FMR Co., Inc.
Fidelity Management & Research (U.K.) Inc.
Fidelity Management & Research (Hong Kong) Limited
Fidelity Management & Research (Japan) Inc.
General Distributor
Fidelity Distributors Corporation
Boston, MA
Transfer and Service Agents
Fidelity Investments Institutional Operations Company, Inc.
Boston, MA
Fidelity Service Company, Inc.
Boston, MA
Custodian
The Northern Trust Company
Chicago, IL
VIPEI-ANN-0211
1.540027.113
Fidelity® Variable Insurance Products:
Equity-Income Portfolio - Service Class 2R
Annual Report
December 31, 2010
(2_fidelity_logos) (Registered_Trademark)
Contents
Performance | <Click Here> | How the fund has done over time. |
Management's Discussion of Fund Performance | <Click Here> | The Portfolio Manager's review of fund performance and strategy. |
Shareholder Expense Example | <Click Here> | An example of shareholder expenses. |
Investment Changes | <Click Here> | A summary of major shifts in the fund's investments over the past six months. |
Investments | <Click Here> | A complete list of the fund's investments with their market values. |
Financial Statements | <Click Here> | Statements of assets and liabilities, operations, and changes in net assets, as well as financial highlights. |
Notes | <Click Here> | Notes to the financial statements. |
Report of Independent Registered Public Accounting Firm | <Click Here> | |
Trustees and Officers | <Click Here> | |
Distributions | <Click Here> | |
Board Approval of Investment Advisory Contracts and Management Fees | <Click Here> | |
To view a fund's proxy voting guidelines and proxy voting record for the 12-month period ended June 30, visit http://www.fidelity.com/proxyvotingresults or visit the Securities and Exchange Commission's (SEC) web site at http://www.sec.gov. You may also call 1-877-208-0098 to request a free copy of the proxy voting guidelines.
Fidelity Variable Insurance Products are separate account options which are purchased through a variable insurance contract.
Standard & Poor's, S&P and S&P 500 are registered service marks of The McGraw-Hill Companies, Inc. and have been licensed for use by Fidelity Distributors Corporation.
Other third party marks appearing herein are the property of their respective owners.
All other marks appearing herein are registered or unregistered trademarks or service marks of FMR LLC or an affiliated company.
The general research services agreement with Fidelity Research & Analysis Company has been terminated and is no longer in effect for the fund.
This report and the financial statements contained herein are submitted for the general information of the shareholders of the fund. This report is not authorized for distribution to prospective investors in the fund unless preceded or accompanied by an effective prospectus.
A fund files its complete schedule of portfolio holdings with the SEC for the first and third quarters of each fiscal year on Form N-Q. Forms N-Q are available on the SEC's web site at http://www.sec.gov. A fund's Forms N-Q may be reviewed and copied at the SEC's Public Reference Room in Washington, DC. Information regarding the operation of the SEC's Public Reference Room may be obtained by calling 1-800-SEC-0330. For a complete list of a fund's portfolio holdings, view the most recent holdings listing, semiannual report, or annual report on Fidelity's web site at http://www.fidelity.com, http://www.advisor.fidelity.com, or http://www.401k.com, as applicable.
NOT FDIC INSURED • MAY LOSE VALUE • NO BANK GUARANTEE
Neither the fund nor Fidelity Distributors Corporation is a bank.
Annual Report
Average annual total return reflects the change in the value of an investment, assuming reinvestment of the class' distributions from dividend income and capital gains (the profits earned upon the sale of securities that have grown in value, if any) and assuming a constant rate of performance each year. During periods of reimbursement by Fidelity, a fund's total return will be greater than it would be had the reimbursement not occurred. Performance numbers are net of all underlying fund operating expenses, but do not include any insurance charges imposed by your insurance company's separate account. If performance information included the effect of these additional charges, the total returns would have been lower. How a fund did yesterday is no guarantee of how it will do tomorrow.
Average Annual Total Returns
Periods ended December 31, 2010 | Past 1
year | Past 5
years | Past 10
years |
VIP Equity-Income PortfolioSM - Service Class 2R A | 14.90% | 0.72% | 2.20% |
A The initial offering of Service Class 2R shares took place on April 24, 2002. Returns prior to April 24, 2002 are those of Service Class 2.
$10,000 Over 10 Years
Let's say hypothetically that $10,000 was invested in VIP Equity-Income PortfolioSM - Service Class 2R on December 31, 2000. The chart shows how the value of your investment would have changed, and also shows how the Russell 3000® Value Index performed over the same period. The initial offering of Service Class 2R took place on April 24, 2002. See above for additional information regarding the performance of Service Class 2R.
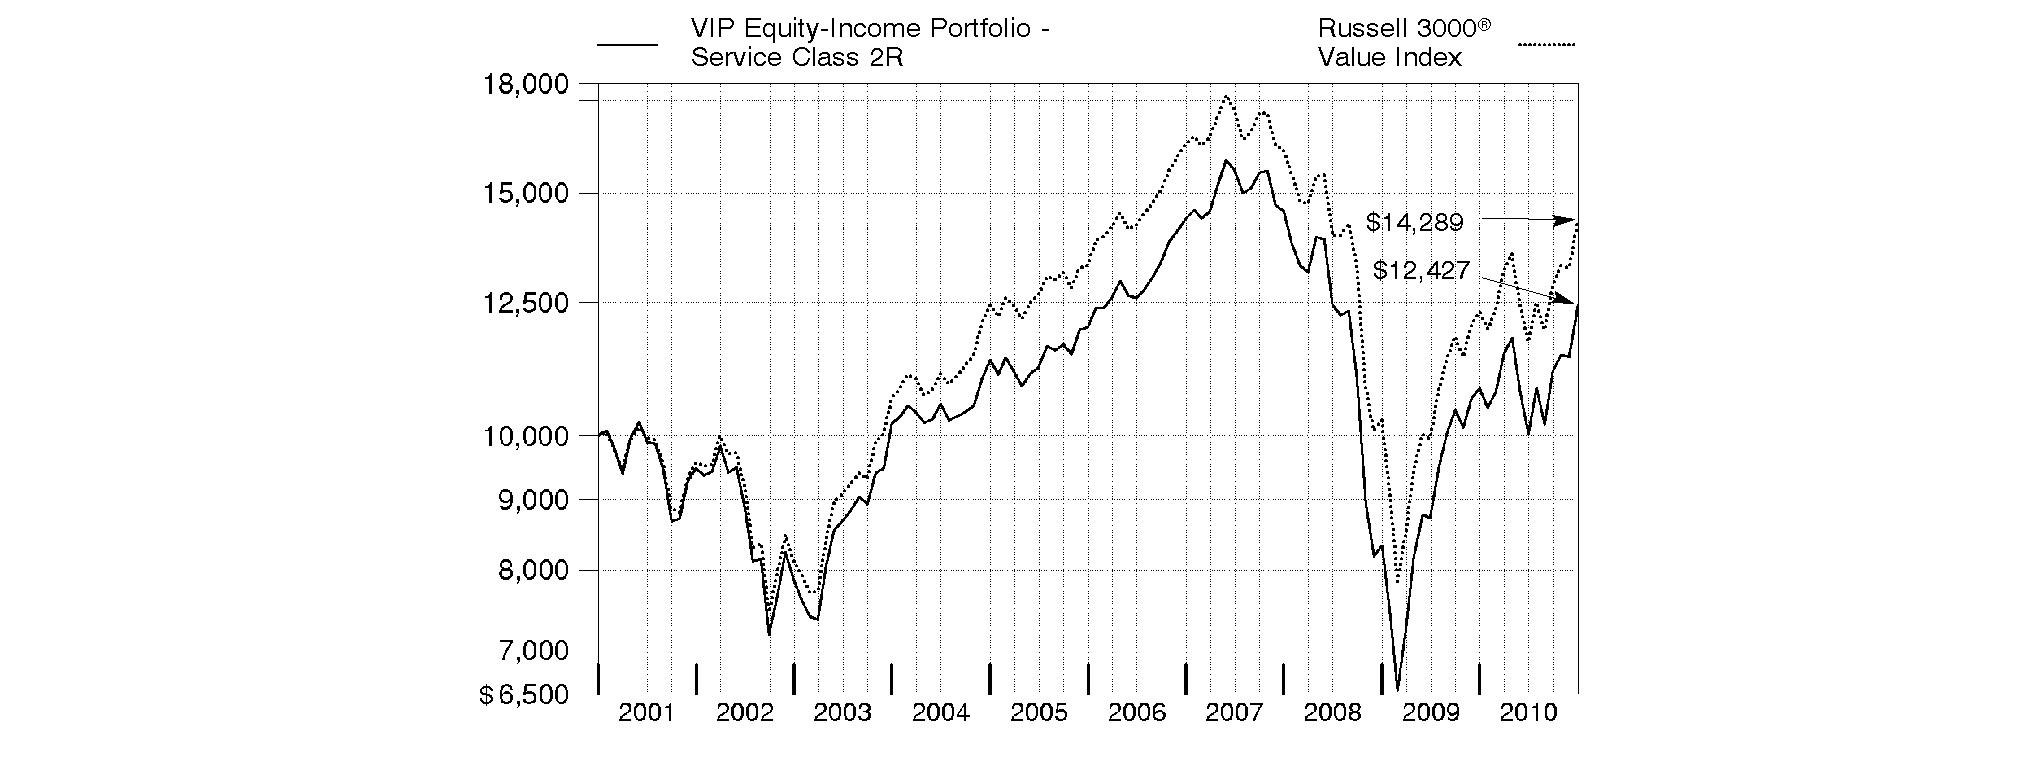
Annual Report
Market Recap: While market improvements around the world hit a speed bump in the first half of the 12-month period ending December 31, 2010, world economies re-accelerated in August, supported by a broadening recovery and low inflation in the U.S. Domestic stock markets recorded solid gains for the year, lifted by a strong second-half rally fueled by economic optimism, encouraging earnings reports and a wave of corporate mergers. The large-cap S&P 500® Index rose 15.06%, the blue-chip-laden Dow Jones Industrial AverageSM added 14.06% and the technology-heavy Nasdaq Composite® Index climbed 18.02%. Meanwhile, international stocks, as represented by the MSCI® ACWI® (All Country World Index) ex USA Index, gained 11.29%, boosted in part by a depreciating U.S. dollar. In the fixed-income arena, U.S. taxable investment-grade bonds generated positive results during 2010, as the Barclays Capital® U.S. Aggregate Bond Index gained 6.54%. With ultra-low interest rates bolstering nearly all fixed-income securities for most of the year, sectors in the index with higher yields and more credit risk generally fared best, while most high-quality bonds generated more-moderate returns. Meanwhile, high-yield bonds, as represented by The BofA Merrill LynchSM US High Yield Constrained Index, returned 15.07%, a result of improved economic data and strengthening investor demand. Overseas, foreign bond markets showed mixed results, with a sizable disparity between the 3.97% return of the Citigroup® Non-U.S. Group of 7 Index - which measures the performance of sovereign debt of the major global economies outside the U.S. - and the 12.04% advance of the JPMorgan Emerging Markets Bond Index Global (EMBI Global), which benefited from the rising overall credit quality of emerging-markets debt issuers.
Comments from Stephen Petersen, Portfolio Manager of VIP Equity-Income PortfolioSM: For the 12 months ending December 31, 2010, the fund's share classes lagged the Russell 3000® Value Index, which returned 16.23%. (For specific portfolio results, please see the performance section of this report.) The fund's relative underperformance was due to security selection, primarily within consumer discretionary, with selections among auto-related names hurting the most. However, the negative impact was more than offset by the fund's overall overweighting in this strong-performing group. Security selection also was weak in energy, information technology and utilities. Unfavorable positioning within diversified financials detracted as well. On the upside, the fund was boosted by its industrials holdings - especially those in the capital goods area - as well as positioning in telecommunication services. Overweighting the energy and retailing segments also provided a boost, despite weak picks in each area. In terms of individual securities, tax-preparation firm H&R Block felt the impact of a reduction in the number of tax filers - a result of the recession and high unemployment in the U.S. Overweighting computer and peripherals maker Hewlett-Packard detracted when the stock fell after the CEO's forced resignation in August. Within financials, large positions in brokerage firm Morgan Stanley and financial services giant Bank of America hurt. Morgan Stanley lost ground due to a softening in the brokerage business, but still posted decent earnings. Bank of America saw its shares decline as investors grew concerned about both the impact of regulatory reform and the possibility that the company's mortgage underwriting business would suffer significant losses related to the ongoing foreclosure crisis. Conversely, global casino operator Las Vegas Sands was the top contributor. The company recently opened a new casino in Singapore, and its financial performance has already vastly outperformed expectations. Underweighting insurance-focused conglomerate Berkshire Hathaway was helpful, as its stock underperformed. The fund also benefited from timely ownership of oil giant Exxon Mobil. Shares of Cummins, a maker of truck engines, rose based on escalating demand. Within telecom, the stock of Qwest Communications International trended upward throughout the reporting period, bolstered in part by its announced merger with CenturyLink in April.
The views expressed above reflect those of the portfolio manager(s) only through the end of the period as stated on the cover of this report and do not necessarily represent the views of Fidelity or any other person in the Fidelity organization. Any such views are subject to change at any time based upon market or other conditions and Fidelity disclaims any responsibility to update such views. These views may not be relied on as investment advice and, because investment decisions for a Fidelity fund are based on numerous factors, may not be relied on as an indication of trading intent on behalf of any Fidelity fund.
Annual Report
As a shareholder of the Fund, you incur two types of costs: (1) transaction costs, including redemption fees, and (2) ongoing costs, including management fees, distribution and/or service (12b-1) fees and other Fund expenses. This Example is intended to help you understand your ongoing costs (in dollars) of investing in the Fund and to compare these costs with the ongoing costs of investing in other mutual funds.
The Example is based on an investment of $1,000 invested at the beginning of the period and held for the entire period (July 1, 2010 to December 31, 2010).
Actual Expenses
The first line of the accompanying table for each class of the Fund provides information about actual account values and actual expenses. You may use the information in this line, together with the amount you invested, to estimate the expenses that you paid over the period. Simply divide your account value by $1,000.00 (for example, an $8,600 account value divided by $1,000.00 = 8.6), then multiply the result by the number in the first line for a class of the Fund under the heading entitled "Expenses Paid During Period" to estimate the expenses you paid on your account during this period. The estimate of expenses does not include any fees or other expenses of any variable annuity or variable life insurance product. If they were, the estimate of expenses you paid during the period would be higher, and your ending account value would be lower. In addition, the Fund, as a shareholder in the underlying Fidelity Central Funds, will indirectly bear its pro-rata share of the fees and expenses incurred by the underlying Fidelity Central Funds. These fees and expenses are not included in the Fund's annualized expense ratio used to calculate the expense estimate in the table below.
Hypothetical Example for Comparison Purposes
The second line of the accompanying table for each class of the Fund provides information about hypothetical account values and hypothetical expenses based on a Class' actual expense ratio and an assumed rate of return of 5% per year before expenses, which is not the Class' actual return. The hypothetical account values and expenses may not be used to estimate the actual ending account balance or expenses you paid for the period. You may use this information to compare the ongoing costs of investing in the Fund and other funds. To do so, compare this 5% hypothetical example with the 5% hypothetical examples that appear in the shareholder reports of the other funds. The estimate of expenses does not include any fees or other expenses of any variable annuity or variable life insurance product. If they were, the estimate of expenses you paid during the period would be higher, and your ending account value would be lower. In addition, the Fund, as a shareholder in the underlying Fidelity Central Funds, will indirectly bear its pro-rata share of the fees and expenses incurred by the underlying Fidelity Central Funds. These fees and expenses are not included in the Fund's annualized expense ratio used to calculate the expense estimate in the table below.
Please note that the expenses shown in the table are meant to highlight your ongoing costs only and do not reflect any transaction costs. Therefore, the second line of the table is useful in comparing ongoing costs only, and will not help you determine the relative total costs of owning different funds. In addition, if these transactional costs were included, your costs would have been higher.
| Annualized
Expense Ratio | Beginning
Account Value
July 1, 2010 | Ending
Account Value
December 31, 2010 | Expenses Paid
During Period*
July 1, 2010 to
December 31, 2010 |
Initial Class | .55% | | | |
Actual | | $ 1,000.00 | $ 1,240.00 | $ 3.11 |
Hypothetical A | | $ 1,000.00 | $ 1,022.43 | $ 2.80 |
Service Class | .65% | | | |
Actual | | $ 1,000.00 | $ 1,239.70 | $ 3.67 |
Hypothetical A | | $ 1,000.00 | $ 1,021.93 | $ 3.31 |
Service Class 2 | .80% | | | |
Actual | | $ 1,000.00 | $ 1,238.90 | $ 4.51 |
Hypothetical A | | $ 1,000.00 | $ 1,021.17 | $ 4.08 |
Service Class 2R | .79% | | | |
Actual | | $ 1,000.00 | $ 1,239.20 | $ 4.46 |
Hypothetical A | | $ 1,000.00 | $ 1,021.22 | $ 4.02 |
Investor Class | .63% | | | |
Actual | | $ 1,000.00 | $ 1,239.90 | $ 3.56 |
Hypothetical A | | $ 1,000.00 | $ 1,022.03 | $ 3.21 |
A 5% return per year before expenses
* Expenses are equal to each Class' annualized expense ratio, multiplied by the average account value over the period, multiplied by 184/365 (to reflect the one-half year period).
Annual Report
Investment Changes (Unaudited)
Top Ten Stocks as of December 31, 2010 |
| % of fund's
net assets | % of fund's net assets
6 months ago |
JPMorgan Chase & Co. | 3.4 | 3.4 |
Wells Fargo & Co. | 3.2 | 3.3 |
Chevron Corp. | 2.5 | 2.3 |
Bank of America Corp. | 2.4 | 3.2 |
AT&T, Inc. | 2.3 | 2.4 |
Pfizer, Inc. | 2.2 | 2.1 |
PNC Financial Services Group, Inc. | 2.0 | 2.4 |
Exxon Mobil Corp. | 2.0 | 3.4 |
General Electric Co. | 1.7 | 1.4 |
Citigroup, Inc. | 1.6 | 0.9 |
| 23.3 | |
Top Five Market Sectors as of December 31, 2010 |
| % of fund's
net assets | % of fund's net assets
6 months ago |
Financials | 27.7 | 27.5 |
Consumer Discretionary | 14.4 | 15.3 |
Energy | 14.0 | 15.5 |
Industrials | 11.2 | 10.4 |
Health Care | 8.8 | 7.2 |
Asset Allocation (% of fund's net assets) |
As of December 31, 2010* | As of June 30, 2010** |
| Stocks 97.3% | | | Stocks 97.3% | |
| Bonds 1.9% | | | Bonds 2.4% | |
| Short-Term
Investments and
Net Other Assets 0.8% | | | Short-Term
Investments and
Net Other Assets 0.3% | |
* Foreign investments | 11.8% | | ** Foreign investments | 11.9% | |

Annual Report
Investments December 31, 2010
Showing Percentage of Net Assets
Common Stocks - 95.5% |
| Shares | | Value |
CONSUMER DISCRETIONARY - 12.5% |
Auto Components - 1.2% |
Johnson Controls, Inc. | 989,967 | | $ 37,816,739 |
Michelin CGDE Series B | 216,474 | | 15,542,162 |
The Goodyear Tire & Rubber Co. (a) | 1,650,000 | | 19,552,500 |
| | 72,911,401 |
Automobiles - 1.5% |
Daimler AG (Germany) (a) | 197,718 | | 13,410,423 |
Ford Motor Co. (a) | 959,365 | | 16,107,738 |
Harley-Davidson, Inc. | 1,425,050 | | 49,406,484 |
Thor Industries, Inc. | 209,500 | | 7,114,620 |
Winnebago Industries, Inc. (a) | 407,511 | | 6,194,167 |
| | 92,233,432 |
Diversified Consumer Services - 0.4% |
H&R Block, Inc. | 1,782,786 | | 21,232,981 |
Hotels, Restaurants & Leisure - 0.3% |
Las Vegas Sands Corp. unit | 24,400 | | 18,986,128 |
Household Durables - 2.5% |
KB Home | 295,900 | | 3,991,691 |
Lennar Corp. Class A | 603,166 | | 11,309,363 |
Newell Rubbermaid, Inc. | 1,692,220 | | 30,764,560 |
PulteGroup, Inc. (a) | 1,665,768 | | 12,526,575 |
Stanley Black & Decker, Inc. | 695,153 | | 46,484,881 |
Techtronic Industries Co. Ltd. | 3,945,500 | | 5,147,298 |
Toll Brothers, Inc. (a) | 170,987 | | 3,248,753 |
Whirlpool Corp. | 375,434 | | 33,349,802 |
| | 146,822,923 |
Internet & Catalog Retail - 0.2% |
Liberty Media Corp. Interactive
Series A (a) | 844,241 | | 13,313,681 |
Leisure Equipment & Products - 0.3% |
Brunswick Corp. | 1,013,757 | | 18,997,806 |
Media - 2.3% |
Belo Corp. Series A (a) | 952,224 | | 6,741,746 |
CC Media Holdings, Inc. Class A (a) | 693,958 | | 6,245,622 |
Comcast Corp.: | | | |
Class A | 1,080,436 | | 23,737,179 |
Class A (special) (non-vtg.) | 911,000 | | 18,957,910 |
The Walt Disney Co. | 1,365,190 | | 51,208,277 |
Time Warner, Inc. | 964,383 | | 31,024,201 |
| | 137,914,935 |
Multiline Retail - 1.4% |
Kohl's Corp. (a) | 413,224 | | 22,454,592 |
Macy's, Inc. | 1,083,500 | | 27,412,550 |
Target Corp. | 520,190 | | 31,279,025 |
Tuesday Morning Corp. (a) | 508,423 | | 2,684,473 |
| | 83,830,640 |
Specialty Retail - 2.1% |
Home Depot, Inc. | 1,860,500 | | 65,229,130 |
Lowe's Companies, Inc. | 1,006,978 | | 25,255,008 |
OfficeMax, Inc. (a) | 598,000 | | 10,584,600 |
|
| Shares | | Value |
RadioShack Corp. | 569,500 | | $ 10,530,055 |
Staples, Inc. | 638,015 | | 14,527,602 |
| | 126,126,395 |
Textiles, Apparel & Luxury Goods - 0.3% |
Phillips-Van Heusen Corp. | 173,516 | | 10,933,243 |
Warnaco Group, Inc. (a) | 165,363 | | 9,106,540 |
| | 20,039,783 |
TOTAL CONSUMER DISCRETIONARY | | 752,410,105 |
CONSUMER STAPLES - 5.2% |
Beverages - 1.0% |
Carlsberg AS Series B | 139,662 | | 13,990,248 |
PepsiCo, Inc. | 257,830 | | 16,844,034 |
The Coca-Cola Co. | 475,329 | | 31,262,388 |
| | 62,096,670 |
Food & Staples Retailing - 1.2% |
CVS Caremark Corp. | 425,189 | | 14,783,822 |
Kroger Co. | 956,200 | | 21,380,632 |
Walgreen Co. | 752,662 | | 29,323,712 |
Winn-Dixie Stores, Inc. (a) | 587,020 | | 4,208,933 |
| | 69,697,099 |
Food Products - 0.4% |
Kraft Foods, Inc. Class A | 67,000 | | 2,111,170 |
Nestle SA | 391,594 | | 22,947,417 |
| | 25,058,587 |
Household Products - 1.5% |
Kimberly-Clark Corp. | 272,870 | | 17,201,725 |
Procter & Gamble Co. | 1,140,705 | | 73,381,553 |
| | 90,583,278 |
Personal Products - 0.3% |
Avon Products, Inc. | 534,971 | | 15,546,257 |
Tobacco - 0.8% |
Philip Morris International, Inc. | 787,105 | | 46,069,256 |
TOTAL CONSUMER STAPLES | | 309,051,147 |
ENERGY - 13.9% |
Energy Equipment & Services - 2.5% |
Baker Hughes, Inc. | 935,631 | | 53,490,024 |
Halliburton Co. | 760,701 | | 31,059,422 |
Noble Corp. | 1,188,302 | | 42,505,563 |
Pride International, Inc. (a) | 451,957 | | 14,914,581 |
Transocean Ltd. (a) | 124,016 | | 8,620,352 |
| | 150,589,942 |
Oil, Gas & Consumable Fuels - 11.4% |
Anadarko Petroleum Corp. | 471,860 | | 35,936,858 |
Apache Corp. | 205,880 | | 24,547,072 |
BP PLC sponsored ADR | 1,216,006 | | 53,710,985 |
Chevron Corp. | 1,630,329 | | 148,767,521 |
ConocoPhillips | 954,110 | | 64,974,891 |
CONSOL Energy, Inc. | 455,890 | | 22,220,079 |
Common Stocks - continued |
| Shares | | Value |
ENERGY - continued |
Oil, Gas & Consumable Fuels - continued |
Devon Energy Corp. | 199,500 | | $ 15,662,745 |
Exxon Mobil Corp. | 1,631,141 | | 119,269,030 |
Marathon Oil Corp. | 816,078 | | 30,219,368 |
Occidental Petroleum Corp. | 480,075 | | 47,095,358 |
Royal Dutch Shell PLC Class A sponsored ADR (d) | 1,439,900 | | 96,156,522 |
Southwestern Energy Co. (a) | 700,621 | | 26,224,244 |
| | 684,784,673 |
TOTAL ENERGY | | 835,374,615 |
FINANCIALS - 26.7% |
Capital Markets - 4.7% |
Bank of New York Mellon Corp. | 1,698,099 | | 51,282,590 |
Bank Sarasin & Co. Ltd. Series B (Reg.) | 252,692 | | 11,521,652 |
Goldman Sachs Group, Inc. | 370,694 | | 62,335,903 |
Morgan Stanley | 2,903,777 | | 79,011,772 |
State Street Corp. | 877,580 | | 40,667,057 |
UBS AG (a) | 640,888 | | 10,530,407 |
UBS AG (NY Shares) (a) | 1,595,121 | | 26,271,643 |
| | 281,621,024 |
Commercial Banks - 8.7% |
Associated Banc-Corp. | 2,093,457 | | 31,715,874 |
Barclays PLC | 5,476,874 | | 22,650,667 |
BB&T Corp. | 1,356,898 | | 35,672,848 |
BNP Paribas SA | 77,400 | | 4,926,864 |
Comerica, Inc. | 475,700 | | 20,093,568 |
Huntington Bancshares, Inc. | 2,786,200 | | 19,141,194 |
KeyCorp | 2,853,500 | | 25,253,475 |
Mitsubishi UFJ Financial Group, Inc. sponsored ADR | 3,449,325 | | 18,660,848 |
PNC Financial Services Group, Inc. | 1,988,230 | | 120,725,326 |
U.S. Bancorp, Delaware | 1,318,938 | | 35,571,758 |
Wells Fargo & Co. | 6,134,109 | | 190,096,038 |
| | 524,508,460 |
Consumer Finance - 1.6% |
American Express Co. | 521,105 | | 22,365,827 |
Capital One Financial Corp. | 300,750 | | 12,799,920 |
Discover Financial Services | 2,519,369 | | 46,683,908 |
SLM Corp. (a) | 904,032 | | 11,381,763 |
| | 93,231,418 |
Diversified Financial Services - 8.0% |
Bank of America Corp. | 10,733,336 | | 143,182,702 |
Citigroup, Inc. (a) | 21,269,761 | | 100,605,970 |
CME Group, Inc. | 38,534 | | 12,398,315 |
JPMorgan Chase & Co. | 4,779,562 | | 202,749,013 |
Moody's Corp. (d) | 883,429 | | 23,446,206 |
| | 482,382,206 |
Insurance - 1.5% |
Berkshire Hathaway, Inc. Class B (a) | 118,700 | | 9,509,057 |
|
| Shares | | Value |
First American Financial Corp. | 619,920 | | $ 9,261,605 |
Hartford Financial Services Group, Inc. | 539,061 | | 14,279,726 |
Marsh & McLennan Companies, Inc. | 503,576 | | 13,767,768 |
Unum Group | 1,268,597 | | 30,725,419 |
XL Capital Ltd. Class A | 418,777 | | 9,137,714 |
| | 86,681,289 |
Real Estate Investment Trusts - 1.7% |
Boston Properties, Inc. | 136,475 | | 11,750,498 |
Camden Property Trust (SBI) | 153,114 | | 8,265,094 |
HCP, Inc. | 823,532 | | 30,297,742 |
ProLogis Trust | 353,500 | | 5,104,540 |
Rayonier, Inc. | 176,815 | | 9,286,324 |
Segro PLC | 1,278,288 | | 5,711,735 |
Ventas, Inc. | 386,075 | | 20,261,216 |
Weyerhaeuser Co. | 687,780 | | 13,019,675 |
| | 103,696,824 |
Real Estate Management & Development - 0.5% |
CB Richard Ellis Group, Inc. Class A (a) | 834,075 | | 17,081,856 |
Indiabulls Real Estate Ltd. (a) | 2,750,085 | | 8,564,704 |
Unite Group PLC (a) | 683,979 | | 2,071,260 |
| | 27,717,820 |
TOTAL FINANCIALS | | 1,599,839,041 |
HEALTH CARE - 8.8% |
Biotechnology - 1.2% |
Amgen, Inc. (a) | 712,122 | | 39,095,498 |
Cephalon, Inc. (a) | 153,200 | | 9,455,504 |
Gilead Sciences, Inc. (a) | 674,065 | | 24,428,116 |
| | 72,979,118 |
Health Care Equipment & Supplies - 1.4% |
C. R. Bard, Inc. | 205,200 | | 18,831,204 |
CareFusion Corp. (a) | 1,109,900 | | 28,524,430 |
Covidien PLC | 268,900 | | 12,277,974 |
Stryker Corp. | 454,900 | | 24,428,130 |
| | 84,061,738 |
Health Care Providers & Services - 0.4% |
UnitedHealth Group, Inc. | 687,400 | | 24,822,014 |
Life Sciences Tools & Services - 0.5% |
Agilent Technologies, Inc. (a) | 662,181 | | 27,434,159 |
Pharmaceuticals - 5.3% |
GlaxoSmithKline PLC | 631,919 | | 12,263,020 |
GlaxoSmithKline PLC sponsored ADR | 43,700 | | 1,713,914 |
Johnson & Johnson | 929,766 | | 57,506,027 |
Merck & Co., Inc. | 2,380,872 | | 85,806,627 |
Pfizer, Inc. | 7,516,615 | | 131,615,929 |
Sanofi-Aventis | 487,372 | | 31,261,967 |
| | 320,167,484 |
TOTAL HEALTH CARE | | 529,464,513 |
Common Stocks - continued |
| Shares | | Value |
INDUSTRIALS - 11.0% |
Aerospace & Defense - 2.5% |
Goodrich Corp. | 128,142 | | $ 11,285,466 |
Honeywell International, Inc. | 925,025 | | 49,174,329 |
Spirit AeroSystems Holdings, Inc.
Class A (a) | 275,088 | | 5,724,581 |
The Boeing Co. | 406,784 | | 26,546,724 |
United Technologies Corp. | 724,789 | | 57,055,390 |
| | 149,786,490 |
Building Products - 0.4% |
Armstrong World Industries, Inc. | 120,914 | | 5,199,302 |
Masco Corp. | 1,569,300 | | 19,867,338 |
| | 25,066,640 |
Commercial Services & Supplies - 0.5% |
Pitney Bowes, Inc. | 459,700 | | 11,115,546 |
Republic Services, Inc. | 652,000 | | 19,468,720 |
| | 30,584,266 |
Construction & Engineering - 0.6% |
Fluor Corp. | 255,800 | | 16,949,308 |
KBR, Inc. | 635,239 | | 19,355,732 |
| | 36,305,040 |
Industrial Conglomerates - 3.8% |
General Electric Co. | 5,720,475 | | 104,627,488 |
Koninklijke Philips Electronics NV unit | 413,300 | | 12,688,310 |
Rheinmetall AG | 296,433 | | 23,847,231 |
Siemens AG sponsored ADR | 416,000 | | 51,688,000 |
Textron, Inc. | 823,200 | | 19,460,448 |
Tyco International Ltd. | 380,936 | | 15,785,988 |
| | 228,097,465 |
Machinery - 2.5% |
Briggs & Stratton Corp. | 1,203,409 | | 23,695,123 |
Caterpillar, Inc. | 101,800 | | 9,534,588 |
Cummins, Inc. | 340,500 | | 37,458,405 |
Harsco Corp. | 223,320 | | 6,324,422 |
Ingersoll-Rand Co. Ltd. | 673,888 | | 31,733,386 |
Kennametal, Inc. | 250,344 | | 9,878,574 |
Navistar International Corp. (a) | 292,170 | | 16,919,565 |
SPX Corp. | 145,800 | | 10,423,242 |
| | 145,967,305 |
Road & Rail - 0.7% |
CSX Corp. | 345,000 | | 22,290,450 |
Union Pacific Corp. | 228,400 | | 21,163,544 |
| | 43,453,994 |
TOTAL INDUSTRIALS | | 659,261,200 |
INFORMATION TECHNOLOGY - 6.0% |
Communications Equipment - 0.7% |
Cisco Systems, Inc. (a) | 1,134,453 | | 22,949,984 |
|
| Shares | | Value |
Comverse Technology, Inc. (a) | 1,623,693 | | $ 11,788,011 |
Motorola, Inc. (a) | 725,557 | | 6,580,802 |
| | 41,318,797 |
Computers & Peripherals - 0.9% |
Hewlett-Packard Co. | 1,287,050 | | 54,184,805 |
Electronic Equipment & Components - 1.2% |
Arrow Electronics, Inc. (a) | 704,900 | | 24,142,825 |
Avnet, Inc. (a) | 352,303 | | 11,636,568 |
Tyco Electronics Ltd. | 960,536 | | 34,002,974 |
| | 69,782,367 |
IT Services - 0.4% |
CoreLogic, Inc. (a) | 289,320 | | 5,358,206 |
MoneyGram International, Inc. (a) | 438,950 | | 1,189,555 |
Visa, Inc. Class A | 219,433 | | 15,443,695 |
| | 21,991,456 |
Office Electronics - 0.3% |
Xerox Corp. | 1,784,378 | | 20,556,035 |
Semiconductors & Semiconductor Equipment - 2.5% |
Applied Materials, Inc. | 1,707,400 | | 23,988,970 |
Intel Corp. | 2,738,600 | | 57,592,758 |
Micron Technology, Inc. (a) | 1,507,800 | | 12,092,556 |
National Semiconductor Corp. | 1,433,347 | | 19,722,855 |
Samsung Electronics Co. Ltd. | 12,977 | | 10,983,435 |
Teradyne, Inc. (a) | 1,435,900 | | 20,160,036 |
Varian Semiconductor Equipment Associates, Inc. (a) | 182,020 | | 6,729,279 |
| | 151,269,889 |
TOTAL INFORMATION TECHNOLOGY | | 359,103,349 |
MATERIALS - 2.8% |
Chemicals - 2.0% |
Celanese Corp. Class A | 471,412 | | 19,408,032 |
Clariant AG (Reg.) (a) | 1,331,205 | | 26,986,003 |
Dow Chemical Co. | 794,805 | | 27,134,643 |
E.I. du Pont de Nemours & Co. | 670,700 | | 33,454,516 |
PPG Industries, Inc. | 131,300 | | 11,038,391 |
| | 118,021,585 |
Construction Materials - 0.2% |
HeidelbergCement AG | 192,600 | | 12,077,041 |
Metals & Mining - 0.6% |
Alcoa, Inc. | 1,012,171 | | 15,577,312 |
Commercial Metals Co. | 442,971 | | 7,348,889 |
Freeport-McMoRan Copper & Gold, Inc. | 135,551 | | 16,278,320 |
| | 39,204,521 |
TOTAL MATERIALS | | 169,303,147 |
TELECOMMUNICATION SERVICES - 5.0% |
Diversified Telecommunication Services - 4.6% |
AT&T, Inc. | 4,610,452 | | 135,455,080 |
Common Stocks - continued |
| Shares | | Value |
TELECOMMUNICATION SERVICES - continued |
Diversified Telecommunication Services - continued |
Qwest Communications International,
Inc. | 5,608,200 | | $ 42,678,402 |
Verizon Communications, Inc. | 2,666,517 | | 95,407,978 |
| | 273,541,460 |
Wireless Telecommunication Services - 0.4% |
Sprint Nextel Corp. (a) | 6,011,178 | | 25,427,283 |
TOTAL TELECOMMUNICATION SERVICES | | 298,968,743 |
UTILITIES - 3.6% |
Electric Utilities - 2.2% |
Allegheny Energy, Inc. | 921,509 | | 22,337,378 |
American Electric Power Co., Inc. | 1,349,079 | | 48,539,862 |
Entergy Corp. | 296,459 | | 20,998,191 |
FirstEnergy Corp. (d) | 1,101,500 | | 40,777,530 |
| | 132,652,961 |
Independent Power Producers & Energy Traders - 0.6% |
AES Corp. (a) | 2,879,421 | | 35,071,348 |
Multi-Utilities - 0.8% |
Alliant Energy Corp. | 340,496 | | 12,520,038 |
PG&E Corp. | 298,392 | | 14,275,073 |
Public Service Enterprise Group, Inc. | 600,479 | | 19,101,237 |
Veolia Environnement | 132,700 | | 3,886,319 |
| | 49,782,667 |
TOTAL UTILITIES | | 217,506,976 |
TOTAL COMMON STOCKS (Cost $5,250,694,342) | 5,730,282,836 |
Preferred Stocks - 1.8% |
| | | |
Convertible Preferred Stocks - 1.6% |
CONSUMER DISCRETIONARY - 0.6% |
Automobiles - 0.6% |
General Motors Co. 4.75% | 656,400 | | 35,517,804 |
Household Durables - 0.0% |
Stanley Black & Decker, Inc. 4.75% (a) | 13,800 | | 1,494,713 |
TOTAL CONSUMER DISCRETIONARY | | 37,012,517 |
ENERGY - 0.1% |
Oil, Gas & Consumable Fuels - 0.1% |
Apache Corp. 6.00% | 111,700 | | 7,401,242 |
FINANCIALS - 0.8% |
Commercial Banks - 0.2% |
Huntington Bancshares, Inc. 8.50% | 9,000 | | 9,497,340 |
Diversified Financial Services - 0.2% |
Citigroup, Inc. 7.50% | 87,000 | | 11,892,030 |
|
| Shares | | Value |
Insurance - 0.4% |
Hartford Financial Services Group, Inc. Series F 7.25% | 310,900 | | $ 7,995,975 |
XL Capital Ltd. 10.75% | 494,600 | | 15,411,736 |
| | 23,407,711 |
TOTAL FINANCIALS | | 44,797,081 |
UTILITIES - 0.1% |
Electric Utilities - 0.1% |
PPL Corp. 9.50% | 121,900 | | 6,665,492 |
TOTAL CONVERTIBLE PREFERRED STOCKS | | 95,876,332 |
Nonconvertible Preferred Stocks - 0.2% |
CONSUMER DISCRETIONARY - 0.2% |
Automobiles - 0.2% |
Volkswagen AG | 82,700 | | 13,423,186 |
TOTAL PREFERRED STOCKS (Cost $93,391,048) | 109,299,518 |
Corporate Bonds - 1.9% |
| Principal Amount | | |
Convertible Bonds - 1.7% |
CONSUMER DISCRETIONARY - 1.1% |
Hotels, Restaurants & Leisure - 0.3% |
MGM Mirage, Inc. 4.25% 4/15/15 (e) | | $ 14,560,000 | | 15,852,200 |
Leisure Equipment & Products - 0.0% |
Eastman Kodak Co. 7% 4/1/17 | | 2,030,000 | | 2,117,696 |
Media - 0.8% |
Liberty Media Corp.: | | | | |
3.5% 1/15/31 | | 254,655 | | 184,425 |
4% 11/15/29 | | 4,750,000 | | 2,707,500 |
3.5% 1/15/31 (e) | | 9,306,795 | | 6,740,111 |
News America, Inc. liquid yield option note: | | | | |
0% 2/28/21 (e) | | 22,670,000 | | 15,879,202 |
0% 2/28/21 | | 3,490,000 | | 2,444,571 |
Virgin Media, Inc. 6.5% 11/15/16 | | 12,614,000 | | 20,867,340 |
| | 48,823,149 |
TOTAL CONSUMER DISCRETIONARY | | 66,793,045 |
FINANCIALS - 0.2% |
Thrifts & Mortgage Finance - 0.2% |
MGIC Investment Corp. 9% 4/1/63 (e) | | 10,438,000 | | 11,507,895 |
Corporate Bonds - continued |
| Principal Amount | | Value |
Convertible Bonds - continued |
INDUSTRIALS - 0.2% |
Airlines - 0.2% |
UAL Corp.: | | | | |
4.5% 6/30/21 (e) | | $ 8,490,000 | | $ 8,666,592 |
4.5% 6/30/21 | | 280,000 | | 285,824 |
| | 8,952,416 |
INFORMATION TECHNOLOGY - 0.2% |
Semiconductors & Semiconductor Equipment - 0.2% |
Advanced Micro Devices, Inc.: | | | | |
6% 5/1/15 (e) | | 6,316,000 | | 6,329,264 |
6% 5/1/15 | | 2,798,000 | | 2,803,876 |
Micron Technology, Inc. 1.875% 6/1/27 | | 3,933,000 | | 3,765,848 |
| | 12,898,988 |
TOTAL CONVERTIBLE BONDS | | 100,152,344 |
Nonconvertible Bonds - 0.2% |
MATERIALS - 0.2% |
Chemicals - 0.2% |
Hercules, Inc. 6.5% 6/30/29 unit | | 15,700,000 | | 12,462,660 |
TOTAL CORPORATE BONDS (Cost $100,580,725) | 112,615,004 |
Money Market Funds - 0.9% |
| Shares | | Value |
Fidelity Cash Central Fund, 0.19% (b) | 46,188,835 | | $ 46,188,835 |
Fidelity Securities Lending Cash Central Fund, 0.21% (b)(c) | 8,104,000 | | 8,104,000 |
TOTAL MONEY MARKET FUNDS (Cost $54,292,835) | 54,292,835 |
TOTAL INVESTMENT PORTFOLIO - 100.1% (Cost $5,498,958,950) | | 6,006,490,193 |
NET OTHER ASSETS (LIABILITIES) - (0.1)% | | (3,042,714) |
NET ASSETS - 100% | $ 6,003,447,479 |
Legend |
(a) Non-income producing |
(b) Affiliated fund that is available only to investment companies and other accounts managed by Fidelity Investments. The rate quoted is the annualized seven-day yield of the fund at period end. A complete unaudited listing of the fund's holdings as of its most recent quarter end is available upon request. In addition, each Fidelity Central Fund's financial statements, which are not covered by the Fund's Report of Independent Registered Public Accounting Firm, are available on the SEC's website or upon request. |
(c) Investment made with cash collateral received from securities on loan. |
(d) Security or a portion of the security is on loan at period end. |
(e) Security exempt from registration under Rule 144A of the Securities Act of 1933. These securities may be resold in transactions exempt from registration, normally to qualified institutional buyers. At the end of the period, the value of these securities amounted to $64,975,264 or 1.1% of net assets. |
Affiliated Central Funds |
Information regarding fiscal year to date income earned by the Fund from investments in Fidelity Central Funds is as follows: |
Fund | Income earned |
Fidelity Cash Central Fund | $ 39,921 |
Fidelity Securities Lending Cash Central Fund | 800,893 |
Total | $ 840,814 |
Other Information |
The following is a summary of the inputs used, as of December 31, 2010, involving the Fund's assets and liabilities carried at fair value. The inputs or methodology used for valuing securities may not be an indication of the risk associated with investing in those securities. For more information on valuation inputs, and their aggregation into the levels used in the table below, please refer to the Security Valuation section in the accompanying Notes to Financial Statements. |
Valuation Inputs at Reporting Date: |
Description | Total | Level 1 | Level 2 | Level 3 |
Investments in Securities: | | | | |
Equities: | | | | |
Consumer Discretionary | $ 802,845,808 | $ 782,364,967 | $ 20,480,841 | $ - |
Consumer Staples | 309,051,147 | 309,051,147 | - | - |
Energy | 842,775,857 | 842,775,857 | - | - |
Financials | 1,644,636,122 | 1,582,069,703 | 62,566,419 | - |
Health Care | 529,464,513 | 485,939,526 | 43,524,987 | - |
Industrials | 659,261,200 | 659,261,200 | - | - |
Information Technology | 359,103,349 | 359,103,349 | - | - |
Materials | 169,303,147 | 169,303,147 | - | - |
Telecommunication Services | 298,968,743 | 298,968,743 | - | - |
Utilities | 224,172,468 | 213,620,657 | 10,551,811 | - |
Corporate Bonds | 112,615,004 | - | 112,615,004 | - |
Money Market Funds | 54,292,835 | 54,292,835 | - | - |
Total Investments in Securities: | $ 6,006,490,193 | $ 5,756,751,131 | $ 249,739,062 | $ - |
Distribution of investments by country of issue, as a percentage of total net assets, is as follows: (Unaudited) |
United States of America | 88.2% |
Switzerland | 3.3% |
United Kingdom | 3.2% |
Germany | 1.9% |
Ireland | 1.2% |
France | 1.0% |
Others (Individually Less Than 1%) | 1.2% |
| 100.0% |
Income Tax Information |
At December 31, 2010, the Fund had a capital loss carryforward of approximately $168,007,461 all of which will expire in fiscal 2017. Capital loss carryforwards are only available to offset future capital gains of the Fund to the extent provided by regulations and may be limited. |
See accompanying notes which are an integral part of the financial statements.
Annual Report
Statement of Assets and Liabilities
| December 31, 2010 |
| | |
Assets | | |
Investment in securities, at value (including securities loaned of $7,895,710) - See accompanying schedule: Unaffiliated issuers (cost $5,444,666,115) | $ 5,952,197,358 | |
Fidelity Central Funds (cost $54,292,835) | 54,292,835 | |
Total Investments (cost $5,498,958,950) | | $ 6,006,490,193 |
Cash | | 255,113 |
Receivable for investments sold | | 7,846,729 |
Receivable for fund shares sold | | 929,418 |
Dividends receivable | | 6,209,156 |
Interest receivable | | 777,210 |
Distributions receivable from Fidelity Central Funds | | 5,998 |
Prepaid expenses | | 17,204 |
Other receivables | | 289,394 |
Total assets | | 6,022,820,415 |
| | |
Liabilities | | |
Payable for fund shares redeemed | $ 7,876,491 | |
Accrued management fee | 2,255,589 | |
Distribution and service plan fees payable | 367,554 | |
Other affiliated payables | 431,145 | |
Other payables and accrued expenses | 338,157 | |
Collateral on securities loaned, at value | 8,104,000 | |
Total liabilities | | 19,372,936 |
| | |
Net Assets | | $ 6,003,447,479 |
Net Assets consist of: | | |
Paid in capital | | $ 5,729,372,443 |
Distributions in excess of net investment income | | (1,868,429) |
Accumulated undistributed net realized gain (loss) on investments and foreign currency transactions | | (231,633,750) |
Net unrealized appreciation (depreciation) on investments and assets and liabilities in foreign currencies | | 507,577,215 |
Net Assets | | $ 6,003,447,479 |
Statement of Assets and Liabilities - continued
| December 31, 2010 |
| | |
Initial Class:
Net Asset Value, offering price and redemption price per share ($3,798,309,587 ÷ 199,689,311 shares) | | $ 19.02 |
| | |
Service Class:
Net Asset Value, offering price and redemption price per share ($414,431,332 ÷ 21,859,341 shares) | | $ 18.96 |
| | |
Service Class 2:
Net Asset Value, offering price and redemption price per share ($1,619,355,750 ÷ 86,388,600 shares) | | $ 18.75 |
| | |
Service Class 2R:
Net Asset Value, offering price and redemption price per share ($5,405,078 ÷ 289,707 shares) | | $ 18.66 |
| | |
Investor Class:
Net Asset Value, offering price and redemption price per share ($165,945,732 ÷ 8,745,541 shares) | | $ 18.97 |
See accompanying notes which are an integral part of the financial statements.
Annual Report
Financial Statements - continued
Statement of Operations
| Year ended December 31, 2010 |
| | |
Investment Income | | |
Dividends | | $ 120,053,669 |
Interest | | 8,740,142 |
Income from Fidelity Central Funds | | 840,814 |
Total income | | 129,634,625 |
| | |
Expenses | | |
Management fee | $ 26,340,116 | |
Transfer agent fees | 4,446,398 | |
Distribution and service plan fees | 4,243,891 | |
Accounting and security lending fees | 1,132,655 | |
Custodian fees and expenses | 170,669 | |
Independent trustees' compensation | 33,980 | |
Appreciation in deferred trustee compensation account | 95 | |
Audit | 78,093 | |
Legal | 33,320 | |
Interest | 7,056 | |
Miscellaneous | 82,578 | |
Total expenses before reductions | 36,568,851 | |
Expense reductions | (575,254) | 35,993,597 |
Net investment income (loss) | | 93,641,028 |
Realized and Unrealized Gain (Loss) Net realized gain (loss) on: | | |
Investment securities: | | |
Unaffiliated issuers (net of foreign taxes of $171,799) | 376,291,349 | |
Foreign currency transactions | (269,831) | |
Total net realized gain (loss) | | 376,021,518 |
Change in net unrealized appreciation (depreciation) on: Investment securities (net of decrease in deferred foreign taxes of $170,609) | 339,357,549 | |
Assets and liabilities in foreign currencies | 40,455 | |
Total change in net unrealized appreciation (depreciation) | | 339,398,004 |
Net gain (loss) | | 715,419,522 |
Net increase (decrease) in net assets resulting from operations | | $ 809,060,550 |
Statement of Changes in Net Assets
| Year ended
December 31, 2010 | Year ended
December 31, 2009 |
Increase (Decrease) in Net Assets | | |
Operations | | |
Net investment income (loss) | $ 93,641,028 | $ 115,365,664 |
Net realized gain (loss) | 376,021,518 | (309,873,827) |
Change in net unrealized appreciation (depreciation) | 339,398,004 | 1,591,452,108 |
Net increase (decrease) in net assets resulting from operations | 809,060,550 | 1,396,943,945 |
Distributions to shareholders from net investment income | (98,879,089) | (115,095,209) |
Share transactions - net increase (decrease) | (619,890,150) | (545,969,487) |
Redemption fees | 2,603 | 1,473 |
Total increase (decrease) in net assets | 90,293,914 | 735,880,722 |
| | |
Net Assets | | |
Beginning of period | 5,913,153,565 | 5,177,272,843 |
End of period (including distributions in excess of net investment income of $1,868,429 and undistributed net investment income of $3,552,237, respectively) | $ 6,003,447,479 | $ 5,913,153,565 |
See accompanying notes which are an integral part of the financial statements.
Annual Report
Financial Highlights - Initial Class
Years ended December 31, | 2010 | 2009 | 2008 | 2007 | 2006 |
Selected Per-Share Data | | | | | |
Net asset value, beginning of period | $ 16.81 | $ 13.18 | $ 23.91 | $ 26.20 | $ 25.49 |
Income from Investment Operations | | | | | |
Net investment income (loss) C | .30 | .33 | .47 | .47 | .45 |
Net realized and unrealized gain (loss) | 2.24 | 3.64 | (10.67) | (.05) | 4.37 |
Total from investment operations | 2.54 | 3.97 | (10.20) | .42 | 4.82 |
Distributions from net investment income | (.33) | (.34) | (.51) | (.50) | (.89) |
Distributions from net realized gain | - | - | (.02) | (2.21) | (3.22) |
Total distributions | (.33) | (.34) | (.53) | (2.71) | (4.11) |
Redemption fees added to paid in capital C,G | - | - | - | - | - |
Net asset value, end of period | $ 19.02 | $ 16.81 | $ 13.18 | $ 23.91 | $ 26.20 |
Total Return A,B | 15.15% | 30.21% | (42.65)% | 1.53% | 20.19% |
Ratios to Average Net Assets D,F | | | | | |
Expenses before reductions | .56% | .58% | .57% | .55% | .57% |
Expenses net of fee waivers, if any | .55% | .58% | .57% | .55% | .57% |
Expenses net of all reductions | .55% | .58% | .57% | .54% | .56% |
Net investment income (loss) | 1.71% | 2.29% | 2.37% | 1.71% | 1.76% |
Supplemental Data | | | | | |
Net assets, end of period (000 omitted) | $ 3,798,310 | $ 3,771,733 | $ 3,322,799 | $ 7,201,655 | $ 8,315,159 |
Portfolio turnover rate E | 29% | 29% | 34% | 20% | 22% |
A Total returns do not reflect charges attributable to your insurance company's separate account. Inclusion of these charges would reduce the total returns shown.
B Total returns would have been lower had certain expenses not been reduced during the periods shown.
C Calculated based on average shares outstanding during the period.
D Fees and expenses of the underlying Fidelity Central Funds are not included in the Fund's expense ratio. The Fund indirectly bears its proportionate share of the expenses of any underlying Fidelity Central Funds.
E Amount does not include the portfolio activity of any underlying Fidelity Central Funds.
F Expense ratios reflect operating expenses of the class. Expenses before reductions do not reflect amounts reimbursed by the investment adviser or reductions from brokerage service arrangements or reductions from other expense offset arrangements and do not represent the amount paid by the class during periods when reimbursements or reductions occur. Expenses net of fee waivers reflect expenses after reimbursement by the investment adviser but prior to reductions from brokerage service arrangements or other expense offset arrangements. Expenses net of all reductions represent the net expenses paid by the class.
G Amount represents less than $.01 per share.
Financial Highlights - Service Class
Years ended December 31, | 2010 | 2009 | 2008 | 2007 | 2006 |
Selected Per-Share Data | | | | | |
Net asset value, beginning of period | $ 16.75 | $ 13.14 | $ 23.82 | $ 26.11 | $ 25.39 |
Income from Investment Operations | | | | | |
Net investment income (loss) C | .28 | .31 | .44 | .44 | .43 |
Net realized and unrealized gain (loss) | 2.24 | 3.63 | (10.62) | (.05) | 4.35 |
Total from investment operations | 2.52 | 3.94 | (10.18) | .39 | 4.78 |
Distributions from net investment income | (.31) | (.33) | (.48) | (.47) | (.84) |
Distributions from net realized gain | - | - | (.02) | (2.21) | (3.22) |
Total distributions | (.31) | (.33) | (.50) | (2.68) | (4.06) |
Redemption fees added to paid in capital C,G | - | - | - | - | - |
Net asset value, end of period | $ 18.96 | $ 16.75 | $ 13.14 | $ 23.82 | $ 26.11 |
Total Return A,B | 15.09% | 30.03% | (42.70)% | 1.42% | 20.08% |
Ratios to Average Net Assets D,F | | | | | |
Expenses before reductions | .66% | .68% | .67% | .65% | .67% |
Expenses net of fee waivers, if any | .65% | .68% | .67% | .65% | .67% |
Expenses net of all reductions | .65% | .68% | .67% | .64% | .66% |
Net investment income (loss) | 1.61% | 2.19% | 2.27% | 1.61% | 1.66% |
Supplemental Data | | | | | |
Net assets, end of period (000 omitted) | $ 414,431 | $ 430,383 | $ 405,082 | $ 920,054 | $ 1,118,333 |
Portfolio turnover rate E | 29% | 29% | 34% | 20% | 22% |
A Total returns do not reflect charges attributable to your insurance company's separate account. Inclusion of these charges would reduce the total returns shown.
B Total returns would have been lower had certain expenses not been reduced during the periods shown.
C Calculated based on average shares outstanding during the period.
D Fees and expenses of the underlying Fidelity Central Funds are not included in the Fund's expense ratio. The Fund indirectly bears its proportionate share of the expenses of any underlying Fidelity Central Funds.
E Amount does not include the portfolio activity of any underlying Fidelity Central Funds.
F Expense ratios reflect operating expenses of the class. Expenses before reductions do not reflect amounts reimbursed by the investment adviser or reductions from brokerage service arrangements or reductions from other expense offset arrangements and do not represent the amount paid by the class during periods when reimbursements or reductions occur. Expenses net of fee waivers reflect expenses after reimbursement by the investment adviser but prior to reductions from brokerage service arrangements or other expense offset arrangements. Expenses net of all reductions represent the net expenses paid by the class.
G Amount represents less than $.01 per share.
See accompanying notes which are an integral part of the financial statements.
Annual Report
Financial Highlights - Service Class 2
Years ended December 31, | 2010 | 2009 | 2008 | 2007 | 2006 |
Selected Per-Share Data | | | | | |
Net asset value, beginning of period | $ 16.57 | $ 13.00 | $ 23.57 | $ 25.87 | $ 25.17 |
Income from Investment Operations | | | | | |
Net investment income (loss) C | .25 | .29 | .41 | .39 | .38 |
Net realized and unrealized gain (loss) | 2.21 | 3.58 | (10.50) | (.04) | 4.32 |
Total from investment operations | 2.46 | 3.87 | (10.09) | .35 | 4.70 |
Distributions from net investment income | (.28) | (.30) | (.46) | (.44) | (.78) |
Distributions from net realized gain | - | - | (.02) | (2.21) | (3.22) |
Total distributions | (.28) | (.30) | (.48) | (2.65) | (4.00) |
Redemption fees added to paid in capital C,G | - | - | - | - | - |
Net asset value, end of period | $ 18.75 | $ 16.57 | $ 13.00 | $ 23.57 | $ 25.87 |
Total Return A,B | 14.92% | 29.88% | (42.81)% | 1.27% | 19.93% |
Ratios to Average Net Assets D,F | | | | | |
Expenses before reductions | .81% | .83% | .82% | .80% | .82% |
Expenses net of fee waivers, if any | .80% | .83% | .82% | .80% | .82% |
Expenses net of all reductions | .80% | .83% | .82% | .80% | .82% |
Net investment income (loss) | 1.46% | 2.04% | 2.12% | 1.46% | 1.51% |
Supplemental Data | | | | | |
Net assets, end of period (000 omitted) | $ 1,619,356 | $ 1,558,421 | $ 1,321,569 | $ 2,583,129 | $ 2,373,059 |
Portfolio turnover rate E | 29% | 29% | 34% | 20% | 22% |
A Total returns do not reflect charges attributable to your insurance company's separate account. Inclusion of these charges would reduce the total returns shown.
B Total returns would have been lower had certain expenses not been reduced during the periods shown.
C Calculated based on average shares outstanding during the period.
D Fees and expenses of the underlying Fidelity Central Funds are not included in the Fund's expense ratio. The Fund indirectly bears its proportionate share of the expenses of any underlying Fidelity Central Funds.
E Amount does not include the portfolio activity of any underlying Fidelity Central Funds.
F Expense ratios reflect operating expenses of the class. Expenses before reductions do not reflect amounts reimbursed by the investment adviser or reductions from brokerage service arrangements or reductions from other expense offset arrangements and do not represent the amount paid by the class during periods when reimbursements or reductions occur. Expenses net of fee waivers reflect expenses after reimbursement by the investment adviser but prior to reductions from brokerage service arrangements or other expense offset arrangements. Expenses net of all reductions represent the net expenses paid by the class.
G Amount represents less than $.01 per share.
Financial Highlights - Service Class 2R
Years ended December 31, | 2010 | 2009 | 2008 | 2007 | 2006 |
Selected Per-Share Data | | | | | |
Net asset value, beginning of period | $ 16.49 | $ 12.93 | $ 23.44 | $ 25.73 | $ 25.08 |
Income from Investment Operations | | | | | |
Net investment income (loss) C | .25 | .28 | .41 | .39 | .38 |
Net realized and unrealized gain (loss) | 2.20 | 3.58 | (10.45) | (.04) | 4.29 |
Total from investment operations | 2.45 | 3.86 | (10.04) | .35 | 4.67 |
Distributions from net investment income | (.28) | (.30) | (.45) | (.43) | (.80) |
Distributions from net realized gain | - | - | (.02) | (2.21) | (3.22) |
Total distributions | (.28) | (.30) | (.47) | (2.64) | (4.02) |
Redemption fees added to paid in capital C,G | - | - | - | - | - |
Net asset value, end of period | $ 18.66 | $ 16.49 | $ 12.93 | $ 23.44 | $ 25.73 |
Total Return A,B | 14.90% | 29.95% | (42.82)% | 1.27% | 19.89% |
Ratios to Average Net Assets D,F | | | | | |
Expenses before reductions | .81% | .83% | .82% | .80% | .82% |
Expenses net of fee waivers, if any | .80% | .83% | .82% | .80% | .82% |
Expenses net of all reductions | .80% | .83% | .81% | .79% | .81% |
Net investment income (loss) | 1.46% | 2.04% | 2.12% | 1.46% | 1.51% |
Supplemental Data | | | | | |
Net assets, end of period (000 omitted) | $ 5,405 | $ 5,259 | $ 5,339 | $ 13,558 | $ 17,089 |
Portfolio turnover rate E | 29% | 29% | 34% | 20% | 22% |
A Total returns do not reflect charges attributable to your insurance company's separate account. Inclusion of these charges would reduce the total returns shown.
B Total returns would have been lower had certain expenses not been reduced during the periods shown.
C Calculated based on average shares outstanding during the period.
D Fees and expenses of the underlying Fidelity Central Funds are not included in the Fund's expense ratio. The Fund indirectly bears its proportionate share of the expenses of any underlying Fidelity Central Funds.
E Amount does not include the portfolio activity of any underlying Fidelity Central Funds.
F Expense ratios reflect operating expenses of the class. Expenses before reductions do not reflect amounts reimbursed by the investment adviser or reductions from brokerage service arrangements or reductions from other expense offset arrangements and do not represent the amount paid by the class during periods when reimbursements or reductions occur. Expenses net of fee waivers reflect expenses after reimbursement by the investment adviser but prior to reductions from brokerage service arrangements or other expense offset arrangements. Expenses net of all reductions represent the net expenses paid by the class.
G Amount represents less than $.01 per share.
See accompanying notes which are an integral part of the financial statements.
Annual Report
Financial Highlights - Investor Class
Years ended December 31, | 2010 | 2009 | 2008 | 2007 | 2006 |
Selected Per-Share Data | | | | | |
Net asset value, beginning of period | $ 16.77 | $ 13.15 | $ 23.85 | $ 26.15 | $ 25.48 |
Income from Investment Operations | | | | | |
Net investment income (loss) C | .28 | .31 | .44 | .44 | .42 |
Net realized and unrealized gain (loss) | 2.23 | 3.64 | (10.63) | (.05) | 4.36 |
Total from investment operations | 2.51 | 3.95 | (10.19) | .39 | 4.78 |
Distributions from net investment income | (.31) | (.33) | (.49) | (.48) | (.89) |
Distributions from net realized gain | - | - | (.02) | (2.21) | (3.22) |
Total distributions | (.31) | (.33) | (.51) | (2.69) | (4.11) |
Redemption fees added to paid in capital C,G | - | - | - | - | - |
Net asset value, end of period | $ 18.97 | $ 16.77 | $ 13.15 | $ 23.85 | $ 26.15 |
Total Return A,B | 15.04% | 30.09% | (42.71)% | 1.39% | 20.04% |
Ratios to Average Net Assets D,F | | | | | |
Expenses before reductions | .65% | .68% | .66% | .66% | .69% |
Expenses net of fee waivers, if any | .64% | .68% | .66% | .66% | .69% |
Expenses net of all reductions | .64% | .68% | .66% | .66% | .69% |
Net investment income (loss) | 1.62% | 2.19% | 2.28% | 1.60% | 1.63% |
Supplemental Data | | | | | |
Net assets, end of period (000 omitted) | $ 165,946 | $ 147,358 | $ 122,483 | $ 230,534 | $ 170,050 |
Portfolio turnover rate E | 29% | 29% | 34% | 20% | 22% |
A Total returns do not reflect charges attributable to your insurance company's separate account. Inclusion of these charges would reduce the total returns shown.
B Total returns would have been lower had certain expenses not been reduced during the periods shown.
C Calculated based on average shares outstanding during the period.
D Fees and expenses of the underlying Fidelity Central Funds are not included in the Fund's expense ratio. The Fund indirectly bears its proportionate share of the expenses of any underlying Fidelity Central Funds.
E Amount does not include the portfolio activity of any underlying Fidelity Central Funds.
F Expense ratios reflect operating expenses of the class. Expenses before reductions do not reflect amounts reimbursed by the investment adviser or reductions from brokerage service arrangements or reductions from other expense offset arrangements and do not represent the amount paid by the class during periods when reimbursements or reductions occur. Expenses net of fee waivers reflect expenses after reimbursement by the investment adviser but prior to reductions from brokerage service arrangements or other expense offset arrangements. Expenses net of all reductions represent the net expenses paid by the class.
G Amount represents less than $.01 per share.
See accompanying notes which are an integral part of the financial statements.
Annual Report
Notes to Financial Statements
For the period ended December 31, 2010
1. Organization.
VIP Equity-Income Portfolio (the Fund) is a fund of Variable Insurance Products Fund (the Trust) and is authorized to issue an unlimited number of shares. The Trust is registered under the Investment Company Act of 1940, as amended (the 1940 Act), as an open-end management investment company organized as a Massachusetts business trust. Shares of the Fund may only be purchased by insurance companies for the purpose of funding variable annuity or variable life insurance contracts. The Fund offers the following classes of shares: Initial Class shares, Service Class shares, Service Class 2 shares, Service Class 2R shares, and Investor Class shares. All classes have equal rights and voting privileges, except for matters affecting a single class. Investment income, realized and unrealized capital gains and losses, the common expenses of the Fund, and certain fund-level expense reductions, if any, are allocated on a pro-rata basis to each class based on the relative net assets of each class to the total net assets of the Fund. Each class differs with respect to transfer agent and distribution and service plan fees incurred. Certain expense reductions may also differ by class.
2. Investments in Fidelity Central Funds.
The Fund may invest in Fidelity Central Funds, which are open-end investment companies available only to other investment companies and accounts managed by Fidelity Management & Research Company (FMR) and its affiliates. The Fund's Schedule of Investments lists each of the Fidelity Central Funds held as of period end, if any, as an investment of the Fund, but does not include the underlying holdings of each Fidelity Central Fund. As an Investing Fund, the Fund indirectly bears its proportionate share of the expenses of the underlying Fidelity Central Funds.
The Money Market Central Funds seek preservation of capital and current income and are managed by Fidelity Investments Money Management, Inc. (FIMM), an affiliate of FMR.
A complete unaudited list of holdings for each Fidelity Central Fund is available upon request or at the Securities and Exchange Commission (the SEC) web site at www.sec.gov. In addition, the financial statements of the Fidelity Central Funds, which are not covered by the Fund's Report of Independent Registered Public Accounting Firm, are available on the SEC web site or upon request.
3. Significant Accounting Policies.
The financial statements have been prepared in conformity with accounting principles generally accepted in the United States of America (GAAP), which require management to make certain estimates and assumptions at the date of the financial statements. Actual results could differ from those estimates. Subsequent events, if any, through the date that the financial statements were issued have been evaluated in the preparation of the financial statements. The following summarizes the significant accounting policies of the Fund:
Security Valuation. Investments are valued as of 4:00 p.m. Eastern time on the last calendar day of the period. The Fund uses independent pricing services approved by the Board of Trustees to value its investments. When current market prices or quotations are not readily available or reliable, valuations may be determined in good faith in accordance with procedures adopted by the Board of Trustees. Factors used in determining value may include market or security specific events, changes in interest rates and credit quality. The frequency with which these procedures are used cannot be predicted and they may be utilized to a significant extent. The value used for net asset value (NAV) calculation under these procedures may differ from published prices for the same securities.
The Fund categorizes the inputs to valuation techniques used to value its investments into a disclosure hierarchy consisting of three levels as shown below.
Level 1 - quoted prices in active markets for identical investments
Level 2 - other significant observable inputs (including quoted prices for similar investments, interest rates, prepayment speeds, etc.)
Level 3 - unobservable inputs (including the Fund's own assumptions based on the best information available)
Changes in valuation techniques may result in transfers in or out of an assigned level within the disclosure hierarchy. The aggregate value of investments by input level, as of December 31, 2010, is included at the end of the Fund's Schedule of Investments. Valuation techniques used to value the Fund's investments by major category are as follows.
Equity securities, including restricted securities, for which market quotations are readily available, are valued at the last reported sale price or official closing price as reported by an independent pricing service on the primary market or exchange on which they are traded and are categorized as Level 1 in the hierarchy. In the event there were no sales during the day or closing prices are not available, securities are valued at the last quoted bid price or may be valued using the last available price and are generally categorized as Level 2 in the hierarchy. For foreign equity securities, when significant market or security specific events arise, comparisons to the valuation of American Depositary Receipts (ADRs), futures contracts, Exchange-traded funds (ETFs) and certain indexes as well as quoted prices for similar securities are used and are categorized as Level 2 in the hierarchy in these circumstances. Utilizing these techniques may result in transfers between Level 1 and Level 2. For restricted equity securities and private placements where observable inputs are limited, assumptions about market activity and risk are used and are categorized as Level 3 in the hierarchy.
Annual Report
3. Significant Accounting Policies - continued
Security Valuation - continued
Debt securities, including restricted securities, are valued based on evaluated prices received from independent pricing services or from dealers who make markets in such securities. For corporate bonds, pricing services utilize matrix pricing which considers yield or price of bonds of comparable quality, coupon, maturity and type as well as dealer supplied prices and are generally categorized as Level 2 in the hierarchy.
Investments in open-end mutual funds, including the Fidelity Central Funds, are valued at their closing net asset value each business day and are categorized as Level 1 in the hierarchy.
When independent prices are unavailable or unreliable, debt securities may be valued utilizing pricing matrices which consider similar factors that would be used by independent pricing services. These are generally categorized as Level 2 in the hierarchy but may be Level 3 depending on the circumstances.
Foreign Currency. The Fund uses foreign currency contracts to facilitate transactions in foreign-denominated securities. Gains and losses from these transactions may arise from changes in the value of the foreign currency or if the counterparties do not perform under the contracts' terms.
Foreign-denominated assets, including investment securities, and liabilities are translated into U.S. dollars at the exchange rate at period end. Purchases and sales of investment securities, income and dividends received and expenses denominated in foreign currencies are translated into U.S. dollars at the exchange rate in effect on the transaction date.
The effects of exchange rate fluctuations on investments are included with the net realized and unrealized gain (loss) on investment securities. Other foreign currency transactions resulting in realized and unrealized gain (loss) are disclosed separately.
Investment Transactions and Income. For financial reporting purposes, the Fund's investment holdings and NAV include trades executed through the end of the last business day of the period. The NAV per share for processing shareholder transactions is calculated as of the close of business of the New York Stock Exchange (NYSE), normally 4:00 p.m. Eastern time and includes trades executed through the end of the prior business day. Gains and losses on securities sold are determined on the basis of identified cost and may include proceeds received from litigation. Dividend income is recorded on the ex-dividend date, except for certain dividends from foreign securities where the ex-dividend date may have passed, which are recorded as soon as the Fund is informed of the ex-dividend date. Non-cash dividends included in dividend income, if any, are recorded at the fair market value of the securities received. Distributions received on securities that represent a return of capital or capital gain are recorded as a reduction of cost of investments and/or as a realized gain. The Fund estimates the components of distributions received that may be considered return of capital distributions or capital gain distributions. Interest income and distributions from the Fidelity Central Funds are accrued as earned. Interest income includes coupon interest and amortization of premium and accretion of discount on debt securities. Investment income is recorded net of foreign taxes withheld where recovery of such taxes is uncertain.
Expenses. Expenses directly attributable to a fund are charged to that fund. Expenses attributable to more than one fund are allocated among the respective funds on the basis of relative net assets or other appropriate methods. Expense estimates are accrued in the period to which they relate and adjustments are made when actual amounts are known.
Deferred Trustee Compensation. Under a Deferred Compensation Plan (the Plan), independent Trustees may elect to defer receipt of a portion of their annual compensation. Deferred amounts are invested in a cross-section of Fidelity funds, are marked-to-market and remain in the Fund until distributed in accordance with the Plan. The investment of deferred amounts and the offsetting payable to the Trustees are included in the accompanying Statement of Assets and Liabilities.
Income Tax Information and Distributions to Shareholders. Each year the Fund intends to qualify as a regulated investment company, including distributing substantially all of its taxable income and realized gains under Subchapter M of the Internal Revenue Code and filing its U.S. federal tax return. As a result, no provision for income taxes is required. As of December 31, 2010, the Fund did not have any unrecognized tax benefits in the accompanying financial statements. A fund's federal tax return is subject to examination by the Internal Revenue Service (IRS) for a period of three years. Foreign taxes are provided for based on the Fund's understanding of the tax rules and rates that exist in the foreign markets in which it invests.
Distributions are declared and recorded on the ex-dividend date. Income dividends and capital gain distributions are declared separately for each class. Income and capital gain distributions are determined in accordance with income tax regulations, which may differ from GAAP.
Capital accounts within the financial statements are adjusted for permanent book-tax differences. These adjustments have no impact on net assets or the results of operations. Temporary book-tax differences will reverse in a subsequent period.
Book-tax differences are primarily due to foreign currency transactions, certain foreign taxes, market discount, deferred trustees compensation, capital loss carryforwards and losses deferred due to wash sales.
Annual Report
Notes to Financial Statements - continued
3. Significant Accounting Policies - continued
Income Tax Information and Distributions to Shareholders - continued
The federal tax cost of investment securities and unrealized appreciation (depreciation) as of period end were as follows:
Gross unrealized appreciation | $ 1,311,972,907 |
Gross unrealized depreciation | (866,844,462) |
Net unrealized appreciation (depreciation) | $ 445,128,445 |
Tax Cost | $ 5,561,361,748 |
The tax-based components of distributable earnings as of period end were as follows:
Capital loss carryforward | $ (168,007,461) |
Net unrealized appreciation (depreciation) | $ 445,174,417 |
The tax character of distributions paid was as follows:
| December 31, 2010 | December 31, 2009 |
Ordinary Income | $ 98,879,089 | $ 115,095,209 |
Trading (Redemption) Fees. Service Class 2R shares held by investors less than 60 days are subject to a redemption fee equal to 1% of the net asset value of shares redeemed. All redemption fees, which reduce the proceeds of the shareholder redemption, are retained by the Fund and accounted for as an addition to paid in capital.
4. Operating Policies.
Restricted Securities. The Fund may invest in securities that are subject to legal or contractual restrictions on resale. These securities generally may be resold in transactions exempt from registration or to the public if the securities are registered. Disposal of these securities may involve time-consuming negotiations and expense, and prompt sale at an acceptable price may be difficult. Information regarding restricted securities is included at the end of the Fund's Schedule of Investments.
5. Purchases and Sales of Investments.
Purchases and sales of securities, other than short-term securities, aggregated $1,645,368,856 and $2,315,535,549, respectively.
6. Fees and Other Transactions with Affiliates.
Management Fee. FMR and its affiliates provide the Fund with investment management related services for which the Fund pays a monthly management fee. The management fee is the sum of an individual fund fee rate that is based on an annual rate of .20% of the Fund's average net assets and a group fee rate that averaged .26% during the period. The group fee rate is based upon the average net assets of all the mutual funds advised by FMR. The group fee rate decreases as assets under management increase and increases as assets under management decrease. For the period, the total annual management fee rate was .46% of the Fund's average net assets.
Distribution and Service Plan Fees. In accordance with Rule 12b-1 of the 1940 Act, the Fund has adopted separate 12b-1 Plans for each Service Class of shares. Each Service Class pays Fidelity Distributors Corporation (FDC), an affiliate of FMR, a service fee. For the period, the service fee is based on an annual rate of .10% of Service Class' average net assets and .25% of Service Class 2's and Service Class 2R's average net assets.
For the period, total fees, all of which were re-allowed to insurance companies for the distribution of shares and providing shareholder support services were as follows:
Service Class | $ 408,532 |
Service Class 2 | 3,821,620 |
Service Class 2R | 13,739 |
| $ 4,243,891 |
Annual Report
6. Fees and Other Transactions with Affiliates - continued
Transfer Agent Fees. Fidelity Investments Institutional Operations Company, Inc. (FIIOC), an affiliate of FMR, is the Fund's transfer, dividend disbursing, and shareholder servicing agent. FIIOC receives an asset-based fee with respect to each class. Each class (with the exception of Investor Class) pays a transfer agent fee, excluding out of pocket expenses, equal to an annual rate of .07% of average net assets. Investor Class pays a monthly asset-based transfer agent fee of .15% of average net assets. In addition, FIIOC receives an asset-based fee of .01% of average net assets for typesetting, printing and mailing of shareholder reports, except proxy statements. FIIOC has agreed to voluntarily waive this fee until December 31, 2010 (See Note 10: Expense Reductions.) For the period, transfer agent fees for each class, including printing and out of pocket expenses, were as follows:
Initial Class | $ 2,741,443 |
Service Class | 306,678 |
Service Class 2 | 1,152,436 |
Service Class 2R | 4,090 |
Investor Class | 241,751 |
| $ 4,446,398 |
Accounting and Security Lending Fees. Fidelity Service Company, Inc. (FSC), an affiliate of FMR, maintains the Fund's accounting records. The accounting fee is based on the level of average net assets for the month. Under a separate contract, FSC administers the security lending program. The security lending fee is based on the number and duration of lending transactions.
Brokerage Commissions. The Fund placed a portion of its portfolio transactions with brokerage firms which are affiliates of the investment adviser. The commissions paid to these affiliated firms were $21,052 for the period.
Interfund Lending Program. Pursuant to an Exemptive Order issued by the SEC, the Fund, along with other registered investment companies having management contracts with FMR, may participate in an interfund lending program. This program provides an alternative credit facility allowing the funds to borrow from, or lend money to, other participating affiliated funds. At period end, there were no interfund loans outstanding. The Fund's activity in this program during the period for which loans were outstanding was as follows:
Borrower or Lender | Average Daily
Loan Balance | Weighted Average Interest Rate | Interest
Expense |
Borrower | $ 10,269,037 | .45% | $ 6,877 |
7. Committed Line of Credit.
The Fund participates with other funds managed by FMR or an affiliate in a $3.75 billion credit facility (the "line of credit") to be utilized for temporary or emergency purposes to fund shareholder redemptions or for other short-term liquidity purposes. The Fund has agreed to pay commitment fees on its pro-rata portion of the line of credit, which amounted to $22,836 and is reflected in Miscellaneous expenses on the Statement of Operations. During the period, there were no borrowings on this line of credit.
8. Security Lending.
The Fund lends portfolio securities through a lending agent from time to time in order to earn additional income. The lending agent may loan securities to certain qualified borrowers, including Fidelity Capital Markets (FCM), a broker-dealer affiliated with the Fund. On the settlement date of the loan, the Fund receives collateral (in the form of U.S. Treasury obligations, letters of credit and/or cash) against the loaned securities and maintains collateral in an amount not less than 100% of the market value of the loaned securities during the period of the loan. The market value of the loaned securities is determined at the close of business of the Fund and any additional required collateral is delivered to the Fund on the next business day. If the borrower defaults on its obligation to return the securities loaned because of insolvency or other reasons, a fund could experience delays and costs in recovering the securities loaned or in gaining access to the collateral. Any cash collateral received is invested in the Fidelity Securities Lending Cash Central Fund. The value of loaned securities and cash collateral at period end are disclosed on the Fund's Statement of Assets and Liabilities. Security lending income represents the income earned on investing cash collateral, less rebates paid to borrowers and lending agent fees associated with the loan, plus any premium payments received for lending certain types of securities. Security lending income is presented in the Statement of Operations as a component of income from Fidelity Central Funds. Total security lending income during the period amounted to $800,893. During the period, there were no securities loaned to FCM.
9. Bank Borrowings.
The Fund is permitted to have bank borrowings for temporary or emergency purposes to fund shareholder redemptions. The Fund has established borrowing arrangements with certain banks. The interest rate on the borrowings is the bank's base rate, as revised from time to time. The average daily loan balance during the period for which loans were outstanding amounted to $9,231,000. The weighted average interest rate was .70%. The interest expense amounted to $179 under the bank borrowing program. At period end, there were no bank borrowings outstanding.
Annual Report
Notes to Financial Statements - continued
10. Expense Reductions.
FMR or its affiliates agreed to waive certain fees during the period as noted in the table below.
Initial Class | $ 264,507 |
Service Class | 29,610 |
Service Class 2 | 110,854 |
Service Class 2R | 399 |
Investor Class | 10,794 |
| $ 416,164 |
Many of the brokers with whom FMR places trades on behalf of the Fund provided services to the Fund in addition to trade execution. These services included payments of certain expenses on behalf of the Fund totaling $159,090 for the period.
11. Distributions to Shareholders.
Distributions to shareholders of each class were as follows:
Years ended December 31, | 2010 | 2009 |
From net investment income | | |
Initial Class | $ 64,973,877 | $ 75,517,681 |
Service Class | 6,737,480 | 8,350,109 |
Service Class 2 | 24,391,968 | 28,318,758 |
Service Class 2R | 80,537 | 96,589 |
Investor Class | 2,695,227 | 2,812,072 |
Total | $ 98,879,089 | $ 115,095,209 |
12. Share Transactions.
Transactions for each class of shares were as follows:
| Shares | Dollars |
Years ended December 31, | 2010 | 2009 | 2010 | 2009 |
Initial Class | | | | |
Shares sold | 4,740,512 | 8,717,811 | $ 82,331,514 | $ 119,199,048 |
Reinvestment of distributions | 3,504,835 | 4,649,155 | 64,973,877 | 75,517,681 |
Shares redeemed | (32,979,175) | (41,112,018) | (570,621,114) | (560,835,381) |
Net increase (decrease) | (24,733,828) | (27,745,052) | $ (423,315,723) | $ (366,118,652) |
Service Class | | | | |
Shares sold | 702,398 | 1,374,191 | $ 12,089,968 | $ 18,756,098 |
Reinvestment of distributions | 364,809 | 516,788 | 6,737,480 | 8,350,109 |
Shares redeemed | (4,898,823) | (7,035,493) | (84,563,059) | (95,421,754) |
Net increase (decrease) | (3,831,616) | (5,144,514) | $ (65,735,611) | $ (68,315,547) |
Service Class 2 | | | | |
Shares sold | 6,065,151 | 9,883,762 | $ 102,701,453 | $ 131,168,937 |
Reinvestment of distributions | 1,335,936 | 1,771,906 | 24,391,968 | 28,318,758 |
Shares redeemed | (15,068,707) | (19,265,158) | (257,524,680) | (264,471,751) |
Net increase (decrease) | (7,667,620) | (7,609,490) | $ (130,431,259) | $ (104,984,056) |
Service Class 2R | | | | |
Shares sold | 174,505 | 65,422 | $ 2,953,931 | $ 914,849 |
Reinvestment of distributions | 4,431 | 6,094 | 80,537 | 96,589 |
Shares redeemed | (208,193) | (165,320) | (3,392,012) | (2,222,121) |
Net increase (decrease) | (29,257) | (93,804) | $ (357,544) | $ (1,210,683) |
Investor Class | | | | |
Shares sold | 1,468,527 | 1,142,867 | $ 25,723,911 | $ 16,328,956 |
Reinvestment of distributions | 145,666 | 173,430 | 2,695,227 | 2,812,072 |
Shares redeemed | (1,656,459) | (1,842,484) | (28,469,151) | (24,481,577) |
Net increase (decrease) | (42,266) | (526,187) | $ (50,013) | $ (5,340,549) |
Annual Report
13. Other.
The Fund's organizational documents provide former and current trustees and officers with a limited indemnification against liabilities arising in connection with the performance of their duties to the Fund. In the normal course of business, the Fund may also enter into contracts that provide general indemnifications. The Fund's maximum exposure under these arrangements is unknown as this would be dependent on future claims that may be made against the Fund. The risk of material loss from such claims is considered remote.
At the end of the period, FMR or its affiliates were the owners of record of 12% of the total outstanding shares of the Fund and two otherwise unaffiliated shareholders were the owners of record of 31% of the total outstanding shares of the Fund.
Annual Report
Report of Independent Registered Public Accounting Firm
To the Trustees of Variable Insurance Products Fund and the Shareholders of VIP Equity-Income Portfolio:
In our opinion, the accompanying statement of assets and liabilities, including the schedule of investments, and the related statements of operations and of changes in net assets and the financial highlights present fairly, in all material respects, the financial position of VIP Equity-Income Portfolio (a fund of Variable Insurance Products Fund) at December 31, 2010, the results of its operations for the year then ended, the changes in its net assets for each of the two years in the period then ended and the financial highlights for each of the five years in the period then ended, in conformity with accounting principles generally accepted in the United States of America. These financial statements and financial highlights (hereafter referred to as "financial statements") are the responsibility of the VIP Equity-Income Portfolio's management. Our responsibility is to express an opinion on these financial statements based on our audits. We conducted our audits of these financial statements in accordance with the standards of the Public Company Accounting Oversight Board (United States). Those standards require that we plan and perform the audit to obtain reasonable assurance about whether the financial statements are free of material misstatement. An audit includes examining, on a test basis, evidence supporting the amounts and disclosures in the financial statements, assessing the accounting principles used and significant estimates made by management, and evaluating the overall financial statement presentation. We believe that our audits, which included confirmation of securities at December 31, 2010 by correspondence with the custodian and brokers, provide a reasonable basis for our opinion.
/s/ PricewaterhouseCoopers LLP
PricewaterhouseCoopers LLP
Boston, Massachusetts
February 15, 2011
Annual Report
The Trustees, Members of the Advisory Board, and executive officers of the trust and fund, as applicable, are listed below. The Board of Trustees governs the fund and is responsible for protecting the interests of shareholders. The Trustees are experienced executives who meet periodically throughout the year to oversee the fund's activities, review contractual arrangements with companies that provide services to the fund, oversee management of the risks associated with such activities and contractual arrangements, and review the fund's performance. Except for James C. Curvey, each of the Trustees oversees 219 funds advised by FMR or an affiliate. Mr. Curvey oversees 408 funds advised by FMR or an affiliate.
The Trustees hold office without limit in time except that (a) any Trustee may resign; (b) any Trustee may be removed by written instrument, signed by at least two-thirds of the number of Trustees prior to such removal; (c) any Trustee who requests to be retired or who has become incapacitated by illness or injury may be retired by written instrument signed by a majority of the other Trustees; and (d) any Trustee may be removed at any special meeting of shareholders by a two-thirds vote of the outstanding voting securities of the trust. Each Trustee who is not an interested person (as defined in the 1940 Act) (Independent Trustee), shall retire not later than the last day of the calendar year in which his or her 72nd birthday occurs. The Independent Trustees may waive this mandatory retirement age policy with respect to individual Trustees. The executive officers and Advisory Board Members hold office without limit in time, except that any officer and Advisory Board Member may resign or may be removed by a vote of a majority of the Trustees at any regular meeting or any special meeting of the Trustees. Except as indicated, each individual has held the office shown or other offices in the same company for the past five years.
Experience, Skills, Attributes, and Qualifications of the Fund's Trustees. The Governance and Nominating Committee has adopted a statement of policy that describes the experience, qualifications, attributes, and skills that are necessary and desirable for potential Independent Trustee candidates (Statement of Policy). The Board believes that each Trustee satisfied at the time he or she was initially elected or appointed a Trustee, and continues to satisfy, the standards contemplated by the Statement of Policy. The Governance and Nominating Committee also engages professional search firms to help identify potential Independent Trustee candidates who have the experience, qualifications, attributes, and skills consistent with the Statement of Policy. From time to time, additional criteria based on the composition and skills of the current Independent Trustees, as well as experience or skills that may be appropriate in light of future changes to board composition, business conditions, and regulatory or other developments, have also been considered by the professional search firms and the Governance and Nominating Committee. In addition, the Board takes into account the Trustees' commitment and participation in Board and committee meetings, as well as their leadership of standing and ad hoc committees throughout their tenure.
In determining that a particular Trustee was and continues to be qualified to serve as a Trustee, the Board has considered a variety of criteria, none of which, in isolation, was controlling. The Board believes that, collectively, the Trustees have balanced and diverse experience, qualifications, attributes, and skills, which allow the Board to operate effectively in governing the fund and protecting the interests of shareholders. Information about the specific experience, skills, attributes, and qualifications of each Trustee, which in each case led to the Board's conclusion that the Trustee should serve (or continue to serve) as a trustee of the fund, is provided below.
Board Structure and Oversight Function. James C. Curvey is an interested person (as defined in the 1940 Act) and currently serves as Acting Chairman. The Trustees have determined that an interested Chairman is appropriate and benefits shareholders because an interested Chairman has a personal and professional stake in the quality and continuity of services provided to the fund. Independent Trustees exercise their informed business judgment to appoint an individual of their choosing to serve as Chairman, regardless of whether the Trustee happens to be independent or a member of management. The Independent Trustees have determined that they can act independently and effectively without having an Independent Trustee serve as Chairman and that a key structural component for assuring that they are in a position to do so is for the Independent Trustees to constitute a substantial majority for the Board. The Independent Trustees also regularly meet in executive session. Ned C. Lautenbach serves as Chairman of the Independent Trustees and as such (i) acts as a liaison between the Independent Trustees and management with respect to matters important to the Independent Trustees and (ii) with management prepares agendas for Board meetings.
Fidelity funds are overseen by different Boards of Trustees. The fund's Board oversees Fidelity's equity and high income funds and another Board oversees Fidelity's investment-grade bond, money market, and asset allocation funds. The asset allocation funds may invest in Fidelity funds overseen by the fund's Board. The use of separate Boards, each with its own committee structure, allows the Trustees of each group of Fidelity funds to focus on the unique issues of the funds they oversee, including common research, investment, and operational issues. On occasion, the separate Boards establish joint committees to address issues of overlapping consequences for the Fidelity funds overseen by each Board.
The Trustees operate using a system of committees to facilitate the timely and efficient consideration of all matters of importance to the Trustees, the fund, and fund shareholders and to facilitate compliance with legal and regulatory requirements and oversight of the fund's activities and associated risks. The Board, acting through its committees, has charged FMR and its affiliates with (i) identifying events or circumstances the occurrence of which could have demonstrably adverse effects on the fund's business and/or reputation; (ii) implementing processes and controls to lessen the possibility that such events or circumstances occur or to mitigate the effects of such events or circumstances if they do occur; and (iii) creating and maintaining a system designed to evaluate continuously business and market conditions in order to facilitate the identification and implementation processes described in (i) and (ii) above. Because the day-to-day operations and activities of the fund are carried out by or through FMR, its affiliates and other service providers, the fund's exposure to risks is mitigated but not eliminated by the processes overseen by the Trustees. While each of the Board's committees has responsibility for overseeing different aspects of the fund's activities, oversight is exercised primarily through the Operations, Audit, and Compliance Committees. Appropriate personnel, including but not limited to the fund's Chief Compliance Officer (CCO), FMR's internal auditor, the independent accountants, the fund's Treasurer and portfolio management personnel, make periodic reports to the Board's committees, as appropriate. The responsibilities of each committee, including their oversight responsibilities, are described further under "Standing Committees of the Fund's Trustees."
Annual Report
Trustees and Officers - continued
The fund's Statement of Additional Information (SAI) includes more information about the Trustees. To request a free copy, call Fidelity at 1-877-208-0098.
Interested Trustees*:
Correspondence intended for each Trustee who is an interested person may be sent to Fidelity Investments, 82 Devonshire Street, Boston, Massachusetts 02109.
Name, Age; Principal Occupations and Other Relevant Experience+ |
James C. Curvey (75) |
| Year of Election or Appointment: 2007 Mr. Curvey is Trustee and Acting Chairman of the Board of Trustees of certain Trusts. Mr. Curvey also serves as Trustee (2007-present) of other investment companies advised by FMR. Mr. Curvey is a Director of Fidelity Investments Money Management, Inc. (2009-
present), Director of Fidelity Research & Analysis Co. (2009-present) and Director of FMR and FMR Co., Inc. (2007-present). Mr. Curvey is also Vice Chairman (2007-present) and Director of FMR LLC. In addition, Mr. Curvey serves as an Overseer for the Boston Symphony Orchestra and a member of the Trustees of Villanova University. Previously, Mr. Curvey was the Vice Chairman (2006-2007) and Director (2000-2007) of FMR Corp. |
Ronald P. O'Hanley (54) |
| Year of Election or Appointment: 2011 Mr. O'Hanley is President of Fidelity Asset Management and Corporate Services and a member of Fidelity's Executive Committee (2010-present). Previously, Mr. O'Hanley served as President and Chief Executive Officer of BNY Mellon Asset Management (2007-2010). Mr. O'Hanley also served as Vice Chairman of Bank New York Mellon Corp. and a member of that firm's Executive Committee. Prior to the 2007 merger of The Bank of New York and Mellon Financial Corporation, he was Vice Chairman of Mellon Financial Corporation and President and Chief Executive Officer of Mellon Asset Management. He joined Mellon in February 1997. Mr. O'Hanley currently serves as Chairman of the Boston Public Library Foundation Board of Directors and sits on the Board of Directors of Beth Israel Deaconess Medical Center, the Board of Trustees of the Marine Biological Laboratory and the Advisory Board of the Maxwell School of Citizenship and Public Administration at Syracuse University. Mr. O'Hanley also chairs the Council on Asset Management for the Financial Services Roundtable and is a member of the Board of Directors of Institutional Investor's U.S. Institute. |
* Trustees have been determined to be "Interested Trustees" by virtue of, among other things, their affiliation with the trust or various entities under common control with FMR.
+ The information above includes each Trustee's principal occupation during the last five years and other information relating to the experience, attributes, and skills relevant to each Trustee's qualifications to serve as a Trustee, which led to the conclusion that each Trustee should serve as a Trustee for the fund.
Independent Trustees:
Correspondence intended for each Independent Trustee (that is, the Trustees other than the Interested Trustees) may be sent to Fidelity Investments, P.O. Box 55235, Boston, Massachusetts 02205-5235.
Name, Age; Principal Occupations and Other Relevant Experience+ |
Dennis J. Dirks (62) |
| Year of Election or Appointment: 2005 Prior to his retirement in May 2003, Mr. Dirks was Chief Operating Officer and a member of the Board of The Depository Trust & Clearing Corporation (DTCC). He also served as President, Chief Operating Officer, and Board member of The Depository Trust Company (DTC) and President and Board member of the National Securities Clearing Corporation (NSCC). In addition, Mr. Dirks served as Chief Executive Officer and Board member of the Government Securities Clearing Corporation, Chief Executive Officer and Board member of the Mortgage-Backed Securities Clearing Corporation, as a Trustee and a member of the Finance Committee of Manhattan College (2005-2008), and as a Trustee and a member of the Finance Committee of AHRC of Nassau County (2006-2008). Mr. Dirks is a member of the Independent Directors Council (IDC) Governing Council (2010-Present) and Board of Directors for The Brookville Center for Children's Services, Inc. (2009-present). |
Alan J. Lacy (57) |
| Year of Election or Appointment: 2008 Mr. Lacy serves as Senior Adviser (2007-present) of Oak Hill Capital Partners, L.P. (private equity). Mr. Lacy also served as Chief Executive Officer (2000-2005) and Vice Chairman (2005-2006) of Sears Holdings Corporation and Sears, Roebuck and Co. (retail). In addition, Mr. Lacy serves as a member of the Board of Directors of The Western Union Company (global money transfer, 2006-present) and Bristol-Myers Squibb Company (global pharmaceuticals, 2007-present). Mr. Lacy is Chairman (2008-present) and a member (2006-present) of the Board of Trustees of The National Parks Conservation Association. |
Ned C. Lautenbach (66) |
| Year of Election or Appointment: 2000 Mr. Lautenbach is Chairman of the Independent Trustees of the Equity and High Income Funds (2006-present). Mr. Lautenbach currently serves as the Lead Director of the Eaton Corporation Board of Directors (diversified industrial, 1997-present). Mr. Lautenbach is also a member of the Board of Directors of the Philharmonic Center for the Arts in Naples, Florida (1999-
present); a member of the Board of Trustees of Fairfield University (2005-present); and a member of the Council on Foreign Relations (1994-present). Previously, Mr. Lautenbach was a Partner/Advisory Partner at Clayton, Dubilier & Rice, Inc. (private equity investment, 1998-2010), as well as a Director of Sony Corporation (2006-2007). |
Joseph Mauriello (66) |
| Year of Election or Appointment: 2008 Prior to his retirement in January 2006, Mr. Mauriello served in numerous senior management positions including Deputy Chairman and Chief Operating Officer (2004-2005), and Vice Chairman of Financial Services (2002-2004) of KPMG LLP US (professional services, 1965-2005). Mr. Mauriello currently serves as a member of the Board of Directors of XL Group plc. (global insurance and re-insurance, 2006-present) and of Arcadia Resources Inc. (health care services and products, 2007-present). Previously, Mr. Mauriello served as a Director of the Hamilton Funds of the Bank of New York (2006-2007). |
Cornelia M. Small (66) |
| Year of Election or Appointment: 2005 Ms. Small is a member of the Board of Directors of the Teagle Foundation (2009-present). Ms. Small is also a member of the Investment Committee, and Chair (2008-present) and a member of the Board of Trustees of Smith College. In addition, Ms. Small serves on the Investment Committee of the Berkshire Taconic Community Foundation (2008-present). Previously, Ms. Small served as Chairperson of the Investment Committee (2002-2008) of Smith College. In addition, Ms. Small served as Chief Investment Officer, Director of Global Equity Investments, and a member of the Board of Directors of Scudder, Stevens & Clark and Scudder Kemper Investments. |
William S. Stavropoulos (71) |
| Year of Election or Appointment: 2001 Mr. Stavropoulos is Vice Chairman of the Independent Trustees of the Equity and High Income Funds (2006-present). Mr. Stavropoulos serves as President and Founder of the Michigan Baseball Foundation, the Great Lakes Loons (2007-present). Mr. Stavropoulos is Chairman Emeritus of the Board of Directors of The Dow Chemical Company, where he previously served in numerous senior management positions, including President, CEO (1995-2000; 2002-2004), Chairman of the Executive Committee (2000-2006), and as a member of the Board of Directors (1990-2006). Currently, Mr. Stavropoulos is Chairman of Univar (global distributor of commodity and specialty chemicals, 2010-present), a Director of Teradata Corporation (data warehousing and technology solutions, 2008-present), Chemical Financial Corporation, Maersk Inc. (industrial conglomerate), Tyco International, Inc. (multinational manufacturing and services, 2007-present), and a member of the Advisory Board for Metalmark Capital (private equity investment, 2005-present). Mr. Stavropoulos is a special advisor to Clayton, Dubilier & Rice, LLC (private equity investment). In addition, Mr. Stavropoulos is a member of the University of Notre Dame Advisory Council for the College of Science. |
David M. Thomas (61) |
| Year of Election or Appointment: 2008 Previously, Mr. Thomas served as Executive Chairman (2005-2006) and Chairman and Chief Executive Officer (2000-2005) of IMS Health, Inc. (pharmaceutical and healthcare information solutions). In addition, Mr. Thomas serves as a member of the Board of Directors of Fortune Brands, Inc. (consumer products), and Interpublic Group of Companies, Inc. (marketing communication, 2004-present). |
Michael E. Wiley (60) |
| Year of Election or Appointment: 2008 Mr. Wiley also serves as a Director of Asia Pacific Exploration Consolidated (international oil and gas exploration and production, 2008-present). Mr. Wiley serves as a Director of Tesoro Corporation (independent oil refiner and marketer, 2005-present), and a Director of Bill Barrett Corporation (exploration and production, 2005-present). In addition, Mr. Wiley also serves as a Director of Post Oak Bank (privately-held bank, 2004-present). Previously, Mr. Wiley served as a member of the Board of Trustees of the University of Tulsa (2000-2006; 2007-2010), as a Senior Energy Advisor of Katzenbach Partners, LLC (consulting, 2006-2007), as an Advisory Director of Riverstone Holdings (private investment), Chairman, President, and CEO of Baker Hughes, Inc. (oilfield services, 2000-2004), and as Director of Spinnaker Exploration Company (exploration and production, 2001-2005). |
+ The information above includes each Trustee's principal occupation during the last five years and other information relating to the experience, attributes, and skills relevant to each Trustee's qualifications to serve as a Trustee, which led to the conclusion that each Trustee should serve as a Trustee for the fund.
Advisory Board Members and Executive Officers:
Correspondence intended for each executive officer, Edward C. Johnson 3d, and Peter S. Lynch may be sent to Fidelity Investments, 82 Devonshire Street, Boston, Massachusetts 02109.
Name, Age; Principal Occupation |
Edward C. Johnson 3d (80) |
| Year of Election or Appointment: 2011 Member of the Advisory Board of Fidelity's Equity and High Income Funds. Formerly Trustee and Chairman of the Board of Trustees of certain Trusts, Mr. Johnson serves as Chief Executive Officer, Chairman, and a Director of FMR LLC; Chairman and a Director of FMR; and Chairman and a Director of FMR Co., Inc. In addition, Mr. Johnson serves as Chairman and Director of FIL Limited. Previously, Mr. Johnson served as President of FMR LLC (2006-2007). |
Peter S. Lynch (66) |
| Year of Election or Appointment: 2003 Member of the Advisory Board of Fidelity's Equity and High Income Funds. Mr. Lynch is Vice Chairman and a Director of FMR and FMR Co., Inc. In addition, Mr. Lynch serves as a Trustee of Boston College and as the Chairman of the Inner-City Scholarship Fund. Previously, Mr. Lynch served on the Special Olympics International Board of Directors (1997-2006). |
Kenneth B. Robins (41) |
| Year of Election or Appointment: 2008 President and Treasurer of Fidelity's Equity and High Income Funds. Mr. Robins also serves as President and Treasurer (2010-
present) and Assistant Treasurer (2009-present) of other Fidelity funds and is an employee of Fidelity Investments (2004-present). Previously, Mr. Robins served as Deputy Treasurer of the Fidelity funds (2005-2008) and Treasurer and Chief Financial Officer of The North Carolina Capital Management Trust: Cash and Term Portfolios (2006-2008). |
Bruce T. Herring (45) |
| Year of Election or Appointment: 2006 Vice President of certain Equity Funds. Mr. Herring also serves as Chief Investment Officer and Director of Fidelity Management & Research (U.K.) Inc. (2010-present) and Group Chief Investments Officer of FMR. Previously, Mr. Herring served as Vice President (2005-2006) and Senior Vice President (2006-2007) of Fidelity Management & Research Company, Vice President of FMR Co., Inc. (2001-2007) and as a portfolio manager for Fidelity U.S. Equity Funds. |
Brian B. Hogan (46) |
| Year of Election or Appointment: 2009 Vice President of certain Equity Funds and Vice President of Sector Funds. Mr. Hogan also serves as President of FMR's Equity Division (2009-present). Previously, Mr. Hogan served as Senior Vice President, Equity Research of FMR (2006-2009) and as a portfolio manager. |
Scott C. Goebel (42) |
| Year of Election or Appointment: 2008 Secretary and Chief Legal Officer (CLO) of the Fidelity funds. Mr. Goebel also serves as Secretary and CLO of The North Carolina Capital Management Trust: Cash and Term Portfolio (2008-present); General Counsel, Secretary, and Senior Vice President of FMR (2008-present) and FMR Co., Inc. (2008-present); Deputy General Counsel of FMR LLC; Chief Legal Officer of Fidelity Management & Research (Hong Kong) Limited (2008-present) and Assistant Secretary of Fidelity Management & Research (Japan) Inc. (2008-present), Fidelity Investments Money Management, Inc. (2008-present), Fidelity Management & Research (U.K.) Inc. (2008-present), and Fidelity Research and Analysis Company (2008-present). Previously, Mr. Goebel served as Assistant Secretary of the Funds (2007-2008) and as Vice President and Secretary of Fidelity Distributors Corporation (FDC) (2005-2007). |
William C. Coffey (41) |
| Year of Election or Appointment: 2009 Assistant Secretary of Fidelity's Equity and High Income Funds. Mr. Coffey also serves as Senior Vice President and Deputy General Counsel of FMR LLC (2010-present), and is an employee of Fidelity Investments. Previously, Mr. Coffey served as Vice President and Associate General Counsel of FMR LLC (2005-2009). |
Holly C. Laurent (56) |
| Year of Election or Appointment: 2008 Anti-Money Laundering (AML) Officer of the Fidelity funds. Ms. Laurent also serves as AML Officer of The North Carolina Capital Management Trust: Cash and Term Portfolio (2008-present) and is an employee of Fidelity Investments. Previously, Ms. Laurent was Senior Vice President and Head of Legal for Fidelity Business Services India Pvt. Ltd. (2006-2008), and Senior Vice President, Deputy General Counsel and Group Head for FMR LLC (2005-2006). |
Christine Reynolds (52) |
| Year of Election or Appointment: 2008 Chief Financial Officer of the Fidelity funds. Ms. Reynolds became President of Fidelity Pricing and Cash Management Services (FPCMS) in August 2008. Ms. Reynolds served as Chief Operating Officer of FPCMS (2007-2008). Previously, Ms. Reynolds served as President, Treasurer, and Anti-Money Laundering officer of the Fidelity funds (2004-2007). |
Kenneth A. Rathgeber (63) |
| Year of Election or Appointment: 2004 Chief Compliance Officer of Fidelity's Equity and High Income Funds. Mr. Rathgeber is Chief Compliance Officer of Fidelity Management & Research (Hong Kong) Limited (2008-present), Fidelity Management & Research (Japan) Inc. (2008-present), FMR (2005-present), FMR Co., Inc. (2005-present), Fidelity Management & Research (U.K.) Inc. (2005-present), Fidelity Research & Analysis Company (2005-present), Fidelity Investments Money Management, Inc. (2005-present), Pyramis Global Advisors, LLC (2005-present), and Strategic Advisers, Inc. (2005-present). |
Jeffrey S. Christian (49) |
| Year of Election or Appointment: 2009 Deputy Treasurer of the Fidelity funds. Mr. Christian is an employee of Fidelity Investments. Previously, Mr. Christian served as Chief Financial Officer (2008-2009) of certain Fidelity funds and Senior Vice President of Fidelity Pricing and Cash Management Services (FPCMS) (2004-2009). |
Bryan A. Mehrmann (49) |
| Year of Election or Appointment: 2005 Deputy Treasurer of the Fidelity funds. Mr. Mehrmann is an employee of Fidelity Investments. |
Adrien E. Deberghes (43) |
| Year of Election or Appointment: 2008 Deputy Treasurer of Fidelity's Equity and High Income Funds. Mr. Deberghes also serves as Assistant Treasurer of other Fidelity funds (2010-present) and is an employee of Fidelity Investments (2008-present). Previously, Mr. Deberghes served as Senior Vice President of Mutual Fund Administration at State Street Corporation (2007-2008), Senior Director of Mutual Fund Administration at Investors Bank & Trust (2005-2007), and Director of Finance for Dunkin' Brands (2000-2005). |
Stephanie J. Dorsey (41) |
| Year of Election or Appointment: 2010 Assistant Treasurer of Fidelity's Equity and High Income Funds. Ms. Dorsey also serves as Deputy Treasurer of other Fidelity funds (2008-present) and is an employee of Fidelity Investments (2008-present). Previously, Ms. Dorsey served as Treasurer (2004-2008) of the JPMorgan Mutual Funds and Vice President (2004-2008) of JPMorgan Chase Bank. |
John R. Hebble (52) |
| Year of Election or Appointment: 2009 Assistant Treasurer of Fidelity's Equity and High Income Funds. Mr. Hebble also serves as Treasurer and Chief Financial Officer of The North Carolina Capital Management Trust: Cash and Term Portfolio (2008-present), President and Treasurer of other Fidelity funds (2008-present) and is an employee of Fidelity Investments. |
Gary W. Ryan (52) |
| Year of Election or Appointment: 2005 Assistant Treasurer of the Fidelity funds. Mr. Ryan is an employee of Fidelity Investments. Previously, Mr. Ryan served as Vice President of Fund Reporting in Fidelity Pricing and Cash Management Services (FPCMS) (1999-2005). |
Jonathan Davis (42) |
| Year of Election or Appointment: 2010 Assistant Treasurer of the Fidelity funds. Mr. Davis is an employee of Fidelity Investments. Previously, Mr. Davis served as Vice President and Associate General Counsel of FMR LLC (2003-2010). |
Annual Report
Service Class 2R designates 38% and 100% of the dividends distributed in February and December respectively, during the fiscal year as qualifying for the dividends-received deduction for corporate shareholders.
Annual Report
Board Approval of Investment Advisory Contracts and Management Fees
VIP Equity-Income Portfolio
Each year, the Board of Trustees, including the Independent Trustees (together, the Board), votes on the renewal of the management contract and sub-advisory agreements (together, the Advisory Contracts) for the fund. The Board, assisted by the advice of fund counsel and Independent Trustees' counsel, requests and considers a broad range of information relevant to the renewal of the Advisory Contracts throughout the year.
The Board meets regularly and considers at each of its meetings factors that are relevant to its annual consideration of the renewal of the fund's Advisory Contracts, including the services and support provided to the fund and its shareholders. The Board has established various standing committees, each composed of Independent Trustees with varying backgrounds, to which the Board has assigned specific subject matter responsibilities in order to enhance effective decision-making by the Board. The Board, acting directly and through its Committees, requests and receives information concerning the annual consideration of the renewal of the fund's Advisory Contracts. The Board also meets as needed to consider matters specifically related to the Board's annual consideration of the renewal of Advisory Contracts. Members of the Board may also meet with trustees of other Fidelity funds through ad hoc joint committees to discuss certain matters relevant to the Fidelity funds.
At its July 2010 meeting, the Board of Trustees, including the Independent Trustees, unanimously determined to renew the fund's Advisory Contracts. In reaching its determination, the Board considered all factors it believed relevant, including (i) the nature, extent, and quality of the services to be provided to the fund and its shareholders (including the investment performance of the fund); (ii) the competitiveness of the fund's management fee and total expenses; (iii) the total costs of the services to be provided by and the profits to be realized by Fidelity from its relationship with the fund; (iv) the extent to which economies of scale would be realized as the fund grows; and (v) whether fee levels reflect these economies of scale, if any, for the benefit of fund shareholders.
In considering whether to renew the Advisory Contracts for the fund, the Board reached a determination, with the assistance of fund counsel and Independent Trustees' counsel and through the exercise of its business judgment, that the renewal of the Advisory Contracts is in the best interests of fund shareholders and that the compensation to be received by Fidelity under the management contract is fair and reasonable. The Board's decision to renew the Advisory Contracts was not based on any single factor noted above, but rather was based on a comprehensive consideration of all the information provided to the Board at its meetings throughout the year. The Board, in reaching its determination to renew the Advisory Contracts, is aware that shareholders in the fund have a broad range of investment choices available to them, including a wide choice among mutual funds offered by Fidelity's competitors, and that the fund's shareholders, with the opportunity to review and weigh the disclosure provided by the fund in its prospectus and other public disclosures, have chosen to invest in this fund, managed by Fidelity.
Nature, Extent, and Quality of Services Provided. The Board considered the staffing within the investment adviser, FMR, and the sub-advisers (together, the Investment Advisers), including the backgrounds of the fund's investment personnel and the fund's investment objective and discipline. The Independent Trustees also had discussions with senior management of Fidelity's investment operations and investment groups. The Board considered the structure of the portfolio manager compensation program and whether this structure provides appropriate incentives to act in the best interest of the fund.
Resources Dedicated to Investment Management and Support Services. The Board and the equity research subcommittee of the Board's Fund Oversight Committee reviewed the size, education, and experience of the Investment Advisers' investment staff, their use of technology, and the Investment Advisers' approach to recruiting, training, and retaining portfolio managers and other research, advisory, and management personnel. The Board noted that Fidelity's analysts have access to a variety of technological tools and market and securities data that enable them to perform both fundamental and quantitative analysis and to specialize in various disciplines. The Board considered Fidelity's extensive global research capabilities that enable the Investment Advisers to aggregate data from various sources in an effort to produce positive investment results. The Board also considered that Fidelity's portfolio managers and analysts have access to daily portfolio attribution that allows for monitoring of a fund's portfolio, as well as an electronic communication system that provides immediate real-time access to research concerning issuers and credit enhancers. The Board noted FMR's continued focus on strengthening the organization and discipline of equity portfolio management and research.
Shareholder and Administrative Services. The Board considered (i) the nature, extent, quality, and cost of advisory, administrative, and shareholder services performed by the Investment Advisers and their affiliates under the Advisory Contracts and under separate agreements covering transfer agency, pricing and bookkeeping, and securities lending services for the fund; (ii) the nature and extent of the investment adviser's supervision of third party service providers, principally custodians and subcustodians; and (iii) the resources devoted to, and the record of compliance with, the fund's compliance policies and procedures. The Board also reviewed the allocation of fund brokerage, including allocations to brokers affiliated with the Investment Advisers, the use of brokerage commissions to pay fund expenses, and the use of "soft" commission dollars to pay for research services.
The Board noted that the growth of fund assets over time across the complex allows Fidelity to reinvest in the development of services designed to enhance the value or convenience of the Fidelity funds as investment vehicles. These services include 24-hour access to account information and market information through phone representatives and over the Internet, and investor education materials and asset allocation tools.
Investment in a Large Fund Family. The Board considered the benefits to shareholders of investing in a Fidelity fund, including the benefits of investing in a fund that is part of a large family of funds offering a variety of investment disciplines and providing a large variety of mutual fund investor services. The Board noted that Fidelity had taken, or had made recommendations that resulted in the Fidelity funds taking, a number of actions over the previous year that benefited particular funds, including (i) dedicating additional resources to investment research and restructuring and broadening the focus of the investment research teams; (ii) bolstering the senior management team that oversees asset management; (iii) launching Class F of certain funds as a lower-fee class available to Freedom K and Freedom Index Funds; (iv) lowering the initial investment minimums and ongoing balance requirements for Real Estate High Income Fund; (v) eliminating subsequent purchase minimums for all funds and adding a waiver of the investment minimum requirement for new accounts opened with the proceeds of a systematic withdrawal plan; (vi) eliminating the withdrawal minimum and maximum limits for systematic withdrawals from Advisor funds; (vii) expanding sales load waivers on Class A shares for Destiny Planholders and expanding Institutional Class eligibility for Class O Destiny Planholders; and (viii) changing certain Class A and Class T sales charge structures to further align them with industry practices.
Annual Report
Investment Performance. The Board considered whether the fund has operated in accordance with its investment objective, as well as its record of compliance with its investment restrictions. It also reviewed the fund's absolute investment performance for each class, as well as the fund's relative investment performance for each class measured over multiple periods against (i) a broad-based securities market index, and (ii) a peer group of mutual funds deemed appropriate by Fidelity and reviewed by the Board. The following charts considered by the Board show, over the one-, three-, and five-year periods ended December 31, 2009, the cumulative total returns of Initial Class and Service Class 2 of the fund, the cumulative total returns of a broad-based securities market index ("benchmark"), and a range of cumulative total returns of a peer group of mutual funds identified by Lipper Inc. as having an investment objective similar to that of the fund. The returns of Initial Class and Service Class 2 show the performance of the highest and lowest performing classes, respectively (based on five-year performance). The box within each chart shows the 25th percentile return (bottom of box) and the 75th percentile return (top of box) of the peer group. Returns shown above the box are in the first quartile and returns shown below the box are in the fourth quartile. The percentage beaten numbers noted below each chart correspond to the percentile box and represent the percentage of funds in the peer group whose performance was equal to or lower than that of the class indicated.
VIP Equity-Income Portfolio
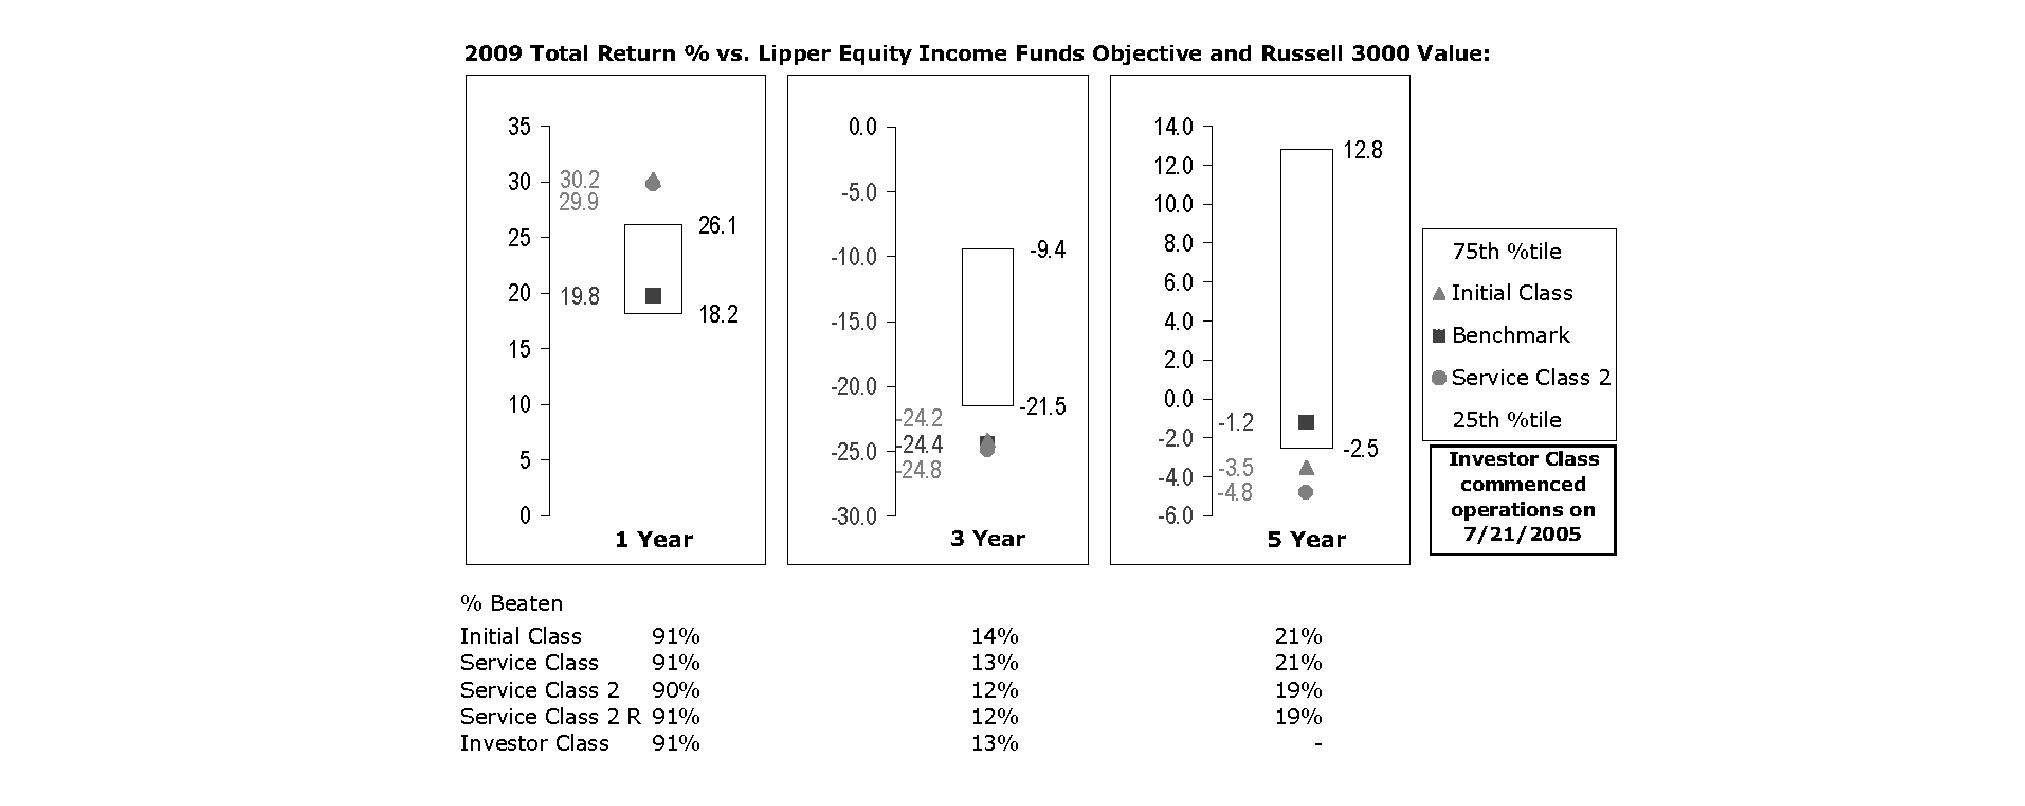
The Board reviewed the fund's relative investment performance against its peer group and noted that the performance of Initial Class of the fund was in the first quartile for the one-year period and the fourth quartile for the three- and five-year periods. The Board also noted that the investment performance of Initial Class of the fund compared favorably to its benchmark for the one- and three-year periods, although the fund's five-year cumulative total return was lower than its benchmark. The Board considered that the variations in performance among the fund's classes reflect the variations in class expenses, which result in lower performance for higher expense classes. The Board also reviewed the fund's performance since inception as well as performance in the current year.
Based on its review, and giving particular weight to the nature and quality of the resources dedicated by the Investment Advisers to maintain and improve relative performance and factoring in the unprecedented market events in recent years, the Board concluded that the nature, extent, and quality of investment management and support services and of shareholder and administrative services provided to the fund will benefit the fund's shareholders, particularly in light of the Board's view that the fund's shareholders benefit from investing in a fund that is part of a large family of funds offering a variety of investment disciplines and services.
Competitiveness of Management Fee and Total Fund Expenses. The Board considered the fund's management fee and total expenses compared to "mapped groups" of competitive funds and classes. Fidelity creates "mapped groups" by combining similar Lipper investment objective categories that have comparable management fee characteristics. Combining Lipper investment objective categories aids the Board's management fee and total expense comparisons by broadening the competitive group used for comparison and by reducing the number of universes to which various Fidelity funds are compared.
Annual Report
Board Approval of Investment Advisory Contracts and Management Fees - continued
Management Fee. The Board considered two proprietary management fee comparisons for the 12-month periods shown in the chart below. The group of Lipper funds used by the Board for management fee comparisons is referred to below as the "Total Mapped Group." The Total Mapped Group is broader than the Lipper peer group used by the Board for performance comparisons because the Total Mapped Group combines several Lipper investment objective categories while the Lipper peer group does not. The Total Mapped Group comparison focuses on a fund's standing relative to the total universe of comparable funds available to investors, in terms of gross management fees before expense reimbursements or caps. "TMG %" represents the percentage of funds in the Total Mapped Group that had management fees that were lower than the fund's. For example, a TMG % of 14% means that 86% of the funds in the Total Mapped Group had higher management fees than the fund. The "Asset-Size Peer Group" (ASPG) comparison focuses on a fund's standing relative to non-Fidelity funds similar in size to the fund within the Total Mapped Group. The ASPG represents at least 15% of the funds in the Total Mapped Group with comparable asset size and management fee characteristics, subject to a minimum of 50 funds (or all funds in the Total Mapped Group if fewer than 50). Additional information, such as the ASPG quartile in which the fund's management fee ranked, is also included in the chart and considered by the Board.
VIP Equity-Income Portfolio
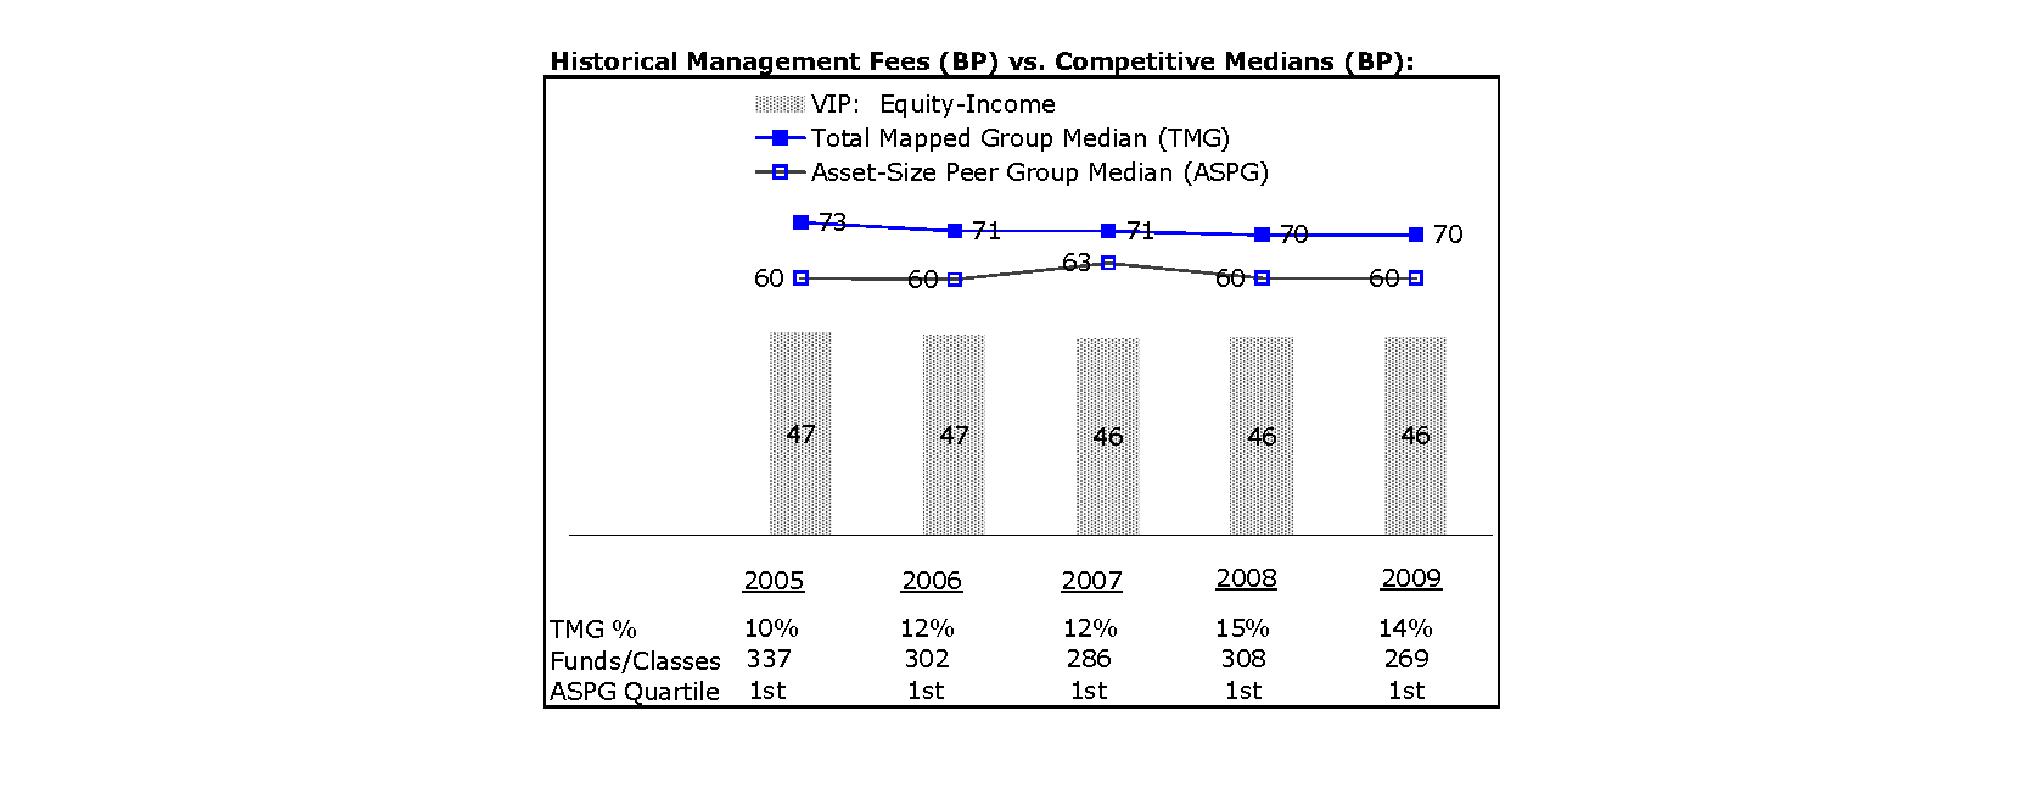
The Board noted that the fund's management fee ranked below the median of its Total Mapped Group and below the median of its ASPG for 2009.
Based on its review, the Board concluded that the fund's management fee is fair and reasonable in light of the services that the fund receives and the other factors considered.
Total Expenses. In its review of each class's total expenses, the Board considered the fund's management fee as well as other fund or class expenses, as applicable, such as transfer agent fees, pricing and bookkeeping fees, fund-paid 12b-1 fees, and custodial, legal, and audit fees. The Board also noted the effects of any waivers and reimbursements on fees and expenses. As part of its review, the Board also considered current and historical total expenses of each class of the fund compared to competitive fund median expenses. Each class of the fund is compared to those funds and classes in the Total Mapped Group (used by the Board for management fee comparisons) that have a similar sales load structure.
The Board noted that the total expenses of each class ranked below its competitive median for 2009.
Fees Charged to Other Fidelity Clients. The Board also considered Fidelity fee structures and other information with respect to clients of FMR and its affiliates, such as other mutual funds advised or subadvised by FMR or its affiliates, pension plan clients, and other institutional clients. In March 2010, the Board created an ad hoc joint committee with the board of other Fidelity funds (the Committee) to review and compare Fidelity's institutional investment advisory business with its business of providing services to the Fidelity funds, including the differences in services provided, fees charged, and costs incurred, as well as competition in their respective marketplaces.
Based on its review of total expenses and fees charged to other Fidelity clients, the Board concluded that the total expenses of each class of the fund were reasonable in light of the services that the fund and its shareholders receive and the other factors considered, including the findings of the Committee.
Annual Report
Costs of the Services and Profitability. The Board considered the revenues earned and the expenses incurred by Fidelity in conducting the business of developing, marketing, distributing, managing, administering and servicing the fund and its shareholders. The Board also considered the level of Fidelity's profits in respect of all the Fidelity funds.
On an annual basis, FMR presents to the Board Fidelity's profitability for the fund. Fidelity calculates the profitability for each fund, as well as aggregate profitability for groups of Fidelity funds and all Fidelity funds, using a series of detailed revenue and cost allocation methodologies which originate with the audited books and records of Fidelity. The Audit Committee of the Board reviews any significant changes from the prior year's methodologies.
PricewaterhouseCoopers LLP (PwC), independent registered public accounting firm and auditor to Fidelity and certain Fidelity funds, has been engaged annually by the Board as part of the Board's assessment of Fidelity's profitability analysis. PwC's engagement includes the review and assessment of Fidelity's methodologies used in determining the revenues and expenses attributable to Fidelity's mutual fund business, and completion of agreed-upon procedures surrounding the mathematical accuracy of fund profitability and its conformity to allocation methodologies. After considering PwC's reports issued under the engagement and information provided by Fidelity, the Board believes that while other allocation methods may also be reasonable, Fidelity's profitability methodologies are reasonable in all material respects.
The Board has also reviewed Fidelity's non-fund businesses and fall-out benefits related to the mutual fund business as well as cases where Fidelity's affiliates may benefit from or be related to the fund's business.
The Board considered the costs of the services provided by and the profits realized by Fidelity in connection with the operation of the fund and were satisfied that the profitability was not excessive in the circumstances.
Economies of Scale. The Board considered whether there have been economies of scale in respect of the management of the Fidelity funds, whether the Fidelity funds (including the fund) have appropriately benefited from any such economies of scale, and whether there is potential for realization of any further economies of scale. The Board considered the extent to which the fund will benefit from economies of scale through increased services to the fund, through waivers or reimbursements, or through fee or expense reductions.
In February 2009, the Board and the board of other Fidelity funds created an ad hoc committee (the Economies of Scale Committee) to analyze whether FMR attains economies of scale in respect of the management and servicing of the Fidelity funds, whether the Fidelity funds have appropriately benefited from such economies of scale, and whether there is potential for realization of any further economies of scale.
The Board recognized that the fund's management contract incorporates a "group fee" structure, which provides for lower group fee rates as total fund assets under FMR's management increase, and for higher group fee rates as total fund assets under FMR's management decrease. FMR calculates the group fee rates based on a tiered asset "breakpoint" schedule that varies based on asset class. The Board considered that the group fee is designed to deliver the benefits of economies of scale to fund shareholders when total Fidelity fund assets increase, even if assets of any particular fund are unchanged or have declined, because some portion of Fidelity's costs are attributable to services provided to all Fidelity funds, and all funds benefit if those costs can be allocated among more assets. The Board concluded that, given the group fee structure, fund shareholders will benefit from lower management fees as assets under FMR's management increase at the fund complex level, regardless of whether Fidelity achieves any such economies of scale.
The Board concluded, considering the findings of the Economies of Scale Committee, that any potential economies of scale are being appropriately shared between fund shareholders and Fidelity.
Additional Information Requested by the Board. In order to develop fully the factual basis for consideration of the Fidelity funds' Advisory Contracts, the Board requested and received additional information on certain topics, including (i) fund performance trends, actions to be taken by FMR to improve certain funds' overall performance, and Fidelity's long-term strategies for certain funds; (ii) portfolio manager changes that have occurred during the past year and length of portfolio manager tenure for different categories of funds over time; (iii) Fidelity's compensation structure for portfolio managers, research analysts, and other key personnel, the rationale for the compensation structure, and how the compensation structure provides appropriate performance incentives; (iv) the amount of the investment that each portfolio manager has made in the Fidelity fund(s) that he or she manages; (v) management and other fees paid by FMR to affiliated sub-advisers on behalf of the Fidelity funds; (vi) Fidelity's fee structures and rationale for recommending different fees among different categories of funds; (vii) Fidelity's rationale for recommending which funds should have a performance adjustment component as part of their management fees; (viii) the rationale for any differences between fund fee structures and fee structures in place for other Fidelity clients; and (ix) explanations regarding the relative total expenses borne by certain funds and classes, total expense competitive trends, and actions that might be taken by FMR to reduce total expenses for certain funds and classes.
Based on its evaluation of all of the conclusions noted above, and after considering all factors it believed relevant, the Board ultimately concluded that the advisory fee structures are fair and reasonable, and that the fund's Advisory Contracts should be renewed.
Annual Report
Investment Adviser
Fidelity Management & Research Company
Boston, MA
Investment Sub-Advisers
FMR Co., Inc.
Fidelity Management & Research (U.K.) Inc.
Fidelity Management & Research (Hong Kong) Limited
Fidelity Management & Research (Japan) Inc.
General Distributor
Fidelity Distributors Corporation
Boston, MA
Transfer and Service Agents
Fidelity Investments Institutional Operations Company, Inc.
Boston, MA
Fidelity Service Company, Inc.
Boston, MA
Custodian
The Northern Trust Company
Chicago, IL
VIPEI2R-ANN-0211
1.782454.109
Fidelity® Variable Insurance Products:
Growth Portfolio
Annual Report
December 31, 2010
(2_fidelity_logos) (Registered_Trademark)
Contents
Performance | <Click Here> | How the fund has done over time. |
Management's Discussion of Fund Performance | <Click Here> | The Portfolio Manager's review of fund performance and strategy. |
Shareholder Expense Example | <Click Here> | An example of shareholder expenses. |
Investment Changes | <Click Here> | A summary of major shifts in the fund's investments over the past six months. |
Investments | <Click Here> | A complete list of the fund's investments with their market values. |
Financial Statements | <Click Here> | Statements of assets and liabilities, operations, and changes in net assets, as well as financial highlights. |
Notes | <Click Here> | Notes to the financial statements. |
Report of Independent Registered Public Accounting Firm | <Click Here> | |
Trustees and Officers | <Click Here> | |
Distributions | <Click Here> | |
Board Approval of Investment Advisory Contracts and Management Fees | <Click Here> | |
To view a fund's proxy voting guidelines and proxy voting record for the 12-month period ended June 30, visit http://www.fidelity.com/proxyvotingresults or visit the Securities and Exchange Commission's (SEC) web site at http://www.sec.gov. You may also call 1-877-208-0098 to request a free copy of the proxy voting guidelines.
Fidelity Variable Insurance Products are separate account options which are purchased through a variable insurance contract.
Standard & Poor's, S&P and S&P 500 are registered service marks of The McGraw-Hill Companies, Inc. and have been licensed for use by Fidelity Distributors Corporation.
Other third party marks appearing herein are the property of their respective owners.
All other marks appearing herein are registered or unregistered trademarks or service marks of FMR LLC or an affiliated company.
The general research services agreement with Fidelity Research & Analysis Company has been terminated and is no longer in effect for the fund.
This report and the financial statements contained herein are submitted for the general information of the shareholders of the fund. This report is not authorized for distribution to prospective investors in the fund unless preceded or accompanied by an effective prospectus.
A fund files its complete schedule of portfolio holdings with the SEC for the first and third quarters of each fiscal year on Form N-Q. Forms N-Q are available on the SEC's web site at http://www.sec.gov. A fund's Forms N-Q may be reviewed and copied at the SEC's Public Reference Room in Washington, DC. Information regarding the operation of the SEC's Public Reference Room may be obtained by calling 1-800-SEC-0330. For a complete list of a fund's portfolio holdings, view the most recent holdings listing, semiannual report, or annual report on Fidelity's web site at http://www.fidelity.com, http://www.advisor.fidelity.com, or http://www.401k.com, as applicable.
NOT FDIC INSURED • MAY LOSE VALUE • NO BANK GUARANTEE
Neither the fund nor Fidelity Distributors Corporation is a bank.
Annual Report
Average annual total return reflects the change in the value of an investment, assuming reinvestment of the class' distributions from dividend income and capital gains (the profits earned upon the sale of securities that have grown in value, if any) and assuming a constant rate of performance each year. During periods of reimbursement by Fidelity, a fund's total return will be greater than it would be had the reimbursement not occurred. Performance numbers are net of all underlying fund operating expenses, but do not include any insurance charges imposed by your insurance company's separate account. If performance information included the effect of these additional charges, the total returns would have been lower. How a fund did yesterday is no guarantee of how it will do tomorrow.
Average Annual Total Returns
Periods ended December 31, 2010 | Past 1
year | Past 5
years | Past 10
years |
VIP Growth Portfolio - Initial Class | 24.17% | 2.69% | -0.46% |
VIP Growth Portfolio - Service Class | 24.06% | 2.58% | -0.56% |
VIP Growth Portfolio - Service Class 2 | 23.86% | 2.43% | -0.72% |
VIP Growth Portfolio - Investor Class A | 24.08% | 2.58% | -0.53% |
A The initial offering of Investor Class shares took place on July 21, 2005. Returns prior to July 21, 2005 are those of Initial Class. Had Investor Class's transfer agent fee been reflected, returns prior to July 21, 2005 would have been lower.
$10,000 Over 10 Years
Let's say hypothetically that $10,000 was invested in VIP Growth Portfolio - Initial Class on December 31, 2000. The chart shows how the value of your investment would have changed, and also shows how the Russell 3000® Growth Index performed over the same period.
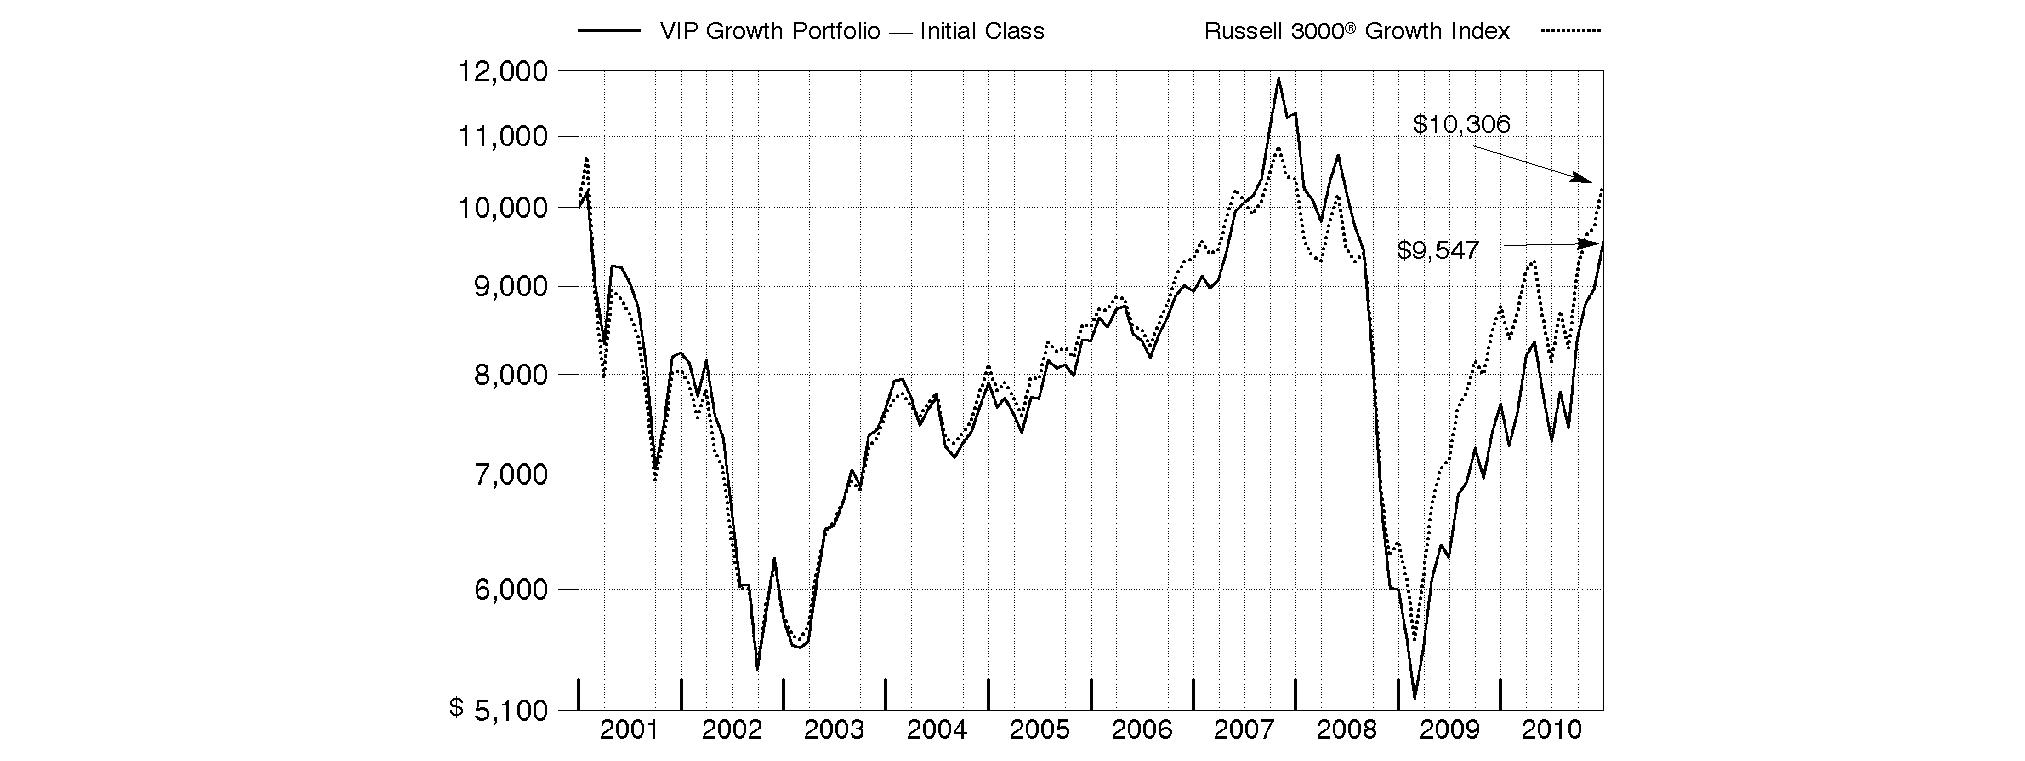
Annual Report
Market Recap: While market improvements around the world hit a speed bump in the first half of the 12-month period ending December 31, 2010, world economies re-accelerated in August, supported by a broadening recovery and low inflation in the U.S. Domestic stock markets recorded solid gains for the year, lifted by a strong second-half rally fueled by economic optimism, encouraging earnings reports and a wave of corporate mergers. The large-cap S&P 500® Index rose 15.06%, the blue-chip-laden Dow Jones Industrial AverageSM added 14.06% and the technology-heavy Nasdaq Composite® Index climbed 18.02%. Meanwhile, international stocks, as represented by the MSCI® ACWI® (All Country World Index) ex USA Index, gained 11.29%, boosted in part by a depreciating U.S. dollar. In the fixed-income arena, U.S. taxable investment-grade bonds generated positive results during 2010, as the Barclays Capital® U.S. Aggregate Bond Index gained 6.54%. With ultra-low interest rates bolstering nearly all fixed-income securities for most of the year, sectors in the index with higher yields and more credit risk generally fared best, while most high-quality bonds generated more-moderate returns. Meanwhile, high-yield bonds, as represented by The BofA Merrill LynchSM US High Yield Constrained Index, returned 15.07%, a result of improved economic data and strengthening investor demand. Overseas, foreign bond markets showed mixed results, with a sizable disparity between the 3.97% return of the Citigroup® Non-U.S. Group of 7 Index - which measures the performance of sovereign debt of the major global economies outside the U.S. - and the 12.04% advance of the JPMorgan Emerging Markets Bond Index Global (EMBI Global), which benefited from the rising overall credit quality of emerging-markets debt issuers.
Comments from Jason Weiner, Portfolio Manager of VIP Growth Portfolio: For the 12 months ending December 31, 2010, the fund's share classes solidly outperformed the 17.64% gain of the Russell 3000® Growth Index. (For specific portfolio results, please refer to the performance section of this report.) The portfolio benefited from strong positioning in information technology, including an out-of-index stake in Chinese Internet search firm Baidu, which benefited from its leading position for paid-search advertising in China, and a significant overweighting in Riverbed Technology, a niche networking products manufacturer that is the dominant player in providing innovative networking solutions for cloud and wide area networking. Having no exposure to two index components - Microsoft and Hewlett-Packard - paid off when both stocks lagged during the period. Good stock selection in health care helped, particularly within the pharmaceuticals/biotechnology/life science area, including an out-of-index position in Denmark's Novo Nordisk, which got a boost from positive clinical trials for a new diabetes treatment. Stock picking in industrials and energy - sectors where I increased the fund's investments - also contributed. On the other hand, positioning within financials - which decreased as a percentage of fund assets - detracted. There also were some disappointments in tech - another area where we shed exposure - despite the sector's overall contribution. Positions in Internet networking products manufacturer Cisco Systems, semiconductor maker Monolithic Power Systems and Internet search giant Google underperformed during the period. Cisco was hurt by softer-than-expected demand from its public sector clients, while Monolithic detracted when the firm misjudged demand for its products, resulting in crippling shortages. Google's stock fell when the cyclical rebound in advertising lagged expectations and as investors began to view paid search as a maturing business. Elsewhere, a significant overweighting in medical benefits manager Medco Health Solutions hurt. Some of these stocks were sold prior to period end.
The views expressed above reflect those of the portfolio manager(s) only through the end of the period as stated on the cover of this report and do not necessarily represent the views of Fidelity or any other person in the Fidelity organization. Any such views are subject to change at any time based upon market or other conditions and Fidelity disclaims any responsibility to update such views. These views may not be relied on as investment advice and, because investment decisions for a Fidelity fund are based on numerous factors, may not be relied on as an indication of trading intent on behalf of any Fidelity fund.
Annual Report
As a shareholder of the Fund, you incur two types of costs: (1) transaction costs, including redemption fees, and (2) ongoing costs, including management fees, distribution and/or service (12b-1) fees and other Fund expenses. This Example is intended to help you understand your ongoing costs (in dollars) of investing in the Fund and to compare these costs with the ongoing costs of investing in other mutual funds.
The Example is based on an investment of $1,000 invested at the beginning of the period and held for the entire period (July 1, 2010 to December 31, 2010).
Actual Expenses
The first line of the accompanying table for each class of the Fund provides information about actual account values and actual expenses. You may use the information in this line, together with the amount you invested, to estimate the expenses that you paid over the period. Simply divide your account value by $1,000.00 (for example, an $8,600 account value divided by $1,000.00 = 8.6), then multiply the result by the number in the first line for a class of the Fund under the heading entitled "Expenses Paid During Period" to estimate the expenses you paid on your account during this period. The estimate of expenses does not include any fees or other expenses of any variable annuity or variable life insurance product. If they were, the estimate of expenses you paid during the period would be higher, and your ending account value would be lower. In addition, the Fund, as a shareholder in the underlying Fidelity Central Funds, will indirectly bear its pro-rata share of the fees and expenses incurred by the underlying Fidelity Central Funds. These fees and expenses are not included in the Fund's annualized expense ratio used to calculate the expense estimate in the table below.
Hypothetical Example for Comparison Purposes
The second line of the accompanying table for each class of the Fund provides information about hypothetical account values and hypothetical expenses based on a Class' actual expense ratio and an assumed rate of return of 5% per year before expenses, which is not the Class' actual return. The hypothetical account values and expenses may not be used to estimate the actual ending account balance or expenses you paid for the period. You may use this information to compare the ongoing costs of investing in the Fund and other funds. To do so, compare this 5% hypothetical example with the 5% hypothetical examples that appear in the shareholder reports of the other funds. The estimate of expenses does not include any fees or other expenses of any variable annuity or variable life insurance product. If they were, the estimate of expenses you paid during the period would be higher, and your ending account value would be lower. In addition, the Fund, as a shareholder in the underlying Fidelity Central Funds, will indirectly bear its pro-rata share of the fees and expenses incurred by the underlying Fidelity Central Funds. These fees and expenses are not included in the Fund's annualized expense ratio used to calculate the expense estimate in the table below.
Please note that the expenses shown in the table are meant to highlight your ongoing costs only and do not reflect any transaction costs. Therefore, the second line of the table is useful in comparing ongoing costs only, and will not help you determine the relative total costs of owning different funds. In addition, if these transactional costs were included, your costs would have been higher.
| Annualized Expense Ratio | Beginning
Account Value
July 1, 2010 | Ending
Account Value
December 31, 2010 | Expenses Paid
During Period*
July 1, 2010 to December 31, 2010 |
Initial Class | .66% | | | |
Actual | | $ 1,000.00 | $ 1,306.70 | $ 3.84 |
HypotheticalA | | $ 1,000.00 | $ 1,021.88 | $ 3.36 |
Service Class | .76% | | | |
Actual | | $ 1,000.00 | $ 1,305.70 | $ 4.42 |
HypotheticalA | | $ 1,000.00 | $ 1,021.37 | $ 3.87 |
Service Class 2 | .91% | | | |
Actual | | $ 1,000.00 | $ 1,305.10 | $ 5.29 |
HypotheticalA | | $ 1,000.00 | $ 1,020.62 | $ 4.63 |
Service Class 2R | .91% | | | |
Actual | | $ 1,000.00 | $ 1,305.10 | $ 5.29 |
HypotheticalA | | $ 1,000.00 | $ 1,020.62 | $ 4.63 |
Investor Class | .74% | | | |
Actual | | $ 1,000.00 | $ 1,305.90 | $ 4.30 |
HypotheticalA | | $ 1,000.00 | $ 1,021.48 | $ 3.77 |
A 5% return per year before expenses
* Expenses are equal to each Class' annualized expense ratio, multiplied by the average account value over the period, multiplied by 184/365 (to reflect the one-half year period).
Annual Report
Investment Changes (Unaudited)
Top Ten Stocks as of December 31, 2010 |
| % of fund's
net assets | % of fund's net assets
6 months ago |
Apple, Inc. | 6.5 | 5.9 |
QUALCOMM, Inc. | 4.0 | 3.1 |
Exxon Mobil Corp. | 3.7 | 0.0 |
Google, Inc. Class A | 3.4 | 2.3 |
United Technologies Corp. | 2.7 | 2.6 |
Amazon.com, Inc. | 2.3 | 1.2 |
Cisco Systems, Inc. | 1.6 | 5.0 |
Express Scripts, Inc. | 1.5 | 1.6 |
WABCO Holdings, Inc. | 1.5 | 0.0 |
Novo Nordisk AS Series B | 1.5 | 1.3 |
| 28.7 | |
Top Five Market Sectors as of December 31, 2010 |
| % of fund's
net assets | % of fund's net assets
6 months ago |
Information Technology | 28.8 | 34.0 |
Industrials | 17.3 | 12.7 |
Consumer Discretionary | 15.6 | 15.3 |
Health Care | 12.5 | 15.7 |
Energy | 9.0 | 2.3 |
Asset Allocation (% of fund's net assets) |
As of December 31, 2010 * | As of June 30, 2010 ** |
| Stocks 97.7% | | | Stocks 97.8% | |
| Short-Term
Investments and
Net Other Assets 2.3% | | | Short-Term
Investments and
Net Other Assets 2.2% | |
* Foreign investments | 13.8% | | ** Foreign investments | 9.7% | |

Annual Report
Investments December 31, 2010
Showing Percentage of Net Assets
Common Stocks - 97.7% |
| Shares | | Value |
CONSUMER DISCRETIONARY - 15.6% |
Auto Components - 0.7% |
Gentex Corp. | 862,574 | | $ 25,497,687 |
Tenneco, Inc. (a) | 111,900 | | 4,605,804 |
| | 30,103,491 |
Automobiles - 1.3% |
Bayerische Motoren Werke AG (BMW) | 309,498 | | 24,352,061 |
Harley-Davidson, Inc. | 662,466 | | 22,967,696 |
Tesla Motors, Inc. (a)(d) | 136,500 | | 3,634,995 |
| | 50,954,752 |
Diversified Consumer Services - 0.3% |
Anhanguera Educacional Participacoes SA | 59,100 | | 1,424,483 |
Navitas Ltd. | 2,440,338 | | 9,624,112 |
| | 11,048,595 |
Hotels, Restaurants & Leisure - 3.8% |
China Lodging Group Ltd. ADR (d) | 172,175 | | 3,751,693 |
Chipotle Mexican Grill, Inc. (a) | 13,893 | | 2,954,485 |
Home Inns & Hotels Management, Inc. sponsored ADR (a) | 54,772 | | 2,243,461 |
Marriott International, Inc. Class A | 483,099 | | 20,067,932 |
McDonald's Corp. | 689,600 | | 52,933,696 |
Starbucks Corp. | 1,136,473 | | 36,514,877 |
Starwood Hotels & Resorts Worldwide, Inc. | 279,900 | | 17,012,322 |
The Cheesecake Factory, Inc. (a) | 558,625 | | 17,127,443 |
| | 152,605,909 |
Household Durables - 0.1% |
Mohawk Industries, Inc. (a) | 71,028 | | 4,031,549 |
Internet & Catalog Retail - 2.3% |
Amazon.com, Inc. (a) | 525,557 | | 94,600,260 |
Media - 0.5% |
Discovery Communications, Inc. Class C (a) | 444,191 | | 16,297,368 |
Interpublic Group of Companies, Inc. (a) | 261,608 | | 2,778,277 |
| | 19,075,645 |
Multiline Retail - 2.1% |
Dollarama, Inc. (a) | 718,740 | | 20,748,546 |
Dollarama, Inc. (a)(e) | 128,200 | | 3,700,870 |
Droga Raia SA | 122,000 | | 1,870,194 |
Target Corp. | 956,124 | | 57,491,736 |
| | 83,811,346 |
Specialty Retail - 2.3% |
Lowe's Companies, Inc. | 1,251,691 | | 31,392,410 |
Ross Stores, Inc. | 303,509 | | 19,196,944 |
TJX Companies, Inc. | 476,150 | | 21,136,299 |
Vitamin Shoppe, Inc. (a) | 602,892 | | 20,281,287 |
| | 92,006,940 |
Textiles, Apparel & Luxury Goods - 2.2% |
Coach, Inc. | 498,100 | | 27,549,911 |
|
| Shares | | Value |
lululemon athletica, Inc. (a) | 405,257 | | $ 27,727,684 |
LVMH Moet Hennessy - Louis Vuitton | 28,981 | | 4,769,829 |
Polo Ralph Lauren Corp. Class A | 250,600 | | 27,796,552 |
| | 87,843,976 |
TOTAL CONSUMER DISCRETIONARY | | 626,082,463 |
CONSUMER STAPLES - 4.3% |
Beverages - 0.7% |
The Coca-Cola Co. | 447,541 | | 29,434,772 |
Food & Staples Retailing - 1.7% |
Costco Wholesale Corp. | 69,600 | | 5,025,816 |
Walgreen Co. | 743,885 | | 28,981,760 |
Whole Foods Market, Inc. | 659,762 | | 33,377,360 |
| | 67,384,936 |
Food Products - 0.6% |
Diamond Foods, Inc. (d) | 211,314 | | 11,237,679 |
Mead Johnson Nutrition Co. Class A | 224,969 | | 14,004,320 |
| | 25,241,999 |
Household Products - 0.3% |
Procter & Gamble Co. | 191,045 | | 12,289,925 |
Personal Products - 1.0% |
Estee Lauder Companies, Inc. Class A | 149,676 | | 12,078,853 |
Herbalife Ltd. | 377,907 | | 25,837,502 |
| | 37,916,355 |
TOTAL CONSUMER STAPLES | | 172,267,987 |
ENERGY - 9.0% |
Energy Equipment & Services - 3.0% |
Halliburton Co. | 1,106,300 | | 45,170,229 |
National Oilwell Varco, Inc. | 85,300 | | 5,736,425 |
Oceaneering International, Inc. (a) | 284,956 | | 20,981,310 |
Schlumberger Ltd. | 596,033 | | 49,768,756 |
| | 121,656,720 |
Oil, Gas & Consumable Fuels - 6.0% |
Anadarko Petroleum Corp. | 59,600 | | 4,539,136 |
Apache Corp. | 35,000 | | 4,173,050 |
Concho Resources, Inc. (a) | 141,092 | | 12,369,536 |
Exxon Mobil Corp. | 2,010,034 | | 146,973,686 |
Occidental Petroleum Corp. | 416,600 | | 40,868,460 |
Pioneer Natural Resources Co. | 71,000 | | 6,164,220 |
Whiting Petroleum Corp. (a) | 210,300 | | 24,645,057 |
| | 239,733,145 |
TOTAL ENERGY | | 361,389,865 |
FINANCIALS - 5.3% |
Capital Markets - 1.7% |
BlackRock, Inc. Class A | 206,409 | | 39,337,427 |
Charles Schwab Corp. | 855,448 | | 14,636,715 |
Goldman Sachs Group, Inc. | 25,158 | | 4,230,569 |
Common Stocks - continued |
| Shares | | Value |
FINANCIALS - continued |
Capital Markets - continued |
JMP Group, Inc. | 127,100 | | $ 969,773 |
Noah Holdings Ltd. ADR (d) | 476,500 | | 9,315,575 |
| | 68,490,059 |
Commercial Banks - 1.6% |
M&T Bank Corp. | 88,785 | | 7,728,734 |
Wells Fargo & Co. | 1,835,260 | | 56,874,707 |
| | 64,603,441 |
Consumer Finance - 0.1% |
Shriram Transport Finance Co. Ltd. | 281,024 | | 4,909,003 |
Diversified Financial Services - 1.4% |
CME Group, Inc. | 61,177 | | 19,683,700 |
JPMorgan Chase & Co. | 842,798 | | 35,751,491 |
| | 55,435,191 |
Insurance - 0.3% |
AFLAC, Inc. | 179,900 | | 10,151,757 |
Real Estate Investment Trusts - 0.0% |
Dynex Capital, Inc. | 124,200 | | 1,356,264 |
Real Estate Management & Development - 0.2% |
CB Richard Ellis Group, Inc. Class A (a) | 436,297 | | 8,935,363 |
TOTAL FINANCIALS | | 213,881,078 |
HEALTH CARE - 12.5% |
Biotechnology - 2.7% |
Acorda Therapeutics, Inc. (a) | 376,138 | | 10,253,522 |
Alexion Pharmaceuticals, Inc. (a) | 176,642 | | 14,228,513 |
Clinical Data, Inc. (a)(d) | 732,978 | | 11,661,680 |
Human Genome Sciences, Inc. (a) | 396,700 | | 9,477,163 |
Incyte Corp. (a) | 734,200 | | 12,158,352 |
United Therapeutics Corp. (a) | 806,660 | | 50,997,045 |
| | 108,776,275 |
Health Care Equipment & Supplies - 0.6% |
Edwards Lifesciences Corp. (a) | 299,412 | | 24,204,466 |
Health Care Providers & Services - 2.7% |
Express Scripts, Inc. (a) | 1,089,710 | | 58,898,826 |
HMS Holdings Corp. (a) | 64,200 | | 4,158,234 |
Medco Health Solutions, Inc. (a) | 750,306 | | 45,971,249 |
| | 109,028,309 |
Life Sciences Tools & Services - 2.3% |
Agilent Technologies, Inc. (a) | 996,046 | | 41,266,186 |
Illumina, Inc. (a) | 747,273 | | 47,332,272 |
QIAGEN NV (a) | 240,330 | | 4,698,452 |
| | 93,296,910 |
Pharmaceuticals - 4.2% |
Aegerion Pharmaceuticals, Inc. | 123,800 | | 1,754,246 |
Allergan, Inc. | 123,700 | | 8,494,479 |
Novo Nordisk AS Series B | 512,963 | | 57,820,203 |
Perrigo Co. | 464,890 | | 29,441,484 |
|
| Shares | | Value |
Teva Pharmaceutical Industries Ltd. sponsored ADR | 321,203 | | $ 16,744,312 |
Valeant Pharmaceuticals International, Inc. | 1,803,219 | | 51,133,093 |
| | 165,387,817 |
TOTAL HEALTH CARE | | 500,693,777 |
INDUSTRIALS - 17.3% |
Aerospace & Defense - 6.5% |
Esterline Technologies Corp. (a) | 349,467 | | 23,969,942 |
Goodrich Corp. | 494,879 | | 43,583,994 |
Honeywell International, Inc. | 672,816 | | 35,766,899 |
Precision Castparts Corp. | 273,700 | | 38,101,777 |
TransDigm Group, Inc. (a) | 130,148 | | 9,371,957 |
United Technologies Corp. | 1,383,970 | | 108,946,118 |
| | 259,740,687 |
Air Freight & Logistics - 0.4% |
C.H. Robinson Worldwide, Inc. | 225,200 | | 18,058,788 |
Airlines - 0.5% |
Ryanair Holdings PLC sponsored ADR | 113,200 | | 3,482,032 |
Southwest Airlines Co. | 1,176,908 | | 15,276,266 |
| | 18,758,298 |
Building Products - 0.4% |
A.O. Smith Corp. | 150,241 | | 5,721,177 |
Lennox International, Inc. | 209,322 | | 9,898,837 |
| | 15,620,014 |
Commercial Services & Supplies - 0.1% |
Waste Connections, Inc. | 213,450 | | 5,876,279 |
Construction & Engineering - 0.2% |
Jacobs Engineering Group, Inc. (a) | 182,400 | | 8,363,040 |
Electrical Equipment - 2.0% |
Acuity Brands, Inc. | 217,600 | | 12,548,992 |
AMETEK, Inc. | 229,777 | | 9,018,747 |
Cooper Industries PLC Class A | 248,500 | | 14,485,065 |
Crompton Greaves Ltd. | 576,754 | | 3,998,097 |
Emerson Electric Co. | 338,700 | | 19,363,479 |
Polypore International, Inc. (a) | 263,356 | | 10,726,490 |
Regal-Beloit Corp. | 128,100 | | 8,551,956 |
| | 78,692,826 |
Industrial Conglomerates - 1.4% |
3M Co. | 440,788 | | 38,040,004 |
Textron, Inc. | 777,100 | | 18,370,644 |
| | 56,410,648 |
Machinery - 4.3% |
Cummins, Inc. | 310,434 | | 34,150,844 |
Danaher Corp. | 663,368 | | 31,291,069 |
Gardner Denver, Inc. | 150,725 | | 10,372,895 |
Ingersoll-Rand Co. Ltd. | 215,347 | | 10,140,690 |
PACCAR, Inc. | 250,300 | | 14,372,226 |
Common Stocks - continued |
| Shares | | Value |
INDUSTRIALS - continued |
Machinery - continued |
WABCO Holdings, Inc. (a) | 954,898 | | $ 58,181,935 |
Weg SA | 920,400 | | 12,090,458 |
| | 170,600,117 |
Professional Services - 0.8% |
51job, Inc. sponsored ADR (a)(d) | 97,726 | | 4,813,006 |
CoStar Group, Inc. (a) | 43,900 | | 2,526,884 |
IHS, Inc. Class A (a) | 60,702 | | 4,879,834 |
Robert Half International, Inc. | 662,050 | | 20,258,730 |
| | 32,478,454 |
Road & Rail - 0.7% |
Union Pacific Corp. | 288,932 | | 26,772,439 |
TOTAL INDUSTRIALS | | 691,371,590 |
INFORMATION TECHNOLOGY - 28.8% |
Communications Equipment - 7.4% |
Cisco Systems, Inc. (a) | 3,215,219 | | 65,043,880 |
Juniper Networks, Inc. (a) | 1,213,282 | | 44,794,371 |
Motorola, Inc. (a) | 2,406,500 | | 21,826,955 |
Polycom, Inc. (a) | 114,698 | | 4,470,928 |
QUALCOMM, Inc. | 3,196,103 | | 158,175,137 |
| | 294,311,271 |
Computers & Peripherals - 7.6% |
Apple, Inc. (a) | 810,852 | | 261,548,418 |
EMC Corp. (a) | 618,985 | | 14,174,757 |
NetApp, Inc. (a) | 527,400 | | 28,985,904 |
| | 304,709,079 |
Electronic Equipment & Components - 0.2% |
Keyence Corp. | 31,500 | | 9,122,452 |
Internet Software & Services - 6.4% |
Baidu.com, Inc. sponsored ADR (a) | 179,706 | | 17,347,020 |
Dice Holdings, Inc. (a) | 361,000 | | 5,180,350 |
Digital River, Inc. (a) | 10,500 | | 361,410 |
eBay, Inc. (a) | 676,051 | | 18,814,499 |
Google, Inc. Class A (a) | 225,842 | | 134,143,373 |
KIT Digital, Inc. (a)(d) | 943,221 | | 15,129,265 |
The Knot, Inc. (a) | 415,717 | | 4,107,284 |
VeriSign, Inc. | 869,518 | | 28,407,153 |
WebMD Health Corp. (a) | 647,450 | | 33,058,797 |
| | 256,549,151 |
IT Services - 1.1% |
Cognizant Technology Solutions Corp. Class A (a) | 430,100 | | 31,522,029 |
|
| Shares | | Value |
iGate Corp. | 296,681 | | $ 5,847,583 |
Visa, Inc. Class A | 74,586 | | 5,249,363 |
| | 42,618,975 |
Semiconductors & Semiconductor Equipment - 2.0% |
ARM Holdings PLC | 806,300 | | 5,506,908 |
ARM Holdings PLC sponsored ADR (d) | 1,757,254 | | 36,463,021 |
Avago Technologies Ltd. | 1,381,870 | | 39,341,839 |
| | 81,311,768 |
Software - 4.1% |
ANSYS, Inc. (a) | 82,495 | | 4,295,515 |
Ariba, Inc. (a) | 881,211 | | 20,699,646 |
Citrix Systems, Inc. (a) | 404,784 | | 27,691,273 |
Computer Modelling Group Ltd. | 175,100 | | 4,538,589 |
Concur Technologies, Inc. (a) | 78,159 | | 4,058,797 |
Informatica Corp. (a) | 152,600 | | 6,718,978 |
Intuit, Inc. (a) | 159,547 | | 7,865,667 |
Kingdee International Software Group Co. Ltd. | 8,534,000 | | 4,787,165 |
Oracle Corp. | 1,453,116 | | 45,482,531 |
RealPage, Inc. | 53,800 | | 1,664,034 |
Red Hat, Inc. (a) | 204,900 | | 9,353,685 |
salesforce.com, Inc. (a) | 128,389 | | 16,947,348 |
Solera Holdings, Inc. | 51,020 | | 2,618,346 |
VMware, Inc. Class A (a) | 90,900 | | 8,081,919 |
| | 164,803,493 |
TOTAL INFORMATION TECHNOLOGY | | 1,153,426,189 |
MATERIALS - 4.5% |
Chemicals - 1.3% |
CF Industries Holdings, Inc. | 115,950 | | 15,670,643 |
FMC Corp. | 123,400 | | 9,858,426 |
The Mosaic Co. | 315,450 | | 24,087,762 |
| | 49,616,831 |
Metals & Mining - 3.2% |
Consolidated Thompson Iron Mines Ltd. (a) | 2,085,100 | | 29,458,597 |
Grande Cache Coal Corp. (a) | 2,748,600 | | 28,855,753 |
Mirabela Nickel Ltd. (a) | 1,968,948 | | 4,586,617 |
Mongolian Mining Corp. | 3,198,000 | | 3,731,857 |
Newmont Mining Corp. | 577,660 | | 35,485,654 |
Teck Resources Ltd. Class B (sub. vtg.) | 220,400 | | 13,655,386 |
Walter Energy, Inc. | 103,100 | | 13,180,304 |
| | 128,954,168 |
TOTAL MATERIALS | | 178,570,999 |
TELECOMMUNICATION SERVICES - 0.4% |
Wireless Telecommunication Services - 0.4% |
Vivo Participacoes SA sponsored ADR | 422,254 | | 13,761,258 |
TOTAL COMMON STOCKS (Cost $3,024,876,195) | 3,911,445,206 |
Money Market Funds - 2.8% |
| Shares | | Value |
Fidelity Cash Central Fund, 0.19% (b) | 87,934,474 | | $ 87,934,474 |
Fidelity Securities Lending Cash Central Fund, 0.21% (b)(c) | 24,233,150 | | 24,233,150 |
TOTAL MONEY MARKET FUNDS (Cost $112,167,624) | 112,167,624 |
TOTAL INVESTMENT PORTFOLIO - 100.5% (Cost $3,137,043,819) | | 4,023,612,830 |
NET OTHER ASSETS (LIABILITIES) - (0.5)% | | (20,374,947) |
NET ASSETS - 100% | $ 4,003,237,883 |
Legend |
(a) Non-income producing |
(b) Affiliated fund that is available only to investment companies and other accounts managed by Fidelity Investments. The rate quoted is the annualized seven-day yield of the fund at period end. A complete unaudited listing of the fund's holdings as of its most recent quarter end is available upon request. In addition, each Fidelity Central Fund's financial statements, which are not covered by the Fund's Report of Independent Registered Public Accounting Firm, are available on the SEC's website or upon request. |
(c) Investment made with cash collateral received from securities on loan. |
(d) Security or a portion of the security is on loan at period end. |
(e) Security exempt from registration under Rule 144A of the Securities Act of 1933. These securities may be resold in transactions exempt from registration, normally to qualified institutional buyers. At the end of the period, the value of these securities amounted to $3,700,870 or 0.1% of net assets. |
Affiliated Central Funds |
Information regarding fiscal year to date income earned by the Fund from investments in Fidelity Central Funds is as follows: |
Fund | Income earned |
Fidelity Cash Central Fund | $ 124,568 |
Fidelity Securities Lending Cash Central Fund | 726,428 |
Total | $ 850,996 |
Other Information |
The following is a summary of the inputs used, as of December 31, 2010, involving the Fund's assets and liabilities carried at fair value. The inputs or methodology used for valuing securities may not be an indication of the risk associated with investing in those securities. For more information on valuation inputs, and their aggregation into the levels used in the table below, please refer to the Security Valuation section in the accompanying Notes to Financial Statements. |
Valuation Inputs at Reporting Date: |
Description | Total | Level 1 | Level 2 | Level 3 |
Investments in Securities: | | | | |
Equities: | | | | |
Consumer Discretionary | $ 626,082,463 | $ 626,082,463 | $ - | $ - |
Consumer Staples | 172,267,987 | 172,267,987 | - | - |
Energy | 361,389,865 | 361,389,865 | - | - |
Financials | 213,881,078 | 213,881,078 | - | - |
Health Care | 500,693,777 | 442,873,574 | 57,820,203 | - |
Industrials | 691,371,590 | 691,371,590 | - | - |
Information Technology | 1,153,426,189 | 1,147,919,281 | 5,506,908 | - |
Materials | 178,570,999 | 178,570,999 | - | - |
Telecommunication Services | 13,761,258 | 13,761,258 | - | - |
Money Market Funds | 112,167,624 | 112,167,624 | - | - |
Total Investments in Securities: | $ 4,023,612,830 | $ 3,960,285,719 | $ 63,327,111 | $ - |
Distribution of investments by country of issue, as a percentage of total net assets, is as follows: (Unaudited) |
United States of America | 86.2% |
Canada | 3.8% |
Denmark | 1.5% |
Netherlands Antilles | 1.2% |
Cayman Islands | 1.2% |
United Kingdom | 1.0% |
Singapore | 1.0% |
Others (Individually Less Than 1%) | 4.1% |
| 100.0% |
Income Tax Information |
At December 31, 2010, the Fund had a capital loss carryforward of approximately $1,604,451,566 of which $41,234,048, $1,104,811,876 and $458,405,642 will expire in fiscal 2011, 2016 and 2017, respectively. Capital loss carryforwards are only available to offset future capital gains of the Fund to the extent provided by regulations and may be limited. |
See accompanying notes which are an integral part of the financial statements.
Annual Report
Statement of Assets and Liabilities
| December 31, 2010 |
| | |
Assets | | |
Investment in securities, at value (including securities loaned of $23,877,604) - See accompanying schedule: Unaffiliated issuers (cost $3,024,876,195) | $ 3,911,445,206 | |
Fidelity Central Funds (cost $112,167,624) | 112,167,624 | |
Total Investments (cost $3,137,043,819) | | $ 4,023,612,830 |
Receivable for investments sold | | 9,401,826 |
Receivable for fund shares sold | | 814,132 |
Dividends receivable | | 764,089 |
Distributions receivable from Fidelity Central Funds | | 33,563 |
Prepaid expenses | | 10,638 |
Other receivables | | 235,135 |
Total assets | | 4,034,872,213 |
| | |
Liabilities | | |
Payable to custodian bank | $ 4 | |
Payable for investments purchased | 757,972 | |
Payable for fund shares redeemed | 4,086,810 | |
Accrued management fee | 1,845,584 | |
Distribution and service plan fees payable | 157,632 | |
Other affiliated payables | 314,164 | |
Other payables and accrued expenses | 239,014 | |
Collateral on securities loaned, at value | 24,233,150 | |
Total liabilities | | 31,634,330 |
| | |
Net Assets | | $ 4,003,237,883 |
Net Assets consist of: | | |
Paid in capital | | $ 4,749,126,522 |
Distributions in excess of net investment income | | (165,575) |
Accumulated undistributed net realized gain (loss) on investments and foreign currency transactions | | (1,632,294,936) |
Net unrealized appreciation (depreciation) on investments and assets and liabilities in foreign currencies | | 886,571,872 |
Net Assets | | $ 4,003,237,883 |
Statement of Assets and Liabilities - continued
| December 31, 2010 |
| | |
Initial Class:
Net Asset Value, offering price and redemption price per share ($2,842,306,553 ÷ 76,641,606 shares) | | $ 37.09 |
| | |
Service Class:
Net Asset Value, offering price and redemption price per share ($453,062,955 ÷ 12,247,567 shares) | | $ 36.99 |
| | |
Service Class 2:
Net Asset Value, offering price and redemption price per share ($584,193,295 ÷ 15,908,366 shares) | | $ 36.72 |
| | |
Service Class 2R:
Net Asset Value, offering price and redemption price per share ($5,739,135 ÷ 156,628 shares) | | $ 36.64 |
| | |
Investor Class:
Net Asset Value, offering price and redemption price per share ($117,935,945 ÷ 3,187,649 shares) | | $ 37.00 |
See accompanying notes which are an integral part of the financial statements.
Annual Report
Statement of Operations
| Year ended December 31, 2010 |
| | |
Investment Income | | |
Dividends | | $ 31,037,251 |
Interest | | 125 |
Income from Fidelity Central Funds | | 850,996 |
Total income | | 31,888,372 |
| | |
Expenses | | |
Management fee | $ 20,222,973 | |
Transfer agent fees | 2,822,529 | |
Distribution and service plan fees | 1,712,631 | |
Accounting and security lending fees | 1,036,366 | |
Custodian fees and expenses | 115,872 | |
Independent trustees' compensation | 21,887 | |
Appreciation in deferred trustee compensation account | 226 | |
Audit | 75,207 | |
Legal | 19,341 | |
Interest | 194 | |
Miscellaneous | 52,544 | |
Total expenses before reductions | 26,079,770 | |
Expense reductions | (397,466) | 25,682,304 |
Net investment income (loss) | | 6,206,068 |
Realized and Unrealized Gain (Loss) Net realized gain (loss) on: | | |
Investment securities: | | |
Unaffiliated issuers | 368,619,724 | |
Investment not meeting investment restrictions | (19,441) | |
Foreign currency transactions | (385,552) | |
Payment from investment advisor for loss on investment not meeting investment restrictions | 19,441 | |
Total net realized gain (loss) | | 368,234,172 |
Change in net unrealized appreciation (depreciation) on: Investment securities | 419,056,678 | |
Assets and liabilities in foreign currencies | 5,061 | |
Total change in net unrealized appreciation (depreciation) | | 419,061,739 |
Net gain (loss) | | 787,295,911 |
Net increase (decrease) in net assets resulting from operations | | $ 793,501,979 |
Statement of Changes in Net Assets
| Year ended
December 31, 2010 | Year ended
December 31, 2009 |
Increase (Decrease) in Net Assets | | |
Operations | | |
Net investment income (loss) | $ 6,206,068 | $ 11,842,787 |
Net realized gain (loss) | 368,234,172 | (453,010,967) |
Change in net unrealized appreciation (depreciation) | 419,061,739 | 1,274,194,307 |
Net increase (decrease) in net assets resulting from operations | 793,501,979 | 833,026,127 |
Distributions to shareholders from net investment income | (8,150,719) | (12,825,130) |
Distributions to shareholders from net realized gain | (12,197,748) | (2,861,216) |
Total distributions | (20,348,467) | (15,686,346) |
Share transactions - net increase (decrease) | (439,300,401) | (425,627,981) |
Redemption fees | 1,277 | 1,078 |
Total increase (decrease) in net assets | 333,854,388 | 391,712,878 |
| | |
Net Assets | | |
Beginning of period | 3,669,383,495 | 3,277,670,617 |
End of period (including distributions in excess of net investment income of $165,575 and undistributed net investment income of $219,186, respectively) | $ 4,003,237,883 | $ 3,669,383,495 |
See accompanying notes which are an integral part of the financial statements.
Annual Report
Financial Highlights - Initial Class
Years ended December 31, | 2010 | 2009 | 2008 | 2007 | 2006 |
Selected Per-Share Data | | | | | |
Net asset value, beginning of period | $ 30.04 | $ 23.53 | $ 45.12 | $ 35.87 | $ 33.70 |
Income from Investment Operations | | | | | |
Net investment income (loss) C | .07 | .10 | .27 | .09 | .21 |
Net realized and unrealized gain (loss) | 7.18 | 6.55 | (21.55) | 9.53 | 2.09 |
Total from investment operations | 7.25 | 6.65 | (21.28) | 9.62 | 2.30 |
Distributions from net investment income | (.09) | (.12) | (.31) | (.33) | (.13) |
Distributions from net realized gain | (.11) | (.02) | - | (.04) | - |
Total distributions | (.20) | (.14) H | (.31) | (.37) | (.13) |
Redemption fees added to paid in capital C, G | - | - | - | - | - |
Net asset value, end of period | $ 37.09 | $ 30.04 | $ 23.53 | $ 45.12 | $ 35.87 |
Total Return A, B | 24.17% | 28.29% | (47.17)% | 26.96% | 6.85% |
Ratios to Average Net Assets D, F | | | | | |
Expenses before reductions | .67% | .69% | .68% | .65% | .68% |
Expenses net of fee waivers, if any | .66% | .69% | .68% | .65% | .68% |
Expenses net of all reductions | .66% | .68% | .67% | .64% | .67% |
Net investment income (loss) | .22% | .41% | .74% | .21% | .61% |
Supplemental Data | | | | | |
Net assets, end of period (000 omitted) | $ 2,842,307 | $ 2,618,954 | $ 2,337,892 | $ 6,002,656 | $ 5,610,629 |
Portfolio turnover rate E | 75% | 134% | 161% | 109% | 114% |
A Total returns do not reflect charges attributable to your insurance company's separate account. Inclusion of these charges would reduce the total returns shown.
B Total returns would have been lower had certain expenses not been reduced during the periods shown.
C Calculated based on average shares outstanding during the period.
D Fees and expenses of the underlying Fidelity Central Funds are not included in the Fund's expense ratio. The Fund indirectly bears its proportionate share of the expenses of any underlying Fidelity Central Funds.
E Amount does not include the portfolio activity of any underlying Fidelity Central Funds.
F Expense ratios reflect operating expenses of the class. Expenses before reductions do not reflect amounts reimbursed by the investment adviser or reductions from brokerage service arrangements or reductions from other expense offset arrangements and do not represent the amount paid by the class during periods when reimbursements or reductions occur. Expenses net of fee waivers reflect expenses after reimbursement by the investment adviser but prior to reductions from brokerage service arrangements or other expense offset arrangements. Expenses net of all reductions represent the net expenses paid by the class.
G Amount represents less than $.01 per share.
H Total distributions of $.14 per share is comprised of distributions from net investment income of $.118 and distributions from net realized gain of $.023 per share.
Financial Highlights - Service Class
Years ended December 31, | 2010 | 2009 | 2008 | 2007 | 2006 |
Selected Per-Share Data | | | | | |
Net asset value, beginning of period | $ 29.96 | $ 23.47 | $ 44.99 | $ 35.72 | $ 33.56 |
Income from Investment Operations | | | | | |
Net investment income (loss) C | .04 | .08 | .23 | .04 | .18 |
Net realized and unrealized gain (loss) | 7.16 | 6.52 | (21.48) | 9.51 | 2.07 |
Total from investment operations | 7.20 | 6.60 | (21.25) | 9.55 | 2.25 |
Distributions from net investment income | (.06) | (.09) | (.27) | (.24) | (.09) |
Distributions from net realized gain | (.11) | (.02) | - | (.04) | - |
Total distributions | (.17) | (.11) H | (.27) | (.28) | (.09) |
Redemption fees added to paid in capital C, G | - | - | - | - | - |
Net asset value, end of period | $ 36.99 | $ 29.96 | $ 23.47 | $ 44.99 | $ 35.72 |
Total Return A, B | 24.06% | 28.15% | (47.23)% | 26.87% | 6.73% |
Ratios to Average Net Assets D, F | | | | | |
Expenses before reductions | .77% | .79% | .78% | .75% | .78% |
Expenses net of fee waivers, if any | .76% | .79% | .78% | .75% | .78% |
Expenses net of all reductions | .76% | .78% | .77% | .74% | .77% |
Net investment income (loss) | .12% | .31% | .64% | .11% | .51% |
Supplemental Data | | | | | |
Net assets, end of period (000 omitted) | $ 453,063 | $ 421,996 | $ 395,759 | $ 929,848 | $ 877,279 |
Portfolio turnover rate E | 75% | 134% | 161% | 109% | 114% |
A Total returns do not reflect charges attributable to your insurance company's separate account. Inclusion of these charges would reduce the total returns shown.
B Total returns would have been lower had certain expenses not been reduced during the periods shown.
C Calculated based on average shares outstanding during the period.
D Fees and expenses of the underlying Fidelity Central Funds are not included in the Fund's expense ratio. The Fund indirectly bears its proportionate share of the expenses of any underlying Fidelity Central Funds.
E Amount does not include the portfolio activity of any underlying Fidelity Central Funds.
F Expense ratios reflect operating expenses of the class. Expenses before reductions do not reflect amounts reimbursed by the investment adviser or reductions from brokerage service arrangements or reductions from other expense offset arrangements and do not represent the amount paid by the class during periods when reimbursements or reductions occur. Expenses net of fee waivers reflect expenses after reimbursement by the investment adviser but prior to reductions from brokerage service arrangements or other expense offset arrangements. Expenses net of all reductions represent the net expenses paid by the class.
G Amount represents less than $.01 per share.
H Total distributions of $.11 per share is comprised of distributions from net investment income of $.089 and distributions from net realized gain of $.023 per share.
See accompanying notes which are an integral part of the financial statements.
Annual Report
Financial Highlights - Service Class 2
Years ended December 31, | 2010 | 2009 | 2008 | 2007 | 2006 |
Selected Per-Share Data | | | | | |
Net asset value, beginning of period | $ 29.75 | $ 23.31 | $ 44.65 | $ 35.42 | $ 33.29 |
Income from Investment Operations | | | | | |
Net investment income (loss) C | (.01) | .04 | .17 | (.02) | .12 |
Net realized and unrealized gain (loss) | 7.10 | 6.48 | (21.29) | 9.43 | 2.07 |
Total from investment operations | 7.09 | 6.52 | (21.12) | 9.41 | 2.19 |
Distributions from net investment income | (.01) | (.05) | (.22) | (.15) | (.06) |
Distributions from net realized gain | (.11) | (.02) | - | (.03) | - |
Total distributions | (.12) | (.08) G | (.22) | (.18) | (.06) |
Redemption fees added to paid in capital C, G | - | - | - | - | - |
Net asset value, end of period | $ 36.72 | $ 29.75 | $ 23.31 | $ 44.65 | $ 35.42 |
Total Return A, B | 23.86% | 27.97% | (47.31)% | 26.66% | 6.57% |
Ratios to Average Net Assets D, F | | | | | |
Expenses before reductions | .92% | .94% | .93% | .90% | .94% |
Expenses net of fee waivers, if any | .91% | .94% | .93% | .90% | .94% |
Expenses net of all reductions | .91% | .93% | .92% | .89% | .92% |
Net investment income (loss) | (.03)% | .16% | .49% | (.04)% | .36% |
Supplemental Data | | | | | |
Net assets, end of period (000 omitted) | $ 584,193 | $ 528,819 | $ 447,530 | $ 898,204 | $ 627,754 |
Portfolio turnover rate E | 75% | 134% | 161% | 109% | 114% |
A Total returns do not reflect charges attributable to your insurance company's separate account. Inclusion of these charges would reduce the total returns shown.
B Total returns would have been lower had certain expenses not been reduced during the periods shown.
C Calculated based on average shares outstanding during the period.
D Fees and expenses of the underlying Fidelity Central Funds are not included in the Fund's expense ratio. The Fund indirectly bears its proportionate share of the expenses of any underlying Fidelity Central Funds.
E Amount does not include the portfolio activity of any underlying Fidelity Central Funds.
F Expense ratios reflect operating expenses of the class. Expenses before reductions do not reflect amounts reimbursed by the investment adviser or reductions from brokerage service arrangements or reductions from other expense offset arrangements and do not represent the amount paid by the class during periods when reimbursements or reductions occur. Expenses net of fee waivers reflect expenses after reimbursement by the investment adviser but prior to reductions from brokerage service arrangements or other expense offset arrangements. Expenses net of all reductions represent the net expenses paid by the class.
G Total distributions of $.08 per share is comprised of distributions from net investment income of $.052 and distributions from net realized gain of $.023 per share.
Financial Highlights - Service Class 2R
Years ended December 31, | 2010 | 2009 | 2008 | 2007 | 2006 |
Selected Per-Share Data | | | | | |
Net asset value, beginning of period | $ 29.70 | $ 23.26 | $ 44.42 | $ 35.28 | $ 33.18 |
Income from Investment Operations | | | | | |
Net investment income (loss) C | (.01) | .04 | .18 | (.01) | .12 |
Net realized and unrealized gain (loss) | 7.09 | 6.46 | (21.20) | 9.38 | 2.06 |
Total from investment operations | 7.08 | 6.50 | (21.02) | 9.37 | 2.18 |
Distributions from net investment income | (.03) | (.04) | (.14) | (.19) | (.08) |
Distributions from net realized gain | (.11) | (.02) | - | (.04) | - |
Total distributions | (.14) | (.06) G | (.14) | (.23) | (.08) |
Redemption fees added to paid in capital C, G | - | - | - | - | - |
Net asset value, end of period | $ 36.64 | $ 29.70 | $ 23.26 | $ 44.42 | $ 35.28 |
Total Return A, B | 23.86% | 27.98% | (47.31)% | 26.66% | 6.58% |
Ratios to Average Net Assets D, F | | | | | |
Expenses before reductions | .92% | .94% | .93% | .89% | .93% |
Expenses net of fee waivers, if any | .91% | .94% | .93% | .89% | .93% |
Expenses net of all reductions | .91% | .93% | .92% | .89% | .92% |
Net investment income (loss) | (.03)% | .16% | .49% | (.04)% | .36% |
Supplemental Data | | | | | |
Net assets, end of period (000 omitted) | $ 5,739 | $ 4,084 | $ 3,061 | $ 20,051 | $ 5,063 |
Portfolio turnover rate E | 75% | 134% | 161% | 109% | 114% |
A Total returns do not reflect charges attributable to your insurance company's separate account. Inclusion of these charges would reduce the total returns shown.
B Total returns would have been lower had certain expenses not been reduced during the periods shown.
C Calculated based on average shares outstanding during the period.
D Fees and expenses of the underlying Fidelity Central Funds are not included in the Fund's expense ratio. The Fund indirectly bears its proportionate share of the expenses of any underlying Fidelity Central Funds.
E Amount does not include the portfolio activity of any underlying Fidelity Central Funds.
F Expense ratios reflect operating expenses of the class. Expenses before reductions do not reflect amounts reimbursed by the investment adviser or reductions from brokerage service arrangements or reductions from other expense offset arrangements and do not represent the amount paid by the class during periods when reimbursements or reductions occur. Expenses net of fee waivers reflect expenses after reimbursement by the investment adviser but prior to reductions from brokerage service arrangements or other expense offset arrangements. Expenses net of all reductions represent the net expenses paid by the class.
G Total distributions of $.06 per share is comprised of distributions from net investment income of $.041 and distributions from net realized gain of $.023 per share.
See accompanying notes which are an integral part of the financial statements.
Annual Report
Financial Highlights - Investor Class
Years ended December 31, | 2010 | 2009 | 2008 | 2007 | 2006 |
Selected Per-Share Data | | | | | |
Net asset value, beginning of period | $ 29.97 | $ 23.48 | $ 45.00 | $ 35.78 | $ 33.67 |
Income from Investment Operations | | | | | |
Net investment income (loss) C | .04 | .08 | .24 | .04 | .17 |
Net realized and unrealized gain (loss) | 7.17 | 6.52 | (21.49) | 9.50 | 2.08 |
Total from investment operations | 7.21 | 6.60 | (21.25) | 9.54 | 2.25 |
Distributions from net investment income | (.07) | (.09) | (.27) | (.28) | (.14) |
Distributions from net realized gain | (.11) | (.02) | - | (.04) | - |
Total distributions | (.18) | (.11) H | (.27) | (.32) | (.14) |
Redemption fees added to paid in capital C, G | - | - | - | - | - |
Net asset value, end of period | $ 37.00 | $ 29.97 | $ 23.48 | $ 45.00 | $ 35.78 |
Total Return A, B | 24.08% | 28.14% | (47.22)% | 26.81% | 6.72% |
Ratios to Average Net Assets D, F | | | | | |
Expenses before reductions | .76% | .79% | .77% | .76% | .81% |
Expenses net of fee waivers, if any | .75% | .79% | .77% | .76% | .81% |
Expenses net of all reductions | .75% | .78% | .76% | .76% | .80% |
Net investment income (loss) | .13% | .31% | .65% | .09% | .49% |
Supplemental Data | | | | | |
Net assets, end of period (000 omitted) | $ 117,936 | $ 95,531 | $ 93,428 | $ 181,705 | $ 76,965 |
Portfolio turnover rate E | 75% | 134% | 161% | 109% | 114% |
A Total returns do not reflect charges attributable to your insurance company's separate account. Inclusion of these charges would reduce the total returns shown.
B Total returns would have been lower had certain expenses not been reduced during the periods shown.
C Calculated based on average shares outstanding during the period.
D Fees and expenses of the underlying Fidelity Central Funds are not included in the Fund's expense ratio. The Fund indirectly bears its proportionate share of the expenses of any underlying Fidelity Central Funds.
E Amount does not include the portfolio activity of any underlying Fidelity Central Funds.
F Expense ratios reflect operating expenses of the class. Expenses before reductions do not reflect amounts reimbursed by the investment adviser or reductions from brokerage service arrangements or reductions from other expense offset arrangements and do not represent the amount paid by the class during periods when reimbursements or reductions occur. Expenses net of fee waivers reflect expenses after reimbursement by the investment adviser but prior to reductions from brokerage service arrangements or other expense offset arrangements. Expenses net of all reductions represent the net expenses paid by the class.
G Amount represents less than $.01 per share.
H Total distributions of $.11 per share is comprised of distributions from net investment income of $.089 and distributions from net realized gain of $.023 per share.
See accompanying notes which are an integral part of the financial statements.
Annual Report
Notes to Financial Statements
For the period ended December 31, 2010
1. Organization.
VIP Growth Portfolio (the Fund) is a fund of Variable Insurance Products Fund (the Trust) and is authorized to issue an unlimited number of shares. The Trust is registered under the Investment Company Act of 1940, as amended (the 1940 Act), as an open-end management investment company organized as a Massachusetts business trust. Shares of the Fund may only be purchased by insurance companies for the purpose of funding variable annuity or variable life insurance contracts. The Fund offers the following classes of shares: Initial Class shares, Service Class shares, Service Class 2 shares, Service Class 2R shares and Investor Class shares. All classes have equal rights and voting privileges, except for matters affecting a single class. Investment income, realized and unrealized capital gains and losses, the common expenses of the Fund, and certain fund-level expense reductions, if any, are allocated on a pro-rata basis to each class based on the relative net assets of each class to the total net assets of the Fund. Each class differs with respect to transfer agent and distribution and service plan fees incurred. Certain expense reductions also differ by class.
2. Investments in Fidelity Central Funds.
The Fund may invest in Fidelity Central Funds, which are open-end investment companies available only to other investment companies and accounts managed by Fidelity Management & Research Company (FMR) and its affiliates. The Fund's Schedule of Investments lists each of the Fidelity Central Funds held as of period end, if any, as an investment of the Fund, but does not include the underlying holdings of each Fidelity Central Fund. As an Investing Fund, the Fund indirectly bears its proportionate share of the expenses of the underlying Fidelity Central Funds.
The Money Market Central Funds seek preservation of capital and current income and are managed by Fidelity Investments Money Management, Inc. (FIMM), an affiliate of FMR.
A complete unaudited list of holdings for each Fidelity Central Fund is available upon request or at the Securities and Exchange Commission (the SEC) web site at www.sec.gov. In addition, the financial statements of the Fidelity Central Funds, which are not covered by the Fund's Report of Independent Registered Public Accounting Firm, are available on the SEC web site or upon request.
3. Significant Accounting Policies.
The financial statements have been prepared in conformity with accounting principles generally accepted in the United States of America (GAAP), which require management to make certain estimates and assumptions at the date of the financial statements. Actual results could differ from those estimates. Subsequent events, if any, through the date that the financial statements were issued have been evaluated in the preparation of the financial statements. The following summarizes the significant accounting policies of the Fund:
Security Valuation. Investments are valued as of 4:00 p.m. Eastern time on the last calendar day of the period. The Fund uses independent pricing services approved by the Board of Trustees to value its investments. When current market prices or quotations are not readily available or reliable, valuations may be determined in good faith in accordance with procedures adopted by the Board of Trustees. Factors used in determining value may include market or security specific events. The frequency with which these procedures are used cannot be predicted and they may be utilized to a significant extent. The value used for net asset value (NAV) calculation under these procedures may differ from published prices for the same securities.
The Fund categorizes the inputs to valuation techniques used to value its investments into a disclosure hierarchy consisting of three levels as shown below.
Level 1 - quoted prices in active markets for identical investments
Level 2 - other significant observable inputs (including quoted prices for similar investments, interest rates, prepayment speeds, etc.)
Level 3 - unobservable inputs (including the Fund's own assumptions based on the best information available)
Changes in valuation techniques may result in transfers in or out of an assigned level within the disclosure hierarchy. The aggregate value of investments by input level, as of December 31, 2010 is included at the end of the Fund's Schedule of Investments. Valuation techniques used to value the Fund's investments by major category are as follows.
Equity securities, including restricted securities, for which market quotations are readily available, are valued at the last reported sale price or official closing price as reported by an independent pricing service on the primary market or exchange on which they are traded and are categorized as Level 1 in the hierarchy. In the event there were no sales during the day or closing prices are not available, securities are valued at the last quoted bid price or may be valued using the last available price and are generally categorized as Level 2 in the hierarchy. For foreign equity securities, when significant market or security specific events arise, comparisons to the valuation of American Depositary Receipts (ADRs), futures contracts, Exchange-traded funds (ETFs) and certain indexes as well as quoted prices for similar securities are used and are categorized as Level 2 in the hierarchy in these circumstances. Utilizing these techniques may result in transfers between Level 1 and Level 2. For restricted equity securities and private placements where observable inputs are limited, assumptions about market activity and risk are used and are categorized as Level 3 in the hierarchy.
Annual Report
Notes to Financial Statements - continued
3. Significant Accounting Policies - continued
Security Valuation - continued
Investments in open-end mutual funds, including the Fidelity Central Funds, are valued at their closing net asset value each business day and are categorized as Level 1 in the hierarchy.
Foreign Currency. The Fund uses foreign currency contracts to facilitate transactions in foreign-denominated securities. Gains and losses from these transactions may arise from changes in the value of the foreign currency or if the counterparties do not perform under the contracts' terms.
Foreign-denominated assets, including investment securities, and liabilities are translated into U.S. dollars at the exchange rate at period end. Purchases and sales of investment securities, income and dividends received and expenses denominated in foreign currencies are translated into U.S. dollars at the exchange rate in effect on the transaction date.
The effects of exchange rate fluctuations on investments are included with the net realized and unrealized gain (loss) on investment securities. Other foreign currency transactions resulting in realized and unrealized gain (loss) are disclosed separately.
Investment Transactions and Income. For financial reporting purposes, the Fund's investment holdings and NAV include trades executed through the end of the last business day of the period. The NAV per share for processing shareholder transactions is calculated as of the close of business of the New York Stock Exchange (NYSE), normally 4:00 p.m. Eastern time and includes trades executed through the end of the prior business day. Gains and losses on securities sold are determined on the basis of identified cost and may include proceeds received from litigation. Dividend income is recorded on the ex-dividend date, except for certain dividends from foreign securities where the ex-dividend date may have passed, which are recorded as soon as the Fund is informed of the ex-dividend date. Non-cash dividends included in dividend income, if any, are recorded at the fair market value of the securities received. Distributions received on securities that represent a return of capital or capital gain are recorded as a reduction of cost of investments and/or as a realized gain. The Fund estimates the components of distributions received that may be considered return of capital distributions or capital gain distributions. Interest income and distributions from the Fidelity Central Funds are accrued as earned. Interest income includes coupon interest and amortization of premium and accretion of discount on debt securities. Investment income is recorded net of foreign taxes withheld where recovery of such taxes is uncertain.
Expenses. Expenses directly attributable to a fund are charged to that fund. Expenses attributable to more than one fund are allocated among the respective funds on the basis of relative net assets or other appropriate methods. Expense estimates are accrued in the period to which they relate and adjustments are made when actual amounts are known.
Deferred Trustee Compensation. Under a Deferred Compensation Plan (the Plan), independent Trustees may elect to defer receipt of a portion of their annual compensation. Deferred amounts are invested in a cross-section of Fidelity funds, are marked-to-market and remain in the Fund until distributed in accordance with the Plan. The investment of deferred amounts and the offsetting payable to the Trustees are included in the accompanying Statement of Assets and Liabilities.
Income Tax Information and Distributions to Shareholders. Each year the Fund intends to qualify as a regulated investment company, including distributing substantially all of its taxable income and realized gains under Subchapter M of the Internal Revenue Code and filing its U.S. federal tax return. As a result, no provision for income taxes is required. As of December 31, 2010, the Fund did not have any unrecognized tax benefits in the accompanying financial statements. A fund's federal tax return is subject to examination by the Internal Revenue Service (IRS) for a period of three years. Foreign taxes are provided for based on the Fund's understanding of the tax rules and rates that exist in the foreign markets in which it invests.
Distributions are declared and recorded on the ex-dividend date. Income dividends and capital gain distributions are declared separately for each class. Income and capital gain distributions are determined in accordance with income tax regulations, which may differ from GAAP.
Capital accounts within the financial statements are adjusted for permanent book-tax differences. These adjustments have no impact on net assets or the results of operations. Temporary book-tax differences will reverse in a subsequent period.
Book-tax differences are primarily due to foreign currency transactions, passive foreign investment companies (PFIC), deferred trustees compensation, capital loss carryforwards and losses deferred due to wash sales.
The federal tax cost of investment securities and unrealized appreciation (depreciation) as of period end were as follows:
Gross unrealized appreciation | $ 917,016,465 |
Gross unrealized depreciation | (65,205,672) |
Net unrealized appreciation (depreciation) | $ 851,810,793 |
Tax Cost | $ 3,171,802,037 |
Annual Report
3. Significant Accounting Policies - continued
Income Tax Information and Distributions to Shareholders - continued
The tax-based components of distributable earnings as of period end were as follows:
Undistributed ordinary income | $ 6,914,850 |
Capital loss carryforward | $ (1,604,451,566) |
Net unrealized appreciation (depreciation) | $ 851,813,654 |
The tax character of distributions paid was as follows:
| December 31, 2010 | December 31, 2009 |
Ordinary Income | $ 20,348,467 | $ 15,686,346 |
Trading (Redemption) Fees. Service Class 2R shares held by investors less than 60 days are subject to a redemption fee equal to 1% of the net asset value of shares redeemed. All redemption fees, which reduce the proceeds of the shareholder redemption, are retained by the Fund and accounted for as an addition to paid in capital.
4. Operating Policies.
Restricted Securities. The Fund may invest in securities that are subject to legal or contractual restrictions on resale. These securities generally may be resold in transactions exempt from registration or to the public if the securities are registered. Disposal of these securities may involve time-consuming negotiations and expense, and prompt sale at an acceptable price may be difficult. Information regarding restricted securities is included at the end of the Fund's Schedule of Investments.
5. Purchases and Sales of Investments.
Purchases and sales of securities, other than short-term securities, aggregated $2,625,759,610 and $3,106,144,474, respectively.
The Fund realized a loss on the sale of an investment not meeting the investment restrictions of the Fund. The loss was fully reimbursed by the Fund's investment advisor.
6. Fees and Other Transactions with Affiliates.
Management Fee. FMR and its affiliates provide the Fund with investment management related services for which the Fund pays a monthly management fee. The management fee is the sum of an individual fund fee rate that is based on an annual rate of .30% of the Fund's average net assets and a group fee rate that averaged .26% during the period. The group fee rate is based upon the average net assets of all the mutual funds advised by FMR. The group fee rate decreases as assets under management increase and increases as assets under management decrease. For the period, the total annual management fee rate was .56% of the Fund's average net assets.
Distribution and Service Plan Fees. In accordance with Rule 12b-1 of the 1940 Act, the Fund has adopted separate 12b-1 Plans for each Service Class of shares. Each Service Class pays Fidelity Distributors Corporation (FDC), an affiliate of FMR, a service fee. For the period, the service fee is based on an annual rate of .10% of Service Class' average net assets and .25% of Service Class 2's and Service Class 2R's average net assets.
For the period, total fees, all of which were re-allowed to insurance companies for the distribution of shares and providing shareholder support services were as follows:
Service Class | $ 414,029 |
Service Class 2 | 1,288,224 |
Service Class 2 R | 10,378 |
| $ 1,712,631 |
Annual Report
Notes to Financial Statements - continued
6. Fees and Other Transactions with Affiliates - continued
Transfer Agent Fees. Fidelity Investments Institutional Operations Company, Inc. (FIIOC), an affiliate of FMR, is the Fund's transfer, dividend disbursing, and shareholder servicing agent. FIIOC receives an asset-based fee with respect to each class. Each class (with the exception of Investor Class) pays a transfer agent fee, excluding out of pocket expenses, equal to an annual rate of .07% of average net assets. Investor Class pays a monthly asset-based transfer agent fee of .15% of average net assets. In addition, FIIOC receives an asset-based fee of .01% of average net assets for typesetting, printing and mailing of shareholder reports, except proxy statements. FIIOC has agreed to voluntarily waive this fee until December 31, 2010. (See Note 9: Expense Reductions.) For the period, transfer agent fees for each class, including printing and out of pocket expenses, were as follows:
Initial Class | $ 1,948,797 |
Service Class | 314,174 |
Service Class 2 | 396,075 |
Service Class 2R | 3,089 |
Investor Class | 160,394 |
| $ 2,822,529 |
Accounting and Security Lending Fees. Fidelity Service Company, Inc. (FSC), an affiliate of FMR, maintains the Fund's accounting records. The accounting fee is based on the level of average net assets for the month. Under a separate contract, FSC administers the security lending program. The security lending fee is based on the number and duration of lending transactions.
Brokerage Commissions. The Fund placed a portion of its portfolio transactions with brokerage firms which are affiliates of the investment adviser. The commissions paid to these affiliated firms were $45,002 for the period.
Interfund Lending Program. Pursuant to an Exemptive Order issued by the SEC, the Fund, along with other registered investment companies having management contracts with FMR, may participate in an interfund lending program. This program provides an alternative credit facility allowing the funds to borrow from, or lend money to, other participating affiliated funds. At period end, there were no interfund loans outstanding. The Fund's activity in this program during the period for which loans were outstanding was as follows:
Borrower or Lender | Average Daily
Loan Balance | Weighted Average
Interest Rate | Interest
Expense |
Borrower | $ 15,534,000 | .45% | $ 194 |
7. Committed Line of Credit.
The Fund participates with other funds managed by FMR or an affiliate in a $3.75 billion credit facility (the "line of credit") to be utilized for temporary or emergency purposes to fund shareholder redemptions or for other short-term liquidity purposes. The Fund has agreed to pay commitment fees on its pro-rata portion of the line of credit, which amounted to $14,102 and is reflected in Miscellaneous expenses on the Statement of Operations. During the period, there were no borrowings on this line of credit.
8. Security Lending.
The Fund lends portfolio securities through a lending agent from time to time in order to earn additional income. The lending agent may loan securities to certain qualified borrowers, including Fidelity Capital Markets (FCM), a broker-dealer affiliated with the Fund. On the settlement date of the loan, the Fund receives collateral (in the form of U.S. Treasury obligations, letters of credit and/or cash) against the loaned securities and maintains collateral in an amount not less than 100% of the market value of the loaned securities during the period of the loan. The market value of the loaned securities is determined at the close of business of the Fund and any additional required collateral is delivered to the Fund on the next business day. If the borrower defaults on its obligation to return the securities loaned because of insolvency or other reasons, a fund could experience delays and costs in recovering the securities loaned or in gaining access to the collateral. Any cash collateral received is invested in the Fidelity Securities Lending Cash Central Fund. The value of loaned securities and cash collateral at period end are disclosed on the Fund's Statement of Assets and Liabilities. Security lending income represents the income earned on investing cash collateral, less rebates paid to borrowers and lending agent fees associated with the loan, plus any premium payments received for lending certain types of securities. Security lending income is presented in the Statement of Operations as a component of income from Fidelity Central Funds. Total security lending income during the period amounted to $726,428, including $2,452 from securities loaned to FCM.
Annual Report
9. Expense Reductions.
FMR or its affiliates agreed to waive certain fees during the period as noted in the table below.
Initial Class | $ 187,563 |
Service Class | 30,013 |
Service Class 2 | 37,359 |
Service Class 2R | 301 |
Investor Class | 7,099 |
| $ 262,335 |
Many of the brokers with whom FMR places trades on behalf of the Fund provided services to the Fund in addition to trade execution. These services included payments of certain expenses on behalf of the Fund totaling $134,926 for the period. In addition, through arrangements with the Fund's custodian, credits realized as a result of uninvested cash balances were used to reduce the Fund's expenses. During the period, these credits reduced the Fund's custody expenses by $205.
10. Distributions to Shareholders.
Distributions to shareholders of each class were as follows:
Years ended December 31, | 2010 | 2009 |
From net investment income | | |
Initial Class | $ 7,069,872 | $ 10,334,573 |
Service Class | 708,549 | 1,267,138 |
Service Class 2 | 157,035 | 932,585 |
Service Class 2R | 4,039 | 5,914 |
Investor Class | 211,224 | 284,920 |
Total | $ 8,150,719 | $ 12,825,130 |
From net realized gain | | |
Initial Class | $ 8,678,947 | $ 2,036,641 |
Service Class | 1,386,003 | 332,083 |
Service Class 2 | 1,769,479 | 414,242 |
Service Class 2R | 15,949 | 3,345 |
Investor Class | 347,370 | 74,905 |
Total | $ 12,197,748 | $ 2,861,216 |
11. Share Transactions.
Transactions for each class of shares were as follows:
| Shares | Dollars |
Years ended December 31, | 2010 | 2009 | 2010 | 2009 |
Initial Class | | | | |
Shares sold | 3,473,243 | 3,168,252 | $ 113,067,768 | $ 80,283,755 |
Reinvestment of distributions | 445,708 | 426,627 | 15,748,819 | 12,371,214 |
Shares redeemed | (14,471,861) | (15,761,725) | (459,125,365) | (393,809,218) |
Net increase (decrease) | (10,552,910) | (12,166,846) | $ (330,308,778) | $ (301,154,249) |
Service Class | | | | |
Shares sold | 651,294 | 601,860 | $ 21,310,170 | $ 15,078,974 |
Reinvestment of distributions | 59,936 | 55,581 | 2,094,552 | 1,599,221 |
Shares redeemed | (2,547,621) | (3,433,675) | (80,470,779) | (86,029,416) |
Net increase (decrease) | (1,836,391) | (2,776,234) | $ (57,066,057) | $ (69,351,221) |
Service Class 2 | | | | |
Shares sold | 2,292,229 | 3,094,007 | $ 74,709,454 | $ 75,154,813 |
Reinvestment of distributions | 56,469 | 47,559 | 1,926,514 | 1,346,827 |
Shares redeemed | (4,214,967) | (4,562,964) | (130,514,071) | (113,322,366) |
Net increase (decrease) | (1,866,269) | (1,421,398) | $ (53,878,103) | $ (36,820,726) |
Annual Report
Notes to Financial Statements - continued
11. Share Transactions - continued
| Shares | Dollars |
Years ended December 31, | 2010 | 2009 | 2010 | 2009 |
Service Class 2R | | | | |
Shares sold | 106,812 | 70,980 | $ 3,580,908 | $ 1,731,048 |
Reinvestment of distributions | 577 | 331 | 19,988 | 9,259 |
Shares redeemed | (88,264) | (65,400) | (2,902,806) | (1,732,958) |
Net increase (decrease) | 19,125 | 5,911 | $ 698,090 | $ 7,349 |
Investor Class | | | | |
Shares sold | 639,949 | 347,569 | $ 21,166,429 | $ 9,118,954 |
Reinvestment of distributions | 15,871 | 12,514 | 558,594 | 359,825 |
Shares redeemed | (655,594) | (1,151,644) | (20,470,576) | (27,787,913) |
Net increase (decrease) | 226 | (791,561) | $ 1,254,447 | $ (18,309,134) |
12. Other.
The Fund's organizational documents provide former and current trustees and officers with a limited indemnification against liabilities arising in connection with the performance of their duties to the Fund. In the normal course of business, the Fund may also enter into contracts that provide general indemnifications. The Fund's maximum exposure under these arrangements is unknown as this would be dependent on future claims that may be made against the Fund. The risk of material loss from such claims is considered remote.
At the end of the period, FMR or its affiliates were the owners of record of 16% of the total outstanding shares of the Fund and two otherwise unaffiliated shareholders were the owners of record of 34% of the total outstanding shares of the Fund.
Annual Report
Report of Independent Registered Public Accounting Firm
To the Trustees of Variable Insurance Products Fund and the Shareholders of VIP Growth Portfolio:
In our opinion, the accompanying statement of assets and liabilities, including the schedule of investments, and the related statements of operations and of changes in net assets and the financial highlights present fairly, in all material respects, the financial position of VIP Growth Portfolio (a fund of Variable Insurance Products Fund) at December 31, 2010, the results of its operations for the year then ended, the changes in its net assets for each of the two years in the period then ended and the financial highlights for each of the five years in the period then ended, in conformity with accounting principles generally accepted in the United States of America. These financial statements and financial highlights (hereafter referred to as "financial statements") are the responsibility of the VIP Growth Portfolio's management. Our responsibility is to express an opinion on these financial statements based on our audits. We conducted our audits of these financial statements in accordance with the standards of the Public Company Accounting Oversight Board (United States). Those standards require that we plan and perform the audit to obtain reasonable assurance about whether the financial statements are free of material misstatement. An audit includes examining, on a test basis, evidence supporting the amounts and disclosures in the financial statements, assessing the accounting principles used and significant estimates made by management, and evaluating the overall financial statement presentation. We believe that our audits, which included confirmation of securities at December 31, 2010 by correspondence with the custodian and brokers, provide a reasonable basis for our opinion.
/s/ PricewaterhouseCoopers LLP
PricewaterhouseCoopers LLP
Boston, Massachusetts
February 14, 2011
Annual Report
The Trustees, Members of the Advisory Board, and executive officers of the trust and fund, as applicable, are listed below. The Board of Trustees governs the fund and is responsible for protecting the interests of shareholders. The Trustees are experienced executives who meet periodically throughout the year to oversee the fund's activities, review contractual arrangements with companies that provide services to the fund, oversee management of the risks associated with such activities and contractual arrangements, and review the fund's performance. Except for James C. Curvey, each of the Trustees oversees 219 funds advised by FMR or an affiliate. Mr. Curvey oversees 408 funds advised by FMR or an affiliate.
The Trustees hold office without limit in time except that (a) any Trustee may resign; (b) any Trustee may be removed by written instrument, signed by at least two-thirds of the number of Trustees prior to such removal; (c) any Trustee who requests to be retired or who has become incapacitated by illness or injury may be retired by written instrument signed by a majority of the other Trustees; and (d) any Trustee may be removed at any special meeting of shareholders by a two-thirds vote of the outstanding voting securities of the trust. Each Trustee who is not an interested person (as defined in the 1940 Act) (Independent Trustee), shall retire not later than the last day of the calendar year in which his or her 72nd birthday occurs. The Independent Trustees may waive this mandatory retirement age policy with respect to individual Trustees. The executive officers and Advisory Board Members hold office without limit in time, except that any officer and Advisory Board Member may resign or may be removed by a vote of a majority of the Trustees at any regular meeting or any special meeting of the Trustees. Except as indicated, each individual has held the office shown or other offices in the same company for the past five years.
Experience, Skills, Attributes, and Qualifications of the Fund's Trustees. The Governance and Nominating Committee has adopted a statement of policy that describes the experience, qualifications, attributes, and skills that are necessary and desirable for potential Independent Trustee candidates (Statement of Policy). The Board believes that each Trustee satisfied at the time he or she was initially elected or appointed a Trustee, and continues to satisfy, the standards contemplated by the Statement of Policy. The Governance and Nominating Committee also engages professional search firms to help identify potential Independent Trustee candidates who have the experience, qualifications, attributes, and skills consistent with the Statement of Policy. From time to time, additional criteria based on the composition and skills of the current Independent Trustees, as well as experience or skills that may be appropriate in light of future changes to board composition, business conditions, and regulatory or other developments, have also been considered by the professional search firms and the Governance and Nominating Committee. In addition, the Board takes into account the Trustees' commitment and participation in Board and committee meetings, as well as their leadership of standing and ad hoc committees throughout their tenure.
In determining that a particular Trustee was and continues to be qualified to serve as a Trustee, the Board has considered a variety of criteria, none of which, in isolation, was controlling. The Board believes that, collectively, the Trustees have balanced and diverse experience, qualifications, attributes, and skills, which allow the Board to operate effectively in governing the fund and protecting the interests of shareholders. Information about the specific experience, skills, attributes, and qualifications of each Trustee, which in each case led to the Board's conclusion that the Trustee should serve (or continue to serve) as a trustee of the fund, is provided below.
Board Structure and Oversight Function. James C. Curvey is an interested person (as defined in the 1940 Act) and currently serves as Acting Chairman. The Trustees have determined that an interested Chairman is appropriate and benefits shareholders because an interested Chairman has a personal and professional stake in the quality and continuity of services provided to the fund. Independent Trustees exercise their informed business judgment to appoint an individual of their choosing to serve as Chairman, regardless of whether the Trustee happens to be independent or a member of management. The Independent Trustees have determined that they can act independently and effectively without having an Independent Trustee serve as Chairman and that a key structural component for assuring that they are in a position to do so is for the Independent Trustees to constitute a substantial majority for the Board. The Independent Trustees also regularly meet in executive session. Ned C. Lautenbach serves as Chairman of the Independent Trustees and as such (i) acts as a liaison between the Independent Trustees and management with respect to matters important to the Independent Trustees and (ii) with management prepares agendas for Board meetings.
Fidelity funds are overseen by different Boards of Trustees. The fund's Board oversees Fidelity's equity and high income funds and another Board oversees Fidelity's investment-grade bond, money market, and asset allocation funds. The asset allocation funds may invest in Fidelity funds overseen by the fund's Board. The use of separate Boards, each with its own committee structure, allows the Trustees of each group of Fidelity funds to focus on the unique issues of the funds they oversee, including common research, investment, and operational issues. On occasion, the separate Boards establish joint committees to address issues of overlapping consequences for the Fidelity funds overseen by each Board.
The Trustees operate using a system of committees to facilitate the timely and efficient consideration of all matters of importance to the Trustees, the fund, and fund shareholders and to facilitate compliance with legal and regulatory requirements and oversight of the fund's activities and associated risks. The Board, acting through its committees, has charged FMR and its affiliates with (i) identifying events or circumstances the occurrence of which could have demonstrably adverse effects on the fund's business and/or reputation; (ii) implementing processes and controls to lessen the possibility that such events or circumstances occur or to mitigate the effects of such events or circumstances if they do occur; and (iii) creating and maintaining a system designed to evaluate continuously business and market conditions in order to facilitate the identification and implementation processes described in (i) and (ii) above. Because the day-to-day operations and activities of the fund are carried out by or through FMR, its affiliates and other service providers, the fund's exposure to risks is mitigated but not eliminated by the processes overseen by the Trustees. While each of the Board's committees has responsibility for overseeing different aspects of the fund's activities, oversight is exercised primarily through the Operations, Audit, and Compliance Committees. Appropriate personnel, including but not limited to the fund's Chief Compliance Officer (CCO), FMR's internal auditor, the independent accountants, the fund's Treasurer and portfolio management personnel, make periodic reports to the Board's committees, as appropriate. The responsibilities of each committee, including their oversight responsibilities, are described further under "Standing Committees of the Fund's Trustees."
Annual Report
Trustees and Officers - continued
The fund's Statement of Additional Information (SAI) includes more information about the Trustees. To request a free copy, call Fidelity at 1-877-208-0098.
Interested Trustees*:
Correspondence intended for each Trustee who is an interested person may be sent to Fidelity Investments, 82 Devonshire Street, Boston, Massachusetts 02109.
Name, Age; Principal Occupations and Other Relevant Experience+ |
James C. Curvey (75) |
| Year of Election or Appointment: 2007 Mr. Curvey is Trustee and Acting Chairman of the Board of Trustees of certain Trusts. Mr. Curvey also serves as Trustee (2007-present) of other investment companies advised by FMR. Mr. Curvey is a Director of Fidelity Investments Money Management, Inc. (2009-present), Director of Fidelity Research & Analysis Co. (2009-present) and Director of FMR and FMR Co., Inc. (2007-present). Mr. Curvey is also Vice Chairman (2007-present) and Director of FMR LLC. In addition, Mr. Curvey serves as an Overseer for the Boston Symphony Orchestra and a member of the Trustees of Villanova University. Previously, Mr. Curvey was the Vice Chairman (2006-2007) and Director (2000-2007) of FMR Corp. |
Ronald P. O'Hanley (54) |
| Year of Election or Appointment: 2011 Mr. O'Hanley is President of Fidelity Asset Management and Corporate Services, for Fidelity Investments and a member of Fidelity's Executive Committee (2010-present). Previously, Mr. O'Hanley served as President and Chief Executive Officer of BNY Mellon Asset Management (2007-2010). Mr. O'Hanley also served as Vice Chairman of Bank New York Mellon Corp. and a member of that firm's Executive Committee. Prior to the 2007 merger of The Bank of New York and Mellon Financial Corporation, he was Vice Chairman of Mellon Financial Corporation and President and Chief Executive Officer of Mellon Asset Management. He joined Mellon in February 1997. Mr. O'Hanley currently serves as Chairman of the Boston Public Library Foundation Board of Directors and sits on the Board of Directors of Beth Israel Deaconess Medical Center, the Board of Trustees of the Marine Biological Laboratory and the Advisory Board of the Maxwell School of Citizenship and Public Administration at Syracuse University. Mr. O'Hanley also chairs the Council on Asset Management for the Financial Services Roundtable and is a member of the Board of Directors of Institutional Investor's U.S. Institute. |
* Trustees have been determined to be "Interested Trustees" by virtue of, among other things, their affiliation with the trust or various entities under common control with FMR.
+ The information above includes each Trustee's principal occupation during the last five years and other information relating to the experience, attributes, and skills relevant to each Trustee's qualifications to serve as a Trustee, which led to the conclusion that each Trustee should serve as a Trustee for the fund.
Independent Trustees:
Correspondence intended for each Independent Trustee (that is, the Trustees other than the Interested Trustees) may be sent to Fidelity Investments, P.O. Box 55235, Boston, Massachusetts 02205-5235.
Name, Age; Principal Occupations and Other Relevant Experience+ |
Dennis J. Dirks (62) |
| Year of Election or Appointment: 200 Prior to his retirement in May 2003, Mr. Dirks was Chief Operating Officer and a member of the Board of The Depository Trust & Clearing Corporation (DTCC). He also served as President, Chief Operating Officer, and Board member of The Depository Trust Company (DTC) and President and Board member of the National Securities Clearing Corporation (NSCC). In addition, Mr. Dirks served as Chief Executive Officer and Board member of the Government Securities Clearing Corporation, Chief Executive Officer and Board member of the Mortgage-Backed Securities Clearing Corporation, as a Trustee and a member of the Finance Committee of Manhattan College (2005-2008), and as a Trustee and a member of the Finance Committee of AHRC of Nassau County (2006-2008). Mr. Dirks is a member of the Independent Directors Council (IDC) Governing Council (2010-Present) and Board of Directors for The Brookville Center for Children's Services, Inc. (2009-present). |
Alan J. Lacy (57) |
| Year of Election or Appointment: 2008 Mr. Lacy serves as Senior Adviser (2007-present) of Oak Hill Capital Partners, L.P. (private equity). Mr. Lacy also served as Chief Executive Officer (2000-2005) and Vice Chairman (2005-2006) of Sears Holdings Corporation and Sears, Roebuck and Co. (retail). In addition, Mr. Lacy serves as a member of the Board of Directors of The Western Union Company (global money transfer, 2006-present) and Bristol-Myers Squibb Company (global pharmaceuticals, 2007-present). Mr. Lacy is Chairman (2008-present) and a member (2006-present) of the Board of Trustees of The National Parks Conservation Association. |
Ned C. Lautenbach (66) |
| Year of Election or Appointment: 2000 Mr. Lautenbach is Chairman of the Independent Trustees of the Equity and High Income Funds (2006-present). Mr. Lautenbach currently serves as the Lead Director of the Eaton Corporation Board of Directors (diversified industrial, 1997-present). Mr. Lautenbach is also a member of the Board of Directors of the Philharmonic Center for the Arts in Naples, Florida (1999-
present); a member of the Board of Trustees of Fairfield University (2005-present); and a member of the Council on Foreign Relations (1994-present). Previously, Mr. Lautenbach was a Partner/Advisory Partner at Clayton, Dubilier & Rice, Inc. (private equity investment, 1998-2010), as well as a Director of Sony Corporation (2006-2007). |
Joseph Mauriello (66) |
| Year of Election or Appointment: 2008 Prior to his retirement in January 2006, Mr. Mauriello served in numerous senior management positions including Deputy Chairman and Chief Operating Officer (2004-2005), and Vice Chairman of Financial Services (2002-2004) of KPMG LLP US (professional services, 1965-2005). Mr. Mauriello currently serves as a member of the Board of Directors of XL Group plc. (global insurance and re-insurance, 2006-present) and of Arcadia Resources Inc. (health care services and products, 2007-present). Previously, Mr. Mauriello served as a Director of the Hamilton Funds of the Bank of New York (2006-2007). |
Cornelia M. Small (66) |
| Year of Election or Appointment: 2005 Ms. Small is a member of the Board of Directors of the Teagle Foundation (2009-present). Ms. Small is also a member of the Investment Committee, and Chair (2008-present) and a member of the Board of Trustees of Smith College. In addition, Ms. Small serves on the Investment Committee of the Berkshire Taconic Community Foundation (2008-present). Previously, Ms. Small served as Chairperson of the Investment Committee (2002-2008) of Smith College. In addition, Ms. Small served as Chief Investment Officer, Director of Global Equity Investments, and a member of the Board of Directors of Scudder, Stevens & Clark and Scudder Kemper Investments. |
William S. Stavropoulos (71) |
| Year of Election or Appointment: 2001 Mr. Stavropoulos is Vice Chairman of the Independent Trustees of the Equity and High Income Funds (2006-present). Mr. Stavropoulos serves as President and Founder of the Michigan Baseball Foundation, the Great Lakes Loons (2007-present). Mr. Stavropoulos is Chairman Emeritus of the Board of Directors of The Dow Chemical Company, where he previously served in numerous senior management positions, including President, CEO (1995-2000; 2002-2004), Chairman of the Executive Committee (2000-2006), and as a member of the Board of Directors (1990-2006). Currently, Mr. Stavropoulos is Chairman of Univar (global distributor of commodity and specialty chemicals, 2010-present), a Director of Teradata Corporation (data warehousing and technology solutions, 2008-present), Chemical Financial Corporation, Maersk Inc. (industrial conglomerate), Tyco International, Inc. (multinational manufacturing and services, 2007-present), and a member of the Advisory Board for Metalmark Capital (private equity investment, 2005-present). Mr. Stavropoulos is a special advisor to Clayton, Dubilier & Rice, LLC (private equity investment). In addition, Mr. Stavropoulos is a member of the University of Notre Dame Advisory Council for the College of Science. |
David M. Thomas (61) |
| Year of Election or Appointment: 2008 Previously, Mr. Thomas served as Executive Chairman (2005-2006) and Chairman and Chief Executive Officer (2000-2005) of IMS Health, Inc. (pharmaceutical and healthcare information solutions). In addition, Mr. Thomas serves as a member of the Board of Directors of Fortune Brands, Inc. (consumer products), and Interpublic Group of Companies, Inc. (marketing communication, 2004-present). |
Michael E. Wiley (60) |
| Year of Election or Appointment: 2008 Mr. Wiley also serves as a Director of Asia Pacific Exploration Consolidated (international oil and gas exploration and production, 2008-present). Mr. Wiley serves as a Director of Tesoro Corporation (independent oil refiner and marketer, 2005-present), and a Director of Bill Barrett Corporation (exploration and production, 2005-present). In addition, Mr. Wiley also serves as a Director of Post Oak Bank (privately-held bank, 2004-present). Previously, Mr. Wiley served as a member of the Board of Trustees of the University of Tulsa (2000-2006; 2007-2010), as a Senior Energy Advisor of Katzenbach Partners, LLC (consulting, 2006-2007), as an Advisory Director of Riverstone Holdings (private investment), Chairman, President, and CEO of Baker Hughes, Inc. (oilfield services, 2000-2004), and as Director of Spinnaker Exploration Company (exploration and production, 2001-2005). |
+ The information above includes each Trustee's principal occupation during the last five years and other information relating to the experience, attributes, and skills relevant to each Trustee's qualifications to serve as a Trustee, which led to the conclusion that each Trustee should serve as a Trustee for the fund.
Advisory Board Members and Executive Officers:
Correspondence intended for each executive officer, Edward C. Johnson 3d, and Peter S. Lynch may be sent to Fidelity Investments, 82 Devonshire Street, Boston, Massachusetts 02109.
Name, Age; Principal Occupation |
Edward C. Johnson 3d (80) |
| Year of Election or Appointment: 2011 Member of the Advisory Board of Fidelity's Equity and High Income Funds. Formerly Trustee and Chairman of the Board of Trustees of certain Trusts, Mr. Johnson serves as Chief Executive Officer, Chairman, and a Director of FMR LLC; Chairman and a Director of FMR; and Chairman and a Director of FMR Co., Inc. In addition, Mr. Johnson serves as Chairman and Director of FIL Limited. Previously, Mr. Johnson served as President of FMR LLC (2006-2007). |
Peter S. Lynch (66) |
| Year of Election or Appointment: 2003 Member of the Advisory Board of Fidelity's Equity and High Income Funds. Mr. Lynch is Vice Chairman and a Director of FMR and FMR Co., Inc. In addition, Mr. Lynch serves as a Trustee of Boston College and as the Chairman of the Inner-City Scholarship Fund. Previously, Mr. Lynch served on the Special Olympics International Board of Directors (1997-2006). |
Kenneth B. Robins (41) |
| Year of Election or Appointment: 2008 President and Treasurer of Fidelity's Equity and High Income Funds. Mr. Robins also serves as President and Treasurer (2010-
present) and Assistant Treasurer (2009-present) of other Fidelity funds and is an employee of Fidelity Investments (2004-present). Previously, Mr. Robins served as Deputy Treasurer of the Fidelity funds (2005-2008) and Treasurer and Chief Financial Officer of The North Carolina Capital Management Trust: Cash and Term Portfolios (2006-2008). |
Bruce T. Herring (45) |
| Year of Election or Appointment: 2006 Vice President of certain Equity Funds. Mr. Herring also serves as Chief Investment Officer and Director of Fidelity Management & Research (U.K.) Inc. (2010-present) and Group Chief Investments Officer of FMR. Previously, Mr. Herring served as Vice President (2005-2006) and Senior Vice President (2006-2007) of Fidelity Management & Research Company, Vice President of FMR Co., Inc. (2001-2007) and as a portfolio manager for Fidelity U.S. Equity Funds. |
Brian B. Hogan (46) |
| Year of Election or Appointment: 2009 Vice President of certain Equity Funds and Vice President of Sector Funds. Mr. Hogan also serves as President of FMR's Equity Division (2009-present). Previously, Mr. Hogan served as Senior Vice President, Equity Research of FMR (2006-2009) and as a portfolio manager. |
Scott C. Goebel (42) |
| Year of Election or Appointment: 2008 Secretary and Chief Legal Officer (CLO) of the Fidelity funds. Mr. Goebel also serves as Secretary and CLO of The North Carolina Capital Management Trust: Cash and Term Portfolio (2008-present); General Counsel, Secretary, and Senior Vice President of FMR (2008-present) and FMR Co., Inc. (2008-present); Deputy General Counsel of FMR LLC; Chief Legal Officer of Fidelity Management & Research (Hong Kong) Limited (2008-present) and Assistant Secretary of Fidelity Management & Research (Japan) Inc. (2008-present), Fidelity Investments Money Management, Inc. (2008-present), Fidelity Management & Research (U.K.) Inc. (2008-present), and Fidelity Research and Analysis Company (2008-present). Previously, Mr. Goebel served as Assistant Secretary of the Funds (2007-2008) and as Vice President and Secretary of Fidelity Distributors Corporation (FDC) (2005-2007). |
William C. Coffey (41) |
| Year of Election or Appointment: 2009 Assistant Secretary of Fidelity's Equity and High Income Funds. Mr. Coffey also serves as Senior Vice President and Deputy General Counsel of FMR LLC (2010-present), and is an employee of Fidelity Investments. Previously, Mr. Coffey served as Vice President and Associate General Counsel of FMR LLC (2005-2009). |
Holly C. Laurent (56) |
| Year of Election or Appointment: 2008 Anti-Money Laundering (AML) Officer of the Fidelity funds. Ms. Laurent also serves as AML Officer of The North Carolina Capital Management Trust: Cash and Term Portfolio (2008-present) and is an employee of Fidelity Investments. Previously, Ms. Laurent was Senior Vice President and Head of Legal for Fidelity Business Services India Pvt. Ltd. (2006-2008), and Senior Vice President, Deputy General Counsel and Group Head for FMR LLC (2005-2006). |
Christine Reynolds (52) |
| Year of Election or Appointment: 2008 Chief Financial Officer of the Fidelity funds. Ms. Reynolds became President of Fidelity Pricing and Cash Management Services (FPCMS) in August 2008. Ms. Reynolds served as Chief Operating Officer of FPCMS (2007-2008). Previously, Ms. Reynolds served as President, Treasurer, and Anti-Money Laundering officer of the Fidelity funds (2004-2007). |
Kenneth A. Rathgeber (63) |
| Year of Election or Appointment: 2004 Chief Compliance Officer of Fidelity's Equity and High Income Funds. Mr. Rathgeber is Chief Compliance Officer of Fidelity Management & Research (Hong Kong) Limited (2008-present), Fidelity Management & Research (Japan) Inc. (2008-present), FMR (2005-present), FMR Co., Inc. (2005-present), Fidelity Management & Research (U.K.) Inc. (2005-present), Fidelity Research & Analysis Company (2005-present), Fidelity Investments Money Management, Inc. (2005-present), Pyramis Global Advisors, LLC (2005-present), and Strategic Advisers, Inc. (2005-present). |
Jeffrey S. Christian (49) |
| Year of Election or Appointment: 2009 Deputy Treasurer of the Fidelity funds. Mr. Christian is an employee of Fidelity Investments. Previously, Mr. Christian served as Chief Financial Officer (2008-2009) of certain Fidelity funds and Senior Vice President of Fidelity Pricing and Cash Management Services (FPCMS) (2004-2009). |
Bryan A. Mehrmann (49) |
| Year of Election or Appointment: 2005 Deputy Treasurer of the Fidelity funds. Mr. Mehrmann is an employee of Fidelity Investments. |
Adrien E. Deberghes (43) |
| Year of Election or Appointment: 2008 Deputy Treasurer of Fidelity's Equity and High Income Funds. Mr. Deberghes also serves as Assistant Treasurer of other Fidelity funds (2010-present) and is an employee of Fidelity Investments (2008-present). Previously, Mr. Deberghes served as Senior Vice President of Mutual Fund Administration at State Street Corporation (2007-2008), Senior Director of Mutual Fund Administration at Investors Bank & Trust (2005-2007), and Director of Finance for Dunkin' Brands (2000-2005). |
Stephanie J. Dorsey (41) |
| Year of Election or Appointment: 2010 Assistant Treasurer of Fidelity's Equity and High Income Funds. Ms. Dorsey also serves as Deputy Treasurer of other Fidelity funds (2008-present) and is an employee of Fidelity Investments (2008-present). Previously, Ms. Dorsey served as Treasurer (2004-2008) of the JPMorgan Mutual Funds and Vice President (2004-2008) of JPMorgan Chase Bank. |
Name, Age; Principal Occupation |
John R. Hebble (52) |
| Year of Election or Appointment: 2009 Assistant Treasurer of Fidelity's Equity and High Income Funds. Mr. Hebble also serves as Treasurer and Chief Financial Officer of The North Carolina Capital Management Trust: Cash and Term Portfolio (2008-present), President and Treasurer of other Fidelity funds (2008-present) and is an employee of Fidelity Investments. |
Gary W. Ryan (52) |
| Year of Election or Appointment: 2005 Assistant Treasurer of the Fidelity funds. Mr. Ryan is an employee of Fidelity Investments. Previously, Mr. Ryan served as Vice President of Fund Reporting in Fidelity Pricing and Cash Management Services (FPCMS) (1999-2005). |
Jonathan Davis (42) |
| Year of Election or Appointment: 2010 Assistant Treasurer of the Fidelity funds. Mr. Davis is an employee of Fidelity Investments. Previously, Mr. Davis served as Vice President and Associate General Counsel of FMR LLC (2003-2010). |
Annual Report
The Board of Trustees of VIP Growth Portfolio voted to pay to shareholders of record at the opening of business on record date, the following distributions per share derived from capital gains realized from sales of portfolio securities, and dividends derived from net investment income:
| Pay Date | Record Date | Dividends | Capital Gains |
Initial Class | 02/04/11 | 02/04/11 | - | $0.075 |
Service Class | 02/04/11 | 02/04/11 | - | $0.075 |
Service Class 2 | 02/04/11 | 02/04/11 | - | $0.075 |
Investor Class | 02/04/11 | 02/04/11 | - | $0.075 |
Initial Class designates 100%; Service Class designates 100%; Service Class 2 designates 100%; and Investor Class designates 100% of the dividends distributed during the fiscal year as qualifying for the dividends-received deduction for corporate shareholders.
The fund will notify shareholders in January 2011 of amounts for use in preparing 2010 income tax returns.
Annual Report
Board Approval of Investment Advisory Contracts and Management Fees
VIP Growth Portfolio
Each year, the Board of Trustees, including the Independent Trustees (together, the Board), votes on the renewal of the management contract and sub-advisory agreements (together, the Advisory Contracts) for the fund. The Board, assisted by the advice of fund counsel and Independent Trustees' counsel, requests and considers a broad range of information relevant to the renewal of the Advisory Contracts throughout the year.
The Board meets regularly and considers at each of its meetings factors that are relevant to its annual consideration of the renewal of the fund's Advisory Contracts, including the services and support provided to the fund and its shareholders. The Board has established various standing committees, each composed of Independent Trustees with varying backgrounds, to which the Board has assigned specific subject matter responsibilities in order to enhance effective decision-making by the Board. The Board, acting directly and through its Committees, requests and receives information concerning the annual consideration of the renewal of the fund's Advisory Contracts. The Board also meets as needed to consider matters specifically related to the Board's annual consideration of the renewal of Advisory Contracts. Members of the Board may also meet with trustees of other Fidelity funds through ad hoc joint committees to discuss certain matters relevant to the Fidelity funds.
At its July 2010 meeting, the Board of Trustees, including the Independent Trustees, unanimously determined to renew the fund's Advisory Contracts. In reaching its determination, the Board considered all factors it believed relevant, including (i) the nature, extent, and quality of the services to be provided to the fund and its shareholders (including the investment performance of the fund); (ii) the competitiveness of the fund's management fee and total expenses; (iii) the total costs of the services to be provided by and the profits to be realized by Fidelity from its relationship with the fund; (iv) the extent to which economies of scale would be realized as the fund grows; and (v) whether fee levels reflect these economies of scale, if any, for the benefit of fund shareholders.
In considering whether to renew the Advisory Contracts for the fund, the Board reached a determination, with the assistance of fund counsel and Independent Trustees' counsel and through the exercise of its business judgment, that the renewal of the Advisory Contracts is in the best interests of fund shareholders and that the compensation to be received by Fidelity under the management contract is fair and reasonable. The Board's decision to renew the Advisory Contracts was not based on any single factor noted above, but rather was based on a comprehensive consideration of all the information provided to the Board at its meetings throughout the year. The Board, in reaching its determination to renew the Advisory Contracts, is aware that shareholders in the fund have a broad range of investment choices available to them, including a wide choice among mutual funds offered by Fidelity's competitors, and that the fund's shareholders, with the opportunity to review and weigh the disclosure provided by the fund in its prospectus and other public disclosures, have chosen to invest in this fund, managed by Fidelity.
Nature, Extent, and Quality of Services Provided. The Board considered the staffing within the investment adviser, FMR, and the sub-advisers (together, the Investment Advisers), including the backgrounds of the fund's investment personnel and the fund's investment objective and discipline. The Independent Trustees also had discussions with senior management of Fidelity's investment operations and investment groups. The Board considered the structure of the portfolio manager compensation program and whether this structure provides appropriate incentives to act in the best interest of the fund.
Resources Dedicated to Investment Management and Support Services. The Board and the equity research subcommittee of the Board's Fund Oversight Committee reviewed the size, education, and experience of the Investment Advisers' investment staff, their use of technology, and the Investment Advisers' approach to recruiting, training, and retaining portfolio managers and other research, advisory, and management personnel. The Board noted that Fidelity's analysts have access to a variety of technological tools and market and securities data that enable them to perform both fundamental and quantitative analysis and to specialize in various disciplines. The Board considered Fidelity's extensive global research capabilities that enable the Investment Advisers to aggregate data from various sources in an effort to produce positive investment results. The Board also considered that Fidelity's portfolio managers and analysts have access to daily portfolio attribution that allows for monitoring of a fund's portfolio, as well as an electronic communication system that provides immediate real-time access to research concerning issuers and credit enhancers. The Board noted FMR's continued focus on strengthening the organization and discipline of equity portfolio management and research.
Shareholder and Administrative Services. The Board considered (i) the nature, extent, quality, and cost of advisory, administrative, and shareholder services performed by the Investment Advisers and their affiliates under the Advisory Contracts and under separate agreements covering transfer agency, pricing and bookkeeping, and securities lending services for the fund; (ii) the nature and extent of the investment adviser's supervision of third party service providers, principally custodians and subcustodians; and (iii) the resources devoted to, and the record of compliance with, the fund's compliance policies and procedures. The Board also reviewed the allocation of fund brokerage, including allocations to brokers affiliated with the Investment Advisers, the use of brokerage commissions to pay fund expenses, and the use of "soft" commission dollars to pay for research services.
The Board noted that the growth of fund assets over time across the complex allows Fidelity to reinvest in the development of services designed to enhance the value or convenience of the Fidelity funds as investment vehicles. These services include 24-hour access to account information and market information through phone representatives and over the Internet, and investor education materials and asset allocation tools.
Investment in a Large Fund Family. The Board considered the benefits to shareholders of investing in a Fidelity fund, including the benefits of investing in a fund that is part of a large family of funds offering a variety of investment disciplines and providing a large variety of mutual fund investor services. The Board noted that Fidelity had taken, or had made recommendations that resulted in the Fidelity funds taking, a number of actions over the previous year that benefited particular funds, including (i) dedicating additional resources to investment research and restructuring and broadening the focus of the investment research teams; (ii) bolstering the senior management team that oversees asset management; (iii) launching Class F of certain funds as a lower-fee class available to Freedom K and Freedom Index Funds; (iv) lowering the initial investment minimums and ongoing balance requirements for Real Estate High Income Fund; (v) eliminating subsequent purchase minimums for all funds and adding a waiver of the investment minimum requirement for new accounts opened with the proceeds of a systematic withdrawal plan; (vi) eliminating the withdrawal minimum and maximum limits for systematic withdrawals from Advisor funds; (vii) expanding sales load waivers on Class A shares for Destiny Planholders and expanding Institutional Class eligibility for Class O Destiny Planholders; and (viii) changing certain Class A and Class T sales charge structures to further align them with industry practices.
Annual Report
Investment Performance. The Board considered whether the fund has operated in accordance with its investment objective, as well as its record of compliance with its investment restrictions. It also reviewed the fund's absolute investment performance for each class, as well as the fund's relative investment performance for each class measured over multiple periods against (i) a broad-based securities market index, and (ii) a custom peer group of mutual funds deemed appropriate by Fidelity and reviewed by the Board. The following charts considered by the Board show, over the one-, three-, and five-year periods ended December 31, 2009, the cumulative total returns of Initial Class and Service Class 2 of the fund, the cumulative total returns of a broad-based securities market index ("benchmark"), and a range of cumulative total returns of a custom peer group of mutual funds defined by FMR based on categories assigned by Morningstar, Inc. The returns of Initial Class and Service Class 2 show the performance of the highest and lowest performing classes, respectively (based on five-year performance). The box within each chart shows the 25th percentile return (bottom of box) and the 75th percentile return (top of box) of the peer group. Returns shown above the box are in the first quartile and returns shown below the box are in the fourth quartile. The percentage beaten numbers noted below each chart correspond to the percentile box and represent the percentage of funds in the peer group whose performance was equal to or lower than that of the class indicated. The fund's custom peer group, defined by FMR, is a peer group that FMR believes provides a more meaningful performance comparison than the peer group assigned by Morningstar, Inc., which assigns mutual funds to categories based on their investment styles as measured by their underlying portfolio holdings.
VIP Growth Portfolio
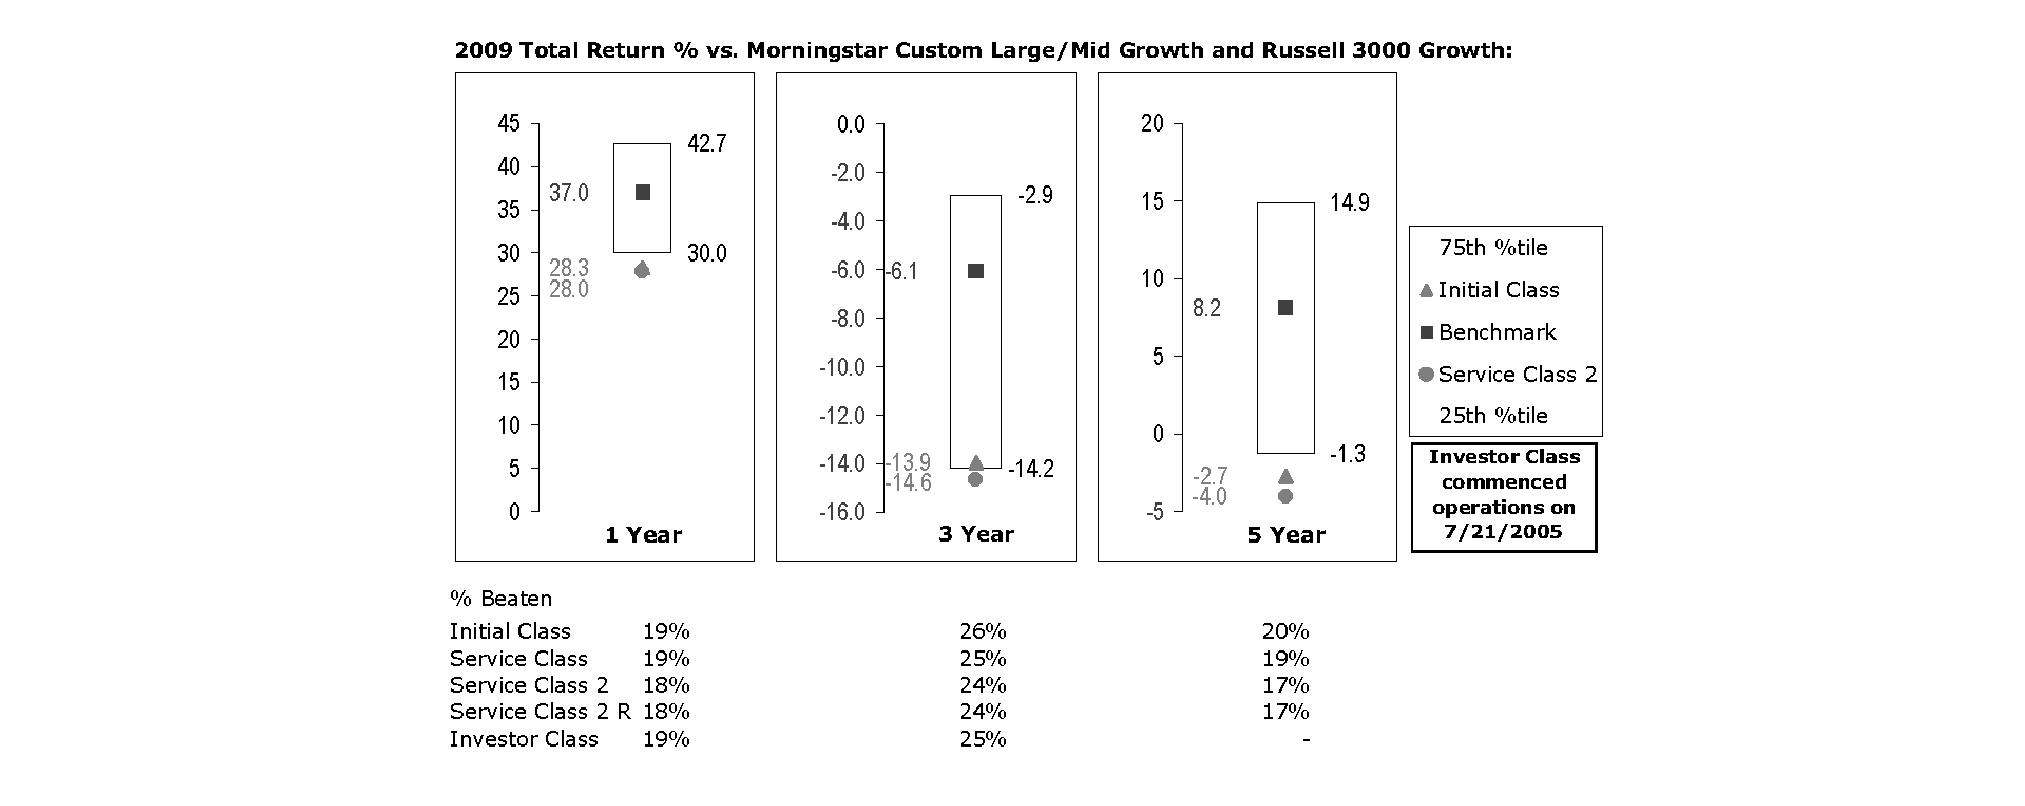
The Board reviewed the fund's relative investment performance against its peer group and noted that the performance of Initial Class of the fund was in the fourth quartile for the one- and five-year periods and the third quartile for the three-year period. The Board also noted that the investment performance of the fund was lower than its benchmark for all the periods shown. The Board considered that the variations in performance among the fund's classes reflect the variations in class expenses, which result in lower performance for higher expense classes. The Board discussed with FMR actions that have been taken by FMR to improve the fund's disappointing performance relative to its peer group and benchmark. The Board noted that this fund had underperformed in the previous year and discussed with FMR its disappointment with the continued underperformance of the fund. The Board also reviewed the fund's performance since inception as well as performance in the current year. The Board will continue to closely monitor the performance of the fund in the coming year and discuss with FMR other appropriate actions to address the performance of the fund.
Based on its review, and giving particular weight to the nature and quality of the resources dedicated by the Investment Advisers to maintain and improve relative performance and factoring in the unprecedented market events in recent years, the Board concluded that the nature, extent, and quality of investment management and support services and of shareholder and administrative services provided to the fund will benefit the fund's shareholders, particularly in light of the Board's view that the fund's shareholders benefit from investing in a fund that is part of a large family of funds offering a variety of investment disciplines and services.
Annual Report
Board Approval of Investment Advisory Contracts and Management Fees - continued
Competitiveness of Management Fee and Total Fund Expenses. The Board considered the fund's management fee and total expenses compared to "mapped groups" of competitive funds and classes. Fidelity creates "mapped groups" by combining similar Lipper investment objective categories that have comparable management fee characteristics. Combining Lipper investment objective categories aids the Board's management fee and total expense comparisons by broadening the competitive group used for comparison and by reducing the number of universes to which various Fidelity funds are compared.
Management Fee. The Board considered two proprietary management fee comparisons for the 12-month periods shown in the chart below. The group of Lipper funds used by the Board for management fee comparisons is referred to below as the "Total Mapped Group." The Total Mapped Group comparison focuses on a fund's standing relative to the total universe of comparable funds available to investors, in terms of gross management fees before expense reimbursements or caps. "TMG %" represents the percentage of funds in the Total Mapped Group that had management fees that were lower than the fund's. For example, a TMG % of 10% means that 90% of the funds in the Total Mapped Group had higher management fees than the fund. The "Asset-Size Peer Group" (ASPG) comparison focuses on a fund's standing relative to non-Fidelity funds similar in size to the fund within the Total Mapped Group. The ASPG represents at least 15% of the funds in the Total Mapped Group with comparable asset size and management fee characteristics, subject to a minimum of 50 funds (or all funds in the Total Mapped Group if fewer than 50). Additional information, such as the ASPG quartile in which the fund's management fee ranked, is also included in the chart and considered by the Board.
VIP Growth Portfolio
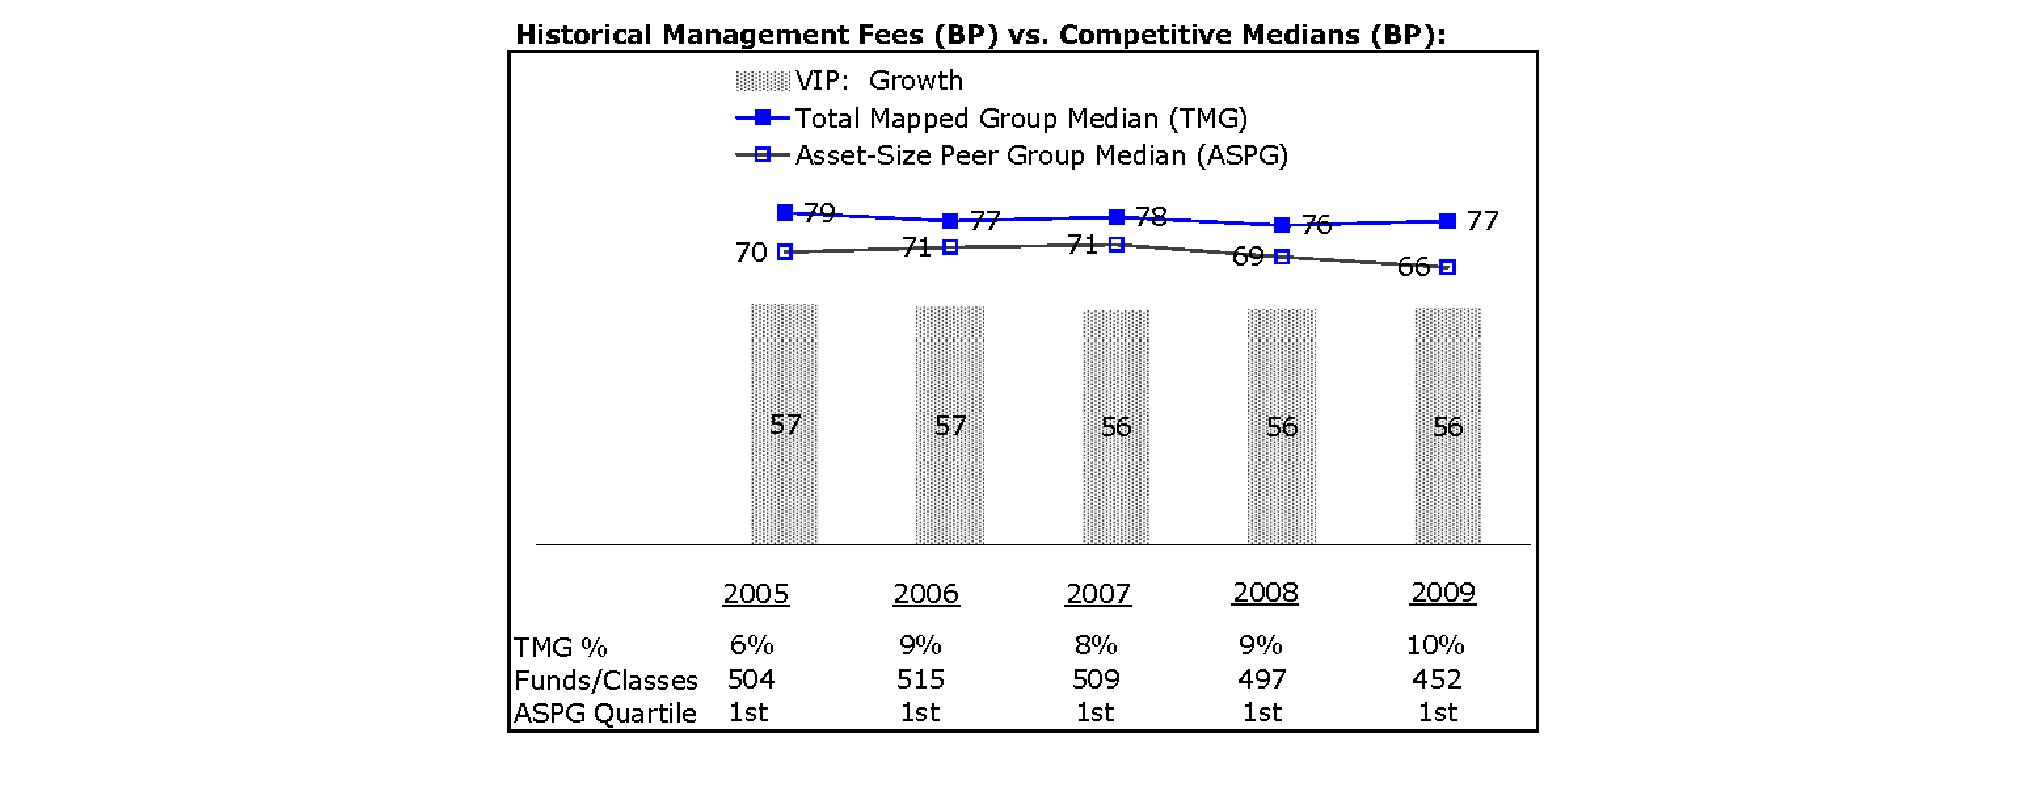
The Board noted that the fund's management fee ranked below the median of its Total Mapped Group and below the median of its ASPG for 2009.
Based on its review, the Board concluded that the fund's management fee is fair and reasonable in light of the services that the fund receives and the other factors considered.
Total Expenses. In its review of each class's total expenses, the Board considered the fund's management fee as well as other fund or class expenses, as applicable, such as transfer agent fees, pricing and bookkeeping fees, fund-paid 12b-1 fees, and custodial, legal, and audit fees. The Board also noted the effects of any waivers and reimbursements on fees and expenses. As part of its review, the Board also considered current and historical total expenses of each class of the fund compared to competitive fund median expenses. Each class of the fund is compared to those funds and classes in the Total Mapped Group (used by the Board for management fee comparisons) that have a similar sales load structure.
The Board noted that the total expenses of each of Initial Class, Investor Class, and Service Class ranked below its competitive median for 2009 and the total expenses of each of Service Class 2 and Service Class 2 R ranked above its competitive median for 2009. The Board noted that the fund offers multiple classes, each of which has a different 12b-1 fee structure, and that the multiple structures are intended to offer a range of pricing options for the intermediary market. The Board also noted that the total expenses of the classes vary primarily by the level of their 12b-1 fees, although differences in transfer agent fees may also cause expenses to vary from class to class.
Fees Charged to Other Fidelity Clients. The Board also considered Fidelity fee structures and other information with respect to clients of FMR and its affiliates, such as other mutual funds advised or subadvised by FMR or its affiliates, pension plan clients, and other institutional clients. In March 2010, the Board created an ad hoc joint committee with the board of other Fidelity funds (the Committee) to review and compare Fidelity's institutional investment advisory business with its business of providing services to the Fidelity funds, including the differences in services provided, fees charged, and costs incurred, as well as competition in their respective marketplaces.
Annual Report
Based on its review of total expenses and fees charged to other Fidelity clients, the Board concluded that the total expenses of each class of the fund were reasonable, although in some cases above the median of the universe presented for comparison, in light of the services that the fund and its shareholders receive and the other factors considered, including the findings of the Committee.
Costs of the Services and Profitability. The Board considered the revenues earned and the expenses incurred by Fidelity in conducting the business of developing, marketing, distributing, managing, administering and servicing the fund and its shareholders. The Board also considered the level of Fidelity's profits in respect of all the Fidelity funds.
On an annual basis, FMR presents to the Board Fidelity's profitability for the fund. Fidelity calculates the profitability for each fund, as well as aggregate profitability for groups of Fidelity funds and all Fidelity funds, using a series of detailed revenue and cost allocation methodologies which originate with the audited books and records of Fidelity. The Audit Committee of the Board reviews any significant changes from the prior year's methodologies.
PricewaterhouseCoopers LLP (PwC), independent registered public accounting firm and auditor to Fidelity and certain Fidelity funds, has been engaged annually by the Board as part of the Board's assessment of Fidelity's profitability analysis. PwC's engagement includes the review and assessment of Fidelity's methodologies used in determining the revenues and expenses attributable to Fidelity's mutual fund business, and completion of agreed-upon procedures surrounding the mathematical accuracy of fund profitability and its conformity to allocation methodologies. After considering PwC's reports issued under the engagement and information provided by Fidelity, the Board believes that while other allocation methods may also be reasonable, Fidelity's profitability methodologies are reasonable in all material respects.
The Board has also reviewed Fidelity's non-fund businesses and fall-out benefits related to the mutual fund business as well as cases where Fidelity's affiliates may benefit from or be related to the fund's business.
The Board considered the costs of the services provided by and the profits realized by Fidelity in connection with the operation of the fund and were satisfied that the profitability was not excessive in the circumstances.
Economies of Scale. The Board considered whether there have been economies of scale in respect of the management of the Fidelity funds, whether the Fidelity funds (including the fund) have appropriately benefited from any such economies of scale, and whether there is potential for realization of any further economies of scale. The Board considered the extent to which the fund will benefit from economies of scale through increased services to the fund, through waivers or reimbursements, or through fee or expense reductions.
In February 2009, the Board and the board of other Fidelity funds created an ad hoc committee (the Economies of Scale Committee) to analyze whether FMR attains economies of scale in respect of the management and servicing of the Fidelity funds, whether the Fidelity funds have appropriately benefited from such economies of scale, and whether there is potential for realization of any further economies of scale.
The Board recognized that the fund's management contract incorporates a "group fee" structure, which provides for lower group fee rates as total fund assets under FMR's management increase, and for higher group fee rates as total fund assets under FMR's management decrease. FMR calculates the group fee rates based on a tiered asset "breakpoint" schedule that varies based on asset class. The Board considered that the group fee is designed to deliver the benefits of economies of scale to fund shareholders when total Fidelity fund assets increase, even if assets of any particular fund are unchanged or have declined, because some portion of Fidelity's costs are attributable to services provided to all Fidelity funds, and all funds benefit if those costs can be allocated among more assets. The Board concluded that, given the group fee structure, fund shareholders will benefit from lower management fees as assets under FMR's management increase at the fund complex level, regardless of whether Fidelity achieves any such economies of scale.
The Board concluded, considering the findings of the Economies of Scale Committee, that any potential economies of scale are being appropriately shared between fund shareholders and Fidelity.
Additional Information Requested by the Board. In order to develop fully the factual basis for consideration of the Fidelity funds' Advisory Contracts, the Board requested and received additional information on certain topics, including (i) fund performance trends, actions to be taken by FMR to improve certain funds' overall performance, and Fidelity's long-term strategies for certain funds; (ii) portfolio manager changes that have occurred during the past year and length of portfolio manager tenure for different categories of funds over time; (iii) Fidelity's compensation structure for portfolio managers, research analysts, and other key personnel, the rationale for the compensation structure, and how the compensation structure provides appropriate performance incentives; (iv) the amount of the investment that each portfolio manager has made in the Fidelity fund(s) that he or she manages; (v) management and other fees paid by FMR to affiliated sub-advisers on behalf of the Fidelity funds; (vi) Fidelity's fee structures and rationale for recommending different fees among different categories of funds; (vii) Fidelity's rationale for recommending which funds should have a performance adjustment component as part of their management fees; (viii) the rationale for any differences between fund fee structures and fee structures in place for other Fidelity clients; and (ix) explanations regarding the relative total expenses borne by certain funds and classes, total expense competitive trends, and actions that might be taken by FMR to reduce total expenses for certain funds and classes.
Annual Report
Board Approval of Investment Advisory Contracts and Management Fees - continued
Based on its evaluation of all of the conclusions noted above, and after considering all factors it believed relevant, the Board ultimately concluded that the advisory fee structures are fair and reasonable, and that the fund's Advisory Contracts should be renewed.
Annual Report
Investment Adviser
Fidelity Management & Research Company
Boston, MA
Investment Sub-Adviser
FMR Co., Inc.
Fidelity Management & Research (U.K.) Inc.
Fidelity Management & Research (Hong Kong) Limited
Fidelity Management & Research (Japan) Inc.
General Distributor
Fidelity Distributors Corporation
Boston, MA
Transfer and Service Agents
Fidelity Investments Institutional Operations Company, Inc.
Boston, MA
Fidelity Service Company, Inc.
Boston, MA
Custodian
The Bank of New York Mellon
New York, NY
VIPGRWT-ANN-0211
1.540077.113
Fidelity® Variable Insurance Products:
Growth Portfolio - Service Class 2R
Annual Report
December 31, 2010
(2_fidelity_logos) (Registered_Trademark)
Contents
Performance | <Click Here> | How the fund has done over time. |
Management's Discussion of Fund Performance | <Click Here> | The Portfolio Manager's review of fund performance and strategy. |
Shareholder Expense Example | <Click Here> | An example of shareholder expenses. |
Investment Changes | <Click Here> | A summary of major shifts in the fund's investments over the past six months. |
Investments | <Click Here> | A complete list of the fund's investments with their market values. |
Financial Statements | <Click Here> | Statements of assets and liabilities, operations, and changes in net assets, as well as financial highlights. |
Notes | <Click Here> | Notes to the financial statements. |
Report of Independent Registered Public Accounting Firm | <Click Here> | |
Trustees and Officers | <Click Here> | |
Distributions | <Click Here> | |
Board Approval of Investment Advisory Contracts and Management Fees | <Click Here> | |
To view a fund's proxy voting guidelines and proxy voting record for the 12-month period ended June 30, visit http://www.fidelity.com/proxyvotingresults or visit the Securities and Exchange Commission's (SEC) web site at http://www.sec.gov. You may also call 1-877-208-0098 to request a free copy of the proxy voting guidelines.
Fidelity Variable Insurance Products are separate account options which are purchased through a variable insurance contract.
Standard & Poor's, S&P and S&P 500 are registered service marks of The McGraw-Hill Companies, Inc. and have been licensed for use by Fidelity Distributors Corporation.
Other third party marks appearing herein are the property of their respective owners.
All other marks appearing herein are registered or unregistered trademarks or service marks of FMR LLC or an affiliated company.
The general research services agreement with Fidelity Research & Analysis Company has been terminated and is no longer in effect for the fund.
This report and the financial statements contained herein are submitted for the general information of the shareholders of the fund. This report is not authorized for distribution to prospective investors in the fund unless preceded or accompanied by an effective prospectus.
A fund files its complete schedule of portfolio holdings with the SEC for the first and third quarters of each fiscal year on Form N-Q. Forms N-Q are available on the SEC's web site at http://www.sec.gov. A fund's Forms N-Q may be reviewed and copied at the SEC's Public Reference Room in Washington, DC. Information regarding the operation of the SEC's Public Reference Room may be obtained by calling 1-800-SEC-0330. For a complete list of a fund's portfolio holdings, view the most recent holdings listing, semiannual report, or annual report on Fidelity's web site at http://www.fidelity.com, http://www.advisor.fidelity.com, or http://www.401k.com, as applicable.
NOT FDIC INSURED • MAY LOSE VALUE • NO BANK GUARANTEE
Neither the fund nor Fidelity Distributors Corporation is a bank.
Annual Report
Average annual total return reflects the change in the value of an investment, assuming reinvestment of the class' distributions from dividend income and capital gains (the profits earned upon the sale of securities that have grown in value, if any) and assuming a constant rate of performance each year. During periods of reimbursement by Fidelity, a fund's total return will be greater than it would be had the reimbursement not occurred. Performance numbers are net of all underlying fund operating expenses, but do not include any insurance charges imposed by your insurance company's separate account. If performance information included the effect of these additional charges, the total returns would be lower. How a fund did yesterday is no guarantee of how it will do tomorrow.
Average Annual Total Returns
Periods ended December 31, 2010 | Past 1
year | Past 5
years | Past 10
years |
VIP Growth Portfolio - Service Class 2R A | 23.86% | 2.43% | -0.72% |
A The initial offering of Service Class 2R shares took place on April 24, 2002. Returns prior to April 24, 2002 are those of Service Class 2.
$10,000 Over 10 Years
Let's say hypothetically that $10,000 was invested in VIP Growth Portfolio - Service Class 2R on December 31, 2000. The chart shows how the value of your investment would have changed, and also shows how the Russell 3000® Growth Index performed over the same period. The initial offering of Service Class 2R took place on April 24, 2002. See above for additional information regarding the performance of Service Class 2R.
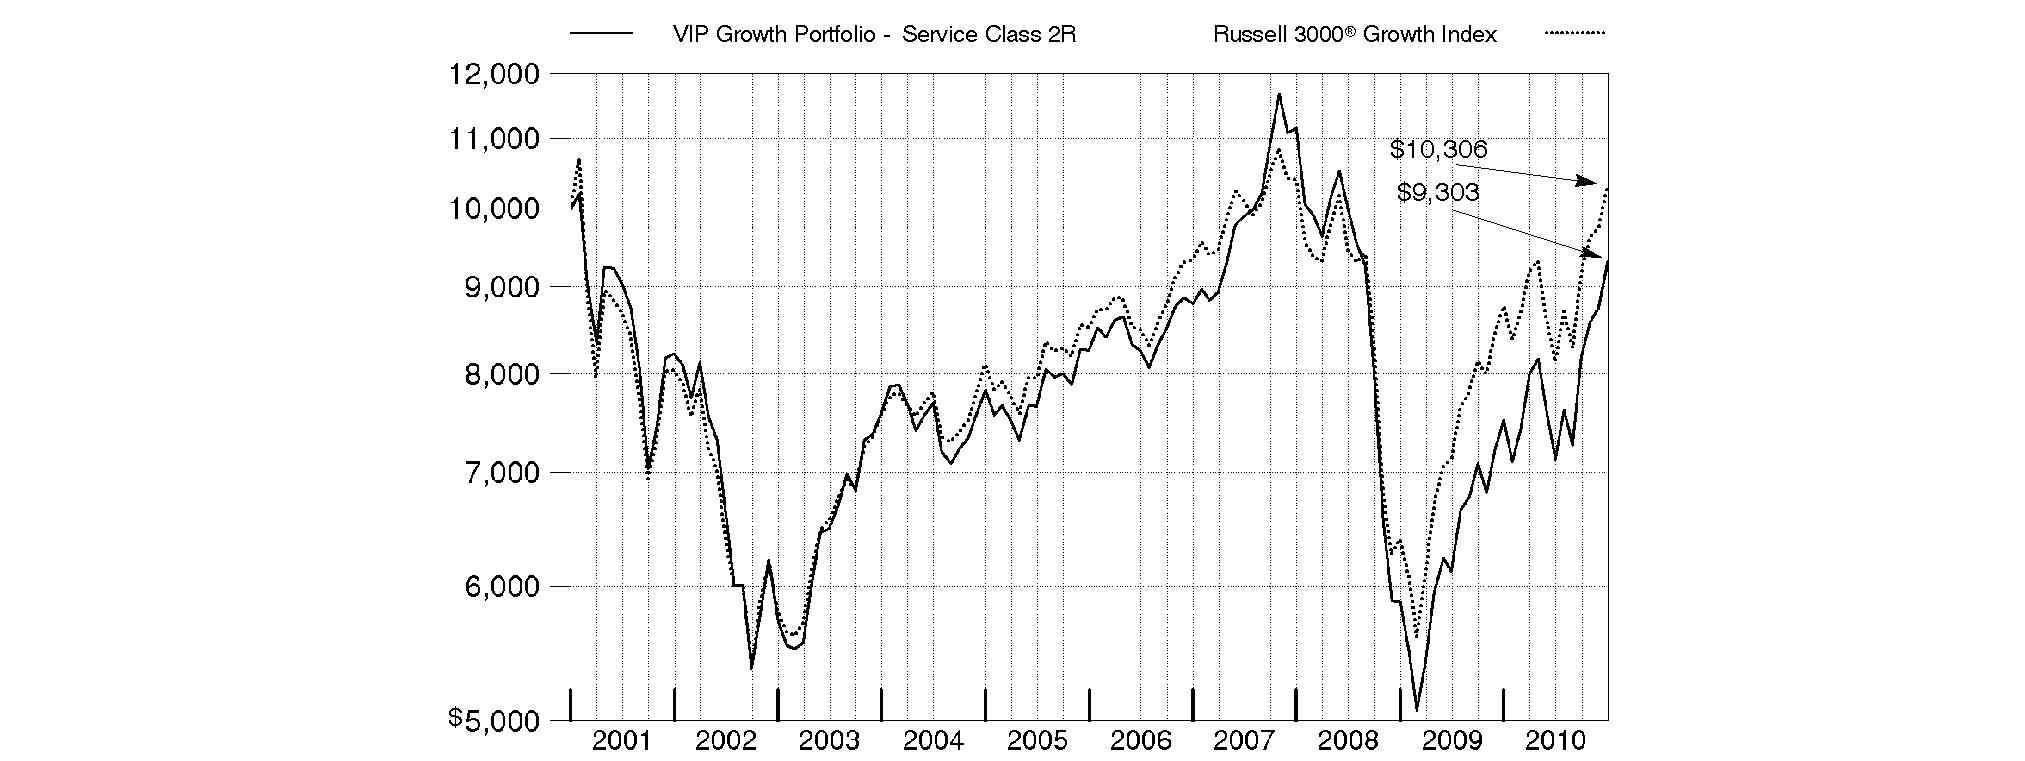
Annual Report
Market Recap: While market improvements around the world hit a speed bump in the first half of the 12-month period ending December 31, 2010, world economies re-accelerated in August, supported by a broadening recovery and low inflation in the U.S. Domestic stock markets recorded solid gains for the year, lifted by a strong second-half rally fueled by economic optimism, encouraging earnings reports and a wave of corporate mergers. The large-cap S&P 500® Index rose 15.06%, the blue-chip-laden Dow Jones Industrial AverageSM added 14.06% and the technology-heavy Nasdaq Composite® Index climbed 18.02%. Meanwhile, international stocks, as represented by the MSCI® ACWI® (All Country World Index) ex USA Index, gained 11.29%, boosted in part by a depreciating U.S. dollar. In the fixed-income arena, U.S. taxable investment-grade bonds generated positive results during 2010, as the Barclays Capital® U.S. Aggregate Bond Index gained 6.54%. With ultra-low interest rates bolstering nearly all fixed-income securities for most of the year, sectors in the index with higher yields and more credit risk generally fared best, while most high-quality bonds generated more-moderate returns. Meanwhile, high-yield bonds, as represented by The BofA Merrill LynchSM US High Yield Constrained Index, returned 15.07%, a result of improved economic data and strengthening investor demand. Overseas, foreign bond markets showed mixed results, with a sizable disparity between the 3.97% return of the Citigroup® Non-U.S. Group of 7 Index - which measures the performance of sovereign debt of the major global economies outside the U.S. - and the 12.04% advance of the JPMorgan Emerging Markets Bond Index Global (EMBI Global), which benefited from the rising overall credit quality of emerging-markets debt issuers.
Comments from Jason Weiner, Portfolio Manager of VIP Growth Portfolio: For the 12 months ending December 31, 2010, the fund's share classes solidly outperformed the 17.64% gain of the Russell 3000® Growth Index. (For specific portfolio results, please refer to the performance section of this report.) The portfolio benefited from strong positioning in information technology, including an out-of-index stake in Chinese Internet search firm Baidu, which benefited from its leading position for paid-search advertising in China, and a significant overweighting in Riverbed Technology, a niche networking products manufacturer that is the dominant player in providing innovative networking solutions for cloud and wide area networking. Having no exposure to two index components - Microsoft and Hewlett-Packard - paid off when both stocks lagged during the period. Good stock selection in health care helped, particularly within the pharmaceuticals/biotechnology/life science area, including an out-of-index position in Denmark's Novo Nordisk, which got a boost from positive clinical trials for a new diabetes treatment. Stock picking in industrials and energy - sectors where I increased the fund's investments - also contributed. On the other hand, positioning within financials - which decreased as a percentage of fund assets - detracted. There also were some disappointments in tech - another area where we shed exposure - despite the sector's overall contribution. Positions in Internet networking products manufacturer Cisco Systems, semiconductor maker Monolithic Power Systems and Internet search giant Google underperformed during the period. Cisco was hurt by softer-than-expected demand from its public sector clients, while Monolithic detracted when the firm misjudged demand for its products, resulting in crippling shortages. Google's stock fell when the cyclical rebound in advertising lagged expectations and as investors began to view paid search as a maturing business. Elsewhere, a significant overweighting in medical benefits manager Medco Health Solutions hurt. Some of these stocks were sold prior to period end.
The views expressed above reflect those of the portfolio manager(s) only through the end of the period as stated on the cover of this report and do not necessarily represent the views of Fidelity or any other person in the Fidelity organization. Any such views are subject to change at any time based upon market or other conditions and Fidelity disclaims any responsibility to update such views. These views may not be relied on as investment advice and, because investment decisions for a Fidelity fund are based on numerous factors, may not be relied on as an indication of trading intent on behalf of any Fidelity fund.
Annual Report
As a shareholder of the Fund, you incur two types of costs: (1) transaction costs, including redemption fees, and (2) ongoing costs, including management fees, distribution and/or service (12b-1) fees and other Fund expenses. This Example is intended to help you understand your ongoing costs (in dollars) of investing in the Fund and to compare these costs with the ongoing costs of investing in other mutual funds.
The Example is based on an investment of $1,000 invested at the beginning of the period and held for the entire period (July 1, 2010 to December 31, 2010).
Actual Expenses
The first line of the accompanying table for each class of the Fund provides information about actual account values and actual expenses. You may use the information in this line, together with the amount you invested, to estimate the expenses that you paid over the period. Simply divide your account value by $1,000.00 (for example, an $8,600 account value divided by $1,000.00 = 8.6), then multiply the result by the number in the first line for a class of the Fund under the heading entitled "Expenses Paid During Period" to estimate the expenses you paid on your account during this period. The estimate of expenses does not include any fees or other expenses of any variable annuity or variable life insurance product. If they were, the estimate of expenses you paid during the period would be higher, and your ending account value would be lower. In addition, the Fund, as a shareholder in the underlying Fidelity Central Funds, will indirectly bear its pro-rata share of the fees and expenses incurred by the underlying Fidelity Central Funds. These fees and expenses are not included in the Fund's annualized expense ratio used to calculate the expense estimate in the table below.
Hypothetical Example for Comparison Purposes
The second line of the accompanying table for each class of the Fund provides information about hypothetical account values and hypothetical expenses based on a Class' actual expense ratio and an assumed rate of return of 5% per year before expenses, which is not the Class' actual return. The hypothetical account values and expenses may not be used to estimate the actual ending account balance or expenses you paid for the period. You may use this information to compare the ongoing costs of investing in the Fund and other funds. To do so, compare this 5% hypothetical example with the 5% hypothetical examples that appear in the shareholder reports of the other funds. The estimate of expenses does not include any fees or other expenses of any variable annuity or variable life insurance product. If they were, the estimate of expenses you paid during the period would be higher, and your ending account value would be lower. In addition, the Fund, as a shareholder in the underlying Fidelity Central Funds, will indirectly bear its pro-rata share of the fees and expenses incurred by the underlying Fidelity Central Funds. These fees and expenses are not included in the Fund's annualized expense ratio used to calculate the expense estimate in the table below.
Please note that the expenses shown in the table are meant to highlight your ongoing costs only and do not reflect any transaction costs. Therefore, the second line of the table is useful in comparing ongoing costs only, and will not help you determine the relative total costs of owning different funds. In addition, if these transactional costs were included, your costs would have been higher.
| Annualized Expense Ratio | Beginning
Account Value
July 1, 2010 | Ending
Account Value
December 31, 2010 | Expenses Paid
During Period*
July 1, 2010 to December 31, 2010 |
Initial Class | .66% | | | |
Actual | | $ 1,000.00 | $ 1,306.70 | $ 3.84 |
HypotheticalA | | $ 1,000.00 | $ 1,021.88 | $ 3.36 |
Service Class | .76% | | | |
Actual | | $ 1,000.00 | $ 1,305.70 | $ 4.42 |
HypotheticalA | | $ 1,000.00 | $ 1,021.37 | $ 3.87 |
Service Class 2 | .91% | | | |
Actual | | $ 1,000.00 | $ 1,305.10 | $ 5.29 |
HypotheticalA | | $ 1,000.00 | $ 1,020.62 | $ 4.63 |
Service Class 2R | .91% | | | |
Actual | | $ 1,000.00 | $ 1,305.10 | $ 5.29 |
HypotheticalA | | $ 1,000.00 | $ 1,020.62 | $ 4.63 |
Investor Class | .74% | | | |
Actual | | $ 1,000.00 | $ 1,305.90 | $ 4.30 |
HypotheticalA | | $ 1,000.00 | $ 1,021.48 | $ 3.77 |
A 5% return per year before expenses
* Expenses are equal to each Class' annualized expense ratio, multiplied by the average account value over the period, multiplied by 184/365 (to reflect the one-half year period).
Annual Report
Investment Changes (Unaudited)
Top Ten Stocks as of December 31, 2010 |
| % of fund's
net assets | % of fund's net assets
6 months ago |
Apple, Inc. | 6.5 | 5.9 |
QUALCOMM, Inc. | 4.0 | 3.1 |
Exxon Mobil Corp. | 3.7 | 0.0 |
Google, Inc. Class A | 3.4 | 2.3 |
United Technologies Corp. | 2.7 | 2.6 |
Amazon.com, Inc. | 2.3 | 1.2 |
Cisco Systems, Inc. | 1.6 | 5.0 |
Express Scripts, Inc. | 1.5 | 1.6 |
WABCO Holdings, Inc. | 1.5 | 0.0 |
Novo Nordisk AS Series B | 1.5 | 1.3 |
| 28.7 | |
Top Five Market Sectors as of December 31, 2010 |
| % of fund's
net assets | % of fund's net assets
6 months ago |
Information Technology | 28.8 | 34.0 |
Industrials | 17.3 | 12.7 |
Consumer Discretionary | 15.6 | 15.3 |
Health Care | 12.5 | 15.7 |
Energy | 9.0 | 2.3 |
Asset Allocation (% of fund's net assets) |
As of December 31, 2010 * | As of June 30, 2010 ** |
| Stocks 97.7% | | | Stocks 97.8% | |
| Short-Term
Investments and
Net Other Assets 2.3% | | | Short-Term
Investments and
Net Other Assets 2.2% | |
* Foreign investments | 13.8% | | ** Foreign investments | 9.7% | |

Annual Report
Investments December 31, 2010
Showing Percentage of Net Assets
Common Stocks - 97.7% |
| Shares | | Value |
CONSUMER DISCRETIONARY - 15.6% |
Auto Components - 0.7% |
Gentex Corp. | 862,574 | | $ 25,497,687 |
Tenneco, Inc. (a) | 111,900 | | 4,605,804 |
| | 30,103,491 |
Automobiles - 1.3% |
Bayerische Motoren Werke AG (BMW) | 309,498 | | 24,352,061 |
Harley-Davidson, Inc. | 662,466 | | 22,967,696 |
Tesla Motors, Inc. (a)(d) | 136,500 | | 3,634,995 |
| | 50,954,752 |
Diversified Consumer Services - 0.3% |
Anhanguera Educacional Participacoes SA | 59,100 | | 1,424,483 |
Navitas Ltd. | 2,440,338 | | 9,624,112 |
| | 11,048,595 |
Hotels, Restaurants & Leisure - 3.8% |
China Lodging Group Ltd. ADR (d) | 172,175 | | 3,751,693 |
Chipotle Mexican Grill, Inc. (a) | 13,893 | | 2,954,485 |
Home Inns & Hotels Management, Inc. sponsored ADR (a) | 54,772 | | 2,243,461 |
Marriott International, Inc. Class A | 483,099 | | 20,067,932 |
McDonald's Corp. | 689,600 | | 52,933,696 |
Starbucks Corp. | 1,136,473 | | 36,514,877 |
Starwood Hotels & Resorts Worldwide, Inc. | 279,900 | | 17,012,322 |
The Cheesecake Factory, Inc. (a) | 558,625 | | 17,127,443 |
| | 152,605,909 |
Household Durables - 0.1% |
Mohawk Industries, Inc. (a) | 71,028 | | 4,031,549 |
Internet & Catalog Retail - 2.3% |
Amazon.com, Inc. (a) | 525,557 | | 94,600,260 |
Media - 0.5% |
Discovery Communications, Inc. Class C (a) | 444,191 | | 16,297,368 |
Interpublic Group of Companies, Inc. (a) | 261,608 | | 2,778,277 |
| | 19,075,645 |
Multiline Retail - 2.1% |
Dollarama, Inc. (a) | 718,740 | | 20,748,546 |
Dollarama, Inc. (a)(e) | 128,200 | | 3,700,870 |
Droga Raia SA | 122,000 | | 1,870,194 |
Target Corp. | 956,124 | | 57,491,736 |
| | 83,811,346 |
Specialty Retail - 2.3% |
Lowe's Companies, Inc. | 1,251,691 | | 31,392,410 |
Ross Stores, Inc. | 303,509 | | 19,196,944 |
TJX Companies, Inc. | 476,150 | | 21,136,299 |
Vitamin Shoppe, Inc. (a) | 602,892 | | 20,281,287 |
| | 92,006,940 |
Textiles, Apparel & Luxury Goods - 2.2% |
Coach, Inc. | 498,100 | | 27,549,911 |
|
| Shares | | Value |
lululemon athletica, Inc. (a) | 405,257 | | $ 27,727,684 |
LVMH Moet Hennessy - Louis Vuitton | 28,981 | | 4,769,829 |
Polo Ralph Lauren Corp. Class A | 250,600 | | 27,796,552 |
| | 87,843,976 |
TOTAL CONSUMER DISCRETIONARY | | 626,082,463 |
CONSUMER STAPLES - 4.3% |
Beverages - 0.7% |
The Coca-Cola Co. | 447,541 | | 29,434,772 |
Food & Staples Retailing - 1.7% |
Costco Wholesale Corp. | 69,600 | | 5,025,816 |
Walgreen Co. | 743,885 | | 28,981,760 |
Whole Foods Market, Inc. | 659,762 | | 33,377,360 |
| | 67,384,936 |
Food Products - 0.6% |
Diamond Foods, Inc. (d) | 211,314 | | 11,237,679 |
Mead Johnson Nutrition Co. Class A | 224,969 | | 14,004,320 |
| | 25,241,999 |
Household Products - 0.3% |
Procter & Gamble Co. | 191,045 | | 12,289,925 |
Personal Products - 1.0% |
Estee Lauder Companies, Inc. Class A | 149,676 | | 12,078,853 |
Herbalife Ltd. | 377,907 | | 25,837,502 |
| | 37,916,355 |
TOTAL CONSUMER STAPLES | | 172,267,987 |
ENERGY - 9.0% |
Energy Equipment & Services - 3.0% |
Halliburton Co. | 1,106,300 | | 45,170,229 |
National Oilwell Varco, Inc. | 85,300 | | 5,736,425 |
Oceaneering International, Inc. (a) | 284,956 | | 20,981,310 |
Schlumberger Ltd. | 596,033 | | 49,768,756 |
| | 121,656,720 |
Oil, Gas & Consumable Fuels - 6.0% |
Anadarko Petroleum Corp. | 59,600 | | 4,539,136 |
Apache Corp. | 35,000 | | 4,173,050 |
Concho Resources, Inc. (a) | 141,092 | | 12,369,536 |
Exxon Mobil Corp. | 2,010,034 | | 146,973,686 |
Occidental Petroleum Corp. | 416,600 | | 40,868,460 |
Pioneer Natural Resources Co. | 71,000 | | 6,164,220 |
Whiting Petroleum Corp. (a) | 210,300 | | 24,645,057 |
| | 239,733,145 |
TOTAL ENERGY | | 361,389,865 |
FINANCIALS - 5.3% |
Capital Markets - 1.7% |
BlackRock, Inc. Class A | 206,409 | | 39,337,427 |
Charles Schwab Corp. | 855,448 | | 14,636,715 |
Goldman Sachs Group, Inc. | 25,158 | | 4,230,569 |
Common Stocks - continued |
| Shares | | Value |
FINANCIALS - continued |
Capital Markets - continued |
JMP Group, Inc. | 127,100 | | $ 969,773 |
Noah Holdings Ltd. ADR (d) | 476,500 | | 9,315,575 |
| | 68,490,059 |
Commercial Banks - 1.6% |
M&T Bank Corp. | 88,785 | | 7,728,734 |
Wells Fargo & Co. | 1,835,260 | | 56,874,707 |
| | 64,603,441 |
Consumer Finance - 0.1% |
Shriram Transport Finance Co. Ltd. | 281,024 | | 4,909,003 |
Diversified Financial Services - 1.4% |
CME Group, Inc. | 61,177 | | 19,683,700 |
JPMorgan Chase & Co. | 842,798 | | 35,751,491 |
| | 55,435,191 |
Insurance - 0.3% |
AFLAC, Inc. | 179,900 | | 10,151,757 |
Real Estate Investment Trusts - 0.0% |
Dynex Capital, Inc. | 124,200 | | 1,356,264 |
Real Estate Management & Development - 0.2% |
CB Richard Ellis Group, Inc. Class A (a) | 436,297 | | 8,935,363 |
TOTAL FINANCIALS | | 213,881,078 |
HEALTH CARE - 12.5% |
Biotechnology - 2.7% |
Acorda Therapeutics, Inc. (a) | 376,138 | | 10,253,522 |
Alexion Pharmaceuticals, Inc. (a) | 176,642 | | 14,228,513 |
Clinical Data, Inc. (a)(d) | 732,978 | | 11,661,680 |
Human Genome Sciences, Inc. (a) | 396,700 | | 9,477,163 |
Incyte Corp. (a) | 734,200 | | 12,158,352 |
United Therapeutics Corp. (a) | 806,660 | | 50,997,045 |
| | 108,776,275 |
Health Care Equipment & Supplies - 0.6% |
Edwards Lifesciences Corp. (a) | 299,412 | | 24,204,466 |
Health Care Providers & Services - 2.7% |
Express Scripts, Inc. (a) | 1,089,710 | | 58,898,826 |
HMS Holdings Corp. (a) | 64,200 | | 4,158,234 |
Medco Health Solutions, Inc. (a) | 750,306 | | 45,971,249 |
| | 109,028,309 |
Life Sciences Tools & Services - 2.3% |
Agilent Technologies, Inc. (a) | 996,046 | | 41,266,186 |
Illumina, Inc. (a) | 747,273 | | 47,332,272 |
QIAGEN NV (a) | 240,330 | | 4,698,452 |
| | 93,296,910 |
Pharmaceuticals - 4.2% |
Aegerion Pharmaceuticals, Inc. | 123,800 | | 1,754,246 |
Allergan, Inc. | 123,700 | | 8,494,479 |
Novo Nordisk AS Series B | 512,963 | | 57,820,203 |
Perrigo Co. | 464,890 | | 29,441,484 |
|
| Shares | | Value |
Teva Pharmaceutical Industries Ltd. sponsored ADR | 321,203 | | $ 16,744,312 |
Valeant Pharmaceuticals International, Inc. | 1,803,219 | | 51,133,093 |
| | 165,387,817 |
TOTAL HEALTH CARE | | 500,693,777 |
INDUSTRIALS - 17.3% |
Aerospace & Defense - 6.5% |
Esterline Technologies Corp. (a) | 349,467 | | 23,969,942 |
Goodrich Corp. | 494,879 | | 43,583,994 |
Honeywell International, Inc. | 672,816 | | 35,766,899 |
Precision Castparts Corp. | 273,700 | | 38,101,777 |
TransDigm Group, Inc. (a) | 130,148 | | 9,371,957 |
United Technologies Corp. | 1,383,970 | | 108,946,118 |
| | 259,740,687 |
Air Freight & Logistics - 0.4% |
C.H. Robinson Worldwide, Inc. | 225,200 | | 18,058,788 |
Airlines - 0.5% |
Ryanair Holdings PLC sponsored ADR | 113,200 | | 3,482,032 |
Southwest Airlines Co. | 1,176,908 | | 15,276,266 |
| | 18,758,298 |
Building Products - 0.4% |
A.O. Smith Corp. | 150,241 | | 5,721,177 |
Lennox International, Inc. | 209,322 | | 9,898,837 |
| | 15,620,014 |
Commercial Services & Supplies - 0.1% |
Waste Connections, Inc. | 213,450 | | 5,876,279 |
Construction & Engineering - 0.2% |
Jacobs Engineering Group, Inc. (a) | 182,400 | | 8,363,040 |
Electrical Equipment - 2.0% |
Acuity Brands, Inc. | 217,600 | | 12,548,992 |
AMETEK, Inc. | 229,777 | | 9,018,747 |
Cooper Industries PLC Class A | 248,500 | | 14,485,065 |
Crompton Greaves Ltd. | 576,754 | | 3,998,097 |
Emerson Electric Co. | 338,700 | | 19,363,479 |
Polypore International, Inc. (a) | 263,356 | | 10,726,490 |
Regal-Beloit Corp. | 128,100 | | 8,551,956 |
| | 78,692,826 |
Industrial Conglomerates - 1.4% |
3M Co. | 440,788 | | 38,040,004 |
Textron, Inc. | 777,100 | | 18,370,644 |
| | 56,410,648 |
Machinery - 4.3% |
Cummins, Inc. | 310,434 | | 34,150,844 |
Danaher Corp. | 663,368 | | 31,291,069 |
Gardner Denver, Inc. | 150,725 | | 10,372,895 |
Ingersoll-Rand Co. Ltd. | 215,347 | | 10,140,690 |
PACCAR, Inc. | 250,300 | | 14,372,226 |
Common Stocks - continued |
| Shares | | Value |
INDUSTRIALS - continued |
Machinery - continued |
WABCO Holdings, Inc. (a) | 954,898 | | $ 58,181,935 |
Weg SA | 920,400 | | 12,090,458 |
| | 170,600,117 |
Professional Services - 0.8% |
51job, Inc. sponsored ADR (a)(d) | 97,726 | | 4,813,006 |
CoStar Group, Inc. (a) | 43,900 | | 2,526,884 |
IHS, Inc. Class A (a) | 60,702 | | 4,879,834 |
Robert Half International, Inc. | 662,050 | | 20,258,730 |
| | 32,478,454 |
Road & Rail - 0.7% |
Union Pacific Corp. | 288,932 | | 26,772,439 |
TOTAL INDUSTRIALS | | 691,371,590 |
INFORMATION TECHNOLOGY - 28.8% |
Communications Equipment - 7.4% |
Cisco Systems, Inc. (a) | 3,215,219 | | 65,043,880 |
Juniper Networks, Inc. (a) | 1,213,282 | | 44,794,371 |
Motorola, Inc. (a) | 2,406,500 | | 21,826,955 |
Polycom, Inc. (a) | 114,698 | | 4,470,928 |
QUALCOMM, Inc. | 3,196,103 | | 158,175,137 |
| | 294,311,271 |
Computers & Peripherals - 7.6% |
Apple, Inc. (a) | 810,852 | | 261,548,418 |
EMC Corp. (a) | 618,985 | | 14,174,757 |
NetApp, Inc. (a) | 527,400 | | 28,985,904 |
| | 304,709,079 |
Electronic Equipment & Components - 0.2% |
Keyence Corp. | 31,500 | | 9,122,452 |
Internet Software & Services - 6.4% |
Baidu.com, Inc. sponsored ADR (a) | 179,706 | | 17,347,020 |
Dice Holdings, Inc. (a) | 361,000 | | 5,180,350 |
Digital River, Inc. (a) | 10,500 | | 361,410 |
eBay, Inc. (a) | 676,051 | | 18,814,499 |
Google, Inc. Class A (a) | 225,842 | | 134,143,373 |
KIT Digital, Inc. (a)(d) | 943,221 | | 15,129,265 |
The Knot, Inc. (a) | 415,717 | | 4,107,284 |
VeriSign, Inc. | 869,518 | | 28,407,153 |
WebMD Health Corp. (a) | 647,450 | | 33,058,797 |
| | 256,549,151 |
IT Services - 1.1% |
Cognizant Technology Solutions Corp. Class A (a) | 430,100 | | 31,522,029 |
|
| Shares | | Value |
iGate Corp. | 296,681 | | $ 5,847,583 |
Visa, Inc. Class A | 74,586 | | 5,249,363 |
| | 42,618,975 |
Semiconductors & Semiconductor Equipment - 2.0% |
ARM Holdings PLC | 806,300 | | 5,506,908 |
ARM Holdings PLC sponsored ADR (d) | 1,757,254 | | 36,463,021 |
Avago Technologies Ltd. | 1,381,870 | | 39,341,839 |
| | 81,311,768 |
Software - 4.1% |
ANSYS, Inc. (a) | 82,495 | | 4,295,515 |
Ariba, Inc. (a) | 881,211 | | 20,699,646 |
Citrix Systems, Inc. (a) | 404,784 | | 27,691,273 |
Computer Modelling Group Ltd. | 175,100 | | 4,538,589 |
Concur Technologies, Inc. (a) | 78,159 | | 4,058,797 |
Informatica Corp. (a) | 152,600 | | 6,718,978 |
Intuit, Inc. (a) | 159,547 | | 7,865,667 |
Kingdee International Software Group Co. Ltd. | 8,534,000 | | 4,787,165 |
Oracle Corp. | 1,453,116 | | 45,482,531 |
RealPage, Inc. | 53,800 | | 1,664,034 |
Red Hat, Inc. (a) | 204,900 | | 9,353,685 |
salesforce.com, Inc. (a) | 128,389 | | 16,947,348 |
Solera Holdings, Inc. | 51,020 | | 2,618,346 |
VMware, Inc. Class A (a) | 90,900 | | 8,081,919 |
| | 164,803,493 |
TOTAL INFORMATION TECHNOLOGY | | 1,153,426,189 |
MATERIALS - 4.5% |
Chemicals - 1.3% |
CF Industries Holdings, Inc. | 115,950 | | 15,670,643 |
FMC Corp. | 123,400 | | 9,858,426 |
The Mosaic Co. | 315,450 | | 24,087,762 |
| | 49,616,831 |
Metals & Mining - 3.2% |
Consolidated Thompson Iron Mines Ltd. (a) | 2,085,100 | | 29,458,597 |
Grande Cache Coal Corp. (a) | 2,748,600 | | 28,855,753 |
Mirabela Nickel Ltd. (a) | 1,968,948 | | 4,586,617 |
Mongolian Mining Corp. | 3,198,000 | | 3,731,857 |
Newmont Mining Corp. | 577,660 | | 35,485,654 |
Teck Resources Ltd. Class B (sub. vtg.) | 220,400 | | 13,655,386 |
Walter Energy, Inc. | 103,100 | | 13,180,304 |
| | 128,954,168 |
TOTAL MATERIALS | | 178,570,999 |
TELECOMMUNICATION SERVICES - 0.4% |
Wireless Telecommunication Services - 0.4% |
Vivo Participacoes SA sponsored ADR | 422,254 | | 13,761,258 |
TOTAL COMMON STOCKS (Cost $3,024,876,195) | 3,911,445,206 |
Money Market Funds - 2.8% |
| Shares | | Value |
Fidelity Cash Central Fund, 0.19% (b) | 87,934,474 | | $ 87,934,474 |
Fidelity Securities Lending Cash Central Fund, 0.21% (b)(c) | 24,233,150 | | 24,233,150 |
TOTAL MONEY MARKET FUNDS (Cost $112,167,624) | 112,167,624 |
TOTAL INVESTMENT PORTFOLIO - 100.5% (Cost $3,137,043,819) | | 4,023,612,830 |
NET OTHER ASSETS (LIABILITIES) - (0.5)% | | (20,374,947) |
NET ASSETS - 100% | $ 4,003,237,883 |
Legend |
(a) Non-income producing |
(b) Affiliated fund that is available only to investment companies and other accounts managed by Fidelity Investments. The rate quoted is the annualized seven-day yield of the fund at period end. A complete unaudited listing of the fund's holdings as of its most recent quarter end is available upon request. In addition, each Fidelity Central Fund's financial statements, which are not covered by the Fund's Report of Independent Registered Public Accounting Firm, are available on the SEC's website or upon request. |
(c) Investment made with cash collateral received from securities on loan. |
(d) Security or a portion of the security is on loan at period end. |
(e) Security exempt from registration under Rule 144A of the Securities Act of 1933. These securities may be resold in transactions exempt from registration, normally to qualified institutional buyers. At the end of the period, the value of these securities amounted to $3,700,870 or 0.1% of net assets. |
Affiliated Central Funds |
Information regarding fiscal year to date income earned by the Fund from investments in Fidelity Central Funds is as follows: |
Fund | Income earned |
Fidelity Cash Central Fund | $ 124,568 |
Fidelity Securities Lending Cash Central Fund | 726,428 |
Total | $ 850,996 |
Other Information |
The following is a summary of the inputs used, as of December 31, 2010, involving the Fund's assets and liabilities carried at fair value. The inputs or methodology used for valuing securities may not be an indication of the risk associated with investing in those securities. For more information on valuation inputs, and their aggregation into the levels used in the table below, please refer to the Security Valuation section in the accompanying Notes to Financial Statements. |
Valuation Inputs at Reporting Date: |
Description | Total | Level 1 | Level 2 | Level 3 |
Investments in Securities: | | | | |
Equities: | | | | |
Consumer Discretionary | $ 626,082,463 | $ 626,082,463 | $ - | $ - |
Consumer Staples | 172,267,987 | 172,267,987 | - | - |
Energy | 361,389,865 | 361,389,865 | - | - |
Financials | 213,881,078 | 213,881,078 | - | - |
Health Care | 500,693,777 | 442,873,574 | 57,820,203 | - |
Industrials | 691,371,590 | 691,371,590 | - | - |
Information Technology | 1,153,426,189 | 1,147,919,281 | 5,506,908 | - |
Materials | 178,570,999 | 178,570,999 | - | - |
Telecommunication Services | 13,761,258 | 13,761,258 | - | - |
Money Market Funds | 112,167,624 | 112,167,624 | - | - |
Total Investments in Securities: | $ 4,023,612,830 | $ 3,960,285,719 | $ 63,327,111 | $ - |
Distribution of investments by country of issue, as a percentage of total net assets, is as follows: (Unaudited) |
United States of America | 86.2% |
Canada | 3.8% |
Denmark | 1.5% |
Netherlands Antilles | 1.2% |
Cayman Islands | 1.2% |
United Kingdom | 1.0% |
Singapore | 1.0% |
Others (Individually Less Than 1%) | 4.1% |
| 100.0% |
Income Tax Information |
At December 31, 2010, the Fund had a capital loss carryforward of approximately $1,604,451,566 of which $41,234,048, $1,104,811,876 and $458,405,642 will expire in fiscal 2011, 2016 and 2017, respectively. Capital loss carryforwards are only available to offset future capital gains of the Fund to the extent provided by regulations and may be limited. |
See accompanying notes which are an integral part of the financial statements.
Annual Report
Statement of Assets and Liabilities
| December 31, 2010 |
| | |
Assets | | |
Investment in securities, at value (including securities loaned of $23,877,604) - See accompanying schedule: Unaffiliated issuers (cost $3,024,876,195) | $ 3,911,445,206 | |
Fidelity Central Funds (cost $112,167,624) | 112,167,624 | |
Total Investments (cost $3,137,043,819) | | $ 4,023,612,830 |
Receivable for investments sold | | 9,401,826 |
Receivable for fund shares sold | | 814,132 |
Dividends receivable | | 764,089 |
Distributions receivable from Fidelity Central Funds | | 33,563 |
Prepaid expenses | | 10,638 |
Other receivables | | 235,135 |
Total assets | | 4,034,872,213 |
| | |
Liabilities | | |
Payable to custodian bank | $ 4 | |
Payable for investments purchased | 757,972 | |
Payable for fund shares redeemed | 4,086,810 | |
Accrued management fee | 1,845,584 | |
Distribution and service plan fees payable | 157,632 | |
Other affiliated payables | 314,164 | |
Other payables and accrued expenses | 239,014 | |
Collateral on securities loaned, at value | 24,233,150 | |
Total liabilities | | 31,634,330 |
| | |
Net Assets | | $ 4,003,237,883 |
Net Assets consist of: | | |
Paid in capital | | $ 4,749,126,522 |
Distributions in excess of net investment income | | (165,575) |
Accumulated undistributed net realized gain (loss) on investments and foreign currency transactions | | (1,632,294,936) |
Net unrealized appreciation (depreciation) on investments and assets and liabilities in foreign currencies | | 886,571,872 |
Net Assets | | $ 4,003,237,883 |
Statement of Assets and Liabilities - continued
| December 31, 2010 |
| | |
Initial Class:
Net Asset Value, offering price and redemption price per share ($2,842,306,553 ÷ 76,641,606 shares) | | $ 37.09 |
| | |
Service Class:
Net Asset Value, offering price and redemption price per share ($453,062,955 ÷ 12,247,567 shares) | | $ 36.99 |
| | |
Service Class 2:
Net Asset Value, offering price and redemption price per share ($584,193,295 ÷ 15,908,366 shares) | | $ 36.72 |
| | |
Service Class 2R:
Net Asset Value, offering price and redemption price per share ($5,739,135 ÷ 156,628 shares) | | $ 36.64 |
| | |
Investor Class:
Net Asset Value, offering price and redemption price per share ($117,935,945 ÷ 3,187,649 shares) | | $ 37.00 |
See accompanying notes which are an integral part of the financial statements.
Annual Report
Statement of Operations
| Year ended December 31, 2010 |
| | |
Investment Income | | |
Dividends | | $ 31,037,251 |
Interest | | 125 |
Income from Fidelity Central Funds | | 850,996 |
Total income | | 31,888,372 |
| | |
Expenses | | |
Management fee | $ 20,222,973 | |
Transfer agent fees | 2,822,529 | |
Distribution and service plan fees | 1,712,631 | |
Accounting and security lending fees | 1,036,366 | |
Custodian fees and expenses | 115,872 | |
Independent trustees' compensation | 21,887 | |
Appreciation in deferred trustee compensation account | 226 | |
Audit | 75,207 | |
Legal | 19,341 | |
Interest | 194 | |
Miscellaneous | 52,544 | |
Total expenses before reductions | 26,079,770 | |
Expense reductions | (397,466) | 25,682,304 |
Net investment income (loss) | | 6,206,068 |
Realized and Unrealized Gain (Loss) Net realized gain (loss) on: | | |
Investment securities: | | |
Unaffiliated issuers | 368,619,724 | |
Investment not meeting investment restrictions | (19,441) | |
Foreign currency transactions | (385,552) | |
Payment from investment advisor for loss on investment not meeting investment restrictions | 19,441 | |
Total net realized gain (loss) | | 368,234,172 |
Change in net unrealized appreciation (depreciation) on: Investment securities | 419,056,678 | |
Assets and liabilities in foreign currencies | 5,061 | |
Total change in net unrealized appreciation (depreciation) | | 419,061,739 |
Net gain (loss) | | 787,295,911 |
Net increase (decrease) in net assets resulting from operations | | $ 793,501,979 |
Statement of Changes in Net Assets
| Year ended
December 31, 2010 | Year ended
December 31, 2009 |
Increase (Decrease) in Net Assets | | |
Operations | | |
Net investment income (loss) | $ 6,206,068 | $ 11,842,787 |
Net realized gain (loss) | 368,234,172 | (453,010,967) |
Change in net unrealized appreciation (depreciation) | 419,061,739 | 1,274,194,307 |
Net increase (decrease) in net assets resulting from operations | 793,501,979 | 833,026,127 |
Distributions to shareholders from net investment income | (8,150,719) | (12,825,130) |
Distributions to shareholders from net realized gain | (12,197,748) | (2,861,216) |
Total distributions | (20,348,467) | (15,686,346) |
Share transactions - net increase (decrease) | (439,300,401) | (425,627,981) |
Redemption fees | 1,277 | 1,078 |
Total increase (decrease) in net assets | 333,854,388 | 391,712,878 |
| | |
Net Assets | | |
Beginning of period | 3,669,383,495 | 3,277,670,617 |
End of period (including distributions in excess of net investment income of $165,575 and undistributed net investment income of $219,186, respectively) | $ 4,003,237,883 | $ 3,669,383,495 |
See accompanying notes which are an integral part of the financial statements.
Annual Report
Financial Highlights - Initial Class
Years ended December 31, | 2010 | 2009 | 2008 | 2007 | 2006 |
Selected Per-Share Data | | | | | |
Net asset value, beginning of period | $ 30.04 | $ 23.53 | $ 45.12 | $ 35.87 | $ 33.70 |
Income from Investment Operations | | | | | |
Net investment income (loss) C | .07 | .10 | .27 | .09 | .21 |
Net realized and unrealized gain (loss) | 7.18 | 6.55 | (21.55) | 9.53 | 2.09 |
Total from investment operations | 7.25 | 6.65 | (21.28) | 9.62 | 2.30 |
Distributions from net investment income | (.09) | (.12) | (.31) | (.33) | (.13) |
Distributions from net realized gain | (.11) | (.02) | - | (.04) | - |
Total distributions | (.20) | (.14) H | (.31) | (.37) | (.13) |
Redemption fees added to paid in capital C, G | - | - | - | - | - |
Net asset value, end of period | $ 37.09 | $ 30.04 | $ 23.53 | $ 45.12 | $ 35.87 |
Total Return A, B | 24.17% | 28.29% | (47.17)% | 26.96% | 6.85% |
Ratios to Average Net Assets D, F | | | | | |
Expenses before reductions | .67% | .69% | .68% | .65% | .68% |
Expenses net of fee waivers, if any | .66% | .69% | .68% | .65% | .68% |
Expenses net of all reductions | .66% | .68% | .67% | .64% | .67% |
Net investment income (loss) | .22% | .41% | .74% | .21% | .61% |
Supplemental Data | | | | | |
Net assets, end of period (000 omitted) | $ 2,842,307 | $ 2,618,954 | $ 2,337,892 | $ 6,002,656 | $ 5,610,629 |
Portfolio turnover rate E | 75% | 134% | 161% | 109% | 114% |
A Total returns do not reflect charges attributable to your insurance company's separate account. Inclusion of these charges would reduce the total returns shown.
B Total returns would have been lower had certain expenses not been reduced during the periods shown.
C Calculated based on average shares outstanding during the period.
D Fees and expenses of the underlying Fidelity Central Funds are not included in the Fund's expense ratio. The Fund indirectly bears its proportionate share of the expenses of any underlying Fidelity Central Funds.
E Amount does not include the portfolio activity of any underlying Fidelity Central Funds.
F Expense ratios reflect operating expenses of the class. Expenses before reductions do not reflect amounts reimbursed by the investment adviser or reductions from brokerage service arrangements or reductions from other expense offset arrangements and do not represent the amount paid by the class during periods when reimbursements or reductions occur. Expenses net of fee waivers reflect expenses after reimbursement by the investment adviser but prior to reductions from brokerage service arrangements or other expense offset arrangements. Expenses net of all reductions represent the net expenses paid by the class.
G Amount represents less than $.01 per share.
H Total distributions of $.14 per share is comprised of distributions from net investment income of $.118 and distributions from net realized gain of $.023 per share.
Financial Highlights - Service Class
Years ended December 31, | 2010 | 2009 | 2008 | 2007 | 2006 |
Selected Per-Share Data | | | | | |
Net asset value, beginning of period | $ 29.96 | $ 23.47 | $ 44.99 | $ 35.72 | $ 33.56 |
Income from Investment Operations | | | | | |
Net investment income (loss) C | .04 | .08 | .23 | .04 | .18 |
Net realized and unrealized gain (loss) | 7.16 | 6.52 | (21.48) | 9.51 | 2.07 |
Total from investment operations | 7.20 | 6.60 | (21.25) | 9.55 | 2.25 |
Distributions from net investment income | (.06) | (.09) | (.27) | (.24) | (.09) |
Distributions from net realized gain | (.11) | (.02) | - | (.04) | - |
Total distributions | (.17) | (.11) H | (.27) | (.28) | (.09) |
Redemption fees added to paid in capital C, G | - | - | - | - | - |
Net asset value, end of period | $ 36.99 | $ 29.96 | $ 23.47 | $ 44.99 | $ 35.72 |
Total Return A, B | 24.06% | 28.15% | (47.23)% | 26.87% | 6.73% |
Ratios to Average Net Assets D, F | | | | | |
Expenses before reductions | .77% | .79% | .78% | .75% | .78% |
Expenses net of fee waivers, if any | .76% | .79% | .78% | .75% | .78% |
Expenses net of all reductions | .76% | .78% | .77% | .74% | .77% |
Net investment income (loss) | .12% | .31% | .64% | .11% | .51% |
Supplemental Data | | | | | |
Net assets, end of period (000 omitted) | $ 453,063 | $ 421,996 | $ 395,759 | $ 929,848 | $ 877,279 |
Portfolio turnover rate E | 75% | 134% | 161% | 109% | 114% |
A Total returns do not reflect charges attributable to your insurance company's separate account. Inclusion of these charges would reduce the total returns shown.
B Total returns would have been lower had certain expenses not been reduced during the periods shown.
C Calculated based on average shares outstanding during the period.
D Fees and expenses of the underlying Fidelity Central Funds are not included in the Fund's expense ratio. The Fund indirectly bears its proportionate share of the expenses of any underlying Fidelity Central Funds.
E Amount does not include the portfolio activity of any underlying Fidelity Central Funds.
F Expense ratios reflect operating expenses of the class. Expenses before reductions do not reflect amounts reimbursed by the investment adviser or reductions from brokerage service arrangements or reductions from other expense offset arrangements and do not represent the amount paid by the class during periods when reimbursements or reductions occur. Expenses net of fee waivers reflect expenses after reimbursement by the investment adviser but prior to reductions from brokerage service arrangements or other expense offset arrangements. Expenses net of all reductions represent the net expenses paid by the class.
G Amount represents less than $.01 per share.
H Total distributions of $.11 per share is comprised of distributions from net investment income of $.089 and distributions from net realized gain of $.023 per share.
See accompanying notes which are an integral part of the financial statements.
Annual Report
Financial Highlights - Service Class 2
Years ended December 31, | 2010 | 2009 | 2008 | 2007 | 2006 |
Selected Per-Share Data | | | | | |
Net asset value, beginning of period | $ 29.75 | $ 23.31 | $ 44.65 | $ 35.42 | $ 33.29 |
Income from Investment Operations | | | | | |
Net investment income (loss) C | (.01) | .04 | .17 | (.02) | .12 |
Net realized and unrealized gain (loss) | 7.10 | 6.48 | (21.29) | 9.43 | 2.07 |
Total from investment operations | 7.09 | 6.52 | (21.12) | 9.41 | 2.19 |
Distributions from net investment income | (.01) | (.05) | (.22) | (.15) | (.06) |
Distributions from net realized gain | (.11) | (.02) | - | (.03) | - |
Total distributions | (.12) | (.08) G | (.22) | (.18) | (.06) |
Redemption fees added to paid in capital C, G | - | - | - | - | - |
Net asset value, end of period | $ 36.72 | $ 29.75 | $ 23.31 | $ 44.65 | $ 35.42 |
Total Return A, B | 23.86% | 27.97% | (47.31)% | 26.66% | 6.57% |
Ratios to Average Net Assets D, F | | | | | |
Expenses before reductions | .92% | .94% | .93% | .90% | .94% |
Expenses net of fee waivers, if any | .91% | .94% | .93% | .90% | .94% |
Expenses net of all reductions | .91% | .93% | .92% | .89% | .92% |
Net investment income (loss) | (.03)% | .16% | .49% | (.04)% | .36% |
Supplemental Data | | | | | |
Net assets, end of period (000 omitted) | $ 584,193 | $ 528,819 | $ 447,530 | $ 898,204 | $ 627,754 |
Portfolio turnover rate E | 75% | 134% | 161% | 109% | 114% |
A Total returns do not reflect charges attributable to your insurance company's separate account. Inclusion of these charges would reduce the total returns shown.
B Total returns would have been lower had certain expenses not been reduced during the periods shown.
C Calculated based on average shares outstanding during the period.
D Fees and expenses of the underlying Fidelity Central Funds are not included in the Fund's expense ratio. The Fund indirectly bears its proportionate share of the expenses of any underlying Fidelity Central Funds.
E Amount does not include the portfolio activity of any underlying Fidelity Central Funds.
F Expense ratios reflect operating expenses of the class. Expenses before reductions do not reflect amounts reimbursed by the investment adviser or reductions from brokerage service arrangements or reductions from other expense offset arrangements and do not represent the amount paid by the class during periods when reimbursements or reductions occur. Expenses net of fee waivers reflect expenses after reimbursement by the investment adviser but prior to reductions from brokerage service arrangements or other expense offset arrangements. Expenses net of all reductions represent the net expenses paid by the class.
G Total distributions of $.08 per share is comprised of distributions from net investment income of $.052 and distributions from net realized gain of $.023 per share.
Financial Highlights - Service Class 2R
Years ended December 31, | 2010 | 2009 | 2008 | 2007 | 2006 |
Selected Per-Share Data | | | | | |
Net asset value, beginning of period | $ 29.70 | $ 23.26 | $ 44.42 | $ 35.28 | $ 33.18 |
Income from Investment Operations | | | | | |
Net investment income (loss) C | (.01) | .04 | .18 | (.01) | .12 |
Net realized and unrealized gain (loss) | 7.09 | 6.46 | (21.20) | 9.38 | 2.06 |
Total from investment operations | 7.08 | 6.50 | (21.02) | 9.37 | 2.18 |
Distributions from net investment income | (.03) | (.04) | (.14) | (.19) | (.08) |
Distributions from net realized gain | (.11) | (.02) | - | (.04) | - |
Total distributions | (.14) | (.06) G | (.14) | (.23) | (.08) |
Redemption fees added to paid in capital C, G | - | - | - | - | - |
Net asset value, end of period | $ 36.64 | $ 29.70 | $ 23.26 | $ 44.42 | $ 35.28 |
Total Return A, B | 23.86% | 27.98% | (47.31)% | 26.66% | 6.58% |
Ratios to Average Net Assets D, F | | | | | |
Expenses before reductions | .92% | .94% | .93% | .89% | .93% |
Expenses net of fee waivers, if any | .91% | .94% | .93% | .89% | .93% |
Expenses net of all reductions | .91% | .93% | .92% | .89% | .92% |
Net investment income (loss) | (.03)% | .16% | .49% | (.04)% | .36% |
Supplemental Data | | | | | |
Net assets, end of period (000 omitted) | $ 5,739 | $ 4,084 | $ 3,061 | $ 20,051 | $ 5,063 |
Portfolio turnover rate E | 75% | 134% | 161% | 109% | 114% |
A Total returns do not reflect charges attributable to your insurance company's separate account. Inclusion of these charges would reduce the total returns shown.
B Total returns would have been lower had certain expenses not been reduced during the periods shown.
C Calculated based on average shares outstanding during the period.
D Fees and expenses of the underlying Fidelity Central Funds are not included in the Fund's expense ratio. The Fund indirectly bears its proportionate share of the expenses of any underlying Fidelity Central Funds.
E Amount does not include the portfolio activity of any underlying Fidelity Central Funds.
F Expense ratios reflect operating expenses of the class. Expenses before reductions do not reflect amounts reimbursed by the investment adviser or reductions from brokerage service arrangements or reductions from other expense offset arrangements and do not represent the amount paid by the class during periods when reimbursements or reductions occur. Expenses net of fee waivers reflect expenses after reimbursement by the investment adviser but prior to reductions from brokerage service arrangements or other expense offset arrangements. Expenses net of all reductions represent the net expenses paid by the class.
G Total distributions of $.06 per share is comprised of distributions from net investment income of $.041 and distributions from net realized gain of $.023 per share.
See accompanying notes which are an integral part of the financial statements.
Annual Report
Financial Highlights - Investor Class
Years ended December 31, | 2010 | 2009 | 2008 | 2007 | 2006 |
Selected Per-Share Data | | | | | |
Net asset value, beginning of period | $ 29.97 | $ 23.48 | $ 45.00 | $ 35.78 | $ 33.67 |
Income from Investment Operations | | | | | |
Net investment income (loss) C | .04 | .08 | .24 | .04 | .17 |
Net realized and unrealized gain (loss) | 7.17 | 6.52 | (21.49) | 9.50 | 2.08 |
Total from investment operations | 7.21 | 6.60 | (21.25) | 9.54 | 2.25 |
Distributions from net investment income | (.07) | (.09) | (.27) | (.28) | (.14) |
Distributions from net realized gain | (.11) | (.02) | - | (.04) | - |
Total distributions | (.18) | (.11) H | (.27) | (.32) | (.14) |
Redemption fees added to paid in capital C, G | - | - | - | - | - |
Net asset value, end of period | $ 37.00 | $ 29.97 | $ 23.48 | $ 45.00 | $ 35.78 |
Total Return A, B | 24.08% | 28.14% | (47.22)% | 26.81% | 6.72% |
Ratios to Average Net Assets D, F | | | | | |
Expenses before reductions | .76% | .79% | .77% | .76% | .81% |
Expenses net of fee waivers, if any | .75% | .79% | .77% | .76% | .81% |
Expenses net of all reductions | .75% | .78% | .76% | .76% | .80% |
Net investment income (loss) | .13% | .31% | .65% | .09% | .49% |
Supplemental Data | | | | | |
Net assets, end of period (000 omitted) | $ 117,936 | $ 95,531 | $ 93,428 | $ 181,705 | $ 76,965 |
Portfolio turnover rate E | 75% | 134% | 161% | 109% | 114% |
A Total returns do not reflect charges attributable to your insurance company's separate account. Inclusion of these charges would reduce the total returns shown.
B Total returns would have been lower had certain expenses not been reduced during the periods shown.
C Calculated based on average shares outstanding during the period.
D Fees and expenses of the underlying Fidelity Central Funds are not included in the Fund's expense ratio. The Fund indirectly bears its proportionate share of the expenses of any underlying Fidelity Central Funds.
E Amount does not include the portfolio activity of any underlying Fidelity Central Funds.
F Expense ratios reflect operating expenses of the class. Expenses before reductions do not reflect amounts reimbursed by the investment adviser or reductions from brokerage service arrangements or reductions from other expense offset arrangements and do not represent the amount paid by the class during periods when reimbursements or reductions occur. Expenses net of fee waivers reflect expenses after reimbursement by the investment adviser but prior to reductions from brokerage service arrangements or other expense offset arrangements. Expenses net of all reductions represent the net expenses paid by the class.
G Amount represents less than $.01 per share.
H Total distributions of $.11 per share is comprised of distributions from net investment income of $.089 and distributions from net realized gain of $.023 per share.
See accompanying notes which are an integral part of the financial statements.
Annual Report
Notes to Financial Statements
For the period ended December 31, 2010
1. Organization.
VIP Growth Portfolio (the Fund) is a fund of Variable Insurance Products Fund (the Trust) and is authorized to issue an unlimited number of shares. The Trust is registered under the Investment Company Act of 1940, as amended (the 1940 Act), as an open-end management investment company organized as a Massachusetts business trust. Shares of the Fund may only be purchased by insurance companies for the purpose of funding variable annuity or variable life insurance contracts. The Fund offers the following classes of shares: Initial Class shares, Service Class shares, Service Class 2 shares, Service Class 2R shares and Investor Class shares. All classes have equal rights and voting privileges, except for matters affecting a single class. Investment income, realized and unrealized capital gains and losses, the common expenses of the Fund, and certain fund-level expense reductions, if any, are allocated on a pro-rata basis to each class based on the relative net assets of each class to the total net assets of the Fund. Each class differs with respect to transfer agent and distribution and service plan fees incurred. Certain expense reductions also differ by class.
2. Investments in Fidelity Central Funds.
The Fund may invest in Fidelity Central Funds, which are open-end investment companies available only to other investment companies and accounts managed by Fidelity Management & Research Company (FMR) and its affiliates. The Fund's Schedule of Investments lists each of the Fidelity Central Funds held as of period end, if any, as an investment of the Fund, but does not include the underlying holdings of each Fidelity Central Fund. As an Investing Fund, the Fund indirectly bears its proportionate share of the expenses of the underlying Fidelity Central Funds.
The Money Market Central Funds seek preservation of capital and current income and are managed by Fidelity Investments Money Management, Inc. (FIMM), an affiliate of FMR.
A complete unaudited list of holdings for each Fidelity Central Fund is available upon request or at the Securities and Exchange Commission (the SEC) web site at www.sec.gov. In addition, the financial statements of the Fidelity Central Funds, which are not covered by the Fund's Report of Independent Registered Public Accounting Firm, are available on the SEC web site or upon request.
3. Significant Accounting Policies.
The financial statements have been prepared in conformity with accounting principles generally accepted in the United States of America (GAAP), which require management to make certain estimates and assumptions at the date of the financial statements. Actual results could differ from those estimates. Subsequent events, if any, through the date that the financial statements were issued have been evaluated in the preparation of the financial statements. The following summarizes the significant accounting policies of the Fund:
Security Valuation. Investments are valued as of 4:00 p.m. Eastern time on the last calendar day of the period. The Fund uses independent pricing services approved by the Board of Trustees to value its investments. When current market prices or quotations are not readily available or reliable, valuations may be determined in good faith in accordance with procedures adopted by the Board of Trustees. Factors used in determining value may include market or security specific events. The frequency with which these procedures are used cannot be predicted and they may be utilized to a significant extent. The value used for net asset value (NAV) calculation under these procedures may differ from published prices for the same securities.
The Fund categorizes the inputs to valuation techniques used to value its investments into a disclosure hierarchy consisting of three levels as shown below.
Level 1 - quoted prices in active markets for identical investments
Level 2 - other significant observable inputs (including quoted prices for similar investments, interest rates, prepayment speeds, etc.)
Level 3 - unobservable inputs (including the Fund's own assumptions based on the best information available)
Changes in valuation techniques may result in transfers in or out of an assigned level within the disclosure hierarchy. The aggregate value of investments by input level, as of December 31, 2010 is included at the end of the Fund's Schedule of Investments. Valuation techniques used to value the Fund's investments by major category are as follows.
Equity securities, including restricted securities, for which market quotations are readily available, are valued at the last reported sale price or official closing price as reported by an independent pricing service on the primary market or exchange on which they are traded and are categorized as Level 1 in the hierarchy. In the event there were no sales during the day or closing prices are not available, securities are valued at the last quoted bid price or may be valued using the last available price and are generally categorized as Level 2 in the hierarchy. For foreign equity securities, when significant market or security specific events arise, comparisons to the valuation of American Depositary Receipts (ADRs), futures contracts, Exchange-traded funds (ETFs) and certain indexes as well as quoted prices for similar securities are used and are categorized as Level 2 in the hierarchy in these circumstances. Utilizing these techniques may result in transfers between Level 1 and Level 2. For restricted equity securities and private placements where observable inputs are limited, assumptions about market activity and risk are used and are categorized as Level 3 in the hierarchy.
Annual Report
Notes to Financial Statements - continued
3. Significant Accounting Policies - continued
Security Valuation - continued
Investments in open-end mutual funds, including the Fidelity Central Funds, are valued at their closing net asset value each business day and are categorized as Level 1 in the hierarchy.
Foreign Currency. The Fund uses foreign currency contracts to facilitate transactions in foreign-denominated securities. Gains and losses from these transactions may arise from changes in the value of the foreign currency or if the counterparties do not perform under the contracts' terms.
Foreign-denominated assets, including investment securities, and liabilities are translated into U.S. dollars at the exchange rate at period end. Purchases and sales of investment securities, income and dividends received and expenses denominated in foreign currencies are translated into U.S. dollars at the exchange rate in effect on the transaction date.
The effects of exchange rate fluctuations on investments are included with the net realized and unrealized gain (loss) on investment securities. Other foreign currency transactions resulting in realized and unrealized gain (loss) are disclosed separately.
Investment Transactions and Income. For financial reporting purposes, the Fund's investment holdings and NAV include trades executed through the end of the last business day of the period. The NAV per share for processing shareholder transactions is calculated as of the close of business of the New York Stock Exchange (NYSE), normally 4:00 p.m. Eastern time and includes trades executed through the end of the prior business day. Gains and losses on securities sold are determined on the basis of identified cost and may include proceeds received from litigation. Dividend income is recorded on the ex-dividend date, except for certain dividends from foreign securities where the ex-dividend date may have passed, which are recorded as soon as the Fund is informed of the ex-dividend date. Non-cash dividends included in dividend income, if any, are recorded at the fair market value of the securities received. Distributions received on securities that represent a return of capital or capital gain are recorded as a reduction of cost of investments and/or as a realized gain. The Fund estimates the components of distributions received that may be considered return of capital distributions or capital gain distributions. Interest income and distributions from the Fidelity Central Funds are accrued as earned. Interest income includes coupon interest and amortization of premium and accretion of discount on debt securities. Investment income is recorded net of foreign taxes withheld where recovery of such taxes is uncertain.
Expenses. Expenses directly attributable to a fund are charged to that fund. Expenses attributable to more than one fund are allocated among the respective funds on the basis of relative net assets or other appropriate methods. Expense estimates are accrued in the period to which they relate and adjustments are made when actual amounts are known.
Deferred Trustee Compensation. Under a Deferred Compensation Plan (the Plan), independent Trustees may elect to defer receipt of a portion of their annual compensation. Deferred amounts are invested in a cross-section of Fidelity funds, are marked-to-market and remain in the Fund until distributed in accordance with the Plan. The investment of deferred amounts and the offsetting payable to the Trustees are included in the accompanying Statement of Assets and Liabilities.
Income Tax Information and Distributions to Shareholders. Each year the Fund intends to qualify as a regulated investment company, including distributing substantially all of its taxable income and realized gains under Subchapter M of the Internal Revenue Code and filing its U.S. federal tax return. As a result, no provision for income taxes is required. As of December 31, 2010, the Fund did not have any unrecognized tax benefits in the accompanying financial statements. A fund's federal tax return is subject to examination by the Internal Revenue Service (IRS) for a period of three years. Foreign taxes are provided for based on the Fund's understanding of the tax rules and rates that exist in the foreign markets in which it invests.
Distributions are declared and recorded on the ex-dividend date. Income dividends and capital gain distributions are declared separately for each class. Income and capital gain distributions are determined in accordance with income tax regulations, which may differ from GAAP.
Capital accounts within the financial statements are adjusted for permanent book-tax differences. These adjustments have no impact on net assets or the results of operations. Temporary book-tax differences will reverse in a subsequent period.
Book-tax differences are primarily due to foreign currency transactions, passive foreign investment companies (PFIC), deferred trustees compensation, capital loss carryforwards and losses deferred due to wash sales.
The federal tax cost of investment securities and unrealized appreciation (depreciation) as of period end were as follows:
Gross unrealized appreciation | $ 917,016,465 |
Gross unrealized depreciation | (65,205,672) |
Net unrealized appreciation (depreciation) | $ 851,810,793 |
Tax Cost | $ 3,171,802,037 |
Annual Report
3. Significant Accounting Policies - continued
Income Tax Information and Distributions to Shareholders - continued
The tax-based components of distributable earnings as of period end were as follows:
Undistributed ordinary income | $ 6,914,850 |
Capital loss carryforward | $ (1,604,451,566) |
Net unrealized appreciation (depreciation) | $ 851,813,654 |
The tax character of distributions paid was as follows:
| December 31, 2010 | December 31, 2009 |
Ordinary Income | $ 20,348,467 | $ 15,686,346 |
Trading (Redemption) Fees. Service Class 2R shares held by investors less than 60 days are subject to a redemption fee equal to 1% of the net asset value of shares redeemed. All redemption fees, which reduce the proceeds of the shareholder redemption, are retained by the Fund and accounted for as an addition to paid in capital.
4. Operating Policies.
Restricted Securities. The Fund may invest in securities that are subject to legal or contractual restrictions on resale. These securities generally may be resold in transactions exempt from registration or to the public if the securities are registered. Disposal of these securities may involve time-consuming negotiations and expense, and prompt sale at an acceptable price may be difficult. Information regarding restricted securities is included at the end of the Fund's Schedule of Investments.
5. Purchases and Sales of Investments.
Purchases and sales of securities, other than short-term securities, aggregated $2,625,759,610 and $3,106,144,474, respectively.
The Fund realized a loss on the sale of an investment not meeting the investment restrictions of the Fund. The loss was fully reimbursed by the Fund's investment advisor.
6. Fees and Other Transactions with Affiliates.
Management Fee. FMR and its affiliates provide the Fund with investment management related services for which the Fund pays a monthly management fee. The management fee is the sum of an individual fund fee rate that is based on an annual rate of .30% of the Fund's average net assets and a group fee rate that averaged .26% during the period. The group fee rate is based upon the average net assets of all the mutual funds advised by FMR. The group fee rate decreases as assets under management increase and increases as assets under management decrease. For the period, the total annual management fee rate was .56% of the Fund's average net assets.
Distribution and Service Plan Fees. In accordance with Rule 12b-1 of the 1940 Act, the Fund has adopted separate 12b-1 Plans for each Service Class of shares. Each Service Class pays Fidelity Distributors Corporation (FDC), an affiliate of FMR, a service fee. For the period, the service fee is based on an annual rate of .10% of Service Class' average net assets and .25% of Service Class 2's and Service Class 2R's average net assets.
For the period, total fees, all of which were re-allowed to insurance companies for the distribution of shares and providing shareholder support services were as follows:
Service Class | $ 414,029 |
Service Class 2 | 1,288,224 |
Service Class 2 R | 10,378 |
| $ 1,712,631 |
Annual Report
Notes to Financial Statements - continued
6. Fees and Other Transactions with Affiliates - continued
Transfer Agent Fees. Fidelity Investments Institutional Operations Company, Inc. (FIIOC), an affiliate of FMR, is the Fund's transfer, dividend disbursing, and shareholder servicing agent. FIIOC receives an asset-based fee with respect to each class. Each class (with the exception of Investor Class) pays a transfer agent fee, excluding out of pocket expenses, equal to an annual rate of .07% of average net assets. Investor Class pays a monthly asset-based transfer agent fee of .15% of average net assets. In addition, FIIOC receives an asset-based fee of .01% of average net assets for typesetting, printing and mailing of shareholder reports, except proxy statements. FIIOC has agreed to voluntarily waive this fee until December 31, 2010. (See Note 9: Expense Reductions.) For the period, transfer agent fees for each class, including printing and out of pocket expenses, were as follows:
Initial Class | $ 1,948,797 |
Service Class | 314,174 |
Service Class 2 | 396,075 |
Service Class 2R | 3,089 |
Investor Class | 160,394 |
| $ 2,822,529 |
Accounting and Security Lending Fees. Fidelity Service Company, Inc. (FSC), an affiliate of FMR, maintains the Fund's accounting records. The accounting fee is based on the level of average net assets for the month. Under a separate contract, FSC administers the security lending program. The security lending fee is based on the number and duration of lending transactions.
Brokerage Commissions. The Fund placed a portion of its portfolio transactions with brokerage firms which are affiliates of the investment adviser. The commissions paid to these affiliated firms were $45,002 for the period.
Interfund Lending Program. Pursuant to an Exemptive Order issued by the SEC, the Fund, along with other registered investment companies having management contracts with FMR, may participate in an interfund lending program. This program provides an alternative credit facility allowing the funds to borrow from, or lend money to, other participating affiliated funds. At period end, there were no interfund loans outstanding. The Fund's activity in this program during the period for which loans were outstanding was as follows:
Borrower or Lender | Average Daily
Loan Balance | Weighted Average
Interest Rate | Interest
Expense |
Borrower | $ 15,534,000 | .45% | $ 194 |
7. Committed Line of Credit.
The Fund participates with other funds managed by FMR or an affiliate in a $3.75 billion credit facility (the "line of credit") to be utilized for temporary or emergency purposes to fund shareholder redemptions or for other short-term liquidity purposes. The Fund has agreed to pay commitment fees on its pro-rata portion of the line of credit, which amounted to $14,102 and is reflected in Miscellaneous expenses on the Statement of Operations. During the period, there were no borrowings on this line of credit.
8. Security Lending.
The Fund lends portfolio securities through a lending agent from time to time in order to earn additional income. The lending agent may loan securities to certain qualified borrowers, including Fidelity Capital Markets (FCM), a broker-dealer affiliated with the Fund. On the settlement date of the loan, the Fund receives collateral (in the form of U.S. Treasury obligations, letters of credit and/or cash) against the loaned securities and maintains collateral in an amount not less than 100% of the market value of the loaned securities during the period of the loan. The market value of the loaned securities is determined at the close of business of the Fund and any additional required collateral is delivered to the Fund on the next business day. If the borrower defaults on its obligation to return the securities loaned because of insolvency or other reasons, a fund could experience delays and costs in recovering the securities loaned or in gaining access to the collateral. Any cash collateral received is invested in the Fidelity Securities Lending Cash Central Fund. The value of loaned securities and cash collateral at period end are disclosed on the Fund's Statement of Assets and Liabilities. Security lending income represents the income earned on investing cash collateral, less rebates paid to borrowers and lending agent fees associated with the loan, plus any premium payments received for lending certain types of securities. Security lending income is presented in the Statement of Operations as a component of income from Fidelity Central Funds. Total security lending income during the period amounted to $726,428, including $2,452 from securities loaned to FCM.
Annual Report
9. Expense Reductions.
FMR or its affiliates agreed to waive certain fees during the period as noted in the table below.
Initial Class | $ 187,563 |
Service Class | 30,013 |
Service Class 2 | 37,359 |
Service Class 2R | 301 |
Investor Class | 7,099 |
| $ 262,335 |
Many of the brokers with whom FMR places trades on behalf of the Fund provided services to the Fund in addition to trade execution. These services included payments of certain expenses on behalf of the Fund totaling $134,926 for the period. In addition, through arrangements with the Fund's custodian, credits realized as a result of uninvested cash balances were used to reduce the Fund's expenses. During the period, these credits reduced the Fund's custody expenses by $205.
10. Distributions to Shareholders.
Distributions to shareholders of each class were as follows:
Years ended December 31, | 2010 | 2009 |
From net investment income | | |
Initial Class | $ 7,069,872 | $ 10,334,573 |
Service Class | 708,549 | 1,267,138 |
Service Class 2 | 157,035 | 932,585 |
Service Class 2R | 4,039 | 5,914 |
Investor Class | 211,224 | 284,920 |
Total | $ 8,150,719 | $ 12,825,130 |
From net realized gain | | |
Initial Class | $ 8,678,947 | $ 2,036,641 |
Service Class | 1,386,003 | 332,083 |
Service Class 2 | 1,769,479 | 414,242 |
Service Class 2R | 15,949 | 3,345 |
Investor Class | 347,370 | 74,905 |
Total | $ 12,197,748 | $ 2,861,216 |
11. Share Transactions.
Transactions for each class of shares were as follows:
| Shares | Dollars |
Years ended December 31, | 2010 | 2009 | 2010 | 2009 |
Initial Class | | | | |
Shares sold | 3,473,243 | 3,168,252 | $ 113,067,768 | $ 80,283,755 |
Reinvestment of distributions | 445,708 | 426,627 | 15,748,819 | 12,371,214 |
Shares redeemed | (14,471,861) | (15,761,725) | (459,125,365) | (393,809,218) |
Net increase (decrease) | (10,552,910) | (12,166,846) | $ (330,308,778) | $ (301,154,249) |
Service Class | | | | |
Shares sold | 651,294 | 601,860 | $ 21,310,170 | $ 15,078,974 |
Reinvestment of distributions | 59,936 | 55,581 | 2,094,552 | 1,599,221 |
Shares redeemed | (2,547,621) | (3,433,675) | (80,470,779) | (86,029,416) |
Net increase (decrease) | (1,836,391) | (2,776,234) | $ (57,066,057) | $ (69,351,221) |
Service Class 2 | | | | |
Shares sold | 2,292,229 | 3,094,007 | $ 74,709,454 | $ 75,154,813 |
Reinvestment of distributions | 56,469 | 47,559 | 1,926,514 | 1,346,827 |
Shares redeemed | (4,214,967) | (4,562,964) | (130,514,071) | (113,322,366) |
Net increase (decrease) | (1,866,269) | (1,421,398) | $ (53,878,103) | $ (36,820,726) |
Annual Report
Notes to Financial Statements - continued
11. Share Transactions - continued
| Shares | Dollars |
Years ended December 31, | 2010 | 2009 | 2010 | 2009 |
Service Class 2R | | | | |
Shares sold | 106,812 | 70,980 | $ 3,580,908 | $ 1,731,048 |
Reinvestment of distributions | 577 | 331 | 19,988 | 9,259 |
Shares redeemed | (88,264) | (65,400) | (2,902,806) | (1,732,958) |
Net increase (decrease) | 19,125 | 5,911 | $ 698,090 | $ 7,349 |
Investor Class | | | | |
Shares sold | 639,949 | 347,569 | $ 21,166,429 | $ 9,118,954 |
Reinvestment of distributions | 15,871 | 12,514 | 558,594 | 359,825 |
Shares redeemed | (655,594) | (1,151,644) | (20,470,576) | (27,787,913) |
Net increase (decrease) | 226 | (791,561) | $ 1,254,447 | $ (18,309,134) |
12. Other.
The Fund's organizational documents provide former and current trustees and officers with a limited indemnification against liabilities arising in connection with the performance of their duties to the Fund. In the normal course of business, the Fund may also enter into contracts that provide general indemnifications. The Fund's maximum exposure under these arrangements is unknown as this would be dependent on future claims that may be made against the Fund. The risk of material loss from such claims is considered remote.
At the end of the period, FMR or its affiliates were the owners of record of 16% of the total outstanding shares of the Fund and two otherwise unaffiliated shareholders were the owners of record of 34% of the total outstanding shares of the Fund.
Annual Report
Report of Independent Registered Public Accounting Firm
To the Trustees of Variable Insurance Products Fund and the Shareholders of VIP Growth Portfolio:
In our opinion, the accompanying statement of assets and liabilities, including the schedule of investments, and the related statements of operations and of changes in net assets and the financial highlights present fairly, in all material respects, the financial position of VIP Growth Portfolio (a fund of Variable Insurance Products Fund) at December 31, 2010, the results of its operations for the year then ended, the changes in its net assets for each of the two years in the period then ended and the financial highlights for each of the five years in the period then ended, in conformity with accounting principles generally accepted in the United States of America. These financial statements and financial highlights (hereafter referred to as "financial statements") are the responsibility of the VIP Growth Portfolio's management. Our responsibility is to express an opinion on these financial statements based on our audits. We conducted our audits of these financial statements in accordance with the standards of the Public Company Accounting Oversight Board (United States). Those standards require that we plan and perform the audit to obtain reasonable assurance about whether the financial statements are free of material misstatement. An audit includes examining, on a test basis, evidence supporting the amounts and disclosures in the financial statements, assessing the accounting principles used and significant estimates made by management, and evaluating the overall financial statement presentation. We believe that our audits, which included confirmation of securities at December 31, 2010 by correspondence with the custodian and brokers, provide a reasonable basis for our opinion.
/s/ PricewaterhouseCoopers LLP
PricewaterhouseCoopers LLP
Boston, Massachusetts
February 14, 2011
Annual Report
The Trustees, Members of the Advisory Board, and executive officers of the trust and fund, as applicable, are listed below. The Board of Trustees governs the fund and is responsible for protecting the interests of shareholders. The Trustees are experienced executives who meet periodically throughout the year to oversee the fund's activities, review contractual arrangements with companies that provide services to the fund, oversee management of the risks associated with such activities and contractual arrangements, and review the fund's performance. Except for James C. Curvey, each of the Trustees oversees 219 funds advised by FMR or an affiliate. Mr. Curvey oversees 408 funds advised by FMR or an affiliate.
The Trustees hold office without limit in time except that (a) any Trustee may resign; (b) any Trustee may be removed by written instrument, signed by at least two-thirds of the number of Trustees prior to such removal; (c) any Trustee who requests to be retired or who has become incapacitated by illness or injury may be retired by written instrument signed by a majority of the other Trustees; and (d) any Trustee may be removed at any special meeting of shareholders by a two-thirds vote of the outstanding voting securities of the trust. Each Trustee who is not an interested person (as defined in the 1940 Act) (Independent Trustee), shall retire not later than the last day of the calendar year in which his or her 72nd birthday occurs. The Independent Trustees may waive this mandatory retirement age policy with respect to individual Trustees. The executive officers and Advisory Board Members hold office without limit in time, except that any officer and Advisory Board Member may resign or may be removed by a vote of a majority of the Trustees at any regular meeting or any special meeting of the Trustees. Except as indicated, each individual has held the office shown or other offices in the same company for the past five years.
Experience, Skills, Attributes, and Qualifications of the Fund's Trustees. The Governance and Nominating Committee has adopted a statement of policy that describes the experience, qualifications, attributes, and skills that are necessary and desirable for potential Independent Trustee candidates (Statement of Policy). The Board believes that each Trustee satisfied at the time he or she was initially elected or appointed a Trustee, and continues to satisfy, the standards contemplated by the Statement of Policy. The Governance and Nominating Committee also engages professional search firms to help identify potential Independent Trustee candidates who have the experience, qualifications, attributes, and skills consistent with the Statement of Policy. From time to time, additional criteria based on the composition and skills of the current Independent Trustees, as well as experience or skills that may be appropriate in light of future changes to board composition, business conditions, and regulatory or other developments, have also been considered by the professional search firms and the Governance and Nominating Committee. In addition, the Board takes into account the Trustees' commitment and participation in Board and committee meetings, as well as their leadership of standing and ad hoc committees throughout their tenure.
In determining that a particular Trustee was and continues to be qualified to serve as a Trustee, the Board has considered a variety of criteria, none of which, in isolation, was controlling. The Board believes that, collectively, the Trustees have balanced and diverse experience, qualifications, attributes, and skills, which allow the Board to operate effectively in governing the fund and protecting the interests of shareholders. Information about the specific experience, skills, attributes, and qualifications of each Trustee, which in each case led to the Board's conclusion that the Trustee should serve (or continue to serve) as a trustee of the fund, is provided below.
Board Structure and Oversight Function. James C. Curvey is an interested person (as defined in the 1940 Act) and currently serves as Acting Chairman. The Trustees have determined that an interested Chairman is appropriate and benefits shareholders because an interested Chairman has a personal and professional stake in the quality and continuity of services provided to the fund. Independent Trustees exercise their informed business judgment to appoint an individual of their choosing to serve as Chairman, regardless of whether the Trustee happens to be independent or a member of management. The Independent Trustees have determined that they can act independently and effectively without having an Independent Trustee serve as Chairman and that a key structural component for assuring that they are in a position to do so is for the Independent Trustees to constitute a substantial majority for the Board. The Independent Trustees also regularly meet in executive session. Ned C. Lautenbach serves as Chairman of the Independent Trustees and as such (i) acts as a liaison between the Independent Trustees and management with respect to matters important to the Independent Trustees and (ii) with management prepares agendas for Board meetings.
Fidelity funds are overseen by different Boards of Trustees. The fund's Board oversees Fidelity's equity and high income funds and another Board oversees Fidelity's investment-grade bond, money market, and asset allocation funds. The asset allocation funds may invest in Fidelity funds overseen by the fund's Board. The use of separate Boards, each with its own committee structure, allows the Trustees of each group of Fidelity funds to focus on the unique issues of the funds they oversee, including common research, investment, and operational issues. On occasion, the separate Boards establish joint committees to address issues of overlapping consequences for the Fidelity funds overseen by each Board.
The Trustees operate using a system of committees to facilitate the timely and efficient consideration of all matters of importance to the Trustees, the fund, and fund shareholders and to facilitate compliance with legal and regulatory requirements and oversight of the fund's activities and associated risks. The Board, acting through its committees, has charged FMR and its affiliates with (i) identifying events or circumstances the occurrence of which could have demonstrably adverse effects on the fund's business and/or reputation; (ii) implementing processes and controls to lessen the possibility that such events or circumstances occur or to mitigate the effects of such events or circumstances if they do occur; and (iii) creating and maintaining a system designed to evaluate continuously business and market conditions in order to facilitate the identification and implementation processes described in (i) and (ii) above. Because the day-to-day operations and activities of the fund are carried out by or through FMR, its affiliates and other service providers, the fund's exposure to risks is mitigated but not eliminated by the processes overseen by the Trustees. While each of the Board's committees has responsibility for overseeing different aspects of the fund's activities, oversight is exercised primarily through the Operations, Audit, and Compliance Committees. Appropriate personnel, including but not limited to the fund's Chief Compliance Officer (CCO), FMR's internal auditor, the independent accountants, the fund's Treasurer and portfolio management personnel, make periodic reports to the Board's committees, as appropriate. The responsibilities of each committee, including their oversight responsibilities, are described further under "Standing Committees of the Fund's Trustees."
Annual Report
Trustees and Officers - continued
The fund's Statement of Additional Information (SAI) includes more information about the Trustees. To request a free copy, call Fidelity at 1-877-208-0098.
Interested Trustees*:
Correspondence intended for each Trustee who is an interested person may be sent to Fidelity Investments, 82 Devonshire Street, Boston, Massachusetts 02109.
Name, Age; Principal Occupations and Other Relevant Experience+ |
James C. Curvey (75) |
| Year of Election or Appointment: 2007 Mr. Curvey is Trustee and Acting Chairman of the Board of Trustees of certain Trusts. Mr. Curvey also serves as Trustee (2007-present) of other investment companies advised by FMR. Mr. Curvey is a Director of Fidelity Investments Money Management, Inc. (2009-present), Director of Fidelity Research & Analysis Co. (2009-present) and Director of FMR and FMR Co., Inc. (2007-present). Mr. Curvey is also Vice Chairman (2007-present) and Director of FMR LLC. In addition, Mr. Curvey serves as an Overseer for the Boston Symphony Orchestra and a member of the Trustees of Villanova University. Previously, Mr. Curvey was the Vice Chairman (2006-2007) and Director (2000-2007) of FMR Corp. |
Ronald P. O'Hanley (54) |
| Year of Election or Appointment: 2011 Mr. O'Hanley is President of Fidelity Asset Management and Corporate Services, for Fidelity Investments and a member of Fidelity's Executive Committee (2010-present). Previously, Mr. O'Hanley served as President and Chief Executive Officer of BNY Mellon Asset Management (2007-2010). Mr. O'Hanley also served as Vice Chairman of Bank New York Mellon Corp. and a member of that firm's Executive Committee. Prior to the 2007 merger of The Bank of New York and Mellon Financial Corporation, he was Vice Chairman of Mellon Financial Corporation and President and Chief Executive Officer of Mellon Asset Management. He joined Mellon in February 1997. Mr. O'Hanley currently serves as Chairman of the Boston Public Library Foundation Board of Directors and sits on the Board of Directors of Beth Israel Deaconess Medical Center, the Board of Trustees of the Marine Biological Laboratory and the Advisory Board of the Maxwell School of Citizenship and Public Administration at Syracuse University. Mr. O'Hanley also chairs the Council on Asset Management for the Financial Services Roundtable and is a member of the Board of Directors of Institutional Investor's U.S. Institute. |
* Trustees have been determined to be "Interested Trustees" by virtue of, among other things, their affiliation with the trust or various entities under common control with FMR.
+ The information above includes each Trustee's principal occupation during the last five years and other information relating to the experience, attributes, and skills relevant to each Trustee's qualifications to serve as a Trustee, which led to the conclusion that each Trustee should serve as a Trustee for the fund.
Independent Trustees:
Correspondence intended for each Independent Trustee (that is, the Trustees other than the Interested Trustees) may be sent to Fidelity Investments, P.O. Box 55235, Boston, Massachusetts 02205-5235.
Name, Age; Principal Occupations and Other Relevant Experience+ |
Dennis J. Dirks (62) |
| Year of Election or Appointment: 200 Prior to his retirement in May 2003, Mr. Dirks was Chief Operating Officer and a member of the Board of The Depository Trust & Clearing Corporation (DTCC). He also served as President, Chief Operating Officer, and Board member of The Depository Trust Company (DTC) and President and Board member of the National Securities Clearing Corporation (NSCC). In addition, Mr. Dirks served as Chief Executive Officer and Board member of the Government Securities Clearing Corporation, Chief Executive Officer and Board member of the Mortgage-Backed Securities Clearing Corporation, as a Trustee and a member of the Finance Committee of Manhattan College (2005-2008), and as a Trustee and a member of the Finance Committee of AHRC of Nassau County (2006-2008). Mr. Dirks is a member of the Independent Directors Council (IDC) Governing Council (2010-Present) and Board of Directors for The Brookville Center for Children's Services, Inc. (2009-present). |
Alan J. Lacy (57) |
| Year of Election or Appointment: 2008 Mr. Lacy serves as Senior Adviser (2007-present) of Oak Hill Capital Partners, L.P. (private equity). Mr. Lacy also served as Chief Executive Officer (2000-2005) and Vice Chairman (2005-2006) of Sears Holdings Corporation and Sears, Roebuck and Co. (retail). In addition, Mr. Lacy serves as a member of the Board of Directors of The Western Union Company (global money transfer, 2006-present) and Bristol-Myers Squibb Company (global pharmaceuticals, 2007-present). Mr. Lacy is Chairman (2008-present) and a member (2006-present) of the Board of Trustees of The National Parks Conservation Association. |
Ned C. Lautenbach (66) |
| Year of Election or Appointment: 2000 Mr. Lautenbach is Chairman of the Independent Trustees of the Equity and High Income Funds (2006-present). Mr. Lautenbach currently serves as the Lead Director of the Eaton Corporation Board of Directors (diversified industrial, 1997-present). Mr. Lautenbach is also a member of the Board of Directors of the Philharmonic Center for the Arts in Naples, Florida (1999-
present); a member of the Board of Trustees of Fairfield University (2005-present); and a member of the Council on Foreign Relations (1994-present). Previously, Mr. Lautenbach was a Partner/Advisory Partner at Clayton, Dubilier & Rice, Inc. (private equity investment, 1998-2010), as well as a Director of Sony Corporation (2006-2007). |
Joseph Mauriello (66) |
| Year of Election or Appointment: 2008 Prior to his retirement in January 2006, Mr. Mauriello served in numerous senior management positions including Deputy Chairman and Chief Operating Officer (2004-2005), and Vice Chairman of Financial Services (2002-2004) of KPMG LLP US (professional services, 1965-2005). Mr. Mauriello currently serves as a member of the Board of Directors of XL Group plc. (global insurance and re-insurance, 2006-present) and of Arcadia Resources Inc. (health care services and products, 2007-present). Previously, Mr. Mauriello served as a Director of the Hamilton Funds of the Bank of New York (2006-2007). |
Cornelia M. Small (66) |
| Year of Election or Appointment: 2005 Ms. Small is a member of the Board of Directors of the Teagle Foundation (2009-present). Ms. Small is also a member of the Investment Committee, and Chair (2008-present) and a member of the Board of Trustees of Smith College. In addition, Ms. Small serves on the Investment Committee of the Berkshire Taconic Community Foundation (2008-present). Previously, Ms. Small served as Chairperson of the Investment Committee (2002-2008) of Smith College. In addition, Ms. Small served as Chief Investment Officer, Director of Global Equity Investments, and a member of the Board of Directors of Scudder, Stevens & Clark and Scudder Kemper Investments. |
William S. Stavropoulos (71) |
| Year of Election or Appointment: 2001 Mr. Stavropoulos is Vice Chairman of the Independent Trustees of the Equity and High Income Funds (2006-present). Mr. Stavropoulos serves as President and Founder of the Michigan Baseball Foundation, the Great Lakes Loons (2007-present). Mr. Stavropoulos is Chairman Emeritus of the Board of Directors of The Dow Chemical Company, where he previously served in numerous senior management positions, including President, CEO (1995-2000; 2002-2004), Chairman of the Executive Committee (2000-2006), and as a member of the Board of Directors (1990-2006). Currently, Mr. Stavropoulos is Chairman of Univar (global distributor of commodity and specialty chemicals, 2010-present), a Director of Teradata Corporation (data warehousing and technology solutions, 2008-present), Chemical Financial Corporation, Maersk Inc. (industrial conglomerate), Tyco International, Inc. (multinational manufacturing and services, 2007-present), and a member of the Advisory Board for Metalmark Capital (private equity investment, 2005-present). Mr. Stavropoulos is a special advisor to Clayton, Dubilier & Rice, LLC (private equity investment). In addition, Mr. Stavropoulos is a member of the University of Notre Dame Advisory Council for the College of Science. |
David M. Thomas (61) |
| Year of Election or Appointment: 2008 Previously, Mr. Thomas served as Executive Chairman (2005-2006) and Chairman and Chief Executive Officer (2000-2005) of IMS Health, Inc. (pharmaceutical and healthcare information solutions). In addition, Mr. Thomas serves as a member of the Board of Directors of Fortune Brands, Inc. (consumer products), and Interpublic Group of Companies, Inc. (marketing communication, 2004-present). |
Michael E. Wiley (60) |
| Year of Election or Appointment: 2008 Mr. Wiley also serves as a Director of Asia Pacific Exploration Consolidated (international oil and gas exploration and production, 2008-present). Mr. Wiley serves as a Director of Tesoro Corporation (independent oil refiner and marketer, 2005-present), and a Director of Bill Barrett Corporation (exploration and production, 2005-present). In addition, Mr. Wiley also serves as a Director of Post Oak Bank (privately-held bank, 2004-present). Previously, Mr. Wiley served as a member of the Board of Trustees of the University of Tulsa (2000-2006; 2007-2010), as a Senior Energy Advisor of Katzenbach Partners, LLC (consulting, 2006-2007), as an Advisory Director of Riverstone Holdings (private investment), Chairman, President, and CEO of Baker Hughes, Inc. (oilfield services, 2000-2004), and as Director of Spinnaker Exploration Company (exploration and production, 2001-2005). |
+ The information above includes each Trustee's principal occupation during the last five years and other information relating to the experience, attributes, and skills relevant to each Trustee's qualifications to serve as a Trustee, which led to the conclusion that each Trustee should serve as a Trustee for the fund.
Advisory Board Members and Executive Officers:
Correspondence intended for each executive officer, Edward C. Johnson 3d, and Peter S. Lynch may be sent to Fidelity Investments, 82 Devonshire Street, Boston, Massachusetts 02109.
Name, Age; Principal Occupation |
Edward C. Johnson 3d (80) |
| Year of Election or Appointment: 2011 Member of the Advisory Board of Fidelity's Equity and High Income Funds. Formerly Trustee and Chairman of the Board of Trustees of certain Trusts, Mr. Johnson serves as Chief Executive Officer, Chairman, and a Director of FMR LLC; Chairman and a Director of FMR; and Chairman and a Director of FMR Co., Inc. In addition, Mr. Johnson serves as Chairman and Director of FIL Limited. Previously, Mr. Johnson served as President of FMR LLC (2006-2007). |
Peter S. Lynch (66) |
| Year of Election or Appointment: 2003 Member of the Advisory Board of Fidelity's Equity and High Income Funds. Mr. Lynch is Vice Chairman and a Director of FMR and FMR Co., Inc. In addition, Mr. Lynch serves as a Trustee of Boston College and as the Chairman of the Inner-City Scholarship Fund. Previously, Mr. Lynch served on the Special Olympics International Board of Directors (1997-2006). |
Kenneth B. Robins (41) |
| Year of Election or Appointment: 2008 President and Treasurer of Fidelity's Equity and High Income Funds. Mr. Robins also serves as President and Treasurer (2010-
present) and Assistant Treasurer (2009-present) of other Fidelity funds and is an employee of Fidelity Investments (2004-present). Previously, Mr. Robins served as Deputy Treasurer of the Fidelity funds (2005-2008) and Treasurer and Chief Financial Officer of The North Carolina Capital Management Trust: Cash and Term Portfolios (2006-2008). |
Bruce T. Herring (45) |
| Year of Election or Appointment: 2006 Vice President of certain Equity Funds. Mr. Herring also serves as Chief Investment Officer and Director of Fidelity Management & Research (U.K.) Inc. (2010-present) and Group Chief Investments Officer of FMR. Previously, Mr. Herring served as Vice President (2005-2006) and Senior Vice President (2006-2007) of Fidelity Management & Research Company, Vice President of FMR Co., Inc. (2001-2007) and as a portfolio manager for Fidelity U.S. Equity Funds. |
Brian B. Hogan (46) |
| Year of Election or Appointment: 2009 Vice President of certain Equity Funds and Vice President of Sector Funds. Mr. Hogan also serves as President of FMR's Equity Division (2009-present). Previously, Mr. Hogan served as Senior Vice President, Equity Research of FMR (2006-2009) and as a portfolio manager. |
Scott C. Goebel (42) |
| Year of Election or Appointment: 2008 Secretary and Chief Legal Officer (CLO) of the Fidelity funds. Mr. Goebel also serves as Secretary and CLO of The North Carolina Capital Management Trust: Cash and Term Portfolio (2008-present); General Counsel, Secretary, and Senior Vice President of FMR (2008-present) and FMR Co., Inc. (2008-present); Deputy General Counsel of FMR LLC; Chief Legal Officer of Fidelity Management & Research (Hong Kong) Limited (2008-present) and Assistant Secretary of Fidelity Management & Research (Japan) Inc. (2008-present), Fidelity Investments Money Management, Inc. (2008-present), Fidelity Management & Research (U.K.) Inc. (2008-present), and Fidelity Research and Analysis Company (2008-present). Previously, Mr. Goebel served as Assistant Secretary of the Funds (2007-2008) and as Vice President and Secretary of Fidelity Distributors Corporation (FDC) (2005-2007). |
William C. Coffey (41) |
| Year of Election or Appointment: 2009 Assistant Secretary of Fidelity's Equity and High Income Funds. Mr. Coffey also serves as Senior Vice President and Deputy General Counsel of FMR LLC (2010-present), and is an employee of Fidelity Investments. Previously, Mr. Coffey served as Vice President and Associate General Counsel of FMR LLC (2005-2009). |
Holly C. Laurent (56) |
| Year of Election or Appointment: 2008 Anti-Money Laundering (AML) Officer of the Fidelity funds. Ms. Laurent also serves as AML Officer of The North Carolina Capital Management Trust: Cash and Term Portfolio (2008-present) and is an employee of Fidelity Investments. Previously, Ms. Laurent was Senior Vice President and Head of Legal for Fidelity Business Services India Pvt. Ltd. (2006-2008), and Senior Vice President, Deputy General Counsel and Group Head for FMR LLC (2005-2006). |
Christine Reynolds (52) |
| Year of Election or Appointment: 2008 Chief Financial Officer of the Fidelity funds. Ms. Reynolds became President of Fidelity Pricing and Cash Management Services (FPCMS) in August 2008. Ms. Reynolds served as Chief Operating Officer of FPCMS (2007-2008). Previously, Ms. Reynolds served as President, Treasurer, and Anti-Money Laundering officer of the Fidelity funds (2004-2007). |
Kenneth A. Rathgeber (63) |
| Year of Election or Appointment: 2004 Chief Compliance Officer of Fidelity's Equity and High Income Funds. Mr. Rathgeber is Chief Compliance Officer of Fidelity Management & Research (Hong Kong) Limited (2008-present), Fidelity Management & Research (Japan) Inc. (2008-present), FMR (2005-present), FMR Co., Inc. (2005-present), Fidelity Management & Research (U.K.) Inc. (2005-present), Fidelity Research & Analysis Company (2005-present), Fidelity Investments Money Management, Inc. (2005-present), Pyramis Global Advisors, LLC (2005-present), and Strategic Advisers, Inc. (2005-present). |
Jeffrey S. Christian (49) |
| Year of Election or Appointment: 2009 Deputy Treasurer of the Fidelity funds. Mr. Christian is an employee of Fidelity Investments. Previously, Mr. Christian served as Chief Financial Officer (2008-2009) of certain Fidelity funds and Senior Vice President of Fidelity Pricing and Cash Management Services (FPCMS) (2004-2009). |
Bryan A. Mehrmann (49) |
| Year of Election or Appointment: 2005 Deputy Treasurer of the Fidelity funds. Mr. Mehrmann is an employee of Fidelity Investments. |
Adrien E. Deberghes (43) |
| Year of Election or Appointment: 2008 Deputy Treasurer of Fidelity's Equity and High Income Funds. Mr. Deberghes also serves as Assistant Treasurer of other Fidelity funds (2010-present) and is an employee of Fidelity Investments (2008-present). Previously, Mr. Deberghes served as Senior Vice President of Mutual Fund Administration at State Street Corporation (2007-2008), Senior Director of Mutual Fund Administration at Investors Bank & Trust (2005-2007), and Director of Finance for Dunkin' Brands (2000-2005). |
Stephanie J. Dorsey (41) |
| Year of Election or Appointment: 2010 Assistant Treasurer of Fidelity's Equity and High Income Funds. Ms. Dorsey also serves as Deputy Treasurer of other Fidelity funds (2008-present) and is an employee of Fidelity Investments (2008-present). Previously, Ms. Dorsey served as Treasurer (2004-2008) of the JPMorgan Mutual Funds and Vice President (2004-2008) of JPMorgan Chase Bank. |
Name, Age; Principal Occupation |
John R. Hebble (52) |
| Year of Election or Appointment: 2009 Assistant Treasurer of Fidelity's Equity and High Income Funds. Mr. Hebble also serves as Treasurer and Chief Financial Officer of The North Carolina Capital Management Trust: Cash and Term Portfolio (2008-present), President and Treasurer of other Fidelity funds (2008-present) and is an employee of Fidelity Investments. |
Gary W. Ryan (52) |
| Year of Election or Appointment: 2005 Assistant Treasurer of the Fidelity funds. Mr. Ryan is an employee of Fidelity Investments. Previously, Mr. Ryan served as Vice President of Fund Reporting in Fidelity Pricing and Cash Management Services (FPCMS) (1999-2005). |
Jonathan Davis (42) |
| Year of Election or Appointment: 2010 Assistant Treasurer of the Fidelity funds. Mr. Davis is an employee of Fidelity Investments. Previously, Mr. Davis served as Vice President and Associate General Counsel of FMR LLC (2003-2010). |
Annual Report
The Board of Trustees of VIP Growth Portfolio voted to pay to shareholders of record at the opening of business on record date, the following distributions per share derived from capital gains realized from sales of portfolio securities, and dividends derived from net investment income:
| Pay Date | Record Date | Dividends | Capital Gains |
Service Class 2R | 02/04/11 | 02/04/11 | - | $0.075 |
Service Class 2R designates 100% of the dividends distributed, during the fiscal year as qualifying for the dividends-received deduction for corporate shareholders.
The fund will notify shareholders in January 2011 of amounts for use in preparing 2010 income tax returns.
Annual Report
Board Approval of Investment Advisory Contracts and Management Fees
VIP Growth Portfolio
Each year, the Board of Trustees, including the Independent Trustees (together, the Board), votes on the renewal of the management contract and sub-advisory agreements (together, the Advisory Contracts) for the fund. The Board, assisted by the advice of fund counsel and Independent Trustees' counsel, requests and considers a broad range of information relevant to the renewal of the Advisory Contracts throughout the year.
The Board meets regularly and considers at each of its meetings factors that are relevant to its annual consideration of the renewal of the fund's Advisory Contracts, including the services and support provided to the fund and its shareholders. The Board has established various standing committees, each composed of Independent Trustees with varying backgrounds, to which the Board has assigned specific subject matter responsibilities in order to enhance effective decision-making by the Board. The Board, acting directly and through its Committees, requests and receives information concerning the annual consideration of the renewal of the fund's Advisory Contracts. The Board also meets as needed to consider matters specifically related to the Board's annual consideration of the renewal of Advisory Contracts. Members of the Board may also meet with trustees of other Fidelity funds through ad hoc joint committees to discuss certain matters relevant to the Fidelity funds.
At its July 2010 meeting, the Board of Trustees, including the Independent Trustees, unanimously determined to renew the fund's Advisory Contracts. In reaching its determination, the Board considered all factors it believed relevant, including (i) the nature, extent, and quality of the services to be provided to the fund and its shareholders (including the investment performance of the fund); (ii) the competitiveness of the fund's management fee and total expenses; (iii) the total costs of the services to be provided by and the profits to be realized by Fidelity from its relationship with the fund; (iv) the extent to which economies of scale would be realized as the fund grows; and (v) whether fee levels reflect these economies of scale, if any, for the benefit of fund shareholders.
In considering whether to renew the Advisory Contracts for the fund, the Board reached a determination, with the assistance of fund counsel and Independent Trustees' counsel and through the exercise of its business judgment, that the renewal of the Advisory Contracts is in the best interests of fund shareholders and that the compensation to be received by Fidelity under the management contract is fair and reasonable. The Board's decision to renew the Advisory Contracts was not based on any single factor noted above, but rather was based on a comprehensive consideration of all the information provided to the Board at its meetings throughout the year. The Board, in reaching its determination to renew the Advisory Contracts, is aware that shareholders in the fund have a broad range of investment choices available to them, including a wide choice among mutual funds offered by Fidelity's competitors, and that the fund's shareholders, with the opportunity to review and weigh the disclosure provided by the fund in its prospectus and other public disclosures, have chosen to invest in this fund, managed by Fidelity.
Nature, Extent, and Quality of Services Provided. The Board considered the staffing within the investment adviser, FMR, and the sub-advisers (together, the Investment Advisers), including the backgrounds of the fund's investment personnel and the fund's investment objective and discipline. The Independent Trustees also had discussions with senior management of Fidelity's investment operations and investment groups. The Board considered the structure of the portfolio manager compensation program and whether this structure provides appropriate incentives to act in the best interest of the fund.
Resources Dedicated to Investment Management and Support Services. The Board and the equity research subcommittee of the Board's Fund Oversight Committee reviewed the size, education, and experience of the Investment Advisers' investment staff, their use of technology, and the Investment Advisers' approach to recruiting, training, and retaining portfolio managers and other research, advisory, and management personnel. The Board noted that Fidelity's analysts have access to a variety of technological tools and market and securities data that enable them to perform both fundamental and quantitative analysis and to specialize in various disciplines. The Board considered Fidelity's extensive global research capabilities that enable the Investment Advisers to aggregate data from various sources in an effort to produce positive investment results. The Board also considered that Fidelity's portfolio managers and analysts have access to daily portfolio attribution that allows for monitoring of a fund's portfolio, as well as an electronic communication system that provides immediate real-time access to research concerning issuers and credit enhancers. The Board noted FMR's continued focus on strengthening the organization and discipline of equity portfolio management and research.
Shareholder and Administrative Services. The Board considered (i) the nature, extent, quality, and cost of advisory, administrative, and shareholder services performed by the Investment Advisers and their affiliates under the Advisory Contracts and under separate agreements covering transfer agency, pricing and bookkeeping, and securities lending services for the fund; (ii) the nature and extent of the investment adviser's supervision of third party service providers, principally custodians and subcustodians; and (iii) the resources devoted to, and the record of compliance with, the fund's compliance policies and procedures. The Board also reviewed the allocation of fund brokerage, including allocations to brokers affiliated with the Investment Advisers, the use of brokerage commissions to pay fund expenses, and the use of "soft" commission dollars to pay for research services.
The Board noted that the growth of fund assets over time across the complex allows Fidelity to reinvest in the development of services designed to enhance the value or convenience of the Fidelity funds as investment vehicles. These services include 24-hour access to account information and market information through phone representatives and over the Internet, and investor education materials and asset allocation tools.
Investment in a Large Fund Family. The Board considered the benefits to shareholders of investing in a Fidelity fund, including the benefits of investing in a fund that is part of a large family of funds offering a variety of investment disciplines and providing a large variety of mutual fund investor services. The Board noted that Fidelity had taken, or had made recommendations that resulted in the Fidelity funds taking, a number of actions over the previous year that benefited particular funds, including (i) dedicating additional resources to investment research and restructuring and broadening the focus of the investment research teams; (ii) bolstering the senior management team that oversees asset management; (iii) launching Class F of certain funds as a lower-fee class available to Freedom K and Freedom Index Funds; (iv) lowering the initial investment minimums and ongoing balance requirements for Real Estate High Income Fund; (v) eliminating subsequent purchase minimums for all funds and adding a waiver of the investment minimum requirement for new accounts opened with the proceeds of a systematic withdrawal plan; (vi) eliminating the withdrawal minimum and maximum limits for systematic withdrawals from Advisor funds; (vii) expanding sales load waivers on Class A shares for Destiny Planholders and expanding Institutional Class eligibility for Class O Destiny Planholders; and (viii) changing certain Class A and Class T sales charge structures to further align them with industry practices.
Annual Report
Investment Performance. The Board considered whether the fund has operated in accordance with its investment objective, as well as its record of compliance with its investment restrictions. It also reviewed the fund's absolute investment performance for each class, as well as the fund's relative investment performance for each class measured over multiple periods against (i) a broad-based securities market index, and (ii) a custom peer group of mutual funds deemed appropriate by Fidelity and reviewed by the Board. The following charts considered by the Board show, over the one-, three-, and five-year periods ended December 31, 2009, the cumulative total returns of Initial Class and Service Class 2 of the fund, the cumulative total returns of a broad-based securities market index ("benchmark"), and a range of cumulative total returns of a custom peer group of mutual funds defined by FMR based on categories assigned by Morningstar, Inc. The returns of Initial Class and Service Class 2 show the performance of the highest and lowest performing classes, respectively (based on five-year performance). The box within each chart shows the 25th percentile return (bottom of box) and the 75th percentile return (top of box) of the peer group. Returns shown above the box are in the first quartile and returns shown below the box are in the fourth quartile. The percentage beaten numbers noted below each chart correspond to the percentile box and represent the percentage of funds in the peer group whose performance was equal to or lower than that of the class indicated. The fund's custom peer group, defined by FMR, is a peer group that FMR believes provides a more meaningful performance comparison than the peer group assigned by Morningstar, Inc., which assigns mutual funds to categories based on their investment styles as measured by their underlying portfolio holdings.
VIP Growth Portfolio

The Board reviewed the fund's relative investment performance against its peer group and noted that the performance of Initial Class of the fund was in the fourth quartile for the one- and five-year periods and the third quartile for the three-year period. The Board also noted that the investment performance of the fund was lower than its benchmark for all the periods shown. The Board considered that the variations in performance among the fund's classes reflect the variations in class expenses, which result in lower performance for higher expense classes. The Board discussed with FMR actions that have been taken by FMR to improve the fund's disappointing performance relative to its peer group and benchmark. The Board noted that this fund had underperformed in the previous year and discussed with FMR its disappointment with the continued underperformance of the fund. The Board also reviewed the fund's performance since inception as well as performance in the current year. The Board will continue to closely monitor the performance of the fund in the coming year and discuss with FMR other appropriate actions to address the performance of the fund.
Based on its review, and giving particular weight to the nature and quality of the resources dedicated by the Investment Advisers to maintain and improve relative performance and factoring in the unprecedented market events in recent years, the Board concluded that the nature, extent, and quality of investment management and support services and of shareholder and administrative services provided to the fund will benefit the fund's shareholders, particularly in light of the Board's view that the fund's shareholders benefit from investing in a fund that is part of a large family of funds offering a variety of investment disciplines and services.
Annual Report
Board Approval of Investment Advisory Contracts and Management Fees - continued
Competitiveness of Management Fee and Total Fund Expenses. The Board considered the fund's management fee and total expenses compared to "mapped groups" of competitive funds and classes. Fidelity creates "mapped groups" by combining similar Lipper investment objective categories that have comparable management fee characteristics. Combining Lipper investment objective categories aids the Board's management fee and total expense comparisons by broadening the competitive group used for comparison and by reducing the number of universes to which various Fidelity funds are compared.
Management Fee. The Board considered two proprietary management fee comparisons for the 12-month periods shown in the chart below. The group of Lipper funds used by the Board for management fee comparisons is referred to below as the "Total Mapped Group." The Total Mapped Group comparison focuses on a fund's standing relative to the total universe of comparable funds available to investors, in terms of gross management fees before expense reimbursements or caps. "TMG %" represents the percentage of funds in the Total Mapped Group that had management fees that were lower than the fund's. For example, a TMG % of 10% means that 90% of the funds in the Total Mapped Group had higher management fees than the fund. The "Asset-Size Peer Group" (ASPG) comparison focuses on a fund's standing relative to non-Fidelity funds similar in size to the fund within the Total Mapped Group. The ASPG represents at least 15% of the funds in the Total Mapped Group with comparable asset size and management fee characteristics, subject to a minimum of 50 funds (or all funds in the Total Mapped Group if fewer than 50). Additional information, such as the ASPG quartile in which the fund's management fee ranked, is also included in the chart and considered by the Board.
VIP Growth Portfolio

The Board noted that the fund's management fee ranked below the median of its Total Mapped Group and below the median of its ASPG for 2009.
Based on its review, the Board concluded that the fund's management fee is fair and reasonable in light of the services that the fund receives and the other factors considered.
Total Expenses. In its review of each class's total expenses, the Board considered the fund's management fee as well as other fund or class expenses, as applicable, such as transfer agent fees, pricing and bookkeeping fees, fund-paid 12b-1 fees, and custodial, legal, and audit fees. The Board also noted the effects of any waivers and reimbursements on fees and expenses. As part of its review, the Board also considered current and historical total expenses of each class of the fund compared to competitive fund median expenses. Each class of the fund is compared to those funds and classes in the Total Mapped Group (used by the Board for management fee comparisons) that have a similar sales load structure.
The Board noted that the total expenses of each of Initial Class, Investor Class, and Service Class ranked below its competitive median for 2009 and the total expenses of each of Service Class 2 and Service Class 2 R ranked above its competitive median for 2009. The Board noted that the fund offers multiple classes, each of which has a different 12b-1 fee structure, and that the multiple structures are intended to offer a range of pricing options for the intermediary market. The Board also noted that the total expenses of the classes vary primarily by the level of their 12b-1 fees, although differences in transfer agent fees may also cause expenses to vary from class to class.
Fees Charged to Other Fidelity Clients. The Board also considered Fidelity fee structures and other information with respect to clients of FMR and its affiliates, such as other mutual funds advised or subadvised by FMR or its affiliates, pension plan clients, and other institutional clients. In March 2010, the Board created an ad hoc joint committee with the board of other Fidelity funds (the Committee) to review and compare Fidelity's institutional investment advisory business with its business of providing services to the Fidelity funds, including the differences in services provided, fees charged, and costs incurred, as well as competition in their respective marketplaces.
Annual Report
Based on its review of total expenses and fees charged to other Fidelity clients, the Board concluded that the total expenses of each class of the fund were reasonable, although in some cases above the median of the universe presented for comparison, in light of the services that the fund and its shareholders receive and the other factors considered, including the findings of the Committee.
Costs of the Services and Profitability. The Board considered the revenues earned and the expenses incurred by Fidelity in conducting the business of developing, marketing, distributing, managing, administering and servicing the fund and its shareholders. The Board also considered the level of Fidelity's profits in respect of all the Fidelity funds.
On an annual basis, FMR presents to the Board Fidelity's profitability for the fund. Fidelity calculates the profitability for each fund, as well as aggregate profitability for groups of Fidelity funds and all Fidelity funds, using a series of detailed revenue and cost allocation methodologies which originate with the audited books and records of Fidelity. The Audit Committee of the Board reviews any significant changes from the prior year's methodologies.
PricewaterhouseCoopers LLP (PwC), independent registered public accounting firm and auditor to Fidelity and certain Fidelity funds, has been engaged annually by the Board as part of the Board's assessment of Fidelity's profitability analysis. PwC's engagement includes the review and assessment of Fidelity's methodologies used in determining the revenues and expenses attributable to Fidelity's mutual fund business, and completion of agreed-upon procedures surrounding the mathematical accuracy of fund profitability and its conformity to allocation methodologies. After considering PwC's reports issued under the engagement and information provided by Fidelity, the Board believes that while other allocation methods may also be reasonable, Fidelity's profitability methodologies are reasonable in all material respects.
The Board has also reviewed Fidelity's non-fund businesses and fall-out benefits related to the mutual fund business as well as cases where Fidelity's affiliates may benefit from or be related to the fund's business.
The Board considered the costs of the services provided by and the profits realized by Fidelity in connection with the operation of the fund and were satisfied that the profitability was not excessive in the circumstances.
Economies of Scale. The Board considered whether there have been economies of scale in respect of the management of the Fidelity funds, whether the Fidelity funds (including the fund) have appropriately benefited from any such economies of scale, and whether there is potential for realization of any further economies of scale. The Board considered the extent to which the fund will benefit from economies of scale through increased services to the fund, through waivers or reimbursements, or through fee or expense reductions.
In February 2009, the Board and the board of other Fidelity funds created an ad hoc committee (the Economies of Scale Committee) to analyze whether FMR attains economies of scale in respect of the management and servicing of the Fidelity funds, whether the Fidelity funds have appropriately benefited from such economies of scale, and whether there is potential for realization of any further economies of scale.
The Board recognized that the fund's management contract incorporates a "group fee" structure, which provides for lower group fee rates as total fund assets under FMR's management increase, and for higher group fee rates as total fund assets under FMR's management decrease. FMR calculates the group fee rates based on a tiered asset "breakpoint" schedule that varies based on asset class. The Board considered that the group fee is designed to deliver the benefits of economies of scale to fund shareholders when total Fidelity fund assets increase, even if assets of any particular fund are unchanged or have declined, because some portion of Fidelity's costs are attributable to services provided to all Fidelity funds, and all funds benefit if those costs can be allocated among more assets. The Board concluded that, given the group fee structure, fund shareholders will benefit from lower management fees as assets under FMR's management increase at the fund complex level, regardless of whether Fidelity achieves any such economies of scale.
The Board concluded, considering the findings of the Economies of Scale Committee, that any potential economies of scale are being appropriately shared between fund shareholders and Fidelity.
Additional Information Requested by the Board. In order to develop fully the factual basis for consideration of the Fidelity funds' Advisory Contracts, the Board requested and received additional information on certain topics, including (i) fund performance trends, actions to be taken by FMR to improve certain funds' overall performance, and Fidelity's long-term strategies for certain funds; (ii) portfolio manager changes that have occurred during the past year and length of portfolio manager tenure for different categories of funds over time; (iii) Fidelity's compensation structure for portfolio managers, research analysts, and other key personnel, the rationale for the compensation structure, and how the compensation structure provides appropriate performance incentives; (iv) the amount of the investment that each portfolio manager has made in the Fidelity fund(s) that he or she manages; (v) management and other fees paid by FMR to affiliated sub-advisers on behalf of the Fidelity funds; (vi) Fidelity's fee structures and rationale for recommending different fees among different categories of funds; (vii) Fidelity's rationale for recommending which funds should have a performance adjustment component as part of their management fees; (viii) the rationale for any differences between fund fee structures and fee structures in place for other Fidelity clients; and (ix) explanations regarding the relative total expenses borne by certain funds and classes, total expense competitive trends, and actions that might be taken by FMR to reduce total expenses for certain funds and classes.
Annual Report
Board Approval of Investment Advisory Contracts and Management Fees - continued
Based on its evaluation of all of the conclusions noted above, and after considering all factors it believed relevant, the Board ultimately concluded that the advisory fee structures are fair and reasonable, and that the fund's Advisory Contracts should be renewed.
Annual Report
Investment Adviser
Fidelity Management & Research Company
Boston, MA
Investment Sub-Adviser
FMR Co., Inc.
Fidelity Management & Research (U.K.) Inc.
Fidelity Management & Research (Hong Kong) Limited
Fidelity Management & Research (Japan) Inc.
General Distributor
Fidelity Distributors Corporation
Boston, MA
Transfer and Service Agents
Fidelity Investments Institutional Operations Company, Inc.
Boston, MA
Fidelity Service Company, Inc.
Boston, MA
Custodian
The Bank of New York Mellon
New York, NY
VIPGRWTR-ANN-0211
1.811845.106
Fidelity® Variable Insurance Products:
High Income Portfolio
Annual Report
December 31, 2010
(2_fidelity_logos) (Registered_Trademark)
Contents
Performance | <Click Here> | How the fund has done over time. |
Management's Discussion of Fund Performance | <Click Here> | The Portfolio Manager's review of fund performance and strategy. |
Shareholder Expense Example | <Click Here> | An example of shareholder expenses. |
Investment Changes | <Click Here> | A summary of major shifts in the fund's investments over the past six months. |
Investments | <Click Here> | A complete list of the fund's investments with their market values. |
Financial Statements | <Click Here> | Statements of assets and liabilities, operations, and changes in net assets, as well as financial highlights. |
Notes | <Click Here> | Notes to the financial statements. |
Report of Independent Registered Public Accounting Firm | <Click Here> | |
Trustees and Officers | <Click Here> | |
Board Approval of Investment Advisory Contracts and Management Fees | <Click Here> | |
To view a fund's proxy voting guidelines and proxy voting record for the 12-month period ended June 30, visit http://www.fidelity.com/proxyvotingresults or visit the Securities and Exchange Commission's (SEC) web site at http://www.sec.gov. You may also call 1-877-208-0098 to request a free copy of the proxy voting guidelines.
Fidelity Variable Insurance Products are separate account options which are purchased through a variable insurance contract.
Standard & Poor's, S&P and S&P 500 are registered service marks of The McGraw-Hill Companies, Inc. and have been licensed for use by Fidelity Distributors Corporation.
Other third party marks appearing herein are the property of their respective owners.
All other marks appearing herein are registered or unregistered trademarks or service marks of FMR LLC or an affiliated company.
The general research services agreement with Fidelity Research & Analysis Company has been terminated and is no longer in effect for the fund.
This report and the financial statements contained herein are submitted for the general information of the shareholders of the fund. This report is not authorized for distribution to prospective investors in the fund unless preceded or accompanied by an effective prospectus.
A fund files its complete schedule of portfolio holdings with the SEC for the first and third quarters of each fiscal year on Form N-Q. Forms N-Q are available on the SEC's web site at http://www.sec.gov. A fund's Forms N-Q may be reviewed and copied at the SEC's Public Reference Room in Washington, DC. Information regarding the operation of the SEC's Public Reference Room may be obtained by calling 1-800-SEC-0330. For a complete list of a fund's portfolio holdings, view the most recent holdings listing, semiannual report, or annual report on Fidelity's web site at http://www.fidelity.com, http://www.advisor.fidelity.com, or http://www.401k.com, as applicable.
NOT FDIC INSURED • MAY LOSE VALUE • NO BANK GUARANTEE
Neither the fund nor Fidelity Distributors Corporation is a bank.
Annual Report
Average annual total return reflects the change in the value of an investment, assuming reinvestment of the class' distributions from dividend income and capital gains (the profits earned upon the sale of securities that have grown in value, if any) and assuming a constant rate of performance each year. During periods of reimbursement by Fidelity, a fund's total return will be greater than it would be had the reimbursement not occurred. Performance numbers are net of all underlying fund operating expenses, but do not include any insurance charges imposed by your insurance company's separate account. If performance information included the effect of these additional charges, the total returns would be lower. How a fund did yesterday is no guarantee of how it will do tomorrow.
Average Annual Total Returns
Periods ended December 31, 2010 | Past 1
year | Past 5
years | Past 10
years |
VIP High Income Portfolio - Initial Class | 13.82% | 7.04% | 6.28% |
VIP High Income Portfolio - Service Class | 13.79% | 6.95% | 6.17% |
VIP High Income Portfolio - Service Class 2 | 13.67% | 6.80% | 6.02% |
VIP High Income Portfolio - Investor Class A | 14.04% | 7.02% | 6.25% |
A The initial offering of Investor Class shares took place on July 21, 2005. Returns prior to July 21, 2005 are those of Initial Class. Had Investor Class's transfer agent fee been reflected, returns prior to July 21, 2005 would have been lower.
$10,000 Over 10 Years
Let's say hypothetically that $10,000 was invested in VIP High Income Portfolio - Initial Class on December 31, 2000. The chart shows how the value of your investment would have changed, and also shows how The BofA Merrill LynchSM US High Yield Constrained Index performed over the same period.
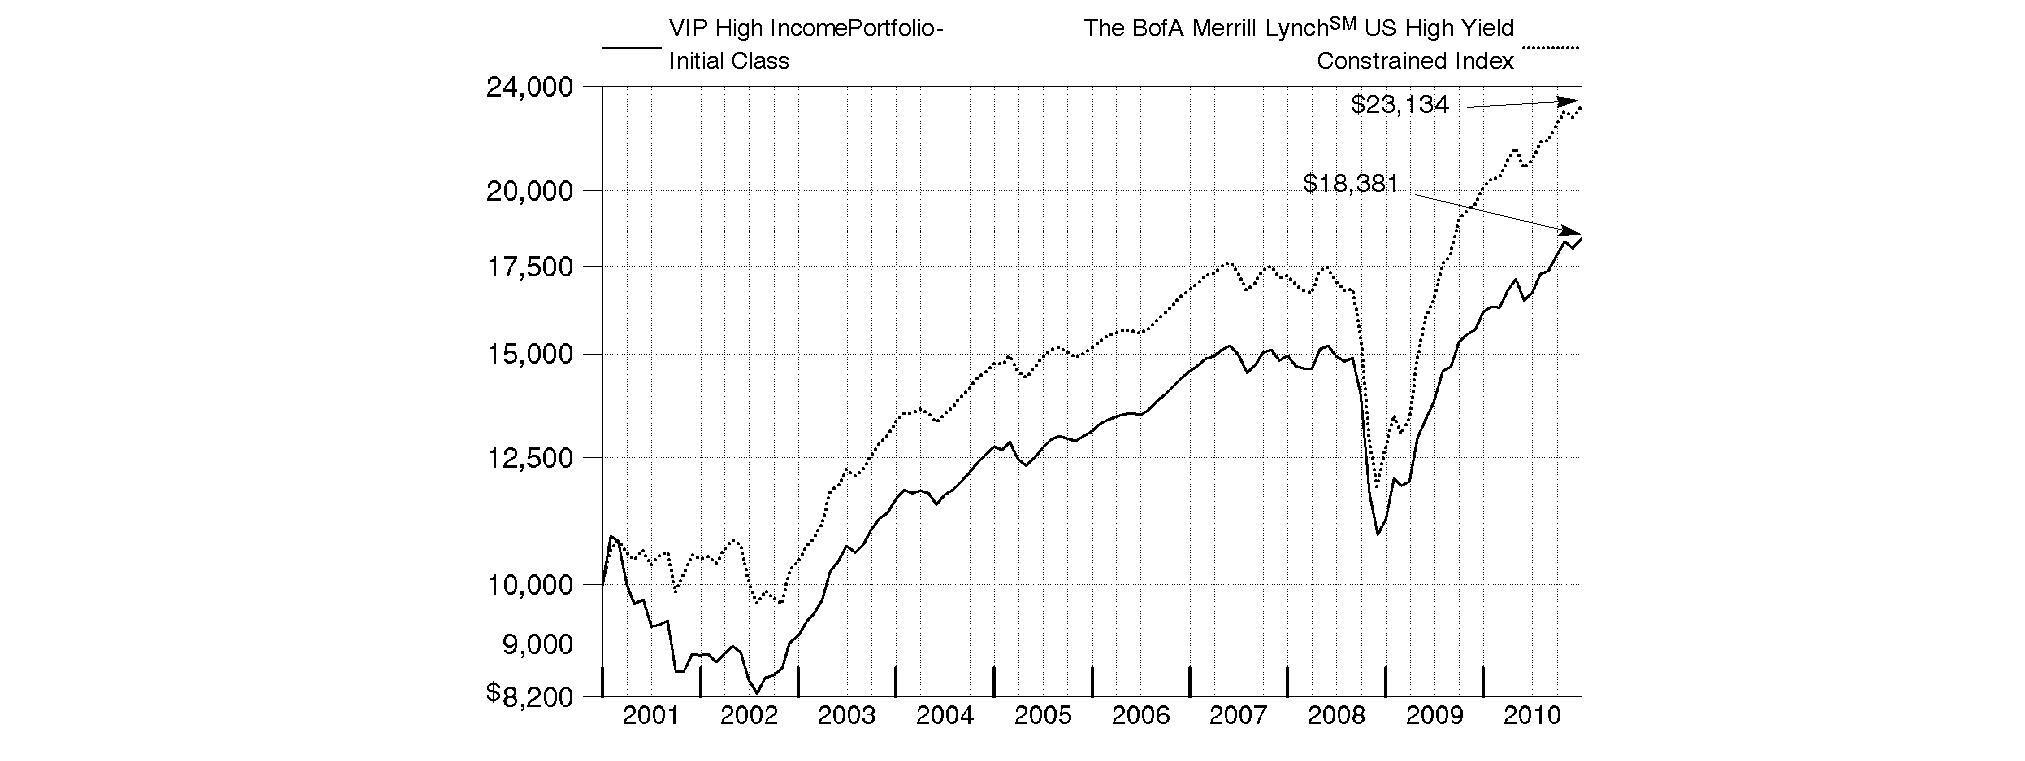
Annual Report
Market Recap: While market improvements around the world hit a speed bump in the first half of the 12-month period ending December 31, 2010, world economies re-accelerated in August, supported by a broadening recovery and low inflation in the U.S. Domestic stock markets recorded solid gains for the year, lifted by a strong second-half rally fueled by economic optimism, encouraging earnings reports and a wave of corporate mergers. The large-cap S&P 500® Index rose 15.06%, the blue-chip-laden Dow Jones Industrial AverageSM added 14.06% and the technology-heavy Nasdaq Composite® Index climbed 18.02%. Meanwhile, international stocks, as represented by the MSCI® ACWI® (All Country World Index) ex USA Index, gained 11.29%, boosted in part by a depreciating U.S. dollar. In the fixed-income arena, U.S. taxable investment-grade bonds generated positive results during 2010, as the Barclays Capital® U.S. Aggregate Bond Index gained 6.54%. With ultra-low interest rates bolstering nearly all fixed-income securities for most of the year, sectors in the index with higher yields and more credit risk generally fared best, while most high-quality bonds generated more-moderate returns. Meanwhile, high-yield bonds, as represented by The BofA Merrill LynchSM US High Yield Constrained Index, returned 15.07%, a result of improved economic data and strengthening investor demand. Overseas, foreign bond markets showed mixed results, with a sizable disparity between the 3.97% return of the Citigroup® Non-U.S. Group of 7 Index - which measures the performance of sovereign debt of the major global economies outside the U.S. - and the 12.04% advance of the JPMorgan Emerging Markets Bond Index Global (EMBI Global), which benefited from the rising overall credit quality of emerging-markets debt issuers.
Comments from Matthew Conti, Portfolio Manager of VIP High Income Portfolio: For the year ending December 31, 2010, the fund's share classes underperformed The BofA Merrill LynchSM US High Yield Constrained Index, which returned 15.07%. (For specific portfolio results, please refer to the performance section of this report.) The fund's relative performance was hurt by its focus on the core, middle-quality tier of the high-yield market, which underperformed the more-speculative, lower-rated credits that significantly outpaced the broader market. At the industry level, the fund's result was held back by underweighting insurance and unfavorable security selection in energy. The fund's modest cash position also was a negative amid a strong market. Individual detractors included untimely ownership of and an underweighting in insurance giant American International Group (AIG), an investment in energy exploration and production company ATP Oil & Gas - not held at period end - not owning real estate financing firm iStar Financial, underweighting casino operator Harrah's and a stake in supermarket chain The Great Atlantic & Pacific Tea Company. Conversely, the fund benefited from strong security selection in utilities - although this benefit was slightly offset by overweighting the group - and by favorable positioning within air transportation. On an issuer basis, contributions came from Texas utility TXU Energy, casino operator Snoqualmie Entertainment Authority, Freescale Semiconductor and Continental Airlines. Some of the securities I've mentioned were not held at period end.
The views expressed above reflect those of the portfolio manager(s) only through the end of the period as stated on the cover of this report and do not necessarily represent the views of Fidelity or any other person in the Fidelity organization. Any such views are subject to change at any time based upon market or other conditions and Fidelity disclaims any responsibility to update such views. These views may not be relied on as investment advice and, because investment decisions for a Fidelity fund are based on numerous factors, may not be relied on as an indication of trading intent on behalf of any Fidelity fund.
Annual Report
As a shareholder of the Fund, you incur two types of costs: (1) transaction costs, including redemption fees, and (2) ongoing costs, including management fees, distribution and/or service (12b-1) fees and other Fund expenses. This Example is intended to help you understand your ongoing costs (in dollars) of investing in the Fund and to compare these costs with the ongoing costs of investing in other mutual funds.
The Example is based on an investment of $1,000 invested at the beginning of the period and held for the entire period (July 1, 2010 to December 31, 2010).
Actual Expenses
The first line of the accompanying table for each class of the Fund provides information about actual account values and actual expenses. You may use the information in this line, together with the amount you invested, to estimate the expenses that you paid over the period. Simply divide your account value by $1,000.00 (for example, an $8,600 account value divided by $1,000.00 = 8.6), then multiply the result by the number in the first line for a class of the Fund under the heading entitled "Expenses Paid During Period" to estimate the expenses you paid on your account during this period. The estimate of expenses does not include any fees or other expenses of any variable annuity or variable life insurance product. If they were, the estimate of expenses you paid during the period would be higher, and your ending account value would be lower. In addition, the Fund, as a shareholder in the underlying Fidelity Central Funds, will indirectly bear its pro-rata share of the fees and expenses incurred by the underlying Fidelity Central Funds. These fees and expenses are not included in the Fund's annualized expense ratio used to calculate the expense estimate in the table below.
Hypothetical Example for Comparison Purposes
The second line of the accompanying table for each class of the Fund provides information about hypothetical account values and hypothetical expenses based on a Class' actual expense ratio and an assumed rate of return of 5% per year before expenses, which is not the Class' actual return. The hypothetical account values and expenses may not be used to estimate the actual ending account balance or expenses you paid for the period. You may use this information to compare the ongoing costs of investing in the Fund and other funds. To do so, compare this 5% hypothetical example with the 5% hypothetical examples that appear in the shareholder reports of the other funds. The estimate of expenses does not include any fees or other expenses of any variable annuity or variable life insurance product. If they were, the estimate of expenses you paid during the period would be higher, and your ending account value would be lower. In addition, the Fund, as a shareholder in the underlying Fidelity Central Funds, will indirectly bear its pro-rata share of the fees and expenses incurred by the underlying Fidelity Central Funds. These fees and expenses are not included in the Fund's annualized expense ratio used to calculate the expense estimate in the table below.
Please note that the expenses shown in the table are meant to highlight your ongoing costs only and do not reflect any transaction costs. Therefore, the second line of the table is useful in comparing ongoing costs only, and will not help you determine the relative total costs of owning different funds. In addition, if these transactional costs were included, your costs would have been higher.
| Annualized
Expense
Ratio | Beginning
Account Value
July 1, 2010 | Ending
Account Value
December 31, 2010 | Expenses Paid
During Period*
July 1, 2010 to December 31, 2010 |
Initial Class | .67% | | | |
Actual | | $ 1,000.00 | $ 1,100.80 | $ 3.55 |
HypotheticalA | | $ 1,000.00 | $ 1,021.83 | $ 3.41 |
Service Class | .77% | | | |
Actual | | $ 1,000.00 | $ 1,100.20 | $ 4.08 |
HypotheticalA | | $ 1,000.00 | $ 1,021.32 | $ 3.92 |
Service Class 2 | .92% | | | |
Actual | | $ 1,000.00 | $ 1,100.60 | $ 4.87 |
HypotheticalA | | $ 1,000.00 | $ 1,020.57 | $ 4.69 |
Initial Class R | .67% | | | |
Actual | | $ 1,000.00 | $ 1,101.10 | $ 3.55 |
HypotheticalA | | $ 1,000.00 | $ 1,021.83 | $ 3.41 |
Service Class R | .77% | | | |
Actual | | $ 1,000.00 | $ 1,101.00 | $ 4.08 |
HypotheticalA | | $ 1,000.00 | $ 1,021.32 | $ 3.92 |
Service Class 2R | .92% | | | |
Actual | | $ 1,000.00 | $ 1,099.60 | $ 4.87 |
HypotheticalA | | $ 1,000.00 | $ 1,020.57 | $ 4.69 |
Investor Class | .71% | | | |
Actual | | $ 1,000.00 | $ 1,102.80 | $ 3.76 |
HypotheticalA | | $ 1,000.00 | $ 1,021.63 | $ 3.62 |
A 5% return per year before expenses
* Expenses are equal to each Class' annualized expense ratio, multiplied by the average account value over the period, multiplied by 184/365 (to reflect the one-half year period).
Annual Report
Investment Changes (Unaudited)
Top Five Holdings as of December 31, 2010 |
(by issuer, excluding cash equivalents) | % of fund's
net assets | % of fund's net assets
6 months ago |
International Lease Finance Corp. | 2.3 | 1.4 |
HCA, Inc. | 2.2 | 2.5 |
CIT Group, Inc. | 1.9 | 1.3 |
Ford Motor Credit Co. LLC | 1.8 | 1.4 |
Nielsen Finance LLC/Nielsen Finance Co. | 1.7 | 2.0 |
| 9.9 | |
Top Five Market Sectors as of December 31, 2010 |
| % of fund's
net assets | % of fund's net assets
6 months ago |
Telecommunications | 12.2 | 15.0 |
Electric Utilities | 6.6 | 6.2 |
Energy | 6.5 | 7.8 |
Diversified Financial Services | 6.2 | 6.5 |
Technology | 6.1 | 5.4 |
Quality Diversification (% of fund's net assets) |
As of December 31, 2010 | As of June 30, 2010 |
 | BBB 3.2% | | | BBB 2.2% | |
 | BB 26.6% | | | BB 28.5% | |
 | B 48.4% | | | B 46.7% | |
 | CCC,CC,C 11.9% | | | CCC,CC,C 14.8% | |
 | Not Rated 1.6% | | | Not Rated 2.7% | |
 | Equities 0.8% | | | Equities 0.5% | |
 | Short-Term
Investments and
Net Other Assets 7.5% | | | Short-Term
Investments and
Net Other Assets 4.6% | |

We have used ratings from Moody's Investors Service, Inc. Where Moody's® ratings are not available, we have used S&P® ratings. All ratings are as of the report date and do not reflect subsequent changes. |
Asset Allocation (% of fund's net assets) |
As of December 31, 2010 * | As of June 30, 2010 ** |
| Nonconvertible
Bonds 86.0% | | | Nonconvertible
Bonds 88.4% | |
| Convertible Bonds, Preferred Stocks 1.2% | | | Convertible Bonds, Preferred Stocks 0.9% | |
| Common Stocks 0.0% | | | Common Stocks 0.1% | |
 | Floating Rate Loans 5.3% | | | Floating Rate Loans 6.0% | |
| Short-Term
Investments and
Net Other Assets 7.5% | | | Short-Term
Investments and
Net Other Assets 4.6% | |
* Foreign investments | 16.5% | | ** Foreign investments | 17.2% | |

Annual Report
Investments December 31, 2010
Showing Percentage of Net Assets
Corporate Bonds - 86.4% |
| Principal Amount | | Value |
Convertible Bonds - 0.4% |
Metals/Mining - 0.2% |
Massey Energy Co. 3.25% 8/1/15 | | $ 2,230,000 | | $ 2,180,940 |
Technology - 0.2% |
Lucent Technologies, Inc. 2.875% 6/15/25 | | 2,902,600 | | 2,759,284 |
TOTAL CONVERTIBLE BONDS | | 4,940,224 |
Nonconvertible Bonds - 86.0% |
Aerospace - 1.1% |
Alliant Techsystems, Inc. 6.875% 9/15/20 | | 2,075,000 | | 2,132,063 |
BE Aerospace, Inc.: | | | | |
6.875% 10/1/20 | | 1,375,000 | | 1,416,250 |
8.5% 7/1/18 | | 3,730,000 | | 4,084,350 |
Esterline Technologies Corp. 7% 8/1/20 (e) | | 2,015,000 | | 2,075,450 |
TransDigm, Inc. 7.75% 12/15/18 (e) | | 3,580,000 | | 3,705,300 |
| | 13,413,413 |
Air Transportation - 2.8% |
Air Canada 9.25% 8/1/15 (e) | | 5,145,000 | | 5,402,250 |
American Airlines, Inc. 10.5% 10/15/12 | | 1,990,000 | | 2,179,050 |
American Airlines, Inc. pass-thru trust certificates: | | | | |
8.608% 10/1/12 | | 535,000 | | 537,675 |
10.375% 7/2/19 | | 1,864,012 | | 2,199,534 |
AMR Corp. 9% 8/1/12 | | 1,980,000 | | 1,999,800 |
Continental Airlines, Inc.: | | | | |
pass-thru trust certificates 9.798% 4/1/21 | | 3,640,625 | | 3,695,235 |
6.75% 9/15/15 (e) | | 4,090,000 | | 4,197,158 |
Continental Airlines, Inc. 9.25% 5/10/17 | | 1,021,101 | | 1,084,919 |
Delta Air Lines, Inc. pass-thru trust certificates: | | | | |
8.021% 8/10/22 | | 2,129,172 | | 2,214,339 |
8.954% 8/10/14 | | 1,809,098 | | 1,890,508 |
Northwest Airlines, Inc. pass-thru trust certificates 8.028% 11/1/17 | | 831,198 | | 822,886 |
United Air Lines, Inc.: | | | | |
9.875% 8/1/13 (e) | | 795,000 | | 856,613 |
12% 11/1/13 (e) | | 1,005,000 | | 1,108,013 |
United Air Lines, Inc. pass-thru trust certificates: | | | | |
Class B, 7.336% 7/2/19 | | 2,765,445 | | 2,682,482 |
9.75% 1/15/17 | | 2,326,969 | | 2,681,832 |
12% 1/15/16 (e) | | 848,353 | | 965,002 |
| | 34,517,296 |
|
| Principal Amount | | Value |
Automotive - 3.2% |
Accuride Corp. 9.5% 8/1/18 (e) | | $ 2,710,000 | | $ 2,940,350 |
American Axle & Manufacturing, Inc. 7.875% 3/1/17 | | 2,470,000 | | 2,544,100 |
ArvinMeritor, Inc.: | | | | |
8.125% 9/15/15 | | 3,250,000 | | 3,400,313 |
10.625% 3/15/18 | | 710,000 | | 796,975 |
Ford Motor Credit Co. LLC: | | | | |
5.625% 9/15/15 | | 3,510,000 | | 3,632,850 |
6.625% 8/15/17 | | 3,200,000 | | 3,352,000 |
7% 4/15/15 | | 2,250,000 | | 2,413,125 |
8% 6/1/14 | | 1,840,000 | | 1,996,400 |
8% 12/15/16 | | 4,870,000 | | 5,442,025 |
12% 5/15/15 | | 3,495,000 | | 4,351,275 |
Navistar International Corp. 8.25% 11/1/21 | | 4,720,000 | | 5,097,600 |
Tenneco, Inc.: | | | | |
6.875% 12/15/20 (e) | | 1,930,000 | | 1,949,300 |
7.75% 8/15/18 (e) | | 1,685,000 | | 1,781,888 |
| | 39,698,201 |
Banks & Thrifts - 5.0% |
Ally Financial, Inc.: | | | | |
6.25% 12/1/17 (e) | | 3,650,000 | | 3,631,750 |
7.5% 9/15/20 (e) | | 3,190,000 | | 3,349,500 |
8% 3/15/20 | | 7,970,000 | | 8,567,750 |
Bank of America Corp.: | | | | |
8% (f) | | 995,000 | | 995,000 |
8.125% (f) | | 1,320,000 | | 1,326,600 |
CIT Group, Inc.: | | | | |
7% 5/1/13 | | 372,017 | | 378,992 |
7% 5/1/14 | | 4,583,026 | | 4,617,399 |
7% 5/1/15 | | 5,468,026 | | 5,481,696 |
7% 5/1/16 | | 6,410,044 | | 6,410,044 |
7% 5/1/17 | | 7,557,062 | | 7,547,616 |
Fifth Third Capital Trust IV 6.5% 4/15/67 (f) | | 2,850,000 | | 2,707,500 |
General Motors Acceptance Corp. 6.875% 8/28/12 | | 4,155,000 | | 4,347,377 |
GMAC LLC: | | | | |
6.75% 12/1/14 | | 4,400,000 | | 4,598,000 |
8% 12/31/18 | | 2,415,000 | | 2,547,825 |
8% 11/1/31 | | 2,275,000 | | 2,422,875 |
Zions Bancorp. 7.75% 9/23/14 | | 3,225,000 | | 3,362,095 |
| | 62,292,019 |
Broadcasting - 1.9% |
Allbritton Communications Co. 8% 5/15/18 | | 2,205,000 | | 2,227,050 |
Belo Corp. 8% 11/15/16 | | 2,190,000 | | 2,370,675 |
Citadel Broadcasting Corp. 7.75% 12/15/18 (e) | | 2,920,000 | | 3,000,300 |
Clear Channel Communications, Inc.: | | | | |
5.5% 9/15/14 | | 2,775,000 | | 2,303,250 |
Corporate Bonds - continued |
| Principal Amount | | Value |
Nonconvertible Bonds - continued |
Broadcasting - continued |
Clear Channel Communications, Inc.: - continued | | | | |
11% 8/1/16 pay-in-kind (f) | | $ 1,758,662 | | $ 1,530,036 |
Nexstar Broadcasting, Inc./Mission, Inc. 8.875% 4/15/17 (e) | | 2,390,000 | | 2,533,400 |
Umbrella Acquisition, Inc. 10.5% 3/15/15 pay-in-kind (e)(f) | | 4,401,126 | | 4,614,581 |
Univision Communications, Inc.: | | | | |
7.875% 11/1/20 (e) | | 1,180,000 | | 1,239,000 |
8.5% 5/15/21 (e) | | 3,630,000 | | 3,693,525 |
| | 23,511,817 |
Building Materials - 0.2% |
Building Materials Corp. of America 6.875% 8/15/18 (e) | | 3,080,000 | | 3,049,200 |
Cable TV - 2.9% |
Bresnan Broadband Holdings LLC 8% 12/15/18 (e) | | 705,000 | | 724,388 |
Cablevision Systems Corp.: | | | | |
7.75% 4/15/18 | | 1,635,000 | | 1,712,663 |
8.625% 9/15/17 | | 4,525,000 | | 4,909,625 |
CCO Holdings LLC/CCO Holdings Capital Corp.: | | | | |
7.25% 10/30/17 | | 3,770,000 | | 3,817,125 |
7.875% 4/30/18 | | 985,000 | | 1,017,013 |
Cequel Communications Holdings I LLC/Cequel Capital Corp. 8.625% 11/15/17 (e) | | 7,435,000 | | 7,843,925 |
CSC Holdings LLC: | | | | |
8.5% 6/15/15 | | 1,655,000 | | 1,795,675 |
8.625% 2/15/19 | | 1,940,000 | | 2,192,200 |
Insight Communications, Inc. 9.375% 7/15/18 (e) | | 4,355,000 | | 4,659,850 |
Kabel Deutschland GmbH 10.625% 7/1/14 | | 1,300,000 | | 1,371,500 |
UPC Germany GmbH 8.125% 12/1/17 (e) | | 2,880,000 | | 3,038,400 |
Videotron Ltd. 9.125% 4/15/18 | | 2,010,000 | | 2,251,200 |
| | 35,333,564 |
Capital Goods - 0.9% |
Amsted Industries, Inc. 8.125% 3/15/18 (e) | | 3,960,000 | | 4,158,000 |
Briggs & Stratton Corp. 6.875% 12/15/20 | | 735,000 | | 747,863 |
RBS Global, Inc./Rexnord Corp. 8.5% 5/1/18 | | 1,470,000 | | 1,543,500 |
SPX Corp. 6.875% 9/1/17 (e) | | 3,935,000 | | 4,180,938 |
| | 10,630,301 |
Chemicals - 2.7% |
Celanese US Holdings LLC 6.625% 10/15/18 (e) | | 1,460,000 | | 1,514,750 |
|
| Principal Amount | | Value |
Huntsman International LLC: | | | | |
5.5% 6/30/16 | | $ 3,245,000 | | $ 3,147,650 |
8.625% 3/15/20 | | 715,000 | | 777,563 |
8.625% 3/15/21 (e) | | 3,275,000 | | 3,520,625 |
LBI Escrow Corp. 8% 11/1/17 (e) | | 2,625,000 | | 2,900,625 |
Lyondell Chemical Co. 11% 5/1/18 | | 7,280,000 | | 8,244,600 |
Nalco Co. 6.625% 1/15/19 (e) | | 1,965,000 | | 2,019,038 |
NOVA Chemicals Corp.: | | | | |
3.5678% 11/15/13 (f) | | 5,325,000 | | 5,231,813 |
8.375% 11/1/16 | | 1,990,000 | | 2,119,350 |
8.625% 11/1/19 | | 1,985,000 | | 2,168,613 |
Rain CII Carbon LLC/CII Carbon Corp. 8% 12/1/18 (e) | | 1,100,000 | | 1,144,000 |
| | 32,788,627 |
Consumer Products - 0.1% |
Jarden Corp. 6.125% 11/15/22 | | 1,035,000 | | 988,425 |
Containers - 0.7% |
Berry Plastics Corp.: | | | | |
5.0391% 2/15/15 (f) | | 1,980,000 | | 1,905,750 |
8.25% 11/15/15 | | 2,715,000 | | 2,830,388 |
Crown Cork & Seal, Inc. 7.375% 12/15/26 | | 3,648,000 | | 3,620,640 |
| | 8,356,778 |
Diversified Financial Services - 5.9% |
Icahn Enterprises LP/Icahn Enterprises Finance Corp.: | | | | |
7.75% 1/15/16 | | 4,405,000 | | 4,427,025 |
7.75% 1/15/16 (e) | | 2,000,000 | | 2,010,000 |
8% 1/15/18 | | 4,925,000 | | 4,949,625 |
8% 1/15/18 (e) | | 2,000,000 | | 2,010,000 |
ILFC E-Capital Trust II 6.25% 12/21/65 (e)(f) | | 1,275,000 | | 969,000 |
Ineos Finance PLC 9% 5/15/15 (e) | | 2,505,000 | | 2,661,563 |
International Lease Finance Corp.: | | | | |
5.625% 9/20/13 | | 1,530,000 | | 1,537,650 |
5.65% 6/1/14 | | 1,315,000 | | 1,305,138 |
6.375% 3/25/13 | | 360,000 | | 369,000 |
6.5% 9/1/14 (e) | | 1,995,000 | | 2,089,763 |
6.625% 11/15/13 | | 1,640,000 | | 1,674,850 |
6.75% 9/1/16 (e) | | 1,995,000 | | 2,089,763 |
8.25% 12/15/20 | | 1,190,000 | | 1,213,800 |
8.625% 9/15/15 (e) | | 5,070,000 | | 5,374,200 |
8.75% 3/15/17 (e) | | 7,300,000 | | 7,756,250 |
8.875% 9/1/17 | | 5,995,000 | | 6,414,650 |
National Money Mart Co. 10.375% 12/15/16 | | 3,010,000 | | 3,265,850 |
Nuveen Investments, Inc.: | | | | |
5.5% 9/15/15 | | 2,450,000 | | 2,100,875 |
10.5% 11/15/15 | | 1,850,000 | | 1,887,000 |
Offshore Group Investment Ltd. 11.5% 8/1/15 (e) | | 3,820,000 | | 4,087,400 |
Corporate Bonds - continued |
| Principal Amount | | Value |
Nonconvertible Bonds - continued |
Diversified Financial Services - continued |
Reliance Intermediate Holdings LP 9.5% 12/15/19 (e) | | $ 3,055,000 | | $ 3,207,750 |
SLM Corp. 8% 3/25/20 | | 5,650,000 | | 5,706,500 |
Trans Union LLC/Trans Union Financing Corp. 11.375% 6/15/18 (e) | | 4,125,000 | | 4,681,875 |
| | 71,789,527 |
Diversified Media - 3.1% |
Catalina Marketing Corp. 10.5% 10/1/15 pay-in-kind (e)(f) | | 3,415,000 | | 3,654,050 |
Checkout Holding Corp. 0% 11/15/15 (e) | | 1,065,000 | | 653,591 |
Clear Channel Worldwide Holdings, Inc.: | | | | |
Series A, 9.25% 12/15/17 | | 560,000 | | 609,000 |
Series B, 9.25% 12/15/17 | | 3,780,000 | | 4,139,100 |
Liberty Media Corp. 8.25% 2/1/30 | | 255,000 | | 247,350 |
Nielsen Finance LLC/Nielsen Finance Co.: | | | | |
0% 8/1/16 (d) | | 9,400,000 | | 9,823,000 |
7.75% 10/15/18 (e) | | 5,240,000 | | 5,410,300 |
11.5% 5/1/16 | | 2,275,000 | | 2,610,563 |
11.625% 2/1/14 | | 2,390,000 | | 2,742,525 |
Quebecor Media, Inc.: | | | | |
7.75% 3/15/16 | | 3,905,000 | | 4,022,150 |
7.75% 3/15/16 | | 3,585,000 | | 3,692,550 |
| | 37,604,179 |
Electric Utilities - 5.5% |
AES Corp.: | | | | |
7.75% 10/15/15 | | 3,745,000 | | 3,979,063 |
8% 10/15/17 | | 2,060,000 | | 2,163,000 |
9.75% 4/15/16 | | 3,010,000 | | 3,363,675 |
Calpine Construction Finance Co. LP 8% 6/1/16 (e) | | 5,775,000 | | 6,107,063 |
Dynegy Holdings, Inc. 7.5% 6/1/15 | | 3,190,000 | | 2,408,450 |
GenOn Escrow Corp.: | | | | |
9.5% 10/15/18 (e) | | 2,075,000 | | 2,064,625 |
9.875% 10/15/20 (e) | | 2,005,000 | | 2,005,000 |
Intergen NV 9% 6/30/17 (e) | | 4,225,000 | | 4,478,500 |
Mirant Americas Generation LLC: | | | | |
8.5% 10/1/21 | | 5,990,000 | | 6,019,950 |
9.125% 5/1/31 | | 5,640,000 | | 5,555,400 |
NRG Energy, Inc. 7.375% 2/1/16 | | 3,710,000 | | 3,784,200 |
NSG Holdings II, LLC 7.75% 12/15/25 (e) | | 10,695,000 | | 9,946,350 |
NV Energy, Inc. 6.25% 11/15/20 | | 2,995,000 | | 2,950,075 |
Otter Tail Corp. 9% 12/15/16 | | 2,460,000 | | 2,681,400 |
|
| Principal Amount | | Value |
Puget Energy, Inc. 6.5% 12/15/20 (e) | | $ 2,930,000 | | $ 2,941,134 |
RRI Energy, Inc. 7.625% 6/15/14 | | 6,280,000 | | 6,421,300 |
| | 66,869,185 |
Energy - 6.5% |
Antero Resources Finance Corp. 9.375% 12/1/17 | | 3,240,000 | | 3,389,688 |
Calfrac Holdings LP 7.5% 12/1/20 (e) | | 1,185,000 | | 1,199,813 |
Continental Resources, Inc. 7.125% 4/1/21 (e) | | 1,210,000 | | 1,258,400 |
Crosstex Energy/Crosstex Energy Finance Corp. 8.875% 2/15/18 | | 3,745,000 | | 3,932,250 |
Drummond Co., Inc. 7.375% 2/15/16 | | 5,510,000 | | 5,675,300 |
Edgen Murray Corp. 12.25% 1/15/15 | | 3,995,000 | | 3,495,625 |
Energy Transfer Equity LP 7.5% 10/15/20 | | 2,655,000 | | 2,747,925 |
Expro Finance Luxembourg SCA 8.5% 12/15/16 (e) | | 4,205,000 | | 4,026,288 |
Exterran Holdings, Inc. 7.25% 12/1/18 (e) | | 2,985,000 | | 2,955,150 |
Frontier Oil Corp.: | | | | |
6.875% 11/15/18 | | 1,245,000 | | 1,269,900 |
8.5% 9/15/16 | | 2,700,000 | | 2,875,500 |
Inergy LP/Inergy Finance Corp. 7% 10/1/18 (e) | | 2,290,000 | | 2,307,175 |
Kinder Morgan Finance Co. LLC 6% 1/15/18 (e) | | 3,895,000 | | 3,831,706 |
LINN Energy LLC: | | | | |
7.75% 2/1/21 (e) | | 2,390,000 | | 2,449,750 |
8.625% 4/15/20 (e) | | 3,055,000 | | 3,291,763 |
Pan American Energy LLC 7.875% 5/7/21 (e) | | 4,125,000 | | 4,372,500 |
Petrohawk Energy Corp.: | | | | |
7.25% 8/15/18 | | 2,430,000 | | 2,454,300 |
7.875% 6/1/15 | | 770,000 | | 801,763 |
10.5% 8/1/14 | | 725,000 | | 825,558 |
Pioneer Natural Resources Co.: | | | | |
6.65% 3/15/17 | | 3,365,000 | | 3,550,075 |
7.5% 1/15/20 | | 3,360,000 | | 3,687,600 |
Plains Exploration & Production Co.: | | | | |
7% 3/15/17 | | 1,730,000 | | 1,764,600 |
7.625% 6/1/18 | | 3,140,000 | | 3,289,150 |
10% 3/1/16 | | 1,337,000 | | 1,484,070 |
Precision Drilling Corp. 6.625% 11/15/20 (e) | | 1,305,000 | | 1,331,100 |
Quicksilver Resources, Inc.: | | | | |
7.125% 4/1/16 | | 4,920,000 | | 4,674,000 |
11.75% 1/1/16 | | 2,250,000 | | 2,610,000 |
Corporate Bonds - continued |
| Principal Amount | | Value |
Nonconvertible Bonds - continued |
Energy - continued |
Range Resources Corp. 6.75% 8/1/20 | | $ 1,045,000 | | $ 1,071,125 |
Targa Resources Partners LP/Targa Resources Partners Finance Corp. 7.875% 10/15/18 (e) | | 2,660,000 | | 2,753,100 |
| | 79,375,174 |
Entertainment/Film - 0.1% |
NAI Entertainment Holdings LLC/NAI Entertainment Finance Corp. 8.25% 12/15/17 (e) | | 855,000 | | 897,750 |
Environmental - 0.4% |
Covanta Holding Corp. 7.25% 12/1/20 | | 1,590,000 | | 1,611,907 |
EnergySolutions, Inc. / EnergySolutions LLC 10.75% 8/15/18 (e) | | 3,145,000 | | 3,431,824 |
| | 5,043,731 |
Food & Drug Retail - 0.7% |
Albertsons, Inc. 7.75% 6/15/26 | | 435,000 | | 334,950 |
Rite Aid Corp.: | | | | |
7.5% 3/1/17 | | 1,185,000 | | 1,134,638 |
9.375% 12/15/15 | | 950,000 | | 817,000 |
9.5% 6/15/17 | | 1,190,000 | | 1,002,575 |
9.75% 6/12/16 | | 1,185,000 | | 1,306,463 |
SUPERVALU, Inc. 8% 5/1/16 | | 1,640,000 | | 1,566,200 |
Tops Markets LLC 10.125% 10/15/15 | | 2,800,000 | | 2,891,000 |
| | 9,052,826 |
Food/Beverage/Tobacco - 0.2% |
C&S Group Enterprises LLC 8.375% 5/1/17 (e) | | 1,365,000 | | 1,317,225 |
NBTY, Inc. 9% 10/1/18 (e) | | 1,655,000 | | 1,754,300 |
| | 3,071,525 |
Gaming - 2.7% |
Chukchansi Economic Development Authority: | | | | |
3.9428% 11/15/12 (e)(f) | | 1,010,000 | | 652,713 |
8% 11/15/13 (e) | | 3,410,000 | | 2,267,650 |
Las Vegas Sands Corp. 6.375% 2/15/15 | | 1,295,000 | | 1,322,519 |
MCE Finance Ltd. 10.25% 5/15/18 | | 2,225,000 | | 2,542,063 |
MGM Mirage, Inc.: | | | | |
5.875% 2/27/14 | | 1,375,000 | | 1,265,000 |
6.625% 7/15/15 | | 5,135,000 | | 4,647,175 |
6.75% 9/1/12 | | 985,000 | | 970,225 |
6.75% 4/1/13 | | 1,140,000 | | 1,105,800 |
7.5% 6/1/16 | | 1,325,000 | | 1,215,688 |
MGM Resorts International: | | | | |
10% 11/1/16 (e) | | 4,125,000 | | 4,166,250 |
11.375% 3/1/18 | | 1,875,000 | | 1,996,875 |
|
| Principal Amount | | Value |
Scientific Games Corp. 7.875% 6/15/16 (e) | | $ 4,064,000 | | $ 4,089,197 |
Wynn Las Vegas LLC/Wynn Las Vegas Capital Corp. 7.75% 8/15/20 | | 6,525,000 | | 6,949,125 |
| | 33,190,280 |
Healthcare - 5.3% |
DaVita, Inc.: | | | | |
6.375% 11/1/18 | | 1,460,000 | | 1,430,800 |
6.625% 11/1/20 | | 1,265,000 | | 1,242,863 |
DJO Finance LLC/DJO Finance Corp. 10.875% 11/15/14 | | 6,465,000 | | 7,046,850 |
Endo Pharmaceuticals Holdings, Inc. 7% 12/15/20 (e) | | 1,485,000 | | 1,503,563 |
HCA, Inc.: | | | | |
8.5% 4/15/19 | | 1,235,000 | | 1,346,150 |
9.125% 11/15/14 | | 6,670,000 | | 6,986,825 |
9.25% 11/15/16 | | 8,519,000 | | 9,115,330 |
9.625% 11/15/16 pay-in-kind (f) | | 5,401,000 | | 5,806,075 |
9.875% 2/15/17 | | 1,610,000 | | 1,771,000 |
HealthSouth Corp. 7.25% 10/1/18 | | 2,095,000 | | 2,126,425 |
Mylan, Inc.: | | | | |
6% 11/15/18 (e) | | 2,000,000 | | 1,957,600 |
7.625% 7/15/17 (e) | | 1,255,000 | | 1,327,163 |
7.875% 7/15/20 (e) | | 2,055,000 | | 2,209,125 |
Omega Healthcare Investors, Inc.: | | | | |
6.75% 10/15/22 (e) | | 1,555,000 | | 1,531,675 |
7% 1/15/16 | | 1,665,000 | | 1,689,975 |
Senior Housing Properties Trust 6.75% 4/15/20 | | 2,640,000 | | 2,788,500 |
Valeant Pharmaceuticals International 6.875% 12/1/18 (e) | | 3,640,000 | | 3,603,600 |
Vanguard Health Holding Co. II LLC/Vanguard Health Holding Co. II, Inc.: | | | | |
8% 2/1/18 | | 6,475,000 | | 6,588,313 |
8% 2/1/18 (e) | | 2,690,000 | | 2,737,075 |
Ventas Realty LP: | | | | |
6.5% 6/1/16 | | 1,200,000 | | 1,248,000 |
6.5% 6/1/16 | | 460,000 | | 478,400 |
| | 64,535,307 |
Homebuilders/Real Estate - 1.3% |
CB Richard Ellis Services, Inc. 6.625% 10/15/20 (e) | | 1,485,000 | | 1,470,150 |
KB Home 7.25% 6/15/18 | | 4,735,000 | | 4,521,925 |
Lennar Corp. 5.6% 5/31/15 | | 545,000 | | 523,200 |
Standard Pacific Corp.: | | | | |
8.375% 5/15/18 | | 1,765,000 | | 1,765,000 |
8.375% 5/15/18 (e) | | 2,375,000 | | 2,363,125 |
8.375% 1/15/21 (e) | | 2,375,000 | | 2,291,875 |
10.75% 9/15/16 | | 2,405,000 | | 2,765,750 |
| | 15,701,025 |
Corporate Bonds - continued |
| Principal Amount | | Value |
Nonconvertible Bonds - continued |
Hotels - 0.7% |
Host Hotels & Resorts LP: | | | | |
6% 11/1/20 (e) | | $ 3,550,000 | | $ 3,496,750 |
9% 5/15/17 | | 2,195,000 | | 2,452,913 |
Host Marriott LP 7.125% 11/1/13 | | 2,406,000 | | 2,430,060 |
| | 8,379,723 |
Insurance - 0.1% |
CNO Financial Group, Inc. 9% 1/15/18 (e) | | 915,000 | | 937,875 |
Leisure - 2.7% |
Equinox Holdings, Inc. 9.5% 2/1/16 (e) | | 3,080,000 | | 3,253,250 |
GWR Operating Partnership LLP/Great Wolf Finance Corp. 10.875% 4/1/17 | | 1,865,000 | | 1,967,575 |
NCL Corp. Ltd.: | | | | |
9.5% 11/15/18 (e) | | 1,465,000 | | 1,519,938 |
11.75% 11/15/16 | | 1,490,000 | | 1,735,850 |
Royal Caribbean Cruises Ltd.: | | | | |
7.25% 3/15/18 | | 1,815,000 | | 1,923,900 |
11.875% 7/15/15 | | 1,440,000 | | 1,771,200 |
yankee: | | | | |
7% 6/15/13 | | 3,220,000 | | 3,405,150 |
7.25% 6/15/16 | | 8,570,000 | | 9,191,325 |
7.5% 10/15/27 | | 2,640,000 | | 2,587,200 |
Town Sports International Holdings, Inc. 11% 2/1/14 | | 1,772,000 | | 1,754,280 |
Universal City Development Partners Ltd./UCDP Finance, Inc.: | | | | |
8.875% 11/15/15 | | 1,245,000 | | 1,322,813 |
10.875% 11/15/16 | | 2,130,000 | | 2,343,000 |
| | 32,775,481 |
Metals/Mining - 1.9% |
Arch Coal, Inc.: | | | | |
7.25% 10/1/20 | | 545,000 | | 568,163 |
8.75% 8/1/16 | | 1,035,000 | | 1,138,500 |
CONSOL Energy, Inc.: | | | | |
8% 4/1/17 (e) | | 2,640,000 | | 2,798,400 |
8.25% 4/1/20 (e) | | 1,760,000 | | 1,883,200 |
Drummond Co., Inc. 9% 10/15/14 (e) | | 830,000 | | 881,875 |
FMG Resources (August 2006) Pty Ltd. 7% 11/1/15 (e) | | 5,570,000 | | 5,751,025 |
Massey Energy Co. 6.875% 12/15/13 | | 5,595,000 | | 5,664,938 |
Severstal Columbus LLC 10.25% 2/15/18 (e) | | 4,340,000 | | 4,578,700 |
| | 23,264,801 |
Paper - 0.5% |
Boise Paper LLC/Boise Co-Issuer Co. 8% 4/1/20 | | 2,790,000 | | 2,957,400 |
|
| Principal Amount | | Value |
Verso Paper Holdings LLC/Verso Paper, Inc.: | | | | |
9.125% 8/1/14 | | $ 1,495,000 | | $ 1,513,688 |
11.5% 7/1/14 | | 1,990,000 | | 2,184,025 |
| | 6,655,113 |
Publishing/Printing - 0.4% |
ProQuest LLC/ProQuest Notes Co. 9% 10/15/18 (e) | | 3,595,000 | | 3,702,850 |
Visant Corp. 10% 10/1/17 (e) | | 1,625,000 | | 1,698,125 |
| | 5,400,975 |
Services - 4.0% |
Aircastle Ltd. 9.75% 8/1/18 | | 2,575,000 | | 2,826,063 |
ARAMARK Corp.: | | | | |
3.7869% 2/1/15 (f) | | 7,820,000 | | 7,644,050 |
8.5% 2/1/15 | | 3,080,000 | | 3,210,900 |
Avis Budget Car Rental LLC/Avis Budget Finance, Inc.: | | | | |
7.625% 5/15/14 | | 1,986,000 | | 2,035,650 |
7.75% 5/15/16 | | 2,430,000 | | 2,478,600 |
Fidelity National Information Services, Inc.: | | | | |
7.625% 7/15/17 (e) | | 915,000 | | 963,038 |
7.875% 7/15/20 (e) | | 1,220,000 | | 1,293,200 |
FTI Consulting, Inc. 6.75% 10/1/20 (e) | | 3,100,000 | | 3,069,000 |
Hertz Corp.: | | | | |
7.375% 1/15/21 (e) | | 3,565,000 | | 3,591,738 |
7.5% 10/15/18 (e) | | 7,485,000 | | 7,690,838 |
8.875% 1/1/14 | | 3,460,000 | | 3,542,175 |
McJunkin Red Man Corp. 9.5% 12/15/16 (e) | | 5,700,000 | | 5,379,375 |
PHH Corp. 9.25% 3/1/16 (e) | | 1,940,000 | | 2,041,850 |
ServiceMaster Co. 10.75% 7/15/15 pay-in-kind (e)(f) | | 3,000,000 | | 3,210,000 |
| | 48,976,477 |
Shipping - 2.9% |
Navios Maritime Acquisition Corp./Navios Acquisition Finance US, Inc. 8.625% 11/1/17 (e) | | 2,220,000 | | 2,247,750 |
Navios Maritime Holdings, Inc.: | | | | |
8.875% 11/1/17 | | 2,255,000 | | 2,407,213 |
9.5% 12/15/14 | | 4,737,000 | | 4,926,480 |
Overseas Shipholding Group, Inc.: | | | | |
7.5% 2/15/24 | | 475,000 | | 412,063 |
8.125% 3/30/18 | | 2,895,000 | | 2,923,950 |
Ship Finance International Ltd. 8.5% 12/15/13 | | 20,075,000 | | 20,426,274 |
Swift Services Holdings, Inc. 10% 11/15/18 (e) | | 2,470,000 | | 2,568,800 |
| | 35,912,530 |
Corporate Bonds - continued |
| Principal Amount | | Value |
Nonconvertible Bonds - continued |
Specialty Retailing - 0.2% |
Sears Holdings Corp. 6.625% 10/15/18 (e) | | $ 3,565,000 | | $ 3,342,188 |
| | 3,342,188 |
Steel - 1.1% |
AK Steel Corp. 7.625% 5/15/20 | | 2,505,000 | | 2,492,475 |
Essar Steel Algoma, Inc. 9.375% 3/15/15 (e) | | 3,045,000 | | 3,064,031 |
Steel Dynamics, Inc. 6.75% 4/1/15 | | 5,775,000 | | 5,876,063 |
Tube City IMS Corp. 9.75% 2/1/15 | | 1,695,000 | | 1,754,325 |
| | 13,186,894 |
Super Retail - 1.1% |
AutoNation, Inc. 6.75% 4/15/18 | | 2,325,000 | | 2,394,750 |
PETCO Animal Supplies, Inc. 9.25% 12/1/18 (e) | | 2,425,000 | | 2,546,250 |
QVC, Inc. 7.125% 4/15/17 (e) | | 1,470,000 | | 1,536,150 |
Toys 'R' Us Property Co. I LLC 10.75% 7/15/17 | | 830,000 | | 952,425 |
Toys 'R' Us Property Co. II LLC 8.5% 12/1/17 | | 3,575,000 | | 3,843,125 |
Toys 'R' Us, Inc. 7.375% 9/1/16 (e) | | 1,475,000 | | 1,545,063 |
| | 12,817,763 |
Technology - 5.7% |
Advanced Micro Devices, Inc. 7.75% 8/1/20 (e) | | 2,510,000 | | 2,604,125 |
Amkor Technology, Inc. 7.375% 5/1/18 | | 5,590,000 | | 5,743,725 |
Atkore International, Inc. 9.875% 1/1/18 (e) | | 670,000 | | 695,125 |
Avaya, Inc. 10.125% 11/1/15 pay-in-kind (f) | | 3,584,645 | | 3,656,338 |
CDW LLC/CDW Finance Corp. 8% 12/15/18 (e) | | 2,860,000 | | 2,917,200 |
Freescale Semiconductor, Inc.: | | | | |
9.125% 12/15/14 pay-in-kind (f) | | 3,145,979 | | 3,271,818 |
9.25% 4/15/18 (e) | | 1,815,000 | | 1,996,500 |
10.125% 12/15/16 | | 6,625,000 | | 6,989,375 |
Jabil Circuit, Inc.: | | | | |
5.625% 12/15/20 | | 925,000 | | 904,188 |
7.75% 7/15/16 | | 2,385,000 | | 2,677,163 |
8.25% 3/15/18 | | 430,000 | | 486,975 |
Lucent Technologies, Inc.: | | | | |
6.45% 3/15/29 | | 5,080,000 | | 4,013,200 |
6.5% 1/15/28 | | 4,915,000 | | 3,907,425 |
Seagate HDD Cayman 6.875% 5/1/20 (e) | | 1,200,000 | | 1,146,000 |
Spansion LLC 7.875% 11/15/17 (e) | | 2,170,000 | | 2,148,300 |
SunGard Data Systems, Inc.: | | | | |
7.375% 11/15/18 (e) | | 1,430,000 | | 1,415,700 |
|
| Principal Amount | | Value |
7.625% 11/15/20 (e) | | $ 1,430,000 | | $ 1,415,700 |
10.25% 8/15/15 | | 4,320,000 | | 4,541,400 |
Terremark Worldwide, Inc.: | | | | |
9.5% 11/15/13 (e) | | 1,325,000 | | 1,318,375 |
12% 6/15/17 | | 5,445,000 | | 6,234,525 |
Viasystems, Inc. 12% 1/15/15 (e) | | 1,625,000 | | 1,815,938 |
Xerox Capital Trust I 8% 2/1/27 | | 9,405,000 | | 9,569,588 |
| | 69,468,683 |
Telecommunications - 11.4% |
Citizens Communications Co.: | | | | |
7.875% 1/15/27 | | 940,000 | | 911,800 |
9% 8/15/31 | | 4,215,000 | | 4,330,913 |
Cleveland Unlimited, Inc. 14.5% 12/15/10 (c)(e)(f) | | 1,275,000 | | 1,147,500 |
Digicel Group Ltd.: | | | | |
8.25% 9/1/17 (e) | | 3,890,000 | | 4,006,700 |
8.875% 1/15/15 (e) | | 5,750,000 | | 5,829,350 |
9.125% 1/15/15 pay-in-kind (e)(f) | | 3,357,000 | | 3,403,327 |
12% 4/1/14 (e) | | 1,430,000 | | 1,673,100 |
Equinix, Inc. 8.125% 3/1/18 | | 2,745,000 | | 2,868,525 |
Frontier Communications Corp.: | | | | |
7.875% 4/15/15 | | 1,760,000 | | 1,922,800 |
8.125% 10/1/18 | | 5,125,000 | | 5,586,250 |
8.25% 4/15/17 | | 2,585,000 | | 2,862,888 |
8.5% 4/15/20 | | 880,000 | | 963,600 |
Global Crossing Ltd.: | | | | |
9% 11/15/19 (e) | | 2,440,000 | | 2,421,700 |
12% 9/15/15 | | 915,000 | | 1,031,663 |
Intelsat Bermuda Ltd.: | | | | |
11.25% 2/4/17 | | 1,505,000 | | 1,636,688 |
12% 2/4/17 pay-in-kind (f) | | 10,789,687 | | 11,608,280 |
Intelsat Jackson Holdings Ltd.: | | | | |
9.5% 6/15/16 | | 5,125,000 | | 5,406,875 |
11.5% 6/15/16 | | 1,883,000 | | 2,028,933 |
Intelsat Jackson Holdings SA 7.25% 10/15/20 (e) | | 4,295,000 | | 4,337,950 |
Intelsat Ltd.: | | | | |
6.5% 11/1/13 | | 7,705,000 | | 7,916,888 |
11.25% 6/15/16 | | 680,000 | | 731,000 |
Intelsat Subsidiary Holding Co. Ltd.: | | | | |
8.875% 1/15/15 (e) | | 585,000 | | 598,163 |
8.875% 1/15/15 | | 6,240,000 | | 6,411,600 |
MetroPCS Wireless, Inc.: | | | | |
6.625% 11/15/20 | | 2,435,000 | | 2,325,425 |
7.875% 9/1/18 | | 3,585,000 | | 3,714,777 |
Nextel Communications, Inc.: | | | | |
5.95% 3/15/14 | | 4,895,000 | | 4,809,338 |
6.875% 10/31/13 | | 3,945,000 | | 3,954,863 |
7.375% 8/1/15 | | 6,745,000 | | 6,753,431 |
NII Capital Corp.: | | | | |
8.875% 12/15/19 | | 2,365,000 | | 2,542,375 |
10% 8/15/16 | | 2,495,000 | | 2,763,213 |
Corporate Bonds - continued |
| Principal Amount | | Value |
Nonconvertible Bonds - continued |
Telecommunications - continued |
Qwest Communications International, Inc.: | | | | |
Series B 7.5% 2/15/14 | | $ 900,000 | | $ 911,250 |
7.125% 4/1/18 (e) | | 2,465,000 | | 2,545,113 |
8% 10/1/15 | | 2,080,000 | | 2,236,000 |
Sprint Nextel Corp. 6% 12/1/16 | | 6,355,000 | | 6,140,519 |
U.S. West Communications 7.5% 6/15/23 | | 9,460,000 | | 9,412,700 |
Wind Acquisition Finance SA: | | | | |
7.25% 2/15/18 (e) | | 1,535,000 | | 1,546,513 |
11.75% 7/15/17 (e) | | 4,510,000 | | 5,039,925 |
Wind Acquisition Holdings Finance SA 12.25% 7/15/17 pay-in-kind (e)(f) | | 5,169,786 | | 5,646,196 |
| | 139,978,131 |
Textiles & Apparel - 0.1% |
Hanesbrands, Inc. 6.375% 12/15/20 (e) | | 1,185,000 | | 1,122,788 |
TOTAL NONCONVERTIBLE BONDS | | 1,053,929,572 |
TOTAL CORPORATE BONDS (Cost $993,438,204) | 1,058,869,796 |
Commercial Mortgage Securities - 0.0% |
|
LB Multi-family Mortgage Trust Series 1991-4 Class A1, 0.936% 4/25/21 (e)(f)
(Cost $26,331) | | 59,267 | | 39,590 |
Common Stocks - 0.0% |
| Shares | | |
Textiles & Apparel - 0.0% |
Arena Brands Holding Corp. Class B (a)(g)
(Cost $1,974,627) | 48,889 | | 363,245 |
Preferred Stocks - 0.8% |
| | | |
Convertible Preferred Stocks - 0.5% |
Automotive - 0.3% |
General Motors Co. 4.75% | 82,000 | | 4,437,020 |
Electric Utilities - 0.2% |
AES Trust III 6.75% | 51,000 | | 2,494,920 |
TOTAL CONVERTIBLE PREFERRED STOCKS | | 6,931,940 |
|
| Shares | | Value |
Nonconvertible Preferred Stocks - 0.3% |
Banks & Thrifts - 0.3% |
GMAC LLC 7.00% (e) | 3,795 | | $ 3,548,325 |
TOTAL PREFERRED STOCKS (Cost $9,901,116) | 10,480,265 |
Floating Rate Loans - 5.3% |
| Principal Amount | | |
Aerospace - 0.0% |
TransDigm Group, Inc. Tranche B, term loan 5% 12/6/16 (f) | | $ 410,000 | | 413,075 |
Air Transportation - 0.6% |
Delta Air Lines, Inc. Tranche 2LN, term loan 3.5391% 4/30/14 (f) | | 2,952,460 | | 2,871,267 |
US Airways Group, Inc. term loan 2.7884% 3/23/14 (f) | | 4,295,000 | | 3,854,763 |
| | 6,726,030 |
Automotive - 0.5% |
Federal-Mogul Corp.: | | | | |
Tranche B, term loan 2.2059% 12/27/14 (f) | | 3,645,905 | | 3,408,921 |
Tranche C, term loan 2.1987% 12/27/15 (f) | | 2,453,397 | | 2,281,660 |
| | 5,690,581 |
Broadcasting - 0.5% |
Clear Channel Capital I LLC Tranche B, term loan 3.9106% 1/29/16 (f) | | 2,145,000 | | 1,860,788 |
Univision Communications, Inc. term loan 4.5106% 3/31/17 (f) | | 5,117,002 | | 4,809,982 |
| | 6,670,770 |
Capital Goods - 0.4% |
Dresser, Inc. Tranche 2LN, term loan 6.0344% 5/4/15 pay-in-kind (f) | | 4,950,000 | | 4,937,625 |
Containers - 0.3% |
Anchor Glass Container Corp.: | | | | |
Tranche 1LN, term loan 6% 3/2/16 (f) | | 1,833,144 | | 1,843,456 |
Tranche 2LN, term loan 10% 9/2/16 (f) | | 2,070,000 | | 2,064,825 |
| | 3,908,281 |
Diversified Financial Services - 0.3% |
AWAS Aviation Acquisitions Ltd. term loan 7.75% 6/10/16 (f) | | 4,111,100 | | 4,229,294 |
Electric Utilities - 0.9% |
Ashmore Energy International: | | | | |
Revolving Credit-Linked Deposit 3.3028% 3/30/12 (f) | | 1,046,925 | | 1,033,839 |
term loan 3.3028% 3/30/14 (f) | | 9,988,662 | | 9,863,804 |
| | 10,897,643 |
Floating Rate Loans - continued |
| Principal Amount | | Value |
Leisure - 0.5% |
Blackstone UTP Capital LLC term loan 7.75% 11/2/14 | | $ 3,945,150 | | $ 4,024,053 |
Six Flags, Inc. Tranche B, term loan 7.25% 6/30/16 (f) | | 1,665,000 | | 1,683,731 |
| | 5,707,784 |
Publishing/Printing - 0.2% |
Newsday LLC term loan 10.5% 8/1/13 | | 925,000 | | 989,750 |
Visant Corp. Tranche B, term loan 7% 12/22/16 (f) | | 1,536,150 | | 1,551,512 |
| | 2,541,262 |
Shipping - 0.1% |
Swift Transportation Co., Inc. Tranche B, term loan 6.75% 12/21/16 (f) | | 865,000 | | 869,325 |
Technology - 0.2% |
Avaya, Inc. term loan 3.0344% 10/24/14 (f) | | 2,286,211 | | 2,166,185 |
Telecommunications - 0.8% |
Asurion Corp.: | | | | |
Tranche 2LN, term loan 6.7622% 7/3/15 (f) | | 5,144,397 | | 4,861,455 |
Tranche B 2LN, term loan 6.75% 3/31/15 (f) | | 4,725,000 | | 4,730,906 |
Intelsat Jackson Holdings Ltd. term loan 3.29% 2/1/14 (f) | | 830,000 | | 788,500 |
| | 10,380,861 |
TOTAL FLOATING RATE LOANS (Cost $61,872,746) | 65,138,716 |
Money Market Funds - 5.8% |
| Shares | | |
Fidelity Cash Central Fund, 0.19% (b)
(Cost $70,967,769) | 70,967,769 | | 70,967,769 |
TOTAL INVESTMENT PORTFOLIO - 98.3% (Cost $1,138,180,793) | | 1,205,859,381 |
NET OTHER ASSETS (LIABILITIES) - 1.7% | | 20,314,161 |
NET ASSETS - 100% | $ 1,226,173,542 |
Legend |
(a) Non-income producing |
(b) Affiliated fund that is available only to investment companies and other accounts managed by Fidelity Investments. The rate quoted is the annualized seven-day yield of the fund at period end. A complete unaudited listing of the fund's holdings as of its most recent quarter end is available upon request. In addition, each Fidelity Central Fund's financial statements, which are not covered by the Fund's Report of Independent Registered Public Accounting Firm, are available on the SEC's website or upon request. |
(c) Non-income producing - Security is in default. |
(d) Security initially issued in zero coupon form which converts to coupon form at a specified rate and date. The rate shown is the rate at period end. |
(e) Security exempt from registration under Rule 144A of the Securities Act of 1933. These securities may be resold in transactions exempt from registration, normally to qualified institutional buyers. At the end of the period, the value of these securities amounted to $364,314,363 or 29.7% of net assets. |
(f) The coupon rate shown on floating or adjustable rate securities represents the rate at period end. |
(g) Restricted securities - Investment in securities not registered under the Securities Act of 1933 (excluding 144A issues). At the end of the period, the value of restricted securities (excluding 144A issues) amounted to $363,245 or 0.0% of net assets. |
Additional information on each holding is as follows: |
Security | Acquisition Date | Acquisition Cost |
Arena Brands Holding Corp. Class B | 6/18/97 | $ 1,974,627 |
Affiliated Central Funds |
Information regarding fiscal year to date income earned by the Fund from investments in Fidelity Central Funds is as follows: |
Fund | Income earned |
Fidelity Cash Central Fund | $ 101,379 |
Other Information |
The following is a summary of the inputs used, as of December 31, 2010, involving the Fund's assets and liabilities carried at fair value. The inputs or methodology used for valuing securities may not be an indication of the risk associated with investing in those securities. For more information on valuation inputs, and their aggregation into the levels used in the tables below, please refer to the Security Valuation section in the accompanying Notes to Financial Statements. |
Valuation Inputs at Reporting Date: |
Description | Total | Level 1 | Level 2 | Level 3 |
Investments in Securities: | | | | |
Equities: | | | | |
Consumer Discretionary | $ 4,800,265 | $ 4,437,020 | $ - | $ 363,245 |
Financials | 3,548,325 | - | 3,548,325 | - |
Utilities | 2,494,920 | - | 2,494,920 | - |
Corporate Bonds | 1,058,869,796 | - | 1,058,869,796 | - |
Commercial Mortgage Securities | 39,590 | - | - | 39,590 |
Floating Rate Loans | 65,138,716 | - | 65,138,716 | - |
Money Market Funds | 70,967,769 | 70,967,769 | - | - |
Total Investments in Securities: | $ 1,205,859,381 | $ 75,404,789 | $ 1,130,051,757 | $ 402,835 |
The following is a reconciliation of Investments in Securities for which Level 3 inputs were used in determining value: |
Investments in Securities: | |
Beginning Balance | $ 431,931 |
Total Realized Gain (Loss) | - |
Total Unrealized Gain (Loss) | 6,003 |
Cost of Purchases | - |
Proceeds of Sales | (36,645) |
Amortization/Accretion | 1,546 |
Transfers in to Level 3 | - |
Transfers out of Level 3 | - |
Ending Balance | $ 402,835 |
The change in unrealized gain (loss) for the period attributable to Level 3 securities held at December 31, 2010 | $ 6,003 |
The information used in the above reconciliation represents fiscal year to date activity for any Investments in Securities identified as using Level 3 inputs at either the beginning or the end of the current fiscal period. Transfers in or out of Level 3 represent the beginning value of any Security or Instrument where a change in the pricing level occurred from the beginning to the end of the period. The cost of purchases and the proceeds of sales may include securities received or delivered through corporate actions or exchanges. Realized and unrealized gains (losses) disclosed in the reconciliation are included in Net Gain (Loss) on the Fund's Statement of Operations. |
Distribution of investments by country of issue, as a percentage of total net assets, is as follows: (Unaudited) |
United States of America | 83.5% |
Bermuda | 6.4% |
Canada | 3.0% |
Liberia | 1.6% |
Cayman Islands | 1.5% |
Luxembourg | 1.3% |
Others (Individually Less Than 1%) | 2.7% |
| 100.0% |
Income Tax Information |
At December 31, 2010, the Fund had a capital loss carryforward of approximately $150,230,408 of which $70,783,139 and $79,447,269 will expire in fiscal 2016 and 2017, respectively. Capital loss carryforwards are only available to offset future capital gains of the Fund to the extent provided by regulations and may be limited. |
See accompanying notes which are an integral part of the financial statements.
Annual Report
Statement of Assets and Liabilities
| December 31, 2010 |
| | |
Assets | | |
Investment in securities, at value - See accompanying schedule: Unaffiliated issuers (cost $1,067,213,024) | $ 1,134,891,612 | |
Fidelity Central Funds (cost $70,967,769) | 70,967,769 | |
Total Investments (cost $1,138,180,793) | | $ 1,205,859,381 |
Cash | | 304,994 |
Receivable for investments sold | | 1,177,233 |
Receivable for fund shares sold | | 1,276,437 |
Interest receivable | | 19,736,755 |
Distributions receivable from Fidelity Central Funds | | 6,896 |
Prepaid expenses | | 3,664 |
Other receivables | | 13,074 |
Total assets | | 1,228,378,434 |
| | |
Liabilities | | |
Payable for fund shares redeemed | $ 1,410,718 | |
Accrued management fee | 561,317 | |
Distribution and service plan fees payable | 52,081 | |
Other affiliated payables | 106,497 | |
Other payables and accrued expenses | 74,279 | |
Total liabilities | | 2,204,892 |
| | |
Net Assets | | $ 1,226,173,542 |
Net Assets consist of: | | |
Paid in capital | | $ 1,300,989,788 |
Undistributed net investment income | | 7,949,486 |
Accumulated undistributed net realized gain (loss) on investments | | (150,433,458) |
Net unrealized appreciation (depreciation) on investments | | 67,667,726 |
Net Assets | | $ 1,226,173,542 |
Statement of Assets and Liabilities - continued
| December 31, 2010 |
| | |
Initial Class:
Net Asset Value, offering price and redemption price per share ($594,687,943 ÷ 106,739,194 shares) | | $ 5.57 |
| | |
Service Class:
Net Asset Value, offering price and redemption price per share ($98,987,511 ÷ 17,857,975 shares) | | $ 5.54 |
| | |
Service Class 2:
Net Asset Value, offering price and redemption price per share ($182,465,372 ÷ 33,495,054 shares) | | $ 5.45 |
| | |
Initial Class R:
Net Asset Value, offering price and redemption price per share ($34,946,042 ÷ 6,293,382 shares) | | $ 5.55 |
| | |
Service Class R:
Net Asset Value, offering price and redemption price per share ($68,805,814 ÷ 12,461,979 shares) | | $ 5.52 |
| | |
Service Class 2R:
Net Asset Value, offering price and redemption price per share ($1,542,536 ÷ 283,274 shares) | | $ 5.45 |
| | |
Investor Class:
Net Asset Value, offering price and redemption price per share ($244,738,324 ÷ 44,056,811 shares) | | $ 5.56 |
See accompanying notes which are an integral part of the financial statements.
Annual Report
Financial Statements - continued
Statement of Operations
| Year ended December 31, 2010 |
| | |
Investment Income | | |
Dividends | | $ 281,237 |
Interest | | 97,344,273 |
Income from Fidelity Central Funds | | 101,379 |
Total income | | 97,726,889 |
| | |
Expenses | | |
Management fee | $ 6,493,662 | |
Transfer agent fees | 948,535 | |
Distribution and service plan fees | 571,541 | |
Accounting fees and expenses | 402,167 | |
Custodian fees and expenses | 22,688 | |
Independent trustees' compensation | 6,823 | |
Audit | 73,446 | |
Legal | 47,563 | |
Interest | 902 | |
Miscellaneous | 18,773 | |
Total expenses before reductions | 8,586,100 | |
Expense reductions | (84,674) | 8,501,426 |
Net investment income | | 89,225,463 |
Realized and Unrealized Gain (Loss) Net realized gain (loss) on: | | |
Investment securities: | | |
Unaffiliated issuers | | 35,026,882 |
Change in net unrealized appreciation (depreciation) on investment securities | | 22,817,242 |
Net gain (loss) | | 57,844,124 |
Net increase (decrease) in net assets resulting from operations | | $ 147,069,587 |
Statement of Changes in Net Assets
| Year ended
December 31, 2010 | Year ended
December 31, 2009 |
Increase (Decrease) in Net Assets | | |
Operations | | |
Net investment income | $ 89,225,463 | $ 88,146,519 |
Net realized gain (loss) | 35,026,882 | (80,957,504) |
Change in net unrealized appreciation (depreciation) | 22,817,242 | 340,753,509 |
Net increase (decrease) in net assets resulting from operations | 147,069,587 | 347,942,524 |
Distributions to shareholders from net investment income | (88,733,895) | (82,969,090) |
Share transactions - net increase (decrease) | 7,262,606 | 122,868,111 |
Redemption fees | 110,732 | 89,023 |
Total increase (decrease) in net assets | 65,709,030 | 387,930,568 |
| | |
Net Assets | | |
Beginning of period | 1,160,464,512 | 772,533,944 |
End of period (including undistributed net investment income of $7,949,486 and undistributed net investment
income of $8,082,942, respectively) | $ 1,226,173,542 | $ 1,160,464,512 |
See accompanying notes which are an integral part of the financial statements.
Annual Report
Financial Highlights - Initial Class
Years ended December 31, | 2010 | 2009 | 2008 | 2007 | 2006 |
Selected Per-Share Data | | | | | |
Net asset value, beginning of period | $ 5.29 | $ 3.96 | $ 5.98 | $ 6.35 | $ 6.17 |
Income from Investment Operations | | | | | |
Net investment income C | .439 | .438 | .475 | .485 | .476 |
Net realized and unrealized gain (loss) | .288 | 1.298 | (1.990) | (.311) | .216 |
Total from investment operations | .727 | 1.736 | (1.515) | .174 | .692 |
Distributions from net investment income | (.448) | (.406) | (.506) | (.545) | (.512) |
Redemption fees added to paid in capital C | .001 | - G | .001 | .001 | - |
Net asset value, end of period | $ 5.57 | $ 5.29 | $ 3.96 | $ 5.98 | $ 6.35 |
Total Return A,B | 13.82% | 43.96% | (24.98)% | 2.79% | 11.24% |
Ratios to Average Net Assets D,F | | | | | |
Expenses before reductions | .69% | .70% | .71% | .68% | .71% |
Expenses net of fee waivers, if any | .69% | .70% | .71% | .68% | .71% |
Expenses net of all reductions | .69% | .70% | .70% | .68% | .71% |
Net investment income | 7.84% | 9.02% | 8.48% | 7.47% | 7.40% |
Supplemental Data | | | | | |
Net assets, end of period (000 omitted) | $ 594,688 | $ 608,802 | $ 451,824 | $ 726,409 | $ 922,565 |
Portfolio turnover rate E | 81% | 70% | 58% | 70% | 65% |
A Total returns do not reflect charges attributable to your insurance company's separate account. Inclusion of these charges would reduce the total returns shown.
B Total returns would have been lower had certain expenses not been reduced during the periods shown.
C Calculated based on average shares outstanding during the period.
D Fees and expenses of the underlying Fidelity Central Funds are not included in the Fund's expense ratio. The Fund indirectly bears its proportionate share of the expenses of any underlying Fidelity Central Funds.
E Amount does not include the portfolio activity of any underlying Fidelity Central Funds.
F Expense ratios reflect operating expenses of the class. Expenses before reductions do not reflect amounts reimbursed by the investment adviser or reductions from brokerage service arrangements or reductions from other expense offset arrangements and do not represent the amount paid by the class during periods when reimbursements or reductions occur. Expenses net of fee waivers reflect expenses after reimbursement by the investment adviser but prior to reductions from brokerage service arrangements or other expense offset arrangements. Expenses net of all reductions represent the net expenses paid by the class.
G Amount represents less than $.001 per share.
Financial Highlights - Service Class
Years ended December 31, | 2010 | 2009 | 2008 | 2007 | 2006 |
Selected Per-Share Data | | | | | |
Net asset value, beginning of period | $ 5.26 | $ 3.95 | $ 5.95 | $ 6.32 | $ 6.14 |
Income from Investment Operations | | | | | |
Net investment income C | .431 | .429 | .469 | .477 | .467 |
Net realized and unrealized gain (loss) | .290 | 1.281 | (1.971) | (.312) | .218 |
Total from investment operations | .721 | 1.710 | (1.502) | .165 | .685 |
Distributions from net investment income | (.442) | (.400) | (.499) | (.536) | (.505) |
Redemption fees added to paid in capital C | .001 | - G | .001 | .001 | - |
Net asset value, end of period | $ 5.54 | $ 5.26 | $ 3.95 | $ 5.95 | $ 6.32 |
Total Return A,B | 13.79% | 43.41% | (24.87)% | 2.66% | 11.18% |
Ratios to Average Net Assets D,F | | | | | |
Expenses before reductions | .79% | .80% | .80% | .78% | .81% |
Expenses net of fee waivers, if any | .78% | .80% | .80% | .78% | .81% |
Expenses net of all reductions | .78% | .80% | .80% | .78% | .81% |
Net investment income | 7.74% | 8.92% | 8.39% | 7.37% | 7.30% |
Supplemental Data | | | | | |
Net assets, end of period (000 omitted) | $ 98,988 | $ 103,511 | $ 95,461 | $ 180,837 | $ 277,546 |
Portfolio turnover rate E | 81% | 70% | 58% | 70% | 65% |
A Total returns do not reflect charges attributable to your insurance company's separate account. Inclusion of these charges would reduce the total returns shown.
B Total returns would have been lower had certain expenses not been reduced during the periods shown.
C Calculated based on average shares outstanding during the period.
D Fees and expenses of the underlying Fidelity Central Funds are not included in the Fund's expense ratio. The Fund indirectly bears its proportionate share of the expenses of any underlying Fidelity Central Funds.
E Amount does not include the portfolio activity of any underlying Fidelity Central Funds.
F Expense ratios reflect operating expenses of the class. Expenses before reductions do not reflect amounts reimbursed by the investment adviser or reductions from brokerage service arrangements or reductions from other expense offset arrangements and do not represent the amount paid by the class during periods when reimbursements or reductions occur. Expenses net of fee waivers reflect expenses after reimbursement by the investment adviser but prior to reductions from brokerage service arrangements or other expense offset arrangements. Expenses net of all reductions represent the net expenses paid by the class.
G Amount represents less than $.001 per share.
See accompanying notes which are an integral part of the financial statements.
Annual Report
Financial Highlights - Service Class 2
Years ended December 31, | 2010 | 2009 | 2008 | 2007 | 2006 |
Selected Per-Share Data | | | | | |
Net asset value, beginning of period | $ 5.18 | $ 3.89 | $ 5.88 | $ 6.25 | $ 6.08 |
Income from Investment Operations | | | | | |
Net investment income C | .417 | .422 | .450 | .461 | .453 |
Net realized and unrealized gain (loss) | .287 | 1.264 | (1.949) | (.305) | .216 |
Total from investment operations | .704 | 1.686 | (1.499) | .156 | .669 |
Distributions from net investment income | (.435) | (.396) | (.492) | (.527) | (.499) |
Redemption fees added to paid in capital C | .001 | - G | .001 | .001 | - |
Net asset value, end of period | $ 5.45 | $ 5.18 | $ 3.89 | $ 5.88 | $ 6.25 |
Total Return A,B | 13.67% | 43.46% | (25.14)% | 2.54% | 11.02% |
Ratios to Average Net Assets D,F | | | | | |
Expenses before reductions | .94% | .95% | .96% | .93% | .97% |
Expenses net of fee waivers, if any | .94% | .95% | .96% | .93% | .97% |
Expenses net of all reductions | .94% | .95% | .96% | .93% | .97% |
Net investment income | 7.59% | 8.77% | 8.23% | 7.22% | 7.14% |
Supplemental Data | | | | | |
Net assets, end of period (000 omitted) | $ 182,465 | $ 181,377 | $ 87,077 | $ 97,266 | $ 110,503 |
Portfolio turnover rate E | 81% | 70% | 58% | 70% | 65% |
A Total returns do not reflect charges attributable to your insurance company's separate account. Inclusion of these charges would reduce the total returns shown.
B Total returns would have been lower had certain expenses not been reduced during the periods shown.
C Calculated based on average shares outstanding during the period.
D Fees and expenses of the underlying Fidelity Central Funds are not included in the Fund's expense ratio. The Fund indirectly bears its proportionate share of the expenses of any underlying Fidelity Central Funds.
E Amount does not include the portfolio activity of any underlying Fidelity Central Funds.
F Expense ratios reflect operating expenses of the class. Expenses before reductions do not reflect amounts reimbursed by the investment adviser or reductions from brokerage service arrangements or reductions from other expense offset arrangements and do not represent the amount paid by the class during periods when reimbursements or reductions occur. Expenses net of fee waivers reflect expenses after reimbursement by the investment adviser but prior to reductions from brokerage service arrangements or other expense offset arrangements. Expenses net of all reductions represent the net expenses paid by the class.
G Amount represents less than $.001 per share.
Financial Highlights - Initial Class R
Years ended December 31, | 2010 | 2009 | 2008 | 2007 | 2006 |
Selected Per-Share Data | | | | | |
Net asset value, beginning of period | $ 5.27 | $ 3.95 | $ 5.96 | $ 6.34 | $ 6.16 |
Income from Investment Operations | | | | | |
Net investment income C | .439 | .440 | .471 | .479 | .475 |
Net realized and unrealized gain (loss) | .288 | 1.286 | (1.975) | (.313) | .218 |
Total from investment operations | .727 | 1.726 | (1.504) | .166 | .693 |
Distributions from net investment income | (.448) | (.406) | (.507) | (.547) | (.513) |
Redemption fees added to paid in capital C | .001 | - G | .001 | .001 | - |
Net asset value, end of period | $ 5.55 | $ 5.27 | $ 3.95 | $ 5.96 | $ 6.34 |
Total Return A,B | 13.88% | 43.82% | (24.88)% | 2.65% | 11.27% |
Ratios to Average Net Assets D,F | | | | | |
Expenses before reductions | .69% | .70% | .70% | .68% | .71% |
Expenses net of fee waivers, if any | .68% | .70% | .70% | .68% | .71% |
Expenses net of all reductions | .68% | .69% | .70% | .67% | .71% |
Net investment income | 7.84% | 9.02% | 8.49% | 7.47% | 7.39% |
Supplemental Data | | | | | |
Net assets, end of period (000 omitted) | $ 34,946 | $ 34,080 | $ 19,801 | $ 19,401 | $ 93 |
Portfolio turnover rate E | 81% | 70% | 58% | 70% | 65% |
A Total returns do not reflect charges attributable to your insurance company's separate account. Inclusion of these charges would reduce the total returns shown.
B Total returns would have been lower had certain expenses not been reduced during the periods shown.
C Calculated based on average shares outstanding during the period.
D Fees and expenses of the underlying Fidelity Central Funds are not included in the Fund's expense ratio. The Fund indirectly bears its proportionate share of the expenses of any underlying Fidelity Central Funds.
E Amount does not include the portfolio activity of any underlying Fidelity Central Funds.
F Expense ratios reflect operating expenses of the class. Expenses before reductions do not reflect amounts reimbursed by the investment adviser or reductions from brokerage service arrangements or reductions from other expense offset arrangements and do not represent the amount paid by the class during periods when reimbursements or reductions occur. Expenses net of fee waivers reflect expenses after reimbursement by the investment adviser but prior to reductions from brokerage service arrangements or other expense offset arrangements. Expenses net of all reductions represent the net expenses paid by the class.
G Amount represents less than $.001 per share.
See accompanying notes which are an integral part of the financial statements.
Annual Report
Financial Highlights - Service Class R
Years ended December 31, | 2010 | 2009 | 2008 | 2007 | 2006 |
Selected Per-Share Data | | | | | |
Net asset value, beginning of period | $ 5.25 | $ 3.94 | $ 5.93 | $ 6.32 | $ 6.14 |
Income from Investment Operations | | | | | |
Net investment income C | .433 | .431 | .467 | .471 | .467 |
Net realized and unrealized gain (loss) | .280 | 1.280 | (1.959) | (.318) | .219 |
Total from investment operations | .713 | 1.711 | (1.492) | .153 | .686 |
Distributions from net investment income | (.444) | (.401) | (.499) | (.544) | (.506) |
Redemption fees added to paid in capital C | .001 | - G | .001 | .001 | - |
Net asset value, end of period | $ 5.52 | $ 5.25 | $ 3.94 | $ 5.93 | $ 6.32 |
Total Return A,B | 13.66% | 43.56% | (24.79)% | 2.45% | 11.19% |
Ratios to Average Net Assets D,F | | | | | |
Expenses before reductions | .79% | .80% | .80% | .78% | .81% |
Expenses net of fee waivers, if any | .78% | .80% | .80% | .78% | .81% |
Expenses net of all reductions | .78% | .80% | .80% | .77% | .81% |
Net investment income | 7.74% | 8.92% | 8.39% | 7.37% | 7.30% |
Supplemental Data | | | | | |
Net assets, end of period (000 omitted) | $ 68,806 | $ 47,873 | $ 26,572 | $ 33,129 | $ 92 |
Portfolio turnover rate E | 81% | 70% | 58% | 70% | 65% |
A Total returns do not reflect charges attributable to your insurance company's separate account. Inclusion of these charges would reduce the total returns shown.
B Total returns would have been lower had certain expenses not been reduced during the periods shown.
C Calculated based on average shares outstanding during the period.
D Fees and expenses of the underlying Fidelity Central Funds are not included in the Fund's expense ratio. The Fund indirectly bears its proportionate share of the expenses of any underlying Fidelity Central Funds.
E Amount does not include the portfolio activity of any underlying Fidelity Central Funds.
F Expense ratios reflect operating expenses of the class. Expenses before reductions do not reflect amounts reimbursed by the investment adviser or reductions from brokerage service arrangements or reductions from other expense offset arrangements and do not represent the amount paid by the class during periods when reimbursements or reductions occur. Expenses net of fee waivers reflect expenses after reimbursement by the investment adviser but prior to reductions from brokerage service arrangements or other expense offset arrangements. Expenses net of all reductions represent the net expenses paid by the class.
G Amount represents less than $.001 per share.
Financial Highlights - Service Class 2R
Years ended December 31, | 2010 | 2009 | 2008 | 2007 | 2006 |
Selected Per-Share Data | | | | | |
Net asset value, beginning of period | $ 5.17 | $ 3.89 | $ 5.87 | $ 6.25 | $ 6.08 |
Income from Investment Operations | | | | | |
Net investment income C | .415 | .416 | .451 | .453 | .453 |
Net realized and unrealized gain (loss) | .293 | 1.257 | (1.940) | (.294) | .214 |
Total from investment operations | .708 | 1.673 | (1.489) | .159 | .667 |
Distributions from net investment income | (.429) | (.393) | (.492) | (.540) | (.497) |
Redemption fees added to paid in capital C | .001 | - G | .001 | .001 | - |
Net asset value, end of period | $ 5.45 | $ 5.17 | $ 3.89 | $ 5.87 | $ 6.25 |
Total Return A,B | 13.79% | 43.13% | (24.99)% | 2.59% | 10.99% |
Ratios to Average Net Assets D,F | | | | | |
Expenses before reductions | .94% | .95% | .95% | .93% | .96% |
Expenses net of fee waivers, if any | .93% | .95% | .95% | .93% | .96% |
Expenses net of all reductions | .93% | .94% | .95% | .92% | .96% |
Net investment income | 7.59% | 8.77% | 8.24% | 7.23% | 7.14% |
Supplemental Data | | | | | |
Net assets, end of period (000 omitted) | $ 1,543 | $ 2,016 | $ 1,487 | $ 2,347 | $ 92 |
Portfolio turnover rate E | 81% | 70% | 58% | 70% | 65% |
A Total returns do not reflect charges attributable to your insurance company's separate account. Inclusion of these charges would reduce the total returns shown.
B Total returns would have been lower had certain expenses not been reduced during the periods shown.
C Calculated based on average shares outstanding during the period.
D Fees and expenses of the underlying Fidelity Central Funds are not included in the Fund's expense ratio. The Fund indirectly bears its proportionate share of the expenses of any underlying Fidelity Central Funds.
E Amount does not include the portfolio activity of any underlying Fidelity Central Funds.
F Expense ratios reflect operating expenses of the class. Expenses before reductions do not reflect amounts reimbursed by the investment adviser or reductions from brokerage service arrangements or reductions from other expense offset arrangements and do not represent the amount paid by the class during periods when reimbursements or reductions occur. Expenses net of fee waivers reflect expenses after reimbursement by the investment adviser but prior to reductions from brokerage service arrangements or other expense offset arrangements. Expenses net of all reductions represent the net expenses paid by the class.
G Amount represents less than $.001 per share.
See accompanying notes which are an integral part of the financial statements.
Annual Report
Financial Highlights - Investor Class
Years ended December 31, | 2010 | 2009 | 2008 | 2007 | 2006 |
Selected Per-Share Data | | | | | |
Net asset value, beginning of period | $ 5.27 | $ 3.96 | $ 5.96 | $ 6.34 | $ 6.16 |
Income from Investment Operations | | | | | |
Net investment income C | .437 | .441 | .473 | .477 | .471 |
Net realized and unrealized gain (loss) | .298 | 1.274 | (1.971) | (.317) | .220 |
Total from investment operations | .735 | 1.715 | (1.498) | .160 | .691 |
Distributions from net investment income | (.446) | (.405) | (.503) | (.541) | (.511) |
Redemption fees added to paid in capital C | .001 | - G | .001 | .001 | - |
Net asset value, end of period | $ 5.56 | $ 5.27 | $ 3.96 | $ 5.96 | $ 6.34 |
Total Return A,B | 14.04% | 43.43% | (24.76)% | 2.56% | 11.24% |
Ratios to Average Net Assets D,F | | | | | |
Expenses before reductions | .73% | .73% | .74% | .75% | .80% |
Expenses net of fee waivers, if any | .72% | .73% | .74% | .75% | .80% |
Expenses net of all reductions | .72% | .73% | .74% | .75% | .79% |
Net investment income | 7.81% | 8.99% | 8.45% | 7.40% | 7.31% |
Supplemental Data | | | | | |
Net assets, end of period (000 omitted) | $ 244,738 | $ 182,806 | $ 90,312 | $ 105,920 | $ 78,122 |
Portfolio turnover rate E | 81% | 70% | 58% | 70% | 65% |
A Total returns do not reflect charges attributable to your insurance company's separate account. Inclusion of these charges would reduce the total returns shown.
B Total returns would have been lower had certain expenses not been reduced during the periods shown.
C Calculated based on average shares outstanding during the period.
D Fees and expenses of the underlying Fidelity Central Funds are not included in the Fund's expense ratio. The Fund indirectly bears its proportionate share of the expenses of any underlying Fidelity Central Funds.
E Amount does not include the portfolio activity of any underlying Fidelity Central Funds.
F Expense ratios reflect operating expenses of the class. Expenses before reductions do not reflect amounts reimbursed by the investment adviser or reductions from brokerage service arrangements or reductions from other expense offset arrangements and do not represent the amount paid by the class during periods when reimbursements or reductions occur. Expenses net of fee waivers reflect expenses after reimbursement by the investment adviser but prior to reductions from brokerage service arrangements or other expense offset arrangements. Expenses net of all reductions represent the net expenses paid by the class.
G Amount represents less than $.001 per share.
See accompanying notes which are an integral part of the financial statements.
Annual Report
Notes to Financial Statements
For the period ended December 31, 2010
1. Organization.
VIP High Income Portfolio (the Fund) is a fund of Variable Insurance Products Fund (the Trust) and is authorized to issue an unlimited number of shares. The Trust is registered under the Investment Company Act of 1940, as amended (the 1940 Act), as an open-end management investment company organized as a Massachusetts business trust. Shares of the Fund may only be purchased by insurance companies for the purpose of funding variable annuity or variable life insurance contracts. The Fund offers the following classes of shares: Initial Class shares, Service Class shares, Service Class 2 shares, Initial Class R shares, Service Class R shares, Service Class 2R shares and Investor Class shares. All classes have equal rights and voting privileges, except for matters affecting a single class. Investment income, realized and unrealized capital gains and losses, the common expenses of the Fund, and certain fund-level expense reductions, if any, are allocated on a pro-rata basis to each class based on the relative net assets of each class to the total net assets of the Fund. Each class differs with respect to transfer agent and distribution and service plan fees incurred. Certain expense reductions may also differ by class.
2. Investments in Fidelity Central Funds.
The Fund may invest in Fidelity Central Funds, which are open-end investment companies available only to other investment companies and accounts managed by Fidelity Management & Research Company (FMR) and its affiliates. The Fund's Schedule of Investments lists each of the Fidelity Central Funds held as of period end, if any, as an investment of the Fund, but does not include the underlying holdings of each Fidelity Central Fund. As an Investing Fund, the Fund indirectly bears its proportionate share of the expenses of the underlying Fidelity Central Funds.
The Money Market Central Funds seek preservation of capital and current income and are managed by Fidelity Investments Money Management, Inc. (FIMM), an affiliate of FMR.
A complete unaudited list of holdings for each Fidelity Central Fund is available upon request or at the Securities and Exchange Commission (the SEC) web site at www.sec.gov. In addition, the financial statements of the Fidelity Central Funds, which are not covered by the Fund's Report of Independent Registered Public Accounting Firm, are available on the SEC web site or upon request.
3. Significant Accounting Policies.
The financial statements have been prepared in conformity with accounting principles generally accepted in the United States of America (GAAP), which require management to make certain estimates and assumptions at the date of the financial statements. Actual results could differ from those estimates. Subsequent events, if any, through the date that the financial statements were issued have been evaluated in the preparation of the financial statements. The following summarizes the significant accounting policies of the Fund:
Security Valuation. Investments are valued as of 4:00 p.m. Eastern time on the last calendar day of the period. The Fund uses independent pricing services approved by the Board of Trustees to value its investments. When current market prices or quotations are not readily available or reliable, valuations may be determined in good faith in accordance with procedures adopted by the Board of Trustees. Factors used in determining value may include market or security specific events, changes in interest rates and credit quality. The frequency with which these procedures are used cannot be predicted and they may be utilized to a significant extent. The value used for net asset value (NAV) calculation under these procedures may differ from published prices for the same securities.
The Fund categorizes the inputs to valuation techniques used to value its investments into a disclosure hierarchy consisting of three levels as shown below.
Level 1 - quoted prices in active markets for identical investments
Level 2 - other significant observable inputs (including quoted prices for similar investments, interest rates, prepayment speeds, etc.)
Level 3 - unobservable inputs (including the Fund's own assumptions based on the best information available)
Changes in valuation techniques may result in transfers in or out of an assigned level within the disclosure hierarchy. The aggregate value of investments by input level, as of December 31, 2010 for the Fund's investments, as well as a roll forward of Level 3 securities, is included at the end of the Fund's Schedule of Investments. Valuation techniques used to value the Fund's investments by major category are as follows.
Debt securities, including restricted securities, are valued based on evaluated prices received from independent pricing services or from dealers who make markets in such securities. For corporate bonds and floating rate loans, pricing services utilize matrix pricing which considers yield or price of bonds of comparable quality, coupon, maturity and type as well as dealer supplied prices and are generally categorized as Level 2 in the hierarchy. For commercial mortgage securities, pricing services utilize matrix pricing which considers prepayment speed assumptions, attributes of the collateral, yield or price of bonds of comparable quality, coupon, maturity and type as well as dealer supplied prices and, accordingly, such securities are generally categorized as Level 2 in the hierarchy. The Fund invests a significant portion of its assets in below investment grade securities. The value of these securities can be more volatile due to changes in the credit quality of the issuer and is sensitive to changes in economic, market and regulatory conditions.
Annual Report
Notes to Financial Statements - continued
3. Significant Accounting Policies - continued
Security Valuation - continued
When independent prices are unavailable or unreliable, debt securities may be valued utilizing pricing matrices which consider similar factors that would be used by independent pricing services. These are generally categorized as Level 2 in the hierarchy but may be Level 3 depending on the circumstances.
Equity securities, including restricted securities, for which market quotations are readily available, are valued at the last reported sale price or official closing price as reported by an independent pricing service on the primary market or exchange on which they are traded and are categorized as Level 1 in the hierarchy. In the event there were no sales during the day or closing prices are not available, securities are valued at the last quoted bid price or may be valued using the last available price and are generally categorized as Level 2 in the hierarchy. Utilizing these techniques may result in transfers between Level 1 and Level 2. For restricted securities and private placements where observable inputs are limited, assumptions about market activity and risk are used and are categorized as Level 3 in the hierarchy.
Investments in open-end mutual funds, including the Fidelity Central Funds, are valued at their closing net asset value each business day and are categorized as Level 1 in the hierarchy.
Investment Transactions and Income. For financial reporting purposes, the Fund's investment holdings and NAV include trades executed through the end of the last business day of the period. The NAV per share for processing shareholder transactions is calculated as of the close of business of the New York Stock Exchange (NYSE), normally 4:00 p.m. Eastern time and includes trades executed through the end of the prior business day. Gains and losses on securities sold are determined on the basis of identified cost and may include proceeds received from litigation. Dividend income is recorded on the ex-dividend date, except for certain dividends from foreign securities where the ex-dividend date may have passed, which are recorded as soon as the Fund is informed of the ex-dividend date. Non-cash dividends included in dividend income, if any, are recorded at the fair market value of the securities received. Interest income and distributions from the Fidelity Central Funds are accrued as earned. Interest income includes coupon interest and amortization of premium and accretion of discount on debt securities. Debt obligations may be placed on non-accrual status and related interest income may be reduced by ceasing current accruals and writing off interest receivables when the collection of all or a portion of interest has become doubtful based on consistently applied procedures. A debt obligation is removed from non-accrual status when the issuer resumes interest payments or when collectability of interest is reasonably assured.
Expenses. Expenses directly attributable to a fund are charged to that fund. Expenses attributable to more than one fund are allocated among the respective funds on the basis of relative net assets or other appropriate methods. Expense estimates are accrued in the period to which they relate and adjustments are made when actual amounts are known.
Income Tax Information and Distributions to Shareholders. Each year the Fund intends to qualify as a regulated investment company, including distributing substantially all of its taxable income and realized gains under Subchapter M of the Internal Revenue Code and filing its U.S. federal tax return. As a result, no provision for income taxes is required. As of December 31, 2010, the Fund did not have any unrecognized tax benefits in the accompanying financial statements. A fund's federal tax return is subject to examination by the Internal Revenue Service (IRS) for a period of three years.
Distributions are declared and recorded on the ex-dividend date. Income dividends and capital gain distributions are declared separately for each class. Income and capital gain distributions are determined in accordance with income tax regulations, which may differ from GAAP.
Capital accounts within the financial statements are adjusted for permanent book-tax differences. These adjustments have no impact on net assets or the results of operations. Temporary book-tax differences will reverse in a subsequent period.
Book-tax differences are primarily due to market discount, deferred trustees compensation, capital loss carryforwards, expiring capital loss carryforwards, and losses deferred due to wash sales.
The federal tax cost of investment securities and unrealized appreciation (depreciation) as of period end were as follows:
Gross unrealized appreciation | $ 83,280,203 |
Gross unrealized depreciation | (8,096,446) |
Net unrealized appreciation (depreciation) | $ 75,183,757 |
| |
Tax Cost | $ 1,130,675,624 |
Annual Report
3. Significant Accounting Policies - continued
Income Tax Information and Distributions to Shareholders - continued
The tax-based components of distributable earnings as of period end were as follows:
Undistributed ordinary income | $ 241,584 |
Capital loss carryforward | $ (150,230,408) |
Net unrealized appreciation (depreciation) | $ 75,183,757 |
The tax character of distributions paid was as follows:
| December 31, 2010 | December 31, 2009 |
Ordinary Income | $ 88,733,895 | $ 82,969,090 |
Trading (Redemption) Fees. Initial Class R shares, Service Class R shares and Service Class 2 R shares held by investors less than 60 days are subject to a redemption fee equal to 1% of the net asset value of shares redeemed. All redemption fees, which reduce the proceeds of the shareholder redemption, are retained by the Fund and accounted for as an addition to paid in capital.
4. Operating Policies.
Restricted Securities. The Fund may invest in securities that are subject to legal or contractual restrictions on resale. These securities generally may be resold in transactions exempt from registration or to the public if the securities are registered. Disposal of these securities may involve time-consuming negotiations and expense, and prompt sale at an acceptable price may be difficult. Information regarding restricted securities is included at the end of the Fund's Schedule of Investments.
Loans and Other Direct Debt Instruments. The Fund may invest in loans and loan participations, trade claims or other receivables. These investments may include standby financing commitments, including revolving credit facilities, that obligate the Fund to supply additional cash to the borrower on demand. Loan participations involve a risk of insolvency of the lending bank or other financial intermediary. The Fund may be contractually obligated to receive approval from the agent bank and/or borrower prior to the sale of these investments.
5. Purchases and Sales of Investments.
Purchases and sales of securities, other than short-term securities, aggregated $878,979,943 and $924,990,768, respectively.
6. Fees and Other Transactions with Affiliates.
Management Fee. FMR and its affiliates provide the Fund with investment management related services for which the Fund pays a monthly management fee. The management fee is the sum of an individual fund fee rate that is based on an annual rate of .45% of the Fund's average net assets and a group fee rate that averaged .12% during the period. The group fee rate is based upon the average net assets of all the mutual funds advised by FMR. The group fee rate decreases as assets under management increase and increases as assets under management decrease. For the period, the total annual management fee rate was .57% of the Fund's average net assets.
Distribution and Service Plan Fees. In accordance with Rule 12b-1 of the 1940 Act, the Fund has adopted separate 12b-1 Plans for each Service Class of shares. Each Service Class pays Fidelity Distributors Corporation (FDC), an affiliate of FMR, a service fee. For the period, the service fee is based on an annual rate of .10% of Service Class' and Service Class R's average net assets and .25% of Service Class 2's and Service Class 2R's average net assets.
For the period, total fees, all of which were re-allowed to insurance companies for the distribution of shares and providing shareholder support services were as follows:
Service Class | $ 100,128 |
Service Class 2 | 412,749 |
Service Class R | 53,786 |
Service Class 2R | 4,878 |
| $ 571,541 |
Annual Report
Notes to Financial Statements - continued
6. Fees and Other Transactions with Affiliates - continued
Transfer Agent Fees. Fidelity Investments Institutional Operations Company, Inc. (FIIOC), an affiliate of FMR, is the Fund's transfer, dividend disbursing, and shareholder servicing agent. FIIOC receives an asset-based fee with respect to each class. Each class (with the exception of Investor Class) pays a transfer agent fee, excluding out of pocket expenses, equal to an annual rate of .07% of average net assets. Investor Class pays a monthly asset-based transfer agent fee of .10% of average net assets. In addition, FIIOC receives an asset-based fee of .01% of average net assets for typesetting, printing and mailing of shareholder reports, expect proxy statements. FIIOC has agreed to voluntarily waive this fee until December 31, 2010. (See Note 8: Expense Reductions.) For the period, transfer agent fees for each class, including printing and out of pocket expenses, were as follows:
Initial Class | $ 464,042 |
Service Class | 75,289 |
Service Class 2 | 126,876 |
Initial Class R | 23,812 |
Service Class R | 39,434 |
Service Class 2R | 1,430 |
Investor Class | 217,652 |
| $ 948,535 |
Accounting Fees. Fidelity Service Company, Inc. (FSC), an affiliate of FMR, maintains the Fund's accounting records. The fee is based on the level of average net assets for the month.
Interfund Lending Program. Pursuant to an Exemptive Order issued by the SEC, the Fund, along with other registered investment companies having management contracts with FMR, may participate in an interfund lending program. This program provides an alternative credit facility allowing the funds to borrow from, or lend money to, other participating affiliated funds. At period end, there were no interfund loans outstanding. The Fund's activity in this program during the period for which loans were outstanding was as follows:
Borrower or Lender | Average Daily Loan Balance | Weighted Average Interest Rate | Interest Expense |
Borrower | $ 25,458,333 | .43% | $ 902 |
7. Committed Line of Credit.
The Fund participates with other funds managed by FMR or an affiliate in a $3.75 billion credit facility (the "line of credit") to be utilized for temporary or emergency purposes to fund shareholder redemptions or for other short-term liquidity purposes. The Fund has agreed to pay commitment fees on its pro-rata portion of the line of credit, which amounted to $4,452 and is reflected in Miscellaneous expenses on the Statement of Operations. During the period, there were no borrowings on this line of credit.
8. Expense Reductions.
FMR or its affiliates agreed to waive certain fees during the period as noted in the table below.
Initial Class | $ 43,071 |
Service Class | 7,261 |
Service Class 2 | 11,949 |
Initial Class R | 2,355 |
Service Class R | 3,902 |
Service Class 2R | 142 |
Investor Class | 14,464 |
Total | $ 83,144 |
Many of the brokers with whom FMR places trades on behalf of the Fund provided services to the Fund in addition to trade execution. These services included payments of certain expenses on behalf of the Fund totaling $93 for the period. In addition, through arrangements with the Fund's custodian, credits realized as a result of uninvested cash balances were used to reduce the Fund's expenses. During the period, these credits reduced the Fund's custody expenses by $1,437.
Annual Report
9. Distributions to Shareholders.
Distributions to shareholders of each class were as follows:
Years ended December 31, | 2010 | 2009 |
From net investment income | | |
Initial Class | $ 44,467,220 | $ 43,747,787 |
Service Class | 7,392,045 | 7,425,935 |
Service Class 2 | 13,449,909 | 12,835,833 |
Initial Class R | 2,630,051 | 2,441,349 |
Service Class R | 5,103,828 | 3,419,501 |
Service Class 2R | 113,793 | 146,215 |
Investor Class | 15,577,049 | 12,952,470 |
Total | $ 88,733,895 | $ 82,969,090 |
10. Share Transactions.
Transactions for each class of shares were as follows:
| Shares | Dollars |
Years ended December 31, | 2010 | 2009 | 2010 | 2009 |
Initial Class | | | | |
Shares sold | 13,981,776 | 20,216,701 | $ 78,466,113 | $ 94,993,807 |
Reinvestment of distributions | 8,041,089 | 8,357,240 | 44,467,220 | 43,747,787 |
Shares redeemed | (30,400,651) | (27,414,117) | (169,255,225) | (129,625,734) |
Net increase (decrease) | (8,377,786) | 1,159,824 | $ (46,321,892) | $ 9,115,860 |
Service Class | | | | |
Shares sold | 1,837,003 | 2,777,781 | $ 10,346,870 | $ 12,897,331 |
Reinvestment of distributions | 1,344,008 | 1,427,657 | 7,392,045 | 7,425,935 |
Shares redeemed | (4,989,128) | (8,725,159) | (27,651,179) | (41,193,317) |
Net increase (decrease) | (1,808,117) | (4,519,721) | $ (9,912,264) | $ (20,870,051) |
Service Class 2 | | | | |
Shares sold | 26,131,374 | 24,366,893 | $ 143,180,880 | $ 112,451,939 |
Reinvestment of distributions | 2,486,120 | 2,502,443 | 13,449,909 | 12,835,833 |
Shares redeemed | (30,129,445) | (14,230,958) | (161,771,346) | (64,857,511) |
Net increase (decrease) | (1,511,951) | 12,638,378 | $ (5,140,557) | $ 60,430,261 |
Initial Class R | | | | |
Shares sold | 2,670,258 | 4,004,167 | $ 14,859,524 | $ 17,798,935 |
Reinvestment of distributions | 477,323 | 468,040 | 2,630,051 | 2,441,349 |
Shares redeemed | (3,318,610) | (3,016,877) | (18,109,555) | (13,725,409) |
Net increase (decrease) | (171,029) | 1,455,330 | $ (619,980) | $ 6,514,875 |
Service Class R | | | | |
Shares sold | 8,426,767 | 7,453,151 | $ 46,508,327 | $ 33,119,246 |
Reinvestment of distributions | 931,355 | 659,445 | 5,103,828 | 3,419,501 |
Shares redeemed | (6,021,801) | (5,739,021) | (32,701,379) | (26,100,257) |
Net increase (decrease) | 3,336,321 | 2,373,575 | $ 18,910,776 | $ 10,438,490 |
Service Class 2R | | | | |
Shares sold | 86,744 | 190,944 | $ 465,296 | $ 835,730 |
Reinvestment of distributions | 21,073 | 28,591 | 113,793 | 146,215 |
Shares redeemed | (214,247) | (212,466) | (1,182,315) | (995,434) |
Net increase (decrease) | (106,430) | 7,069 | $ (603,226) | $ (13,489) |
Investor Class | | | | |
Shares sold | 30,365,867 | 20,189,376 | $ 168,056,935 | $ 92,880,106 |
Reinvestment of distributions | 2,827,051 | 2,482,010 | 15,577,049 | 12,952,470 |
Shares redeemed | (23,797,435) | (10,842,692) | (132,684,235) | (48,580,411) |
Net increase (decrease) | 9,395,483 | 11,828,694 | $ 50,949,749 | $ 57,252,165 |
Annual Report
Notes to Financial Statements - continued
11. Other.
The Fund's organizational documents provide former and current trustees and officers with a limited indemnification against liabilities arising in connection with the performance of their duties to the Fund. In the normal course of business, the Fund may also enter into contracts that provide general indemnifications. The Fund's maximum exposure under these arrangements is unknown as this would be dependent on future claims that may be made against the Fund. The risk of material loss from such claims is considered remote.
At the end of the period, FMR or its affiliates were the owners of record of 32% of the total outstanding shares of the Fund and one otherwise unaffiliated shareholder was the owner of record of 25% of the total outstanding shares of the Fund.
Annual Report
Report of Independent Registered Public Accounting Firm
To the Trustees of Variable Insurance Products Fund and the Shareholders of VIP High Income Portfolio:
In our opinion, the accompanying statement of assets and liabilities, including the schedule of investments, and the related statements of operations and of changes in net assets and the financial highlights present fairly, in all material respects, the financial position of VIP High Income Portfolio (a fund of Variable Insurance Products Fund) at December 31, 2010, the results of its operations for the year then ended, the changes in its net assets for each of the two years in the period then ended and the financial highlights for each of the five years in the period then ended, in conformity with accounting principles generally accepted in the United States of America. These financial statements and financial highlights (hereafter referred to as "financial statements") are the responsibility of the VIP High Income Portfolio's management. Our responsibility is to express an opinion on these financial statements based on our audits. We conducted our audits of these financial statements in accordance with the standards of the Public Company Accounting Oversight Board (United States). Those standards require that we plan and perform the audit to obtain reasonable assurance about whether the financial statements are free of material misstatement. An audit includes examining, on a test basis, evidence supporting the amounts and disclosures in the financial statements, assessing the accounting principles used and significant estimates made by management, and evaluating the overall financial statement presentation. We believe that our audits, which included confirmation of securities at December 31, 2010 by correspondence with the custodian and brokers, provide a reasonable basis for our opinion.
/s/ PricewaterhouseCoopers LLP
PricewaterhouseCoopers LLP
Boston, Massachusetts
February 22, 2011
Annual Report
The Trustees, Members of the Advisory Board, and executive officers of the trust and fund, as applicable, are listed below. The Board of Trustees governs the fund and is responsible for protecting the interests of shareholders. The Trustees are experienced executives who meet periodically throughout the year to oversee the fund's activities, review contractual arrangements with companies that provide services to the fund, oversee management of the risks associated with such activities and contractual arrangements, and review the fund's performance. Except for James C. Curvey, each of the Trustees oversees 219 funds advised by FMR or an affiliate. Mr. Curvey oversees 408 funds advised by FMR or an affiliate.
The Trustees hold office without limit in time except that (a) any Trustee may resign; (b) any Trustee may be removed by written instrument, signed by at least two-thirds of the number of Trustees prior to such removal; (c) any Trustee who requests to be retired or who has become incapacitated by illness or injury may be retired by written instrument signed by a majority of the other Trustees; and (d) any Trustee may be removed at any special meeting of shareholders by a two-thirds vote of the outstanding voting securities of the trust. Each Trustee who is not an interested person (as defined in the 1940 Act) (Independent Trustee), shall retire not later than the last day of the calendar year in which his or her 72nd birthday occurs. The Independent Trustees may waive this mandatory retirement age policy with respect to individual Trustees. The executive officers and Advisory Board Members hold office without limit in time, except that any officer and Advisory Board Member may resign or may be removed by a vote of a majority of the Trustees at any regular meeting or any special meeting of the Trustees. Except as indicated, each individual has held the office shown or other offices in the same company for the past five years.
Experience, Skills, Attributes, and Qualifications of the Fund's Trustees. The Governance and Nominating Committee has adopted a statement of policy that describes the experience, qualifications, attributes, and skills that are necessary and desirable for potential Independent Trustee candidates (Statement of Policy). The Board believes that each Trustee satisfied at the time he or she was initially elected or appointed a Trustee, and continues to satisfy, the standards contemplated by the Statement of Policy. The Governance and Nominating Committee also engages professional search firms to help identify potential Independent Trustee candidates who have the experience, qualifications, attributes, and skills consistent with the Statement of Policy. From time to time, additional criteria based on the composition and skills of the current Independent Trustees, as well as experience or skills that may be appropriate in light of future changes to board composition, business conditions, and regulatory or other developments, have also been considered by the professional search firms and the Governance and Nominating Committee. In addition, the Board takes into account the Trustees' commitment and participation in Board and committee meetings, as well as their leadership of standing and ad hoc committees throughout their tenure.
In determining that a particular Trustee was and continues to be qualified to serve as a Trustee, the Board has considered a variety of criteria, none of which, in isolation, was controlling. The Board believes that, collectively, the Trustees have balanced and diverse experience, qualifications, attributes, and skills, which allow the Board to operate effectively in governing the fund and protecting the interests of shareholders. Information about the specific experience, skills, attributes, and qualifications of each Trustee, which in each case led to the Board's conclusion that the Trustee should serve (or continue to serve) as a trustee of the fund, is provided below.
Board Structure and Oversight Function. James C. Curvey is an interested person (as defined in the 1940 Act) and currently serves as Acting Chairman. The Trustees have determined that an interested Chairman is appropriate and benefits shareholders because an interested Chairman has a personal and professional stake in the quality and continuity of services provided to the fund. Independent Trustees exercise their informed business judgment to appoint an individual of their choosing to serve as Chairman, regardless of whether the Trustee happens to be independent or a member of management. The Independent Trustees have determined that they can act independently and effectively without having an Independent Trustee serve as Chairman and that a key structural component for assuring that they are in a position to do so is for the Independent Trustees to constitute a substantial majority for the Board. The Independent Trustees also regularly meet in executive session. Ned C. Lautenbach serves as Chairman of the Independent Trustees and as such (i) acts as a liaison between the Independent Trustees and management with respect to matters important to the Independent Trustees and (ii) with management prepares agendas for Board meetings.
Fidelity funds are overseen by different Boards of Trustees. The fund's Board oversees Fidelity's equity and high income funds and another Board oversees Fidelity's investment-grade bond, money market, and asset allocation funds. The asset allocation funds may invest in Fidelity funds overseen by the fund's Board. The use of separate Boards, each with its own committee structure, allows the Trustees of each group of Fidelity funds to focus on the unique issues of the funds they oversee, including common research, investment, and operational issues. On occasion, the separate Boards establish joint committees to address issues of overlapping consequences for the Fidelity funds overseen by each Board.
The Trustees operate using a system of committees to facilitate the timely and efficient consideration of all matters of importance to the Trustees, the fund, and fund shareholders and to facilitate compliance with legal and regulatory requirements and oversight of the fund's activities and associated risks. The Board, acting through its committees, has charged FMR and its affiliates with (i) identifying events or circumstances the occurrence of which could have demonstrably adverse effects on the fund's business and/or reputation; (ii) implementing processes and controls to lessen the possibility that such events or circumstances occur or to mitigate the effects of such events or circumstances if they do occur; and (iii) creating and maintaining a system designed to evaluate continuously business and market conditions in order to facilitate the identification and implementation processes described in (i) and (ii) above. Because the day-to-day operations and activities of the fund are carried out by or through FMR, its affiliates and other service providers, the fund's exposure to risks is mitigated but not eliminated by the processes overseen by the Trustees. While each of the Board's committees has responsibility for overseeing different aspects of the fund's activities, oversight is exercised primarily through the Operations, Audit, and Compliance Committees. Appropriate personnel, including but not limited to the fund's Chief Compliance Officer (CCO), FMR's internal auditor, the independent accountants, the fund's Treasurer and portfolio management personnel, make periodic reports to the Board's committees, as appropriate. The responsibilities of each committee, including their oversight responsibilities, are described further under "Standing Committees of the Fund's Trustees."
Annual Report
The fund's Statement of Additional Information (SAI) includes more information about the Trustees. To request a free copy, call Fidelity at 1-877-208-0098.
Interested Trustees*:
Correspondence intended for each Trustee who is an interested person may be sent to Fidelity Investments, 82 Devonshire Street, Boston, Massachusetts 02109.
Name, Age; Principal Occupations and Other Relevant Experience+ |
James C. Curvey (75) |
| Year of Election or Appointment: 2007 Mr. Curvey is Trustee and Acting Chairman of the Board of Trustees of certain Trusts. Mr. Curvey also serves as Trustee (2007-present) of other investment companies advised by FMR. Mr. Curvey is a Director of Fidelity Investments Money Management, Inc. (2009-present), Director of Fidelity Research & Analysis Co. (2009-present) and Director of FMR and FMR Co., Inc. (2007-present). Mr. Curvey is also Vice Chairman (2007-present) and Director of FMR LLC. In addition, Mr. Curvey serves as an Overseer for the Boston Symphony Orchestra and a member of the Trustees of Villanova University. Previously, Mr. Curvey was the Vice Chairman (2006-2007) and Director (2000-2007) of FMR Corp. |
Ronald P. O'Hanley (54) |
| Year of Election or Appointment: 2011 Mr. O'Hanley is President of Fidelity Asset Management and Corporate Services and a member of Fidelity's Executive Committee (2010-present). Previously, Mr. O'Hanley served as President and Chief Executive Officer of BNY Mellon Asset Management (2007-2010). Mr. O'Hanley also served as Vice Chairman of Bank New York Mellon Corp. and a member of that firm's Executive Committee. Prior to the 2007 merger of The Bank of New York and Mellon Financial Corporation, he was Vice Chairman of Mellon Financial Corporation and President and Chief Executive Officer of Mellon Asset Management. He joined Mellon in February 1997. Mr. O'Hanley currently serves as Chairman of the Boston Public Library Foundation Board of Directors and sits on the Board of Directors of Beth Israel Deaconess Medical Center, the Board of Trustees of the Marine Biological Laboratory and the Advisory Board of the Maxwell School of Citizenship and Public Administration at Syracuse University. Mr. O'Hanley also chairs the Council on Asset Management for the Financial Services Roundtable and is a member of the Board of Directors of Institutional Investor's U.S. Institute. |
* Trustees have been determined to be "Interested Trustees" by virtue of, among other things, their affiliation with the trust or various entities under common control with FMR.
+ The information above includes each Trustee's principal occupation during the last five years and other information relating to the experience, attributes, and skills relevant to each Trustee's qualifications to serve as a Trustee, which led to the conclusion that each Trustee should serve as a Trustee for the fund.
Independent Trustees:
Correspondence intended for each Independent Trustee (that is, the Trustees other than the Interested Trustees) may be sent to Fidelity Investments, P.O. Box 55235, Boston, Massachusetts 02205-5235.
Name, Age; Principal Occupations and Other Relevant Experience+ |
Dennis J. Dirks (62) |
| Year of Election or Appointment: 2005 Prior to his retirement in May 2003, Mr. Dirks was Chief Operating Officer and a member of the Board of The Depository Trust & Clearing Corporation (DTCC). He also served as President, Chief Operating Officer, and Board member of The Depository Trust Company (DTC) and President and Board member of the National Securities Clearing Corporation (NSCC). In addition, Mr. Dirks served as Chief Executive Officer and Board member of the Government Securities Clearing Corporation, Chief Executive Officer and Board member of the Mortgage-Backed Securities Clearing Corporation, as a Trustee and a member of the Finance Committee of Manhattan College (2005-2008), and as a Trustee and a member of the Finance Committee of AHRC of Nassau County (2006-2008). Mr. Dirks is a member of the Independent Directors Council (IDC) Governing Council (2010-Present) and Board of Directors for The Brookville Center for Children's Services, Inc. (2009-present). |
Alan J. Lacy (57) |
| Year of Election or Appointment: 2008 Mr. Lacy serves as Senior Adviser (2007-present) of Oak Hill Capital Partners, L.P. (private equity). Mr. Lacy also served as Chief Executive Officer (2000-2005) and Vice Chairman (2005-2006) of Sears Holdings Corporation and Sears, Roebuck and Co. (retail). In addition, Mr. Lacy serves as a member of the Board of Directors of The Western Union Company (global money transfer, 2006-present) and Bristol-Myers Squibb Company (global pharmaceuticals, 2007-present). Mr. Lacy is Chairman (2008-present) and a member (2006-present) of the Board of Trustees of The National Parks Conservation Association. |
Ned C. Lautenbach (66) |
| Year of Election or Appointment: 2000 Mr. Lautenbach is Chairman of the Independent Trustees of the Equity and High Income Funds (2006-present). Mr. Lautenbach currently serves as the Lead Director of the Eaton Corporation Board of Directors (diversified industrial, 1997-present). Mr. Lautenbach is also a member of the Board of Directors of the Philharmonic Center for the Arts in Naples, Florida (1999-present); a member of the Board of Trustees of Fairfield University (2005-present); and a member of the Council on Foreign Relations (1994-present). Previously, Mr. Lautenbach was a Partner/Advisory Partner at Clayton, Dubilier & Rice, Inc. (private equity investment, 1998-2010), as well as a Director of Sony Corporation (2006-2007). |
Joseph Mauriello (66) |
| Year of Election or Appointment: 2008 Prior to his retirement in January 2006, Mr. Mauriello served in numerous senior management positions including Deputy Chairman and Chief Operating Officer (2004-2005), and Vice Chairman of Financial Services (2002-2004) of KPMG LLP US (professional services, 1965-2005). Mr. Mauriello currently serves as a member of the Board of Directors of XL Group plc. (global insurance and re-insurance, 2006-present) and of Arcadia Resources Inc. (health care services and products, 2007-present). Previously, Mr. Mauriello served as a Director of the Hamilton Funds of the Bank of New York (2006-2007). |
Cornelia M. Small (66) |
| Year of Election or Appointment: 2005 Ms. Small is a member of the Board of Directors of the Teagle Foundation (2009-present). Ms. Small is also a member of the Investment Committee, and Chair (2008-present) and a member of the Board of Trustees of Smith College. In addition, Ms. Small serves on the Investment Committee of the Berkshire Taconic Community Foundation (2008-present). Previously, Ms. Small served as Chairperson of the Investment Committee (2002-2008) of Smith College. In addition, Ms. Small served as Chief Investment Officer, Director of Global Equity Investments, and a member of the Board of Directors of Scudder, Stevens & Clark and Scudder Kemper Investments. |
William S. Stavropoulos (71) |
| Year of Election or Appointment: 2001 Mr. Stavropoulos is Vice Chairman of the Independent Trustees of the Equity and High Income Funds (2006-present). Mr. Stavropoulos serves as President and Founder of the Michigan Baseball Foundation, the Great Lakes Loons (2007-present). Mr. Stavropoulos is Chairman Emeritus of the Board of Directors of The Dow Chemical Company, where he previously served in numerous senior management positions, including President, CEO (1995-2000; 2002-2004), Chairman of the Executive Committee (2000-2006), and as a member of the Board of Directors (1990-2006). Currently, Mr. Stavropoulos is Chairman of Univar (global distributor of commodity and specialty chemicals, 2010-present), a Director of Teradata Corporation (data warehousing and technology solutions, 2008-present), Chemical Financial Corporation, Maersk Inc. (industrial conglomerate), Tyco International, Inc. (multinational manufacturing and services, 2007-present), and a member of the Advisory Board for Metalmark Capital (private equity investment, 2005-present). Mr. Stavropoulos is a special advisor to Clayton, Dubilier & Rice, LLC (private equity investment). In addition, Mr. Stavropoulos is a member of the University of Notre Dame Advisory Council for the College of Science. |
David M. Thomas (61) |
| Year of Election or Appointment: 2008 Previously, Mr. Thomas served as Executive Chairman (2005-2006) and Chairman and Chief Executive Officer (2000-2005) of IMS Health, Inc. (pharmaceutical and healthcare information solutions). In addition, Mr. Thomas serves as a member of the Board of Directors of Fortune Brands, Inc. (consumer products), and Interpublic Group of Companies, Inc. (marketing communication, 2004-present). |
Michael E. Wiley (60) |
| Year of Election or Appointment: 2008 Mr. Wiley also serves as a Director of Asia Pacific Exploration Consolidated (international oil and gas exploration and production, 2008-present). Mr. Wiley serves as a Director of Tesoro Corporation (independent oil refiner and marketer, 2005-present), and a Director of Bill Barrett Corporation (exploration and production, 2005-present). In addition, Mr. Wiley also serves as a Director of Post Oak Bank (privately-held bank, 2004-present). Previously, Mr. Wiley served as a member of the Board of Trustees of the University of Tulsa (2000-2006; 2007-2010), as a Senior Energy Advisor of Katzenbach Partners, LLC (consulting, 2006-2007), as an Advisory Director of Riverstone Holdings (private investment), Chairman, President, and CEO of Baker Hughes, Inc. (oilfield services, 2000-2004), and as Director of Spinnaker Exploration Company (exploration and production, 2001-2005). |
+ The information above includes each Trustee's principal occupation during the last five years and other information relating to the experience, attributes, and skills relevant to each Trustee's qualifications to serve as a Trustee, which led to the conclusion that each Trustee should serve as a Trustee for the fund.
Advisory Board Members and Executive Officers:
Correspondence intended for each executive officer, Edward C. Johnson 3d, and Peter S. Lynch may be sent to Fidelity Investments, 82 Devonshire Street, Boston, Massachusetts 02109.
Name, Age; Principal Occupation |
Edward C. Johnson 3d (80) |
| Year of Election or Appointment: 2011 Member of the Advisory Board of Fidelity's Equity and High Income Funds. Formerly Trustee and Chairman of the Board of Trustees of certain Trusts, Mr. Johnson serves as Chief Executive Officer, Chairman, and a Director of FMR LLC; Chairman and a Director of FMR; and Chairman and a Director of FMR Co., Inc. In addition, Mr. Johnson serves as Chairman and Director of FIL Limited. Previously, Mr. Johnson served as President of FMR LLC (2006-2007). |
Peter S. Lynch (66) |
| Year of Election or Appointment: 2003 Member of the Advisory Board of Fidelity's Equity and High Income Funds. Mr. Lynch is Vice Chairman and a Director of FMR and FMR Co., Inc. In addition, Mr. Lynch serves as a Trustee of Boston College and as the Chairman of the Inner-City Scholarship Fund. Previously, Mr. Lynch served on the Special Olympics International Board of Directors (1997-2006). |
Kenneth B. Robins (41) |
| Year of Election or Appointment: 2008 President and Treasurer of Fidelity's Equity and High Income Funds. Mr. Robins also serves as President and Treasurer (2010-present) and Assistant Treasurer (2009-present) of other Fidelity funds and is an employee of Fidelity Investments (2004-present). Previously, Mr. Robins served as Deputy Treasurer of the Fidelity funds (2005-2008) and Treasurer and Chief Financial Officer of The North Carolina Capital Management Trust: Cash and Term Portfolios (2006-2008). |
Brian B. Hogan (46) |
| Year of Election or Appointment: 2009 Vice President of certain Equity Funds and Vice President of Sector Funds. Mr. Hogan also serves as President of FMR's Equity Division (2009-present). Previously, Mr. Hogan served as Senior Vice President, Equity Research of FMR (2006-2009) and as a portfolio manager. |
Thomas C. Hense (46) |
| Year of Election or Appointment: 2008 or 2010 Vice President of Fidelity's High Income (2008), Small Cap (2008), and Value (2010) Funds. Previously, Mr. Hense served as a portfolio manager for Fidelity's Institutional Money Management Group (Pyramis) (2003-2008). |
Scott C. Goebel (42) |
| Year of Election or Appointment: 2008 Secretary and Chief Legal Officer (CLO) of the Fidelity funds. Mr. Goebel also serves as Secretary and CLO of The North Carolina Capital Management Trust: Cash and Term Portfolio (2008-present); General Counsel, Secretary, and Senior Vice President of FMR (2008-present) and FMR Co., Inc. (2008-present); Deputy General Counsel of FMR LLC; Chief Legal Officer of Fidelity Management & Research (Hong Kong) Limited (2008-present) and Assistant Secretary of Fidelity Management & Research (Japan) Inc. (2008-present), Fidelity Investments Money Management, Inc. (2008-present), Fidelity Management & Research (U.K.) Inc. (2008-present), and Fidelity Research and Analysis Company (2008-present). Previously, Mr. Goebel served as Assistant Secretary of the Funds (2007-2008) and as Vice President and Secretary of Fidelity Distributors Corporation (FDC) (2005-2007). |
William C. Coffey (41) |
| Year of Election or Appointment: 2009 Assistant Secretary of Fidelity's Equity and High Income Funds. Mr. Coffey also serves as Senior Vice President and Deputy General Counsel of FMR LLC (2010-present), and is an employee of Fidelity Investments. Previously, Mr. Coffey served as Vice President and Associate General Counsel of FMR LLC (2005-2009). |
Holly C. Laurent (56) |
| Year of Election or Appointment: 2008 Anti-Money Laundering (AML) Officer of the Fidelity funds. Ms. Laurent also serves as AML Officer of The North Carolina Capital Management Trust: Cash and Term Portfolio (2008-present) and is an employee of Fidelity Investments. Previously, Ms. Laurent was Senior Vice President and Head of Legal for Fidelity Business Services India Pvt. Ltd. (2006-2008), and Senior Vice President, Deputy General Counsel and Group Head for FMR LLC (2005-2006). |
Christine Reynolds (52) |
| Year of Election or Appointment: 2008 Chief Financial Officer of the Fidelity funds. Ms. Reynolds became President of Fidelity Pricing and Cash Management Services (FPCMS) in August 2008. Ms. Reynolds served as Chief Operating Officer of FPCMS (2007-2008). Previously, Ms. Reynolds served as President, Treasurer, and Anti-Money Laundering officer of the Fidelity funds (2004-2007). |
Kenneth A. Rathgeber (63) |
| Year of Election or Appointment: 2004 Chief Compliance Officer of Fidelity's Equity and High Income Funds. Mr. Rathgeber is Chief Compliance Officer of Fidelity Management & Research (Hong Kong) Limited (2008-present), Fidelity Management & Research (Japan) Inc. (2008-present), FMR (2005-present), FMR Co., Inc. (2005-present), Fidelity Management & Research (U.K.) Inc. (2005-present), Fidelity Research & Analysis Company (2005-present), Fidelity Investments Money Management, Inc. (2005-present), Pyramis Global Advisors, LLC (2005-present), and Strategic Advisers, Inc. (2005-present). |
Jeffrey S. Christian (49) |
| Year of Election or Appointment: 2009 Deputy Treasurer of the Fidelity funds. Mr. Christian is an employee of Fidelity Investments. Previously, Mr. Christian served as Chief Financial Officer (2008-2009) of certain Fidelity funds and Senior Vice President of Fidelity Pricing and Cash Management Services (FPCMS) (2004-2009). |
Bryan A. Mehrmann (49) |
| Year of Election or Appointment: 2005 Deputy Treasurer of the Fidelity funds. Mr. Mehrmann is an employee of Fidelity Investments. |
Adrien E. Deberghes (43) |
| Year of Election or Appointment: 2008 Deputy Treasurer of Fidelity's Equity and High Income Funds. Mr. Deberghes also serves as Assistant Treasurer of other Fidelity funds (2010-present) and is an employee of Fidelity Investments (2008-present). Previously, Mr. Deberghes served as Senior Vice President of Mutual Fund Administration at State Street Corporation (2007-2008), Senior Director of Mutual Fund Administration at Investors Bank & Trust (2005-2007), and Director of Finance for Dunkin' Brands (2000-2005). |
Stephanie J. Dorsey (41) |
| Year of Election or Appointment: 2010 Assistant Treasurer of Fidelity's Equity and High Income Funds. Ms. Dorsey also serves as Deputy Treasurer of other Fidelity funds (2008-present) and is an employee of Fidelity Investments (2008-present). Previously, Ms. Dorsey served as Treasurer (2004-2008) of the JPMorgan Mutual Funds and Vice President (2004-2008) of JPMorgan Chase Bank. |
John R. Hebble (52) |
| Year of Election or Appointment: 2009 Assistant Treasurer of Fidelity's Equity and High Income Funds. Mr. Hebble also serves as Treasurer and Chief Financial Officer of The North Carolina Capital Management Trust: Cash and Term Portfolio (2008-present), President and Treasurer of other Fidelity funds (2008-present) and is an employee of Fidelity Investments. |
Gary W. Ryan (52) |
| Year of Election or Appointment: 2005 Assistant Treasurer of the Fidelity funds. Mr. Ryan is an employee of Fidelity Investments. Previously, Mr. Ryan served as Vice President of Fund Reporting in Fidelity Pricing and Cash Management Services (FPCMS) (1999-2005). |
Jonathan Davis (42) |
| Year of Election or Appointment: 2010 Assistant Treasurer of the Fidelity funds. Mr. Davis is an employee of Fidelity Investments. Previously, Mr. Davis served as Vice President and Associate General Counsel of FMR LLC (2003-2010). |
Annual Report
Board Approval of Investment Advisory Contracts and Management Fees
VIP High Income Portfolio
Each year, the Board of Trustees, including the Independent Trustees (together, the Board), votes on the renewal of the management contract and sub-advisory agreements (together, the Advisory Contracts) for the fund. The Board, assisted by the advice of fund counsel and Independent Trustees' counsel, requests and considers a broad range of information relevant to the renewal of the Advisory Contracts throughout the year.
The Board meets regularly and considers at each of its meetings factors that are relevant to its annual consideration of the renewal of the fund's Advisory Contracts, including the services and support provided to the fund and its shareholders. The Board has established various standing committees, each composed of Independent Trustees with varying backgrounds, to which the Board has assigned specific subject matter responsibilities in order to enhance effective decision-making by the Board. The Board, acting directly and through its Committees, requests and receives information concerning the annual consideration of the renewal of the fund's Advisory Contracts. The Board also meets as needed to consider matters specifically related to the Board's annual consideration of the renewal of Advisory Contracts. Members of the Board may also meet with trustees of other Fidelity funds through ad hoc joint committees to discuss certain matters relevant to the Fidelity funds.
At its July 2010 meeting, the Board of Trustees, including the Independent Trustees, unanimously determined to renew the fund's Advisory Contracts. In reaching its determination, the Board considered all factors it believed relevant, including (i) the nature, extent, and quality of the services to be provided to the fund and its shareholders (including the investment performance of the fund); (ii) the competitiveness of the fund's management fee and total expenses; (iii) the total costs of the services to be provided by and the profits to be realized by Fidelity from its relationship with the fund; (iv) the extent to which economies of scale would be realized as the fund grows; and (v) whether fee levels reflect these economies of scale, if any, for the benefit of fund shareholders.
In considering whether to renew the Advisory Contracts for the fund, the Board reached a determination, with the assistance of fund counsel and Independent Trustees' counsel and through the exercise of its business judgment, that the renewal of the Advisory Contracts is in the best interests of fund shareholders and that the compensation to be received by Fidelity under the management contract is fair and reasonable. The Board's decision to renew the Advisory Contracts was not based on any single factor noted above, but rather was based on a comprehensive consideration of all the information provided to the Board at its meetings throughout the year. The Board, in reaching its determination to renew the Advisory Contracts, is aware that shareholders in the fund have a broad range of investment choices available to them, including a wide choice among mutual funds offered by Fidelity's competitors, and that the fund's shareholders, with the opportunity to review and weigh the disclosure provided by the fund in its prospectus and other public disclosures, have chosen to invest in this fund, managed by Fidelity.
Nature, Extent, and Quality of Services Provided. The Board considered the staffing within the investment adviser, FMR, and the sub-advisers (together, the Investment Advisers), including the backgrounds of the fund's investment personnel and the fund's investment objective and discipline. The Independent Trustees also had discussions with senior management of Fidelity's investment operations and investment groups. The Board considered the structure of the portfolio manager compensation program and whether this structure provides appropriate incentives to act in the best interest of the fund.
Resources Dedicated to Investment Management and Support Services. The Board and the equity research subcommittee of the Board's Fund Oversight Committee reviewed the size, education, and experience of the Investment Advisers' investment staff, their use of technology, and the Investment Advisers' approach to recruiting, training, and retaining portfolio managers and other research, advisory, and management personnel. The Board noted that Fidelity's analysts have access to a variety of technological tools and market and securities data that enable them to perform both fundamental and quantitative analysis and to specialize in various disciplines. The Board considered Fidelity's extensive global research capabilities that enable the Investment Advisers to aggregate data from various sources in an effort to produce positive investment results. The Board also considered that Fidelity's portfolio managers and analysts have access to daily portfolio attribution that allows for monitoring of a fund's portfolio, as well as an electronic communication system that provides immediate real-time access to research concerning issuers and credit enhancers. The Board noted FMR's continued focus on strengthening the organization and discipline of equity portfolio management and research.
Shareholder and Administrative Services. The Board considered (i) the nature, extent, quality, and cost of advisory, administrative, and shareholder services performed by the Investment Advisers and their affiliates under the Advisory Contracts and under separate agreements covering transfer agency, pricing and bookkeeping, and securities lending services for the fund; (ii) the nature and extent of the investment adviser's supervision of third party service providers, principally custodians and subcustodians; and (iii) the resources devoted to, and the record of compliance with, the fund's compliance policies and procedures. The Board also reviewed the allocation of fund brokerage, including allocations to brokers affiliated with the Investment Advisers, the use of brokerage commissions to pay fund expenses, and the use of "soft" commission dollars to pay for research services.
The Board noted that the growth of fund assets over time across the complex allows Fidelity to reinvest in the development of services designed to enhance the value or convenience of the Fidelity funds as investment vehicles. These services include 24-hour access to account information and market information through phone representatives and over the Internet, and investor education materials and asset allocation tools.
Investment in a Large Fund Family. The Board considered the benefits to shareholders of investing in a Fidelity fund, including the benefits of investing in a fund that is part of a large family of funds offering a variety of investment disciplines and providing a large variety of mutual fund investor services. The Board noted that Fidelity had taken, or had made recommendations that resulted in the Fidelity funds taking, a number of actions over the previous year that benefited particular funds, including (i) dedicating additional resources to investment research and restructuring and broadening the focus of the investment research teams; (ii) bolstering the senior management team that oversees asset management; (iii) launching Class F of certain funds as a lower-fee class available to Freedom K and Freedom Index Funds; (iv) lowering the initial investment minimums and ongoing balance requirements for Real Estate High Income Fund; (v) eliminating subsequent purchase minimums for all funds and adding a waiver of the investment minimum requirement for new accounts opened with the proceeds of a systematic withdrawal plan; (vi) eliminating the withdrawal minimum and maximum limits for systematic withdrawals from Advisor funds; (vii) expanding sales load waivers on Class A shares for Destiny Planholders and expanding Institutional Class eligibility for Class O Destiny Planholders; and (viii) changing certain Class A and Class T sales charge structures to further align them with industry practices.
Annual Report
Investment Performance. The Board considered whether the fund has operated in accordance with its investment objective, as well as its record of compliance with its investment restrictions. It also reviewed the fund's absolute investment performance for each class, as well as the fund's relative investment performance for each class measured over multiple periods against (i) a broad-based securities market index, and (ii) a peer group of mutual funds deemed appropriate by Fidelity and reviewed by the Board. The following charts considered by the Board show, over the one-, three-, and five-year periods ended December 31, 2009, the cumulative total returns of Initial Class and Service Class 2 of the fund, the cumulative total returns of a broad-based securities market index ("benchmark"), and a range of cumulative total returns of a peer group of mutual funds identified by Lipper Inc. as having an investment objective similar to that of the fund. The returns of Initial Class and Service Class 2 show the performance of the highest and lowest performing classes, respectively (based on five-year performance). The box within each chart shows the 25th percentile return (bottom of box) and the 75th percentile return (top of box) of the peer group. Returns shown above the box are in the first quartile and returns shown below the box are in the fourth quartile. The percentage beaten numbers noted below each chart correspond to the percentile box and represent the percentage of funds in the peer group whose performance was equal to or lower than that of the class indicated.
VIP High Income Portfolio
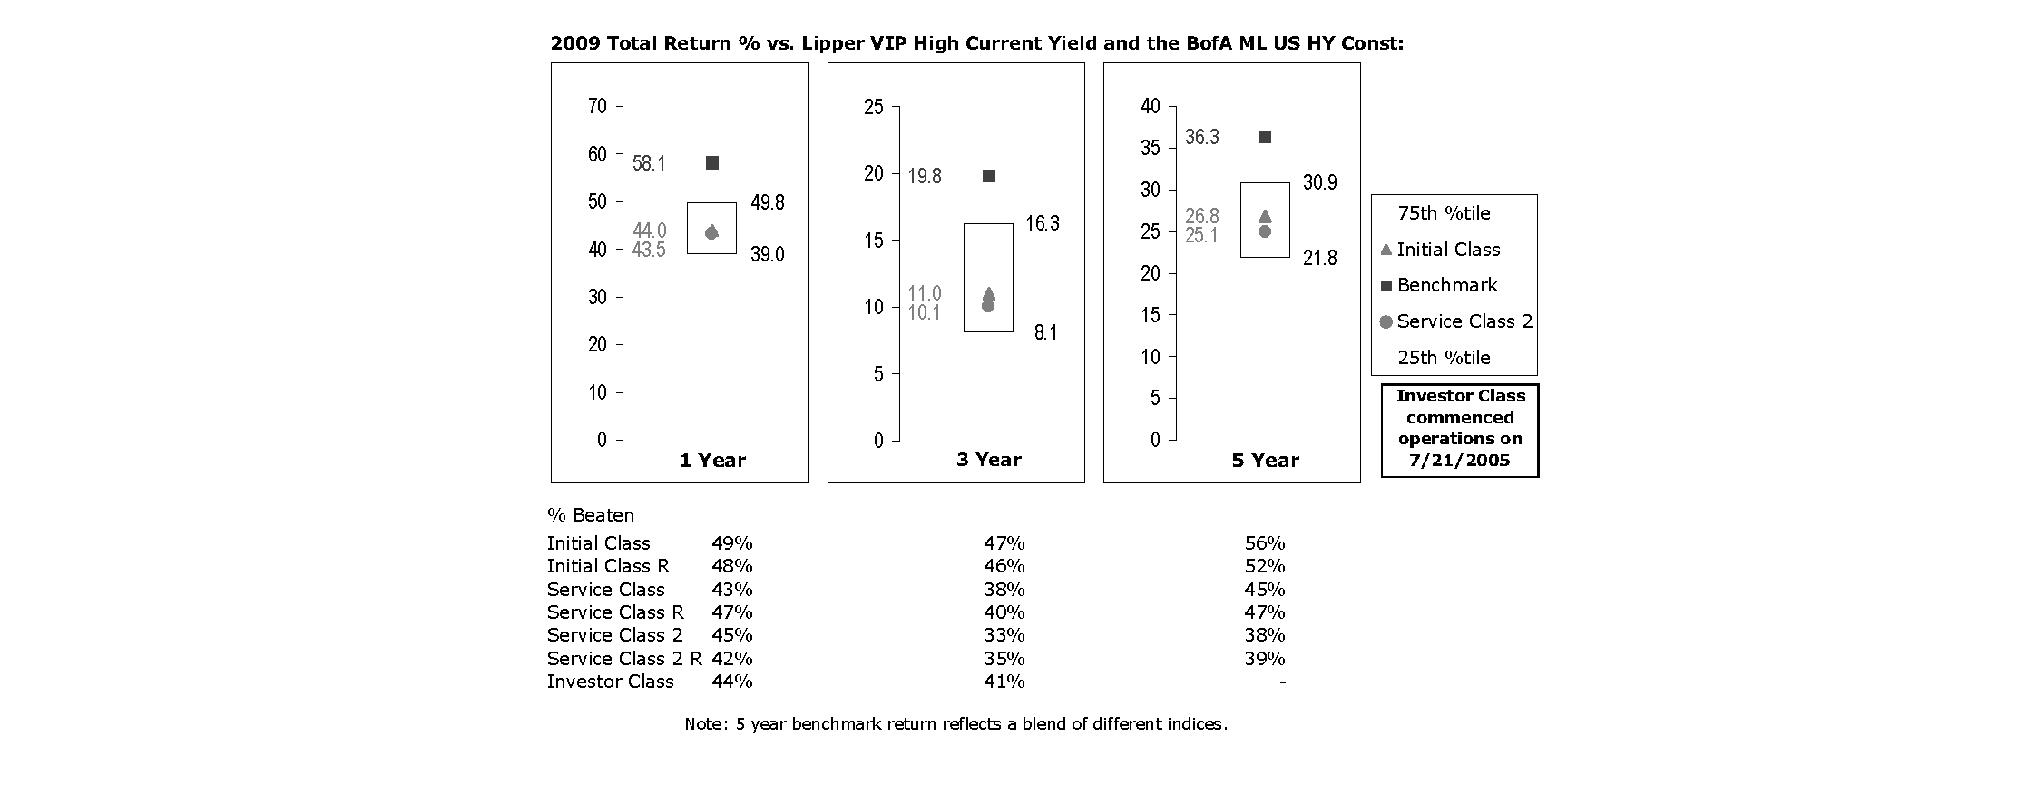
The Board reviewed the fund's relative investment performance against its peer group and noted that the performance of Initial Class of the fund was in the third quartile for the one- and three-year periods and the second quartile for the five-year period. The Board also noted that the investment performance of the fund was lower than its benchmark for all the periods shown. The Board considered that the variations in performance among the fund's classes reflect the variations in class expenses, which result in lower performance for higher expense classes. The Board discussed with FMR actions that have been taken by FMR to improve the fund's more recent disappointing performance relative to its peer group and benchmark. The Board also reviewed the fund's performance since inception as well as performance in the current year. The Board will continue to closely monitor the performance of the fund in the coming year and discuss with FMR other appropriate actions to address the performance of the fund.
Based on its review, and giving particular weight to the nature and quality of the resources dedicated by the Investment Advisers to maintain and improve relative performance and factoring in the unprecedented market events in recent years, the Board concluded that the nature, extent, and quality of investment management and support services and of shareholder and administrative services provided to the fund will benefit the fund's shareholders, particularly in light of the Board's view that the fund's shareholders benefit from investing in a fund that is part of a large family of funds offering a variety of investment disciplines and services.
Competitiveness of Management Fee and Total Fund Expenses. The Board considered the fund's management fee and total expenses compared to "mapped groups" of competitive funds and classes. Fidelity creates "mapped groups" by combining similar Lipper investment objective categories that have comparable management fee characteristics. Combining Lipper investment objective categories aids the Board's management fee and total expense comparisons by broadening the competitive group used for comparison and by reducing the number of universes to which various Fidelity funds are compared.
Annual Report
Board Approval of Investment Advisory Contracts and Management Fees - continued
Management Fee. The Board considered two proprietary management fee comparisons for the 12-month periods shown in the chart below. The group of Lipper funds used by the Board for management fee comparisons is referred to below as the "Total Mapped Group." The Total Mapped Group is broader than the Lipper peer group used by the Board for performance comparisons because the Total Mapped Group combines several Lipper investment objective categories while the Lipper peer group does not. The Total Mapped Group comparison focuses on a fund's standing relative to the total universe of comparable funds available to investors, in terms of gross management fees before expense reimbursements or caps. "TMG %" represents the percentage of funds in the Total Mapped Group that had management fees that were lower than the fund's. For example, a TMG % of 24% means that 76% of the funds in the Total Mapped Group had higher management fees than the fund. The "Asset-Size Peer Group" (ASPG) comparison focuses on a fund's standing relative to non-Fidelity funds similar in size to the fund within the Total Mapped Group. The ASPG represents at least 15% of the funds in the Total Mapped Group with comparable asset size and management fee characteristics, subject to a minimum of 50 funds (or all funds in the Total Mapped Group if fewer than 50). Additional information, such as the ASPG quartile in which the fund's management fee ranked, is also included in the chart and considered by the Board.
VIP High Income Portfolio
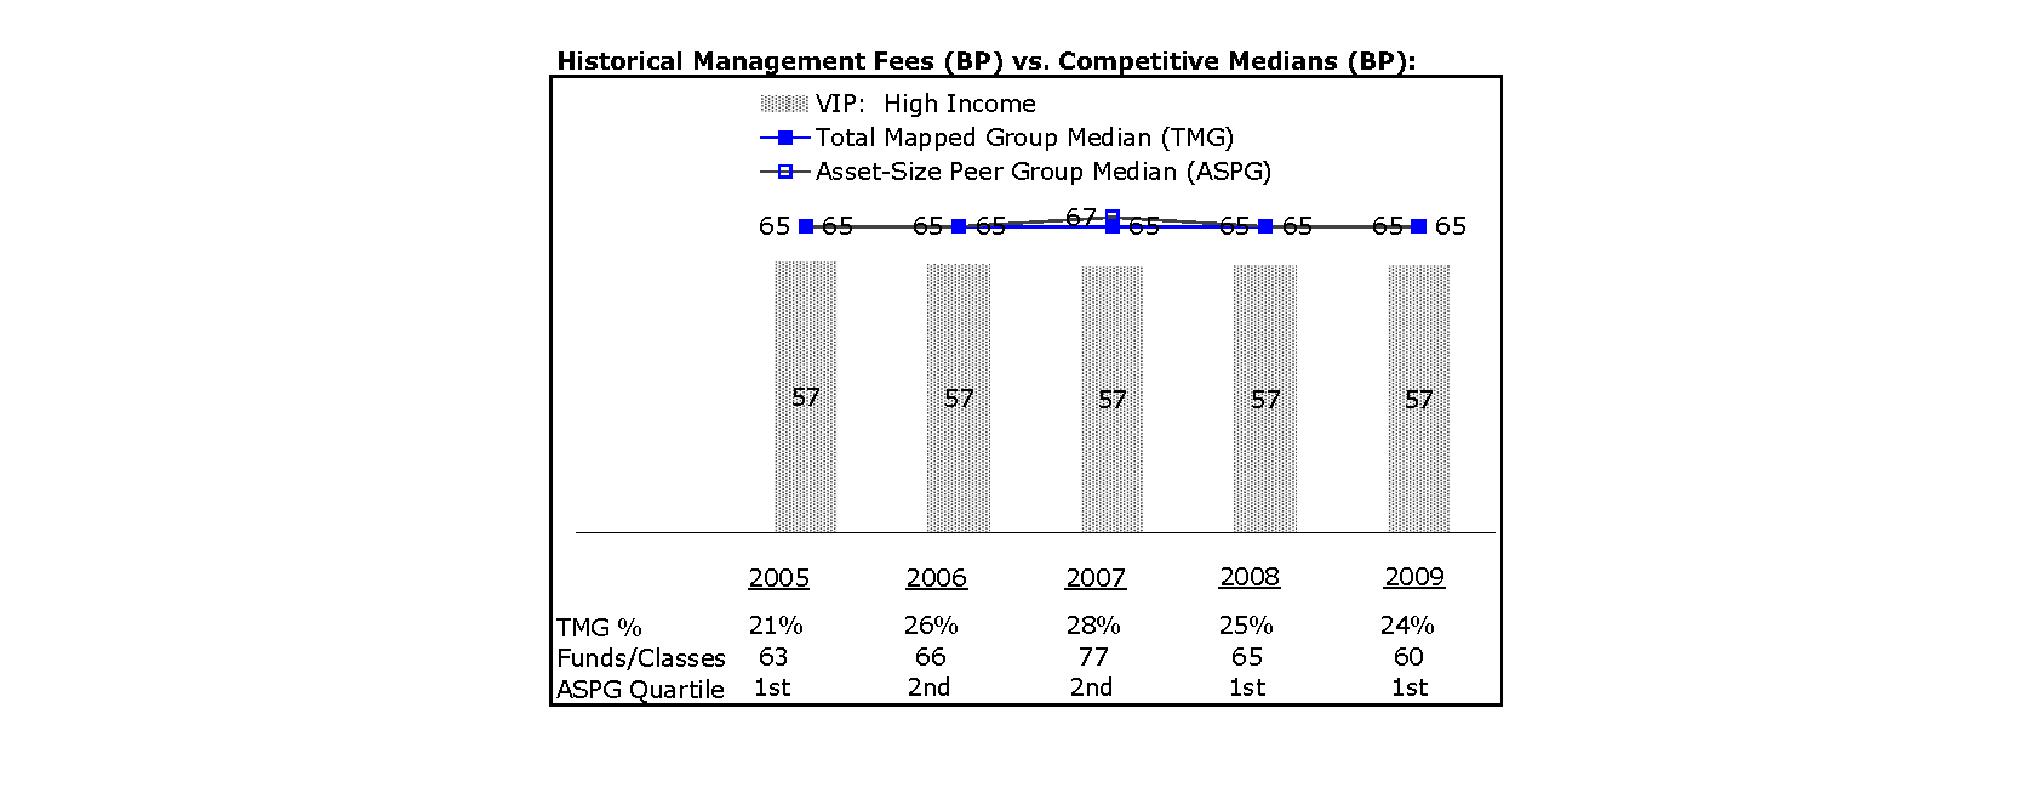
The Board noted that the fund's management fee ranked below the median of its Total Mapped Group and below the median of its ASPG for 2009.
Based on its review, the Board concluded that the fund's management fee is fair and reasonable in light of the services that the fund receives and the other factors considered.
Total Expenses. In its review of each class's total expenses, the Board considered the fund's management fee as well as other fund or class expenses, as applicable, such as transfer agent fees, pricing and bookkeeping fees, fund-paid 12b-1 fees, and custodial, legal, and audit fees. The Board also noted the effects of any waivers and reimbursements on fees and expenses. As part of its review, the Board also considered current and historical total expenses of each class of the fund compared to competitive fund median expenses. Each class of the fund is compared to those funds and classes in the Total Mapped Group (used by the Board for management fee comparisons) that have a similar sales load structure.
The Board noted that the total expenses of each of Initial Class, Initial Class R, Investor Class, Service Class, and Service Class R ranked below its competitive median for 2009 and the total expenses of each of Service Class 2 and Service Class 2 R ranked above its competitive median for 2009. The Board noted that the fund offers multiple classes, each of which has a different 12b-1 fee structure, and that the multiple structures are intended to offer a range of pricing options for the intermediary market. The Board also noted that the total expenses of the classes vary primarily by the level of their 12b-1 fees, although differences in transfer agent fees may also cause expenses to vary from class to class.
Fees Charged to Other Fidelity Clients. The Board also considered Fidelity fee structures and other information with respect to clients of FMR and its affiliates, such as other mutual funds advised or subadvised by FMR or its affiliates, pension plan clients, and other institutional clients. In March 2010, the Board created an ad hoc joint committee with the board of other Fidelity funds (the Committee) to review and compare Fidelity's institutional investment advisory business with its business of providing services to the Fidelity funds, including the differences in services provided, fees charged, and costs incurred, as well as competition in their respective marketplaces.
Annual Report
Based on its review of total expenses and fees charged to other Fidelity clients, the Board concluded that the total expenses of each class of the fund were reasonable, although in some cases above the median of the universe presented for comparison, in light of the services that the fund and its shareholders receive and the other factors considered, including the findings of the Committee.
Costs of the Services and Profitability. The Board considered the revenues earned and the expenses incurred by Fidelity in conducting the business of developing, marketing, distributing, managing, administering and servicing the fund and its shareholders. The Board also considered the level of Fidelity's profits in respect of all the Fidelity funds.
On an annual basis, FMR presents to the Board Fidelity's profitability for the fund. Fidelity calculates the profitability for each fund, as well as aggregate profitability for groups of Fidelity funds and all Fidelity funds, using a series of detailed revenue and cost allocation methodologies which originate with the audited books and records of Fidelity. The Audit Committee of the Board reviews any significant changes from the prior year's methodologies.
PricewaterhouseCoopers LLP (PwC), independent registered public accounting firm and auditor to Fidelity and certain Fidelity funds, has been engaged annually by the Board as part of the Board's assessment of Fidelity's profitability analysis. PwC's engagement includes the review and assessment of Fidelity's methodologies used in determining the revenues and expenses attributable to Fidelity's mutual fund business, and completion of agreed-upon procedures surrounding the mathematical accuracy of fund profitability and its conformity to allocation methodologies. After considering PwC's reports issued under the engagement and information provided by Fidelity, the Board believes that while other allocation methods may also be reasonable, Fidelity's profitability methodologies are reasonable in all material respects.
The Board has also reviewed Fidelity's non-fund businesses and fall-out benefits related to the mutual fund business as well as cases where Fidelity's affiliates may benefit from or be related to the fund's business.
The Board considered the costs of the services provided by and the profits realized by Fidelity in connection with the operation of the fund and were satisfied that the profitability was not excessive in the circumstances.
Economies of Scale. The Board considered whether there have been economies of scale in respect of the management of the Fidelity funds, whether the Fidelity funds (including the fund) have appropriately benefited from any such economies of scale, and whether there is potential for realization of any further economies of scale. The Board considered the extent to which the fund will benefit from economies of scale through increased services to the fund, through waivers or reimbursements, or through fee or expense reductions.
In February 2009, the Board and the board of other Fidelity funds created an ad hoc committee (the Economies of Scale Committee) to analyze whether FMR attains economies of scale in respect of the management and servicing of the Fidelity funds, whether the Fidelity funds have appropriately benefited from such economies of scale, and whether there is potential for realization of any further economies of scale.
The Board recognized that the fund's management contract incorporates a "group fee" structure, which provides for lower group fee rates as total fund assets under FMR's management increase, and for higher group fee rates as total fund assets under FMR's management decrease. FMR calculates the group fee rates based on a tiered asset "breakpoint" schedule that varies based on asset class. The Board considered that the group fee is designed to deliver the benefits of economies of scale to fund shareholders when total Fidelity fund assets increase, even if assets of any particular fund are unchanged or have declined, because some portion of Fidelity's costs are attributable to services provided to all Fidelity funds, and all funds benefit if those costs can be allocated among more assets. The Board concluded that, given the group fee structure, fund shareholders will benefit from lower management fees as assets under FMR's management increase at the fund complex level, regardless of whether Fidelity achieves any such economies of scale.
The Board concluded, considering the findings of the Economies of Scale Committee, that any potential economies of scale are being appropriately shared between fund shareholders and Fidelity.
Additional Information Requested by the Board. In order to develop fully the factual basis for consideration of the Fidelity funds' Advisory Contracts, the Board requested and received additional information on certain topics, including (i) fund performance trends, actions to be taken by FMR to improve certain funds' overall performance, and Fidelity's long-term strategies for certain funds; (ii) portfolio manager changes that have occurred during the past year and length of portfolio manager tenure for different categories of funds over time; (iii) Fidelity's compensation structure for portfolio managers, research analysts, and other key personnel, the rationale for the compensation structure, and how the compensation structure provides appropriate performance incentives; (iv) the amount of the investment that each portfolio manager has made in the Fidelity fund(s) that he or she manages; (v) management and other fees paid by FMR to affiliated sub-advisers on behalf of the Fidelity funds; (vi) Fidelity's fee structures and rationale for recommending different fees among different categories of funds; (vii) Fidelity's rationale for recommending which funds should have a performance adjustment component as part of their management fees; (viii) the rationale for any differences between fund fee structures and fee structures in place for other Fidelity clients; and (ix) explanations regarding the relative total expenses borne by certain funds and classes, total expense competitive trends, and actions that might be taken by FMR to reduce total expenses for certain funds and classes.
Based on its evaluation of all of the conclusions noted above, and after considering all factors it believed relevant, the Board ultimately concluded that the advisory fee structures are fair and reasonable, and that the fund's Advisory Contracts should be renewed.
Annual Report
Investment Adviser
Fidelity Management & Research Company
Boston, MA
Investment Sub-Advisers
FMR Co., Inc.
Fidelity Management & Research (U.K.) Inc.
Fidelity Management & Research (Hong Kong) Limited
Fidelity Management & Research (Japan) Inc.
General Distributor
Fidelity Distributors Corporation
Boston, MA
Transfer and Service Agents
Fidelity Investments Institutional Operations Company, Inc.
Boston, MA
Fidelity Service Company, Inc.
Boston, MA
Custodian
The Bank of New York Mellon
New York, NY
VIPHI-ANN-0211
1.540029.113
Fidelity® Variable Insurance Products:
High Income Portfolio - Class R
Annual Report
December 31, 2010
(2_fidelity_logos) (Registered_Trademark)
Contents
Performance | <Click Here> | How the fund has done over time. |
Management's Discussion of Fund Performance | <Click Here> | The Portfolio Manager's review of fund performance and strategy. |
Shareholder Expense Example | <Click Here> | An example of shareholder expenses. |
Investment Changes | <Click Here> | A summary of major shifts in the fund's investments over the past six months. |
Investments | <Click Here> | A complete list of the fund's investments with their market values. |
Financial Statements | <Click Here> | Statements of assets and liabilities, operations, and changes in net assets, as well as financial highlights. |
Notes | <Click Here> | Notes to the financial statements. |
Report of Independent Registered Public Accounting Firm | <Click Here> | |
Trustees and Officers | <Click Here> | |
Board Approval of Investment Advisory Contracts and Management Fees | <Click Here> | |
To view a fund's proxy voting guidelines and proxy voting record for the 12-month period ended June 30, visit http://www.fidelity.com/proxyvotingresults or visit the Securities and Exchange Commission's (SEC) web site at http://www.sec.gov. You may also call 1-877-208-0098 to request a free copy of the proxy voting guidelines.
Fidelity Variable Insurance Products are separate account options which are purchased through a variable insurance contract.
Standard & Poor's, S&P and S&P 500 are registered service marks of The McGraw-Hill Companies, Inc. and have been licensed for use by Fidelity Distributors Corporation.
Other third party marks appearing herein are the property of their respective owners.
All other marks appearing herein are registered or unregistered trademarks or service marks of FMR LLC or an affiliated company.
The general research services agreement with Fidelity Research & Analysis Company has been terminated and is no longer in effect for the fund.
This report and the financial statements contained herein are submitted for the general information of the shareholders of the fund. This report is not authorized for distribution to prospective investors in the fund unless preceded or accompanied by an effective prospectus.
A fund files its complete schedule of portfolio holdings with the SEC for the first and third quarters of each fiscal year on Form N-Q. Forms N-Q are available on the SEC's web site at http://www.sec.gov. A fund's Forms N-Q may be reviewed and copied at the SEC's Public Reference Room in Washington, DC. Information regarding the operation of the SEC's Public Reference Room may be obtained by calling 1-800-SEC-0330. For a complete list of a fund's portfolio holdings, view the most recent holdings listing, semiannual report, or annual report on Fidelity's web site at http://www.fidelity.com, http://www.advisor.fidelity.com, or http://www.401k.com, as applicable.
NOT FDIC INSURED • MAY LOSE VALUE • NO BANK GUARANTEE
Neither the fund nor Fidelity Distributors Corporation is a bank.
Annual Report
Average annual total return reflects the change in the value of an investment, assuming reinvestment of the class' distributions from dividend income and capital gains (the profits earned upon the sale of securities that have grown in value, if any) and assuming a constant rate of performance each year. During periods of reimbursement by Fidelity, a fund's total return will be greater than it would be had the reimbursement not occurred. Performance numbers are net of all underlying fund operating expenses, but do not include any insurance charges imposed by your insurance company's separate account. If performance information included the effect of these additional charges, the total returns would have been lower. How a fund did yesterday is no guarantee of how it will do tomorrow.
Average Annual Total Returns
Periods ended December 31, 2010 | Past 1
year | Past 5
years | Past 10
years |
VIP High Income Portfolio - Initial Class R A | 13.88% | 7.04% | 6.26% |
VIP High Income Portfolio - Service Class R B | 13.66% | 6.93% | 6.17% |
VIP High Income Portfolio - Service Class 2R C | 13.79% | 6.82% | 6.03% |
A The initial offering of Initial Class R shares took place on April 14, 2004. Returns prior to April 14, 2004 are those of Initial Class.
B The initial offering of Service Class R shares took place on April 14, 2004. Returns prior to April 14, 2004 are those of Service Class.
C The initial offering of Service Class 2R shares took place on April 14, 2004. Returns prior to April 14, 2004 are those of Service Class 2.
$10,000 Over 10 Years
Let's say hypothetically that $10,000 was invested in VIP High Income Portfolio - Initial Class R on December 31, 2000. The chart shows how the value of your investment would have changed, and also shows how The BofA Merrill LynchSM US High Yield Constrained Index performed over the same period. The initial offering of Initial Class R took place on April 14, 2004. See above for additional information regarding the performance of Initial Class R.
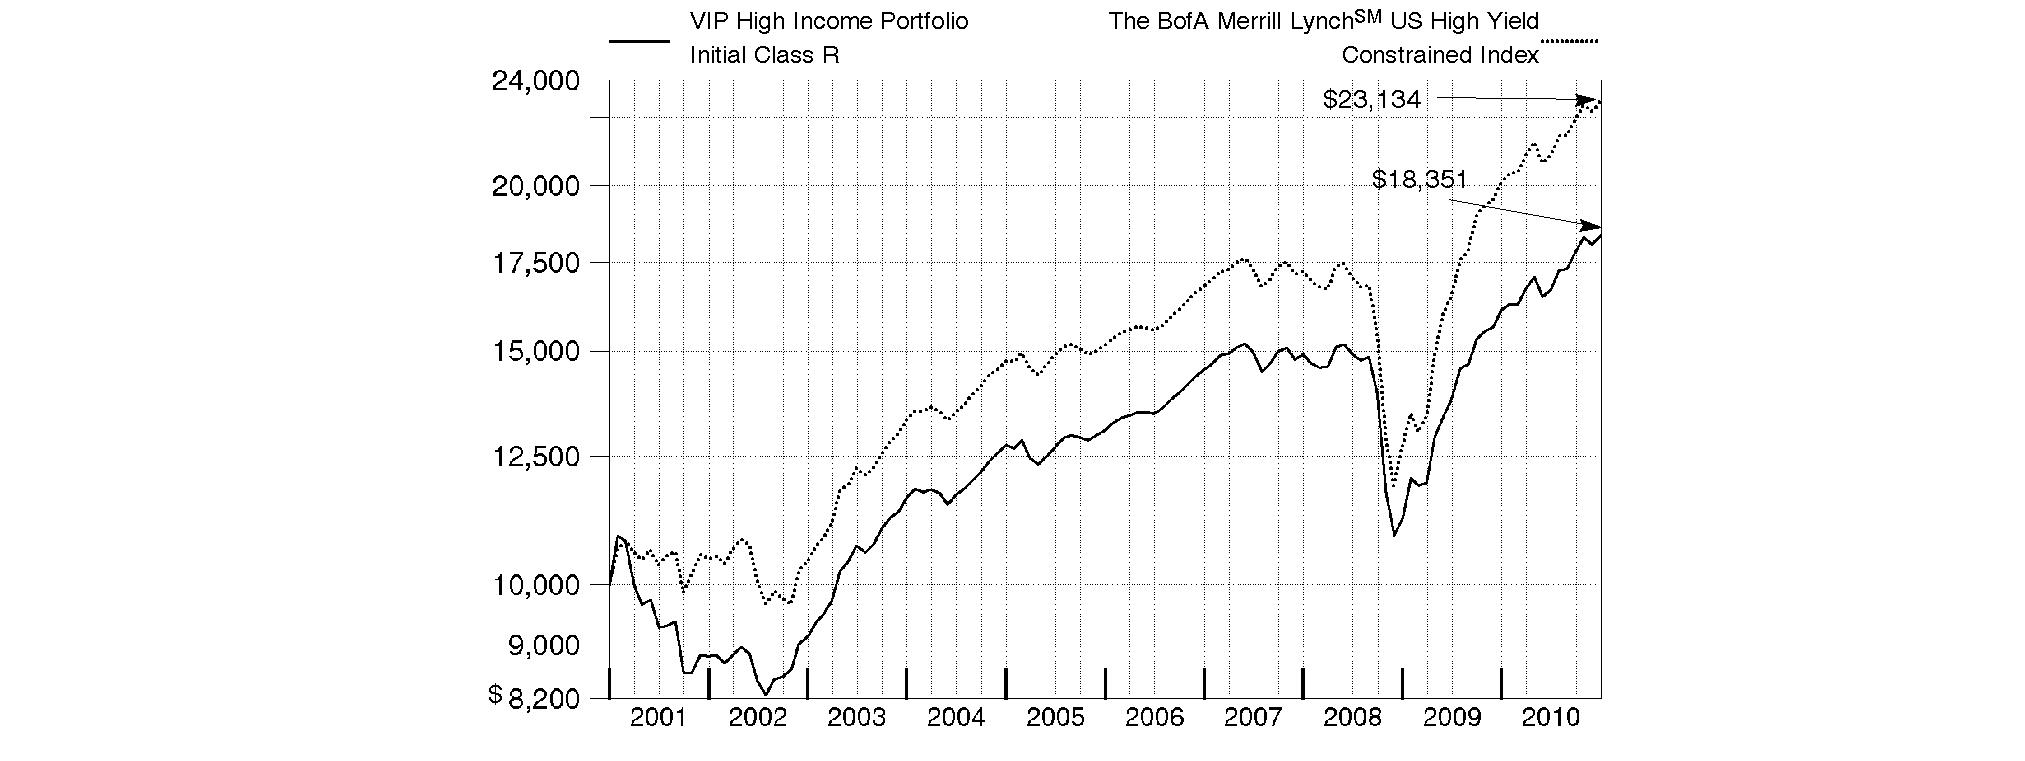
Annual Report
Market Recap: While market improvements around the world hit a speed bump in the first half of the 12-month period ending December 31, 2010, world economies re-accelerated in August, supported by a broadening recovery and low inflation in the U.S. Domestic stock markets recorded solid gains for the year, lifted by a strong second-half rally fueled by economic optimism, encouraging earnings reports and a wave of corporate mergers. The large-cap S&P 500® Index rose 15.06%, the blue-chip-laden Dow Jones Industrial AverageSM added 14.06% and the technology-heavy Nasdaq Composite® Index climbed 18.02%. Meanwhile, international stocks, as represented by the MSCI® ACWI® (All Country World Index) ex USA Index, gained 11.29%, boosted in part by a depreciating U.S. dollar. In the fixed-income arena, U.S. taxable investment-grade bonds generated positive results during 2010, as the Barclays Capital® U.S. Aggregate Bond Index gained 6.54%. With ultra-low interest rates bolstering nearly all fixed-income securities for most of the year, sectors in the index with higher yields and more credit risk generally fared best, while most high-quality bonds generated more-moderate returns. Meanwhile, high-yield bonds, as represented by The BofA Merrill LynchSM US High Yield Constrained Index, returned 15.07%, a result of improved economic data and strengthening investor demand. Overseas, foreign bond markets showed mixed results, with a sizable disparity between the 3.97% return of the Citigroup® Non-U.S. Group of 7 Index - which measures the performance of sovereign debt of the major global economies outside the U.S. - and the 12.04% advance of the JPMorgan Emerging Markets Bond Index Global (EMBI Global), which benefited from the rising overall credit quality of emerging-markets debt issuers.
Comments from Matthew Conti, Portfolio Manager of VIP High Income Portfolio: For the year ending December 31, 2010, the fund's share classes underperformed The BofA Merrill LynchSM US High Yield Constrained Index, which returned 15.07%. (For specific portfolio results, please refer to the performance section of this report.) The fund's relative performance was hurt by its focus on the core, middle-quality tier of the high-yield market, which underperformed the more-speculative, lower-rated credits that significantly outpaced the broader market. At the industry level, the fund's result was held back by underweighting insurance and unfavorable security selection in energy. The fund's modest cash position also was a negative amid a strong market. Individual detractors included untimely ownership of and an underweighting in insurance giant American International Group (AIG), an investment in energy exploration and production company ATP Oil & Gas - not held at period end - not owning real estate financing firm iStar Financial, underweighting casino operator Harrah's and a stake in supermarket chain The Great Atlantic & Pacific Tea Company. Conversely, the fund benefited from strong security selection in utilities - although this benefit was slightly offset by overweighting the group - and by favorable positioning within air transportation. On an issuer basis, contributions came from Texas utility TXU Energy, casino operator Snoqualmie Entertainment Authority, Freescale Semiconductor and Continental Airlines. Some of the securities I've mentioned were not held at period end.
The views expressed above reflect those of the portfolio manager(s) only through the end of the period as stated on the cover of this report and do not necessarily represent the views of Fidelity or any other person in the Fidelity organization. Any such views are subject to change at any time based upon market or other conditions and Fidelity disclaims any responsibility to update such views. These views may not be relied on as investment advice and, because investment decisions for a Fidelity fund are based on numerous factors, may not be relied on as an indication of trading intent on behalf of any Fidelity fund.
Annual Report
As a shareholder of the Fund, you incur two types of costs: (1) transaction costs, including redemption fees, and (2) ongoing costs, including management fees, distribution and/or service (12b-1) fees and other Fund expenses. This Example is intended to help you understand your ongoing costs (in dollars) of investing in the Fund and to compare these costs with the ongoing costs of investing in other mutual funds.
The Example is based on an investment of $1,000 invested at the beginning of the period and held for the entire period (July 1, 2010 to December 31, 2010).
Actual Expenses
The first line of the accompanying table for each class of the Fund provides information about actual account values and actual expenses. You may use the information in this line, together with the amount you invested, to estimate the expenses that you paid over the period. Simply divide your account value by $1,000.00 (for example, an $8,600 account value divided by $1,000.00 = 8.6), then multiply the result by the number in the first line for a class of the Fund under the heading entitled "Expenses Paid During Period" to estimate the expenses you paid on your account during this period. The estimate of expenses does not include any fees or other expenses of any variable annuity or variable life insurance product. If they were, the estimate of expenses you paid during the period would be higher, and your ending account value would be lower. In addition, the Fund, as a shareholder in the underlying Fidelity Central Funds, will indirectly bear its pro-rata share of the fees and expenses incurred by the underlying Fidelity Central Funds. These fees and expenses are not included in the Fund's annualized expense ratio used to calculate the expense estimate in the table below.
Hypothetical Example for Comparison Purposes
The second line of the accompanying table for each class of the Fund provides information about hypothetical account values and hypothetical expenses based on a Class' actual expense ratio and an assumed rate of return of 5% per year before expenses, which is not the Class' actual return. The hypothetical account values and expenses may not be used to estimate the actual ending account balance or expenses you paid for the period. You may use this information to compare the ongoing costs of investing in the Fund and other funds. To do so, compare this 5% hypothetical example with the 5% hypothetical examples that appear in the shareholder reports of the other funds. The estimate of expenses does not include any fees or other expenses of any variable annuity or variable life insurance product. If they were, the estimate of expenses you paid during the period would be higher, and your ending account value would be lower. In addition, the Fund, as a shareholder in the underlying Fidelity Central Funds, will indirectly bear its pro-rata share of the fees and expenses incurred by the underlying Fidelity Central Funds. These fees and expenses are not included in the Fund's annualized expense ratio used to calculate the expense estimate in the table below.
Please note that the expenses shown in the table are meant to highlight your ongoing costs only and do not reflect any transaction costs. Therefore, the second line of the table is useful in comparing ongoing costs only, and will not help you determine the relative total costs of owning different funds. In addition, if these transactional costs were included, your costs would have been higher.
| Annualized
Expense
Ratio | Beginning
Account Value
July 1, 2010 | Ending
Account Value
December 31, 2010 | Expenses Paid
During Period*
July 1, 2010 to December 31, 2010 |
Initial Class | .67% | | | |
Actual | | $ 1,000.00 | $ 1,100.80 | $ 3.55 |
HypotheticalA | | $ 1,000.00 | $ 1,021.83 | $ 3.41 |
Service Class | .77% | | | |
Actual | | $ 1,000.00 | $ 1,100.20 | $ 4.08 |
HypotheticalA | | $ 1,000.00 | $ 1,021.32 | $ 3.92 |
Service Class 2 | .92% | | | |
Actual | | $ 1,000.00 | $ 1,100.60 | $ 4.87 |
HypotheticalA | | $ 1,000.00 | $ 1,020.57 | $ 4.69 |
Initial Class R | .67% | | | |
Actual | | $ 1,000.00 | $ 1,101.10 | $ 3.55 |
HypotheticalA | | $ 1,000.00 | $ 1,021.83 | $ 3.41 |
Service Class R | .77% | | | |
Actual | | $ 1,000.00 | $ 1,101.00 | $ 4.08 |
HypotheticalA | | $ 1,000.00 | $ 1,021.32 | $ 3.92 |
Service Class 2R | .92% | | | |
Actual | | $ 1,000.00 | $ 1,099.60 | $ 4.87 |
HypotheticalA | | $ 1,000.00 | $ 1,020.57 | $ 4.69 |
Investor Class | .71% | | | |
Actual | | $ 1,000.00 | $ 1,102.80 | $ 3.76 |
HypotheticalA | | $ 1,000.00 | $ 1,021.63 | $ 3.62 |
A 5% return per year before expenses
* Expenses are equal to each Class' annualized expense ratio, multiplied by the average account value over the period, multiplied by 184/365 (to reflect the one-half year period).
Annual Report
Investment Changes (Unaudited)
Top Five Holdings as of December 31, 2010 |
(by issuer, excluding cash equivalents) | % of fund's
net assets | % of fund's net assets
6 months ago |
International Lease Finance Corp. | 2.3 | 1.4 |
HCA, Inc. | 2.2 | 2.5 |
CIT Group, Inc. | 1.9 | 1.3 |
Ford Motor Credit Co. LLC | 1.8 | 1.4 |
Nielsen Finance LLC/Nielsen Finance Co. | 1.7 | 2.0 |
| 9.9 | |
Top Five Market Sectors as of December 31, 2010 |
| % of fund's
net assets | % of fund's net assets
6 months ago |
Telecommunications | 12.2 | 15.0 |
Electric Utilities | 6.6 | 6.2 |
Energy | 6.5 | 7.8 |
Diversified Financial Services | 6.2 | 6.5 |
Technology | 6.1 | 5.4 |
Quality Diversification (% of fund's net assets) |
As of December 31, 2010 | As of June 30, 2010 |
| BBB 3.2% | | | BBB 2.2% | |
| BB 26.6% | | | BB 28.5% | |
| B 48.4% | | | B 46.7% | |
| CCC,CC,C 11.9% | | | CCC,CC,C 14.8% | |
| Not Rated 1.6% | | | Not Rated 2.7% | |
| Equities 0.8% | | | Equities 0.5% | |
| Short-Term
Investments and
Net Other Assets 7.5% | | | Short-Term
Investments and
Net Other Assets 4.6% | |
We have used ratings from Moody's Investors Service, Inc. Where Moody's® ratings are not available, we have used S&P® ratings. All ratings are as of the report date and do not reflect subsequent changes. |
Asset Allocation (% of fund's net assets) |
As of December 31, 2010 * | As of June 30, 2010 ** |
| Nonconvertible
Bonds 86.0% | | | Nonconvertible
Bonds 88.4% | |
| Convertible Bonds, Preferred Stocks 1.2% | | | Convertible Bonds, Preferred Stocks 0.9% | |
| Common Stocks 0.0% | | | Common Stocks 0.1% | |
| Floating Rate Loans 5.3% | | | Floating Rate Loans 6.0% | |
| Short-Term
Investments and
Net Other Assets 7.5% | | | Short-Term
Investments and
Net Other Assets 4.6% | |
* Foreign investments | 16.5% | | ** Foreign investments | 17.2% | |
Annual Report
Investments December 31, 2010
Showing Percentage of Net Assets
Corporate Bonds - 86.4% |
| Principal Amount | | Value |
Convertible Bonds - 0.4% |
Metals/Mining - 0.2% |
Massey Energy Co. 3.25% 8/1/15 | | $ 2,230,000 | | $ 2,180,940 |
Technology - 0.2% |
Lucent Technologies, Inc. 2.875% 6/15/25 | | 2,902,600 | | 2,759,284 |
TOTAL CONVERTIBLE BONDS | | 4,940,224 |
Nonconvertible Bonds - 86.0% |
Aerospace - 1.1% |
Alliant Techsystems, Inc. 6.875% 9/15/20 | | 2,075,000 | | 2,132,063 |
BE Aerospace, Inc.: | | | | |
6.875% 10/1/20 | | 1,375,000 | | 1,416,250 |
8.5% 7/1/18 | | 3,730,000 | | 4,084,350 |
Esterline Technologies Corp. 7% 8/1/20 (e) | | 2,015,000 | | 2,075,450 |
TransDigm, Inc. 7.75% 12/15/18 (e) | | 3,580,000 | | 3,705,300 |
| | 13,413,413 |
Air Transportation - 2.8% |
Air Canada 9.25% 8/1/15 (e) | | 5,145,000 | | 5,402,250 |
American Airlines, Inc. 10.5% 10/15/12 | | 1,990,000 | | 2,179,050 |
American Airlines, Inc. pass-thru trust certificates: | | | | |
8.608% 10/1/12 | | 535,000 | | 537,675 |
10.375% 7/2/19 | | 1,864,012 | | 2,199,534 |
AMR Corp. 9% 8/1/12 | | 1,980,000 | | 1,999,800 |
Continental Airlines, Inc.: | | | | |
pass-thru trust certificates 9.798% 4/1/21 | | 3,640,625 | | 3,695,235 |
6.75% 9/15/15 (e) | | 4,090,000 | | 4,197,158 |
Continental Airlines, Inc. 9.25% 5/10/17 | | 1,021,101 | | 1,084,919 |
Delta Air Lines, Inc. pass-thru trust certificates: | | | | |
8.021% 8/10/22 | | 2,129,172 | | 2,214,339 |
8.954% 8/10/14 | | 1,809,098 | | 1,890,508 |
Northwest Airlines, Inc. pass-thru trust certificates 8.028% 11/1/17 | | 831,198 | | 822,886 |
United Air Lines, Inc.: | | | | |
9.875% 8/1/13 (e) | | 795,000 | | 856,613 |
12% 11/1/13 (e) | | 1,005,000 | | 1,108,013 |
United Air Lines, Inc. pass-thru trust certificates: | | | | |
Class B, 7.336% 7/2/19 | | 2,765,445 | | 2,682,482 |
9.75% 1/15/17 | | 2,326,969 | | 2,681,832 |
12% 1/15/16 (e) | | 848,353 | | 965,002 |
| | 34,517,296 |
|
| Principal Amount | | Value |
Automotive - 3.2% |
Accuride Corp. 9.5% 8/1/18 (e) | | $ 2,710,000 | | $ 2,940,350 |
American Axle & Manufacturing, Inc. 7.875% 3/1/17 | | 2,470,000 | | 2,544,100 |
ArvinMeritor, Inc.: | | | | |
8.125% 9/15/15 | | 3,250,000 | | 3,400,313 |
10.625% 3/15/18 | | 710,000 | | 796,975 |
Ford Motor Credit Co. LLC: | | | | |
5.625% 9/15/15 | | 3,510,000 | | 3,632,850 |
6.625% 8/15/17 | | 3,200,000 | | 3,352,000 |
7% 4/15/15 | | 2,250,000 | | 2,413,125 |
8% 6/1/14 | | 1,840,000 | | 1,996,400 |
8% 12/15/16 | | 4,870,000 | | 5,442,025 |
12% 5/15/15 | | 3,495,000 | | 4,351,275 |
Navistar International Corp. 8.25% 11/1/21 | | 4,720,000 | | 5,097,600 |
Tenneco, Inc.: | | | | |
6.875% 12/15/20 (e) | | 1,930,000 | | 1,949,300 |
7.75% 8/15/18 (e) | | 1,685,000 | | 1,781,888 |
| | 39,698,201 |
Banks & Thrifts - 5.0% |
Ally Financial, Inc.: | | | | |
6.25% 12/1/17 (e) | | 3,650,000 | | 3,631,750 |
7.5% 9/15/20 (e) | | 3,190,000 | | 3,349,500 |
8% 3/15/20 | | 7,970,000 | | 8,567,750 |
Bank of America Corp.: | | | | |
8% (f) | | 995,000 | | 995,000 |
8.125% (f) | | 1,320,000 | | 1,326,600 |
CIT Group, Inc.: | | | | |
7% 5/1/13 | | 372,017 | | 378,992 |
7% 5/1/14 | | 4,583,026 | | 4,617,399 |
7% 5/1/15 | | 5,468,026 | | 5,481,696 |
7% 5/1/16 | | 6,410,044 | | 6,410,044 |
7% 5/1/17 | | 7,557,062 | | 7,547,616 |
Fifth Third Capital Trust IV 6.5% 4/15/67 (f) | | 2,850,000 | | 2,707,500 |
General Motors Acceptance Corp. 6.875% 8/28/12 | | 4,155,000 | | 4,347,377 |
GMAC LLC: | | | | |
6.75% 12/1/14 | | 4,400,000 | | 4,598,000 |
8% 12/31/18 | | 2,415,000 | | 2,547,825 |
8% 11/1/31 | | 2,275,000 | | 2,422,875 |
Zions Bancorp. 7.75% 9/23/14 | | 3,225,000 | | 3,362,095 |
| | 62,292,019 |
Broadcasting - 1.9% |
Allbritton Communications Co. 8% 5/15/18 | | 2,205,000 | | 2,227,050 |
Belo Corp. 8% 11/15/16 | | 2,190,000 | | 2,370,675 |
Citadel Broadcasting Corp. 7.75% 12/15/18 (e) | | 2,920,000 | | 3,000,300 |
Clear Channel Communications, Inc.: | | | | |
5.5% 9/15/14 | | 2,775,000 | | 2,303,250 |
Corporate Bonds - continued |
| Principal Amount | | Value |
Nonconvertible Bonds - continued |
Broadcasting - continued |
Clear Channel Communications, Inc.: - continued | | | | |
11% 8/1/16 pay-in-kind (f) | | $ 1,758,662 | | $ 1,530,036 |
Nexstar Broadcasting, Inc./Mission, Inc. 8.875% 4/15/17 (e) | | 2,390,000 | | 2,533,400 |
Umbrella Acquisition, Inc. 10.5% 3/15/15 pay-in-kind (e)(f) | | 4,401,126 | | 4,614,581 |
Univision Communications, Inc.: | | | | |
7.875% 11/1/20 (e) | | 1,180,000 | | 1,239,000 |
8.5% 5/15/21 (e) | | 3,630,000 | | 3,693,525 |
| | 23,511,817 |
Building Materials - 0.2% |
Building Materials Corp. of America 6.875% 8/15/18 (e) | | 3,080,000 | | 3,049,200 |
Cable TV - 2.9% |
Bresnan Broadband Holdings LLC 8% 12/15/18 (e) | | 705,000 | | 724,388 |
Cablevision Systems Corp.: | | | | |
7.75% 4/15/18 | | 1,635,000 | | 1,712,663 |
8.625% 9/15/17 | | 4,525,000 | | 4,909,625 |
CCO Holdings LLC/CCO Holdings Capital Corp.: | | | | |
7.25% 10/30/17 | | 3,770,000 | | 3,817,125 |
7.875% 4/30/18 | | 985,000 | | 1,017,013 |
Cequel Communications Holdings I LLC/Cequel Capital Corp. 8.625% 11/15/17 (e) | | 7,435,000 | | 7,843,925 |
CSC Holdings LLC: | | | | |
8.5% 6/15/15 | | 1,655,000 | | 1,795,675 |
8.625% 2/15/19 | | 1,940,000 | | 2,192,200 |
Insight Communications, Inc. 9.375% 7/15/18 (e) | | 4,355,000 | | 4,659,850 |
Kabel Deutschland GmbH 10.625% 7/1/14 | | 1,300,000 | | 1,371,500 |
UPC Germany GmbH 8.125% 12/1/17 (e) | | 2,880,000 | | 3,038,400 |
Videotron Ltd. 9.125% 4/15/18 | | 2,010,000 | | 2,251,200 |
| | 35,333,564 |
Capital Goods - 0.9% |
Amsted Industries, Inc. 8.125% 3/15/18 (e) | | 3,960,000 | | 4,158,000 |
Briggs & Stratton Corp. 6.875% 12/15/20 | | 735,000 | | 747,863 |
RBS Global, Inc./Rexnord Corp. 8.5% 5/1/18 | | 1,470,000 | | 1,543,500 |
SPX Corp. 6.875% 9/1/17 (e) | | 3,935,000 | | 4,180,938 |
| | 10,630,301 |
Chemicals - 2.7% |
Celanese US Holdings LLC 6.625% 10/15/18 (e) | | 1,460,000 | | 1,514,750 |
|
| Principal Amount | | Value |
Huntsman International LLC: | | | | |
5.5% 6/30/16 | | $ 3,245,000 | | $ 3,147,650 |
8.625% 3/15/20 | | 715,000 | | 777,563 |
8.625% 3/15/21 (e) | | 3,275,000 | | 3,520,625 |
LBI Escrow Corp. 8% 11/1/17 (e) | | 2,625,000 | | 2,900,625 |
Lyondell Chemical Co. 11% 5/1/18 | | 7,280,000 | | 8,244,600 |
Nalco Co. 6.625% 1/15/19 (e) | | 1,965,000 | | 2,019,038 |
NOVA Chemicals Corp.: | | | | |
3.5678% 11/15/13 (f) | | 5,325,000 | | 5,231,813 |
8.375% 11/1/16 | | 1,990,000 | | 2,119,350 |
8.625% 11/1/19 | | 1,985,000 | | 2,168,613 |
Rain CII Carbon LLC/CII Carbon Corp. 8% 12/1/18 (e) | | 1,100,000 | | 1,144,000 |
| | 32,788,627 |
Consumer Products - 0.1% |
Jarden Corp. 6.125% 11/15/22 | | 1,035,000 | | 988,425 |
Containers - 0.7% |
Berry Plastics Corp.: | | | | |
5.0391% 2/15/15 (f) | | 1,980,000 | | 1,905,750 |
8.25% 11/15/15 | | 2,715,000 | | 2,830,388 |
Crown Cork & Seal, Inc. 7.375% 12/15/26 | | 3,648,000 | | 3,620,640 |
| | 8,356,778 |
Diversified Financial Services - 5.9% |
Icahn Enterprises LP/Icahn Enterprises Finance Corp.: | | | | |
7.75% 1/15/16 | | 4,405,000 | | 4,427,025 |
7.75% 1/15/16 (e) | | 2,000,000 | | 2,010,000 |
8% 1/15/18 | | 4,925,000 | | 4,949,625 |
8% 1/15/18 (e) | | 2,000,000 | | 2,010,000 |
ILFC E-Capital Trust II 6.25% 12/21/65 (e)(f) | | 1,275,000 | | 969,000 |
Ineos Finance PLC 9% 5/15/15 (e) | | 2,505,000 | | 2,661,563 |
International Lease Finance Corp.: | | | | |
5.625% 9/20/13 | | 1,530,000 | | 1,537,650 |
5.65% 6/1/14 | | 1,315,000 | | 1,305,138 |
6.375% 3/25/13 | | 360,000 | | 369,000 |
6.5% 9/1/14 (e) | | 1,995,000 | | 2,089,763 |
6.625% 11/15/13 | | 1,640,000 | | 1,674,850 |
6.75% 9/1/16 (e) | | 1,995,000 | | 2,089,763 |
8.25% 12/15/20 | | 1,190,000 | | 1,213,800 |
8.625% 9/15/15 (e) | | 5,070,000 | | 5,374,200 |
8.75% 3/15/17 (e) | | 7,300,000 | | 7,756,250 |
8.875% 9/1/17 | | 5,995,000 | | 6,414,650 |
National Money Mart Co. 10.375% 12/15/16 | | 3,010,000 | | 3,265,850 |
Nuveen Investments, Inc.: | | | | |
5.5% 9/15/15 | | 2,450,000 | | 2,100,875 |
10.5% 11/15/15 | | 1,850,000 | | 1,887,000 |
Offshore Group Investment Ltd. 11.5% 8/1/15 (e) | | 3,820,000 | | 4,087,400 |
Corporate Bonds - continued |
| Principal Amount | | Value |
Nonconvertible Bonds - continued |
Diversified Financial Services - continued |
Reliance Intermediate Holdings LP 9.5% 12/15/19 (e) | | $ 3,055,000 | | $ 3,207,750 |
SLM Corp. 8% 3/25/20 | | 5,650,000 | | 5,706,500 |
Trans Union LLC/Trans Union Financing Corp. 11.375% 6/15/18 (e) | | 4,125,000 | | 4,681,875 |
| | 71,789,527 |
Diversified Media - 3.1% |
Catalina Marketing Corp. 10.5% 10/1/15 pay-in-kind (e)(f) | | 3,415,000 | | 3,654,050 |
Checkout Holding Corp. 0% 11/15/15 (e) | | 1,065,000 | | 653,591 |
Clear Channel Worldwide Holdings, Inc.: | | | | |
Series A, 9.25% 12/15/17 | | 560,000 | | 609,000 |
Series B, 9.25% 12/15/17 | | 3,780,000 | | 4,139,100 |
Liberty Media Corp. 8.25% 2/1/30 | | 255,000 | | 247,350 |
Nielsen Finance LLC/Nielsen Finance Co.: | | | | |
0% 8/1/16 (d) | | 9,400,000 | | 9,823,000 |
7.75% 10/15/18 (e) | | 5,240,000 | | 5,410,300 |
11.5% 5/1/16 | | 2,275,000 | | 2,610,563 |
11.625% 2/1/14 | | 2,390,000 | | 2,742,525 |
Quebecor Media, Inc.: | | | | |
7.75% 3/15/16 | | 3,905,000 | | 4,022,150 |
7.75% 3/15/16 | | 3,585,000 | | 3,692,550 |
| | 37,604,179 |
Electric Utilities - 5.5% |
AES Corp.: | | | | |
7.75% 10/15/15 | | 3,745,000 | | 3,979,063 |
8% 10/15/17 | | 2,060,000 | | 2,163,000 |
9.75% 4/15/16 | | 3,010,000 | | 3,363,675 |
Calpine Construction Finance Co. LP 8% 6/1/16 (e) | | 5,775,000 | | 6,107,063 |
Dynegy Holdings, Inc. 7.5% 6/1/15 | | 3,190,000 | | 2,408,450 |
GenOn Escrow Corp.: | | | | |
9.5% 10/15/18 (e) | | 2,075,000 | | 2,064,625 |
9.875% 10/15/20 (e) | | 2,005,000 | | 2,005,000 |
Intergen NV 9% 6/30/17 (e) | | 4,225,000 | | 4,478,500 |
Mirant Americas Generation LLC: | | | | |
8.5% 10/1/21 | | 5,990,000 | | 6,019,950 |
9.125% 5/1/31 | | 5,640,000 | | 5,555,400 |
NRG Energy, Inc. 7.375% 2/1/16 | | 3,710,000 | | 3,784,200 |
NSG Holdings II, LLC 7.75% 12/15/25 (e) | | 10,695,000 | | 9,946,350 |
NV Energy, Inc. 6.25% 11/15/20 | | 2,995,000 | | 2,950,075 |
Otter Tail Corp. 9% 12/15/16 | | 2,460,000 | | 2,681,400 |
|
| Principal Amount | | Value |
Puget Energy, Inc. 6.5% 12/15/20 (e) | | $ 2,930,000 | | $ 2,941,134 |
RRI Energy, Inc. 7.625% 6/15/14 | | 6,280,000 | | 6,421,300 |
| | 66,869,185 |
Energy - 6.5% |
Antero Resources Finance Corp. 9.375% 12/1/17 | | 3,240,000 | | 3,389,688 |
Calfrac Holdings LP 7.5% 12/1/20 (e) | | 1,185,000 | | 1,199,813 |
Continental Resources, Inc. 7.125% 4/1/21 (e) | | 1,210,000 | | 1,258,400 |
Crosstex Energy/Crosstex Energy Finance Corp. 8.875% 2/15/18 | | 3,745,000 | | 3,932,250 |
Drummond Co., Inc. 7.375% 2/15/16 | | 5,510,000 | | 5,675,300 |
Edgen Murray Corp. 12.25% 1/15/15 | | 3,995,000 | | 3,495,625 |
Energy Transfer Equity LP 7.5% 10/15/20 | | 2,655,000 | | 2,747,925 |
Expro Finance Luxembourg SCA 8.5% 12/15/16 (e) | | 4,205,000 | | 4,026,288 |
Exterran Holdings, Inc. 7.25% 12/1/18 (e) | | 2,985,000 | | 2,955,150 |
Frontier Oil Corp.: | | | | |
6.875% 11/15/18 | | 1,245,000 | | 1,269,900 |
8.5% 9/15/16 | | 2,700,000 | | 2,875,500 |
Inergy LP/Inergy Finance Corp. 7% 10/1/18 (e) | | 2,290,000 | | 2,307,175 |
Kinder Morgan Finance Co. LLC 6% 1/15/18 (e) | | 3,895,000 | | 3,831,706 |
LINN Energy LLC: | | | | |
7.75% 2/1/21 (e) | | 2,390,000 | | 2,449,750 |
8.625% 4/15/20 (e) | | 3,055,000 | | 3,291,763 |
Pan American Energy LLC 7.875% 5/7/21 (e) | | 4,125,000 | | 4,372,500 |
Petrohawk Energy Corp.: | | | | |
7.25% 8/15/18 | | 2,430,000 | | 2,454,300 |
7.875% 6/1/15 | | 770,000 | | 801,763 |
10.5% 8/1/14 | | 725,000 | | 825,558 |
Pioneer Natural Resources Co.: | | | | |
6.65% 3/15/17 | | 3,365,000 | | 3,550,075 |
7.5% 1/15/20 | | 3,360,000 | | 3,687,600 |
Plains Exploration & Production Co.: | | | | |
7% 3/15/17 | | 1,730,000 | | 1,764,600 |
7.625% 6/1/18 | | 3,140,000 | | 3,289,150 |
10% 3/1/16 | | 1,337,000 | | 1,484,070 |
Precision Drilling Corp. 6.625% 11/15/20 (e) | | 1,305,000 | | 1,331,100 |
Quicksilver Resources, Inc.: | | | | |
7.125% 4/1/16 | | 4,920,000 | | 4,674,000 |
11.75% 1/1/16 | | 2,250,000 | | 2,610,000 |
Corporate Bonds - continued |
| Principal Amount | | Value |
Nonconvertible Bonds - continued |
Energy - continued |
Range Resources Corp. 6.75% 8/1/20 | | $ 1,045,000 | | $ 1,071,125 |
Targa Resources Partners LP/Targa Resources Partners Finance Corp. 7.875% 10/15/18 (e) | | 2,660,000 | | 2,753,100 |
| | 79,375,174 |
Entertainment/Film - 0.1% |
NAI Entertainment Holdings LLC/NAI Entertainment Finance Corp. 8.25% 12/15/17 (e) | | 855,000 | | 897,750 |
Environmental - 0.4% |
Covanta Holding Corp. 7.25% 12/1/20 | | 1,590,000 | | 1,611,907 |
EnergySolutions, Inc. / EnergySolutions LLC 10.75% 8/15/18 (e) | | 3,145,000 | | 3,431,824 |
| | 5,043,731 |
Food & Drug Retail - 0.7% |
Albertsons, Inc. 7.75% 6/15/26 | | 435,000 | | 334,950 |
Rite Aid Corp.: | | | | |
7.5% 3/1/17 | | 1,185,000 | | 1,134,638 |
9.375% 12/15/15 | | 950,000 | | 817,000 |
9.5% 6/15/17 | | 1,190,000 | | 1,002,575 |
9.75% 6/12/16 | | 1,185,000 | | 1,306,463 |
SUPERVALU, Inc. 8% 5/1/16 | | 1,640,000 | | 1,566,200 |
Tops Markets LLC 10.125% 10/15/15 | | 2,800,000 | | 2,891,000 |
| | 9,052,826 |
Food/Beverage/Tobacco - 0.2% |
C&S Group Enterprises LLC 8.375% 5/1/17 (e) | | 1,365,000 | | 1,317,225 |
NBTY, Inc. 9% 10/1/18 (e) | | 1,655,000 | | 1,754,300 |
| | 3,071,525 |
Gaming - 2.7% |
Chukchansi Economic Development Authority: | | | | |
3.9428% 11/15/12 (e)(f) | | 1,010,000 | | 652,713 |
8% 11/15/13 (e) | | 3,410,000 | | 2,267,650 |
Las Vegas Sands Corp. 6.375% 2/15/15 | | 1,295,000 | | 1,322,519 |
MCE Finance Ltd. 10.25% 5/15/18 | | 2,225,000 | | 2,542,063 |
MGM Mirage, Inc.: | | | | |
5.875% 2/27/14 | | 1,375,000 | | 1,265,000 |
6.625% 7/15/15 | | 5,135,000 | | 4,647,175 |
6.75% 9/1/12 | | 985,000 | | 970,225 |
6.75% 4/1/13 | | 1,140,000 | | 1,105,800 |
7.5% 6/1/16 | | 1,325,000 | | 1,215,688 |
MGM Resorts International: | | | | |
10% 11/1/16 (e) | | 4,125,000 | | 4,166,250 |
11.375% 3/1/18 | | 1,875,000 | | 1,996,875 |
|
| Principal Amount | | Value |
Scientific Games Corp. 7.875% 6/15/16 (e) | | $ 4,064,000 | | $ 4,089,197 |
Wynn Las Vegas LLC/Wynn Las Vegas Capital Corp. 7.75% 8/15/20 | | 6,525,000 | | 6,949,125 |
| | 33,190,280 |
Healthcare - 5.3% |
DaVita, Inc.: | | | | |
6.375% 11/1/18 | | 1,460,000 | | 1,430,800 |
6.625% 11/1/20 | | 1,265,000 | | 1,242,863 |
DJO Finance LLC/DJO Finance Corp. 10.875% 11/15/14 | | 6,465,000 | | 7,046,850 |
Endo Pharmaceuticals Holdings, Inc. 7% 12/15/20 (e) | | 1,485,000 | | 1,503,563 |
HCA, Inc.: | | | | |
8.5% 4/15/19 | | 1,235,000 | | 1,346,150 |
9.125% 11/15/14 | | 6,670,000 | | 6,986,825 |
9.25% 11/15/16 | | 8,519,000 | | 9,115,330 |
9.625% 11/15/16 pay-in-kind (f) | | 5,401,000 | | 5,806,075 |
9.875% 2/15/17 | | 1,610,000 | | 1,771,000 |
HealthSouth Corp. 7.25% 10/1/18 | | 2,095,000 | | 2,126,425 |
Mylan, Inc.: | | | | |
6% 11/15/18 (e) | | 2,000,000 | | 1,957,600 |
7.625% 7/15/17 (e) | | 1,255,000 | | 1,327,163 |
7.875% 7/15/20 (e) | | 2,055,000 | | 2,209,125 |
Omega Healthcare Investors, Inc.: | | | | |
6.75% 10/15/22 (e) | | 1,555,000 | | 1,531,675 |
7% 1/15/16 | | 1,665,000 | | 1,689,975 |
Senior Housing Properties Trust 6.75% 4/15/20 | | 2,640,000 | | 2,788,500 |
Valeant Pharmaceuticals International 6.875% 12/1/18 (e) | | 3,640,000 | | 3,603,600 |
Vanguard Health Holding Co. II LLC/Vanguard Health Holding Co. II, Inc.: | | | | |
8% 2/1/18 | | 6,475,000 | | 6,588,313 |
8% 2/1/18 (e) | | 2,690,000 | | 2,737,075 |
Ventas Realty LP: | | | | |
6.5% 6/1/16 | | 1,200,000 | | 1,248,000 |
6.5% 6/1/16 | | 460,000 | | 478,400 |
| | 64,535,307 |
Homebuilders/Real Estate - 1.3% |
CB Richard Ellis Services, Inc. 6.625% 10/15/20 (e) | | 1,485,000 | | 1,470,150 |
KB Home 7.25% 6/15/18 | | 4,735,000 | | 4,521,925 |
Lennar Corp. 5.6% 5/31/15 | | 545,000 | | 523,200 |
Standard Pacific Corp.: | | | | |
8.375% 5/15/18 | | 1,765,000 | | 1,765,000 |
8.375% 5/15/18 (e) | | 2,375,000 | | 2,363,125 |
8.375% 1/15/21 (e) | | 2,375,000 | | 2,291,875 |
10.75% 9/15/16 | | 2,405,000 | | 2,765,750 |
| | 15,701,025 |
Corporate Bonds - continued |
| Principal Amount | | Value |
Nonconvertible Bonds - continued |
Hotels - 0.7% |
Host Hotels & Resorts LP: | | | | |
6% 11/1/20 (e) | | $ 3,550,000 | | $ 3,496,750 |
9% 5/15/17 | | 2,195,000 | | 2,452,913 |
Host Marriott LP 7.125% 11/1/13 | | 2,406,000 | | 2,430,060 |
| | 8,379,723 |
Insurance - 0.1% |
CNO Financial Group, Inc. 9% 1/15/18 (e) | | 915,000 | | 937,875 |
Leisure - 2.7% |
Equinox Holdings, Inc. 9.5% 2/1/16 (e) | | 3,080,000 | | 3,253,250 |
GWR Operating Partnership LLP/Great Wolf Finance Corp. 10.875% 4/1/17 | | 1,865,000 | | 1,967,575 |
NCL Corp. Ltd.: | | | | |
9.5% 11/15/18 (e) | | 1,465,000 | | 1,519,938 |
11.75% 11/15/16 | | 1,490,000 | | 1,735,850 |
Royal Caribbean Cruises Ltd.: | | | | |
7.25% 3/15/18 | | 1,815,000 | | 1,923,900 |
11.875% 7/15/15 | | 1,440,000 | | 1,771,200 |
yankee: | | | | |
7% 6/15/13 | | 3,220,000 | | 3,405,150 |
7.25% 6/15/16 | | 8,570,000 | | 9,191,325 |
7.5% 10/15/27 | | 2,640,000 | | 2,587,200 |
Town Sports International Holdings, Inc. 11% 2/1/14 | | 1,772,000 | | 1,754,280 |
Universal City Development Partners Ltd./UCDP Finance, Inc.: | | | | |
8.875% 11/15/15 | | 1,245,000 | | 1,322,813 |
10.875% 11/15/16 | | 2,130,000 | | 2,343,000 |
| | 32,775,481 |
Metals/Mining - 1.9% |
Arch Coal, Inc.: | | | | |
7.25% 10/1/20 | | 545,000 | | 568,163 |
8.75% 8/1/16 | | 1,035,000 | | 1,138,500 |
CONSOL Energy, Inc.: | | | | |
8% 4/1/17 (e) | | 2,640,000 | | 2,798,400 |
8.25% 4/1/20 (e) | | 1,760,000 | | 1,883,200 |
Drummond Co., Inc. 9% 10/15/14 (e) | | 830,000 | | 881,875 |
FMG Resources (August 2006) Pty Ltd. 7% 11/1/15 (e) | | 5,570,000 | | 5,751,025 |
Massey Energy Co. 6.875% 12/15/13 | | 5,595,000 | | 5,664,938 |
Severstal Columbus LLC 10.25% 2/15/18 (e) | | 4,340,000 | | 4,578,700 |
| | 23,264,801 |
Paper - 0.5% |
Boise Paper LLC/Boise Co-Issuer Co. 8% 4/1/20 | | 2,790,000 | | 2,957,400 |
|
| Principal Amount | | Value |
Verso Paper Holdings LLC/Verso Paper, Inc.: | | | | |
9.125% 8/1/14 | | $ 1,495,000 | | $ 1,513,688 |
11.5% 7/1/14 | | 1,990,000 | | 2,184,025 |
| | 6,655,113 |
Publishing/Printing - 0.4% |
ProQuest LLC/ProQuest Notes Co. 9% 10/15/18 (e) | | 3,595,000 | | 3,702,850 |
Visant Corp. 10% 10/1/17 (e) | | 1,625,000 | | 1,698,125 |
| | 5,400,975 |
Services - 4.0% |
Aircastle Ltd. 9.75% 8/1/18 | | 2,575,000 | | 2,826,063 |
ARAMARK Corp.: | | | | |
3.7869% 2/1/15 (f) | | 7,820,000 | | 7,644,050 |
8.5% 2/1/15 | | 3,080,000 | | 3,210,900 |
Avis Budget Car Rental LLC/Avis Budget Finance, Inc.: | | | | |
7.625% 5/15/14 | | 1,986,000 | | 2,035,650 |
7.75% 5/15/16 | | 2,430,000 | | 2,478,600 |
Fidelity National Information Services, Inc.: | | | | |
7.625% 7/15/17 (e) | | 915,000 | | 963,038 |
7.875% 7/15/20 (e) | | 1,220,000 | | 1,293,200 |
FTI Consulting, Inc. 6.75% 10/1/20 (e) | | 3,100,000 | | 3,069,000 |
Hertz Corp.: | | | | |
7.375% 1/15/21 (e) | | 3,565,000 | | 3,591,738 |
7.5% 10/15/18 (e) | | 7,485,000 | | 7,690,838 |
8.875% 1/1/14 | | 3,460,000 | | 3,542,175 |
McJunkin Red Man Corp. 9.5% 12/15/16 (e) | | 5,700,000 | | 5,379,375 |
PHH Corp. 9.25% 3/1/16 (e) | | 1,940,000 | | 2,041,850 |
ServiceMaster Co. 10.75% 7/15/15 pay-in-kind (e)(f) | | 3,000,000 | | 3,210,000 |
| | 48,976,477 |
Shipping - 2.9% |
Navios Maritime Acquisition Corp./Navios Acquisition Finance US, Inc. 8.625% 11/1/17 (e) | | 2,220,000 | | 2,247,750 |
Navios Maritime Holdings, Inc.: | | | | |
8.875% 11/1/17 | | 2,255,000 | | 2,407,213 |
9.5% 12/15/14 | | 4,737,000 | | 4,926,480 |
Overseas Shipholding Group, Inc.: | | | | |
7.5% 2/15/24 | | 475,000 | | 412,063 |
8.125% 3/30/18 | | 2,895,000 | | 2,923,950 |
Ship Finance International Ltd. 8.5% 12/15/13 | | 20,075,000 | | 20,426,274 |
Swift Services Holdings, Inc. 10% 11/15/18 (e) | | 2,470,000 | | 2,568,800 |
| | 35,912,530 |
Corporate Bonds - continued |
| Principal Amount | | Value |
Nonconvertible Bonds - continued |
Specialty Retailing - 0.2% |
Sears Holdings Corp. 6.625% 10/15/18 (e) | | $ 3,565,000 | | $ 3,342,188 |
| | 3,342,188 |
Steel - 1.1% |
AK Steel Corp. 7.625% 5/15/20 | | 2,505,000 | | 2,492,475 |
Essar Steel Algoma, Inc. 9.375% 3/15/15 (e) | | 3,045,000 | | 3,064,031 |
Steel Dynamics, Inc. 6.75% 4/1/15 | | 5,775,000 | | 5,876,063 |
Tube City IMS Corp. 9.75% 2/1/15 | | 1,695,000 | | 1,754,325 |
| | 13,186,894 |
Super Retail - 1.1% |
AutoNation, Inc. 6.75% 4/15/18 | | 2,325,000 | | 2,394,750 |
PETCO Animal Supplies, Inc. 9.25% 12/1/18 (e) | | 2,425,000 | | 2,546,250 |
QVC, Inc. 7.125% 4/15/17 (e) | | 1,470,000 | | 1,536,150 |
Toys 'R' Us Property Co. I LLC 10.75% 7/15/17 | | 830,000 | | 952,425 |
Toys 'R' Us Property Co. II LLC 8.5% 12/1/17 | | 3,575,000 | | 3,843,125 |
Toys 'R' Us, Inc. 7.375% 9/1/16 (e) | | 1,475,000 | | 1,545,063 |
| | 12,817,763 |
Technology - 5.7% |
Advanced Micro Devices, Inc. 7.75% 8/1/20 (e) | | 2,510,000 | | 2,604,125 |
Amkor Technology, Inc. 7.375% 5/1/18 | | 5,590,000 | | 5,743,725 |
Atkore International, Inc. 9.875% 1/1/18 (e) | | 670,000 | | 695,125 |
Avaya, Inc. 10.125% 11/1/15 pay-in-kind (f) | | 3,584,645 | | 3,656,338 |
CDW LLC/CDW Finance Corp. 8% 12/15/18 (e) | | 2,860,000 | | 2,917,200 |
Freescale Semiconductor, Inc.: | | | | |
9.125% 12/15/14 pay-in-kind (f) | | 3,145,979 | | 3,271,818 |
9.25% 4/15/18 (e) | | 1,815,000 | | 1,996,500 |
10.125% 12/15/16 | | 6,625,000 | | 6,989,375 |
Jabil Circuit, Inc.: | | | | |
5.625% 12/15/20 | | 925,000 | | 904,188 |
7.75% 7/15/16 | | 2,385,000 | | 2,677,163 |
8.25% 3/15/18 | | 430,000 | | 486,975 |
Lucent Technologies, Inc.: | | | | |
6.45% 3/15/29 | | 5,080,000 | | 4,013,200 |
6.5% 1/15/28 | | 4,915,000 | | 3,907,425 |
Seagate HDD Cayman 6.875% 5/1/20 (e) | | 1,200,000 | | 1,146,000 |
Spansion LLC 7.875% 11/15/17 (e) | | 2,170,000 | | 2,148,300 |
SunGard Data Systems, Inc.: | | | | |
7.375% 11/15/18 (e) | | 1,430,000 | | 1,415,700 |
|
| Principal Amount | | Value |
7.625% 11/15/20 (e) | | $ 1,430,000 | | $ 1,415,700 |
10.25% 8/15/15 | | 4,320,000 | | 4,541,400 |
Terremark Worldwide, Inc.: | | | | |
9.5% 11/15/13 (e) | | 1,325,000 | | 1,318,375 |
12% 6/15/17 | | 5,445,000 | | 6,234,525 |
Viasystems, Inc. 12% 1/15/15 (e) | | 1,625,000 | | 1,815,938 |
Xerox Capital Trust I 8% 2/1/27 | | 9,405,000 | | 9,569,588 |
| | 69,468,683 |
Telecommunications - 11.4% |
Citizens Communications Co.: | | | | |
7.875% 1/15/27 | | 940,000 | | 911,800 |
9% 8/15/31 | | 4,215,000 | | 4,330,913 |
Cleveland Unlimited, Inc. 14.5% 12/15/10 (c)(e)(f) | | 1,275,000 | | 1,147,500 |
Digicel Group Ltd.: | | | | |
8.25% 9/1/17 (e) | | 3,890,000 | | 4,006,700 |
8.875% 1/15/15 (e) | | 5,750,000 | | 5,829,350 |
9.125% 1/15/15 pay-in-kind (e)(f) | | 3,357,000 | | 3,403,327 |
12% 4/1/14 (e) | | 1,430,000 | | 1,673,100 |
Equinix, Inc. 8.125% 3/1/18 | | 2,745,000 | | 2,868,525 |
Frontier Communications Corp.: | | | | |
7.875% 4/15/15 | | 1,760,000 | | 1,922,800 |
8.125% 10/1/18 | | 5,125,000 | | 5,586,250 |
8.25% 4/15/17 | | 2,585,000 | | 2,862,888 |
8.5% 4/15/20 | | 880,000 | | 963,600 |
Global Crossing Ltd.: | | | | |
9% 11/15/19 (e) | | 2,440,000 | | 2,421,700 |
12% 9/15/15 | | 915,000 | | 1,031,663 |
Intelsat Bermuda Ltd.: | | | | |
11.25% 2/4/17 | | 1,505,000 | | 1,636,688 |
12% 2/4/17 pay-in-kind (f) | | 10,789,687 | | 11,608,280 |
Intelsat Jackson Holdings Ltd.: | | | | |
9.5% 6/15/16 | | 5,125,000 | | 5,406,875 |
11.5% 6/15/16 | | 1,883,000 | | 2,028,933 |
Intelsat Jackson Holdings SA 7.25% 10/15/20 (e) | | 4,295,000 | | 4,337,950 |
Intelsat Ltd.: | | | | |
6.5% 11/1/13 | | 7,705,000 | | 7,916,888 |
11.25% 6/15/16 | | 680,000 | | 731,000 |
Intelsat Subsidiary Holding Co. Ltd.: | | | | |
8.875% 1/15/15 (e) | | 585,000 | | 598,163 |
8.875% 1/15/15 | | 6,240,000 | | 6,411,600 |
MetroPCS Wireless, Inc.: | | | | |
6.625% 11/15/20 | | 2,435,000 | | 2,325,425 |
7.875% 9/1/18 | | 3,585,000 | | 3,714,777 |
Nextel Communications, Inc.: | | | | |
5.95% 3/15/14 | | 4,895,000 | | 4,809,338 |
6.875% 10/31/13 | | 3,945,000 | | 3,954,863 |
7.375% 8/1/15 | | 6,745,000 | | 6,753,431 |
NII Capital Corp.: | | | | |
8.875% 12/15/19 | | 2,365,000 | | 2,542,375 |
10% 8/15/16 | | 2,495,000 | | 2,763,213 |
Corporate Bonds - continued |
| Principal Amount | | Value |
Nonconvertible Bonds - continued |
Telecommunications - continued |
Qwest Communications International, Inc.: | | | | |
Series B 7.5% 2/15/14 | | $ 900,000 | | $ 911,250 |
7.125% 4/1/18 (e) | | 2,465,000 | | 2,545,113 |
8% 10/1/15 | | 2,080,000 | | 2,236,000 |
Sprint Nextel Corp. 6% 12/1/16 | | 6,355,000 | | 6,140,519 |
U.S. West Communications 7.5% 6/15/23 | | 9,460,000 | | 9,412,700 |
Wind Acquisition Finance SA: | | | | |
7.25% 2/15/18 (e) | | 1,535,000 | | 1,546,513 |
11.75% 7/15/17 (e) | | 4,510,000 | | 5,039,925 |
Wind Acquisition Holdings Finance SA 12.25% 7/15/17 pay-in-kind (e)(f) | | 5,169,786 | | 5,646,196 |
| | 139,978,131 |
Textiles & Apparel - 0.1% |
Hanesbrands, Inc. 6.375% 12/15/20 (e) | | 1,185,000 | | 1,122,788 |
TOTAL NONCONVERTIBLE BONDS | | 1,053,929,572 |
TOTAL CORPORATE BONDS (Cost $993,438,204) | 1,058,869,796 |
Commercial Mortgage Securities - 0.0% |
|
LB Multi-family Mortgage Trust Series 1991-4 Class A1, 0.936% 4/25/21 (e)(f)
(Cost $26,331) | | 59,267 | | 39,590 |
Common Stocks - 0.0% |
| Shares | | |
Textiles & Apparel - 0.0% |
Arena Brands Holding Corp. Class B (a)(g)
(Cost $1,974,627) | 48,889 | | 363,245 |
Preferred Stocks - 0.8% |
| | | |
Convertible Preferred Stocks - 0.5% |
Automotive - 0.3% |
General Motors Co. 4.75% | 82,000 | | 4,437,020 |
Electric Utilities - 0.2% |
AES Trust III 6.75% | 51,000 | | 2,494,920 |
TOTAL CONVERTIBLE PREFERRED STOCKS | | 6,931,940 |
|
| Shares | | Value |
Nonconvertible Preferred Stocks - 0.3% |
Banks & Thrifts - 0.3% |
GMAC LLC 7.00% (e) | 3,795 | | $ 3,548,325 |
TOTAL PREFERRED STOCKS (Cost $9,901,116) | 10,480,265 |
Floating Rate Loans - 5.3% |
| Principal Amount | | |
Aerospace - 0.0% |
TransDigm Group, Inc. Tranche B, term loan 5% 12/6/16 (f) | | $ 410,000 | | 413,075 |
Air Transportation - 0.6% |
Delta Air Lines, Inc. Tranche 2LN, term loan 3.5391% 4/30/14 (f) | | 2,952,460 | | 2,871,267 |
US Airways Group, Inc. term loan 2.7884% 3/23/14 (f) | | 4,295,000 | | 3,854,763 |
| | 6,726,030 |
Automotive - 0.5% |
Federal-Mogul Corp.: | | | | |
Tranche B, term loan 2.2059% 12/27/14 (f) | | 3,645,905 | | 3,408,921 |
Tranche C, term loan 2.1987% 12/27/15 (f) | | 2,453,397 | | 2,281,660 |
| | 5,690,581 |
Broadcasting - 0.5% |
Clear Channel Capital I LLC Tranche B, term loan 3.9106% 1/29/16 (f) | | 2,145,000 | | 1,860,788 |
Univision Communications, Inc. term loan 4.5106% 3/31/17 (f) | | 5,117,002 | | 4,809,982 |
| | 6,670,770 |
Capital Goods - 0.4% |
Dresser, Inc. Tranche 2LN, term loan 6.0344% 5/4/15 pay-in-kind (f) | | 4,950,000 | | 4,937,625 |
Containers - 0.3% |
Anchor Glass Container Corp.: | | | | |
Tranche 1LN, term loan 6% 3/2/16 (f) | | 1,833,144 | | 1,843,456 |
Tranche 2LN, term loan 10% 9/2/16 (f) | | 2,070,000 | | 2,064,825 |
| | 3,908,281 |
Diversified Financial Services - 0.3% |
AWAS Aviation Acquisitions Ltd. term loan 7.75% 6/10/16 (f) | | 4,111,100 | | 4,229,294 |
Electric Utilities - 0.9% |
Ashmore Energy International: | | | | |
Revolving Credit-Linked Deposit 3.3028% 3/30/12 (f) | | 1,046,925 | | 1,033,839 |
term loan 3.3028% 3/30/14 (f) | | 9,988,662 | | 9,863,804 |
| | 10,897,643 |
Floating Rate Loans - continued |
| Principal Amount | | Value |
Leisure - 0.5% |
Blackstone UTP Capital LLC term loan 7.75% 11/2/14 | | $ 3,945,150 | | $ 4,024,053 |
Six Flags, Inc. Tranche B, term loan 7.25% 6/30/16 (f) | | 1,665,000 | | 1,683,731 |
| | 5,707,784 |
Publishing/Printing - 0.2% |
Newsday LLC term loan 10.5% 8/1/13 | | 925,000 | | 989,750 |
Visant Corp. Tranche B, term loan 7% 12/22/16 (f) | | 1,536,150 | | 1,551,512 |
| | 2,541,262 |
Shipping - 0.1% |
Swift Transportation Co., Inc. Tranche B, term loan 6.75% 12/21/16 (f) | | 865,000 | | 869,325 |
Technology - 0.2% |
Avaya, Inc. term loan 3.0344% 10/24/14 (f) | | 2,286,211 | | 2,166,185 |
Telecommunications - 0.8% |
Asurion Corp.: | | | | |
Tranche 2LN, term loan 6.7622% 7/3/15 (f) | | 5,144,397 | | 4,861,455 |
Tranche B 2LN, term loan 6.75% 3/31/15 (f) | | 4,725,000 | | 4,730,906 |
Intelsat Jackson Holdings Ltd. term loan 3.29% 2/1/14 (f) | | 830,000 | | 788,500 |
| | 10,380,861 |
TOTAL FLOATING RATE LOANS (Cost $61,872,746) | 65,138,716 |
Money Market Funds - 5.8% |
| Shares | | |
Fidelity Cash Central Fund, 0.19% (b)
(Cost $70,967,769) | 70,967,769 | | 70,967,769 |
TOTAL INVESTMENT PORTFOLIO - 98.3% (Cost $1,138,180,793) | | 1,205,859,381 |
NET OTHER ASSETS (LIABILITIES) - 1.7% | | 20,314,161 |
NET ASSETS - 100% | $ 1,226,173,542 |
Legend |
(a) Non-income producing |
(b) Affiliated fund that is available only to investment companies and other accounts managed by Fidelity Investments. The rate quoted is the annualized seven-day yield of the fund at period end. A complete unaudited listing of the fund's holdings as of its most recent quarter end is available upon request. In addition, each Fidelity Central Fund's financial statements, which are not covered by the Fund's Report of Independent Registered Public Accounting Firm, are available on the SEC's website or upon request. |
(c) Non-income producing - Security is in default. |
(d) Security initially issued in zero coupon form which converts to coupon form at a specified rate and date. The rate shown is the rate at period end. |
(e) Security exempt from registration under Rule 144A of the Securities Act of 1933. These securities may be resold in transactions exempt from registration, normally to qualified institutional buyers. At the end of the period, the value of these securities amounted to $364,314,363 or 29.7% of net assets. |
(f) The coupon rate shown on floating or adjustable rate securities represents the rate at period end. |
(g) Restricted securities - Investment in securities not registered under the Securities Act of 1933 (excluding 144A issues). At the end of the period, the value of restricted securities (excluding 144A issues) amounted to $363,245 or 0.0% of net assets. |
Additional information on each holding is as follows: |
Security | Acquisition Date | Acquisition Cost |
Arena Brands Holding Corp. Class B | 6/18/97 | $ 1,974,627 |
Affiliated Central Funds |
Information regarding fiscal year to date income earned by the Fund from investments in Fidelity Central Funds is as follows: |
Fund | Income earned |
Fidelity Cash Central Fund | $ 101,379 |
Other Information |
The following is a summary of the inputs used, as of December 31, 2010, involving the Fund's assets and liabilities carried at fair value. The inputs or methodology used for valuing securities may not be an indication of the risk associated with investing in those securities. For more information on valuation inputs, and their aggregation into the levels used in the tables below, please refer to the Security Valuation section in the accompanying Notes to Financial Statements. |
Valuation Inputs at Reporting Date: |
Description | Total | Level 1 | Level 2 | Level 3 |
Investments in Securities: | | | | |
Equities: | | | | |
Consumer Discretionary | $ 4,800,265 | $ 4,437,020 | $ - | $ 363,245 |
Financials | 3,548,325 | - | 3,548,325 | - |
Utilities | 2,494,920 | - | 2,494,920 | - |
Corporate Bonds | 1,058,869,796 | - | 1,058,869,796 | - |
Commercial Mortgage Securities | 39,590 | - | - | 39,590 |
Floating Rate Loans | 65,138,716 | - | 65,138,716 | - |
Money Market Funds | 70,967,769 | 70,967,769 | - | - |
Total Investments in Securities: | $ 1,205,859,381 | $ 75,404,789 | $ 1,130,051,757 | $ 402,835 |
The following is a reconciliation of Investments in Securities for which Level 3 inputs were used in determining value: |
Investments in Securities: | |
Beginning Balance | $ 431,931 |
Total Realized Gain (Loss) | - |
Total Unrealized Gain (Loss) | 6,003 |
Cost of Purchases | - |
Proceeds of Sales | (36,645) |
Amortization/Accretion | 1,546 |
Transfers in to Level 3 | - |
Transfers out of Level 3 | - |
Ending Balance | $ 402,835 |
The change in unrealized gain (loss) for the period attributable to Level 3 securities held at December 31, 2010 | $ 6,003 |
The information used in the above reconciliation represents fiscal year to date activity for any Investments in Securities identified as using Level 3 inputs at either the beginning or the end of the current fiscal period. Transfers in or out of Level 3 represent the beginning value of any Security or Instrument where a change in the pricing level occurred from the beginning to the end of the period. The cost of purchases and the proceeds of sales may include securities received or delivered through corporate actions or exchanges. Realized and unrealized gains (losses) disclosed in the reconciliation are included in Net Gain (Loss) on the Fund's Statement of Operations. |
Distribution of investments by country of issue, as a percentage of total net assets, is as follows: (Unaudited) |
United States of America | 83.5% |
Bermuda | 6.4% |
Canada | 3.0% |
Liberia | 1.6% |
Cayman Islands | 1.5% |
Luxembourg | 1.3% |
Others (Individually Less Than 1%) | 2.7% |
| 100.0% |
Income Tax Information |
At December 31, 2010, the Fund had a capital loss carryforward of approximately $150,230,408 of which $70,783,139 and $79,447,269 will expire in fiscal 2016 and 2017, respectively. Capital loss carryforwards are only available to offset future capital gains of the Fund to the extent provided by regulations and may be limited. |
See accompanying notes which are an integral part of the financial statements.
Annual Report
Statement of Assets and Liabilities
| December 31, 2010 |
| | |
Assets | | |
Investment in securities, at value - See accompanying schedule: Unaffiliated issuers (cost $1,067,213,024) | $ 1,134,891,612 | |
Fidelity Central Funds (cost $70,967,769) | 70,967,769 | |
Total Investments (cost $1,138,180,793) | | $ 1,205,859,381 |
Cash | | 304,994 |
Receivable for investments sold | | 1,177,233 |
Receivable for fund shares sold | | 1,276,437 |
Interest receivable | | 19,736,755 |
Distributions receivable from Fidelity Central Funds | | 6,896 |
Prepaid expenses | | 3,664 |
Other receivables | | 13,074 |
Total assets | | 1,228,378,434 |
| | |
Liabilities | | |
Payable for fund shares redeemed | $ 1,410,718 | |
Accrued management fee | 561,317 | |
Distribution and service plan fees payable | 52,081 | |
Other affiliated payables | 106,497 | |
Other payables and accrued expenses | 74,279 | |
Total liabilities | | 2,204,892 |
| | |
Net Assets | | $ 1,226,173,542 |
Net Assets consist of: | | |
Paid in capital | | $ 1,300,989,788 |
Undistributed net investment income | | 7,949,486 |
Accumulated undistributed net realized gain (loss) on investments | | (150,433,458) |
Net unrealized appreciation (depreciation) on investments | | 67,667,726 |
Net Assets | | $ 1,226,173,542 |
Statement of Assets and Liabilities - continued
| December 31, 2010 |
| | |
Initial Class:
Net Asset Value, offering price and redemption price per share ($594,687,943 ÷ 106,739,194 shares) | | $ 5.57 |
| | |
Service Class:
Net Asset Value, offering price and redemption price per share ($98,987,511 ÷ 17,857,975 shares) | | $ 5.54 |
| | |
Service Class 2:
Net Asset Value, offering price and redemption price per share ($182,465,372 ÷ 33,495,054 shares) | | $ 5.45 |
| | |
Initial Class R:
Net Asset Value, offering price and redemption price per share ($34,946,042 ÷ 6,293,382 shares) | | $ 5.55 |
| | |
Service Class R:
Net Asset Value, offering price and redemption price per share ($68,805,814 ÷ 12,461,979 shares) | | $ 5.52 |
| | |
Service Class 2R:
Net Asset Value, offering price and redemption price per share ($1,542,536 ÷ 283,274 shares) | | $ 5.45 |
| | |
Investor Class:
Net Asset Value, offering price and redemption price per share ($244,738,324 ÷ 44,056,811 shares) | | $ 5.56 |
See accompanying notes which are an integral part of the financial statements.
Annual Report
Financial Statements - continued
Statement of Operations
| Year ended December 31, 2010 |
| | |
Investment Income | | |
Dividends | | $ 281,237 |
Interest | | 97,344,273 |
Income from Fidelity Central Funds | | 101,379 |
Total income | | 97,726,889 |
| | |
Expenses | | |
Management fee | $ 6,493,662 | |
Transfer agent fees | 948,535 | |
Distribution and service plan fees | 571,541 | |
Accounting fees and expenses | 402,167 | |
Custodian fees and expenses | 22,688 | |
Independent trustees' compensation | 6,823 | |
Audit | 73,446 | |
Legal | 47,563 | |
Interest | 902 | |
Miscellaneous | 18,773 | |
Total expenses before reductions | 8,586,100 | |
Expense reductions | (84,674) | 8,501,426 |
Net investment income | | 89,225,463 |
Realized and Unrealized Gain (Loss) Net realized gain (loss) on: | | |
Investment securities: | | |
Unaffiliated issuers | | 35,026,882 |
Change in net unrealized appreciation (depreciation) on investment securities | | 22,817,242 |
Net gain (loss) | | 57,844,124 |
Net increase (decrease) in net assets resulting from operations | | $ 147,069,587 |
Statement of Changes in Net Assets
| Year ended
December 31, 2010 | Year ended
December 31, 2009 |
Increase (Decrease) in Net Assets | | |
Operations | | |
Net investment income | $ 89,225,463 | $ 88,146,519 |
Net realized gain (loss) | 35,026,882 | (80,957,504) |
Change in net unrealized appreciation (depreciation) | 22,817,242 | 340,753,509 |
Net increase (decrease) in net assets resulting from operations | 147,069,587 | 347,942,524 |
Distributions to shareholders from net investment income | (88,733,895) | (82,969,090) |
Share transactions - net increase (decrease) | 7,262,606 | 122,868,111 |
Redemption fees | 110,732 | 89,023 |
Total increase (decrease) in net assets | 65,709,030 | 387,930,568 |
| | |
Net Assets | | |
Beginning of period | 1,160,464,512 | 772,533,944 |
End of period (including undistributed net investment income of $7,949,486 and undistributed net investment
income of $8,082,942, respectively) | $ 1,226,173,542 | $ 1,160,464,512 |
See accompanying notes which are an integral part of the financial statements.
Annual Report
Financial Highlights - Initial Class
Years ended December 31, | 2010 | 2009 | 2008 | 2007 | 2006 |
Selected Per-Share Data | | | | | |
Net asset value, beginning of period | $ 5.29 | $ 3.96 | $ 5.98 | $ 6.35 | $ 6.17 |
Income from Investment Operations | | | | | |
Net investment income C | .439 | .438 | .475 | .485 | .476 |
Net realized and unrealized gain (loss) | .288 | 1.298 | (1.990) | (.311) | .216 |
Total from investment operations | .727 | 1.736 | (1.515) | .174 | .692 |
Distributions from net investment income | (.448) | (.406) | (.506) | (.545) | (.512) |
Redemption fees added to paid in capital C | .001 | - G | .001 | .001 | - |
Net asset value, end of period | $ 5.57 | $ 5.29 | $ 3.96 | $ 5.98 | $ 6.35 |
Total Return A,B | 13.82% | 43.96% | (24.98)% | 2.79% | 11.24% |
Ratios to Average Net Assets D,F | | | | | |
Expenses before reductions | .69% | .70% | .71% | .68% | .71% |
Expenses net of fee waivers, if any | .69% | .70% | .71% | .68% | .71% |
Expenses net of all reductions | .69% | .70% | .70% | .68% | .71% |
Net investment income | 7.84% | 9.02% | 8.48% | 7.47% | 7.40% |
Supplemental Data | | | | | |
Net assets, end of period (000 omitted) | $ 594,688 | $ 608,802 | $ 451,824 | $ 726,409 | $ 922,565 |
Portfolio turnover rate E | 81% | 70% | 58% | 70% | 65% |
A Total returns do not reflect charges attributable to your insurance company's separate account. Inclusion of these charges would reduce the total returns shown.
B Total returns would have been lower had certain expenses not been reduced during the periods shown.
C Calculated based on average shares outstanding during the period.
D Fees and expenses of the underlying Fidelity Central Funds are not included in the Fund's expense ratio. The Fund indirectly bears its proportionate share of the expenses of any underlying Fidelity Central Funds.
E Amount does not include the portfolio activity of any underlying Fidelity Central Funds.
F Expense ratios reflect operating expenses of the class. Expenses before reductions do not reflect amounts reimbursed by the investment adviser or reductions from brokerage service arrangements or reductions from other expense offset arrangements and do not represent the amount paid by the class during periods when reimbursements or reductions occur. Expenses net of fee waivers reflect expenses after reimbursement by the investment adviser but prior to reductions from brokerage service arrangements or other expense offset arrangements. Expenses net of all reductions represent the net expenses paid by the class.
G Amount represents less than $.001 per share.
Financial Highlights - Service Class
Years ended December 31, | 2010 | 2009 | 2008 | 2007 | 2006 |
Selected Per-Share Data | | | | | |
Net asset value, beginning of period | $ 5.26 | $ 3.95 | $ 5.95 | $ 6.32 | $ 6.14 |
Income from Investment Operations | | | | | |
Net investment income C | .431 | .429 | .469 | .477 | .467 |
Net realized and unrealized gain (loss) | .290 | 1.281 | (1.971) | (.312) | .218 |
Total from investment operations | .721 | 1.710 | (1.502) | .165 | .685 |
Distributions from net investment income | (.442) | (.400) | (.499) | (.536) | (.505) |
Redemption fees added to paid in capital C | .001 | - G | .001 | .001 | - |
Net asset value, end of period | $ 5.54 | $ 5.26 | $ 3.95 | $ 5.95 | $ 6.32 |
Total Return A,B | 13.79% | 43.41% | (24.87)% | 2.66% | 11.18% |
Ratios to Average Net Assets D,F | | | | | |
Expenses before reductions | .79% | .80% | .80% | .78% | .81% |
Expenses net of fee waivers, if any | .78% | .80% | .80% | .78% | .81% |
Expenses net of all reductions | .78% | .80% | .80% | .78% | .81% |
Net investment income | 7.74% | 8.92% | 8.39% | 7.37% | 7.30% |
Supplemental Data | | | | | |
Net assets, end of period (000 omitted) | $ 98,988 | $ 103,511 | $ 95,461 | $ 180,837 | $ 277,546 |
Portfolio turnover rate E | 81% | 70% | 58% | 70% | 65% |
A Total returns do not reflect charges attributable to your insurance company's separate account. Inclusion of these charges would reduce the total returns shown.
B Total returns would have been lower had certain expenses not been reduced during the periods shown.
C Calculated based on average shares outstanding during the period.
D Fees and expenses of the underlying Fidelity Central Funds are not included in the Fund's expense ratio. The Fund indirectly bears its proportionate share of the expenses of any underlying Fidelity Central Funds.
E Amount does not include the portfolio activity of any underlying Fidelity Central Funds.
F Expense ratios reflect operating expenses of the class. Expenses before reductions do not reflect amounts reimbursed by the investment adviser or reductions from brokerage service arrangements or reductions from other expense offset arrangements and do not represent the amount paid by the class during periods when reimbursements or reductions occur. Expenses net of fee waivers reflect expenses after reimbursement by the investment adviser but prior to reductions from brokerage service arrangements or other expense offset arrangements. Expenses net of all reductions represent the net expenses paid by the class.
G Amount represents less than $.001 per share.
See accompanying notes which are an integral part of the financial statements.
Annual Report
Financial Highlights - Service Class 2
Years ended December 31, | 2010 | 2009 | 2008 | 2007 | 2006 |
Selected Per-Share Data | | | | | |
Net asset value, beginning of period | $ 5.18 | $ 3.89 | $ 5.88 | $ 6.25 | $ 6.08 |
Income from Investment Operations | | | | | |
Net investment income C | .417 | .422 | .450 | .461 | .453 |
Net realized and unrealized gain (loss) | .287 | 1.264 | (1.949) | (.305) | .216 |
Total from investment operations | .704 | 1.686 | (1.499) | .156 | .669 |
Distributions from net investment income | (.435) | (.396) | (.492) | (.527) | (.499) |
Redemption fees added to paid in capital C | .001 | - G | .001 | .001 | - |
Net asset value, end of period | $ 5.45 | $ 5.18 | $ 3.89 | $ 5.88 | $ 6.25 |
Total Return A,B | 13.67% | 43.46% | (25.14)% | 2.54% | 11.02% |
Ratios to Average Net Assets D,F | | | | | |
Expenses before reductions | .94% | .95% | .96% | .93% | .97% |
Expenses net of fee waivers, if any | .94% | .95% | .96% | .93% | .97% |
Expenses net of all reductions | .94% | .95% | .96% | .93% | .97% |
Net investment income | 7.59% | 8.77% | 8.23% | 7.22% | 7.14% |
Supplemental Data | | | | | |
Net assets, end of period (000 omitted) | $ 182,465 | $ 181,377 | $ 87,077 | $ 97,266 | $ 110,503 |
Portfolio turnover rate E | 81% | 70% | 58% | 70% | 65% |
A Total returns do not reflect charges attributable to your insurance company's separate account. Inclusion of these charges would reduce the total returns shown.
B Total returns would have been lower had certain expenses not been reduced during the periods shown.
C Calculated based on average shares outstanding during the period.
D Fees and expenses of the underlying Fidelity Central Funds are not included in the Fund's expense ratio. The Fund indirectly bears its proportionate share of the expenses of any underlying Fidelity Central Funds.
E Amount does not include the portfolio activity of any underlying Fidelity Central Funds.
F Expense ratios reflect operating expenses of the class. Expenses before reductions do not reflect amounts reimbursed by the investment adviser or reductions from brokerage service arrangements or reductions from other expense offset arrangements and do not represent the amount paid by the class during periods when reimbursements or reductions occur. Expenses net of fee waivers reflect expenses after reimbursement by the investment adviser but prior to reductions from brokerage service arrangements or other expense offset arrangements. Expenses net of all reductions represent the net expenses paid by the class.
G Amount represents less than $.001 per share.
Financial Highlights - Initial Class R
Years ended December 31, | 2010 | 2009 | 2008 | 2007 | 2006 |
Selected Per-Share Data | | | | | |
Net asset value, beginning of period | $ 5.27 | $ 3.95 | $ 5.96 | $ 6.34 | $ 6.16 |
Income from Investment Operations | | | | | |
Net investment income C | .439 | .440 | .471 | .479 | .475 |
Net realized and unrealized gain (loss) | .288 | 1.286 | (1.975) | (.313) | .218 |
Total from investment operations | .727 | 1.726 | (1.504) | .166 | .693 |
Distributions from net investment income | (.448) | (.406) | (.507) | (.547) | (.513) |
Redemption fees added to paid in capital C | .001 | - G | .001 | .001 | - |
Net asset value, end of period | $ 5.55 | $ 5.27 | $ 3.95 | $ 5.96 | $ 6.34 |
Total Return A,B | 13.88% | 43.82% | (24.88)% | 2.65% | 11.27% |
Ratios to Average Net Assets D,F | | | | | |
Expenses before reductions | .69% | .70% | .70% | .68% | .71% |
Expenses net of fee waivers, if any | .68% | .70% | .70% | .68% | .71% |
Expenses net of all reductions | .68% | .69% | .70% | .67% | .71% |
Net investment income | 7.84% | 9.02% | 8.49% | 7.47% | 7.39% |
Supplemental Data | | | | | |
Net assets, end of period (000 omitted) | $ 34,946 | $ 34,080 | $ 19,801 | $ 19,401 | $ 93 |
Portfolio turnover rate E | 81% | 70% | 58% | 70% | 65% |
A Total returns do not reflect charges attributable to your insurance company's separate account. Inclusion of these charges would reduce the total returns shown.
B Total returns would have been lower had certain expenses not been reduced during the periods shown.
C Calculated based on average shares outstanding during the period.
D Fees and expenses of the underlying Fidelity Central Funds are not included in the Fund's expense ratio. The Fund indirectly bears its proportionate share of the expenses of any underlying Fidelity Central Funds.
E Amount does not include the portfolio activity of any underlying Fidelity Central Funds.
F Expense ratios reflect operating expenses of the class. Expenses before reductions do not reflect amounts reimbursed by the investment adviser or reductions from brokerage service arrangements or reductions from other expense offset arrangements and do not represent the amount paid by the class during periods when reimbursements or reductions occur. Expenses net of fee waivers reflect expenses after reimbursement by the investment adviser but prior to reductions from brokerage service arrangements or other expense offset arrangements. Expenses net of all reductions represent the net expenses paid by the class.
G Amount represents less than $.001 per share.
See accompanying notes which are an integral part of the financial statements.
Annual Report
Financial Highlights - Service Class R
Years ended December 31, | 2010 | 2009 | 2008 | 2007 | 2006 |
Selected Per-Share Data | | | | | |
Net asset value, beginning of period | $ 5.25 | $ 3.94 | $ 5.93 | $ 6.32 | $ 6.14 |
Income from Investment Operations | | | | | |
Net investment income C | .433 | .431 | .467 | .471 | .467 |
Net realized and unrealized gain (loss) | .280 | 1.280 | (1.959) | (.318) | .219 |
Total from investment operations | .713 | 1.711 | (1.492) | .153 | .686 |
Distributions from net investment income | (.444) | (.401) | (.499) | (.544) | (.506) |
Redemption fees added to paid in capital C | .001 | - G | .001 | .001 | - |
Net asset value, end of period | $ 5.52 | $ 5.25 | $ 3.94 | $ 5.93 | $ 6.32 |
Total Return A,B | 13.66% | 43.56% | (24.79)% | 2.45% | 11.19% |
Ratios to Average Net Assets D,F | | | | | |
Expenses before reductions | .79% | .80% | .80% | .78% | .81% |
Expenses net of fee waivers, if any | .78% | .80% | .80% | .78% | .81% |
Expenses net of all reductions | .78% | .80% | .80% | .77% | .81% |
Net investment income | 7.74% | 8.92% | 8.39% | 7.37% | 7.30% |
Supplemental Data | | | | | |
Net assets, end of period (000 omitted) | $ 68,806 | $ 47,873 | $ 26,572 | $ 33,129 | $ 92 |
Portfolio turnover rate E | 81% | 70% | 58% | 70% | 65% |
A Total returns do not reflect charges attributable to your insurance company's separate account. Inclusion of these charges would reduce the total returns shown.
B Total returns would have been lower had certain expenses not been reduced during the periods shown.
C Calculated based on average shares outstanding during the period.
D Fees and expenses of the underlying Fidelity Central Funds are not included in the Fund's expense ratio. The Fund indirectly bears its proportionate share of the expenses of any underlying Fidelity Central Funds.
E Amount does not include the portfolio activity of any underlying Fidelity Central Funds.
F Expense ratios reflect operating expenses of the class. Expenses before reductions do not reflect amounts reimbursed by the investment adviser or reductions from brokerage service arrangements or reductions from other expense offset arrangements and do not represent the amount paid by the class during periods when reimbursements or reductions occur. Expenses net of fee waivers reflect expenses after reimbursement by the investment adviser but prior to reductions from brokerage service arrangements or other expense offset arrangements. Expenses net of all reductions represent the net expenses paid by the class.
G Amount represents less than $.001 per share.
Financial Highlights - Service Class 2R
Years ended December 31, | 2010 | 2009 | 2008 | 2007 | 2006 |
Selected Per-Share Data | | | | | |
Net asset value, beginning of period | $ 5.17 | $ 3.89 | $ 5.87 | $ 6.25 | $ 6.08 |
Income from Investment Operations | | | | | |
Net investment income C | .415 | .416 | .451 | .453 | .453 |
Net realized and unrealized gain (loss) | .293 | 1.257 | (1.940) | (.294) | .214 |
Total from investment operations | .708 | 1.673 | (1.489) | .159 | .667 |
Distributions from net investment income | (.429) | (.393) | (.492) | (.540) | (.497) |
Redemption fees added to paid in capital C | .001 | - G | .001 | .001 | - |
Net asset value, end of period | $ 5.45 | $ 5.17 | $ 3.89 | $ 5.87 | $ 6.25 |
Total Return A,B | 13.79% | 43.13% | (24.99)% | 2.59% | 10.99% |
Ratios to Average Net Assets D,F | | | | | |
Expenses before reductions | .94% | .95% | .95% | .93% | .96% |
Expenses net of fee waivers, if any | .93% | .95% | .95% | .93% | .96% |
Expenses net of all reductions | .93% | .94% | .95% | .92% | .96% |
Net investment income | 7.59% | 8.77% | 8.24% | 7.23% | 7.14% |
Supplemental Data | | | | | |
Net assets, end of period (000 omitted) | $ 1,543 | $ 2,016 | $ 1,487 | $ 2,347 | $ 92 |
Portfolio turnover rate E | 81% | 70% | 58% | 70% | 65% |
A Total returns do not reflect charges attributable to your insurance company's separate account. Inclusion of these charges would reduce the total returns shown.
B Total returns would have been lower had certain expenses not been reduced during the periods shown.
C Calculated based on average shares outstanding during the period.
D Fees and expenses of the underlying Fidelity Central Funds are not included in the Fund's expense ratio. The Fund indirectly bears its proportionate share of the expenses of any underlying Fidelity Central Funds.
E Amount does not include the portfolio activity of any underlying Fidelity Central Funds.
F Expense ratios reflect operating expenses of the class. Expenses before reductions do not reflect amounts reimbursed by the investment adviser or reductions from brokerage service arrangements or reductions from other expense offset arrangements and do not represent the amount paid by the class during periods when reimbursements or reductions occur. Expenses net of fee waivers reflect expenses after reimbursement by the investment adviser but prior to reductions from brokerage service arrangements or other expense offset arrangements. Expenses net of all reductions represent the net expenses paid by the class.
G Amount represents less than $.001 per share.
See accompanying notes which are an integral part of the financial statements.
Annual Report
Financial Highlights - Investor Class
Years ended December 31, | 2010 | 2009 | 2008 | 2007 | 2006 |
Selected Per-Share Data | | | | | |
Net asset value, beginning of period | $ 5.27 | $ 3.96 | $ 5.96 | $ 6.34 | $ 6.16 |
Income from Investment Operations | | | | | |
Net investment income C | .437 | .441 | .473 | .477 | .471 |
Net realized and unrealized gain (loss) | .298 | 1.274 | (1.971) | (.317) | .220 |
Total from investment operations | .735 | 1.715 | (1.498) | .160 | .691 |
Distributions from net investment income | (.446) | (.405) | (.503) | (.541) | (.511) |
Redemption fees added to paid in capital C | .001 | - G | .001 | .001 | - |
Net asset value, end of period | $ 5.56 | $ 5.27 | $ 3.96 | $ 5.96 | $ 6.34 |
Total Return A,B | 14.04% | 43.43% | (24.76)% | 2.56% | 11.24% |
Ratios to Average Net Assets D,F | | | | | |
Expenses before reductions | .73% | .73% | .74% | .75% | .80% |
Expenses net of fee waivers, if any | .72% | .73% | .74% | .75% | .80% |
Expenses net of all reductions | .72% | .73% | .74% | .75% | .79% |
Net investment income | 7.81% | 8.99% | 8.45% | 7.40% | 7.31% |
Supplemental Data | | | | | |
Net assets, end of period (000 omitted) | $ 244,738 | $ 182,806 | $ 90,312 | $ 105,920 | $ 78,122 |
Portfolio turnover rate E | 81% | 70% | 58% | 70% | 65% |
A Total returns do not reflect charges attributable to your insurance company's separate account. Inclusion of these charges would reduce the total returns shown.
B Total returns would have been lower had certain expenses not been reduced during the periods shown.
C Calculated based on average shares outstanding during the period.
D Fees and expenses of the underlying Fidelity Central Funds are not included in the Fund's expense ratio. The Fund indirectly bears its proportionate share of the expenses of any underlying Fidelity Central Funds.
E Amount does not include the portfolio activity of any underlying Fidelity Central Funds.
F Expense ratios reflect operating expenses of the class. Expenses before reductions do not reflect amounts reimbursed by the investment adviser or reductions from brokerage service arrangements or reductions from other expense offset arrangements and do not represent the amount paid by the class during periods when reimbursements or reductions occur. Expenses net of fee waivers reflect expenses after reimbursement by the investment adviser but prior to reductions from brokerage service arrangements or other expense offset arrangements. Expenses net of all reductions represent the net expenses paid by the class.
G Amount represents less than $.001 per share.
See accompanying notes which are an integral part of the financial statements.
Annual Report
Notes to Financial Statements
For the period ended December 31, 2010
1. Organization.
VIP High Income Portfolio (the Fund) is a fund of Variable Insurance Products Fund (the Trust) and is authorized to issue an unlimited number of shares. The Trust is registered under the Investment Company Act of 1940, as amended (the 1940 Act), as an open-end management investment company organized as a Massachusetts business trust. Shares of the Fund may only be purchased by insurance companies for the purpose of funding variable annuity or variable life insurance contracts. The Fund offers the following classes of shares: Initial Class shares, Service Class shares, Service Class 2 shares, Initial Class R shares, Service Class R shares, Service Class 2R shares and Investor Class shares. All classes have equal rights and voting privileges, except for matters affecting a single class. Investment income, realized and unrealized capital gains and losses, the common expenses of the Fund, and certain fund-level expense reductions, if any, are allocated on a pro-rata basis to each class based on the relative net assets of each class to the total net assets of the Fund. Each class differs with respect to transfer agent and distribution and service plan fees incurred. Certain expense reductions may also differ by class.
2. Investments in Fidelity Central Funds.
The Fund may invest in Fidelity Central Funds, which are open-end investment companies available only to other investment companies and accounts managed by Fidelity Management & Research Company (FMR) and its affiliates. The Fund's Schedule of Investments lists each of the Fidelity Central Funds held as of period end, if any, as an investment of the Fund, but does not include the underlying holdings of each Fidelity Central Fund. As an Investing Fund, the Fund indirectly bears its proportionate share of the expenses of the underlying Fidelity Central Funds.
The Money Market Central Funds seek preservation of capital and current income and are managed by Fidelity Investments Money Management, Inc. (FIMM), an affiliate of FMR.
A complete unaudited list of holdings for each Fidelity Central Fund is available upon request or at the Securities and Exchange Commission (the SEC) web site at www.sec.gov. In addition, the financial statements of the Fidelity Central Funds, which are not covered by the Fund's Report of Independent Registered Public Accounting Firm, are available on the SEC web site or upon request.
3. Significant Accounting Policies.
The financial statements have been prepared in conformity with accounting principles generally accepted in the United States of America (GAAP), which require management to make certain estimates and assumptions at the date of the financial statements. Actual results could differ from those estimates. Subsequent events, if any, through the date that the financial statements were issued have been evaluated in the preparation of the financial statements. The following summarizes the significant accounting policies of the Fund:
Security Valuation. Investments are valued as of 4:00 p.m. Eastern time on the last calendar day of the period. The Fund uses independent pricing services approved by the Board of Trustees to value its investments. When current market prices or quotations are not readily available or reliable, valuations may be determined in good faith in accordance with procedures adopted by the Board of Trustees. Factors used in determining value may include market or security specific events, changes in interest rates and credit quality. The frequency with which these procedures are used cannot be predicted and they may be utilized to a significant extent. The value used for net asset value (NAV) calculation under these procedures may differ from published prices for the same securities.
The Fund categorizes the inputs to valuation techniques used to value its investments into a disclosure hierarchy consisting of three levels as shown below.
Level 1 - quoted prices in active markets for identical investments
Level 2 - other significant observable inputs (including quoted prices for similar investments, interest rates, prepayment speeds, etc.)
Level 3 - unobservable inputs (including the Fund's own assumptions based on the best information available)
Changes in valuation techniques may result in transfers in or out of an assigned level within the disclosure hierarchy. The aggregate value of investments by input level, as of December 31, 2010 for the Fund's investments, as well as a roll forward of Level 3 securities, is included at the end of the Fund's Schedule of Investments. Valuation techniques used to value the Fund's investments by major category are as follows.
Debt securities, including restricted securities, are valued based on evaluated prices received from independent pricing services or from dealers who make markets in such securities. For corporate bonds and floating rate loans, pricing services utilize matrix pricing which considers yield or price of bonds of comparable quality, coupon, maturity and type as well as dealer supplied prices and are generally categorized as Level 2 in the hierarchy. For commercial mortgage securities, pricing services utilize matrix pricing which considers prepayment speed assumptions, attributes of the collateral, yield or price of bonds of comparable quality, coupon, maturity and type as well as dealer supplied prices and, accordingly, such securities are generally categorized as Level 2 in the hierarchy. The Fund invests a significant portion of its assets in below investment grade securities. The value of these securities can be more volatile due to changes in the credit quality of the issuer and is sensitive to changes in economic, market and regulatory conditions.
Annual Report
Notes to Financial Statements - continued
3. Significant Accounting Policies - continued
Security Valuation - continued
When independent prices are unavailable or unreliable, debt securities may be valued utilizing pricing matrices which consider similar factors that would be used by independent pricing services. These are generally categorized as Level 2 in the hierarchy but may be Level 3 depending on the circumstances.
Equity securities, including restricted securities, for which market quotations are readily available, are valued at the last reported sale price or official closing price as reported by an independent pricing service on the primary market or exchange on which they are traded and are categorized as Level 1 in the hierarchy. In the event there were no sales during the day or closing prices are not available, securities are valued at the last quoted bid price or may be valued using the last available price and are generally categorized as Level 2 in the hierarchy. Utilizing these techniques may result in transfers between Level 1 and Level 2. For restricted securities and private placements where observable inputs are limited, assumptions about market activity and risk are used and are categorized as Level 3 in the hierarchy.
Investments in open-end mutual funds, including the Fidelity Central Funds, are valued at their closing net asset value each business day and are categorized as Level 1 in the hierarchy.
Investment Transactions and Income. For financial reporting purposes, the Fund's investment holdings and NAV include trades executed through the end of the last business day of the period. The NAV per share for processing shareholder transactions is calculated as of the close of business of the New York Stock Exchange (NYSE), normally 4:00 p.m. Eastern time and includes trades executed through the end of the prior business day. Gains and losses on securities sold are determined on the basis of identified cost and may include proceeds received from litigation. Dividend income is recorded on the ex-dividend date, except for certain dividends from foreign securities where the ex-dividend date may have passed, which are recorded as soon as the Fund is informed of the ex-dividend date. Non-cash dividends included in dividend income, if any, are recorded at the fair market value of the securities received. Interest income and distributions from the Fidelity Central Funds are accrued as earned. Interest income includes coupon interest and amortization of premium and accretion of discount on debt securities. Debt obligations may be placed on non-accrual status and related interest income may be reduced by ceasing current accruals and writing off interest receivables when the collection of all or a portion of interest has become doubtful based on consistently applied procedures. A debt obligation is removed from non-accrual status when the issuer resumes interest payments or when collectability of interest is reasonably assured.
Expenses. Expenses directly attributable to a fund are charged to that fund. Expenses attributable to more than one fund are allocated among the respective funds on the basis of relative net assets or other appropriate methods. Expense estimates are accrued in the period to which they relate and adjustments are made when actual amounts are known.
Income Tax Information and Distributions to Shareholders. Each year the Fund intends to qualify as a regulated investment company, including distributing substantially all of its taxable income and realized gains under Subchapter M of the Internal Revenue Code and filing its U.S. federal tax return. As a result, no provision for income taxes is required. As of December 31, 2010, the Fund did not have any unrecognized tax benefits in the accompanying financial statements. A fund's federal tax return is subject to examination by the Internal Revenue Service (IRS) for a period of three years.
Distributions are declared and recorded on the ex-dividend date. Income dividends and capital gain distributions are declared separately for each class. Income and capital gain distributions are determined in accordance with income tax regulations, which may differ from GAAP.
Capital accounts within the financial statements are adjusted for permanent book-tax differences. These adjustments have no impact on net assets or the results of operations. Temporary book-tax differences will reverse in a subsequent period.
Book-tax differences are primarily due to market discount, deferred trustees compensation, capital loss carryforwards, expiring capital loss carryforwards, and losses deferred due to wash sales.
The federal tax cost of investment securities and unrealized appreciation (depreciation) as of period end were as follows:
Gross unrealized appreciation | $ 83,280,203 |
Gross unrealized depreciation | (8,096,446) |
Net unrealized appreciation (depreciation) | $ 75,183,757 |
| |
Tax Cost | $ 1,130,675,624 |
Annual Report
3. Significant Accounting Policies - continued
Income Tax Information and Distributions to Shareholders - continued
The tax-based components of distributable earnings as of period end were as follows:
Undistributed ordinary income | $ 241,584 |
Capital loss carryforward | $ (150,230,408) |
Net unrealized appreciation (depreciation) | $ 75,183,757 |
The tax character of distributions paid was as follows:
| December 31, 2010 | December 31, 2009 |
Ordinary Income | $ 88,733,895 | $ 82,969,090 |
Trading (Redemption) Fees. Initial Class R shares, Service Class R shares and Service Class 2 R shares held by investors less than 60 days are subject to a redemption fee equal to 1% of the net asset value of shares redeemed. All redemption fees, which reduce the proceeds of the shareholder redemption, are retained by the Fund and accounted for as an addition to paid in capital.
4. Operating Policies.
Restricted Securities. The Fund may invest in securities that are subject to legal or contractual restrictions on resale. These securities generally may be resold in transactions exempt from registration or to the public if the securities are registered. Disposal of these securities may involve time-consuming negotiations and expense, and prompt sale at an acceptable price may be difficult. Information regarding restricted securities is included at the end of the Fund's Schedule of Investments.
Loans and Other Direct Debt Instruments. The Fund may invest in loans and loan participations, trade claims or other receivables. These investments may include standby financing commitments, including revolving credit facilities, that obligate the Fund to supply additional cash to the borrower on demand. Loan participations involve a risk of insolvency of the lending bank or other financial intermediary. The Fund may be contractually obligated to receive approval from the agent bank and/or borrower prior to the sale of these investments.
5. Purchases and Sales of Investments.
Purchases and sales of securities, other than short-term securities, aggregated $878,979,943 and $924,990,768, respectively.
6. Fees and Other Transactions with Affiliates.
Management Fee. FMR and its affiliates provide the Fund with investment management related services for which the Fund pays a monthly management fee. The management fee is the sum of an individual fund fee rate that is based on an annual rate of .45% of the Fund's average net assets and a group fee rate that averaged .12% during the period. The group fee rate is based upon the average net assets of all the mutual funds advised by FMR. The group fee rate decreases as assets under management increase and increases as assets under management decrease. For the period, the total annual management fee rate was .57% of the Fund's average net assets.
Distribution and Service Plan Fees. In accordance with Rule 12b-1 of the 1940 Act, the Fund has adopted separate 12b-1 Plans for each Service Class of shares. Each Service Class pays Fidelity Distributors Corporation (FDC), an affiliate of FMR, a service fee. For the period, the service fee is based on an annual rate of .10% of Service Class' and Service Class R's average net assets and .25% of Service Class 2's and Service Class 2R's average net assets.
For the period, total fees, all of which were re-allowed to insurance companies for the distribution of shares and providing shareholder support services were as follows:
Service Class | $ 100,128 |
Service Class 2 | 412,749 |
Service Class R | 53,786 |
Service Class 2R | 4,878 |
| $ 571,541 |
Annual Report
Notes to Financial Statements - continued
6. Fees and Other Transactions with Affiliates - continued
Transfer Agent Fees. Fidelity Investments Institutional Operations Company, Inc. (FIIOC), an affiliate of FMR, is the Fund's transfer, dividend disbursing, and shareholder servicing agent. FIIOC receives an asset-based fee with respect to each class. Each class (with the exception of Investor Class) pays a transfer agent fee, excluding out of pocket expenses, equal to an annual rate of .07% of average net assets. Investor Class pays a monthly asset-based transfer agent fee of .10% of average net assets. In addition, FIIOC receives an asset-based fee of .01% of average net assets for typesetting, printing and mailing of shareholder reports, expect proxy statements. FIIOC has agreed to voluntarily waive this fee until December 31, 2010. (See Note 8: Expense Reductions.) For the period, transfer agent fees for each class, including printing and out of pocket expenses, were as follows:
Initial Class | $ 464,042 |
Service Class | 75,289 |
Service Class 2 | 126,876 |
Initial Class R | 23,812 |
Service Class R | 39,434 |
Service Class 2R | 1,430 |
Investor Class | 217,652 |
| $ 948,535 |
Accounting Fees. Fidelity Service Company, Inc. (FSC), an affiliate of FMR, maintains the Fund's accounting records. The fee is based on the level of average net assets for the month.
Interfund Lending Program. Pursuant to an Exemptive Order issued by the SEC, the Fund, along with other registered investment companies having management contracts with FMR, may participate in an interfund lending program. This program provides an alternative credit facility allowing the funds to borrow from, or lend money to, other participating affiliated funds. At period end, there were no interfund loans outstanding. The Fund's activity in this program during the period for which loans were outstanding was as follows:
Borrower or Lender | Average Daily Loan Balance | Weighted Average Interest Rate | Interest Expense |
Borrower | $ 25,458,333 | .43% | $ 902 |
7. Committed Line of Credit.
The Fund participates with other funds managed by FMR or an affiliate in a $3.75 billion credit facility (the "line of credit") to be utilized for temporary or emergency purposes to fund shareholder redemptions or for other short-term liquidity purposes. The Fund has agreed to pay commitment fees on its pro-rata portion of the line of credit, which amounted to $4,452 and is reflected in Miscellaneous expenses on the Statement of Operations. During the period, there were no borrowings on this line of credit.
8. Expense Reductions.
FMR or its affiliates agreed to waive certain fees during the period as noted in the table below.
Initial Class | $ 43,071 |
Service Class | 7,261 |
Service Class 2 | 11,949 |
Initial Class R | 2,355 |
Service Class R | 3,902 |
Service Class 2R | 142 |
Investor Class | 14,464 |
Total | $ 83,144 |
Many of the brokers with whom FMR places trades on behalf of the Fund provided services to the Fund in addition to trade execution. These services included payments of certain expenses on behalf of the Fund totaling $93 for the period. In addition, through arrangements with the Fund's custodian, credits realized as a result of uninvested cash balances were used to reduce the Fund's expenses. During the period, these credits reduced the Fund's custody expenses by $1,437.
Annual Report
9. Distributions to Shareholders.
Distributions to shareholders of each class were as follows:
Years ended December 31, | 2010 | 2009 |
From net investment income | | |
Initial Class | $ 44,467,220 | $ 43,747,787 |
Service Class | 7,392,045 | 7,425,935 |
Service Class 2 | 13,449,909 | 12,835,833 |
Initial Class R | 2,630,051 | 2,441,349 |
Service Class R | 5,103,828 | 3,419,501 |
Service Class 2R | 113,793 | 146,215 |
Investor Class | 15,577,049 | 12,952,470 |
Total | $ 88,733,895 | $ 82,969,090 |
10. Share Transactions.
Transactions for each class of shares were as follows:
| Shares | Dollars |
Years ended December 31, | 2010 | 2009 | 2010 | 2009 |
Initial Class | | | | |
Shares sold | 13,981,776 | 20,216,701 | $ 78,466,113 | $ 94,993,807 |
Reinvestment of distributions | 8,041,089 | 8,357,240 | 44,467,220 | 43,747,787 |
Shares redeemed | (30,400,651) | (27,414,117) | (169,255,225) | (129,625,734) |
Net increase (decrease) | (8,377,786) | 1,159,824 | $ (46,321,892) | $ 9,115,860 |
Service Class | | | | |
Shares sold | 1,837,003 | 2,777,781 | $ 10,346,870 | $ 12,897,331 |
Reinvestment of distributions | 1,344,008 | 1,427,657 | 7,392,045 | 7,425,935 |
Shares redeemed | (4,989,128) | (8,725,159) | (27,651,179) | (41,193,317) |
Net increase (decrease) | (1,808,117) | (4,519,721) | $ (9,912,264) | $ (20,870,051) |
Service Class 2 | | | | |
Shares sold | 26,131,374 | 24,366,893 | $ 143,180,880 | $ 112,451,939 |
Reinvestment of distributions | 2,486,120 | 2,502,443 | 13,449,909 | 12,835,833 |
Shares redeemed | (30,129,445) | (14,230,958) | (161,771,346) | (64,857,511) |
Net increase (decrease) | (1,511,951) | 12,638,378 | $ (5,140,557) | $ 60,430,261 |
Initial Class R | | | | |
Shares sold | 2,670,258 | 4,004,167 | $ 14,859,524 | $ 17,798,935 |
Reinvestment of distributions | 477,323 | 468,040 | 2,630,051 | 2,441,349 |
Shares redeemed | (3,318,610) | (3,016,877) | (18,109,555) | (13,725,409) |
Net increase (decrease) | (171,029) | 1,455,330 | $ (619,980) | $ 6,514,875 |
Service Class R | | | | |
Shares sold | 8,426,767 | 7,453,151 | $ 46,508,327 | $ 33,119,246 |
Reinvestment of distributions | 931,355 | 659,445 | 5,103,828 | 3,419,501 |
Shares redeemed | (6,021,801) | (5,739,021) | (32,701,379) | (26,100,257) |
Net increase (decrease) | 3,336,321 | 2,373,575 | $ 18,910,776 | $ 10,438,490 |
Service Class 2R | | | | |
Shares sold | 86,744 | 190,944 | $ 465,296 | $ 835,730 |
Reinvestment of distributions | 21,073 | 28,591 | 113,793 | 146,215 |
Shares redeemed | (214,247) | (212,466) | (1,182,315) | (995,434) |
Net increase (decrease) | (106,430) | 7,069 | $ (603,226) | $ (13,489) |
Investor Class | | | | |
Shares sold | 30,365,867 | 20,189,376 | $ 168,056,935 | $ 92,880,106 |
Reinvestment of distributions | 2,827,051 | 2,482,010 | 15,577,049 | 12,952,470 |
Shares redeemed | (23,797,435) | (10,842,692) | (132,684,235) | (48,580,411) |
Net increase (decrease) | 9,395,483 | 11,828,694 | $ 50,949,749 | $ 57,252,165 |
Annual Report
Notes to Financial Statements - continued
11. Other.
The Fund's organizational documents provide former and current trustees and officers with a limited indemnification against liabilities arising in connection with the performance of their duties to the Fund. In the normal course of business, the Fund may also enter into contracts that provide general indemnifications. The Fund's maximum exposure under these arrangements is unknown as this would be dependent on future claims that may be made against the Fund. The risk of material loss from such claims is considered remote.
At the end of the period, FMR or its affiliates were the owners of record of 32% of the total outstanding shares of the Fund and one otherwise unaffiliated shareholder was the owner of record of 25% of the total outstanding shares of the Fund.
Annual Report
Report of Independent Registered Public Accounting Firm
To the Trustees of Variable Insurance Products Fund and the Shareholders of VIP High Income Portfolio:
In our opinion, the accompanying statement of assets and liabilities, including the schedule of investments, and the related statements of operations and of changes in net assets and the financial highlights present fairly, in all material respects, the financial position of VIP High Income Portfolio (a fund of Variable Insurance Products Fund) at December 31, 2010, the results of its operations for the year then ended, the changes in its net assets for each of the two years in the period then ended and the financial highlights for each of the five years in the period then ended, in conformity with accounting principles generally accepted in the United States of America. These financial statements and financial highlights (hereafter referred to as "financial statements") are the responsibility of the VIP High Income Portfolio's management. Our responsibility is to express an opinion on these financial statements based on our audits. We conducted our audits of these financial statements in accordance with the standards of the Public Company Accounting Oversight Board (United States). Those standards require that we plan and perform the audit to obtain reasonable assurance about whether the financial statements are free of material misstatement. An audit includes examining, on a test basis, evidence supporting the amounts and disclosures in the financial statements, assessing the accounting principles used and significant estimates made by management, and evaluating the overall financial statement presentation. We believe that our audits, which included confirmation of securities at December 31, 2010 by correspondence with the custodian and brokers, provide a reasonable basis for our opinion.
/s/ PricewaterhouseCoopers LLP
PricewaterhouseCoopers LLP
Boston, Massachusetts
February 22, 2011
Annual Report
The Trustees, Members of the Advisory Board, and executive officers of the trust and fund, as applicable, are listed below. The Board of Trustees governs the fund and is responsible for protecting the interests of shareholders. The Trustees are experienced executives who meet periodically throughout the year to oversee the fund's activities, review contractual arrangements with companies that provide services to the fund, oversee management of the risks associated with such activities and contractual arrangements, and review the fund's performance. Except for James C. Curvey, each of the Trustees oversees 219 funds advised by FMR or an affiliate. Mr. Curvey oversees 408 funds advised by FMR or an affiliate.
The Trustees hold office without limit in time except that (a) any Trustee may resign; (b) any Trustee may be removed by written instrument, signed by at least two-thirds of the number of Trustees prior to such removal; (c) any Trustee who requests to be retired or who has become incapacitated by illness or injury may be retired by written instrument signed by a majority of the other Trustees; and (d) any Trustee may be removed at any special meeting of shareholders by a two-thirds vote of the outstanding voting securities of the trust. Each Trustee who is not an interested person (as defined in the 1940 Act) (Independent Trustee), shall retire not later than the last day of the calendar year in which his or her 72nd birthday occurs. The Independent Trustees may waive this mandatory retirement age policy with respect to individual Trustees. The executive officers and Advisory Board Members hold office without limit in time, except that any officer and Advisory Board Member may resign or may be removed by a vote of a majority of the Trustees at any regular meeting or any special meeting of the Trustees. Except as indicated, each individual has held the office shown or other offices in the same company for the past five years.
Experience, Skills, Attributes, and Qualifications of the Fund's Trustees. The Governance and Nominating Committee has adopted a statement of policy that describes the experience, qualifications, attributes, and skills that are necessary and desirable for potential Independent Trustee candidates (Statement of Policy). The Board believes that each Trustee satisfied at the time he or she was initially elected or appointed a Trustee, and continues to satisfy, the standards contemplated by the Statement of Policy. The Governance and Nominating Committee also engages professional search firms to help identify potential Independent Trustee candidates who have the experience, qualifications, attributes, and skills consistent with the Statement of Policy. From time to time, additional criteria based on the composition and skills of the current Independent Trustees, as well as experience or skills that may be appropriate in light of future changes to board composition, business conditions, and regulatory or other developments, have also been considered by the professional search firms and the Governance and Nominating Committee. In addition, the Board takes into account the Trustees' commitment and participation in Board and committee meetings, as well as their leadership of standing and ad hoc committees throughout their tenure.
In determining that a particular Trustee was and continues to be qualified to serve as a Trustee, the Board has considered a variety of criteria, none of which, in isolation, was controlling. The Board believes that, collectively, the Trustees have balanced and diverse experience, qualifications, attributes, and skills, which allow the Board to operate effectively in governing the fund and protecting the interests of shareholders. Information about the specific experience, skills, attributes, and qualifications of each Trustee, which in each case led to the Board's conclusion that the Trustee should serve (or continue to serve) as a trustee of the fund, is provided below.
Board Structure and Oversight Function. James C. Curvey is an interested person (as defined in the 1940 Act) and currently serves as Acting Chairman. The Trustees have determined that an interested Chairman is appropriate and benefits shareholders because an interested Chairman has a personal and professional stake in the quality and continuity of services provided to the fund. Independent Trustees exercise their informed business judgment to appoint an individual of their choosing to serve as Chairman, regardless of whether the Trustee happens to be independent or a member of management. The Independent Trustees have determined that they can act independently and effectively without having an Independent Trustee serve as Chairman and that a key structural component for assuring that they are in a position to do so is for the Independent Trustees to constitute a substantial majority for the Board. The Independent Trustees also regularly meet in executive session. Ned C. Lautenbach serves as Chairman of the Independent Trustees and as such (i) acts as a liaison between the Independent Trustees and management with respect to matters important to the Independent Trustees and (ii) with management prepares agendas for Board meetings.
Fidelity funds are overseen by different Boards of Trustees. The fund's Board oversees Fidelity's equity and high income funds and another Board oversees Fidelity's investment-grade bond, money market, and asset allocation funds. The asset allocation funds may invest in Fidelity funds overseen by the fund's Board. The use of separate Boards, each with its own committee structure, allows the Trustees of each group of Fidelity funds to focus on the unique issues of the funds they oversee, including common research, investment, and operational issues. On occasion, the separate Boards establish joint committees to address issues of overlapping consequences for the Fidelity funds overseen by each Board.
The Trustees operate using a system of committees to facilitate the timely and efficient consideration of all matters of importance to the Trustees, the fund, and fund shareholders and to facilitate compliance with legal and regulatory requirements and oversight of the fund's activities and associated risks. The Board, acting through its committees, has charged FMR and its affiliates with (i) identifying events or circumstances the occurrence of which could have demonstrably adverse effects on the fund's business and/or reputation; (ii) implementing processes and controls to lessen the possibility that such events or circumstances occur or to mitigate the effects of such events or circumstances if they do occur; and (iii) creating and maintaining a system designed to evaluate continuously business and market conditions in order to facilitate the identification and implementation processes described in (i) and (ii) above. Because the day-to-day operations and activities of the fund are carried out by or through FMR, its affiliates and other service providers, the fund's exposure to risks is mitigated but not eliminated by the processes overseen by the Trustees. While each of the Board's committees has responsibility for overseeing different aspects of the fund's activities, oversight is exercised primarily through the Operations, Audit, and Compliance Committees. Appropriate personnel, including but not limited to the fund's Chief Compliance Officer (CCO), FMR's internal auditor, the independent accountants, the fund's Treasurer and portfolio management personnel, make periodic reports to the Board's committees, as appropriate. The responsibilities of each committee, including their oversight responsibilities, are described further under "Standing Committees of the Fund's Trustees."
Annual Report
The fund's Statement of Additional Information (SAI) includes more information about the Trustees. To request a free copy, call Fidelity at 1-877-208-0098.
Interested Trustees*:
Correspondence intended for each Trustee who is an interested person may be sent to Fidelity Investments, 82 Devonshire Street, Boston, Massachusetts 02109.
Name, Age; Principal Occupations and Other Relevant Experience+ |
James C. Curvey (75) |
| Year of Election or Appointment: 2007 Mr. Curvey is Trustee and Acting Chairman of the Board of Trustees of certain Trusts. Mr. Curvey also serves as Trustee (2007-present) of other investment companies advised by FMR. Mr. Curvey is a Director of Fidelity Investments Money Management, Inc. (2009-present), Director of Fidelity Research & Analysis Co. (2009-present) and Director of FMR and FMR Co., Inc. (2007-present). Mr. Curvey is also Vice Chairman (2007-present) and Director of FMR LLC. In addition, Mr. Curvey serves as an Overseer for the Boston Symphony Orchestra and a member of the Trustees of Villanova University. Previously, Mr. Curvey was the Vice Chairman (2006-2007) and Director (2000-2007) of FMR Corp. |
Ronald P. O'Hanley (54) |
| Year of Election or Appointment: 2011 Mr. O'Hanley is President of Fidelity Asset Management and Corporate Services and a member of Fidelity's Executive Committee (2010-present). Previously, Mr. O'Hanley served as President and Chief Executive Officer of BNY Mellon Asset Management (2007-2010). Mr. O'Hanley also served as Vice Chairman of Bank New York Mellon Corp. and a member of that firm's Executive Committee. Prior to the 2007 merger of The Bank of New York and Mellon Financial Corporation, he was Vice Chairman of Mellon Financial Corporation and President and Chief Executive Officer of Mellon Asset Management. He joined Mellon in February 1997. Mr. O'Hanley currently serves as Chairman of the Boston Public Library Foundation Board of Directors and sits on the Board of Directors of Beth Israel Deaconess Medical Center, the Board of Trustees of the Marine Biological Laboratory and the Advisory Board of the Maxwell School of Citizenship and Public Administration at Syracuse University. Mr. O'Hanley also chairs the Council on Asset Management for the Financial Services Roundtable and is a member of the Board of Directors of Institutional Investor's U.S. Institute. |
* Trustees have been determined to be "Interested Trustees" by virtue of, among other things, their affiliation with the trust or various entities under common control with FMR.
+ The information above includes each Trustee's principal occupation during the last five years and other information relating to the experience, attributes, and skills relevant to each Trustee's qualifications to serve as a Trustee, which led to the conclusion that each Trustee should serve as a Trustee for the fund.
Independent Trustees:
Correspondence intended for each Independent Trustee (that is, the Trustees other than the Interested Trustees) may be sent to Fidelity Investments, P.O. Box 55235, Boston, Massachusetts 02205-5235.
Name, Age; Principal Occupations and Other Relevant Experience+ |
Dennis J. Dirks (62) |
| Year of Election or Appointment: 2005 Prior to his retirement in May 2003, Mr. Dirks was Chief Operating Officer and a member of the Board of The Depository Trust & Clearing Corporation (DTCC). He also served as President, Chief Operating Officer, and Board member of The Depository Trust Company (DTC) and President and Board member of the National Securities Clearing Corporation (NSCC). In addition, Mr. Dirks served as Chief Executive Officer and Board member of the Government Securities Clearing Corporation, Chief Executive Officer and Board member of the Mortgage-Backed Securities Clearing Corporation, as a Trustee and a member of the Finance Committee of Manhattan College (2005-2008), and as a Trustee and a member of the Finance Committee of AHRC of Nassau County (2006-2008). Mr. Dirks is a member of the Independent Directors Council (IDC) Governing Council (2010-Present) and Board of Directors for The Brookville Center for Children's Services, Inc. (2009-present). |
Alan J. Lacy (57) |
| Year of Election or Appointment: 2008 Mr. Lacy serves as Senior Adviser (2007-present) of Oak Hill Capital Partners, L.P. (private equity). Mr. Lacy also served as Chief Executive Officer (2000-2005) and Vice Chairman (2005-2006) of Sears Holdings Corporation and Sears, Roebuck and Co. (retail). In addition, Mr. Lacy serves as a member of the Board of Directors of The Western Union Company (global money transfer, 2006-present) and Bristol-Myers Squibb Company (global pharmaceuticals, 2007-present). Mr. Lacy is Chairman (2008-present) and a member (2006-present) of the Board of Trustees of The National Parks Conservation Association. |
Ned C. Lautenbach (66) |
| Year of Election or Appointment: 2000 Mr. Lautenbach is Chairman of the Independent Trustees of the Equity and High Income Funds (2006-present). Mr. Lautenbach currently serves as the Lead Director of the Eaton Corporation Board of Directors (diversified industrial, 1997-present). Mr. Lautenbach is also a member of the Board of Directors of the Philharmonic Center for the Arts in Naples, Florida (1999-present); a member of the Board of Trustees of Fairfield University (2005-present); and a member of the Council on Foreign Relations (1994-present). Previously, Mr. Lautenbach was a Partner/Advisory Partner at Clayton, Dubilier & Rice, Inc. (private equity investment, 1998-2010), as well as a Director of Sony Corporation (2006-2007). |
Joseph Mauriello (66) |
| Year of Election or Appointment: 2008 Prior to his retirement in January 2006, Mr. Mauriello served in numerous senior management positions including Deputy Chairman and Chief Operating Officer (2004-2005), and Vice Chairman of Financial Services (2002-2004) of KPMG LLP US (professional services, 1965-2005). Mr. Mauriello currently serves as a member of the Board of Directors of XL Group plc. (global insurance and re-insurance, 2006-present) and of Arcadia Resources Inc. (health care services and products, 2007-present). Previously, Mr. Mauriello served as a Director of the Hamilton Funds of the Bank of New York (2006-2007). |
Cornelia M. Small (66) |
| Year of Election or Appointment: 2005 Ms. Small is a member of the Board of Directors of the Teagle Foundation (2009-present). Ms. Small is also a member of the Investment Committee, and Chair (2008-present) and a member of the Board of Trustees of Smith College. In addition, Ms. Small serves on the Investment Committee of the Berkshire Taconic Community Foundation (2008-present). Previously, Ms. Small served as Chairperson of the Investment Committee (2002-2008) of Smith College. In addition, Ms. Small served as Chief Investment Officer, Director of Global Equity Investments, and a member of the Board of Directors of Scudder, Stevens & Clark and Scudder Kemper Investments. |
William S. Stavropoulos (71) |
| Year of Election or Appointment: 2001 Mr. Stavropoulos is Vice Chairman of the Independent Trustees of the Equity and High Income Funds (2006-present). Mr. Stavropoulos serves as President and Founder of the Michigan Baseball Foundation, the Great Lakes Loons (2007-present). Mr. Stavropoulos is Chairman Emeritus of the Board of Directors of The Dow Chemical Company, where he previously served in numerous senior management positions, including President, CEO (1995-2000; 2002-2004), Chairman of the Executive Committee (2000-2006), and as a member of the Board of Directors (1990-2006). Currently, Mr. Stavropoulos is Chairman of Univar (global distributor of commodity and specialty chemicals, 2010-present), a Director of Teradata Corporation (data warehousing and technology solutions, 2008-present), Chemical Financial Corporation, Maersk Inc. (industrial conglomerate), Tyco International, Inc. (multinational manufacturing and services, 2007-present), and a member of the Advisory Board for Metalmark Capital (private equity investment, 2005-present). Mr. Stavropoulos is a special advisor to Clayton, Dubilier & Rice, LLC (private equity investment). In addition, Mr. Stavropoulos is a member of the University of Notre Dame Advisory Council for the College of Science. |
David M. Thomas (61) |
| Year of Election or Appointment: 2008 Previously, Mr. Thomas served as Executive Chairman (2005-2006) and Chairman and Chief Executive Officer (2000-2005) of IMS Health, Inc. (pharmaceutical and healthcare information solutions). In addition, Mr. Thomas serves as a member of the Board of Directors of Fortune Brands, Inc. (consumer products), and Interpublic Group of Companies, Inc. (marketing communication, 2004-present). |
Michael E. Wiley (60) |
| Year of Election or Appointment: 2008 Mr. Wiley also serves as a Director of Asia Pacific Exploration Consolidated (international oil and gas exploration and production, 2008-present). Mr. Wiley serves as a Director of Tesoro Corporation (independent oil refiner and marketer, 2005-present), and a Director of Bill Barrett Corporation (exploration and production, 2005-present). In addition, Mr. Wiley also serves as a Director of Post Oak Bank (privately-held bank, 2004-present). Previously, Mr. Wiley served as a member of the Board of Trustees of the University of Tulsa (2000-2006; 2007-2010), as a Senior Energy Advisor of Katzenbach Partners, LLC (consulting, 2006-2007), as an Advisory Director of Riverstone Holdings (private investment), Chairman, President, and CEO of Baker Hughes, Inc. (oilfield services, 2000-2004), and as Director of Spinnaker Exploration Company (exploration and production, 2001-2005). |
+ The information above includes each Trustee's principal occupation during the last five years and other information relating to the experience, attributes, and skills relevant to each Trustee's qualifications to serve as a Trustee, which led to the conclusion that each Trustee should serve as a Trustee for the fund.
Advisory Board Members and Executive Officers:
Correspondence intended for each executive officer, Edward C. Johnson 3d, and Peter S. Lynch may be sent to Fidelity Investments, 82 Devonshire Street, Boston, Massachusetts 02109.
Name, Age; Principal Occupation |
Edward C. Johnson 3d (80) |
| Year of Election or Appointment: 2011 Member of the Advisory Board of Fidelity's Equity and High Income Funds. Formerly Trustee and Chairman of the Board of Trustees of certain Trusts, Mr. Johnson serves as Chief Executive Officer, Chairman, and a Director of FMR LLC; Chairman and a Director of FMR; and Chairman and a Director of FMR Co., Inc. In addition, Mr. Johnson serves as Chairman and Director of FIL Limited. Previously, Mr. Johnson served as President of FMR LLC (2006-2007). |
Peter S. Lynch (66) |
| Year of Election or Appointment: 2003 Member of the Advisory Board of Fidelity's Equity and High Income Funds. Mr. Lynch is Vice Chairman and a Director of FMR and FMR Co., Inc. In addition, Mr. Lynch serves as a Trustee of Boston College and as the Chairman of the Inner-City Scholarship Fund. Previously, Mr. Lynch served on the Special Olympics International Board of Directors (1997-2006). |
Kenneth B. Robins (41) |
| Year of Election or Appointment: 2008 President and Treasurer of Fidelity's Equity and High Income Funds. Mr. Robins also serves as President and Treasurer (2010-present) and Assistant Treasurer (2009-present) of other Fidelity funds and is an employee of Fidelity Investments (2004-present). Previously, Mr. Robins served as Deputy Treasurer of the Fidelity funds (2005-2008) and Treasurer and Chief Financial Officer of The North Carolina Capital Management Trust: Cash and Term Portfolios (2006-2008). |
Brian B. Hogan (46) |
| Year of Election or Appointment: 2009 Vice President of certain Equity Funds and Vice President of Sector Funds. Mr. Hogan also serves as President of FMR's Equity Division (2009-present). Previously, Mr. Hogan served as Senior Vice President, Equity Research of FMR (2006-2009) and as a portfolio manager. |
Thomas C. Hense (46) |
| Year of Election or Appointment: 2008 or 2010 Vice President of Fidelity's High Income (2008), Small Cap (2008), and Value (2010) Funds. Previously, Mr. Hense served as a portfolio manager for Fidelity's Institutional Money Management Group (Pyramis) (2003-2008). |
Scott C. Goebel (42) |
| Year of Election or Appointment: 2008 Secretary and Chief Legal Officer (CLO) of the Fidelity funds. Mr. Goebel also serves as Secretary and CLO of The North Carolina Capital Management Trust: Cash and Term Portfolio (2008-present); General Counsel, Secretary, and Senior Vice President of FMR (2008-present) and FMR Co., Inc. (2008-present); Deputy General Counsel of FMR LLC; Chief Legal Officer of Fidelity Management & Research (Hong Kong) Limited (2008-present) and Assistant Secretary of Fidelity Management & Research (Japan) Inc. (2008-present), Fidelity Investments Money Management, Inc. (2008-present), Fidelity Management & Research (U.K.) Inc. (2008-present), and Fidelity Research and Analysis Company (2008-present). Previously, Mr. Goebel served as Assistant Secretary of the Funds (2007-2008) and as Vice President and Secretary of Fidelity Distributors Corporation (FDC) (2005-2007). |
William C. Coffey (41) |
| Year of Election or Appointment: 2009 Assistant Secretary of Fidelity's Equity and High Income Funds. Mr. Coffey also serves as Senior Vice President and Deputy General Counsel of FMR LLC (2010-present), and is an employee of Fidelity Investments. Previously, Mr. Coffey served as Vice President and Associate General Counsel of FMR LLC (2005-2009). |
Holly C. Laurent (56) |
| Year of Election or Appointment: 2008 Anti-Money Laundering (AML) Officer of the Fidelity funds. Ms. Laurent also serves as AML Officer of The North Carolina Capital Management Trust: Cash and Term Portfolio (2008-present) and is an employee of Fidelity Investments. Previously, Ms. Laurent was Senior Vice President and Head of Legal for Fidelity Business Services India Pvt. Ltd. (2006-2008), and Senior Vice President, Deputy General Counsel and Group Head for FMR LLC (2005-2006). |
Christine Reynolds (52) |
| Year of Election or Appointment: 2008 Chief Financial Officer of the Fidelity funds. Ms. Reynolds became President of Fidelity Pricing and Cash Management Services (FPCMS) in August 2008. Ms. Reynolds served as Chief Operating Officer of FPCMS (2007-2008). Previously, Ms. Reynolds served as President, Treasurer, and Anti-Money Laundering officer of the Fidelity funds (2004-2007). |
Kenneth A. Rathgeber (63) |
| Year of Election or Appointment: 2004 Chief Compliance Officer of Fidelity's Equity and High Income Funds. Mr. Rathgeber is Chief Compliance Officer of Fidelity Management & Research (Hong Kong) Limited (2008-present), Fidelity Management & Research (Japan) Inc. (2008-present), FMR (2005-present), FMR Co., Inc. (2005-present), Fidelity Management & Research (U.K.) Inc. (2005-present), Fidelity Research & Analysis Company (2005-present), Fidelity Investments Money Management, Inc. (2005-present), Pyramis Global Advisors, LLC (2005-present), and Strategic Advisers, Inc. (2005-present). |
Jeffrey S. Christian (49) |
| Year of Election or Appointment: 2009 Deputy Treasurer of the Fidelity funds. Mr. Christian is an employee of Fidelity Investments. Previously, Mr. Christian served as Chief Financial Officer (2008-2009) of certain Fidelity funds and Senior Vice President of Fidelity Pricing and Cash Management Services (FPCMS) (2004-2009). |
Bryan A. Mehrmann (49) |
| Year of Election or Appointment: 2005 Deputy Treasurer of the Fidelity funds. Mr. Mehrmann is an employee of Fidelity Investments. |
Adrien E. Deberghes (43) |
| Year of Election or Appointment: 2008 Deputy Treasurer of Fidelity's Equity and High Income Funds. Mr. Deberghes also serves as Assistant Treasurer of other Fidelity funds (2010-present) and is an employee of Fidelity Investments (2008-present). Previously, Mr. Deberghes served as Senior Vice President of Mutual Fund Administration at State Street Corporation (2007-2008), Senior Director of Mutual Fund Administration at Investors Bank & Trust (2005-2007), and Director of Finance for Dunkin' Brands (2000-2005). |
Stephanie J. Dorsey (41) |
| Year of Election or Appointment: 2010 Assistant Treasurer of Fidelity's Equity and High Income Funds. Ms. Dorsey also serves as Deputy Treasurer of other Fidelity funds (2008-present) and is an employee of Fidelity Investments (2008-present). Previously, Ms. Dorsey served as Treasurer (2004-2008) of the JPMorgan Mutual Funds and Vice President (2004-2008) of JPMorgan Chase Bank. |
John R. Hebble (52) |
| Year of Election or Appointment: 2009 Assistant Treasurer of Fidelity's Equity and High Income Funds. Mr. Hebble also serves as Treasurer and Chief Financial Officer of The North Carolina Capital Management Trust: Cash and Term Portfolio (2008-present), President and Treasurer of other Fidelity funds (2008-present) and is an employee of Fidelity Investments. |
Gary W. Ryan (52) |
| Year of Election or Appointment: 2005 Assistant Treasurer of the Fidelity funds. Mr. Ryan is an employee of Fidelity Investments. Previously, Mr. Ryan served as Vice President of Fund Reporting in Fidelity Pricing and Cash Management Services (FPCMS) (1999-2005). |
Jonathan Davis (42) |
| Year of Election or Appointment: 2010 Assistant Treasurer of the Fidelity funds. Mr. Davis is an employee of Fidelity Investments. Previously, Mr. Davis served as Vice President and Associate General Counsel of FMR LLC (2003-2010). |
Annual Report
Board Approval of Investment Advisory Contracts and Management Fees
VIP High Income Portfolio
Each year, the Board of Trustees, including the Independent Trustees (together, the Board), votes on the renewal of the management contract and sub-advisory agreements (together, the Advisory Contracts) for the fund. The Board, assisted by the advice of fund counsel and Independent Trustees' counsel, requests and considers a broad range of information relevant to the renewal of the Advisory Contracts throughout the year.
The Board meets regularly and considers at each of its meetings factors that are relevant to its annual consideration of the renewal of the fund's Advisory Contracts, including the services and support provided to the fund and its shareholders. The Board has established various standing committees, each composed of Independent Trustees with varying backgrounds, to which the Board has assigned specific subject matter responsibilities in order to enhance effective decision-making by the Board. The Board, acting directly and through its Committees, requests and receives information concerning the annual consideration of the renewal of the fund's Advisory Contracts. The Board also meets as needed to consider matters specifically related to the Board's annual consideration of the renewal of Advisory Contracts. Members of the Board may also meet with trustees of other Fidelity funds through ad hoc joint committees to discuss certain matters relevant to the Fidelity funds.
At its July 2010 meeting, the Board of Trustees, including the Independent Trustees, unanimously determined to renew the fund's Advisory Contracts. In reaching its determination, the Board considered all factors it believed relevant, including (i) the nature, extent, and quality of the services to be provided to the fund and its shareholders (including the investment performance of the fund); (ii) the competitiveness of the fund's management fee and total expenses; (iii) the total costs of the services to be provided by and the profits to be realized by Fidelity from its relationship with the fund; (iv) the extent to which economies of scale would be realized as the fund grows; and (v) whether fee levels reflect these economies of scale, if any, for the benefit of fund shareholders.
In considering whether to renew the Advisory Contracts for the fund, the Board reached a determination, with the assistance of fund counsel and Independent Trustees' counsel and through the exercise of its business judgment, that the renewal of the Advisory Contracts is in the best interests of fund shareholders and that the compensation to be received by Fidelity under the management contract is fair and reasonable. The Board's decision to renew the Advisory Contracts was not based on any single factor noted above, but rather was based on a comprehensive consideration of all the information provided to the Board at its meetings throughout the year. The Board, in reaching its determination to renew the Advisory Contracts, is aware that shareholders in the fund have a broad range of investment choices available to them, including a wide choice among mutual funds offered by Fidelity's competitors, and that the fund's shareholders, with the opportunity to review and weigh the disclosure provided by the fund in its prospectus and other public disclosures, have chosen to invest in this fund, managed by Fidelity.
Nature, Extent, and Quality of Services Provided. The Board considered the staffing within the investment adviser, FMR, and the sub-advisers (together, the Investment Advisers), including the backgrounds of the fund's investment personnel and the fund's investment objective and discipline. The Independent Trustees also had discussions with senior management of Fidelity's investment operations and investment groups. The Board considered the structure of the portfolio manager compensation program and whether this structure provides appropriate incentives to act in the best interest of the fund.
Resources Dedicated to Investment Management and Support Services. The Board and the equity research subcommittee of the Board's Fund Oversight Committee reviewed the size, education, and experience of the Investment Advisers' investment staff, their use of technology, and the Investment Advisers' approach to recruiting, training, and retaining portfolio managers and other research, advisory, and management personnel. The Board noted that Fidelity's analysts have access to a variety of technological tools and market and securities data that enable them to perform both fundamental and quantitative analysis and to specialize in various disciplines. The Board considered Fidelity's extensive global research capabilities that enable the Investment Advisers to aggregate data from various sources in an effort to produce positive investment results. The Board also considered that Fidelity's portfolio managers and analysts have access to daily portfolio attribution that allows for monitoring of a fund's portfolio, as well as an electronic communication system that provides immediate real-time access to research concerning issuers and credit enhancers. The Board noted FMR's continued focus on strengthening the organization and discipline of equity portfolio management and research.
Shareholder and Administrative Services. The Board considered (i) the nature, extent, quality, and cost of advisory, administrative, and shareholder services performed by the Investment Advisers and their affiliates under the Advisory Contracts and under separate agreements covering transfer agency, pricing and bookkeeping, and securities lending services for the fund; (ii) the nature and extent of the investment adviser's supervision of third party service providers, principally custodians and subcustodians; and (iii) the resources devoted to, and the record of compliance with, the fund's compliance policies and procedures. The Board also reviewed the allocation of fund brokerage, including allocations to brokers affiliated with the Investment Advisers, the use of brokerage commissions to pay fund expenses, and the use of "soft" commission dollars to pay for research services.
The Board noted that the growth of fund assets over time across the complex allows Fidelity to reinvest in the development of services designed to enhance the value or convenience of the Fidelity funds as investment vehicles. These services include 24-hour access to account information and market information through phone representatives and over the Internet, and investor education materials and asset allocation tools.
Investment in a Large Fund Family. The Board considered the benefits to shareholders of investing in a Fidelity fund, including the benefits of investing in a fund that is part of a large family of funds offering a variety of investment disciplines and providing a large variety of mutual fund investor services. The Board noted that Fidelity had taken, or had made recommendations that resulted in the Fidelity funds taking, a number of actions over the previous year that benefited particular funds, including (i) dedicating additional resources to investment research and restructuring and broadening the focus of the investment research teams; (ii) bolstering the senior management team that oversees asset management; (iii) launching Class F of certain funds as a lower-fee class available to Freedom K and Freedom Index Funds; (iv) lowering the initial investment minimums and ongoing balance requirements for Real Estate High Income Fund; (v) eliminating subsequent purchase minimums for all funds and adding a waiver of the investment minimum requirement for new accounts opened with the proceeds of a systematic withdrawal plan; (vi) eliminating the withdrawal minimum and maximum limits for systematic withdrawals from Advisor funds; (vii) expanding sales load waivers on Class A shares for Destiny Planholders and expanding Institutional Class eligibility for Class O Destiny Planholders; and (viii) changing certain Class A and Class T sales charge structures to further align them with industry practices.
Annual Report
Investment Performance. The Board considered whether the fund has operated in accordance with its investment objective, as well as its record of compliance with its investment restrictions. It also reviewed the fund's absolute investment performance for each class, as well as the fund's relative investment performance for each class measured over multiple periods against (i) a broad-based securities market index, and (ii) a peer group of mutual funds deemed appropriate by Fidelity and reviewed by the Board. The following charts considered by the Board show, over the one-, three-, and five-year periods ended December 31, 2009, the cumulative total returns of Initial Class and Service Class 2 of the fund, the cumulative total returns of a broad-based securities market index ("benchmark"), and a range of cumulative total returns of a peer group of mutual funds identified by Lipper Inc. as having an investment objective similar to that of the fund. The returns of Initial Class and Service Class 2 show the performance of the highest and lowest performing classes, respectively (based on five-year performance). The box within each chart shows the 25th percentile return (bottom of box) and the 75th percentile return (top of box) of the peer group. Returns shown above the box are in the first quartile and returns shown below the box are in the fourth quartile. The percentage beaten numbers noted below each chart correspond to the percentile box and represent the percentage of funds in the peer group whose performance was equal to or lower than that of the class indicated.
VIP High Income Portfolio
The Board reviewed the fund's relative investment performance against its peer group and noted that the performance of Initial Class of the fund was in the third quartile for the one- and three-year periods and the second quartile for the five-year period. The Board also noted that the investment performance of the fund was lower than its benchmark for all the periods shown. The Board considered that the variations in performance among the fund's classes reflect the variations in class expenses, which result in lower performance for higher expense classes. The Board discussed with FMR actions that have been taken by FMR to improve the fund's more recent disappointing performance relative to its peer group and benchmark. The Board also reviewed the fund's performance since inception as well as performance in the current year. The Board will continue to closely monitor the performance of the fund in the coming year and discuss with FMR other appropriate actions to address the performance of the fund.
Based on its review, and giving particular weight to the nature and quality of the resources dedicated by the Investment Advisers to maintain and improve relative performance and factoring in the unprecedented market events in recent years, the Board concluded that the nature, extent, and quality of investment management and support services and of shareholder and administrative services provided to the fund will benefit the fund's shareholders, particularly in light of the Board's view that the fund's shareholders benefit from investing in a fund that is part of a large family of funds offering a variety of investment disciplines and services.
Competitiveness of Management Fee and Total Fund Expenses. The Board considered the fund's management fee and total expenses compared to "mapped groups" of competitive funds and classes. Fidelity creates "mapped groups" by combining similar Lipper investment objective categories that have comparable management fee characteristics. Combining Lipper investment objective categories aids the Board's management fee and total expense comparisons by broadening the competitive group used for comparison and by reducing the number of universes to which various Fidelity funds are compared.
Annual Report
Board Approval of Investment Advisory Contracts and Management Fees - continued
Management Fee. The Board considered two proprietary management fee comparisons for the 12-month periods shown in the chart below. The group of Lipper funds used by the Board for management fee comparisons is referred to below as the "Total Mapped Group." The Total Mapped Group is broader than the Lipper peer group used by the Board for performance comparisons because the Total Mapped Group combines several Lipper investment objective categories while the Lipper peer group does not. The Total Mapped Group comparison focuses on a fund's standing relative to the total universe of comparable funds available to investors, in terms of gross management fees before expense reimbursements or caps. "TMG %" represents the percentage of funds in the Total Mapped Group that had management fees that were lower than the fund's. For example, a TMG % of 24% means that 76% of the funds in the Total Mapped Group had higher management fees than the fund. The "Asset-Size Peer Group" (ASPG) comparison focuses on a fund's standing relative to non-Fidelity funds similar in size to the fund within the Total Mapped Group. The ASPG represents at least 15% of the funds in the Total Mapped Group with comparable asset size and management fee characteristics, subject to a minimum of 50 funds (or all funds in the Total Mapped Group if fewer than 50). Additional information, such as the ASPG quartile in which the fund's management fee ranked, is also included in the chart and considered by the Board.
VIP High Income Portfolio
The Board noted that the fund's management fee ranked below the median of its Total Mapped Group and below the median of its ASPG for 2009.
Based on its review, the Board concluded that the fund's management fee is fair and reasonable in light of the services that the fund receives and the other factors considered.
Total Expenses. In its review of each class's total expenses, the Board considered the fund's management fee as well as other fund or class expenses, as applicable, such as transfer agent fees, pricing and bookkeeping fees, fund-paid 12b-1 fees, and custodial, legal, and audit fees. The Board also noted the effects of any waivers and reimbursements on fees and expenses. As part of its review, the Board also considered current and historical total expenses of each class of the fund compared to competitive fund median expenses. Each class of the fund is compared to those funds and classes in the Total Mapped Group (used by the Board for management fee comparisons) that have a similar sales load structure.
The Board noted that the total expenses of each of Initial Class, Initial Class R, Investor Class, Service Class, and Service Class R ranked below its competitive median for 2009 and the total expenses of each of Service Class 2 and Service Class 2 R ranked above its competitive median for 2009. The Board noted that the fund offers multiple classes, each of which has a different 12b-1 fee structure, and that the multiple structures are intended to offer a range of pricing options for the intermediary market. The Board also noted that the total expenses of the classes vary primarily by the level of their 12b-1 fees, although differences in transfer agent fees may also cause expenses to vary from class to class.
Fees Charged to Other Fidelity Clients. The Board also considered Fidelity fee structures and other information with respect to clients of FMR and its affiliates, such as other mutual funds advised or subadvised by FMR or its affiliates, pension plan clients, and other institutional clients. In March 2010, the Board created an ad hoc joint committee with the board of other Fidelity funds (the Committee) to review and compare Fidelity's institutional investment advisory business with its business of providing services to the Fidelity funds, including the differences in services provided, fees charged, and costs incurred, as well as competition in their respective marketplaces.
Annual Report
Based on its review of total expenses and fees charged to other Fidelity clients, the Board concluded that the total expenses of each class of the fund were reasonable, although in some cases above the median of the universe presented for comparison, in light of the services that the fund and its shareholders receive and the other factors considered, including the findings of the Committee.
Costs of the Services and Profitability. The Board considered the revenues earned and the expenses incurred by Fidelity in conducting the business of developing, marketing, distributing, managing, administering and servicing the fund and its shareholders. The Board also considered the level of Fidelity's profits in respect of all the Fidelity funds.
On an annual basis, FMR presents to the Board Fidelity's profitability for the fund. Fidelity calculates the profitability for each fund, as well as aggregate profitability for groups of Fidelity funds and all Fidelity funds, using a series of detailed revenue and cost allocation methodologies which originate with the audited books and records of Fidelity. The Audit Committee of the Board reviews any significant changes from the prior year's methodologies.
PricewaterhouseCoopers LLP (PwC), independent registered public accounting firm and auditor to Fidelity and certain Fidelity funds, has been engaged annually by the Board as part of the Board's assessment of Fidelity's profitability analysis. PwC's engagement includes the review and assessment of Fidelity's methodologies used in determining the revenues and expenses attributable to Fidelity's mutual fund business, and completion of agreed-upon procedures surrounding the mathematical accuracy of fund profitability and its conformity to allocation methodologies. After considering PwC's reports issued under the engagement and information provided by Fidelity, the Board believes that while other allocation methods may also be reasonable, Fidelity's profitability methodologies are reasonable in all material respects.
The Board has also reviewed Fidelity's non-fund businesses and fall-out benefits related to the mutual fund business as well as cases where Fidelity's affiliates may benefit from or be related to the fund's business.
The Board considered the costs of the services provided by and the profits realized by Fidelity in connection with the operation of the fund and were satisfied that the profitability was not excessive in the circumstances.
Economies of Scale. The Board considered whether there have been economies of scale in respect of the management of the Fidelity funds, whether the Fidelity funds (including the fund) have appropriately benefited from any such economies of scale, and whether there is potential for realization of any further economies of scale. The Board considered the extent to which the fund will benefit from economies of scale through increased services to the fund, through waivers or reimbursements, or through fee or expense reductions.
In February 2009, the Board and the board of other Fidelity funds created an ad hoc committee (the Economies of Scale Committee) to analyze whether FMR attains economies of scale in respect of the management and servicing of the Fidelity funds, whether the Fidelity funds have appropriately benefited from such economies of scale, and whether there is potential for realization of any further economies of scale.
The Board recognized that the fund's management contract incorporates a "group fee" structure, which provides for lower group fee rates as total fund assets under FMR's management increase, and for higher group fee rates as total fund assets under FMR's management decrease. FMR calculates the group fee rates based on a tiered asset "breakpoint" schedule that varies based on asset class. The Board considered that the group fee is designed to deliver the benefits of economies of scale to fund shareholders when total Fidelity fund assets increase, even if assets of any particular fund are unchanged or have declined, because some portion of Fidelity's costs are attributable to services provided to all Fidelity funds, and all funds benefit if those costs can be allocated among more assets. The Board concluded that, given the group fee structure, fund shareholders will benefit from lower management fees as assets under FMR's management increase at the fund complex level, regardless of whether Fidelity achieves any such economies of scale.
The Board concluded, considering the findings of the Economies of Scale Committee, that any potential economies of scale are being appropriately shared between fund shareholders and Fidelity.
Additional Information Requested by the Board. In order to develop fully the factual basis for consideration of the Fidelity funds' Advisory Contracts, the Board requested and received additional information on certain topics, including (i) fund performance trends, actions to be taken by FMR to improve certain funds' overall performance, and Fidelity's long-term strategies for certain funds; (ii) portfolio manager changes that have occurred during the past year and length of portfolio manager tenure for different categories of funds over time; (iii) Fidelity's compensation structure for portfolio managers, research analysts, and other key personnel, the rationale for the compensation structure, and how the compensation structure provides appropriate performance incentives; (iv) the amount of the investment that each portfolio manager has made in the Fidelity fund(s) that he or she manages; (v) management and other fees paid by FMR to affiliated sub-advisers on behalf of the Fidelity funds; (vi) Fidelity's fee structures and rationale for recommending different fees among different categories of funds; (vii) Fidelity's rationale for recommending which funds should have a performance adjustment component as part of their management fees; (viii) the rationale for any differences between fund fee structures and fee structures in place for other Fidelity clients; and (ix) explanations regarding the relative total expenses borne by certain funds and classes, total expense competitive trends, and actions that might be taken by FMR to reduce total expenses for certain funds and classes.
Based on its evaluation of all of the conclusions noted above, and after considering all factors it believed relevant, the Board ultimately concluded that the advisory fee structures are fair and reasonable, and that the fund's Advisory Contracts should be renewed.
Annual Report
Investment Adviser
Fidelity Management & Research Company
Boston, MA
Investment Sub-Advisers
FMR Co., Inc.
Fidelity Management & Research (U.K.) Inc.
Fidelity Management & Research (Hong Kong) Limited
Fidelity Management & Research (Japan) Inc.
General Distributor
Fidelity Distributors Corporation
Boston, MA
Transfer and Service Agents
Fidelity Investments Institutional Operations Company, Inc.
Boston, MA
Fidelity Service Company, Inc.
Boston, MA
Custodian
The Bank of New York Mellon
New York, NY
VIPHIR-ANN-0211
1.811842.106
Fidelity® Variable Insurance Products:
Overseas Portfolio
Annual Report
December 31, 2010
(2_fidelity_logos) (Registered_Trademark)
Contents
Performance | <Click Here> | How the fund has done over time. |
Management's Discussion of Fund Performance | <Click Here> | The Portfolio Manager's review of fund performance and strategy. |
Shareholder Expense Example | <Click Here> | An example of shareholder expenses. |
Investment Changes | <Click Here> | A summary of major shifts in the fund's investments over the past six months. |
Investments | <Click Here> | A complete list of the fund's investments with their market values. |
Financial Statements | <Click Here> | Statements of assets and liabilities, operations, and changes in net assets, as well as financial highlights. |
Notes | <Click Here> | Notes to the financial statements. |
Report of Independent Registered Public Accounting Firm | <Click Here> | |
Trustees and Officers | <Click Here> | |
Distributions | <Click Here> | |
Board Approval of Investment Advisory Contracts and Management Fees | <Click Here> | |
To view a fund's proxy voting guidelines and proxy voting record for the 12-month period ended June 30, visit http://www.fidelity.com/proxyvotingresults or visit the Securities and Exchange Commission's (SEC) web site at http://www.sec.gov. You may also call 1-877-208-0098 to request a free copy of the proxy voting guidelines.
Fidelity Variable Insurance Products are separate account options which are purchased through a variable insurance contract.
Standard & Poor's, S&P and S&P 500 are registered service marks of The McGraw-Hill Companies, Inc. and have been licensed for use by Fidelity Distributors Corporation.
Other third party marks appearing herein are the property of their respective owners.
All other marks appearing herein are registered or unregistered trademarks or service marks of FMR LLC or an affiliated company.
The general research services agreement with Fidelity Research & Analysis Company has been terminated and is no longer in effect for the fund.
This report and the financial statements contained herein are submitted for the general information of the shareholders of the fund. This report is not authorized for distribution to prospective investors in the fund unless preceded or accompanied by an effective prospectus.
A fund files its complete schedule of portfolio holdings with the SEC for the first and third quarters of each fiscal year on Form N-Q. Forms N-Q are available on the SEC's web site at http://www.sec.gov. A fund's Forms N-Q may be reviewed and copied at the SEC's Public Reference Room in Washington, DC. Information regarding the operation of the SEC's Public Reference Room may be obtained by calling 1-800-SEC-0330. For a complete list of a fund's portfolio holdings, view the most recent holdings listing, semiannual report, or annual report on Fidelity's web site at http://www.fidelity.com, http://www.advisor.fidelity.com, or http://www.401k.com, as applicable.
NOT FDIC INSURED • MAY LOSE VALUE • NO BANK GUARANTEE
Neither the fund nor Fidelity Distributors Corporation is a bank.
Annual Report
Average annual total return reflects the change in the value of an investment, assuming reinvestment of the class' distributions from dividend income and capital gains (the profits earned upon the sale of securities that have grown in value, if any) and assuming a constant rate of performance each year. During periods of reimbursement by Fidelity, a fund's total return will be greater than it would be had the reimbursement not occurred. Performance numbers are net of all underlying fund operating expenses, but do not include any insurance charges imposed by your insurance company's separate account. If performance information included the effect of these additional charges, the total returns would have been lower. How a fund did yesterday is no guarantee of how it will do tomorrow.
Average Annual Total Returns
Periods ended December 31, 2010 | Past 1
year | Past 5
years | Past 10
years |
VIP Overseas Portfolio - Initial Class | 13.11% | 2.19% | 3.10% |
VIP Overseas Portfolio - Service Class | 12.99% | 2.08% | 3.00% |
VIP Overseas Portfolio - Service Class 2 | 12.83% | 1.94% | 2.87% |
$10,000 Over 10 Years
Let's say hypothetically that $10,000 was invested in VIP Overseas Portfolio - Initial Class on December 31, 2000. The chart shows how the value of your investment would have changed, and also shows how the MSCI® EAFE® (Europe, Australasia, Far East) Index performed over the same period.
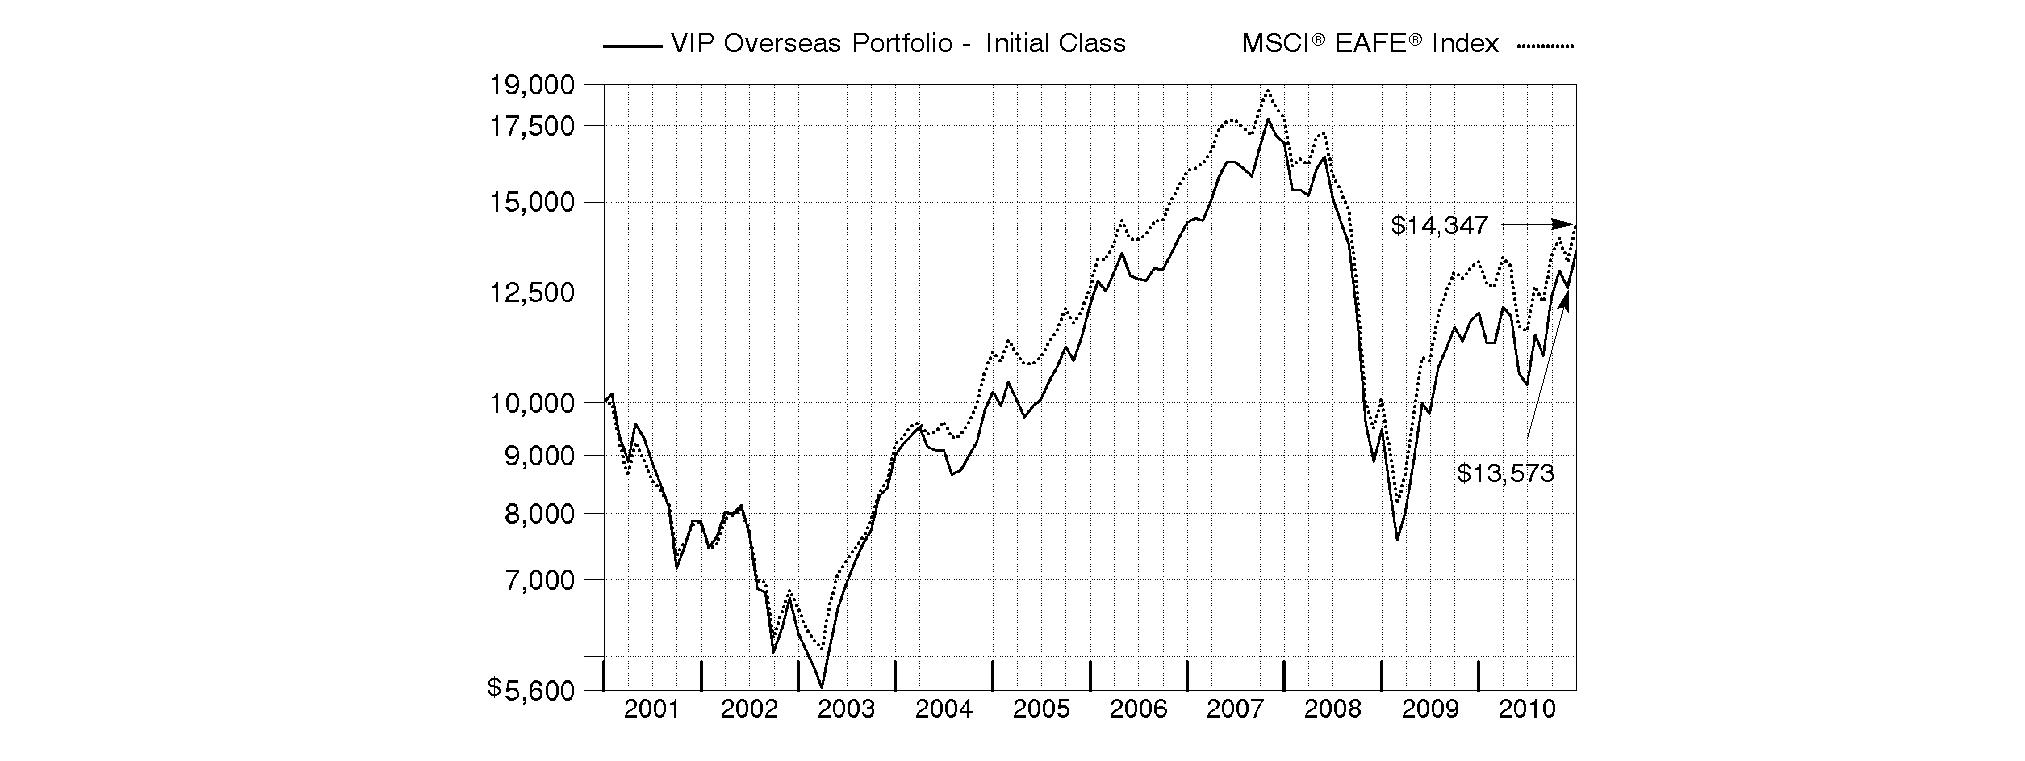
Annual Report
Market Recap: While market improvements around the world hit a speed bump in the first half of the 12-month period ending December 31, 2010, world economies re-accelerated in August, supported by a broadening recovery and low inflation in the U.S. Domestic stock markets recorded solid gains for the year, lifted by a strong second-half rally fueled by economic optimism, encouraging earnings reports and a wave of corporate mergers. The large-cap S&P 500® Index rose 15.06%, the blue-chip-laden Dow Jones Industrial AverageSM added 14.06% and the technology-heavy Nasdaq Composite® Index climbed 18.02%. Meanwhile, international stocks, as represented by the MSCI® ACWI® (All Country World Index) ex USA Index, gained 11.29%, boosted in part by a depreciating U.S. dollar. In the fixed-income arena, U.S. taxable investment-grade bonds generated positive results during 2010, as the Barclays Capital® U.S. Aggregate Bond Index gained 6.54%. With ultra-low interest rates bolstering nearly all fixed-income securities for most of the year, sectors in the index with higher yields and more credit risk generally fared best, while most high-quality bonds generated more-moderate returns. Meanwhile, high-yield bonds, as represented by The BofA Merrill LynchSM US High Yield Constrained Index, returned 15.07%, a result of improved economic data and strengthening investor demand. Overseas, foreign bond markets showed mixed results, with a sizable disparity between the 3.97% return of the Citigroup® Non-U.S. Group of 7 Index - which measures the performance of sovereign debt of the major global economies outside the U.S. - and the 12.04% advance of the JPMorgan Emerging Markets Bond Index Global (EMBI Global), which benefited from the rising overall credit quality of emerging-markets debt issuers.
Comments from Graeme Rockett, Portfolio Manager of VIP Overseas Portfolio: For the 12 months ending December 31, 2010, the fund's share classes substantially outperformed the MSCI® EAFE® (Europe, Australasia, Far East) Index, which rose 7.88%. (For specific portfolio results, please refer to the performance section of this report.) Stock picking was especially effective in consumer discretionary, where an increased overweighting also helped, and in information technology and health care. However, security selection was poor in banking, and the fund was suboptimally positioned in the capital goods and food/beverage/tobacco industries. Contributing stocks included several luxury goods companies: France's LVMH and Switzerland's Swatch Group and Compagnie Financiere Richemont. Three out-of-benchmark investments also helped: Clicks Group, a South African retailer; Deckers Outdoor, a U.S.-based footwear company; and Baidu, a Chinese Internet search provider. Detractors included Scientific Games Corporation, an out-of-benchmark U.S. gaming company; Nestle, a Swiss food giant we underweighted; Intesa Sanpaolo, an Italian bank; and Ireland-based CRH, which supplies building materials. Some of the stocks I've mentioned were sold by period end.
The views expressed above reflect those of the portfolio manager(s) only through the end of the period as stated on the cover of this report and do not necessarily represent the views of Fidelity or any other person in the Fidelity organization. Any such views are subject to change at any time based upon market or other conditions and Fidelity disclaims any responsibility to update such views. These views may not be relied on as investment advice and, because investment decisions for a Fidelity fund are based on numerous factors, may not be relied on as an indication of trading intent on behalf of any Fidelity fund.
Annual Report
As a shareholder of the Fund, you incur two types of costs: (1) transaction costs, including redemption fees, and (2) ongoing costs, including management fees, distribution and/or service (12b-1) fees and other Fund expenses. This Example is intended to help you understand your ongoing costs (in dollars) of investing in the Fund and to compare these costs with the ongoing costs of investing in other mutual funds.
The Example is based on an investment of $1,000 invested at the beginning of the period and held for the entire period (July 1, 2010 to December 31, 2010).
Actual Expenses
The first line of the accompanying table for each class of the Fund provides information about actual account values and actual expenses. You may use the information in this line, together with the amount you invested, to estimate the expenses that you paid over the period. Simply divide your account value by $1,000.00 (for example, an $8,600 account value divided by $1,000.00 = 8.6), then multiply the result by the number in the first line for a class of the Fund under the heading entitled "Expenses Paid During Period" to estimate the expenses you paid on your account during this period. The estimate of expenses does not include any fees or other expenses of any variable annuity or variable life insurance product. If they were, the estimate of expenses you paid during the period would be higher, and your ending account value would be lower. In addition, the Fund, as a shareholder in the underlying Fidelity Central Funds, will indirectly bear its pro-rata share of the fees and expenses incurred by the underlying Fidelity Central Funds. These fees and expenses are not included in the Fund's annualized expense ratio used to calculate the expense estimate in the table below.
Hypothetical Example for Comparison Purposes
The second line of the accompanying table for each class of the Fund provides information about hypothetical account values and hypothetical expenses based on a Class' actual expense ratio and an assumed rate of return of 5% per year before expenses, which is not the Class' actual return. The hypothetical account values and expenses may not be used to estimate the actual ending account balance or expenses you paid for the period. You may use this information to compare the ongoing costs of investing in the Fund and other funds. To do so, compare this 5% hypothetical example with the 5% hypothetical examples that appear in the shareholder reports of the other funds. The estimate of expenses does not include any fees or other expenses of any variable annuity or variable life insurance product. If they were, the estimate of expenses you paid during the period would be higher, and your ending account value would be lower. In addition, the Fund, as a shareholder in the underlying Fidelity Central Funds, will indirectly bear its pro-rata share of the fees and expenses incurred by the underlying Fidelity Central Funds. These fees and expenses are not included in the Fund's annualized expense ratio used to calculate the expense estimate in the table below.
Please note that the expenses shown in the table are meant to highlight your ongoing costs only and do not reflect any transaction costs. Therefore, the second line of the table is useful in comparing ongoing costs only, and will not help you determine the relative total costs of owning different funds. In addition, if these transactional costs were included, your costs would have been higher.
| Annualized
Expense Ratio | Beginning
Account Value
July 1, 2010 | Ending
Account Value
December 31, 2010 | Expenses Paid
During Period*
July 1, 2010 to
December 31, 2010 |
Initial Class | .84% | | | |
Actual | | $ 1,000.00 | $ 1,308.50 | $ 4.89 |
Hypothetical A | | $ 1,000.00 | $ 1,020.97 | $ 4.28 |
Service Class | .94% | | | |
Actual | | $ 1,000.00 | $ 1,307.90 | $ 5.47 |
Hypothetical A | | $ 1,000.00 | $ 1,020.47 | $ 4.79 |
Service Class 2 | 1.09% | | | |
Actual | | $ 1,000.00 | $ 1,307.00 | $ 6.34 |
Hypothetical A | | $ 1,000.00 | $ 1,019.71 | $ 5.55 |
Initial Class R | .84% | | | |
Actual | | $ 1,000.00 | $ 1,308.40 | $ 4.89 |
Hypothetical A | | $ 1,000.00 | $ 1,020.97 | $ 4.28 |
Service Class R | .94% | | | |
Actual | | $ 1,000.00 | $ 1,308.40 | $ 5.47 |
Hypothetical A | | $ 1,000.00 | $ 1,020.47 | $ 4.79 |
Service Class 2R | 1.09% | | | |
Actual | | $ 1,000.00 | $ 1,306.60 | $ 6.34 |
Hypothetical A | | $ 1,000.00 | $ 1,019.71 | $ 5.55 |
Investor Class R | .93% | | | |
Actual | | $ 1,000.00 | $ 1,308.60 | $ 5.41 |
Hypothetical A | | $ 1,000.00 | $ 1,020.52 | $ 4.74 |
A 5% return per year before expenses
* Expenses are equal to each Class' annualized expense ratio, multiplied by the average account value over the period, multiplied by 184/365 (to reflect the one-half year period).
Annual Report
Investment Changes (Unaudited)
Geographic Diversification (% of fund's net assets) |
As of December 31, 2010 |
 | Japan | 17.3% | |
 | United Kingdom | 16.8% | |
 | Germany | 11.1% | |
 | France | 10.7% | |
 | Switzerland | 6.0% | |
 | Cayman Islands | 4.7% | |
 | Denmark | 3.2% | |
 | United States of America | 3.0% | |
 | Italy | 3.0% | |
 | Other | 24.2% | |

Percentages are adjusted for the effect of futures contracts, if applicable. |
As of June 30, 2010 |
| Japan | 19.3% | |
| United Kingdom | 17.8% | |
| France | 10.5% | |
| Germany | 7.7% | |
| Switzerland | 7.3% | |
| United States of America | 4.6% | |
| Australia | 3.7% | |
| Cayman Islands | 3.3% | |
| Spain | 3.0% | |
| Other | 22.8% | |

Percentages are adjusted for the effect of futures contracts, if applicable. |
Asset Allocation as of December 31, 2010 |
| % of fund's
net assets | % of fund's net assets
6 months ago |
Stocks | 98.9 | 98.2 |
Short-Term Investments and Net Other Assets | 1.1 | 1.8 |
Top Ten Stocks as of December 31, 2010 |
| % of fund's
net assets | % of fund's net assets
6 months ago |
LVMH Moet Hennessy - Louis Vuitton (France, Textiles, Apparel & Luxury Goods) | 2.8 | 2.4 |
HSBC Holdings PLC (United Kingdom, Commercial Banks) | 2.1 | 2.6 |
The Swatch Group AG (Bearer) (Switzerland, Textiles, Apparel & Luxury Goods) | 2.1 | 2.0 |
Bayerische Motoren Werke AG (BMW) (Germany, Automobiles) | 1.8 | 1.1 |
Novo Nordisk AS Series B (Denmark, Pharmaceuticals) | 1.8 | 1.6 |
Volkswagen AG (Germany, Automobiles) | 1.7 | 0.3 |
BHP Billiton PLC (United Kingdom, Metals & Mining) | 1.6 | 1.2 |
Compagnie Financiere Richemont SA Series A (Switzerland, Textiles, Apparel & Luxury Goods) | 1.5 | 0.9 |
Saipem SpA (Italy, Energy Equipment & Services) | 1.5 | 1.1 |
Signet Jewelers Ltd. (Bermuda, Specialty Retail) | 1.5 | 0.0 |
| 18.4 | |
Market Sectors as of December 31, 2010 |
| % of fund's
net assets | % of fund's net assets
6 months ago |
Consumer Discretionary | 27.4 | 21.9 |
Financials | 21.3 | 24.8 |
Materials | 10.6 | 8.8 |
Industrials | 9.5 | 9.7 |
Information Technology | 8.9 | 9.2 |
Energy | 6.8 | 6.3 |
Health Care | 6.0 | 8.6 |
Consumer Staples | 4.3 | 5.0 |
Telecommunication Services | 3.7 | 3.0 |
Utilities | 0.4 | 0.9 |
Annual Report
Investments December 31, 2010
Showing Percentage of Net Assets
Common Stocks - 96.5% |
| Shares | | Value |
Australia - 2.1% |
AMP Ltd. | 169,593 | | $ 916,615 |
Aristocrat Leisure Ltd. (d) | 1,050,218 | | 3,208,293 |
Australia & New Zealand Banking Group Ltd. | 161,823 | | 3,860,562 |
BHP Billiton Ltd. | 318,002 | | 14,771,546 |
Newcrest Mining Ltd. | 258,132 | | 10,665,381 |
Paladin Energy Ltd. (a) | 546,057 | | 2,750,479 |
Rio Tinto Ltd. | 24,301 | | 2,122,078 |
Westfield Retail Trust unit | 158,772 | | 416,899 |
TOTAL AUSTRALIA | | 38,711,853 |
Austria - 0.5% |
Wienerberger AG (a) | 479,120 | | 9,153,937 |
Bailiwick of Jersey - 1.2% |
Informa PLC | 1,151,821 | | 7,322,830 |
WPP PLC | 1,147,486 | | 14,195,520 |
TOTAL BAILIWICK OF JERSEY | | 21,518,350 |
Belgium - 1.3% |
Ageas | 1,039,800 | | 2,377,264 |
Anheuser-Busch InBev SA NV | 338,997 | | 19,398,629 |
Hamon & Compagnie International SA | 73,974 | | 2,657,530 |
TOTAL BELGIUM | | 24,433,423 |
Bermuda - 2.3% |
Clear Media Ltd. (a) | 2,035,000 | | 1,361,467 |
GOME Electrical Appliances Holdings Ltd. (a) | 25,542,000 | | 9,201,364 |
Huabao International Holdings Ltd. | 2,642,000 | | 4,276,148 |
Signet Jewelers Ltd. (a) | 632,400 | | 27,446,160 |
TOTAL BERMUDA | | 42,285,139 |
Brazil - 0.0% |
Drogasil SA | 66,000 | | 536,893 |
British Virgin Islands - 0.0% |
Mail.ru Group Ltd. GDR unit (a)(e) | 6,600 | | 237,600 |
Canada - 1.3% |
Barrick Gold Corp. | 73,000 | | 3,888,258 |
Suncor Energy, Inc. | 298,000 | | 11,438,323 |
Uranium One, Inc. | 823,300 | | 3,929,518 |
Yamana Gold, Inc. | 288,100 | | 3,688,997 |
TOTAL CANADA | | 22,945,096 |
Cayman Islands - 4.7% |
Ajisen (China) Holdings Ltd. | 2,309,000 | | 3,879,774 |
Bosideng International Holdings Ltd. | 23,660,000 | | 9,436,603 |
China Shanshui Cement Group Ltd. | 5,679,000 | | 4,055,124 |
China ZhengTong Auto Services Holdings Ltd. | 602,000 | | 567,727 |
Ctrip.com International Ltd. sponsored ADR (a) | 102,100 | | 4,129,945 |
Daphne International Holdings Ltd. | 5,048,000 | | 4,728,136 |
E-Commerce China Dangdang, Inc. ADR | 59,800 | | 1,618,786 |
|
| Shares | | Value |
Hengdeli Holdings Ltd. | 29,546,000 | | $ 17,600,255 |
Little Sheep Group Ltd. | 5,448,000 | | 3,441,580 |
Natural Beauty Bio-Technology Ltd. | 8,580,000 | | 2,318,173 |
Noah Holdings Ltd. ADR | 111,200 | | 2,173,960 |
Peak Sport Products Co. Ltd. | 6,502,000 | | 4,266,349 |
Shenguan Holdings Group Ltd. | 2,664,000 | | 3,489,163 |
Silver Base Group Holdings Ltd. | 17,981,000 | | 15,985,682 |
Tencent Holdings Ltd. | 398,400 | | 8,657,415 |
TOTAL CAYMAN ISLANDS | | 86,348,672 |
China - 0.4% |
Baidu.com, Inc. sponsored ADR (a) | 81,700 | | 7,886,501 |
Denmark - 3.2% |
Carlsberg AS Series B | 107,200 | | 10,738,458 |
Danske Bank AS (a) | 96,100 | | 2,464,810 |
Novo Nordisk AS: | | | |
Series B | 51,925 | | 5,852,886 |
Series B sponsored ADR | 236,100 | | 26,577,777 |
Pandora A/S | 134,500 | | 8,105,607 |
William Demant Holding AS (a) | 62,971 | | 4,653,308 |
TOTAL DENMARK | | 58,392,846 |
France - 10.7% |
Alstom SA | 152,257 | | 7,289,756 |
Atos Origin SA (a) | 72,705 | | 3,872,710 |
AXA SA | 209,420 | | 3,485,932 |
AXA SA sponsored ADR | 158,600 | | 2,640,690 |
BNP Paribas SA | 223,399 | | 14,220,367 |
Carrefour SA | 130,903 | | 5,399,284 |
Compagnie Generale de Geophysique SA (a) | 184,500 | | 5,635,186 |
Credit Agricole SA | 315,700 | | 4,011,552 |
Danone | 206,912 | | 13,007,676 |
Iliad Group SA | 28,200 | | 3,069,057 |
Ingenico SA | 115,504 | | 4,184,250 |
Ipsos SA | 113,100 | | 5,371,146 |
Laurent-Perrier Group | 21,000 | | 2,246,160 |
LVMH Moet Hennessy - Louis Vuitton | 312,886 | | 51,496,244 |
Safran SA | 101,400 | | 3,592,653 |
Sanofi-Aventis | 45,238 | | 2,901,744 |
Sanofi-Aventis sponsored ADR | 515,600 | | 16,617,788 |
Schneider Electric SA | 101,394 | | 15,183,143 |
Societe Generale Series A | 180,737 | | 9,718,977 |
Total SA | 212,400 | | 11,318,812 |
Total SA sponsored ADR | 99,300 | | 5,310,564 |
Vallourec SA | 58,136 | | 6,109,408 |
TOTAL FRANCE | | 196,683,099 |
Germany - 8.7% |
Allianz AG | 77,600 | | 9,226,594 |
BASF AG | 146,767 | | 11,714,780 |
Bayerische Motoren Werke AG (BMW) | 428,568 | | 33,720,780 |
Deutsche Bank AG | 91,246 | | 4,770,040 |
Deutsche Bank AG (NY Shares) | 33,900 | | 1,764,495 |
Common Stocks - continued |
| Shares | | Value |
Germany - continued |
Deutsche Boerse AG | 151,220 | | $ 10,472,983 |
Deutsche Lufthansa AG (a) | 209,900 | | 4,589,807 |
Deutsche Post AG | 273,501 | | 4,644,020 |
Fresenius Medical Care AG & Co. KGaA | 272,500 | | 15,750,094 |
HeidelbergCement AG | 51,500 | | 3,229,323 |
Hugo Boss AG | 66,900 | | 4,403,392 |
K&S AG | 37,600 | | 2,833,285 |
Kabel Deutschland Holding AG | 115,800 | | 5,399,508 |
Linde AG | 69,387 | | 10,534,081 |
MAN SE | 64,363 | | 7,657,886 |
Munich Re Group | 23,549 | | 3,571,975 |
Puma AG | 17,183 | | 5,697,470 |
Rheinmetall AG | 35,400 | | 2,847,834 |
SAP AG | 154,842 | | 7,887,605 |
SAP AG sponsored ADR (d) | 129,900 | | 6,574,239 |
Tom Tailor Holding AG | 92,300 | | 1,973,865 |
TOTAL GERMANY | | 159,264,056 |
Hong Kong - 2.8% |
Cathay Pacific Airways Ltd. | 3,106,000 | | 8,571,721 |
China Unicom (Hong Kong) Ltd. sponsored ADR | 415,000 | | 5,913,750 |
Emperor Watch & Jewellery Ltd. | 36,420,000 | | 5,248,041 |
Hang Seng Bank Ltd. | 131,600 | | 2,163,844 |
Henderson Land Development Co. Ltd. | 814,919 | | 5,556,862 |
Henderson Land Development Co. Ltd. warrants 6/1/11 (a) | 123,200 | | 28,531 |
Hong Kong Exchanges and Clearing Ltd. | 242,600 | | 5,502,783 |
I.T Ltd. | 4,802,000 | | 3,638,955 |
Television Broadcasts Ltd. | 1,125,000 | | 6,079,125 |
Wharf Holdings Ltd. | 1,050,000 | | 8,078,482 |
TOTAL HONG KONG | | 50,782,094 |
Ireland - 1.2% |
CRH PLC | 554,756 | | 11,513,244 |
Kingspan Group PLC (United Kingdom) | 980,600 | | 9,603,531 |
TOTAL IRELAND | | 21,116,775 |
Israel - 0.2% |
Teva Pharmaceutical Industries Ltd. sponsored ADR | 59,700 | | 3,112,161 |
Italy - 3.0% |
Bulgari SpA | 646,400 | | 6,987,354 |
Intesa Sanpaolo SpA | 3,187,500 | | 8,651,226 |
Saipem SpA | 558,496 | | 27,508,765 |
Tod's SpA | 43,100 | | 4,258,465 |
UniCredit SpA | 2,558,038 | | 5,294,310 |
Unione di Banche Italiane SCpA | 246,904 | | 2,162,225 |
TOTAL ITALY | | 54,862,345 |
Japan - 17.3% |
Aozora Bank Ltd. | 1,825,000 | | 3,775,165 |
Asahi Glass Co. Ltd. | 421,000 | | 4,919,399 |
|
| Shares | | Value |
Canon, Inc. | 218,000 | | $ 11,194,183 |
Canon, Inc. sponsored ADR | 124,900 | | 6,412,366 |
Denso Corp. | 64,600 | | 2,228,766 |
eAccess Ltd. | 3,575 | | 2,161,331 |
East Japan Railway Co. | 43,300 | | 2,815,046 |
Fanuc Ltd. | 56,200 | | 8,629,120 |
Fuji Media Holdings, Inc. | 1,132 | | 1,789,679 |
Hoya Corp. | 107,800 | | 2,617,516 |
Japan Retail Fund Investment Corp. | 3,506 | | 6,721,470 |
Japan Tobacco, Inc. | 916 | | 3,389,251 |
JFE Holdings, Inc. | 123,900 | | 4,314,341 |
JSR Corp. | 121,600 | | 2,268,349 |
Keyence Corp. | 30,200 | | 8,745,970 |
Konica Minolta Holdings, Inc. | 114,000 | | 1,184,707 |
Mazda Motor Corp. | 4,278,000 | | 12,273,274 |
Mitsubishi Corp. | 422,200 | | 11,426,406 |
Mitsubishi Electric Corp. | 1,084,000 | | 11,371,889 |
Mitsubishi Estate Co. Ltd. | 428,000 | | 7,936,563 |
Mitsubishi UFJ Financial Group, Inc. | 2,944,500 | | 15,872,212 |
Mitsubishi UFJ Financial Group, Inc. sponsored ADR | 675,000 | | 3,651,750 |
Mitsui & Co. Ltd. | 611,300 | | 10,093,619 |
Mizuho Financial Group, Inc. | 1,836,800 | | 3,444,546 |
Mizuho Financial Group, Inc. ADR | 509,700 | | 1,911,375 |
MS&AD Insurance Group Holdings, Inc. | 141,900 | | 3,555,581 |
Murata Manufacturing Co. Ltd. | 64,300 | | 4,504,919 |
Nintendo Co. Ltd. | 10,100 | | 2,963,529 |
NKSJ Holdings, Inc. (a) | 380,000 | | 2,798,005 |
Nomura Holdings, Inc. | 1,041,300 | | 6,605,092 |
NSK Ltd. | 587,000 | | 5,305,153 |
ORIX Corp. | 110,910 | | 10,911,419 |
Rakuten, Inc. | 9,640 | | 8,071,415 |
Ricoh Co. Ltd. | 619,000 | | 9,069,876 |
Shin-Etsu Chemical Co., Ltd. | 121,400 | | 6,577,110 |
SMC Corp. | 66,100 | | 11,321,196 |
SOFTBANK CORP. | 522,300 | | 18,077,760 |
Sony Corp. | 128,400 | | 4,590,768 |
Sony Corp. sponsored ADR | 34,500 | | 1,231,995 |
Sumitomo Corp. | 546,000 | | 7,724,607 |
Sumitomo Mitsui Financial Group, Inc. | 346,200 | | 12,327,900 |
Tokio Marine Holdings, Inc. | 128,400 | | 3,837,060 |
Tokyo Electron Ltd. | 159,500 | | 10,094,564 |
Toshiba Corp. (a) | 1,336,000 | | 7,270,972 |
Toyota Motor Corp. | 412,300 | | 16,226,613 |
Toyota Motor Corp. sponsored ADR (d) | 101,100 | | 7,949,493 |
Yahoo! Japan Corp. | 12,647 | | 4,905,258 |
TOTAL JAPAN | | 317,068,578 |
Korea (South) - 0.5% |
Samsung Electronics Co. Ltd. | 9,803 | | 8,297,034 |
Luxembourg - 0.3% |
ArcelorMittal SA Class A unit (d) | 159,300 | | 6,074,109 |
Common Stocks - continued |
| Shares | | Value |
Netherlands - 1.5% |
AEGON NV (a) | 308,300 | | $ 1,888,302 |
ASML Holding NV | 146,200 | | 5,605,308 |
ING Groep NV: | | | |
(Certificaten Van Aandelen) unit (a) | 574,784 | | 5,610,347 |
sponsored ADR (a) | 174,500 | | 1,708,355 |
Koninklijke Philips Electronics NV | 268,116 | | 8,223,973 |
Koninklijke Philips Electronics NV unit | 138,500 | | 4,251,950 |
TOTAL NETHERLANDS | | 27,288,235 |
Norway - 1.0% |
Aker Solutions ASA | 437,400 | | 7,451,544 |
DnB NOR ASA | 413,200 | | 5,808,730 |
StatoilHydro ASA sponsored ADR (d) | 206,500 | | 4,908,505 |
TOTAL NORWAY | | 18,168,779 |
Russia - 0.2% |
Uralkali JSC GDR (Reg. S) | 85,200 | | 3,128,544 |
Singapore - 0.1% |
United Overseas Bank Ltd. | 176,086 | | 2,497,382 |
South Africa - 1.2% |
Aspen Pharmacare Holdings Ltd. | 640,300 | | 8,892,680 |
Clicks Group Ltd. | 1,178,104 | | 7,707,023 |
Impala Platinum Holdings Ltd. | 121,100 | | 4,258,333 |
Nedbank Group Ltd. | 99,700 | | 1,961,645 |
TOTAL SOUTH AFRICA | | 22,819,681 |
Spain - 2.4% |
Antena 3 Television SA | 391,100 | | 3,634,160 |
Banco Bilbao Vizcaya Argentaria SA | 493,103 | | 5,027,950 |
Banco Santander SA | 1,231,235 | | 13,126,610 |
Banco Santander SA sponsored ADR | 164,500 | | 1,751,925 |
EDP Renovaveis SA (a) | 628,538 | | 3,644,621 |
NH Hoteles SA (a)(d) | 901,900 | | 4,093,828 |
Telefonica SA | 540,906 | | 12,355,294 |
TOTAL SPAIN | | 43,634,388 |
Sweden - 1.3% |
Elekta AB (B Shares) | 472,500 | | 18,199,041 |
Svenska Handelsbanken AB (A Shares) | 98,900 | | 3,163,116 |
Swedbank AB (A Shares) (a) | 181,632 | | 2,535,582 |
TOTAL SWEDEN | | 23,897,739 |
Switzerland - 6.0% |
Compagnie Financiere Richemont SA Series A | 473,964 | | 27,901,124 |
Credit Suisse Group | 71,082 | | 2,864,968 |
Credit Suisse Group sponsored ADR | 117,600 | | 4,752,216 |
GAM Holding Ltd. (a) | 228,269 | | 3,774,758 |
Julius Baer Group Ltd. | 144,820 | | 6,789,164 |
Kuehne & Nagel International AG | 33,380 | | 4,644,547 |
Swiss Reinsurance Co. | 40,826 | | 2,197,953 |
The Swatch Group AG (Bearer) | 86,670 | | 38,664,301 |
|
| Shares | | Value |
UBS AG (a) | 447,317 | | $ 7,349,849 |
UBS AG (NY Shares) (a) | 300,443 | | 4,948,296 |
Zurich Financial Services AG | 25,658 | | 6,651,362 |
TOTAL SWITZERLAND | | 110,538,538 |
Taiwan - 1.5% |
Hon Hai Precision Industry Co. Ltd. (Foxconn) | 645,360 | | 2,599,582 |
HTC Corp. | 684,900 | | 21,131,642 |
Taiwan Semiconductor Manufacturing Co. Ltd. sponsored ADR | 249,667 | | 3,130,824 |
TOTAL TAIWAN | | 26,862,048 |
Turkey - 0.9% |
Boyner Buyuk Magazacilik AS (a) | 2,434,000 | | 6,551,073 |
Dogus Otomotiv Servis ve Ticaret AS | 844,000 | | 3,623,633 |
Turkcell Iletisim Hizmet AS sponsored ADR | 343,200 | | 5,879,016 |
TOTAL TURKEY | | 16,053,722 |
United Kingdom - 16.8% |
Anglo American PLC: | | | |
ADR | 238,400 | | 6,224,624 |
(United Kingdom) | 259,780 | | 13,518,640 |
Aviva PLC | 431,600 | | 2,654,784 |
Barclays PLC | 1,845,252 | | 7,631,395 |
Barclays PLC Sponsored ADR (d) | 669,100 | | 11,053,532 |
BG Group PLC | 582,221 | | 11,772,243 |
BHP Billiton PLC | 706,682 | | 28,450,340 |
BP PLC | 1,586,406 | | 11,701,245 |
BP PLC sponsored ADR | 104,300 | | 4,606,931 |
Burberry Group PLC | 415,700 | | 7,289,751 |
Centrica PLC | 854,600 | | 4,421,237 |
Dunelm Group PLC | 364,200 | | 2,900,695 |
Great Portland Estates PLC | 805,600 | | 4,534,739 |
Hays PLC | 1,754,300 | | 3,527,956 |
Hikma Pharmaceuticals PLC | 223,300 | | 2,827,116 |
HSBC Holdings PLC: | | | |
(United Kingdom) | 1,119,769 | | 11,451,950 |
sponsored ADR | 535,270 | | 27,320,181 |
Imperial Tobacco Group PLC | 387,432 | | 11,895,616 |
InterContinental Hotel Group PLC | 443,064 | | 8,660,652 |
International Personal Finance PLC | 713,300 | | 4,273,363 |
ITV PLC (a) | 3,249,900 | | 3,551,767 |
Johnson Matthey PLC | 248,370 | | 7,897,137 |
Legal & General Group PLC | 1,128,633 | | 1,703,610 |
Lloyds Banking Group PLC (a) | 4,266,744 | | 4,407,554 |
Lloyds Banking Group PLC sponsored ADR | 549,500 | | 2,258,445 |
Man Group PLC | 1,135,453 | | 5,243,572 |
Prudential PLC | 879,018 | | 9,189,513 |
Rio Tinto PLC | 204,415 | | 14,580,888 |
Rio Tinto PLC sponsored ADR | 103,200 | | 7,395,312 |
Royal Bank of Scotland Group PLC (a) | 1,668,800 | | 1,025,533 |
Common Stocks - continued |
| Shares | | Value |
United Kingdom - continued |
Royal Dutch Shell PLC: | | | |
Class A (United Kingdom) | 281,700 | | $ 9,398,585 |
Class B | 178,888 | | 5,927,822 |
Schroders PLC | 235,800 | | 6,824,237 |
Standard Chartered PLC (United Kingdom) | 290,623 | | 7,823,684 |
Sthree PLC | 229,400 | | 1,312,771 |
SuperGroup PLC | 161,400 | | 3,265,952 |
Vodafone Group PLC | 6,973,198 | | 18,318,064 |
Vodafone Group PLC sponsored ADR | 137,000 | | 3,620,910 |
Xstrata PLC | 344,400 | | 8,089,287 |
TOTAL UNITED KINGDOM | | 308,551,633 |
United States of America - 1.9% |
Apple, Inc. (a) | 17,100 | | 5,515,776 |
Deckers Outdoor Corp. (a) | 209,300 | | 16,689,582 |
Google, Inc. Class A (a) | 14,200 | | 8,434,374 |
Philip Morris International, Inc. | 86,700 | | 5,074,551 |
TOTAL UNITED STATES OF AMERICA | | 35,714,283 |
TOTAL COMMON STOCKS (Cost $1,435,750,820) | 1,768,865,533 |
Nonconvertible Preferred Stocks - 2.4% |
| | | |
Germany - 2.4% |
Hugo Boss AG (non-vtg.) | 169,900 | | 12,834,331 |
Volkswagen AG | 191,947 | | 31,155,263 |
TOTAL NONCONVERTIBLE PREFERRED STOCKS (Cost $28,393,566) | 43,989,594 |
Money Market Funds - 2.6% |
| Shares | | Value |
Fidelity Cash Central Fund, 0.19% (b) | 20,163,895 | | $ 20,163,895 |
Fidelity Securities Lending Cash Central Fund, 0.21% (b)(c) | 27,985,568 | | 27,985,568 |
TOTAL MONEY MARKET FUNDS (Cost $48,149,463) | 48,149,463 |
TOTAL INVESTMENT PORTFOLIO - 101.5% (Cost $1,512,293,849) | | 1,861,004,590 |
NET OTHER ASSETS (LIABILITIES) - (1.5)% | | (27,428,200) |
NET ASSETS - 100% | $ 1,833,576,390 |
Legend |
(a) Non-income producing |
(b) Affiliated fund that is available only to investment companies and other accounts managed by Fidelity Investments. The rate quoted is the annualized seven-day yield of the fund at period end. A complete unaudited listing of the fund's holdings as of its most recent quarter end is available upon request. In addition, each Fidelity Central Fund's financial statements, which are not covered by the Fund's Report of Independent Registered Public Accounting Firm, are available on the SEC's website or upon request. |
(c) Investment made with cash collateral received from securities on loan. |
(d) Security or a portion of the security is on loan at period end. |
(e) Security exempt from registration under Rule 144A of the Securities Act of 1933. These securities may be resold in transactions exempt from registration, normally to qualified institutional buyers. At the end of the period, the value of these securities amounted to $237,600 or 0.0% of net assets. |
Affiliated Central Funds |
Information regarding fiscal year to date income earned by the Fund from investments in Fidelity Central Funds is as follows: |
Fund | Income earned |
Fidelity Cash Central Fund | $ 16,477 |
Fidelity Securities Lending Cash Central Fund | 1,148,632 |
Total | $ 1,165,109 |
Other Information |
The following is a summary of the inputs used, as of December 31, 2010, involving the Fund's assets and liabilities carried at fair value. The inputs or methodology used for valuing securities may not be an indication of the risk associated with investing in those securities. For more information on valuation inputs, and their aggregation into the levels used in the table below, please refer to the Security Valuation section in the accompanying Notes to Financial Statements. |
Valuation Inputs at Reporting Date: |
Description | Total | Level 1 | Level 2 | Level 3 |
Investments in Securities: | | | | |
Equities: | | | | |
Japan | $ 317,068,578 | $ 259,135,164 | $ 57,933,414 | $ - |
United Kingdom | 308,551,633 | 184,551,893 | 123,999,740 | - |
Germany | 203,253,650 | 203,253,650 | - | - |
France | 196,683,099 | 176,827,357 | 19,855,742 | - |
Switzerland | 110,538,538 | 100,323,721 | 10,214,817 | - |
Cayman Islands | 86,348,672 | 86,348,672 | - | - |
Denmark | 58,392,846 | 52,539,960 | 5,852,886 | - |
Italy | 54,862,345 | 54,862,345 | - | - |
Hong Kong | 50,782,094 | 50,782,094 | - | - |
Other | 426,373,672 | 339,660,886 | 86,712,786 | - |
Money Market Funds | 48,149,463 | 48,149,463 | - | - |
Total Investments in Securities: | $ 1,861,004,590 | $ 1,556,435,205 | $ 304,569,385 | $ - |
Income Tax Information |
At December 31, 2010, the Fund had a capital loss carryforward of approximately $461,114,094 of which $180,666,624 and $280,447,470 will expire in fiscal 2016 and 2017, respectively. Capital loss carryforwards are only available to offset future capital gains of the Fund to the extent provided by regulations and may be limited. |
See accompanying notes which are an integral part of the financial statements.
Annual Report
Statement of Assets and Liabilities
| December 31, 2010 |
| | |
Assets | | |
Investment in securities, at value (including securities loaned of $27,519,089) - See accompanying schedule: Unaffiliated issuers (cost $1,464,144,386) | $ 1,812,855,127 | |
Fidelity Central Funds (cost $48,149,463) | 48,149,463 | |
Total Investments (cost $1,512,293,849) | | $ 1,861,004,590 |
Receivable for investments sold | | 2,869,512 |
Receivable for fund shares sold | | 541,467 |
Dividends receivable | | 2,049,995 |
Distributions receivable from Fidelity Central Funds | | 25,743 |
Prepaid expenses | | 5,206 |
Other receivables | | 389,495 |
Total assets | | 1,866,886,008 |
| | |
Liabilities | | |
Payable for investments purchased | $ 450,196 | |
Payable for fund shares redeemed | 2,712,905 | |
Accrued management fee | 1,074,552 | |
Distribution and service plan fees payable | 128,189 | |
Other affiliated payables | 180,250 | |
Other payables and accrued expenses | 777,958 | |
Collateral on securities loaned, at value | 27,985,568 | |
Total liabilities | | 33,309,618 |
| | |
Net Assets | | $ 1,833,576,390 |
Net Assets consist of: | | |
Paid in capital | | $ 1,967,196,831 |
Undistributed net investment income | | 26,675 |
Accumulated undistributed net realized gain (loss) on investments and foreign currency transactions | | (482,401,583) |
Net unrealized appreciation (depreciation) on investments and assets and liabilities in foreign currencies | | 348,754,467 |
Net Assets | | $ 1,833,576,390 |
Statement of Assets and Liabilities - continued
| December 31, 2010 |
| | |
Initial Class:
Net Asset Value, offering price and redemption price per share ($779,501,175 ÷ 46,476,097 shares) | | $ 16.77 |
| | |
Service Class:
Net Asset Value, offering price and redemption price per share ($162,393,974 ÷ 9,723,054 shares) | | $ 16.70 |
| | |
Service Class 2:
Net Asset Value, offering price and redemption price per share ($461,032,624 ÷ 27,734,572 shares) | | $ 16.62 |
| | |
Initial Class R:
Net Asset Value, offering price and redemption price per share ($122,655,249 ÷ 7,330,609 shares) | | $ 16.73 |
| | |
Service Class R:
Net Asset Value, offering price and redemption price per share ($60,616,829 ÷ 3,635,151 shares) | | $ 16.68 |
| | |
Service Class 2R:
Net Asset Value, offering price and redemption price per share ($69,392,576 ÷ 4,209,944 shares) | | $ 16.48 |
| | |
Investor Class R:
Net Asset Value, offering price and redemption price per share ($177,983,963 ÷ 10,640,372 shares) | | $ 16.73 |
See accompanying notes which are an integral part of the financial statements.
Annual Report
Statement of Operations
| Year ended December 31, 2010 |
| | |
Investment Income | | |
Dividends | | $ 40,140,121 |
Interest | | 23 |
Income from Fidelity Central Funds | | 1,165,109 |
Income before foreign taxes withheld | | 41,305,253 |
Less foreign taxes withheld | | (3,176,380) |
Total income | | 38,128,873 |
| | |
Expenses | | |
Management fee | $ 12,060,613 | |
Transfer agent fees | 1,443,728 | |
Distribution and service plan fees | 1,443,017 | |
Accounting and security lending fees | 770,096 | |
Custodian fees and expenses | 346,550 | |
Independent trustees' compensation | 9,875 | |
Appreciation in deferred trustee compensation account | 33 | |
Audit | 82,867 | |
Legal | 13,693 | |
Interest | 2,688 | |
Miscellaneous | 27,039 | |
Total expenses before reductions | 16,200,199 | |
Expense reductions | (491,686) | 15,708,513 |
Net investment income (loss) | | 22,420,360 |
Realized and Unrealized Gain (Loss) Net realized gain (loss) on: | | |
Investment securities: | | |
Unaffiliated issuers (net of foreign taxes of $1,318) | 70,397,991 | |
Foreign currency transactions | (478,560) | |
Total net realized gain (loss) | | 69,919,431 |
Change in net unrealized appreciation (depreciation) on: Investment securities | 119,019,938 | |
Assets and liabilities in foreign currencies | 32,134 | |
Total change in net unrealized appreciation (depreciation) | | 119,052,072 |
Net gain (loss) | | 188,971,503 |
Net increase (decrease) in net assets resulting from operations | | $ 211,391,863 |
Statement of Changes in Net Assets
| Year ended
December 31, 2010 | Year ended
December 31, 2009 |
Increase (Decrease) in Net Assets | | |
Operations | | |
Net investment income (loss) | $ 22,420,360 | $ 33,212,492 |
Net realized gain (loss) | 69,919,431 | (285,899,417) |
Change in net unrealized appreciation (depreciation) | 119,052,072 | 627,435,395 |
Net increase (decrease) in net assets resulting from operations | 211,391,863 | 374,748,470 |
Distributions to shareholders from net investment income | (22,348,246) | (32,759,678) |
Distributions to shareholders from net realized gain | (3,258,162) | (5,176,451) |
Total distributions | (25,606,408) | (37,936,129) |
Share transactions - net increase (decrease) | (147,181,149) | (176,347,409) |
Redemption fees | 21,072 | 22,016 |
Total increase (decrease) in net assets | 38,625,378 | 160,486,948 |
| | |
Net Assets | | |
Beginning of period | 1,794,951,012 | 1,634,464,064 |
End of period (including undistributed net investment income of $26,675 and distributions in excess of net investment income of $45,440, respectively) | $ 1,833,576,390 | $ 1,794,951,012 |
See accompanying notes which are an integral part of the financial statements.
Annual Report
Financial Highlights - Initial Class
Years ended December 31, | 2010 | 2009 | 2008 | 2007 | 2006 |
Selected Per-Share Data | | | | | |
Net asset value, beginning of period | $ 15.05 | $ 12.17 | $ 25.33 | $ 23.96 | $ 20.60 |
Income from Investment Operations | | | | | |
Net investment income (loss) C | .21 | .28 | .46 | .45 | .38 |
Net realized and unrealized gain (loss) | 1.76 | 2.93 | (10.67) | 3.42 | 3.30 |
Total from investment operations | 1.97 | 3.21 | (10.21) | 3.87 | 3.68 |
Distributions from net investment income | (.22) | (.29) | (.49) | (.84) | (.19) |
Distributions from net realized gain | (.03) | (.04) | (2.46) | (1.66) | (.13) |
Total distributions | (.25) | (.33) | (2.95) | (2.50) | (.32) |
Redemption fees added to paid in capital C,G | - | - | - | - | - |
Net asset value, end of period | $ 16.77 | $ 15.05 | $ 12.17 | $ 25.33 | $ 23.96 |
Total Return A,B | 13.11% | 26.53% | (43.83)% | 17.41% | 18.09% |
Ratios to Average Net Assets D,F | | | | | |
Expenses before reductions | .86% | .88% | .87% | .85% | .88% |
Expenses net of fee waivers, if any | .85% | .88% | .87% | .85% | .88% |
Expenses net of all reductions | .83% | .84% | .84% | .82% | .81% |
Net investment income (loss) | 1.41% | 2.17% | 2.45% | 1.85% | 1.76% |
Supplemental Data | | | | | |
Net assets, end of period (000 omitted) | $ 779,501 | $ 758,018 | $ 703,357 | $ 1,702,235 | $ 1,624,901 |
Portfolio turnover rate E | 50% | 78% | 77% | 62% | 123% |
A Total returns do not reflect charges attributable to your insurance company's separate account. Inclusion of these charges would reduce the total returns shown.
B Total returns would have been lower had certain expenses not been reduced during the periods shown.
C Calculated based on average shares outstanding during the period.
D Fees and expenses of the underlying Fidelity Central Funds are not included in the Fund's expense ratio. The Fund indirectly bears its proportionate share of the expenses of any underlying Fidelity Central Funds.
E Amount does not include the portfolio activity of any underlying Fidelity Central Funds.
F Expense ratios reflect operating expenses of the class. Expenses before reductions do not reflect amounts reimbursed by the investment adviser or reductions from brokerage service arrangements or reductions from other expense offset arrangements and do not represent the amount paid by the class during periods when reimbursements or reductions occur. Expenses net of fee waivers reflect expenses after reimbursement by the investment adviser but prior to reductions from brokerage service arrangements or other expense offset arrangements. Expenses net of all reductions represent the net expenses paid by the class.
G Amount represents less than $.01 per share.
Financial Highlights - Service Class
Years ended December 31, | 2010 | 2009 | 2008 | 2007 | 2006 |
Selected Per-Share Data | | | | | |
Net asset value, beginning of period | $ 14.99 | $ 12.12 | $ 25.23 | $ 23.86 | $ 20.52 |
Income from Investment Operations | | | | | |
Net investment income (loss) C | .19 | .26 | .44 | .43 | .36 |
Net realized and unrealized gain (loss) | 1.75 | 2.93 | (10.61) | 3.39 | 3.28 |
Total from investment operations | 1.94 | 3.19 | (10.17) | 3.82 | 3.64 |
Distributions from net investment income | (.20) | (.28) | (.48) | (.79) | (.17) |
Distributions from net realized gain | (.03) | (.04) | (2.46) | (1.66) | (.13) |
Total distributions | (.23) | (.32) | (2.94) | (2.45) | (.30) |
Redemption fees added to paid in capital C,G | - | - | - | - | - |
Net asset value, end of period | $ 16.70 | $ 14.99 | $ 12.12 | $ 25.23 | $ 23.86 |
Total Return A,B | 12.99% | 26.44% | (43.89)% | 17.25% | 17.95% |
Ratios to Average Net Assets D,F | | | | | |
Expenses before reductions | .96% | .98% | .97% | .95% | .98% |
Expenses net of fee waivers, if any | .95% | .98% | .97% | .95% | .98% |
Expenses net of all reductions | .93% | .94% | .94% | .92% | .91% |
Net investment income (loss) | 1.31% | 2.07% | 2.35% | 1.75% | 1.66% |
Supplemental Data | | | | | |
Net assets, end of period (000 omitted) | $ 162,394 | $ 171,252 | $ 165,608 | $ 366,777 | $ 362,060 |
Portfolio turnover rate E | 50% | 78% | 77% | 62% | 123% |
A Total returns do not reflect charges attributable to your insurance company's separate account. Inclusion of these charges would reduce the total returns shown.
B Total returns would have been lower had certain expenses not been reduced during the periods shown.
C Calculated based on average shares outstanding during the period.
D Fees and expenses of the underlying Fidelity Central Funds are not included in the Fund's expense ratio. The Fund indirectly bears its proportionate share of the expenses of any underlying Fidelity Central Funds.
E Amount does not include the portfolio activity of any underlying Fidelity Central Funds.
F Expense ratios reflect operating expenses of the class. Expenses before reductions do not reflect amounts reimbursed by the investment adviser or reductions from brokerage service arrangements or reductions from other expense offset arrangements and do not represent the amount paid by the class during periods when reimbursements or reductions occur. Expenses net of fee waivers reflect expenses after reimbursement by the investment adviser but prior to reductions from brokerage service arrangements or other expense offset arrangements. Expenses net of all reductions represent the net expenses paid by the class.
G Amount represents less than $.01 per share.
See accompanying notes which are an integral part of the financial statements.
Annual Report
Financial Highlights - Service Class 2
Years ended December 31, | 2010 | 2009 | 2008 | 2007 | 2006 |
Selected Per-Share Data | | | | | |
Net asset value, beginning of period | $ 14.92 | $ 12.07 | $ 25.12 | $ 23.75 | $ 20.43 |
Income from Investment Operations | | | | | |
Net investment income (loss) C | .17 | .24 | .40 | .39 | .33 |
Net realized and unrealized gain (loss) | 1.74 | 2.91 | (10.54) | 3.37 | 3.27 |
Total from investment operations | 1.91 | 3.15 | (10.14) | 3.76 | 3.60 |
Distributions from net investment income | (.18) | (.26) | (.45) | (.73) | (.15) |
Distributions from net realized gain | (.03) | (.04) | (2.46) | (1.66) | (.13) |
Total distributions | (.21) | (.30) | (2.91) | (2.39) | (.28) |
Redemption fees added to paid in capital C,G | - | - | - | - | - |
Net asset value, end of period | $ 16.62 | $ 14.92 | $ 12.07 | $ 25.12 | $ 23.75 |
Total Return A,B | 12.83% | 26.22% | (43.96)% | 17.05% | 17.83% |
Ratios to Average Net Assets D,F | | | | | |
Expenses before reductions | 1.11% | 1.12% | 1.12% | 1.10% | 1.13% |
Expenses net of fee waivers, if any | 1.10% | 1.12% | 1.12% | 1.10% | 1.13% |
Expenses net of all reductions | 1.08% | 1.09% | 1.09% | 1.07% | 1.06% |
Net investment income (loss) | 1.16% | 1.93% | 2.21% | 1.60% | 1.51% |
Supplemental Data | | | | | |
Net assets, end of period (000 omitted) | $ 461,033 | $ 457,971 | $ 414,492 | $ 821,943 | $ 703,421 |
Portfolio turnover rate E | 50% | 78% | 77% | 62% | 123% |
A Total returns do not reflect charges attributable to your insurance company's separate account. Inclusion of these charges would reduce the total returns shown.
B Total returns would have been lower had certain expenses not been reduced during the periods shown.
C Calculated based on average shares outstanding during the period.
D Fees and expenses of the underlying Fidelity Central Funds are not included in the Fund's expense ratio. The Fund indirectly bears its proportionate share of the expenses of any underlying Fidelity Central Funds.
E Amount does not include the portfolio activity of any underlying Fidelity Central Funds.
F Expense ratios reflect operating expenses of the class. Expenses before reductions do not reflect amounts reimbursed by the investment adviser or reductions from brokerage service arrangements or reductions from other expense offset arrangements and do not represent the amount paid by the class during periods when reimbursements or reductions occur. Expenses net of fee waivers reflect expenses after reimbursement by the investment adviser but prior to reductions from brokerage service arrangements or other expense offset arrangements. Expenses net of all reductions represent the net expenses paid by the class.
G Amount represents less than $.01 per share.
Financial Highlights - Initial Class R
Years ended December 31, | 2010 | 2009 | 2008 | 2007 | 2006 |
Selected Per-Share Data | | | | | |
Net asset value, beginning of period | $ 15.02 | $ 12.14 | $ 25.28 | $ 23.92 | $ 20.57 |
Income from Investment Operations | | | | | |
Net investment income (loss) C | .21 | .28 | .46 | .45 | .38 |
Net realized and unrealized gain (loss) | 1.75 | 2.93 | (10.65) | 3.41 | 3.29 |
Total from investment operations | 1.96 | 3.21 | (10.19) | 3.86 | 3.67 |
Distributions from net investment income | (.22) | (.29) | (.49) | (.84) | (.19) |
Distributions from net realized gain | (.03) | (.04) | (2.46) | (1.66) | (.13) |
Total distributions | (.25) | (.33) | (2.95) | (2.50) | (.32) |
Redemption fees added to paid in capital C,G | - | - | - | - | - |
Net asset value, end of period | $ 16.73 | $ 15.02 | $ 12.14 | $ 25.28 | $ 23.92 |
Total Return A,B | 13.07% | 26.60% | (43.84)% | 17.40% | 18.08% |
Ratios to Average Net Assets D,F | | | | | |
Expenses before reductions | .86% | .88% | .87% | .85% | .88% |
Expenses net of fee waivers, if any | .85% | .88% | .87% | .85% | .88% |
Expenses net of all reductions | .83% | .84% | .84% | .82% | .81% |
Net investment income (loss) | 1.41% | 2.17% | 2.46% | 1.85% | 1.76% |
Supplemental Data | | | | | |
Net assets, end of period (000 omitted) | $ 122,655 | $ 128,689 | $ 118,749 | $ 275,678 | $ 240,693 |
Portfolio turnover rate E | 50% | 78% | 77% | 62% | 123% |
A Total returns do not reflect charges attributable to your insurance company's separate account. Inclusion of these charges would reduce the total returns shown.
B Total returns would have been lower had certain expenses not been reduced during the periods shown.
C Calculated based on average shares outstanding during the period.
D Fees and expenses of the underlying Fidelity Central Funds are not included in the Fund's expense ratio. The Fund indirectly bears its proportionate share of the expenses of any underlying Fidelity Central Funds.
E Amount does not include the portfolio activity of any underlying Fidelity Central Funds.
F Expense ratios reflect operating expenses of the class. Expenses before reductions do not reflect amounts reimbursed by the investment adviser or reductions from brokerage service arrangements or reductions from other expense offset arrangements and do not represent the amount paid by the class during periods when reimbursements or reductions occur. Expenses net of fee waivers reflect expenses after reimbursement by the investment adviser but prior to reductions from brokerage service arrangements or other expense offset arrangements. Expenses net of all reductions represent the net expenses paid by the class.
G Amount represents less than $.01 per share.
See accompanying notes which are an integral part of the financial statements.
Annual Report
Financial Highlights - Service Class R
Years ended December 31, | 2010 | 2009 | 2008 | 2007 | 2006 |
Selected Per-Share Data | | | | | |
Net asset value, beginning of period | $ 14.97 | $ 12.10 | $ 25.19 | $ 23.83 | $ 20.50 |
Income from Investment Operations | | | | | |
Net investment income (loss) C | .19 | .27 | .43 | .43 | .36 |
Net realized and unrealized gain (loss) | 1.75 | 2.92 | (10.58) | 3.38 | 3.27 |
Total from investment operations | 1.94 | 3.19 | (10.15) | 3.81 | 3.63 |
Distributions from net investment income | (.20) | (.28) | (.48) | (.79) | (.17) |
Distributions from net realized gain | (.03) | (.04) | (2.46) | (1.66) | (.13) |
Total distributions | (.23) | (.32) | (2.94) | (2.45) | (.30) |
Redemption fees added to paid in capital C,G | - | - | - | - | - |
Net asset value, end of period | $ 16.68 | $ 14.97 | $ 12.10 | $ 25.19 | $ 23.83 |
Total Return A,B | 13.01% | 26.49% | (43.88)% | 17.23% | 17.95% |
Ratios to Average Net Assets D,F | | | | | |
Expenses before reductions | .96% | .97% | .96% | .94% | .98% |
Expenses net of fee waivers, if any | .95% | .97% | .96% | .94% | .98% |
Expenses net of all reductions | .93% | .94% | .94% | .92% | .91% |
Net investment income (loss) | 1.31% | 2.08% | 2.36% | 1.75% | 1.66% |
Supplemental Data | | | | | |
Net assets, end of period (000 omitted) | $ 60,617 | $ 66,014 | $ 61,825 | $ 135,038 | $ 133,934 |
Portfolio turnover rate E | 50% | 78% | 77% | 62% | 123% |
A Total returns do not reflect charges attributable to your insurance company's separate account. Inclusion of these charges would reduce the total returns shown.
B Total returns would have been lower had certain expenses not been reduced during the periods shown.
C Calculated based on average shares outstanding during the period.
D Fees and expenses of the underlying Fidelity Central Funds are not included in the Fund's expense ratio. The Fund indirectly bears its proportionate share of the expenses of any underlying Fidelity Central Funds.
E Amount does not include the portfolio activity of any underlying Fidelity Central Funds.
F Expense ratios reflect operating expenses of the class. Expenses before reductions do not reflect amounts reimbursed by the investment adviser or reductions from brokerage service arrangements or reductions from other expense offset arrangements and do not represent the amount paid by the class during periods when reimbursements or reductions occur. Expenses net of fee waivers reflect expenses after reimbursement by the investment adviser but prior to reductions from brokerage service arrangements or other expense offset arrangements. Expenses net of all reductions represent the net expenses paid by the class.
G Amount represents less than $.01 per share.
Financial Highlights - Service Class 2R
Years ended December 31, | 2010 | 2009 | 2008 | 2007 | 2006 |
Selected Per-Share Data | | | | | |
Net asset value, beginning of period | $ 14.80 | $ 11.98 | $ 24.95 | $ 23.61 | $ 20.32 |
Income from Investment Operations | | | | | |
Net investment income (loss) C | .17 | .25 | .40 | .39 | .32 |
Net realized and unrealized gain (loss) | 1.73 | 2.87 | (10.46) | 3.35 | 3.26 |
Total from investment operations | 1.90 | 3.12 | (10.06) | 3.74 | 3.58 |
Distributions from net investment income | (.19) | (.26) | (.45) | (.74) | (.16) |
Distributions from net realized gain | (.03) | (.04) | (2.46) | (1.66) | (.13) |
Total distributions | (.22) | (.30) | (2.91) | (2.40) | (.29) |
Redemption fees added to paid in capital C,G | - | - | - | - | - |
Net asset value, end of period | $ 16.48 | $ 14.80 | $ 11.98 | $ 24.95 | $ 23.61 |
Total Return A,B | 12.82% | 26.20% | (43.94)% | 17.06% | 17.81% |
Ratios to Average Net Assets D,F | | | | | |
Expenses before reductions | 1.11% | 1.12% | 1.11% | 1.09% | 1.13% |
Expenses net of fee waivers, if any | 1.10% | 1.12% | 1.11% | 1.09% | 1.13% |
Expenses net of all reductions | 1.08% | 1.09% | 1.09% | 1.07% | 1.06% |
Net investment income (loss) | 1.16% | 1.93% | 2.21% | 1.60% | 1.51% |
Supplemental Data | | | | | |
Net assets, end of period (000 omitted) | $ 69,393 | $ 64,200 | $ 46,323 | $ 95,871 | $ 68,729 |
Portfolio turnover rate E | 50% | 78% | 77% | 62% | 123% |
A Total returns do not reflect charges attributable to your insurance company's separate account. Inclusion of these charges would reduce the total returns shown.
B Total returns would have been lower had certain expenses not been reduced during the periods shown.
C Calculated based on average shares outstanding during the period.
D Fees and expenses of the underlying Fidelity Central Funds are not included in the Fund's expense ratio. The Fund indirectly bears its proportionate share of the expenses of any underlying Fidelity Central Funds.
E Amount does not include the portfolio activity of any underlying Fidelity Central Funds.
F Expense ratios reflect operating expenses of the class. Expenses before reductions do not reflect amounts reimbursed by the investment adviser or reductions from brokerage service arrangements or reductions from other expense offset arrangements and do not represent the amount paid by the class during periods when reimbursements or reductions occur. Expenses net of fee waivers reflect expenses after reimbursement by the investment adviser but prior to reductions from brokerage service arrangements or other expense offset arrangements. Expenses net of all reductions represent the net expenses paid by the class.
G Amount represents less than $.01 per share.
See accompanying notes which are an integral part of the financial statements.
Annual Report
Financial Highlights - Investor Class R
Years ended December 31, | 2010 | 2009 | 2008 | 2007 | 2006 |
Selected Per-Share Data | | | | | |
Net asset value, beginning of period | $ 15.01 | $ 12.14 | $ 25.27 | $ 23.91 | $ 20.59 |
Income from Investment Operations | | | | | |
Net investment income (loss) C | .20 | .27 | .43 | .42 | .36 |
Net realized and unrealized gain (loss) | 1.76 | 2.92 | (10.62) | 3.41 | 3.29 |
Total from investment operations | 1.96 | 3.19 | (10.19) | 3.83 | 3.65 |
Distributions from net investment income | (.21) | (.28) | (.48) | (.81) | (.20) |
Distributions from net realized gain | (.03) | (.04) | (2.46) | (1.66) | (.13) |
Total distributions | (.24) | (.32) | (2.94) | (2.47) | (.33) |
Redemption fees added to paid in capital C,G | - | - | - | - | - |
Net asset value, end of period | $ 16.73 | $ 15.01 | $ 12.14 | $ 25.27 | $ 23.91 |
Total Return A,B | 13.07% | 26.42% | (43.89)% | 17.25% | 17.94% |
Ratios to Average Net Assets D,F | | | | | |
Expenses before reductions | .95% | .97% | .96% | .96% | 1.01% |
Expenses net of fee waivers, if any | .94% | .97% | .96% | .96% | 1.01% |
Expenses net of all reductions | .92% | .94% | .93% | .94% | .93% |
Net investment income (loss) | 1.32% | 2.08% | 2.36% | 1.74% | 1.64% |
Supplemental Data | | | | | |
Net assets, end of period (000 omitted) | $ 177,984 | $ 148,806 | $ 124,111 | $ 229,829 | $ 122,018 |
Portfolio turnover rate E | 50% | 78% | 77% | 62% | 123% |
A Total returns do not reflect charges attributable to your insurance company's separate account. Inclusion of these charges would reduce the total returns shown.
B Total returns would have been lower had certain expenses not been reduced during the periods shown.
C Calculated based on average shares outstanding during the period.
D Fees and expenses of the underlying Fidelity Central Funds are not included in the Fund's expense ratio. The Fund indirectly bears its proportionate share of the expenses of any underlying Fidelity Central Funds.
E Amount does not include the portfolio activity of any underlying Fidelity Central Funds.
F Expense ratios reflect operating expenses of the class. Expenses before reductions do not reflect amounts reimbursed by the investment adviser or reductions from brokerage service arrangements or reductions from other expense offset arrangements and do not represent the amount paid by the class during periods when reimbursements or reductions occur. Expenses net of fee waivers reflect expenses after reimbursement by the investment adviser but prior to reductions from brokerage service arrangements or other expense offset arrangements. Expenses net of all reductions represent the net expenses paid by the class.
G Amount represents less than $.01 per share.
See accompanying notes which are an integral part of the financial statements.
Annual Report
Notes to Financial Statements
For the period ended December 31, 2010
1. Organization.
VIP Overseas Portfolio (the Fund) is a fund of Variable Insurance Products Fund (the Trust) and is authorized to issue an unlimited number of shares. The Trust is registered under the Investment Company Act of 1940, as amended (the 1940 Act), as an open-end management investment company organized as a Massachusetts business trust. Shares of the Fund may only be purchased by insurance companies for the purpose of funding variable annuity or variable life insurance contracts. The Fund offers the following classes of shares: Initial Class shares, Service Class shares, Service Class 2 shares, Initial Class R shares, Service Class R shares, Service Class 2R shares and Investor Class R shares. All classes have equal rights and voting privileges, except for matters affecting a single class. Investment income, realized and unrealized capital gains and losses, the common expenses of the Fund, and certain fund-level expense reductions, if any, are allocated on a pro-rata basis to each class based on the relative net assets of each class to the total net assets of the Fund. Each class differs with respect to transfer agent and distribution and service plan fees incurred. Certain expense reductions may also differ by class.
2. Investments in Fidelity Central Funds.
The Fund may invest in Fidelity Central Funds, which are open-end investment companies available only to other investment companies and accounts managed by Fidelity Management & Research Company (FMR) and its affiliates. The Fund's Schedule of Investments lists each of the Fidelity Central Funds held as of period end, if any, as an investment of the Fund, but does not include the underlying holdings of each Fidelity Central Fund. As an Investing Fund, the Fund indirectly bears its proportionate share of the expenses of the underlying Fidelity Central Funds.
The Money Market Central Funds seek preservation of capital and current income and are managed by Fidelity Investments Money Management, Inc. (FIMM), an affiliate of FMR.
A complete unaudited list of holdings for each Fidelity Central Fund is available upon request or at the Securities and Exchange Commission (the SEC) web site at www.sec.gov. In addition, the financial statements of the Fidelity Central Funds, which are not covered by the Fund's Report of Independent Registered Public Accounting Firm, are available on the SEC web site or upon request.
3. Significant Accounting Policies.
The financial statements have been prepared in conformity with accounting principles generally accepted in the United States of America (GAAP), which require management to make certain estimates and assumptions at the date of the financial statements. Actual results could differ from those estimates. Subsequent events, if any, through the date that the financial statements were issued have been evaluated in the preparation of the financial statements. The following summarizes the significant accounting policies of the Fund:
Security Valuation. Investments are valued as of 4:00 p.m. Eastern time on the last calendar day of the period. The Fund uses independent pricing services approved by the Board of Trustees to value its investments. When current market prices or quotations are not readily available or reliable, valuations may be determined in good faith in accordance with procedures adopted by the Board of Trustees. Factors used in determining value may include market or security specific events. The frequency with which these procedures are used cannot be predicted and they may be utilized to a significant extent. The value used for net asset value (NAV) calculation under these procedures may differ from published prices for the same securities.
The Fund categorizes the inputs to valuation techniques used to value its investments into a disclosure hierarchy consisting of three levels as shown below.
Level 1 - quoted prices in active markets for identical investments
Level 2 - other significant observable inputs (including quoted prices for similar investments, interest rates, prepayment speeds, etc.)
Level 3 - unobservable inputs (including the Fund's own assumptions based on the best information available)
Changes in valuation techniques may result in transfers in or out of an assigned level within the disclosure hierarchy. Valuation techniques used to value the Fund's investments by major category are as follows.
Equity securities, including restricted securities, for which market quotations are readily available, are valued at the last reported sale price or official closing price as reported by an independent pricing service on the primary market or exchange on which they are traded and are categorized as Level 1 in the hierarchy. In the event there were no sales during the day or closing prices are not available, securities are valued at the last quoted bid price or may be valued using the last available price and are generally categorized as Level 2 in the hierarchy. For foreign equity securities, when significant market or security specific events arise, comparisons to the valuation of American Depositary Receipts (ADRs), futures contracts, Exchange-traded funds (ETFs) and certain indexes as well as quoted prices for similar securities are used and are categorized as Level 2 in the hierarchy in these circumstances. Utilizing these techniques may result in significant transfers between Level 1 and Level 2. For restricted equity securities and private placements where observable inputs are limited, assumptions about market activity and risk are used and are categorized as Level 3 in the hierarchy.
Annual Report
Notes to Financial Statements - continued
3. Significant Accounting Policies - continued
Security Valuation - continued
Investments in open-end mutual funds, including the Fidelity Central Funds, are valued at their closing net asset value each business day and are categorized as Level 1 in the hierarchy.
Foreign Currency. The Fund uses foreign currency contracts to facilitate transactions in foreign-denominated securities. Gains and losses from these transactions may arise from changes in the value of the foreign currency or if the counterparties do not perform under the contracts' terms.
Foreign-denominated assets, including investment securities, and liabilities are translated into U.S. dollars at the exchange rate at period end. Purchases and sales of investment securities, income and dividends received and expenses denominated in foreign currencies are translated into U.S. dollars at the exchange rate in effect on the transaction date.
The effects of exchange rate fluctuations on investments are included with the net realized and unrealized gain (loss) on investment securities. Other foreign currency transactions resulting in realized and unrealized gain (loss) are disclosed separately.
Investment Transactions and Income. For financial reporting purposes, the Fund's investment holdings and NAV include trades executed through the end of the last business day of the period. The NAV per share for processing shareholder transactions is calculated as of the close of business of the New York Stock Exchange (NYSE), normally 4:00 p.m. Eastern time and includes trades executed through the end of the prior business day. Gains and losses on securities sold are determined on the basis of identified cost and may include proceeds received from litigation. Dividend income is recorded on the ex-dividend date, except for certain dividends from foreign securities where the ex-dividend date may have passed, which are recorded as soon as the Fund is informed of the ex-dividend date. Non-cash dividends included in dividend income, if any, are recorded at the fair market value of the securities received. Interest income and distributions from the Fidelity Central Funds are accrued as earned. Interest income includes coupon interest and amortization of premium and accretion of discount on debt securities. Investment income is recorded net of foreign taxes withheld where recovery of such taxes is uncertain.
Expenses. Expenses directly attributable to a fund are charged to that fund. Expenses attributable to more than one fund are allocated among the respective funds on the basis of relative net assets or other appropriate methods. Expense estimates are accrued in the period to which they relate and adjustments are made when actual amounts are known.
Deferred Trustee Compensation. Under a Deferred Compensation Plan (the Plan), independent Trustees may elect to defer receipt of a portion of their annual compensation. Deferred amounts are invested in a cross-section of Fidelity funds, are marked-to-market and remain in the Fund until distributed in accordance with the Plan. The investment of deferred amounts and the offsetting payable to the Trustees are included in the accompanying Statement of Assets and Liabilities.
Income Tax Information and Distributions to Shareholders. Each year the Fund intends to qualify as a regulated investment company, including distributing substantially all of its taxable income and realized gains under Subchapter M of the Internal Revenue Code and filing its U.S. federal tax return. As a result, no provision for income taxes is required. As of December 31, 2010, the Fund did not have any unrecognized tax benefits in the accompanying financial statements. A fund's federal tax return is subject to examination by the Internal Revenue Service (IRS) for a period of three years. Foreign taxes are provided for based on the Fund's understanding of the tax rules and rates that exist in the foreign markets in which it invests.
Distributions are declared and recorded on the ex-dividend date. Income dividends and capital gain distributions are declared separately for each class. Income and capital gain distributions are determined in accordance with income tax regulations, which may differ from GAAP.
Capital accounts within the financial statements are adjusted for permanent book-tax differences. These adjustments have no impact on net assets or the results of operations. Temporary book-tax differences will reverse in a subsequent period.
Book-tax differences are primarily due to certain foreign taxes, foreign currency transactions, passive foreign investment companies (PFIC), deferred trustees compensation, capital loss carryforwards and losses deferred due to wash sales.
The federal tax cost of investment securities and unrealized appreciation (depreciation) as of period end were as follows:
Gross unrealized appreciation | $ 467,323,274 |
Gross unrealized depreciation | (142,922,059) |
Net unrealized appreciation (depreciation) | $ 324,401,215 |
Tax Cost | $ 1,536,603,375 |
Annual Report
3. Significant Accounting Policies - continued
Income Tax Information and Distributions to Shareholders - continued
The tax-based components of distributable earnings as of period end were as follows:
Undistributed ordinary income | $ 3,095,129 |
Capital loss carryforward | $ (461,114,094) |
Net unrealized appreciation (depreciation) | $ 324,444,941 |
The tax character of distributions paid was as follows:
| December 31, 2010 | December 31, 2009 |
Ordinary Income | $ 25,606,408 | $ 37,936,129 |
Trading (Redemption) Fees. Initial Class R shares, Service Class R shares, Service Class 2 R shares and Investor Class R shares held by investors less than 60 days are subject to a redemption fee equal to 1% of the net asset value of shares redeemed. All redemption fees, which reduce the proceeds of the shareholder redemption, are retained by the Fund and accounted for as an addition to paid in capital.
4. Operating Policies.
Restricted Securities. The Fund may invest in securities that are subject to legal or contractual restrictions on resale. These securities generally may be resold in transactions exempt from registration or to the public if the securities are registered. Disposal of these securities may involve time-consuming negotiations and expense, and prompt sale at an acceptable price may be difficult. Information regarding restricted securities is included at the end of the Fund's Schedule of Investments.
5. Purchases and Sales of Investments.
Purchases and sales of securities other than short-term securities, aggregated $833,549,159 and $998,122,373, respectively.
6. Fees and Other Transactions with Affiliates.
Management Fee. FMR and its affiliates provide the Fund with investment management related services for which the Fund pays a monthly management fee. The management fee is the sum of an individual fund fee rate that is based on an annual rate of .45% of the Fund's average net assets and a group fee rate that averaged .26% during the period. The group fee rate is based upon the average net assets of all the mutual funds advised by FMR. The group fee rate decreases as assets under management increase and increases as assets under management decrease. For the period, the total annual management fee rate was .71% of the Fund's average net assets.
Distribution and Service Plan Fees. In accordance with Rule 12b-1 of the 1940 Act, the Fund has adopted separate 12b-1 Plans for each Service Class of shares. Each Service Class pays Fidelity Distributors Corporation (FDC), an affiliate of FMR, a service fee. For the period, the service fee is based on an annual rate of .10% of Service Class' and Service Class R's average net assets and .25% of Service Class 2's and Service Class 2R's average net assets.
For the period, total fees, all of which were re-allowed to insurance companies for the distribution of shares and providing shareholder support services were as follows:
Service Class | $ 156,474 |
Service Class 2 | 1,076,469 |
Service Class R | 58,951 |
Service Class 2 R | 151,123 |
| $ 1,443,017 |
Annual Report
Notes to Financial Statements - continued
6. Fees and Other Transactions with Affiliates - continued
Transfer Agent Fees. Fidelity Investments Institutional Operations Company, Inc. (FIIOC), an affiliate of FMR, is the Fund's transfer, dividend disbursing, and shareholder servicing agent. FIIOC receives an asset-based fee with respect to each class. Each class (with the exception of Investor R Class) pays a transfer agent fee, excluding out of pocket expenses, equal to an annual rate of .07% of average net assets. Investor Class R pays a monthly asset-based transfer agent fee of .15% of average net assets. In addition, FIIOC receives an asset-based fee of .01% of average net assets for typesetting, printing and mailing of shareholder reports, except proxy statements. FIIOC has agreed to voluntarily waive this fee until December 31, 2010. (See Note 9: Expense Reductions.) For the period, transfer agent fees for each class, including printing and out of pocket expenses, were as follows:
Initial Class | $ 565,513 |
Service Class | 120,653 |
Service Class 2 | 328,709 |
Initial Class R | 89,684 |
Service Class R | 43,930 |
Service Class 2R | 45,029 |
Investor Class R | 250,210 |
| $ 1,443,728 |
Accounting and Security Lending Fees. Fidelity Service Company, Inc. (FSC), an affiliate of FMR, maintains the Fund's accounting records. The accounting fee is based on the level of average net assets for the month. Under a separate contract, FSC administers the security lending program. The security lending fee is based on the number and duration of lending transactions.
Brokerage Commissions. The Fund placed a portion of its portfolio transactions with brokerage firms which are affiliates of the investment adviser. The commissions paid to these affiliated firms were $1,146 for the period.
Interfund Lending Program. Pursuant to an Exemptive Order issued by the SEC, the Fund, along with other registered investment companies having management contracts with FMR, may participate in an interfund lending program. This program provides an alternative credit facility allowing the funds to borrow from, or lend money to, other participating affiliated funds. At period end, there were no interfund loans outstanding. The Fund's activity in this program during the period for which loans were outstanding was as follows:
Borrower or Lender | Average Daily
Loan Balance | Weighted Average Interest Rate | Interest
Expense |
Borrower | $ 6,327,394 | .46% | $ 2,688 |
7. Committed Line of Credit.
The Fund participates with other funds managed by FMR or an affiliate in a $3.75 billion credit facility (the "line of credit") to be utilized for temporary or emergency purposes to fund shareholder redemptions or for other short-term liquidity purposes. The Fund has agreed to pay commitment fees on its pro-rata portion of the line of credit, which amounted to $6,726 and is reflected in Miscellaneous expenses on the Statement of Operations. During the period, there were no borrowings on this line of credit.
8. Security Lending.
The Fund lends portfolio securities through a lending agent from time to time in order to earn additional income. The lending agent may loan securities to certain qualified borrowers, including Fidelity Capital Markets (FCM), a broker-dealer affiliated with the Fund. On the settlement date of the loan, the Fund receives collateral (in the form of U.S. Treasury obligations, letters of credit and/or cash) against the loaned securities and maintains collateral in an amount not less than 100% of the market value of the loaned securities during the period of the loan. The market value of the loaned securities is determined at the close of business of the Fund and any additional required collateral is delivered to the Fund on the next business day. If the borrower defaults on its obligation to return the securities loaned because of insolvency or other reasons, a fund could experience delays and costs in recovering the securities loaned or in gaining access to the collateral. Any cash collateral received is invested in the Fidelity Securities Lending Cash Central Fund. The value of loaned securities and cash collateral at period end are disclosed on the Fund's Statement of Assets and Liabilities. Security lending income represents the income earned on investing cash collateral, less rebates paid to borrowers and lending agent fees associated with the loan, plus any premium payments received for lending certain types of securities. Security lending income is presented in the Statement of Operations as a component of income from Fidelity Central Funds. Total security lending income during the period amounted to $1,148,632. During the period, there were no securities loaned to FCM.
Annual Report
9. Expense Reductions.
FMR or its affiliates agreed to waive certain fees during the period as noted in the table below.
Initial Class | $ 52,562 |
Service Class | 11,339 |
Service Class 2 | 31,214 |
Initial Class R | 8,436 |
Service Class R | 4,270 |
Service Class 2R | 4,382 |
Investor Class R | 11,149 |
| $ 123,352 |
Many of the brokers with whom FMR places trades on behalf of the Fund provided services to the Fund in addition to trade execution. These services included payments of certain expenses on behalf of the Fund totaling $368,334 for the period.
10. Distributions to Shareholders.
Distributions to shareholders of each class were as follows:
Years ended December 31, | 2010 | 2009 |
From net investment income | | |
Initial Class | $ 10,110,257 | $ 14,372,278 |
Service Class | 1,970,639 | 3,138,360 |
Service Class 2 | 4,977,207 | 7,783,553 |
Initial Class R | 1,595,066 | 2,454,887 |
Service Class R | 737,292 | 1,206,143 |
Service Class 2R | 764,839 | 1,088,142 |
Investor Class R | 2,192,946 | 2,716,315 |
Total | $ 22,348,246 | $ 32,759,678 |
From net realized gain | | |
Initial Class | $ 1,378,672 | $ 2,196,333 |
Service Class | 289,800 | 510,078 |
Service Class 2 | 824,951 | 1,322,412 |
Initial Class R | 217,509 | 370,967 |
Service Class R | 108,425 | 192,822 |
Service Class 2R | 124,028 | 169,786 |
Investor Class R | 314,777 | 414,053 |
Total | $ 3,258,162 | $ 5,176,451 |
11. Share Transactions.
Transactions for each class of shares were as follows:
| Shares | Dollars |
Years ended December 31, | 2010 | 2009 | 2010 | 2009 |
Initial Class | | | | |
Shares sold | 6,240,893 | 5,347,946 | $ 91,816,123 | $ 70,803,136 |
Reinvestment of distributions | 695,035 | 1,154,164 | 11,488,929 | 16,568,611 |
Shares redeemed | (10,822,191) | (13,947,134) | (162,039,161) | (175,327,331) |
Net increase (decrease) | (3,886,263) | (7,445,024) | $ (58,734,109) | $ (87,955,584) |
Service Class | | | | |
Shares sold | 784,984 | 959,799 | $ 11,710,566 | $ 12,824,467 |
Reinvestment of distributions | 137,329 | 255,575 | 2,260,439 | 3,648,438 |
Shares redeemed | (2,623,870) | (3,455,536) | (38,868,573) | (43,871,038) |
Net increase (decrease) | (1,701,557) | (2,240,162) | $ (24,897,568) | $ (27,398,133) |
Service Class 2 | | | | |
Shares sold | 2,715,745 | 2,952,474 | $ 39,743,530 | $ 36,740,955 |
Reinvestment of distributions | 354,006 | 640,998 | 5,802,158 | 9,105,965 |
Shares redeemed | (6,027,184) | (7,248,281) | (88,461,595) | (89,623,254) |
Net increase (decrease) | (2,957,433) | (3,654,809) | $ (42,915,907) | $ (43,776,334) |
Annual Report
Notes to Financial Statements - continued
11. Share Transactions - continued
| Shares | Dollars |
Years ended December 31, | 2010 | 2009 | 2010 | 2009 |
Initial Class R | | | | |
Shares sold | 408,250 | 612,315 | $ 6,248,778 | $ 8,157,631 |
Reinvestment of distributions | 109,920 | 197,166 | 1,812,575 | 2,825,854 |
Shares redeemed | (1,757,857) | (2,020,970) | (26,056,661) | (24,694,123) |
Net increase (decrease) | (1,239,687) | (1,211,489) | $ (17,995,308) | $ (13,710,638) |
Service Class R | | | | |
Shares sold | 220,630 | 305,936 | $ 3,280,664 | $ 4,003,822 |
Reinvestment of distributions | 51,443 | 98,069 | 845,717 | 1,398,965 |
Shares redeemed | (1,047,945) | (1,102,231) | (15,463,802) | (13,550,063) |
Net increase (decrease) | (775,872) | (698,226) | $ (11,337,421) | $ (8,147,276) |
Service Class 2R | | | | |
Shares sold | 861,942 | 1,006,368 | $ 12,744,208 | $ 12,396,135 |
Reinvestment of distributions | 54,700 | 88,897 | 888,867 | 1,257,928 |
Shares redeemed | (1,044,322) | (625,865) | (15,533,067) | (7,643,458) |
Net increase (decrease) | (127,680) | 469,400 | $ (1,899,992) | $ 6,010,605 |
Investor Class R | | | | |
Shares sold | 2,450,123 | 1,131,791 | $ 36,039,937 | $ 15,649,216 |
Reinvestment of distributions | 152,075 | 218,381 | 2,507,723 | 3,130,368 |
Shares redeemed | (1,872,670) | (1,661,407) | (27,948,504) | (20,149,633) |
Net increase (decrease) | 729,528 | (311,235) | $ 10,599,156 | $ (1,370,049) |
12. Other.
The Fund's organizational documents provide former and current trustees and officers with a limited indemnification against liabilities arising in connection with the performance of their duties to the Fund. In the normal course of business, the Fund may also enter into contracts that provide general indemnifications. The Fund's maximum exposure under these arrangements is unknown as this would be dependent on future claims that may be made against the Fund. The risk of material loss from such claims is considered remote.
At the end of the period, FMR or its affiliates were the owners of record of 16% of the total outstanding shares of the Fund and two otherwise unaffiliated shareholders were the owners of record of 32% of the total outstanding shares of the Fund.
Annual Report
Report of Independent Registered Public Accounting Firm
To the Trustees of Variable Insurance Products Fund and the Shareholders of VIP Overseas Portfolio:
In our opinion, the accompanying statement of assets and liabilities, including the schedule of investments, and the related statements of operations and of changes in net assets and the financial highlights present fairly, in all material respects, the financial position of VIP Overseas Portfolio (a fund of Variable Insurance Products Fund) at December 31, 2010, the results of its operations for the year then ended, the changes in its net assets for each of the two years in the period then ended and the financial highlights for each of the five years in the period then ended, in conformity with accounting principles generally accepted in the United States of America. These financial statements and financial highlights (hereafter referred to as "financial statements") are the responsibility of the VIP Overseas Portfolio's management. Our responsibility is to express an opinion on these financial statements based on our audits. We conducted our audits of these financial statements in accordance with the standards of the Public Company Accounting Oversight Board (United States). Those standards require that we plan and perform the audit to obtain reasonable assurance about whether the financial statements are free of material misstatement. An audit includes examining, on a test basis, evidence supporting the amounts and disclosures in the financial statements, assessing the accounting principles used and significant estimates made by management, and evaluating the overall financial statement presentation. We believe that our audits, which included confirmation of securities at December 31, 2010 by correspondence with the custodian and brokers, provide a reasonable basis for our opinion.
/s/ PricewaterhouseCoopers LLP
PricewaterhouseCoopers LLP
Boston, Massachusetts
February 14, 2011
Annual Report
The Trustees, Members of the Advisory Board, and executive officers of the trust and fund, as applicable, are listed below. The Board of Trustees governs the fund and is responsible for protecting the interests of shareholders. The Trustees are experienced executives who meet periodically throughout the year to oversee the fund's activities, review contractual arrangements with companies that provide services to the fund, oversee management of the risks associated with such activities and contractual arrangements, and review the fund's performance. Except for James C. Curvey, each of the Trustees oversees 219 funds advised by FMR or an affiliate. Mr. Curvey oversees 408 funds advised by FMR or an affiliate.
The Trustees hold office without limit in time except that (a) any Trustee may resign; (b) any Trustee may be removed by written instrument, signed by at least two-thirds of the number of Trustees prior to such removal; (c) any Trustee who requests to be retired or who has become incapacitated by illness or injury may be retired by written instrument signed by a majority of the other Trustees; and (d) any Trustee may be removed at any special meeting of shareholders by a two-thirds vote of the outstanding voting securities of the trust. Each Trustee who is not an interested person (as defined in the 1940 Act) (Independent Trustee), shall retire not later than the last day of the calendar year in which his or her 72nd birthday occurs. The Independent Trustees may waive this mandatory retirement age policy with respect to individual Trustees. The executive officers and Advisory Board Members hold office without limit in time, except that any officer and Advisory Board Member may resign or may be removed by a vote of a majority of the Trustees at any regular meeting or any special meeting of the Trustees. Except as indicated, each individual has held the office shown or other offices in the same company for the past five years.
Experience, Skills, Attributes, and Qualifications of the Fund's Trustees. The Governance and Nominating Committee has adopted a statement of policy that describes the experience, qualifications, attributes, and skills that are necessary and desirable for potential Independent Trustee candidates (Statement of Policy). The Board believes that each Trustee satisfied at the time he or she was initially elected or appointed a Trustee, and continues to satisfy, the standards contemplated by the Statement of Policy. The Governance and Nominating Committee also engages professional search firms to help identify potential Independent Trustee candidates who have the experience, qualifications, attributes, and skills consistent with the Statement of Policy. From time to time, additional criteria based on the composition and skills of the current Independent Trustees, as well as experience or skills that may be appropriate in light of future changes to board composition, business conditions, and regulatory or other developments, have also been considered by the professional search firms and the Governance and Nominating Committee. In addition, the Board takes into account the Trustees' commitment and participation in Board and committee meetings, as well as their leadership of standing and ad hoc committees throughout their tenure.
In determining that a particular Trustee was and continues to be qualified to serve as a Trustee, the Board has considered a variety of criteria, none of which, in isolation, was controlling. The Board believes that, collectively, the Trustees have balanced and diverse experience, qualifications, attributes, and skills, which allow the Board to operate effectively in governing the fund and protecting the interests of shareholders. Information about the specific experience, skills, attributes, and qualifications of each Trustee, which in each case led to the Board's conclusion that the Trustee should serve (or continue to serve) as a trustee of the fund, is provided below.
Board Structure and Oversight Function. James C. Curvey is an interested person (as defined in the 1940 Act) and currently serves as Acting Chairman. The Trustees have determined that an interested Chairman is appropriate and benefits shareholders because an interested Chairman has a personal and professional stake in the quality and continuity of services provided to the fund. Independent Trustees exercise their informed business judgment to appoint an individual of their choosing to serve as Chairman, regardless of whether the Trustee happens to be independent or a member of management. The Independent Trustees have determined that they can act independently and effectively without having an Independent Trustee serve as Chairman and that a key structural component for assuring that they are in a position to do so is for the Independent Trustees to constitute a substantial majority for the Board. The Independent Trustees also regularly meet in executive session. Ned C. Lautenbach serves as Chairman of the Independent Trustees and as such (i) acts as a liaison between the Independent Trustees and management with respect to matters important to the Independent Trustees and (ii) with management prepares agendas for Board meetings.
Fidelity funds are overseen by different Boards of Trustees. The fund's Board oversees Fidelity's equity and high income funds and another Board oversees Fidelity's investment-grade bond, money market, and asset allocation funds. The asset allocation funds may invest in Fidelity funds overseen by the fund's Board. The use of separate Boards, each with its own committee structure, allows the Trustees of each group of Fidelity funds to focus on the unique issues of the funds they oversee, including common research, investment, and operational issues. On occasion, the separate Boards establish joint committees to address issues of overlapping consequences for the Fidelity funds overseen by each Board.
The Trustees operate using a system of committees to facilitate the timely and efficient consideration of all matters of importance to the Trustees, the fund, and fund shareholders and to facilitate compliance with legal and regulatory requirements and oversight of the fund's activities and associated risks. The Board, acting through its committees, has charged FMR and its affiliates with (i) identifying events or circumstances the occurrence of which could have demonstrably adverse effects on the fund's business and/or reputation; (ii) implementing processes and controls to lessen the possibility that such events or circumstances occur or to mitigate the effects of such events or circumstances if they do occur; and (iii) creating and maintaining a system designed to evaluate continuously business and market conditions in order to facilitate the identification and implementation processes described in (i) and (ii) above. Because the day-to-day operations and activities of the fund are carried out by or through FMR, its affiliates and other service providers, the fund's exposure to risks is mitigated but not eliminated by the processes overseen by the Trustees. While each of the Board's committees has responsibility for overseeing different aspects of the fund's activities, oversight is exercised primarily through the Operations, Audit, and Compliance Committees. Appropriate personnel, including but not limited to the fund's Chief Compliance Officer (CCO), FMR's internal auditor, the independent accountants, the fund's Treasurer and portfolio management personnel, make periodic reports to the Board's committees, as appropriate. The responsibilities of each committee, including their oversight responsibilities, are described further under "Standing Committees of the Fund's Trustees."
Annual Report
The fund's Statement of Additional Information (SAI) includes more information about the Trustees. To request a free copy, call Fidelity at 1-877-208-0098.
Interested Trustees*:
Correspondence intended for each Trustee who is an interested person may be sent to Fidelity Investments, 82 Devonshire Street, Boston, Massachusetts 02109.
Name, Age; Principal Occupations and Other Relevant Experience+ |
James C. Curvey (75) |
| Year of Election or Appointment: 2007 Mr. Curvey is Trustee and Acting Chairman of the Board of Trustees of certain Trusts. Mr. Curvey also serves as Trustee (2007-present) of other investment companies advised by FMR. Mr. Curvey is a Director of Fidelity Investments Money Management, Inc. (2009-
present), Director of Fidelity Research & Analysis Co. (2009-present) and Director of FMR and FMR Co., Inc. (2007-present). Mr. Curvey is also Vice Chairman (2007-present) and Director of FMR LLC. In addition, Mr. Curvey serves as an Overseer for the Boston Symphony Orchestra and a member of the Trustees of Villanova University. Previously, Mr. Curvey was the Vice Chairman (2006-2007) and Director (2000-2007) of FMR Corp. |
Ronald P. O'Hanley (54) |
| Year of Election or Appointment: 2011 Mr. O'Hanley is President of Fidelity Asset Management and Corporate Services and a member of Fidelity's Executive Committee (2010-present). Previously, Mr. O'Hanley served as President and Chief Executive Officer of BNY Mellon Asset Management (2007-2010). Mr. O'Hanley also served as Vice Chairman of Bank New York Mellon Corp. and a member of that firm's Executive Committee. Prior to the 2007 merger of The Bank of New York and Mellon Financial Corporation, he was Vice Chairman of Mellon Financial Corporation and President and Chief Executive Officer of Mellon Asset Management. He joined Mellon in February 1997. Mr. O'Hanley currently serves as Chairman of the Boston Public Library Foundation Board of Directors and sits on the Board of Directors of Beth Israel Deaconess Medical Center, the Board of Trustees of the Marine Biological Laboratory and the Advisory Board of the Maxwell School of Citizenship and Public Administration at Syracuse University. Mr. O'Hanley also chairs the Council on Asset Management for the Financial Services Roundtable and is a member of the Board of Directors of Institutional Investor's U.S. Institute. |
* Trustees have been determined to be "Interested Trustees" by virtue of, among other things, their affiliation with the trust various entities under common control with FMR.
+ The information above includes each Trustee's principal occupation during the last five years and other information relating to the experience, attributes, and skills relevant to each Trustee's qualifications to serve as a Trustee, which led to the conclusion that each Trustee should serve as a Trustee for the fund.
Independent Trustees:
Correspondence intended for each Independent Trustee (that is, the Trustees other than the Interested Trustees) may be sent to Fidelity Investments, P.O. Box 55235, Boston, Massachusetts 02205-5235.
Name, Age; Principal Occupations and Other Relevant Experience+ |
Dennis J. Dirks (62) |
| Year of Election or Appointment: 2005 Prior to his retirement in May 2003, Mr. Dirks was Chief Operating Officer and a member of the Board of The Depository Trust & Clearing Corporation (DTCC). He also served as President, Chief Operating Officer, and Board member of The Depository Trust Company (DTC) and President and Board member of the National Securities Clearing Corporation (NSCC). In addition, Mr. Dirks served as Chief Executive Officer and Board member of the Government Securities Clearing Corporation, Chief Executive Officer and Board member of the Mortgage-Backed Securities Clearing Corporation, as a Trustee and a member of the Finance Committee of Manhattan College (2005-2008), and as a Trustee and a member of the Finance Committee of AHRC of Nassau County (2006-2008). Mr. Dirks is a member of the Independent Directors Council (IDC) Governing Council (2010-Present) and Board of Directors for The Brookville Center for Children's Services, Inc. (2009-present). |
Alan J. Lacy (57) |
| Year of Election or Appointment: 2008 Mr. Lacy serves as Senior Adviser (2007-present) of Oak Hill Capital Partners, L.P. (private equity). Mr. Lacy also served as Chief Executive Officer (2000-2005) and Vice Chairman (2005-2006) of Sears Holdings Corporation and Sears, Roebuck and Co. (retail). In addition, Mr. Lacy serves as a member of the Board of Directors of The Western Union Company (global money transfer, 2006-present) and Bristol-Myers Squibb Company (global pharmaceuticals, 2007-present). Mr. Lacy is Chairman (2008-present) and a member (2006-present) of the Board of Trustees of The National Parks Conservation Association. |
Ned C. Lautenbach (66) |
| Year of Election or Appointment: 2000 Mr. Lautenbach is Chairman of the Independent Trustees of the Equity and High Income Funds (2006-present). Mr. Lautenbach currently serves as the Lead Director of the Eaton Corporation Board of Directors (diversified industrial, 1997-present). Mr. Lautenbach is also a member of the Board of Directors of the Philharmonic Center for the Arts in Naples, Florida (1999-
present); a member of the Board of Trustees of Fairfield University (2005-present); and a member of the Council on Foreign Relations (1994-present). Previously, Mr. Lautenbach was a Partner/Advisory Partner at Clayton, Dubilier & Rice, Inc. (private equity investment, 1998-2010), as well as a Director of Sony Corporation (2006-2007). |
Joseph Mauriello (66) |
| Year of Election or Appointment: 2008 Prior to his retirement in January 2006, Mr. Mauriello served in numerous senior management positions including Deputy Chairman and Chief Operating Officer (2004-2005), and Vice Chairman of Financial Services (2002-2004) of KPMG LLP US (professional services, 1965-2005). Mr. Mauriello currently serves as a member of the Board of Directors of XL Group plc. (global insurance and re-insurance, 2006-present) and of Arcadia Resources Inc. (health care services and products, 2007-present). Previously, Mr. Mauriello served as a Director of the Hamilton Funds of the Bank of New York (2006-2007). |
Cornelia M. Small (66) |
| Year of Election or Appointment: 2005 Ms. Small is a member of the Board of Directors of the Teagle Foundation (2009-present). Ms. Small is also a member of the Investment Committee, and Chair (2008-present) and a member of the Board of Trustees of Smith College. In addition, Ms. Small serves on the Investment Committee of the Berkshire Taconic Community Foundation (2008-present). Previously, Ms. Small served as Chairperson of the Investment Committee (2002-2008) of Smith College. In addition, Ms. Small served as Chief Investment Officer, Director of Global Equity Investments, and a member of the Board of Directors of Scudder, Stevens & Clark and Scudder Kemper Investments. |
William S. Stavropoulos (71) |
| Year of Election or Appointment: 2001 Mr. Stavropoulos is Vice Chairman of the Independent Trustees of the Equity and High Income Funds (2006-present). Mr. Stavropoulos serves as President and Founder of the Michigan Baseball Foundation, the Great Lakes Loons (2007-present). Mr. Stavropoulos is Chairman Emeritus of the Board of Directors of The Dow Chemical Company, where he previously served in numerous senior management positions, including President, CEO (1995-2000; 2002-2004), Chairman of the Executive Committee (2000-2006), and as a member of the Board of Directors (1990-2006). Currently, Mr. Stavropoulos is Chairman of Univar (global distributor of commodity and specialty chemicals, 2010-present), a Director of Teradata Corporation (data warehousing and technology solutions, 2008-present), Chemical Financial Corporation, Maersk Inc. (industrial conglomerate), Tyco International, Inc. (multinational manufacturing and services, 2007-present), and a member of the Advisory Board for Metalmark Capital (private equity investment, 2005-present). Mr. Stavropoulos is a special advisor to Clayton, Dubilier & Rice, LLC (private equity investment). In addition, Mr. Stavropoulos is a member of the University of Notre Dame Advisory Council for the College of Science. |
David M. Thomas (61) |
| Year of Election or Appointment: 2008 Previously, Mr. Thomas served as Executive Chairman (2005-2006) and Chairman and Chief Executive Officer (2000-2005) of IMS Health, Inc. (pharmaceutical and healthcare information solutions). In addition, Mr. Thomas serves as a member of the Board of Directors of Fortune Brands, Inc. (consumer products), and Interpublic Group of Companies, Inc. (marketing communication, 2004-present). |
Michael E. Wiley (60) |
| Year of Election or Appointment: 2008 Mr. Wiley also serves as a Director of Asia Pacific Exploration Consolidated (international oil and gas exploration and production, 2008-present). Mr. Wiley serves as a Director of Tesoro Corporation (independent oil refiner and marketer, 2005-present), and a Director of Bill Barrett Corporation (exploration and production, 2005-present). In addition, Mr. Wiley also serves as a Director of Post Oak Bank (privately-held bank, 2004-present). Previously, Mr. Wiley served as a member of the Board of Trustees of the University of Tulsa (2000-2006; 2007-2010), as a Senior Energy Advisor of Katzenbach Partners, LLC (consulting, 2006-2007), as an Advisory Director of Riverstone Holdings (private investment), Chairman, President, and CEO of Baker Hughes, Inc. (oilfield services, 2000-2004), and as Director of Spinnaker Exploration Company (exploration and production, 2001-2005). |
+ The information above includes each Trustee's principal occupation during the last five years and other information relating to the experience, attributes, and skills relevant to each Trustee's qualifications to serve as a Trustee, which led to the conclusion that each Trustee should serve as a Trustee for the fund.
Advisory Board Members and Executive Officers:
Correspondence intended for each executive officer, Edward C. Johnson 3d, and Peter S. Lynch may be sent to Fidelity Investments, 82 Devonshire Street, Boston, Massachusetts 02109.
Name, Age; Principal Occupation |
Edward C. Johnson 3d (80) |
| Year of Election or Appointment: 2011 Member of the Advisory Board of Fidelity's Equity and High Income Funds. Formerly Trustee and Chairman of the Board of Trustees of certain Trusts, Mr. Johnson serves as Chief Executive Officer, Chairman, and a Director of FMR LLC; Chairman and a Director of FMR; and Chairman and a Director of FMR Co., Inc. In addition, Mr. Johnson serves as Chairman and Director of FIL Limited. Previously, Mr. Johnson served as President of FMR LLC (2006-2007). |
Peter S. Lynch (66) |
| Year of Election or Appointment: 2003 Member of the Advisory Board of Fidelity's Equity and High Income Funds. Mr. Lynch is Vice Chairman and a Director of FMR and FMR Co., Inc. In addition, Mr. Lynch serves as a Trustee of Boston College and as the Chairman of the Inner-City Scholarship Fund. Previously, Mr. Lynch served on the Special Olympics International Board of Directors (1997-2006). |
Kenneth B. Robins (41) |
| Year of Election or Appointment: 2008 President and Treasurer of Fidelity's Equity and High Income Funds. Mr. Robins also serves as President and Treasurer (2010-
present) and Assistant Treasurer (2009-present) of other Fidelity funds and is an employee of Fidelity Investments (2004-present). Previously, Mr. Robins served as Deputy Treasurer of the Fidelity funds (2005-2008) and Treasurer and Chief Financial Officer of The North Carolina Capital Management Trust: Cash and Term Portfolios (2006-2008). |
Bruce T. Herring (45) |
| Year of Election or Appointment: 2006 Vice President of certain Equity Funds. Mr. Herring also serves as Chief Investment Officer and Director of Fidelity Management & Research (U.K.) Inc. (2010-present) and Group Chief Investments Officer of FMR. Previously, Mr. Herring served as Vice President (2005-2006) and Senior Vice President (2006-2007) of Fidelity Management & Research Company, Vice President of FMR Co., Inc. (2001-2007) and as a portfolio manager for Fidelity U.S. Equity Funds. |
Brian B. Hogan (46) |
| Year of Election or Appointment: 2009 Vice President of certain Equity Funds and Vice President of Sector Funds. Mr. Hogan also serves as President of FMR's Equity Division (2009-present). Previously, Mr. Hogan served as Senior Vice President, Equity Research of FMR (2006-2009) and as a portfolio manager. |
Scott C. Goebel (42) |
| Year of Election or Appointment: 2008 Secretary and Chief Legal Officer (CLO) of the Fidelity funds. Mr. Goebel also serves as Secretary and CLO of The North Carolina Capital Management Trust: Cash and Term Portfolio (2008-present); General Counsel, Secretary, and Senior Vice President of FMR (2008-present) and FMR Co., Inc. (2008-present); Deputy General Counsel of FMR LLC; Chief Legal Officer of Fidelity Management & Research (Hong Kong) Limited (2008-present) and Assistant Secretary of Fidelity Management & Research (Japan) Inc. (2008-present), Fidelity Investments Money Management, Inc. (2008-present), Fidelity Management & Research (U.K.) Inc. (2008-
present), and Fidelity Research and Analysis Company (2008-present). Previously, Mr. Goebel served as Assistant Secretary of the Funds (2007-2008) and as Vice President and Secretary of Fidelity Distributors Corporation (FDC) (2005-2007). |
William C. Coffey (41) |
| Year of Election or Appointment: 2009 Assistant Secretary of Fidelity's Equity and High Income Funds. Mr. Coffey also serves as Senior Vice President and Deputy General Counsel of FMR LLC (2010-present), and is an employee of Fidelity Investments. Previously, Mr. Coffey served as Vice President and Associate General Counsel of FMR LLC (2005-2009). |
Holly C. Laurent (56) |
| Year of Election or Appointment: 2008 Anti-Money Laundering (AML) Officer of the Fidelity funds. Ms. Laurent also serves as AML Officer of The North Carolina Capital Management Trust: Cash and Term Portfolio (2008-present) and is an employee of Fidelity Investments. Previously, Ms. Laurent was Senior Vice President and Head of Legal for Fidelity Business Services India Pvt. Ltd. (2006-2008), and Senior Vice President, Deputy General Counsel and Group Head for FMR LLC (2005-2006). |
Christine Reynolds (52) |
| Year of Election or Appointment: 2008 Chief Financial Officer of the Fidelity funds. Ms. Reynolds became President of Fidelity Pricing and Cash Management Services (FPCMS) in August 2008. Ms. Reynolds served as Chief Operating Officer of FPCMS (2007-2008). Previously, Ms. Reynolds served as President, Treasurer, and Anti-Money Laundering officer of the Fidelity funds (2004-2007). |
Kenneth A. Rathgeber (63) |
| Year of Election or Appointment: 2004 Chief Compliance Officer of Fidelity's Equity and High Income Funds. Mr. Rathgeber is Chief Compliance Officer of Fidelity Management & Research (Hong Kong) Limited (2008-present), Fidelity Management & Research (Japan) Inc. (2008-present), FMR (2005-present), FMR Co., Inc. (2005-present), Fidelity Management & Research (U.K.) Inc. (2005-present), Fidelity Research & Analysis Company (2005-present), Fidelity Investments Money Management, Inc. (2005-present), Pyramis Global Advisors, LLC (2005-present), and Strategic Advisers, Inc. (2005-present). |
Jeffrey S. Christian (49) |
| Year of Election or Appointment: 2009 Deputy Treasurer of the Fidelity funds. Mr. Christian is an employee of Fidelity Investments. Previously, Mr. Christian served as Chief Financial Officer (2008-2009) of certain Fidelity funds and Senior Vice President of Fidelity Pricing and Cash Management Services (FPCMS) (2004-2009). |
Bryan A. Mehrmann (49) |
| Year of Election or Appointment: 2005 Deputy Treasurer of the Fidelity funds. Mr. Mehrmann is an employee of Fidelity Investments. |
Adrien E. Deberghes (43) |
| Year of Election or Appointment: 2008 Deputy Treasurer of Fidelity's Equity and High Income Funds. Mr. Deberghes also serves as Assistant Treasurer of other Fidelity funds (2010-present) and is an employee of Fidelity Investments (2008-present). Previously, Mr. Deberghes served as Senior Vice President of Mutual Fund Administration at State Street Corporation (2007-2008), Senior Director of Mutual Fund Administration at Investors Bank & Trust (2005-2007), and Director of Finance for Dunkin' Brands (2000-2005). |
Stephanie J. Dorsey (41) |
| Year of Election or Appointment: 2010 Assistant Treasurer of Fidelity's Equity and High Income Funds. Ms. Dorsey also serves as Deputy Treasurer of other Fidelity funds (2008-present) and is an employee of Fidelity Investments (2008-present). Previously, Ms. Dorsey served as Treasurer (2004-2008) of the JPMorgan Mutual Funds and Vice President (2004-2008) of JPMorgan Chase Bank. |
John R. Hebble (52) |
| Year of Election or Appointment: 2009 Assistant Treasurer of Fidelity's Equity and High Income Funds. Mr. Hebble also serves as Treasurer and Chief Financial Officer of The North Carolina Capital Management Trust: Cash and Term Portfolio (2008-present), President and Treasurer of other Fidelity funds (2008-present) and is an employee of Fidelity Investments. |
Gary W. Ryan (52) |
| Year of Election or Appointment: 2005 Assistant Treasurer of the Fidelity funds. Mr. Ryan is an employee of Fidelity Investments. Previously, Mr. Ryan served as Vice President of Fund Reporting in Fidelity Pricing and Cash Management Services (FPCMS) (1999-2005). |
Jonathan Davis (42) |
| Year of Election or Appointment: 2010 Assistant Treasurer of the Fidelity funds. Mr. Davis is an employee of Fidelity Investments. Previously, Mr. Davis served as Vice President and Associate General Counsel of FMR LLC (2003-2010). |
Annual Report
The Board of Trustees of VIP Overseas Portfolio voted to pay to shareholders of record at the opening of business on record date, the following distributions per share derived from capital gains realized from sales of portfolio securities:
| Pay Date | Record Date | Capital Gains |
Initial Class | 02/04/11 | 02/04/11 | $0.03 |
Service Class | 02/04/11 | 02/04/11 | $0.03 |
Service Class 2 | 02/04/11 | 02/04/11 | $0.03 |
The amounts per share which represent income derived from sources within, and taxes paid to, foreign countries or possessions of the United States are as follows:
| Pay Date | Income | Taxes |
Initial Class | 12/17/10 | $0.263 | $0.013 |
Service Class | 12/17/10 | $0.247 | $0.013 |
Service Class 2 | 12/17/10 | $0.224 | $0.013 |
Annual Report
Board Approval of Investment Advisory Contracts and Management Fees
VIP Overseas Portfolio
Each year, the Board of Trustees, including the Independent Trustees (together, the Board), votes on the renewal of the management contract and sub-advisory agreements (together, the Advisory Contracts) for the fund. The Board, assisted by the advice of fund counsel and Independent Trustees' counsel, requests and considers a broad range of information relevant to the renewal of the Advisory Contracts throughout the year.
The Board meets regularly and considers at each of its meetings factors that are relevant to its annual consideration of the renewal of the fund's Advisory Contracts, including the services and support provided to the fund and its shareholders. The Board has established various standing committees, each composed of Independent Trustees with varying backgrounds, to which the Board has assigned specific subject matter responsibilities in order to enhance effective decision-making by the Board. The Board, acting directly and through its Committees, requests and receives information concerning the annual consideration of the renewal of the fund's Advisory Contracts. The Board also meets as needed to consider matters specifically related to the Board's annual consideration of the renewal of Advisory Contracts. Members of the Board may also meet with trustees of other Fidelity funds through ad hoc joint committees to discuss certain matters relevant to the Fidelity funds.
At its July 2010 meeting, the Board of Trustees, including the Independent Trustees, unanimously determined to renew the fund's Advisory Contracts. In reaching its determination, the Board considered all factors it believed relevant, including (i) the nature, extent, and quality of the services to be provided to the fund and its shareholders (including the investment performance of the fund); (ii) the competitiveness of the fund's management fee and total expenses; (iii) the total costs of the services to be provided by and the profits to be realized by Fidelity from its relationship with the fund; (iv) the extent to which economies of scale would be realized as the fund grows; and (v) whether fee levels reflect these economies of scale, if any, for the benefit of fund shareholders.
In considering whether to renew the Advisory Contracts for the fund, the Board reached a determination, with the assistance of fund counsel and Independent Trustees' counsel and through the exercise of its business judgment, that the renewal of the Advisory Contracts is in the best interests of fund shareholders and that the compensation to be received by Fidelity under the management contract is fair and reasonable. The Board's decision to renew the Advisory Contracts was not based on any single factor noted above, but rather was based on a comprehensive consideration of all the information provided to the Board at its meetings throughout the year. The Board, in reaching its determination to renew the Advisory Contracts, is aware that shareholders in the fund have a broad range of investment choices available to them, including a wide choice among mutual funds offered by Fidelity's competitors, and that the fund's shareholders, with the opportunity to review and weigh the disclosure provided by the fund in its prospectus and other public disclosures, have chosen to invest in this fund, managed by Fidelity.
Nature, Extent, and Quality of Services Provided. The Board considered the staffing within the investment adviser, FMR, and the sub-advisers (together, the Investment Advisers), including the backgrounds of the fund's investment personnel and the fund's investment objective and discipline. The Independent Trustees also had discussions with senior management of Fidelity's investment operations and investment groups. The Board considered the structure of the portfolio manager compensation program and whether this structure provides appropriate incentives to act in the best interest of the fund.
Resources Dedicated to Investment Management and Support Services. The Board and the equity research subcommittee of the Board's Fund Oversight Committee reviewed the size, education, and experience of the Investment Advisers' investment staff, their use of technology, and the Investment Advisers' approach to recruiting, training, and retaining portfolio managers and other research, advisory, and management personnel. The Board noted that Fidelity's analysts have access to a variety of technological tools and market and securities data that enable them to perform both fundamental and quantitative analysis and to specialize in various disciplines. The Board considered Fidelity's extensive global research capabilities that enable the Investment Advisers to aggregate data from various sources in an effort to produce positive investment results. The Board also considered that Fidelity's portfolio managers and analysts have access to daily portfolio attribution that allows for monitoring of a fund's portfolio, as well as an electronic communication system that provides immediate real-time access to research concerning issuers and credit enhancers. The Board noted FMR's continued focus on strengthening the organization and discipline of equity portfolio management and research.
Shareholder and Administrative Services. The Board considered (i) the nature, extent, quality, and cost of advisory, administrative, and shareholder services performed by the Investment Advisers and their affiliates under the Advisory Contracts and under separate agreements covering transfer agency, pricing and bookkeeping, and securities lending services for the fund; (ii) the nature and extent of the investment adviser's supervision of third party service providers, principally custodians and subcustodians; and (iii) the resources devoted to, and the record of compliance with, the fund's compliance policies and procedures. The Board also reviewed the allocation of fund brokerage, including allocations to brokers affiliated with the Investment Advisers, the use of brokerage commissions to pay fund expenses, and the use of "soft" commission dollars to pay for research services.
The Board noted that the growth of fund assets over time across the complex allows Fidelity to reinvest in the development of services designed to enhance the value or convenience of the Fidelity funds as investment vehicles. These services include 24-hour access to account information and market information through phone representatives and over the Internet, and investor education materials and asset allocation tools.
Investment in a Large Fund Family. The Board considered the benefits to shareholders of investing in a Fidelity fund, including the benefits of investing in a fund that is part of a large family of funds offering a variety of investment disciplines and providing a large variety of mutual fund investor services. The Board noted that Fidelity had taken, or had made recommendations that resulted in the Fidelity funds taking, a number of actions over the previous year that benefited particular funds, including (i) dedicating additional resources to investment research and restructuring and broadening the focus of the investment research teams; (ii) bolstering the senior management team that oversees asset management; (iii) launching Class F of certain funds as a lower-fee class available to Freedom K and Freedom Index Funds; (iv) lowering the initial investment minimums and ongoing balance requirements for Real Estate High Income Fund; (v) eliminating subsequent purchase minimums for all funds and adding a waiver of the investment minimum requirement for new accounts opened with the proceeds of a systematic withdrawal plan; (vi) eliminating the withdrawal minimum and maximum limits for systematic withdrawals from Advisor funds; (vii) expanding sales load waivers on Class A shares for Destiny Planholders and expanding Institutional Class eligibility for Class O Destiny Planholders; and (viii) changing certain Class A and Class T sales charge structures to further align them with industry practices.
Annual Report
Board Approval of Investment Advisory Contracts and Management Fees - continued
Investment Performance. The Board considered whether the fund has operated in accordance with its investment objective, as well as its record of compliance with its investment restrictions. It also reviewed the fund's absolute investment performance for each class, as well as the fund's relative investment performance for each class measured over multiple periods against (i) a broad-based securities market index, and (ii) a peer group of mutual funds deemed appropriate by Fidelity and reviewed by the Board. The following charts considered by the Board show, over the one-, three-, and five-year periods ended December 31, 2009, the cumulative total returns of Initial Class R and Service Class 2 of the fund, the cumulative total returns of a broad-based securities market index ("benchmark"), and a range of cumulative total returns of a peer group of mutual funds identified by Morningstar, Inc. as having an investment style similar to that of the fund based on underlying portfolio holdings. The returns of Initial Class R and Service Class 2 show the performance of the highest and lowest performing classes, respectively (based on five-year performance). The box within each chart shows the 25th percentile return (bottom of box) and the 75th percentile return (top of box) of the peer group. Returns shown above the box are in the first quartile and returns shown below the box are in the fourth quartile. The percentage beaten numbers noted below each chart correspond to the percentile box and represent the percentage of funds in the peer group whose performance was equal to or lower than that of the class indicated.
VIP Overseas Portfolio

The Board reviewed the fund's relative investment performance against its peer group and noted that the performance of Initial Class R of the fund was in the third quartile for the one- and five-year periods and the second quartile for the three-year period. The Board also noted that the investment performance of the fund was lower than its benchmark for the one- and five-year periods, although the three-year cumulative total return of Initial Class R compared favorably to its benchmark. The Board considered that the variations in performance among the fund's classes reflect the variations in class expenses, which result in lower performance for higher expense classes. The Board also reviewed the fund's performance since inception as well as performance in the current year.
Based on its review, and giving particular weight to the nature and quality of the resources dedicated by the Investment Advisers to maintain and improve relative performance and factoring in the unprecedented market events in recent years, the Board concluded that the nature, extent, and quality of investment management and support services and of shareholder and administrative services provided to the fund will benefit the fund's shareholders, particularly in light of the Board's view that the fund's shareholders benefit from investing in a fund that is part of a large family of funds offering a variety of investment disciplines and services.
Competitiveness of Management Fee and Total Fund Expenses. The Board considered the fund's management fee and total expenses compared to "mapped groups" of competitive funds and classes. Fidelity creates "mapped groups" by combining similar Lipper investment objective categories that have comparable management fee characteristics. Combining Lipper investment objective categories aids the Board's management fee and total expense comparisons by broadening the competitive group used for comparison and by reducing the number of universes to which various Fidelity funds are compared.
Annual Report
Management Fee. The Board considered two proprietary management fee comparisons for the 12-month periods shown in the chart below. The group of Lipper funds used by the Board for management fee comparisons is referred to below as the "Total Mapped Group." The Total Mapped Group comparison focuses on a fund's standing relative to the total universe of comparable funds available to investors, in terms of gross management fees before expense reimbursements or caps. "TMG %" represents the percentage of funds in the Total Mapped Group that had management fees that were lower than the fund's. For example, a TMG % of 14% means that 86% of the funds in the Total Mapped Group had higher management fees than the fund. The "Asset-Size Peer Group" (ASPG) comparison focuses on a fund's standing relative to non-Fidelity funds similar in size to the fund within the Total Mapped Group. The ASPG represents at least 15% of the funds in the Total Mapped Group with comparable asset size and management fee characteristics, subject to a minimum of 50 funds (or all funds in the Total Mapped Group if fewer than 50). Additional information, such as the ASPG quartile in which the fund's management fee ranked, is also included in the chart and considered by the Board.
VIP Overseas Portfolio
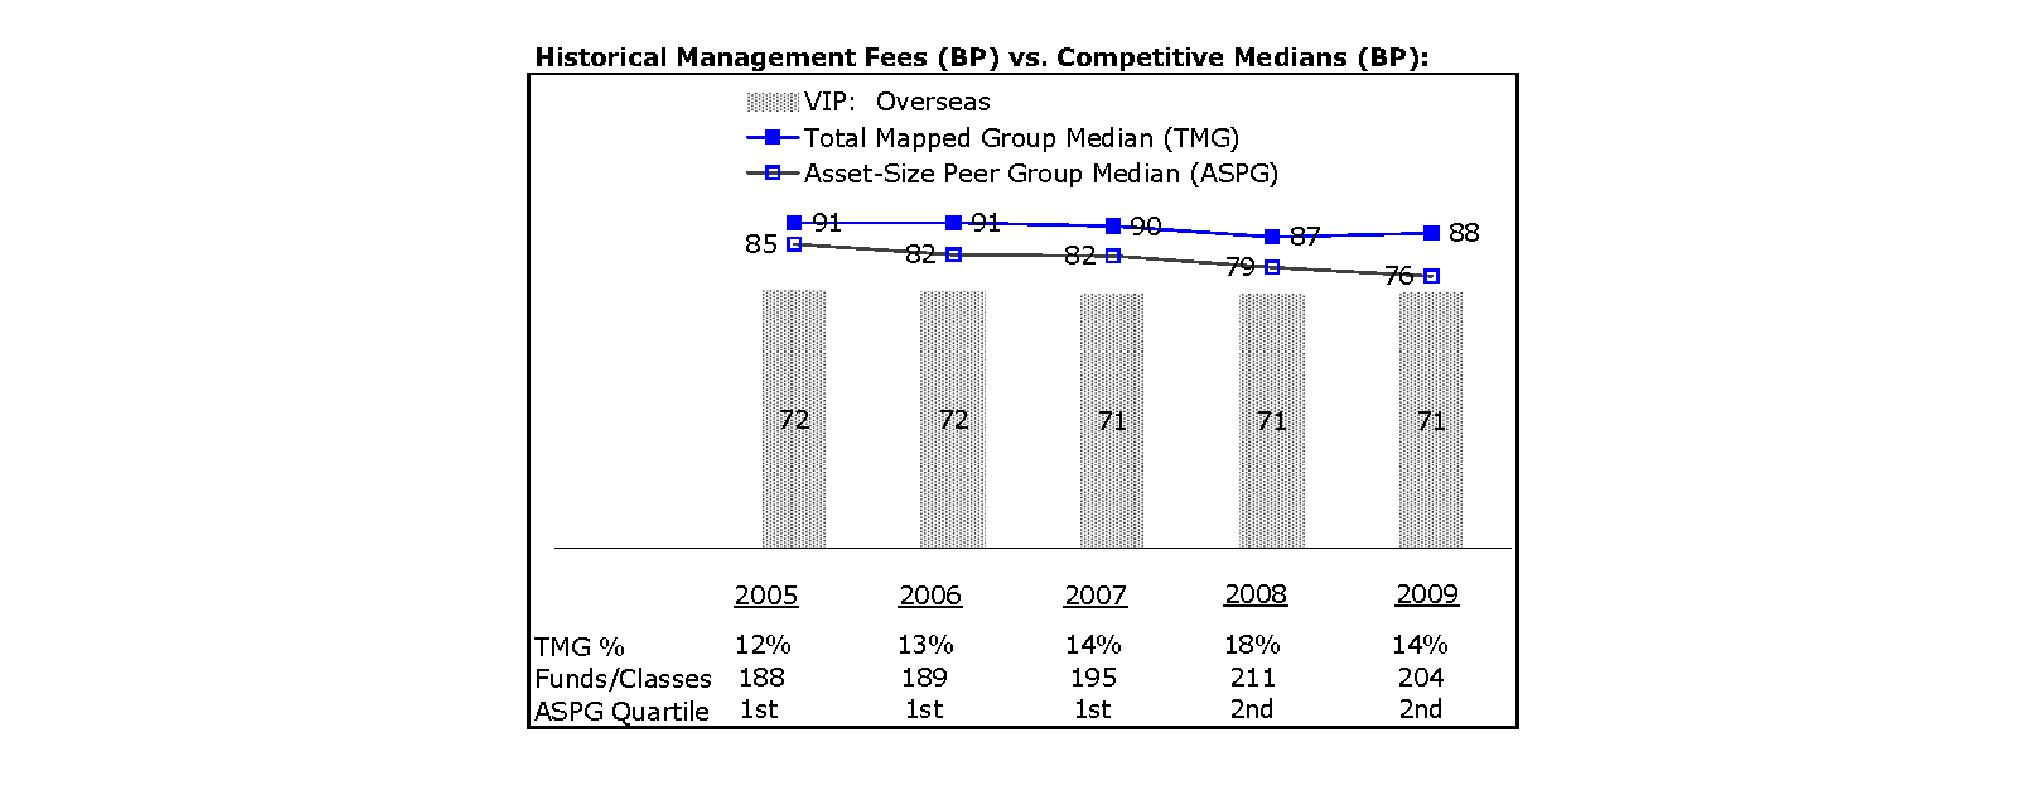
The Board noted that the fund's management fee ranked below the median of its Total Mapped Group and below the median of its ASPG for 2009.
Based on its review, the Board concluded that the fund's management fee is fair and reasonable in light of the services that the fund receives and the other factors considered.
Total Expenses. In its review of each class's total expenses, the Board considered the fund's management fee as well as other fund or class expenses, as applicable, such as transfer agent fees, pricing and bookkeeping fees, fund-paid 12b-1 fees, and custodial, legal, and audit fees. The Board also noted the effects of any waivers and reimbursements on fees and expenses. As part of its review, the Board also considered current and historical total expenses of each class of the fund compared to competitive fund median expenses. Each class of the fund is compared to those funds and classes in the Total Mapped Group (used by the Board for management fee comparisons) that have a similar sales load structure.
The Board noted that the total expenses of each of Initial Class, Initial Class R, Investor Class R, Service Class, and Service Class R ranked below its competitive median for 2009 and the total expenses of each of Service Class 2 and Service Class 2 R ranked above its competitive median for 2009. The Board noted that the fund offers multiple classes, each of which has a different 12b-1 fee structure, and that the multiple structures are intended to offer a range of pricing options for the intermediary market. The Board also noted that the total expenses of the classes vary primarily by the level of their 12b-1 fees, although differences in transfer agent fees may also cause expenses to vary from class to class.
Fees Charged to Other Fidelity Clients. The Board also considered Fidelity fee structures and other information with respect to clients of FMR and its affiliates, such as other mutual funds advised or subadvised by FMR or its affiliates, pension plan clients, and other institutional clients. In March 2010, the Board created an ad hoc joint committee with the board of other Fidelity funds (the Committee) to review and compare Fidelity's institutional investment advisory business with its business of providing services to the Fidelity funds, including the differences in services provided, fees charged, and costs incurred, as well as competition in their respective marketplaces.
Annual Report
Board Approval of Investment Advisory Contracts and Management Fees - continued
Based on its review of total expenses and fees charged to other Fidelity clients, the Board concluded that the total expenses of each class of the fund were reasonable, although in some cases above the median of the universe presented for comparison, in light of the services that the fund and its shareholders receive and the other factors considered, including the findings of the Committee.
Costs of the Services and Profitability. The Board considered the revenues earned and the expenses incurred by Fidelity in conducting the business of developing, marketing, distributing, managing, administering and servicing the fund and its shareholders. The Board also considered the level of Fidelity's profits in respect of all the Fidelity funds.
On an annual basis, FMR presents to the Board Fidelity's profitability for the fund. Fidelity calculates the profitability for each fund, as well as aggregate profitability for groups of Fidelity funds and all Fidelity funds, using a series of detailed revenue and cost allocation methodologies which originate with the audited books and records of Fidelity. The Audit Committee of the Board reviews any significant changes from the prior year's methodologies.
PricewaterhouseCoopers LLP (PwC), independent registered public accounting firm and auditor to Fidelity and certain Fidelity funds, has been engaged annually by the Board as part of the Board's assessment of Fidelity's profitability analysis. PwC's engagement includes the review and assessment of Fidelity's methodologies used in determining the revenues and expenses attributable to Fidelity's mutual fund business, and completion of agreed-upon procedures surrounding the mathematical accuracy of fund profitability and its conformity to allocation methodologies. After considering PwC's reports issued under the engagement and information provided by Fidelity, the Board believes that while other allocation methods may also be reasonable, Fidelity's profitability methodologies are reasonable in all material respects.
The Board has also reviewed Fidelity's non-fund businesses and fall-out benefits related to the mutual fund business as well as cases where Fidelity's affiliates may benefit from or be related to the fund's business.
The Board considered the costs of the services provided by and the profits realized by Fidelity in connection with the operation of the fund and were satisfied that the profitability was not excessive in the circumstances.
Economies of Scale. The Board considered whether there have been economies of scale in respect of the management of the Fidelity funds, whether the Fidelity funds (including the fund) have appropriately benefited from any such economies of scale, and whether there is potential for realization of any further economies of scale. The Board considered the extent to which the fund will benefit from economies of scale through increased services to the fund, through waivers or reimbursements, or through fee or expense reductions.
In February 2009, the Board and the board of other Fidelity funds created an ad hoc committee (the Economies of Scale Committee) to analyze whether FMR attains economies of scale in respect of the management and servicing of the Fidelity funds, whether the Fidelity funds have appropriately benefited from such economies of scale, and whether there is potential for realization of any further economies of scale.
The Board recognized that the fund's management contract incorporates a "group fee" structure, which provides for lower group fee rates as total fund assets under FMR's management increase, and for higher group fee rates as total fund assets under FMR's management decrease. FMR calculates the group fee rates based on a tiered asset "breakpoint" schedule that varies based on asset class. The Board considered that the group fee is designed to deliver the benefits of economies of scale to fund shareholders when total Fidelity fund assets increase, even if assets of any particular fund are unchanged or have declined, because some portion of Fidelity's costs are attributable to services provided to all Fidelity funds, and all funds benefit if those costs can be allocated among more assets. The Board concluded that, given the group fee structure, fund shareholders will benefit from lower management fees as assets under FMR's management increase at the fund complex level, regardless of whether Fidelity achieves any such economies of scale.
The Board concluded, considering the findings of the Economies of Scale Committee, that any potential economies of scale are being appropriately shared between fund shareholders and Fidelity.
Additional Information Requested by the Board. In order to develop fully the factual basis for consideration of the Fidelity funds' Advisory Contracts, the Board requested and received additional information on certain topics, including (i) fund performance trends, actions to be taken by FMR to improve certain funds' overall performance, and Fidelity's long-term strategies for certain funds; (ii) portfolio manager changes that have occurred during the past year and length of portfolio manager tenure for different categories of funds over time; (iii) Fidelity's compensation structure for portfolio managers, research analysts, and other key personnel, the rationale for the compensation structure, and how the compensation structure provides appropriate performance incentives; (iv) the amount of the investment that each portfolio manager has made in the Fidelity fund(s) that he or she manages; (v) management and other fees paid by FMR to affiliated sub-advisers on behalf of the Fidelity funds; (vi) Fidelity's fee structures and rationale for recommending different fees among different categories of funds; (vii) Fidelity's rationale for recommending which funds should have a performance adjustment component as part of their management fees; (viii) the rationale for any differences between fund fee structures and fee structures in place for other Fidelity clients; and (ix) explanations regarding the relative total expenses borne by certain funds and classes, total expense competitive trends, and actions that might be taken by FMR to reduce total expenses for certain funds and classes.
Based on its evaluation of all of the conclusions noted above, and after considering all factors it believed relevant, the Board ultimately concluded that the advisory fee structures are fair and reasonable, and that the fund's Advisory Contracts should be renewed.
Annual Report
Investment Adviser
Fidelity Management & Research Company
Boston, MA
Investment Sub-Advisers
FMR Co., Inc.
Fidelity Management & Research (U.K.) Inc.
Fidelity Management & Research (Japan) Inc.
Fidelity Management & Research (Hong Kong) Limited
FIL Investment Advisors
FIL Investment Advisors (U.K.) Ltd.
FIL Investment (Japan) Limited
General Distributor
Fidelity Distributors Corporation
Boston, MA
Transfer and Service Agents
Fidelity Investments Institutional Operations Company, Inc.
Boston, MA
Fidelity Service Company, Inc.
Boston, MA
Custodian
JPMorgan Chase Bank
New York, NY
VIPOVRS-ANN-0211
1.540205.113
Fidelity® Variable Insurance Products:
Overseas Portfolio - Class R
Annual Report
December 31, 2010
(2_fidelity_logos) (Registered_Trademark)
Contents
Performance | <Click Here> | How the fund has done over time. |
Management's Discussion of Fund Performance | <Click Here> | The Portfolio Manager's review of fund performance and strategy. |
Shareholder Expense Example | <Click Here> | An example of shareholder expenses. |
Investment Changes | <Click Here> | A summary of major shifts in the fund's investments over the past six months. |
Investments | <Click Here> | A complete list of the fund's investments with their market values. |
Financial Statements | <Click Here> | Statements of assets and liabilities, operations, and changes in net assets, as well as financial highlights. |
Notes | <Click Here> | Notes to the financial statements. |
Report of Independent Registered Public Accounting Firm | <Click Here> | |
Trustees and Officers | <Click Here> | |
Distributions | <Click Here> | |
Board Approval of Investment Advisory Contracts and Management Fees | <Click Here> | |
To view a fund's proxy voting guidelines and proxy voting record for the 12-month period ended June 30, visit http://www.fidelity.com/proxyvotingresults or visit the Securities and Exchange Commission's (SEC) web site at http://www.sec.gov. You may also call 1-877-208-0098 to request a free copy of the proxy voting guidelines.
Fidelity Variable Insurance Products are separate account options which are purchased through a variable insurance contract.
Standard & Poor's, S&P and S&P 500 are registered service marks of The McGraw-Hill Companies, Inc. and have been licensed for use by Fidelity Distributors Corporation.
Other third party marks appearing herein are the property of their respective owners.
All other marks appearing herein are registered or unregistered trademarks or service marks of FMR LLC or an affiliated company.
The general research services agreement with Fidelity Research & Analysis Company has been terminated and is no longer in effect for the fund.
This report and the financial statements contained herein are submitted for the general information of the shareholders of the fund. This report is not authorized for distribution to prospective investors in the fund unless preceded or accompanied by an effective prospectus.
A fund files its complete schedule of portfolio holdings with the SEC for the first and third quarters of each fiscal year on Form N-Q. Forms N-Q are available on the SEC's web site at http://www.sec.gov. A fund's Forms N-Q may be reviewed and copied at the SEC's Public Reference Room in Washington, DC. Information regarding the operation of the SEC's Public Reference Room may be obtained by calling 1-800-SEC-0330. For a complete list of a fund's portfolio holdings, view the most recent holdings listing, semiannual report, or annual report on Fidelity's web site at http://www.fidelity.com, http://www.advisor.fidelity.com, or http://www.401k.com, as applicable.
NOT FDIC INSURED • MAY LOSE VALUE • NO BANK GUARANTEE
Neither the fund nor Fidelity Distributors Corporation is a bank.
Annual Report
Average annual total return reflects the change in the value of an investment, assuming reinvestment of the class' distributions from dividend income and capital gains (the profits earned upon the sale of securities that have grown in value, if any) and assuming a constant rate of performance each year. During periods of reimbursement by Fidelity, a fund's total return will be greater than it would be had the reimbursement not occurred. Performance numbers are net of all underlying fund operating expenses, but do not include any insurance charges imposed by your insurance company's separate account. If performance information included the effect of these additional charges, the total returns would be lower. How a fund did yesterday is no guarantee of how it will do tomorrow.
Average Annual Total Returns
Periods ended December 31, 2010 | Past 1
year | Past 5
years | Past 10
years |
VIP Overseas Portfolio - Initial Class R A | 13.07% | 2.19% | 3.10% |
VIP Overseas Portfolio - Service Class R B | 13.01% | 2.10% | 3.01% |
VIP Overseas Portfolio - Service Class 2R C | 12.82% | 1.94% | 2.87% |
VIP Overseas Portfolio - Investor Class R D | 13.07% | 2.09% | 3.05% |
A The initial offering of Initial Class R shares took place on April 24, 2002. Returns prior to April 24, 2002 are those of Initial Class.
B The initial offering of Service Class R shares took place on April 24, 2002. Returns prior to April 24, 2002 are those of Service Class.
C The initial offering of Service Class 2R shares took place on April 24, 2002. Returns from prior to April 24, 2002 are those of Service Class 2.
D The initial offering of Investor Class R shares took place on July 21, 2005. Returns prior to July 21, 2005 are those of Initial Class. If Investor Class R's transfer agent fee had been reflected, returns prior to July 21, 2005 would have been lower.
$10,000 Over 10 Years
Let's say hypothetically that $10,000 was invested in VIP Overseas Portfolio - Initial Class R on December 31, 2000. The chart shows how the value of your investment would have changed, and also shows how the MSCI® EAFE® (Europe, Australasia, Far East) Index performed over the same period. The initial offering of Initial Class R took place on April 24, 2002. See above for additional information regarding the performance of Initial Class R.
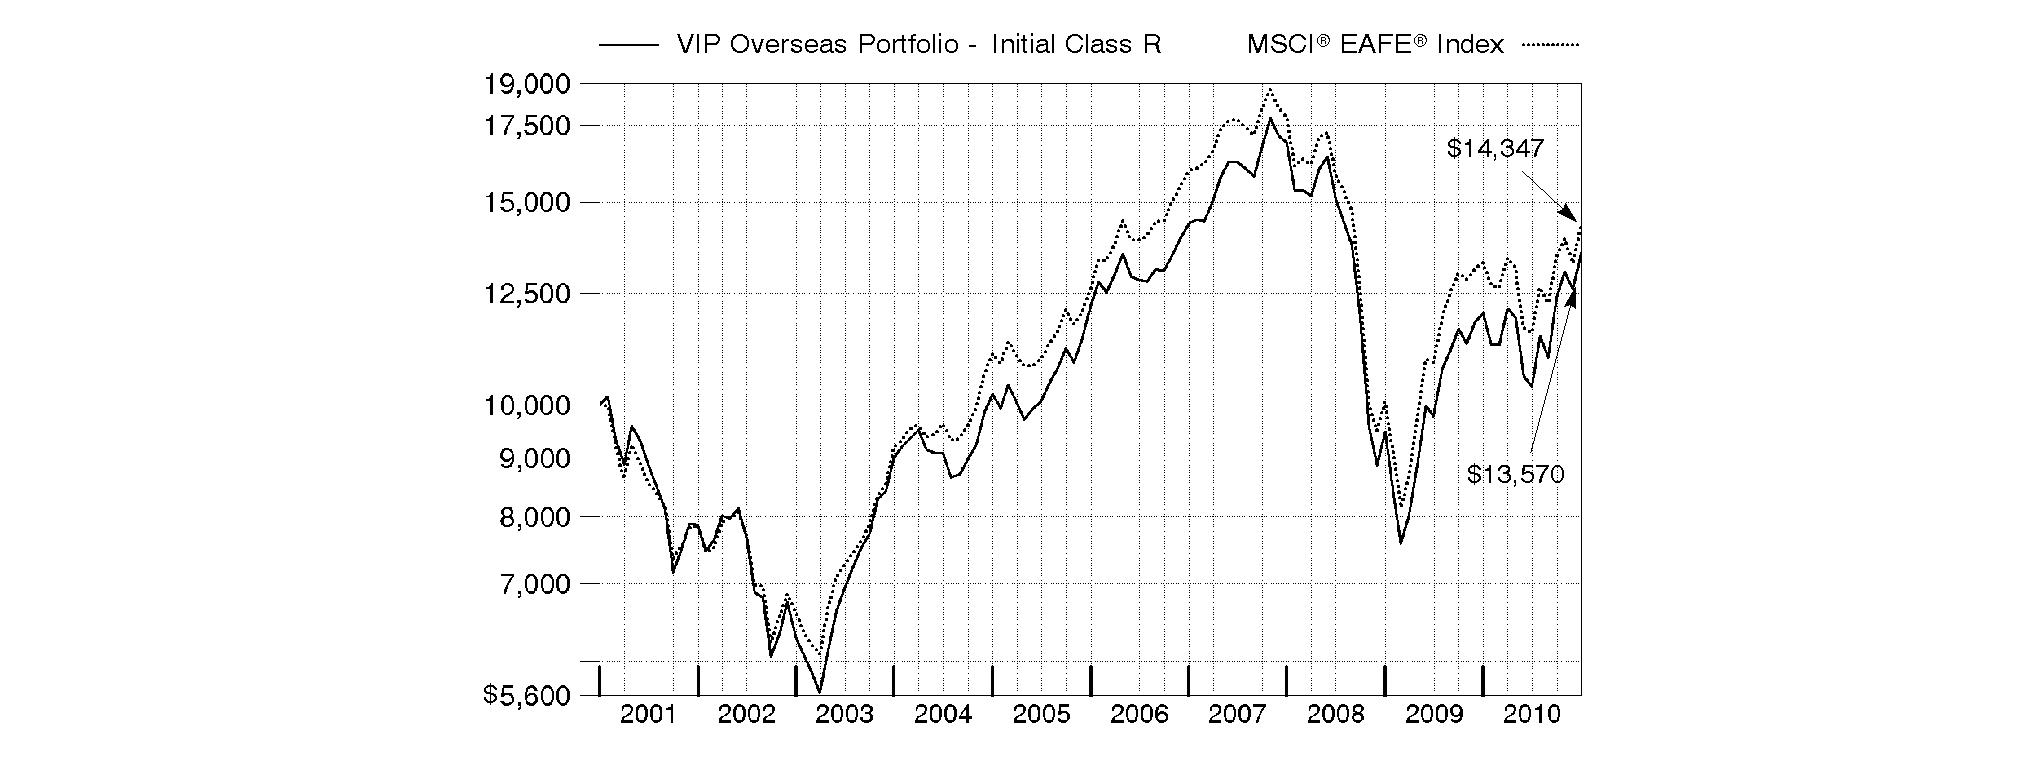
Annual Report
Market Recap: While market improvements around the world hit a speed bump in the first half of the 12-month period ending December 31, 2010, world economies re-accelerated in August, supported by a broadening recovery and low inflation in the U.S. Domestic stock markets recorded solid gains for the year, lifted by a strong second-half rally fueled by economic optimism, encouraging earnings reports and a wave of corporate mergers. The large-cap S&P 500® Index rose 15.06%, the blue-chip-laden Dow Jones Industrial AverageSM added 14.06% and the technology-heavy Nasdaq Composite® Index climbed 18.02%. Meanwhile, international stocks, as represented by the MSCI® ACWI® (All Country World Index) ex USA Index, gained 11.29%, boosted in part by a depreciating U.S. dollar. In the fixed-income arena, U.S. taxable investment-grade bonds generated positive results during 2010, as the Barclays Capital® U.S. Aggregate Bond Index gained 6.54%. With ultra-low interest rates bolstering nearly all fixed-income securities for most of the year, sectors in the index with higher yields and more credit risk generally fared best, while most high-quality bonds generated more-moderate returns. Meanwhile, high-yield bonds, as represented by The BofA Merrill LynchSM US High Yield Constrained Index, returned 15.07%, a result of improved economic data and strengthening investor demand. Overseas, foreign bond markets showed mixed results, with a sizable disparity between the 3.97% return of the Citigroup® Non-U.S. Group of 7 Index - which measures the performance of sovereign debt of the major global economies outside the U.S. - and the 12.04% advance of the JPMorgan Emerging Markets Bond Index Global (EMBI Global), which benefited from the rising overall credit quality of emerging-markets debt issuers.
Comments from Graeme Rockett, Portfolio Manager of VIP Overseas Portfolio: For the 12 months ending December 31, 2010, the fund's share classes substantially outperformed the MSCI® EAFE® (Europe, Australasia, Far East) Index, which rose 7.88%. (For specific portfolio results, please refer to the performance section of this report.) Stock picking was especially effective in consumer discretionary, where an increased overweighting also helped, and in information technology and health care. However, security selection was poor in banking, and the fund was suboptimally positioned in the capital goods and food/beverage/tobacco industries. Contributing stocks included several luxury goods companies: France's LVMH and Switzerland's Swatch Group and Compagnie Financiere Richemont. Three out-of-benchmark investments also helped: Clicks Group, a South African retailer; Deckers Outdoor, a U.S.-based footwear company; and Baidu, a Chinese Internet search provider. Detractors included Scientific Games Corporation, an out-of-benchmark U.S. gaming company; Nestle, a Swiss food giant we underweighted; Intesa Sanpaolo, an Italian bank; and Ireland-based CRH, which supplies building materials. Some of the stocks I've mentioned were sold by period end.
The views expressed above reflect those of the portfolio manager(s) only through the end of the period as stated on the cover of this report and do not necessarily represent the views of Fidelity or any other person in the Fidelity organization. Any such views are subject to change at any time based upon market or other conditions and Fidelity disclaims any responsibility to update such views. These views may not be relied on as investment advice and, because investment decisions for a Fidelity fund are based on numerous factors, may not be relied on as an indication of trading intent on behalf of any Fidelity fund.
Annual Report
As a shareholder of the Fund, you incur two types of costs: (1) transaction costs, including redemption fees, and (2) ongoing costs, including management fees, distribution and/or service (12b-1) fees and other Fund expenses. This Example is intended to help you understand your ongoing costs (in dollars) of investing in the Fund and to compare these costs with the ongoing costs of investing in other mutual funds.
The Example is based on an investment of $1,000 invested at the beginning of the period and held for the entire period (July 1, 2010 to December 31, 2010).
Actual Expenses
The first line of the accompanying table for each class of the Fund provides information about actual account values and actual expenses. You may use the information in this line, together with the amount you invested, to estimate the expenses that you paid over the period. Simply divide your account value by $1,000.00 (for example, an $8,600 account value divided by $1,000.00 = 8.6), then multiply the result by the number in the first line for a class of the Fund under the heading entitled "Expenses Paid During Period" to estimate the expenses you paid on your account during this period. The estimate of expenses does not include any fees or other expenses of any variable annuity or variable life insurance product. If they were, the estimate of expenses you paid during the period would be higher, and your ending account value would be lower. In addition, the Fund, as a shareholder in the underlying Fidelity Central Funds, will indirectly bear its pro-rata share of the fees and expenses incurred by the underlying Fidelity Central Funds. These fees and expenses are not included in the Fund's annualized expense ratio used to calculate the expense estimate in the table below.
Hypothetical Example for Comparison Purposes
The second line of the accompanying table for each class of the Fund provides information about hypothetical account values and hypothetical expenses based on a Class' actual expense ratio and an assumed rate of return of 5% per year before expenses, which is not the Class' actual return. The hypothetical account values and expenses may not be used to estimate the actual ending account balance or expenses you paid for the period. You may use this information to compare the ongoing costs of investing in the Fund and other funds. To do so, compare this 5% hypothetical example with the 5% hypothetical examples that appear in the shareholder reports of the other funds. The estimate of expenses does not include any fees or other expenses of any variable annuity or variable life insurance product. If they were, the estimate of expenses you paid during the period would be higher, and your ending account value would be lower. In addition, the Fund, as a shareholder in the underlying Fidelity Central Funds, will indirectly bear its pro-rata share of the fees and expenses incurred by the underlying Fidelity Central Funds. These fees and expenses are not included in the Fund's annualized expense ratio used to calculate the expense estimate in the table below.
Please note that the expenses shown in the table are meant to highlight your ongoing costs only and do not reflect any transaction costs. Therefore, the second line of the table is useful in comparing ongoing costs only, and will not help you determine the relative total costs of owning different funds. In addition, if these transactional costs were included, your costs would have been higher.
| Annualized
Expense Ratio | Beginning
Account Value
July 1, 2010 | Ending
Account Value
December 31, 2010 | Expenses Paid
During Period*
July 1, 2010 to
December 31, 2010 |
Initial Class | .84% | | | |
Actual | | $ 1,000.00 | $ 1,308.50 | $ 4.89 |
Hypothetical A | | $ 1,000.00 | $ 1,020.97 | $ 4.28 |
Service Class | .94% | | | |
Actual | | $ 1,000.00 | $ 1,307.90 | $ 5.47 |
Hypothetical A | | $ 1,000.00 | $ 1,020.47 | $ 4.79 |
Service Class 2 | 1.09% | | | |
Actual | | $ 1,000.00 | $ 1,307.00 | $ 6.34 |
Hypothetical A | | $ 1,000.00 | $ 1,019.71 | $ 5.55 |
Initial Class R | .84% | | | |
Actual | | $ 1,000.00 | $ 1,308.40 | $ 4.89 |
Hypothetical A | | $ 1,000.00 | $ 1,020.97 | $ 4.28 |
Service Class R | .94% | | | |
Actual | | $ 1,000.00 | $ 1,308.40 | $ 5.47 |
Hypothetical A | | $ 1,000.00 | $ 1,020.47 | $ 4.79 |
Service Class 2R | 1.09% | | | |
Actual | | $ 1,000.00 | $ 1,306.60 | $ 6.34 |
Hypothetical A | | $ 1,000.00 | $ 1,019.71 | $ 5.55 |
Investor Class R | .93% | | | |
Actual | | $ 1,000.00 | $ 1,308.60 | $ 5.41 |
Hypothetical A | | $ 1,000.00 | $ 1,020.52 | $ 4.74 |
A 5% return per year before expenses
* Expenses are equal to each Class' annualized expense ratio, multiplied by the average account value over the period, multiplied by 184/365 (to reflect the one-half year period).
Annual Report
Investment Changes (Unaudited)
Geographic Diversification (% of fund's net assets) |
As of December 31, 2010 |
| Japan | 17.3% | |
| United Kingdom | 16.8% | |
| Germany | 11.1% | |
| France | 10.7% | |
| Switzerland | 6.0% | |
| Cayman Islands | 4.7% | |
| Denmark | 3.2% | |
| United States of America | 3.0% | |
| Italy | 3.0% | |
| Other | 24.2% | |

Percentages are adjusted for the effect of futures contracts, if applicable. |
As of June 30, 2010 |
| Japan | 19.3% | |
| United Kingdom | 17.8% | |
| France | 10.5% | |
| Germany | 7.7% | |
| Switzerland | 7.3% | |
| United States of America | 4.6% | |
| Australia | 3.7% | |
| Cayman Islands | 3.3% | |
| Spain | 3.0% | |
| Other | 22.8% | |

Percentages are adjusted for the effect of futures contracts, if applicable. |
Asset Allocation as of December 31, 2010 |
| % of fund's
net assets | % of fund's net assets
6 months ago |
Stocks | 98.9 | 98.2 |
Short-Term Investments and Net Other Assets | 1.1 | 1.8 |
Top Ten Stocks as of December 31, 2010 |
| % of fund's
net assets | % of fund's net assets
6 months ago |
LVMH Moet Hennessy - Louis Vuitton (France, Textiles, Apparel & Luxury Goods) | 2.8 | 2.4 |
HSBC Holdings PLC (United Kingdom, Commercial Banks) | 2.1 | 2.6 |
The Swatch Group AG (Bearer) (Switzerland, Textiles, Apparel & Luxury Goods) | 2.1 | 2.0 |
Bayerische Motoren Werke AG (BMW) (Germany, Automobiles) | 1.8 | 1.1 |
Novo Nordisk AS Series B (Denmark, Pharmaceuticals) | 1.8 | 1.6 |
Volkswagen AG (Germany, Automobiles) | 1.7 | 0.3 |
BHP Billiton PLC (United Kingdom, Metals & Mining) | 1.6 | 1.2 |
Compagnie Financiere Richemont SA Series A (Switzerland, Textiles, Apparel & Luxury Goods) | 1.5 | 0.9 |
Saipem SpA (Italy, Energy Equipment & Services) | 1.5 | 1.1 |
Signet Jewelers Ltd. (Bermuda, Specialty Retail) | 1.5 | 0.0 |
| 18.4 | |
Market Sectors as of December 31, 2010 |
| % of fund's
net assets | % of fund's net assets
6 months ago |
Consumer Discretionary | 27.4 | 21.9 |
Financials | 21.3 | 24.8 |
Materials | 10.6 | 8.8 |
Industrials | 9.5 | 9.7 |
Information Technology | 8.9 | 9.2 |
Energy | 6.8 | 6.3 |
Health Care | 6.0 | 8.6 |
Consumer Staples | 4.3 | 5.0 |
Telecommunication Services | 3.7 | 3.0 |
Utilities | 0.4 | 0.9 |
Annual Report
Investments December 31, 2010
Showing Percentage of Net Assets
Common Stocks - 96.5% |
| Shares | | Value |
Australia - 2.1% |
AMP Ltd. | 169,593 | | $ 916,615 |
Aristocrat Leisure Ltd. (d) | 1,050,218 | | 3,208,293 |
Australia & New Zealand Banking Group Ltd. | 161,823 | | 3,860,562 |
BHP Billiton Ltd. | 318,002 | | 14,771,546 |
Newcrest Mining Ltd. | 258,132 | | 10,665,381 |
Paladin Energy Ltd. (a) | 546,057 | | 2,750,479 |
Rio Tinto Ltd. | 24,301 | | 2,122,078 |
Westfield Retail Trust unit | 158,772 | | 416,899 |
TOTAL AUSTRALIA | | 38,711,853 |
Austria - 0.5% |
Wienerberger AG (a) | 479,120 | | 9,153,937 |
Bailiwick of Jersey - 1.2% |
Informa PLC | 1,151,821 | | 7,322,830 |
WPP PLC | 1,147,486 | | 14,195,520 |
TOTAL BAILIWICK OF JERSEY | | 21,518,350 |
Belgium - 1.3% |
Ageas | 1,039,800 | | 2,377,264 |
Anheuser-Busch InBev SA NV | 338,997 | | 19,398,629 |
Hamon & Compagnie International SA | 73,974 | | 2,657,530 |
TOTAL BELGIUM | | 24,433,423 |
Bermuda - 2.3% |
Clear Media Ltd. (a) | 2,035,000 | | 1,361,467 |
GOME Electrical Appliances Holdings Ltd. (a) | 25,542,000 | | 9,201,364 |
Huabao International Holdings Ltd. | 2,642,000 | | 4,276,148 |
Signet Jewelers Ltd. (a) | 632,400 | | 27,446,160 |
TOTAL BERMUDA | | 42,285,139 |
Brazil - 0.0% |
Drogasil SA | 66,000 | | 536,893 |
British Virgin Islands - 0.0% |
Mail.ru Group Ltd. GDR unit (a)(e) | 6,600 | | 237,600 |
Canada - 1.3% |
Barrick Gold Corp. | 73,000 | | 3,888,258 |
Suncor Energy, Inc. | 298,000 | | 11,438,323 |
Uranium One, Inc. | 823,300 | | 3,929,518 |
Yamana Gold, Inc. | 288,100 | | 3,688,997 |
TOTAL CANADA | | 22,945,096 |
Cayman Islands - 4.7% |
Ajisen (China) Holdings Ltd. | 2,309,000 | | 3,879,774 |
Bosideng International Holdings Ltd. | 23,660,000 | | 9,436,603 |
China Shanshui Cement Group Ltd. | 5,679,000 | | 4,055,124 |
China ZhengTong Auto Services Holdings Ltd. | 602,000 | | 567,727 |
Ctrip.com International Ltd. sponsored ADR (a) | 102,100 | | 4,129,945 |
Daphne International Holdings Ltd. | 5,048,000 | | 4,728,136 |
E-Commerce China Dangdang, Inc. ADR | 59,800 | | 1,618,786 |
|
| Shares | | Value |
Hengdeli Holdings Ltd. | 29,546,000 | | $ 17,600,255 |
Little Sheep Group Ltd. | 5,448,000 | | 3,441,580 |
Natural Beauty Bio-Technology Ltd. | 8,580,000 | | 2,318,173 |
Noah Holdings Ltd. ADR | 111,200 | | 2,173,960 |
Peak Sport Products Co. Ltd. | 6,502,000 | | 4,266,349 |
Shenguan Holdings Group Ltd. | 2,664,000 | | 3,489,163 |
Silver Base Group Holdings Ltd. | 17,981,000 | | 15,985,682 |
Tencent Holdings Ltd. | 398,400 | | 8,657,415 |
TOTAL CAYMAN ISLANDS | | 86,348,672 |
China - 0.4% |
Baidu.com, Inc. sponsored ADR (a) | 81,700 | | 7,886,501 |
Denmark - 3.2% |
Carlsberg AS Series B | 107,200 | | 10,738,458 |
Danske Bank AS (a) | 96,100 | | 2,464,810 |
Novo Nordisk AS: | | | |
Series B | 51,925 | | 5,852,886 |
Series B sponsored ADR | 236,100 | | 26,577,777 |
Pandora A/S | 134,500 | | 8,105,607 |
William Demant Holding AS (a) | 62,971 | | 4,653,308 |
TOTAL DENMARK | | 58,392,846 |
France - 10.7% |
Alstom SA | 152,257 | | 7,289,756 |
Atos Origin SA (a) | 72,705 | | 3,872,710 |
AXA SA | 209,420 | | 3,485,932 |
AXA SA sponsored ADR | 158,600 | | 2,640,690 |
BNP Paribas SA | 223,399 | | 14,220,367 |
Carrefour SA | 130,903 | | 5,399,284 |
Compagnie Generale de Geophysique SA (a) | 184,500 | | 5,635,186 |
Credit Agricole SA | 315,700 | | 4,011,552 |
Danone | 206,912 | | 13,007,676 |
Iliad Group SA | 28,200 | | 3,069,057 |
Ingenico SA | 115,504 | | 4,184,250 |
Ipsos SA | 113,100 | | 5,371,146 |
Laurent-Perrier Group | 21,000 | | 2,246,160 |
LVMH Moet Hennessy - Louis Vuitton | 312,886 | | 51,496,244 |
Safran SA | 101,400 | | 3,592,653 |
Sanofi-Aventis | 45,238 | | 2,901,744 |
Sanofi-Aventis sponsored ADR | 515,600 | | 16,617,788 |
Schneider Electric SA | 101,394 | | 15,183,143 |
Societe Generale Series A | 180,737 | | 9,718,977 |
Total SA | 212,400 | | 11,318,812 |
Total SA sponsored ADR | 99,300 | | 5,310,564 |
Vallourec SA | 58,136 | | 6,109,408 |
TOTAL FRANCE | | 196,683,099 |
Germany - 8.7% |
Allianz AG | 77,600 | | 9,226,594 |
BASF AG | 146,767 | | 11,714,780 |
Bayerische Motoren Werke AG (BMW) | 428,568 | | 33,720,780 |
Deutsche Bank AG | 91,246 | | 4,770,040 |
Deutsche Bank AG (NY Shares) | 33,900 | | 1,764,495 |
Common Stocks - continued |
| Shares | | Value |
Germany - continued |
Deutsche Boerse AG | 151,220 | | $ 10,472,983 |
Deutsche Lufthansa AG (a) | 209,900 | | 4,589,807 |
Deutsche Post AG | 273,501 | | 4,644,020 |
Fresenius Medical Care AG & Co. KGaA | 272,500 | | 15,750,094 |
HeidelbergCement AG | 51,500 | | 3,229,323 |
Hugo Boss AG | 66,900 | | 4,403,392 |
K&S AG | 37,600 | | 2,833,285 |
Kabel Deutschland Holding AG | 115,800 | | 5,399,508 |
Linde AG | 69,387 | | 10,534,081 |
MAN SE | 64,363 | | 7,657,886 |
Munich Re Group | 23,549 | | 3,571,975 |
Puma AG | 17,183 | | 5,697,470 |
Rheinmetall AG | 35,400 | | 2,847,834 |
SAP AG | 154,842 | | 7,887,605 |
SAP AG sponsored ADR (d) | 129,900 | | 6,574,239 |
Tom Tailor Holding AG | 92,300 | | 1,973,865 |
TOTAL GERMANY | | 159,264,056 |
Hong Kong - 2.8% |
Cathay Pacific Airways Ltd. | 3,106,000 | | 8,571,721 |
China Unicom (Hong Kong) Ltd. sponsored ADR | 415,000 | | 5,913,750 |
Emperor Watch & Jewellery Ltd. | 36,420,000 | | 5,248,041 |
Hang Seng Bank Ltd. | 131,600 | | 2,163,844 |
Henderson Land Development Co. Ltd. | 814,919 | | 5,556,862 |
Henderson Land Development Co. Ltd. warrants 6/1/11 (a) | 123,200 | | 28,531 |
Hong Kong Exchanges and Clearing Ltd. | 242,600 | | 5,502,783 |
I.T Ltd. | 4,802,000 | | 3,638,955 |
Television Broadcasts Ltd. | 1,125,000 | | 6,079,125 |
Wharf Holdings Ltd. | 1,050,000 | | 8,078,482 |
TOTAL HONG KONG | | 50,782,094 |
Ireland - 1.2% |
CRH PLC | 554,756 | | 11,513,244 |
Kingspan Group PLC (United Kingdom) | 980,600 | | 9,603,531 |
TOTAL IRELAND | | 21,116,775 |
Israel - 0.2% |
Teva Pharmaceutical Industries Ltd. sponsored ADR | 59,700 | | 3,112,161 |
Italy - 3.0% |
Bulgari SpA | 646,400 | | 6,987,354 |
Intesa Sanpaolo SpA | 3,187,500 | | 8,651,226 |
Saipem SpA | 558,496 | | 27,508,765 |
Tod's SpA | 43,100 | | 4,258,465 |
UniCredit SpA | 2,558,038 | | 5,294,310 |
Unione di Banche Italiane SCpA | 246,904 | | 2,162,225 |
TOTAL ITALY | | 54,862,345 |
Japan - 17.3% |
Aozora Bank Ltd. | 1,825,000 | | 3,775,165 |
Asahi Glass Co. Ltd. | 421,000 | | 4,919,399 |
|
| Shares | | Value |
Canon, Inc. | 218,000 | | $ 11,194,183 |
Canon, Inc. sponsored ADR | 124,900 | | 6,412,366 |
Denso Corp. | 64,600 | | 2,228,766 |
eAccess Ltd. | 3,575 | | 2,161,331 |
East Japan Railway Co. | 43,300 | | 2,815,046 |
Fanuc Ltd. | 56,200 | | 8,629,120 |
Fuji Media Holdings, Inc. | 1,132 | | 1,789,679 |
Hoya Corp. | 107,800 | | 2,617,516 |
Japan Retail Fund Investment Corp. | 3,506 | | 6,721,470 |
Japan Tobacco, Inc. | 916 | | 3,389,251 |
JFE Holdings, Inc. | 123,900 | | 4,314,341 |
JSR Corp. | 121,600 | | 2,268,349 |
Keyence Corp. | 30,200 | | 8,745,970 |
Konica Minolta Holdings, Inc. | 114,000 | | 1,184,707 |
Mazda Motor Corp. | 4,278,000 | | 12,273,274 |
Mitsubishi Corp. | 422,200 | | 11,426,406 |
Mitsubishi Electric Corp. | 1,084,000 | | 11,371,889 |
Mitsubishi Estate Co. Ltd. | 428,000 | | 7,936,563 |
Mitsubishi UFJ Financial Group, Inc. | 2,944,500 | | 15,872,212 |
Mitsubishi UFJ Financial Group, Inc. sponsored ADR | 675,000 | | 3,651,750 |
Mitsui & Co. Ltd. | 611,300 | | 10,093,619 |
Mizuho Financial Group, Inc. | 1,836,800 | | 3,444,546 |
Mizuho Financial Group, Inc. ADR | 509,700 | | 1,911,375 |
MS&AD Insurance Group Holdings, Inc. | 141,900 | | 3,555,581 |
Murata Manufacturing Co. Ltd. | 64,300 | | 4,504,919 |
Nintendo Co. Ltd. | 10,100 | | 2,963,529 |
NKSJ Holdings, Inc. (a) | 380,000 | | 2,798,005 |
Nomura Holdings, Inc. | 1,041,300 | | 6,605,092 |
NSK Ltd. | 587,000 | | 5,305,153 |
ORIX Corp. | 110,910 | | 10,911,419 |
Rakuten, Inc. | 9,640 | | 8,071,415 |
Ricoh Co. Ltd. | 619,000 | | 9,069,876 |
Shin-Etsu Chemical Co., Ltd. | 121,400 | | 6,577,110 |
SMC Corp. | 66,100 | | 11,321,196 |
SOFTBANK CORP. | 522,300 | | 18,077,760 |
Sony Corp. | 128,400 | | 4,590,768 |
Sony Corp. sponsored ADR | 34,500 | | 1,231,995 |
Sumitomo Corp. | 546,000 | | 7,724,607 |
Sumitomo Mitsui Financial Group, Inc. | 346,200 | | 12,327,900 |
Tokio Marine Holdings, Inc. | 128,400 | | 3,837,060 |
Tokyo Electron Ltd. | 159,500 | | 10,094,564 |
Toshiba Corp. (a) | 1,336,000 | | 7,270,972 |
Toyota Motor Corp. | 412,300 | | 16,226,613 |
Toyota Motor Corp. sponsored ADR (d) | 101,100 | | 7,949,493 |
Yahoo! Japan Corp. | 12,647 | | 4,905,258 |
TOTAL JAPAN | | 317,068,578 |
Korea (South) - 0.5% |
Samsung Electronics Co. Ltd. | 9,803 | | 8,297,034 |
Luxembourg - 0.3% |
ArcelorMittal SA Class A unit (d) | 159,300 | | 6,074,109 |
Common Stocks - continued |
| Shares | | Value |
Netherlands - 1.5% |
AEGON NV (a) | 308,300 | | $ 1,888,302 |
ASML Holding NV | 146,200 | | 5,605,308 |
ING Groep NV: | | | |
(Certificaten Van Aandelen) unit (a) | 574,784 | | 5,610,347 |
sponsored ADR (a) | 174,500 | | 1,708,355 |
Koninklijke Philips Electronics NV | 268,116 | | 8,223,973 |
Koninklijke Philips Electronics NV unit | 138,500 | | 4,251,950 |
TOTAL NETHERLANDS | | 27,288,235 |
Norway - 1.0% |
Aker Solutions ASA | 437,400 | | 7,451,544 |
DnB NOR ASA | 413,200 | | 5,808,730 |
StatoilHydro ASA sponsored ADR (d) | 206,500 | | 4,908,505 |
TOTAL NORWAY | | 18,168,779 |
Russia - 0.2% |
Uralkali JSC GDR (Reg. S) | 85,200 | | 3,128,544 |
Singapore - 0.1% |
United Overseas Bank Ltd. | 176,086 | | 2,497,382 |
South Africa - 1.2% |
Aspen Pharmacare Holdings Ltd. | 640,300 | | 8,892,680 |
Clicks Group Ltd. | 1,178,104 | | 7,707,023 |
Impala Platinum Holdings Ltd. | 121,100 | | 4,258,333 |
Nedbank Group Ltd. | 99,700 | | 1,961,645 |
TOTAL SOUTH AFRICA | | 22,819,681 |
Spain - 2.4% |
Antena 3 Television SA | 391,100 | | 3,634,160 |
Banco Bilbao Vizcaya Argentaria SA | 493,103 | | 5,027,950 |
Banco Santander SA | 1,231,235 | | 13,126,610 |
Banco Santander SA sponsored ADR | 164,500 | | 1,751,925 |
EDP Renovaveis SA (a) | 628,538 | | 3,644,621 |
NH Hoteles SA (a)(d) | 901,900 | | 4,093,828 |
Telefonica SA | 540,906 | | 12,355,294 |
TOTAL SPAIN | | 43,634,388 |
Sweden - 1.3% |
Elekta AB (B Shares) | 472,500 | | 18,199,041 |
Svenska Handelsbanken AB (A Shares) | 98,900 | | 3,163,116 |
Swedbank AB (A Shares) (a) | 181,632 | | 2,535,582 |
TOTAL SWEDEN | | 23,897,739 |
Switzerland - 6.0% |
Compagnie Financiere Richemont SA Series A | 473,964 | | 27,901,124 |
Credit Suisse Group | 71,082 | | 2,864,968 |
Credit Suisse Group sponsored ADR | 117,600 | | 4,752,216 |
GAM Holding Ltd. (a) | 228,269 | | 3,774,758 |
Julius Baer Group Ltd. | 144,820 | | 6,789,164 |
Kuehne & Nagel International AG | 33,380 | | 4,644,547 |
Swiss Reinsurance Co. | 40,826 | | 2,197,953 |
The Swatch Group AG (Bearer) | 86,670 | | 38,664,301 |
|
| Shares | | Value |
UBS AG (a) | 447,317 | | $ 7,349,849 |
UBS AG (NY Shares) (a) | 300,443 | | 4,948,296 |
Zurich Financial Services AG | 25,658 | | 6,651,362 |
TOTAL SWITZERLAND | | 110,538,538 |
Taiwan - 1.5% |
Hon Hai Precision Industry Co. Ltd. (Foxconn) | 645,360 | | 2,599,582 |
HTC Corp. | 684,900 | | 21,131,642 |
Taiwan Semiconductor Manufacturing Co. Ltd. sponsored ADR | 249,667 | | 3,130,824 |
TOTAL TAIWAN | | 26,862,048 |
Turkey - 0.9% |
Boyner Buyuk Magazacilik AS (a) | 2,434,000 | | 6,551,073 |
Dogus Otomotiv Servis ve Ticaret AS | 844,000 | | 3,623,633 |
Turkcell Iletisim Hizmet AS sponsored ADR | 343,200 | | 5,879,016 |
TOTAL TURKEY | | 16,053,722 |
United Kingdom - 16.8% |
Anglo American PLC: | | | |
ADR | 238,400 | | 6,224,624 |
(United Kingdom) | 259,780 | | 13,518,640 |
Aviva PLC | 431,600 | | 2,654,784 |
Barclays PLC | 1,845,252 | | 7,631,395 |
Barclays PLC Sponsored ADR (d) | 669,100 | | 11,053,532 |
BG Group PLC | 582,221 | | 11,772,243 |
BHP Billiton PLC | 706,682 | | 28,450,340 |
BP PLC | 1,586,406 | | 11,701,245 |
BP PLC sponsored ADR | 104,300 | | 4,606,931 |
Burberry Group PLC | 415,700 | | 7,289,751 |
Centrica PLC | 854,600 | | 4,421,237 |
Dunelm Group PLC | 364,200 | | 2,900,695 |
Great Portland Estates PLC | 805,600 | | 4,534,739 |
Hays PLC | 1,754,300 | | 3,527,956 |
Hikma Pharmaceuticals PLC | 223,300 | | 2,827,116 |
HSBC Holdings PLC: | | | |
(United Kingdom) | 1,119,769 | | 11,451,950 |
sponsored ADR | 535,270 | | 27,320,181 |
Imperial Tobacco Group PLC | 387,432 | | 11,895,616 |
InterContinental Hotel Group PLC | 443,064 | | 8,660,652 |
International Personal Finance PLC | 713,300 | | 4,273,363 |
ITV PLC (a) | 3,249,900 | | 3,551,767 |
Johnson Matthey PLC | 248,370 | | 7,897,137 |
Legal & General Group PLC | 1,128,633 | | 1,703,610 |
Lloyds Banking Group PLC (a) | 4,266,744 | | 4,407,554 |
Lloyds Banking Group PLC sponsored ADR | 549,500 | | 2,258,445 |
Man Group PLC | 1,135,453 | | 5,243,572 |
Prudential PLC | 879,018 | | 9,189,513 |
Rio Tinto PLC | 204,415 | | 14,580,888 |
Rio Tinto PLC sponsored ADR | 103,200 | | 7,395,312 |
Royal Bank of Scotland Group PLC (a) | 1,668,800 | | 1,025,533 |
Common Stocks - continued |
| Shares | | Value |
United Kingdom - continued |
Royal Dutch Shell PLC: | | | |
Class A (United Kingdom) | 281,700 | | $ 9,398,585 |
Class B | 178,888 | | 5,927,822 |
Schroders PLC | 235,800 | | 6,824,237 |
Standard Chartered PLC (United Kingdom) | 290,623 | | 7,823,684 |
Sthree PLC | 229,400 | | 1,312,771 |
SuperGroup PLC | 161,400 | | 3,265,952 |
Vodafone Group PLC | 6,973,198 | | 18,318,064 |
Vodafone Group PLC sponsored ADR | 137,000 | | 3,620,910 |
Xstrata PLC | 344,400 | | 8,089,287 |
TOTAL UNITED KINGDOM | | 308,551,633 |
United States of America - 1.9% |
Apple, Inc. (a) | 17,100 | | 5,515,776 |
Deckers Outdoor Corp. (a) | 209,300 | | 16,689,582 |
Google, Inc. Class A (a) | 14,200 | | 8,434,374 |
Philip Morris International, Inc. | 86,700 | | 5,074,551 |
TOTAL UNITED STATES OF AMERICA | | 35,714,283 |
TOTAL COMMON STOCKS (Cost $1,435,750,820) | 1,768,865,533 |
Nonconvertible Preferred Stocks - 2.4% |
| | | |
Germany - 2.4% |
Hugo Boss AG (non-vtg.) | 169,900 | | 12,834,331 |
Volkswagen AG | 191,947 | | 31,155,263 |
TOTAL NONCONVERTIBLE PREFERRED STOCKS (Cost $28,393,566) | 43,989,594 |
Money Market Funds - 2.6% |
| Shares | | Value |
Fidelity Cash Central Fund, 0.19% (b) | 20,163,895 | | $ 20,163,895 |
Fidelity Securities Lending Cash Central Fund, 0.21% (b)(c) | 27,985,568 | | 27,985,568 |
TOTAL MONEY MARKET FUNDS (Cost $48,149,463) | 48,149,463 |
TOTAL INVESTMENT PORTFOLIO - 101.5% (Cost $1,512,293,849) | | 1,861,004,590 |
NET OTHER ASSETS (LIABILITIES) - (1.5)% | | (27,428,200) |
NET ASSETS - 100% | $ 1,833,576,390 |
Legend |
(a) Non-income producing |
(b) Affiliated fund that is available only to investment companies and other accounts managed by Fidelity Investments. The rate quoted is the annualized seven-day yield of the fund at period end. A complete unaudited listing of the fund's holdings as of its most recent quarter end is available upon request. In addition, each Fidelity Central Fund's financial statements, which are not covered by the Fund's Report of Independent Registered Public Accounting Firm, are available on the SEC's website or upon request. |
(c) Investment made with cash collateral received from securities on loan. |
(d) Security or a portion of the security is on loan at period end. |
(e) Security exempt from registration under Rule 144A of the Securities Act of 1933. These securities may be resold in transactions exempt from registration, normally to qualified institutional buyers. At the end of the period, the value of these securities amounted to $237,600 or 0.0% of net assets. |
Affiliated Central Funds |
Information regarding fiscal year to date income earned by the Fund from investments in Fidelity Central Funds is as follows: |
Fund | Income earned |
Fidelity Cash Central Fund | $ 16,477 |
Fidelity Securities Lending Cash Central Fund | 1,148,632 |
Total | $ 1,165,109 |
Other Information |
The following is a summary of the inputs used, as of December 31, 2010, involving the Fund's assets and liabilities carried at fair value. The inputs or methodology used for valuing securities may not be an indication of the risk associated with investing in those securities. For more information on valuation inputs, and their aggregation into the levels used in the table below, please refer to the Security Valuation section in the accompanying Notes to Financial Statements. |
Valuation Inputs at Reporting Date: |
Description | Total | Level 1 | Level 2 | Level 3 |
Investments in Securities: | | | | |
Equities: | | | | |
Japan | $ 317,068,578 | $ 259,135,164 | $ 57,933,414 | $ - |
United Kingdom | 308,551,633 | 184,551,893 | 123,999,740 | - |
Germany | 203,253,650 | 203,253,650 | - | - |
France | 196,683,099 | 176,827,357 | 19,855,742 | - |
Switzerland | 110,538,538 | 100,323,721 | 10,214,817 | - |
Cayman Islands | 86,348,672 | 86,348,672 | - | - |
Denmark | 58,392,846 | 52,539,960 | 5,852,886 | - |
Italy | 54,862,345 | 54,862,345 | - | - |
Hong Kong | 50,782,094 | 50,782,094 | - | - |
Other | 426,373,672 | 339,660,886 | 86,712,786 | - |
Money Market Funds | 48,149,463 | 48,149,463 | - | - |
Total Investments in Securities: | $ 1,861,004,590 | $ 1,556,435,205 | $ 304,569,385 | $ - |
Income Tax Information |
At December 31, 2010, the Fund had a capital loss carryforward of approximately $461,114,094 of which $180,666,624 and $280,447,470 will expire in fiscal 2016 and 2017, respectively. Capital loss carryforwards are only available to offset future capital gains of the Fund to the extent provided by regulations and may be limited. |
See accompanying notes which are an integral part of the financial statements.
Annual Report
Statement of Assets and Liabilities
| December 31, 2010 |
| | |
Assets | | |
Investment in securities, at value (including securities loaned of $27,519,089) - See accompanying schedule: Unaffiliated issuers (cost $1,464,144,386) | $ 1,812,855,127 | |
Fidelity Central Funds (cost $48,149,463) | 48,149,463 | |
Total Investments (cost $1,512,293,849) | | $ 1,861,004,590 |
Receivable for investments sold | | 2,869,512 |
Receivable for fund shares sold | | 541,467 |
Dividends receivable | | 2,049,995 |
Distributions receivable from Fidelity Central Funds | | 25,743 |
Prepaid expenses | | 5,206 |
Other receivables | | 389,495 |
Total assets | | 1,866,886,008 |
| | |
Liabilities | | |
Payable for investments purchased | $ 450,196 | |
Payable for fund shares redeemed | 2,712,905 | |
Accrued management fee | 1,074,552 | |
Distribution and service plan fees payable | 128,189 | |
Other affiliated payables | 180,250 | |
Other payables and accrued expenses | 777,958 | |
Collateral on securities loaned, at value | 27,985,568 | |
Total liabilities | | 33,309,618 |
| | |
Net Assets | | $ 1,833,576,390 |
Net Assets consist of: | | |
Paid in capital | | $ 1,967,196,831 |
Undistributed net investment income | | 26,675 |
Accumulated undistributed net realized gain (loss) on investments and foreign currency transactions | | (482,401,583) |
Net unrealized appreciation (depreciation) on investments and assets and liabilities in foreign currencies | | 348,754,467 |
Net Assets | | $ 1,833,576,390 |
Statement of Assets and Liabilities - continued
| December 31, 2010 |
| | |
Initial Class:
Net Asset Value, offering price and redemption price per share ($779,501,175 ÷ 46,476,097 shares) | | $ 16.77 |
| | |
Service Class:
Net Asset Value, offering price and redemption price per share ($162,393,974 ÷ 9,723,054 shares) | | $ 16.70 |
| | |
Service Class 2:
Net Asset Value, offering price and redemption price per share ($461,032,624 ÷ 27,734,572 shares) | | $ 16.62 |
| | |
Initial Class R:
Net Asset Value, offering price and redemption price per share ($122,655,249 ÷ 7,330,609 shares) | | $ 16.73 |
| | |
Service Class R:
Net Asset Value, offering price and redemption price per share ($60,616,829 ÷ 3,635,151 shares) | | $ 16.68 |
| | |
Service Class 2R:
Net Asset Value, offering price and redemption price per share ($69,392,576 ÷ 4,209,944 shares) | | $ 16.48 |
| | |
Investor Class R:
Net Asset Value, offering price and redemption price per share ($177,983,963 ÷ 10,640,372 shares) | | $ 16.73 |
See accompanying notes which are an integral part of the financial statements.
Annual Report
Statement of Operations
| Year ended December 31, 2010 |
| | |
Investment Income | | |
Dividends | | $ 40,140,121 |
Interest | | 23 |
Income from Fidelity Central Funds | | 1,165,109 |
Income before foreign taxes withheld | | 41,305,253 |
Less foreign taxes withheld | | (3,176,380) |
Total income | | 38,128,873 |
| | |
Expenses | | |
Management fee | $ 12,060,613 | |
Transfer agent fees | 1,443,728 | |
Distribution and service plan fees | 1,443,017 | |
Accounting and security lending fees | 770,096 | |
Custodian fees and expenses | 346,550 | |
Independent trustees' compensation | 9,875 | |
Appreciation in deferred trustee compensation account | 33 | |
Audit | 82,867 | |
Legal | 13,693 | |
Interest | 2,688 | |
Miscellaneous | 27,039 | |
Total expenses before reductions | 16,200,199 | |
Expense reductions | (491,686) | 15,708,513 |
Net investment income (loss) | | 22,420,360 |
Realized and Unrealized Gain (Loss) Net realized gain (loss) on: | | |
Investment securities: | | |
Unaffiliated issuers (net of foreign taxes of $1,318) | 70,397,991 | |
Foreign currency transactions | (478,560) | |
Total net realized gain (loss) | | 69,919,431 |
Change in net unrealized appreciation (depreciation) on: Investment securities | 119,019,938 | |
Assets and liabilities in foreign currencies | 32,134 | |
Total change in net unrealized appreciation (depreciation) | | 119,052,072 |
Net gain (loss) | | 188,971,503 |
Net increase (decrease) in net assets resulting from operations | | $ 211,391,863 |
Statement of Changes in Net Assets
| Year ended
December 31, 2010 | Year ended
December 31, 2009 |
Increase (Decrease) in Net Assets | | |
Operations | | |
Net investment income (loss) | $ 22,420,360 | $ 33,212,492 |
Net realized gain (loss) | 69,919,431 | (285,899,417) |
Change in net unrealized appreciation (depreciation) | 119,052,072 | 627,435,395 |
Net increase (decrease) in net assets resulting from operations | 211,391,863 | 374,748,470 |
Distributions to shareholders from net investment income | (22,348,246) | (32,759,678) |
Distributions to shareholders from net realized gain | (3,258,162) | (5,176,451) |
Total distributions | (25,606,408) | (37,936,129) |
Share transactions - net increase (decrease) | (147,181,149) | (176,347,409) |
Redemption fees | 21,072 | 22,016 |
Total increase (decrease) in net assets | 38,625,378 | 160,486,948 |
| | |
Net Assets | | |
Beginning of period | 1,794,951,012 | 1,634,464,064 |
End of period (including undistributed net investment income of $26,675 and distributions in excess of net investment income of $45,440, respectively) | $ 1,833,576,390 | $ 1,794,951,012 |
See accompanying notes which are an integral part of the financial statements.
Annual Report
Financial Highlights - Initial Class
Years ended December 31, | 2010 | 2009 | 2008 | 2007 | 2006 |
Selected Per-Share Data | | | | | |
Net asset value, beginning of period | $ 15.05 | $ 12.17 | $ 25.33 | $ 23.96 | $ 20.60 |
Income from Investment Operations | | | | | |
Net investment income (loss) C | .21 | .28 | .46 | .45 | .38 |
Net realized and unrealized gain (loss) | 1.76 | 2.93 | (10.67) | 3.42 | 3.30 |
Total from investment operations | 1.97 | 3.21 | (10.21) | 3.87 | 3.68 |
Distributions from net investment income | (.22) | (.29) | (.49) | (.84) | (.19) |
Distributions from net realized gain | (.03) | (.04) | (2.46) | (1.66) | (.13) |
Total distributions | (.25) | (.33) | (2.95) | (2.50) | (.32) |
Redemption fees added to paid in capital C,G | - | - | - | - | - |
Net asset value, end of period | $ 16.77 | $ 15.05 | $ 12.17 | $ 25.33 | $ 23.96 |
Total Return A,B | 13.11% | 26.53% | (43.83)% | 17.41% | 18.09% |
Ratios to Average Net Assets D,F | | | | | |
Expenses before reductions | .86% | .88% | .87% | .85% | .88% |
Expenses net of fee waivers, if any | .85% | .88% | .87% | .85% | .88% |
Expenses net of all reductions | .83% | .84% | .84% | .82% | .81% |
Net investment income (loss) | 1.41% | 2.17% | 2.45% | 1.85% | 1.76% |
Supplemental Data | | | | | |
Net assets, end of period (000 omitted) | $ 779,501 | $ 758,018 | $ 703,357 | $ 1,702,235 | $ 1,624,901 |
Portfolio turnover rate E | 50% | 78% | 77% | 62% | 123% |
A Total returns do not reflect charges attributable to your insurance company's separate account. Inclusion of these charges would reduce the total returns shown.
B Total returns would have been lower had certain expenses not been reduced during the periods shown.
C Calculated based on average shares outstanding during the period.
D Fees and expenses of the underlying Fidelity Central Funds are not included in the Fund's expense ratio. The Fund indirectly bears its proportionate share of the expenses of any underlying Fidelity Central Funds.
E Amount does not include the portfolio activity of any underlying Fidelity Central Funds.
F Expense ratios reflect operating expenses of the class. Expenses before reductions do not reflect amounts reimbursed by the investment adviser or reductions from brokerage service arrangements or reductions from other expense offset arrangements and do not represent the amount paid by the class during periods when reimbursements or reductions occur. Expenses net of fee waivers reflect expenses after reimbursement by the investment adviser but prior to reductions from brokerage service arrangements or other expense offset arrangements. Expenses net of all reductions represent the net expenses paid by the class.
G Amount represents less than $.01 per share.
Financial Highlights - Service Class
Years ended December 31, | 2010 | 2009 | 2008 | 2007 | 2006 |
Selected Per-Share Data | | | | | |
Net asset value, beginning of period | $ 14.99 | $ 12.12 | $ 25.23 | $ 23.86 | $ 20.52 |
Income from Investment Operations | | | | | |
Net investment income (loss) C | .19 | .26 | .44 | .43 | .36 |
Net realized and unrealized gain (loss) | 1.75 | 2.93 | (10.61) | 3.39 | 3.28 |
Total from investment operations | 1.94 | 3.19 | (10.17) | 3.82 | 3.64 |
Distributions from net investment income | (.20) | (.28) | (.48) | (.79) | (.17) |
Distributions from net realized gain | (.03) | (.04) | (2.46) | (1.66) | (.13) |
Total distributions | (.23) | (.32) | (2.94) | (2.45) | (.30) |
Redemption fees added to paid in capital C,G | - | - | - | - | - |
Net asset value, end of period | $ 16.70 | $ 14.99 | $ 12.12 | $ 25.23 | $ 23.86 |
Total Return A,B | 12.99% | 26.44% | (43.89)% | 17.25% | 17.95% |
Ratios to Average Net Assets D,F | | | | | |
Expenses before reductions | .96% | .98% | .97% | .95% | .98% |
Expenses net of fee waivers, if any | .95% | .98% | .97% | .95% | .98% |
Expenses net of all reductions | .93% | .94% | .94% | .92% | .91% |
Net investment income (loss) | 1.31% | 2.07% | 2.35% | 1.75% | 1.66% |
Supplemental Data | | | | | |
Net assets, end of period (000 omitted) | $ 162,394 | $ 171,252 | $ 165,608 | $ 366,777 | $ 362,060 |
Portfolio turnover rate E | 50% | 78% | 77% | 62% | 123% |
A Total returns do not reflect charges attributable to your insurance company's separate account. Inclusion of these charges would reduce the total returns shown.
B Total returns would have been lower had certain expenses not been reduced during the periods shown.
C Calculated based on average shares outstanding during the period.
D Fees and expenses of the underlying Fidelity Central Funds are not included in the Fund's expense ratio. The Fund indirectly bears its proportionate share of the expenses of any underlying Fidelity Central Funds.
E Amount does not include the portfolio activity of any underlying Fidelity Central Funds.
F Expense ratios reflect operating expenses of the class. Expenses before reductions do not reflect amounts reimbursed by the investment adviser or reductions from brokerage service arrangements or reductions from other expense offset arrangements and do not represent the amount paid by the class during periods when reimbursements or reductions occur. Expenses net of fee waivers reflect expenses after reimbursement by the investment adviser but prior to reductions from brokerage service arrangements or other expense offset arrangements. Expenses net of all reductions represent the net expenses paid by the class.
G Amount represents less than $.01 per share.
See accompanying notes which are an integral part of the financial statements.
Annual Report
Financial Highlights - Service Class 2
Years ended December 31, | 2010 | 2009 | 2008 | 2007 | 2006 |
Selected Per-Share Data | | | | | |
Net asset value, beginning of period | $ 14.92 | $ 12.07 | $ 25.12 | $ 23.75 | $ 20.43 |
Income from Investment Operations | | | | | |
Net investment income (loss) C | .17 | .24 | .40 | .39 | .33 |
Net realized and unrealized gain (loss) | 1.74 | 2.91 | (10.54) | 3.37 | 3.27 |
Total from investment operations | 1.91 | 3.15 | (10.14) | 3.76 | 3.60 |
Distributions from net investment income | (.18) | (.26) | (.45) | (.73) | (.15) |
Distributions from net realized gain | (.03) | (.04) | (2.46) | (1.66) | (.13) |
Total distributions | (.21) | (.30) | (2.91) | (2.39) | (.28) |
Redemption fees added to paid in capital C,G | - | - | - | - | - |
Net asset value, end of period | $ 16.62 | $ 14.92 | $ 12.07 | $ 25.12 | $ 23.75 |
Total Return A,B | 12.83% | 26.22% | (43.96)% | 17.05% | 17.83% |
Ratios to Average Net Assets D,F | | | | | |
Expenses before reductions | 1.11% | 1.12% | 1.12% | 1.10% | 1.13% |
Expenses net of fee waivers, if any | 1.10% | 1.12% | 1.12% | 1.10% | 1.13% |
Expenses net of all reductions | 1.08% | 1.09% | 1.09% | 1.07% | 1.06% |
Net investment income (loss) | 1.16% | 1.93% | 2.21% | 1.60% | 1.51% |
Supplemental Data | | | | | |
Net assets, end of period (000 omitted) | $ 461,033 | $ 457,971 | $ 414,492 | $ 821,943 | $ 703,421 |
Portfolio turnover rate E | 50% | 78% | 77% | 62% | 123% |
A Total returns do not reflect charges attributable to your insurance company's separate account. Inclusion of these charges would reduce the total returns shown.
B Total returns would have been lower had certain expenses not been reduced during the periods shown.
C Calculated based on average shares outstanding during the period.
D Fees and expenses of the underlying Fidelity Central Funds are not included in the Fund's expense ratio. The Fund indirectly bears its proportionate share of the expenses of any underlying Fidelity Central Funds.
E Amount does not include the portfolio activity of any underlying Fidelity Central Funds.
F Expense ratios reflect operating expenses of the class. Expenses before reductions do not reflect amounts reimbursed by the investment adviser or reductions from brokerage service arrangements or reductions from other expense offset arrangements and do not represent the amount paid by the class during periods when reimbursements or reductions occur. Expenses net of fee waivers reflect expenses after reimbursement by the investment adviser but prior to reductions from brokerage service arrangements or other expense offset arrangements. Expenses net of all reductions represent the net expenses paid by the class.
G Amount represents less than $.01 per share.
Financial Highlights - Initial Class R
Years ended December 31, | 2010 | 2009 | 2008 | 2007 | 2006 |
Selected Per-Share Data | | | | | |
Net asset value, beginning of period | $ 15.02 | $ 12.14 | $ 25.28 | $ 23.92 | $ 20.57 |
Income from Investment Operations | | | | | |
Net investment income (loss) C | .21 | .28 | .46 | .45 | .38 |
Net realized and unrealized gain (loss) | 1.75 | 2.93 | (10.65) | 3.41 | 3.29 |
Total from investment operations | 1.96 | 3.21 | (10.19) | 3.86 | 3.67 |
Distributions from net investment income | (.22) | (.29) | (.49) | (.84) | (.19) |
Distributions from net realized gain | (.03) | (.04) | (2.46) | (1.66) | (.13) |
Total distributions | (.25) | (.33) | (2.95) | (2.50) | (.32) |
Redemption fees added to paid in capital C,G | - | - | - | - | - |
Net asset value, end of period | $ 16.73 | $ 15.02 | $ 12.14 | $ 25.28 | $ 23.92 |
Total Return A,B | 13.07% | 26.60% | (43.84)% | 17.40% | 18.08% |
Ratios to Average Net Assets D,F | | | | | |
Expenses before reductions | .86% | .88% | .87% | .85% | .88% |
Expenses net of fee waivers, if any | .85% | .88% | .87% | .85% | .88% |
Expenses net of all reductions | .83% | .84% | .84% | .82% | .81% |
Net investment income (loss) | 1.41% | 2.17% | 2.46% | 1.85% | 1.76% |
Supplemental Data | | | | | |
Net assets, end of period (000 omitted) | $ 122,655 | $ 128,689 | $ 118,749 | $ 275,678 | $ 240,693 |
Portfolio turnover rate E | 50% | 78% | 77% | 62% | 123% |
A Total returns do not reflect charges attributable to your insurance company's separate account. Inclusion of these charges would reduce the total returns shown.
B Total returns would have been lower had certain expenses not been reduced during the periods shown.
C Calculated based on average shares outstanding during the period.
D Fees and expenses of the underlying Fidelity Central Funds are not included in the Fund's expense ratio. The Fund indirectly bears its proportionate share of the expenses of any underlying Fidelity Central Funds.
E Amount does not include the portfolio activity of any underlying Fidelity Central Funds.
F Expense ratios reflect operating expenses of the class. Expenses before reductions do not reflect amounts reimbursed by the investment adviser or reductions from brokerage service arrangements or reductions from other expense offset arrangements and do not represent the amount paid by the class during periods when reimbursements or reductions occur. Expenses net of fee waivers reflect expenses after reimbursement by the investment adviser but prior to reductions from brokerage service arrangements or other expense offset arrangements. Expenses net of all reductions represent the net expenses paid by the class.
G Amount represents less than $.01 per share.
See accompanying notes which are an integral part of the financial statements.
Annual Report
Financial Highlights - Service Class R
Years ended December 31, | 2010 | 2009 | 2008 | 2007 | 2006 |
Selected Per-Share Data | | | | | |
Net asset value, beginning of period | $ 14.97 | $ 12.10 | $ 25.19 | $ 23.83 | $ 20.50 |
Income from Investment Operations | | | | | |
Net investment income (loss) C | .19 | .27 | .43 | .43 | .36 |
Net realized and unrealized gain (loss) | 1.75 | 2.92 | (10.58) | 3.38 | 3.27 |
Total from investment operations | 1.94 | 3.19 | (10.15) | 3.81 | 3.63 |
Distributions from net investment income | (.20) | (.28) | (.48) | (.79) | (.17) |
Distributions from net realized gain | (.03) | (.04) | (2.46) | (1.66) | (.13) |
Total distributions | (.23) | (.32) | (2.94) | (2.45) | (.30) |
Redemption fees added to paid in capital C,G | - | - | - | - | - |
Net asset value, end of period | $ 16.68 | $ 14.97 | $ 12.10 | $ 25.19 | $ 23.83 |
Total Return A,B | 13.01% | 26.49% | (43.88)% | 17.23% | 17.95% |
Ratios to Average Net Assets D,F | | | | | |
Expenses before reductions | .96% | .97% | .96% | .94% | .98% |
Expenses net of fee waivers, if any | .95% | .97% | .96% | .94% | .98% |
Expenses net of all reductions | .93% | .94% | .94% | .92% | .91% |
Net investment income (loss) | 1.31% | 2.08% | 2.36% | 1.75% | 1.66% |
Supplemental Data | | | | | |
Net assets, end of period (000 omitted) | $ 60,617 | $ 66,014 | $ 61,825 | $ 135,038 | $ 133,934 |
Portfolio turnover rate E | 50% | 78% | 77% | 62% | 123% |
A Total returns do not reflect charges attributable to your insurance company's separate account. Inclusion of these charges would reduce the total returns shown.
B Total returns would have been lower had certain expenses not been reduced during the periods shown.
C Calculated based on average shares outstanding during the period.
D Fees and expenses of the underlying Fidelity Central Funds are not included in the Fund's expense ratio. The Fund indirectly bears its proportionate share of the expenses of any underlying Fidelity Central Funds.
E Amount does not include the portfolio activity of any underlying Fidelity Central Funds.
F Expense ratios reflect operating expenses of the class. Expenses before reductions do not reflect amounts reimbursed by the investment adviser or reductions from brokerage service arrangements or reductions from other expense offset arrangements and do not represent the amount paid by the class during periods when reimbursements or reductions occur. Expenses net of fee waivers reflect expenses after reimbursement by the investment adviser but prior to reductions from brokerage service arrangements or other expense offset arrangements. Expenses net of all reductions represent the net expenses paid by the class.
G Amount represents less than $.01 per share.
Financial Highlights - Service Class 2R
Years ended December 31, | 2010 | 2009 | 2008 | 2007 | 2006 |
Selected Per-Share Data | | | | | |
Net asset value, beginning of period | $ 14.80 | $ 11.98 | $ 24.95 | $ 23.61 | $ 20.32 |
Income from Investment Operations | | | | | |
Net investment income (loss) C | .17 | .25 | .40 | .39 | .32 |
Net realized and unrealized gain (loss) | 1.73 | 2.87 | (10.46) | 3.35 | 3.26 |
Total from investment operations | 1.90 | 3.12 | (10.06) | 3.74 | 3.58 |
Distributions from net investment income | (.19) | (.26) | (.45) | (.74) | (.16) |
Distributions from net realized gain | (.03) | (.04) | (2.46) | (1.66) | (.13) |
Total distributions | (.22) | (.30) | (2.91) | (2.40) | (.29) |
Redemption fees added to paid in capital C,G | - | - | - | - | - |
Net asset value, end of period | $ 16.48 | $ 14.80 | $ 11.98 | $ 24.95 | $ 23.61 |
Total Return A,B | 12.82% | 26.20% | (43.94)% | 17.06% | 17.81% |
Ratios to Average Net Assets D,F | | | | | |
Expenses before reductions | 1.11% | 1.12% | 1.11% | 1.09% | 1.13% |
Expenses net of fee waivers, if any | 1.10% | 1.12% | 1.11% | 1.09% | 1.13% |
Expenses net of all reductions | 1.08% | 1.09% | 1.09% | 1.07% | 1.06% |
Net investment income (loss) | 1.16% | 1.93% | 2.21% | 1.60% | 1.51% |
Supplemental Data | | | | | |
Net assets, end of period (000 omitted) | $ 69,393 | $ 64,200 | $ 46,323 | $ 95,871 | $ 68,729 |
Portfolio turnover rate E | 50% | 78% | 77% | 62% | 123% |
A Total returns do not reflect charges attributable to your insurance company's separate account. Inclusion of these charges would reduce the total returns shown.
B Total returns would have been lower had certain expenses not been reduced during the periods shown.
C Calculated based on average shares outstanding during the period.
D Fees and expenses of the underlying Fidelity Central Funds are not included in the Fund's expense ratio. The Fund indirectly bears its proportionate share of the expenses of any underlying Fidelity Central Funds.
E Amount does not include the portfolio activity of any underlying Fidelity Central Funds.
F Expense ratios reflect operating expenses of the class. Expenses before reductions do not reflect amounts reimbursed by the investment adviser or reductions from brokerage service arrangements or reductions from other expense offset arrangements and do not represent the amount paid by the class during periods when reimbursements or reductions occur. Expenses net of fee waivers reflect expenses after reimbursement by the investment adviser but prior to reductions from brokerage service arrangements or other expense offset arrangements. Expenses net of all reductions represent the net expenses paid by the class.
G Amount represents less than $.01 per share.
See accompanying notes which are an integral part of the financial statements.
Annual Report
Financial Highlights - Investor Class R
Years ended December 31, | 2010 | 2009 | 2008 | 2007 | 2006 |
Selected Per-Share Data | | | | | |
Net asset value, beginning of period | $ 15.01 | $ 12.14 | $ 25.27 | $ 23.91 | $ 20.59 |
Income from Investment Operations | | | | | |
Net investment income (loss) C | .20 | .27 | .43 | .42 | .36 |
Net realized and unrealized gain (loss) | 1.76 | 2.92 | (10.62) | 3.41 | 3.29 |
Total from investment operations | 1.96 | 3.19 | (10.19) | 3.83 | 3.65 |
Distributions from net investment income | (.21) | (.28) | (.48) | (.81) | (.20) |
Distributions from net realized gain | (.03) | (.04) | (2.46) | (1.66) | (.13) |
Total distributions | (.24) | (.32) | (2.94) | (2.47) | (.33) |
Redemption fees added to paid in capital C,G | - | - | - | - | - |
Net asset value, end of period | $ 16.73 | $ 15.01 | $ 12.14 | $ 25.27 | $ 23.91 |
Total Return A,B | 13.07% | 26.42% | (43.89)% | 17.25% | 17.94% |
Ratios to Average Net Assets D,F | | | | | |
Expenses before reductions | .95% | .97% | .96% | .96% | 1.01% |
Expenses net of fee waivers, if any | .94% | .97% | .96% | .96% | 1.01% |
Expenses net of all reductions | .92% | .94% | .93% | .94% | .93% |
Net investment income (loss) | 1.32% | 2.08% | 2.36% | 1.74% | 1.64% |
Supplemental Data | | | | | |
Net assets, end of period (000 omitted) | $ 177,984 | $ 148,806 | $ 124,111 | $ 229,829 | $ 122,018 |
Portfolio turnover rate E | 50% | 78% | 77% | 62% | 123% |
A Total returns do not reflect charges attributable to your insurance company's separate account. Inclusion of these charges would reduce the total returns shown.
B Total returns would have been lower had certain expenses not been reduced during the periods shown.
C Calculated based on average shares outstanding during the period.
D Fees and expenses of the underlying Fidelity Central Funds are not included in the Fund's expense ratio. The Fund indirectly bears its proportionate share of the expenses of any underlying Fidelity Central Funds.
E Amount does not include the portfolio activity of any underlying Fidelity Central Funds.
F Expense ratios reflect operating expenses of the class. Expenses before reductions do not reflect amounts reimbursed by the investment adviser or reductions from brokerage service arrangements or reductions from other expense offset arrangements and do not represent the amount paid by the class during periods when reimbursements or reductions occur. Expenses net of fee waivers reflect expenses after reimbursement by the investment adviser but prior to reductions from brokerage service arrangements or other expense offset arrangements. Expenses net of all reductions represent the net expenses paid by the class.
G Amount represents less than $.01 per share.
See accompanying notes which are an integral part of the financial statements.
Annual Report
Notes to Financial Statements
For the period ended December 31, 2010
1. Organization.
VIP Overseas Portfolio (the Fund) is a fund of Variable Insurance Products Fund (the Trust) and is authorized to issue an unlimited number of shares. The Trust is registered under the Investment Company Act of 1940, as amended (the 1940 Act), as an open-end management investment company organized as a Massachusetts business trust. Shares of the Fund may only be purchased by insurance companies for the purpose of funding variable annuity or variable life insurance contracts. The Fund offers the following classes of shares: Initial Class shares, Service Class shares, Service Class 2 shares, Initial Class R shares, Service Class R shares, Service Class 2R shares and Investor Class R shares. All classes have equal rights and voting privileges, except for matters affecting a single class. Investment income, realized and unrealized capital gains and losses, the common expenses of the Fund, and certain fund-level expense reductions, if any, are allocated on a pro-rata basis to each class based on the relative net assets of each class to the total net assets of the Fund. Each class differs with respect to transfer agent and distribution and service plan fees incurred. Certain expense reductions may also differ by class.
2. Investments in Fidelity Central Funds.
The Fund may invest in Fidelity Central Funds, which are open-end investment companies available only to other investment companies and accounts managed by Fidelity Management & Research Company (FMR) and its affiliates. The Fund's Schedule of Investments lists each of the Fidelity Central Funds held as of period end, if any, as an investment of the Fund, but does not include the underlying holdings of each Fidelity Central Fund. As an Investing Fund, the Fund indirectly bears its proportionate share of the expenses of the underlying Fidelity Central Funds.
The Money Market Central Funds seek preservation of capital and current income and are managed by Fidelity Investments Money Management, Inc. (FIMM), an affiliate of FMR.
A complete unaudited list of holdings for each Fidelity Central Fund is available upon request or at the Securities and Exchange Commission (the SEC) web site at www.sec.gov. In addition, the financial statements of the Fidelity Central Funds, which are not covered by the Fund's Report of Independent Registered Public Accounting Firm, are available on the SEC web site or upon request.
3. Significant Accounting Policies.
The financial statements have been prepared in conformity with accounting principles generally accepted in the United States of America (GAAP), which require management to make certain estimates and assumptions at the date of the financial statements. Actual results could differ from those estimates. Subsequent events, if any, through the date that the financial statements were issued have been evaluated in the preparation of the financial statements. The following summarizes the significant accounting policies of the Fund:
Security Valuation. Investments are valued as of 4:00 p.m. Eastern time on the last calendar day of the period. The Fund uses independent pricing services approved by the Board of Trustees to value its investments. When current market prices or quotations are not readily available or reliable, valuations may be determined in good faith in accordance with procedures adopted by the Board of Trustees. Factors used in determining value may include market or security specific events. The frequency with which these procedures are used cannot be predicted and they may be utilized to a significant extent. The value used for net asset value (NAV) calculation under these procedures may differ from published prices for the same securities.
The Fund categorizes the inputs to valuation techniques used to value its investments into a disclosure hierarchy consisting of three levels as shown below.
Level 1 - quoted prices in active markets for identical investments
Level 2 - other significant observable inputs (including quoted prices for similar investments, interest rates, prepayment speeds, etc.)
Level 3 - unobservable inputs (including the Fund's own assumptions based on the best information available)
Changes in valuation techniques may result in transfers in or out of an assigned level within the disclosure hierarchy. Valuation techniques used to value the Fund's investments by major category are as follows.
Equity securities, including restricted securities, for which market quotations are readily available, are valued at the last reported sale price or official closing price as reported by an independent pricing service on the primary market or exchange on which they are traded and are categorized as Level 1 in the hierarchy. In the event there were no sales during the day or closing prices are not available, securities are valued at the last quoted bid price or may be valued using the last available price and are generally categorized as Level 2 in the hierarchy. For foreign equity securities, when significant market or security specific events arise, comparisons to the valuation of American Depositary Receipts (ADRs), futures contracts, Exchange-traded funds (ETFs) and certain indexes as well as quoted prices for similar securities are used and are categorized as Level 2 in the hierarchy in these circumstances. Utilizing these techniques may result in significant transfers between Level 1 and Level 2. For restricted equity securities and private placements where observable inputs are limited, assumptions about market activity and risk are used and are categorized as Level 3 in the hierarchy.
Annual Report
Notes to Financial Statements - continued
3. Significant Accounting Policies - continued
Security Valuation - continued
Investments in open-end mutual funds, including the Fidelity Central Funds, are valued at their closing net asset value each business day and are categorized as Level 1 in the hierarchy.
Foreign Currency. The Fund uses foreign currency contracts to facilitate transactions in foreign-denominated securities. Gains and losses from these transactions may arise from changes in the value of the foreign currency or if the counterparties do not perform under the contracts' terms.
Foreign-denominated assets, including investment securities, and liabilities are translated into U.S. dollars at the exchange rate at period end. Purchases and sales of investment securities, income and dividends received and expenses denominated in foreign currencies are translated into U.S. dollars at the exchange rate in effect on the transaction date.
The effects of exchange rate fluctuations on investments are included with the net realized and unrealized gain (loss) on investment securities. Other foreign currency transactions resulting in realized and unrealized gain (loss) are disclosed separately.
Investment Transactions and Income. For financial reporting purposes, the Fund's investment holdings and NAV include trades executed through the end of the last business day of the period. The NAV per share for processing shareholder transactions is calculated as of the close of business of the New York Stock Exchange (NYSE), normally 4:00 p.m. Eastern time and includes trades executed through the end of the prior business day. Gains and losses on securities sold are determined on the basis of identified cost and may include proceeds received from litigation. Dividend income is recorded on the ex-dividend date, except for certain dividends from foreign securities where the ex-dividend date may have passed, which are recorded as soon as the Fund is informed of the ex-dividend date. Non-cash dividends included in dividend income, if any, are recorded at the fair market value of the securities received. Interest income and distributions from the Fidelity Central Funds are accrued as earned. Interest income includes coupon interest and amortization of premium and accretion of discount on debt securities. Investment income is recorded net of foreign taxes withheld where recovery of such taxes is uncertain.
Expenses. Expenses directly attributable to a fund are charged to that fund. Expenses attributable to more than one fund are allocated among the respective funds on the basis of relative net assets or other appropriate methods. Expense estimates are accrued in the period to which they relate and adjustments are made when actual amounts are known.
Deferred Trustee Compensation. Under a Deferred Compensation Plan (the Plan), independent Trustees may elect to defer receipt of a portion of their annual compensation. Deferred amounts are invested in a cross-section of Fidelity funds, are marked-to-market and remain in the Fund until distributed in accordance with the Plan. The investment of deferred amounts and the offsetting payable to the Trustees are included in the accompanying Statement of Assets and Liabilities.
Income Tax Information and Distributions to Shareholders. Each year the Fund intends to qualify as a regulated investment company, including distributing substantially all of its taxable income and realized gains under Subchapter M of the Internal Revenue Code and filing its U.S. federal tax return. As a result, no provision for income taxes is required. As of December 31, 2010, the Fund did not have any unrecognized tax benefits in the accompanying financial statements. A fund's federal tax return is subject to examination by the Internal Revenue Service (IRS) for a period of three years. Foreign taxes are provided for based on the Fund's understanding of the tax rules and rates that exist in the foreign markets in which it invests.
Distributions are declared and recorded on the ex-dividend date. Income dividends and capital gain distributions are declared separately for each class. Income and capital gain distributions are determined in accordance with income tax regulations, which may differ from GAAP.
Capital accounts within the financial statements are adjusted for permanent book-tax differences. These adjustments have no impact on net assets or the results of operations. Temporary book-tax differences will reverse in a subsequent period.
Book-tax differences are primarily due to certain foreign taxes, foreign currency transactions, passive foreign investment companies (PFIC), deferred trustees compensation, capital loss carryforwards and losses deferred due to wash sales.
The federal tax cost of investment securities and unrealized appreciation (depreciation) as of period end were as follows:
Gross unrealized appreciation | $ 467,323,274 |
Gross unrealized depreciation | (142,922,059) |
Net unrealized appreciation (depreciation) | $ 324,401,215 |
Tax Cost | $ 1,536,603,375 |
Annual Report
3. Significant Accounting Policies - continued
Income Tax Information and Distributions to Shareholders - continued
The tax-based components of distributable earnings as of period end were as follows:
Undistributed ordinary income | $ 3,095,129 |
Capital loss carryforward | $ (461,114,094) |
Net unrealized appreciation (depreciation) | $ 324,444,941 |
The tax character of distributions paid was as follows:
| December 31, 2010 | December 31, 2009 |
Ordinary Income | $ 25,606,408 | $ 37,936,129 |
Trading (Redemption) Fees. Initial Class R shares, Service Class R shares, Service Class 2 R shares and Investor Class R shares held by investors less than 60 days are subject to a redemption fee equal to 1% of the net asset value of shares redeemed. All redemption fees, which reduce the proceeds of the shareholder redemption, are retained by the Fund and accounted for as an addition to paid in capital.
4. Operating Policies.
Restricted Securities. The Fund may invest in securities that are subject to legal or contractual restrictions on resale. These securities generally may be resold in transactions exempt from registration or to the public if the securities are registered. Disposal of these securities may involve time-consuming negotiations and expense, and prompt sale at an acceptable price may be difficult. Information regarding restricted securities is included at the end of the Fund's Schedule of Investments.
5. Purchases and Sales of Investments.
Purchases and sales of securities other than short-term securities, aggregated $833,549,159 and $998,122,373, respectively.
6. Fees and Other Transactions with Affiliates.
Management Fee. FMR and its affiliates provide the Fund with investment management related services for which the Fund pays a monthly management fee. The management fee is the sum of an individual fund fee rate that is based on an annual rate of .45% of the Fund's average net assets and a group fee rate that averaged .26% during the period. The group fee rate is based upon the average net assets of all the mutual funds advised by FMR. The group fee rate decreases as assets under management increase and increases as assets under management decrease. For the period, the total annual management fee rate was .71% of the Fund's average net assets.
Distribution and Service Plan Fees. In accordance with Rule 12b-1 of the 1940 Act, the Fund has adopted separate 12b-1 Plans for each Service Class of shares. Each Service Class pays Fidelity Distributors Corporation (FDC), an affiliate of FMR, a service fee. For the period, the service fee is based on an annual rate of .10% of Service Class' and Service Class R's average net assets and .25% of Service Class 2's and Service Class 2R's average net assets.
For the period, total fees, all of which were re-allowed to insurance companies for the distribution of shares and providing shareholder support services were as follows:
Service Class | $ 156,474 |
Service Class 2 | 1,076,469 |
Service Class R | 58,951 |
Service Class 2 R | 151,123 |
| $ 1,443,017 |
Annual Report
Notes to Financial Statements - continued
6. Fees and Other Transactions with Affiliates - continued
Transfer Agent Fees. Fidelity Investments Institutional Operations Company, Inc. (FIIOC), an affiliate of FMR, is the Fund's transfer, dividend disbursing, and shareholder servicing agent. FIIOC receives an asset-based fee with respect to each class. Each class (with the exception of Investor R Class) pays a transfer agent fee, excluding out of pocket expenses, equal to an annual rate of .07% of average net assets. Investor Class R pays a monthly asset-based transfer agent fee of .15% of average net assets. In addition, FIIOC receives an asset-based fee of .01% of average net assets for typesetting, printing and mailing of shareholder reports, except proxy statements. FIIOC has agreed to voluntarily waive this fee until December 31, 2010. (See Note 9: Expense Reductions.) For the period, transfer agent fees for each class, including printing and out of pocket expenses, were as follows:
Initial Class | $ 565,513 |
Service Class | 120,653 |
Service Class 2 | 328,709 |
Initial Class R | 89,684 |
Service Class R | 43,930 |
Service Class 2R | 45,029 |
Investor Class R | 250,210 |
| $ 1,443,728 |
Accounting and Security Lending Fees. Fidelity Service Company, Inc. (FSC), an affiliate of FMR, maintains the Fund's accounting records. The accounting fee is based on the level of average net assets for the month. Under a separate contract, FSC administers the security lending program. The security lending fee is based on the number and duration of lending transactions.
Brokerage Commissions. The Fund placed a portion of its portfolio transactions with brokerage firms which are affiliates of the investment adviser. The commissions paid to these affiliated firms were $1,146 for the period.
Interfund Lending Program. Pursuant to an Exemptive Order issued by the SEC, the Fund, along with other registered investment companies having management contracts with FMR, may participate in an interfund lending program. This program provides an alternative credit facility allowing the funds to borrow from, or lend money to, other participating affiliated funds. At period end, there were no interfund loans outstanding. The Fund's activity in this program during the period for which loans were outstanding was as follows:
Borrower or Lender | Average Daily
Loan Balance | Weighted Average Interest Rate | Interest
Expense |
Borrower | $ 6,327,394 | .46% | $ 2,688 |
7. Committed Line of Credit.
The Fund participates with other funds managed by FMR or an affiliate in a $3.75 billion credit facility (the "line of credit") to be utilized for temporary or emergency purposes to fund shareholder redemptions or for other short-term liquidity purposes. The Fund has agreed to pay commitment fees on its pro-rata portion of the line of credit, which amounted to $6,726 and is reflected in Miscellaneous expenses on the Statement of Operations. During the period, there were no borrowings on this line of credit.
8. Security Lending.
The Fund lends portfolio securities through a lending agent from time to time in order to earn additional income. The lending agent may loan securities to certain qualified borrowers, including Fidelity Capital Markets (FCM), a broker-dealer affiliated with the Fund. On the settlement date of the loan, the Fund receives collateral (in the form of U.S. Treasury obligations, letters of credit and/or cash) against the loaned securities and maintains collateral in an amount not less than 100% of the market value of the loaned securities during the period of the loan. The market value of the loaned securities is determined at the close of business of the Fund and any additional required collateral is delivered to the Fund on the next business day. If the borrower defaults on its obligation to return the securities loaned because of insolvency or other reasons, a fund could experience delays and costs in recovering the securities loaned or in gaining access to the collateral. Any cash collateral received is invested in the Fidelity Securities Lending Cash Central Fund. The value of loaned securities and cash collateral at period end are disclosed on the Fund's Statement of Assets and Liabilities. Security lending income represents the income earned on investing cash collateral, less rebates paid to borrowers and lending agent fees associated with the loan, plus any premium payments received for lending certain types of securities. Security lending income is presented in the Statement of Operations as a component of income from Fidelity Central Funds. Total security lending income during the period amounted to $1,148,632. During the period, there were no securities loaned to FCM.
Annual Report
9. Expense Reductions.
FMR or its affiliates agreed to waive certain fees during the period as noted in the table below.
Initial Class | $ 52,562 |
Service Class | 11,339 |
Service Class 2 | 31,214 |
Initial Class R | 8,436 |
Service Class R | 4,270 |
Service Class 2R | 4,382 |
Investor Class R | 11,149 |
| $ 123,352 |
Many of the brokers with whom FMR places trades on behalf of the Fund provided services to the Fund in addition to trade execution. These services included payments of certain expenses on behalf of the Fund totaling $368,334 for the period.
10. Distributions to Shareholders.
Distributions to shareholders of each class were as follows:
Years ended December 31, | 2010 | 2009 |
From net investment income | | |
Initial Class | $ 10,110,257 | $ 14,372,278 |
Service Class | 1,970,639 | 3,138,360 |
Service Class 2 | 4,977,207 | 7,783,553 |
Initial Class R | 1,595,066 | 2,454,887 |
Service Class R | 737,292 | 1,206,143 |
Service Class 2R | 764,839 | 1,088,142 |
Investor Class R | 2,192,946 | 2,716,315 |
Total | $ 22,348,246 | $ 32,759,678 |
From net realized gain | | |
Initial Class | $ 1,378,672 | $ 2,196,333 |
Service Class | 289,800 | 510,078 |
Service Class 2 | 824,951 | 1,322,412 |
Initial Class R | 217,509 | 370,967 |
Service Class R | 108,425 | 192,822 |
Service Class 2R | 124,028 | 169,786 |
Investor Class R | 314,777 | 414,053 |
Total | $ 3,258,162 | $ 5,176,451 |
11. Share Transactions.
Transactions for each class of shares were as follows:
| Shares | Dollars |
Years ended December 31, | 2010 | 2009 | 2010 | 2009 |
Initial Class | | | | |
Shares sold | 6,240,893 | 5,347,946 | $ 91,816,123 | $ 70,803,136 |
Reinvestment of distributions | 695,035 | 1,154,164 | 11,488,929 | 16,568,611 |
Shares redeemed | (10,822,191) | (13,947,134) | (162,039,161) | (175,327,331) |
Net increase (decrease) | (3,886,263) | (7,445,024) | $ (58,734,109) | $ (87,955,584) |
Service Class | | | | |
Shares sold | 784,984 | 959,799 | $ 11,710,566 | $ 12,824,467 |
Reinvestment of distributions | 137,329 | 255,575 | 2,260,439 | 3,648,438 |
Shares redeemed | (2,623,870) | (3,455,536) | (38,868,573) | (43,871,038) |
Net increase (decrease) | (1,701,557) | (2,240,162) | $ (24,897,568) | $ (27,398,133) |
Service Class 2 | | | | |
Shares sold | 2,715,745 | 2,952,474 | $ 39,743,530 | $ 36,740,955 |
Reinvestment of distributions | 354,006 | 640,998 | 5,802,158 | 9,105,965 |
Shares redeemed | (6,027,184) | (7,248,281) | (88,461,595) | (89,623,254) |
Net increase (decrease) | (2,957,433) | (3,654,809) | $ (42,915,907) | $ (43,776,334) |
Annual Report
Notes to Financial Statements - continued
11. Share Transactions - continued
| Shares | Dollars |
Years ended December 31, | 2010 | 2009 | 2010 | 2009 |
Initial Class R | | | | |
Shares sold | 408,250 | 612,315 | $ 6,248,778 | $ 8,157,631 |
Reinvestment of distributions | 109,920 | 197,166 | 1,812,575 | 2,825,854 |
Shares redeemed | (1,757,857) | (2,020,970) | (26,056,661) | (24,694,123) |
Net increase (decrease) | (1,239,687) | (1,211,489) | $ (17,995,308) | $ (13,710,638) |
Service Class R | | | | |
Shares sold | 220,630 | 305,936 | $ 3,280,664 | $ 4,003,822 |
Reinvestment of distributions | 51,443 | 98,069 | 845,717 | 1,398,965 |
Shares redeemed | (1,047,945) | (1,102,231) | (15,463,802) | (13,550,063) |
Net increase (decrease) | (775,872) | (698,226) | $ (11,337,421) | $ (8,147,276) |
Service Class 2R | | | | |
Shares sold | 861,942 | 1,006,368 | $ 12,744,208 | $ 12,396,135 |
Reinvestment of distributions | 54,700 | 88,897 | 888,867 | 1,257,928 |
Shares redeemed | (1,044,322) | (625,865) | (15,533,067) | (7,643,458) |
Net increase (decrease) | (127,680) | 469,400 | $ (1,899,992) | $ 6,010,605 |
Investor Class R | | | | |
Shares sold | 2,450,123 | 1,131,791 | $ 36,039,937 | $ 15,649,216 |
Reinvestment of distributions | 152,075 | 218,381 | 2,507,723 | 3,130,368 |
Shares redeemed | (1,872,670) | (1,661,407) | (27,948,504) | (20,149,633) |
Net increase (decrease) | 729,528 | (311,235) | $ 10,599,156 | $ (1,370,049) |
12. Other.
The Fund's organizational documents provide former and current trustees and officers with a limited indemnification against liabilities arising in connection with the performance of their duties to the Fund. In the normal course of business, the Fund may also enter into contracts that provide general indemnifications. The Fund's maximum exposure under these arrangements is unknown as this would be dependent on future claims that may be made against the Fund. The risk of material loss from such claims is considered remote.
At the end of the period, FMR or its affiliates were the owners of record of 16% of the total outstanding shares of the Fund and two otherwise unaffiliated shareholders were the owners of record of 32% of the total outstanding shares of the Fund.
Annual Report
Report of Independent Registered Public Accounting Firm
To the Trustees of Variable Insurance Products Fund and the Shareholders of VIP Overseas Portfolio:
In our opinion, the accompanying statement of assets and liabilities, including the schedule of investments, and the related statements of operations and of changes in net assets and the financial highlights present fairly, in all material respects, the financial position of VIP Overseas Portfolio (a fund of Variable Insurance Products Fund) at December 31, 2010, the results of its operations for the year then ended, the changes in its net assets for each of the two years in the period then ended and the financial highlights for each of the five years in the period then ended, in conformity with accounting principles generally accepted in the United States of America. These financial statements and financial highlights (hereafter referred to as "financial statements") are the responsibility of the VIP Overseas Portfolio's management. Our responsibility is to express an opinion on these financial statements based on our audits. We conducted our audits of these financial statements in accordance with the standards of the Public Company Accounting Oversight Board (United States). Those standards require that we plan and perform the audit to obtain reasonable assurance about whether the financial statements are free of material misstatement. An audit includes examining, on a test basis, evidence supporting the amounts and disclosures in the financial statements, assessing the accounting principles used and significant estimates made by management, and evaluating the overall financial statement presentation. We believe that our audits, which included confirmation of securities at December 31, 2010 by correspondence with the custodian and brokers, provide a reasonable basis for our opinion.
/s/ PricewaterhouseCoopers LLP
PricewaterhouseCoopers LLP
Boston, Massachusetts
February 14, 2011
Annual Report
The Trustees, Members of the Advisory Board, and executive officers of the trust and fund, as applicable, are listed below. The Board of Trustees governs the fund and is responsible for protecting the interests of shareholders. The Trustees are experienced executives who meet periodically throughout the year to oversee the fund's activities, review contractual arrangements with companies that provide services to the fund, oversee management of the risks associated with such activities and contractual arrangements, and review the fund's performance. Except for James C. Curvey, each of the Trustees oversees 219 funds advised by FMR or an affiliate. Mr. Curvey oversees 408 funds advised by FMR or an affiliate.
The Trustees hold office without limit in time except that (a) any Trustee may resign; (b) any Trustee may be removed by written instrument, signed by at least two-thirds of the number of Trustees prior to such removal; (c) any Trustee who requests to be retired or who has become incapacitated by illness or injury may be retired by written instrument signed by a majority of the other Trustees; and (d) any Trustee may be removed at any special meeting of shareholders by a two-thirds vote of the outstanding voting securities of the trust. Each Trustee who is not an interested person (as defined in the 1940 Act) (Independent Trustee), shall retire not later than the last day of the calendar year in which his or her 72nd birthday occurs. The Independent Trustees may waive this mandatory retirement age policy with respect to individual Trustees. The executive officers and Advisory Board Members hold office without limit in time, except that any officer and Advisory Board Member may resign or may be removed by a vote of a majority of the Trustees at any regular meeting or any special meeting of the Trustees. Except as indicated, each individual has held the office shown or other offices in the same company for the past five years.
Experience, Skills, Attributes, and Qualifications of the Fund's Trustees. The Governance and Nominating Committee has adopted a statement of policy that describes the experience, qualifications, attributes, and skills that are necessary and desirable for potential Independent Trustee candidates (Statement of Policy). The Board believes that each Trustee satisfied at the time he or she was initially elected or appointed a Trustee, and continues to satisfy, the standards contemplated by the Statement of Policy. The Governance and Nominating Committee also engages professional search firms to help identify potential Independent Trustee candidates who have the experience, qualifications, attributes, and skills consistent with the Statement of Policy. From time to time, additional criteria based on the composition and skills of the current Independent Trustees, as well as experience or skills that may be appropriate in light of future changes to board composition, business conditions, and regulatory or other developments, have also been considered by the professional search firms and the Governance and Nominating Committee. In addition, the Board takes into account the Trustees' commitment and participation in Board and committee meetings, as well as their leadership of standing and ad hoc committees throughout their tenure.
In determining that a particular Trustee was and continues to be qualified to serve as a Trustee, the Board has considered a variety of criteria, none of which, in isolation, was controlling. The Board believes that, collectively, the Trustees have balanced and diverse experience, qualifications, attributes, and skills, which allow the Board to operate effectively in governing the fund and protecting the interests of shareholders. Information about the specific experience, skills, attributes, and qualifications of each Trustee, which in each case led to the Board's conclusion that the Trustee should serve (or continue to serve) as a trustee of the fund, is provided below.
Board Structure and Oversight Function. James C. Curvey is an interested person (as defined in the 1940 Act) and currently serves as Acting Chairman. The Trustees have determined that an interested Chairman is appropriate and benefits shareholders because an interested Chairman has a personal and professional stake in the quality and continuity of services provided to the fund. Independent Trustees exercise their informed business judgment to appoint an individual of their choosing to serve as Chairman, regardless of whether the Trustee happens to be independent or a member of management. The Independent Trustees have determined that they can act independently and effectively without having an Independent Trustee serve as Chairman and that a key structural component for assuring that they are in a position to do so is for the Independent Trustees to constitute a substantial majority for the Board. The Independent Trustees also regularly meet in executive session. Ned C. Lautenbach serves as Chairman of the Independent Trustees and as such (i) acts as a liaison between the Independent Trustees and management with respect to matters important to the Independent Trustees and (ii) with management prepares agendas for Board meetings.
Fidelity funds are overseen by different Boards of Trustees. The fund's Board oversees Fidelity's equity and high income funds and another Board oversees Fidelity's investment-grade bond, money market, and asset allocation funds. The asset allocation funds may invest in Fidelity funds overseen by the fund's Board. The use of separate Boards, each with its own committee structure, allows the Trustees of each group of Fidelity funds to focus on the unique issues of the funds they oversee, including common research, investment, and operational issues. On occasion, the separate Boards establish joint committees to address issues of overlapping consequences for the Fidelity funds overseen by each Board.
The Trustees operate using a system of committees to facilitate the timely and efficient consideration of all matters of importance to the Trustees, the fund, and fund shareholders and to facilitate compliance with legal and regulatory requirements and oversight of the fund's activities and associated risks. The Board, acting through its committees, has charged FMR and its affiliates with (i) identifying events or circumstances the occurrence of which could have demonstrably adverse effects on the fund's business and/or reputation; (ii) implementing processes and controls to lessen the possibility that such events or circumstances occur or to mitigate the effects of such events or circumstances if they do occur; and (iii) creating and maintaining a system designed to evaluate continuously business and market conditions in order to facilitate the identification and implementation processes described in (i) and (ii) above. Because the day-to-day operations and activities of the fund are carried out by or through FMR, its affiliates and other service providers, the fund's exposure to risks is mitigated but not eliminated by the processes overseen by the Trustees. While each of the Board's committees has responsibility for overseeing different aspects of the fund's activities, oversight is exercised primarily through the Operations, Audit, and Compliance Committees. Appropriate personnel, including but not limited to the fund's Chief Compliance Officer (CCO), FMR's internal auditor, the independent accountants, the fund's Treasurer and portfolio management personnel, make periodic reports to the Board's committees, as appropriate. The responsibilities of each committee, including their oversight responsibilities, are described further under "Standing Committees of the Fund's Trustees."
Annual Report
The fund's Statement of Additional Information (SAI) includes more information about the Trustees. To request a free copy, call Fidelity at 1-877-208-0098.
Interested Trustees*:
Correspondence intended for each Trustee who is an interested person may be sent to Fidelity Investments, 82 Devonshire Street, Boston, Massachusetts 02109.
Name, Age; Principal Occupations and Other Relevant Experience+ |
James C. Curvey (75) |
| Year of Election or Appointment: 2007 Mr. Curvey is Trustee and Acting Chairman of the Board of Trustees of certain Trusts. Mr. Curvey also serves as Trustee (2007-present) of other investment companies advised by FMR. Mr. Curvey is a Director of Fidelity Investments Money Management, Inc. (2009-
present), Director of Fidelity Research & Analysis Co. (2009-present) and Director of FMR and FMR Co., Inc. (2007-present). Mr. Curvey is also Vice Chairman (2007-present) and Director of FMR LLC. In addition, Mr. Curvey serves as an Overseer for the Boston Symphony Orchestra and a member of the Trustees of Villanova University. Previously, Mr. Curvey was the Vice Chairman (2006-2007) and Director (2000-2007) of FMR Corp. |
Ronald P. O'Hanley (54) |
| Year of Election or Appointment: 2011 Mr. O'Hanley is President of Fidelity Asset Management and Corporate Services and a member of Fidelity's Executive Committee (2010-present). Previously, Mr. O'Hanley served as President and Chief Executive Officer of BNY Mellon Asset Management (2007-2010). Mr. O'Hanley also served as Vice Chairman of Bank New York Mellon Corp. and a member of that firm's Executive Committee. Prior to the 2007 merger of The Bank of New York and Mellon Financial Corporation, he was Vice Chairman of Mellon Financial Corporation and President and Chief Executive Officer of Mellon Asset Management. He joined Mellon in February 1997. Mr. O'Hanley currently serves as Chairman of the Boston Public Library Foundation Board of Directors and sits on the Board of Directors of Beth Israel Deaconess Medical Center, the Board of Trustees of the Marine Biological Laboratory and the Advisory Board of the Maxwell School of Citizenship and Public Administration at Syracuse University. Mr. O'Hanley also chairs the Council on Asset Management for the Financial Services Roundtable and is a member of the Board of Directors of Institutional Investor's U.S. Institute. |
* Trustees have been determined to be "Interested Trustees" by virtue of, among other things, their affiliation with the trust various entities under common control with FMR.
+ The information above includes each Trustee's principal occupation during the last five years and other information relating to the experience, attributes, and skills relevant to each Trustee's qualifications to serve as a Trustee, which led to the conclusion that each Trustee should serve as a Trustee for the fund.
Independent Trustees:
Correspondence intended for each Independent Trustee (that is, the Trustees other than the Interested Trustees) may be sent to Fidelity Investments, P.O. Box 55235, Boston, Massachusetts 02205-5235.
Name, Age; Principal Occupations and Other Relevant Experience+ |
Dennis J. Dirks (62) |
| Year of Election or Appointment: 2005 Prior to his retirement in May 2003, Mr. Dirks was Chief Operating Officer and a member of the Board of The Depository Trust & Clearing Corporation (DTCC). He also served as President, Chief Operating Officer, and Board member of The Depository Trust Company (DTC) and President and Board member of the National Securities Clearing Corporation (NSCC). In addition, Mr. Dirks served as Chief Executive Officer and Board member of the Government Securities Clearing Corporation, Chief Executive Officer and Board member of the Mortgage-Backed Securities Clearing Corporation, as a Trustee and a member of the Finance Committee of Manhattan College (2005-2008), and as a Trustee and a member of the Finance Committee of AHRC of Nassau County (2006-2008). Mr. Dirks is a member of the Independent Directors Council (IDC) Governing Council (2010-Present) and Board of Directors for The Brookville Center for Children's Services, Inc. (2009-present). |
Alan J. Lacy (57) |
| Year of Election or Appointment: 2008 Mr. Lacy serves as Senior Adviser (2007-present) of Oak Hill Capital Partners, L.P. (private equity). Mr. Lacy also served as Chief Executive Officer (2000-2005) and Vice Chairman (2005-2006) of Sears Holdings Corporation and Sears, Roebuck and Co. (retail). In addition, Mr. Lacy serves as a member of the Board of Directors of The Western Union Company (global money transfer, 2006-present) and Bristol-Myers Squibb Company (global pharmaceuticals, 2007-present). Mr. Lacy is Chairman (2008-present) and a member (2006-present) of the Board of Trustees of The National Parks Conservation Association. |
Ned C. Lautenbach (66) |
| Year of Election or Appointment: 2000 Mr. Lautenbach is Chairman of the Independent Trustees of the Equity and High Income Funds (2006-present). Mr. Lautenbach currently serves as the Lead Director of the Eaton Corporation Board of Directors (diversified industrial, 1997-present). Mr. Lautenbach is also a member of the Board of Directors of the Philharmonic Center for the Arts in Naples, Florida (1999-
present); a member of the Board of Trustees of Fairfield University (2005-present); and a member of the Council on Foreign Relations (1994-present). Previously, Mr. Lautenbach was a Partner/Advisory Partner at Clayton, Dubilier & Rice, Inc. (private equity investment, 1998-2010), as well as a Director of Sony Corporation (2006-2007). |
Joseph Mauriello (66) |
| Year of Election or Appointment: 2008 Prior to his retirement in January 2006, Mr. Mauriello served in numerous senior management positions including Deputy Chairman and Chief Operating Officer (2004-2005), and Vice Chairman of Financial Services (2002-2004) of KPMG LLP US (professional services, 1965-2005). Mr. Mauriello currently serves as a member of the Board of Directors of XL Group plc. (global insurance and re-insurance, 2006-present) and of Arcadia Resources Inc. (health care services and products, 2007-present). Previously, Mr. Mauriello served as a Director of the Hamilton Funds of the Bank of New York (2006-2007). |
Cornelia M. Small (66) |
| Year of Election or Appointment: 2005 Ms. Small is a member of the Board of Directors of the Teagle Foundation (2009-present). Ms. Small is also a member of the Investment Committee, and Chair (2008-present) and a member of the Board of Trustees of Smith College. In addition, Ms. Small serves on the Investment Committee of the Berkshire Taconic Community Foundation (2008-present). Previously, Ms. Small served as Chairperson of the Investment Committee (2002-2008) of Smith College. In addition, Ms. Small served as Chief Investment Officer, Director of Global Equity Investments, and a member of the Board of Directors of Scudder, Stevens & Clark and Scudder Kemper Investments. |
William S. Stavropoulos (71) |
| Year of Election or Appointment: 2001 Mr. Stavropoulos is Vice Chairman of the Independent Trustees of the Equity and High Income Funds (2006-present). Mr. Stavropoulos serves as President and Founder of the Michigan Baseball Foundation, the Great Lakes Loons (2007-present). Mr. Stavropoulos is Chairman Emeritus of the Board of Directors of The Dow Chemical Company, where he previously served in numerous senior management positions, including President, CEO (1995-2000; 2002-2004), Chairman of the Executive Committee (2000-2006), and as a member of the Board of Directors (1990-2006). Currently, Mr. Stavropoulos is Chairman of Univar (global distributor of commodity and specialty chemicals, 2010-present), a Director of Teradata Corporation (data warehousing and technology solutions, 2008-present), Chemical Financial Corporation, Maersk Inc. (industrial conglomerate), Tyco International, Inc. (multinational manufacturing and services, 2007-present), and a member of the Advisory Board for Metalmark Capital (private equity investment, 2005-present). Mr. Stavropoulos is a special advisor to Clayton, Dubilier & Rice, LLC (private equity investment). In addition, Mr. Stavropoulos is a member of the University of Notre Dame Advisory Council for the College of Science. |
David M. Thomas (61) |
| Year of Election or Appointment: 2008 Previously, Mr. Thomas served as Executive Chairman (2005-2006) and Chairman and Chief Executive Officer (2000-2005) of IMS Health, Inc. (pharmaceutical and healthcare information solutions). In addition, Mr. Thomas serves as a member of the Board of Directors of Fortune Brands, Inc. (consumer products), and Interpublic Group of Companies, Inc. (marketing communication, 2004-present). |
Michael E. Wiley (60) |
| Year of Election or Appointment: 2008 Mr. Wiley also serves as a Director of Asia Pacific Exploration Consolidated (international oil and gas exploration and production, 2008-present). Mr. Wiley serves as a Director of Tesoro Corporation (independent oil refiner and marketer, 2005-present), and a Director of Bill Barrett Corporation (exploration and production, 2005-present). In addition, Mr. Wiley also serves as a Director of Post Oak Bank (privately-held bank, 2004-present). Previously, Mr. Wiley served as a member of the Board of Trustees of the University of Tulsa (2000-2006; 2007-2010), as a Senior Energy Advisor of Katzenbach Partners, LLC (consulting, 2006-2007), as an Advisory Director of Riverstone Holdings (private investment), Chairman, President, and CEO of Baker Hughes, Inc. (oilfield services, 2000-2004), and as Director of Spinnaker Exploration Company (exploration and production, 2001-2005). |
+ The information above includes each Trustee's principal occupation during the last five years and other information relating to the experience, attributes, and skills relevant to each Trustee's qualifications to serve as a Trustee, which led to the conclusion that each Trustee should serve as a Trustee for the fund.
Advisory Board Members and Executive Officers:
Correspondence intended for each executive officer, Edward C. Johnson 3d, and Peter S. Lynch may be sent to Fidelity Investments, 82 Devonshire Street, Boston, Massachusetts 02109.
Name, Age; Principal Occupation |
Edward C. Johnson 3d (80) |
| Year of Election or Appointment: 2011 Member of the Advisory Board of Fidelity's Equity and High Income Funds. Formerly Trustee and Chairman of the Board of Trustees of certain Trusts, Mr. Johnson serves as Chief Executive Officer, Chairman, and a Director of FMR LLC; Chairman and a Director of FMR; and Chairman and a Director of FMR Co., Inc. In addition, Mr. Johnson serves as Chairman and Director of FIL Limited. Previously, Mr. Johnson served as President of FMR LLC (2006-2007). |
Peter S. Lynch (66) |
| Year of Election or Appointment: 2003 Member of the Advisory Board of Fidelity's Equity and High Income Funds. Mr. Lynch is Vice Chairman and a Director of FMR and FMR Co., Inc. In addition, Mr. Lynch serves as a Trustee of Boston College and as the Chairman of the Inner-City Scholarship Fund. Previously, Mr. Lynch served on the Special Olympics International Board of Directors (1997-2006). |
Kenneth B. Robins (41) |
| Year of Election or Appointment: 2008 President and Treasurer of Fidelity's Equity and High Income Funds. Mr. Robins also serves as President and Treasurer (2010-
present) and Assistant Treasurer (2009-present) of other Fidelity funds and is an employee of Fidelity Investments (2004-present). Previously, Mr. Robins served as Deputy Treasurer of the Fidelity funds (2005-2008) and Treasurer and Chief Financial Officer of The North Carolina Capital Management Trust: Cash and Term Portfolios (2006-2008). |
Bruce T. Herring (45) |
| Year of Election or Appointment: 2006 Vice President of certain Equity Funds. Mr. Herring also serves as Chief Investment Officer and Director of Fidelity Management & Research (U.K.) Inc. (2010-present) and Group Chief Investments Officer of FMR. Previously, Mr. Herring served as Vice President (2005-2006) and Senior Vice President (2006-2007) of Fidelity Management & Research Company, Vice President of FMR Co., Inc. (2001-2007) and as a portfolio manager for Fidelity U.S. Equity Funds. |
Brian B. Hogan (46) |
| Year of Election or Appointment: 2009 Vice President of certain Equity Funds and Vice President of Sector Funds. Mr. Hogan also serves as President of FMR's Equity Division (2009-present). Previously, Mr. Hogan served as Senior Vice President, Equity Research of FMR (2006-2009) and as a portfolio manager. |
Scott C. Goebel (42) |
| Year of Election or Appointment: 2008 Secretary and Chief Legal Officer (CLO) of the Fidelity funds. Mr. Goebel also serves as Secretary and CLO of The North Carolina Capital Management Trust: Cash and Term Portfolio (2008-present); General Counsel, Secretary, and Senior Vice President of FMR (2008-present) and FMR Co., Inc. (2008-present); Deputy General Counsel of FMR LLC; Chief Legal Officer of Fidelity Management & Research (Hong Kong) Limited (2008-present) and Assistant Secretary of Fidelity Management & Research (Japan) Inc. (2008-present), Fidelity Investments Money Management, Inc. (2008-present), Fidelity Management & Research (U.K.) Inc. (2008-
present), and Fidelity Research and Analysis Company (2008-present). Previously, Mr. Goebel served as Assistant Secretary of the Funds (2007-2008) and as Vice President and Secretary of Fidelity Distributors Corporation (FDC) (2005-2007). |
William C. Coffey (41) |
| Year of Election or Appointment: 2009 Assistant Secretary of Fidelity's Equity and High Income Funds. Mr. Coffey also serves as Senior Vice President and Deputy General Counsel of FMR LLC (2010-present), and is an employee of Fidelity Investments. Previously, Mr. Coffey served as Vice President and Associate General Counsel of FMR LLC (2005-2009). |
Holly C. Laurent (56) |
| Year of Election or Appointment: 2008 Anti-Money Laundering (AML) Officer of the Fidelity funds. Ms. Laurent also serves as AML Officer of The North Carolina Capital Management Trust: Cash and Term Portfolio (2008-present) and is an employee of Fidelity Investments. Previously, Ms. Laurent was Senior Vice President and Head of Legal for Fidelity Business Services India Pvt. Ltd. (2006-2008), and Senior Vice President, Deputy General Counsel and Group Head for FMR LLC (2005-2006). |
Christine Reynolds (52) |
| Year of Election or Appointment: 2008 Chief Financial Officer of the Fidelity funds. Ms. Reynolds became President of Fidelity Pricing and Cash Management Services (FPCMS) in August 2008. Ms. Reynolds served as Chief Operating Officer of FPCMS (2007-2008). Previously, Ms. Reynolds served as President, Treasurer, and Anti-Money Laundering officer of the Fidelity funds (2004-2007). |
Kenneth A. Rathgeber (63) |
| Year of Election or Appointment: 2004 Chief Compliance Officer of Fidelity's Equity and High Income Funds. Mr. Rathgeber is Chief Compliance Officer of Fidelity Management & Research (Hong Kong) Limited (2008-present), Fidelity Management & Research (Japan) Inc. (2008-present), FMR (2005-present), FMR Co., Inc. (2005-present), Fidelity Management & Research (U.K.) Inc. (2005-present), Fidelity Research & Analysis Company (2005-present), Fidelity Investments Money Management, Inc. (2005-present), Pyramis Global Advisors, LLC (2005-present), and Strategic Advisers, Inc. (2005-present). |
Jeffrey S. Christian (49) |
| Year of Election or Appointment: 2009 Deputy Treasurer of the Fidelity funds. Mr. Christian is an employee of Fidelity Investments. Previously, Mr. Christian served as Chief Financial Officer (2008-2009) of certain Fidelity funds and Senior Vice President of Fidelity Pricing and Cash Management Services (FPCMS) (2004-2009). |
Bryan A. Mehrmann (49) |
| Year of Election or Appointment: 2005 Deputy Treasurer of the Fidelity funds. Mr. Mehrmann is an employee of Fidelity Investments. |
Adrien E. Deberghes (43) |
| Year of Election or Appointment: 2008 Deputy Treasurer of Fidelity's Equity and High Income Funds. Mr. Deberghes also serves as Assistant Treasurer of other Fidelity funds (2010-present) and is an employee of Fidelity Investments (2008-present). Previously, Mr. Deberghes served as Senior Vice President of Mutual Fund Administration at State Street Corporation (2007-2008), Senior Director of Mutual Fund Administration at Investors Bank & Trust (2005-2007), and Director of Finance for Dunkin' Brands (2000-2005). |
Stephanie J. Dorsey (41) |
| Year of Election or Appointment: 2010 Assistant Treasurer of Fidelity's Equity and High Income Funds. Ms. Dorsey also serves as Deputy Treasurer of other Fidelity funds (2008-present) and is an employee of Fidelity Investments (2008-present). Previously, Ms. Dorsey served as Treasurer (2004-2008) of the JPMorgan Mutual Funds and Vice President (2004-2008) of JPMorgan Chase Bank. |
John R. Hebble (52) |
| Year of Election or Appointment: 2009 Assistant Treasurer of Fidelity's Equity and High Income Funds. Mr. Hebble also serves as Treasurer and Chief Financial Officer of The North Carolina Capital Management Trust: Cash and Term Portfolio (2008-present), President and Treasurer of other Fidelity funds (2008-present) and is an employee of Fidelity Investments. |
Gary W. Ryan (52) |
| Year of Election or Appointment: 2005 Assistant Treasurer of the Fidelity funds. Mr. Ryan is an employee of Fidelity Investments. Previously, Mr. Ryan served as Vice President of Fund Reporting in Fidelity Pricing and Cash Management Services (FPCMS) (1999-2005). |
Jonathan Davis (42) |
| Year of Election or Appointment: 2010 Assistant Treasurer of the Fidelity funds. Mr. Davis is an employee of Fidelity Investments. Previously, Mr. Davis served as Vice President and Associate General Counsel of FMR LLC (2003-2010). |
Annual Report
The Board of Trustees of VIP Overseas Portfolio voted to pay to shareholders of record at the opening of business on record date, the following distributions per share derived from capital gains realized from sales of portfolio securities:
| Pay Date | Record Date | Capital Gains |
Initial Class R | 02/04/11 | 02/04/11 | $0.03 |
Service Class R | 02/04/11 | 02/04/11 | $0.03 |
Service Class 2R | 02/04/11 | 02/04/11 | $0.03 |
Investor Class R | 02/04/11 | 02/04/11 | $0.03 |
The amounts per share which represent income derived from sources within, and taxes paid to, foreign countries or possessions of the United States are as follows:
| Pay Date | Income | Taxes |
Initial Class R | 12/17/10 | $0.263 | $0.013 |
Service Class R | 12/17/10 | $0.247 | $0.013 |
Service Class 2R | 12/17/10 | $0.228 | $0.013 |
Investor Class R | 12/17/10 | $0.252 | $0.013 |
Annual Report
Board Approval of Investment Advisory Contracts and Management Fees
VIP Overseas Portfolio
Each year, the Board of Trustees, including the Independent Trustees (together, the Board), votes on the renewal of the management contract and sub-advisory agreements (together, the Advisory Contracts) for the fund. The Board, assisted by the advice of fund counsel and Independent Trustees' counsel, requests and considers a broad range of information relevant to the renewal of the Advisory Contracts throughout the year.
The Board meets regularly and considers at each of its meetings factors that are relevant to its annual consideration of the renewal of the fund's Advisory Contracts, including the services and support provided to the fund and its shareholders. The Board has established various standing committees, each composed of Independent Trustees with varying backgrounds, to which the Board has assigned specific subject matter responsibilities in order to enhance effective decision-making by the Board. The Board, acting directly and through its Committees, requests and receives information concerning the annual consideration of the renewal of the fund's Advisory Contracts. The Board also meets as needed to consider matters specifically related to the Board's annual consideration of the renewal of Advisory Contracts. Members of the Board may also meet with trustees of other Fidelity funds through ad hoc joint committees to discuss certain matters relevant to the Fidelity funds.
At its July 2010 meeting, the Board of Trustees, including the Independent Trustees, unanimously determined to renew the fund's Advisory Contracts. In reaching its determination, the Board considered all factors it believed relevant, including (i) the nature, extent, and quality of the services to be provided to the fund and its shareholders (including the investment performance of the fund); (ii) the competitiveness of the fund's management fee and total expenses; (iii) the total costs of the services to be provided by and the profits to be realized by Fidelity from its relationship with the fund; (iv) the extent to which economies of scale would be realized as the fund grows; and (v) whether fee levels reflect these economies of scale, if any, for the benefit of fund shareholders.
In considering whether to renew the Advisory Contracts for the fund, the Board reached a determination, with the assistance of fund counsel and Independent Trustees' counsel and through the exercise of its business judgment, that the renewal of the Advisory Contracts is in the best interests of fund shareholders and that the compensation to be received by Fidelity under the management contract is fair and reasonable. The Board's decision to renew the Advisory Contracts was not based on any single factor noted above, but rather was based on a comprehensive consideration of all the information provided to the Board at its meetings throughout the year. The Board, in reaching its determination to renew the Advisory Contracts, is aware that shareholders in the fund have a broad range of investment choices available to them, including a wide choice among mutual funds offered by Fidelity's competitors, and that the fund's shareholders, with the opportunity to review and weigh the disclosure provided by the fund in its prospectus and other public disclosures, have chosen to invest in this fund, managed by Fidelity.
Nature, Extent, and Quality of Services Provided. The Board considered the staffing within the investment adviser, FMR, and the sub-advisers (together, the Investment Advisers), including the backgrounds of the fund's investment personnel and the fund's investment objective and discipline. The Independent Trustees also had discussions with senior management of Fidelity's investment operations and investment groups. The Board considered the structure of the portfolio manager compensation program and whether this structure provides appropriate incentives to act in the best interest of the fund.
Resources Dedicated to Investment Management and Support Services. The Board and the equity research subcommittee of the Board's Fund Oversight Committee reviewed the size, education, and experience of the Investment Advisers' investment staff, their use of technology, and the Investment Advisers' approach to recruiting, training, and retaining portfolio managers and other research, advisory, and management personnel. The Board noted that Fidelity's analysts have access to a variety of technological tools and market and securities data that enable them to perform both fundamental and quantitative analysis and to specialize in various disciplines. The Board considered Fidelity's extensive global research capabilities that enable the Investment Advisers to aggregate data from various sources in an effort to produce positive investment results. The Board also considered that Fidelity's portfolio managers and analysts have access to daily portfolio attribution that allows for monitoring of a fund's portfolio, as well as an electronic communication system that provides immediate real-time access to research concerning issuers and credit enhancers. The Board noted FMR's continued focus on strengthening the organization and discipline of equity portfolio management and research.
Shareholder and Administrative Services. The Board considered (i) the nature, extent, quality, and cost of advisory, administrative, and shareholder services performed by the Investment Advisers and their affiliates under the Advisory Contracts and under separate agreements covering transfer agency, pricing and bookkeeping, and securities lending services for the fund; (ii) the nature and extent of the investment adviser's supervision of third party service providers, principally custodians and subcustodians; and (iii) the resources devoted to, and the record of compliance with, the fund's compliance policies and procedures. The Board also reviewed the allocation of fund brokerage, including allocations to brokers affiliated with the Investment Advisers, the use of brokerage commissions to pay fund expenses, and the use of "soft" commission dollars to pay for research services.
The Board noted that the growth of fund assets over time across the complex allows Fidelity to reinvest in the development of services designed to enhance the value or convenience of the Fidelity funds as investment vehicles. These services include 24-hour access to account information and market information through phone representatives and over the Internet, and investor education materials and asset allocation tools.
Investment in a Large Fund Family. The Board considered the benefits to shareholders of investing in a Fidelity fund, including the benefits of investing in a fund that is part of a large family of funds offering a variety of investment disciplines and providing a large variety of mutual fund investor services. The Board noted that Fidelity had taken, or had made recommendations that resulted in the Fidelity funds taking, a number of actions over the previous year that benefited particular funds, including (i) dedicating additional resources to investment research and restructuring and broadening the focus of the investment research teams; (ii) bolstering the senior management team that oversees asset management; (iii) launching Class F of certain funds as a lower-fee class available to Freedom K and Freedom Index Funds; (iv) lowering the initial investment minimums and ongoing balance requirements for Real Estate High Income Fund; (v) eliminating subsequent purchase minimums for all funds and adding a waiver of the investment minimum requirement for new accounts opened with the proceeds of a systematic withdrawal plan; (vi) eliminating the withdrawal minimum and maximum limits for systematic withdrawals from Advisor funds; (vii) expanding sales load waivers on Class A shares for Destiny Planholders and expanding Institutional Class eligibility for Class O Destiny Planholders; and (viii) changing certain Class A and Class T sales charge structures to further align them with industry practices.
Annual Report
Board Approval of Investment Advisory Contracts and Management Fees - continued
Investment Performance. The Board considered whether the fund has operated in accordance with its investment objective, as well as its record of compliance with its investment restrictions. It also reviewed the fund's absolute investment performance for each class, as well as the fund's relative investment performance for each class measured over multiple periods against (i) a broad-based securities market index, and (ii) a peer group of mutual funds deemed appropriate by Fidelity and reviewed by the Board. The following charts considered by the Board show, over the one-, three-, and five-year periods ended December 31, 2009, the cumulative total returns of Initial Class R and Service Class 2 of the fund, the cumulative total returns of a broad-based securities market index ("benchmark"), and a range of cumulative total returns of a peer group of mutual funds identified by Morningstar, Inc. as having an investment style similar to that of the fund based on underlying portfolio holdings. The returns of Initial Class R and Service Class 2 show the performance of the highest and lowest performing classes, respectively (based on five-year performance). The box within each chart shows the 25th percentile return (bottom of box) and the 75th percentile return (top of box) of the peer group. Returns shown above the box are in the first quartile and returns shown below the box are in the fourth quartile. The percentage beaten numbers noted below each chart correspond to the percentile box and represent the percentage of funds in the peer group whose performance was equal to or lower than that of the class indicated.
VIP Overseas Portfolio
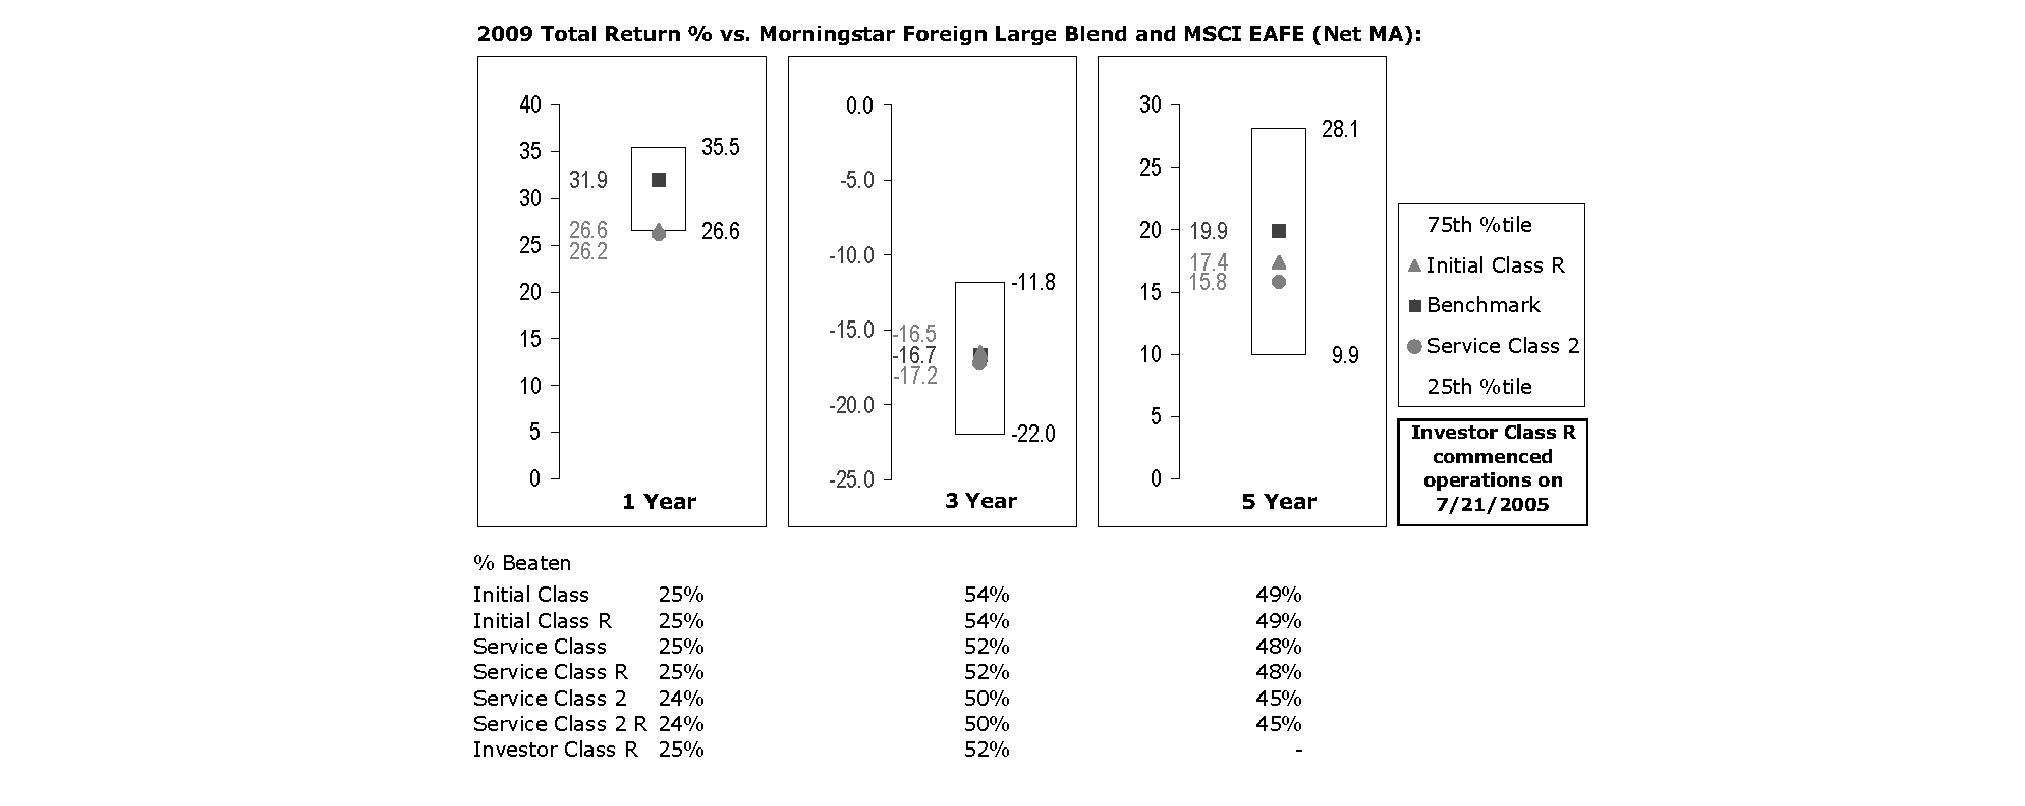
The Board reviewed the fund's relative investment performance against its peer group and noted that the performance of Initial Class R of the fund was in the third quartile for the one- and five-year periods and the second quartile for the three-year period. The Board also noted that the investment performance of the fund was lower than its benchmark for the one- and five-year periods, although the three-year cumulative total return of Initial Class R compared favorably to its benchmark. The Board considered that the variations in performance among the fund's classes reflect the variations in class expenses, which result in lower performance for higher expense classes. The Board also reviewed the fund's performance since inception as well as performance in the current year.
Based on its review, and giving particular weight to the nature and quality of the resources dedicated by the Investment Advisers to maintain and improve relative performance and factoring in the unprecedented market events in recent years, the Board concluded that the nature, extent, and quality of investment management and support services and of shareholder and administrative services provided to the fund will benefit the fund's shareholders, particularly in light of the Board's view that the fund's shareholders benefit from investing in a fund that is part of a large family of funds offering a variety of investment disciplines and services.
Competitiveness of Management Fee and Total Fund Expenses. The Board considered the fund's management fee and total expenses compared to "mapped groups" of competitive funds and classes. Fidelity creates "mapped groups" by combining similar Lipper investment objective categories that have comparable management fee characteristics. Combining Lipper investment objective categories aids the Board's management fee and total expense comparisons by broadening the competitive group used for comparison and by reducing the number of universes to which various Fidelity funds are compared.
Annual Report
Management Fee. The Board considered two proprietary management fee comparisons for the 12-month periods shown in the chart below. The group of Lipper funds used by the Board for management fee comparisons is referred to below as the "Total Mapped Group." The Total Mapped Group comparison focuses on a fund's standing relative to the total universe of comparable funds available to investors, in terms of gross management fees before expense reimbursements or caps. "TMG %" represents the percentage of funds in the Total Mapped Group that had management fees that were lower than the fund's. For example, a TMG % of 14% means that 86% of the funds in the Total Mapped Group had higher management fees than the fund. The "Asset-Size Peer Group" (ASPG) comparison focuses on a fund's standing relative to non-Fidelity funds similar in size to the fund within the Total Mapped Group. The ASPG represents at least 15% of the funds in the Total Mapped Group with comparable asset size and management fee characteristics, subject to a minimum of 50 funds (or all funds in the Total Mapped Group if fewer than 50). Additional information, such as the ASPG quartile in which the fund's management fee ranked, is also included in the chart and considered by the Board.
VIP Overseas Portfolio

The Board noted that the fund's management fee ranked below the median of its Total Mapped Group and below the median of its ASPG for 2009.
Based on its review, the Board concluded that the fund's management fee is fair and reasonable in light of the services that the fund receives and the other factors considered.
Total Expenses. In its review of each class's total expenses, the Board considered the fund's management fee as well as other fund or class expenses, as applicable, such as transfer agent fees, pricing and bookkeeping fees, fund-paid 12b-1 fees, and custodial, legal, and audit fees. The Board also noted the effects of any waivers and reimbursements on fees and expenses. As part of its review, the Board also considered current and historical total expenses of each class of the fund compared to competitive fund median expenses. Each class of the fund is compared to those funds and classes in the Total Mapped Group (used by the Board for management fee comparisons) that have a similar sales load structure.
The Board noted that the total expenses of each of Initial Class, Initial Class R, Investor Class R, Service Class, and Service Class R ranked below its competitive median for 2009 and the total expenses of each of Service Class 2 and Service Class 2 R ranked above its competitive median for 2009. The Board noted that the fund offers multiple classes, each of which has a different 12b-1 fee structure, and that the multiple structures are intended to offer a range of pricing options for the intermediary market. The Board also noted that the total expenses of the classes vary primarily by the level of their 12b-1 fees, although differences in transfer agent fees may also cause expenses to vary from class to class.
Fees Charged to Other Fidelity Clients. The Board also considered Fidelity fee structures and other information with respect to clients of FMR and its affiliates, such as other mutual funds advised or subadvised by FMR or its affiliates, pension plan clients, and other institutional clients. In March 2010, the Board created an ad hoc joint committee with the board of other Fidelity funds (the Committee) to review and compare Fidelity's institutional investment advisory business with its business of providing services to the Fidelity funds, including the differences in services provided, fees charged, and costs incurred, as well as competition in their respective marketplaces.
Annual Report
Board Approval of Investment Advisory Contracts and Management Fees - continued
Based on its review of total expenses and fees charged to other Fidelity clients, the Board concluded that the total expenses of each class of the fund were reasonable, although in some cases above the median of the universe presented for comparison, in light of the services that the fund and its shareholders receive and the other factors considered, including the findings of the Committee.
Costs of the Services and Profitability. The Board considered the revenues earned and the expenses incurred by Fidelity in conducting the business of developing, marketing, distributing, managing, administering and servicing the fund and its shareholders. The Board also considered the level of Fidelity's profits in respect of all the Fidelity funds.
On an annual basis, FMR presents to the Board Fidelity's profitability for the fund. Fidelity calculates the profitability for each fund, as well as aggregate profitability for groups of Fidelity funds and all Fidelity funds, using a series of detailed revenue and cost allocation methodologies which originate with the audited books and records of Fidelity. The Audit Committee of the Board reviews any significant changes from the prior year's methodologies.
PricewaterhouseCoopers LLP (PwC), independent registered public accounting firm and auditor to Fidelity and certain Fidelity funds, has been engaged annually by the Board as part of the Board's assessment of Fidelity's profitability analysis. PwC's engagement includes the review and assessment of Fidelity's methodologies used in determining the revenues and expenses attributable to Fidelity's mutual fund business, and completion of agreed-upon procedures surrounding the mathematical accuracy of fund profitability and its conformity to allocation methodologies. After considering PwC's reports issued under the engagement and information provided by Fidelity, the Board believes that while other allocation methods may also be reasonable, Fidelity's profitability methodologies are reasonable in all material respects.
The Board has also reviewed Fidelity's non-fund businesses and fall-out benefits related to the mutual fund business as well as cases where Fidelity's affiliates may benefit from or be related to the fund's business.
The Board considered the costs of the services provided by and the profits realized by Fidelity in connection with the operation of the fund and were satisfied that the profitability was not excessive in the circumstances.
Economies of Scale. The Board considered whether there have been economies of scale in respect of the management of the Fidelity funds, whether the Fidelity funds (including the fund) have appropriately benefited from any such economies of scale, and whether there is potential for realization of any further economies of scale. The Board considered the extent to which the fund will benefit from economies of scale through increased services to the fund, through waivers or reimbursements, or through fee or expense reductions.
In February 2009, the Board and the board of other Fidelity funds created an ad hoc committee (the Economies of Scale Committee) to analyze whether FMR attains economies of scale in respect of the management and servicing of the Fidelity funds, whether the Fidelity funds have appropriately benefited from such economies of scale, and whether there is potential for realization of any further economies of scale.
The Board recognized that the fund's management contract incorporates a "group fee" structure, which provides for lower group fee rates as total fund assets under FMR's management increase, and for higher group fee rates as total fund assets under FMR's management decrease. FMR calculates the group fee rates based on a tiered asset "breakpoint" schedule that varies based on asset class. The Board considered that the group fee is designed to deliver the benefits of economies of scale to fund shareholders when total Fidelity fund assets increase, even if assets of any particular fund are unchanged or have declined, because some portion of Fidelity's costs are attributable to services provided to all Fidelity funds, and all funds benefit if those costs can be allocated among more assets. The Board concluded that, given the group fee structure, fund shareholders will benefit from lower management fees as assets under FMR's management increase at the fund complex level, regardless of whether Fidelity achieves any such economies of scale.
The Board concluded, considering the findings of the Economies of Scale Committee, that any potential economies of scale are being appropriately shared between fund shareholders and Fidelity.
Additional Information Requested by the Board. In order to develop fully the factual basis for consideration of the Fidelity funds' Advisory Contracts, the Board requested and received additional information on certain topics, including (i) fund performance trends, actions to be taken by FMR to improve certain funds' overall performance, and Fidelity's long-term strategies for certain funds; (ii) portfolio manager changes that have occurred during the past year and length of portfolio manager tenure for different categories of funds over time; (iii) Fidelity's compensation structure for portfolio managers, research analysts, and other key personnel, the rationale for the compensation structure, and how the compensation structure provides appropriate performance incentives; (iv) the amount of the investment that each portfolio manager has made in the Fidelity fund(s) that he or she manages; (v) management and other fees paid by FMR to affiliated sub-advisers on behalf of the Fidelity funds; (vi) Fidelity's fee structures and rationale for recommending different fees among different categories of funds; (vii) Fidelity's rationale for recommending which funds should have a performance adjustment component as part of their management fees; (viii) the rationale for any differences between fund fee structures and fee structures in place for other Fidelity clients; and (ix) explanations regarding the relative total expenses borne by certain funds and classes, total expense competitive trends, and actions that might be taken by FMR to reduce total expenses for certain funds and classes.
Based on its evaluation of all of the conclusions noted above, and after considering all factors it believed relevant, the Board ultimately concluded that the advisory fee structures are fair and reasonable, and that the fund's Advisory Contracts should be renewed.
Annual Report
Investment Adviser
Fidelity Management & Research Company
Boston, MA
Investment Sub-Advisers
FMR Co., Inc.
Fidelity Management & Research (U.K.) Inc.
Fidelity Management & Research (Japan) Inc.
Fidelity Management & Research (Hong Kong) Limited
FIL Investment Advisors
FIL Investment Advisors (U.K.) Ltd.
FIL Investment (Japan) Limited
General Distributor
Fidelity Distributors Corporation
Boston, MA
Transfer and Service Agents
Fidelity Investments Institutional Operations Company, Inc.
Boston, MA
Fidelity Service Company, Inc.
Boston, MA
Custodian
JPMorgan Chase Bank
New York, NY
VIPOVRSR-ANN-0211
1.781996.108
Fidelity® Variable Insurance Products:
Value Portfolio
Annual Report
December 31, 2010
(2_fidelity_logos) (Registered_Trademark)
Contents
Performance | <Click Here> | How the fund has done over time. |
Management's Discussion of Fund Performance | <Click Here> | The Portfolio Manager's review of fund performance and strategy. |
Shareholder Expense Example | <Click Here> | An example of shareholder expenses. |
Investment Changes | <Click Here> | A summary of major shifts in the fund's investments over the past six months. |
Investments | <Click Here> | A complete list of the fund's investments with their market values. |
Financial Statements | <Click Here> | Statements of assets and liabilities, operations, and changes in net assets, as well as financial highlights. |
Notes | <Click Here> | Notes to the financial statements. |
Report of Independent Registered Public Accounting Firm | <Click Here> | |
Trustees and Officers | <Click Here> | |
Distributions | <Click Here> | |
Board Approval of Investment Advisory Contracts and Management Fees | <Click Here> | |
To view a fund's proxy voting guidelines and proxy voting record for the 12-month period ended June 30, visit http://www.fidelity.com/proxyvotingresults or visit the Securities and Exchange Commission's (SEC) web site at http://www.sec.gov. You may also call 1-877-208-0098 to request a free copy of the proxy voting guidelines.
Fidelity Variable Insurance Products are separate account options which are purchased through a variable insurance contract.
Standard & Poor's, S&P and S&P 500 are registered service marks of The McGraw-Hill Companies, Inc. and have been licensed for use by Fidelity Distributors Corporation.
Other third party marks appearing herein are the property of their respective owners.
All other marks appearing herein are registered or unregistered trademarks or service marks of FMR LLC or an affiliated company.
The general research services agreement with Fidelity Research & Analysis Company has been terminated and is no longer in effect for the fund.
This report and the financial statements contained herein are submitted for the general information of the shareholders of the fund. This report is not authorized for distribution to prospective investors in the fund unless preceded or accompanied by an effective prospectus.
A fund files its complete schedule of portfolio holdings with the SEC for the first and third quarters of each fiscal year on Form N-Q. Forms N-Q are available on the SEC's web site at http://www.sec.gov. A fund's Forms N-Q may be reviewed and copied at the SEC's Public Reference Room in Washington, DC. Information regarding the operation of the SEC's Public Reference Room may be obtained by calling 1-800-SEC-0330. For a complete list of a fund's portfolio holdings, view the most recent holdings listing, semiannual report, or annual report on Fidelity's web site at http://www.fidelity.com, http://www.advisor.fidelity.com, or http://www.401k.com, as applicable.
NOT FDIC INSURED • MAY LOSE VALUE • NO BANK GUARANTEE
Neither the fund nor Fidelity Distributors Corporation is a bank.
Annual Report
Average annual total return reflects the change in the value of an investment, assuming reinvestment of the class' distributions from dividend income and capital gains (the profits earned upon the sale of securities that have grown in value, if any) and assuming a constant rate of performance each year. During periods of reimbursement by Fidelity, a fund's total return will be greater than it would be had the reimbursement not occurred. Performance numbers are net of all underlying fund operating expenses, but do not include any insurance charges imposed by your insurance company's separate account. If performance information included the effect of these additional charges, the total returns would have been lower. How a fund did yesterday is no guarantee of how it will do tomorrow.
Average Annual Total Returns
Periods ended December 31, 2010 | Past 1
year | Past 5
years | Life of
fundA |
VIP Value Portfolio - Initial Class | 17.82% | 1.03% | 3.22% |
VIP Value Portfolio - Service Class | 17.73% | 0.92% | 3.11% |
VIP Value Portfolio - Service Class 2 | 17.52% | 0.76% | 2.96% |
VIP Value Portfolio - Investor Class B | 17.74% | 0.92% | 3.16% |
A From May 9, 2001.
B The initial offering of Investor Class shares took place on July 21, 2005. Returns prior to July 21, 2005 are those of Initial Class. Had Investor Class's transfer agent fee been reflected, returns prior to July 21, 2005 would have been lower.
$10,000 Over Life of Fund
Let's say hypothetically that $10,000 was invested in VIP Value Portfolio - Initial Class on May 9, 2001, when the fund started. The chart shows how the value of your investment would have changed, and also shows how the Russell 3000® Value Index performed over the same period.
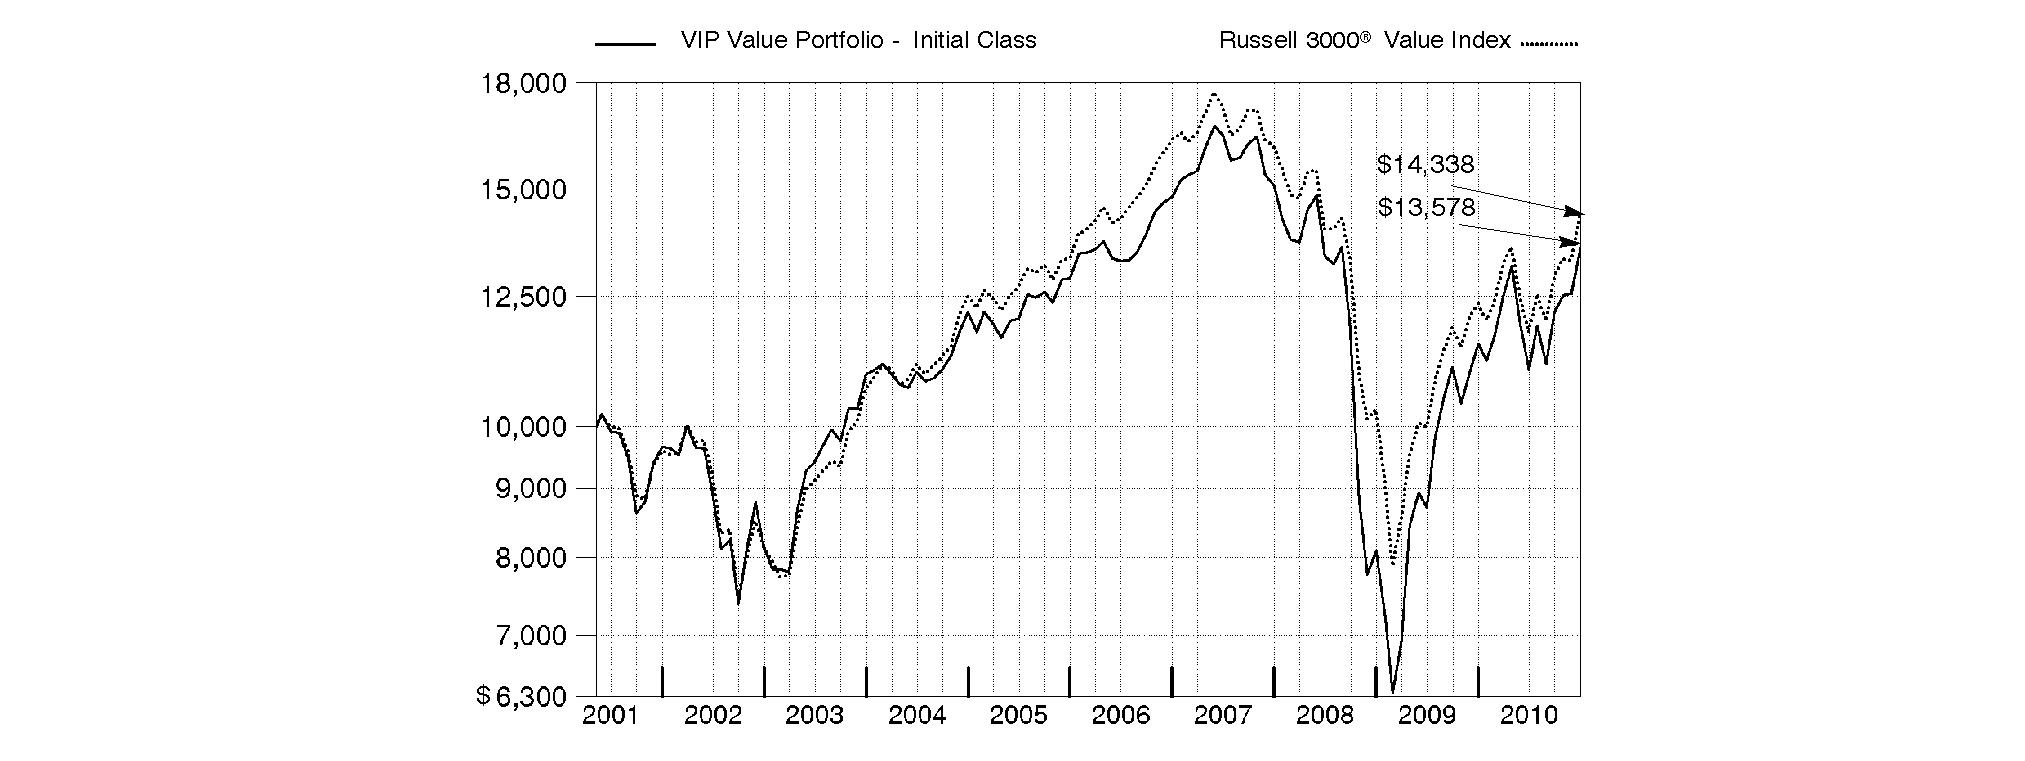
Annual Report
Market Recap: While market improvements around the world hit a speed bump in the first half of the 12-month period ending December 31, 2010, world economies re-accelerated in August, supported by a broadening recovery and low inflation in the U.S. Domestic stock markets recorded solid gains for the year, lifted by a strong second-half rally fueled by economic optimism, encouraging earnings reports and a wave of corporate mergers. The large-cap S&P 500® Index rose 15.06%, the blue-chip-laden Dow Jones Industrial AverageSM added 14.06% and the technology-heavy Nasdaq Composite® Index climbed 18.02%. Meanwhile, international stocks, as represented by the MSCI® ACWI® (All Country World Index) ex USA Index, gained 11.29%, boosted in part by a depreciating U.S. dollar. In the fixed-income arena, U.S. taxable investment-grade bonds generated positive results during 2010, as the Barclays Capital® U.S. Aggregate Bond Index gained 6.54%. With ultra-low interest rates bolstering nearly all fixed-income securities for most of the year, sectors in the index with higher yields and more credit risk generally fared best, while most high-quality bonds generated more-moderate returns. Meanwhile, high-yield bonds, as represented by The BofA Merrill LynchSM US High Yield Constrained Index, returned 15.07%, a result of improved economic data and strengthening investor demand. Overseas, foreign bond markets showed mixed results, with a sizable disparity between the 3.97% return of the Citigroup® Non-U.S. Group of 7 Index - which measures the performance of sovereign debt of the major global economies outside the U.S. - and the 12.04% advance of the JPMorgan Emerging Markets Bond Index Global (EMBI Global), which benefited from the rising overall credit quality of emerging-markets debt issuers.
Comments from Scott Offen, who became sole Portfolio Manager of VIP Value Portfolio on July 31, 2010, after serving as Co-Portfolio Manager since May 1, 2010: For the year, the fund's share classes outperformed the Russell 3000® Value Index, which returned 16.23%. (For specific portfolio results, please refer to the performance section of this report.) Relative to the index, the fund was helped the most by strong positioning in financials - particularly among banks - and some good stock picks in industrials and health care. An overweighting in the top-performing consumer discretionary sector also helped, as did an underweighting in health care, which was by far the market's weakest segment. Carrying a bias toward smaller-cap stocks further buoyed relative performance, as that segment of the market outperformed. On the flip side, weak stock selection in energy notably detracted, along with picks in consumer durables/apparel, utilities and information technology. On an individual security basis, the fund was helped the most by its overweighting in diesel-engine manufacturer Cummins and underexposure to three poor-performing index constituents - integrated oil firm Exxon Mobil, pharmaceutical giant Pfizer and insurance-focused conglomerate Berkshire Hathaway, the latter of which the fund didn't own. Investments in U.K.-based Virgin Media and retailer OfficeMax also contributed. Among the biggest individual detractors were homebuilders PulteGroup, KB Home and M/I Homes, the latter of which was a case of untimely ownership. KB Home and M/I Homes were sold by period end. Underweighting industrial conglomerate General Electric and modestly overweighting banking firm Wells Fargo also hurt.
The views expressed above reflect those of the portfolio manager(s) only through the end of the period as stated on the cover of this report and do not necessarily represent the views of Fidelity or any other person in the Fidelity organization. Any such views are subject to change at any time based upon market or other conditions and Fidelity disclaims any responsibility to update such views. These views may not be relied on as investment advice and, because investment decisions for a Fidelity fund are based on numerous factors, may not be relied on as an indication of trading intent on behalf of any Fidelity fund.
Annual Report
As a shareholder of the Fund, you incur two types of costs: (1) transaction costs, and (2) ongoing costs, including management fees, distribution and/or service (12b-1) fees and other Fund expenses. This Example is intended to help you understand your ongoing costs (in dollars) of investing in the Fund and to compare these costs with the ongoing costs of investing in other mutual funds.
The Example is based on an investment of $1,000 invested at the beginning of the period and held for the entire period (July 1, 2010 to December 31, 2010).
Actual Expenses
The first line of the accompanying table for each class of the Fund provides information about actual account values and actual expenses. You may use the information in this line, together with the amount you invested, to estimate the expenses that you paid over the period. Simply divide your account value by $1,000.00 (for example, an $8,600 account value divided by $1,000.00 = 8.6), then multiply the result by the number in the first line for a class of the Fund under the heading entitled "Expenses Paid During Period" to estimate the expenses you paid on your account during this period. The estimate of expenses does not include any fees or other expenses of any variable annuity or variable life insurance product. If they were, the estimate of expenses you paid during the period would be higher, and your ending account value would be lower. In addition, the Fund, as a shareholder in the underlying Fidelity Central Funds, will indirectly bear its pro-rata share of the fees and expenses incurred by the underlying Fidelity Central Funds. These fees and expenses are not included in the Fund's annualized expense ratio used to calculate the expense estimate in the table below.
Hypothetical Example for Comparison Purposes
The second line of the accompanying table for each class of the Fund provides information about hypothetical account values and hypothetical expenses based on a Class' actual expense ratio and an assumed rate of return of 5% per year before expenses, which is not the Class' actual return. The hypothetical account values and expenses may not be used to estimate the actual ending account balance or expenses you paid for the period. You may use this information to compare the ongoing costs of investing in the Fund and other funds. To do so, compare this 5% hypothetical example with the 5% hypothetical examples that appear in the shareholder reports of the other funds. The estimate of expenses does not include any fees or other expenses of any variable annuity or variable life insurance product. If they were, the estimate of expenses you paid during the period would be higher, and your ending account value would be lower. In addition, the Fund, as a shareholder in the underlying Fidelity Central Funds, will indirectly bear its pro-rata share of the fees and expenses incurred by the underlying Fidelity Central Funds. These fees and expenses are not included in the Fund's annualized expense ratio used to calculate the expense estimate in the table below.
Please note that the expenses shown in the table are meant to highlight your ongoing costs only and do not reflect any transaction costs. Therefore, the second line of the table is useful in comparing ongoing costs only, and will not help you determine the relative total costs of owning different funds.
| Annualized
Expense Ratio | Beginning
Account Value
July 1, 2010 | Ending
Account Value
December 31, 2010 | Expenses Paid
During Period*
July 1, 2010
to December 31, 2010 |
Initial Class | .72% | | | |
Actual | | $ 1,000.00 | $ 1,231.50 | $ 4.05 |
HypotheticalA | | $ 1,000.00 | $ 1,021.58 | $ 3.67 |
Service Class | .81% | | | |
Actual | | $ 1,000.00 | $ 1,230.70 | $ 4.55 |
HypotheticalA | | $ 1,000.00 | $ 1,021.12 | $ 4.13 |
Service Class 2 | .97% | | | |
Actual | | $ 1,000.00 | $ 1,228.90 | $ 5.45 |
HypotheticalA | | $ 1,000.00 | $ 1,020.32 | $ 4.94 |
Investor Class | .80% | | | |
Actual | | $ 1,000.00 | $ 1,230.80 | $ 4.50 |
HypotheticalA | | $ 1,000.00 | $ 1,021.17 | $ 4.08 |
A 5% return per year before expenses
* Expenses are equal to each Class' annualized expense ratio, multiplied by the average account value over the period, multiplied by 184/365 (to reflect the one-half year period).
Annual Report
Investment Changes (Unaudited)
Top Ten Stocks as of December 31, 2010 |
| % of fund's
net assets | % of fund's net assets
6 months ago |
JPMorgan Chase & Co. | 2.4 | 3.1 |
Philip Morris International, Inc. | 2.3 | 2.1 |
Wells Fargo & Co. | 2.1 | 2.9 |
Chevron Corp. | 2.0 | 1.0 |
U.S. Bancorp, Delaware | 2.0 | 1.3 |
Goldman Sachs Group, Inc. | 1.9 | 0.5 |
Merck & Co., Inc. | 1.9 | 2.1 |
Citigroup, Inc. | 1.9 | 1.9 |
Bank of America Corp. | 1.9 | 3.1 |
General Electric Co. | 1.5 | 0.6 |
| 19.9 | |
Top Five Market Sectors as of December 31, 2010 |
| % of fund's
net assets | % of fund's net assets
6 months ago |
Financials | 23.7 | 25.7 |
Industrials | 12.9 | 10.5 |
Consumer Discretionary | 12.9 | 10.6 |
Energy | 12.0 | 10.8 |
Health Care | 10.8 | 11.5 |
Asset Allocation (% of fund's net assets) |
As of December 31, 2010 * | As of June 30, 2010 ** |
| Stocks 98.6% | | | Stocks 98.0% | |
| Short-Term
Investments and
Net Other Assets 1.4% | | | Short-Term
Investments and
Net Other Assets 2.0% | |
* Foreign investments | 9.1% | | ** Foreign investments | 7.0% | |

Annual Report
Investments December 31, 2010
Showing Percentage of Net Assets
Common Stocks - 98.6% |
| Shares | | Value |
CONSUMER DISCRETIONARY - 12.9% |
Auto Components - 0.6% |
Modine Manufacturing Co. (a) | 22,065 | | $ 342,008 |
Tenneco, Inc. (a) | 13,000 | | 535,080 |
| | 877,088 |
Automobiles - 1.2% |
Bayerische Motoren Werke AG (BMW) | 10,958 | | 862,202 |
General Motors Co. | 18,400 | | 678,224 |
Harley-Davidson, Inc. | 8,300 | | 287,761 |
| | 1,828,187 |
Hotels, Restaurants & Leisure - 1.4% |
Starbucks Corp. | 11,421 | | 366,957 |
Starwood Hotels & Resorts Worldwide, Inc. | 10,500 | | 638,190 |
WMS Industries, Inc. (a) | 12,626 | | 571,200 |
Wyndham Worldwide Corp. | 16,496 | | 494,220 |
| | 2,070,567 |
Household Durables - 3.4% |
D.R. Horton, Inc. | 98,628 | | 1,176,632 |
Lennar Corp. Class A | 58,200 | | 1,091,250 |
PulteGroup, Inc. (a) | 154,457 | | 1,161,517 |
Stanley Black & Decker, Inc. | 26,200 | | 1,751,994 |
Toll Brothers, Inc. (a) | 100 | | 1,900 |
| | 5,183,293 |
Media - 2.9% |
The Walt Disney Co. | 48,034 | | 1,801,755 |
Time Warner Cable, Inc. | 14,500 | | 957,435 |
Virgin Media, Inc. (d) | 62,900 | | 1,713,396 |
| | 4,472,586 |
Specialty Retail - 1.8% |
Advance Auto Parts, Inc. | 9,700 | | 641,655 |
Group 1 Automotive, Inc. | 4,600 | | 192,096 |
Lowe's Companies, Inc. | 32,100 | | 805,068 |
O'Reilly Automotive, Inc. (a) | 7,300 | | 441,066 |
OfficeMax, Inc. (a) | 18,500 | | 327,450 |
TJX Companies, Inc. | 6,400 | | 284,096 |
| | 2,691,431 |
Textiles, Apparel & Luxury Goods - 1.6% |
Phillips-Van Heusen Corp. | 14,300 | | 901,043 |
Polo Ralph Lauren Corp. Class A | 7,480 | | 829,682 |
VF Corp. | 7,500 | | 646,350 |
| | 2,377,075 |
TOTAL CONSUMER DISCRETIONARY | | 19,500,227 |
CONSUMER STAPLES - 6.1% |
Beverages - 0.8% |
Anheuser-Busch InBev SA NV | 4,200 | | 240,339 |
The Coca-Cola Co. | 15,400 | | 1,012,858 |
| | 1,253,197 |
|
| Shares | | Value |
Food & Staples Retailing - 1.5% |
CVS Caremark Corp. | 27,400 | | $ 952,698 |
Kroger Co. | 13,100 | | 292,916 |
Susser Holdings Corp. (a) | 12,320 | | 170,632 |
Wal-Mart Stores, Inc. | 5,100 | | 275,043 |
Whole Foods Market, Inc. | 11,300 | | 571,667 |
| | 2,262,956 |
Household Products - 1.5% |
Procter & Gamble Co. | 34,800 | | 2,238,684 |
Tobacco - 2.3% |
Philip Morris International, Inc. | 58,082 | | 3,399,539 |
TOTAL CONSUMER STAPLES | | 9,154,376 |
ENERGY - 12.0% |
Energy Equipment & Services - 3.9% |
Baker Hughes, Inc. | 12,068 | | 689,928 |
Ensco International Ltd. ADR | 28,100 | | 1,499,978 |
National Oilwell Varco, Inc. | 24,800 | | 1,667,800 |
Noble Corp. | 35,800 | | 1,280,566 |
Weatherford International Ltd. (a) | 31,200 | | 711,360 |
| | 5,849,632 |
Oil, Gas & Consumable Fuels - 8.1% |
Alpha Natural Resources, Inc. (a) | 8,200 | | 492,246 |
Apache Corp. | 14,500 | | 1,728,835 |
Chevron Corp. | 32,722 | | 2,985,883 |
Exxon Mobil Corp. | 13,400 | | 979,808 |
Frontier Oil Corp. | 12,900 | | 232,329 |
Holly Corp. | 13,000 | | 530,010 |
Occidental Petroleum Corp. | 15,998 | | 1,569,404 |
Pioneer Natural Resources Co. | 9,653 | | 838,073 |
Royal Dutch Shell PLC Class A sponsored ADR | 26,300 | | 1,756,314 |
Sunoco, Inc. | 10,000 | | 403,100 |
Talisman Energy, Inc. | 36,800 | | 816,220 |
| | 12,332,222 |
TOTAL ENERGY | | 18,181,854 |
FINANCIALS - 23.7% |
Capital Markets - 2.6% |
Goldman Sachs Group, Inc. | 17,208 | | 2,893,697 |
Morgan Stanley | 37,960 | | 1,032,892 |
| | 3,926,589 |
Commercial Banks - 6.3% |
City National Corp. | 6,600 | | 404,976 |
Huntington Bancshares, Inc. | 72,100 | | 495,327 |
M&T Bank Corp. | 2,700 | | 235,035 |
PNC Financial Services Group, Inc. | 10,990 | | 667,313 |
Regions Financial Corp. | 49,900 | | 349,300 |
Southwest Bancorp, Inc., Oklahoma | 400 | | 4,960 |
SunTrust Banks, Inc. | 19,800 | | 584,298 |
SVB Financial Group (a) | 10,042 | | 532,728 |
Common Stocks - continued |
| Shares | | Value |
FINANCIALS - continued |
Commercial Banks - continued |
U.S. Bancorp, Delaware | 109,934 | | $ 2,964,920 |
Wells Fargo & Co. | 104,765 | | 3,246,667 |
| | 9,485,524 |
Consumer Finance - 0.4% |
Discover Financial Services | 32,339 | | 599,242 |
Diversified Financial Services - 6.2% |
Bank of America Corp. | 214,840 | | 2,865,966 |
Citigroup, Inc. (a) | 608,128 | | 2,876,445 |
JPMorgan Chase & Co. | 85,686 | | 3,634,801 |
| | 9,377,212 |
Insurance - 4.1% |
AFLAC, Inc. | 13,840 | | 780,991 |
Allstate Corp. | 19,600 | | 624,848 |
Assured Guaranty Ltd. | 13,300 | | 235,410 |
Delphi Financial Group, Inc. Class A | 18,750 | | 540,750 |
Lincoln National Corp. | 34,268 | | 952,993 |
Loews Corp. | 19,200 | | 747,072 |
MetLife, Inc. | 13,200 | | 586,608 |
Prudential Financial, Inc. | 10,100 | | 592,971 |
Unum Group | 7,720 | | 186,978 |
XL Capital Ltd. Class A | 44,100 | | 962,262 |
| | 6,210,883 |
Real Estate Investment Trusts - 2.6% |
CBL & Associates Properties, Inc. | 48,400 | | 847,000 |
DiamondRock Hospitality Co. | 49,454 | | 593,448 |
HCP, Inc. | 3,300 | | 121,407 |
Lexington Corporate Properties Trust | 36,800 | | 292,560 |
Public Storage | 4,600 | | 466,532 |
Rayonier, Inc. | 4,300 | | 225,836 |
Segro PLC | 791 | | 3,534 |
The Macerich Co. | 29,263 | | 1,386,188 |
| | 3,936,505 |
Real Estate Management & Development - 1.5% |
CB Richard Ellis Group, Inc. Class A (a) | 87,294 | | 1,787,781 |
Jones Lang LaSalle, Inc. | 6,500 | | 545,480 |
| | 2,333,261 |
TOTAL FINANCIALS | | 35,869,216 |
HEALTH CARE - 10.8% |
Biotechnology - 1.8% |
Amgen, Inc. (a) | 13,600 | | 746,640 |
Anthera Pharmaceuticals, Inc. | 24,700 | | 120,536 |
ARIAD Pharmaceuticals, Inc. (a) | 33,200 | | 169,320 |
ArQule, Inc. (a) | 13,800 | | 81,006 |
BioMarin Pharmaceutical, Inc. (a) | 7,900 | | 212,747 |
Gilead Sciences, Inc. (a) | 12,900 | | 467,496 |
Keryx Biopharmaceuticals, Inc. (a) | 33,100 | | 151,598 |
|
| Shares | | Value |
Micromet, Inc. (a) | 4,200 | | $ 34,104 |
Pharmasset, Inc. (a) | 1,400 | | 60,774 |
Theravance, Inc. (a) | 8,300 | | 208,081 |
United Therapeutics Corp. (a) | 5,000 | | 316,100 |
ZIOPHARM Oncology, Inc. (a) | 29,000 | | 135,140 |
| | 2,703,542 |
Health Care Equipment & Supplies - 1.0% |
Boston Scientific Corp. (a) | 84,500 | | 639,665 |
Covidien PLC | 10,000 | | 456,600 |
Edwards Lifesciences Corp. (a) | 1,600 | | 129,344 |
Wright Medical Group, Inc. (a) | 16,575 | | 257,410 |
| | 1,483,019 |
Health Care Providers & Services - 1.7% |
CIGNA Corp. | 17,600 | | 645,216 |
Emeritus Corp. (a) | 464 | | 9,145 |
Fresenius Medical Care AG & Co. KGaA sponsored ADR | 2,400 | | 138,456 |
McKesson Corp. | 8,539 | | 600,975 |
Medco Health Solutions, Inc. (a) | 17,000 | | 1,041,590 |
Sunrise Senior Living, Inc. (a) | 32,200 | | 175,490 |
| | 2,610,872 |
Health Care Technology - 0.1% |
Allscripts-Misys Healthcare Solutions, Inc. (a) | 7,300 | | 140,671 |
Life Sciences Tools & Services - 0.8% |
Covance, Inc. (a) | 7,400 | | 380,434 |
PAREXEL International Corp. (a) | 13,400 | | 284,482 |
PerkinElmer, Inc. | 13,700 | | 353,734 |
QIAGEN NV (a) | 7,700 | | 150,535 |
| | 1,169,185 |
Pharmaceuticals - 5.4% |
Ardea Biosciences, Inc. (a) | 11,300 | | 293,800 |
Cadence Pharmaceuticals, Inc. (a) | 17,747 | | 133,990 |
Cardiome Pharma Corp. (a) | 9,500 | | 60,774 |
GlaxoSmithKline PLC sponsored ADR | 11,000 | | 431,420 |
Johnson & Johnson | 31,192 | | 1,929,225 |
Merck & Co., Inc. | 80,270 | | 2,892,931 |
Pfizer, Inc. | 122,704 | | 2,148,547 |
Valeant Pharmaceuticals International, Inc. | 12,400 | | 351,621 |
| | 8,242,308 |
TOTAL HEALTH CARE | | 16,349,597 |
INDUSTRIALS - 12.9% |
Aerospace & Defense - 2.2% |
DigitalGlobe, Inc. (a) | 5,052 | | 160,199 |
Precision Castparts Corp. | 7,900 | | 1,099,759 |
United Technologies Corp. | 26,800 | | 2,109,696 |
| | 3,369,654 |
Common Stocks - continued |
| Shares | | Value |
INDUSTRIALS - continued |
Airlines - 0.5% |
Southwest Airlines Co. | 43,231 | | $ 561,138 |
United Continental Holdings, Inc. (a) | 7,900 | | 188,178 |
| | 749,316 |
Building Products - 0.6% |
Armstrong World Industries, Inc. | 8,600 | | 369,800 |
Owens Corning (a) | 15,375 | | 478,931 |
| | 848,731 |
Commercial Services & Supplies - 0.2% |
Republic Services, Inc. | 6,700 | | 200,062 |
The Geo Group, Inc. (a) | 7,400 | | 182,484 |
| | 382,546 |
Construction & Engineering - 0.2% |
KBR, Inc. | 8,602 | | 262,103 |
Electrical Equipment - 0.8% |
Regal-Beloit Corp. | 18,600 | | 1,241,736 |
Industrial Conglomerates - 1.9% |
General Electric Co. | 123,248 | | 2,254,206 |
Textron, Inc. | 24,900 | | 588,636 |
| | 2,842,842 |
Machinery - 3.2% |
Cummins, Inc. | 16,081 | | 1,769,071 |
Danaher Corp. | 23,000 | | 1,084,910 |
Dover Corp. | 5,200 | | 303,940 |
Gardner Denver, Inc. | 9,800 | | 674,436 |
Pall Corp. | 3,200 | | 158,656 |
Schindler Holding AG (participation certificate) | 2,431 | | 287,775 |
Timken Co. | 13,100 | | 625,263 |
| | 4,904,051 |
Professional Services - 0.6% |
Adecco SA (Reg.) | 4,646 | | 304,578 |
Manpower, Inc. | 8,808 | | 552,790 |
| | 857,368 |
Road & Rail - 2.7% |
Con-way, Inc. | 9,603 | | 351,182 |
CSX Corp. | 24,200 | | 1,563,562 |
Union Pacific Corp. | 23,400 | | 2,168,244 |
| | 4,082,988 |
TOTAL INDUSTRIALS | | 19,541,335 |
INFORMATION TECHNOLOGY - 8.0% |
Communications Equipment - 1.4% |
Adtran, Inc. | 14,100 | | 510,561 |
Cisco Systems, Inc. (a) | 25,585 | | 517,585 |
Juniper Networks, Inc. (a) | 15,464 | | 570,931 |
QUALCOMM, Inc. | 11,475 | | 567,898 |
| | 2,166,975 |
|
| Shares | | Value |
Electronic Equipment & Components - 1.4% |
Avnet, Inc. (a) | 35,034 | | $ 1,157,173 |
Tyco Electronics Ltd. | 25,400 | | 899,160 |
| | 2,056,333 |
Internet Software & Services - 0.5% |
eBay, Inc. (a) | 29,200 | | 812,636 |
IT Services - 0.7% |
Fidelity National Information Services, Inc. | 5,100 | | 139,689 |
MasterCard, Inc. Class A | 4,021 | | 901,146 |
| | 1,040,835 |
Office Electronics - 0.4% |
Xerox Corp. | 48,534 | | 559,112 |
Semiconductors & Semiconductor Equipment - 2.9% |
Advanced Micro Devices, Inc. (a) | 83,156 | | 680,216 |
ASML Holding NV | 13,044 | | 500,107 |
Avago Technologies Ltd. | 16,700 | | 475,449 |
GT Solar International, Inc. (a) | 8,100 | | 73,872 |
Intersil Corp. Class A | 36,900 | | 563,463 |
KLA-Tencor Corp. | 9,900 | | 382,536 |
Lam Research Corp. (a) | 12,900 | | 667,962 |
Linear Technology Corp. | 9,113 | | 315,219 |
Marvell Technology Group Ltd. (a) | 12,449 | | 230,929 |
Standard Microsystems Corp. (a) | 15,854 | | 457,071 |
| | 4,346,824 |
Software - 0.7% |
AsiaInfo Holdings, Inc. (a) | 11,700 | | 193,869 |
BMC Software, Inc. (a) | 8,700 | | 410,118 |
Oracle Corp. | 16,300 | | 510,190 |
| | 1,114,177 |
TOTAL INFORMATION TECHNOLOGY | | 12,096,892 |
MATERIALS - 3.5% |
Chemicals - 2.1% |
Albemarle Corp. | 17,126 | | 955,288 |
CF Industries Holdings, Inc. | 1,700 | | 229,755 |
Praxair, Inc. | 8,500 | | 811,495 |
Solutia, Inc. (a) | 47,091 | | 1,086,860 |
Symrise AG | 3,200 | | 87,814 |
| | 3,171,212 |
Containers & Packaging - 0.4% |
Ball Corp. | 5,800 | | 394,690 |
Owens-Illinois, Inc. (a) | 7,412 | | 227,548 |
| | 622,238 |
Metals & Mining - 1.0% |
BHP Billiton Ltd. sponsored ADR | 1,700 | | 157,964 |
Carpenter Technology Corp. | 9,800 | | 394,352 |
Goldcorp, Inc. | 5,200 | | 239,222 |
Newcrest Mining Ltd. | 8,213 | | 339,341 |
Common Stocks - continued |
| Shares | | Value |
MATERIALS - continued |
Metals & Mining - continued |
Newmont Mining Corp. | 3,914 | | $ 240,437 |
Teck Resources Ltd. Class B (sub. vtg.) | 3,100 | | 192,068 |
| | 1,563,384 |
TOTAL MATERIALS | | 5,356,834 |
TELECOMMUNICATION SERVICES - 5.7% |
Diversified Telecommunication Services - 3.9% |
AboveNet, Inc. | 16,500 | | 964,590 |
AT&T, Inc. | 42,123 | | 1,237,574 |
Cbeyond, Inc. (a) | 34,000 | | 519,520 |
China Unicom (Hong Kong) Ltd. sponsored ADR | 11,900 | | 169,575 |
Iliad Group SA | 1,555 | | 169,233 |
Qwest Communications International, Inc. | 174,266 | | 1,326,164 |
Verizon Communications, Inc. | 41,734 | | 1,493,243 |
| | 5,879,899 |
Wireless Telecommunication Services - 1.8% |
American Tower Corp. Class A (a) | 17,800 | | 919,192 |
SBA Communications Corp. Class A (a) | 11,600 | | 474,904 |
Sprint Nextel Corp. (a) | 301,687 | | 1,276,136 |
| | 2,670,232 |
TOTAL TELECOMMUNICATION SERVICES | | 8,550,131 |
UTILITIES - 3.0% |
Electric Utilities - 2.4% |
American Electric Power Co., Inc. | 30,429 | | 1,094,835 |
FirstEnergy Corp. | 26,300 | | 973,626 |
PPL Corp. | 62,227 | | 1,637,815 |
| | 3,706,276 |
|
| Shares | | Value |
Independent Power Producers & Energy Traders - 0.6% |
Calpine Corp. (a) | 68,108 | | $ 908,561 |
TOTAL UTILITIES | | 4,614,837 |
TOTAL COMMON STOCKS (Cost $131,884,661) | 149,215,299 |
Money Market Funds - 2.5% |
| | | |
Fidelity Cash Central Fund, 0.19% (b) | 2,074,699 | | 2,074,699 |
Fidelity Securities Lending Cash Central Fund, 0.21% (b)(c) | 1,637,250 | | 1,637,250 |
TOTAL MONEY MARKET FUNDS (Cost $3,711,949) | 3,711,949 |
TOTAL INVESTMENT
PORTFOLIO - 101.1% (Cost $135,596,610) | | 152,927,248 |
NET OTHER ASSETS (LIABILITIES) - (1.1)% | | (1,642,192) |
NET ASSETS - 100% | $ 151,285,056 |
Legend |
(a) Non-income producing |
(b) Affiliated fund that is available only to investment companies and other accounts managed by Fidelity Investments. The rate quoted is the annualized seven-day yield of the fund at period end. A complete unaudited listing of the fund's holdings as of its most recent quarter end is available upon request. In addition, each Fidelity Central Fund's financial statements, which are not covered by the Fund's Report of Independent Registered Public Accounting Firm, are available on the SEC's website or upon request. |
(c) Investment made with cash collateral received from securities on loan. |
(d) Security or a portion of the security is on loan at period end. |
Affiliated Central Funds |
Information regarding fiscal year to date income earned by the Fund from investments in Fidelity Central Funds is as follows: |
Fund | Income earned |
Fidelity Cash Central Fund | $ 5,797 |
Fidelity Securities Lending Cash Central Fund | 5,956 |
Total | $ 11,753 |
Other Information |
All investments are categorized as Level 1 under the Fair Value Hierarchy. The inputs or methodology used for valuing securities may not be an indication of the risk associated with investing in those securities. For more information on valuation inputs, please refer to the Security Valuation section in the accompanying Notes to Financial Statements. |
Income Tax Information |
At December 31, 2010, the Fund had a capital loss carryforward of approximately $26,689,507 of which $9,078,392, $15,545,941 and $2,065,174 will expire in fiscal 2016, 2017 and 2018, respectively. Capital loss carryforwards are only available to offset future capital gains of the Fund to the extent provided by regulations and may be limited. |
See accompanying notes which are an integral part of the financial statements.
Annual Report
Statement of Assets and Liabilities
| December 31, 2010 |
| | |
Assets | | |
Investment in securities, at value (including securities loaned of $1,607,160) - See accompanying schedule: Unaffiliated issuers (cost $131,884,661) | $ 149,215,299 | |
Fidelity Central Funds (cost $3,711,949) | 3,711,949 | |
Total Investments (cost $135,596,610) | | $ 152,927,248 |
Foreign currency held at value (cost $85) | | 85 |
Receivable for fund shares sold | | 50,938 |
Dividends receivable | | 186,612 |
Distributions receivable from Fidelity Central Funds | | 887 |
Prepaid expenses | | 421 |
Other receivables | | 2,143 |
Total assets | | 153,168,334 |
| | |
Liabilities | | |
Payable for fund shares redeemed | $ 117,130 | |
Accrued management fee | 68,564 | |
Distribution and service plan fees payable | 1,817 | |
Other affiliated payables | 17,251 | |
Other payables and accrued expenses | 41,266 | |
Collateral on securities loaned, at value | 1,637,250 | |
Total liabilities | | 1,883,278 |
| | |
Net Assets | | $ 151,285,056 |
Net Assets consist of: | | |
Paid in capital | | $ 161,968,217 |
Distributions in excess of net investment income | | (121,999) |
Accumulated undistributed net realized gain (loss) on investments and foreign currency transactions | | (27,891,532) |
Net unrealized appreciation (depreciation) on investments and assets and liabilities in foreign currencies | | 17,330,370 |
Net Assets | | $ 151,285,056 |
Statement of Assets and Liabilities - continued
| December 31, 2010 |
| | |
Initial Class:
Net Asset Value, offering price and redemption price per share ($78,133,156 ÷ 7,103,993 shares) | | $ 11.00 |
| | |
Service Class:
Net Asset Value, offering price and redemption price per share ($258,275 ÷ 23,501 shares) | | $ 10.99 |
| | |
Service Class 2:
Net Asset Value, offering price and redemption price per share ($8,651,882 ÷ 793,478 shares) | | $ 10.90 |
| | |
Investor Class:
Net Asset Value, offering price and redemption price per share ($64,241,743 ÷ 5,845,246 shares) | | $ 10.99 |
See accompanying notes which are an integral part of the financial statements.
Annual Report
Statement of Operations
| Year ended December 31, 2010 |
| | |
Investment Income | | |
Dividends | | $ 1,964,448 |
Special dividends | | 874,484 |
Interest | | 2,318 |
Income from Fidelity Central Funds | | 11,753 |
Total income | | 2,853,003 |
| | |
Expenses | | |
Management fee | $ 769,650 | |
Transfer agent fees | 167,683 | |
Distribution and service plan fees | 25,123 | |
Accounting and security lending fees | 53,800 | |
Custodian fees and expenses | 37,998 | |
Independent trustees' compensation | 770 | |
Audit | 54,863 | |
Legal | 841 | |
Miscellaneous | 1,574 | |
Total expenses before reductions | 1,112,302 | |
Expense reductions | (17,805) | 1,094,497 |
Net investment income (loss) | | 1,758,506 |
Realized and Unrealized Gain (Loss) Net realized gain (loss) on: | | |
Investment securities: | | |
Unaffiliated issuers | (1,136,064) | |
Foreign currency transactions | 31,722 | |
Total net realized gain (loss) | | (1,104,342) |
Change in net unrealized appreciation (depreciation) on: Investment securities (net of decrease in deferred foreign taxes of $56) | 21,464,984 | |
Assets and liabilities in foreign currencies | (306) | |
Total change in net unrealized appreciation (depreciation) | | 21,464,678 |
Net gain (loss) | | 20,360,336 |
Net increase (decrease) in net assets resulting from operations | | $ 22,118,842 |
Statement of Changes in Net Assets
| Year ended
December 31, 2010 | Year ended
December 31, 2009 |
Increase (Decrease) in Net Assets | | |
Operations | | |
Net investment income (loss) | $ 1,758,506 | $ 888,333 |
Net realized gain (loss) | (1,104,342) | (11,420,401) |
Change in net unrealized appreciation (depreciation) | 21,464,678 | 47,255,164 |
Net increase (decrease) in net assets resulting from operations | 22,118,842 | 36,723,096 |
Distributions to shareholders from net investment income | (1,920,442) | (908,042) |
Distributions to shareholders from net realized gain | (94,534) | - |
Total distributions | (2,014,976) | (908,042) |
Share transactions - net increase (decrease) | 2,075,233 | 10,552,112 |
Total increase (decrease) in net assets | 22,179,099 | 46,367,166 |
| | |
Net Assets | | |
Beginning of period | 129,105,957 | 82,738,791 |
End of period (including distributions in excess of net investment income of $121,999 and undistributed net
investment income of $136, respectively) | $ 151,285,056 | $ 129,105,957 |
See accompanying notes which are an integral part of the financial statements.
Annual Report
Financial Highlights - Initial Class
Years ended December 31, | 2010 | 2009 | 2008 | 2007 | 2006 |
Selected Per-Share Data | | | | | |
Net asset value, beginning of period | $ 9.47 | $ 6.69 | $ 13.10 | $ 14.28 | $ 12.63 |
Income from Investment Operations | | | | | |
Net investment income (loss) C | .13 F | .07 | .13 | .10 | .16 |
Net realized and unrealized gain (loss) | 1.56 | 2.78 | (6.07) | .22 | 1.70 |
Total from investment operations | 1.69 | 2.85 | (5.94) | .32 | 1.86 |
Distributions from net investment income | (.15) | (.07) | (.10) | (.09) | (.13) |
Distributions from net realized gain | (.01) | - | (.37) | (1.41) | (.08) |
Total distributions | (.16) | (.07) | (.47) | (1.50) H | (.21) |
Net asset value, end of period | $ 11.00 | $ 9.47 | $ 6.69 | $ 13.10 | $ 14.28 |
Total Return A,B | 17.82% | 42.66% | (46.50)% | 2.02% | 14.75% |
Ratios to Average Net Assets D,G | | | | | |
Expenses before reductions | .76% | .80% | .79% | .77% | .88% |
Expenses net of fee waivers, if any | .75% | .80% | .79% | .77% | .85% |
Expenses net of all reductions | .74% | .80% | .79% | .77% | .84% |
Net investment income (loss) | 1.33% F | .95% | 1.25% | .68% | 1.16% |
Supplemental Data | | | | | |
Net assets, end of period (000 omitted) | $ 78,133 | $ 64,198 | $ 41,306 | $ 52,544 | $ 35,416 |
Portfolio turnover rate E | 160% | 73% | 53% | 52% | 263% |
A Total returns do not reflect charges attributable to your insurance company's separate account. Inclusion of these charges would reduce the total returns shown.
B Total returns would have been lower had certain expenses not been reduced during the periods shown.
C Calculated based on average shares outstanding during the period.
D Fees and expenses of the underlying Fidelity Central Funds are not included in the Fund's expense ratio. The Fund indirectly bears its proportionate share of the expenses of any underlying Fidelity Central Funds.
E Amount does not include the portfolio activity of any underlying Fidelity Central Funds.
F Investment income per share reflects a special dividend which amounted to $.06 per share. Excluding the special dividend, the ratio of net investment income (loss) to average net assets would have been .69%.
G Expense ratios reflect operating expenses of the class. Expenses before reductions do not reflect amounts reimbursed by the investment adviser or reductions from brokerage service arrangements or reductions from other expense offset arrangements and do not represent the amount paid by the class during periods when reimbursements or reductions occur. Expenses net of fee waivers reflect expenses after reimbursement by the investment adviser but prior to reductions from brokerage service arrangements or other expense offset arrangements. Expenses net of all reductions represent the net expenses paid by the class.
H Total distributions of $1.50 per share is comprised of distributions from net investment income of $.092 and distributions from net realized gain of $1.405 per share.
Financial Highlights - Service Class
Years ended December 31, | 2010 | 2009 | 2008 | 2007 | 2006 |
Selected Per-Share Data | | | | | |
Net asset value, beginning of period | $ 9.46 | $ 6.69 | $ 13.06 | $ 14.24 | $ 12.60 |
Income from Investment Operations | | | | | |
Net investment income (loss) C | .12 F | .06 | .13 | .09 | .14 |
Net realized and unrealized gain (loss) | 1.56 | 2.77 | (6.05) | .21 | 1.69 |
Total from investment operations | 1.68 | 2.83 | (5.92) | .30 | 1.83 |
Distributions from net investment income | (.14) | (.06) | (.08) | (.08) | (.11) |
Distributions from net realized gain | (.01) | - | (.37) | (1.41) | (.08) |
Total distributions | (.15) | (.06) | (.45) | (1.48) H | (.19) |
Net asset value, end of period | $ 10.99 | $ 9.46 | $ 6.69 | $ 13.06 | $ 14.24 |
Total Return A,B | 17.73% | 42.35% | (46.49)% | 1.92% | 14.56% |
Ratios to Average Net Assets D,G | | | | | |
Expenses before reductions | .84% | .91% | .88% | .86% | .96% |
Expenses net of fee waivers, if any | .83% | .91% | .88% | .86% | .95% |
Expenses net of all reductions | .83% | .90% | .88% | .86% | .94% |
Net investment income (loss) | 1.24% F | .84% | 1.17% | .60% | 1.06% |
Supplemental Data | | | | | |
Net assets, end of period (000 omitted) | $ 258 | $ 251 | $ 293 | $ 958 | $ 1,017 |
Portfolio turnover rate E | 160% | 73% | 53% | 52% | 263% |
A Total returns do not reflect charges attributable to your insurance company's separate account. Inclusion of these charges would reduce the total returns shown.
B Total returns would have been lower had certain expenses not been reduced during the periods shown.
C Calculated based on average shares outstanding during the period.
D Fees and expenses of the underlying Fidelity Central Funds are not included in the Fund's expense ratio. The Fund indirectly bears its proportionate share of the expenses of any underlying Fidelity Central Funds.
E Amount does not include the portfolio activity of any underlying Fidelity Central Funds.
F Investment income per share reflects a special dividend which amounted to $.06 per share. Excluding the special dividend, the ratio of net investment income (loss) to average net assets would have been .61%.
G Expense ratios reflect operating expenses of the class. Expenses before reductions do not reflect amounts reimbursed by the investment adviser or reductions from brokerage service arrangements or reductions from other expense offset arrangements and do not represent the amount paid by the class during periods when reimbursements or reductions occur. Expenses net of fee waivers reflect expenses after reimbursement by the investment adviser but prior to reductions from brokerage service arrangements or other expense offset arrangements. Expenses net of all reductions represent the net expenses paid by the class.
H Total distributions of $1.48 per share is comprised of distributions from net investment income of $.077 and distributions from net realized gain of $1.405 per share.
See accompanying notes which are an integral part of the financial statements.
Annual Report
Financial Highlights - Service Class 2
Years ended December 31, | 2010 | 2009 | 2008 | 2007 | 2006 |
Selected Per-Share Data | | | | | |
Net asset value, beginning of period | $ 9.38 | $ 6.63 | $ 12.97 | $ 14.14 | $ 12.53 |
Income from Investment Operations | | | | | |
Net investment income (loss) C | .11 F | .05 | .11 | .06 | .12 |
Net realized and unrealized gain (loss) | 1.53 | 2.75 | (6.01) | .23 | 1.67 |
Total from investment operations | 1.64 | 2.80 | (5.90) | .29 | 1.79 |
Distributions from net investment income | (.11) | (.05) | (.07) | (.06) | (.10) |
Distributions from net realized gain | (.01) | - | (.37) | (1.41) | (.08) |
Total distributions | (.12) | (.05) | (.44) | (1.46) H | (.18) |
Net asset value, end of period | $ 10.90 | $ 9.38 | $ 6.63 | $ 12.97 | $ 14.14 |
Total Return A,B | 17.52% | 42.32% | (46.68)% | 1.86% | 14.32% |
Ratios to Average Net Assets D,G | | | | | |
Expenses before reductions | 1.00% | 1.05% | 1.04% | 1.02% | 1.15% |
Expenses net of fee waivers, if any | 1.00% | 1.05% | 1.04% | 1.02% | 1.10% |
Expenses net of all reductions | .99% | 1.05% | 1.04% | 1.02% | 1.09% |
Net investment income (loss) | 1.08% F | .70% | 1.01% | .43% | .91% |
Supplemental Data | | | | | |
Net assets, end of period (000 omitted) | $ 8,652 | $ 8,277 | $ 4,941 | $ 11,081 | $ 7,803 |
Portfolio turnover rate E | 160% | 73% | 53% | 52% | 263% |
A Total returns do not reflect charges attributable to your insurance company's separate account. Inclusion of these charges would reduce the total returns shown.
B Total returns would have been lower had certain expenses not been reduced during the periods shown.
C Calculated based on average shares outstanding during the period.
D Fees and expenses of the underlying Fidelity Central Funds are not included in the Fund's expense ratio. The Fund indirectly bears its proportionate share of the expenses of any underlying Fidelity Central Funds.
E Amount does not include the portfolio activity of any underlying Fidelity Central Funds.
F Investment income per share reflects a special dividend which amounted to $.06 per share. Excluding the special dividend, the ratio of net investment income (loss) to average net assets would have been .45%.
G Expense ratios reflect operating expenses of the class. Expenses before reductions do not reflect amounts reimbursed by the investment adviser or reductions from brokerage service arrangements or reductions from other expense offset arrangements and do not represent the amount paid by the class during periods when reimbursements or reductions occur. Expenses net of fee waivers reflect expenses after reimbursement by the investment adviser but prior to reductions from brokerage service arrangements or other expense offset arrangements. Expenses net of all reductions represent the net expenses paid by the class.
H Total distributions of $1.46 per share is comprised of distributions from net investment income of $.058 and distributions from net realized gain of $1.405 per share.
Financial Highlights - Investor Class
Years ended December 31, | 2010 | 2009 | 2008 | 2007 | 2006 |
Selected Per-Share Data | | | | | |
Net asset value, beginning of period | $ 9.46 | $ 6.69 | $ 13.09 | $ 14.26 | $ 12.63 |
Income from Investment Operations | | | | | |
Net investment income (loss) C | .12 F | .07 | .12 | .08 | .14 |
Net realized and unrealized gain (loss) | 1.56 | 2.77 | (6.06) | .23 | 1.69 |
Total from investment operations | 1.68 | 2.84 | (5.94) | .31 | 1.83 |
Distributions from net investment income | (.14) | (.07) | (.09) | (.08) | (.12) |
Distributions from net realized gain | (.01) | - | (.37) | (1.41) | (.08) |
Total distributions | (.15) | (.07) | (.46) | (1.48) H | (.20) |
Net asset value, end of period | $ 10.99 | $ 9.46 | $ 6.69 | $ 13.09 | $ 14.26 |
Total Return A,B | 17.74% | 42.41% | (46.53)% | 1.99% | 14.49% |
Ratios to Average Net Assets D,G | | | | | |
Expenses before reductions | .83% | .89% | .87% | .88% | .99% |
Expenses net of fee waivers, if any | .83% | .89% | .87% | .88% | .99% |
Expenses net of all reductions | .82% | .88% | .87% | .88% | .98% |
Net investment income (loss) | 1.25% F | .86% | 1.17% | .58% | 1.01% |
Supplemental Data | | | | | |
Net assets, end of period (000 omitted) | $ 64,242 | $ 56,380 | $ 36,199 | $ 61,052 | $ 37,239 |
Portfolio turnover rate E | 160% | 73% | 53% | 52% | 263% |
A Total returns do not reflect charges attributable to your insurance company's separate account. Inclusion of these charges would reduce the total returns shown.
B Total returns would have been lower had certain expenses not been reduced during the periods shown.
C Calculated based on average shares outstanding during the period.
D Fees and expenses of the underlying Fidelity Central Funds are not included in the Fund's expense ratio. The Fund indirectly bears its proportionate share of the expenses of any underlying Fidelity Central Funds.
E Amount does not include the portfolio activity of any underlying Fidelity Central Funds.
F Investment income per share reflects a special dividend which amounted to $.06 per share. Excluding the special dividend, the ratio of net investment income (loss) to average net assets would have been .61%.
G Expense ratios reflect operating expenses of the class. Expenses before reductions do not reflect amounts reimbursed by the investment adviser or reductions from brokerage service arrangements or reductions from other expense offset arrangements and do not represent the amount paid by the class during periods when reimbursements or reductions occur. Expenses net of fee waivers reflect expenses after reimbursement by the investment adviser but prior to reductions from brokerage service arrangements or other expense offset arrangements. Expenses net of all reductions represent the net expenses paid by the class.
H Total distributions of $1.48 per share is comprised of distributions from net investment income of $.078 and distributions from net realized gain of $1.405 per share.
See accompanying notes which are an integral part of the financial statements.
Annual Report
Notes to Financial Statements
For the period ended December 31, 2010
1. Organization.
VIP Value Portfolio (the Fund) is a fund of Variable Insurance Products Fund (the Trust) and is authorized to issue an unlimited number of shares. The Trust is registered under the Investment Company Act of 1940, as amended (the 1940 Act), as an open-end management investment company organized as a Massachusetts business trust. Shares of the Fund may only be purchased by insurance companies for the purpose of funding variable annuity or variable life insurance contracts. The Fund offers the following classes of shares: Initial Class shares, Service Class shares, Service Class 2 shares and Investor Class shares. All classes have equal rights and voting privileges, except for matters affecting a single class. Investment income, realized and unrealized capital gains and losses, the common expenses of the Fund, and certain fund-level expense reductions, if any, are allocated on a pro-rata basis to each class based on the relative net assets of each class to the total net assets of the Fund. Each class differs with respect to transfer agent and distribution and service plan fees incurred. Certain expense reductions also differ by class.
2. Investments in Fidelity Central Funds.
The Fund may invest in Fidelity Central Funds, which are open-end investment companies available only to other investment companies and accounts managed by Fidelity Management & Research Company (FMR) and its affiliates. The Fund's Schedule of Investments lists each of the Fidelity Central Funds held as of period end, if any, as an investment of the Fund, but does not include the underlying holdings of each Fidelity Central Fund. As an Investing Fund, the Fund indirectly bears its proportionate share of the expenses of the underlying Fidelity Central Funds.
The Money Market Central Funds seek preservation of capital and current income and are managed by Fidelity Investments Money Management, Inc. (FIMM), an affiliate of FMR.
A complete unaudited list of holdings for each Fidelity Central Fund is available upon request or at the Securities and Exchange Commission (the SEC) web site at www.sec.gov. In addition, the financial statements of the Fidelity Central Funds, which are not covered by the Fund's Report of Independent Registered Public Accounting Firm, are available on the SEC web site or upon request.
3. Significant Accounting Policies.
The financial statements have been prepared in conformity with accounting principles generally accepted in the United States of America (GAAP), which require management to make certain estimates and assumptions at the date of the financial statements. Actual results could differ from those estimates. Subsequent events, if any, through the date that the financial statements were issued have been evaluated in the preparation of the financial statements. The following summarizes the significant accounting policies of the Fund:
Security Valuation. Investments are valued as of 4:00 p.m. Eastern time on the last calendar day of the period. The Fund uses independent pricing services approved by the Board of Trustees to value its investments. When current market prices or quotations are not readily available or reliable, valuations may be determined in good faith in accordance with procedures adopted by the Board of Trustees. Factors used in determining value may include market or security specific events. The frequency with which these procedures are used cannot be predicted and they may be utilized to a significant extent. The value used for net asset value (NAV) calculation under these procedures may differ from published prices for the same securities.
The Fund categorizes the inputs to valuation techniques used to value its investments into a disclosure hierarchy consisting of three levels as shown below.
Level 1 - quoted prices in active markets for identical investments
Level 2 - other significant observable inputs (including quoted prices for similar investments, interest rates, prepayment speeds, etc.)
Level 3 - unobservable inputs (including the Fund's own assumptions based on the best information available)
Changes in valuation techniques may result in transfers in or out of an assigned level within the disclosure hierarchy. Valuation techniques used to value the Fund's investments by major category are as follows.
Equity securities, including restricted securities, for which market quotations are readily available, are valued at the last reported sale price or official closing price as reported by an independent pricing service on the primary market or exchange on which they are traded and are categorized as Level 1 in the hierarchy. In the event there were no sales during the day or closing prices are not available, securities are valued at the last quoted bid price or may be valued using the last available price and are generally categorized as Level 2 in the hierarchy. For foreign equity securities, when significant market or security specific events arise, comparisons to the valuation of American Depositary Receipts (ADRs), futures contracts, Exchange-traded funds (ETFs) and certain indexes as well as quoted prices for similar securities are used and are categorized as Level 2 in the hierarchy in these circumstances. Utilizing these techniques may result in transfers between Level 1 and Level 2. For restricted equity securities and private placements where observable inputs are limited, assumptions about market activity and risk are used and are categorized as Level 3 in the hierarchy.
Investments in open-end mutual funds, including the Fidelity Central Funds, are valued at their closing net asset value each business day and are categorized as Level 1 in the hierarchy.
Annual Report
3. Significant Accounting Policies - continued
Foreign Currency. The Fund uses foreign currency contracts to facilitate transactions in foreign-denominated securities. Gains and losses from these transactions may arise from changes in the value of the foreign currency or if the counterparties do not perform under the contracts' terms.
Foreign-denominated assets, including investment securities, and liabilities are translated into U.S. dollars at the exchange rate at period end. Purchases and sales of investment securities, income and dividends received and expenses denominated in foreign currencies are translated into U.S. dollars at the exchange rate in effect on the transaction date.
The effects of exchange rate fluctuations on investments are included with the net realized and unrealized gain (loss) on investment securities. Other foreign currency transactions resulting in realized and unrealized gain (loss) are disclosed separately.
Investment Transactions and Income. For financial reporting purposes, the Fund's investment holdings and NAV include trades executed through the end of the last business day of the period. The NAV per share for processing shareholder transactions is calculated as of the close of business of the New York Stock Exchange (NYSE), normally 4:00 p.m. Eastern time and includes trades executed through the end of the prior business day. Gains and losses on securities sold are determined on the basis of identified cost and may include proceeds received from litigation. Dividend income is recorded on the ex-dividend date, except for certain dividends from foreign securities where the ex-dividend date may have passed, which are recorded as soon as the Fund is informed of the ex-dividend date. Non-cash dividends included in dividend income, if any, are recorded at the fair market value of the securities received. Distributions received on securities that represent a return of capital or capital gain are recorded as a reduction of cost of investments and/or as a realized gain. The Fund estimates the components of distributions received that may be considered return of capital distributions or capital gain distributions. Large, non-recurring dividends recognized by the Fund are presented separately on the Statement of Operations as "Special Dividends" and the impact of these dividends is presented in the Financial Highlights. Interest income and distributions from the Fidelity Central Funds are accrued as earned. Interest income includes coupon interest and amortization of premium and accretion of discount on debt securities. Investment income is recorded net of foreign taxes withheld where recovery of such taxes is uncertain.
Expenses. Expenses directly attributable to a fund are charged to that fund. Expenses attributable to more than one fund are allocated among the respective funds on the basis of relative net assets or other appropriate methods. Expense estimates are accrued in the period to which they relate and adjustments are made when actual amounts are known.
Income Tax Information and Distributions to Shareholders. Each year the Fund intends to qualify as a regulated investment company, including distributing substantially all of its taxable income and realized gains under Subchapter M of the Internal Revenue Code and filing its U.S. federal tax return. As a result, no provision for income taxes is required. As of December 31, 2010, the Fund did not have any unrecognized tax benefits in the accompanying financial statements. A fund's federal tax return is subject to examination by the Internal Revenue Service (IRS) for a period of three years. Foreign taxes are provided for based on the Fund's understanding of the tax rules and rates that exist in the foreign markets in which it invests.
Distributions are declared and recorded on the ex-dividend date. Income dividends and capital gain distributions are declared separately for each class. Income and capital gain distributions are determined in accordance with income tax regulations, which may differ from GAAP.
Capital accounts within the financial statements are adjusted for permanent book-tax differences. These adjustments have no impact on net assets or the results of operations. Temporary book-tax differences will reverse in a subsequent period.
Book-tax differences are primarily due to foreign currency transactions, passive foreign investment companies (PFIC), market discount, partnerships, capital loss carryforwards and losses deferred due to wash sales and excise tax regulations.
The federal tax cost of investment securities and unrealized appreciation (depreciation) as of period end were as follows:
Gross unrealized appreciation | $ 22,251,968 |
Gross unrealized depreciation | (6,047,285) |
Net unrealized appreciation (depreciation) | $ 16,204,683 |
| |
Tax Cost | $ 136,722,565 |
The tax-based components of distributable earnings as of period end were as follows:
Capital loss carryforward | $ (26,689,507) |
Net unrealized appreciation (depreciation) | $ 16,204,415 |
The tax character of distributions paid was as follows:
| December 31, 2010 | December 31, 2009 |
Ordinary Income | $ 2,014,976 | $ 908,042 |
Annual Report
Notes to Financial Statements - continued
4. Purchases and Sales of Investments.
Purchases and sales of securities, other than short-term securities, aggregated $213,809,711 and $213,188,813, respectively.
5. Fees and Other Transactions with Affiliates.
Management Fee. FMR and its affiliates provide the Fund with investment management related services for which the Fund pays a monthly management fee. The management fee is the sum of an individual fund fee rate that is based on an annual rate of .30% of the Fund's average net assets and a group fee rate that averaged .26% during the period. The group fee rate is based upon the average net assets of all the mutual funds advised by FMR. The group fee rate decreases as assets under management increase and increases as assets under management decrease. For the period, the total annual management fee rate was .56% of the Fund's average net assets.
Distribution and Service Plan Fees. In accordance with Rule 12b-1 of the 1940 Act, the Fund has adopted separate 12b-1 Plans for each Service Class of shares. Each Service Class pays Fidelity Distributors Corporation (FDC), an affiliate of FMR, a service fee. For the period, the service fee is based on an annual rate of .10% of Service Class' average net assets and .25% of Service Class 2's average net assets.
For the period, total fees, all of which were re-allowed to insurance companies for the distribution of shares and providing shareholder support services were as follows:
Service Class | $ 245 |
Service Class 2 | 24,878 |
| $ 25,123 |
Transfer Agent Fees. Fidelity Investments Institutional Operations Company, Inc. (FIIOC), an affiliate of FMR, is the Fund's transfer, dividend disbursing, and shareholder servicing agent. FIIOC receives an asset-based fee with respect to each class. Each class (with the exception of Investor Class) pays a transfer agent fee, excluding out of pocket expenses, equal to an annual rate of .07% of average net assets. Investor Class pays a monthly asset-based transfer agent fee of .15% of average net assets. In addition, FIIOC receives an asset-based fee of .01% of average net assets for typesetting, printing and mailing of shareholder reports, except proxy statements. FIIOC has agreed to voluntarily waive this fee until December 31, 2010. (See Note 8: Expense Reductions.) For the period, transfer agent fees for each class, including printing and out of pocket expenses, were as follows:
Initial Class | $ 60,193 |
Service Class | 185 |
Service Class 2 | 8,575 |
Investor Class | 98,730 |
| $ 167,683 |
Accounting and Security Lending Fees. Fidelity Service Company, Inc. (FSC), an affiliate of FMR, maintains the Fund's accounting records. The accounting fee is based on the level of average net assets for the month. Under a separate contract, FSC administers the security lending program. The security lending fee is based on the number and duration of lending transactions.
Brokerage Commissions. The Fund placed a portion of its portfolio transactions with brokerage firms which are affiliates of the investment adviser. The commissions paid to these affiliated firms were $5,832 for the period.
6. Committed Line of Credit.
The Fund participates with other funds managed by FMR or an affiliate in a $3.75 billion credit facility (the "line of credit") to be utilized for temporary or emergency purposes to fund shareholder redemptions or for other short-term liquidity purposes. The Fund has agreed to pay commitment fees on its pro-rata portion of the line of credit, which amounted to $528 and is reflected in Miscellaneous expenses on the Statement of Operations. During the period, there were no borrowings on this line of credit.
7. Security Lending.
The Fund lends portfolio securities through a lending agent from time to time in order to earn additional income. The lending agent may loan securities to certain qualified borrowers, including Fidelity Capital Markets (FCM), a broker-dealer affiliated with the Fund. On the settlement date of the loan, the Fund receives collateral (in the form of U.S. Treasury obligations, letters of credit and/or cash) against the loaned securities and maintains collateral in an amount not less than 100% of the market value of the loaned securities during the period of the loan. The market value of the loaned securities is determined at the close of business of the Fund and any additional required collateral is delivered to the Fund on the next business day. If the borrower defaults on its obligation to return the securities loaned because of insolvency or other reasons, a fund could experience delays and costs in recovering the securities loaned or in gaining access to the collateral. Any cash collateral received is invested in the Fidelity Securities Lending Cash
Annual Report
7. Security Lending - continued
Central Fund. The value of loaned securities and cash collateral at period end are disclosed on the Fund's Statement of Assets and Liabilities. Security lending income represents the income earned on investing cash collateral, less rebates paid to borrowers and lending agent fees associated with the loan, plus any premium payments received for lending certain types of securities. Security lending income is presented in the Statement of Operations as a component of income from Fidelity Central Funds. Total security lending income during the period amounted to $5,956. During the period, there were no securities loaned to FCM.
8. Expense Reductions.
FMR or its affiliates agreed to waive certain fees during the period as noted in the table below.
Initial Class | $ 4,967 |
Service Class | 18 |
Service Class 2 | 722 |
Investor Class | 4,277 |
| $ 9,984 |
Many of the brokers with whom FMR places trades on behalf of the Fund provided services to the Fund in addition to trade execution. These services included payments of certain expenses on behalf of the Fund totaling $7,821 for the period.
9. Distributions to Shareholders.
Distributions to shareholders of each class were as follows:
Years ended December 31, | 2010 | 2009 |
From net investment income | | |
Initial Class | $ 1,033,189 | $ 478,243 |
Service Class | 3,201 | 1,636 |
Service Class 2 | 89,139 | 47,870 |
Investor Class | 794,913 | 380,293 |
Total | $ 1,920,442 | $ 908,042 |
From net realized gain | | |
Initial Class | $ 48,867 | $ - |
Service Class | 162 | - |
Service Class 2 | 5,473 | - |
Investor Class | 40,032 | - |
Total | $ 94,534 | $ - |
10. Share Transactions.
Transactions for each class of shares were as follows:
| Shares | Dollars |
Years ended December 31, | 2010 | 2009 | 2010 | 2009 |
Initial Class | | | | |
Shares sold | 2,529,638 | 2,751,446 | $ 25,307,034 | $ 21,075,692 |
Reinvestment of distributions | 100,005 | 51,811 | 1,082,056 | 478,243 |
Shares redeemed | (2,307,063) | (2,194,877) | (22,791,411) | (16,803,915) |
Net increase (decrease) | 322,580 | 608,380 | $ 3,597,679 | $ 4,750,020 |
Service Class | | | | |
Shares sold | 11 | 1,781 | $ 106 | $ 15,343 |
Reinvestment of distributions | 311 | 180 | 3,363 | 1,636 |
Shares redeemed | (3,333) | (19,214) | (32,263) | (127,485) |
Net increase (decrease) | (3,011) | (17,253) | $ (28,794) | $ (110,506) |
Service Class 2 | | | | |
Shares sold | 542,450 | 426,973 | $ 5,464,536 | $ 3,212,958 |
Reinvestment of distributions | 8,818 | 5,254 | 94,612 | 47,870 |
Shares redeemed | (640,164) | (294,560) | (6,413,192) | (2,309,735) |
Net increase (decrease) | (88,896) | 137,667 | $ (854,044) | $ 951,093 |
Investor Class | | | | |
Shares sold | 1,682,289 | 2,278,184 | $ 17,042,279 | $ 17,900,905 |
Reinvestment of distributions | 77,238 | 41,298 | 834,945 | 380,293 |
Shares redeemed | (1,874,299) | (1,772,319) | (18,516,832) | (13,319,693) |
Net increase (decrease) | (114,772) | 547,163 | $ (639,608) | $ 4,961,505 |
Annual Report
Notes to Financial Statements - continued
11. Other.
The Fund's organizational documents provide former and current trustees and officers with a limited indemnification against liabilities arising in connection with the performance of their duties to the Fund. In the normal course of business, the Fund may also enter into contracts that provide general indemnifications. The Fund's maximum exposure under these arrangements is unknown as this would be dependent on future claims that may be made against the Fund. The risk of material loss from such claims is considered remote.
At the end of the period, VIP Freedom 2020 was the owner of record of approximately 19% of the total outstanding shares of the Fund. The VIP Freedom Funds, VIP Freedom Lifetime Funds and VIP Investor Freedom Funds were the owners of record, in the aggregate, of approximately 55% of the total outstanding shares of the Fund. FMR or its affiliates were the owners of record of 94% of the total outstanding shares of the Fund.
Annual Report
Report of Independent Registered Public Accounting Firm
To the Trustees of Variable Insurance Products Fund and Shareholders of VIP Value Portfolio:
We have audited the accompanying statement of assets and liabilities of VIP Value Portfolio (the Fund), a fund of Variable Insurance Products Fund, including the schedule of investments, as of December 31, 2010, and the related statement of operations for the year then ended, the statement of changes in net assets for each of the two years in the period then ended, and the financial highlights for each of the five years in the period then ended. These financial statements and financial highlights are the responsibility of the Fund's management. Our responsibility is to express an opinion on these financial statements and financial highlights based on our audits.
We conducted our audits in accordance with the standards of the Public Company Accounting Oversight Board (United States). Those standards require that we plan and perform the audit to obtain reasonable assurance about whether the financial statements and financial highlights are free of material misstatement. The Fund is not required to have, nor were we engaged to perform, an audit of its internal control over financial reporting. Our audits included consideration of internal control over financial reporting as a basis for designing audit procedures that are appropriate in the circumstances, but not for the purpose of expressing an opinion on the effectiveness of the Fund's internal control over financial reporting. Accordingly, we express no such opinion. An audit also includes examining, on a test basis, evidence supporting the amounts and disclosures in the financial statements, assessing the accounting principles used and significant estimates made by management, as well as evaluating the overall financial statement presentation. Our procedures included confirmation of securities owned as of December 31, 2010, by correspondence with the custodians and brokers; where replies were not received from brokers, we performed other auditing procedures. We believe that our audits provide a reasonable basis for our opinion.
In our opinion, the financial statements and financial highlights referred to above present fairly, in all material respects, the financial position of VIP Value Portfolio as of December 31, 2010, the results of its operations for the year then ended, the changes in its net assets for each of the two years in the period then ended, and the financial highlights for each of the five years in the period then ended, in conformity with accounting principles generally accepted in the United States of America.
/s/ Deloitte & Touche LLP
DELOITTE & TOUCHE LLP
Boston, Massachusetts
February 15, 2011
Annual Report
The Trustees, Members of the Advisory Board, and executive officers of the trust and fund, as applicable, are listed below. The Board of Trustees governs the fund and is responsible for protecting the interests of shareholders. The Trustees are experienced executives who meet periodically throughout the year to oversee the fund's activities, review contractual arrangements with companies that provide services to the fund, oversee management of the risks associated with such activities and contractual arrangements, and review the fund's performance. Except for Mr. James C. Curvey, each of the Trustees oversees 219 funds advised by FMR or an affiliate. Mr. James C. Curvey oversees 408 funds advised by FMR or an affiliate.
The Trustees hold office without limit in time except that (a) any Trustee may resign; (b) any Trustee may be removed by written instrument, signed by at least two-thirds of the number of Trustees prior to such removal; (c) any Trustee who requests to be retired or who has become incapacitated by illness or injury may be retired by written instrument signed by a majority of the other Trustees; and (d) any Trustee may be removed at any special meeting of shareholders by a two-thirds vote of the outstanding voting securities of the trust. Each Trustee who is not an interested person (as defined in the 1940 Act) (Independent Trustee), shall retire not later than the last day of the calendar year in which his or her 72nd birthday occurs. The Independent Trustees may waive this mandatory retirement age policy with respect to individual Trustees. The executive officers and Advisory Board Members hold office without limit in time, except that any officer and Advisory Board Member may resign or may be removed by a vote of a majority of the Trustees at any regular meeting or any special meeting of the Trustees. Except as indicated, each individual has held the office shown or other offices in the same company for the past five years.
Experience, Skills, Attributes, and Qualifications of the Fund's Trustees. The Governance and Nominating Committee has adopted a statement of policy that describes the experience, qualifications, attributes, and skills that are necessary and desirable for potential Independent Trustee candidates (Statement of Policy). The Board believes that each Trustee satisfied at the time he or she was initially elected or appointed a Trustee, and continues to satisfy, the standards contemplated by the Statement of Policy. The Governance and Nominating Committee also engages professional search firms to help identify potential Independent Trustee candidates who have the experience, qualifications, attributes, and skills consistent with the Statement of Policy. From time to time, additional criteria based on the composition and skills of the current Independent Trustees, as well as experience or skills that may be appropriate in light of future changes to board composition, business conditions, and regulatory or other developments, have also been considered by the professional search firms and the Governance and Nominating Committee. In addition, the Board takes into account the Trustees' commitment and participation in Board and committee meetings, as well as their leadership of standing and ad hoc committees throughout their tenure.
In determining that a particular Trustee was and continues to be qualified to serve as a Trustee, the Board has considered a variety of criteria, none of which, in isolation, was controlling. The Board believes that, collectively, the Trustees have balanced and diverse experience, qualifications, attributes, and skills, which allow the Board to operate effectively in governing the fund and protecting the interests of shareholders. Information about the specific experience, skills, attributes, and qualifications of each Trustee, which in each case led to the Board's conclusion that the Trustee should serve (or continue to serve) as a trustee of the fund, is provided below.
Board Structure and Oversight Function. James C. Curvey is an interested person (as defined in the 1940 Act) and currently serves as Acting Chairman. The Trustees have determined that an interested Chairman is appropriate and benefits shareholders because an interested Chairman has a personal and professional stake in the quality and continuity of services provided to the fund. Independent Trustees exercise their informed business judgment to appoint an individual of their choosing to serve as Chairman, regardless of whether the Trustee happens to be independent or a member of management. The Independent Trustees have determined that they can act independently and effectively without having an Independent Trustee serve as Chairman and that a key structural component for assuring that they are in a position to do so is for the Independent Trustees to constitute a substantial majority for the Board. The Independent Trustees also regularly meet in executive session. Ned C. Lautenbach serves as Chairman of the Independent Trustees and as such (i) acts as a liaison between the Independent Trustees and management with respect to matters important to the Independent Trustees and (ii) with management prepares agendas for Board meetings.
Fidelity funds are overseen by different Boards of Trustees. The fund's Board oversees Fidelity's equity and high income funds and another Board oversees Fidelity's investment-grade bond, money market, and asset allocation funds. The asset allocation funds may invest in Fidelity funds overseen by the fund's Board. The use of separate Boards, each with its own committee structure, allows the Trustees of each group of Fidelity funds to focus on the unique issues of the funds they oversee, including common research, investment, and operational issues. On occasion, the separate Boards establish joint committees to address issues of overlapping consequences for the Fidelity funds overseen by each Board.
The Trustees operate using a system of committees to facilitate the timely and efficient consideration of all matters of importance to the Trustees, the fund, and fund shareholders and to facilitate compliance with legal and regulatory requirements and oversight of the fund's activities and associated risks. The Board, acting through its committees, has charged FMR and its affiliates with (i) identifying events or circumstances the occurrence of which could have demonstrably adverse effects on the fund's business and/or reputation; (ii) implementing processes and controls to lessen the possibility that such events or circumstances occur or to mitigate the effects of such events or circumstances if they do occur; and (iii) creating and maintaining a system designed to evaluate continuously business and market conditions in order to facilitate the identification and implementation processes described in (i) and (ii) above. Because the day-to-day operations and activities of the fund are carried out by or through FMR, its affiliates and other service providers, the fund's exposure to risks is mitigated but not eliminated by the processes overseen by the Trustees. While each of the Board's committees has responsibility for overseeing different aspects of the fund's activities, oversight is exercised primarily through the Operations, Audit, and Compliance Committees. Appropriate personnel, including but not limited to the fund's Chief Compliance Officer (CCO), FMR's internal auditor, the independent accountants, the fund's Treasurer and portfolio management personnel, make periodic reports to the Board's committees, as appropriate. The responsibilities of each committee, including their oversight responsibilities, are described further under "Standing Committees of the Fund's Trustees."
Annual Report
The fund's Statement of Additional Information (SAI) includes more information about the Trustees. To request a free copy, call Fidelity at 1-800-208-0098.
Interested Trustees*:
Correspondence intended for each Trustee who is an interested person may be sent to Fidelity Investments, 82 Devonshire Street, Boston, Massachusetts 02109.
Name, Age; Principal Occupations and Other Relevant Experience+ |
James C. Curvey (75) |
| Year of Election or Appointment: 2007 Mr. Curvey is Trustee and Acting Chairman of the Board of Trustees of certain Trusts. Mr. Curvey also serves as Trustee (2007-present) of other investment companies advised by FMR. Mr. Curvey is a Director of Fidelity Investments Money Management, Inc. (2009-present), Director of Fidelity Research & Analysis Co. (2009-present) and Director of FMR and FMR Co., Inc. (2007-present). Mr. Curvey is also Vice Chairman (2007-present) and Director of FMR LLC. In addition, Mr. Curvey serves as an Overseer for the Boston Symphony Orchestra and a member of the Trustees of Villanova University. Previously, Mr. Curvey was the Vice Chairman (2006-2007) and Director (2000-2007) of FMR Corp. |
Ronald P. O'Hanley (54) |
| Year of Election or Appointment: 2011 Mr. O'Hanley is President of Fidelity Asset Management and Corporate Services and a member of Fidelity's Executive Committee (2010-present). Previously, Mr. O'Hanley served as President and Chief Executive Officer of BNY Mellon Asset Management (2007-2010). Mr. O'Hanley also served as Vice Chairman of Bank New York Mellon Corp. and a member of that firm's Executive Committee. Prior to the 2007 merger of The Bank of New York and Mellon Financial Corporation, he was Vice Chairman of Mellon Financial Corporation and President and Chief Executive Officer of Mellon Asset Management. He joined Mellon in February 1997. Mr. O'Hanley currently serves as Chairman of the Boston Public Library Foundation Board of Directors and sits on the Board of Directors of Beth Israel Deaconess Medical Center, the Board of Trustees of the Marine Biological Laboratory and the Advisory Board of the Maxwell School of Citizenship and Public Administration at Syracuse University. Mr. O'Hanley also chairs the Council on Asset Management for the Financial Services Roundtable and is a member of the Board of Directors of Institutional Investor's U.S. Institute. |
* Trustees have been determined to be "Interested Trustees" by virtue of, among other things, their affiliation with the trust or various entities under common control with FMR.
+ The information above includes each Trustee's principal occupation during the last five years and other information relating to the experience, attributes, and skills relevant to each Trustee's qualifications to serve as a Trustee, which led to the conclusion that each Trustee should serve as a Trustee for the fund.
Independent Trustees:
Correspondence intended for each Independent Trustee (that is, the Trustees other than the Interested Trustees) may be sent to Fidelity Investments, P.O. Box 55235, Boston, Massachusetts 02205-5235.
Name, Age; Principal Occupations and Other Relevant Experience+ |
Dennis J. Dirks (62) |
| Year of Election or Appointment: 2005 Prior to his retirement in May 2003, Mr. Dirks was Chief Operating Officer and a member of the Board of The Depository Trust & Clearing Corporation (DTCC). He also served as President, Chief Operating Officer, and Board member of The Depository Trust Company (DTC) and President and Board member of the National Securities Clearing Corporation (NSCC). In addition, Mr. Dirks served as Chief Executive Officer and Board member of the Government Securities Clearing Corporation, Chief Executive Officer and Board member of the Mortgage-Backed Securities Clearing Corporation, as a Trustee and a member of the Finance Committee of Manhattan College (2005-2008), and as a Trustee and a member of the Finance Committee of AHRC of Nassau County (2006-2008). Mr. Dirks is a member of the Independent Directors Council (IDC) Governing Council (2010-Present) and Board of Directors for The Brookville Center for Children's Services, Inc. (2009-present). |
Alan J. Lacy (57) |
| Year of Election or Appointment: 2008 Mr. Lacy serves as Senior Adviser (2007-present) of Oak Hill Capital Partners, L.P. (private equity). Mr. Lacy also served as Chief Executive Officer (2000-2005) and Vice Chairman (2005-2006) of Sears Holdings Corporation and Sears, Roebuck and Co. (retail). In addition, Mr. Lacy serves as a member of the Board of Directors of The Western Union Company (global money transfer, 2006-present) and Bristol-Myers Squibb Company (global pharmaceuticals, 2007-present). Mr. Lacy is Chairman (2008-present) and a member (2006-present) of the Board of Trustees of The National Parks Conservation Association. |
Ned C. Lautenbach (66) |
| Year of Election or Appointment: 2000 Mr. Lautenbach is Chairman of the Independent Trustees of the Equity and High Income Funds (2006-present). Mr. Lautenbach currently serves as the Lead Director of the Eaton Corporation Board of Directors (diversified industrial, 1997-present). Mr. Lautenbach is also a member of the Board of Directors of the Philharmonic Center for the Arts in Naples, Florida (1999-present); a member of the Board of Trustees of Fairfield University (2005-present); and a member of the Council on Foreign Relations (1994-present). Previously, Mr. Lautenbach was a Partner/Advisory Partner at Clayton, Dubilier & Rice, Inc. (private equity investment, 1998-2010), as well as a Director of Sony Corporation (2006-2007). |
Joseph Mauriello (66) |
| Year of Election or Appointment: 2008 Prior to his retirement in January 2006, Mr. Mauriello served in numerous senior management positions including Deputy Chairman and Chief Operating Officer (2004-2005), and Vice Chairman of Financial Services (2002-2004) of KPMG LLP US (professional services, 1965-2005). Mr. Mauriello currently serves as a member of the Board of Directors of XL Group plc. (global insurance and re-insurance, 2006-present) and of Arcadia Resources Inc. (health care services and products, 2007-present). Previously, Mr. Mauriello served as a Director of the Hamilton Funds of the Bank of New York (2006-2007). |
Cornelia M. Small (66) |
| Year of Election or Appointment: 2005 Ms. Small is a member of the Board of Directors of the Teagle Foundation (2009-present). Ms. Small is also a member of the Investment Committee, and Chair (2008-present) and a member of the Board of Trustees of Smith College. In addition, Ms. Small serves on the Investment Committee of the Berkshire Taconic Community Foundation (2008-present). Previously, Ms. Small served as Chairperson of the Investment Committee (2002-2008) of Smith College. In addition, Ms. Small served as Chief Investment Officer, Director of Global Equity Investments, and a member of the Board of Directors of Scudder, Stevens & Clark and Scudder Kemper Investments. |
William S. Stavropoulos (71) |
| Year of Election or Appointment: 2001 Mr. Stavropoulos is Vice Chairman of the Independent Trustees of the Equity and High Income Funds (2006-present). Mr. Stavropoulos serves as President and Founder of the Michigan Baseball Foundation, the Great Lakes Loons (2007-present). Mr. Stavropoulos is Chairman Emeritus of the Board of Directors of The Dow Chemical Company, where he previously served in numerous senior management positions, including President, CEO (1995-2000; 2002-2004), Chairman of the Executive Committee (2000-2006), and as a member of the Board of Directors (1990-2006). Currently, Mr. Stavropoulos is Chairman of Univar (global distributor of commodity and specialty chemicals, 2010-present), a Director of Teradata Corporation (data warehousing and technology solutions, 2008-present), Chemical Financial Corporation, Maersk Inc. (industrial conglomerate), Tyco International, Inc. (multinational manufacturing and services, 2007-present), and a member of the Advisory Board for Metalmark Capital (private equity investment, 2005-present). Mr. Stavropoulos is a special advisor to Clayton, Dubilier & Rice, LLC (private equity investment). In addition, Mr. Stavropoulos is a member of the University of Notre Dame Advisory Council for the College of Science. |
David M. Thomas (61) |
| Year of Election or Appointment: 2008 Previously, Mr. Thomas served as Executive Chairman (2005-2006) and Chairman and Chief Executive Officer (2000-2005) of IMS Health, Inc. (pharmaceutical and healthcare information solutions). In addition, Mr. Thomas serves as a member of the Board of Directors of Fortune Brands, Inc. (consumer products), and Interpublic Group of Companies, Inc. (marketing communication, 2004-present). |
Michael E. Wiley (60) |
| Year of Election or Appointment: 2008 Mr. Wiley also serves as a Director of Asia Pacific Exploration Consolidated (international oil and gas exploration and production, 2008-present). Mr. Wiley serves as a Director of Tesoro Corporation (independent oil refiner and marketer, 2005-present), and a Director of Bill Barrett Corporation (exploration and production, 2005-present). In addition, Mr. Wiley also serves as a Director of Post Oak Bank (privately-held bank, 2004-present). Previously, Mr. Wiley served as a member of the Board of Trustees of the University of Tulsa (2000-2006; 2007-2010), as a Senior Energy Advisor of Katzenbach Partners, LLC (consulting, 2006-2007), as an Advisory Director of Riverstone Holdings (private investment), Chairman, President, and CEO of Baker Hughes, Inc. (oilfield services, 2000-2004), and as Director of Spinnaker Exploration Company (exploration and production, 2001-2005). |
+ The information above includes each Trustee's principal occupation during the last five years and other information relating to the experience, attributes, and skills relevant to each Trustee's qualifications to serve as a Trustee, which led to the conclusion that each Trustee should serve as a Trustee for the fund.
Advisory Board Members and Executive Officers:
Correspondence intended for each executive officer, Edward C. Johnson 3d, and Peter S. Lynch may be sent to Fidelity Investments, 82 Devonshire Street, Boston, Massachusetts 02109.
Name, Age; Principal Occupation |
Edward C. Johnson 3d (80) |
| Year of Election or Appointment: 2011 Member of the Advisory Board of Fidelity's Equity and High Income Funds. Formerly Trustee and Chairman of the Board of Trustees of certain Trusts, Mr. Johnson serves as Chief Executive Officer, Chairman, and a Director of FMR LLC; Chairman and a Director of FMR; and Chairman and a Director of FMR Co., Inc. In addition, Mr. Johnson serves as Chairman and Director of FIL Limited. Previously, Mr. Johnson served as President of FMR LLC (2006-2007). |
Peter S. Lynch (66) |
| Year of Election or Appointment: 2003 Member of the Advisory Board of Fidelity's Equity and High Income Funds. Mr. Lynch is Vice Chairman and a Director of FMR and FMR Co., Inc. In addition, Mr. Lynch serves as a Trustee of Boston College and as the Chairman of the Inner-City Scholarship Fund. Previously, Mr. Lynch served on the Special Olympics International Board of Directors (1997-2006). |
Kenneth B. Robins (41) |
| Year of Election or Appointment: 2008 President and Treasurer of Fidelity's Equity and High Income Funds. Mr. Robins also serves as President and Treasurer (2010-present) and Assistant Treasurer (2009-present) of other Fidelity funds and is an employee of Fidelity Investments (2004-present). Previously, Mr. Robins served as Deputy Treasurer of the Fidelity funds (2005-2008) and Treasurer and Chief Financial Officer of The North Carolina Capital Management Trust: Cash and Term Portfolios (2006-2008). |
Bruce T. Herring (45) |
| Year of Election or Appointment: 2006 Vice President of certain Equity Funds. Mr. Herring also serves as Chief Investment Officer and Director of Fidelity Management & Research (U.K.) Inc. (2010-present) and Group Chief Investments Officer of FMR. Previously, Mr. Herring served as Vice President (2005-2006) and Senior Vice President (2006-2007) of Fidelity Management & Research Company, Vice President of FMR Co., Inc. (2001-2007) and as a portfolio manager for Fidelity U.S. Equity Funds. |
Brian B. Hogan (46) |
| Year of Election or Appointment: 2009 Vice President of certain Equity Funds and Vice President of Sector Funds. Mr. Hogan also serves as President of FMR's Equity Division (2009-present). Previously, Mr. Hogan served as Senior Vice President, Equity Research of FMR (2006-2009) and as a portfolio manager. |
Scott C. Goebel (42) |
| Year of Election or Appointment: 2008 Secretary and Chief Legal Officer (CLO) of the Fidelity funds. Mr. Goebel also serves as Secretary and CLO of The North Carolina Capital Management Trust: Cash and Term Portfolio (2008-present); General Counsel, Secretary, and Senior Vice President of FMR (2008-present) and FMR Co., Inc. (2008-present); Deputy General Counsel of FMR LLC; Chief Legal Officer of Fidelity Management & Research (Hong Kong) Limited (2008-present) and Assistant Secretary of Fidelity Management & Research (Japan) Inc. (2008-present), Fidelity Investments Money Management, Inc. (2008-present), Fidelity Management & Research (U.K.) Inc. (2008-present), and Fidelity Research and Analysis Company (2008-present). Previously, Mr. Goebel served as Assistant Secretary of the Funds (2007-2008) and as Vice President and Secretary of Fidelity Distributors Corporation (FDC) (2005-2007). |
William C. Coffey (41) |
| Year of Election or Appointment: 2009 Assistant Secretary of Fidelity's Equity and High Income Funds. Mr. Coffey also serves as Senior Vice President and Deputy General Counsel of FMR LLC (2010-present), and is an employee of Fidelity Investments. Previously, Mr. Coffey served as Vice President and Associate General Counsel of FMR LLC (2005-2009). |
Holly C. Laurent (56) |
| Year of Election or Appointment: 2008 Anti-Money Laundering (AML) Officer of the Fidelity funds. Ms. Laurent also serves as AML Officer of The North Carolina Capital Management Trust: Cash and Term Portfolio (2008-present) and is an employee of Fidelity Investments. Previously, Ms. Laurent was Senior Vice President and Head of Legal for Fidelity Business Services India Pvt. Ltd. (2006-2008), and Senior Vice President, Deputy General Counsel and Group Head for FMR LLC (2005-2006). |
Christine Reynolds (52) |
| Year of Election or Appointment: 2008 Chief Financial Officer of the Fidelity funds. Ms. Reynolds became President of Fidelity Pricing and Cash Management Services (FPCMS) in August 2008. Ms. Reynolds served as Chief Operating Officer of FPCMS (2007-2008). Previously, Ms. Reynolds served as President, Treasurer, and Anti-Money Laundering officer of the Fidelity funds (2004-2007). |
Kenneth A. Rathgeber (63) |
| Year of Election or Appointment: 2004 Chief Compliance Officer of Fidelity's Equity and High Income Funds. Mr. Rathgeber is Chief Compliance Officer of Fidelity Management & Research (Hong Kong) Limited (2008-present), Fidelity Management & Research (Japan) Inc. (2008-present), FMR (2005-present), FMR Co., Inc. (2005-present), Fidelity Management & Research (U.K.) Inc. (2005-present), Fidelity Research & Analysis Company (2005-present), Fidelity Investments Money Management, Inc. (2005-present), Pyramis Global Advisors, LLC (2005-present), and Strategic Advisers, Inc. (2005-present). |
Jeffrey S. Christian (49) |
| Year of Election or Appointment: 2009 Deputy Treasurer of the Fidelity funds. Mr. Christian is an employee of Fidelity Investments. Previously, Mr. Christian served as Chief Financial Officer (2008-2009) of certain Fidelity funds and Senior Vice President of Fidelity Pricing and Cash Management Services (FPCMS) (2004-2009). |
Bryan A. Mehrmann (49) |
| Year of Election or Appointment: 2005 Deputy Treasurer of the Fidelity funds. Mr. Mehrmann is an employee of Fidelity Investments. |
Adrien E. Deberghes (43) |
| Year of Election or Appointment: 2008 Deputy Treasurer of Fidelity's Equity and High Income Funds. Mr. Deberghes also serves as Assistant Treasurer of other Fidelity funds (2010-present) and is an employee of Fidelity Investments (2008-present). Previously, Mr. Deberghes served as Senior Vice President of Mutual Fund Administration at State Street Corporation (2007-2008), Senior Director of Mutual Fund Administration at Investors Bank & Trust (2005-2007), and Director of Finance for Dunkin' Brands (2000-2005). |
Stephanie J. Dorsey (41) |
| Year of Election or Appointment: 2010 Assistant Treasurer of Fidelity's Equity and High Income Funds. Ms. Dorsey also serves as Deputy Treasurer of other Fidelity funds (2008-present) and is an employee of Fidelity Investments (2008-present). Previously, Ms. Dorsey served as Treasurer (2004-2008) of the JPMorgan Mutual Funds and Vice President (2004-2008) of JPMorgan Chase Bank. |
John R. Hebble (52) |
| Year of Election or Appointment: 2009 Assistant Treasurer of Fidelity's Equity and High Income Funds. Mr. Hebble also serves as Treasurer and Chief Financial Officer of The North Carolina Capital Management Trust: Cash and Term Portfolio (2008-present), President and Treasurer of other Fidelity funds (2008-present) and is an employee of Fidelity Investments. |
Gary W. Ryan (52) |
| Year of Election or Appointment: 2005 Assistant Treasurer of the Fidelity funds. Mr. Ryan is an employee of Fidelity Investments. Previously, Mr. Ryan served as Vice President of Fund Reporting in Fidelity Pricing and Cash Management Services (FPCMS) (1999-2005). |
Jonathan Davis (42) |
| Year of Election or Appointment: 2010 Assistant Treasurer of the Fidelity funds. Mr. Davis is an employee of Fidelity Investments. Previously, Mr. Davis served as Vice President and Associate General Counsel of FMR LLC (2003-2010). |
Annual Report
A percentage of the dividends distributed during the fiscal year for the following classes qualifies for the dividends-received deduction for corporate shareholders:
Initial Class | 100% |
Service Class | 100% |
Service Class 2 | 100% |
Investor Class | 100% |
Annual Report
Board Approval of Investment Advisory Contracts and Management Fees
VIP Value Portfolio
Each year, the Board of Trustees, including the Independent Trustees (together, the Board), votes on the renewal of the management contract and sub-advisory agreements (together, the Advisory Contracts) for the fund. The Board, assisted by the advice of fund counsel and Independent Trustees' counsel, requests and considers a broad range of information relevant to the renewal of the Advisory Contracts throughout the year.
The Board meets regularly and considers at each of its meetings factors that are relevant to its annual consideration of the renewal of the fund's Advisory Contracts, including the services and support provided to the fund and its shareholders. The Board has established various standing committees, each composed of Independent Trustees with varying backgrounds, to which the Board has assigned specific subject matter responsibilities in order to enhance effective decision-making by the Board. The Board, acting directly and through its Committees, requests and receives information concerning the annual consideration of the renewal of the fund's Advisory Contracts. The Board also meets as needed to consider matters specifically related to the Board's annual consideration of the renewal of Advisory Contracts. Members of the Board may also meet with trustees of other Fidelity funds through ad hoc joint committees to discuss certain matters relevant to the Fidelity funds.
At its July 2010 meeting, the Board of Trustees, including the Independent Trustees, unanimously determined to renew the fund's Advisory Contracts. In reaching its determination, the Board considered all factors it believed relevant, including (i) the nature, extent, and quality of the services to be provided to the fund and its shareholders (including the investment performance of the fund); (ii) the competitiveness of the fund's management fee and total expenses; (iii) the total costs of the services to be provided by and the profits to be realized by Fidelity from its relationship with the fund; (iv) the extent to which economies of scale would be realized as the fund grows; and (v) whether fee levels reflect these economies of scale, if any, for the benefit of fund shareholders.
In considering whether to renew the Advisory Contracts for the fund, the Board reached a determination, with the assistance of fund counsel and Independent Trustees' counsel and through the exercise of its business judgment, that the renewal of the Advisory Contracts is in the best interests of fund shareholders and that the compensation to be received by Fidelity under the management contract is fair and reasonable. The Board's decision to renew the Advisory Contracts was not based on any single factor noted above, but rather was based on a comprehensive consideration of all the information provided to the Board at its meetings throughout the year. The Board, in reaching its determination to renew the Advisory Contracts, is aware that shareholders in the fund have a broad range of investment choices available to them, including a wide choice among mutual funds offered by Fidelity's competitors, and that the fund's shareholders, with the opportunity to review and weigh the disclosure provided by the fund in its prospectus and other public disclosures, have chosen to invest in this fund, managed by Fidelity.
Nature, Extent, and Quality of Services Provided. The Board considered the staffing within the investment adviser, FMR, and the sub-advisers (together, the Investment Advisers), including the backgrounds of the fund's investment personnel and the fund's investment objective and discipline. The Independent Trustees also had discussions with senior management of Fidelity's investment operations and investment groups. The Board considered the structure of the portfolio manager compensation program and whether this structure provides appropriate incentives to act in the best interest of the fund.
Resources Dedicated to Investment Management and Support Services. The Board and the equity research subcommittee of the Board's Fund Oversight Committee reviewed the size, education, and experience of the Investment Advisers' investment staff, their use of technology, and the Investment Advisers' approach to recruiting, training, and retaining portfolio managers and other research, advisory, and management personnel. The Board noted that Fidelity's analysts have access to a variety of technological tools and market and securities data that enable them to perform both fundamental and quantitative analysis and to specialize in various disciplines. The Board considered Fidelity's extensive global research capabilities that enable the Investment Advisers to aggregate data from various sources in an effort to produce positive investment results. The Board also considered that Fidelity's portfolio managers and analysts have access to daily portfolio attribution that allows for monitoring of a fund's portfolio, as well as an electronic communication system that provides immediate real-time access to research concerning issuers and credit enhancers. The Board noted FMR's continued focus on strengthening the organization and discipline of equity portfolio management and research.
Shareholder and Administrative Services. The Board considered (i) the nature, extent, quality, and cost of advisory, administrative, and shareholder services performed by the Investment Advisers and their affiliates under the Advisory Contracts and under separate agreements covering transfer agency, pricing and bookkeeping, and securities lending services for the fund; (ii) the nature and extent of the investment adviser's supervision of third party service providers, principally custodians and subcustodians; and (iii) the resources devoted to, and the record of compliance with, the fund's compliance policies and procedures. The Board also reviewed the allocation of fund brokerage, including allocations to brokers affiliated with the Investment Advisers, the use of brokerage commissions to pay fund expenses, and the use of "soft" commission dollars to pay for research services.
The Board noted that the growth of fund assets over time across the complex allows Fidelity to reinvest in the development of services designed to enhance the value or convenience of the Fidelity funds as investment vehicles. These services include 24-hour access to account information and market information through phone representatives and over the Internet, and investor education materials and asset allocation tools.
Investment in a Large Fund Family. The Board considered the benefits to shareholders of investing in a Fidelity fund, including the benefits of investing in a fund that is part of a large family of funds offering a variety of investment disciplines and providing a large variety of mutual fund investor services. The Board noted that Fidelity had taken, or had made recommendations that resulted in the Fidelity funds taking, a number of actions over the previous year that benefited particular funds, including (i) dedicating additional resources to investment research and restructuring and broadening the focus of the investment research teams; (ii) bolstering the senior management team that oversees asset management; (iii) launching Class F of certain funds as a lower-fee class available to Freedom K and Freedom Index Funds; (iv) lowering the initial investment minimums and ongoing balance requirements for Real Estate High Income Fund; (v) eliminating subsequent purchase minimums for all funds and adding a waiver of the investment minimum requirement for new accounts opened with the proceeds of a systematic withdrawal plan; (vi) eliminating the withdrawal minimum and maximum limits for systematic withdrawals from Advisor funds; (vii) expanding sales load waivers on Class A shares for Destiny Planholders and expanding Institutional Class eligibility for Class O Destiny Planholders; and (viii) changing certain Class A and Class T sales charge structures to further align them with industry practices.
Annual Report
Board Approval of Investment Advisory Contracts and Management Fees - continued
Investment Performance. The Board considered whether the fund has operated in accordance with its investment objective, as well as its record of compliance with its investment restrictions. It also reviewed the fund's absolute investment performance for each class, as well as the fund's relative investment performance for each class measured over multiple periods against (i) a broad-based securities market index, and (ii) a peer group of mutual funds deemed appropriate by Fidelity and reviewed by the Board. The following charts considered by the Board show, over the one-, three-, and five-year periods ended December 31, 2009, the cumulative total returns of Initial Class and Service Class 2 of the fund, the cumulative total returns of a broad-based securities market index ("benchmark"), and a range of cumulative total returns of a peer group of mutual funds identified by Morningstar, Inc. as having an investment style similar to that of the fund based on underlying portfolio holdings. The returns of Initial Class and Service Class 2 show the performance of the highest and lowest performing classes, respectively (based on five-year performance). The box within each chart shows the 25th percentile return (bottom of box) and the 75th percentile return (top of box) of the peer group. Returns shown above the box are in the first quartile and returns shown below the box are in the fourth quartile. The percentage beaten numbers noted below each chart correspond to the percentile box and represent the percentage of funds in the peer group whose performance was equal to or lower than that of the class indicated.
VIP Value Portfolio
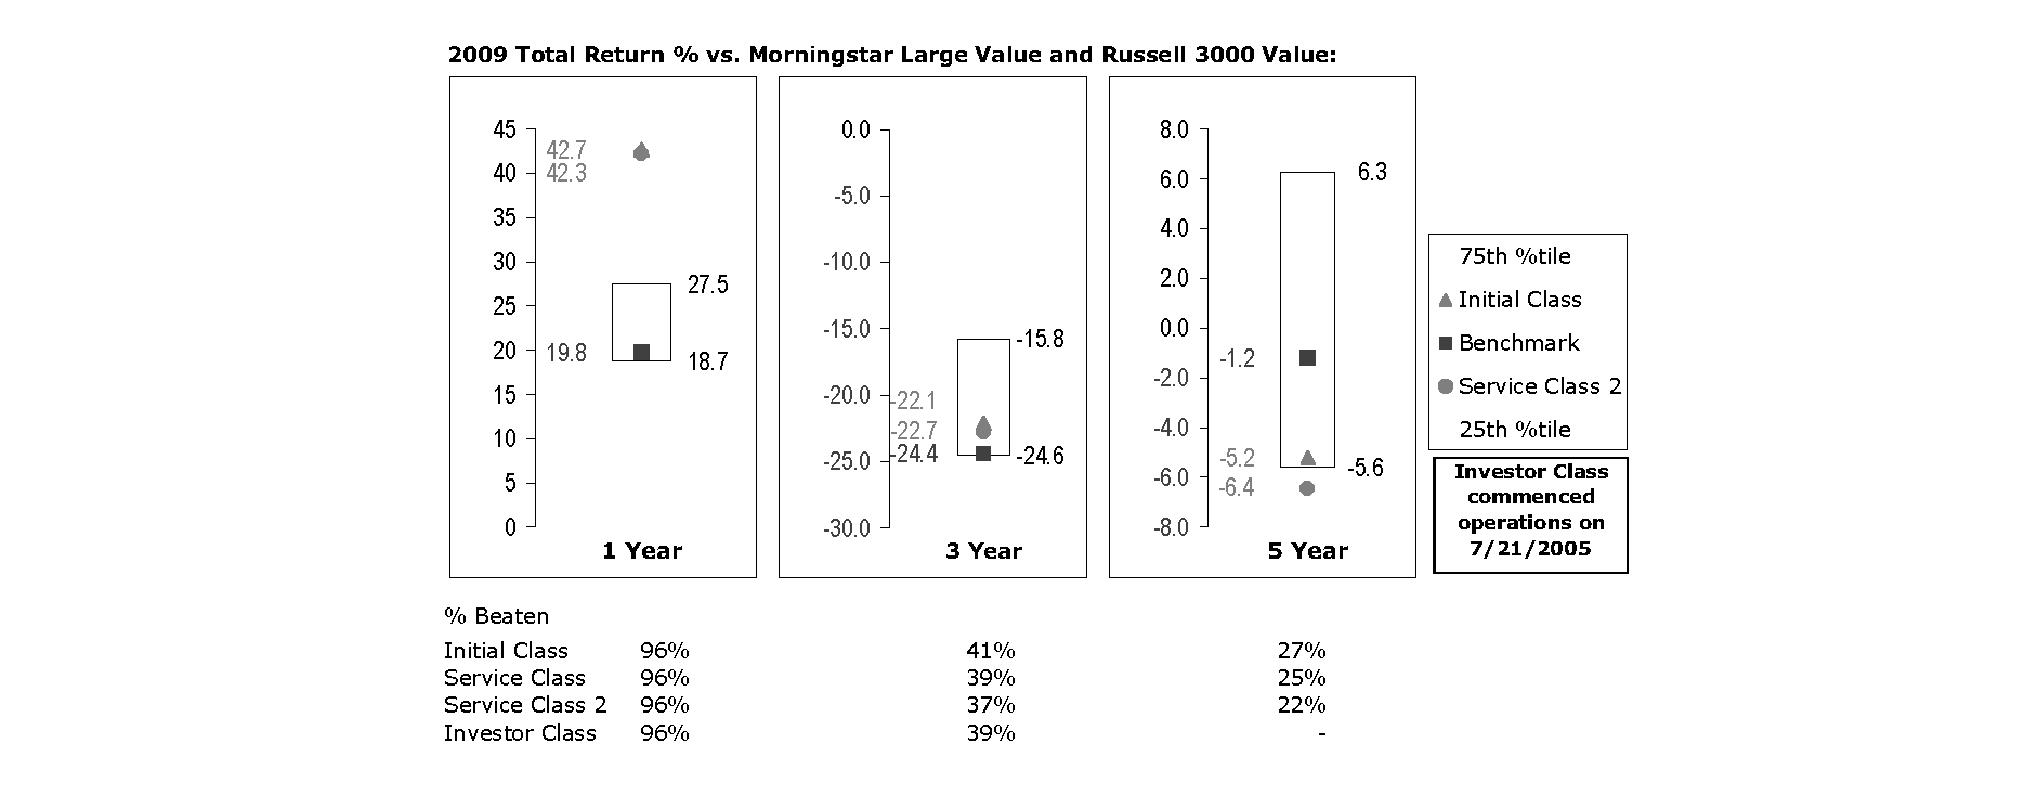
The Board reviewed the fund's relative investment performance against its peer group and noted that the performance of Initial Class of the fund was in the first quartile for the one-year period and the third quartile for the three- and five-year periods. The Board also noted that the investment performance of Initial Class of the fund compared favorably to its benchmark for the one- and three-year periods, although the fund's five-year cumulative total return was lower than its benchmark. The Board considered that the variations in performance among the fund's classes reflect the variations in class expenses, which result in lower performance for higher expense classes. The Board also reviewed the fund's performance since inception as well as performance in the current year.
Based on its review, and giving particular weight to the nature and quality of the resources dedicated by the Investment Advisers to maintain and improve relative performance and factoring in the unprecedented market events in recent years, the Board concluded that the nature, extent, and quality of investment management and support services and of shareholder and administrative services provided to the fund will benefit the fund's shareholders, particularly in light of the Board's view that the fund's shareholders benefit from investing in a fund that is part of a large family of funds offering a variety of investment disciplines and services.
Competitiveness of Management Fee and Total Fund Expenses. The Board considered the fund's management fee and total expenses compared to "mapped groups" of competitive funds and classes. Fidelity creates "mapped groups" by combining similar Lipper investment objective categories that have comparable management fee characteristics. Combining Lipper investment objective categories aids the Board's management fee and total expense comparisons by broadening the competitive group used for comparison and by reducing the number of universes to which various Fidelity funds are compared.
Annual Report
Management Fee. The Board considered two proprietary management fee comparisons for the 12-month periods shown in the chart below. The group of Lipper funds used by the Board for management fee comparisons is referred to below as the "Total Mapped Group." The Total Mapped Group comparison focuses on a fund's standing relative to the total universe of comparable funds available to investors, in terms of gross management fees before expense reimbursements or caps. "TMG %" represents the percentage of funds in the Total Mapped Group that had management fees that were lower than the fund's. For example, a TMG % of 10% means that 90% of the funds in the Total Mapped Group had higher management fees than the fund. The "Asset-Size Peer Group" (ASPG) comparison focuses on a fund's standing relative to non-Fidelity funds similar in size to the fund within the Total Mapped Group. The ASPG represents at least 15% of the funds in the Total Mapped Group with comparable asset size and management fee characteristics, subject to a minimum of 50 funds (or all funds in the Total Mapped Group if fewer than 50). Additional information, such as the ASPG quartile in which the fund's management fee ranked, is also included in the chart and considered by the Board.
VIP Value Portfolio
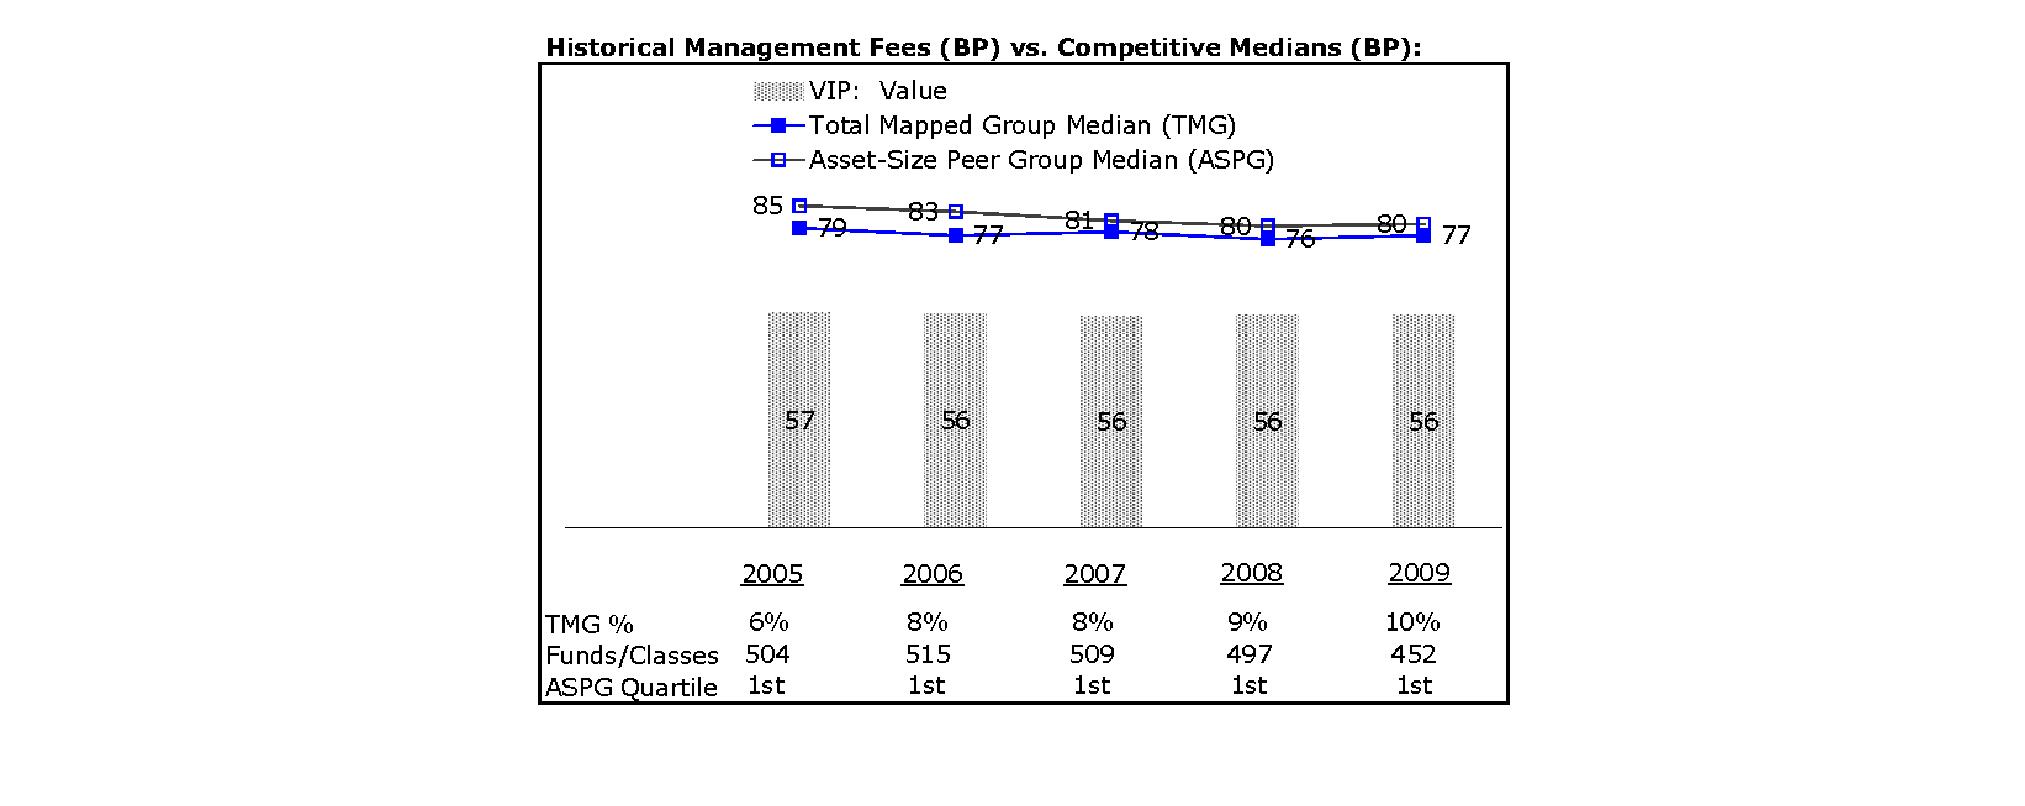
The Board noted that the fund's management fee ranked below the median of its Total Mapped Group and below the median of its ASPG for 2009.
Based on its review, the Board concluded that the fund's management fee is fair and reasonable in light of the services that the fund receives and the other factors considered.
Total Expenses. In its review of each class's total expenses, the Board considered the fund's management fee as well as other fund or class expenses, as applicable, such as transfer agent fees, pricing and bookkeeping fees, fund-paid 12b-1 fees, and custodial, legal, and audit fees. The Board also noted the effects of any waivers and reimbursements on fees and expenses. As part of its review, the Board also considered current and historical total expenses of each class of the fund compared to competitive fund median expenses. Each class of the fund is compared to those funds and classes in the Total Mapped Group (used by the Board for management fee comparisons) that have a similar sales load structure.
The Board noted that the total expenses of each of Initial Class, Investor Class, and Service Class ranked below its competitive median for 2009 and the total expenses of Service Class 2 ranked above its competitive median for 2009. The Board noted that the fund offers multiple classes, each of which has a different 12b-1 fee structure, and that the multiple structures are intended to offer a range of pricing options for the intermediary market. The Board also noted that the total expenses of the classes vary primarily by the level of their 12b-1 fees, although differences in transfer agent fees may also cause expenses to vary from class to class.
Fees Charged to Other Fidelity Clients. The Board also considered Fidelity fee structures and other information with respect to clients of FMR and its affiliates, such as other mutual funds advised or subadvised by FMR or its affiliates, pension plan clients, and other institutional clients. In March 2010, the Board created an ad hoc joint committee with the board of other Fidelity funds (the Committee) to review and compare Fidelity's institutional investment advisory business with its business of providing services to the Fidelity funds, including the differences in services provided, fees charged, and costs incurred, as well as competition in their respective marketplaces.
Annual Report
Board Approval of Investment Advisory Contracts and Management Fees - continued
Based on its review of total expenses and fees charged to other Fidelity clients, the Board concluded that the total expenses of each class of the fund were reasonable, although in one case above the median of the universe presented for comparison, in light of the services that the fund and its shareholders receive and the other factors considered, including the findings of the Committee.
Costs of the Services and Profitability. The Board considered the revenues earned and the expenses incurred by Fidelity in conducting the business of developing, marketing, distributing, managing, administering and servicing the fund and its shareholders. The Board also considered the level of Fidelity's profits in respect of all the Fidelity funds.
On an annual basis, FMR presents to the Board Fidelity's profitability for the fund. Fidelity calculates the profitability for each fund, as well as aggregate profitability for groups of Fidelity funds and all Fidelity funds, using a series of detailed revenue and cost allocation methodologies which originate with the audited books and records of Fidelity. The Audit Committee of the Board reviews any significant changes from the prior year's methodologies.
PricewaterhouseCoopers LLP (PwC), independent registered public accounting firm and auditor to Fidelity and certain Fidelity funds, has been engaged annually by the Board as part of the Board's assessment of Fidelity's profitability analysis. PwC's engagement includes the review and assessment of Fidelity's methodologies used in determining the revenues and expenses attributable to Fidelity's mutual fund business, and completion of agreed-upon procedures surrounding the mathematical accuracy of fund profitability and its conformity to allocation methodologies. After considering PwC's reports issued under the engagement and information provided by Fidelity, the Board believes that while other allocation methods may also be reasonable, Fidelity's profitability methodologies are reasonable in all material respects.
The Board has also reviewed Fidelity's non-fund businesses and fall-out benefits related to the mutual fund business as well as cases where Fidelity's affiliates may benefit from or be related to the fund's business.
The Board considered the costs of the services provided by and the profits realized by Fidelity in connection with the operation of the fund and were satisfied that the profitability was not excessive in the circumstances.
Economies of Scale. The Board considered whether there have been economies of scale in respect of the management of the Fidelity funds, whether the Fidelity funds (including the fund) have appropriately benefited from any such economies of scale, and whether there is potential for realization of any further economies of scale. The Board considered the extent to which the fund will benefit from economies of scale through increased services to the fund, through waivers or reimbursements, or through fee or expense reductions.
In February 2009, the Board and the board of other Fidelity funds created an ad hoc committee (the Economies of Scale Committee) to analyze whether FMR attains economies of scale in respect of the management and servicing of the Fidelity funds, whether the Fidelity funds have appropriately benefited from such economies of scale, and whether there is potential for realization of any further economies of scale.
The Board recognized that the fund's management contract incorporates a "group fee" structure, which provides for lower group fee rates as total fund assets under FMR's management increase, and for higher group fee rates as total fund assets under FMR's management decrease. FMR calculates the group fee rates based on a tiered asset "breakpoint" schedule that varies based on asset class. The Board considered that the group fee is designed to deliver the benefits of economies of scale to fund shareholders when total Fidelity fund assets increase, even if assets of any particular fund are unchanged or have declined, because some portion of Fidelity's costs are attributable to services provided to all Fidelity funds, and all funds benefit if those costs can be allocated among more assets. The Board concluded that, given the group fee structure, fund shareholders will benefit from lower management fees as assets under FMR's management increase at the fund complex level, regardless of whether Fidelity achieves any such economies of scale.
The Board concluded, considering the findings of the Economies of Scale Committee, that any potential economies of scale are being appropriately shared between fund shareholders and Fidelity.
Additional Information Requested by the Board. In order to develop fully the factual basis for consideration of the Fidelity funds' Advisory Contracts, the Board requested and received additional information on certain topics, including (i) fund performance trends, actions to be taken by FMR to improve certain funds' overall performance, and Fidelity's long-term strategies for certain funds; (ii) portfolio manager changes that have occurred during the past year and length of portfolio manager tenure for different categories of funds over time; (iii) Fidelity's compensation structure for portfolio managers, research analysts, and other key personnel, the rationale for the compensation structure, and how the compensation structure provides appropriate performance incentives; (iv) the amount of the investment that each portfolio manager has made in the Fidelity fund(s) that he or she manages; (v) management and other fees paid by FMR to affiliated sub-advisers on behalf of the Fidelity funds; (vi) Fidelity's fee structures and rationale for recommending different fees among different categories of funds; (vii) Fidelity's rationale for recommending which funds should have a performance adjustment component as part of their management fees; (viii) the rationale for any differences between fund fee structures and fee structures in place for other Fidelity clients; and (ix) explanations regarding the relative total expenses borne by certain funds and classes, total expense competitive trends, and actions that might be taken by FMR to reduce total expenses for certain funds and classes.
Based on its evaluation of all of the conclusions noted above, and after considering all factors it believed relevant, the Board ultimately concluded that the advisory fee structures are fair and reasonable, and that the fund's Advisory Contracts should be renewed.
Annual Report
Investment Adviser
Fidelity Management & Research Company
Boston, MA
Investment Sub-Advisers
FMR Co., Inc.
Fidelity Management & Research (U.K.) Inc.
Fidelity Management & Research (Hong Kong) Limited
Fidelity Management & Research (Japan) Inc.
General Distributor
Fidelity Distributors Corporation
Boston, MA
Transfer and Service Agents
Fidelity Investments Institutional Operations Company, Inc.
Boston, MA
Fidelity Service Company, Inc.
Boston, MA
Custodian
State Street Bank and Trust Company
Quincy, MA
VIPVAL-ANN-0211
1.768949.109
Item 2. Code of Ethics
As of the end of the period, December 31, 2010, Variable Insurance Products Fund (the trust) has adopted a code of ethics, as defined in Item 2 of Form N-CSR, that applies to its President and Treasurer and its Chief Financial Officer. A copy of the code of ethics is filed as an exhibit to this Form N-CSR.
Item 3. Audit Committee Financial Expert
The Board of Trustees of the trust has determined that Joseph Mauriello is an audit committee financial expert, as defined in Item 3 of Form N-CSR. Mr. Mauriello is independent for purposes of Item 3 of Form N-CSR.
Item 4. Principal Accountant Fees and Services
Fees and Services
The following table presents fees billed by Deloitte & Touche LLP, the member firms of Deloitte Touche Tohmatsu, and their respective affiliates (collectively, "Deloitte Entities") in each of the last two fiscal years for services rendered to Value Portfolio (the "Fund"):
Services Billed by Deloitte Entities
December 31, 2010 FeesA
| Audit Fees | Audit-Related Fees | Tax Fees | All Other Fees |
Value Portfolio | $42,000 | $- | $7,000 | $- |
December 31, 2009 FeesA
| Audit Fees | Audit-Related Fees | Tax Fees | All Other Fees |
Value Portfolio | $42,000 | $- | $7,000 | $- |
A Amounts may reflect rounding.
The following table presents fees billed by PricewaterhouseCoopers LLP ("PwC") in each of the last two fiscal years for services rendered to Equity-Income Portfolio, Growth Portfolio, High Income Portfolio and Overseas Portfolio (the "Funds"):
Services Billed by PwC
December 31, 2010 FeesA
| Audit Fees | Audit-Related Fees | Tax Fees | All Other Fees |
Equity-Income Portfolio | $66,000 | $- | $3,400 | $5,200 |
Growth Portfolio | $63,000 | $- | $3,000 | $4,000 |
High Income Portfolio | $68,000 | $- | $3,200 | $2,600 |
Overseas Portfolio | $61,000 | $- | $15,200 | $2,900 |
December 31, 2009 FeesA
| Audit Fees | Audit-Related Fees | Tax Fees | All Other Fees |
Equity-Income Portfolio | $70,000 | $- | $5,900 | $5,500 |
Growth Portfolio | $64,000 | $- | $4,000 | $4,000 |
High Income Portfolio | $76,000 | $- | $3,200 | $2,200 |
Overseas Portfolio | $64,000 | $- | $5,100 | $2,700 |
A Amounts may reflect rounding.
The following table presents fees billed by PwC and Deloitte Entities that were required to be approved by the Audit Committee for services that relate directly to the operations and financial reporting of the Funds and that are rendered on behalf of Fidelity Management & Research Company ("FMR") and entities controlling, controlled by, or under common control with FMR (not including any sub-adviser whose role is primarily portfolio management and is subcontracted with or overseen by another investment adviser) that provide ongoing services to the Funds ("Fund Service Providers"):
Services Billed by Deloitte Entities
| December 31, 2010A | December 31, 2009A |
Audit-Related Fees | $645,000 | $725,000 |
Tax Fees | $- | $- |
All Other Fees | $840,000 | $515,000 |
A Amounts may reflect rounding.
Services Billed by PwC
| December 31, 2010A | December 31, 2009A |
Audit-Related Fees | $2,505,000 | $2,655,000 |
Tax Fees | $- | $- |
All Other Fees | $510,000 | $- |
A Amounts may reflect rounding.
"Audit-Related Fees" represent fees billed for assurance and related services that are reasonably related to the performance of the fund audit or the review of the fund's financial statements and that are not reported under Audit Fees.
"Tax Fees" represent fees billed for tax compliance, tax advice or tax planning that relate directly to the operations and financial reporting of the fund.
"All Other Fees" represent fees billed for services provided to the fund or Fund Service Provider, a significant portion of which are assurance related, that relate directly to the operations and financial reporting of the fund, excluding those services that are reported under Audit Fees, Audit-Related Fees or Tax Fees.
Assurance services must be performed by an independent public accountant.
* * *
The aggregate non-audit fees billed by PwC and Deloitte Entities for services rendered to the Funds, FMR (not including any sub-adviser whose role is primarily portfolio management and is subcontracted with or overseen by another investment adviser), and any Fund Service Provider for each of the last two fiscal years of the Funds are as follows:
Billed By | December 31, 2010 A | December 31, 2009 A |
PwC | $5,050,000 | $4,575,000 |
Deloitte Entities | $1,585,000 | $1,245,000 |
A Amounts may reflect rounding.
The trust's Audit Committee has considered non-audit services that were not pre-approved that were provided by PwC and Deloitte Entities to Fund Service Providers to be compatible with maintaining the independence of PwC and Deloitte Entities in their audits of the Funds, taking into account representations from PwC and Deloitte Entities, in accordance with Public Company Accounting Oversight Board rules, regarding their independence from the Funds and their related entities and FMR's review of the appropriateness and permissibility under applicable law of such non-audit services prior to their provision to the Fund Service Providers.
Audit Committee Pre-Approval Policies and Procedures
The trust's Audit Committee must pre-approve all audit and non-audit services provided by a fund's independent registered public accounting firm relating to the operations or financial reporting of the fund. Prior to the commencement of any audit or non-audit services to a fund, the Audit Committee reviews the services to determine whether they are appropriate and permissible under applicable law.
The Audit Committee has adopted policies and procedures to, among other purposes, provide a framework for the Committee's consideration of non-audit services by the audit firms that audit the Fidelity funds. The policies and procedures require that any non-audit service provided by a fund audit firm to a Fidelity fund and any non-audit service provided by a fund auditor to a Fund Service Provider that relates directly to the operations and financial reporting of a Fidelity fund ("Covered Service") are subject to approval by the Audit Committee before such service is provided.
All Covered Services must be approved in advance of provision of the service either: (i) by formal resolution of the Audit Committee, or (ii) by oral or written approval of the service by the Chair of the Audit Committee (or if the Chair is unavailable, such other member of the Audit Committee as may be designated by the Chair to act in the Chair's absence). The approval contemplated by (ii) above is permitted where the Treasurer determines that action on such an engagement is necessary before the next meeting of the Audit Committee.
Non-audit services provided by a fund audit firm to a Fund Service Provider that do not relate directly to the operations and financial reporting of a Fidelity fund are reported to the Audit Committee on a periodic basis.
Non-Audit Services Approved Pursuant to Rule 2-01(c)(7)(i)(C) and (ii) of Regulation S-X ("De Minimis Exception")
There were no non-audit services approved or required to be approved by the Audit Committee pursuant to the De Minimis Exception during the Funds' last two fiscal years relating to services provided to (i) the Funds or (ii) any Fund Service Provider that relate directly to the operations and financial reporting of the Funds.
Item 5. Audit Committee of Listed Registrants
Not applicable.
Item 6. Investments
(a) Not applicable.
(b) Not applicable
Item 7. Disclosure of Proxy Voting Policies and Procedures for Closed-End Management Investment Companies
Not applicable.
Item 8. Portfolio Managers of Closed-End Management Investment Companies
Not applicable.
Item 9. Purchase of Equity Securities by Closed-End Management Investment Company and Affiliated Purchasers
Not applicable.
Item 10. Submission of Matters to a Vote of Security Holders
There were no material changes to the procedures by which shareholders may recommend nominees to the trust's Board of Trustees.
Item 11. Controls and Procedures
(a)(i) The President and Treasurer and the Chief Financial Officer have concluded that the trust's disclosure controls and procedures (as defined in Rule 30a-3(c) under the Investment Company Act) provide reasonable assurances that material information relating to the trust is made known to them by the appropriate persons, based on their evaluation of these controls and procedures as of a date within 90 days of the filing date of this report.
(a)(ii) There was no change in the trust's internal control over financial reporting (as defined in Rule 30a-3(d) under the Investment Company Act) that occurred during the second fiscal quarter of the period covered by this report that has materially affected, or is reasonably likely to materially affect, the trust's internal control over financial reporting.
Item 12. Exhibits
(a) | (1) | Code of Ethics pursuant to Item 2 of Form N-CSR is filed and attached hereto as EX-99.CODE ETH. |
(a) | (2) | Certification pursuant to Rule 30a-2(a) under the Investment Company Act of 1940 (17 CFR 270.30a-2(a)) is filed and attached hereto as Exhibit 99.CERT. |
(a) | (3) | Not applicable. |
(b) | | Certification pursuant to Rule 30a-2(b) under the Investment Company Act of 1940 (17 CFR 270.30a-2(b)) is furnished and attached hereto as Exhibit 99.906CERT. |
SIGNATURES
Pursuant to the requirements of the Securities Exchange Act of 1934 and the Investment Company Act of 1940, the registrant has duly caused this report to be signed on its behalf by the undersigned, thereunto duly authorized.
Variable Insurance Products Fund
By: | /s/Kenneth B. Robins |
| Kenneth B. Robins |
| President and Treasurer |
| |
Date: | February 25, 2011 |
Pursuant to the requirements of the Securities Exchange Act of 1934 and the Investment Company Act of 1940, this report has been signed below by the following persons on behalf of the registrant and in the capacities and on the dates indicated.
By: | /s/Kenneth B. Robins |
| Kenneth B. Robins |
| President and Treasurer |
| |
Date: | February 25, 2011 |
By: | /s/Christine Reynolds |
| Christine Reynolds |
| Chief Financial Officer |
| |
Date: | February 2011 |