UNITED STATES
SECURITIES AND EXCHANGE COMMISSION
Washington, D.C. 20549
FORM N-CSR
CERTIFIED SHAREHOLDER REPORT OF REGISTERED
MANAGEMENT INVESTMENT COMPANIES
Investment Company Act file number 811-3329
Variable Insurance Products Fund
(Exact name of registrant as specified in charter)
245 Summer St., Boston, Massachusetts 02210
(Address of principal executive offices) (Zip code)
Scott C. Goebel, Secretary
245 Summer St.
Boston, Massachusetts 02210
(Name and address of agent for service)
Registrant's telephone number, including area code: 617-563-7000
Date of fiscal year end: | December 31 |
| |
Date of reporting period: | December 31, 2013 |
Item 1. Reports to Stockholders
Fidelity® Variable Insurance Products:
Value Portfolio
Annual Report
December 31, 2013
(Fidelity Cover Art)
Contents
Performance | (Click Here) | How the fund has done over time. |
Management's Discussion of Fund Performance | (Click Here) | The Portfolio Manager's review of fund performance and strategy. |
Shareholder Expense Example | (Click Here) | An example of shareholder expenses. |
Investment Changes | (Click Here) | A summary of major shifts in the fund's investments over the past six months. |
Investments | (Click Here) | A complete list of the fund's investments with their market values. |
Financial Statements | (Click Here) | Statements of assets and liabilities, operations, and changes in net assets, as well as financial highlights. |
Notes | (Click Here) | Notes to the financial statements. |
Report of Independent Registered Public Accounting Firm | (Click Here) | |
Trustees and Officers | (Click Here) | |
Distributions | (Click Here) | |
Board Approval of Investment Advisory Contracts and Management Fees | (Click Here) | |
To view a fund's proxy voting guidelines and proxy voting record for the 12-month period ended June 30, visit http://www.fidelity.com/proxyvotingresults or visit the Securities and Exchange Commission's (SEC) web site at http://www.sec.gov. You may also call 1-877-208-0098 to request a free copy of the proxy voting guidelines.
Fidelity Variable Insurance Products are separate account options which are purchased through a variable insurance contract.
Standard & Poor's, S&P and S&P 500 are registered service marks of The McGraw-Hill Companies, Inc. and have been licensed for use by Fidelity Distributors Corporation.
Other third-party marks appearing herein are the property of their respective owners.
All other marks appearing herein are registered or unregistered trademarks or service marks of FMR LLC or an affiliated company. © 2014 FMR LLC. All rights reserved.
This report and the financial statements contained herein are submitted for the general information of the shareholders of the fund. This report is not authorized for distribution to prospective investors in the fund unless preceded or accompanied by an effective prospectus.
A fund files its complete schedule of portfolio holdings with the SEC for the first and third quarters of each fiscal year on Form N-Q. Forms N-Q are available on the SEC's web site at http://www.sec.gov. A fund's Forms N-Q may be reviewed and copied at the SEC's Public Reference Room in Washington, DC. Information regarding the operation of the SEC's Public Reference Room may be obtained by calling 1-800-SEC-0330. For a complete list of a fund's portfolio holdings, view the most recent holdings listing, semiannual report, or annual report on Fidelity's web site at http://www.fidelity.com, http://www.advisor.fidelity.com, or http://www.401k.com, as applicable.
NOT FDIC INSURED • MAY LOSE VALUE • NO BANK GUARANTEE
Neither the fund nor Fidelity Distributors Corporation is a bank.
Annual Report
Average annual total return reflects the change in the value of an investment, assuming reinvestment of the class' distributions from dividend income and capital gains (the profits earned upon the sale of securities that have grown in value, if any) and assuming a constant rate of performance each year. During periods of reimbursement by Fidelity, a fund's total return will be greater than it would be had the reimbursement not occurred. Performance numbers are net of all underlying fund operating expenses, but do not include any insurance charges imposed by your insurance company's separate account. If performance information included the effect of these additional charges, the total returns would have been lower. How a fund did yesterday is no guarantee of how it will do tomorrow.
Average Annual Total Returns
Periods ended December 31, 2013 | Past 1
year | Past 5
years | Past 10
years |
VIP Value Portfolio - Initial Class | 32.46% | 21.28% | 6.85% |
VIP Value Portfolio - Service Class | 32.29% | 21.15% | 6.75% |
VIP Value Portfolio - Service Class 2 | 32.18% | 21.00% | 6.58% |
VIP Value Portfolio - Investor Class A | 32.42% | 21.18% | 6.77% |
A The initial offering of Investor Class shares took place on July 21, 2005. Returns prior to July 21, 2005, are those of Initial Class. Had Investor Class's transfer agent fee been reflected, returns prior to July 21, 2005, would have been lower.
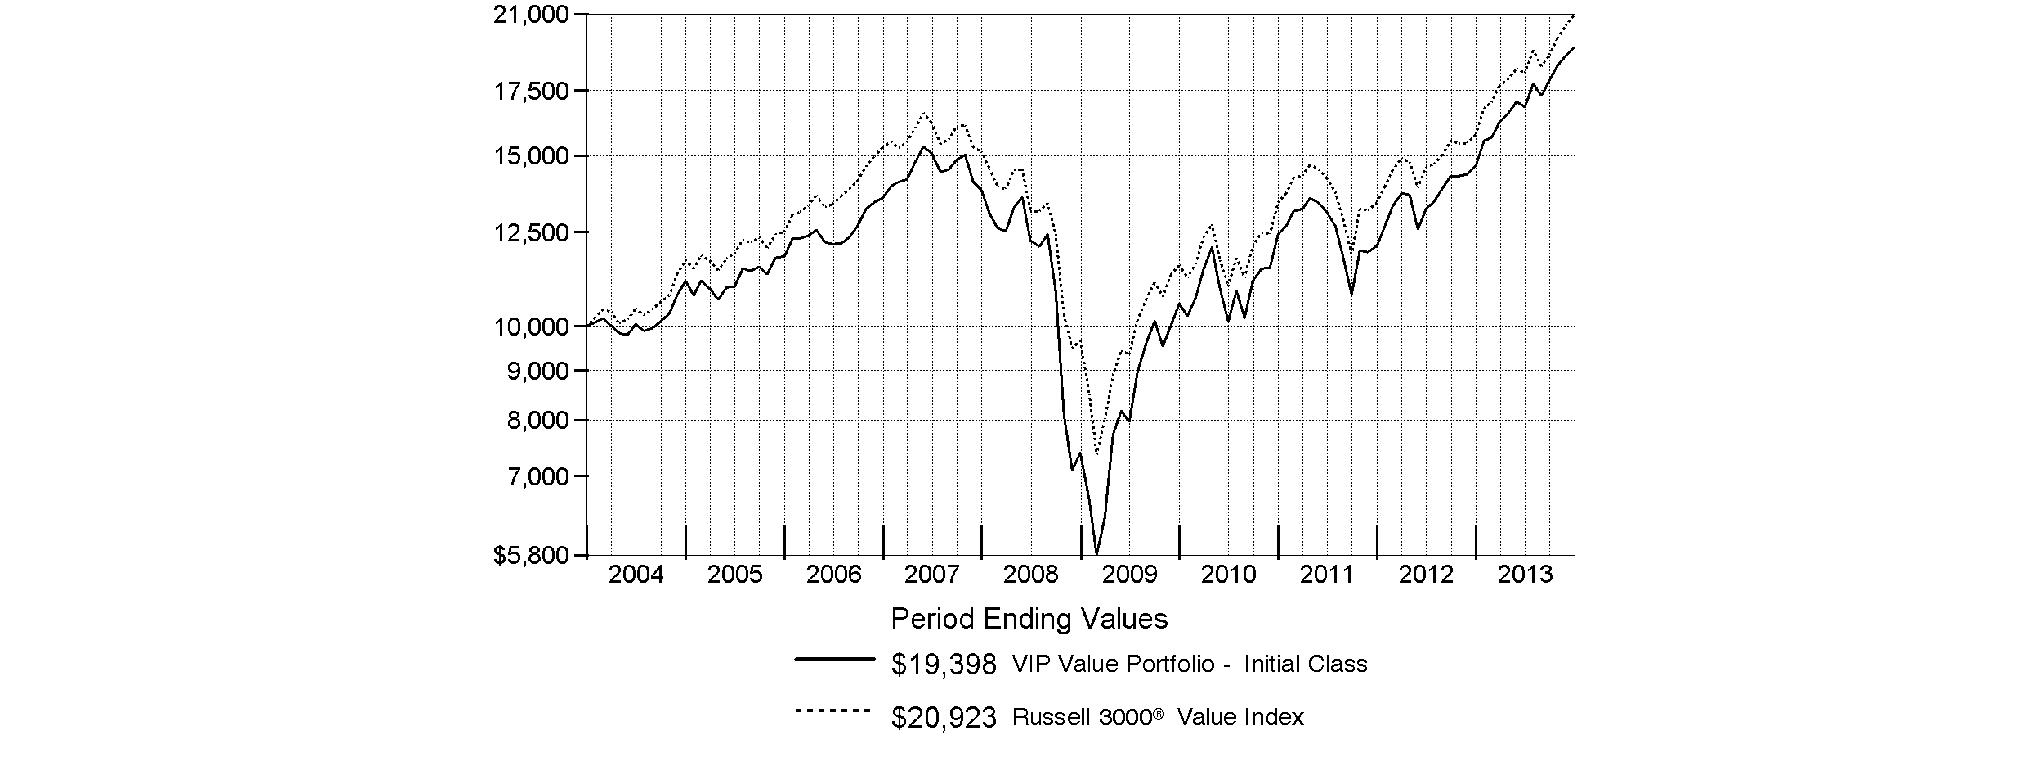
$10,000 Over 10 Years
Let's say hypothetically that $10,000 was invested in VIP Value Portfolio - Initial Class on December 31, 2003. The chart shows how the value of your investment would have changed, and also shows how the Russell 3000® Value Index performed over the same period.
Annual Report
Market Recap: Global equity markets remained upbeat for the 12 months ending December 31, 2013, propelling the MSCI® ACWI® (All Country World Index) Index to a 23.24% return. Midyear turbulence gave way by autumn when policymakers in the U.S. and China had made clear their intentions to maintain accommodative monetary policies. That stance, combined with modest cyclical improvement around the globe and generally low valuations, underpinned the broad rally in equities, although the relative strength of the U.S. dollar generally tempered gains for U.S. investors holding foreign securities based in local currencies. During the period, the broad-market S&P 500® Index set a series of new highs, finishing the year up 32.39%. For the first time since 1995, the S&P® scored a "perfect 10," with all 10 economic sectors gaining at least 10% for the year. A resurgence in growth-oriented stocks lifted the Nasdaq Composite Index® to a 40.12% result for 2013, while the blue-chip Dow Jones Industrial AverageSM notched a relatively more modest 29.65% gain. International developed-markets equities rose in concert with their U.S. counterparts, with the MSCI® EAFE® Index gaining 22.92% for the period. Meanwhile, foreign exchange and commodity weakness curbed results in resource-heavy emerging markets (EM), especially in the year's waning months. More generally, concern over EM's slowing growth, its declining share of global trade and uncertainty surrounding U.S. central bank intentions were all factors hampering performance. The MSCI Emerging Markets Index returned -2.27% for the period. On the bond side, U.S. high-yield securities rallied with equities for much of the period, with The BofA Merrill LynchSM US High Yield Constrained Index returning 7.41% for 2013. The more rate-sensitive U.S. investment-grade bond category faced headwinds though, as reflected in the -2.02% return of the Barclays® U.S. Aggregate Bond Index. Within the Barclays index, investment-grade corporate credit returned -2.01%, while ultra-safe U.S. Treasuries saw a -2.75% result. Major non-U.S. developed markets performed only slightly better, with the Citigroup® Non-USD Group-of-Seven (G7) Equal Weighted Index logging a -1.59% result. After several years of strong advances, EM debt reversed course in 2013, with the J.P. Morgan Emerging Markets Bond Index Global returning -6.58%.
Comments from Matthew Friedman, Portfolio Manager of VIP Value Portfolio: For the year, the fund's share classes performed roughly in line with the 32.69% gain of the Russell 3000® Value Index (For specific portfolio results, please refer to the performance section of this report). Although overall security selection was a modest negative this period, no one stock alone did major damage. Instead, a group of modest detractors - mainly in the software & services and food, beverage & tobacco industries - collectively weighed down performance. However, fortunate market positioning helped the fund relative to its benchmark. Shares of France-based pharmaceuticals firm Sanofi hit some bumps during the second half of the period, as the company reported consecutive quarters of weaker-than-expected financial results, including declines in sales caused by generic competition to its biggest medicines, such as its PLAVIX® blood thinner. While security selection in energy was positive overall, my investment in integrated oil and natural gas giant Royal Dutch Shell was detrimental to performance. The fund only owned the stock for the first two months of the period, when the stock suffered after a lower-than-anticipated dividend increase fueled investors' concern about the company's capital allocation policy. On the flip side, a few great decisions in telecommunication services, along with an overall underweighting in this lagging sector, boosted the fund's relative result. Avoiding integrated telecom stalwart and benchmark component AT&T was the biggest individual contributor. The stock had a volatile run and lagged the index for the full period, as investors became increasingly concerned about mounting competition from other major wireless providers, especially T-Mobile. Elsewhere, I found the valuation of British multinational telecom giant Vodafone Group attractive, so I held a stake here, which was another plus. Vodafone owned a large position in telecom giant Verizon Wireless, and reports of Verizon Communications' potential buyout of Vodafone's interest boosted Vodafone's share price during the period, as did the early-September announcement of the agreement.
The views expressed above reflect those of the portfolio manager(s) only through the end of the period as stated on the cover of this report and do not necessarily represent the views of Fidelity or any other person in the Fidelity organization. Any such views are subject to change at any time based upon market or other conditions and Fidelity disclaims any responsibility to update such views. These views may not be relied on as investment advice and, because investment decisions for a Fidelity fund are based on numerous factors, may not be relied on as an indication of trading intent on behalf of any Fidelity fund.
Annual Report
As a shareholder of the Fund, you incur two types of costs: (1) transaction costs, and (2) ongoing costs, including management fees, distribution and/or service (12b-1) fees and other Fund expenses. This Example is intended to help you understand your ongoing costs (in dollars) of investing in the Fund and to compare these costs with the ongoing costs of investing in other mutual funds.
The Example is based on an investment of $1,000 invested at the beginning of the period and held for the entire period (July 1, 2013 to December 31, 2013).
Actual Expenses
The first line of the accompanying table for each class of the Fund provides information about actual account values and actual expenses. You may use the information in this line, together with the amount you invested, to estimate the expenses that you paid over the period. Simply divide your account value by $1,000.00 (for example, an $8,600 account value divided by $1,000.00 = 8.6), then multiply the result by the number in the first line for a class of the Fund under the heading entitled "Expenses Paid During Period" to estimate the expenses you paid on your account during this period. The estimate of expenses does not include any fees or other expenses of any variable annuity or variable life insurance product. If they were, the estimate of expenses you paid during the period would be higher, and your ending account value would be lower. In addition, the Fund, as a shareholder in the underlying Fidelity Central Funds, will indirectly bear its pro-rata share of the fees and expenses incurred by the underlying Fidelity Central Funds. These fees and expenses are not included in the Fund's annualized expense ratio used to calculate the expense estimate in the table below.
Hypothetical Example for Comparison Purposes
The second line of the accompanying table for each class of the Fund provides information about hypothetical account values and hypothetical expenses based on a Class' actual expense ratio and an assumed rate of return of 5% per year before expenses, which is not the Class' actual return. The hypothetical account values and expenses may not be used to estimate the actual ending account balance or expenses you paid for the period. You may use this information to compare the ongoing costs of investing in the Fund and other funds. To do so, compare this 5% hypothetical example with the 5% hypothetical examples that appear in the shareholder reports of the other funds. The estimate of expenses does not include any fees or other expenses of any variable annuity or variable life insurance product. If they were, the estimate of expenses you paid during the period would be higher, and your ending account value would be lower. In addition, the Fund, as a shareholder in the underlying Fidelity Central Funds, will indirectly bear its pro-rata share of the fees and expenses incurred by the underlying Fidelity Central Funds. These fees and expenses are not included in the Fund's annualized expense ratio used to calculate the expense estimate in the table below.
Please note that the expenses shown in the table are meant to highlight your ongoing costs only and do not reflect any transaction costs. Therefore, the second line of the table is useful in comparing ongoing costs only, and will not help you determine the relative total costs of owning different funds.
| Annualized
Expense Ratio B | Beginning
Account Value
July 1, 2013 | Ending
Account Value
December 31, 2013 | Expenses Paid
During Period*
July 1, 2013
to December 31, 2013 |
Initial Class | .70% | | | |
Actual | | $ 1,000.00 | $ 1,152.60 | $ 3.80 |
HypotheticalA | | $ 1,000.00 | $ 1,021.68 | $ 3.57 |
Service Class | .79% | | | |
Actual | | $ 1,000.00 | $ 1,152.00 | $ 4.29 |
HypotheticalA | | $ 1,000.00 | $ 1,021.22 | $ 4.02 |
Service Class 2 | .96% | | | |
Actual | | $ 1,000.00 | $ 1,151.40 | $ 5.21 |
HypotheticalA | | $ 1,000.00 | $ 1,020.37 | $ 4.89 |
Investor Class | .78% | | | |
Actual | | $ 1,000.00 | $ 1,152.10 | $ 4.23 |
HypotheticalA | | $ 1,000.00 | $ 1,021.27 | $ 3.97 |
A 5% return per year before expenses
B Annualized expense ratio reflects expenses net of applicable fee waivers.
* Expenses are equal to each Class' annualized expense ratio, multiplied by the average account value over the period, multiplied by 184/365 (to reflect the one-half year period).
Annual Report
Investment Changes (Unaudited)
Top Ten Stocks as of December 31, 2013 |
| % of fund's
net assets | % of fund's net assets
6 months ago |
JPMorgan Chase & Co. | 3.7 | 2.5 |
Chevron Corp. | 3.2 | 3.4 |
Bank of America Corp. | 2.8 | 0.9 |
Citigroup, Inc. | 2.7 | 2.8 |
General Electric Co. | 2.5 | 2.8 |
U.S. Bancorp | 2.2 | 1.4 |
Occidental Petroleum Corp. | 1.7 | 2.0 |
Cisco Systems, Inc. | 1.7 | 1.9 |
National Oilwell Varco, Inc. | 1.6 | 1.8 |
The Travelers Companies, Inc. | 1.5 | 1.1 |
| 23.6 | |
Top Five Market Sectors as of December 31, 2013 |
| % of fund's
net assets | % of fund's net assets
6 months ago |
Financials | 27.6 | 28.0 |
Energy | 14.2 | 14.2 |
Health Care | 12.0 | 11.3 |
Information Technology | 11.8 | 10.1 |
Industrials | 9.6 | 10.8 |
Asset Allocation (% of fund's net assets) |
As of December 31, 2013* | As of June 30, 2013** |
 | Stocks 97.9% | | | Stocks 98.6% | |
 | Short-Term
Investments and
Net Other Assets
(Liabilities) 2.1% | | | Short-Term
Investments and
Net Other Assets
(Liabilities) 1.4% | |
* Foreign investments | 16.9% | | ** Foreign investments | 15.6% | |

Annual Report
Investments December 31, 2013
Showing Percentage of Net Assets
Common Stocks - 97.9% |
| Shares | | Value |
CONSUMER DISCRETIONARY - 9.1% |
Auto Components - 1.6% |
Delphi Automotive PLC | 19,300 | | $ 1,160,509 |
Tenneco, Inc. (a) | 15,500 | | 876,835 |
Visteon Corp. (a) | 21,300 | | 1,744,257 |
| | 3,781,601 |
Hotels, Restaurants & Leisure - 0.5% |
Brinker International, Inc. | 23,800 | | 1,102,892 |
Media - 3.0% |
CBS Corp. Class B | 35,900 | | 2,288,266 |
Comcast Corp. Class A (special) (non-vtg.) | 40,400 | | 2,015,152 |
Twenty-First Century Fox, Inc. Class A | 71,200 | | 2,504,816 |
| | 6,808,234 |
Multiline Retail - 1.5% |
Dillard's, Inc. Class A | 12,300 | | 1,195,683 |
Target Corp. | 35,200 | | 2,227,104 |
| | 3,422,787 |
Specialty Retail - 2.5% |
Ascena Retail Group, Inc. (a) | 99,600 | | 2,107,536 |
AutoZone, Inc. (a) | 3,300 | | 1,577,202 |
Bed Bath & Beyond, Inc. (a) | 13,400 | | 1,076,020 |
Office Depot, Inc. (a) | 206,400 | | 1,091,856 |
| | 5,852,614 |
TOTAL CONSUMER DISCRETIONARY | | 20,968,128 |
CONSUMER STAPLES - 5.4% |
Food & Staples Retailing - 1.1% |
Alimentation Couche-Tard, Inc. Class B (sub. vtg.) | 16,700 | | 1,255,821 |
Walgreen Co. | 21,300 | | 1,223,472 |
| | 2,479,293 |
Food Products - 1.6% |
Ingredion, Inc. | 20,400 | | 1,396,584 |
Mondelez International, Inc. | 67,300 | | 2,375,690 |
| | 3,772,274 |
Household Products - 1.7% |
Procter & Gamble Co. | 33,400 | | 2,719,094 |
Svenska Cellulosa AB (SCA) (B Shares) | 38,100 | | 1,172,882 |
| | 3,891,976 |
Personal Products - 0.5% |
Coty, Inc. Class A | 70,600 | | 1,076,650 |
Tobacco - 0.5% |
British American Tobacco PLC sponsored ADR | 11,000 | | 1,181,620 |
TOTAL CONSUMER STAPLES | | 12,401,813 |
|
| Shares | | Value |
ENERGY - 14.2% |
Energy Equipment & Services - 2.9% |
Cameron International Corp. (a) | 31,600 | | $ 1,881,148 |
National Oilwell Varco, Inc. | 48,400 | | 3,849,252 |
Rowan Companies PLC (a) | 32,400 | | 1,145,664 |
| | 6,876,064 |
Oil, Gas & Consumable Fuels - 11.3% |
Anadarko Petroleum Corp. | 26,500 | | 2,101,980 |
Apache Corp. | 12,300 | | 1,057,062 |
Canadian Natural Resources Ltd. | 81,500 | | 2,757,458 |
Chevron Corp. | 58,800 | | 7,344,708 |
Energen Corp. | 36,200 | | 2,561,150 |
Marathon Petroleum Corp. | 31,700 | | 2,907,841 |
Occidental Petroleum Corp. | 41,498 | | 3,946,460 |
Suncor Energy, Inc. | 63,500 | | 2,226,161 |
Whiting Petroleum Corp. (a) | 19,900 | | 1,231,213 |
| | 26,134,033 |
TOTAL ENERGY | | 33,010,097 |
FINANCIALS - 27.6% |
Capital Markets - 3.2% |
Ameriprise Financial, Inc. | 21,800 | | 2,508,090 |
KKR & Co. LP | 95,600 | | 2,326,904 |
UBS AG | 134,045 | | 2,566,607 |
| | 7,401,601 |
Commercial Banks - 2.8% |
Barclays PLC sponsored ADR | 80,800 | | 1,464,904 |
U.S. Bancorp | 125,834 | | 5,083,694 |
| | 6,548,598 |
Consumer Finance - 1.2% |
Capital One Financial Corp. | 35,400 | | 2,711,994 |
Diversified Financial Services - 10.7% |
Bank of America Corp. | 411,800 | | 6,411,726 |
Berkshire Hathaway, Inc. Class B (a) | 29,900 | | 3,544,944 |
Citigroup, Inc. | 121,047 | | 6,307,759 |
JPMorgan Chase & Co. | 146,519 | | 8,568,432 |
| | 24,832,861 |
Insurance - 6.1% |
Allied World Assurance Co. Holdings Ltd. | 14,900 | | 1,680,869 |
Primerica, Inc. | 37,600 | | 1,613,416 |
Prudential PLC | 83,843 | | 1,873,389 |
Reinsurance Group of America, Inc. | 24,800 | | 1,919,768 |
StanCorp Financial Group, Inc. | 19,000 | | 1,258,750 |
The Chubb Corp. | 24,100 | | 2,328,783 |
The Travelers Companies, Inc. | 39,500 | | 3,576,330 |
| | 14,251,305 |
Real Estate Investment Trusts - 3.0% |
Alexandria Real Estate Equities, Inc. | 27,600 | | 1,755,912 |
American Tower Corp. | 28,000 | | 2,234,960 |
Common Stocks - continued |
| Shares | | Value |
FINANCIALS - continued |
Real Estate Investment Trusts - continued |
Equity Lifestyle Properties, Inc. | 30,800 | | $ 1,115,884 |
Prologis, Inc. | 28,287 | | 1,045,205 |
SL Green Realty Corp. | 8,700 | | 803,706 |
| | 6,955,667 |
Real Estate Management & Development - 0.6% |
Forest City Enterprises, Inc. Class A (a) | 73,500 | | 1,403,850 |
TOTAL FINANCIALS | | 64,105,876 |
HEALTH CARE - 12.0% |
Biotechnology - 0.9% |
Amgen, Inc. | 19,000 | | 2,169,040 |
Health Care Equipment & Supplies - 0.9% |
Boston Scientific Corp. (a) | 162,200 | | 1,949,644 |
Health Care Providers & Services - 3.4% |
Cigna Corp. | 38,100 | | 3,332,988 |
Express Scripts Holding Co. (a) | 24,100 | | 1,692,784 |
McKesson Corp. | 18,039 | | 2,911,495 |
| | 7,937,267 |
Pharmaceuticals - 6.8% |
Actavis PLC (a) | 12,600 | | 2,116,800 |
Bayer AG | 23,800 | | 3,338,012 |
GlaxoSmithKline PLC sponsored ADR | 31,500 | | 1,681,785 |
Novartis AG sponsored ADR | 36,400 | | 2,925,832 |
Pfizer, Inc. | 81,600 | | 2,499,408 |
Sanofi SA sponsored ADR | 59,400 | | 3,185,622 |
| | 15,747,459 |
TOTAL HEALTH CARE | | 27,803,410 |
INDUSTRIALS - 9.6% |
Aerospace & Defense - 1.8% |
Meggitt PLC | 168,800 | | 1,474,491 |
United Technologies Corp. | 23,968 | | 2,727,558 |
| | 4,202,049 |
Air Freight & Logistics - 0.6% |
FedEx Corp. | 9,700 | | 1,394,569 |
Commercial Services & Supplies - 0.7% |
Iron Mountain, Inc. | 50,300 | | 1,526,605 |
Construction & Engineering - 1.1% |
URS Corp. | 50,500 | | 2,675,995 |
Electrical Equipment - 0.5% |
Babcock & Wilcox Co. | 34,600 | | 1,182,974 |
Industrial Conglomerates - 3.6% |
3M Co. | 18,500 | | 2,594,625 |
General Electric Co. | 207,748 | | 5,823,176 |
| | 8,417,801 |
|
| Shares | | Value |
Machinery - 1.3% |
Cummins, Inc. | 10,800 | | $ 1,522,476 |
Stanley Black & Decker, Inc. | 17,700 | | 1,428,213 |
| | 2,950,689 |
TOTAL INDUSTRIALS | | 22,350,682 |
INFORMATION TECHNOLOGY - 11.8% |
Communications Equipment - 2.4% |
Cisco Systems, Inc. | 174,400 | | 3,915,280 |
QUALCOMM, Inc. | 21,400 | | 1,588,950 |
| | 5,504,230 |
Computers & Peripherals - 1.1% |
Apple, Inc. | 4,600 | | 2,581,106 |
Electronic Equipment & Components - 0.6% |
TE Connectivity Ltd. | 26,200 | | 1,443,882 |
IT Services - 3.1% |
Amdocs Ltd. | 29,200 | | 1,204,208 |
Fidelity National Information Services, Inc. | 43,700 | | 2,345,816 |
Global Payments, Inc. | 28,400 | | 1,845,716 |
Total System Services, Inc. | 53,200 | | 1,770,496 |
| | 7,166,236 |
Semiconductors & Semiconductor Equipment - 0.7% |
Maxim Integrated Products, Inc. | 55,200 | | 1,540,632 |
Software - 3.9% |
Activision Blizzard, Inc. | 79,300 | | 1,413,919 |
Electronic Arts, Inc. (a) | 53,100 | | 1,218,114 |
Intuit, Inc. | 15,400 | | 1,175,328 |
Microsoft Corp. | 30,600 | | 1,145,358 |
Oracle Corp. | 73,600 | | 2,815,936 |
Synopsys, Inc. (a) | 32,300 | | 1,310,411 |
| | 9,079,066 |
TOTAL INFORMATION TECHNOLOGY | | 27,315,152 |
MATERIALS - 2.6% |
Chemicals - 2.0% |
Eastman Chemical Co. | 24,400 | | 1,969,080 |
LyondellBasell Industries NV Class A | 19,600 | | 1,573,488 |
Methanex Corp. | 18,700 | | 1,105,892 |
| | 4,648,460 |
Metals & Mining - 0.6% |
Freeport-McMoRan Copper & Gold, Inc. | 34,800 | | 1,313,352 |
TOTAL MATERIALS | | 5,961,812 |
TELECOMMUNICATION SERVICES - 0.8% |
Wireless Telecommunication Services - 0.8% |
Vodafone Group PLC sponsored ADR | 48,900 | | 1,922,259 |
Common Stocks - continued |
| Shares | | Value |
UTILITIES - 4.8% |
Electric Utilities - 2.1% |
Edison International | 42,907 | | $ 1,986,594 |
ITC Holdings Corp. | 29,400 | | 2,817,108 |
| | 4,803,702 |
Multi-Utilities - 2.7% |
CMS Energy Corp. | 69,000 | | 1,847,130 |
NiSource, Inc. | 66,300 | | 2,179,944 |
Sempra Energy | 25,500 | | 2,288,880 |
| | 6,315,954 |
TOTAL UTILITIES | | 11,119,656 |
TOTAL COMMON STOCKS (Cost $187,542,579) |
226,958,885
|
Money Market Funds - 1.9% |
| Shares | | Value |
Fidelity Cash Central Fund, 0.11% (b)
(Cost $4,505,644) | 4,505,644 | | $ 4,505,644 |
TOTAL INVESTMENT PORTFOLIO - 99.8% (Cost $192,048,223) | | 231,464,529 |
NET OTHER ASSETS (LIABILITIES) - 0.2% | | 495,690 |
NET ASSETS - 100% | $ 231,960,219 |
Legend |
(a) Non-income producing |
(b) Affiliated fund that is generally available only to investment companies and other accounts managed by Fidelity Investments. The rate quoted is the annualized seven-day yield of the fund at period end. A complete unaudited listing of the fund's holdings as of its most recent quarter end is available upon request. In addition, each Fidelity Central Fund's financial statements, which are not covered by the Fund's Report of Independent Registered Public Accounting Firm, are available on the SEC's website or upon request. |
Affiliated Central Funds |
Information regarding fiscal year to date income earned by the Fund from investments in Fidelity Central Funds is as follows: |
Fund | Income earned |
Fidelity Cash Central Fund | $ 5,283 |
Fidelity Securities Lending Cash Central Fund | 12,940 |
Total | $ 18,223 |
Other Information |
The following is a summary of the inputs used, as of December 31, 2013, involving the Fund's assets and liabilities carried at fair value. The inputs or methodology used for valuing securities may not be an indication of the risk associated with investing in those securities. For more information on valuation inputs, and their aggregation into the levels used in the table below, please refer to the Investment Valuation section in the accompanying Notes to Financial Statements. |
Valuation Inputs at Reporting Date: |
Description | Total | Level 1 | Level 2 | Level 3 |
Investments in Securities: | | | | |
Equities: | | | | |
Consumer Discretionary | $ 20,968,128 | $ 20,968,128 | $ - | $ - |
Consumer Staples | 12,401,813 | 12,401,813 | - | - |
Energy | 33,010,097 | 33,010,097 | - | - |
Financials | 64,105,876 | 59,665,880 | 4,439,996 | - |
Health Care | 27,803,410 | 27,803,410 | - | - |
Industrials | 22,350,682 | 22,350,682 | - | - |
Information Technology | 27,315,152 | 27,315,152 | - | - |
Materials | 5,961,812 | 5,961,812 | - | - |
Telecommunication Services | 1,922,259 | 1,922,259 | - | - |
Utilities | 11,119,656 | 11,119,656 | - | - |
Money Market Funds | 4,505,644 | 4,505,644 | - | - |
Total Investments in Securities: | $ 231,464,529 | $ 227,024,533 | $ 4,439,996 | $ - |
Distribution of investments by country or territory of incorporation, as a percentage of total net assets, is as follows (Unaudited): |
United States of America | 83.1% |
United Kingdom | 4.5% |
Switzerland | 3.7% |
Canada | 3.3% |
Germany | 1.4% |
France | 1.4% |
Others (Individually Less Than 1%) | 2.6% |
| 100.0% |
See accompanying notes which are an integral part of the financial statements.
Annual Report
Statement of Assets and Liabilities
| December 31, 2013 |
| | |
Assets | | |
Investment in securities, at value - See accompanying schedule: Unaffiliated issuers (cost $187,542,579) | $ 226,958,885 | |
Fidelity Central Funds (cost $4,505,644) | 4,505,644 | |
Total Investments (cost $192,048,223) | | $ 231,464,529 |
Foreign currency held at value (cost $76) | | 77 |
Receivable for fund shares sold | | 437,016 |
Dividends receivable | | 319,776 |
Distributions receivable from Fidelity Central Funds | | 1,468 |
Prepaid expenses | | 538 |
Other receivables | | 1,918 |
Total assets | | 232,225,322 |
| | |
Liabilities | | |
Payable for fund shares redeemed | $ 92,463 | |
Accrued management fee | 102,868 | |
Transfer agent fee payable | 19,883 | |
Distribution and service plan fees payable | 1,176 | |
Other affiliated payables | 7,258 | |
Audit fees payable | 32,765 | |
Other payables and accrued expenses | 8,690 | |
Total liabilities | | 265,103 |
| | |
Net Assets | | $ 231,960,219 |
Net Assets consist of: | | |
Paid in capital | | $ 190,086,990 |
Undistributed net investment income | | 19,805 |
Accumulated undistributed net realized gain (loss) on investments and foreign currency transactions | | 2,437,142 |
Net unrealized appreciation (depreciation) on investments and assets and liabilities in foreign currencies | | 39,416,282 |
Net Assets | | $ 231,960,219 |
Statement of Assets and Liabilities - continued
| December 31, 2013 |
| | |
Initial Class:
Net Asset Value, offering price and redemption price per share ($115,004,259 ÷ 7,574,557 shares) | | $ 15.18 |
| | |
Service Class:
Net Asset Value, offering price and redemption price per share ($213,997 ÷ 14,094 shares) | | $ 15.18 |
| | |
Service Class 2:
Net Asset Value, offering price and redemption price per share ($5,831,085 ÷ 387,493 shares) | | $ 15.05 |
| | |
Investor Class:
Net Asset Value, offering price and redemption price per share ($110,910,878 ÷ 7,312,007 shares) | | $ 15.17 |
See accompanying notes which are an integral part of the financial statements.
Annual Report
Statement of Operations
| Year ended December 31, 2013 |
| | |
Investment Income | | |
Dividends | | $ 3,729,754 |
Income from Fidelity Central Funds | | 18,223 |
Total income | | 3,747,977 |
| | |
Expenses | | |
Management fee | $ 1,051,181 | |
Transfer agent fees | 212,513 | |
Distribution and service plan fees | 12,580 | |
Accounting and security lending fees | 74,174 | |
Custodian fees and expenses | 16,564 | |
Independent trustees' compensation | 961 | |
Audit | 55,185 | |
Legal | 1,049 | |
Miscellaneous | 1,483 | |
Total expenses before reductions | 1,425,690 | |
Expense reductions | (14,002) | 1,411,688 |
Net investment income (loss) | | 2,336,289 |
Realized and Unrealized Gain (Loss) Net realized gain (loss) on: | | |
Investment securities: | | |
Unaffiliated issuers | 23,882,131 | |
Foreign currency transactions | 8,735 | |
Total net realized gain (loss) | | 23,890,866 |
Change in net unrealized appreciation (depreciation) on: Investment securities | 26,021,961 | |
Assets and liabilities in foreign currencies | 7 | |
Total change in net unrealized appreciation (depreciation) | | 26,021,968 |
Net gain (loss) | | 49,912,834 |
Net increase (decrease) in net assets resulting from operations | | $ 52,249,123 |
Statement of Changes in Net Assets
| Year ended
December 31,
2013 | Year ended
December 31,
2012 |
Increase (Decrease) in Net Assets | | |
Operations | | |
Net investment income (loss) | $ 2,336,289 | $ 2,451,042 |
Net realized gain (loss) | 23,890,866 | 19,300,533 |
Change in net unrealized appreciation (depreciation) | 26,021,968 | 5,851,497 |
Net increase (decrease) in net assets resulting from operations | 52,249,123 | 27,603,072 |
Distributions to shareholders from net investment income | (2,294,348) | (2,418,565) |
Distributions to shareholders from net realized gain | (17,534,055) | - |
Total distributions | (19,828,403) | (2,418,565) |
Share transactions - net increase (decrease) | 51,029,038 | (21,074,853) |
Total increase (decrease) in net assets | 83,449,758 | 4,109,654 |
| | |
Net Assets | | |
Beginning of period | 148,510,461 | 144,400,807 |
End of period (including undistributed net investment income of $19,805 and distributions in excess of net investment income of $196, respectively) | $ 231,960,219 | $ 148,510,461 |
See accompanying notes which are an integral part of the financial statements.
Annual Report
Financial Highlights - Initial Class
Years ended December 31, | 2013 | 2012 | 2011 | 2010 | 2009 |
Selected Per-Share Data | | | | | |
Net asset value, beginning of period | $ 12.60 | $ 10.60 | $ 11.00 | $ 9.47 | $ 6.69 |
Income from Investment Operations | | | | | |
Net investment income (loss) C | .19 | .20 | .12 | .13 F | .07 |
Net realized and unrealized gain (loss) | 3.84 | 2.01 | (.40) | 1.56 | 2.78 |
Total from investment operations | 4.03 | 2.21 | (.28) | 1.69 | 2.85 |
Distributions from net investment income | (.17) | (.21) | (.12) | (.15) | (.07) |
Distributions from net realized gain | (1.27) | - | - | (.01) | - |
Total distributions | (1.45) H | (.21) | (.12) | (.16) | (.07) |
Net asset value, end of period | $ 15.18 | $ 12.60 | $ 10.60 | $ 11.00 | $ 9.47 |
Total Return A, B | 32.46% | 20.91% | (2.51)% | 17.82% | 42.66% |
Ratios to Average Net Assets D, G | | | | | |
Expenses before reductions | .71% | .72% | .73% | .76% | .80% |
Expenses net of fee waivers, if any | .70% | .72% | .72% | .75% | .80% |
Expenses net of all reductions | .70% | .71% | .72% | .74% | .80% |
Net investment income (loss) | 1.27% | 1.70% | 1.14% | 1.33% F | .95% |
Supplemental Data | | | | | |
Net assets, end of period (000 omitted) | $ 115,004 | $ 82,711 | $ 82,980 | $ 78,133 | $ 64,198 |
Portfolio turnover rate E | 96% | 106% | 79% | 160% | 73% |
A Total returns do not reflect charges attributable to your insurance company's separate account. Inclusion of these charges would reduce the total returns shown.
B Total returns would have been lower if certain expenses had not been reduced during the applicable periods shown.
C Calculated based on average shares outstanding during the period.
D Fees and expenses of any underlying Fidelity Central Funds are not included in the Fund's expense ratio. The Fund indirectly bears its proportionate share of the expenses of any underlying Fidelity Central Funds.
E Amount does not include the portfolio activity of any underlying Fidelity Central Funds.
F Investment income per share reflects a large, non-recurring dividend which amounted to $.06 per share. Excluding this non-recurring dividend, the ratio of net investment income (loss) to average net assets would have been .69%.
G Expense ratios reflect operating expenses of the class. Expenses before reductions do not reflect amounts reimbursed by the investment adviser or reductions from brokerage service arrangements or reductions from other expense offset arrangements and do not represent the amount paid by the class during periods when reimbursements or reductions occur. Expenses net of fee waivers reflect expenses after reimbursement by the investment adviser but prior to reductions from brokerage service arrangements or other expense offset arrangements. Expenses net of all reductions represent the net expenses paid by the class.
H Total distributions of $1.45 per share is comprised of distributions from net investment income of $.172 and distributions from net realized gain of $1.274 per share.
Financial Highlights - Service Class
Years ended December 31, | 2013 | 2012 | 2011 | 2010 | 2009 |
Selected Per-Share Data | | | | | |
Net asset value, beginning of period | $ 12.60 | $ 10.60 | $ 10.99 | $ 9.46 | $ 6.69 |
Income from Investment Operations | | | | | |
Net investment income (loss) C | .17 | .19 | .12 | .12 F | .06 |
Net realized and unrealized gain (loss) | 3.84 | 2.01 | (.40) | 1.56 | 2.77 |
Total from investment operations | 4.01 | 2.20 | (.28) | 1.68 | 2.83 |
Distributions from net investment income | (.15) | (.20) | (.11) | (.14) | (.06) |
Distributions from net realized gain | (1.27) | - | - | (.01) | - |
Total distributions | (1.43) H | (.20) | (.11) | (.15) | (.06) |
Net asset value, end of period | $ 15.18 | $ 12.60 | $ 10.60 | $ 10.99 | $ 9.46 |
Total Return A, B | 32.29% | 20.80% | (2.55)% | 17.73% | 42.35% |
Ratios to Average Net Assets D, G | | | | | |
Expenses before reductions | .80% | .81% | .81% | .84% | .91% |
Expenses net of fee waivers, if any | .80% | .81% | .81% | .83% | .91% |
Expenses net of all reductions | .79% | .80% | .81% | .83% | .90% |
Net investment income (loss) | 1.18% | 1.61% | 1.05% | 1.24% F | .84% |
Supplemental Data | | | | | |
Net assets, end of period (000 omitted) | $ 214 | $ 211 | $ 194 | $ 258 | $ 251 |
Portfolio turnover rate E | 96% | 106% | 79% | 160% | 73% |
A Total returns do not reflect charges attributable to your insurance company's separate account. Inclusion of these charges would reduce the total returns shown.
B Total returns would have been lower if certain expenses had not been reduced during the applicable periods shown.
C Calculated based on average shares outstanding during the period.
D Fees and expenses of any underlying Fidelity Central Funds are not included in the Fund's expense ratio. The Fund indirectly bears its proportionate share of the expenses of any underlying Fidelity Central Funds.
E Amount does not include the portfolio activity of any underlying Fidelity Central Funds.
F Investment income per share reflects a large, non-recurring dividend which amounted to $.06 per share. Excluding this non-recurring dividend, the ratio of net investment income (loss) to average net assets would have been .61%.
G Expense ratios reflect operating expenses of the class. Expenses before reductions do not reflect amounts reimbursed by the investment adviser or reductions from brokerage service arrangements or reductions from other expense offset arrangements and do not represent the amount paid by the class during periods when reimbursements or reductions occur. Expenses net of fee waivers reflect expenses after reimbursement by the investment adviser but prior to reductions from brokerage service arrangements or other expense offset arrangements. Expenses net of all reductions represent the net expenses paid by the class.
H Total distributions of $1.43 per share is comprised of distributions from net investment income of $.152 and distributions from net realized gain of $1.274 per share.
See accompanying notes which are an integral part of the financial statements.
Annual Report
Financial Highlights - Service Class 2
Years ended December 31, | 2013 | 2012 | 2011 | 2010 | 2009 |
Selected Per-Share Data | | | | | |
Net asset value, beginning of period | $ 12.50 | $ 10.52 | $ 10.90 | $ 9.38 | $ 6.63 |
Income from Investment Operations | | | | | |
Net investment income (loss) C | .15 | .17 | .10 | .11 F | .05 |
Net realized and unrealized gain (loss) | 3.81 | 1.99 | (.39) | 1.53 | 2.75 |
Total from investment operations | 3.96 | 2.16 | (.29) | 1.64 | 2.80 |
Distributions from net investment income | (.14) | (.18) | (.09) | (.11) | (.05) |
Distributions from net realized gain | (1.27) | - | - | (.01) | - |
Total distributions | (1.41) | (.18) | (.09) | (.12) | (.05) |
Net asset value, end of period | $ 15.05 | $ 12.50 | $ 10.52 | $ 10.90 | $ 9.38 |
Total Return A, B | 32.18% | 20.55% | (2.68)% | 17.52% | 42.32% |
Ratios to Average Net Assets D, G | | | | | |
Expenses before reductions | .96% | .98% | .98% | 1.00% | 1.05% |
Expenses net of fee waivers, if any | .96% | .98% | .97% | 1.00% | 1.05% |
Expenses net of all reductions | .95% | .97% | .97% | .99% | 1.05% |
Net investment income (loss) | 1.01% | 1.45% | .89% | 1.08% F | .70% |
Supplemental Data | | | | | |
Net assets, end of period (000 omitted) | $ 5,831 | $ 3,736 | $ 3,202 | $ 8,652 | $ 8,277 |
Portfolio turnover rate E | 96% | 106% | 79% | 160% | 73% |
A Total returns do not reflect charges attributable to your insurance company's separate account. Inclusion of these charges would reduce the total returns shown.
B Total returns would have been lower if certain expenses had not been reduced during the applicable periods shown.
C Calculated based on average shares outstanding during the period.
D Fees and expenses of any underlying Fidelity Central Funds are not included in the Fund's expense ratio. The Fund indirectly bears its proportionate share of the expenses of any underlying Fidelity Central Funds.
E Amount does not include the portfolio activity of any underlying Fidelity Central Funds.
F Investment income per share reflects a large, non-recurring dividend which amounted to $.06 per share. Excluding this non-recurring dividend, the ratio of net investment income (loss) to average net assets would have been .45%.
G Expense ratios reflect operating expenses of the class. Expenses before reductions do not reflect amounts reimbursed by the investment adviser or reductions from brokerage service arrangements or reductions from other expense offset arrangements and do not represent the amount paid by the class during periods when reimbursements or reductions occur. Expenses net of fee waivers reflect expenses after reimbursement by the investment adviser but prior to reductions from brokerage service arrangements or other expense offset arrangements. Expenses net of all reductions represent the net expenses paid by the class.
Financial Highlights - Investor Class
Years ended December 31, | 2013 | 2012 | 2011 | 2010 | 2009 |
Selected Per-Share Data | | | | | |
Net asset value, beginning of period | $ 12.59 | $ 10.59 | $ 10.99 | $ 9.46 | $ 6.69 |
Income from Investment Operations | | | | | |
Net investment income (loss) C | .18 | .19 | .12 | .12 F | .07 |
Net realized and unrealized gain (loss) | 3.84 | 2.01 | (.41) | 1.56 | 2.77 |
Total from investment operations | 4.02 | 2.20 | (.29) | 1.68 | 2.84 |
Distributions from net investment income | (.16) | (.20) | (.11) | (.14) | (.07) |
Distributions from net realized gain | (1.27) | - | - | (.01) | - |
Total distributions | (1.44) H | (.20) | (.11) | (.15) | (.07) |
Net asset value, end of period | $ 15.17 | $ 12.59 | $ 10.59 | $ 10.99 | $ 9.46 |
Total Return A, B | 32.42% | 20.83% | (2.59)% | 17.74% | 42.41% |
Ratios to Average Net Assets D, G | | | | | |
Expenses before reductions | .78% | .80% | .80% | .83% | .89% |
Expenses net of fee waivers, if any | .78% | .80% | .80% | .83% | .89% |
Expenses net of all reductions | .78% | .79% | .80% | .82% | .88% |
Net investment income (loss) | 1.19% | 1.62% | 1.06% | 1.25% F | .86% |
Supplemental Data | | | | | |
Net assets, end of period (000 omitted) | $ 110,911 | $ 61,852 | $ 58,025 | $ 64,242 | $ 56,380 |
Portfolio turnover rate E | 96% | 106% | 79% | 160% | 73% |
A Total returns do not reflect charges attributable to your insurance company's separate account. Inclusion of these charges would reduce the total returns shown.
B Total returns would have been lower if certain expenses had not been reduced during the applicable periods shown.
C Calculated based on average shares outstanding during the period.
D Fees and expenses of any underlying Fidelity Central Funds are not included in the Fund's expense ratio. The Fund indirectly bears its proportionate share of the expenses of any underlying Fidelity Central Funds.
E Amount does not include the portfolio activity of any underlying Fidelity Central Funds.
F Investment income per share reflects a large, non-recurring dividend which amounted to $.06 per share. Excluding this non-recurring dividend, the ratio of net investment income (loss) to average net assets would have been .61%.
G Expense ratios reflect operating expenses of the class. Expenses before reductions do not reflect amounts reimbursed by the investment adviser or reductions from brokerage service arrangements or reductions from other expense offset arrangements and do not represent the amount paid by the class during periods when reimbursements or reductions occur. Expenses net of fee waivers reflect expenses after reimbursement by the investment adviser but prior to reductions from brokerage service arrangements or other expense offset arrangements. Expenses net of all reductions represent the net expenses paid by the class.
H Total distributions of $1.44 per share is comprised of distributions from net investment income of $.163 and distributions from net realized gain of $1.274 per share.
See accompanying notes which are an integral part of the financial statements.
Annual Report
Notes to Financial Statements
For the period ended December 31, 2013
1. Organization.
VIP Value Portfolio (the Fund) is a fund of Variable Insurance Products Fund (the Trust) and is authorized to issue an unlimited number of shares. The Trust is registered under the Investment Company Act of 1940, as amended (the 1940 Act), as an open-end management investment company organized as a Massachusetts business trust. Shares of the Fund may only be purchased by insurance companies for the purpose of funding variable annuity or variable life insurance contracts. The Fund offers the following classes of shares: Initial Class shares, Service Class shares, Service Class 2 shares and Investor Class shares. All classes have equal rights and voting privileges, except for matters affecting a single class.
2. Investments in Fidelity Central Funds.
The Fund invests in Fidelity Central Funds, which are open-end investment companies generally available only to other investment companies and accounts managed by the investment adviser and its affiliates. The Fund's Schedule of Investments lists each of the Fidelity Central Funds held as of period end, if any, as an investment of the Fund, but does not include the underlying holdings of each Fidelity Central Fund. As an Investing Fund, the Fund indirectly bears its proportionate share of the expenses of the underlying Fidelity Central Funds.
The Money Market Central Funds seek preservation of capital and current income and are managed by Fidelity Investments Money Management, Inc. (FIMM), an affiliate of the investment adviser. Annualized expenses of the Money Market Central Funds as of their most recent shareholder report date are less than .01%.
A complete unaudited list of holdings for each Fidelity Central Fund is available upon request or at the Securities and Exchange Commission (the SEC) website at www.sec.gov. In addition, the financial statements of the Fidelity Central Funds, which are not covered by the Fund's Report of Independent Registered Public Accounting Firm, are available on the SEC website or upon request.
3. Significant Accounting Policies.
The financial statements have been prepared in conformity with accounting principles generally accepted in the United States of America (GAAP), which require management to make certain estimates and assumptions at the date of the financial statements. Actual results could differ from those estimates. Subsequent events, if any, through the date that the financial statements were issued have been evaluated in the preparation of the financial statements. The following summarizes the significant accounting policies of the Fund:
Investment Valuation. Investments are valued as of 4:00 p.m. Eastern time on the last calendar day of the period. In accordance with valuation policies and procedures approved by the Board of Trustees (the Board), the Fund attempts to obtain prices from one or more third party pricing vendors or brokers to value its investments. When current market prices, quotations or currency exchange rates are not readily available or reliable, investments will be fair valued in good faith by the Fidelity Management & Research Company (FMR) Fair Value Committee (the Committee), in accordance with procedures adopted by the Board. Factors used in determining fair value vary by investment type and may include market or investment specific events. The frequency with which these procedures are used cannot be predicted and they may be utilized to a significant extent. The Committee oversees the Fund's valuation policies and procedures and is responsible for approving and reporting to the Board all fair value determinations.
The Fund categorizes the inputs to valuation techniques used to value its investments into a disclosure hierarchy consisting of three levels as shown below:
Level 1 - quoted prices in active markets for identical investments
Level 2 - other significant observable inputs (including quoted prices for similar investments, interest rates, prepayment speeds, etc.)
Level 3 - unobservable inputs (including the Fund's own assumptions based on the best information available)
Valuation techniques used to value the Fund's investments by major category are as follows:
Equity securities, including restricted securities, for which market quotations are readily available, are valued at the last reported sale price or official closing price as reported by a third party pricing vendor on the primary market or exchange on which they are traded and are categorized as Level 1 in the hierarchy. In the event there were no sales during the day or closing prices are not available, securities are valued at the last quoted bid price or may be valued using the last available price and are generally categorized as Level 2 in the hierarchy. For foreign equity securities, when market or security specific events arise, comparisons to the valuation of American Depositary Receipts (ADRs), futures contracts, Exchange-Traded Funds (ETFs) and certain indexes as well as quoted prices for similar securities may be used and would be categorized as Level 2 in the hierarchy. Utilizing these techniques may result in transfers between Level 1 and Level 2. For equity securities, including restricted securities, where observable inputs are limited, assumptions about market activity and risk are used and these securities may be categorized as Level 3 in the hierarchy.
Investments in open-end mutual funds, including the Fidelity Central Funds, are valued at their closing net asset value (NAV) each business day and are categorized as Level 1 in the hierarchy.
Annual Report
3. Significant Accounting Policies - continued
Investment Valuation - continued
Changes in valuation techniques may result in transfers in or out of an assigned level within the disclosure hierarchy. The aggregate value of investments by input level, as of December 31, 2013 is included at the end of the Fund's Schedule of Investments.
Foreign Currency. The Fund may use foreign currency contracts to facilitate transactions in foreign-denominated securities. Gains and losses from these transactions may arise from changes in the value of the foreign currency or if the counterparties do not perform under the contracts' terms.
Foreign-denominated assets, including investment securities, and liabilities are translated into U.S. dollars at the exchange rates at period end. Purchases and sales of investment securities, income and dividends received and expenses denominated in foreign currencies are translated into U.S. dollars at the exchange rate in effect on the transaction date.
The effects of exchange rate fluctuations on investments are included with the net realized and unrealized gain (loss) on investment securities. Other foreign currency transactions resulting in realized and unrealized gain (loss) are disclosed separately.
Investment Transactions and Income. For financial reporting purposes, the Fund's investment holdings and NAV include trades executed through the end of the last business day of the period. The NAV per share for processing shareholder transactions is calculated as of the close of business of the New York Stock Exchange (NYSE), normally 4:00 p.m. Eastern time and includes trades executed through the end of the prior business day. Gains and losses on securities sold are determined on the basis of identified cost and may include proceeds received from litigation. Dividend income is recorded on the ex-dividend date, except for certain dividends from foreign securities where the ex-dividend date may have passed, which are recorded as soon as the Fund is informed of the ex-dividend date. Non-cash dividends included in dividend income, if any, are recorded at the fair market value of the securities received. Distributions received on securities that represent a return of capital or capital gain are recorded as a reduction of cost of investments and/or as a realized gain. Subsequent to ex-dividend date the Fund determines the components of these distributions, based upon receipt of tax filings or other correspondence relating to the underlying investment. Interest income and distributions from the Fidelity Central Funds are accrued as earned. Investment income is recorded net of foreign taxes withheld where recovery of such taxes is uncertain.
Class Allocations and Expenses. Investment income, realized and unrealized capital gains and losses, common expenses of the Fund, and certain fund-level expense reductions, if any, are allocated daily on a pro-rata basis to each class based on the relative net assets of each class to the total net assets of the Fund. Each class differs with respect to transfer agent and distribution and service plan fees incurred. Certain expense reductions may also differ by class. For the reporting period, the allocated portion of income and expenses to each class as a percent of its average net assets may vary due to the timing of recording these transactions in relation to fluctuating net assets of the classes. Expenses directly attributable to a fund are charged to that fund. Expenses attributable to more than one fund are allocated among the respective funds on the basis of relative net assets or other appropriate methods. Expense estimates are accrued in the period to which they relate and adjustments are made when actual amounts are known.
Income Tax Information and Distributions to Shareholders. Each year, the Fund intends to qualify as a regulated investment company under Subchapter M of the Internal Revenue Code, including distributing substantially all of its taxable income and realized gains. As a result, no provision for U.S. Federal income taxes is required. As of December 31, 2013, the Fund did not have any unrecognized tax benefits in the financial statements; nor is the Fund aware of any tax positions for which it is reasonably possible that the total amounts of unrecognized tax benefits will significantly change in the next twelve months. The Fund files a U.S. federal tax return, in addition to state and local tax returns as required. The Fund's federal income tax returns are subject to examination by the Internal Revenue Service (IRS) for a period of three fiscal years after they are filed. State and local tax returns may be subject to examination for an additional fiscal year depending on the jurisdiction. Foreign taxes are provided for based on the Fund's understanding of the tax rules and rates that exist in the foreign markets in which it invests.
Distributions are declared and recorded on the ex-dividend date. Income dividends and capital gain distributions are declared separately for each class. Income and capital gain distributions are determined in accordance with income tax regulations, which may differ from GAAP.
Capital accounts within the financial statements are adjusted for permanent book-tax differences. These adjustments have no impact on net assets or the results of operations. Capital accounts are not adjusted for temporary book-tax differences which will reverse in a subsequent period.
Book-tax differences are primarily due to foreign currency transactions, partnerships, capital loss carryforwards and losses deferred due to wash sales and excise tax regulations.
The federal tax cost of investment securities and unrealized appreciation (depreciation) as of period end were as follows:
Gross unrealized appreciation | $ 39,561,512 |
Gross unrealized depreciation | (491,559) |
Net unrealized appreciation (depreciation) on securities and other investments | $ 39,069,953 |
| |
Tax Cost | $ 192,394,576 |
Annual Report
Notes to Financial Statements - continued
3. Significant Accounting Policies - continued
Income Tax Information and Distributions to Shareholders - continued
The tax-based components of distributable earnings as of period end were as follows:
Undistributed ordinary income | $ 1,675,330 |
Undistributed long-term capital gain | $ 1,127,970 |
Net unrealized appreciation (depreciation) | $ 39,069,929 |
The tax character of distributions paid was as follows:
| December 31, 2013 | December 31, 2012 |
Ordinary Income | $ 7,235,263 | $ 2,418,565 |
Long-term Capital Gains | 12,593,140 | - |
Total | $ 19,828,403 | $ 2,418,565 |
4. Purchases and Sales of Investments.
Purchases and sales of securities, other than short-term securities, aggregated $208,436,436 and $177,305,261, respectively.
5. Fees and Other Transactions with Affiliates.
Management Fee. Fidelity Management & Research Company (the investment adviser) and its affiliates provide the Fund with investment management related services for which the Fund pays a monthly management fee. The management fee is the sum of an individual fund fee rate that is based on an annual rate of .30% of the Fund's average net assets and an annualized group fee rate that averaged .25% during the period. The group fee rate is based upon the average net assets of all the mutual funds advised by the investment adviser, including any mutual funds previously advised by the investment adviser that are currently advised by Fidelity SelectCo, LLC, an affiliate of the investment adviser. The group fee rate decreases as assets under management increase and increases as assets under management decrease. For the reporting period, the total annual management fee rate was .55% of the Fund's average net assets.
Distribution and Service Plan Fees. In accordance with Rule 12b-1 of the 1940 Act, the Fund has adopted separate 12b-1 Plans for each Service Class of shares. Each Service Class pays Fidelity Distributors Corporation (FDC), an affiliate of the investment adviser, a service fee. For the period, the service fee is based on an annual rate of .10% of Service Class' average net assets and .25% of Service Class 2's average net assets.
For the period, total fees, all of which were re-allowed to insurance companies for the distribution of shares and providing shareholder support services were as follows:
Service Class | $ 240 |
Service Class 2 | 12,340 |
| $ 12,580 |
Transfer Agent Fees. Fidelity Investments Institutional Operations Company, Inc. (FIIOC), an affiliate of the investment adviser, is the Fund's transfer, dividend disbursing, and shareholder servicing agent. FIIOC receives an asset-based fee with respect to each class. Each class (with the exception of Investor Class) pays a transfer agent fee, excluding out of pocket expenses, equal to an annual rate of .07% of average net assets. Investor Class pays a monthly asset-based transfer agent fee of .15% of average net assets. In addition, FIIOC receives an asset-based fee of .0035% of average net assets for typesetting, printing and mailing of shareholder reports, except proxy statements. FIIOC voluntarily agreed to reimburse or waive this fee for the period January 1, 2013 through December 31, 2013 (see Expense Reductions note). For the period, transfer agent fees for each class, including printing and out of pocket expenses, were as follows:
Initial Class | $ 74,513 |
Service Class | 166 |
Service Class 2 | 4,030 |
Investor Class | 133,804 |
| $ 212,513 |
Effective February 1, 2014, the Board of Trustees approved an amendment to the transfer agent fee agreement whereby each class (with the exception of Investor Class) pays a single fee of .07% of average net assets for transfer agent services, typesetting, printing and mailing of shareholder reports, excluding mailing of proxy statements and out of pocket expenses. Investor Class pays a single fee of .15% of average net assets.
Annual Report
5. Fees and Other Transactions with Affiliates - continued
Accounting and Security Lending Fees. Fidelity Service Company, Inc. (FSC), an affiliate of the investment adviser, maintains the Fund's accounting records. The accounting fee is based on the level of average net assets for each month. Under a separate contract, FSC administers the security lending program. The security lending fee is based on the number and duration of lending transactions.
Brokerage Commissions. The Fund placed a portion of its portfolio transactions with brokerage firms which are affiliates of the investment adviser. Brokerage commissions are included in net realized gain (loss) and change in net unrealized appreciation (depreciation) in the Statement of Operations. The commissions paid to these affiliated firms were $6,997 for the period.
6. Committed Line of Credit.
The Fund participates with other funds managed by the investment adviser or an affiliate in a $4.25 billion credit facility (the "line of credit") to be utilized for temporary or emergency purposes to fund shareholder redemptions or for other short-term liquidity purposes. The Fund has agreed to pay commitment fees on its pro-rata portion of the line of credit, which amounted to $367 and is reflected in Miscellaneous expenses on the Statement of Operations. During the period, there were no borrowings on this line of credit.
7. Security Lending.
The Fund lends portfolio securities through a lending agent from time to time in order to earn additional income. For equity securities, a lending agent is used and may loan securities to certain qualified borrowers, including Fidelity Capital Markets (FCM), a broker-dealer affiliated with the Fund. On the settlement date of the loan, the Fund receives collateral (in the form of U.S. Treasury obligations, letters of credit and/or cash) against the loaned securities and maintains collateral in an amount not less than 100% of the market value of the loaned securities during the period of the loan. The market value of the loaned securities is determined at the close of business of the Fund and any additional required collateral is delivered to the Fund on the next business day. If the borrower defaults on its obligation to return the securities loaned because of insolvency or other reasons, the Fund may apply collateral received from the borrower against the obligation. The Fund may experience delays and costs in recovering the securities loaned. Any cash collateral received is invested in the Fidelity Securities Lending Cash Central Fund. At period end, there were no security loans outstanding. Security lending income represents the income earned on investing cash collateral, less rebates paid to borrowers and any lending agent fees associated with the loan, plus any premium payments received for lending certain types of securities. Security lending income is presented in the Statement of Operations as a component of income from Fidelity Central Funds. Total security lending income during the period amounted to $12,940. During the period, there were no securities loaned to FCM.
8. Expense Reductions.
The investment adviser or its affiliates agreed to reimburse or waive certain fees during the period as noted in the table below.
Initial Class | $ 3,809 |
Service Class | 9 |
Service Class 2 | 192 |
Investor Class | 3,373 |
| $ 7,383 |
Commissions paid to certain brokers with whom the investment adviser, or its affiliates, places trades on behalf of the Fund include an amount in addition to trade execution, which may be rebated back to the Fund to offset certain expenses. This amount totaled $6,619 for the period.
9. Distributions to Shareholders.
Distributions to shareholders of each class were as follows:
Years ended December 31, | 2013 | 2012 |
From net investment income | | |
Initial Class | $ 1,155,945 | $ 1,379,268 |
Service Class | 1,953 | 3,393 |
Service Class 2 | 47,170 | 53,882 |
Investor Class | 1,089,280 | 982,022 |
Total | $ 2,294,348 | $ 2,418,565 |
Annual Report
Notes to Financial Statements - continued
9. Distributions to Shareholders - continued
Years ended December 31, | 2013 | 2012 |
From net realized gain | | |
Initial Class | $ 8,562,059 | $ - |
Service Class | 16,366 | - |
Service Class 2 | 441,871 | - |
Investor Class | 8,513,759 | - |
Total | $ 17,534,055 | $ - |
10. Share Transactions.
Transactions for each class of shares were as follows:
| Shares | Dollars |
Years ended December 31, | 2013 | 2012 | 2013 | 2012 |
Initial Class | | | | |
Shares sold | 1,950,146 | 1,352,046 | $ 28,708,696 | $ 15,992,881 |
Reinvestment of distributions | 668,363 | 110,518 | 9,718,004 | 1,379,268 |
Shares redeemed | (1,608,838) | (2,727,326) | (23,715,531) | (31,911,868) |
Net increase (decrease) | 1,009,671 | (1,264,762) | $ 14,711,169 | $ (14,539,719) |
Service Class | | | | |
Shares sold | 845 | 451 | $ 12,321 | $ 5,296 |
Reinvestment of distributions | 1,260 | 272 | 18,319 | 3,393 |
Shares redeemed | (4,799) | (2,236) | (75,686) | (26,470) |
Net increase (decrease) | (2,694) | (1,513) | $ (45,046) | $ (17,781) |
Service Class 2 | | | | |
Shares sold | 196,960 | 141,782 | $ 2,818,674 | $ 1,633,565 |
Reinvestment of distributions | 33,938 | 4,352 | 489,041 | 53,882 |
Shares redeemed | (142,285) | (151,734) | (2,062,350) | (1,773,957) |
Net increase (decrease) | 88,613 | (5,600) | $ 1,245,365 | $ (86,510) |
Investor Class | | | | |
Shares sold | 2,819,642 | 959,913 | $ 41,243,193 | $ 11,352,729 |
Reinvestment of distributions | 661,366 | 78,751 | 9,603,039 | 982,022 |
Shares redeemed | (1,081,471) | (1,604,791) | (15,728,682) | (18,765,594) |
Net increase (decrease) | 2,399,537 | (566,127) | $ 35,117,550 | $ (6,430,843) |
11. Other.
The Fund's organizational documents provide former and current trustees and officers with a limited indemnification against liabilities arising in connection with the performance of their duties to the Fund. In the normal course of business, the Fund may also enter into contracts that provide general indemnifications. The Fund's maximum exposure under these arrangements is unknown as this would be dependent on future claims that may be made against the Fund. The risk of material loss from such claims is considered remote.
At the end of the period, the VIP Freedom 2020 Portfolio was the owner of record of approximately 19% of the total outstanding shares of the Fund. The VIP Freedom Funds were the owners of record, in the aggregate, of approximately 56% of the total outstanding shares of the Fund. In addition, the investment adviser or its affiliates were the owners of record of 40% of the total outstanding shares of the Fund.
Annual Report
Report of Independent Registered Public Accounting Firm
To the Trustees of Variable Insurance Products Fund and Shareholders of VIP Value Portfolio:
We have audited the accompanying statement of assets and liabilities of VIP Value Portfolio (the Fund), a fund of Variable Insurance Products Fund, including the schedule of investments, as of December 31, 2013, and the related statement of operations for the year then ended, the statement of changes in net assets for each of the two years in the period then ended, and the financial highlights for each of the five years in the period then ended. These financial statements and financial highlights are the responsibility of the Fund's management. Our responsibility is to express an opinion on these financial statements and financial highlights based on our audits.
We conducted our audits in accordance with the standards of the Public Company Accounting Oversight Board (United States). Those standards require that we plan and perform the audit to obtain reasonable assurance about whether the financial statements and financial highlights are free of material misstatement. The Fund is not required to have, nor were we engaged to perform, an audit of its internal control over financial reporting. Our audits included consideration of internal control over financial reporting as a basis for designing audit procedures that are appropriate in the circumstances, but not for the purpose of expressing an opinion on the effectiveness of the Fund's internal control over financial reporting. Accordingly, we express no such opinion. An audit also includes examining, on a test basis, evidence supporting the amounts and disclosures in the financial statements, assessing the accounting principles used and significant estimates made by management, as well as evaluating the overall financial statement presentation. Our procedures included confirmation of securities owned as of December 31, 2013, by correspondence with the custodians. We believe that our audits provide a reasonable basis for our opinion.
In our opinion, the financial statements and financial highlights referred to above present fairly, in all material respects, the financial position of VIP Value Portfolio as of December 31, 2013, the results of its operations for the year then ended, the changes in its net assets for each of the two years in the period then ended, and the financial highlights for each of the five years in the period then ended, in conformity with accounting principles generally accepted in the United States of America.
DELOITTE & TOUCHE LLP
Boston, Massachusetts
February 11, 2014
Annual Report
The Trustees, Member of the Advisory Board, and officers of the trust and fund, as applicable, are listed below. The Board of Trustees governs the fund and is responsible for protecting the interests of shareholders. The Trustees are experienced executives who meet periodically throughout the year to oversee the fund's activities, review contractual arrangements with companies that provide services to the fund, oversee management of the risks associated with such activities and contractual arrangements, and review the fund's performance. Except for James C. Curvey, Ned C. Lautenbach, Ronald P. O'Hanley, and William S. Stavropoulos, each of the Trustees oversees 173 funds. Mr. Curvey oversees 396 funds. Mr. Lautenbach, Mr. O'Hanley, and Mr. Stavropoulos each oversees 247 funds.
The Trustees hold office without limit in time except that (a) any Trustee may resign; (b) any Trustee may be removed by written instrument, signed by at least two-thirds of the number of Trustees prior to such removal; (c) any Trustee who requests to be retired or who has become incapacitated by illness or injury may be retired by written instrument signed by a majority of the other Trustees; and (d) any Trustee may be removed at any special meeting of shareholders by a two-thirds vote of the outstanding voting securities of the trust. Each Trustee who is not an interested person (as defined in the 1940 Act) of the trust and the fund (Independent Trustee), shall retire not later than the last day of the calendar year in which his or her 75th birthday occurs. The Independent Trustees may waive this mandatory retirement age policy with respect to individual Trustees. The officers and Advisory Board Member hold office without limit in time, except that any officer and Advisory Board Member may resign or may be removed by a vote of a majority of the Trustees at any regular meeting or any special meeting of the Trustees. Except as indicated, each individual has held the office shown or other offices in the same company for the past five years.
Experience, Skills, Attributes, and Qualifications of the Fund's Trustees. The Governance and Nominating Committee has adopted a statement of policy that describes the experience, qualifications, attributes, and skills that are necessary and desirable for potential Independent Trustee candidates (Statement of Policy). The Board believes that each Trustee satisfied at the time he or she was initially elected or appointed a Trustee, and continues to satisfy, the standards contemplated by the Statement of Policy. The Governance and Nominating Committee also engages professional search firms to help identify potential Independent Trustee candidates who have the experience, qualifications, attributes, and skills consistent with the Statement of Policy. From time to time, additional criteria based on the composition and skills of the current Independent Trustees, as well as experience or skills that may be appropriate in light of future changes to board composition, business conditions, and regulatory or other developments, have also been considered by the professional search firms and the Governance and Nominating Committee. In addition, the Board takes into account the Trustees' commitment and participation in Board and committee meetings, as well as their leadership of standing and ad hoc committees throughout their tenure.
In determining that a particular Trustee was and continues to be qualified to serve as a Trustee, the Board has considered a variety of criteria, none of which, in isolation, was controlling. The Board believes that, collectively, the Trustees have balanced and diverse experience, qualifications, attributes, and skills, which allow the Board to operate effectively in governing the fund and protecting the interests of shareholders. Information about the specific experience, skills, attributes, and qualifications of each Trustee, which in each case led to the Board's conclusion that the Trustee should serve (or continue to serve) as a trustee of the fund, is provided below.
Board Structure and Oversight Function. James C. Curvey is an interested person (as defined in the 1940 Act) and currently serves as Chairman. The Trustees have determined that an interested Chairman is appropriate and benefits shareholders because an interested Chairman has a personal and professional stake in the quality and continuity of services provided to the fund. Independent Trustees exercise their informed business judgment to appoint an individual of their choosing to serve as Chairman, regardless of whether the Trustee happens to be independent or a member of management. The Independent Trustees have determined that they can act independently and effectively without having an Independent Trustee serve as Chairman and that a key structural component for assuring that they are in a position to do so is for the Independent Trustees to constitute a substantial majority for the Board. The Independent Trustees also regularly meet in executive session. Ned C. Lautenbach serves as Chairman of the Independent Trustees and as such (i) acts as a liaison between the Independent Trustees and management with respect to matters important to the Independent Trustees and (ii) with management prepares agendas for Board meetings.
Fidelity funds are overseen by different Boards of Trustees. The fund's Board oversees Fidelity's equity and high income funds and another Board oversees Fidelity's investment-grade bond, money market, and asset allocation funds. The asset allocation funds may invest in Fidelity funds overseen by the fund's Board. The use of separate Boards, each with its own committee structure, allows the Trustees of each group of Fidelity funds to focus on the unique issues of the funds they oversee, including common research, investment, and operational issues. On occasion, the separate Boards establish joint committees to address issues of overlapping consequences for the Fidelity funds overseen by each Board.
The Trustees operate using a system of committees to facilitate the timely and efficient consideration of all matters of importance to the Trustees, the fund, and fund shareholders and to facilitate compliance with legal and regulatory requirements and oversight of the fund's activities and associated risks. The Board, acting through its committees, has charged FMR and its affiliates with (i) identifying events or circumstances the occurrence of which could have demonstrably adverse effects on the fund's business and/or reputation; (ii) implementing processes and controls to lessen the possibility that such events or circumstances occur or to mitigate the effects of such events or circumstances if they do occur; and (iii) creating and maintaining a system designed to evaluate continuously business and market conditions in order to facilitate the identification and implementation processes described in (i) and (ii) above. Because the day-to-day operations and activities of the fund are carried out by or through FMR, its affiliates and other service providers, the fund's exposure to risks is mitigated but not eliminated by the processes overseen by the Trustees. While each of the Board's committees has responsibility for overseeing different aspects of the fund's activities, oversight is exercised primarily through the Operations, Audit, and Compliance Committees. In addition, the Independent Trustees have worked with FMR to enhance the Board's oversight of investment and financial risks, legal and regulatory risks, technology risks, and operational risks, including the development of additional risk reporting to the Board. For example, a working group comprised of Independent Trustees and FMR has worked and continues to work to review the Fidelity funds' valuation-related activities, reporting and risk management. Appropriate personnel, including but not limited to the fund's Chief Compliance Officer (CCO), FMR's internal auditor, the independent accountants, the fund's Treasurer and portfolio management personnel, make periodic reports to the Board's committees, as appropriate, including an annual review of FMR's risk management program for the Fidelity funds. The responsibilities of each standing committee, including their oversight responsibilities, are described further under "Standing Committees of the Fund's Trustees."
Annual Report
Trustees and Officers - continued
The fund's Statement of Additional Information (SAI) includes more information about the Trustees. To request a free copy, call Fidelity at 1-877-208-0098.
Interested Trustees*:
Correspondence intended for the Trustee who is an interested person may be sent to Fidelity Investments, 245 Summer Street, Boston, Massachusetts 02210.
Name, Year of Birth; Principal Occupations and Other Relevant Experience+ |
James C. Curvey (1935) |
Year of Election or Appointment: 2007 Trustee Chairman of the Board of Trustees |
| Mr. Curvey also serves as Trustee of other Fidelity funds. Mr. Curvey is a Director of Fidelity Investments Money Management, Inc. (2009-present), Director of Fidelity Research & Analysis Co. (2009-present) and Director of FMR and FMR Co., Inc. (2007-present). Mr. Curvey is also Vice Chairman (2007-present) and Director of FMR LLC. In addition, Mr. Curvey serves as an Overseer for the Boston Symphony Orchestra and a member of the Trustees of Villanova University. Previously, Mr. Curvey was the Vice Chairman (2006-2007) and Director (2000-2007) of FMR Corp. |
Ronald P. O'Hanley (1957) |
Year of Election or Appointment: 2011 Trustee |
| Mr. O'Hanley also serves as Trustee of other Fidelity funds. He is Director of Fidelity SelectCo, LLC (2013-present), FMR Co., Inc. (2010-present), Director of Fidelity Investments Money Management, Inc. (2010-present), Director of Fidelity Research & Analysis Company (2010-present), President of Fidelity Asset Management and Corporate Services and a Member of Fidelity's Executive Committee (2010-present). Previously, Mr. O'Hanley served as President and Chief Executive Officer of BNY Mellon Asset Management (2007-2010). Mr. O'Hanley also served as Vice Chairman of Bank New York Mellon Corp. and a member of that firm's Executive Committee. Prior to the 2007 merger of The Bank of New York and Mellon Financial Corporation, he was Vice Chairman of Mellon Financial Corporation and President and Chief Executive Officer of Mellon Asset Management. He joined Mellon in February 1997. Mr. O'Hanley currently serves as Chairman of the Boston Public Library Foundation Board of Directors and sits on the Board of Directors of Beth Israel Deaconess Medical Center, the Board of Trustees of the Marine Biological Laboratory and the Advisory Board of the Maxwell School of Citizenship and Public Administration at Syracuse University. Mr. O'Hanley also chairs the Council on Asset Management for the Financial Services Roundtable and is a member of the Board of Directors of Institutional Investor's U.S. Institute. |
* Trustees have been determined to be "Interested Trustees" by virtue of, among other things, their affiliation with the trust or various entities under common control with FMR.
+ The information above includes each Trustee's principal occupation during the last five years and other information relating to the experience, attributes, and skills relevant to each Trustee's qualifications to serve as a Trustee, which led to the conclusion that each Trustee should serve as a Trustee for the fund.
Annual Report
Independent Trustees:
Correspondence intended for each Independent Trustee (that is, the Trustees other than the Interested Trustee) may be sent to Fidelity Investments, P.O. Box 55235, Boston, Massachusetts 02205-5235.
Name, Year of Birth; Principal Occupations and Other Relevant Experience+ |
Dennis J. Dirks (1948) |
Year of Election or Appointment: 2005 Trustee |
| Mr. Dirks also serves as Trustee of other Fidelity funds. Prior to his retirement in May 2003, Mr. Dirks was Chief Operating Officer and a member of the Board of The Depository Trust & Clearing Corporation (DTCC). He also served as President, Chief Operating Officer, and Board member of The Depository Trust Company (DTC) and President and Board member of the National Securities Clearing Corporation (NSCC). In addition, Mr. Dirks served as Chief Executive Officer and Board member of the Government Securities Clearing Corporation, Chief Executive Officer and Board member of the Mortgage-Backed Securities Clearing Corporation, as a Trustee and a member of the Finance Committee of Manhattan College (2005-2008), and as a Trustee and a member of the Finance Committee of AHRC of Nassau County (2006-2008). Mr. Dirks is a member of the Independent Directors Council (IDC) Governing Council (2010-present) and Board of Directors for The Brookville Center for Children's Services, Inc. (2009-present). |
Alan J. Lacy (1953) |
Year of Election or Appointment: 2008 Trustee |
| Mr. Lacy also serves as Trustee of other Fidelity funds. Mr. Lacy serves as Senior Adviser (2007-present) of Oak Hill Capital Partners, L.P. (private equity). Mr. Lacy also served as Chief Executive Officer (2000-2005) and Vice Chairman (2005-2006) of Sears Holdings Corporation and Sears, Roebuck and Co. (retail). In addition, Mr. Lacy serves as a member of the Board of Directors of Dave & Buster's Entertainment, Inc. (restaurant and entertainment complexes, 2010-present), Earth Fare, Inc. (retail grocery, 2012-present), The Hillman Companies, Inc. (hardware wholesalers, 2010-present), and Bristol-Myers Squibb Company (global pharmaceuticals, 2008-present). Mr. Lacy is a member of the Board of Trustees of The National Parks Conservation Association (2006-present). Previously, Mr. Lacy served as Chairman of the Board of Trustees of the National Parks Conservation Association (2008-2011) and as a member of the Board of Directors for the Western Union Company (global money transfer, 2006-2011). |
Ned C. Lautenbach (1944) |
Year of Election or Appointment: 2000 Trustee Chairman of the Independent Trustees |
| Mr. Lautenbach also serves as Trustee of other Fidelity funds. Mr. Lautenbach currently serves as the Lead Director of the Eaton Corporation Board of Directors (diversified industrial, 1997-present). Mr. Lautenbach is Chairman of the Board of Directors of the Philharmonic Center for the Arts in Naples, Florida (2012-present) and a member of the Council on Foreign Relations (1994-present). Previously, Mr. Lautenbach was a Partner/Advisory Partner at Clayton, Dubilier & Rice, LLC (private equity investment, 1998-2010), as well as a Director of Sony Corporation (2006-2007). |
Joseph Mauriello (1944) |
Year of Election or Appointment: 2008 Trustee |
| Mr. Mauriello also serves as Trustee of other Fidelity funds. Prior to his retirement in January 2006, Mr. Mauriello served in numerous senior management positions including Deputy Chairman and Chief Operating Officer (2004-2005), and Vice Chairman of Financial Services (2002-2004) of KPMG LLP US (professional services, 1965-2005). Mr. Mauriello currently serves as a member of the Board of Directors of XL Group plc. (global insurance and re-insurance, 2006-present). Previously, Mr. Mauriello served as a Director of the Hamilton Funds of the Bank of New York (2006-2007) and of Arcadia Resources Inc. (health care services and products, 2007-2012). |
Robert W. Selander (1950) |
Year of Election or Appointment: 2011 Trustee |
| Mr. Selander also serves as Trustee of other Fidelity funds. Previously, Mr. Selander served as a Member of the Advisory Board of other Fidelity funds (2011), and Executive Vice Chairman (2010), Chief Executive Officer (2009-2010), and President and Chief Executive Officer (1997-2009) of Mastercard, Inc. |
Cornelia M. Small (1944) |
Year of Election or Appointment: 2005 Trustee |
| Ms. Small also serves as Trustee of other Fidelity funds. Ms. Small is a member of the Board of Directors (2009-present) and Chair of the Investment Committee (2010-present) of the Teagle Foundation. Ms. Small also serves on the Investment Committee of the Berkshire Taconic Community Foundation (2008-present). Previously, Ms. Small served as Chairperson (2002-2008) and a member of the Investment Committee and Chairperson (2008-2012) and a member of the Board of Trustees of Smith College. In addition, Ms. Small served as Chief Investment Officer, Director of Global Equity Investments, and a member of the Board of Directors of Scudder, Stevens & Clark and Scudder Kemper Investments. |
William S. Stavropoulos (1939) |
Year of Election or Appointment: 2002 Trustee Vice Chairman of the Independent Trustees |
| Mr. Stavropoulos also serves as Trustee of other Fidelity funds. Mr. Stavropoulos serves as President and Founder of the Michigan Baseball Foundation, the Great Lakes Loons (2007-present). Mr. Stavropoulos is Chairman Emeritus of the Board of Directors of The Dow Chemical Company, where he previously served in numerous senior management positions, including President, CEO (1995-2000; 2002-2004), Chairman of the Executive Committee (2000-2006), and as a member of the Board of Directors (1990-2006). Currently, Mr. Stavropoulos is Chairman of the Board of Directors of Univar Inc. (global distributor of commodity and specialty chemicals), a Director of Teradata Corporation (data warehousing and technology solutions), and Maersk Inc. (industrial conglomerate), and a member of the Advisory Board for Metalmark Capital LLC (private equity investment, 2005-present). Mr. Stavropoulos is an operating advisor to Clayton, Dubilier & Rice, LLC (private equity investment). In addition, Mr. Stavropoulos is a member of the University of Notre Dame Advisory Council for the College of Science, a Trustee of the Rollin L. Gerstacker Foundation, and a Director of the Naples Philharmonic Center for the Arts. Previously, Mr. Stavropoulos served as a Director of Chemical Financial Corporation (bank holding company, 1993-2012) and Tyco International, Ltd. (multinational manufacturing and services, 2007-2012). |
David M. Thomas (1949) |
Year of Election or Appointment: 2008 Trustee |
| Mr. Thomas also serves as Trustee of other Fidelity funds. Mr. Thomas serves as Non-Executive Chairman of the Board of Directors of Fortune Brands Home and Security (home and security products, 2011-present), and as a member of the Board of Directors of Interpublic Group of Companies, Inc. (marketing communication, 2004-present). Previously, Mr. Thomas served as Executive Chairman (2005-2006) and Chairman and Chief Executive Officer (2000-2005) of IMS Health, Inc. (pharmaceutical and healthcare information solutions), and a Director of Fortune Brands, Inc. (consumer products, 2000-2011). |
+ The information above includes each Trustee's principal occupation during the last five years and other information relating to the experience, attributes, and skills relevant to each Trustee's qualifications to serve as a Trustee, which led to the conclusion that each Trustee should serve as a Trustee for the fund.
Advisory Board Member and Officers:
Correspondence intended for each officer and Peter S. Lynch may be sent to Fidelity Investments, 245 Summer Street, Boston, Massachusetts 02210. Officers appear below in alphabetical order.
Name, Year of Birth; Principal Occupation |
Peter S. Lynch (1944) |
Year of Election or Appointment: 2003 Member of the Advisory Board |
| Mr. Lynch also serves as Member of the Advisory Board of other Fidelity funds. Mr. Lynch is Vice Chairman and a Director of FMR and FMR Co., Inc. In addition, Mr. Lynch serves as a Trustee of Boston College and as the Chairman of the Inner-City Scholarship Fund. Previously, Mr. Lynch served on the Special Olympics International Board of Directors (1997-2006). |
Elizabeth Paige Baumann (1968) |
Year of Election or Appointment: 2012 Anti-Money Laundering (AML) Officer |
| Ms. Baumann also serves as AML Officer of other funds. She is Chief AML Officer of FMR LLC (2012-present) and is an employee of Fidelity Investments. Previously, Ms. Baumann served as Vice President and Deputy Anti-Money Laundering Officer (2007-2012). |
William C. Coffey (1969) |
Year of Election or Appointment: 2009 Assistant Secretary |
| Mr. Coffey also serves as Assistant Secretary of other funds. He is Senior Vice President and Deputy General Counsel of FMR LLC (2010-present), and is an employee of Fidelity Investments. Previously, Mr. Coffey served as Vice President and Associate General Counsel of FMR LLC (2005-2009). |
Jonathan Davis (1968) |
Year of Election or Appointment: 2010 Assistant Treasurer |
| Mr. Davis also serves as Assistant Treasurer of other funds. Mr. Davis is an employee of Fidelity Investments. Previously, Mr. Davis served as Vice President and Associate General Counsel of FMR LLC (2003-2010). |
Adrien E. Deberghes (1967) |
Year of Election or Appointment: 2008 Deputy Treasurer |
| Mr. Deberghes also serves as an officer of other funds. He is an employee of Fidelity Investments (2008-present). Prior to joining Fidelity Investments, Mr. Deberghes was Senior Vice President of Mutual Fund Administration at State Street Corporation (2007-2008), Senior Director of Mutual Fund Administration at Investors Bank & Trust (2005-2007), and Director of Finance for Dunkin' Brands (2000-2005). |
Stephanie J. Dorsey (1969) |
Year of Election or Appointment: 2010 Assistant Treasurer |
| Ms. Dorsey also serves as an officer of other funds. She is an employee of Fidelity Investments (2008-present) and has served in other fund officer roles. Prior to joining Fidelity Investments, Ms. Dorsey served as Treasurer (2004-2008) of the JPMorgan Mutual Funds and Vice President (2004-2008) of JPMorgan Chase Bank. |
Scott C. Goebel (1968) |
Year of Election or Appointment: 2008 Secretary and Chief Legal Officer (CLO) |
| Mr. Goebel serves as Secretary and CLO of other funds. Mr. Goebel also serves as Secretary of Fidelity Investments Money Management, Inc. (FIMM) (2010-present) and Fidelity Research and Analysis Company (FRAC) (2010-present); General Counsel, Secretary, and Senior Vice President of FMR (2008-present) and FMR Co., Inc. (2008-present); Chief Legal Officer of Fidelity Management & Research (Hong Kong) Limited (2008-present) and Assistant Secretary of Fidelity Management & Research (Japan) Inc. (2008-present), and Fidelity Management & Research (U.K.) Inc. (2008-present). Previously, Mr. Goebel served as Secretary and CLO of other Fidelity funds (2008-2013), Assistant Secretary of FIMM (2008-2010), FRAC (2008-2010), and certain funds (2007-2008); and as Vice President and Secretary of Fidelity Distributors Corporation (FDC) (2005-2007). Mr. Goebel has been employed by FMR LLC or an affiliate since 2001. |
Joseph A. Hanlon (1968) |
Year of Election or Appointment: 2012 Chief Compliance Officer |
| Mr. Hanlon also serves as Chief Compliance Officer of other funds. Mr. Hanlon serves as Compliance Officer of FMR, FMR Co., Inc., Fidelity Investments Money Management, Inc. (FIMM), Fidelity Research and Analysis Company (FRAC), and Fidelity Management & Research (Hong Kong) (2009-present), as Senior Vice President of the Fidelity Asset Management Division (2009-present), and is an employee of Fidelity Investments. Previously, Mr. Hanlon served as Compliance Officer of Fidelity Management & Research (Japan) Inc. (2009-2013), Strategic Advisers, Inc. (2009-2013), and Fidelity Management & Research (U.K.) Inc. (2009-2013). |
Thomas C. Hense (1964) |
Year of Election or Appointment: 2008/2010 Vice President |
| Mr. Hense also serves as Vice President of other funds (High Income (2008), Small Cap (2008), and Value (2010) funds). Previously, Mr. Hense served as a portfolio manager for Fidelity's Institutional Money Management Group (Pyramis) (2003-2008). |
Brian B. Hogan (1964) |
Year of Election or Appointment: 2009 Vice President |
| Mr. Hogan also serves as Vice President of other funds. Mr. Hogan serves as President of FMR's Equity Division (2009-present). Previously, Mr. Hogan served as Senior Vice President, Equity Research of FMR (2006-2009) and as a portfolio manager. |
Chris Maher (1972) |
Year of Election or Appointment: 2013 Assistant Treasurer |
| Mr. Maher serves as Assistant Treasurer of other funds. Mr. Maher is Vice President of Valuation Oversight and is an employee of Fidelity Investments. Previously, Mr. Maher served as Vice President of Asset Management Compliance (2013), Vice President of FMR's Program Management Group (2010-2013), and Vice President of Valuation Oversight (2008-2010). |
Christine Reynolds (1958) |
Year of Election or Appointment: 2008 Chief Financial Officer |
| Ms. Reynolds also serves as Chief Financial Officer of other funds. Ms. Reynolds became President of Fidelity Pricing and Cash Management Services (FPCMS) in August 2008. Ms. Reynolds served as Chief Operating Officer of FPCMS (2007-2008). Previously, Ms. Reynolds served as President, Treasurer, and Anti-Money Laundering officer of the Fidelity funds (2004-2007). |
Kenneth B. Robins (1969) |
Year of Election or Appointment: 2008 President and Treasurer |
| Mr. Robins also serves as an officer of other funds. Mr. Robins serves as Executive Vice President of Fidelity Investments Money Management, Inc. (FIMM) (2013-present) and is an employee of Fidelity Investments (2004-present). Previously, Mr. Robins served in other fund officer roles. |
Gary W. Ryan (1958) |
Year of Election or Appointment: 2005 Assistant Treasurer |
| Mr. Ryan also serves as Assistant Treasurer of other funds. Mr. Ryan is an employee of Fidelity Investments and has served in other fund officer roles. Previously, Mr. Ryan served as Vice President of Fund Reporting in Fidelity Pricing and Cash Management Services (FPCMS) (1999-2005). |
Stephen Sadoski (1971) |
Year of Election or Appointment: 2012 Deputy Treasurer |
| Mr. Sadoski also serves as Deputy Treasurer of other funds. He is an employee of Fidelity Investments (2012-present) and has served in another fund officer role. Prior to joining Fidelity Investments, Mr. Sadoski served as an assistant chief accountant in the Division of Investment Management of the Securities and Exchange Commission (SEC) (2009-2012) and as a senior manager at Deloitte & Touche LLP (1997-2009). |
Stacie M. Smith (1974) |
Year of Election or Appointment: 2013 Deputy Treasurer |
| Ms. Smith also serves as an officer of other funds. She is an employee of Fidelity Investments (2009-present) and has served in other fund officer roles. Prior to joining Fidelity Investments, Ms. Smith served as Senior Audit Manager of Ernst & Young LLP (1996-2009). |
Renee Stagnone (1975) |
Year of Election or Appointment: 2013 Deputy Treasurer |
| Ms. Stagnone also serves as Deputy Treasurer of other funds. Ms. Stagnone is an employee of Fidelity Investments. |
Joseph F. Zambello (1957) |
Year of Election or Appointment: 2011 Deputy Treasurer |
| Mr. Zambello also serves as Deputy Treasurer of other funds. Mr. Zambello is an employee of Fidelity Investments. Previously, Mr. Zambello served as Vice President of FMR's Program Management Group (2009-2011) and Vice President of the Transfer Agent Oversight Group (2005-2009). |
Annual Report
The Board of Trustees of VIP Value Portfolio voted to pay to shareholders of record at the opening of business on record date, the following distributions per share derived from capital gains realized from sales of portfolio securities, and dividends derived from net investment income:
| Pay Date | Record Date | Dividends | Capital Gains |
Initial Class | 02/07/2014 | 02/07/2014 | $0.000 | $0.183 |
Service Class | 02/07/2014 | 02/07/2014 | $0.000 | $0.183 |
Service Class 2 | 02/07/2014 | 02/07/2014 | $0.000 | $0.183 |
Investor Class | 02/07/2014 | 02/07/2014 | $0.000 | $0.183 |
The fund hereby designates as a capital gain dividend with respect to the taxable year ended December 31, 2013, $13,721,110, or, if subsequently determined to be different, the net capital gain of such year.
Initial Class designates 37%; Service Class designates 38%; Service Class 2 designates 40%; and Investor Class designates 38% of the dividends distributed, during the fiscal year as qualifying for the dividends-received deduction for corporate shareholders.
Annual Report
Board Approval of Investment Advisory Contracts and Management Fees
VIP Value Portfolio
Each year, the Board of Trustees, including the Independent Trustees (together, the Board), votes on the renewal of the management contract and sub-advisory agreements (together, the Advisory Contracts) for the fund. The Board, assisted by the advice of fund counsel and Independent Trustees' counsel, requests and considers a broad range of information relevant to the renewal of the Advisory Contracts throughout the year.
The Board meets regularly and, at each of its meetings, covers an extensive agenda of topics and materials and considers factors that are relevant to its annual consideration of the renewal of the fund's Advisory Contracts, including the services and support provided to the fund and its shareholders. The Board has established various standing committees, each composed of and chaired by Independent Trustees with varying backgrounds, to which the Board has assigned specific subject matter responsibilities in order to enhance effective decision-making by the Board. The Board, acting directly and through its Committees, requests and receives information concerning the annual consideration of the renewal of the fund's Advisory Contracts. The Board also meets as needed to consider matters specifically related to the Board's annual consideration of the renewal of Advisory Contracts. Members of the Board may also meet with trustees of other Fidelity funds through ad hoc joint committees to discuss certain matters relevant to the Fidelity funds.
At its July 2013 meeting, the Board, including the Independent Trustees, unanimously determined to renew the fund's Advisory Contracts. In reaching its determination, the Board considered all factors it believed relevant, including (i) the nature, extent, and quality of the services to be provided to the fund and its shareholders (including the investment performance of the fund); (ii) the competitiveness of the fund's management fee and total expense ratio relative to peer funds; (iii) the total costs of the services to be provided by and the profits to be realized by Fidelity from its relationship with the fund; (iv) the extent to which economies of scale exist and would be realized as the fund grows; and (v) whether fee levels reflect these economies of scale, if any, for the benefit of fund shareholders.
In considering whether to renew the Advisory Contracts for the fund, the Board reached a determination, with the assistance of fund counsel and Independent Trustees' counsel and through the exercise of its business judgment, that the renewal of the Advisory Contracts was in the best interests of the fund and its shareholders and that the compensation payable under the Advisory Contracts was fair and reasonable. The Board's decision to renew the Advisory Contracts was not based on any single factor, but rather was based on a comprehensive consideration of all the information provided to the Board at its meetings throughout the year. The Board, in reaching its determination to renew the Advisory Contracts, was aware that shareholders in the fund have a broad range of investment choices available to them, including a wide choice among mutual funds offered by Fidelity's competitors, and that the fund's shareholders, who have the opportunity to review and weigh the disclosure provided by the fund in its prospectus and other public disclosures, have chosen to invest in this fund, which is a part of the Fidelity family of funds.
Nature, Extent, and Quality of Services Provided. The Board considered the staffing within the investment adviser, Fidelity Management & Research Company (FMR), and the sub-advisers (together, the Investment Advisers) as it relates to the fund, including the backgrounds of the fund's investment personnel, and also considered the fund's investment objective, strategies, and related investment philosophy. The Independent Trustees also had discussions with senior management of Fidelity's investment operations and investment groups. The Board considered the structure of the portfolio manager compensation program and whether this structure provides appropriate incentives to act in the best interests of the fund.
Resources Dedicated to Investment Management and Support Services. The Board and the Fund Oversight and Research Committees reviewed the general qualifications and capabilities of the Investment Advisers' investment staff, including its size, education, experience, and resources, as well as the Investment Advisers' approach to recruiting, training, managing, and compensating investment personnel. The Board noted that FMR has continued to increase the resources devoted to non-U.S. offices, including expansion of Fidelity's global investment organization. The Board also noted that Fidelity's analysts have extensive resources, tools and capabilities that allow them to conduct sophisticated quantitative and fundamental analysis, as well as credit analysis of issuers, counterparties and guarantors. Further, the Board believes that Fidelity's investment professionals have sufficient access to global information and data so as to provide competitive investment results over time, and that those professionals also have access to sophisticated tools that permit them to assess portfolio construction and risk and performance attribution characteristics continuously, as well as to transmit new information and research conclusions rapidly around the world. Additionally, in its deliberations, the Board considered the Investment Advisers' trading and risk management capabilities and resources, which are an integral part of the investment management process.
Shareholder and Administrative Services. The Board considered (i) the nature, extent, quality, and cost of advisory, administrative, and shareholder services performed by the Investment Advisers and their affiliates under the Advisory Contracts and under separate agreements covering transfer agency, pricing and bookkeeping, and securities lending services for the fund; (ii) the nature and extent of the supervision of third party service providers, principally custodians and subcustodians; and (iii) the resources devoted to, and the record of compliance with, the fund's compliance policies and procedures. The Board also reviewed the allocation of fund brokerage, including allocations to brokers affiliated with the Investment Advisers, the use of brokerage commissions to pay fund expenses, and the use of "soft" commission dollars to pay for research services.
The Board noted that the growth of fund assets over time across the complex allows Fidelity to reinvest in the development of services designed to enhance the value or convenience of the Fidelity funds as investment vehicles. These services include 24-hour access to account information and market information through telephone representatives and over the Internet, investor education materials and asset allocation tools, and the expanded availability of Fidelity Investor Centers.
Annual Report
Board Approval of Investment Advisory Contracts and Management Fees - continued
Investment in a Large Fund Family. The Board considered the benefits to shareholders of investing in a Fidelity fund, including the benefits of investing in a fund that is part of a large family of funds offering a variety of investment disciplines and providing a large variety of mutual fund investor services. The Board noted that Fidelity had taken, or had made recommendations that resulted in the Fidelity funds taking, a number of actions over the previous year that benefited particular funds, including (i) continuing to dedicate additional resources to investment research and to the support of the senior management team that oversees asset management; (ii) persisting in efforts to enhance Fidelity's global research capabilities; (iii) launching new funds and making other enhancements to meet client needs for global and income-oriented solutions; (iv) continuing to launch dedicated lower cost underlying funds to meet portfolio construction needs related to expanding underlying fund options for Fidelity funds of funds, specifically for the Freedom Fund product lines; (v) rationalizing product lines and gaining increased efficiencies through the mergers of several funds into other funds; (vi) strengthening Fidelity's index fund offerings by reducing investment minimums and adopting or lowering existing expense caps for certain funds and classes; (vii) enhancing Global Asset Allocation product offerings by launching new funds and strategies, including "open architecture" target date funds that utilize affiliated and unaffiliated sub-advisers; (viii) modifying the eligibility criteria for Institutional Class shares of Advisor funds to increase their marketability to a portion of the defined contribution plan market; (ix) creating a new low-cost retirement share class for certain Advisor funds to appeal to large retirement plans; (x) transitioning the management of certain Fidelity commodity funds to Geode Capital Management LLC, a registered commodity pool operator, while retaining administrative responsibilities for the funds; (xi) reorganizing a number of funds; and (xii) taking steps toward establishing a new Fidelity adviser to manage sector-based funds and products.
Investment Performance. The Board considered whether the fund has operated in accordance with its investment objective, as well as its record of compliance with its investment restrictions and its performance history. The Board noted that there was a portfolio management change for the fund in July 2010 and January 2012.
The Board took into account discussions with the Investment Advisers about fund investment performance that occur at Board meetings throughout the year. In this regard the Board noted that as part of regularly scheduled fund reviews and other reports to the Board on fund performance, the Board periodically considers annualized return information for the fund, for different time periods, measured against a securities market index ("benchmark index") and a peer group of mutual funds with similar objectives ("peer group"). In its evaluation of fund investment performance, the Board gave particular attention to information indicating changes in performance of certain Fidelity funds for specific time periods and the Investment Advisers' explanations for any overperformance or underperformance.
In addition to reviewing absolute and relative fund performance, the Independent Trustees periodically consider the appropriateness of fund performance metrics in evaluating the results achieved. In general, the Independent Trustees believe that fund performance should be evaluated based on net performance (after fees and expenses) of both the highest performing and lowest performing classes, where applicable, compared to appropriate benchmark indices, over appropriate time periods which may include full market cycles, and compared to peer groups, as applicable, over the same periods, taking into account relevant factors including the following: general market conditions; issuer-specific information; tactical opportunities for investment; and fund cash flows and other factors.
The Independent Trustees recognize that shareholders evaluate performance on a net basis over their own holding periods, for which one-, three-, and five-year periods are used as a proxy. For this reason, the performance information reviewed by the Board also included net cumulative calendar year total return information for the fund and an appropriate benchmark index and peer group for the most recent one-, three-, and five-year periods, as shown below. Returns are shown compared to the 25th percentile (top of box) and 75th percentile (bottom of box) of the peer universe.
Annual Report
VIP Value Portfolio
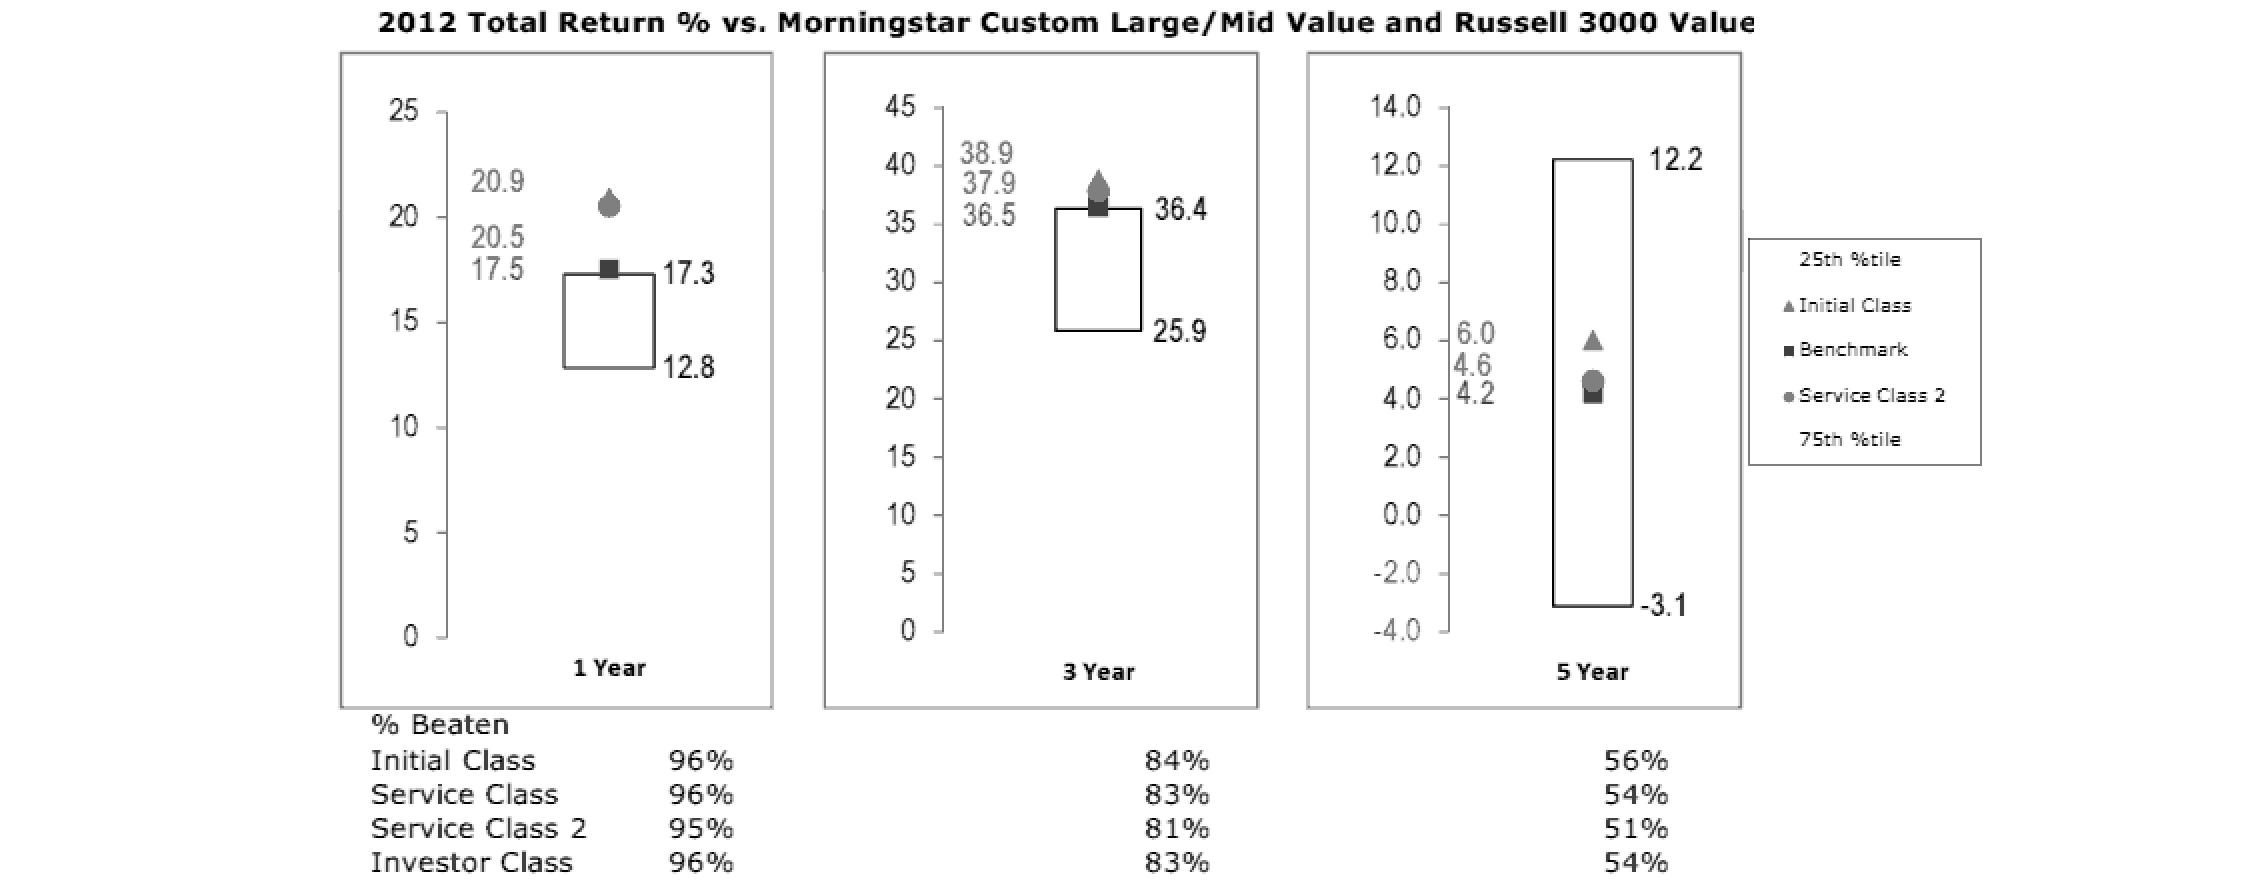
Based on its review, the Board concluded that the nature, extent, and quality of services provided to the fund under the Advisory Contracts should benefit the fund's shareholders.
Competitiveness of Management Fee and Total Expense Ratio. The Board considered the fund's management fee and total expense ratio compared to "mapped groups" of competitive funds and classes. Fidelity creates "mapped groups" by combining similar Lipper investment objective categories that have comparable management fee characteristics. Combining Lipper investment objective categories aids the Board's management fee and total expense ratio comparisons by broadening the competitive group used for comparison and by reducing the number of universes to which various Fidelity funds are compared.
Management Fee. The Board considered two proprietary management fee comparisons for the 12-month periods shown in the chart below. The group of Lipper funds used by the Board for management fee comparisons is referred to below as the "Total Mapped Group." The Total Mapped Group comparison focuses on a fund's standing in terms of gross management fees before expense reimbursements or caps relative to the total universe of funds with comparable investment mandates, regardless of whether their management fee structures also are comparable. Funds with comparable investment mandates offer exposure to similar types of securities. Funds with comparable management fee structures have similar management fee contractual arrangements (e.g., flat rate charged for advisory services, all-inclusive fee rate, etc.). "TMG %" represents the percentage of funds in the Total Mapped Group that had management fees that were lower than the fund's. For example, a TMG % of 10% means that 90% of the funds in the Total Mapped Group had higher management fees than the fund. The "Asset-Size Peer Group" (ASPG) comparison focuses on a fund's standing relative to a subset of non-Fidelity funds within the Total Mapped Group that are similar in size and management fee structure. The ASPG represents at least 15% of the funds in the Total Mapped Group with comparable asset size and management fee structures, subject to a minimum of 50 funds (or all funds in the Total Mapped Group if fewer than 50). Additional information, such as the ASPG quartile in which the fund's management fee ranked, is also included in the chart and considered by the Board.
Annual Report
Board Approval of Investment Advisory Contracts and Management Fees - continued
VIP Value Portfolio

The Board noted that the fund's management fee ranked below the median of its Total Mapped Group and below the median of its ASPG for 2012.
Based on its review, the Board concluded that the fund's management fee is fair and reasonable in light of the services that the fund receives and the other factors considered.
Total Expense Ratio. In its review of each class's total expense ratio, the Board considered the fund's management fee as well as other fund or class expenses, as applicable, such as transfer agent fees, pricing and bookkeeping fees, fund-paid 12b-1 fees, and custodial, legal, and audit fees. The Board also noted the effects of any waivers and reimbursements on fees and expenses. As part of its review, the Board also considered the current and historical total expense ratios of each class of the fund compared to competitive fund median expenses. Each class of the fund is compared to those funds and classes in the Total Mapped Group (used by the Board for management fee comparisons) that have a similar sales load structure.
The Board noted that the total expense ratio of each of Initial Class, Investor Class, and Service Class ranked below its competitive median for 2012 and the total expense ratio of Service Class 2 ranked above its competitive median for 2012. The Board considered that, in general, various factors can affect total expense ratios. The Board noted that the fund offers multiple classes, each of which has a different 12b-1 fee structure, and that the multiple structures are intended to offer a range of pricing options for the intermediary market. The Board also noted that the total expense ratios of the classes vary primarily by the level of their 12b-1 fees, although differences in transfer agent fees may also cause expenses to vary from class to class.
Fees Charged to Other Fidelity Clients. The Board also considered Fidelity fee structures and other information with respect to clients of FMR and its affiliates, such as other mutual funds advised or subadvised by FMR or its affiliates, pension plan clients, and other institutional clients. The Board noted the findings of the 2013 ad hoc joint committee (created with the board of other Fidelity funds), which reviewed and compared Fidelity's institutional investment advisory business with its business of providing services to the Fidelity funds, including the differences in services provided, fees charged, and costs incurred, as well as competition in their respective marketplaces.
Based on its review of total expense ratios and fees charged to other Fidelity clients, the Board concluded that the total expense ratio of each class of the fund was reasonable, although Service Class 2 was above the median of the universe presented for comparison, in light of the services that the fund and its shareholders receive and the other factors considered.
Costs of the Services and Profitability. The Board considered the revenues earned and the expenses incurred by Fidelity in conducting the business of developing, marketing, distributing, managing, administering and servicing the fund and servicing the fund's shareholders. The Board also considered the level of Fidelity's profits in respect of all the Fidelity funds.
On an annual basis, FMR presents to the Board Fidelity's profitability for the fund. Fidelity calculates the profitability for each fund, as well as aggregate profitability for groups of Fidelity funds and all Fidelity funds, using a series of detailed revenue and cost allocation methodologies which originate with the books and records of Fidelity on which Fidelity's audited financial statements are based. The Audit Committee of the Board reviews any significant changes from the prior year's methodologies.
PricewaterhouseCoopers LLP (PwC), independent registered public accounting firm and auditor to Fidelity and certain Fidelity funds, has been engaged annually by the Board as part of the Board's assessment of Fidelity's profitability analysis. PwC's engagement includes the review and assessment of the methodologies used by Fidelity in determining the revenues and expenses attributable to Fidelity's mutual fund business, and completion of agreed-upon procedures surrounding the mathematical accuracy of fund profitability and its conformity to allocation methodologies. After considering PwC's reports issued under the engagement and information provided by Fidelity, the Board concluded that while other allocation methods may also be reasonable, Fidelity's profitability methodologies are reasonable in all material respects.
Annual Report
The Board also reviewed Fidelity's non-fund businesses and fall-out benefits related to the mutual fund business as well as cases where Fidelity's affiliates may benefit from or be related to the fund's business.
The Board considered the costs of the services provided by and the profits realized by Fidelity in connection with the operation of the fund and was satisfied that the profitability was not excessive in the circumstances.
Economies of Scale. The Board considered whether there have been economies of scale in respect of the management of the Fidelity funds, whether the Fidelity funds (including the fund) have appropriately benefited from any such economies of scale, and whether there is potential for realization of any further economies of scale. The Board considered the extent to which the fund will benefit from economies of scale through increased services to the fund, through waivers or reimbursements, or through fee or expense reductions. The Board also noted that in 2009, it and the board of other Fidelity funds created an ad hoc committee (the Economies of Scale Committee) to analyze whether FMR attains economies of scale in respect of the management and servicing of the Fidelity funds, whether the Fidelity funds have appropriately benefited from such economies of scale, and whether there is potential for realization of any further economies of scale.
The Board recognized that the fund's management contract incorporates a "group fee" structure, which provides for lower group fee rates as total fund assets under FMR's management increase, and for higher group fee rates as total fund assets under FMR's management decrease. FMR calculates the group fee rates based on a tiered asset "breakpoint" schedule that varies based on asset class. The Board considered that the group fee is designed to deliver the benefits of economies of scale to fund shareholders when total Fidelity fund assets increase, even if assets of any particular fund are unchanged or have declined, because some portion of Fidelity's costs are attributable to services provided to all Fidelity funds, and all funds benefit if those costs can be allocated among more assets. The Board concluded that, given the group fee structure, fund shareholders will benefit from lower management fees as assets under FMR's management increase at the fund complex level, regardless of whether Fidelity achieves any such economies of scale.
The Board concluded, taking into account the analysis of the Economies of Scale Committee, that economies of scale, if any, are being appropriately shared between fund shareholders and Fidelity.
Amendment to Description of Group Fee Rate. At its July 2013 meeting, the Board voted to approve an amendment to the fund's management contract to modify the description of the "group fee rate" effective August 1, 2013. The Board noted that under the prior description in the contract, the group fee rate was based on the average net assets of all registered investment companies with which FMR has management contracts. Under the contract's tiered asset breakpoint schedule, the group fee rate is lower as total fund assets under FMR's management increase, and higher as total fund assets under FMR's management decrease. The Board considered that the prior description would have excluded the assets of 64 Fidelity sector funds from the group fee rate calculation once Fidelity SelectCo, LLC, an affiliate of FMR, assumed management responsibilities for those funds. The Board noted that modifying the description of the group fee rate to continue to include the assets of those 64 funds for purposes of determining group fee rate breakpoints would avoid an immediate adverse impact on the group fee rate for any fund.
Additional Information Requested by the Board. In order to develop fully the factual basis for consideration of the Fidelity funds' Advisory Contracts, the Board requested and received additional information on certain topics, including: (i) fund performance trends and Fidelity's long-term strategies for certain funds; (ii) the potential to further rationalize the Fidelity fund lineup with the possibility of achieving savings for the funds and Fidelity; (iii) the methodology with respect to competitive fund data and peer group classifications; (iv) the arrangements with, and performance of, certain sub-advisers on behalf of the Fidelity funds, as well as certain proposed participating affiliate arrangements; (v) the realization of fall-out benefits in certain Fidelity business units; (vi) Fidelity's group fee structures, including the rationale for the individual fee rates of certain categories of funds and the definition of group assets; (vii) trends regarding industry use of performance fee structures and the performance adjustment methodologies applicable to the Fidelity funds; (viii) additional competitive analysis regarding the total expenses for certain classes; and (ix) fund profitability methodology, including Fidelity's cost allocation methodology, and the impact of certain factors on fund profitability results.
Based on its evaluation of all of the conclusions noted above, and after considering all factors it believed relevant, the Board ultimately concluded that the advisory fee structures are fair and reasonable, and that the fund's Advisory Contracts should be renewed.
Annual Report
Investment Adviser
Fidelity Management & Research Company
Boston, MA
Investment Sub-Advisers
FMR Co., Inc.
Fidelity Management & Research (U.K.) Inc.
Fidelity Management & Research (Hong Kong) Limited
Fidelity Management & Research (Japan) Inc.
General Distributor
Fidelity Distributors Corporation
Smithfield, RI
Transfer and Service Agents
Fidelity Investments Institutional Operations Company, Inc.
Boston, MA
Fidelity Service Company, Inc.
Boston, MA
Custodian
State Street Bank and Trust Company
Quincy, MA
VIPVAL-ANN-0214
1.768949.112
Fidelity® Variable Insurance Products:
Growth Portfolio
Annual Report
December 31, 2013
(Fidelity Cover Art)
Contents
Performance | (Click Here) | How the fund has done over time. |
Management's Discussion of Fund Performance | (Click Here) | The Portfolio Manager's review of fund performance and strategy. |
Shareholder Expense Example | (Click Here) | An example of shareholder expenses. |
Investment Changes | (Click Here) | A summary of major shifts in the fund's investments over the past six months. |
Investments | (Click Here) | A complete list of the fund's investments with their market values. |
Financial Statements | (Click Here) | Statements of assets and liabilities, operations, and changes in net assets, as well as financial highlights. |
Notes | (Click Here) | Notes to the financial statements. |
Report of Independent Registered Public Accounting Firm | (Click Here) | |
Trustees and Officers | (Click Here) | |
Distributions | (Click Here) | |
Board Approval of Investment Advisory Contracts and Management Fees | (Click Here) | |
To view a fund's proxy voting guidelines and proxy voting record for the 12-month period ended June 30, visit http://www.fidelity.com/proxyvotingresults or visit the Securities and Exchange Commission's (SEC) web site at http://www.sec.gov. You may also call 1-877-208-0098 to request a free copy of the proxy voting guidelines.
Fidelity Variable Insurance Products are separate account options which are purchased through a variable insurance contract.
Standard & Poor's, S&P and S&P 500 are registered service marks of The McGraw-Hill Companies, Inc. and have been licensed for use by Fidelity Distributors Corporation.
Other third-party marks appearing herein are the property of their respective owners.
All other marks appearing herein are registered or unregistered trademarks or service marks of FMR LLC or an affiliated company. © 2014 FMR LLC. All rights reserved.
This report and the financial statements contained herein are submitted for the general information of the shareholders of the fund. This report is not authorized for distribution to prospective investors in the fund unless preceded or accompanied by an effective prospectus.
A fund files its complete schedule of portfolio holdings with the SEC for the first and third quarters of each fiscal year on Form N-Q. Forms N-Q are available on the SEC's web site at http://www.sec.gov. A fund's Forms N-Q may be reviewed and copied at the SEC's Public Reference Room in Washington, DC. Information regarding the operation of the SEC's Public Reference Room may be obtained by calling 1-800-SEC-0330. For a complete list of a fund's portfolio holdings, view the most recent holdings listing, semiannual report, or annual report on Fidelity's web site at http://www.fidelity.com, http://www.advisor.fidelity.com, or http://www.401k.com, as applicable.
NOT FDIC INSURED • MAY LOSE VALUE • NO BANK GUARANTEE
Neither the fund nor Fidelity Distributors Corporation is a bank.
Annual Report
Average annual total return reflects the change in the value of an investment, assuming reinvestment of the class' distributions from dividend income and capital gains (the profits earned upon the sale of securities that have grown in value, if any) and assuming a constant rate of performance each year. During periods of reimbursement by Fidelity, a fund's total return will be greater than it would be had the reimbursement not occurred. Performance numbers are net of all underlying fund operating expenses, but do not include any insurance charges imposed by your insurance company's separate account. If performance information included the effect of these additional charges, the total returns would have been lower. How a fund did yesterday is no guarantee of how it will do tomorrow.
Average Annual Total Returns
Periods ended December 31, 2013 | Past 1
year | Past 5
years | Past 10
years |
VIP Growth Portfolio - Initial Class | 36.34% | 20.07% | 6.94% |
VIP Growth Portfolio - Service Class | 36.20% | 19.96% | 6.83% |
VIP Growth Portfolio - Service Class 2 | 36.00% | 19.78% | 6.67% |
VIP Growth Portfolio - Investor Class A | 36.22% | 19.97% | 6.85% |
A The initial offering of Investor Class shares took place on July 21, 2005. Returns prior to July 21, 2005, are those of Initial Class. Had Investor Class's transfer agent fee been reflected, returns prior to July 21, 2005, would have been lower.
$10,000 Over 10 Years
Let's say hypothetically that $10,000 was invested in VIP Growth Portfolio - Initial Class on December 31, 2003. The chart shows how the value of your investment would have changed, and also shows how the Russell 3000® Growth Index performed over the same period.
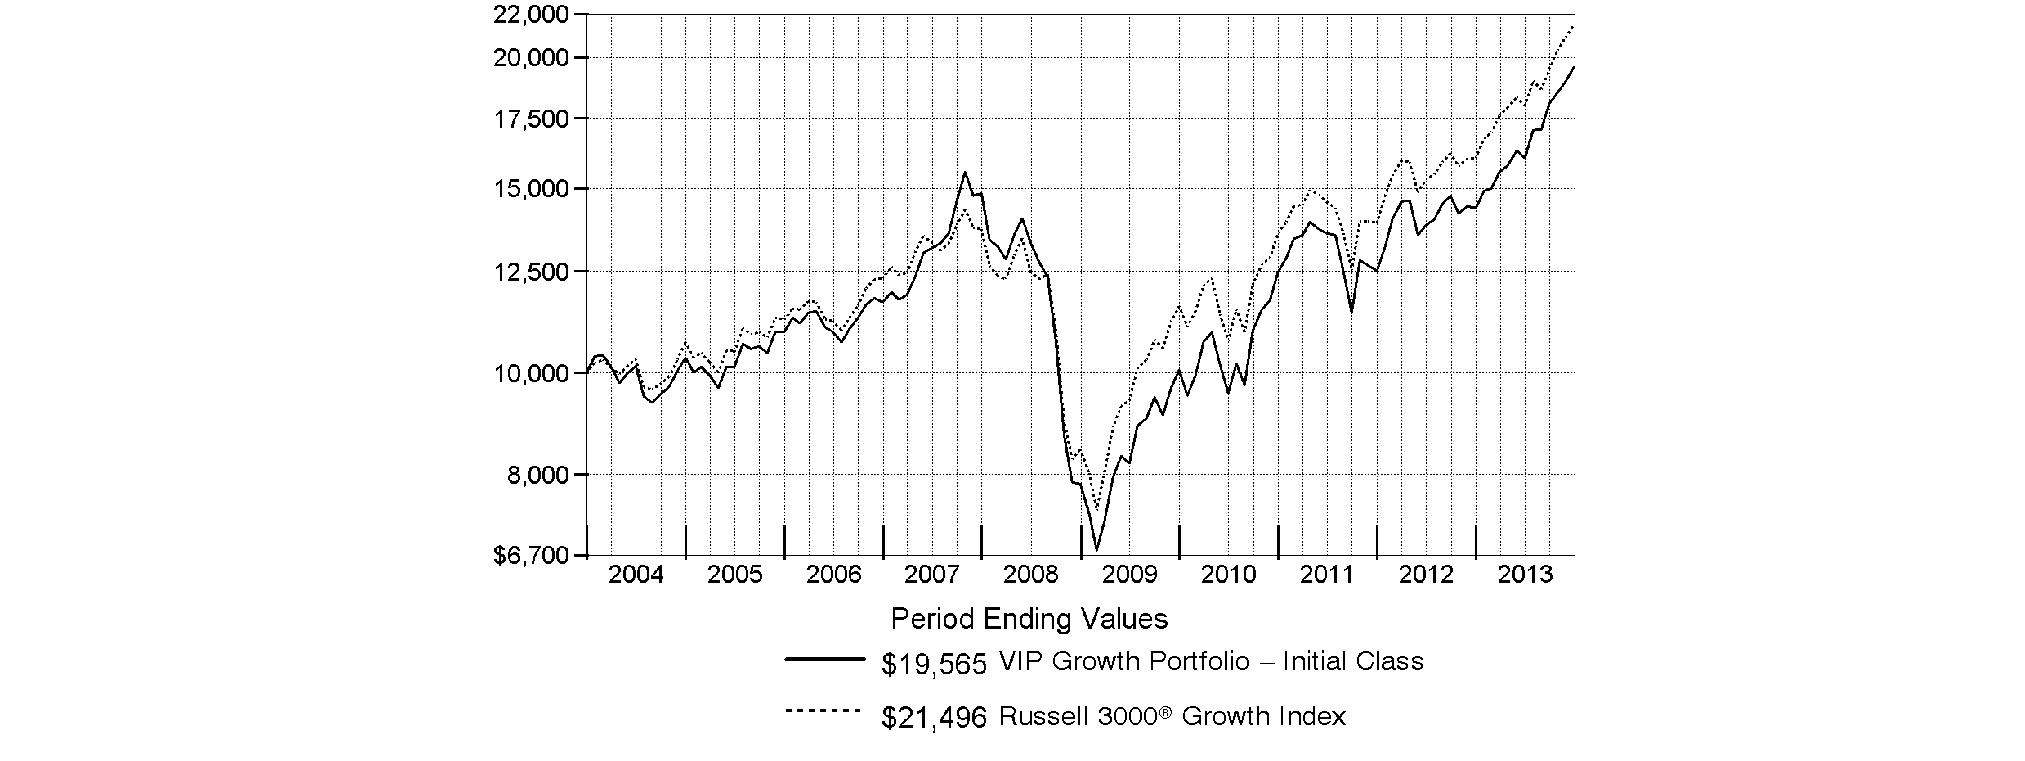
Annual Report
Market Recap: Global equity markets remained upbeat for the 12 months ending December 31, 2013, propelling the MSCI® ACWI® (All Country World Index) Index to a 23.24% return. Midyear turbulence gave way by autumn when policymakers in the U.S. and China had made clear their intentions to maintain accommodative monetary policies. That stance, combined with modest cyclical improvement around the globe and generally low valuations, underpinned the broad rally in equities, although the relative strength of the U.S. dollar generally tempered gains for U.S. investors holding foreign securities based in local currencies. During the period, the broad-market S&P 500® Index set a series of new highs, finishing the year up 32.39%. For the first time since 1995, the S&P® scored a "perfect 10," with all 10 economic sectors gaining at least 10% for the year. A resurgence in growth-oriented stocks lifted the Nasdaq Composite Index® to a 40.12% result for 2013, while the blue-chip Dow Jones Industrial AverageSM notched a relatively more modest 29.65% gain. International developed-markets equities rose in concert with their U.S. counterparts, with the MSCI® EAFE® Index gaining 22.92% for the period. Meanwhile, foreign exchange and commodity weakness curbed results in resource-heavy emerging markets (EM), especially in the year's waning months. More generally, concern over EM's slowing growth, its declining share of global trade and uncertainty surrounding U.S. central bank intentions were all factors hampering performance. The MSCI Emerging Markets Index returned -2.27% for the period. On the bond side, U.S. high-yield securities rallied with equities for much of the period, with The BofA Merrill LynchSM US High Yield Constrained Index returning 7.41% for 2013. The more rate-sensitive U.S. investment-grade bond category faced headwinds though, as reflected in the -2.02% return of the Barclays® U.S. Aggregate Bond Index. Within the Barclays index, investment-grade corporate credit returned -2.01%, while ultra-safe U.S. Treasuries saw a -2.75% result. Major non-U.S. developed markets performed only slightly better, with the Citigroup® Non-USD Group-of-Seven (G7) Equal Weighted Index logging a -1.59% result. After several years of strong advances, EM debt reversed course in 2013, with the J.P. Morgan Emerging Markets Bond Index Global returning -6.58%.
Comments from Jason Weiner, Portfolio Manager of VIP Growth Portfolio: For the year, the fund's share classes solidly outpaced the 34.23% gain of the Russell 3000® Growth Index. (For specific portfolio results, please refer to the performance section of this shareholder report). The fund's biggest relative contributor during the past year was social networking firm Facebook. The stock popped in July after the firm announced better-than-expected earnings and an explosion in mobile use and mobile revenue. I nearly doubled the fund's position here during the period. Tesla Motors was another big contributor this period. In May, the automaker received rave reviews for its first electric luxury vehicle, the Model S, and shares catapulted higher. Subsequently, the firm ramped up production to meet growing demand, which helped it move into profitability. The stock hiccuped over a string of car battery fires and a battery supply shortage later on in the period, and the fund ended the period with a reduced overweighting. Lastly, shares of Green Mountain Coffee Roasters, the maker of Keurig® single-cup coffee systems, rose sharply during the period on positive financial results and jumped higher in May when management announced the company would expand and extend its manufacturing agreement with coffee giant Starbucks. On the flip side, Apple was by far the fund's biggest relative detractor. The tech giant struggled amid mounting competition in the smartphone industry - particularly from South Korea-based Samsung Electronics - and its lack of innovation during the period hurt the stock. Given these factors, we substantially reduced our position in Apple, a major index component, ending the period with an underweighting. An overweighting in Broadcom, on average, was another miss. The company produces baseband chips that provide Internet connectivity to Apple's iPhone® smartphones and iPad® tablets, as well as some of Samsung Electronics' GalaxyTM mobile devices. The stock lagged for most of the period, however, as the firm faced intensifying competition and setbacks in releasing new baseband chips. Shares plummeted in July and August after the company issued a lower-than-expected revenue forecast amid slowing smartphone sales. I sold Broadcom prior to period end.
The views expressed above reflect those of the portfolio manager(s) only through the end of the period as stated on the cover of this report and do not necessarily represent the views of Fidelity or any other person in the Fidelity organization. Any such views are subject to change at any time based upon market or other conditions and Fidelity disclaims any responsibility to update such views. These views may not be relied on as investment advice and, because investment decisions for a Fidelity fund are based on numerous factors, may not be relied on as an indication of trading intent on behalf of any Fidelity fund.
Annual Report
As a shareholder of the Fund, you incur two types of costs: (1) transaction costs, including redemption fees and (2) ongoing costs, including management fees, distribution and/or service (12b-1) fees and other Fund expenses. This Example is intended to help you understand your ongoing costs (in dollars) of investing in the Fund and to compare these costs with the ongoing costs of investing in other mutual funds.
The Example is based on an investment of $1,000 invested at the beginning of the period and held for the entire period (July 1, 2013 to December 31, 2013).
Actual Expenses
The first line of the accompanying table for each class of the Fund provides information about actual account values and actual expenses. You may use the information in this line, together with the amount you invested, to estimate the expenses that you paid over the period. Simply divide your account value by $1,000.00 (for example, an $8,600 account value divided by $1,000.00 = 8.6), then multiply the result by the number in the first line for a class of the Fund under the heading entitled "Expenses Paid During Period" to estimate the expenses you paid on your account during this period. The estimate of expenses does not include any fees or other expenses of any variable annuity or variable life insurance product. If they were, the estimate of expenses you paid during the period would be higher, and your ending account value would be lower. In addition, the Fund, as a shareholder in the underlying Fidelity Central Funds, will indirectly bear its pro-rata share of the fees and expenses incurred by the underlying Fidelity Central Funds. These fees and expenses are not included in the Fund's annualized expense ratio used to calculate the expense estimate in the table below.
Hypothetical Example for Comparison Purposes
The second line of the accompanying table for each class of the Fund provides information about hypothetical account values and hypothetical expenses based on a Class' actual expense ratio and an assumed rate of return of 5% per year before expenses, which is not the Class' actual return. The hypothetical account values and expenses may not be used to estimate the actual ending account balance or expenses you paid for the period. You may use this information to compare the ongoing costs of investing in the Fund and other funds. To do so, compare this 5% hypothetical example with the 5% hypothetical examples that appear in the shareholder reports of the other funds. The estimate of expenses does not include any fees or other expenses of any variable annuity or variable life insurance product. If they were, the estimate of expenses you paid during the period would be higher, and your ending account value would be lower. In addition, the Fund, as a shareholder in the underlying Fidelity Central Funds, will indirectly bear its pro-rata share of the fees and expenses incurred by the underlying Fidelity Central Funds. These fees and expenses are not included in the Fund's annualized expense ratio used to calculate the expense estimate in the table below.
Please note that the expenses shown in the table are meant to highlight your ongoing costs only and do not reflect any transaction costs. Therefore, the second line of the table is useful in comparing ongoing costs only, and will not help you determine the relative total costs of owning different funds. In addition, if these transactional costs were included, your costs would have been higher.
| Annualized
Expense Ratio B | Beginning
Account Value
July 1, 2013 | Ending
Account Value
December 31, 2013 | Expenses Paid
During Period*
July 1, 2013
to December 31, 2013 |
Initial Class | .65% | | | |
Actual | | $ 1,000.00 | $ 1,220.30 | $ 3.64 |
HypotheticalA | | $ 1,000.00 | $ 1,021.93 | $ 3.31 |
Service Class | .75% | | | |
Actual | | $ 1,000.00 | $ 1,219.60 | $ 4.20 |
HypotheticalA | | $ 1,000.00 | $ 1,021.42 | $ 3.82 |
Service Class 2 | .90% | | | |
Actual | | $ 1,000.00 | $ 1,218.60 | $ 5.03 |
HypotheticalA | | $ 1,000.00 | $ 1,020.67 | $ 4.58 |
Service Class 2R | .90% | | | |
Actual | | $ 1,000.00 | $ 1,218.60 | $ 5.03 |
HypotheticalA | | $ 1,000.00 | $ 1,020.67 | $ 4.58 |
Investor Class | .73% | | | |
Actual | | $ 1,000.00 | $ 1,219.70 | $ 4.08 |
HypotheticalA | | $ 1,000.00 | $ 1,021.53 | $ 3.72 |
A 5% return per year before expenses
B Annualized expense ratio reflects expenses net of applicable fee waivers.
* Expenses are equal to each Class' annualized expense ratio, multiplied by the average account value over the period, multiplied by 184/365 (to reflect the one-half year period).
Annual Report
Investment Changes (Unaudited)
Top Ten Stocks as of December 31, 2013 |
| % of fund's
net assets | % of fund's net assets
6 months ago |
Facebook, Inc. Class A | 6.6 | 2.3 |
Google, Inc. Class A | 4.3 | 3.1 |
Microsoft Corp. | 3.1 | 0.0 |
Harley-Davidson, Inc. | 3.0 | 2.7 |
Apple, Inc. | 2.5 | 2.8 |
Green Mountain Coffee Roasters, Inc. | 2.5 | 2.5 |
Home Depot, Inc. | 2.5 | 3.2 |
QUALCOMM, Inc. | 2.3 | 1.4 |
Visa, Inc. Class A | 1.9 | 2.3 |
Amazon.com, Inc. | 1.9 | 1.5 |
| 30.6 | |
Top Five Market Sectors as of December 31, 2013 |
| % of fund's
net assets | % of fund's net assets
6 months ago |
Information Technology | 29.1 | 26.5 |
Consumer Discretionary | 19.6 | 21.9 |
Health Care | 17.0 | 16.6 |
Consumer Staples | 9.3 | 10.2 |
Industrials | 7.8 | 7.2 |
Asset Allocation (% of fund's net assets) |
As of December 31, 2013* | As of June 30, 2013** |
| Stocks 99.1% | | | Stocks 98.8% | |
| Short-Term
Investments and
Net Other Assets
(Liabilities) 0.9% | | | Short-Term
Investments and
Net Other Assets
(Liabilities) 1.2% | |
* Foreign investments | 12.6% | | ** Foreign investments | 11.1% | |

Annual Report
Investments December 31, 2013
Showing Percentage of Net Assets
Common Stocks - 99.0% |
| Shares | | Value |
CONSUMER DISCRETIONARY - 19.5% |
Automobiles - 3.5% |
Harley-Davidson, Inc. | 1,987,852 | | $ 137,638,872 |
Tesla Motors, Inc. (a) | 162,739 | | 24,472,691 |
| | 162,111,563 |
Diversified Consumer Services - 1.3% |
Anhanguera Educacional Participacoes SA | 2,640,000 | | 16,823,153 |
H&R Block, Inc. | 408,760 | | 11,870,390 |
Kroton Educacional SA | 1,850,100 | | 31,064,381 |
| | 59,757,924 |
Hotels, Restaurants & Leisure - 3.8% |
China Lodging Group Ltd. ADR (a) | 27,000 | | 822,420 |
Chipotle Mexican Grill, Inc. (a) | 34,394 | | 18,324,435 |
Dunkin' Brands Group, Inc. | 582,595 | | 28,081,079 |
Las Vegas Sands Corp. | 128,000 | | 10,095,360 |
Starbucks Corp. | 989,073 | | 77,533,432 |
Yum! Brands, Inc. | 577,384 | | 43,656,004 |
| | 178,512,730 |
Household Durables - 0.6% |
Mohawk Industries, Inc. (a) | 172,755 | | 25,723,220 |
Internet & Catalog Retail - 2.3% |
Amazon.com, Inc. (a) | 212,488 | | 84,738,090 |
TripAdvisor, Inc. (a) | 235,653 | | 19,519,138 |
| | 104,257,228 |
Leisure Equipment & Products - 0.0% |
NJOY, Inc. (a)(e) | 243,618 | | 1,968,433 |
Media - 0.8% |
Comcast Corp. Class A (special) (non-vtg.) | 712,919 | | 35,560,400 |
Specialty Retail - 5.4% |
CarMax, Inc. (a) | 465,400 | | 21,883,108 |
Five Below, Inc. (a) | 165,200 | | 7,136,640 |
GNC Holdings, Inc. | 560,137 | | 32,740,008 |
Home Depot, Inc. | 1,406,132 | | 115,780,909 |
TJX Companies, Inc. | 338,830 | | 21,593,636 |
Ulta Salon, Cosmetics & Fragrance, Inc. (a) | 246,594 | | 23,801,253 |
Urban Outfitters, Inc. (a) | 786,300 | | 29,171,730 |
| | 252,107,284 |
Textiles, Apparel & Luxury Goods - 1.8% |
ECLAT Textile Co. Ltd. | 1,342,740 | | 15,123,632 |
Michael Kors Holdings Ltd. (a) | 318,503 | | 25,859,259 |
NIKE, Inc. Class B | 544,776 | | 42,841,185 |
| | 83,824,076 |
TOTAL CONSUMER DISCRETIONARY | | 903,822,858 |
|
| Shares | | Value |
CONSUMER STAPLES - 9.3% |
Beverages - 1.2% |
Monster Beverage Corp. (a) | 138,607 | | $ 9,393,396 |
SABMiller PLC | 485,142 | | 24,912,531 |
The Coca-Cola Co. | 550,438 | | 22,738,594 |
| | 57,044,521 |
Food & Staples Retailing - 1.2% |
Costco Wholesale Corp. | 216,700 | | 25,789,467 |
Sprouts Farmers Market LLC | 62,695 | | 2,409,369 |
Whole Foods Market, Inc. | 423,066 | | 24,465,907 |
| | 52,664,743 |
Food Products - 3.8% |
Annie's, Inc. (a)(d) | 139,453 | | 6,002,057 |
Green Mountain Coffee Roasters, Inc. (d) | 1,541,237 | | 116,486,692 |
Mead Johnson Nutrition Co. Class A | 52,186 | | 4,371,099 |
The Hershey Co. | 494,044 | | 48,035,898 |
| | 174,895,746 |
Household Products - 1.8% |
Procter & Gamble Co. | 1,036,123 | | 84,350,773 |
Personal Products - 1.3% |
Herbalife Ltd. | 705,155 | | 55,495,699 |
Inter Parfums, Inc. | 151,377 | | 5,420,810 |
| | 60,916,509 |
TOTAL CONSUMER STAPLES | | 429,872,292 |
ENERGY - 3.4% |
Energy Equipment & Services - 2.0% |
Cameron International Corp. (a) | 178,171 | | 10,606,520 |
Dril-Quip, Inc. (a) | 207,312 | | 22,789,808 |
National Oilwell Varco, Inc. | 111,436 | | 8,862,505 |
Oceaneering International, Inc. | 356,174 | | 28,095,005 |
Pason Systems, Inc. | 76,100 | | 1,646,296 |
RigNet, Inc. (a) | 420,094 | | 20,135,105 |
| | 92,135,239 |
Oil, Gas & Consumable Fuels - 1.4% |
Bonanza Creek Energy, Inc. (a) | 462,234 | | 20,093,312 |
Continental Resources, Inc. (a) | 120,564 | | 13,565,861 |
Noble Energy, Inc. | 190,800 | | 12,995,388 |
Pioneer Natural Resources Co. | 107,598 | | 19,805,564 |
| | 66,460,125 |
TOTAL ENERGY | | 158,595,364 |
FINANCIALS - 7.1% |
Capital Markets - 4.1% |
BlackRock, Inc. Class A | 94,306 | | 29,845,020 |
E*TRADE Financial Corp. (a) | 1,352,486 | | 26,562,825 |
Harvest Capital Credit Corp. | 161,500 | | 2,425,730 |
Invesco Ltd. | 1,361,593 | | 49,561,985 |
KKR & Co. LP | 570,400 | | 13,883,536 |
Common Stocks - continued |
| Shares | | Value |
FINANCIALS - continued |
Capital Markets - continued |
Legg Mason, Inc. | 396,642 | | $ 17,245,994 |
The Blackstone Group LP | 1,390,898 | | 43,813,287 |
Virtus Investment Partners, Inc. (a) | 32,000 | | 6,401,600 |
| | 189,739,977 |
Commercial Banks - 1.0% |
First Republic Bank | 176,800 | | 9,255,480 |
HDFC Bank Ltd. sponsored ADR | 1,061,349 | | 36,552,860 |
| | 45,808,340 |
Consumer Finance - 0.7% |
American Express Co. | 282,793 | | 25,657,809 |
Mahindra & Mahindra Financial Services Ltd. | 594,639 | | 3,083,295 |
Shriram Transport Finance Co. Ltd. | 478,307 | | 5,202,285 |
| | 33,943,389 |
Diversified Financial Services - 0.9% |
Berkshire Hathaway, Inc. Class B (a) | 95,200 | | 11,286,912 |
McGraw-Hill Companies, Inc. | 353,613 | | 27,652,537 |
| | 38,939,449 |
Real Estate Management & Development - 0.4% |
Leopalace21 Corp. (a) | 320,900 | | 1,700,153 |
Realogy Holdings Corp. (a) | 375,301 | | 18,566,140 |
| | 20,266,293 |
TOTAL FINANCIALS | | 328,697,448 |
HEALTH CARE - 17.0% |
Biotechnology - 8.9% |
Actelion Ltd. | 72,344 | | 6,110,779 |
Alexion Pharmaceuticals, Inc. (a) | 178,625 | | 23,767,843 |
Amgen, Inc. | 244,457 | | 27,907,211 |
Biogen Idec, Inc. (a) | 233,205 | | 65,239,099 |
BioMarin Pharmaceutical, Inc. (a) | 568,225 | | 39,929,171 |
Cytokinetics, Inc. warrants 6/25/17 (a) | 1,084,980 | | 159,286 |
Enanta Pharmaceuticals, Inc. | 375,307 | | 10,238,375 |
Gentium SpA sponsored ADR (a) | 245,125 | | 13,996,638 |
Gilead Sciences, Inc. (a) | 972,461 | | 73,080,444 |
Insmed, Inc. (a) | 1,229,502 | | 20,913,829 |
Kamada (a) | 1,056,917 | | 15,716,356 |
Ophthotech Corp. | 115,239 | | 3,727,982 |
Regeneron Pharmaceuticals, Inc. (a) | 77,041 | | 21,204,765 |
Swedish Orphan Biovitrum AB (a) | 1,582,148 | | 16,419,596 |
Theravance, Inc. (a)(d) | 1,314,546 | | 46,863,565 |
United Therapeutics Corp. (a) | 154,970 | | 17,524,008 |
Vanda Pharmaceuticals, Inc. (a)(d) | 865,010 | | 10,734,774 |
| | 413,533,721 |
Health Care Equipment & Supplies - 0.7% |
AxoGen, Inc. (a) | 323,300 | | 1,451,617 |
GI Dynamics, Inc. CDI (a) | 704,680 | | 471,907 |
|
| Shares | | Value |
Intuitive Surgical, Inc. (a) | 12,000 | | $ 4,608,960 |
The Cooper Companies, Inc. | 190,400 | | 23,579,136 |
| | 30,111,620 |
Health Care Providers & Services - 1.3% |
Apollo Hospitals Enterprise Ltd. | 483,176 | | 7,394,530 |
Express Scripts Holding Co. (a) | 594,204 | | 41,736,889 |
Qualicorp SA (a) | 992,800 | | 9,553,478 |
| | 58,684,897 |
Health Care Technology - 0.3% |
Cerner Corp. (a) | 269,056 | | 14,997,181 |
Life Sciences Tools & Services - 0.9% |
Illumina, Inc. (a) | 374,901 | | 41,471,549 |
Pharmaceuticals - 4.9% |
AbbVie, Inc. | 1,072,547 | | 56,641,207 |
Actavis PLC (a) | 310,118 | | 52,099,824 |
Cadence Pharmaceuticals, Inc. (a) | 933,722 | | 8,450,184 |
Novo Nordisk A/S Series B | 135,840 | | 24,906,964 |
Pacira Pharmaceuticals, Inc. (a) | 342,086 | | 19,666,524 |
Perrigo Co. PLC | 163,077 | | 25,025,796 |
Valeant Pharmaceuticals International, Inc. (Canada) (a) | 355,295 | | 41,682,149 |
| | 228,472,648 |
TOTAL HEALTH CARE | | 787,271,616 |
INDUSTRIALS - 7.8% |
Aerospace & Defense - 2.2% |
TransDigm Group, Inc. | 219,996 | | 35,423,756 |
United Technologies Corp. | 606,569 | | 69,027,552 |
| | 104,451,308 |
Airlines - 0.1% |
Ryanair Holdings PLC sponsored ADR | 149,082 | | 6,996,418 |
Building Products - 0.3% |
A.O. Smith Corp. | 273,618 | | 14,758,955 |
Commercial Services & Supplies - 0.1% |
KAR Auction Services, Inc. | 163,200 | | 4,822,560 |
Construction & Engineering - 0.2% |
Jacobs Engineering Group, Inc. (a) | 75,594 | | 4,761,666 |
MasTec, Inc. (a) | 76,200 | | 2,493,264 |
| | 7,254,930 |
Electrical Equipment - 1.7% |
AMETEK, Inc. | 442,500 | | 23,306,475 |
Generac Holdings, Inc. | 420,100 | | 23,794,464 |
Power Solutions International, Inc. (a) | 70,043 | | 5,260,229 |
Roper Industries, Inc. | 176,017 | | 24,410,038 |
| | 76,771,206 |
Industrial Conglomerates - 1.5% |
Danaher Corp. | 907,226 | | 70,037,847 |
Machinery - 0.9% |
Graco, Inc. | 52,262 | | 4,082,707 |
Haitian International Holdings Ltd. | 266,000 | | 600,998 |
Common Stocks - continued |
| Shares | | Value |
INDUSTRIALS - continued |
Machinery - continued |
Manitowoc Co., Inc. | 1,301,305 | | $ 30,346,433 |
Weg SA | 370,900 | | 4,942,782 |
| | 39,972,920 |
Professional Services - 0.8% |
Equifax, Inc. | 150,887 | | 10,424,783 |
Verisk Analytics, Inc. (a) | 419,304 | | 27,556,659 |
| | 37,981,442 |
TOTAL INDUSTRIALS | | 363,047,586 |
INFORMATION TECHNOLOGY - 29.1% |
Communications Equipment - 2.3% |
QUALCOMM, Inc. | 1,422,786 | | 105,641,861 |
Computers & Peripherals - 2.5% |
Apple, Inc. | 208,581 | | 117,036,885 |
Electronic Equipment & Components - 0.6% |
National Instruments Corp. | 71,200 | | 2,279,824 |
TE Connectivity Ltd. | 474,800 | | 26,166,228 |
| | 28,446,052 |
Internet Software & Services - 13.8% |
Cornerstone OnDemand, Inc. (a) | 257,965 | | 13,759,853 |
CoStar Group, Inc. (a) | 105,099 | | 19,399,173 |
Facebook, Inc. Class A (a) | 5,634,609 | | 307,987,727 |
Google, Inc. Class A (a) | 178,731 | | 200,305,619 |
LinkedIn Corp. (a) | 50,129 | | 10,869,471 |
MercadoLibre, Inc. (d) | 22,290 | | 2,402,639 |
Naver Corp. | 20,397 | | 13,987,944 |
SPS Commerce, Inc. (a) | 251,729 | | 16,437,904 |
Textura Corp. | 341,122 | | 10,213,193 |
Twitter, Inc. (d) | 34,600 | | 2,202,290 |
Xoom Corp. | 73,430 | | 2,009,779 |
Yahoo!, Inc. (a) | 995,888 | | 40,273,711 |
| | 639,849,303 |
IT Services - 2.1% |
Gartner, Inc. Class A (a) | 152,922 | | 10,865,108 |
Visa, Inc. Class A | 390,368 | | 86,927,146 |
| | 97,792,254 |
Software - 7.8% |
ANSYS, Inc. (a) | 5,410 | | 471,752 |
Computer Modelling Group Ltd. | 557,800 | | 13,973,225 |
Diligent Board Member Services, Inc. (a) | 630,921 | | 1,971,704 |
Electronic Arts, Inc. (a) | 1,021,221 | | 23,426,810 |
FireEye, Inc. | 647,141 | | 28,221,819 |
FleetMatics Group PLC (a) | 165,050 | | 7,138,413 |
|
| Shares | | Value |
Microsoft Corp. | 3,810,100 | | $ 142,612,043 |
salesforce.com, Inc. (a) | 1,468,462 | | 81,044,418 |
ServiceNow, Inc. (a) | 109,600 | | 6,138,696 |
SolarWinds, Inc. (a) | 138,207 | | 5,228,371 |
Solera Holdings, Inc. | 80,800 | | 5,717,408 |
SS&C Technologies Holdings, Inc. (a) | 798,844 | | 35,356,835 |
Tableau Software, Inc. | 104,200 | | 7,182,506 |
Workday, Inc. Class A (a) | 62,800 | | 5,222,448 |
| | 363,706,448 |
TOTAL INFORMATION TECHNOLOGY | | 1,352,472,803 |
MATERIALS - 4.3% |
Chemicals - 2.3% |
FMC Corp. | 379,605 | | 28,644,993 |
LyondellBasell Industries NV Class A | 184,027 | | 14,773,688 |
Monsanto Co. | 281,849 | | 32,849,501 |
Sherwin-Williams Co. | 161,260 | | 29,591,210 |
| | 105,859,392 |
Construction Materials - 2.0% |
Eagle Materials, Inc. | 606,269 | | 46,943,409 |
James Hardie Industries PLC sponsored ADR | 212,000 | | 12,162,440 |
Vulcan Materials Co. | 611,846 | | 36,355,889 |
| | 95,461,738 |
TOTAL MATERIALS | | 201,321,130 |
TELECOMMUNICATION SERVICES - 0.8% |
Diversified Telecommunication Services - 0.4% |
8x8, Inc. (a) | 1,959,586 | | 19,909,394 |
Wireless Telecommunication Services - 0.4% |
SBA Communications Corp. Class A (a) | 200,397 | | 18,003,666 |
TOTAL TELECOMMUNICATION SERVICES | | 37,913,060 |
UTILITIES - 0.7% |
Electric Utilities - 0.7% |
ITC Holdings Corp. | 355,479 | | 34,061,998 |
TOTAL COMMON STOCKS (Cost $3,158,759,035) |
4,597,076,155
|
Convertible Preferred Stocks - 0.1% |
| | | |
CONSUMER DISCRETIONARY - 0.1% |
Household Durables - 0.1% |
Blu Homes, Inc. Series A, 5.00% (e) (Cost $4,848,302) | 1,049,416 | |
4,848,302
|
Money Market Funds - 1.8% |
| Shares | | Value |
Fidelity Cash Central Fund, 0.11% (b) | 46,557,522 | | $ 46,557,522 |
Fidelity Securities Lending Cash Central Fund, 0.11% (b)(c) | 36,082,850 | | 36,082,850 |
TOTAL MONEY MARKET FUNDS (Cost $82,640,372) |
82,640,372
|
TOTAL INVESTMENT PORTFOLIO - 100.9% (Cost $3,246,247,709) | | 4,684,564,829 |
NET OTHER ASSETS (LIABILITIES) - (0.9)% | | (41,775,265) |
NET ASSETS - 100% | $ 4,642,789,564 |
Legend |
(a) Non-income producing |
(b) Affiliated fund that is generally available only to investment companies and other accounts managed by Fidelity Investments. The rate quoted is the annualized seven-day yield of the fund at period end. A complete unaudited listing of the fund's holdings as of its most recent quarter end is available upon request. In addition, each Fidelity Central Fund's financial statements, which are not covered by the Fund's Report of Independent Registered Public Accounting Firm, are available on the SEC's website or upon request. |
(c) Investment made with cash collateral received from securities on loan. |
(d) Security or a portion of the security is on loan at period end. |
(e) Restricted securities - Investment in securities not registered under the Securities Act of 1933 (excluding 144A issues). At the end of the period, the value of restricted securities (excluding 144A issues) amounted to $6,816,735 or 0.1% of net assets. |
Additional information on each restricted holding is as follows: |
Security | Acquisition Date | Acquisition Cost |
Blu Homes, Inc. Series A, 5.00% | 6/21/13 | $ 4,848,302 |
NJOY, Inc. | 9/11/13 | $ 1,968,433 |
Affiliated Central Funds |
Information regarding fiscal year to date income earned by the Fund from investments in Fidelity Central Funds is as follows: |
Fund | Income earned |
Fidelity Cash Central Fund | $ 88,966 |
Fidelity Securities Lending Cash Central Fund | 401,092 |
Total | $ 490,058 |
Other Information |
The following is a summary of the inputs used, as of December 31, 2013, involving the Fund's assets and liabilities carried at fair value. The inputs or methodology used for valuing securities may not be an indication of the risk associated with investing in those securities. For more information on valuation inputs, and their aggregation into the levels used in the tables below, please refer to the Investment Valuation section in the accompanying Notes to Financial Statements. |
Valuation Inputs at Reporting Date: |
Description | Total | Level 1 | Level 2 | Level 3 |
Investments in Securities: | | | | |
Equities: | | | | |
Consumer Discretionary | $ 908,671,160 | $ 853,966,891 | $ 47,887,534 | $ 6,816,735 |
Consumer Staples | 429,872,292 | 429,872,292 | - | - |
Energy | 158,595,364 | 158,595,364 | - | - |
Financials | 328,697,448 | 326,997,295 | 1,700,153 | - |
Health Care | 787,271,616 | 752,651,888 | 34,619,728 | - |
Industrials | 363,047,586 | 358,104,804 | 4,942,782 | - |
Information Technology | 1,352,472,803 | 1,352,472,803 | - | - |
Materials | 201,321,130 | 201,321,130 | - | - |
Telecommunication Services | 37,913,060 | 37,913,060 | - | - |
Utilities | 34,061,998 | 34,061,998 | - | - |
Money Market Funds | 82,640,372 | 82,640,372 | - | - |
Total Investments in Securities: | $ 4,684,564,829 | $ 4,588,597,897 | $ 89,150,197 | $ 6,816,735 |
The following is a summary of transfers between Level 1 and Level 2 for the period ended December 31, 2013. Transfers are assumed to have occurred at the beginning of the period, and are primarily attributable to the valuation techniques used for foreign equity securities, as discussed in the accompanying Notes to Financial Statements: |
Transfers | Total |
Level 1 to Level 2 | $ 0 |
Level 2 to Level 1 | $ 53,945,723 |
Distribution of investments by country or territory of incorporation, as a percentage of total net assets, is as follows (Unaudited): |
United States of America | 87.4% |
Ireland | 2.2% |
Brazil | 1.4% |
Canada | 1.3% |
Cayman Islands | 1.2% |
India | 1.2% |
Bermuda | 1.1% |
Others (Individually Less Than 1%) | 4.2% |
| 100.0% |
See accompanying notes which are an integral part of the financial statements.
Annual Report
Statement of Assets and Liabilities
| December 31, 2013 |
| | |
Assets | | |
Investment in securities, at value (including securities loaned of $35,539,956) - See accompanying schedule: Unaffiliated issuers (cost $3,163,607,337) | $ 4,601,924,457 | |
Fidelity Central Funds (cost $82,640,372) | 82,640,372 | |
Total Investments (cost $3,246,247,709) | | $ 4,684,564,829 |
Receivable for fund shares sold | | 802,040 |
Dividends receivable | | 722,625 |
Distributions receivable from Fidelity Central Funds | | 14,631 |
Prepaid expenses | | 9,979 |
Other receivables | | 255,386 |
Total assets | | 4,686,369,490 |
| | |
Liabilities | | |
Payable for investments purchased | $ 1,896,929 | |
Payable for fund shares redeemed | 2,689,656 | |
Accrued management fee | 2,087,460 | |
Distribution and service plan fees payable | 194,872 | |
Other affiliated payables | 355,173 | |
Other payables and accrued expenses | 272,986 | |
Collateral on securities loaned, at value | 36,082,850 | |
Total liabilities | | 43,579,926 |
| | |
Net Assets | | $ 4,642,789,564 |
Net Assets consist of: | | |
Paid in capital | | $ 3,619,670,365 |
Distributions in excess of net investment income | | (1,203,691) |
Accumulated undistributed net realized gain (loss) on investments and foreign currency transactions | | (413,993,101) |
Net unrealized appreciation (depreciation) on investments and assets and liabilities in foreign currencies | | 1,438,315,991 |
Net Assets | | $ 4,642,789,564 |
Statement of Assets and Liabilities - continued
| December 31, 2013 |
| | |
Initial Class:
Net Asset Value, offering price and redemption price per share ($3,179,927,638 ÷ 55,654,399 shares) | | $ 57.14 |
| | |
Service Class:
Net Asset Value, offering price and redemption price per share ($491,959,418 ÷ 8,631,338 shares) | | $ 57.00 |
| | |
Service Class 2:
Net Asset Value, offering price and redemption price per share ($739,551,433 ÷ 13,074,235 shares) | | $ 56.57 |
| | |
Service Class 2R:
Net Asset Value, offering price and redemption price per share ($17,283,735 ÷ 306,654 shares) | | $ 56.36 |
| | |
Investor Class:
Net Asset Value, offering price and redemption price per share ($214,067,340 ÷ 3,756,532 shares) | | $ 56.99 |
See accompanying notes which are an integral part of the financial statements.
Annual Report
Financial Statements - continued
Statement of Operations
| Year ended December 31, 2013 |
| | |
Investment Income | | |
Dividends | | $ 37,840,573 |
Interest | | 86 |
Income from Fidelity Central Funds | | 490,058 |
Total income | | 38,330,717 |
| | |
Expenses | | |
Management fee | $ 22,829,845 | |
Transfer agent fees | 3,000,565 | |
Distribution and service plan fees | 2,095,590 | |
Accounting and security lending fees | 1,061,417 | |
Custodian fees and expenses | 155,822 | |
Independent trustees' compensation | 22,413 | |
Appreciation in deferred trustee compensation account | 566 | |
Audit | 72,611 | |
Legal | 19,908 | |
Miscellaneous | 36,902 | |
Total expenses before reductions | 29,295,639 | |
Expense reductions | (332,039) | 28,963,600 |
Net investment income (loss) | | 9,367,117 |
Realized and Unrealized Gain (Loss) Net realized gain (loss) on: | | |
Investment securities: | | |
Unaffiliated issuers | 696,444,168 | |
Foreign currency transactions | (155,925) | |
Total net realized gain (loss) | | 696,288,243 |
Change in net unrealized appreciation (depreciation) on: Investment securities | 576,500,448 | |
Assets and liabilities in foreign currencies | (1,345) | |
Total change in net unrealized appreciation (depreciation) | | 576,499,103 |
Net gain (loss) | | 1,272,787,346 |
Net increase (decrease) in net assets resulting from operations | | $ 1,282,154,463 |
Statement of Changes in Net Assets
| Year ended
December 31,
2013 | Year ended
December 31,
2012 |
Increase (Decrease) in Net Assets | | |
Operations | | |
Net investment income (loss) | $ 9,367,117 | $ 22,744,289 |
Net realized gain (loss) | 696,288,243 | 142,104,433 |
Change in net unrealized appreciation (depreciation) | 576,499,103 | 361,931,133 |
Net increase (decrease) in net assets resulting from operations | 1,282,154,463 | 526,779,855 |
Distributions to shareholders from net investment income | (9,763,755) | (20,720,579) |
Distributions to shareholders from net realized gain | (2,850,414) | - |
Total distributions | (12,614,169) | (20,720,579) |
Share transactions - net increase (decrease) | (377,103,293) | (456,375,196) |
Redemption fees | 17,166 | 1,933 |
Total increase (decrease) in net assets | 892,454,167 | 49,686,013 |
| | |
Net Assets | | |
Beginning of period | 3,750,335,397 | 3,700,649,384 |
End of period (including distributions in excess of net investment income of $1,203,691 and distributions in excess of net investment income of $162,984, respectively) | $ 4,642,789,564 | $ 3,750,335,397 |
See accompanying notes which are an integral part of the financial statements.
Annual Report
Financial Highlights - Initial Class
Years ended December 31, | 2013 | 2012 | 2011 | 2010 | 2009 |
Selected Per-Share Data | | | | | |
Net asset value, beginning of period | $ 42.05 | $ 36.89 | $ 37.09 | $ 30.04 | $ 23.53 |
Income from Investment Operations | | | | | |
Net investment income (loss) C | .14 | .26 | .14 | .07 | .10 |
Net realized and unrealized gain (loss) | 15.13 | 5.16 | (.06) | 7.18 | 6.55 |
Total from investment operations | 15.27 | 5.42 | .08 | 7.25 | 6.65 |
Distributions from net investment income | (.15) | (.26) | (.15) F | (.09) | (.12) |
Distributions from net realized gain | (.04) | - | (.12) F | (.11) | (.02) |
Total distributions | (.18) K | (.26) | (.28) J | (.20) | (.14) I |
Redemption fees added to paid in capital C, H | - | - | - | - | - |
Net asset value, end of period | $ 57.14 | $ 42.05 | $ 36.89 | $ 37.09 | $ 30.04 |
Total Return A, B | 36.34% | 14.69% | .20% | 24.17% | 28.29% |
Ratios to Average Net Assets D, G | | | | | |
Expenses before reductions | .66% | .66% | .66% | .67% | .69% |
Expenses net of fee waivers, if any | .65% | .66% | .66% | .66% | .69% |
Expenses net of all reductions | .65% | .65% | .66% | .66% | .68% |
Net investment income (loss) | .28% | .64% | .36% | .22% | .41% |
Supplemental Data | | | | | |
Net assets, end of period (000 omitted) | $ 3,179,928 | $ 2,613,977 | $ 2,583,122 | $ 2,842,307 | $ 2,618,954 |
Portfolio turnover rate E | 74% | 68% | 71% | 75% | 134% |
ATotal returns do not reflect charges attributable to your insurance company's separate account. Inclusion of these charges would reduce the total returns shown. BTotal returns would have been lower if certain expenses had not been reduced during the applicable periods shown. CCalculated based on average shares outstanding during the period. DFees and expenses of any underlying Fidelity Central Funds are not included in the Fund's expense ratio. The Fund indirectly bears its proportionate share of the expenses of any underlying Fidelity Central Funds. EAmount does not include the portfolio activity of any underlying Fidelity Central Funds. FThe amounts shown reflect certain reclassifications related to book to tax differences that were made in the year shown. GExpense ratios reflect operating expenses of the class. Expenses before reductions do not reflect amounts reimbursed by the investment adviser or reductions from brokerage service arrangements or reductions from other expense offset arrangements and do not represent the amount paid by the class during periods when reimbursements or reductions occur. Expenses net of fee waivers reflect expenses after reimbursement by the investment adviser but prior to reductions from brokerage service arrangements or other expense offset arrangements. Expenses net of all reductions represent the net expenses paid by the class. HAmount represents less than $.01 per share. ITotal distributions of $.14 per share is comprised of distributions from net investment income of $.118 and distributions from net realized gain of $.023 per share. JTotal distributions of $.28 per share is comprised of distributions from net investment income of $.152 and distributions from net realized gain of $.123 per share. KTotal distributions of $.18 per share is comprised of distributions from net investment income of $.147 and distributions from net realized gain of $.035 per share. |
Financial Highlights - Service Class
Years ended December 31, | 2013 | 2012 | 2011 | 2010 | 2009 |
Selected Per-Share Data | | | | | |
Net asset value, beginning of period | $ 41.95 | $ 36.81 | $ 36.99 | $ 29.96 | $ 23.47 |
Income from Investment Operations | | | | | |
Net investment income (loss) C | .09 | .22 | .10 | .04 | .08 |
Net realized and unrealized gain (loss) | 15.09 | 5.13 | (.05) | 7.16 | 6.52 |
Total from investment operations | 15.18 | 5.35 | .05 | 7.20 | 6.60 |
Distributions from net investment income | (.10) | (.21) | (.11) F | (.06) | (.09) |
Distributions from net realized gain | (.04) | - | (.12) F | (.11) | (.02) |
Total distributions | (.13) J | (.21) | (.23) | (.17) | (.11) I |
Redemption fees added to paid in capital C, H | - | - | - | - | - |
Net asset value, end of period | $ 57.00 | $ 41.95 | $ 36.81 | $ 36.99 | $ 29.96 |
Total Return A, B | 36.20% | 14.54% | .14% | 24.06% | 28.15% |
Ratios to Average Net Assets D, G | | | | | |
Expenses before reductions | .76% | .76% | .77% | .77% | .79% |
Expenses net of fee waivers, if any | .75% | .76% | .76% | .76% | .79% |
Expenses net of all reductions | .75% | .75% | .76% | .76% | .78% |
Net investment income (loss) | .18% | .54% | .26% | .12% | .31% |
Supplemental Data | | | | | |
Net assets, end of period (000 omitted) | $ 491,959 | $ 395,589 | $ 395,217 | $ 453,063 | $ 421,996 |
Portfolio turnover rate E | 74% | 68% | 71% | 75% | 134% |
ATotal returns do not reflect charges attributable to your insurance company's separate account. Inclusion of these charges would reduce the total returns shown. BTotal returns would have been lower if certain expenses had not been reduced during the applicable periods shown. CCalculated based on average shares outstanding during the period. DFees and expenses of any underlying Fidelity Central Funds are not included in the Fund's expense ratio. The Fund indirectly bears its proportionate share of the expenses of any underlying Fidelity Central Funds. EAmount does not include the portfolio activity of any underlying Fidelity Central Funds. FThe amounts shown reflect certain reclassifications related to book to tax differences that were made in the year shown. GExpense ratios reflect operating expenses of the class. Expenses before reductions do not reflect amounts reimbursed by the investment adviser or reductions from brokerage service arrangements or reductions from other expense offset arrangements and do not represent the amount paid by the class during periods when reimbursements or reductions occur. Expenses net of fee waivers reflect expenses after reimbursement by the investment adviser but prior to reductions from brokerage service arrangements or other expense offset arrangements. Expenses net of all reductions represent the net expenses paid by the class. HAmount represents less than $.01 per share. ITotal distributions of $.11 per share is comprised of distributions from net investment income of $.089 and distributions from net realized gain of $.023 per share. JTotal distributions of $.13 per share is comprised of distributions from net investment income of $.097 and distributions from net realized gain of $.035 per share. |
See accompanying notes which are an integral part of the financial statements.
Annual Report
Financial Highlights - Service Class 2
Years ended December 31, | 2013 | 2012 | 2011 | 2010 | 2009 |
Selected Per-Share Data | | | | | |
Net asset value, beginning of period | $ 41.64 | $ 36.53 | $ 36.72 | $ 29.75 | $ 23.31 |
Income from Investment Operations | | | | | |
Net investment income (loss) C | .01 | .16 | .04 | (.01) | .04 |
Net realized and unrealized gain (loss) | 14.98 | 5.10 | (.05) | 7.10 | 6.48 |
Total from investment operations | 14.99 | 5.26 | (.01) | 7.09 | 6.52 |
Distributions from net investment income | (.02) | (.15) | (.06) F | (.01) | (.05) |
Distributions from net realized gain | (.04) | - | (.12) F | (.11) | (.02) |
Total distributions | (.06) | (.15) | (.18) | (.12) | (.08) I |
Redemption fees added to paid in capital C, H | - | - | - | - | - |
Net asset value, end of period | $ 56.57 | $ 41.64 | $ 36.53 | $ 36.72 | $ 29.75 |
Total Return A, B | 36.00% | 14.40% | (.03)% | 23.86% | 27.97% |
Ratios to Average Net Assets D, G | | | | | |
Expenses before reductions | .91% | .91% | .92% | .92% | .94% |
Expenses net of fee waivers, if any | .90% | .91% | .91% | .91% | .94% |
Expenses net of all reductions | .90% | .90% | .91% | .91% | .93% |
Net investment income (loss) | .03% | .39% | .11% | (.03)% | .16% |
Supplemental Data | | | | | |
Net assets, end of period (000 omitted) | $ 739,551 | $ 592,407 | $ 590,556 | $ 584,193 | $ 528,819 |
Portfolio turnover rate E | 74% | 68% | 71% | 75% | 134% |
ATotal returns do not reflect charges attributable to your insurance company's separate account. Inclusion of these charges would reduce the total returns shown. BTotal returns would have been lower if certain expenses had not been reduced during the applicable periods shown. CCalculated based on average shares outstanding during the period. DFees and expenses of any underlying Fidelity Central Funds are not included in the Fund's expense ratio. The Fund indirectly bears its proportionate share of the expenses of any underlying Fidelity Central Funds. EAmount does not include the portfolio activity of any underlying Fidelity Central Funds. FThe amounts shown reflect certain reclassifications related to book to tax differences that were made in the year shown. GExpense ratios reflect operating expenses of the class. Expenses before reductions do not reflect amounts reimbursed by the investment adviser or reductions from brokerage service arrangements or reductions from other expense offset arrangements and do not represent the amount paid by the class during periods when reimbursements or reductions occur. Expenses net of fee waivers reflect expenses after reimbursement by the investment adviser but prior to reductions from brokerage service arrangements or other expense offset arrangements. Expenses net of all reductions represent the net expenses paid by the class. HAmount represents less than $.01 per share. ITotal distributions of $.08 per share is comprised of distributions from net investment income of $.052 and distributions from net realized gain of $.023 per share. |
Financial Highlights - Service Class 2R
Years ended December 31, | 2013 | 2012 | 2011 | 2010 | 2009 |
Selected Per-Share Data | | | | | |
Net asset value, beginning of period | $ 41.55 | $ 36.46 | $ 36.64 | $ 29.70 | $ 23.26 |
Income from Investment Operations | | | | | |
Net investment income (loss) C | .02 | .16 | .04 | (.01) | .04 |
Net realized and unrealized gain (loss) | 14.92 | 5.09 | (.05) | 7.09 | 6.46 |
Total from investment operations | 14.94 | 5.25 | (.01) | 7.08 | 6.50 |
Distributions from net investment income | (.10) | (.16) | (.05) F | (.03) | (.04) |
Distributions from net realized gain | (.04) | - | (.12) F | (.11) | (.02) |
Total distributions | (.13) J | (.16) | (.17) | (.14) | (.06) I |
Redemption fees added to paid in capital C, H | - | - | - | - | - |
Net asset value, end of period | $ 56.36 | $ 41.55 | $ 36.46 | $ 36.64 | $ 29.70 |
Total Return A, B | 35.97% | 14.41% | (.02)% | 23.86% | 27.98% |
Ratios to Average Net Assets D, G | | | | | |
Expenses before reductions | .90% | .91% | .91% | .92% | .94% |
Expenses net of fee waivers, if any | .90% | .91% | .91% | .91% | .94% |
Expenses net of all reductions | .90% | .90% | .91% | .91% | .93% |
Net investment income (loss) | .03% | .39% | .11% | (.03)% | .16% |
Supplemental Data | | | | | |
Net assets, end of period (000 omitted) | $ 17,284 | $ 5,357 | $ 5,202 | $ 5,739 | $ 4,084 |
Portfolio turnover rate E | 74% | 68% | 71% | 75% | 134% |
ATotal returns do not reflect charges attributable to your insurance company's separate account. Inclusion of these charges would reduce the total returns shown. BTotal returns would have been lower if certain expenses had not been reduced during the applicable periods shown. CCalculated based on average shares outstanding during the period. DFees and expenses of any underlying Fidelity Central Funds are not included in the Fund's expense ratio. The Fund indirectly bears its proportionate share of the expenses of any underlying Fidelity Central Funds. EAmount does not include the portfolio activity of any underlying Fidelity Central Funds. FThe amounts shown reflect certain reclassifications related to book to tax differences that were made in the year shown. GExpense ratios reflect operating expenses of the class. Expenses before reductions do not reflect amounts reimbursed by the investment adviser or reductions from brokerage service arrangements or reductions from other expense offset arrangements and do not represent the amount paid by the class during periods when reimbursements or reductions occur. Expenses net of fee waivers reflect expenses after reimbursement by the investment adviser but prior to reductions from brokerage service arrangements or other expense offset arrangements. Expenses net of all reductions represent the net expenses paid by the class. HAmount represents less than $.01 per share. ITotal distributions of $.06 per share is comprised of distributions from net investment income of $.041 and distributions from net realized gain of $.023 per share. JTotal distributions of $.13 per share is comprised of distributions from net investment income of $.095 and distributions from net realized gain of $.035 per share. |
See accompanying notes which are an integral part of the financial statements.
Annual Report
Financial Highlights - Investor Class
Years ended December 31, | 2013 | 2012 | 2011 | 2010 | 2009 |
Selected Per-Share Data | | | | | |
Net asset value, beginning of period | $ 41.95 | $ 36.81 | $ 37.00 | $ 29.97 | $ 23.48 |
Income from Investment Operations | | | | | |
Net investment income (loss) C | .10 | .23 | .10 | .04 | .08 |
Net realized and unrealized gain (loss) | 15.09 | 5.13 | (.05) | 7.17 | 6.52 |
Total from investment operations | 15.19 | 5.36 | .05 | 7.21 | 6.60 |
Distributions from net investment income | (.11) | (.22) | (.12) F | (.07) | (.09) |
Distributions from net realized gain | (.04) | - | (.12) F | (.11) | (.02) |
Total distributions | (.15) | (.22) | (.24) | (.18) | (.11) I |
Redemption fees added to paid in capital C, H | - | - | - | - | - |
Net asset value, end of period | $ 56.99 | $ 41.95 | $ 36.81 | $ 37.00 | $ 29.97 |
Total Return A, B | 36.22% | 14.58% | .14% | 24.08% | 28.14% |
Ratios to Average Net Assets D, G | | | | | |
Expenses before reductions | .74% | .75% | .75% | .76% | .79% |
Expenses net of fee waivers, if any | .73% | .75% | .75% | .75% | .79% |
Expenses net of all reductions | .73% | .74% | .74% | .75% | .78% |
Net investment income (loss) | .20% | .55% | .27% | .13% | .31% |
Supplemental Data | | | | | |
Net assets, end of period (000 omitted) | $ 214,067 | $ 143,005 | $ 126,551 | $ 117,936 | $ 95,531 |
Portfolio turnover rate E | 74% | 68% | 71% | 75% | 134% |
ATotal returns do not reflect charges attributable to your insurance company's separate account. Inclusion of these charges would reduce the total returns shown. BTotal returns would have been lower if certain expenses had not been reduced during the applicable periods shown. CCalculated based on average shares outstanding during the period. DFees and expenses of any underlying Fidelity Central Funds are not included in the Fund's expense ratio. The Fund indirectly bears its proportionate share of the expenses of any underlying Fidelity Central Funds. EAmount does not include the portfolio activity of any underlying Fidelity Central Funds. FThe amounts shown reflect certain reclassifications related to book to tax differences that were made in the year shown. GExpense ratios reflect operating expenses of the class. Expenses before reductions do not reflect amounts reimbursed by the investment adviser or reductions from brokerage service arrangements or reductions from other expense offset arrangements and do not represent the amount paid by the class during periods when reimbursements or reductions occur. Expenses net of fee waivers reflect expenses after reimbursement by the investment adviser but prior to reductions from brokerage service arrangements or other expense offset arrangements. Expenses net of all reductions represent the net expenses paid by the class. HAmount represents less than $.01 per share. ITotal distributions of $.11 per share is comprised of distributions from net investment income of $.089 and distributions from net realized gain of $.023 per share. |
See accompanying notes which are an integral part of the financial statements.
Annual Report
Notes to Financial Statements
For the period ended December 31, 2013
1. Organization.
VIP Growth Portfolio (the Fund) is a fund of Variable Insurance Products Fund (the Trust) and is authorized to issue an unlimited number of shares. The Trust is registered under the Investment Company Act of 1940, as amended (the 1940 Act), as an open-end management investment company organized as a Massachusetts business trust. Shares of the Fund may only be purchased by insurance companies for the purpose of funding variable annuity or variable life insurance contracts. The Fund offers the following classes of shares: Initial Class shares, Service Class shares, Service Class 2 shares, Service Class 2R shares and Investor Class. All classes have equal rights and voting privileges, except for matters affecting a single class.
2. Investments in Fidelity Central Funds.
The Fund invests in Fidelity Central Funds, which are open-end investment companies generally available only to other investment companies and accounts managed by the investment adviser and its affiliates. The Fund's Schedule of Investments lists each of the Fidelity Central Funds held as of period end, if any, as an investment of the Fund, but does not include the underlying holdings of each Fidelity Central Fund. As an Investing Fund, the Fund indirectly bears its proportionate share of the expenses of the underlying Fidelity Central Funds.
The Money Market Central Funds seek preservation of capital and current income and are managed by Fidelity Investments Money Management, Inc. (FIMM), an affiliate of the investment adviser. Annualized expenses of the Money Market Central Funds as of their most recent shareholder report date are less than .01%.
A complete unaudited list of holdings for each Fidelity Central Fund is available upon request or at the Securities and Exchange Commission (the SEC) website at www.sec.gov. In addition, the financial statements of the Fidelity Central Funds, which are not covered by the Fund's Report of Independent Registered Public Accounting Firm, are available on the SEC website or upon request.
3. Significant Accounting Policies.
The financial statements have been prepared in conformity with accounting principles generally accepted in the United States of America (GAAP), which require management to make certain estimates and assumptions at the date of the financial statements. Actual results could differ from those estimates. Subsequent events, if any, through the date that the financial statements were issued have been evaluated in the preparation of the financial statements. The following summarizes the significant accounting policies of the Fund:
Investment Valuation. Investments are valued as of 4:00 p.m. Eastern time on the last calendar day of the period. In accordance with valuation policies and procedures approved by the Board of Trustees (the Board), the Fund attempts to obtain prices from one or more third party pricing vendors or brokers to value its investments. When current market prices, quotations or currency exchange rates are not readily available or reliable, investments will be fair valued in good faith by the Fidelity Management & Research Company (FMR) Fair Value Committee (the Committee), in accordance with procedures adopted by the Board. Factors used in determining fair value vary by investment type and may include market or investment specific events. The frequency with which these procedures are used cannot be predicted and they may be utilized to a significant extent. The Committee oversees the Fund's valuation policies and procedures and is responsible for approving and reporting to the Board all fair value determinations.
The Fund categorizes the inputs to valuation techniques used to value its investments into a disclosure hierarchy consisting of three levels as shown below:
Level 1 - quoted prices in active markets for identical investments
Level 2 - other significant observable inputs (including quoted prices for similar investments, interest rates, prepayment speeds, etc.)
Level 3 - unobservable inputs (including the Fund's own assumptions based on the best information available)
Valuation techniques used to value the Fund's investments by major category are as follows:
Equity securities, including restricted securities, for which market quotations are readily available, are valued at the last reported sale price or official closing price as reported by a third party pricing vendor on the primary market or exchange on which they are traded and are categorized as Level 1 in the hierarchy. In the event there were no sales during the day or closing prices are not available, securities are valued at the last quoted bid price or may be valued using the last available price and are generally categorized as Level 2 in the hierarchy. For foreign equity securities, when market or security specific events arise, comparisons to the valuation of American Depositary Receipts (ADRs), futures contracts, Exchange-Traded Funds (ETFs) and certain indexes as well as quoted prices for similar securities may be used and would be categorized as Level 2 in the hierarchy. Utilizing these techniques may result in transfers between Level 1 and Level 2. For equity securities, including restricted securities, where observable inputs are limited, assumptions about market activity and risk are used and these securities may be categorized as Level 3 in the hierarchy.
Investments in open-end mutual funds, including the Fidelity Central Funds, are valued at their closing net asset value (NAV) each business day and are categorized as Level 1 in the hierarchy.
Annual Report
Notes to Financial Statements - continued
3. Significant Accounting Policies - continued
Investment Valuation - continued
Changes in valuation techniques may result in transfers in or out of an assigned level within the disclosure hierarchy. The aggregate value of investments by input level, as of December 31, 2013, including information on transfers between Levels 1 and 2, is included at the end of the Fund's Schedule of Investments.
Foreign Currency. The Fund may use foreign currency contracts to facilitate transactions in foreign-denominated securities. Gains and losses from these transactions may arise from changes in the value of the foreign currency or if the counterparties do not perform under the contracts' terms.
Foreign-denominated assets, including investment securities, and liabilities are translated into U.S. dollars at the exchange rates at period end. Purchases and sales of investment securities, income and dividends received and expenses denominated in foreign currencies are translated into U.S. dollars at the exchange rate in effect on the transaction date.
The effects of exchange rate fluctuations on investments are included with the net realized and unrealized gain (loss) on investment securities. Other foreign currency transactions resulting in realized and unrealized gain (loss) are disclosed separately.
Investment Transactions and Income. For financial reporting purposes, the Fund's investment holdings and NAV include trades executed through the end of the last business day of the period. The NAV per share for processing shareholder transactions is calculated as of the close of business of the New York Stock Exchange (NYSE), normally 4:00 p.m. Eastern time and includes trades executed through the end of the prior business day. Gains and losses on securities sold are determined on the basis of identified cost and may include proceeds received from litigation. Dividend income is recorded on the ex-dividend date, except for certain dividends from foreign securities where the ex-dividend date may have passed, which are recorded as soon as the Fund is informed of the ex-dividend date. Non-cash dividends included in dividend income, if any, are recorded at the fair market value of the securities received. Distributions received on securities that represent a return of capital or capital gain are recorded as a reduction of cost of investments and/or as a realized gain. Subsequent to ex-dividend date the Fund determines the components of these distributions, based upon receipt of tax filings or other correspondence relating to the underlying investment. Interest income and distributions from the Fidelity Central Funds are accrued as earned. Interest income includes coupon interest and amortization of premium and accretion of discount on debt securities. Investment income is recorded net of foreign taxes withheld where recovery of such taxes is uncertain.
Class Allocations and Expenses. Investment income, realized and unrealized capital gains and losses, common expenses of the Fund, and certain fund-level expense reductions, if any, are allocated daily on a pro-rata basis to each class based on the relative net assets of each class to the total net assets of the Fund. Each class differs with respect to transfer agent and distribution and service plan fees incurred. Certain expense reductions may also differ by class. For the reporting period, the allocated portion of income and expenses to each class as a percent of its average net assets may vary due to the timing of recording these transactions in relation to fluctuating net assets of the classes. Expenses directly attributable to a fund are charged to that fund. Expenses attributable to more than one fund are allocated among the respective funds on the basis of relative net assets or other appropriate methods. Expense estimates are accrued in the period to which they relate and adjustments are made when actual amounts are known.
Deferred Trustee Compensation. Under a Deferred Compensation Plan (the Plan), independent Trustees may elect to defer receipt of a portion of their annual compensation. Deferred amounts are invested in a cross-section of Fidelity funds, are marked-to-market and remain in the Fund until distributed in accordance with the Plan. The investment of deferred amounts and the offsetting payable to the Trustees are included in the accompanying Statement of Assets and Liabilities.
Income Tax Information and Distributions to Shareholders. Each year, the Fund intends to qualify as a regulated investment company under Subchapter M of the Internal Revenue Code, including distributing substantially all of its taxable income and realized gains. As a result, no provision for U.S. Federal income taxes is required. As of December 31, 2013, the Fund did not have any unrecognized tax benefits in the financial statements; nor is the Fund aware of any tax positions for which it is reasonably possible that the total amounts of unrecognized tax benefits will significantly change in the next twelve months. The Fund files a U.S. federal tax return, in addition to state and local tax returns as required. The Fund's federal income tax returns are subject to examination by the Internal Revenue Service (IRS) for a period of three fiscal years after they are filed. State and local tax returns may be subject to examination for an additional fiscal year depending on the jurisdiction. Foreign taxes are provided for based on the Fund's understanding of the tax rules and rates that exist in the foreign markets in which it invests.
Distributions are declared and recorded on the ex-dividend date. Income dividends and capital gain distributions are declared separately for each class. Income and capital gain distributions are determined in accordance with income tax regulations, which may differ from GAAP.
Capital accounts within the financial statements are adjusted for permanent book-tax differences. These adjustments have no impact on net assets or the results of operations. Capital accounts are not adjusted for temporary book-tax differences which will reverse in a subsequent period.
Book-tax differences are primarily due to foreign currency transactions, passive foreign investment companies (PFIC), partnerships, deferred trustees compensation, capital loss carryforwards and losses deferred due to wash sales and excise tax regulations.
Annual Report
3. Significant Accounting Policies - continued
Income Tax Information and Distributions to Shareholders - continued
The federal tax cost of investment securities and unrealized appreciation (depreciation) as of period end were as follows:
Gross unrealized appreciation | $ 1,455,099,967 |
Gross unrealized depreciation | (26,583,864) |
Net unrealized appreciation (depreciation) on securities and other investments | $ 1,428,516,103 |
| |
Tax Cost | $ 3,256,048,726 |
The tax-based components of distributable earnings as of period end were as follows:
Capital loss carryforward | $ (404,192,084) |
Net unrealized appreciation (depreciation) | $ 1,428,514,974 |
Capital loss carryforwards are only available to offset future capital gains of the Fund to the extent provided by regulations and may be limited. Under the Regulated Investment Company Modernization Act of 2010 (the Act), the Fund is permitted to carry forward capital losses incurred in taxable years beginning after December 22, 2010 for an unlimited period and such capital losses are required to be used prior to any losses that expire. The capital loss carryforward information presented below, including any applicable limitation, is estimated as of fiscal period end and is subject to adjustment.
Fiscal year of expiration | |
2017 | $ (404,192,084) |
The tax character of distributions paid was as follows:
| December 31, 2013 | December 31, 2012 |
Ordinary Income | $ 12,614,169 | $ 20,720,579 |
Trading (Redemption) Fees. Service Class 2R shares held by investors less than 60 days may be subject to a redemption fee equal to 1% of the NAV of shares redeemed. All redemption fees, which reduce the proceeds of the shareholder redemption, are retained by the Fund and accounted for as an addition to paid in capital.
Restricted Securities. The Fund may invest in securities that are subject to legal or contractual restrictions on resale. These securities generally may be resold in transactions exempt from registration or to the public if the securities are registered. Disposal of these securities may involve time-consuming negotiations and expense, and prompt sale at an acceptable price may be difficult. Information regarding restricted securities is included at the end of the Fund's Schedule of Investments.
4. Purchases and Sales of Investments.
Purchases and sales of securities, other than short-term securities, aggregated $3,015,138,781 and $3,345,346,296, respectively.
5. Fees and Other Transactions with Affiliates.
Management Fee. Fidelity Management & Research Company (the investment adviser) and its affiliates provide the Fund with investment management related services for which the Fund pays a monthly management fee. The management fee is the sum of an individual fund fee rate that is based on an annual rate of .30% of the Fund's average net assets and an annualized group fee rate that averaged .25% during the period. The group fee rate is based upon the average net assets of all the mutual funds advised by the investment adviser, including any mutual funds previously advised by the investment adviser that are currently advised by Fidelity SelectCo, LLC, an affiliate of the investment adviser. The group fee rate decreases as assets under management increase and increases as assets under management decrease. For the reporting period, the total annual management fee rate was .55% of the Fund's average net assets.
Distribution and Service Plan Fees. In accordance with Rule 12b-1 of the 1940 Act, the Fund has adopted separate 12b-1 Plans for each Service Class of shares. Each Service Class pays Fidelity Distributors Corporation (FDC), an affiliate of the investment adviser, a service fee. For the period, the service fee is based on an annual rate of .10% of Service Class' average net assets and .25% of Service Class 2's and Service Class 2R's average net assets.
Annual Report
Notes to Financial Statements - continued
5. Fees and Other Transactions with Affiliates - continued
Distribution and Service Plan Fees - continued
For the period, total fees, all of which were re-allowed to insurance companies for the distribution of shares and providing shareholder support services were as follows:
Service Class | $ 435,996 |
Service Class 2 | 1,638,791 |
Service Class 2R | 20,803 |
| $ 2,095,590 |
Transfer Agent Fees. Fidelity Investments Institutional Operations Company, Inc. (FIIOC), an affiliate of the investment adviser, is the Fund's transfer, dividend disbursing, and shareholder servicing agent. FIIOC receives an asset-based fee with respect to each class. Each class (with the exception of Investor Class) pays a transfer agent fee, excluding out of pocket expenses, equal to an annual rate of .07% of average net assets. Investor Class pays a monthly asset-based transfer agent fee of .15% of average net assets. In addition, FIIOC receives an asset-based fee of .0035% of average net assets for typesetting, printing and mailing of shareholder reports, except proxy statements. FIIOC voluntarily agreed to reimburse or waive this fee for the period January 1, 2013 through December 31, 2013 (see Expense Reductions note). For the period, transfer agent fees for each class, including printing and out of pocket expenses, were as follows:
Initial Class | $ 1,974,884 |
Service Class | 302,617 |
Service Class 2 | 456,343 |
Service Class 2R | 5,682 |
Investor Class | 261,039 |
| $ 3,000,565 |
Effective February 1, 2014, the Board of Trustees approved an amendment to the transfer agent fee agreement whereby each class (with the exception of Investor Class) pays a single fee of .07% of average net assets for transfer agent services, typesetting, printing and mailing of shareholder reports, excluding mailing of proxy statements and out of pocket expenses. Investor Class pays a single fee of .15% of average net assets.
Accounting and Security Lending Fees. Fidelity Service Company, Inc. (FSC), an affiliate of the investment adviser, maintains the Fund's accounting records. The accounting fee is based on the level of average net assets for each month. Under a separate contract, FSC administers the security lending program. The security lending fee is based on the number and duration of lending transactions.
Brokerage Commissions. The Fund placed a portion of its portfolio transactions with brokerage firms which are affiliates of the investment adviser. Brokerage commissions are included in net realized gain (loss) and change in net unrealized appreciation (depreciation) in the Statement of Operations. The commissions paid to these affiliated firms were $48,550 for the period.
6. Committed Line of Credit.
The Fund participates with other funds managed by the investment adviser or an affiliate in a $4.25 billion credit facility (the "line of credit") to be utilized for temporary or emergency purposes to fund shareholder redemptions or for other short-term liquidity purposes. The Fund has agreed to pay commitment fees on its pro-rata portion of the line of credit, which amounted to $8,597 and is reflected in Miscellaneous expenses on the Statement of Operations. During the period, there were no borrowings on this line of credit.
7. Security Lending.
The Fund lends portfolio securities through a lending agent from time to time in order to earn additional income. For equity securities, a lending agent is used and may loan securities to certain qualified borrowers, including Fidelity Capital Markets (FCM), a broker-dealer affiliated with the Fund. On the settlement date of the loan, the Fund receives collateral (in the form of U.S. Treasury obligations, letters of credit and/or cash) against the loaned securities and maintains collateral in an amount not less than 100% of the market value of the loaned securities during the period of the loan. The market value of the loaned securities is determined at the close of business of the Fund and any additional required collateral is delivered to the Fund on the next business day. If the borrower defaults on its obligation to return the securities loaned because of insolvency or other reasons, the Fund may apply collateral received from the borrower against the obligation. The Fund may experience delays and costs in recovering the securities loaned. Any cash collateral received is invested in the Fidelity Securities Lending Cash Central Fund. The value of loaned securities and cash collateral at period end are disclosed on the Fund's Statement of Assets and Liabilities. The value of securities loaned to FCM at period end was $2,195,925. Security lending income represents the income earned on investing cash collateral, less rebates paid to borrowers and any lending agent fees associated with the loan, plus any premium payments received for lending certain types of securities. Security lending income is presented in the Statement of Operations as a component of income from Fidelity Central Funds. Total security lending income during the period amounted to $401,092, including $13,794 from securities loaned to FCM.
Annual Report
8. Expense Reductions.
The investment adviser or its affiliates agreed to reimburse or waive certain fees during the period as noted in the table below.
Initial Class | $ 111,610 |
Service Class | 17,044 |
Service Class 2 | 25,625 |
Service Class 2R | 326 |
Investor Class | 6,687 |
| $ 161,292 |
Commissions paid to certain brokers with whom the investment adviser, or its affiliates, places trades on behalf of the Fund include an amount in addition to trade execution, which may be rebated back to the Fund to offset certain expenses. This amount totaled $170,747 for the period.
9. Distributions to Shareholders.
Distributions to shareholders of each class were as follows:
Years ended December 31, | 2013 | 2012 |
From net investment income | | |
Initial Class | $ 8,183,689 | $ 15,820,328 |
Service Class | 834,735 | 1,992,915 |
Service Class 2 | 302,832 | 2,128,126 |
Service Class 2R | 28,824 | 21,103 |
Investor Class | 413,675 | 758,107 |
Total | $ 9,763,755 | $ 20,720,579 |
From net realized gain | | |
Initial Class | $ 1,948,498 | $ - |
Service Class | 301,193 | - |
Service Class 2 | 460,831 | - |
Service Class 2R | 10,619 | - |
Investor Class | 129,273 | - |
Total | $ 2,850,414 | $ - |
10. Share Transactions.
Transactions for each class of shares were as follows:
| Shares | Dollars |
Years ended December 31, | 2013 | 2012 | 2013 | 2012 |
Initial Class | | | | |
Shares sold | 1,850,753 | 2,323,728 | $ 90,925,901 | $ 96,521,392 |
Reinvestment of distributions | 184,188 | 381,572 | 10,132,187 | 15,820,328 |
Shares redeemed | (8,540,450) | (10,560,173) | (413,920,350) | (437,343,347) |
Net increase (decrease) | (6,505,509) | (7,854,873) | $ (312,862,262) | $ (325,001,627) |
Service Class | | | | |
Shares sold | 506,606 | 449,055 | $ 24,889,515 | $ 18,616,054 |
Reinvestment of distributions | 20,698 | 48,172 | 1,135,928 | 1,992,915 |
Shares redeemed | (1,325,183) | (1,805,917) | (63,783,330) | (74,456,372) |
Net increase (decrease) | (797,879) | (1,308,690) | $ (37,757,887) | $ (53,847,403) |
Service Class 2 | | | | |
Shares sold | 1,978,056 | 2,992,976 | $ 97,911,059 | $ 122,866,709 |
Reinvestment of distributions | 14,022 | 51,828 | 763,663 | 2,128,126 |
Shares redeemed | (3,143,720) | (4,983,249) | (152,819,651) | (200,935,979) |
Net increase (decrease) | (1,151,642) | (1,938,445) | $ (54,144,929) | $ (75,941,144) |
Service Class 2R | | | | |
Shares sold | 261,110 | 51,435 | $ 13,399,914 | $ 2,117,779 |
Reinvestment of distributions | 727 | 515 | 39,443 | 21,103 |
Shares redeemed | (84,125) | (65,694) | (4,065,469) | (2,637,205) |
Net increase (decrease) | 177,712 | (13,744) | $ 9,373,888 | $ (498,323) |
Annual Report
Notes to Financial Statements - continued
10. Share Transactions - continued
| Shares | Dollars |
Years ended December 31, | 2013 | 2012 | 2013 | 2012 |
Investor Class | | | | |
Shares sold | 770,590 | 497,342 | $ 38,503,533 | $ 20,659,697 |
Reinvestment of distributions | 9,897 | 18,329 | 542,948 | 758,107 |
Shares redeemed | (432,922) | (544,984) | (20,758,584) | (22,504,503) |
Net increase (decrease) | 347,565 | (29,313) | $ 18,287,897 | $ (1,086,699) |
11. Other.
The Fund's organizational documents provide former and current trustees and officers with a limited indemnification against liabilities arising in connection with the performance of their duties to the Fund. In the normal course of business, the Fund may also enter into contracts that provide general indemnifications. The Fund's maximum exposure under these arrangements is unknown as this would be dependent on future claims that may be made against the Fund. The risk of material loss from such claims is considered remote.
At the end of the period, the investment adviser or its affiliates were the owners of record of 14% of the total outstanding shares of the Fund and one otherwise unaffiliated shareholder was the owner of record of 24% of the total outstanding shares of the Fund.
Annual Report
Report of Independent Registered Public Accounting Firm
To the Trustees of Variable Insurance Products Fund and the Shareholders of VIP Growth Portfolio:
In our opinion, the accompanying statement of assets and liabilities, including the schedule of investments, and the related statements of operations and of changes in net assets and the financial highlights present fairly, in all material respects, the financial position of VIP Growth Portfolio (a fund of Variable Insurance Products Fund) at December 31, 2013, the results of its operations for the year then ended, the changes in its net assets for each of the two years in the period then ended and the financial highlights for each of the five years in the period then ended, in conformity with accounting principles generally accepted in the United States of America. These financial statements and financial highlights (hereafter referred to as "financial statements") are the responsibility of the VIP Growth Portfolio's management. Our responsibility is to express an opinion on these financial statements based on our audits. We conducted our audits of these financial statements in accordance with the standards of the Public Company Accounting Oversight Board (United States). Those standards require that we plan and perform the audit to obtain reasonable assurance about whether the financial statements are free of material misstatement. An audit includes examining, on a test basis, evidence supporting the amounts and disclosures in the financial statements, assessing the accounting principles used and significant estimates made by management, and evaluating the overall financial statement presentation. We believe that our audits, which included confirmation of securities at December 31, 2013 by correspondence with the custodian and brokers, provide a reasonable basis for our opinion.
PricewaterhouseCoopers LLP
Boston, Massachusetts
February 10, 2014
Annual Report
The Trustees, Member of the Advisory Board, and officers of the trust and fund, as applicable, are listed below. The Board of Trustees governs the fund and is responsible for protecting the interests of shareholders. The Trustees are experienced executives who meet periodically throughout the year to oversee the fund's activities, review contractual arrangements with companies that provide services to the fund, oversee management of the risks associated with such activities and contractual arrangements, and review the fund's performance. Except for James C. Curvey, Ned C. Lautenbach, Ronald P. O'Hanley, and William S. Stavropoulos, each of the Trustees oversees 173 funds. Mr. Curvey oversees 396 funds. Mr. Lautenbach, Mr. O'Hanley, and Mr. Stavropoulos each oversees 247 funds.
The Trustees hold office without limit in time except that (a) any Trustee may resign; (b) any Trustee may be removed by written instrument, signed by at least two-thirds of the number of Trustees prior to such removal; (c) any Trustee who requests to be retired or who has become incapacitated by illness or injury may be retired by written instrument signed by a majority of the other Trustees; and (d) any Trustee may be removed at any special meeting of shareholders by a two-thirds vote of the outstanding voting securities of the trust. Each Trustee who is not an interested person (as defined in the 1940 Act) of the trust and the fund (Independent Trustee), shall retire not later than the last day of the calendar year in which his or her 75th birthday occurs. The Independent Trustees may waive this mandatory retirement age policy with respect to individual Trustees. The officers and Advisory Board Member hold office without limit in time, except that any officer and Advisory Board Member may resign or may be removed by a vote of a majority of the Trustees at any regular meeting or any special meeting of the Trustees. Except as indicated, each individual has held the office shown or other offices in the same company for the past five years.
Experience, Skills, Attributes, and Qualifications of the Fund's Trustees. The Governance and Nominating Committee has adopted a statement of policy that describes the experience, qualifications, attributes, and skills that are necessary and desirable for potential Independent Trustee candidates (Statement of Policy). The Board believes that each Trustee satisfied at the time he or she was initially elected or appointed a Trustee, and continues to satisfy, the standards contemplated by the Statement of Policy. The Governance and Nominating Committee also engages professional search firms to help identify potential Independent Trustee candidates who have the experience, qualifications, attributes, and skills consistent with the Statement of Policy. From time to time, additional criteria based on the composition and skills of the current Independent Trustees, as well as experience or skills that may be appropriate in light of future changes to board composition, business conditions, and regulatory or other developments, have also been considered by the professional search firms and the Governance and Nominating Committee. In addition, the Board takes into account the Trustees' commitment and participation in Board and committee meetings, as well as their leadership of standing and ad hoc committees throughout their tenure.
In determining that a particular Trustee was and continues to be qualified to serve as a Trustee, the Board has considered a variety of criteria, none of which, in isolation, was controlling. The Board believes that, collectively, the Trustees have balanced and diverse experience, qualifications, attributes, and skills, which allow the Board to operate effectively in governing the fund and protecting the interests of shareholders. Information about the specific experience, skills, attributes, and qualifications of each Trustee, which in each case led to the Board's conclusion that the Trustee should serve (or continue to serve) as a trustee of the fund, is provided below.
Board Structure and Oversight Function. James C. Curvey is an interested person (as defined in the 1940 Act) and currently serves as Chairman. The Trustees have determined that an interested Chairman is appropriate and benefits shareholders because an interested Chairman has a personal and professional stake in the quality and continuity of services provided to the fund. Independent Trustees exercise their informed business judgment to appoint an individual of their choosing to serve as Chairman, regardless of whether the Trustee happens to be independent or a member of management. The Independent Trustees have determined that they can act independently and effectively without having an Independent Trustee serve as Chairman and that a key structural component for assuring that they are in a position to do so is for the Independent Trustees to constitute a substantial majority for the Board. The Independent Trustees also regularly meet in executive session. Ned C. Lautenbach serves as Chairman of the Independent Trustees and as such (i) acts as a liaison between the Independent Trustees and management with respect to matters important to the Independent Trustees and (ii) with management prepares agendas for Board meetings.
Fidelity funds are overseen by different Boards of Trustees. The fund's Board oversees Fidelity's equity and high income funds and another Board oversees Fidelity's investment-grade bond, money market, and asset allocation funds. The asset allocation funds may invest in Fidelity funds overseen by the fund's Board. The use of separate Boards, each with its own committee structure, allows the Trustees of each group of Fidelity funds to focus on the unique issues of the funds they oversee, including common research, investment, and operational issues. On occasion, the separate Boards establish joint committees to address issues of overlapping consequences for the Fidelity funds overseen by each Board.
The Trustees operate using a system of committees to facilitate the timely and efficient consideration of all matters of importance to the Trustees, the fund, and fund shareholders and to facilitate compliance with legal and regulatory requirements and oversight of the fund's activities and associated risks. The Board, acting through its committees, has charged FMR and its affiliates with (i) identifying events or circumstances the occurrence of which could have demonstrably adverse effects on the fund's business and/or reputation; (ii) implementing processes and controls to lessen the possibility that such events or circumstances occur or to mitigate the effects of such events or circumstances if they do occur; and (iii) creating and maintaining a system designed to evaluate continuously business and market conditions in order to facilitate the identification and implementation processes described in (i) and (ii) above. Because the day-to-day operations and activities of the fund are carried out by or through FMR, its affiliates and other service providers, the fund's exposure to risks is mitigated but not eliminated by the processes overseen by the Trustees. While each of the Board's committees has responsibility for overseeing different aspects of the fund's activities, oversight is exercised primarily through the Operations, Audit, and Compliance Committees. In addition, the Independent Trustees have worked with FMR to enhance the Board's oversight of investment and financial risks, legal and regulatory risks, technology risks, and operational risks, including the development of additional risk reporting to the Board. For example, a working group comprised of Independent Trustees and FMR has worked and continues to work to review the Fidelity funds' valuation-related activities, reporting and risk management. Appropriate personnel, including but not limited to the fund's Chief Compliance Officer (CCO), FMR's internal auditor, the independent accountants, the funds' Treasurer and portfolio management personnel, make periodic reports to the Board's committees, as appropriate, including an annual review of FMR's risk management program for the Fidelity funds. The responsibilities of each standing committee, including their oversight responsibilities, are described further under "Standing Committees of the Fund's Trustees."
Annual Report
The fund's Statement of Additional Information (SAI) includes more information about the Trustees. To request a free copy, call Fidelity at 1-877-208-0098.
Interested Trustees*:
Correspondence intended for each Trustee who is an interested person may be sent to Fidelity Investments, 245 Summer Street, Boston, Massachusetts 02210.
Name, Year of Birth; Principal Occupations and Other Relevant Experience+ |
James C. Curvey (1935) |
Year of Election or Appointment: 2007 Trustee Chairman of the Board of Trustees |
| Mr. Curvey also serves as Trustee of other Fidelity funds. Mr. Curvey is a Director of Fidelity Investments Money Management, Inc. (2009-present), Director of Fidelity Research & Analysis Co. (2009-present) and Director of FMR and FMR Co., Inc. (2007-present). Mr. Curvey is also Vice Chairman (2007-present) and Director of FMR LLC. In addition, Mr. Curvey serves as an Overseer for the Boston Symphony Orchestra and a member of the Trustees of Villanova University. Previously, Mr. Curvey was the Vice Chairman (2006-2007) and Director (2000-2007) of FMR Corp. |
Ronald P. O'Hanley (1957) |
Year of Election or Appointment: 2011 Trustee |
| Mr. O'Hanley also serves as Trustee of other Fidelity funds. He is Director of Fidelity SelectCo, LLC (2013-present), FMR Co., Inc. (2010-present), Director of Fidelity Investments Money Management, Inc. (2010-present), Director of Fidelity Research & Analysis Company (2010-present), President of Fidelity Asset Management and Corporate Services and a Member of Fidelity's Executive Committee (2010-present). Previously, Mr. O'Hanley served as President and Chief Executive Officer of BNY Mellon Asset Management (2007-2010). Mr. O'Hanley also served as Vice Chairman of Bank New York Mellon Corp. and a member of that firm's Executive Committee. Prior to the 2007 merger of The Bank of New York and Mellon Financial Corporation, he was Vice Chairman of Mellon Financial Corporation and President and Chief Executive Officer of Mellon Asset Management. He joined Mellon in February 1997. Mr. O'Hanley currently serves as Chairman of the Boston Public Library Foundation Board of Directors and sits on the Board of Directors of Beth Israel Deaconess Medical Center, the Board of Trustees of the Marine Biological Laboratory and the Advisory Board of the Maxwell School of Citizenship and Public Administration at Syracuse University. Mr. O'Hanley also chairs the Council on Asset Management for the Financial Services Roundtable and is a member of the Board of Directors of Institutional Investor's U.S. Institute. |
* Trustees have been determined to be "Interested Trustees" by virtue of, among other things, their affiliation with the trust or various entities under common control with FMR.
+ The information above includes each Trustee's principal occupation during the last five years and other information relating to the experience, attributes, and skills relevant to each Trustee's qualifications to serve as a Trustee, which led to the conclusion that each Trustee should serve as a Trustee for the fund.
Annual Report
Trustees and Officers - continued
Independent Trustees:
Correspondence intended for each Independent Trustee (that is, the Trustees other than the Interested Trustees) may be sent to Fidelity Investments, P.O. Box 55235, Boston, Massachusetts 02205-5235.
Name, Year of Birth; Principal Occupations and Other Relevant Experience+ |
Dennis J. Dirks (1948) |
Year of Election or Appointment: 2005 Trustee |
| Mr. Dirks also serves as Trustee of other Fidelity funds. Prior to his retirement in May 2003, Mr. Dirks was Chief Operating Officer and a member of the Board of The Depository Trust & Clearing Corporation (DTCC). He also served as President, Chief Operating Officer, and Board member of The Depository Trust Company (DTC) and President and Board member of the National Securities Clearing Corporation (NSCC). In addition, Mr. Dirks served as Chief Executive Officer and Board member of the Government Securities Clearing Corporation, Chief Executive Officer and Board member of the Mortgage-Backed Securities Clearing Corporation, as a Trustee and a member of the Finance Committee of Manhattan College (2005-2008), and as a Trustee and a member of the Finance Committee of AHRC of Nassau County (2006-2008). Mr. Dirks is a member of the Independent Directors Council (IDC) Governing Council (2010-present) and Board of Directors for The Brookville Center for Children's Services, Inc. (2009-present). |
Alan J. Lacy (1953) |
Year of Election or Appointment: 2008 Trustee |
| Mr. Lacy also serves as Trustee of other Fidelity funds. Mr. Lacy serves as Senior Adviser (2007-present) of Oak Hill Capital Partners, L.P. (private equity). Mr. Lacy also served as Chief Executive Officer (2000-2005) and Vice Chairman (2005-2006) of Sears Holdings Corporation and Sears, Roebuck and Co. (retail). In addition, Mr. Lacy serves as a member of the Board of Directors of Dave & Buster's Entertainment, Inc. (restaurant and entertainment complexes, 2010-present), Earth Fare, Inc. (retail grocery, 2012-present), The Hillman Companies, Inc. (hardware wholesalers, 2010-present), and Bristol-Myers Squibb Company (global pharmaceuticals, 2008-present). Mr. Lacy is a member of the Board of Trustees of The National Parks Conservation Association (2006-present). Previously, Mr. Lacy served as Chairman of the Board of Trustees of the National Parks Conservation Association (2008-2011) and as a member of the Board of Directors for the Western Union Company (global money transfer, 2006-2011). |
Ned C. Lautenbach (1944) |
Year of Election or Appointment: 2000 Trustee Chairman of the Independent Trustees |
| Mr. Lautenbach also serves as Trustee of other Fidelity funds. Mr. Lautenbach currently serves as the Lead Director of the Eaton Corporation Board of Directors (diversified industrial, 1997-present). Mr. Lautenbach is Chairman of the Board of Directors of the Philharmonic Center for the Arts in Naples, Florida (2012-present) and a member of the Council on Foreign Relations (1994-present). Previously, Mr. Lautenbach was a Partner/Advisory Partner at Clayton, Dubilier & Rice, LLC (private equity investment, 1998-2010), as well as a Director of Sony Corporation (2006-2007). |
Joseph Mauriello (1944) |
Year of Election or Appointment: 2008 Trustee |
| Mr. Mauriello also serves as Trustee of other Fidelity funds. Prior to his retirement in January 2006, Mr. Mauriello served in numerous senior management positions including Deputy Chairman and Chief Operating Officer (2004-2005), and Vice Chairman of Financial Services (2002-2004) of KPMG LLP US (professional services, 1965-2005). Mr. Mauriello currently serves as a member of the Board of Directors of XL Group plc. (global insurance and re-insurance, 2006-present). Previously, Mr. Mauriello served as a Director of the Hamilton Funds of the Bank of New York (2006-2007) and of Arcadia Resources Inc. (health care services and products, 2007-2012). |
Robert W. Selander (1950) |
Year of Election or Appointment: 2011 Trustee |
| Mr. Selander also serves as Trustee of other Fidelity funds. Previously, Mr. Selander served as a Member of the Advisory Board of other Fidelity funds (2011), and Executive Vice Chairman (2010), Chief Executive Officer (2009-2010), and President and Chief Executive Officer (1997-2009) of Mastercard, Inc. |
Cornelia M. Small (1944) |
Year of Election or Appointment: 2005 Trustee |
| Ms. Small also serves as Trustee of other Fidelity funds. Ms. Small is a member of the Board of Directors (2009-present) and Chair of the Investment Committee (2010-present) of the Teagle Foundation. Ms. Small also serves on the Investment Committee of the Berkshire Taconic Community Foundation (2008-present). Previously, Ms. Small served as Chairperson (2002-2008) and a member of the Investment Committee and Chairperson (2008-2012) and a member of the Board of Trustees of Smith College. In addition, Ms. Small served as Chief Investment Officer, Director of Global Equity Investments, and a member of the Board of Directors of Scudder, Stevens & Clark and Scudder Kemper Investments. |
William S. Stavropoulos (1939) |
Year of Election or Appointment: 2001 Trustee Vice Chairman of the Independent Trustees |
| Mr. Stavropoulos also serves as Trustee of other Fidelity funds. Mr. Stavropoulos serves as President and Founder of the Michigan Baseball Foundation, the Great Lakes Loons (2007-present). Mr. Stavropoulos is Chairman Emeritus of the Board of Directors of The Dow Chemical Company, where he previously served in numerous senior management positions, including President, CEO (1995-2000; 2002-2004), Chairman of the Executive Committee (2000-2006), and as a member of the Board of Directors (1990-2006). Currently, Mr. Stavropoulos is Chairman of the Board of Directors of Univar Inc. (global distributor of commodity and specialty chemicals), a Director of Teradata Corporation (data warehousing and technology solutions), and Maersk Inc. (industrial conglomerate), and a member of the Advisory Board for Metalmark Capital LLC (private equity investment, 2005-present). Mr. Stavropoulos is an operating advisor to Clayton, Dubilier & Rice, LLC (private equity investment). In addition, Mr. Stavropoulos is a member of the University of Notre Dame Advisory Council for the College of Science, a Trustee of the Rollin L. Gerstacker Foundation, and a Director of the Naples Philharmonic Center for the Arts. Previously, Mr. Stavropoulos served as a Director of Chemical Financial Corporation (bank holding company, 1993-2012) and Tyco International, Ltd. (multinational manufacturing and services, 2007-2012). |
David M. Thomas (1949) |
Year of Election or Appointment: 2008 Trustee |
| Mr. Thomas also serves as Trustee of other Fidelity funds. Mr. Thomas serves as Non-Executive Chairman of the Board of Directors of Fortune Brands Home and Security (home and security products, 2011-present), and as a member of the Board of Directors of Interpublic Group of Companies, Inc. (marketing communication, 2004-present). Previously, Mr. Thomas served as Executive Chairman (2005-2006) and Chairman and Chief Executive Officer (2000-2005) of IMS Health, Inc. (pharmaceutical and healthcare information solutions), and a Director of Fortune Brands, Inc. (consumer products, 2000-2011). |
+ The information above includes each Trustee's principal occupation during the last five years and other information relating to the experience, attributes, and skills relevant to each Trustee's qualifications to serve as a Trustee, which led to the conclusion that each Trustee should serve as a Trustee for the fund.
Advisory Board Member and Officers:
Correspondence intended for each officer and Peter S. Lynch may be sent to Fidelity Investments, 245 Summer Street, Boston, Massachusetts 02210. Officers appear below in alphabetical order.
Name, Year of Birth; Principal Occupation |
Peter S. Lynch (1944) |
Year of Election or Appointment: 2003 Member of the Advisory Board |
| Mr. Lynch also serves as Member of the Advisory Board of other Fidelity funds. Mr. Lynch is Vice Chairman and a Director of FMR and FMR Co., Inc. In addition, Mr. Lynch serves as a Trustee of Boston College and as the Chairman of the Inner-City Scholarship Fund. Previously, Mr. Lynch served on the Special Olympics International Board of Directors (1997-2006). |
Elizabeth Paige Baumann (1968) |
Year of Election or Appointment: 2012 Anti-Money Laundering (AML) Officer |
| Ms. Baumann also serves as AML Officer of other funds. She is Chief AML Officer of FMR LLC (2012-present) and is an employee of Fidelity Investments. Previously, Ms. Baumann served as Vice President and Deputy Anti-Money Laundering Officer (2007-2012). |
William C. Coffey (1969) |
Year of Election or Appointment: 2009 Assistant Secretary |
| Mr. Coffey also serves as Assistant Secretary of other funds. He is Senior Vice President and Deputy General Counsel of FMR LLC (2010-present), and is an employee of Fidelity Investments. Previously, Mr. Coffey served as Vice President and Associate General Counsel of FMR LLC (2005-2009). |
Jonathan Davis (1968) |
Year of Election or Appointment: 2010 Assistant Treasurer |
| Mr. Davis also serves as Assistant Treasurer of other funds. Mr. Davis is an employee of Fidelity Investments. Previously, Mr. Davis served as Vice President and Associate General Counsel of FMR LLC (2003-2010). |
Adrien E. Deberghes (1967) |
Year of Election or Appointment: 2008 Deputy Treasurer |
| Mr. Deberghes also serves as an officer of other funds. He is an employee of Fidelity Investments (2008-present). Prior to joining Fidelity Investments, Mr. Deberghes was Senior Vice President of Mutual Fund Administration at State Street Corporation (2007-2008), Senior Director of Mutual Fund Administration at Investors Bank & Trust (2005-2007), and Director of Finance for Dunkin' Brands (2000-2005). |
Stephanie J. Dorsey (1969) |
Year of Election or Appointment: 2010 Assistant Treasurer |
| Ms. Dorsey also serves as an officer of other funds. She is an employee of Fidelity Investments (2008-present) and has served in other fund officer roles. Prior to joining Fidelity Investments, Ms. Dorsey served as Treasurer (2004-2008) of the JPMorgan Mutual Funds and Vice President (2004-2008) of JPMorgan Chase Bank. |
Scott C. Goebel (1968) |
Year of Election or Appointment: 2008 Secretary and Chief Legal Officer (CLO) |
| Mr. Goebel serves as Secretary and CLO of other funds. Mr. Goebel also serves as Secretary of Fidelity Investments Money Management, Inc. (FIMM) (2010-present) and Fidelity Research and Analysis Company (FRAC) (2010-present); General Counsel, Secretary, and Senior Vice President of FMR (2008-present) and FMR Co., Inc. (2008-present); Chief Legal Officer of Fidelity Management & Research (Hong Kong) Limited (2008-present) and Assistant Secretary of Fidelity Management & Research (Japan) Inc. (2008-present), and Fidelity Management & Research (U.K.) Inc. (2008-present). Previously, Mr. Goebel served as Secretary and CLO of other Fidelity funds (2008-2013), Assistant Secretary of FIMM (2008-2010), FRAC (2008-2010), and certain funds (2007-2008); and as Vice President and Secretary of Fidelity Distributors Corporation (FDC) (2005-2007). Mr. Goebel has been employed by FMR LLC or an affiliate since 2001. |
Joseph A. Hanlon (1968) |
Year of Election or Appointment: 2012 Chief Compliance Officer |
| Mr. Hanlon also serves as Chief Compliance Officer of other funds. Mr. Hanlon serves as Compliance Officer of FMR, FMR Co., Inc., Fidelity Investments Money Management, Inc. (FIMM), Fidelity Research and Analysis Company (FRAC), and Fidelity Management & Research (Hong Kong) (2009-present), as Senior Vice President of the Fidelity Asset Management Division (2009-present), and is an employee of Fidelity Investments. Previously, Mr. Hanlon served as Compliance Officer of Fidelity Management & Research (Japan) Inc. (2009-2013), Strategic Advisers, Inc. (2009-2013), and Fidelity Management & Research (U.K.) Inc. (2009-2013). |
Bruce T. Herring (1965) |
Year of Election or Appointment: 2006 Vice President of certain Equity Funds |
| Mr. Herring also serves as Vice President of other funds. He serves as Chief Investment Officer of Fidelity Global Asset Allocation (GAA) (2013-present), Group Chief Investment Officer of FMR, and President of Fidelity Research & Analysis Company (2010-present). Previously, Mr. Herring served as Chief Investment Officer and Director of Fidelity Management & Research (U.K.) Inc. (2010-2013), Vice President (2005-2006) and Senior Vice President (2006-2007) of Fidelity Management & Research Company, Vice President of FMR Co., Inc. (2001-2007), and as a portfolio manager for Fidelity U.S. Equity Funds. |
Brian B. Hogan (1964) |
Year of Election or Appointment: 2009 Vice President |
| Mr. Hogan also serves as Vice President of other funds. Mr. Hogan serves as President of FMR's Equity Division (2009-present). Previously, Mr. Hogan served as Senior Vice President, Equity Research of FMR (2006-2009) and as a portfolio manager. |
Chris Maher (1972) |
Year of Election or Appointment: 2013 Assistant Treasurer |
| Mr. Maher serves as Assistant Treasurer of other funds. Mr. Maher is Vice President of Valuation Oversight and is an employee of Fidelity Investments. Previously, Mr. Maher served as Vice President of Asset Management Compliance (2013), Vice President of FMR's Program Management Group (2010-2013), and Vice President of Valuation Oversight (2008-2010). |
Christine Reynolds (1958) |
Year of Election or Appointment: 2008 Chief Financial Officer |
| Ms. Reynolds also serves as Chief Financial Officer of other funds. Ms. Reynolds became President of Fidelity Pricing and Cash Management Services (FPCMS) in August 2008. Ms. Reynolds served as Chief Operating Officer of FPCMS (2007-2008). Previously, Ms. Reynolds served as President, Treasurer, and Anti-Money Laundering officer of the Fidelity funds (2004-2007). |
Kenneth B. Robins (1969) |
Year of Election or Appointment: 2008 President and Treasurer |
| Mr. Robins also serves as an officer of other funds. Mr. Robins serves as Executive Vice President of Fidelity Investments Money Management, Inc. (FIMM) (2013-present) and is an employee of Fidelity Investments (2004-present). Previously, Mr. Robins served in other fund officer roles. |
Gary W. Ryan (1958) |
Year of Election or Appointment: 2005 Assistant Treasurer |
| Mr. Ryan also serves as Assistant Treasurer of other funds. Mr. Ryan is an employee of Fidelity Investments and has served in other fund officer roles. Previously, Mr. Ryan served as Vice President of Fund Reporting in Fidelity Pricing and Cash Management Services (FPCMS) (1999-2005). |
Stephen Sadoski (1971) |
Year of Election or Appointment: 2012 Deputy Treasurer |
| Mr. Sadoski also serves as Deputy Treasurer of other funds. He is an employee of Fidelity Investments (2012-present) and has served in another fund officer role. Prior to joining Fidelity Investments, Mr. Sadoski served as an assistant chief accountant in the Division of Investment Management of the Securities and Exchange Commission (SEC) (2009-2012) and as a senior manager at Deloitte & Touche LLP (1997-2009). |
Stacie M. Smith (1974) |
Year of Election or Appointment: 2013 Deputy Treasurer |
| Ms. Smith also serves as an officer of other funds. She is an employee of Fidelity Investments (2009-present) and has served in other fund officer roles. Prior to joining Fidelity Investments, Ms. Smith served as Senior Audit Manager of Ernst & Young LLP (1996-2009). |
Renee Stagnone (1975) |
Year of Election or Appointment: 2013 Deputy Treasurer |
| Ms. Stagnone also serves as Deputy Treasurer of other funds. Ms. Stagnone is an employee of Fidelity Investments. |
Joseph F. Zambello (1957) |
Year of Election or Appointment: 2011 Deputy Treasurer |
| Mr. Zambello also serves as Deputy Treasurer of other funds. Mr. Zambello is an employee of Fidelity Investments. Previously, Mr. Zambello served as Vice President of FMR's Program Management Group (2009-2011) and Vice President of the Transfer Agent Oversight Group (2005-2009). |
Annual Report
Initial Class, Service Class, Service Class 2 and Investor Class designates 100% of the dividends distributed during the fiscal year as qualifying for the dividends-received deduction for corporate shareholders.
Annual Report
Board Approval of Investment Advisory Contracts and Management Fees
VIP Growth Portfolio
Each year, the Board of Trustees, including the Independent Trustees (together, the Board), votes on the renewal of the management contract and sub-advisory agreements (together, the Advisory Contracts) for the fund. The Board, assisted by the advice of fund counsel and Independent Trustees' counsel, requests and considers a broad range of information relevant to the renewal of the Advisory Contracts throughout the year.
The Board meets regularly and, at each of its meetings, covers an extensive agenda of topics and materials and considers factors that are relevant to its annual consideration of the renewal of the fund's Advisory Contracts, including the services and support provided to the fund and its shareholders. The Board has established various standing committees, each composed of and chaired by Independent Trustees with varying backgrounds, to which the Board has assigned specific subject matter responsibilities in order to enhance effective decision-making by the Board. The Board, acting directly and through its Committees, requests and receives information concerning the annual consideration of the renewal of the fund's Advisory Contracts. The Board also meets as needed to consider matters specifically related to the Board's annual consideration of the renewal of Advisory Contracts. Members of the Board may also meet with trustees of other Fidelity funds through ad hoc joint committees to discuss certain matters relevant to the Fidelity funds.
At its July 2013 meeting, the Board, including the Independent Trustees, unanimously determined to renew the fund's Advisory Contracts. In reaching its determination, the Board considered all factors it believed relevant, including (i) the nature, extent, and quality of the services to be provided to the fund and its shareholders (including the investment performance of the fund); (ii) the competitiveness of the fund's management fee and total expense ratio relative to peer funds; (iii) the total costs of the services to be provided by and the profits to be realized by Fidelity from its relationship with the fund; (iv) the extent to which economies of scale exist and would be realized as the fund grows; and (v) whether fee levels reflect these economies of scale, if any, for the benefit of fund shareholders.
In considering whether to renew the Advisory Contracts for the fund, the Board reached a determination, with the assistance of fund counsel and Independent Trustees' counsel and through the exercise of its business judgment, that the renewal of the Advisory Contracts was in the best interests of the fund and its shareholders and that the compensation payable under the Advisory Contracts was fair and reasonable. The Board's decision to renew the Advisory Contracts was not based on any single factor, but rather was based on a comprehensive consideration of all the information provided to the Board at its meetings throughout the year. The Board, in reaching its determination to renew the Advisory Contracts, was aware that shareholders in the fund have a broad range of investment choices available to them, including a wide choice among mutual funds offered by Fidelity's competitors, and that the fund's shareholders, who have the opportunity to review and weigh the disclosure provided by the fund in its prospectus and other public disclosures, have chosen to invest in this fund, which is a part of the Fidelity family of funds.
Nature, Extent, and Quality of Services Provided. The Board considered the staffing within the investment adviser, Fidelity Management & Research Company (FMR), and the sub-advisers (together, the Investment Advisers) as it relates to the fund, including the backgrounds of the fund's investment personnel, and also considered the fund's investment objective, strategies, and related investment philosophy. The Independent Trustees also had discussions with senior management of Fidelity's investment operations and investment groups. The Board considered the structure of the portfolio manager compensation program and whether this structure provides appropriate incentives to act in the best interests of the fund.
Resources Dedicated to Investment Management and Support Services. The Board and the Fund Oversight and Research Committees reviewed the general qualifications and capabilities of the Investment Advisers' investment staff, including its size, education, experience, and resources, as well as the Investment Advisers' approach to recruiting, training, managing, and compensating investment personnel. The Board noted that FMR has continued to increase the resources devoted to non-U.S. offices, including expansion of Fidelity's global investment organization. The Board also noted that Fidelity's analysts have extensive resources, tools and capabilities that allow them to conduct sophisticated quantitative and fundamental analysis, as well as credit analysis of issuers, counterparties and guarantors. Further, the Board believes that Fidelity's investment professionals have sufficient access to global information and data so as to provide competitive investment results over time, and that those professionals also have access to sophisticated tools that permit them to assess portfolio construction and risk and performance attribution characteristics continuously, as well as to transmit new information and research conclusions rapidly around the world. Additionally, in its deliberations, the Board considered the Investment Advisers' trading and risk management capabilities and resources, which are an integral part of the investment management process.
Shareholder and Administrative Services. The Board considered (i) the nature, extent, quality, and cost of advisory, administrative, and shareholder services performed by the Investment Advisers and their affiliates under the Advisory Contracts and under separate agreements covering transfer agency, pricing and bookkeeping, and securities lending services for the fund; (ii) the nature and extent of the supervision of third party service providers, principally custodians and subcustodians; and (iii) the resources devoted to, and the record of compliance with, the fund's compliance policies and procedures. The Board also reviewed the allocation of fund brokerage, including allocations to brokers affiliated with the Investment Advisers, the use of brokerage commissions to pay fund expenses, and the use of "soft" commission dollars to pay for research services.
The Board noted that the growth of fund assets over time across the complex allows Fidelity to reinvest in the development of services designed to enhance the value or convenience of the Fidelity funds as investment vehicles. These services include 24-hour access to account information and market information through telephone representatives and over the Internet, investor education materials and asset allocation tools, and the expanded availability of Fidelity Investor Centers.
Annual Report
Investment in a Large Fund Family. The Board considered the benefits to shareholders of investing in a Fidelity fund, including the benefits of investing in a fund that is part of a large family of funds offering a variety of investment disciplines and providing a large variety of mutual fund investor services. The Board noted that Fidelity had taken, or had made recommendations that resulted in the Fidelity funds taking, a number of actions over the previous year that benefited particular funds, including (i) continuing to dedicate additional resources to investment research and to the support of the senior management team that oversees asset management; (ii) persisting in efforts to enhance Fidelity's global research capabilities; (iii) launching new funds and making other enhancements to meet client needs for global and income-oriented solutions; (iv) continuing to launch dedicated lower cost underlying funds to meet portfolio construction needs related to expanding underlying fund options for Fidelity funds of funds, specifically for the Freedom Fund product lines; (v) rationalizing product lines and gaining increased efficiencies through the mergers of several funds into other funds; (vi) strengthening Fidelity's index fund offerings by reducing investment minimums and adopting or lowering existing expense caps for certain funds and classes; (vii) enhancing Global Asset Allocation product offerings by launching new funds and strategies, including "open architecture" target date funds that utilize affiliated and unaffiliated sub-advisers; (viii) modifying the eligibility criteria for Institutional Class shares of Advisor funds to increase their marketability to a portion of the defined contribution plan market; (ix) creating a new low-cost retirement share class for certain Advisor funds to appeal to large retirement plans; (x) transitioning the management of certain Fidelity commodity funds to Geode Capital Management LLC, a registered commodity pool operator, while retaining administrative responsibilities for the funds; (xi) reorganizing a number of funds; and (xii) taking steps toward establishing a new Fidelity adviser to manage sector-based funds and products.
Investment Performance. The Board considered whether the fund has operated in accordance with its investment objective, as well as its record of compliance with its investment restrictions and its performance history.
The Board took into account discussions with the Investment Advisers about fund investment performance that occur at Board meetings throughout the year. In this regard the Board noted that as part of regularly scheduled fund reviews and other reports to the Board on fund performance, the Board periodically considers annualized return information for the fund, for different time periods, measured against a securities market index ("benchmark index") and a peer group of mutual funds with similar objectives ("peer group"). In its evaluation of fund investment performance, the Board gave particular attention to information indicating changes in performance of certain Fidelity funds for specific time periods and the Investment Advisers' explanations for any overperformance or underperformance.
In addition to reviewing absolute and relative fund performance, the Independent Trustees periodically consider the appropriateness of fund performance metrics in evaluating the results achieved. In general, the Independent Trustees believe that fund performance should be evaluated based on net performance (after fees and expenses) of both the highest performing and lowest performing classes, where applicable, compared to appropriate benchmark indices, over appropriate time periods which may include full market cycles, and compared to peer groups, as applicable, over the same periods, taking into account relevant factors including the following: general market conditions; issuer-specific information; tactical opportunities for investment; and fund cash flows and other factors.
The Independent Trustees recognize that shareholders evaluate performance on a net basis over their own holding periods, for which one-, three-, and five-year periods are used as a proxy. For this reason, the performance information reviewed by the Board also included net cumulative calendar year total return information for the fund and an appropriate benchmark index and peer group for the most recent one-, three-, and five-year periods, as shown below. Returns are shown compared to the 25th percentile (top of box) and 75th percentile (bottom of box) of the peer universe.
Annual Report
Board Approval of Investment Advisory Contracts and Management Fees - continued
VIP Growth Portfolio
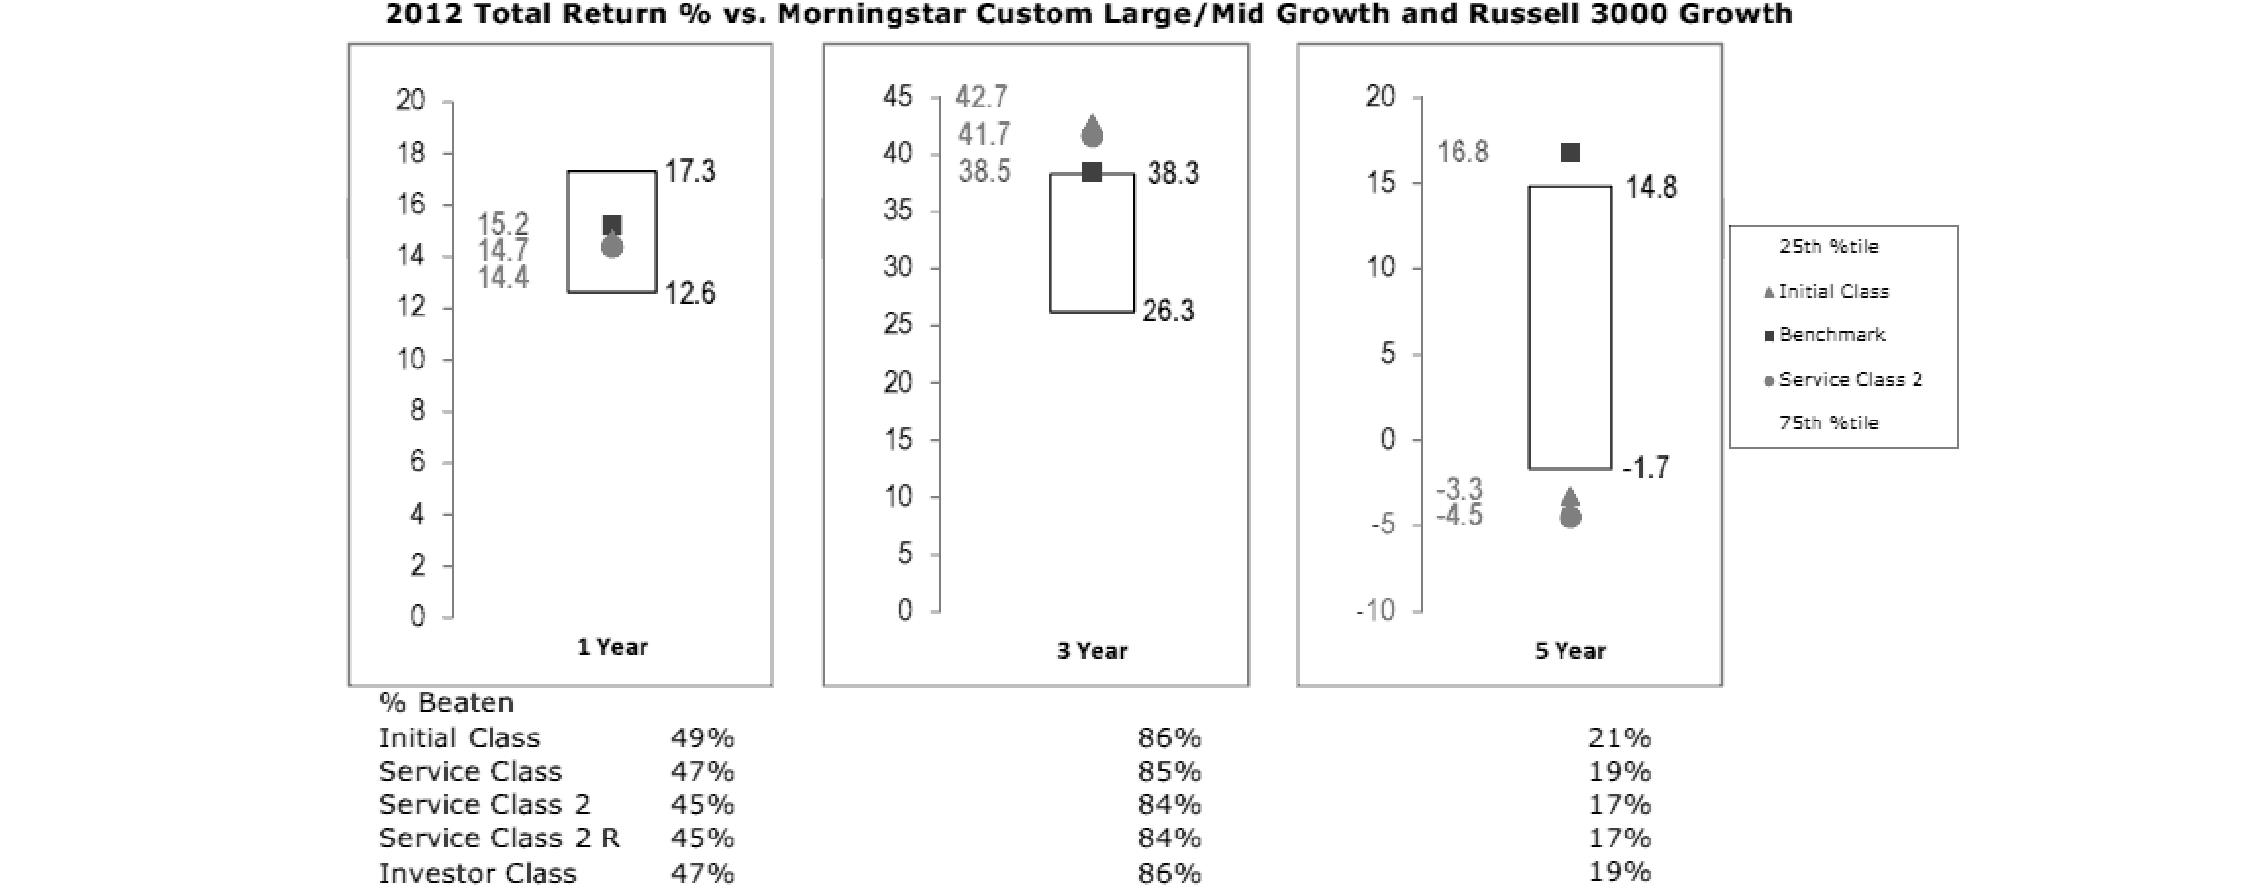
Based on its review, the Board concluded that the nature, extent, and quality of services provided to the fund under the Advisory Contracts should benefit the fund's shareholders.
Competitiveness of Management Fee and Total Expense Ratio. The Board considered the fund's management fee and total expense ratio compared to "mapped groups" of competitive funds and classes. Fidelity creates "mapped groups" by combining similar Lipper investment objective categories that have comparable management fee characteristics. Combining Lipper investment objective categories aids the Board's management fee and total expense ratio comparisons by broadening the competitive group used for comparison and by reducing the number of universes to which various Fidelity funds are compared.
Management Fee. The Board considered two proprietary management fee comparisons for the 12-month periods shown in the chart below. The group of Lipper funds used by the Board for management fee comparisons is referred to below as the "Total Mapped Group." The Total Mapped Group comparison focuses on a fund's standing in terms of gross management fees before expense reimbursements or caps relative to the total universe of funds with comparable investment mandates, regardless of whether their management fee structures also are comparable. Funds with comparable investment mandates offer exposure to similar types of securities. Funds with comparable management fee structures have similar management fee contractual arrangements (e.g., flat rate charged for advisory services, all-inclusive fee rate, etc.). "TMG %" represents the percentage of funds in the Total Mapped Group that had management fees that were lower than the fund's. For example, a TMG % of 10% means that 90% of the funds in the Total Mapped Group had higher management fees than the fund. The "Asset-Size Peer Group" (ASPG) comparison focuses on a fund's standing relative to a subset of non-Fidelity funds within the Total Mapped Group that are similar in size and management fee structure. The ASPG represents at least 15% of the funds in the Total Mapped Group with comparable asset size and management fee structures, subject to a minimum of 50 funds (or all funds in the Total Mapped Group if fewer than 50). Additional information, such as the ASPG quartile in which the fund's management fee ranked, is also included in the chart and considered by the Board.
Annual Report
VIP Growth Portfolio

The Board noted that the fund's management fee ranked below the median of its Total Mapped Group and below the median of its ASPG for 2012.
Based on its review, the Board concluded that the fund's management fee is fair and reasonable in light of the services that the fund receives and the other factors considered.
Total Expense Ratio. In its review of each class's total expense ratio, the Board considered the fund's management fee as well as other fund or class expenses, as applicable, such as transfer agent fees, pricing and bookkeeping fees, fund-paid 12b-1 fees, and custodial, legal, and audit fees. The Board also noted the effects of any waivers and reimbursements on fees and expenses. As part of its review, the Board also considered the current and historical total expense ratios of each class of the fund compared to competitive fund median expenses. Each class of the fund is compared to those funds and classes in the Total Mapped Group (used by the Board for management fee comparisons) that have a similar sales load structure.
The Board noted that the total expense ratio of each class ranked below its competitive median for 2012.
Fees Charged to Other Fidelity Clients. The Board also considered Fidelity fee structures and other information with respect to clients of FMR and its affiliates, such as other mutual funds advised or subadvised by FMR or its affiliates, pension plan clients, and other institutional clients. The Board noted the findings of the 2013 ad hoc joint committee (created with the board of other Fidelity funds), which reviewed and compared Fidelity's institutional investment advisory business with its business of providing services to the Fidelity funds, including the differences in services provided, fees charged, and costs incurred, as well as competition in their respective marketplaces.
Based on its review of total expense ratios and fees charged to other Fidelity clients, the Board concluded that the total expense ratio of each class of the fund was reasonable in light of the services that the fund and its shareholders receive and the other factors considered.
Costs of the Services and Profitability. The Board considered the revenues earned and the expenses incurred by Fidelity in conducting the business of developing, marketing, distributing, managing, administering and servicing the fund and servicing the fund's shareholders. The Board also considered the level of Fidelity's profits in respect of all the Fidelity funds.
On an annual basis, FMR presents to the Board Fidelity's profitability for the fund. Fidelity calculates the profitability for each fund, as well as aggregate profitability for groups of Fidelity funds and all Fidelity funds, using a series of detailed revenue and cost allocation methodologies which originate with the books and records of Fidelity on which Fidelity's audited financial statements are based. The Audit Committee of the Board reviews any significant changes from the prior year's methodologies.
PricewaterhouseCoopers LLP (PwC), independent registered public accounting firm and auditor to Fidelity and certain Fidelity funds, has been engaged annually by the Board as part of the Board's assessment of Fidelity's profitability analysis. PwC's engagement includes the review and assessment of the methodologies used by Fidelity in determining the revenues and expenses attributable to Fidelity's mutual fund business, and completion of agreed-upon procedures surrounding the mathematical accuracy of fund profitability and its conformity to allocation methodologies. After considering PwC's reports issued under the engagement and information provided by Fidelity, the Board concluded that while other allocation methods may also be reasonable, Fidelity's profitability methodologies are reasonable in all material respects.
Annual Report
Board Approval of Investment Advisory Contracts and Management Fees - continued
The Board also reviewed Fidelity's non-fund businesses and fall-out benefits related to the mutual fund business as well as cases where Fidelity's affiliates may benefit from or be related to the fund's business.
The Board considered the costs of the services provided by and the profits realized by Fidelity in connection with the operation of the fund and was satisfied that the profitability was not excessive in the circumstances.
Economies of Scale. The Board considered whether there have been economies of scale in respect of the management of the Fidelity funds, whether the Fidelity funds (including the fund) have appropriately benefited from any such economies of scale, and whether there is potential for realization of any further economies of scale. The Board considered the extent to which the fund will benefit from economies of scale through increased services to the fund, through waivers or reimbursements, or through fee or expense reductions. The Board also noted that in 2009, it and the board of other Fidelity funds created an ad hoc committee (the Economies of Scale Committee) to analyze whether FMR attains economies of scale in respect of the management and servicing of the Fidelity funds, whether the Fidelity funds have appropriately benefited from such economies of scale, and whether there is potential for realization of any further economies of scale.
The Board recognized that the fund's management contract incorporates a "group fee" structure, which provides for lower group fee rates as total fund assets under FMR's management increase, and for higher group fee rates as total fund assets under FMR's management decrease. FMR calculates the group fee rates based on a tiered asset "breakpoint" schedule that varies based on asset class. The Board considered that the group fee is designed to deliver the benefits of economies of scale to fund shareholders when total Fidelity fund assets increase, even if assets of any particular fund are unchanged or have declined, because some portion of Fidelity's costs are attributable to services provided to all Fidelity funds, and all funds benefit if those costs can be allocated among more assets. The Board concluded that, given the group fee structure, fund shareholders will benefit from lower management fees as assets under FMR's management increase at the fund complex level, regardless of whether Fidelity achieves any such economies of scale.
The Board concluded, taking into account the analysis of the Economies of Scale Committee, that economies of scale, if any, are being appropriately shared between fund shareholders and Fidelity.
Amendment to Description of Group Fee Rate. At its July 2013 meeting, the Board voted to approve an amendment to the fund's management contract to modify the description of the "group fee rate" effective August 1, 2013. The Board noted that under the prior description in the contract, the group fee rate was based on the average net assets of all registered investment companies with which FMR has management contracts. Under the contract's tiered asset breakpoint schedule, the group fee rate is lower as total fund assets under FMR's management increase, and higher as total fund assets under FMR's management decrease. The Board considered that the prior description would have excluded the assets of 64 Fidelity sector funds from the group fee rate calculation once Fidelity SelectCo, LLC, an affiliate of FMR, assumed management responsibilities for those funds. The Board noted that modifying the description of the group fee rate to continue to include the assets of those 64 funds for purposes of determining group fee rate breakpoints would avoid an immediate adverse impact on the group fee rate for any fund.
Additional Information Requested by the Board. In order to develop fully the factual basis for consideration of the Fidelity funds' Advisory Contracts, the Board requested and received additional information on certain topics, including: (i) fund performance trends and Fidelity's long-term strategies for certain funds; (ii) the potential to further rationalize the Fidelity fund lineup with the possibility of achieving savings for the funds and Fidelity; (iii) the methodology with respect to competitive fund data and peer group classifications; (iv) the arrangements with, and performance of, certain sub-advisers on behalf of the Fidelity funds, as well as certain proposed participating affiliate arrangements; (v) the realization of fall-out benefits in certain Fidelity business units; (vi) Fidelity's group fee structures, including the rationale for the individual fee rates of certain categories of funds and the definition of group assets; (vii) trends regarding industry use of performance fee structures and the performance adjustment methodologies applicable to the Fidelity funds; (viii) additional competitive analysis regarding the total expenses for certain classes; and (ix) fund profitability methodology, including Fidelity's cost allocation methodology, and the impact of certain factors on fund profitability results.
Based on its evaluation of all of the conclusions noted above, and after considering all factors it believed relevant, the Board ultimately concluded that the advisory fee structures are fair and reasonable, and that the fund's Advisory Contracts should be renewed.
Annual Report
Investment Adviser
Fidelity Management & Research Company
Boston, MA
Investment Sub-Advisers
FMR Co., Inc.
Fidelity Management & Research (U.K.) Inc.
Fidelity Management & Research (Hong Kong) Limited
Fidelity Management & Research (Japan) Inc.
General Distributor
Fidelity Distributors Corporation
Smithfield, RI
Transfer and Service Agents
Fidelity Investments Institutional Operations Company, Inc.
Boston, MA
Fidelity Service Company, Inc.
Boston, MA
Custodian
State Street Bank and Trust Company
Quincy, MA
VIPGRWT-ANN-0214
1.540077.116
Fidelity® Variable Insurance Products:
Growth Portfolio - Service Class 2R
Annual Report
December 31, 2013
(Fidelity Cover Art)
Contents
Performance | (Click Here) | How the fund has done over time. |
Management's Discussion of Fund Performance | (Click Here) | The Portfolio Manager's review of fund performance and strategy. |
Shareholder Expense Example | (Click Here) | An example of shareholder expenses. |
Investment Changes | (Click Here) | A summary of major shifts in the fund's investments over the past six months. |
Investments | (Click Here) | A complete list of the fund's investments with their market values. |
Financial Statements | (Click Here) | Statements of assets and liabilities, operations, and changes in net assets, as well as financial highlights. |
Notes | (Click Here) | Notes to the financial statements. |
Report of Independent Registered Public Accounting Firm | (Click Here) | |
Trustees and Officers | (Click Here) | |
Distributions | (Click Here) | |
Board Approval of Investment Advisory Contracts and Management Fees | (Click Here) | |
To view a fund's proxy voting guidelines and proxy voting record for the 12-month period ended June 30, visit http://www.fidelity.com/proxyvotingresults or visit the Securities and Exchange Commission's (SEC) web site at http://www.sec.gov. You may also call 1-877-208-0098 to request a free copy of the proxy voting guidelines.
Fidelity Variable Insurance Products are separate account options which are purchased through a variable insurance contract.
Standard & Poor's, S&P and S&P 500 are registered service marks of The McGraw-Hill Companies, Inc. and have been licensed for use by Fidelity Distributors Corporation.
Other third-party marks appearing herein are the property of their respective owners.
All other marks appearing herein are registered or unregistered trademarks or service marks of FMR LLC or an affiliated company. © 2014 FMR LLC. All rights reserved.
This report and the financial statements contained herein are submitted for the general information of the shareholders of the fund. This report is not authorized for distribution to prospective investors in the fund unless preceded or accompanied by an effective prospectus.
A fund files its complete schedule of portfolio holdings with the SEC for the first and third quarters of each fiscal year on Form N-Q. Forms N-Q are available on the SEC's web site at http://www.sec.gov. A fund's Forms N-Q may be reviewed and copied at the SEC's Public Reference Room in Washington, DC. Information regarding the operation of the SEC's Public Reference Room may be obtained by calling 1-800-SEC-0330. For a complete list of a fund's portfolio holdings, view the most recent holdings listing, semiannual report, or annual report on Fidelity's web site at http://www.fidelity.com, http://www.advisor.fidelity.com, or http://www.401k.com, as applicable.
NOT FDIC INSURED • MAY LOSE VALUE • NO BANK GUARANTEE
Neither the fund nor Fidelity Distributors Corporation is a bank.
Annual Report
Average annual total return reflects the change in the value of an investment, assuming reinvestment of the class' distributions from dividend income and capital gains (the profits earned upon the sale of securities that have grown in value, if any) and assuming a constant rate of performance each year. During periods of reimbursement by Fidelity, a fund's total return will be greater than it would be had the reimbursement not occurred. Performance numbers are net of all underlying fund operating expenses, but do not include any insurance charges imposed by your insurance company's separate account. If performance information included the effect of these additional charges, the total returns would have been lower. How a fund did yesterday is no guarantee of how it will do tomorrow.
Average Annual Total Returns
Periods ended December 31, 2013 | Past 1
year | Past 5
years | Past 10
years |
VIP Growth Portfolio - Service Class 2R | 35.97% | 19.78% | 6.67% |
$10,000 Over 10 Years
Let's say hypothetically that $10,000 was invested in VIP Growth Portfolio - Service Class 2R on December 31, 2003. The chart shows how the value of your investment would have changed, and also shows how the Russell 3000® Growth Index performed over the same period.
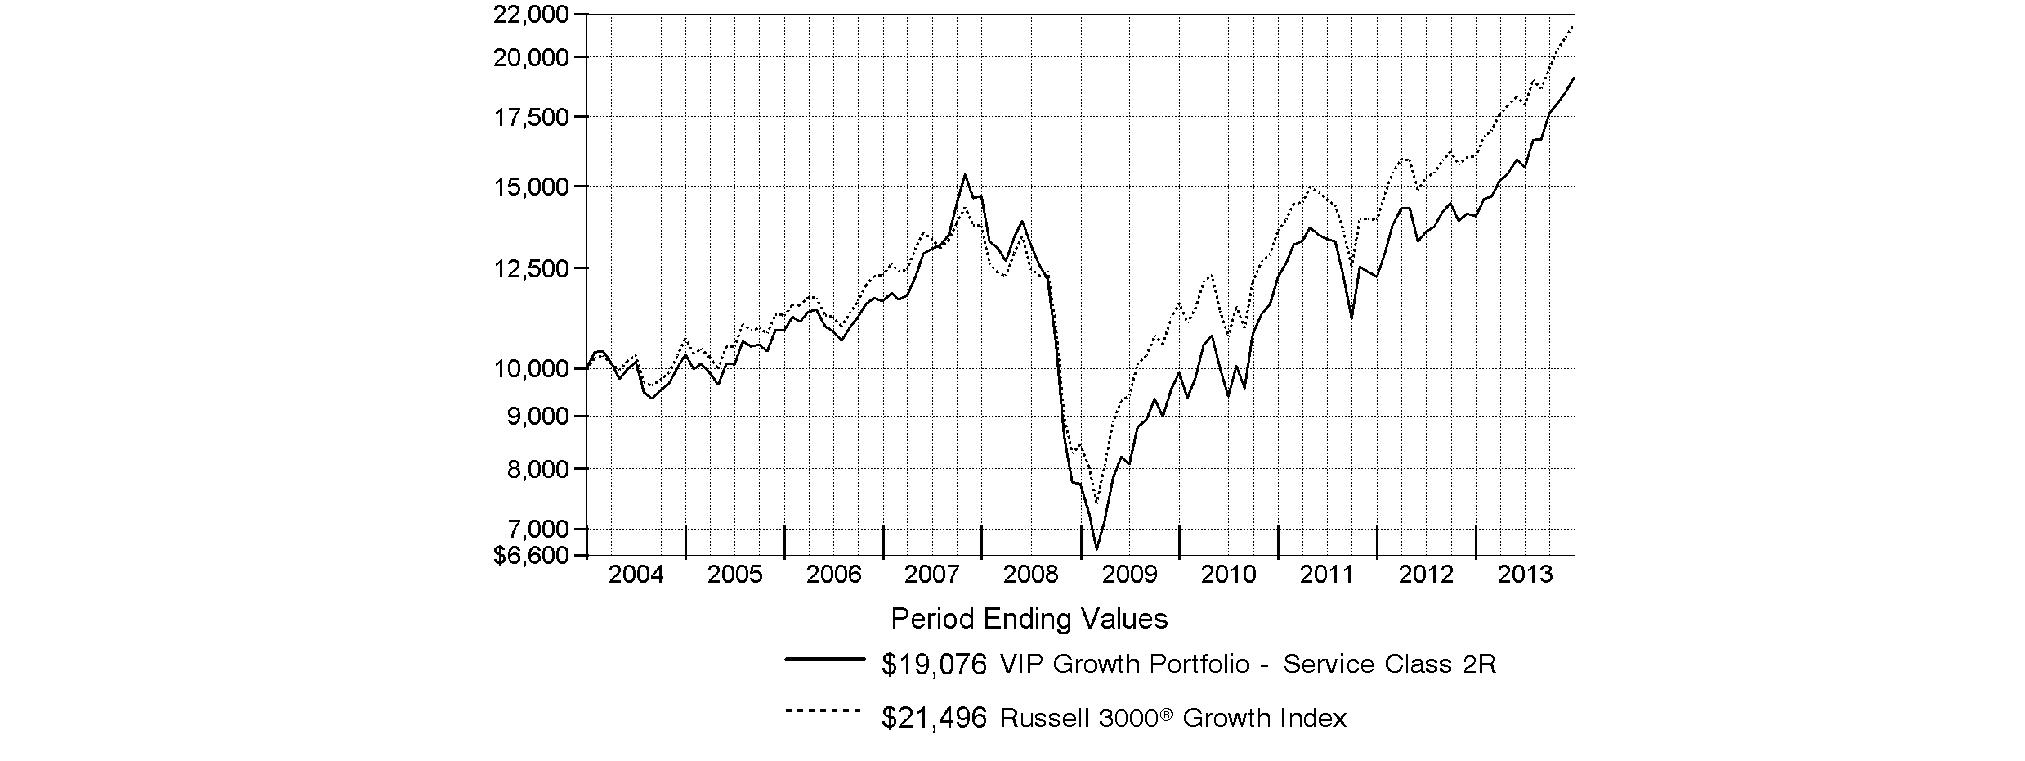
Annual Report
Market Recap: Global equity markets remained upbeat for the 12 months ending December 31, 2013, propelling the MSCI® ACWI® (All Country World Index) Index to a 23.24% return. Midyear turbulence gave way by autumn when policymakers in the U.S. and China had made clear their intentions to maintain accommodative monetary policies. That stance, combined with modest cyclical improvement around the globe and generally low valuations, underpinned the broad rally in equities, although the relative strength of the U.S. dollar generally tempered gains for U.S. investors holding foreign securities based in local currencies. During the period, the broad-market S&P 500® Index set a series of new highs, finishing the year up 32.39%. For the first time since 1995, the S&P® scored a "perfect 10," with all 10 economic sectors gaining at least 10% for the year. A resurgence in growth-oriented stocks lifted the Nasdaq Composite Index® to a 40.12% result for 2013, while the blue-chip Dow Jones Industrial AverageSM notched a relatively more modest 29.65% gain. International developed-markets equities rose in concert with their U.S. counterparts, with the MSCI® EAFE® Index gaining 22.92% for the period. Meanwhile, foreign exchange and commodity weakness curbed results in resource-heavy emerging markets (EM), especially in the year's waning months. More generally, concern over EM's slowing growth, its declining share of global trade and uncertainty surrounding U.S. central bank intentions were all factors hampering performance. The MSCI Emerging Markets Index returned -2.27% for the period. On the bond side, U.S. high-yield securities rallied with equities for much of the period, with The BofA Merrill LynchSM US High Yield Constrained Index returning 7.41% for 2013. The more rate-sensitive U.S. investment-grade bond category faced headwinds though, as reflected in the -2.02% return of the Barclays® U.S. Aggregate Bond Index. Within the Barclays index, investment-grade corporate credit returned -2.01%, while ultra-safe U.S. Treasuries saw a -2.75% result. Major non-U.S. developed markets performed only slightly better, with the Citigroup® Non-USD Group-of-Seven (G7) Equal Weighted Index logging a -1.59% result. After several years of strong advances, EM debt reversed course in 2013, with the J.P. Morgan Emerging Markets Bond Index Global returning -6.58%.
Comments from Jason Weiner, Portfolio Manager of VIP Growth Portfolio: For the year, the fund's share classes solidly outpaced the 34.23% gain of the Russell 3000® Growth Index. (For specific portfolio results, please refer to the performance section of this shareholder report). The fund's biggest relative contributor during the past year was social networking firm Facebook. The stock popped in July after the firm announced better-than-expected earnings and an explosion in mobile use and mobile revenue. I nearly doubled the fund's position here during the period. Tesla Motors was another big contributor this period. In May, the automaker received rave reviews for its first electric luxury vehicle, the Model S, and shares catapulted higher. Subsequently, the firm ramped up production to meet growing demand, which helped it move into profitability. The stock hiccuped over a string of car battery fires and a battery supply shortage later on in the period, and the fund ended the period with a reduced overweighting. Lastly, shares of Green Mountain Coffee Roasters, the maker of Keurig® single-cup coffee systems, rose sharply during the period on positive financial results and jumped higher in May when management announced the company would expand and extend its manufacturing agreement with coffee giant Starbucks. On the flip side, Apple was by far the fund's biggest relative detractor. The tech giant struggled amid mounting competition in the smartphone industry - particularly from South Korea-based Samsung Electronics - and its lack of innovation during the period hurt the stock. Given these factors, we substantially reduced our position in Apple, a major index component, ending the period with an underweighting. An overweighting in Broadcom, on average, was another miss. The company produces baseband chips that provide Internet connectivity to Apple's iPhone® smartphones and iPad® tablets, as well as some of Samsung Electronics' GalaxyTM mobile devices. The stock lagged for most of the period, however, as the firm faced intensifying competition and setbacks in releasing new baseband chips. Shares plummeted in July and August after the company issued a lower-than-expected revenue forecast amid slowing smartphone sales. I sold Broadcom prior to period end.
The views expressed above reflect those of the portfolio manager(s) only through the end of the period as stated on the cover of this report and do not necessarily represent the views of Fidelity or any other person in the Fidelity organization. Any such views are subject to change at any time based upon market or other conditions and Fidelity disclaims any responsibility to update such views. These views may not be relied on as investment advice and, because investment decisions for a Fidelity fund are based on numerous factors, may not be relied on as an indication of trading intent on behalf of any Fidelity fund.
Annual Report
As a shareholder of the Fund, you incur two types of costs: (1) transaction costs, including redemption fees and (2) ongoing costs, including management fees, distribution and/or service (12b-1) fees and other Fund expenses. This Example is intended to help you understand your ongoing costs (in dollars) of investing in the Fund and to compare these costs with the ongoing costs of investing in other mutual funds.
The Example is based on an investment of $1,000 invested at the beginning of the period and held for the entire period (July 1, 2013 to December 31, 2013).
Actual Expenses
The first line of the accompanying table for each class of the Fund provides information about actual account values and actual expenses. You may use the information in this line, together with the amount you invested, to estimate the expenses that you paid over the period. Simply divide your account value by $1,000.00 (for example, an $8,600 account value divided by $1,000.00 = 8.6), then multiply the result by the number in the first line for a class of the Fund under the heading entitled "Expenses Paid During Period" to estimate the expenses you paid on your account during this period. The estimate of expenses does not include any fees or other expenses of any variable annuity or variable life insurance product. If they were, the estimate of expenses you paid during the period would be higher, and your ending account value would be lower. In addition, the Fund, as a shareholder in the underlying Fidelity Central Funds, will indirectly bear its pro-rata share of the fees and expenses incurred by the underlying Fidelity Central Funds. These fees and expenses are not included in the Fund's annualized expense ratio used to calculate the expense estimate in the table below.
Hypothetical Example for Comparison Purposes
The second line of the accompanying table for each class of the Fund provides information about hypothetical account values and hypothetical expenses based on a Class' actual expense ratio and an assumed rate of return of 5% per year before expenses, which is not the Class' actual return. The hypothetical account values and expenses may not be used to estimate the actual ending account balance or expenses you paid for the period. You may use this information to compare the ongoing costs of investing in the Fund and other funds. To do so, compare this 5% hypothetical example with the 5% hypothetical examples that appear in the shareholder reports of the other funds. The estimate of expenses does not include any fees or other expenses of any variable annuity or variable life insurance product. If they were, the estimate of expenses you paid during the period would be higher, and your ending account value would be lower. In addition, the Fund, as a shareholder in the underlying Fidelity Central Funds, will indirectly bear its pro-rata share of the fees and expenses incurred by the underlying Fidelity Central Funds. These fees and expenses are not included in the Fund's annualized expense ratio used to calculate the expense estimate in the table below.
Please note that the expenses shown in the table are meant to highlight your ongoing costs only and do not reflect any transaction costs. Therefore, the second line of the table is useful in comparing ongoing costs only, and will not help you determine the relative total costs of owning different funds. In addition, if these transactional costs were included, your costs would have been higher.
| Annualized
Expense Ratio B | Beginning
Account Value
July 1, 2013 | Ending
Account Value
December 31, 2013 | Expenses Paid
During Period*
July 1, 2013
to December 31, 2013 |
Initial Class | .65% | | | |
Actual | | $ 1,000.00 | $ 1,220.30 | $ 3.64 |
HypotheticalA | | $ 1,000.00 | $ 1,021.93 | $ 3.31 |
Service Class | .75% | | | |
Actual | | $ 1,000.00 | $ 1,219.60 | $ 4.20 |
HypotheticalA | | $ 1,000.00 | $ 1,021.42 | $ 3.82 |
Service Class 2 | .90% | | | |
Actual | | $ 1,000.00 | $ 1,218.60 | $ 5.03 |
HypotheticalA | | $ 1,000.00 | $ 1,020.67 | $ 4.58 |
Service Class 2R | .90% | | | |
Actual | | $ 1,000.00 | $ 1,218.60 | $ 5.03 |
HypotheticalA | | $ 1,000.00 | $ 1,020.67 | $ 4.58 |
Investor Class | .73% | | | |
Actual | | $ 1,000.00 | $ 1,219.70 | $ 4.08 |
HypotheticalA | | $ 1,000.00 | $ 1,021.53 | $ 3.72 |
A 5% return per year before expenses
B Annualized expense ratio reflects expenses net of applicable fee waivers.
* Expenses are equal to each Class' annualized expense ratio, multiplied by the average account value over the period, multiplied by 184/365 (to reflect the one-half year period).
Annual Report
Investment Changes (Unaudited)
Top Ten Stocks as of December 31, 2013 |
| % of fund's
net assets | % of fund's net assets
6 months ago |
Facebook, Inc. Class A | 6.6 | 2.3 |
Google, Inc. Class A | 4.3 | 3.1 |
Microsoft Corp. | 3.1 | 0.0 |
Harley-Davidson, Inc. | 3.0 | 2.7 |
Apple, Inc. | 2.5 | 2.8 |
Green Mountain Coffee Roasters, Inc. | 2.5 | 2.5 |
Home Depot, Inc. | 2.5 | 3.2 |
QUALCOMM, Inc. | 2.3 | 1.4 |
Visa, Inc. Class A | 1.9 | 2.3 |
Amazon.com, Inc. | 1.9 | 1.5 |
| 30.6 | |
Top Five Market Sectors as of December 31, 2013 |
| % of fund's
net assets | % of fund's net assets
6 months ago |
Information Technology | 29.1 | 26.5 |
Consumer Discretionary | 19.6 | 21.9 |
Health Care | 17.0 | 16.6 |
Consumer Staples | 9.3 | 10.2 |
Industrials | 7.8 | 7.2 |
Asset Allocation (% of fund's net assets) |
As of December 31, 2013* | As of June 30, 2013** |
| Stocks 99.1% | | | Stocks 98.8% | |
| Short-Term
Investments and
Net Other Assets
(Liabilities) 0.9% | | | Short-Term
Investments and
Net Other Assets
(Liabilities) 1.2% | |
* Foreign investments | 12.6% | | ** Foreign investments | 11.1% | |

Annual Report
Investments December 31, 2013
Showing Percentage of Net Assets
Common Stocks - 99.0% |
| Shares | | Value |
CONSUMER DISCRETIONARY - 19.5% |
Automobiles - 3.5% |
Harley-Davidson, Inc. | 1,987,852 | | $ 137,638,872 |
Tesla Motors, Inc. (a) | 162,739 | | 24,472,691 |
| | 162,111,563 |
Diversified Consumer Services - 1.3% |
Anhanguera Educacional Participacoes SA | 2,640,000 | | 16,823,153 |
H&R Block, Inc. | 408,760 | | 11,870,390 |
Kroton Educacional SA | 1,850,100 | | 31,064,381 |
| | 59,757,924 |
Hotels, Restaurants & Leisure - 3.8% |
China Lodging Group Ltd. ADR (a) | 27,000 | | 822,420 |
Chipotle Mexican Grill, Inc. (a) | 34,394 | | 18,324,435 |
Dunkin' Brands Group, Inc. | 582,595 | | 28,081,079 |
Las Vegas Sands Corp. | 128,000 | | 10,095,360 |
Starbucks Corp. | 989,073 | | 77,533,432 |
Yum! Brands, Inc. | 577,384 | | 43,656,004 |
| | 178,512,730 |
Household Durables - 0.6% |
Mohawk Industries, Inc. (a) | 172,755 | | 25,723,220 |
Internet & Catalog Retail - 2.3% |
Amazon.com, Inc. (a) | 212,488 | | 84,738,090 |
TripAdvisor, Inc. (a) | 235,653 | | 19,519,138 |
| | 104,257,228 |
Leisure Equipment & Products - 0.0% |
NJOY, Inc. (a)(e) | 243,618 | | 1,968,433 |
Media - 0.8% |
Comcast Corp. Class A (special) (non-vtg.) | 712,919 | | 35,560,400 |
Specialty Retail - 5.4% |
CarMax, Inc. (a) | 465,400 | | 21,883,108 |
Five Below, Inc. (a) | 165,200 | | 7,136,640 |
GNC Holdings, Inc. | 560,137 | | 32,740,008 |
Home Depot, Inc. | 1,406,132 | | 115,780,909 |
TJX Companies, Inc. | 338,830 | | 21,593,636 |
Ulta Salon, Cosmetics & Fragrance, Inc. (a) | 246,594 | | 23,801,253 |
Urban Outfitters, Inc. (a) | 786,300 | | 29,171,730 |
| | 252,107,284 |
Textiles, Apparel & Luxury Goods - 1.8% |
ECLAT Textile Co. Ltd. | 1,342,740 | | 15,123,632 |
Michael Kors Holdings Ltd. (a) | 318,503 | | 25,859,259 |
NIKE, Inc. Class B | 544,776 | | 42,841,185 |
| | 83,824,076 |
TOTAL CONSUMER DISCRETIONARY | | 903,822,858 |
|
| Shares | | Value |
CONSUMER STAPLES - 9.3% |
Beverages - 1.2% |
Monster Beverage Corp. (a) | 138,607 | | $ 9,393,396 |
SABMiller PLC | 485,142 | | 24,912,531 |
The Coca-Cola Co. | 550,438 | | 22,738,594 |
| | 57,044,521 |
Food & Staples Retailing - 1.2% |
Costco Wholesale Corp. | 216,700 | | 25,789,467 |
Sprouts Farmers Market LLC | 62,695 | | 2,409,369 |
Whole Foods Market, Inc. | 423,066 | | 24,465,907 |
| | 52,664,743 |
Food Products - 3.8% |
Annie's, Inc. (a)(d) | 139,453 | | 6,002,057 |
Green Mountain Coffee Roasters, Inc. (d) | 1,541,237 | | 116,486,692 |
Mead Johnson Nutrition Co. Class A | 52,186 | | 4,371,099 |
The Hershey Co. | 494,044 | | 48,035,898 |
| | 174,895,746 |
Household Products - 1.8% |
Procter & Gamble Co. | 1,036,123 | | 84,350,773 |
Personal Products - 1.3% |
Herbalife Ltd. | 705,155 | | 55,495,699 |
Inter Parfums, Inc. | 151,377 | | 5,420,810 |
| | 60,916,509 |
TOTAL CONSUMER STAPLES | | 429,872,292 |
ENERGY - 3.4% |
Energy Equipment & Services - 2.0% |
Cameron International Corp. (a) | 178,171 | | 10,606,520 |
Dril-Quip, Inc. (a) | 207,312 | | 22,789,808 |
National Oilwell Varco, Inc. | 111,436 | | 8,862,505 |
Oceaneering International, Inc. | 356,174 | | 28,095,005 |
Pason Systems, Inc. | 76,100 | | 1,646,296 |
RigNet, Inc. (a) | 420,094 | | 20,135,105 |
| | 92,135,239 |
Oil, Gas & Consumable Fuels - 1.4% |
Bonanza Creek Energy, Inc. (a) | 462,234 | | 20,093,312 |
Continental Resources, Inc. (a) | 120,564 | | 13,565,861 |
Noble Energy, Inc. | 190,800 | | 12,995,388 |
Pioneer Natural Resources Co. | 107,598 | | 19,805,564 |
| | 66,460,125 |
TOTAL ENERGY | | 158,595,364 |
FINANCIALS - 7.1% |
Capital Markets - 4.1% |
BlackRock, Inc. Class A | 94,306 | | 29,845,020 |
E*TRADE Financial Corp. (a) | 1,352,486 | | 26,562,825 |
Harvest Capital Credit Corp. | 161,500 | | 2,425,730 |
Invesco Ltd. | 1,361,593 | | 49,561,985 |
KKR & Co. LP | 570,400 | | 13,883,536 |
Common Stocks - continued |
| Shares | | Value |
FINANCIALS - continued |
Capital Markets - continued |
Legg Mason, Inc. | 396,642 | | $ 17,245,994 |
The Blackstone Group LP | 1,390,898 | | 43,813,287 |
Virtus Investment Partners, Inc. (a) | 32,000 | | 6,401,600 |
| | 189,739,977 |
Commercial Banks - 1.0% |
First Republic Bank | 176,800 | | 9,255,480 |
HDFC Bank Ltd. sponsored ADR | 1,061,349 | | 36,552,860 |
| | 45,808,340 |
Consumer Finance - 0.7% |
American Express Co. | 282,793 | | 25,657,809 |
Mahindra & Mahindra Financial Services Ltd. | 594,639 | | 3,083,295 |
Shriram Transport Finance Co. Ltd. | 478,307 | | 5,202,285 |
| | 33,943,389 |
Diversified Financial Services - 0.9% |
Berkshire Hathaway, Inc. Class B (a) | 95,200 | | 11,286,912 |
McGraw-Hill Companies, Inc. | 353,613 | | 27,652,537 |
| | 38,939,449 |
Real Estate Management & Development - 0.4% |
Leopalace21 Corp. (a) | 320,900 | | 1,700,153 |
Realogy Holdings Corp. (a) | 375,301 | | 18,566,140 |
| | 20,266,293 |
TOTAL FINANCIALS | | 328,697,448 |
HEALTH CARE - 17.0% |
Biotechnology - 8.9% |
Actelion Ltd. | 72,344 | | 6,110,779 |
Alexion Pharmaceuticals, Inc. (a) | 178,625 | | 23,767,843 |
Amgen, Inc. | 244,457 | | 27,907,211 |
Biogen Idec, Inc. (a) | 233,205 | | 65,239,099 |
BioMarin Pharmaceutical, Inc. (a) | 568,225 | | 39,929,171 |
Cytokinetics, Inc. warrants 6/25/17 (a) | 1,084,980 | | 159,286 |
Enanta Pharmaceuticals, Inc. | 375,307 | | 10,238,375 |
Gentium SpA sponsored ADR (a) | 245,125 | | 13,996,638 |
Gilead Sciences, Inc. (a) | 972,461 | | 73,080,444 |
Insmed, Inc. (a) | 1,229,502 | | 20,913,829 |
Kamada (a) | 1,056,917 | | 15,716,356 |
Ophthotech Corp. | 115,239 | | 3,727,982 |
Regeneron Pharmaceuticals, Inc. (a) | 77,041 | | 21,204,765 |
Swedish Orphan Biovitrum AB (a) | 1,582,148 | | 16,419,596 |
Theravance, Inc. (a)(d) | 1,314,546 | | 46,863,565 |
United Therapeutics Corp. (a) | 154,970 | | 17,524,008 |
Vanda Pharmaceuticals, Inc. (a)(d) | 865,010 | | 10,734,774 |
| | 413,533,721 |
Health Care Equipment & Supplies - 0.7% |
AxoGen, Inc. (a) | 323,300 | | 1,451,617 |
GI Dynamics, Inc. CDI (a) | 704,680 | | 471,907 |
|
| Shares | | Value |
Intuitive Surgical, Inc. (a) | 12,000 | | $ 4,608,960 |
The Cooper Companies, Inc. | 190,400 | | 23,579,136 |
| | 30,111,620 |
Health Care Providers & Services - 1.3% |
Apollo Hospitals Enterprise Ltd. | 483,176 | | 7,394,530 |
Express Scripts Holding Co. (a) | 594,204 | | 41,736,889 |
Qualicorp SA (a) | 992,800 | | 9,553,478 |
| | 58,684,897 |
Health Care Technology - 0.3% |
Cerner Corp. (a) | 269,056 | | 14,997,181 |
Life Sciences Tools & Services - 0.9% |
Illumina, Inc. (a) | 374,901 | | 41,471,549 |
Pharmaceuticals - 4.9% |
AbbVie, Inc. | 1,072,547 | | 56,641,207 |
Actavis PLC (a) | 310,118 | | 52,099,824 |
Cadence Pharmaceuticals, Inc. (a) | 933,722 | | 8,450,184 |
Novo Nordisk A/S Series B | 135,840 | | 24,906,964 |
Pacira Pharmaceuticals, Inc. (a) | 342,086 | | 19,666,524 |
Perrigo Co. PLC | 163,077 | | 25,025,796 |
Valeant Pharmaceuticals International, Inc. (Canada) (a) | 355,295 | | 41,682,149 |
| | 228,472,648 |
TOTAL HEALTH CARE | | 787,271,616 |
INDUSTRIALS - 7.8% |
Aerospace & Defense - 2.2% |
TransDigm Group, Inc. | 219,996 | | 35,423,756 |
United Technologies Corp. | 606,569 | | 69,027,552 |
| | 104,451,308 |
Airlines - 0.1% |
Ryanair Holdings PLC sponsored ADR | 149,082 | | 6,996,418 |
Building Products - 0.3% |
A.O. Smith Corp. | 273,618 | | 14,758,955 |
Commercial Services & Supplies - 0.1% |
KAR Auction Services, Inc. | 163,200 | | 4,822,560 |
Construction & Engineering - 0.2% |
Jacobs Engineering Group, Inc. (a) | 75,594 | | 4,761,666 |
MasTec, Inc. (a) | 76,200 | | 2,493,264 |
| | 7,254,930 |
Electrical Equipment - 1.7% |
AMETEK, Inc. | 442,500 | | 23,306,475 |
Generac Holdings, Inc. | 420,100 | | 23,794,464 |
Power Solutions International, Inc. (a) | 70,043 | | 5,260,229 |
Roper Industries, Inc. | 176,017 | | 24,410,038 |
| | 76,771,206 |
Industrial Conglomerates - 1.5% |
Danaher Corp. | 907,226 | | 70,037,847 |
Machinery - 0.9% |
Graco, Inc. | 52,262 | | 4,082,707 |
Haitian International Holdings Ltd. | 266,000 | | 600,998 |
Common Stocks - continued |
| Shares | | Value |
INDUSTRIALS - continued |
Machinery - continued |
Manitowoc Co., Inc. | 1,301,305 | | $ 30,346,433 |
Weg SA | 370,900 | | 4,942,782 |
| | 39,972,920 |
Professional Services - 0.8% |
Equifax, Inc. | 150,887 | | 10,424,783 |
Verisk Analytics, Inc. (a) | 419,304 | | 27,556,659 |
| | 37,981,442 |
TOTAL INDUSTRIALS | | 363,047,586 |
INFORMATION TECHNOLOGY - 29.1% |
Communications Equipment - 2.3% |
QUALCOMM, Inc. | 1,422,786 | | 105,641,861 |
Computers & Peripherals - 2.5% |
Apple, Inc. | 208,581 | | 117,036,885 |
Electronic Equipment & Components - 0.6% |
National Instruments Corp. | 71,200 | | 2,279,824 |
TE Connectivity Ltd. | 474,800 | | 26,166,228 |
| | 28,446,052 |
Internet Software & Services - 13.8% |
Cornerstone OnDemand, Inc. (a) | 257,965 | | 13,759,853 |
CoStar Group, Inc. (a) | 105,099 | | 19,399,173 |
Facebook, Inc. Class A (a) | 5,634,609 | | 307,987,727 |
Google, Inc. Class A (a) | 178,731 | | 200,305,619 |
LinkedIn Corp. (a) | 50,129 | | 10,869,471 |
MercadoLibre, Inc. (d) | 22,290 | | 2,402,639 |
Naver Corp. | 20,397 | | 13,987,944 |
SPS Commerce, Inc. (a) | 251,729 | | 16,437,904 |
Textura Corp. | 341,122 | | 10,213,193 |
Twitter, Inc. (d) | 34,600 | | 2,202,290 |
Xoom Corp. | 73,430 | | 2,009,779 |
Yahoo!, Inc. (a) | 995,888 | | 40,273,711 |
| | 639,849,303 |
IT Services - 2.1% |
Gartner, Inc. Class A (a) | 152,922 | | 10,865,108 |
Visa, Inc. Class A | 390,368 | | 86,927,146 |
| | 97,792,254 |
Software - 7.8% |
ANSYS, Inc. (a) | 5,410 | | 471,752 |
Computer Modelling Group Ltd. | 557,800 | | 13,973,225 |
Diligent Board Member Services, Inc. (a) | 630,921 | | 1,971,704 |
Electronic Arts, Inc. (a) | 1,021,221 | | 23,426,810 |
FireEye, Inc. | 647,141 | | 28,221,819 |
FleetMatics Group PLC (a) | 165,050 | | 7,138,413 |
|
| Shares | | Value |
Microsoft Corp. | 3,810,100 | | $ 142,612,043 |
salesforce.com, Inc. (a) | 1,468,462 | | 81,044,418 |
ServiceNow, Inc. (a) | 109,600 | | 6,138,696 |
SolarWinds, Inc. (a) | 138,207 | | 5,228,371 |
Solera Holdings, Inc. | 80,800 | | 5,717,408 |
SS&C Technologies Holdings, Inc. (a) | 798,844 | | 35,356,835 |
Tableau Software, Inc. | 104,200 | | 7,182,506 |
Workday, Inc. Class A (a) | 62,800 | | 5,222,448 |
| | 363,706,448 |
TOTAL INFORMATION TECHNOLOGY | | 1,352,472,803 |
MATERIALS - 4.3% |
Chemicals - 2.3% |
FMC Corp. | 379,605 | | 28,644,993 |
LyondellBasell Industries NV Class A | 184,027 | | 14,773,688 |
Monsanto Co. | 281,849 | | 32,849,501 |
Sherwin-Williams Co. | 161,260 | | 29,591,210 |
| | 105,859,392 |
Construction Materials - 2.0% |
Eagle Materials, Inc. | 606,269 | | 46,943,409 |
James Hardie Industries PLC sponsored ADR | 212,000 | | 12,162,440 |
Vulcan Materials Co. | 611,846 | | 36,355,889 |
| | 95,461,738 |
TOTAL MATERIALS | | 201,321,130 |
TELECOMMUNICATION SERVICES - 0.8% |
Diversified Telecommunication Services - 0.4% |
8x8, Inc. (a) | 1,959,586 | | 19,909,394 |
Wireless Telecommunication Services - 0.4% |
SBA Communications Corp. Class A (a) | 200,397 | | 18,003,666 |
TOTAL TELECOMMUNICATION SERVICES | | 37,913,060 |
UTILITIES - 0.7% |
Electric Utilities - 0.7% |
ITC Holdings Corp. | 355,479 | | 34,061,998 |
TOTAL COMMON STOCKS (Cost $3,158,759,035) |
4,597,076,155
|
Convertible Preferred Stocks - 0.1% |
| | | |
CONSUMER DISCRETIONARY - 0.1% |
Household Durables - 0.1% |
Blu Homes, Inc. Series A, 5.00% (e) (Cost $4,848,302) | 1,049,416 | |
4,848,302
|
Money Market Funds - 1.8% |
| Shares | | Value |
Fidelity Cash Central Fund, 0.11% (b) | 46,557,522 | | $ 46,557,522 |
Fidelity Securities Lending Cash Central Fund, 0.11% (b)(c) | 36,082,850 | | 36,082,850 |
TOTAL MONEY MARKET FUNDS (Cost $82,640,372) |
82,640,372
|
TOTAL INVESTMENT PORTFOLIO - 100.9% (Cost $3,246,247,709) | | 4,684,564,829 |
NET OTHER ASSETS (LIABILITIES) - (0.9)% | | (41,775,265) |
NET ASSETS - 100% | $ 4,642,789,564 |
Legend |
(a) Non-income producing |
(b) Affiliated fund that is generally available only to investment companies and other accounts managed by Fidelity Investments. The rate quoted is the annualized seven-day yield of the fund at period end. A complete unaudited listing of the fund's holdings as of its most recent quarter end is available upon request. In addition, each Fidelity Central Fund's financial statements, which are not covered by the Fund's Report of Independent Registered Public Accounting Firm, are available on the SEC's website or upon request. |
(c) Investment made with cash collateral received from securities on loan. |
(d) Security or a portion of the security is on loan at period end. |
(e) Restricted securities - Investment in securities not registered under the Securities Act of 1933 (excluding 144A issues). At the end of the period, the value of restricted securities (excluding 144A issues) amounted to $6,816,735 or 0.1% of net assets. |
Additional information on each restricted holding is as follows: |
Security | Acquisition Date | Acquisition Cost |
Blu Homes, Inc. Series A, 5.00% | 6/21/13 | $ 4,848,302 |
NJOY, Inc. | 9/11/13 | $ 1,968,433 |
Affiliated Central Funds |
Information regarding fiscal year to date income earned by the Fund from investments in Fidelity Central Funds is as follows: |
Fund | Income earned |
Fidelity Cash Central Fund | $ 88,966 |
Fidelity Securities Lending Cash Central Fund | 401,092 |
Total | $ 490,058 |
Other Information |
The following is a summary of the inputs used, as of December 31, 2013, involving the Fund's assets and liabilities carried at fair value. The inputs or methodology used for valuing securities may not be an indication of the risk associated with investing in those securities. For more information on valuation inputs, and their aggregation into the levels used in the tables below, please refer to the Investment Valuation section in the accompanying Notes to Financial Statements. |
Valuation Inputs at Reporting Date: |
Description | Total | Level 1 | Level 2 | Level 3 |
Investments in Securities: | | | | |
Equities: | | | | |
Consumer Discretionary | $ 908,671,160 | $ 853,966,891 | $ 47,887,534 | $ 6,816,735 |
Consumer Staples | 429,872,292 | 429,872,292 | - | - |
Energy | 158,595,364 | 158,595,364 | - | - |
Financials | 328,697,448 | 326,997,295 | 1,700,153 | - |
Health Care | 787,271,616 | 752,651,888 | 34,619,728 | - |
Industrials | 363,047,586 | 358,104,804 | 4,942,782 | - |
Information Technology | 1,352,472,803 | 1,352,472,803 | - | - |
Materials | 201,321,130 | 201,321,130 | - | - |
Telecommunication Services | 37,913,060 | 37,913,060 | - | - |
Utilities | 34,061,998 | 34,061,998 | - | - |
Money Market Funds | 82,640,372 | 82,640,372 | - | - |
Total Investments in Securities: | $ 4,684,564,829 | $ 4,588,597,897 | $ 89,150,197 | $ 6,816,735 |
The following is a summary of transfers between Level 1 and Level 2 for the period ended December 31, 2013. Transfers are assumed to have occurred at the beginning of the period, and are primarily attributable to the valuation techniques used for foreign equity securities, as discussed in the accompanying Notes to Financial Statements: |
Transfers | Total |
Level 1 to Level 2 | $ 0 |
Level 2 to Level 1 | $ 53,945,723 |
Distribution of investments by country or territory of incorporation, as a percentage of total net assets, is as follows (Unaudited): |
United States of America | 87.4% |
Ireland | 2.2% |
Brazil | 1.4% |
Canada | 1.3% |
Cayman Islands | 1.2% |
India | 1.2% |
Bermuda | 1.1% |
Others (Individually Less Than 1%) | 4.2% |
| 100.0% |
See accompanying notes which are an integral part of the financial statements.
Annual Report
Statement of Assets and Liabilities
| December 31, 2013 |
| | |
Assets | | |
Investment in securities, at value (including securities loaned of $35,539,956) - See accompanying schedule: Unaffiliated issuers (cost $3,163,607,337) | $ 4,601,924,457 | |
Fidelity Central Funds (cost $82,640,372) | 82,640,372 | |
Total Investments (cost $3,246,247,709) | | $ 4,684,564,829 |
Receivable for fund shares sold | | 802,040 |
Dividends receivable | | 722,625 |
Distributions receivable from Fidelity Central Funds | | 14,631 |
Prepaid expenses | | 9,979 |
Other receivables | | 255,386 |
Total assets | | 4,686,369,490 |
| | |
Liabilities | | |
Payable for investments purchased | $ 1,896,929 | |
Payable for fund shares redeemed | 2,689,656 | |
Accrued management fee | 2,087,460 | |
Distribution and service plan fees payable | 194,872 | |
Other affiliated payables | 355,173 | |
Other payables and accrued expenses | 272,986 | |
Collateral on securities loaned, at value | 36,082,850 | |
Total liabilities | | 43,579,926 |
| | |
Net Assets | | $ 4,642,789,564 |
Net Assets consist of: | | |
Paid in capital | | $ 3,619,670,365 |
Distributions in excess of net investment income | | (1,203,691) |
Accumulated undistributed net realized gain (loss) on investments and foreign currency transactions | | (413,993,101) |
Net unrealized appreciation (depreciation) on investments and assets and liabilities in foreign currencies | | 1,438,315,991 |
Net Assets | | $ 4,642,789,564 |
Statement of Assets and Liabilities - continued
| December 31, 2013 |
| | |
Initial Class:
Net Asset Value, offering price and redemption price per share ($3,179,927,638 ÷ 55,654,399 shares) | | $ 57.14 |
| | |
Service Class:
Net Asset Value, offering price and redemption price per share ($491,959,418 ÷ 8,631,338 shares) | | $ 57.00 |
| | |
Service Class 2:
Net Asset Value, offering price and redemption price per share ($739,551,433 ÷ 13,074,235 shares) | | $ 56.57 |
| | |
Service Class 2R:
Net Asset Value, offering price and redemption price per share ($17,283,735 ÷ 306,654 shares) | | $ 56.36 |
| | |
Investor Class:
Net Asset Value, offering price and redemption price per share ($214,067,340 ÷ 3,756,532 shares) | | $ 56.99 |
See accompanying notes which are an integral part of the financial statements.
Annual Report
Financial Statements - continued
Statement of Operations
| Year ended December 31, 2013 |
| | |
Investment Income | | |
Dividends | | $ 37,840,573 |
Interest | | 86 |
Income from Fidelity Central Funds | | 490,058 |
Total income | | 38,330,717 |
| | |
Expenses | | |
Management fee | $ 22,829,845 | |
Transfer agent fees | 3,000,565 | |
Distribution and service plan fees | 2,095,590 | |
Accounting and security lending fees | 1,061,417 | |
Custodian fees and expenses | 155,822 | |
Independent trustees' compensation | 22,413 | |
Appreciation in deferred trustee compensation account | 566 | |
Audit | 72,611 | |
Legal | 19,908 | |
Miscellaneous | 36,902 | |
Total expenses before reductions | 29,295,639 | |
Expense reductions | (332,039) | 28,963,600 |
Net investment income (loss) | | 9,367,117 |
Realized and Unrealized Gain (Loss) Net realized gain (loss) on: | | |
Investment securities: | | |
Unaffiliated issuers | 696,444,168 | |
Foreign currency transactions | (155,925) | |
Total net realized gain (loss) | | 696,288,243 |
Change in net unrealized appreciation (depreciation) on: Investment securities | 576,500,448 | |
Assets and liabilities in foreign currencies | (1,345) | |
Total change in net unrealized appreciation (depreciation) | | 576,499,103 |
Net gain (loss) | | 1,272,787,346 |
Net increase (decrease) in net assets resulting from operations | | $ 1,282,154,463 |
Statement of Changes in Net Assets
| Year ended
December 31,
2013 | Year ended
December 31,
2012 |
Increase (Decrease) in Net Assets | | |
Operations | | |
Net investment income (loss) | $ 9,367,117 | $ 22,744,289 |
Net realized gain (loss) | 696,288,243 | 142,104,433 |
Change in net unrealized appreciation (depreciation) | 576,499,103 | 361,931,133 |
Net increase (decrease) in net assets resulting from operations | 1,282,154,463 | 526,779,855 |
Distributions to shareholders from net investment income | (9,763,755) | (20,720,579) |
Distributions to shareholders from net realized gain | (2,850,414) | - |
Total distributions | (12,614,169) | (20,720,579) |
Share transactions - net increase (decrease) | (377,103,293) | (456,375,196) |
Redemption fees | 17,166 | 1,933 |
Total increase (decrease) in net assets | 892,454,167 | 49,686,013 |
| | |
Net Assets | | |
Beginning of period | 3,750,335,397 | 3,700,649,384 |
End of period (including distributions in excess of net investment income of $1,203,691 and distributions in excess of net investment income of $162,984, respectively) | $ 4,642,789,564 | $ 3,750,335,397 |
See accompanying notes which are an integral part of the financial statements.
Annual Report
Financial Highlights - Initial Class
Years ended December 31, | 2013 | 2012 | 2011 | 2010 | 2009 |
Selected Per-Share Data | | | | | |
Net asset value, beginning of period | $ 42.05 | $ 36.89 | $ 37.09 | $ 30.04 | $ 23.53 |
Income from Investment Operations | | | | | |
Net investment income (loss) C | .14 | .26 | .14 | .07 | .10 |
Net realized and unrealized gain (loss) | 15.13 | 5.16 | (.06) | 7.18 | 6.55 |
Total from investment operations | 15.27 | 5.42 | .08 | 7.25 | 6.65 |
Distributions from net investment income | (.15) | (.26) | (.15) F | (.09) | (.12) |
Distributions from net realized gain | (.04) | - | (.12) F | (.11) | (.02) |
Total distributions | (.18) K | (.26) | (.28) J | (.20) | (.14) I |
Redemption fees added to paid in capital C, H | - | - | - | - | - |
Net asset value, end of period | $ 57.14 | $ 42.05 | $ 36.89 | $ 37.09 | $ 30.04 |
Total Return A, B | 36.34% | 14.69% | .20% | 24.17% | 28.29% |
Ratios to Average Net Assets D, G | | | | | |
Expenses before reductions | .66% | .66% | .66% | .67% | .69% |
Expenses net of fee waivers, if any | .65% | .66% | .66% | .66% | .69% |
Expenses net of all reductions | .65% | .65% | .66% | .66% | .68% |
Net investment income (loss) | .28% | .64% | .36% | .22% | .41% |
Supplemental Data | | | | | |
Net assets, end of period (000 omitted) | $ 3,179,928 | $ 2,613,977 | $ 2,583,122 | $ 2,842,307 | $ 2,618,954 |
Portfolio turnover rate E | 74% | 68% | 71% | 75% | 134% |
ATotal returns do not reflect charges attributable to your insurance company's separate account. Inclusion of these charges would reduce the total returns shown. BTotal returns would have been lower if certain expenses had not been reduced during the applicable periods shown. CCalculated based on average shares outstanding during the period. DFees and expenses of any underlying Fidelity Central Funds are not included in the Fund's expense ratio. The Fund indirectly bears its proportionate share of the expenses of any underlying Fidelity Central Funds. EAmount does not include the portfolio activity of any underlying Fidelity Central Funds. FThe amounts shown reflect certain reclassifications related to book to tax differences that were made in the year shown. GExpense ratios reflect operating expenses of the class. Expenses before reductions do not reflect amounts reimbursed by the investment adviser or reductions from brokerage service arrangements or reductions from other expense offset arrangements and do not represent the amount paid by the class during periods when reimbursements or reductions occur. Expenses net of fee waivers reflect expenses after reimbursement by the investment adviser but prior to reductions from brokerage service arrangements or other expense offset arrangements. Expenses net of all reductions represent the net expenses paid by the class. HAmount represents less than $.01 per share. ITotal distributions of $.14 per share is comprised of distributions from net investment income of $.118 and distributions from net realized gain of $.023 per share. JTotal distributions of $.28 per share is comprised of distributions from net investment income of $.152 and distributions from net realized gain of $.123 per share. KTotal distributions of $.18 per share is comprised of distributions from net investment income of $.147 and distributions from net realized gain of $.035 per share. |
Financial Highlights - Service Class
Years ended December 31, | 2013 | 2012 | 2011 | 2010 | 2009 |
Selected Per-Share Data | | | | | |
Net asset value, beginning of period | $ 41.95 | $ 36.81 | $ 36.99 | $ 29.96 | $ 23.47 |
Income from Investment Operations | | | | | |
Net investment income (loss) C | .09 | .22 | .10 | .04 | .08 |
Net realized and unrealized gain (loss) | 15.09 | 5.13 | (.05) | 7.16 | 6.52 |
Total from investment operations | 15.18 | 5.35 | .05 | 7.20 | 6.60 |
Distributions from net investment income | (.10) | (.21) | (.11) F | (.06) | (.09) |
Distributions from net realized gain | (.04) | - | (.12) F | (.11) | (.02) |
Total distributions | (.13) J | (.21) | (.23) | (.17) | (.11) I |
Redemption fees added to paid in capital C, H | - | - | - | - | - |
Net asset value, end of period | $ 57.00 | $ 41.95 | $ 36.81 | $ 36.99 | $ 29.96 |
Total Return A, B | 36.20% | 14.54% | .14% | 24.06% | 28.15% |
Ratios to Average Net Assets D, G | | | | | |
Expenses before reductions | .76% | .76% | .77% | .77% | .79% |
Expenses net of fee waivers, if any | .75% | .76% | .76% | .76% | .79% |
Expenses net of all reductions | .75% | .75% | .76% | .76% | .78% |
Net investment income (loss) | .18% | .54% | .26% | .12% | .31% |
Supplemental Data | | | | | |
Net assets, end of period (000 omitted) | $ 491,959 | $ 395,589 | $ 395,217 | $ 453,063 | $ 421,996 |
Portfolio turnover rate E | 74% | 68% | 71% | 75% | 134% |
ATotal returns do not reflect charges attributable to your insurance company's separate account. Inclusion of these charges would reduce the total returns shown. BTotal returns would have been lower if certain expenses had not been reduced during the applicable periods shown. CCalculated based on average shares outstanding during the period. DFees and expenses of any underlying Fidelity Central Funds are not included in the Fund's expense ratio. The Fund indirectly bears its proportionate share of the expenses of any underlying Fidelity Central Funds. EAmount does not include the portfolio activity of any underlying Fidelity Central Funds. FThe amounts shown reflect certain reclassifications related to book to tax differences that were made in the year shown. GExpense ratios reflect operating expenses of the class. Expenses before reductions do not reflect amounts reimbursed by the investment adviser or reductions from brokerage service arrangements or reductions from other expense offset arrangements and do not represent the amount paid by the class during periods when reimbursements or reductions occur. Expenses net of fee waivers reflect expenses after reimbursement by the investment adviser but prior to reductions from brokerage service arrangements or other expense offset arrangements. Expenses net of all reductions represent the net expenses paid by the class. HAmount represents less than $.01 per share. ITotal distributions of $.11 per share is comprised of distributions from net investment income of $.089 and distributions from net realized gain of $.023 per share. JTotal distributions of $.13 per share is comprised of distributions from net investment income of $.097 and distributions from net realized gain of $.035 per share. |
See accompanying notes which are an integral part of the financial statements.
Annual Report
Financial Highlights - Service Class 2
Years ended December 31, | 2013 | 2012 | 2011 | 2010 | 2009 |
Selected Per-Share Data | | | | | |
Net asset value, beginning of period | $ 41.64 | $ 36.53 | $ 36.72 | $ 29.75 | $ 23.31 |
Income from Investment Operations | | | | | |
Net investment income (loss) C | .01 | .16 | .04 | (.01) | .04 |
Net realized and unrealized gain (loss) | 14.98 | 5.10 | (.05) | 7.10 | 6.48 |
Total from investment operations | 14.99 | 5.26 | (.01) | 7.09 | 6.52 |
Distributions from net investment income | (.02) | (.15) | (.06) F | (.01) | (.05) |
Distributions from net realized gain | (.04) | - | (.12) F | (.11) | (.02) |
Total distributions | (.06) | (.15) | (.18) | (.12) | (.08) I |
Redemption fees added to paid in capital C, H | - | - | - | - | - |
Net asset value, end of period | $ 56.57 | $ 41.64 | $ 36.53 | $ 36.72 | $ 29.75 |
Total Return A, B | 36.00% | 14.40% | (.03)% | 23.86% | 27.97% |
Ratios to Average Net Assets D, G | | | | | |
Expenses before reductions | .91% | .91% | .92% | .92% | .94% |
Expenses net of fee waivers, if any | .90% | .91% | .91% | .91% | .94% |
Expenses net of all reductions | .90% | .90% | .91% | .91% | .93% |
Net investment income (loss) | .03% | .39% | .11% | (.03)% | .16% |
Supplemental Data | | | | | |
Net assets, end of period (000 omitted) | $ 739,551 | $ 592,407 | $ 590,556 | $ 584,193 | $ 528,819 |
Portfolio turnover rate E | 74% | 68% | 71% | 75% | 134% |
ATotal returns do not reflect charges attributable to your insurance company's separate account. Inclusion of these charges would reduce the total returns shown. BTotal returns would have been lower if certain expenses had not been reduced during the applicable periods shown. CCalculated based on average shares outstanding during the period. DFees and expenses of any underlying Fidelity Central Funds are not included in the Fund's expense ratio. The Fund indirectly bears its proportionate share of the expenses of any underlying Fidelity Central Funds. EAmount does not include the portfolio activity of any underlying Fidelity Central Funds. FThe amounts shown reflect certain reclassifications related to book to tax differences that were made in the year shown. GExpense ratios reflect operating expenses of the class. Expenses before reductions do not reflect amounts reimbursed by the investment adviser or reductions from brokerage service arrangements or reductions from other expense offset arrangements and do not represent the amount paid by the class during periods when reimbursements or reductions occur. Expenses net of fee waivers reflect expenses after reimbursement by the investment adviser but prior to reductions from brokerage service arrangements or other expense offset arrangements. Expenses net of all reductions represent the net expenses paid by the class. HAmount represents less than $.01 per share. ITotal distributions of $.08 per share is comprised of distributions from net investment income of $.052 and distributions from net realized gain of $.023 per share. |
Financial Highlights - Service Class 2R
Years ended December 31, | 2013 | 2012 | 2011 | 2010 | 2009 |
Selected Per-Share Data | | | | | |
Net asset value, beginning of period | $ 41.55 | $ 36.46 | $ 36.64 | $ 29.70 | $ 23.26 |
Income from Investment Operations | | | | | |
Net investment income (loss) C | .02 | .16 | .04 | (.01) | .04 |
Net realized and unrealized gain (loss) | 14.92 | 5.09 | (.05) | 7.09 | 6.46 |
Total from investment operations | 14.94 | 5.25 | (.01) | 7.08 | 6.50 |
Distributions from net investment income | (.10) | (.16) | (.05) F | (.03) | (.04) |
Distributions from net realized gain | (.04) | - | (.12) F | (.11) | (.02) |
Total distributions | (.13) J | (.16) | (.17) | (.14) | (.06) I |
Redemption fees added to paid in capital C, H | - | - | - | - | - |
Net asset value, end of period | $ 56.36 | $ 41.55 | $ 36.46 | $ 36.64 | $ 29.70 |
Total Return A, B | 35.97% | 14.41% | (.02)% | 23.86% | 27.98% |
Ratios to Average Net Assets D, G | | | | | |
Expenses before reductions | .90% | .91% | .91% | .92% | .94% |
Expenses net of fee waivers, if any | .90% | .91% | .91% | .91% | .94% |
Expenses net of all reductions | .90% | .90% | .91% | .91% | .93% |
Net investment income (loss) | .03% | .39% | .11% | (.03)% | .16% |
Supplemental Data | | | | | |
Net assets, end of period (000 omitted) | $ 17,284 | $ 5,357 | $ 5,202 | $ 5,739 | $ 4,084 |
Portfolio turnover rate E | 74% | 68% | 71% | 75% | 134% |
ATotal returns do not reflect charges attributable to your insurance company's separate account. Inclusion of these charges would reduce the total returns shown. BTotal returns would have been lower if certain expenses had not been reduced during the applicable periods shown. CCalculated based on average shares outstanding during the period. DFees and expenses of any underlying Fidelity Central Funds are not included in the Fund's expense ratio. The Fund indirectly bears its proportionate share of the expenses of any underlying Fidelity Central Funds. EAmount does not include the portfolio activity of any underlying Fidelity Central Funds. FThe amounts shown reflect certain reclassifications related to book to tax differences that were made in the year shown. GExpense ratios reflect operating expenses of the class. Expenses before reductions do not reflect amounts reimbursed by the investment adviser or reductions from brokerage service arrangements or reductions from other expense offset arrangements and do not represent the amount paid by the class during periods when reimbursements or reductions occur. Expenses net of fee waivers reflect expenses after reimbursement by the investment adviser but prior to reductions from brokerage service arrangements or other expense offset arrangements. Expenses net of all reductions represent the net expenses paid by the class. HAmount represents less than $.01 per share. ITotal distributions of $.06 per share is comprised of distributions from net investment income of $.041 and distributions from net realized gain of $.023 per share. JTotal distributions of $.13 per share is comprised of distributions from net investment income of $.095 and distributions from net realized gain of $.035 per share. |
See accompanying notes which are an integral part of the financial statements.
Annual Report
Financial Highlights - Investor Class
Years ended December 31, | 2013 | 2012 | 2011 | 2010 | 2009 |
Selected Per-Share Data | | | | | |
Net asset value, beginning of period | $ 41.95 | $ 36.81 | $ 37.00 | $ 29.97 | $ 23.48 |
Income from Investment Operations | | | | | |
Net investment income (loss) C | .10 | .23 | .10 | .04 | .08 |
Net realized and unrealized gain (loss) | 15.09 | 5.13 | (.05) | 7.17 | 6.52 |
Total from investment operations | 15.19 | 5.36 | .05 | 7.21 | 6.60 |
Distributions from net investment income | (.11) | (.22) | (.12) F | (.07) | (.09) |
Distributions from net realized gain | (.04) | - | (.12) F | (.11) | (.02) |
Total distributions | (.15) | (.22) | (.24) | (.18) | (.11) I |
Redemption fees added to paid in capital C, H | - | - | - | - | - |
Net asset value, end of period | $ 56.99 | $ 41.95 | $ 36.81 | $ 37.00 | $ 29.97 |
Total Return A, B | 36.22% | 14.58% | .14% | 24.08% | 28.14% |
Ratios to Average Net Assets D, G | | | | | |
Expenses before reductions | .74% | .75% | .75% | .76% | .79% |
Expenses net of fee waivers, if any | .73% | .75% | .75% | .75% | .79% |
Expenses net of all reductions | .73% | .74% | .74% | .75% | .78% |
Net investment income (loss) | .20% | .55% | .27% | .13% | .31% |
Supplemental Data | | | | | |
Net assets, end of period (000 omitted) | $ 214,067 | $ 143,005 | $ 126,551 | $ 117,936 | $ 95,531 |
Portfolio turnover rate E | 74% | 68% | 71% | 75% | 134% |
ATotal returns do not reflect charges attributable to your insurance company's separate account. Inclusion of these charges would reduce the total returns shown. BTotal returns would have been lower if certain expenses had not been reduced during the applicable periods shown. CCalculated based on average shares outstanding during the period. DFees and expenses of any underlying Fidelity Central Funds are not included in the Fund's expense ratio. The Fund indirectly bears its proportionate share of the expenses of any underlying Fidelity Central Funds. EAmount does not include the portfolio activity of any underlying Fidelity Central Funds. FThe amounts shown reflect certain reclassifications related to book to tax differences that were made in the year shown. GExpense ratios reflect operating expenses of the class. Expenses before reductions do not reflect amounts reimbursed by the investment adviser or reductions from brokerage service arrangements or reductions from other expense offset arrangements and do not represent the amount paid by the class during periods when reimbursements or reductions occur. Expenses net of fee waivers reflect expenses after reimbursement by the investment adviser but prior to reductions from brokerage service arrangements or other expense offset arrangements. Expenses net of all reductions represent the net expenses paid by the class. HAmount represents less than $.01 per share. ITotal distributions of $.11 per share is comprised of distributions from net investment income of $.089 and distributions from net realized gain of $.023 per share. |
See accompanying notes which are an integral part of the financial statements.
Annual Report
Notes to Financial Statements
For the period ended December 31, 2013
1. Organization.
VIP Growth Portfolio (the Fund) is a fund of Variable Insurance Products Fund (the Trust) and is authorized to issue an unlimited number of shares. The Trust is registered under the Investment Company Act of 1940, as amended (the 1940 Act), as an open-end management investment company organized as a Massachusetts business trust. Shares of the Fund may only be purchased by insurance companies for the purpose of funding variable annuity or variable life insurance contracts. The Fund offers the following classes of shares: Initial Class shares, Service Class shares, Service Class 2 shares, Service Class 2R shares and Investor Class. All classes have equal rights and voting privileges, except for matters affecting a single class.
2. Investments in Fidelity Central Funds.
The Fund invests in Fidelity Central Funds, which are open-end investment companies generally available only to other investment companies and accounts managed by the investment adviser and its affiliates. The Fund's Schedule of Investments lists each of the Fidelity Central Funds held as of period end, if any, as an investment of the Fund, but does not include the underlying holdings of each Fidelity Central Fund. As an Investing Fund, the Fund indirectly bears its proportionate share of the expenses of the underlying Fidelity Central Funds.
The Money Market Central Funds seek preservation of capital and current income and are managed by Fidelity Investments Money Management, Inc. (FIMM), an affiliate of the investment adviser. Annualized expenses of the Money Market Central Funds as of their most recent shareholder report date are less than .01%.
A complete unaudited list of holdings for each Fidelity Central Fund is available upon request or at the Securities and Exchange Commission (the SEC) website at www.sec.gov. In addition, the financial statements of the Fidelity Central Funds, which are not covered by the Fund's Report of Independent Registered Public Accounting Firm, are available on the SEC website or upon request.
3. Significant Accounting Policies.
The financial statements have been prepared in conformity with accounting principles generally accepted in the United States of America (GAAP), which require management to make certain estimates and assumptions at the date of the financial statements. Actual results could differ from those estimates. Subsequent events, if any, through the date that the financial statements were issued have been evaluated in the preparation of the financial statements. The following summarizes the significant accounting policies of the Fund:
Investment Valuation. Investments are valued as of 4:00 p.m. Eastern time on the last calendar day of the period. In accordance with valuation policies and procedures approved by the Board of Trustees (the Board), the Fund attempts to obtain prices from one or more third party pricing vendors or brokers to value its investments. When current market prices, quotations or currency exchange rates are not readily available or reliable, investments will be fair valued in good faith by the Fidelity Management & Research Company (FMR) Fair Value Committee (the Committee), in accordance with procedures adopted by the Board. Factors used in determining fair value vary by investment type and may include market or investment specific events. The frequency with which these procedures are used cannot be predicted and they may be utilized to a significant extent. The Committee oversees the Fund's valuation policies and procedures and is responsible for approving and reporting to the Board all fair value determinations.
The Fund categorizes the inputs to valuation techniques used to value its investments into a disclosure hierarchy consisting of three levels as shown below:
Level 1 - quoted prices in active markets for identical investments
Level 2 - other significant observable inputs (including quoted prices for similar investments, interest rates, prepayment speeds, etc.)
Level 3 - unobservable inputs (including the Fund's own assumptions based on the best information available)
Valuation techniques used to value the Fund's investments by major category are as follows:
Equity securities, including restricted securities, for which market quotations are readily available, are valued at the last reported sale price or official closing price as reported by a third party pricing vendor on the primary market or exchange on which they are traded and are categorized as Level 1 in the hierarchy. In the event there were no sales during the day or closing prices are not available, securities are valued at the last quoted bid price or may be valued using the last available price and are generally categorized as Level 2 in the hierarchy. For foreign equity securities, when market or security specific events arise, comparisons to the valuation of American Depositary Receipts (ADRs), futures contracts, Exchange-Traded Funds (ETFs) and certain indexes as well as quoted prices for similar securities may be used and would be categorized as Level 2 in the hierarchy. Utilizing these techniques may result in transfers between Level 1 and Level 2. For equity securities, including restricted securities, where observable inputs are limited, assumptions about market activity and risk are used and these securities may be categorized as Level 3 in the hierarchy.
Investments in open-end mutual funds, including the Fidelity Central Funds, are valued at their closing net asset value (NAV) each business day and are categorized as Level 1 in the hierarchy.
Annual Report
Notes to Financial Statements - continued
3. Significant Accounting Policies - continued
Investment Valuation - continued
Changes in valuation techniques may result in transfers in or out of an assigned level within the disclosure hierarchy. The aggregate value of investments by input level, as of December 31, 2013, including information on transfers between Levels 1 and 2, is included at the end of the Fund's Schedule of Investments.
Foreign Currency. The Fund may use foreign currency contracts to facilitate transactions in foreign-denominated securities. Gains and losses from these transactions may arise from changes in the value of the foreign currency or if the counterparties do not perform under the contracts' terms.
Foreign-denominated assets, including investment securities, and liabilities are translated into U.S. dollars at the exchange rates at period end. Purchases and sales of investment securities, income and dividends received and expenses denominated in foreign currencies are translated into U.S. dollars at the exchange rate in effect on the transaction date.
The effects of exchange rate fluctuations on investments are included with the net realized and unrealized gain (loss) on investment securities. Other foreign currency transactions resulting in realized and unrealized gain (loss) are disclosed separately.
Investment Transactions and Income. For financial reporting purposes, the Fund's investment holdings and NAV include trades executed through the end of the last business day of the period. The NAV per share for processing shareholder transactions is calculated as of the close of business of the New York Stock Exchange (NYSE), normally 4:00 p.m. Eastern time and includes trades executed through the end of the prior business day. Gains and losses on securities sold are determined on the basis of identified cost and may include proceeds received from litigation. Dividend income is recorded on the ex-dividend date, except for certain dividends from foreign securities where the ex-dividend date may have passed, which are recorded as soon as the Fund is informed of the ex-dividend date. Non-cash dividends included in dividend income, if any, are recorded at the fair market value of the securities received. Distributions received on securities that represent a return of capital or capital gain are recorded as a reduction of cost of investments and/or as a realized gain. Subsequent to ex-dividend date the Fund determines the components of these distributions, based upon receipt of tax filings or other correspondence relating to the underlying investment. Interest income and distributions from the Fidelity Central Funds are accrued as earned. Interest income includes coupon interest and amortization of premium and accretion of discount on debt securities. Investment income is recorded net of foreign taxes withheld where recovery of such taxes is uncertain.
Class Allocations and Expenses. Investment income, realized and unrealized capital gains and losses, common expenses of the Fund, and certain fund-level expense reductions, if any, are allocated daily on a pro-rata basis to each class based on the relative net assets of each class to the total net assets of the Fund. Each class differs with respect to transfer agent and distribution and service plan fees incurred. Certain expense reductions may also differ by class. For the reporting period, the allocated portion of income and expenses to each class as a percent of its average net assets may vary due to the timing of recording these transactions in relation to fluctuating net assets of the classes. Expenses directly attributable to a fund are charged to that fund. Expenses attributable to more than one fund are allocated among the respective funds on the basis of relative net assets or other appropriate methods. Expense estimates are accrued in the period to which they relate and adjustments are made when actual amounts are known.
Deferred Trustee Compensation. Under a Deferred Compensation Plan (the Plan), independent Trustees may elect to defer receipt of a portion of their annual compensation. Deferred amounts are invested in a cross-section of Fidelity funds, are marked-to-market and remain in the Fund until distributed in accordance with the Plan. The investment of deferred amounts and the offsetting payable to the Trustees are included in the accompanying Statement of Assets and Liabilities.
Income Tax Information and Distributions to Shareholders. Each year, the Fund intends to qualify as a regulated investment company under Subchapter M of the Internal Revenue Code, including distributing substantially all of its taxable income and realized gains. As a result, no provision for U.S. Federal income taxes is required. As of December 31, 2013, the Fund did not have any unrecognized tax benefits in the financial statements; nor is the Fund aware of any tax positions for which it is reasonably possible that the total amounts of unrecognized tax benefits will significantly change in the next twelve months. The Fund files a U.S. federal tax return, in addition to state and local tax returns as required. The Fund's federal income tax returns are subject to examination by the Internal Revenue Service (IRS) for a period of three fiscal years after they are filed. State and local tax returns may be subject to examination for an additional fiscal year depending on the jurisdiction. Foreign taxes are provided for based on the Fund's understanding of the tax rules and rates that exist in the foreign markets in which it invests.
Distributions are declared and recorded on the ex-dividend date. Income dividends and capital gain distributions are declared separately for each class. Income and capital gain distributions are determined in accordance with income tax regulations, which may differ from GAAP.
Capital accounts within the financial statements are adjusted for permanent book-tax differences. These adjustments have no impact on net assets or the results of operations. Capital accounts are not adjusted for temporary book-tax differences which will reverse in a subsequent period.
Book-tax differences are primarily due to foreign currency transactions, passive foreign investment companies (PFIC), partnerships, deferred trustees compensation, capital loss carryforwards and losses deferred due to wash sales and excise tax regulations.
Annual Report
3. Significant Accounting Policies - continued
Income Tax Information and Distributions to Shareholders - continued
The federal tax cost of investment securities and unrealized appreciation (depreciation) as of period end were as follows:
Gross unrealized appreciation | $ 1,455,099,967 |
Gross unrealized depreciation | (26,583,864) |
Net unrealized appreciation (depreciation) on securities and other investments | $ 1,428,516,103 |
| |
Tax Cost | $ 3,256,048,726 |
The tax-based components of distributable earnings as of period end were as follows:
Capital loss carryforward | $ (404,192,084) |
Net unrealized appreciation (depreciation) | $ 1,428,514,974 |
Capital loss carryforwards are only available to offset future capital gains of the Fund to the extent provided by regulations and may be limited. Under the Regulated Investment Company Modernization Act of 2010 (the Act), the Fund is permitted to carry forward capital losses incurred in taxable years beginning after December 22, 2010 for an unlimited period and such capital losses are required to be used prior to any losses that expire. The capital loss carryforward information presented below, including any applicable limitation, is estimated as of fiscal period end and is subject to adjustment.
Fiscal year of expiration | |
2017 | $ (404,192,084) |
The tax character of distributions paid was as follows:
| December 31, 2013 | December 31, 2012 |
Ordinary Income | $ 12,614,169 | $ 20,720,579 |
Trading (Redemption) Fees. Service Class 2R shares held by investors less than 60 days may be subject to a redemption fee equal to 1% of the NAV of shares redeemed. All redemption fees, which reduce the proceeds of the shareholder redemption, are retained by the Fund and accounted for as an addition to paid in capital.
Restricted Securities. The Fund may invest in securities that are subject to legal or contractual restrictions on resale. These securities generally may be resold in transactions exempt from registration or to the public if the securities are registered. Disposal of these securities may involve time-consuming negotiations and expense, and prompt sale at an acceptable price may be difficult. Information regarding restricted securities is included at the end of the Fund's Schedule of Investments.
4. Purchases and Sales of Investments.
Purchases and sales of securities, other than short-term securities, aggregated $3,015,138,781 and $3,345,346,296, respectively.
5. Fees and Other Transactions with Affiliates.
Management Fee. Fidelity Management & Research Company (the investment adviser) and its affiliates provide the Fund with investment management related services for which the Fund pays a monthly management fee. The management fee is the sum of an individual fund fee rate that is based on an annual rate of .30% of the Fund's average net assets and an annualized group fee rate that averaged .25% during the period. The group fee rate is based upon the average net assets of all the mutual funds advised by the investment adviser, including any mutual funds previously advised by the investment adviser that are currently advised by Fidelity SelectCo, LLC, an affiliate of the investment adviser. The group fee rate decreases as assets under management increase and increases as assets under management decrease. For the reporting period, the total annual management fee rate was .55% of the Fund's average net assets.
Distribution and Service Plan Fees. In accordance with Rule 12b-1 of the 1940 Act, the Fund has adopted separate 12b-1 Plans for each Service Class of shares. Each Service Class pays Fidelity Distributors Corporation (FDC), an affiliate of the investment adviser, a service fee. For the period, the service fee is based on an annual rate of .10% of Service Class' average net assets and .25% of Service Class 2's and Service Class 2R's average net assets.
Annual Report
Notes to Financial Statements - continued
5. Fees and Other Transactions with Affiliates - continued
Distribution and Service Plan Fees - continued
For the period, total fees, all of which were re-allowed to insurance companies for the distribution of shares and providing shareholder support services were as follows:
Service Class | $ 435,996 |
Service Class 2 | 1,638,791 |
Service Class 2R | 20,803 |
| $ 2,095,590 |
Transfer Agent Fees. Fidelity Investments Institutional Operations Company, Inc. (FIIOC), an affiliate of the investment adviser, is the Fund's transfer, dividend disbursing, and shareholder servicing agent. FIIOC receives an asset-based fee with respect to each class. Each class (with the exception of Investor Class) pays a transfer agent fee, excluding out of pocket expenses, equal to an annual rate of .07% of average net assets. Investor Class pays a monthly asset-based transfer agent fee of .15% of average net assets. In addition, FIIOC receives an asset-based fee of .0035% of average net assets for typesetting, printing and mailing of shareholder reports, except proxy statements. FIIOC voluntarily agreed to reimburse or waive this fee for the period January 1, 2013 through December 31, 2013 (see Expense Reductions note). For the period, transfer agent fees for each class, including printing and out of pocket expenses, were as follows:
Initial Class | $ 1,974,884 |
Service Class | 302,617 |
Service Class 2 | 456,343 |
Service Class 2R | 5,682 |
Investor Class | 261,039 |
| $ 3,000,565 |
Effective February 1, 2014, the Board of Trustees approved an amendment to the transfer agent fee agreement whereby each class (with the exception of Investor Class) pays a single fee of .07% of average net assets for transfer agent services, typesetting, printing and mailing of shareholder reports, excluding mailing of proxy statements and out of pocket expenses. Investor Class pays a single fee of .15% of average net assets.
Accounting and Security Lending Fees. Fidelity Service Company, Inc. (FSC), an affiliate of the investment adviser, maintains the Fund's accounting records. The accounting fee is based on the level of average net assets for each month. Under a separate contract, FSC administers the security lending program. The security lending fee is based on the number and duration of lending transactions.
Brokerage Commissions. The Fund placed a portion of its portfolio transactions with brokerage firms which are affiliates of the investment adviser. Brokerage commissions are included in net realized gain (loss) and change in net unrealized appreciation (depreciation) in the Statement of Operations. The commissions paid to these affiliated firms were $48,550 for the period.
6. Committed Line of Credit.
The Fund participates with other funds managed by the investment adviser or an affiliate in a $4.25 billion credit facility (the "line of credit") to be utilized for temporary or emergency purposes to fund shareholder redemptions or for other short-term liquidity purposes. The Fund has agreed to pay commitment fees on its pro-rata portion of the line of credit, which amounted to $8,597 and is reflected in Miscellaneous expenses on the Statement of Operations. During the period, there were no borrowings on this line of credit.
7. Security Lending.
The Fund lends portfolio securities through a lending agent from time to time in order to earn additional income. For equity securities, a lending agent is used and may loan securities to certain qualified borrowers, including Fidelity Capital Markets (FCM), a broker-dealer affiliated with the Fund. On the settlement date of the loan, the Fund receives collateral (in the form of U.S. Treasury obligations, letters of credit and/or cash) against the loaned securities and maintains collateral in an amount not less than 100% of the market value of the loaned securities during the period of the loan. The market value of the loaned securities is determined at the close of business of the Fund and any additional required collateral is delivered to the Fund on the next business day. If the borrower defaults on its obligation to return the securities loaned because of insolvency or other reasons, the Fund may apply collateral received from the borrower against the obligation. The Fund may experience delays and costs in recovering the securities loaned. Any cash collateral received is invested in the Fidelity Securities Lending Cash Central Fund. The value of loaned securities and cash collateral at period end are disclosed on the Fund's Statement of Assets and Liabilities. The value of securities loaned to FCM at period end was $2,195,925. Security lending income represents the income earned on investing cash collateral, less rebates paid to borrowers and any lending agent fees associated with the loan, plus any premium payments received for lending certain types of securities. Security lending income is presented in the Statement of Operations as a component of income from Fidelity Central Funds. Total security lending income during the period amounted to $401,092, including $13,794 from securities loaned to FCM.
Annual Report
8. Expense Reductions.
The investment adviser or its affiliates agreed to reimburse or waive certain fees during the period as noted in the table below.
Initial Class | $ 111,610 |
Service Class | 17,044 |
Service Class 2 | 25,625 |
Service Class 2R | 326 |
Investor Class | 6,687 |
| $ 161,292 |
Commissions paid to certain brokers with whom the investment adviser, or its affiliates, places trades on behalf of the Fund include an amount in addition to trade execution, which may be rebated back to the Fund to offset certain expenses. This amount totaled $170,747 for the period.
9. Distributions to Shareholders.
Distributions to shareholders of each class were as follows:
Years ended December 31, | 2013 | 2012 |
From net investment income | | |
Initial Class | $ 8,183,689 | $ 15,820,328 |
Service Class | 834,735 | 1,992,915 |
Service Class 2 | 302,832 | 2,128,126 |
Service Class 2R | 28,824 | 21,103 |
Investor Class | 413,675 | 758,107 |
Total | $ 9,763,755 | $ 20,720,579 |
From net realized gain | | |
Initial Class | $ 1,948,498 | $ - |
Service Class | 301,193 | - |
Service Class 2 | 460,831 | - |
Service Class 2R | 10,619 | - |
Investor Class | 129,273 | - |
Total | $ 2,850,414 | $ - |
10. Share Transactions.
Transactions for each class of shares were as follows:
| Shares | Dollars |
Years ended December 31, | 2013 | 2012 | 2013 | 2012 |
Initial Class | | | | |
Shares sold | 1,850,753 | 2,323,728 | $ 90,925,901 | $ 96,521,392 |
Reinvestment of distributions | 184,188 | 381,572 | 10,132,187 | 15,820,328 |
Shares redeemed | (8,540,450) | (10,560,173) | (413,920,350) | (437,343,347) |
Net increase (decrease) | (6,505,509) | (7,854,873) | $ (312,862,262) | $ (325,001,627) |
Service Class | | | | |
Shares sold | 506,606 | 449,055 | $ 24,889,515 | $ 18,616,054 |
Reinvestment of distributions | 20,698 | 48,172 | 1,135,928 | 1,992,915 |
Shares redeemed | (1,325,183) | (1,805,917) | (63,783,330) | (74,456,372) |
Net increase (decrease) | (797,879) | (1,308,690) | $ (37,757,887) | $ (53,847,403) |
Service Class 2 | | | | |
Shares sold | 1,978,056 | 2,992,976 | $ 97,911,059 | $ 122,866,709 |
Reinvestment of distributions | 14,022 | 51,828 | 763,663 | 2,128,126 |
Shares redeemed | (3,143,720) | (4,983,249) | (152,819,651) | (200,935,979) |
Net increase (decrease) | (1,151,642) | (1,938,445) | $ (54,144,929) | $ (75,941,144) |
Service Class 2R | | | | |
Shares sold | 261,110 | 51,435 | $ 13,399,914 | $ 2,117,779 |
Reinvestment of distributions | 727 | 515 | 39,443 | 21,103 |
Shares redeemed | (84,125) | (65,694) | (4,065,469) | (2,637,205) |
Net increase (decrease) | 177,712 | (13,744) | $ 9,373,888 | $ (498,323) |
Annual Report
Notes to Financial Statements - continued
10. Share Transactions - continued
| Shares | Dollars |
Years ended December 31, | 2013 | 2012 | 2013 | 2012 |
Investor Class | | | | |
Shares sold | 770,590 | 497,342 | $ 38,503,533 | $ 20,659,697 |
Reinvestment of distributions | 9,897 | 18,329 | 542,948 | 758,107 |
Shares redeemed | (432,922) | (544,984) | (20,758,584) | (22,504,503) |
Net increase (decrease) | 347,565 | (29,313) | $ 18,287,897 | $ (1,086,699) |
11. Other.
The Fund's organizational documents provide former and current trustees and officers with a limited indemnification against liabilities arising in connection with the performance of their duties to the Fund. In the normal course of business, the Fund may also enter into contracts that provide general indemnifications. The Fund's maximum exposure under these arrangements is unknown as this would be dependent on future claims that may be made against the Fund. The risk of material loss from such claims is considered remote.
At the end of the period, the investment adviser or its affiliates were the owners of record of 14% of the total outstanding shares of the Fund and one otherwise unaffiliated shareholder was the owner of record of 24% of the total outstanding shares of the Fund.
Annual Report
Report of Independent Registered Public Accounting Firm
To the Trustees of Variable Insurance Products Fund and the Shareholders of VIP Growth Portfolio:
In our opinion, the accompanying statement of assets and liabilities, including the schedule of investments, and the related statements of operations and of changes in net assets and the financial highlights present fairly, in all material respects, the financial position of VIP Growth Portfolio (a fund of Variable Insurance Products Fund) at December 31, 2013, the results of its operations for the year then ended, the changes in its net assets for each of the two years in the period then ended and the financial highlights for each of the five years in the period then ended, in conformity with accounting principles generally accepted in the United States of America. These financial statements and financial highlights (hereafter referred to as "financial statements") are the responsibility of the VIP Growth Portfolio's management. Our responsibility is to express an opinion on these financial statements based on our audits. We conducted our audits of these financial statements in accordance with the standards of the Public Company Accounting Oversight Board (United States). Those standards require that we plan and perform the audit to obtain reasonable assurance about whether the financial statements are free of material misstatement. An audit includes examining, on a test basis, evidence supporting the amounts and disclosures in the financial statements, assessing the accounting principles used and significant estimates made by management, and evaluating the overall financial statement presentation. We believe that our audits, which included confirmation of securities at December 31, 2013 by correspondence with the custodian and brokers, provide a reasonable basis for our opinion.
PricewaterhouseCoopers LLP
Boston, Massachusetts
February 10, 2014
Annual Report
The Trustees, Member of the Advisory Board, and officers of the trust and fund, as applicable, are listed below. The Board of Trustees governs the fund and is responsible for protecting the interests of shareholders. The Trustees are experienced executives who meet periodically throughout the year to oversee the fund's activities, review contractual arrangements with companies that provide services to the fund, oversee management of the risks associated with such activities and contractual arrangements, and review the fund's performance. Except for James C. Curvey, Ned C. Lautenbach, Ronald P. O'Hanley, and William S. Stavropoulos, each of the Trustees oversees 173 funds. Mr. Curvey oversees 396 funds. Mr. Lautenbach, Mr. O'Hanley, and Mr. Stavropoulos each oversees 247 funds.
The Trustees hold office without limit in time except that (a) any Trustee may resign; (b) any Trustee may be removed by written instrument, signed by at least two-thirds of the number of Trustees prior to such removal; (c) any Trustee who requests to be retired or who has become incapacitated by illness or injury may be retired by written instrument signed by a majority of the other Trustees; and (d) any Trustee may be removed at any special meeting of shareholders by a two-thirds vote of the outstanding voting securities of the trust. Each Trustee who is not an interested person (as defined in the 1940 Act) of the trust and the fund (Independent Trustee), shall retire not later than the last day of the calendar year in which his or her 75th birthday occurs. The Independent Trustees may waive this mandatory retirement age policy with respect to individual Trustees. The officers and Advisory Board Member hold office without limit in time, except that any officer and Advisory Board Member may resign or may be removed by a vote of a majority of the Trustees at any regular meeting or any special meeting of the Trustees. Except as indicated, each individual has held the office shown or other offices in the same company for the past five years.
Experience, Skills, Attributes, and Qualifications of the Fund's Trustees. The Governance and Nominating Committee has adopted a statement of policy that describes the experience, qualifications, attributes, and skills that are necessary and desirable for potential Independent Trustee candidates (Statement of Policy). The Board believes that each Trustee satisfied at the time he or she was initially elected or appointed a Trustee, and continues to satisfy, the standards contemplated by the Statement of Policy. The Governance and Nominating Committee also engages professional search firms to help identify potential Independent Trustee candidates who have the experience, qualifications, attributes, and skills consistent with the Statement of Policy. From time to time, additional criteria based on the composition and skills of the current Independent Trustees, as well as experience or skills that may be appropriate in light of future changes to board composition, business conditions, and regulatory or other developments, have also been considered by the professional search firms and the Governance and Nominating Committee. In addition, the Board takes into account the Trustees' commitment and participation in Board and committee meetings, as well as their leadership of standing and ad hoc committees throughout their tenure.
In determining that a particular Trustee was and continues to be qualified to serve as a Trustee, the Board has considered a variety of criteria, none of which, in isolation, was controlling. The Board believes that, collectively, the Trustees have balanced and diverse experience, qualifications, attributes, and skills, which allow the Board to operate effectively in governing the fund and protecting the interests of shareholders. Information about the specific experience, skills, attributes, and qualifications of each Trustee, which in each case led to the Board's conclusion that the Trustee should serve (or continue to serve) as a trustee of the fund, is provided below.
Board Structure and Oversight Function. James C. Curvey is an interested person (as defined in the 1940 Act) and currently serves as Chairman. The Trustees have determined that an interested Chairman is appropriate and benefits shareholders because an interested Chairman has a personal and professional stake in the quality and continuity of services provided to the fund. Independent Trustees exercise their informed business judgment to appoint an individual of their choosing to serve as Chairman, regardless of whether the Trustee happens to be independent or a member of management. The Independent Trustees have determined that they can act independently and effectively without having an Independent Trustee serve as Chairman and that a key structural component for assuring that they are in a position to do so is for the Independent Trustees to constitute a substantial majority for the Board. The Independent Trustees also regularly meet in executive session. Ned C. Lautenbach serves as Chairman of the Independent Trustees and as such (i) acts as a liaison between the Independent Trustees and management with respect to matters important to the Independent Trustees and (ii) with management prepares agendas for Board meetings.
Fidelity funds are overseen by different Boards of Trustees. The fund's Board oversees Fidelity's equity and high income funds and another Board oversees Fidelity's investment-grade bond, money market, and asset allocation funds. The asset allocation funds may invest in Fidelity funds overseen by the fund's Board. The use of separate Boards, each with its own committee structure, allows the Trustees of each group of Fidelity funds to focus on the unique issues of the funds they oversee, including common research, investment, and operational issues. On occasion, the separate Boards establish joint committees to address issues of overlapping consequences for the Fidelity funds overseen by each Board.
The Trustees operate using a system of committees to facilitate the timely and efficient consideration of all matters of importance to the Trustees, the fund, and fund shareholders and to facilitate compliance with legal and regulatory requirements and oversight of the fund's activities and associated risks. The Board, acting through its committees, has charged FMR and its affiliates with (i) identifying events or circumstances the occurrence of which could have demonstrably adverse effects on the fund's business and/or reputation; (ii) implementing processes and controls to lessen the possibility that such events or circumstances occur or to mitigate the effects of such events or circumstances if they do occur; and (iii) creating and maintaining a system designed to evaluate continuously business and market conditions in order to facilitate the identification and implementation processes described in (i) and (ii) above. Because the day-to-day operations and activities of the fund are carried out by or through FMR, its affiliates and other service providers, the fund's exposure to risks is mitigated but not eliminated by the processes overseen by the Trustees. While each of the Board's committees has responsibility for overseeing different aspects of the fund's activities, oversight is exercised primarily through the Operations, Audit, and Compliance Committees. In addition, the Independent Trustees have worked with FMR to enhance the Board's oversight of investment and financial risks, legal and regulatory risks, technology risks, and operational risks, including the development of additional risk reporting to the Board. For example, a working group comprised of Independent Trustees and FMR has worked and continues to work to review the Fidelity funds' valuation-related activities, reporting and risk management. Appropriate personnel, including but not limited to the fund's Chief Compliance Officer (CCO), FMR's internal auditor, the independent accountants, the funds' Treasurer and portfolio management personnel, make periodic reports to the Board's committees, as appropriate, including an annual review of FMR's risk management program for the Fidelity funds. The responsibilities of each standing committee, including their oversight responsibilities, are described further under "Standing Committees of the Fund's Trustees."
Annual Report
The fund's Statement of Additional Information (SAI) includes more information about the Trustees. To request a free copy, call Fidelity at 1-877-208-0098.
Interested Trustees*:
Correspondence intended for each Trustee who is an interested person may be sent to Fidelity Investments, 245 Summer Street, Boston, Massachusetts 02210.
Name, Year of Birth; Principal Occupations and Other Relevant Experience+ |
James C. Curvey (1935) |
Year of Election or Appointment: 2007 Trustee Chairman of the Board of Trustees |
| Mr. Curvey also serves as Trustee of other Fidelity funds. Mr. Curvey is a Director of Fidelity Investments Money Management, Inc. (2009-present), Director of Fidelity Research & Analysis Co. (2009-present) and Director of FMR and FMR Co., Inc. (2007-present). Mr. Curvey is also Vice Chairman (2007-present) and Director of FMR LLC. In addition, Mr. Curvey serves as an Overseer for the Boston Symphony Orchestra and a member of the Trustees of Villanova University. Previously, Mr. Curvey was the Vice Chairman (2006-2007) and Director (2000-2007) of FMR Corp. |
Ronald P. O'Hanley (1957) |
Year of Election or Appointment: 2011 Trustee |
| Mr. O'Hanley also serves as Trustee of other Fidelity funds. He is Director of Fidelity SelectCo, LLC (2013-present), FMR Co., Inc. (2010-present), Director of Fidelity Investments Money Management, Inc. (2010-present), Director of Fidelity Research & Analysis Company (2010-present), President of Fidelity Asset Management and Corporate Services and a Member of Fidelity's Executive Committee (2010-present). Previously, Mr. O'Hanley served as President and Chief Executive Officer of BNY Mellon Asset Management (2007-2010). Mr. O'Hanley also served as Vice Chairman of Bank New York Mellon Corp. and a member of that firm's Executive Committee. Prior to the 2007 merger of The Bank of New York and Mellon Financial Corporation, he was Vice Chairman of Mellon Financial Corporation and President and Chief Executive Officer of Mellon Asset Management. He joined Mellon in February 1997. Mr. O'Hanley currently serves as Chairman of the Boston Public Library Foundation Board of Directors and sits on the Board of Directors of Beth Israel Deaconess Medical Center, the Board of Trustees of the Marine Biological Laboratory and the Advisory Board of the Maxwell School of Citizenship and Public Administration at Syracuse University. Mr. O'Hanley also chairs the Council on Asset Management for the Financial Services Roundtable and is a member of the Board of Directors of Institutional Investor's U.S. Institute. |
* Trustees have been determined to be "Interested Trustees" by virtue of, among other things, their affiliation with the trust or various entities under common control with FMR.
+ The information above includes each Trustee's principal occupation during the last five years and other information relating to the experience, attributes, and skills relevant to each Trustee's qualifications to serve as a Trustee, which led to the conclusion that each Trustee should serve as a Trustee for the fund.
Annual Report
Trustees and Officers - continued
Independent Trustees:
Correspondence intended for each Independent Trustee (that is, the Trustees other than the Interested Trustees) may be sent to Fidelity Investments, P.O. Box 55235, Boston, Massachusetts 02205-5235.
Name, Year of Birth; Principal Occupations and Other Relevant Experience+ |
Dennis J. Dirks (1948) |
Year of Election or Appointment: 2005 Trustee |
| Mr. Dirks also serves as Trustee of other Fidelity funds. Prior to his retirement in May 2003, Mr. Dirks was Chief Operating Officer and a member of the Board of The Depository Trust & Clearing Corporation (DTCC). He also served as President, Chief Operating Officer, and Board member of The Depository Trust Company (DTC) and President and Board member of the National Securities Clearing Corporation (NSCC). In addition, Mr. Dirks served as Chief Executive Officer and Board member of the Government Securities Clearing Corporation, Chief Executive Officer and Board member of the Mortgage-Backed Securities Clearing Corporation, as a Trustee and a member of the Finance Committee of Manhattan College (2005-2008), and as a Trustee and a member of the Finance Committee of AHRC of Nassau County (2006-2008). Mr. Dirks is a member of the Independent Directors Council (IDC) Governing Council (2010-present) and Board of Directors for The Brookville Center for Children's Services, Inc. (2009-present). |
Alan J. Lacy (1953) |
Year of Election or Appointment: 2008 Trustee |
| Mr. Lacy also serves as Trustee of other Fidelity funds. Mr. Lacy serves as Senior Adviser (2007-present) of Oak Hill Capital Partners, L.P. (private equity). Mr. Lacy also served as Chief Executive Officer (2000-2005) and Vice Chairman (2005-2006) of Sears Holdings Corporation and Sears, Roebuck and Co. (retail). In addition, Mr. Lacy serves as a member of the Board of Directors of Dave & Buster's Entertainment, Inc. (restaurant and entertainment complexes, 2010-present), Earth Fare, Inc. (retail grocery, 2012-present), The Hillman Companies, Inc. (hardware wholesalers, 2010-present), and Bristol-Myers Squibb Company (global pharmaceuticals, 2008-present). Mr. Lacy is a member of the Board of Trustees of The National Parks Conservation Association (2006-present). Previously, Mr. Lacy served as Chairman of the Board of Trustees of the National Parks Conservation Association (2008-2011) and as a member of the Board of Directors for the Western Union Company (global money transfer, 2006-2011). |
Ned C. Lautenbach (1944) |
Year of Election or Appointment: 2000 Trustee Chairman of the Independent Trustees |
| Mr. Lautenbach also serves as Trustee of other Fidelity funds. Mr. Lautenbach currently serves as the Lead Director of the Eaton Corporation Board of Directors (diversified industrial, 1997-present). Mr. Lautenbach is Chairman of the Board of Directors of the Philharmonic Center for the Arts in Naples, Florida (2012-present) and a member of the Council on Foreign Relations (1994-present). Previously, Mr. Lautenbach was a Partner/Advisory Partner at Clayton, Dubilier & Rice, LLC (private equity investment, 1998-2010), as well as a Director of Sony Corporation (2006-2007). |
Joseph Mauriello (1944) |
Year of Election or Appointment: 2008 Trustee |
| Mr. Mauriello also serves as Trustee of other Fidelity funds. Prior to his retirement in January 2006, Mr. Mauriello served in numerous senior management positions including Deputy Chairman and Chief Operating Officer (2004-2005), and Vice Chairman of Financial Services (2002-2004) of KPMG LLP US (professional services, 1965-2005). Mr. Mauriello currently serves as a member of the Board of Directors of XL Group plc. (global insurance and re-insurance, 2006-present). Previously, Mr. Mauriello served as a Director of the Hamilton Funds of the Bank of New York (2006-2007) and of Arcadia Resources Inc. (health care services and products, 2007-2012). |
Robert W. Selander (1950) |
Year of Election or Appointment: 2011 Trustee |
| Mr. Selander also serves as Trustee of other Fidelity funds. Previously, Mr. Selander served as a Member of the Advisory Board of other Fidelity funds (2011), and Executive Vice Chairman (2010), Chief Executive Officer (2009-2010), and President and Chief Executive Officer (1997-2009) of Mastercard, Inc. |
Cornelia M. Small (1944) |
Year of Election or Appointment: 2005 Trustee |
| Ms. Small also serves as Trustee of other Fidelity funds. Ms. Small is a member of the Board of Directors (2009-present) and Chair of the Investment Committee (2010-present) of the Teagle Foundation. Ms. Small also serves on the Investment Committee of the Berkshire Taconic Community Foundation (2008-present). Previously, Ms. Small served as Chairperson (2002-2008) and a member of the Investment Committee and Chairperson (2008-2012) and a member of the Board of Trustees of Smith College. In addition, Ms. Small served as Chief Investment Officer, Director of Global Equity Investments, and a member of the Board of Directors of Scudder, Stevens & Clark and Scudder Kemper Investments. |
William S. Stavropoulos (1939) |
Year of Election or Appointment: 2001 Trustee Vice Chairman of the Independent Trustees |
| Mr. Stavropoulos also serves as Trustee of other Fidelity funds. Mr. Stavropoulos serves as President and Founder of the Michigan Baseball Foundation, the Great Lakes Loons (2007-present). Mr. Stavropoulos is Chairman Emeritus of the Board of Directors of The Dow Chemical Company, where he previously served in numerous senior management positions, including President, CEO (1995-2000; 2002-2004), Chairman of the Executive Committee (2000-2006), and as a member of the Board of Directors (1990-2006). Currently, Mr. Stavropoulos is Chairman of the Board of Directors of Univar Inc. (global distributor of commodity and specialty chemicals), a Director of Teradata Corporation (data warehousing and technology solutions), and Maersk Inc. (industrial conglomerate), and a member of the Advisory Board for Metalmark Capital LLC (private equity investment, 2005-present). Mr. Stavropoulos is an operating advisor to Clayton, Dubilier & Rice, LLC (private equity investment). In addition, Mr. Stavropoulos is a member of the University of Notre Dame Advisory Council for the College of Science, a Trustee of the Rollin L. Gerstacker Foundation, and a Director of the Naples Philharmonic Center for the Arts. Previously, Mr. Stavropoulos served as a Director of Chemical Financial Corporation (bank holding company, 1993-2012) and Tyco International, Ltd. (multinational manufacturing and services, 2007-2012). |
David M. Thomas (1949) |
Year of Election or Appointment: 2008 Trustee |
| Mr. Thomas also serves as Trustee of other Fidelity funds. Mr. Thomas serves as Non-Executive Chairman of the Board of Directors of Fortune Brands Home and Security (home and security products, 2011-present), and as a member of the Board of Directors of Interpublic Group of Companies, Inc. (marketing communication, 2004-present). Previously, Mr. Thomas served as Executive Chairman (2005-2006) and Chairman and Chief Executive Officer (2000-2005) of IMS Health, Inc. (pharmaceutical and healthcare information solutions), and a Director of Fortune Brands, Inc. (consumer products, 2000-2011). |
+ The information above includes each Trustee's principal occupation during the last five years and other information relating to the experience, attributes, and skills relevant to each Trustee's qualifications to serve as a Trustee, which led to the conclusion that each Trustee should serve as a Trustee for the fund.
Advisory Board Member and Officers:
Correspondence intended for each officer and Peter S. Lynch may be sent to Fidelity Investments, 245 Summer Street, Boston, Massachusetts 02210. Officers appear below in alphabetical order.
Name, Year of Birth; Principal Occupation |
Peter S. Lynch (1944) |
Year of Election or Appointment: 2003 Member of the Advisory Board |
| Mr. Lynch also serves as Member of the Advisory Board of other Fidelity funds. Mr. Lynch is Vice Chairman and a Director of FMR and FMR Co., Inc. In addition, Mr. Lynch serves as a Trustee of Boston College and as the Chairman of the Inner-City Scholarship Fund. Previously, Mr. Lynch served on the Special Olympics International Board of Directors (1997-2006). |
Elizabeth Paige Baumann (1968) |
Year of Election or Appointment: 2012 Anti-Money Laundering (AML) Officer |
| Ms. Baumann also serves as AML Officer of other funds. She is Chief AML Officer of FMR LLC (2012-present) and is an employee of Fidelity Investments. Previously, Ms. Baumann served as Vice President and Deputy Anti-Money Laundering Officer (2007-2012). |
William C. Coffey (1969) |
Year of Election or Appointment: 2009 Assistant Secretary |
| Mr. Coffey also serves as Assistant Secretary of other funds. He is Senior Vice President and Deputy General Counsel of FMR LLC (2010-present), and is an employee of Fidelity Investments. Previously, Mr. Coffey served as Vice President and Associate General Counsel of FMR LLC (2005-2009). |
Jonathan Davis (1968) |
Year of Election or Appointment: 2010 Assistant Treasurer |
| Mr. Davis also serves as Assistant Treasurer of other funds. Mr. Davis is an employee of Fidelity Investments. Previously, Mr. Davis served as Vice President and Associate General Counsel of FMR LLC (2003-2010). |
Adrien E. Deberghes (1967) |
Year of Election or Appointment: 2008 Deputy Treasurer |
| Mr. Deberghes also serves as an officer of other funds. He is an employee of Fidelity Investments (2008-present). Prior to joining Fidelity Investments, Mr. Deberghes was Senior Vice President of Mutual Fund Administration at State Street Corporation (2007-2008), Senior Director of Mutual Fund Administration at Investors Bank & Trust (2005-2007), and Director of Finance for Dunkin' Brands (2000-2005). |
Stephanie J. Dorsey (1969) |
Year of Election or Appointment: 2010 Assistant Treasurer |
| Ms. Dorsey also serves as an officer of other funds. She is an employee of Fidelity Investments (2008-present) and has served in other fund officer roles. Prior to joining Fidelity Investments, Ms. Dorsey served as Treasurer (2004-2008) of the JPMorgan Mutual Funds and Vice President (2004-2008) of JPMorgan Chase Bank. |
Scott C. Goebel (1968) |
Year of Election or Appointment: 2008 Secretary and Chief Legal Officer (CLO) |
| Mr. Goebel serves as Secretary and CLO of other funds. Mr. Goebel also serves as Secretary of Fidelity Investments Money Management, Inc. (FIMM) (2010-present) and Fidelity Research and Analysis Company (FRAC) (2010-present); General Counsel, Secretary, and Senior Vice President of FMR (2008-present) and FMR Co., Inc. (2008-present); Chief Legal Officer of Fidelity Management & Research (Hong Kong) Limited (2008-present) and Assistant Secretary of Fidelity Management & Research (Japan) Inc. (2008-present), and Fidelity Management & Research (U.K.) Inc. (2008-present). Previously, Mr. Goebel served as Secretary and CLO of other Fidelity funds (2008-2013), Assistant Secretary of FIMM (2008-2010), FRAC (2008-2010), and certain funds (2007-2008); and as Vice President and Secretary of Fidelity Distributors Corporation (FDC) (2005-2007). Mr. Goebel has been employed by FMR LLC or an affiliate since 2001. |
Joseph A. Hanlon (1968) |
Year of Election or Appointment: 2012 Chief Compliance Officer |
| Mr. Hanlon also serves as Chief Compliance Officer of other funds. Mr. Hanlon serves as Compliance Officer of FMR, FMR Co., Inc., Fidelity Investments Money Management, Inc. (FIMM), Fidelity Research and Analysis Company (FRAC), and Fidelity Management & Research (Hong Kong) (2009-present), as Senior Vice President of the Fidelity Asset Management Division (2009-present), and is an employee of Fidelity Investments. Previously, Mr. Hanlon served as Compliance Officer of Fidelity Management & Research (Japan) Inc. (2009-2013), Strategic Advisers, Inc. (2009-2013), and Fidelity Management & Research (U.K.) Inc. (2009-2013). |
Bruce T. Herring (1965) |
Year of Election or Appointment: 2006 Vice President of certain Equity Funds |
| Mr. Herring also serves as Vice President of other funds. He serves as Chief Investment Officer of Fidelity Global Asset Allocation (GAA) (2013-present), Group Chief Investment Officer of FMR, and President of Fidelity Research & Analysis Company (2010-present). Previously, Mr. Herring served as Chief Investment Officer and Director of Fidelity Management & Research (U.K.) Inc. (2010-2013), Vice President (2005-2006) and Senior Vice President (2006-2007) of Fidelity Management & Research Company, Vice President of FMR Co., Inc. (2001-2007), and as a portfolio manager for Fidelity U.S. Equity Funds. |
Brian B. Hogan (1964) |
Year of Election or Appointment: 2009 Vice President |
| Mr. Hogan also serves as Vice President of other funds. Mr. Hogan serves as President of FMR's Equity Division (2009-present). Previously, Mr. Hogan served as Senior Vice President, Equity Research of FMR (2006-2009) and as a portfolio manager. |
Chris Maher (1972) |
Year of Election or Appointment: 2013 Assistant Treasurer |
| Mr. Maher serves as Assistant Treasurer of other funds. Mr. Maher is Vice President of Valuation Oversight and is an employee of Fidelity Investments. Previously, Mr. Maher served as Vice President of Asset Management Compliance (2013), Vice President of FMR's Program Management Group (2010-2013), and Vice President of Valuation Oversight (2008-2010). |
Christine Reynolds (1958) |
Year of Election or Appointment: 2008 Chief Financial Officer |
| Ms. Reynolds also serves as Chief Financial Officer of other funds. Ms. Reynolds became President of Fidelity Pricing and Cash Management Services (FPCMS) in August 2008. Ms. Reynolds served as Chief Operating Officer of FPCMS (2007-2008). Previously, Ms. Reynolds served as President, Treasurer, and Anti-Money Laundering officer of the Fidelity funds (2004-2007). |
Kenneth B. Robins (1969) |
Year of Election or Appointment: 2008 President and Treasurer |
| Mr. Robins also serves as an officer of other funds. Mr. Robins serves as Executive Vice President of Fidelity Investments Money Management, Inc. (FIMM) (2013-present) and is an employee of Fidelity Investments (2004-present). Previously, Mr. Robins served in other fund officer roles. |
Gary W. Ryan (1958) |
Year of Election or Appointment: 2005 Assistant Treasurer |
| Mr. Ryan also serves as Assistant Treasurer of other funds. Mr. Ryan is an employee of Fidelity Investments and has served in other fund officer roles. Previously, Mr. Ryan served as Vice President of Fund Reporting in Fidelity Pricing and Cash Management Services (FPCMS) (1999-2005). |
Stephen Sadoski (1971) |
Year of Election or Appointment: 2012 Deputy Treasurer |
| Mr. Sadoski also serves as Deputy Treasurer of other funds. He is an employee of Fidelity Investments (2012-present) and has served in another fund officer role. Prior to joining Fidelity Investments, Mr. Sadoski served as an assistant chief accountant in the Division of Investment Management of the Securities and Exchange Commission (SEC) (2009-2012) and as a senior manager at Deloitte & Touche LLP (1997-2009). |
Stacie M. Smith (1974) |
Year of Election or Appointment: 2013 Deputy Treasurer |
| Ms. Smith also serves as an officer of other funds. She is an employee of Fidelity Investments (2009-present) and has served in other fund officer roles. Prior to joining Fidelity Investments, Ms. Smith served as Senior Audit Manager of Ernst & Young LLP (1996-2009). |
Renee Stagnone (1975) |
Year of Election or Appointment: 2013 Deputy Treasurer |
| Ms. Stagnone also serves as Deputy Treasurer of other funds. Ms. Stagnone is an employee of Fidelity Investments. |
Joseph F. Zambello (1957) |
Year of Election or Appointment: 2011 Deputy Treasurer |
| Mr. Zambello also serves as Deputy Treasurer of other funds. Mr. Zambello is an employee of Fidelity Investments. Previously, Mr. Zambello served as Vice President of FMR's Program Management Group (2009-2011) and Vice President of the Transfer Agent Oversight Group (2005-2009). |
Annual Report
Service Class 2R designates 100% of the dividends distributed during the fiscal year as qualifying for the dividends-received deduction for corporate shareholders.
Annual Report
Board Approval of Investment Advisory Contracts and Management Fees
VIP Growth Portfolio
Each year, the Board of Trustees, including the Independent Trustees (together, the Board), votes on the renewal of the management contract and sub-advisory agreements (together, the Advisory Contracts) for the fund. The Board, assisted by the advice of fund counsel and Independent Trustees' counsel, requests and considers a broad range of information relevant to the renewal of the Advisory Contracts throughout the year.
The Board meets regularly and, at each of its meetings, covers an extensive agenda of topics and materials and considers factors that are relevant to its annual consideration of the renewal of the fund's Advisory Contracts, including the services and support provided to the fund and its shareholders. The Board has established various standing committees, each composed of and chaired by Independent Trustees with varying backgrounds, to which the Board has assigned specific subject matter responsibilities in order to enhance effective decision-making by the Board. The Board, acting directly and through its Committees, requests and receives information concerning the annual consideration of the renewal of the fund's Advisory Contracts. The Board also meets as needed to consider matters specifically related to the Board's annual consideration of the renewal of Advisory Contracts. Members of the Board may also meet with trustees of other Fidelity funds through ad hoc joint committees to discuss certain matters relevant to the Fidelity funds.
At its July 2013 meeting, the Board, including the Independent Trustees, unanimously determined to renew the fund's Advisory Contracts. In reaching its determination, the Board considered all factors it believed relevant, including (i) the nature, extent, and quality of the services to be provided to the fund and its shareholders (including the investment performance of the fund); (ii) the competitiveness of the fund's management fee and total expense ratio relative to peer funds; (iii) the total costs of the services to be provided by and the profits to be realized by Fidelity from its relationship with the fund; (iv) the extent to which economies of scale exist and would be realized as the fund grows; and (v) whether fee levels reflect these economies of scale, if any, for the benefit of fund shareholders.
In considering whether to renew the Advisory Contracts for the fund, the Board reached a determination, with the assistance of fund counsel and Independent Trustees' counsel and through the exercise of its business judgment, that the renewal of the Advisory Contracts was in the best interests of the fund and its shareholders and that the compensation payable under the Advisory Contracts was fair and reasonable. The Board's decision to renew the Advisory Contracts was not based on any single factor, but rather was based on a comprehensive consideration of all the information provided to the Board at its meetings throughout the year. The Board, in reaching its determination to renew the Advisory Contracts, was aware that shareholders in the fund have a broad range of investment choices available to them, including a wide choice among mutual funds offered by Fidelity's competitors, and that the fund's shareholders, who have the opportunity to review and weigh the disclosure provided by the fund in its prospectus and other public disclosures, have chosen to invest in this fund, which is a part of the Fidelity family of funds.
Nature, Extent, and Quality of Services Provided. The Board considered the staffing within the investment adviser, Fidelity Management & Research Company (FMR), and the sub-advisers (together, the Investment Advisers) as it relates to the fund, including the backgrounds of the fund's investment personnel, and also considered the fund's investment objective, strategies, and related investment philosophy. The Independent Trustees also had discussions with senior management of Fidelity's investment operations and investment groups. The Board considered the structure of the portfolio manager compensation program and whether this structure provides appropriate incentives to act in the best interests of the fund.
Resources Dedicated to Investment Management and Support Services. The Board and the Fund Oversight and Research Committees reviewed the general qualifications and capabilities of the Investment Advisers' investment staff, including its size, education, experience, and resources, as well as the Investment Advisers' approach to recruiting, training, managing, and compensating investment personnel. The Board noted that FMR has continued to increase the resources devoted to non-U.S. offices, including expansion of Fidelity's global investment organization. The Board also noted that Fidelity's analysts have extensive resources, tools and capabilities that allow them to conduct sophisticated quantitative and fundamental analysis, as well as credit analysis of issuers, counterparties and guarantors. Further, the Board believes that Fidelity's investment professionals have sufficient access to global information and data so as to provide competitive investment results over time, and that those professionals also have access to sophisticated tools that permit them to assess portfolio construction and risk and performance attribution characteristics continuously, as well as to transmit new information and research conclusions rapidly around the world. Additionally, in its deliberations, the Board considered the Investment Advisers' trading and risk management capabilities and resources, which are an integral part of the investment management process.
Shareholder and Administrative Services. The Board considered (i) the nature, extent, quality, and cost of advisory, administrative, and shareholder services performed by the Investment Advisers and their affiliates under the Advisory Contracts and under separate agreements covering transfer agency, pricing and bookkeeping, and securities lending services for the fund; (ii) the nature and extent of the supervision of third party service providers, principally custodians and subcustodians; and (iii) the resources devoted to, and the record of compliance with, the fund's compliance policies and procedures. The Board also reviewed the allocation of fund brokerage, including allocations to brokers affiliated with the Investment Advisers, the use of brokerage commissions to pay fund expenses, and the use of "soft" commission dollars to pay for research services.
The Board noted that the growth of fund assets over time across the complex allows Fidelity to reinvest in the development of services designed to enhance the value or convenience of the Fidelity funds as investment vehicles. These services include 24-hour access to account information and market information through telephone representatives and over the Internet, investor education materials and asset allocation tools, and the expanded availability of Fidelity Investor Centers.
Annual Report
Investment in a Large Fund Family. The Board considered the benefits to shareholders of investing in a Fidelity fund, including the benefits of investing in a fund that is part of a large family of funds offering a variety of investment disciplines and providing a large variety of mutual fund investor services. The Board noted that Fidelity had taken, or had made recommendations that resulted in the Fidelity funds taking, a number of actions over the previous year that benefited particular funds, including (i) continuing to dedicate additional resources to investment research and to the support of the senior management team that oversees asset management; (ii) persisting in efforts to enhance Fidelity's global research capabilities; (iii) launching new funds and making other enhancements to meet client needs for global and income-oriented solutions; (iv) continuing to launch dedicated lower cost underlying funds to meet portfolio construction needs related to expanding underlying fund options for Fidelity funds of funds, specifically for the Freedom Fund product lines; (v) rationalizing product lines and gaining increased efficiencies through the mergers of several funds into other funds; (vi) strengthening Fidelity's index fund offerings by reducing investment minimums and adopting or lowering existing expense caps for certain funds and classes; (vii) enhancing Global Asset Allocation product offerings by launching new funds and strategies, including "open architecture" target date funds that utilize affiliated and unaffiliated sub-advisers; (viii) modifying the eligibility criteria for Institutional Class shares of Advisor funds to increase their marketability to a portion of the defined contribution plan market; (ix) creating a new low-cost retirement share class for certain Advisor funds to appeal to large retirement plans; (x) transitioning the management of certain Fidelity commodity funds to Geode Capital Management LLC, a registered commodity pool operator, while retaining administrative responsibilities for the funds; (xi) reorganizing a number of funds; and (xii) taking steps toward establishing a new Fidelity adviser to manage sector-based funds and products.
Investment Performance. The Board considered whether the fund has operated in accordance with its investment objective, as well as its record of compliance with its investment restrictions and its performance history.
The Board took into account discussions with the Investment Advisers about fund investment performance that occur at Board meetings throughout the year. In this regard the Board noted that as part of regularly scheduled fund reviews and other reports to the Board on fund performance, the Board periodically considers annualized return information for the fund, for different time periods, measured against a securities market index ("benchmark index") and a peer group of mutual funds with similar objectives ("peer group"). In its evaluation of fund investment performance, the Board gave particular attention to information indicating changes in performance of certain Fidelity funds for specific time periods and the Investment Advisers' explanations for any overperformance or underperformance.
In addition to reviewing absolute and relative fund performance, the Independent Trustees periodically consider the appropriateness of fund performance metrics in evaluating the results achieved. In general, the Independent Trustees believe that fund performance should be evaluated based on net performance (after fees and expenses) of both the highest performing and lowest performing classes, where applicable, compared to appropriate benchmark indices, over appropriate time periods which may include full market cycles, and compared to peer groups, as applicable, over the same periods, taking into account relevant factors including the following: general market conditions; issuer-specific information; tactical opportunities for investment; and fund cash flows and other factors.
The Independent Trustees recognize that shareholders evaluate performance on a net basis over their own holding periods, for which one-, three-, and five-year periods are used as a proxy. For this reason, the performance information reviewed by the Board also included net cumulative calendar year total return information for the fund and an appropriate benchmark index and peer group for the most recent one-, three-, and five-year periods, as shown below. Returns are shown compared to the 25th percentile (top of box) and 75th percentile (bottom of box) of the peer universe.
Annual Report
Board Approval of Investment Advisory Contracts and Management Fees - continued
VIP Growth Portfolio

Based on its review, the Board concluded that the nature, extent, and quality of services provided to the fund under the Advisory Contracts should benefit the fund's shareholders.
Competitiveness of Management Fee and Total Expense Ratio. The Board considered the fund's management fee and total expense ratio compared to "mapped groups" of competitive funds and classes. Fidelity creates "mapped groups" by combining similar Lipper investment objective categories that have comparable management fee characteristics. Combining Lipper investment objective categories aids the Board's management fee and total expense ratio comparisons by broadening the competitive group used for comparison and by reducing the number of universes to which various Fidelity funds are compared.
Management Fee. The Board considered two proprietary management fee comparisons for the 12-month periods shown in the chart below. The group of Lipper funds used by the Board for management fee comparisons is referred to below as the "Total Mapped Group." The Total Mapped Group comparison focuses on a fund's standing in terms of gross management fees before expense reimbursements or caps relative to the total universe of funds with comparable investment mandates, regardless of whether their management fee structures also are comparable. Funds with comparable investment mandates offer exposure to similar types of securities. Funds with comparable management fee structures have similar management fee contractual arrangements (e.g., flat rate charged for advisory services, all-inclusive fee rate, etc.). "TMG %" represents the percentage of funds in the Total Mapped Group that had management fees that were lower than the fund's. For example, a TMG % of 10% means that 90% of the funds in the Total Mapped Group had higher management fees than the fund. The "Asset-Size Peer Group" (ASPG) comparison focuses on a fund's standing relative to a subset of non-Fidelity funds within the Total Mapped Group that are similar in size and management fee structure. The ASPG represents at least 15% of the funds in the Total Mapped Group with comparable asset size and management fee structures, subject to a minimum of 50 funds (or all funds in the Total Mapped Group if fewer than 50). Additional information, such as the ASPG quartile in which the fund's management fee ranked, is also included in the chart and considered by the Board.
Annual Report
VIP Growth Portfolio
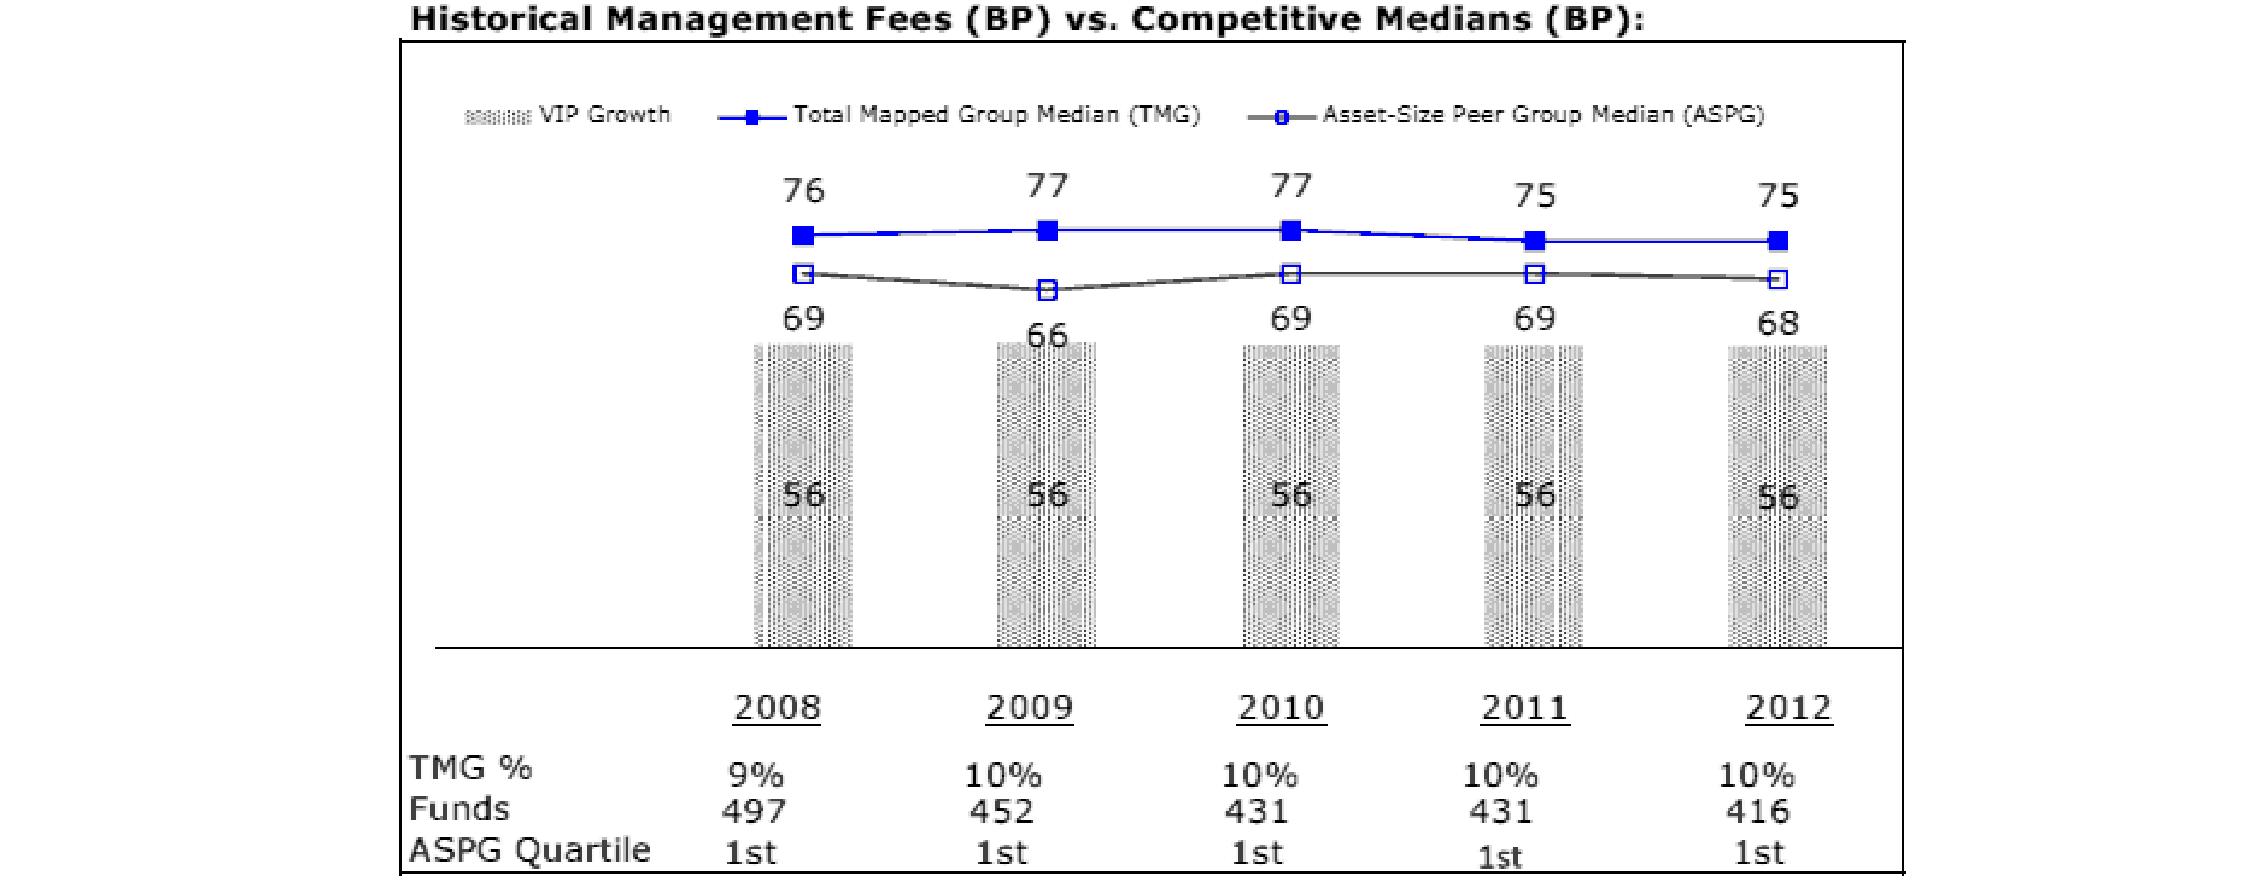
The Board noted that the fund's management fee ranked below the median of its Total Mapped Group and below the median of its ASPG for 2012.
Based on its review, the Board concluded that the fund's management fee is fair and reasonable in light of the services that the fund receives and the other factors considered.
Total Expense Ratio. In its review of each class's total expense ratio, the Board considered the fund's management fee as well as other fund or class expenses, as applicable, such as transfer agent fees, pricing and bookkeeping fees, fund-paid 12b-1 fees, and custodial, legal, and audit fees. The Board also noted the effects of any waivers and reimbursements on fees and expenses. As part of its review, the Board also considered the current and historical total expense ratios of each class of the fund compared to competitive fund median expenses. Each class of the fund is compared to those funds and classes in the Total Mapped Group (used by the Board for management fee comparisons) that have a similar sales load structure.
The Board noted that the total expense ratio of each class ranked below its competitive median for 2012.
Fees Charged to Other Fidelity Clients. The Board also considered Fidelity fee structures and other information with respect to clients of FMR and its affiliates, such as other mutual funds advised or subadvised by FMR or its affiliates, pension plan clients, and other institutional clients. The Board noted the findings of the 2013 ad hoc joint committee (created with the board of other Fidelity funds), which reviewed and compared Fidelity's institutional investment advisory business with its business of providing services to the Fidelity funds, including the differences in services provided, fees charged, and costs incurred, as well as competition in their respective marketplaces.
Based on its review of total expense ratios and fees charged to other Fidelity clients, the Board concluded that the total expense ratio of each class of the fund was reasonable in light of the services that the fund and its shareholders receive and the other factors considered.
Costs of the Services and Profitability. The Board considered the revenues earned and the expenses incurred by Fidelity in conducting the business of developing, marketing, distributing, managing, administering and servicing the fund and servicing the fund's shareholders. The Board also considered the level of Fidelity's profits in respect of all the Fidelity funds.
On an annual basis, FMR presents to the Board Fidelity's profitability for the fund. Fidelity calculates the profitability for each fund, as well as aggregate profitability for groups of Fidelity funds and all Fidelity funds, using a series of detailed revenue and cost allocation methodologies which originate with the books and records of Fidelity on which Fidelity's audited financial statements are based. The Audit Committee of the Board reviews any significant changes from the prior year's methodologies.
PricewaterhouseCoopers LLP (PwC), independent registered public accounting firm and auditor to Fidelity and certain Fidelity funds, has been engaged annually by the Board as part of the Board's assessment of Fidelity's profitability analysis. PwC's engagement includes the review and assessment of the methodologies used by Fidelity in determining the revenues and expenses attributable to Fidelity's mutual fund business, and completion of agreed-upon procedures surrounding the mathematical accuracy of fund profitability and its conformity to allocation methodologies. After considering PwC's reports issued under the engagement and information provided by Fidelity, the Board concluded that while other allocation methods may also be reasonable, Fidelity's profitability methodologies are reasonable in all material respects.
Annual Report
Board Approval of Investment Advisory Contracts and Management Fees - continued
The Board also reviewed Fidelity's non-fund businesses and fall-out benefits related to the mutual fund business as well as cases where Fidelity's affiliates may benefit from or be related to the fund's business.
The Board considered the costs of the services provided by and the profits realized by Fidelity in connection with the operation of the fund and was satisfied that the profitability was not excessive in the circumstances.
Economies of Scale. The Board considered whether there have been economies of scale in respect of the management of the Fidelity funds, whether the Fidelity funds (including the fund) have appropriately benefited from any such economies of scale, and whether there is potential for realization of any further economies of scale. The Board considered the extent to which the fund will benefit from economies of scale through increased services to the fund, through waivers or reimbursements, or through fee or expense reductions. The Board also noted that in 2009, it and the board of other Fidelity funds created an ad hoc committee (the Economies of Scale Committee) to analyze whether FMR attains economies of scale in respect of the management and servicing of the Fidelity funds, whether the Fidelity funds have appropriately benefited from such economies of scale, and whether there is potential for realization of any further economies of scale.
The Board recognized that the fund's management contract incorporates a "group fee" structure, which provides for lower group fee rates as total fund assets under FMR's management increase, and for higher group fee rates as total fund assets under FMR's management decrease. FMR calculates the group fee rates based on a tiered asset "breakpoint" schedule that varies based on asset class. The Board considered that the group fee is designed to deliver the benefits of economies of scale to fund shareholders when total Fidelity fund assets increase, even if assets of any particular fund are unchanged or have declined, because some portion of Fidelity's costs are attributable to services provided to all Fidelity funds, and all funds benefit if those costs can be allocated among more assets. The Board concluded that, given the group fee structure, fund shareholders will benefit from lower management fees as assets under FMR's management increase at the fund complex level, regardless of whether Fidelity achieves any such economies of scale.
The Board concluded, taking into account the analysis of the Economies of Scale Committee, that economies of scale, if any, are being appropriately shared between fund shareholders and Fidelity.
Amendment to Description of Group Fee Rate. At its July 2013 meeting, the Board voted to approve an amendment to the fund's management contract to modify the description of the "group fee rate" effective August 1, 2013. The Board noted that under the prior description in the contract, the group fee rate was based on the average net assets of all registered investment companies with which FMR has management contracts. Under the contract's tiered asset breakpoint schedule, the group fee rate is lower as total fund assets under FMR's management increase, and higher as total fund assets under FMR's management decrease. The Board considered that the prior description would have excluded the assets of 64 Fidelity sector funds from the group fee rate calculation once Fidelity SelectCo, LLC, an affiliate of FMR, assumed management responsibilities for those funds. The Board noted that modifying the description of the group fee rate to continue to include the assets of those 64 funds for purposes of determining group fee rate breakpoints would avoid an immediate adverse impact on the group fee rate for any fund.
Additional Information Requested by the Board. In order to develop fully the factual basis for consideration of the Fidelity funds' Advisory Contracts, the Board requested and received additional information on certain topics, including: (i) fund performance trends and Fidelity's long-term strategies for certain funds; (ii) the potential to further rationalize the Fidelity fund lineup with the possibility of achieving savings for the funds and Fidelity; (iii) the methodology with respect to competitive fund data and peer group classifications; (iv) the arrangements with, and performance of, certain sub-advisers on behalf of the Fidelity funds, as well as certain proposed participating affiliate arrangements; (v) the realization of fall-out benefits in certain Fidelity business units; (vi) Fidelity's group fee structures, including the rationale for the individual fee rates of certain categories of funds and the definition of group assets; (vii) trends regarding industry use of performance fee structures and the performance adjustment methodologies applicable to the Fidelity funds; (viii) additional competitive analysis regarding the total expenses for certain classes; and (ix) fund profitability methodology, including Fidelity's cost allocation methodology, and the impact of certain factors on fund profitability results.
Based on its evaluation of all of the conclusions noted above, and after considering all factors it believed relevant, the Board ultimately concluded that the advisory fee structures are fair and reasonable, and that the fund's Advisory Contracts should be renewed.
Annual Report
Investment Adviser
Fidelity Management & Research Company
Boston, MA
Investment Sub-Advisers
FMR Co., Inc.
Fidelity Management & Research (U.K.) Inc.
Fidelity Management & Research (Hong Kong) Limited
Fidelity Management & Research (Japan) Inc.
General Distributor
Fidelity Distributors Corporation
Smithfield, RI
Transfer and Service Agents
Fidelity Investments Institutional Operations Company, Inc.
Boston, MA
Fidelity Service Company, Inc.
Boston, MA
Custodian
State Street Bank and Trust Company
Quincy, MA
VIPGRWTR-ANN-0214
1.811845.109
Fidelity® Variable Insurance Products:
Equity-Income Portfolio
Annual Report
December 31, 2013
(Fidelity Cover Art)
Contents
Performance | (Click Here) | How the fund has done over time. |
Management's Discussion of Fund Performance | (Click Here) | The Portfolio Manager's review of fund performance and strategy. |
Shareholder Expense Example | (Click Here) | An example of shareholder expenses. |
Investment Changes | (Click Here) | A summary of major shifts in the fund's investments over the past six months. |
Investments | (Click Here) | A complete list of the fund's investments with their market values. |
Financial Statements | (Click Here) | Statements of assets and liabilities, operations, and changes in net assets, as well as financial highlights. |
Notes | (Click Here) | Notes to the financial statements. |
Report of Independent Registered Public Accounting Firm | (Click Here) | |
Trustees and Officers | (Click Here) | |
Distributions | (Click Here) | |
Board Approval of Investment Advisory Contracts and Management Fees | (Click Here) | |
To view a fund's proxy voting guidelines and proxy voting record for the 12-month period ended June 30, visit http://www.fidelity.com/proxyvotingresults or visit the Securities and Exchange Commission's (SEC) web site at http://www.sec.gov. You may also call 1-877-208-0098 to request a free copy of the proxy voting guidelines.
Fidelity Variable Insurance Products are separate account options which are purchased through a variable insurance contract.
Standard & Poor's, S&P and S&P 500 are registered service marks of The McGraw-Hill Companies, Inc. and have been licensed for use by Fidelity Distributors Corporation.
Other third-party marks appearing herein are the property of their respective owners.
All other marks appearing herein are registered or unregistered trademarks or service marks of FMR LLC or an affiliated company. © 2014 FMR LLC. All rights reserved.
This report and the financial statements contained herein are submitted for the general information of the shareholders of the fund. This report is not authorized for distribution to prospective investors in the fund unless preceded or accompanied by an effective prospectus.
A fund files its complete schedule of portfolio holdings with the SEC for the first and third quarters of each fiscal year on Form N-Q. Forms N-Q are available on the SEC's web site at http://www.sec.gov. A fund's Forms N-Q may be reviewed and copied at the SEC's Public Reference Room in Washington, DC. Information regarding the operation of the SEC's Public Reference Room may be obtained by calling 1-800-SEC-0330. For a complete list of a fund's portfolio holdings, view the most recent holdings listing, semiannual report, or annual report on Fidelity's web site at http://www.fidelity.com, http://www.advisor.fidelity.com, or http://www.401k.com, as applicable.
NOT FDIC INSURED • MAY LOSE VALUE • NO BANK GUARANTEE
Neither the fund nor Fidelity Distributors Corporation is a bank.
Annual Report
Average annual total return reflects the change in the value of an investment, assuming reinvestment of the class' distributions from dividend income and capital gains (the profits earned upon the sale of securities that have grown in value, if any) and assuming a constant rate of performance each year. During periods of reimbursement by Fidelity, a fund's total return will be greater than it would be had the reimbursement not occurred. Performance numbers are net of all underlying fund operating expenses, but do not include any insurance charges imposed by your insurance company's separate account. If performance information included the effect of these additional charges, the total returns would have been lower. How a fund did yesterday is no guarantee of how it will do tomorrow.
Average Annual Total Returns
Periods ended December 31, 2013 | Past 1
year | Past 5
years | Past 10
years |
VIP Equity-Income PortfolioSM - Initial Class | 28.15% | 17.88% | 6.52% |
VIP Equity-Income Portfolio - Service Class | 28.01% | 17.76% | 6.41% |
VIP Equity-Income Portfolio - Service Class 2 | 27.83% | 17.59% | 6.25% |
VIP Equity-Income Portfolio - Investor Class A | 27.99% | 17.78% | 6.43% |
A The initial offering of Investor Class shares took place on July 21, 2005. Returns prior to July 21, 2005, are those of Initial Class. Had Investor Class's transfer agent fee been reflected, returns prior to July 21, 2005, would have been lower.
$10,000 Over 10 Years
Let's say hypothetically that $10,000 was invested in VIP Equity-Income PortfolioSM - Initial Class on December 31, 2003. The chart shows how the value of your investment would have changed, and also shows how the Russell 3000® Value Index performed over the same period.
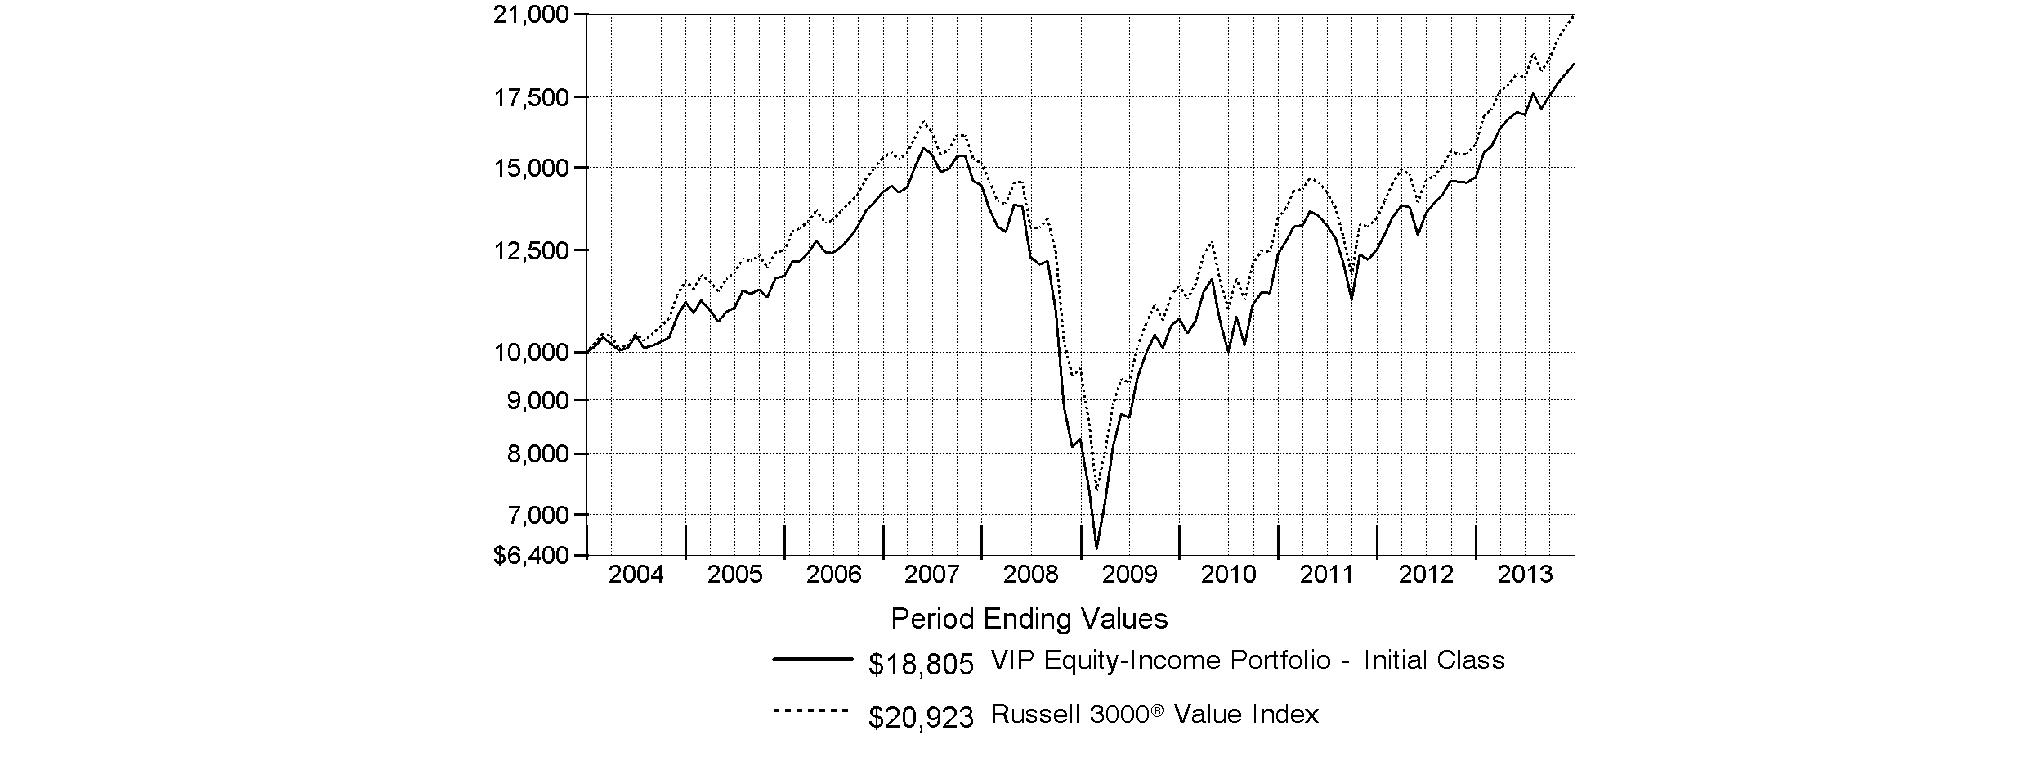
Annual Report
Market Recap: Global equity markets remained upbeat for the 12 months ending December 31, 2013, propelling the MSCI® ACWI® (All Country World Index) Index to a 23.24% return. Midyear turbulence gave way by autumn when policymakers in the U.S. and China had made clear their intentions to maintain accommodative monetary policies. That stance, combined with modest cyclical improvement around the globe and generally low valuations, underpinned the broad rally in equities, although the relative strength of the U.S. dollar generally tempered gains for U.S. investors holding foreign securities based in local currencies. During the period, the broad-market S&P 500® Index set a series of new highs, finishing the year up 32.39%. For the first time since 1995, the S&P® scored a "perfect 10," with all 10 economic sectors gaining at least 10% for the year. A resurgence in growth-oriented stocks lifted the Nasdaq Composite Index® to a 40.12% result for 2013, while the blue-chip Dow Jones Industrial AverageSM notched a relatively more modest 29.65% gain. International developed-markets equities rose in concert with their U.S. counterparts, with the MSCI® EAFE® Index gaining 22.92% for the period. Meanwhile, foreign exchange and commodity weakness curbed results in resource-heavy emerging markets (EM), especially in the year's waning months. More generally, concern over EM's slowing growth, its declining share of global trade and uncertainty surrounding U.S. central bank intentions were all factors hampering performance. The MSCI Emerging Markets Index returned -2.27% for the period. On the bond side, U.S. high-yield securities rallied with equities for much of the period, with The BofA Merrill LynchSM US High Yield Constrained Index returning 7.41% for 2013. The more rate-sensitive U.S. investment-grade bond category faced headwinds though, as reflected in the -2.02% return of the Barclays® U.S. Aggregate Bond Index. Within the Barclays index, investment-grade corporate credit returned -2.01%, while ultra-safe U.S. Treasuries saw a -2.75% result. Major non-U.S. developed markets performed only slightly better, with the Citigroup® Non-USD Group-of-Seven (G7) Equal Weighted Index logging a -1.59% result. After several years of strong advances, EM debt reversed course in 2013, with the J.P. Morgan Emerging Markets Bond Index Global returning -6.58%.
Comments from James Morrow, Lead Portfolio Manager of VIP Equity-Income Portfolio: For the year, the fund's share classes significantly trailed the benchmark Russell 3000® Value Index, which gained 32.69%. (For specific portfolio results, please refer to the performance section of this report.) Versus the index, stock selection was challenging, especially in information technology, industrials and energy. The fund's cash stake of 5% on average - a reflection of fewer attractive buying opportunities as the period progressed - also detracted. On the positive side, the fund benefited from helpful underweightings in the lagging real estate, utilities and materials sectors, and from overweighting the outperforming software & services industry. The biggest individual detractor was a sizable out-of-index stake in diversified technology stock IBM, which I liked for its competitive dividend, high-return business, solid earnings growth and attractive valuation. But in a market environment that rewarded fast-growing, momentum-oriented stocks, investors found steady growers like IBM to be relatively boring. I think owning "boring" stocks can be very profitable over the long term, which is why I added to my stake in IBM overall, but it was certainly a disappointment for the fund this past year. Other notable relative detractors were Netherlands-based energy producer Royal Dutch Shell and computer and peripherals maker Hewlett-Packard (HP). In the latter case, I avoided owning this benchmark component because I thought the company faced too many long-term headwinds. This decision did not work out well during the year, however, as HP's shares more than doubled. I did, however, invest in Royal Dutch Shell, an out-of-benchmark stock that lagged. Over time, I notably reduced the fund's stake, as I had hoped the company's dividend would grow more quickly. On the positive side, the fund benefited disproportionately from a couple of financials stocks - life insurance provider MetLife and a non-index stake in asset manager Blackstone Group, whose shares gained about 64% and 116%, respectively. Both are good examples of the types of businesses I like to own - they have healthy balance sheets, good dividends and strong competitive positions.
The views expressed above reflect those of the portfolio manager(s) only through the end of the period as stated on the cover of this report and do not necessarily represent the views of Fidelity or any other person in the Fidelity organization. Any such views are subject to change at any time based upon market or other conditions and Fidelity disclaims any responsibility to update such views. These views may not be relied on as investment advice and, because investment decisions for a Fidelity fund are based on numerous factors, may not be relied on as an indication of trading intent on behalf of any Fidelity fund.
Annual Report
As a shareholder of the Fund, you incur two types of costs: (1) transaction costs, including redemption fees and (2) ongoing costs, including management fees, distribution and/or service (12b-1) fees and other Fund expenses. This Example is intended to help you understand your ongoing costs (in dollars) of investing in the Fund and to compare these costs with the ongoing costs of investing in other mutual funds.
The Example is based on an investment of $1,000 invested at the beginning of the period and held for the entire period (July 1, 2013 to December 31, 2013).
Actual Expenses
The first line of the accompanying table for each class of the Fund provides information about actual account values and actual expenses. You may use the information in this line, together with the amount you invested, to estimate the expenses that you paid over the period. Simply divide your account value by $1,000.00 (for example, an $8,600 account value divided by $1,000.00 = 8.6), then multiply the result by the number in the first line for a class of the Fund under the heading entitled "Expenses Paid During Period" to estimate the expenses you paid on your account during this period. The estimate of expenses does not include any fees or other expenses of any variable annuity or variable life insurance product. If they were, the estimate of expenses you paid during the period would be higher, and your ending account value would be lower. In addition, the Fund, as a shareholder in the underlying Fidelity Central Funds, will indirectly bear its pro-rata share of the fees and expenses incurred by the underlying Fidelity Central Funds. These fees and expenses are not included in the Fund's annualized expense ratio used to calculate the expense estimate in the table below.
Hypothetical Example for Comparison Purposes
The second line of the accompanying table for each class of the Fund provides information about hypothetical account values and hypothetical expenses based on a Class' actual expense ratio and an assumed rate of return of 5% per year before expenses, which is not the Class' actual return. The hypothetical account values and expenses may not be used to estimate the actual ending account balance or expenses you paid for the period. You may use this information to compare the ongoing costs of investing in the Fund and other funds. To do so, compare this 5% hypothetical example with the 5% hypothetical examples that appear in the shareholder reports of the other funds. The estimate of expenses does not include any fees or other expenses of any variable annuity or variable life insurance product. If they were, the estimate of expenses you paid during the period would be higher, and your ending account value would be lower. In addition, the Fund, as a shareholder in the underlying Fidelity Central Funds, will indirectly bear its pro-rata share of the fees and expenses incurred by the underlying Fidelity Central Funds. These fees and expenses are not included in the Fund's annualized expense ratio used to calculate the expense estimate in the table below.
Please note that the expenses shown in the table are meant to highlight your ongoing costs only and do not reflect any transaction costs. Therefore, the second line of the table is useful in comparing ongoing costs only, and will not help you determine the relative total costs of owning different funds. In addition, if these transactional costs were included, your costs would have been higher.
| Annualized
Expense RatioB | Beginning
Account Value
July 1, 2013 | Ending
Account Value
December 31, 2013 | Expenses Paid
During Period*
July 1, 2013 to
December 31, 2013 |
Initial Class | .54% | | | |
Actual | | $ 1,000.00 | $ 1,117.70 | $ 2.88 |
HypotheticalA | | $ 1,000.00 | $ 1,022.48 | $ 2.75 |
Service Class | .64% | | | |
Actual | | $ 1,000.00 | $ 1,117.00 | $ 3.42 |
HypotheticalA | | $ 1,000.00 | $ 1,021.98 | $ 3.26 |
Service Class 2 | .79% | | | |
Actual | | $ 1,000.00 | $ 1,116.50 | $ 4.21 |
HypotheticalA | | $ 1,000.00 | $ 1,021.22 | $ 4.02 |
Service Class 2R | .79% | | | |
Actual | | $ 1,000.00 | $ 1,116.60 | $ 4.21 |
HypotheticalA | | $ 1,000.00 | $ 1,021.22 | $ 4.02 |
Investor Class | .62% | | | |
Actual | | $ 1,000.00 | $ 1,117.40 | $ 3.31 |
HypotheticalA | | $ 1,000.00 | $ 1,022.08 | $ 3.16 |
A 5% return per year before expenses
B Annualized expense ratio reflects expenses net of applicable fee waivers.
* Expenses are equal to each Class' annualized expense ratio, multiplied by the average account value over the period, multiplied by 184/365 (to reflect the one-half year period).
Annual Report
Investment Changes (Unaudited)
Top Ten Stocks as of December 31, 2013 |
| % of fund's
net assets | % of fund's net assets
6 months ago |
JPMorgan Chase & Co. | 4.1 | 3.9 |
Wells Fargo & Co.* | 3.1 | 2.9 |
Chevron Corp. | 3.0 | 2.9 |
General Electric Co. | 2.7 | 2.2 |
Exxon Mobil Corp. | 2.6 | 2.3 |
MetLife, Inc. | 2.4 | 2.1 |
Cisco Systems, Inc. | 2.3 | 2.3 |
Merck & Co., Inc. | 2.2 | 2.1 |
Procter & Gamble Co. | 2.1 | 2.5 |
Paychex, Inc. | 2.0 | 2.2 |
| 26.5 | |
* Security or a portion of the security is pledged as collateral for call options written.
Top Five Market Sectors as of December 31, 2013 |
| % of fund's
net assets | % of fund's net assets
6 months ago |
Financials | 22.2 | 22.3 |
Energy | 14.2 | 12.3 |
Health Care | 12.2 | 13.5 |
Information Technology | 11.9 | 11.1 |
Industrials | 10.5 | 10.4 |
Asset Allocation (% of fund's net assets) |
As of December 31, 2013* | As of June 30, 2013** |
 | Stocks 94.6% | | | Stocks 93.2% | |
 | Bonds 3.1% | | | Bonds 3.5% | |
 | Short-Term
Investments and
Net Other Assets
(Liabilities) 2.2% | | | Short-Term
Investments and
Net Other Assets
(Liabilities) 3.3% | |
 | Other Investments 0.1% | |  | Other Investments 0.0% | |
* Foreign investments | 12.2% | | ** Foreign investments | 9.7% | |
* Written options | (0.1)% | | ** Written options | 0.0% | |

Annual Report
Investments December 31, 2013
Showing Percentage of Net Assets
Common Stocks - 92.9% |
| Shares | | Value |
CONSUMER DISCRETIONARY - 7.6% |
Auto Components - 0.2% |
Gentex Corp. | 492,457 | | $ 16,246,156 |
Automobiles - 0.2% |
General Motors Co. (a) | 301,766 | | 12,333,176 |
Hotels, Restaurants & Leisure - 1.6% |
McDonald's Corp. | 547,900 | | 53,162,737 |
Texas Roadhouse, Inc. Class A | 550,397 | | 15,301,037 |
Wynn Resorts Ltd. | 29,950 | | 5,816,590 |
Yum! Brands, Inc. | 388,000 | | 29,336,680 |
| | 103,617,044 |
Leisure Equipment & Products - 0.4% |
New Academy Holding Co. LLC unit (j)(k) | 127,200 | | 23,350,104 |
Media - 2.7% |
Comcast Corp. Class A (h) | 1,708,043 | | 88,758,455 |
Sinclair Broadcast Group, Inc. Class A | 279,207 | | 9,976,066 |
Time Warner, Inc. | 1,085,308 | | 75,667,674 |
| | 174,402,195 |
Multiline Retail - 1.7% |
Kohl's Corp. | 526,300 | | 29,867,525 |
Target Corp. | 1,261,103 | | 79,789,987 |
| | 109,657,512 |
Specialty Retail - 0.6% |
Adastria Holdings Co. Ltd. | 77,930 | | 2,812,218 |
American Eagle Outfitters, Inc. | 716,039 | | 10,310,962 |
Foot Locker, Inc. | 352,385 | | 14,602,834 |
Staples, Inc. (h) | 854,036 | | 13,570,632 |
| | 41,296,646 |
Textiles, Apparel & Luxury Goods - 0.2% |
Coach, Inc. | 174,394 | | 9,788,735 |
TOTAL CONSUMER DISCRETIONARY | | 490,691,568 |
CONSUMER STAPLES - 9.4% |
Beverages - 1.9% |
Molson Coors Brewing Co. Class B (h) | 470,900 | | 26,441,035 |
PepsiCo, Inc. | 284,757 | | 23,617,746 |
The Coca-Cola Co. | 1,746,721 | | 72,157,045 |
| | 122,215,826 |
Food & Staples Retailing - 2.0% |
CVS Caremark Corp. | 428,200 | | 30,646,274 |
Wal-Mart Stores, Inc. | 395,978 | | 31,159,509 |
Walgreen Co. | 1,197,846 | | 68,804,274 |
| | 130,610,057 |
Food Products - 1.0% |
B&G Foods, Inc. Class A | 65,051 | | 2,205,879 |
Kellogg Co. | 951,557 | | 58,111,586 |
| | 60,317,465 |
Household Products - 2.1% |
Procter & Gamble Co. | 1,658,919 | | 135,052,596 |
|
| Shares | | Value |
Tobacco - 2.4% |
Altria Group, Inc. | 1,194,896 | | $ 45,872,057 |
British American Tobacco PLC sponsored ADR | 138,097 | | 14,834,380 |
Lorillard, Inc. | 996,073 | | 50,480,980 |
Philip Morris International, Inc. | 503,784 | | 43,894,700 |
| | 155,082,117 |
TOTAL CONSUMER STAPLES | | 603,278,061 |
ENERGY - 13.6% |
Energy Equipment & Services - 1.8% |
Ensco PLC Class A | 364,023 | | 20,814,835 |
Halliburton Co. | 35,476 | | 1,800,407 |
National Oilwell Varco, Inc. | 320,906 | | 25,521,654 |
Noble Corp. | 637,502 | | 23,887,200 |
Schlumberger Ltd. | 324,602 | | 29,249,886 |
Trinidad Drilling Ltd. | 1,191,800 | | 11,051,287 |
| | 112,325,269 |
Oil, Gas & Consumable Fuels - 11.8% |
Access Midstream Partners LP | 181,200 | | 10,252,296 |
Apache Corp. | 586,861 | | 50,434,834 |
BG Group PLC | 160,400 | | 3,446,347 |
Canadian Natural Resources Ltd. | 814,600 | | 27,561,049 |
Chevron Corp. | 1,533,580 | | 191,559,478 |
CONSOL Energy, Inc. | 566,142 | | 21,536,042 |
EV Energy Partners LP | 626,524 | | 21,257,959 |
Exxon Mobil Corp. | 1,644,369 | | 166,410,143 |
Holly Energy Partners LP | 290,744 | | 9,399,754 |
HollyFrontier Corp. | 275,460 | | 13,687,607 |
Legacy Reserves LP | 289,401 | | 8,149,532 |
Markwest Energy Partners LP | 530,529 | | 35,083,883 |
Occidental Petroleum Corp. | 545,587 | | 51,885,324 |
Royal Dutch Shell PLC Class A sponsored ADR | 449,629 | | 32,045,059 |
Scorpio Tankers, Inc. | 327,173 | | 3,857,370 |
Suncor Energy, Inc. | 1,054,300 | | 36,961,292 |
The Williams Companies, Inc. | 1,719,249 | | 66,311,434 |
Tsakos Energy Navigation Ltd. | 563,289 | | 3,385,367 |
Western Gas Equity Partners LP | 43,077 | | 1,701,972 |
Williams Partners LP | 155,800 | | 7,923,988 |
| | 762,850,730 |
TOTAL ENERGY | | 875,175,999 |
FINANCIALS - 21.2% |
Capital Markets - 3.9% |
Aberdeen Asset Management PLC | 243,300 | | 2,014,463 |
Apollo Investment Corp. | 1,896,163 | | 16,079,462 |
Ashmore Group PLC | 3,084,342 | | 20,496,462 |
BlackRock, Inc. Class A | 52,357 | | 16,569,420 |
Carlyle Group LP | 215,500 | | 7,676,110 |
Charles Schwab Corp. | 1,117,300 | | 29,049,800 |
Common Stocks - continued |
| Shares | | Value |
FINANCIALS - continued |
Capital Markets - continued |
Greenhill & Co., Inc. | 185,003 | | $ 10,719,074 |
Invesco Ltd. | 267,400 | | 9,733,360 |
KKR & Co. LP | 2,188,157 | | 53,259,741 |
Morgan Stanley | 956,575 | | 29,998,192 |
The Blackstone Group LP | 1,788,326 | | 56,332,269 |
| | 251,928,353 |
Commercial Banks - 5.5% |
CIT Group, Inc. | 180,538 | | 9,411,446 |
Comerica, Inc. | 331,820 | | 15,774,723 |
M&T Bank Corp. (h) | 341,091 | | 39,709,814 |
PNC Financial Services Group, Inc. | 176,200 | | 13,669,596 |
Standard Chartered PLC (United Kingdom) | 904,693 | | 20,374,519 |
U.S. Bancorp | 1,463,138 | | 59,110,775 |
Wells Fargo & Co. (h) | 4,405,586 | | 200,013,604 |
| | 358,064,477 |
Diversified Financial Services - 4.9% |
JPMorgan Chase & Co. | 4,555,040 | | 266,378,735 |
KKR Financial Holdings LLC | 4,013,060 | | 48,919,201 |
| | 315,297,936 |
Insurance - 4.7% |
ACE Ltd. | 526,611 | | 54,520,037 |
AFLAC, Inc. | 209,149 | | 13,971,153 |
Brasil Insurance Participacoes e Administracao SA | 338,500 | | 2,642,036 |
esure Group PLC | 1,874,500 | | 7,753,987 |
Fidelity National Financial, Inc. Class A | 46,200 | | 1,499,190 |
MetLife, Inc. | 2,824,531 | | 152,298,712 |
MetLife, Inc. unit | 309,915 | | 9,759,223 |
Prudential Financial, Inc. | 296,662 | | 27,358,170 |
Validus Holdings Ltd. | 858,447 | | 34,586,830 |
| | 304,389,338 |
Real Estate Investment Trusts - 2.0% |
American Capital Agency Corp. | 1,454,548 | | 28,058,231 |
Annaly Capital Management, Inc. | 2,356,009 | | 23,489,410 |
Coresite Realty Corp. | 168,047 | | 5,409,433 |
First Potomac Realty Trust | 1,025,993 | | 11,932,299 |
Home Properties, Inc. | 372,672 | | 19,982,673 |
Rayonier, Inc. | 249,081 | | 10,486,310 |
Retail Properties America, Inc. | 1,038,232 | | 13,206,311 |
Two Harbors Investment Corp. | 1,464,834 | | 13,593,660 |
Ventas, Inc. | 109,690 | | 6,283,043 |
| | 132,441,370 |
Real Estate Management & Development - 0.1% |
Beazer Pre-Owned Rental Homes, Inc. (a)(k) | 257,800 | | 5,413,800 |
|
| Shares | | Value |
Thrifts & Mortgage Finance - 0.1% |
Radian Group, Inc. | 301,008 | | $ 4,250,233 |
TOTAL FINANCIALS | | 1,371,785,507 |
HEALTH CARE - 11.2% |
Biotechnology - 0.5% |
Amgen, Inc. | 308,900 | | 35,264,024 |
Health Care Equipment & Supplies - 0.7% |
Baxter International, Inc. | 166,600 | | 11,587,030 |
Covidien PLC | 282,500 | | 19,238,250 |
Hologic, Inc. (a) | 84,800 | | 1,895,280 |
St. Jude Medical, Inc. | 230,561 | | 14,283,254 |
| | 47,003,814 |
Health Care Providers & Services - 1.6% |
Aetna, Inc. | 358,305 | | 24,576,140 |
Quest Diagnostics, Inc. | 249,482 | | 13,357,266 |
UnitedHealth Group, Inc. | 465,423 | | 35,046,352 |
WellPoint, Inc. | 306,360 | | 28,304,600 |
| | 101,284,358 |
Health Care Technology - 0.1% |
Quality Systems, Inc. | 298,853 | | 6,293,844 |
Pharmaceuticals - 8.3% |
AbbVie, Inc. | 314,624 | | 16,615,293 |
Actavis PLC (a) | 154,653 | | 25,981,704 |
Astellas Pharma, Inc. | 206,600 | | 12,248,661 |
AstraZeneca PLC sponsored ADR | 1,050,300 | | 62,356,311 |
Eli Lilly & Co. (h) | 574,977 | | 29,323,827 |
Johnson & Johnson | 1,316,268 | | 120,556,986 |
Merck & Co., Inc. | 2,790,960 | | 139,687,548 |
Pfizer, Inc. | 2,465,912 | | 75,530,885 |
Sanofi SA | 186,368 | | 19,903,159 |
Teva Pharmaceutical Industries Ltd. sponsored ADR | 840,322 | | 33,680,106 |
| | 535,884,480 |
TOTAL HEALTH CARE | | 725,730,520 |
INDUSTRIALS - 10.0% |
Aerospace & Defense - 1.1% |
United Technologies Corp. | 645,976 | | 73,512,069 |
Air Freight & Logistics - 2.1% |
C.H. Robinson Worldwide, Inc. | 645,416 | | 37,653,569 |
United Parcel Service, Inc. Class B | 954,645 | | 100,314,097 |
| | 137,967,666 |
Commercial Services & Supplies - 1.1% |
Intrum Justitia AB | 659,308 | | 18,451,214 |
Republic Services, Inc. | 1,651,826 | | 54,840,623 |
| | 73,291,837 |
Electrical Equipment - 0.6% |
Eaton Corp. PLC | 138,200 | | 10,519,784 |
Common Stocks - continued |
| Shares | | Value |
INDUSTRIALS - continued |
Electrical Equipment - continued |
Emerson Electric Co. | 197,603 | | $ 13,867,779 |
Hubbell, Inc. Class B | 124,100 | | 13,514,490 |
| | 37,902,053 |
Industrial Conglomerates - 2.7% |
General Electric Co. | 6,290,176 | | 176,313,633 |
Machinery - 1.6% |
Cummins, Inc. (h) | 190,300 | | 26,826,591 |
Douglas Dynamics, Inc. | 587,191 | | 9,876,553 |
Harsco Corp. | 502,809 | | 14,093,736 |
Stanley Black & Decker, Inc. | 593,906 | | 47,922,275 |
Stanley Black & Decker, Inc. unit (a) | 13,400 | | 1,382,880 |
| | 100,102,035 |
Professional Services - 0.5% |
Acacia Research Corp. | 505,926 | | 7,356,164 |
Michael Page International PLC | 2,755,399 | | 22,266,478 |
| | 29,622,642 |
Road & Rail - 0.3% |
Union Pacific Corp. | 113,977 | | 19,148,136 |
TOTAL INDUSTRIALS | | 647,860,071 |
INFORMATION TECHNOLOGY - 11.3% |
Communications Equipment - 2.3% |
Cisco Systems, Inc. | 6,683,452 | | 150,043,497 |
Computers & Peripherals - 0.9% |
Apple, Inc. | 97,496 | | 54,705,981 |
EMC Corp. | 193,864 | | 4,875,680 |
| | 59,581,661 |
Electronic Equipment & Components - 0.2% |
TE Connectivity Ltd. | 232,090 | | 12,790,480 |
IT Services - 4.3% |
Accenture PLC Class A | 538,971 | | 44,314,196 |
IBM Corp. | 551,563 | | 103,456,672 |
Paychex, Inc. | 2,812,986 | | 128,075,253 |
| | 275,846,121 |
Office Electronics - 0.0% |
Xerox Corp. | 117,700 | | 1,432,409 |
Semiconductors & Semiconductor Equipment - 1.8% |
Applied Materials, Inc. | 2,427,200 | | 42,937,168 |
Broadcom Corp. Class A | 1,660,160 | | 49,223,744 |
KLA-Tencor Corp. | 170,591 | | 10,996,296 |
Siliconware Precision Industries Co. Ltd. sponsored ADR | 2,523,619 | | 15,091,242 |
| | 118,248,450 |
Software - 1.8% |
CA Technologies, Inc. | 465,919 | | 15,678,174 |
Microsoft Corp. | 2,599,503 | | 97,299,397 |
| | 112,977,571 |
TOTAL INFORMATION TECHNOLOGY | | 730,920,189 |
|
| Shares | | Value |
MATERIALS - 0.9% |
Chemicals - 0.4% |
RPM International, Inc. | 475,052 | | $ 19,719,409 |
Sociedad Quimica y Minera de Chile SA (PN-B) sponsored ADR (e) | 240,803 | | 6,231,982 |
Tronox Ltd. Class A | 125,500 | | 2,895,285 |
| | 28,846,676 |
Metals & Mining - 0.5% |
Commercial Metals Co. | 731,327 | | 14,867,878 |
Freeport-McMoRan Copper & Gold, Inc. | 416,394 | | 15,714,710 |
| | 30,582,588 |
TOTAL MATERIALS | | 59,429,264 |
TELECOMMUNICATION SERVICES - 4.0% |
Diversified Telecommunication Services - 3.0% |
AT&T, Inc. | 1,894,159 | | 66,598,630 |
CenturyLink, Inc. | 1,114,725 | | 35,503,991 |
Verizon Communications, Inc. | 1,796,900 | | 88,299,666 |
| | 190,402,287 |
Wireless Telecommunication Services - 1.0% |
Vodafone Group PLC | 16,451,698 | | 64,773,521 |
TOTAL TELECOMMUNICATION SERVICES | | 255,175,808 |
UTILITIES - 3.7% |
Electric Utilities - 3.2% |
American Electric Power Co., Inc. | 349,172 | | 16,320,299 |
FirstEnergy Corp. | 565,359 | | 18,645,540 |
Hawaiian Electric Industries, Inc. (e) | 563,987 | | 14,697,501 |
NextEra Energy, Inc. | 377,921 | | 32,357,596 |
Northeast Utilities | 375,355 | | 15,911,298 |
PPL Corp. | 1,296,647 | | 39,016,108 |
Southern Co. | 1,347,177 | | 55,382,446 |
Xcel Energy, Inc. | 545,889 | | 15,252,139 |
| | 207,582,927 |
Multi-Utilities - 0.5% |
CenterPoint Energy, Inc. | 86,821 | | 2,012,511 |
Sempra Energy | 327,109 | | 29,361,304 |
| | 31,373,815 |
TOTAL UTILITIES | | 238,956,742 |
TOTAL COMMON STOCKS (Cost $4,513,509,884) |
5,999,003,729
|
Preferred Stocks - 1.7% |
| Shares | | Value |
Convertible Preferred Stocks - 1.1% |
FINANCIALS - 0.1% |
Real Estate Investment Trusts - 0.1% |
Weyerhaeuser Co. Series A, 6.375% | 111,500 | | $ 6,204,975 |
HEALTH CARE - 0.1% |
Health Care Equipment & Supplies - 0.1% |
Alere, Inc. 3.00% | 29,880 | | 8,554,644 |
INDUSTRIALS - 0.2% |
Aerospace & Defense - 0.2% |
United Technologies Corp. 7.50% | 179,400 | | 11,745,318 |
TELECOMMUNICATION SERVICES - 0.1% |
Wireless Telecommunication Services - 0.1% |
Crown Castle International Corp. Series A, 4.50% (a) | 93,900 | | 9,387,183 |
UTILITIES - 0.6% |
Electric Utilities - 0.2% |
NextEra Energy, Inc.: | | | |
5.889% | 90,807 | | 5,135,136 |
Series E, 5.599% | 158,600 | | 9,132,188 |
| | 14,267,324 |
Multi-Utilities - 0.4% |
CenterPoint Energy, Inc. 2.00% ZENS | 188,700 | | 9,884,106 |
Dominion Resources, Inc.: | | | |
Series A, 6.125% | 112,300 | | 6,077,676 |
Series B, 6.00% | 112,400 | | 6,093,204 |
| | 22,054,986 |
TOTAL UTILITIES | | 36,322,310 |
TOTAL CONVERTIBLE PREFERRED STOCKS | | 72,214,430 |
Nonconvertible Preferred Stocks - 0.6% |
CONSUMER DISCRETIONARY - 0.2% |
Automobiles - 0.2% |
Volkswagen AG | 46,518 | | 13,064,541 |
FINANCIALS - 0.4% |
Consumer Finance - 0.4% |
Ally Financial, Inc.: | | | |
7.00% (f) | 22,163 | | 21,165,665 |
Series A, 8.50% | 121,466 | | 3,261,362 |
| | 24,427,027 |
TOTAL NONCONVERTIBLE PREFERRED STOCKS | | 37,491,568 |
TOTAL PREFERRED STOCKS (Cost $96,029,323) |
109,705,998
|
Corporate Bonds - 3.1% |
| Principal
Amount (d) | | Value |
Convertible Bonds - 3.0% |
CONSUMER DISCRETIONARY - 0.2% |
Automobiles - 0.2% |
Volkswagen International Finance NV 5.5% 11/9/15 (f) | EUR | 6,400,000 | | $ 10,932,523 |
ENERGY - 0.6% |
Oil, Gas & Consumable Fuels - 0.6% |
Alpha Natural Resources, Inc. 3.75% 12/15/17 | | 12,370,000 | | 12,788,106 |
Amyris, Inc. 3% 2/27/17 | | 1,383,000 | | 1,308,429 |
BPZ Energy, Inc. 8.5% 10/1/17 | | 2,410,000 | | 2,132,850 |
Chesapeake Energy Corp. 2.5% 5/15/37 | | 8,660,000 | | 8,803,756 |
Cobalt International Energy, Inc. 2.625% 12/1/19 | | 3,520,000 | | 3,115,200 |
Ship Finance International Ltd. 3.25% 2/1/18 | | 9,290,000 | | 9,684,825 |
| | 37,833,166 |
FINANCIALS - 0.4% |
Insurance - 0.2% |
Fidelity National Financial, Inc. 4.25% 8/15/18 | | 8,210,000 | | 13,382,300 |
Thrifts & Mortgage Finance - 0.2% |
MGIC Investment Corp. 9% 4/1/63 (f) | | 10,438,000 | | 11,946,291 |
TOTAL FINANCIALS | | 25,328,591 |
HEALTH CARE - 0.9% |
Biotechnology - 0.1% |
Theravance, Inc. 2.125% 1/15/23 | | 4,670,000 | | 6,748,150 |
Health Care Equipment & Supplies - 0.2% |
Teleflex, Inc. 3.875% 8/1/17 | | 7,650,000 | | 12,107,655 |
Health Care Providers & Services - 0.6% |
HealthSouth Corp. 2% 12/1/43 | | 13,908,000 | | 14,656,250 |
WellPoint, Inc. 2.75% 10/15/42 | | 17,660,000 | | 23,907,225 |
| | 38,563,475 |
TOTAL HEALTH CARE | | 57,419,280 |
INDUSTRIALS - 0.3% |
Commercial Services & Supplies - 0.1% |
Covanta Holding Corp. 3.25% 6/1/14 | | 5,860,000 | | 6,856,200 |
Construction & Engineering - 0.2% |
Layne Christensen Co. 4.25% 11/15/18 (f) | | 3,060,000 | | 3,075,300 |
Corporate Bonds - continued |
| Principal
Amount (d) | | Value |
Convertible Bonds - continued |
INDUSTRIALS - continued |
Construction & Engineering - continued |
MasTec, Inc.: | | | | |
4% 6/15/14 | | $ 4,000,000 | | $ 8,320,000 |
4.25% 12/15/14 | | 550,000 | | 1,179,063 |
| | 12,574,363 |
TOTAL INDUSTRIALS | | 19,430,563 |
INFORMATION TECHNOLOGY - 0.6% |
Communications Equipment - 0.2% |
InterDigital, Inc. 2.5% 3/15/16 | | 12,210,000 | | 12,423,675 |
Liberty Interactive LLC 0.75% 3/30/43 (f) | | 2,100,000 | | 2,604,105 |
| | 15,027,780 |
Semiconductors & Semiconductor Equipment - 0.3% |
GT Advanced Technologies, Inc. 3% 10/1/17 | | 13,190,000 | | 18,078,544 |
Software - 0.1% |
TiVo, Inc. 4% 3/15/16 (f) | | 5,210,000 | | 7,092,894 |
TOTAL INFORMATION TECHNOLOGY | | 40,199,218 |
MATERIALS - 0.0% |
Chemicals - 0.0% |
RPM International, Inc. 2.25% 12/15/20 | | 1,500,000 | | 1,660,313 |
TOTAL CONVERTIBLE BONDS | | 192,803,654 |
Nonconvertible Bonds - 0.1% |
FINANCIALS - 0.0% |
Diversified Financial Services - 0.0% |
ILFC E-Capital Trust I 5.46% 12/21/65 (f)(i) | | 540,000 | | 494,100 |
|
| Principal
Amount (d) | | Value |
MATERIALS - 0.1% |
Metals & Mining - 0.1% |
Boart Longyear Management Pty Ltd. 7% 4/1/21 (f) | | $ 3,700,000 | | $ 2,765,750 |
JMC Steel Group, Inc. 8.25% 3/15/18 (f) | | 50,000 | | 50,500 |
Walter Energy, Inc. 8.5% 4/15/21 | | 5,250,000 | | 4,370,625 |
| | 7,186,875 |
TOTAL NONCONVERTIBLE BONDS | | 7,680,975 |
TOTAL CORPORATE BONDS (Cost $173,393,536) |
200,484,629
|
Preferred Securities - 0.1% |
| | | |
FINANCIALS - 0.1% |
Diversified Financial Services - 0.1% |
Baggot Securities Ltd. 10.24% (f)(g) (Cost $3,931,922) | 2,560,000 | | 4,016,327 |
Money Market Funds - 2.8% |
| Shares | | |
Fidelity Cash Central Fund, 0.11% (b) | 177,023,094 | | 177,023,094 |
Fidelity Securities Lending Cash Central Fund, 0.11% (b)(c) | 5,737,500 | | 5,737,500 |
TOTAL MONEY MARKET FUNDS (Cost $182,760,594) |
182,760,594
|
TOTAL INVESTMENT PORTFOLIO - 100.6% (Cost $4,969,625,259) | | 6,495,971,277 |
NET OTHER ASSETS (LIABILITIES) - (0.6)% | | (37,459,566) |
NET ASSETS - 100% | $ 6,458,511,711 |
Written Options |
| Expiration
Date/Exercise
Price | | Number of
Contracts | | Premium | | Value |
Call Options |
Comcast Corp. Class A | 1/18/14 -
$49.00 | | 3,668 | | $ 398,968 | | $ (1,155,420) |
Cummins, Inc. | 1/18/14 -
$140.00 | | 476 | | 72,542 | | (129,710) |
Eli Lilly & Co. | 1/18/14 -
$52.50 | | 2,875 | | 112,412 | | (44,563) |
M&T Bank Corp. | 1/18/14 -
$115.00 | | 845 | | 166,803 | | (217,588) |
Staples, Inc. | 1/18/14 -
$17.00 | | 2,135 | | 69,174 | | (10,675) |
Well Fargo & Co. | 1/18/14 -
$44.00 | | 21,691 | | 1,047,459 | | (3,579,014) |
TOTAL WRITTEN OPTIONS | | $ 1,867,358 | | $ (5,136,970) |
Currency Abbreviations |
EUR | - | European Monetary Unit |
Legend |
(a) Non-income producing |
(b) Affiliated fund that is generally available only to investment companies and other accounts managed by Fidelity Investments. The rate quoted is the annualized seven-day yield of the fund at period end. A complete unaudited listing of the fund's holdings as of its most recent quarter end is available upon request. In addition, each Fidelity Central Fund's financial statements, which are not covered by the Fund's Report of Independent Registered Public Accounting Firm, are available on the SEC's website or upon request. |
(c) Investment made with cash collateral received from securities on loan. |
(d) Amount is stated in United States dollars unless otherwise noted. |
(e) Security or a portion of the security is on loan at period end. |
(f) Security exempt from registration under Rule 144A of the Securities Act of 1933. These securities may be resold in transactions exempt from registration, normally to qualified institutional buyers. At the end of the period, the value of these securities amounted to $64,143,455 or 1.0% of net assets. |
(g) Security is perpetual in nature with no stated maturity date. |
(h) Security or a portion of the security is pledged as collateral for call options written. At period end, the value of securities pledged amounted to $152,140,579. |
(i) Coupon rates for floating and adjustable rate securities reflect the rates in effect at period end. |
(j) Investment is owned by an entity that is treated as a corporation for U.S. tax purposes and is owned by the Fund. |
(k) Restricted securities - Investment in securities not registered under the Securities Act of 1933 (excluding 144A issues). At the end of the period, the value of restricted securities (excluding 144A issues) amounted to $28,763,904 or 0.4% of net assets. |
Additional information on each restricted holding is as follows: |
Security | Acquisition Date | Acquisition Cost |
Beazer Pre-Owned Rental Homes, Inc. | 5/3/12 - 10/23/12 | $ 5,156,000 |
New Academy Holding Co. LLC unit | 8/1/11 | $ 13,406,880 |
Affiliated Central Funds |
Information regarding fiscal year to date income earned by the Fund from investments in Fidelity Central Funds is as follows: |
Fund | Income earned |
Fidelity Cash Central Fund | $ 266,191 |
Fidelity Securities Lending Cash Central Fund | 977,799 |
Total | $ 1,243,990 |
Other Information |
The following is a summary of the inputs used, as of December 31, 2013, involving the Fund's assets and liabilities carried at fair value. The inputs or methodology used for valuing securities may not be an indication of the risk associated with investing in those securities. For more information on valuation inputs, and their aggregation into the levels used in the tables below, please refer to the Investment Valuation section in the accompanying Notes to Financial Statements. |
Valuation Inputs at Reporting Date: |
Description | Total | Level 1 | Level 2 | Level 3 |
Investments in Securities: | | | | |
Equities: | | | | |
Consumer Discretionary | $ 503,756,109 | $ 477,593,787 | $ 2,812,218 | $ 23,350,104 |
Consumer Staples | 603,278,061 | 603,278,061 | - | - |
Energy | 875,175,999 | 875,175,999 | - | - |
Financials | 1,402,417,509 | 1,357,231,810 | 39,771,899 | 5,413,800 |
Health Care | 734,285,164 | 702,133,344 | 32,151,820 | - |
Industrials | 659,605,389 | 659,605,389 | - | - |
Information Technology | 730,920,189 | 730,920,189 | - | - |
Materials | 59,429,264 | 59,429,264 | - | - |
Telecommunication Services | 264,562,991 | 190,402,287 | 74,160,704 | - |
Utilities | 275,279,052 | 251,127,622 | 24,151,430 | - |
Corporate Bonds | 200,484,629 | - | 200,484,629 | - |
Preferred Securities | 4,016,327 | - | 4,016,327 | - |
Money Market Funds | 182,760,594 | 182,760,594 | - | - |
Total Investments in Securities: | $ 6,495,971,277 | $ 6,089,658,346 | $ 377,549,027 | $ 28,763,904 |
Derivative Instruments: | | | | |
Liabilities | | | | |
Written Options | $ (5,136,970) | $ (5,136,970) | $ - | $ - |
The following is a summary of transfers between Level 1 and Level 2 for the period ended December 31, 2013. Transfers are assumed to have occurred at the beginning of the period, and are primarily attributable to the valuation techniques used for foreign equity securities, as discussed in the accompanying Notes to Financial Statements: |
Transfers | Total |
Level 1 to Level 2 | $ 7,582,185 |
Level 2 to Level 1 | $ 70,127,828 |
Value of Derivative Instruments |
The following table is a summary of the Fund's value of derivative instruments by primary risk exposure as of December 31, 2013. For additional information on derivative instruments, please refer to the Derivative Instruments section in the accompanying Notes to Financial Statements. |
Primary Risk Exposure /
Derivative Type | Value |
| Asset | Liability |
Equity Risk | | |
Written Options (a) | $ - | $ (5,136,970) |
Total Value of Derivatives | $ - | $ (5,136,970) |
(a) Gross value is presented in the Statement of Assets and Liabilities in the written options, at value line-item. |
Distribution of investments by country or territory of incorporation, as a percentage of total net assets, is as follows (Unaudited): |
United States of America | 87.8% |
United Kingdom | 4.6% |
Ireland | 1.7% |
Canada | 1.2% |
Switzerland | 1.1% |
Bermuda | 1.0% |
Others (Individually Less Than 1%) | 2.6% |
| 100.0% |
See accompanying notes which are an integral part of the financial statements.
Annual Report
Statement of Assets and Liabilities
| December 31, 2013 |
| | |
Assets | | |
Investment in securities, at value (including securities loaned of $5,556,830) - See accompanying schedule: Unaffiliated issuers (cost $4,786,864,665) | $ 6,313,210,683 | |
Fidelity Central Funds (cost $182,760,594) | 182,760,594 | |
Total Investments (cost $4,969,625,259) | | $ 6,495,971,277 |
Cash | | 614,311 |
Receivable for investments sold | | 13,287,124 |
Receivable for fund shares sold | | 2,071,839 |
Dividends receivable | | 10,872,039 |
Interest receivable | | 1,581,529 |
Distributions receivable from Fidelity Central Funds | | 24,388 |
Prepaid expenses | | 15,583 |
Other receivables | | 314,170 |
Total assets | | 6,524,752,260 |
| | |
Liabilities | | |
Payable for investments purchased | $ 46,313,941 | |
Payable for fund shares redeemed | 5,349,185 | |
Accrued management fee | 2,386,342 | |
Distribution and service plan fees payable | 393,585 | |
Written options, at value (premium received $1,867,358) | 5,136,970 | |
Other affiliated payables | 470,567 | |
Other payables and accrued expenses | 452,459 | |
Collateral on securities loaned, at value | 5,737,500 | |
Total liabilities | | 66,240,549 |
| | |
Net Assets | | $ 6,458,511,711 |
Net Assets consist of: | | |
Paid in capital | | $ 4,946,469,899 |
Distributions in excess of net investment income | | (72,000) |
Accumulated undistributed net realized gain (loss) on investments and foreign currency transactions | | (11,038,434) |
Net unrealized appreciation (depreciation) on investments and assets and liabilities in foreign currencies | | 1,523,152,246 |
Net Assets | | $ 6,458,511,711 |
Statement of Assets and Liabilities - continued
| December 31, 2013 |
| | |
Initial Class:
Net Asset Value, offering price and redemption price per share ($3,947,727,657 ÷ 169,497,923 shares) | | $ 23.29 |
| | |
Service Class:
Net Asset Value, offering price and redemption price per share ($391,895,679 ÷ 16,890,227 shares) | | $ 23.20 |
| | |
Service Class 2:
Net Asset Value, offering price and redemption price per share ($1,755,769,154 ÷ 76,740,063 shares) | | $ 22.88 |
| | |
Service Class 2R:
Net Asset Value, offering price and redemption price per share ($11,979,811 ÷ 526,873 shares) | | $ 22.74 |
| | |
Investor Class:
Net Asset Value, offering price and redemption price per share ($351,139,410 ÷ 15,128,261 shares) | | $ 23.21 |
See accompanying notes which are an integral part of the financial statements.
Annual Report
Financial Statements - continued
Statement of Operations
| Year ended December 31, 2013 |
| | |
Investment Income | | |
Dividends | | $ 173,396,541 |
Interest | | 7,797,673 |
Income from Fidelity Central Funds | | 1,243,990 |
Total income | | 182,438,204 |
| | |
Expenses | | |
Management fee | $ 27,811,092 | |
Transfer agent fees | 4,481,786 | |
Distribution and service plan fees | 4,613,549 | |
Accounting and security lending fees | 1,137,350 | |
Custodian fees and expenses | 106,206 | |
Independent trustees' compensation | 33,128 | |
Appreciation in deferred trustee compensation account | 482 | |
Audit | 88,697 | |
Legal | 22,919 | |
Miscellaneous | 54,366 | |
Total expenses before reductions | 38,349,575 | |
Expense reductions | (420,027) | 37,929,548 |
Net investment income (loss) | | 144,508,656 |
Realized and Unrealized Gain (Loss) Net realized gain (loss) on: | | |
Investment securities: | | |
Unaffiliated issuers | 424,202,903 | |
Foreign currency transactions | (125,453) | |
Written options | 2,748,674 | |
Total net realized gain (loss) | | 426,826,124 |
Change in net unrealized appreciation (depreciation) on: Investment securities | 933,618,681 | |
Assets and liabilities in foreign currencies | 54,684 | |
Written options | (3,269,612) | |
Total change in net unrealized appreciation (depreciation) | | 930,403,753 |
Net gain (loss) | | 1,357,229,877 |
Net increase (decrease) in net assets resulting from operations | | $ 1,501,738,533 |
Statement of Changes in Net Assets
| Year ended
December 31,
2013 | Year ended
December 31,
2012 |
Increase (Decrease) in Net Assets | | |
Operations | | |
Net investment income (loss) | $ 144,508,656 | $ 160,196,451 |
Net realized gain (loss) | 426,826,124 | 225,861,427 |
Change in net unrealized appreciation (depreciation) | 930,403,753 | 499,587,896 |
Net increase (decrease) in net assets resulting from operations | 1,501,738,533 | 885,645,774 |
Distributions to shareholders from net investment income | (147,533,373) | (160,836,253) |
Distributions to shareholders from net realized gain | (403,959,921) | (361,842,958) |
Total distributions | (551,493,294) | (522,679,211) |
Share transactions - net increase (decrease) | (90,118,096) | (98,030,068) |
Redemption fees | 144 | 2,080 |
Total increase (decrease) in net assets | 860,127,287 | 264,938,575 |
| | |
Net Assets | | |
Beginning of period | 5,598,384,424 | 5,333,445,849 |
End of period (including distributions in excess of net investment income of $72,000 and distributions in excess of net investment income of $131,517, respectively) | $ 6,458,511,711 | $ 5,598,384,424 |
See accompanying notes which are an integral part of the financial statements.
Annual Report
Financial Highlights - Initial Class
Years ended December 31, | 2013 | 2012 | 2011 | 2010 | 2009 |
Selected Per-Share Data | | | | | |
Net asset value, beginning of period | $ 19.94 | $ 18.69 | $ 19.02 | $ 16.81 | $ 13.18 |
Income from Investment Operations | | | | | |
Net investment income (loss) C | .56 | .59 | .48 | .30 | .33 |
Net realized and unrealized gain (loss) | 4.96 | 2.59 | (.31) | 2.24 | 3.64 |
Total from investment operations | 5.52 | 3.18 | .17 | 2.54 | 3.97 |
Distributions from net investment income | (.60) | (.63) F | (.50) | (.33) | (.34) |
Distributions from net realized gain | (1.57) | (1.30) F | - | - | - |
Total distributions | (2.17) | (1.93) | (.50) | (.33) | (.34) |
Redemption fees added to paid in capital C, H | - | - | - | - | - |
Net asset value, end of period | $ 23.29 | $ 19.94 | $ 18.69 | $ 19.02 | $ 16.81 |
Total Return A, B | 28.15% | 17.31% | .97% | 15.15% | 30.21% |
Ratios to Average Net Assets D, G | | | | | |
Expenses before reductions | .55% | .55% | .56% | .56% | .58% |
Expenses net of fee waivers, if any | .54% | .55% | .55% | .55% | .58% |
Expenses net of all reductions | .54% | .54% | .54% | .55% | .58% |
Net investment income (loss) | 2.43% | 2.94% | 2.48% | 1.71% | 2.29% |
Supplemental Data | | | | | |
Net assets, end of period (000 omitted) | $ 3,947,728 | $ 3,461,083 | $ 3,345,762 | $ 3,798,310 | $ 3,771,733 |
Portfolio turnover rate E | 32% | 48% | 96% | 29% | 29% |
A Total returns do not reflect charges attributable to your insurance company's separate account. Inclusion of these charges would reduce the total returns shown.
B Total returns would have been lower if certain expenses had not been reduced during the applicable periods shown.
C Calculated based on average shares outstanding during the period.
D Fees and expenses of any underlying Fidelity Central Funds are not included in the Fund's expense ratio. The Fund indirectly bears its proportionate share of the expenses of any underlying Fidelity Central Funds.
E Amount does not include the portfolio activity of any underlying Fidelity Central Funds.
F The amounts shown reflect certain reclassifications related to book to tax differences that were made in the year shown.
G Expense ratios reflect operating expenses of the class. Expenses before reductions do not reflect amounts reimbursed by the investment adviser or reductions from brokerage service arrangements or reductions from other expense offset arrangements and do not represent the amount paid by the class during periods when reimbursements or reductions occur. Expenses net of fee waivers reflect expenses after reimbursement by the investment adviser but prior to reductions from brokerage service arrangements or other expense offset arrangements. Expenses net of all reductions represent the net expenses paid by the class.
H Amount represents less than $.01 per share.
Financial Highlights - Service Class
Years ended December 31, | 2013 | 2012 | 2011 | 2010 | 2009 |
Selected Per-Share Data | | | | | |
Net asset value, beginning of period | $ 19.87 | $ 18.63 | $ 18.96 | $ 16.75 | $ 13.14 |
Income from Investment Operations | | | | | |
Net investment income (loss) C | .53 | .57 | .46 | .28 | .31 |
Net realized and unrealized gain (loss) | 4.94 | 2.57 | (.31) | 2.24 | 3.63 |
Total from investment operations | 5.47 | 3.14 | .15 | 2.52 | 3.94 |
Distributions from net investment income | (.57) | (.60) F | (.48) | (.31) | (.33) |
Distributions from net realized gain | (1.57) | (1.30) F | - | - | - |
Total distributions | (2.14) | (1.90) | (.48) | (.31) | (.33) |
Redemption fees added to paid in capital C, H | - | - | - | - | - |
Net asset value, end of period | $ 23.20 | $ 19.87 | $ 18.63 | $ 18.96 | $ 16.75 |
Total Return A, B | 28.01% | 17.19% | .86% | 15.09% | 30.03% |
Ratios to Average Net Assets D, G | | | | | |
Expenses before reductions | .65% | .65% | .66% | .66% | .68% |
Expenses net of fee waivers, if any | .64% | .65% | .66% | .65% | .68% |
Expenses net of all reductions | .64% | .64% | .64% | .65% | .68% |
Net investment income (loss) | 2.33% | 2.84% | 2.38% | 1.61% | 2.19% |
Supplemental Data | | | | | |
Net assets, end of period (000 omitted) | $ 391,896 | $ 350,493 | $ 347,999 | $ 414,431 | $ 430,383 |
Portfolio turnover rate E | 32% | 48% | 96% | 29% | 29% |
A Total returns do not reflect charges attributable to your insurance company's separate account. Inclusion of these charges would reduce the total returns shown.
B Total returns would have been lower if certain expenses had not been reduced during the applicable periods shown.
C Calculated based on average shares outstanding during the period.
D Fees and expenses of any underlying Fidelity Central Funds are not included in the Fund's expense ratio. The Fund indirectly bears its proportionate share of the expenses of any underlying Fidelity Central Funds.
E Amount does not include the portfolio activity of any underlying Fidelity Central Funds.
F The amounts shown reflect certain reclassifications related to book to tax differences that were made in the year shown.
G Expense ratios reflect operating expenses of the class. Expenses before reductions do not reflect amounts reimbursed by the investment adviser or reductions from brokerage service arrangements or reductions from other expense offset arrangements and do not represent the amount paid by the class during periods when reimbursements or reductions occur. Expenses net of fee waivers reflect expenses after reimbursement by the investment adviser but prior to reductions from brokerage service arrangements or other expense offset arrangements. Expenses net of all reductions represent the net expenses paid by the class.
H Amount represents less than $.01 per share.
See accompanying notes which are an integral part of the financial statements.
Annual Report
Financial Highlights - Service Class 2
Years ended December 31, | 2013 | 2012 | 2011 | 2010 | 2009 |
Selected Per-Share Data | | | | | |
Net asset value, beginning of period | $ 19.62 | $ 18.41 | $ 18.75 | $ 16.57 | $ 13.00 |
Income from Investment Operations | | | | | |
Net investment income (loss) C | .49 | .53 | .42 | .25 | .29 |
Net realized and unrealized gain (loss) | 4.88 | 2.55 | (.31) | 2.21 | 3.58 |
Total from investment operations | 5.37 | 3.08 | .11 | 2.46 | 3.87 |
Distributions from net investment income | (.54) | (.57) F | (.45) | (.28) | (.30) |
Distributions from net realized gain | (1.57) | (1.30) F | - | - | - |
Total distributions | (2.11) | (1.87) | (.45) | (.28) | (.30) |
Redemption fees added to paid in capital C, H | - | - | - | - | - |
Net asset value, end of period | $ 22.88 | $ 19.62 | $ 18.41 | $ 18.75 | $ 16.57 |
Total Return A, B | 27.83% | 17.05% | .66% | 14.92% | 29.88% |
Ratios to Average Net Assets D, G | | | | | |
Expenses before reductions | .80% | .80% | .81% | .81% | .83% |
Expenses net of fee waivers, if any | .79% | .80% | .81% | .80% | .83% |
Expenses net of all reductions | .79% | .79% | .80% | .80% | .83% |
Net investment income (loss) | 2.18% | 2.69% | 2.23% | 1.46% | 2.04% |
Supplemental Data | | | | | |
Net assets, end of period (000 omitted) | $ 1,755,769 | $ 1,560,856 | $ 1,457,230 | $ 1,619,356 | $ 1,558,421 |
Portfolio turnover rate E | 32% | 48% | 96% | 29% | 29% |
A Total returns do not reflect charges attributable to your insurance company's separate account. Inclusion of these charges would reduce the total returns shown.
B Total returns would have been lower if certain expenses had not been reduced during the applicable periods shown.
C Calculated based on average shares outstanding during the period.
D Fees and expenses of any underlying Fidelity Central Funds are not included in the Fund's expense ratio. The Fund indirectly bears its proportionate share of the expenses of any underlying Fidelity Central Funds.
E Amount does not include the portfolio activity of any underlying Fidelity Central Funds.
F The amounts shown reflect certain reclassifications related to book to tax differences that were made in the year shown.
G Expense ratios reflect operating expenses of the class. Expenses before reductions do not reflect amounts reimbursed by the investment adviser or reductions from brokerage service arrangements or reductions from other expense offset arrangements and do not represent the amount paid by the class during periods when reimbursements or reductions occur. Expenses net of fee waivers reflect expenses after reimbursement by the investment adviser but prior to reductions from brokerage service arrangements or other expense offset arrangements. Expenses net of all reductions represent the net expenses paid by the class.
H Amount represents less than $.01 per share.
Financial Highlights - Service Class 2R
Years ended December 31, | 2013 | 2012 | 2011 | 2010 | 2009 |
Selected Per-Share Data | | | | | |
Net asset value, beginning of period | $ 19.53 | $ 18.34 | $ 18.66 | $ 16.49 | $ 12.93 |
Income from Investment Operations | | | | | |
Net investment income (loss) C | .49 | .53 | .42 | .25 | .28 |
Net realized and unrealized gain (loss) | 4.84 | 2.54 | (.30) | 2.20 | 3.58 |
Total from investment operations | 5.33 | 3.07 | .12 | 2.45 | 3.86 |
Distributions from net investment income | (.55) | (.58) F | (.44) | (.28) | (.30) |
Distributions from net realized gain | (1.57) | (1.30) F | - | - | - |
Total distributions | (2.12) | (1.88) | (.44) | (.28) | (.30) |
Redemption fees added to paid in capital C, H | - | - | - | - | - |
Net asset value, end of period | $ 22.74 | $ 19.53 | $ 18.34 | $ 18.66 | $ 16.49 |
Total Return A, B | 27.79% | 17.05% | .70% | 14.90% | 29.95% |
Ratios to Average Net Assets D, G | | | | | |
Expenses before reductions | .79% | .80% | .81% | .81% | .83% |
Expenses net of fee waivers, if any | .79% | .80% | .80% | .80% | .83% |
Expenses net of all reductions | .79% | .79% | .79% | .80% | .83% |
Net investment income (loss) | 2.19% | 2.69% | 2.23% | 1.46% | 2.04% |
Supplemental Data | | | | | |
Net assets, end of period (000 omitted) | $ 11,980 | $ 5,640 | $ 3,956 | $ 5,405 | $ 5,259 |
Portfolio turnover rate E | 32% | 48% | 96% | 29% | 29% |
A Total returns do not reflect charges attributable to your insurance company's separate account. Inclusion of these charges would reduce the total returns shown.
B Total returns would have been lower if certain expenses had not been reduced during the applicable periods shown.
C Calculated based on average shares outstanding during the period.
D Fees and expenses of any underlying Fidelity Central Funds are not included in the Fund's expense ratio. The Fund indirectly bears its proportionate share of the expenses of any underlying Fidelity Central Funds.
E Amount does not include the portfolio activity of any underlying Fidelity Central Funds.
F The amounts shown reflect certain reclassifications related to book to tax differences that were made in the year shown.
G Expense ratios reflect operating expenses of the class. Expenses before reductions do not reflect amounts reimbursed by the investment adviser or reductions from brokerage service arrangements or reductions from other expense offset arrangements and do not represent the amount paid by the class during periods when reimbursements or reductions occur. Expenses net of fee waivers reflect expenses after reimbursement by the investment adviser but prior to reductions from brokerage service arrangements or other expense offset arrangements. Expenses net of all reductions represent the net expenses paid by the class.
H Amount represents less than $.01 per share.
See accompanying notes which are an integral part of the financial statements.
Annual Report
Financial Highlights - Investor Class
Years ended December 31, | 2013 | 2012 | 2011 | 2010 | 2009 |
Selected Per-Share Data | | | | | |
Net asset value, beginning of period | $ 19.89 | $ 18.64 | $ 18.97 | $ 16.77 | $ 13.15 |
Income from Investment Operations | | | | | |
Net investment income (loss) C | �� .54 | .57 | .46 | .28 | .31 |
Net realized and unrealized gain (loss) | 4.93 | 2.59 | (.31) | 2.23 | 3.64 |
Total from investment operations | 5.47 | 3.16 | .15 | 2.51 | 3.95 |
Distributions from net investment income | (.58) | (.61) F | (.48) | (.31) | (.33) |
Distributions from net realized gain | (1.57) | (1.30) F | - | - | - |
Total distributions | (2.15) | (1.91) | (.48) | (.31) | (.33) |
Redemption fees added to paid in capital C, H | - | - | - | - | - |
Net asset value, end of period | $ 23.21 | $ 19.89 | $ 18.64 | $ 18.97 | $ 16.77 |
Total Return A, B | 27.99% | 17.27% | .89% | 15.04% | 30.09% |
Ratios to Average Net Assets D, G | | | | | |
Expenses before reductions | .63% | .64% | .64% | .65% | .68% |
Expenses net of fee waivers, if any | .62% | .64% | .64% | .64% | .68% |
Expenses net of all reductions | .62% | .63% | .63% | .64% | .68% |
Net investment income (loss) | 2.35% | 2.85% | 2.39% | 1.62% | 2.19% |
Supplemental Data | | | | | |
Net assets, end of period (000 omitted) | $ 351,139 | $ 220,311 | $ 178,499 | $ 165,946 | $ 147,358 |
Portfolio turnover rate E | 32% | 48% | 96% | 29% | 29% |
A Total returns do not reflect charges attributable to your insurance company's separate account. Inclusion of these charges would reduce the total returns shown.
B Total returns would have been lower if certain expenses had not been reduced during the applicable periods shown.
C Calculated based on average shares outstanding during the period.
D Fees and expenses of any underlying Fidelity Central Funds are not included in the Fund's expense ratio. The Fund indirectly bears its proportionate share of the expenses of any underlying Fidelity Central Funds.
E Amount does not include the portfolio activity of any underlying Fidelity Central Funds.
F The amounts shown reflect certain reclassifications related to book to tax differences that were made in the year shown.
G Expense ratios reflect operating expenses of the class. Expenses before reductions do not reflect amounts reimbursed by the investment adviser or reductions from brokerage service arrangements or reductions from other expense offset arrangements and do not represent the amount paid by the class during periods when reimbursements or reductions occur. Expenses net of fee waivers reflect expenses after reimbursement by the investment adviser but prior to reductions from brokerage service arrangements or other expense offset arrangements. Expenses net of all reductions represent the net expenses paid by the class.
H Amount represents less than $.01 per share.
See accompanying notes which are an integral part of the financial statements.
Annual Report
Notes to Financial Statements
For the period ended December 31, 2013
1. Organization.
VIP Equity-Income Portfolio (the Fund) is a fund of Variable Insurance Products Fund (the Trust) and is authorized to issue an unlimited number of shares. The Trust is registered under the Investment Company Act of 1940, as amended (the 1940 Act), as an open-end management investment company organized as a Massachusetts business trust. Shares of the Fund may only be purchased by insurance companies for the purpose of funding variable annuity or variable life insurance contracts. The Fund offers the following classes of shares: Initial Class shares, Service Class shares, Service Class 2 shares, Service Class 2R shares and Investor Class shares. All classes have equal rights and voting privileges, except for matters affecting a single class.
2. Investments in Fidelity Central Funds.
The Fund invests in Fidelity Central Funds, which are open-end investment companies generally available only to other investment companies and accounts managed by the investment adviser and its affiliates. The Fund's Schedule of Investments lists each of the Fidelity Central Funds held as of period end, if any, as an investment of the Fund, but does not include the underlying holdings of each Fidelity Central Fund. As an Investing Fund, the Fund indirectly bears its proportionate share of the expenses of the underlying Fidelity Central Funds.
The Money Market Central Funds seek preservation of capital and current income and are managed by Fidelity Investments Money Management, Inc. (FIMM), an affiliate of the investment adviser. Annualized expenses of the Money Market Central Funds as of their most recent shareholder report date are less than .01%.
A complete unaudited list of holdings for each Fidelity Central Fund is available upon request or at the Securities and Exchange Commission (the SEC) website at www.sec.gov. In addition, the financial statements of the Fidelity Central Funds, which are not covered by the Fund's Report of Independent Registered Public Accounting Firm, are available on the SEC website or upon request.
3. Significant Accounting Policies.
The financial statements have been prepared in conformity with accounting principles generally accepted in the United States of America (GAAP), which require management to make certain estimates and assumptions at the date of the financial statements. Actual results could differ from those estimates. Subsequent events, if any, through the date that the financial statements were issued have been evaluated in the preparation of the financial statements. The following summarizes the significant accounting policies of the Fund:
Investment Valuation. Investments are valued as of 4:00 p.m. Eastern time on the last calendar day of the period. In accordance with valuation policies and procedures approved by the Board of Trustees (the Board), the Fund attempts to obtain prices from one or more third party pricing vendors or brokers to value its investments. When current market prices, quotations or currency exchange rates are not readily available or reliable, investments will be fair valued in good faith by the Fidelity Management & Research Company (FMR) Fair Value Committee (the Committee), in accordance with procedures adopted by the Board. Factors used in determining fair value vary by investment type and may include market or investment specific events, changes in interest rates and credit quality. The frequency with which these procedures are used cannot be predicted and they may be utilized to a significant extent. The Committee oversees the Fund's valuation policies and procedures and is responsible for approving and reporting to the Board all fair value determinations.
The Fund categorizes the inputs to valuation techniques used to value its investments into a disclosure hierarchy consisting of three levels as shown below:
Level 1 - quoted prices in active markets for identical investments
Level 2 - other significant observable inputs (including quoted prices for similar investments, interest rates, prepayment speeds, etc.)
Level 3 - unobservable inputs (including the Fund's own assumptions based on the best information available)
Valuation techniques used to value the Fund's investments by major category are as follows:
Equity securities, including restricted securities, for which market quotations are readily available, are valued at the last reported sale price or official closing price as reported by a third party pricing vendor on the primary market or exchange on which they are traded and are categorized as Level 1 in the hierarchy. In the event there were no sales during the day or closing prices are not available, securities are valued at the last quoted bid price or may be valued using the last available price and are generally categorized as Level 2 in the hierarchy. For foreign equity securities, when market or security specific events arise, comparisons to the valuation of American Depositary Receipts (ADRs), futures contracts, Exchange-Traded Funds (ETFs) and certain indexes as well as quoted prices for similar securities may be used and would be categorized as Level 2 in the hierarchy. Utilizing these techniques may result in transfers between Level 1 and Level 2. For equity securities, including restricted securities, where observable inputs are limited, assumptions about market activity and risk are used and these securities may be categorized as Level 3 in the hierarchy.
Annual Report
3. Significant Accounting Policies - continued
Investment Valuation - continued
Debt securities, including restricted securities, are valued based on evaluated prices received from third party pricing vendors or from brokers who make markets in such securities. Corporate bonds and preferred securities are valued by pricing vendors who utilize matrix pricing which considers yield or price of bonds of comparable quality, coupon, maturity and type or by broker-supplied prices. When independent prices are unavailable or unreliable, debt securities may be valued utilizing pricing methodologies which consider similar factors that would be used by third party pricing vendors. Debt securities are generally categorized as Level 2 in the hierarchy but may be Level 3 depending on the circumstances.
Exchange-traded options are valued using the last sale price or, in the absence of a sale, the last offering price and are categorized as Level 1 in the hierarchy. Investments in open-end mutual funds, including the Fidelity Central Funds, are valued at their closing net asset value (NAV) each business day and are categorized as Level 1 in the hierarchy.
Changes in valuation techniques may result in transfers in or out of an assigned level within the disclosure hierarchy. The aggregate value of investments by input level, as of December 31, 2013, including information on transfers between Levels 1 and 2, is included at the end of the Fund's Schedule of Investments.
Foreign Currency. The Fund may use foreign currency contracts to facilitate transactions in foreign-denominated securities. Gains and losses from these transactions may arise from changes in the value of the foreign currency or if the counterparties do not perform under the contracts' terms.
Foreign-denominated assets, including investment securities, and liabilities are translated into U.S. dollars at the exchange rates at period end. Purchases and sales of investment securities, income and dividends received and expenses denominated in foreign currencies are translated into U.S. dollars at the exchange rate in effect on the transaction date.
The effects of exchange rate fluctuations on investments are included with the net realized and unrealized gain (loss) on investment securities. Other foreign currency transactions resulting in realized and unrealized gain (loss) are disclosed separately.
Investment Transactions and Income. For financial reporting purposes, the Fund's investment holdings and NAV include trades executed through the end of the last business day of the period. The NAV per share for processing shareholder transactions is calculated as of the close of business of the New York Stock Exchange (NYSE), normally 4:00 p.m. Eastern time and includes trades executed through the end of the prior business day. Gains and losses on securities sold are determined on the basis of identified cost and may include proceeds received from litigation. Dividend income is recorded on the ex-dividend date, except for certain dividends from foreign securities where the ex-dividend date may have passed, which are recorded as soon as the Fund is informed of the ex-dividend date. Non-cash dividends included in dividend income, if any, are recorded at the fair market value of the securities received. Distributions received on securities that represent a return of capital or capital gain are recorded as a reduction of cost of investments and/or as a realized gain. Subsequent to ex-dividend date the Fund determines the components of these distributions, based upon receipt of tax filings or other correspondence relating to the underlying investment. Interest income and distributions from the Fidelity Central Funds are accrued as earned. Interest income includes coupon interest and amortization of premium and accretion of discount on debt securities. Investment income is recorded net of foreign taxes withheld where recovery of such taxes is uncertain.
Class Allocations and Expenses. Investment income, realized and unrealized capital gains and losses, common expenses of the Fund, and certain fund-level expense reductions, if any, are allocated daily on a pro-rata basis to each class based on the relative net assets of each class to the total net assets of the Fund. Each class differs with respect to transfer agent and distribution and service plan fees incurred. Certain expense reductions may also differ by class. For the reporting period, the allocated portion of income and expenses to each class as a percent of its average net assets may vary due to the timing of recording these transactions in relation to fluctuating net assets of the classes. Expenses directly attributable to a fund are charged to that fund. Expenses attributable to more than one fund are allocated among the respective funds on the basis of relative net assets or other appropriate methods. Expense estimates are accrued in the period to which they relate and adjustments are made when actual amounts are known.
Deferred Trustee Compensation. Under a Deferred Compensation Plan (the Plan), independent Trustees may elect to defer receipt of a portion of their annual compensation. Deferred amounts are invested in a cross-section of Fidelity funds, are marked-to-market and remain in the Fund until distributed in accordance with the Plan. The investment of deferred amounts and the offsetting payable to the Trustees are included in the accompanying Statement of Assets and Liabilities.
Income Tax Information and Distributions to Shareholders. Each year, the Fund intends to qualify as a regulated investment company under Subchapter M of the Internal Revenue Code, including distributing substantially all of its taxable income and realized gains. As a result, no provision for U.S. Federal income taxes is required. As of December 31, 2013, the Fund did not have any unrecognized tax benefits in the financial statements; nor is the Fund aware of any tax positions for which it is reasonably possible that the total amounts of unrecognized tax benefits will significantly change in the next twelve months. The Fund files a U.S. federal tax return, in addition to state and local tax returns as required. The Fund's federal income tax returns are subject to examination by the Internal Revenue Service (IRS) for a period of three fiscal years after they are filed. State and local tax
Annual Report
Notes to Financial Statements - continued
3. Significant Accounting Policies - continued
Income Tax Information and Distributions to Shareholders - continued
returns may be subject to examination for an additional fiscal year depending on the jurisdiction. Foreign taxes are provided for based on the Fund's understanding of the tax rules and rates that exist in the foreign markets in which it invests.
Distributions are declared and recorded on the ex-dividend date. Income dividends and capital gain distributions are declared separately for each class. Income and capital gain distributions are determined in accordance with income tax regulations, which may differ from GAAP.
Capital accounts within the financial statements are adjusted for permanent book-tax differences. These adjustments have no impact on net assets or the results of operations. Capital accounts are not adjusted for temporary book-tax differences which will reverse in a subsequent period.
Book-tax differences are primarily due to foreign currency transactions, market discount, contingent interest, partnerships, deferred trustees compensation, equity-debt classifications and losses deferred due to wash sales and excise tax regulations.
The federal tax cost of investment securities and unrealized appreciation (depreciation) as of period end were as follows:
Gross unrealized appreciation | $ 1,712,776,208 |
Gross unrealized depreciation | (219,402,686) |
Net unrealized appreciation (depreciation) on securities and other investments | $ 1,493,373,522 |
| |
Tax Cost | $ 5,002,597,755 |
The tax-based components of distributable earnings as of period end were as follows:
Undistributed ordinary income | $ 8,759,639 |
Undistributed long-term capital gain | $ 13,764,500 |
Net unrealized appreciation (depreciation) | $ 1,490,179,750 |
| December 31, 2013 | December 31, 2012 |
Ordinary Income | $ 279,000,432 | $ 250,126,867 |
Long-term Capital Gains | 272,492,862 | 272,552,344 |
Total | $ 551,493,294 | $ 522,679,211 |
Trading (Redemption) Fees. Service Class 2R shares held by investors less than 60 days may be subject to a redemption fee equal to 1% of the NAV of shares redeemed. All redemption fees, which reduce the proceeds of the shareholder redemption, are retained by the Fund and accounted for as an addition to paid in capital.
Restricted Securities. The Fund may invest in securities that are subject to legal or contractual restrictions on resale. These securities generally may be resold in transactions exempt from registration or to the public if the securities are registered. Disposal of these securities may involve time-consuming negotiations and expense, and prompt sale at an acceptable price may be difficult. Information regarding restricted securities is included at the end of the Fund's Schedule of Investments.
4. Derivative Instruments.
Risk Exposures and the Use of Derivative Instruments. The Fund's investment objective allows the Fund to enter into various types of derivative contracts, including options. Derivatives are investments whose value is primarily derived from underlying assets, indices or reference rates and may be transacted on an exchange or over-the-counter (OTC). Derivatives may involve a future commitment to buy or sell a specified asset based on specified terms, to exchange future cash flows at periodic intervals based on a notional principal amount, or for one party to make one or more payments upon the occurrence of specified events in exchange for periodic payments from the other party.
The Fund used derivatives to increase returns and to manage exposure to certain risks as defined below. The success of any strategy involving derivatives depends on analysis of numerous economic factors, and if the strategies for investment do not work as intended, the Fund may not achieve its objectives.
Annual Report
4. Derivative Instruments - continued
Risk Exposures and the Use of Derivative Instruments - continued
The Fund's use of derivatives increased or decreased its exposure to the following risk:
Equity Risk | Equity risk relates to the fluctuations in the value of financial instruments as a result of changes in market prices (other than those arising from interest rate risk or foreign exchange risk), whether caused by factors specific to an individual investment, its issuer, or all factors affecting all instruments traded in a market or market segment. |
The Fund is also exposed to additional risks from investing in derivatives, such as liquidity risk and counterparty credit risk. Liquidity risk is the risk that the Fund will be unable to close out the derivative in the open market in a timely manner. Counterparty credit risk is the risk that the counterparty will not be able to fulfill its obligation to the Fund. Counterparty credit risk related to exchange-traded options may be mitigated by the protection provided by the exchange on which they trade.
Investing in derivatives may involve greater risks than investing in the underlying assets directly and, to varying degrees, may involve risk of loss in excess of any initial investment and collateral received and amounts recognized in the Statement of Assets and Liabilities. In addition, there may be the risk that the change in value of the derivative contract does not correspond to the change in value of the underlying instrument.
Options. Options give the purchaser the right, but not the obligation, to buy (call) or sell (put) an underlying security or financial instrument at an agreed exercise or strike price between or on certain dates. Options obligate the seller (writer) to buy (put) or sell (call) an underlying instrument at the exercise or strike price or cash settle an underlying derivative instrument if the holder exercises the option on or before the expiration date.
The Fund used exchange-traded written covered call options to manage its exposure to the market. When the Fund writes a covered call option, the Fund holds the underlying instrument which must be delivered to the holder upon the exercise of the option.
Upon entering into a written options contract, the Fund will receive a premium. Premiums received are reflected as a liability on the Statement of Assets and Liabilities. Options are valued daily and any unrealized appreciation (depreciation) is reflected on the Statement of Assets and Liabilities. When a written option is exercised, the premium is added to the proceeds from the sale of the underlying instrument in determining the gain or loss realized on that investment. When an option is closed the Fund will realize a gain or loss depending on whether the proceeds or amount paid for the closing sale transaction are greater or less than the premium received. When an option expires, gains and losses are realized to the extent of premiums received. The net realized gain (loss) on closed and expired written options and the change in net unrealized appreciation (depreciation) on written options are reflected separately on the Statement of Operations.
Writing call options tends to decrease exposure to the underlying instrument and risk of loss is the change in value in excess of the premium received.
Any open options at period end are presented in the Schedule of Investments under the caption "Written Options" and are representative of volume of activity during the period.
During the period, the Fund recognized net realized gain (loss) of $2,748,674 and a change in net unrealized appreciation (depreciation) of $(3,269,612) related to its investment in written options. This amount is included in the Statement of Operations.
The following is a summary of the Fund's written options activity:
Written Options | Number of
Contracts | Amount of
Premiums |
Outstanding at beginning of period | - | $ - |
Options Opened | 112,703 | 7,533,155 |
Options Exercised | (36,096) | (2,608,708) |
Options Closed | (33,513) | (1,720,362) |
Options Expired | (11,404) | (1,336,727) |
Outstanding at end of period | 31,690 | $ 1,867,358 |
5. Purchases and Sales of Investments.
Purchases and sales of securities, other than short-term securities, aggregated $1,848,843,213 and $2,393,269,140, respectively.
6. Fees and Other Transactions with Affiliates.
Management Fee. Fidelity Management & Research Company (the investment adviser) and its affiliates provide the Fund with investment management related services for which the Fund pays a monthly management fee. The management fee is the sum of an individual fund fee rate that is based on an annual rate of .20% of the Fund's average net assets and an annualized group fee rate that averaged .25% during the period. The group fee rate is based upon the average net assets of all the mutual funds advised by the investment adviser, including any mutual funds previously advised by the
Annual Report
Notes to Financial Statements - continued
6. Fees and Other Transactions with Affiliates - continued
Management Fee - continued
investment adviser that are currently advised by Fidelity SelectCo, LLC, an affiliate of the investment adviser. The group fee rate decreases as assets under management increase and increases as assets under management decrease. For the reporting period, the total annual management fee rate was .45% of the Fund's average net assets.
Distribution and Service Plan Fees. In accordance with Rule 12b-1 of the 1940 Act, the Fund has adopted separate 12b-1 Plans for each Service Class of shares. Each Service Class pays Fidelity Distributors Corporation (FDC), an affiliate of the investment adviser, a service fee. For the period, the service fee is based on an annual rate of .10% of Service Class' average net assets and .25% of Service Class 2's and Service Class 2R's average net assets.
For the period, total fees, all of which were re-allowed to insurance companies for the distribution of shares and providing shareholder support services were as follows:
Service Class | $ 378,082 |
Service Class 2 | 4,213,523 |
Service Class 2 R | 21,944 |
| $ 4,613,549 |
Transfer Agent Fees. Fidelity Investments Institutional Operations Company, Inc. (FIIOC), an affiliate of the investment adviser, is the Fund's transfer, dividend disbursing, and shareholder servicing agent. FIIOC receives an asset-based fee with respect to each class. Each class (with the exception of Investor Class) pays a transfer agent fee, excluding out of pocket expenses, equal to an annual rate of .07% of average net assets. Investor Class pays a monthly asset-based transfer agent fee of .15% of average net assets. In addition, FIIOC receives an asset-based fee of .0035% of average net assets for typesetting, printing and mailing of shareholder reports, except proxy statements. FIIOC voluntarily agreed to reimburse or waive this fee for the period January 1, 2013 through December 31, 2013 (see Expense Reductions note). For the period, transfer agent fees for each class, including printing and out of pocket expenses, were as follows:
Initial Class | $ 2,602,767 |
Service Class | 261,102 |
Service Class 2 | 1,165,791 |
Service Class 2R | 6,010 |
Investor Class | 446,116 |
| $ 4,481,786 |
Effective February 1, 2014, the Board of Trustees approved an amendment to the transfer agent fee agreement whereby each class (with the exception of Investor Class) pays a single fee of .07% of average net assets for transfer agent services, typesetting, printing and mailing of shareholder reports, excluding mailing of proxy statements and out of pocket expense. Investor Class pays a single fee of .15% of average net assets.
Accounting and Security Lending Fees. Fidelity Service Company, Inc. (FSC), an affiliate of the investment adviser, maintains the Fund's accounting records. The accounting fee is based on the level of average net assets for each month. Under a separate contract, FSC administers the security lending program. The security lending fee is based on the number and duration of lending transactions.
Brokerage Commissions. The Fund placed a portion of its portfolio transactions with brokerage firms which are affiliates of the investment adviser. Brokerage commissions are included in net realized gain (loss) and change in net unrealized appreciation (depreciation) in the Statement of Operations. The commissions paid to these affiliated firms were $38,613 for the period.
7. Committed Line of Credit.
The Fund participates with other funds managed by the investment adviser or an affiliate in a $4.25 billion credit facility (the "line of credit") to be utilized for temporary or emergency purposes to fund shareholder redemptions or for other short-term liquidity purposes. The Fund has agreed to pay commitment fees on its pro-rata portion of the line of credit, which amounted to $12,942 and is reflected in Miscellaneous expenses on the Statement of Operations. During the period, there were no borrowings on this line of credit.
8. Security Lending.
The Fund lends portfolio securities through a lending agent from time to time in order to earn additional income. For equity securities, a lending agent is used and may loan securities to certain qualified borrowers, including Fidelity Capital Markets (FCM), a broker-dealer affiliated with the Fund. On the settlement date of the loan, the Fund receives collateral (in the form of U.S. Treasury obligations, letters of credit and/or cash) against the loaned securities and maintains collateral in an amount not less than 100% of the market value of the loaned securities during the period of the loan. The
Annual Report
8. Security Lending - continued
market value of the loaned securities is determined at the close of business of the Fund and any additional required collateral is delivered to the Fund on the next business day. If the borrower defaults on its obligation to return the securities loaned because of insolvency or other reasons, the Fund may apply collateral received from the borrower against the obligation. The Fund may experience delays and costs in recovering the securities loaned. Any cash collateral received is invested in the Fidelity Securities Lending Cash Central Fund. The value of loaned securities and cash collateral at period end are disclosed on the Fund's Statement of Assets and Liabilities. At period end, there were no security loans outstanding with FCM. Security lending income represents the income earned on investing cash collateral, less rebates paid to borrowers and any lending agent fees associated with the loan, plus any premium payments received for lending certain types of securities. Security lending income is presented in the Statement of Operations as a component of income from Fidelity Central Funds. Total security lending income during the period amounted to $977,799, including $43,766 from securities loaned to FCM.
9. Expense Reductions.
The investment adviser or its affiliates agreed to reimburse or waive certain fees during the period as noted in the table below.
Initial Class | $ 147,762 |
Service Class | 14,824 |
Service Class 2 | 66,075 |
Service Class 2R | 345 |
Investor Class | 11,526 |
| $ 240,532 |
Commissions paid to certain brokers with whom the investment adviser, or its affiliates, places trades on behalf of the Fund include an amount in addition to trade execution, which may be rebated back to the Fund to offset certain expenses. This amount totaled $177,294 for the period. In addition, through arrangements with the Fund's custodian, credits realized as a result of uninvested cash balances were used to reduce the Fund's expenses. During the period, these credits reduced the Fund's custody expenses by $2,201.
10. Distributions to Shareholders.
Distributions to shareholders of each class were as follows:
Years ended December 31, | 2013 | 2012 |
From net investment income | | |
Initial Class | $ 92,568,520 | $ 101,791,140 |
Service Class | 8,840,014 | 9,989,279 |
Service Class 2 | 37,705,026 | 42,628,835 |
Service Class 2R | 258,073 | 156,403 |
Investor Class | 8,161,740 | 6,270,596 |
Total | $ 147,533,373 | $ 160,836,253 |
From net realized gain | | |
Initial Class | $ 245,504,561 | $ 222,187,565 |
Service Class | 24,485,710 | 22,886,320 |
Service Class 2 | 111,276,322 | 103,060,364 |
Service Class 2R | 724,327 | 339,927 |
Investor Class | 21,969,001 | 13,368,782 |
Total | $ 403,959,921 | $ 361,842,958 |
11. Share Transactions.
Transactions for each class of shares were as follows:
| Shares | Dollars |
Years ended December 31, | 2013 | 2012 | 2013 | 2012 |
Initial Class | | | | |
Shares sold | 5,939,757 | 3,870,932 | $ 136,791,018 | $ 77,988,279 |
Reinvestment of distributions | 15,117,940 | 16,250,583 | 338,073,081 | 323,978,705 |
Shares redeemed | (25,104,941) | (25,610,108) | (577,075,155) | (515,027,646) |
Net increase (decrease) | (4,047,244) | (5,488,593) | $ (102,211,056) | $ (113,060,662) |
Annual Report
Notes to Financial Statements - continued
11. Share Transactions - continued
| Shares | Dollars |
Years ended December 31, | 2013 | 2012 | 2013 | 2012 |
Service Class | | | | |
Shares sold | 522,521 | 779,349 | $ 11,868,622 | $ 15,549,373 |
Reinvestment of distributions | 1,495,670 | 1,655,419 | 33,325,724 | 32,875,599 |
Shares redeemed | (2,763,995) | (3,480,467) | (62,879,133) | (69,732,701) |
Net increase (decrease) | (745,804) | (1,045,699) | $ (17,684,787) | $ (21,307,729) |
Service Class 2 | | | | |
Shares sold | 5,862,575 | 9,943,946 | $ 132,392,944 | $ 192,585,015 |
Reinvestment of distributions | 6,780,471 | 7,428,210 | 148,981,348 | 145,689,199 |
Shares redeemed | (15,448,401) | (16,965,629) | (348,570,665) | (333,504,543) |
Net increase (decrease) | (2,805,355) | 406,527 | $ (67,196,373) | $ 4,769,671 |
Service Class 2R | | | | |
Shares sold | 253,817 | 121,840 | $ 5,683,428 | $ 2,390,089 |
Reinvestment of distributions | 44,961 | 25,375 | 982,400 | 496,330 |
Shares redeemed | (60,780) | (74,064) | (1,351,791) | (1,477,846) |
Net increase (decrease) | 237,998 | 73,151 | $ 5,314,037 | $ 1,408,573 |
Investor Class | | | | |
Shares sold | 3,800,857 | 1,569,001 | $ 86,969,508 | $ 31,601,024 |
Reinvestment of distributions | 1,351,634 | 986,760 | 30,130,741 | 19,639,378 |
Shares redeemed | (1,103,166) | (1,052,779) | (25,440,166) | (21,080,323) |
Net increase (decrease) | 4,049,325 | 1,502,982 | $ 91,660,083 | $ 30,160,079 |
12. Other.
The Fund's organizational documents provide former and current trustees and officers with a limited indemnification against liabilities arising in connection with the performance of their duties to the Fund. In the normal course of business, the Fund may also enter into contracts that provide general indemnifications. The Fund's maximum exposure under these arrangements is unknown as this would be dependent on future claims that may be made against the Fund. The risk of material loss from such claims is considered remote.
At the end of the period, the investment adviser or its affiliates were the owners of record of 13% of the total outstanding shares of the Fund and one otherwise unaffiliated shareholder was the owner of record of 18% of the total outstanding shares of the Fund.
Annual Report
Report of Independent Registered Public Accounting Firm
To the Trustees of Variable Insurance Products Fund and the Shareholders of VIP Equity-Income Portfolio:
In our opinion, the accompanying statement of assets and liabilities, including the schedule of investments, and the related statements of operations and of changes in net assets and the financial highlights present fairly, in all material respects, the financial position of VIP Equity-Income Portfolio (a fund of Variable Insurance Products Fund) at December 31, 2013, the results of its operations for the year then ended, the changes in its net assets for each of the two years in the period then ended and the financial highlights for each of the five years in the period then ended, in conformity with accounting principles generally accepted in the United States of America. These financial statements and financial highlights (hereafter referred to as "financial statements") are the responsibility of the VIP Equity-Income Portfolio's management. Our responsibility is to express an opinion on these financial statements based on our audits. We conducted our audits of these financial statements in accordance with the standards of the Public Company Accounting Oversight Board (United States). Those standards require that we plan and perform the audit to obtain reasonable assurance about whether the financial statements are free of material misstatement. An audit includes examining, on a test basis, evidence supporting the amounts and disclosures in the financial statements, assessing the accounting principles used and significant estimates made by management, and evaluating the overall financial statement presentation. We believe that our audits, which included confirmation of securities at December 31, 2013 by correspondence with the custodian and brokers, provide a reasonable basis for our opinion.
PricewaterhouseCoopers LLP
Boston, Massachusetts
February 14, 2014
Annual Report
The Trustees, Member of the Advisory Board, and officers of the trust and fund, as applicable, are listed below. The Board of Trustees governs the fund and is responsible for protecting the interests of shareholders. The Trustees are experienced executives who meet periodically throughout the year to oversee the fund's activities, review contractual arrangements with companies that provide services to the fund, oversee management of the risks associated with such activities and contractual arrangements, and review the fund's performance. Except for James C. Curvey, Ned C. Lautenbach, Ronald P. O'Hanley, and William S. Stavropoulos, each of the Trustees oversees 173 funds. Mr. Curvey oversees 396 funds. Mr. Lautenbach, Mr. O'Hanley, and Mr. Stavropoulos each oversees 247 funds.
The Trustees hold office without limit in time except that (a) any Trustee may resign; (b) any Trustee may be removed by written instrument, signed by at least two-thirds of the number of Trustees prior to such removal; (c) any Trustee who requests to be retired or who has become incapacitated by illness or injury may be retired by written instrument signed by a majority of the other Trustees; and (d) any Trustee may be removed at any special meeting of shareholders by a two-thirds vote of the outstanding voting securities of the trust. Each Trustee who is not an interested person (as defined in the 1940 Act) of the trust and the fund (Independent Trustee), shall retire not later than the last day of the calendar year in which his or her 75th birthday occurs. The Independent Trustees may waive this mandatory retirement age policy with respect to individual Trustees. The officers and Advisory Board Member hold office without limit in time, except that any officer and Advisory Board Member may resign or may be removed by a vote of a majority of the Trustees at any regular meeting or any special meeting of the Trustees. Except as indicated, each individual has held the office shown or other offices in the same company for the past five years.
Experience, Skills, Attributes, and Qualifications of the Fund's Trustees. The Governance and Nominating Committee has adopted a statement of policy that describes the experience, qualifications, attributes, and skills that are necessary and desirable for potential Independent Trustee candidates (Statement of Policy). The Board believes that each Trustee satisfied at the time he or she was initially elected or appointed a Trustee, and continues to satisfy, the standards contemplated by the Statement of Policy. The Governance and Nominating Committee also engages professional search firms to help identify potential Independent Trustee candidates who have the experience, qualifications, attributes, and skills consistent with the Statement of Policy. From time to time, additional criteria based on the composition and skills of the current Independent Trustees, as well as experience or skills that may be appropriate in light of future changes to board composition, business conditions, and regulatory or other developments, have also been considered by the professional search firms and the Governance and Nominating Committee. In addition, the Board takes into account the Trustees' commitment and participation in Board and committee meetings, as well as their leadership of standing and ad hoc committees throughout their tenure.
In determining that a particular Trustee was and continues to be qualified to serve as a Trustee, the Board has considered a variety of criteria, none of which, in isolation, was controlling. The Board believes that, collectively, the Trustees have balanced and diverse experience, qualifications, attributes, and skills, which allow the Board to operate effectively in governing the fund and protecting the interests of shareholders. Information about the specific experience, skills, attributes, and qualifications of each Trustee, which in each case led to the Board's conclusion that the Trustee should serve (or continue to serve) as a trustee of the fund, is provided below.
Board Structure and Oversight Function. James C. Curvey is an interested person (as defined in the 1940 Act) and currently serves as Chairman. The Trustees have determined that an interested Chairman is appropriate and benefits shareholders because an interested Chairman has a personal and professional stake in the quality and continuity of services provided to the funds. Independent Trustees exercise their informed business judgment to appoint an individual of their choosing to serve as Chairman, regardless of whether the Trustee happens to be independent or a member of management. The Independent Trustees have determined that they can act independently and effectively without having an Independent Trustee serve as Chairman and that a key structural component for assuring that they are in a position to do so is for the Independent Trustees to constitute a substantial majority for the Board. The Independent Trustees also regularly meet in executive session. Ned C. Lautenbach serves as Chairman of the Independent Trustees and as such (i) acts as a liaison between the Independent Trustees and management with respect to matters important to the Independent Trustees and (ii) with management prepares agendas for Board meetings.
Fidelity funds are overseen by different Boards of Trustees. The fund's Board oversees Fidelity's equity and high income funds and another Board oversees Fidelity's investment-grade bond, money market, and asset allocation funds. The asset allocation funds may invest in Fidelity funds overseen by the fund's Board. The use of separate Boards, each with its own committee structure, allows the Trustees of each group of Fidelity funds to focus on the unique issues of the funds they oversee, including common research, investment, and operational issues. On occasion, the separate Boards establish joint committees to address issues of overlapping consequences for the Fidelity funds overseen by each Board.
The Trustees operate using a system of committees to facilitate the timely and efficient consideration of all matters of importance to the Trustees, the fund, and fund shareholders and to facilitate compliance with legal and regulatory requirements and oversight of the fund's activities and associated risks. The Board, acting through its committees, has charged FMR and its affiliates with (i) identifying events or circumstances the occurrence of which could have demonstrably adverse effects on the fund's business and/or reputation; (ii) implementing processes and controls to lessen the possibility that such events or circumstances occur or to mitigate the effects of such events or circumstances if they do occur; and (iii) creating and maintaining a system designed to evaluate continuously business and market conditions in order to facilitate the identification and implementation processes described in (i) and (ii) above. Because the day-to-day operations and activities of the fund are carried out by or through FMR, its affiliates and other service providers, the fund's exposure to risks is mitigated but not eliminated by the processes overseen by the Trustees. While each of the Board's committees has responsibility for overseeing different aspects of the funds' activities, oversight is exercised primarily through the Operations, Audit, and Compliance Committees. In addition, the Independent Trustees have worked with FMR to enhance the Board's oversight of investment and financial risks, legal and regulatory risks, technology risks, and operational risks, including the development of additional risk reporting to the Board. For example, a working group comprised of Independent Trustees and FMR has worked and continues to work to review the Fidelity fund's valuation-related activities, reporting and risk management. Appropriate personnel, including but not limited to the fund's Chief Compliance Officer (CCO), FMR's internal auditor, the independent accountants, the fund's Treasurer and portfolio management personnel, make periodic reports to the Board's committees, as appropriate, including an annual review of FMR's risk management program for the Fidelity funds. The responsibilities of each standing committee, including their oversight responsibilities, are described further under "Standing Committees of the Fund's Trustees."
Annual Report
Trustees and Officers - continued
The fund's Statements of Additional Information (SAI) includes more information about the Trustees. To request a free copy, call Fidelity at 1-877-208-0098.
Interested Trustees*:
Correspondence intended for each Trustee who is an interested person may be sent to Fidelity Investments, 245 Summer Street, Boston, Massachusetts 02210.
Name, Year of Birth; Principal Occupations and Other Relevant Experience+ |
James C. Curvey (1935) |
Year of Election or Appointment: 2007 Trustee Chairman of the Board of Trustees |
| Mr. Curvey also serves as Trustee of other Fidelity funds. Mr. Curvey is a Director of Fidelity Investments Money Management, Inc. (2009-present), Director of Fidelity Research & Analysis Co. (2009-present) and Director of FMR and FMR Co., Inc. (2007-present). Mr. Curvey is also Vice Chairman (2007-present) and Director of FMR LLC. In addition, Mr. Curvey serves as an Overseer for the Boston Symphony Orchestra and a member of the Trustees of Villanova University. Previously, Mr. Curvey was the Vice Chairman (2006-2007) and Director (2000-2007) of FMR Corp. |
Ronald P. O'Hanley (1957) |
Year of Election or Appointment: 2011 Trustee |
| Mr. O'Hanley also serves as Trustee of other Fidelity funds. He is Director of Fidelity SelectCo, LLC (2013-present), FMR Co., Inc. (2010-present), Director of Fidelity Investments Money Management, Inc. (2010-present), Director of Fidelity Research & Analysis Company (2010-present), President of Fidelity Asset Management and Corporate Services and a Member of Fidelity's Executive Committee (2010-present). Previously, Mr. O'Hanley served as President and Chief Executive Officer of BNY Mellon Asset Management (2007-2010). Mr. O'Hanley also served as Vice Chairman of Bank New York Mellon Corp. and a member of that firm's Executive Committee. Prior to the 2007 merger of The Bank of New York and Mellon Financial Corporation, he was Vice Chairman of Mellon Financial Corporation and President and Chief Executive Officer of Mellon Asset Management. He joined Mellon in February 1997. Mr. O'Hanley currently serves as Chairman of the Boston Public Library Foundation Board of Directors and sits on the Board of Directors of Beth Israel Deaconess Medical Center, the Board of Trustees of the Marine Biological Laboratory and the Advisory Board of the Maxwell School of Citizenship and Public Administration at Syracuse University. Mr. O'Hanley also chairs the Council on Asset Management for the Financial Services Roundtable and is a member of the Board of Directors of Institutional Investor's U.S. Institute. |
* Trustees have been determined to be "Interested Trustees" by virtue of, among other things, their affiliation with the trust or various entities under common control with FMR.
+ The information above includes each Trustee's principal occupation during the last five years and other information relating to the experience, attributes, and skills relevant to each Trustee's qualifications to serve as a Trustee, which led to the conclusion that each Trustee should serve as a Trustee for the fund.
Annual Report
Independent Trustees:
Correspondence intended for each Independent Trustee (that is, the Trustees other than the Interested Trustees) may be sent to Fidelity Investments, P.O. Box 55235, Boston, Massachusetts 02205-5235.
Name, Year of Birth; Principal Occupations and Other Relevant Experience+ |
Dennis J. Dirks (1948) |
Year of Election or Appointment: 2005 Trustee |
| Mr. Dirks also serves as Trustee of other Fidelity funds. Prior to his retirement in May 2003, Mr. Dirks was Chief Operating Officer and a member of the Board of The Depository Trust & Clearing Corporation (DTCC). He also served as President, Chief Operating Officer, and Board member of The Depository Trust Company (DTC) and President and Board member of the National Securities Clearing Corporation (NSCC). In addition, Mr. Dirks served as Chief Executive Officer and Board member of the Government Securities Clearing Corporation, Chief Executive Officer and Board member of the Mortgage-Backed Securities Clearing Corporation, as a Trustee and a member of the Finance Committee of Manhattan College (2005-2008), and as a Trustee and a member of the Finance Committee of AHRC of Nassau County (2006-2008). Mr. Dirks is a member of the Independent Directors Council (IDC) Governing Council (2010-present) and Board of Directors for The Brookville Center for Children's Services, Inc. (2009-present). |
Alan J. Lacy (1953) |
Year of Election or Appointment: 2008 Trustee |
| Mr. Lacy also serves as Trustee of other Fidelity funds. Mr. Lacy serves as Senior Adviser (2007-present) of Oak Hill Capital Partners, L.P. (private equity). Mr. Lacy also served as Chief Executive Officer (2000-2005) and Vice Chairman (2005-2006) of Sears Holdings Corporation and Sears, Roebuck and Co. (retail). In addition, Mr. Lacy serves as a member of the Board of Directors of Dave & Buster's Entertainment, Inc. (restaurant and entertainment complexes, 2010-present), Earth Fare, Inc. (retail grocery, 2012-present), The Hillman Companies, Inc. (hardware wholesalers, 2010-present), and Bristol-Myers Squibb Company (global pharmaceuticals, 2008-present). Mr. Lacy is a member of the Board of Trustees of The National Parks Conservation Association (2006-present). Previously, Mr. Lacy served as Chairman of the Board of Trustees of the National Parks Conservation Association (2008-2011) and as a member of the Board of Directors for the Western Union Company (global money transfer, 2006-2011). |
Ned C. Lautenbach (1944) |
Year of Election or Appointment: 2000 Trustee Chairman of the Independent Trustees |
| Mr. Lautenbach also serves as Trustee of other Fidelity funds. Mr. Lautenbach currently serves as the Lead Director of the Eaton Corporation Board of Directors (diversified industrial, 1997-present). Mr. Lautenbach is Chairman of the Board of Directors of the Philharmonic Center for the Arts in Naples, Florida (2012-present) and a member of the Council on Foreign Relations (1994-present). Previously, Mr. Lautenbach was a Partner/Advisory Partner at Clayton, Dubilier & Rice, LLC (private equity investment, 1998-2010), as well as a Director of Sony Corporation (2006-2007). |
Joseph Mauriello (1944) |
Year of Election or Appointment: 2008 Trustee |
| Mr. Mauriello also serves as Trustee of other Fidelity funds. Prior to his retirement in January 2006, Mr. Mauriello served in numerous senior management positions including Deputy Chairman and Chief Operating Officer (2004-2005), and Vice Chairman of Financial Services (2002-2004) of KPMG LLP US (professional services, 1965-2005). Mr. Mauriello currently serves as a member of the Board of Directors of XL Group plc. (global insurance and re-insurance, 2006-present). Previously, Mr. Mauriello served as a Director of the Hamilton Funds of the Bank of New York (2006-2007) and of Arcadia Resources Inc. (health care services and products, 2007-2012). |
Robert W. Selander (1950) |
Year of Election or Appointment: 2011 Trustee |
| Mr. Selander also serves as Trustee of other Fidelity funds. Previously, Mr. Selander served as a Member of the Advisory Board of other Fidelity funds (2011), and Executive Vice Chairman (2010), Chief Executive Officer (2009-2010), and President and Chief Executive Officer (1997-2009) of Mastercard, Inc. |
Cornelia M. Small (1944) |
Year of Election or Appointment: 2005 Trustee |
| Ms. Small also serves as Trustee of other Fidelity funds. Ms. Small is a member of the Board of Directors (2009-present) and Chair of the Investment Committee (2010-present) of the Teagle Foundation. Ms. Small also serves on the Investment Committee of the Berkshire Taconic Community Foundation (2008-present). Previously, Ms. Small served as Chairperson (2002-2008) and a member of the Investment Committee and Chairperson (2008-2012) and a member of the Board of Trustees of Smith College. In addition, Ms. Small served as Chief Investment Officer, Director of Global Equity Investments, and a member of the Board of Directors of Scudder, Stevens & Clark and Scudder Kemper Investments. |
William S. Stavropoulos (1939) |
Year of Election or Appointment: 2001 Trustee Vice Chairman of the Independent Trustees |
| Mr. Stavropoulos also serves as Trustee of other Fidelity funds. Mr. Stavropoulos serves as President and Founder of the Michigan Baseball Foundation, the Great Lakes Loons (2007-present). Mr. Stavropoulos is Chairman Emeritus of the Board of Directors of The Dow Chemical Company, where he previously served in numerous senior management positions, including President, CEO (1995-2000; 2002-2004), Chairman of the Executive Committee (2000-2006), and as a member of the Board of Directors (1990-2006). Currently, Mr. Stavropoulos is Chairman of the Board of Directors of Univar Inc. (global distributor of commodity and specialty chemicals), a Director of Teradata Corporation (data warehousing and technology solutions), and Maersk Inc. (industrial conglomerate), and a member of the Advisory Board for Metalmark Capital LLC (private equity investment, 2005-present). Mr. Stavropoulos is an operating advisor to Clayton, Dubilier & Rice, LLC (private equity investment). In addition, Mr. Stavropoulos is a member of the University of Notre Dame Advisory Council for the College of Science, a Trustee of the Rollin L. Gerstacker Foundation, and a Director of the Naples Philharmonic Center for the Arts. Previously, Mr. Stavropoulos served as a Director of Chemical Financial Corporation (bank holding company, 1993-2012) and Tyco International, Ltd. (multinational manufacturing and services, 2007-2012). |
David M. Thomas (1949) |
Year of Election or Appointment: 2008 Trustee |
| Mr. Thomas also serves as Trustee of other Fidelity funds. Mr. Thomas serves as Non-Executive Chairman of the Board of Directors of Fortune Brands Home and Security (home and security products, 2011-present), and as a member of the Board of Directors of Interpublic Group of Companies, Inc. (marketing communication, 2004-present). Previously, Mr. Thomas served as Executive Chairman (2005-2006) and Chairman and Chief Executive Officer (2000-2005) of IMS Health, Inc. (pharmaceutical and healthcare information solutions), and a Director of Fortune Brands, Inc. (consumer products, 2000-2011). |
+ The information above includes each Trustee's principal occupation during the last five years and other information relating to the experience, attributes, and skills relevant to each Trustee's qualifications to serve as a Trustee, which led to the conclusion that each Trustee should serve as a Trustee for the fund.
Advisory Board Members and Officers:
Correspondence intended for each officer and Peter S. Lynch may be sent to Fidelity Investments, 245 Summer Street, Boston, Massachusetts 02210. Officers appear below in alphabetical order.
Name, Year of Birth; Principal Occupation |
Peter S. Lynch (1944) |
Year of Election or Appointment: 2003 Member of the Advisory Board |
| Mr. Lynch also serves as Member of the Advisory Board of other Fidelity funds. Mr. Lynch is Vice Chairman and a Director of FMR and FMR Co., Inc. In addition, Mr. Lynch serves as a Trustee of Boston College and as the Chairman of the Inner-City Scholarship Fund. Previously, Mr. Lynch served on the Special Olympics International Board of Directors (1997-2006). |
Elizabeth Paige Baumann (1968) |
Year of Election or Appointment: 2012 Anti-Money Laundering (AML) Officer |
| Ms. Baumann also serves as AML Officer of other funds. She is Chief AML Officer of FMR LLC (2012-present) and is an employee of Fidelity Investments. Previously, Ms. Baumann served as Vice President and Deputy Anti-Money Laundering Officer (2007-2012). |
William C. Coffey (1969) |
Year of Election or Appointment: 2009 Assistant Secretary |
| Mr. Coffey also serves as Assistant Secretary of other funds. He is Senior Vice President and Deputy General Counsel of FMR LLC (2010-present), and is an employee of Fidelity Investments. Previously, Mr. Coffey served as Vice President and Associate General Counsel of FMR LLC (2005-2009). |
Jonathan Davis (1968) |
Year of Election or Appointment: 2010 Assistant Treasurer |
| Mr. Davis also serves as Assistant Treasurer of other funds. Mr. Davis is an employee of Fidelity Investments. Previously, Mr. Davis served as Vice President and Associate General Counsel of FMR LLC (2003-2010). |
Adrien E. Deberghes (1967) |
Year of Election or Appointment: 2008 Deputy Treasurer |
| Mr. Deberghes also serves as an officer of other funds. He is an employee of Fidelity Investments (2008-present). Prior to joining Fidelity Investments, Mr. Deberghes was Senior Vice President of Mutual Fund Administration at State Street Corporation (2007-2008), Senior Director of Mutual Fund Administration at Investors Bank & Trust (2005-2007), and Director of Finance for Dunkin' Brands (2000-2005). |
Stephanie J. Dorsey (1969) |
Year of Election or Appointment: 2010 Assistant Treasurer |
| Ms. Dorsey also serves as an officer of other funds. She is an employee of Fidelity Investments (2008-present) and has served in other fund officer roles. Prior to joining Fidelity Investments, Ms. Dorsey served as Treasurer (2004-2008) of the JPMorgan Mutual Funds and Vice President (2004-2008) of JPMorgan Chase Bank. |
Scott C. Goebel (1968) |
Year of Election or Appointment: 2008 Secretary and Chief Legal Officer (CLO) |
| Mr. Goebel serves as Secretary and CLO of other funds. Mr. Goebel also serves as Secretary of Fidelity Investments Money Management, Inc. (FIMM) (2010-present) and Fidelity Research and Analysis Company (FRAC) (2010-present); General Counsel, Secretary, and Senior Vice President of FMR (2008-present) and FMR Co., Inc. (2008-present); Chief Legal Officer of Fidelity Management & Research (Hong Kong) Limited (2008-present) and Assistant Secretary of Fidelity Management & Research (Japan) Inc. (2008-present), and Fidelity Management & Research (U.K.) Inc. (2008-present). Previously, Mr. Goebel served as Secretary and CLO of other Fidelity funds (2008-2013), Assistant Secretary of FIMM (2008-2010), FRAC (2008-2010), and certain funds (2007-2008); and as Vice President and Secretary of Fidelity Distributors Corporation (FDC) (2005-2007). Mr. Goebel has been employed by FMR LLC or an affiliate since 2001. |
Joseph A. Hanlon (1968) |
Year of Election or Appointment: 2012 Chief Compliance Officer |
| Mr. Hanlon also serves as Chief Compliance Officer of other funds. Mr. Hanlon serves as Compliance Officer of FMR, FMR Co., Inc., Fidelity Investments Money Management, Inc. (FIMM), Fidelity Research and Analysis Company (FRAC), and Fidelity Management & Research (Hong Kong) (2009-present), as Senior Vice President of the Fidelity Asset Management Division (2009-present), and is an employee of Fidelity Investments. Previously, Mr. Hanlon served as Compliance Officer of Fidelity Management & Research (Japan) Inc. (2009-2013), Strategic Advisers, Inc. (2009-2013), and Fidelity Management & Research (U.K.) Inc. (2009-2013). |
Bruce T. Herring (1965) |
Year of Election or Appointment: 2006 Vice President of certain Equity Funds |
| Mr. Herring also serves as Vice President of other funds. He serves as Chief Investment Officer of Fidelity Global Asset Allocation (GAA) (2013-present), Group Chief Investment Officer of FMR, and President of Fidelity Research & Analysis Company (2010-present). Previously, Mr. Herring served as Chief Investment Officer and Director of Fidelity Management & Research (U.K.) Inc. (2010-2013), Vice President (2005-2006) and Senior Vice President (2006-2007) of Fidelity Management & Research Company, Vice President of FMR Co., Inc. (2001-2007), and as a portfolio manager for Fidelity U.S. Equity Funds. |
Brian B. Hogan (1964) |
Year of Election or Appointment: 2009 Vice President |
| Mr. Hogan also serves as Vice President of other funds. Mr. Hogan serves as President of FMR's Equity Division (2009-present). Previously, Mr. Hogan served as Senior Vice President, Equity Research of FMR (2006-2009) and as a portfolio manager. |
Chris Maher (1972) |
Year of Election or Appointment: 2013 Assistant Treasurer |
| Mr. Maher serves as Assistant Treasurer of other funds. Mr. Maher is Vice President of Valuation Oversight and is an employee of Fidelity Investments. Previously, Mr. Maher served as Vice President of Asset Management Compliance (2013), Vice President of FMR's Program Management Group (2010-2013), and Vice President of Valuation Oversight (2008-2010). |
Christine Reynolds (1958) |
Year of Election or Appointment: 2008 Chief Financial Officer |
| Ms. Reynolds also serves as Chief Financial Officer of other funds. Ms. Reynolds became President of Fidelity Pricing and Cash Management Services (FPCMS) in August 2008. Ms. Reynolds served as Chief Operating Officer of FPCMS (2007-2008). Previously, Ms. Reynolds served as President, Treasurer, and Anti-Money Laundering officer of the Fidelity funds (2004-2007). |
Kenneth B. Robins (1969) |
Year of Election or Appointment: 2008 President and Treasurer |
| Mr. Robins also serves as an officer of other funds. Mr. Robins serves as Executive Vice President of Fidelity Investments Money Management, Inc. (FIMM) (2013-present) and is an employee of Fidelity Investments (2004-present). Previously, Mr. Robins served in other fund officer roles. |
Gary W. Ryan (1958) |
Year of Election or Appointment: 2005 Assistant Treasurer |
| Mr. Ryan also serves as Assistant Treasurer of other funds. Mr. Ryan is an employee of Fidelity Investments and has served in other fund officer roles. Previously, Mr. Ryan served as Vice President of Fund Reporting in Fidelity Pricing and Cash Management Services (FPCMS) (1999-2005). |
Stephen Sadoski (1971) |
Year of Election or Appointment: 2012 Deputy Treasurer |
| Mr. Sadoski also serves as Deputy Treasurer of other funds. He is an employee of Fidelity Investments (2012-present) and has served in another fund officer role. Prior to joining Fidelity Investments, Mr. Sadoski served as an assistant chief accountant in the Division of Investment Management of the Securities and Exchange Commission (SEC) (2009-2012) and as a senior manager at Deloitte & Touche LLP (1997-2009). |
Stacie M. Smith (1974) |
Year of Election or Appointment: 2013 Deputy Treasurer |
| Ms. Smith also serves as an officer of other funds. She is an employee of Fidelity Investments (2009-present) and has served in other fund officer roles. Prior to joining Fidelity Investments, Ms. Smith served as Senior Audit Manager of Ernst & Young LLP (1996-2009). |
Renee Stagnone (1975) |
Year of Election or Appointment: 2013 Deputy Treasurer |
| Ms. Stagnone also serves as Deputy Treasurer of other funds. Ms. Stagnone is an employee of Fidelity Investments. |
Joseph F. Zambello (1957) |
Year of Election or Appointment: 2011 Deputy Treasurer |
| Mr. Zambello also serves as Deputy Treasurer of other funds. Mr. Zambello is an employee of Fidelity Investments. Previously, Mr. Zambello served as Vice President of FMR's Program Management Group (2009-2011) and Vice President of the Transfer Agent Oversight Group (2005-2009). |
Annual Report
The Board of Trustees of VIP Equity-Income Portfolio voted to pay to shareholders of record at the opening of business on record date, the following distributions per share derived from capital gains realized from sales of portfolio securities:
| Pay Date | Record Date | Capital Gains |
Initial Class | 02/07/2014 | 02/07/2014 | $0.083 |
Service Class | 02/07/2014 | 02/07/2014 | $0.083 |
Service Class 2 | 02/07/2014 | 02/07/2014 | $0.083 |
Investor Class | 02/07/2014 | 02/07/2014 | $0.083 |
The fund hereby designates as a capital gain dividend with respect to the taxable year ended December 31, 2013 $286,257,362, or, if subsequently determined to be different, the net capital gain of such year.
Initial Class designates 10% and 47%; Service Class designates 10% and 48%; Service Class 2 designates 10% and 50%; and Investor Class designates 10% and 48% of the dividends distributed in February and December 2013 respectively, during the fiscal year as qualifying for the dividends-received deduction for corporate shareholders.
Annual Report
Board Approval of Investment Advisory Contracts and Management Fees
VIP Equity-Income Portfolio
Each year, the Board of Trustees, including the Independent Trustees (together, the Board), votes on the renewal of the management contract and sub-advisory agreements (together, the Advisory Contracts) for the fund. The Board, assisted by the advice of fund counsel and Independent Trustees' counsel, requests and considers a broad range of information relevant to the renewal of the Advisory Contracts throughout the year.
The Board meets regularly and, at each of its meetings, covers an extensive agenda of topics and materials and considers factors that are relevant to its annual consideration of the renewal of the fund's Advisory Contracts, including the services and support provided to the fund and its shareholders. The Board has established various standing committees, each composed of and chaired by Independent Trustees with varying backgrounds, to which the Board has assigned specific subject matter responsibilities in order to enhance effective decision-making by the Board. The Board, acting directly and through its Committees, requests and receives information concerning the annual consideration of the renewal of the fund's Advisory Contracts. The Board also meets as needed to consider matters specifically related to the Board's annual consideration of the renewal of Advisory Contracts. Members of the Board may also meet with trustees of other Fidelity funds through ad hoc joint committees to discuss certain matters relevant to the Fidelity funds.
At its July 2013 meeting, the Board, including the Independent Trustees, unanimously determined to renew the fund's Advisory Contracts. In reaching its determination, the Board considered all factors it believed relevant, including (i) the nature, extent, and quality of the services to be provided to the fund and its shareholders (including the investment performance of the fund); (ii) the competitiveness of the fund's management fee and total expense ratio relative to peer funds; (iii) the total costs of the services to be provided by and the profits to be realized by Fidelity from its relationship with the fund; (iv) the extent to which economies of scale exist and would be realized as the fund grows; and (v) whether fee levels reflect these economies of scale, if any, for the benefit of fund shareholders.
In considering whether to renew the Advisory Contracts for the fund, the Board reached a determination, with the assistance of fund counsel and Independent Trustees' counsel and through the exercise of its business judgment, that the renewal of the Advisory Contracts was in the best interests of the fund and its shareholders and that the compensation payable under the Advisory Contracts was fair and reasonable. The Board's decision to renew the Advisory Contracts was not based on any single factor, but rather was based on a comprehensive consideration of all the information provided to the Board at its meetings throughout the year. The Board, in reaching its determination to renew the Advisory Contracts, was aware that shareholders in the fund have a broad range of investment choices available to them, including a wide choice among mutual funds offered by Fidelity's competitors, and that the fund's shareholders, who have the opportunity to review and weigh the disclosure provided by the fund in its prospectus and other public disclosures, have chosen to invest in this fund, which is part of the Fidelity family of funds.
Nature, Extent, and Quality of Services Provided. The Board considered the staffing within the investment adviser, Fidelity Management & Research Company (FMR), and the sub-advisers (together, the Investment Advisers) as it relates to the fund, including the backgrounds of the fund's investment personnel, and also considered the fund's investment objective, strategies, and related investment philosophy. The Independent Trustees also had discussions with senior management of Fidelity's investment operations and investment groups. The Board considered the structure of the portfolio manager compensation program and whether this structure provides appropriate incentives to act in the best interests of the fund.
Resources Dedicated to Investment Management and Support Services. The Board and the Fund Oversight and Research Committees reviewed the general qualifications and capabilities of the Investment Advisers' investment staff, including its size, education, experience, and resources, as well as the Investment Advisers' approach to recruiting, training, managing, and compensating investment personnel. The Board noted that FMR has continued to increase the resources devoted to non-U.S. offices, including expansion of Fidelity's global investment organization. The Board also noted that Fidelity's analysts have extensive resources, tools and capabilities that allow them to conduct sophisticated quantitative and fundamental analysis, as well as credit analysis of issuers, counterparties and guarantors. Further, the Board believes that Fidelity's investment professionals have sufficient access to global information and data so as to provide competitive investment results over time, and that those professionals also have access to sophisticated tools that permit them to assess portfolio construction and risk and performance attribution characteristics continuously, as well as to transmit new information and research conclusions rapidly around the world. Additionally, in its deliberations, the Board considered the Investment Advisers' trading and risk management capabilities and resources, which are an integral part of the investment management process.
Shareholder and Administrative Services. The Board considered (i) the nature, extent, quality, and cost of advisory, administrative, and shareholder services performed by the Investment Advisers and their affiliates under the Advisory Contracts and under separate agreements covering transfer agency, pricing and bookkeeping, and securities lending services for the fund; (ii) the nature and extent of the supervision of third party service providers, principally custodians and subcustodians; and (iii) the resources devoted to, and the record of compliance with, the fund's compliance policies and procedures. The Board also reviewed the allocation of fund brokerage, including allocations to brokers affiliated with the Investment Advisers, the use of brokerage commissions to pay fund expenses, and the use of "soft" commission dollars to pay for research services.
The Board noted that the growth of fund assets over time across the complex allows Fidelity to reinvest in the development of services designed to enhance the value or convenience of the Fidelity funds as investment vehicles. These services include 24-hour access to account information and market information through telephone representatives and over the Internet, investor education materials and asset allocation tools, and the expanded availability of Fidelity Investor Centers.
Annual Report
Board Approval of Investment Advisory Contracts and Management Fees - continued
Investment in a Large Fund Family. The Board considered the benefits to shareholders of investing in a Fidelity fund, including the benefits of investing in a fund that is part of a large family of funds offering a variety of investment disciplines and providing a large variety of mutual fund investor services. The Board noted that Fidelity had taken, or had made recommendations that resulted in the Fidelity funds taking, a number of actions over the previous year that benefited particular funds, including (i) continuing to dedicate additional resources to investment research and to the support of the senior management team that oversees asset management; (ii) persisting in efforts to enhance Fidelity's global research capabilities; (iii) launching new funds and making other enhancements to meet client needs for global and income-oriented solutions; (iv) continuing to launch dedicated lower cost underlying funds to meet portfolio construction needs related to expanding underlying fund options for Fidelity funds of funds, specifically for the Freedom Fund product lines; (v) rationalizing product lines and gaining increased efficiencies through the mergers of several funds into other funds; (vi) strengthening Fidelity's index fund offerings by reducing investment minimums and adopting or lowering existing expense caps for certain funds and classes; (vii) enhancing Global Asset Allocation product offerings by launching new funds and strategies, including "open architecture" target date funds that utilize affiliated and unaffiliated sub-advisers; (viii) modifying the eligibility criteria for Institutional Class shares of Advisor funds to increase their marketability to a portion of the defined contribution plan market; (ix) creating a new low-cost retirement share class for certain Advisor funds to appeal to large retirement plans; (x) transitioning the management of certain Fidelity commodity funds to Geode Capital Management LLC, a registered commodity pool operator, while retaining administrative responsibilities for the funds; (xi) reorganizing a number of funds; and (xii) taking steps toward establishing a new Fidelity adviser to manage sector-based funds and products.
Investment Performance. The Board considered whether the fund has operated in accordance with its investment objective, as well as its record of compliance with its investment restrictions and its performance history.
The Board took into account discussions with the Investment Advisers about fund investment performance that occur at Board meetings throughout the year. In this regard the Board noted that as part of regularly scheduled fund reviews and other reports to the Board on fund performance, the Board periodically considers annualized return information for the fund, for different time periods, measured against a securities market index ("benchmark index") and a peer group of mutual funds with similar objectives ("peer group"). In its evaluation of fund investment performance, the Board gave particular attention to information indicating changes in performance of certain Fidelity funds for specific time periods and the Investment Advisers' explanations for any overperformance or underperformance.
In addition to reviewing absolute and relative fund performance, the Independent Trustees periodically consider the appropriateness of fund performance metrics in evaluating the results achieved. In general, the Independent Trustees believe that fund performance should be evaluated based on net performance (after fees and expenses) of both the highest performing and lowest performing classes, where applicable, compared to appropriate benchmark indices, over appropriate time periods which may include full market cycles, and compared to peer groups, as applicable, over the same periods, taking into account relevant factors including the following: general market conditions; issuer-specific information; tactical opportunities for investment; and fund cash flows and other factors.
The Independent Trustees recognize that shareholders evaluate performance on a net basis over their own holding periods, for which one-, three-, and five-year periods are used as a proxy. For this reason, the performance information reviewed by the Board also included net cumulative calendar year total return information for the fund and an appropriate benchmark index and peer group for the most recent one-, three-, and five-year periods, as shown below. Returns are shown compared to the 25th percentile (top of box) and 75th percentile (bottom of box) of the peer universe.
Annual Report
VIP Equity-Income Portfolio
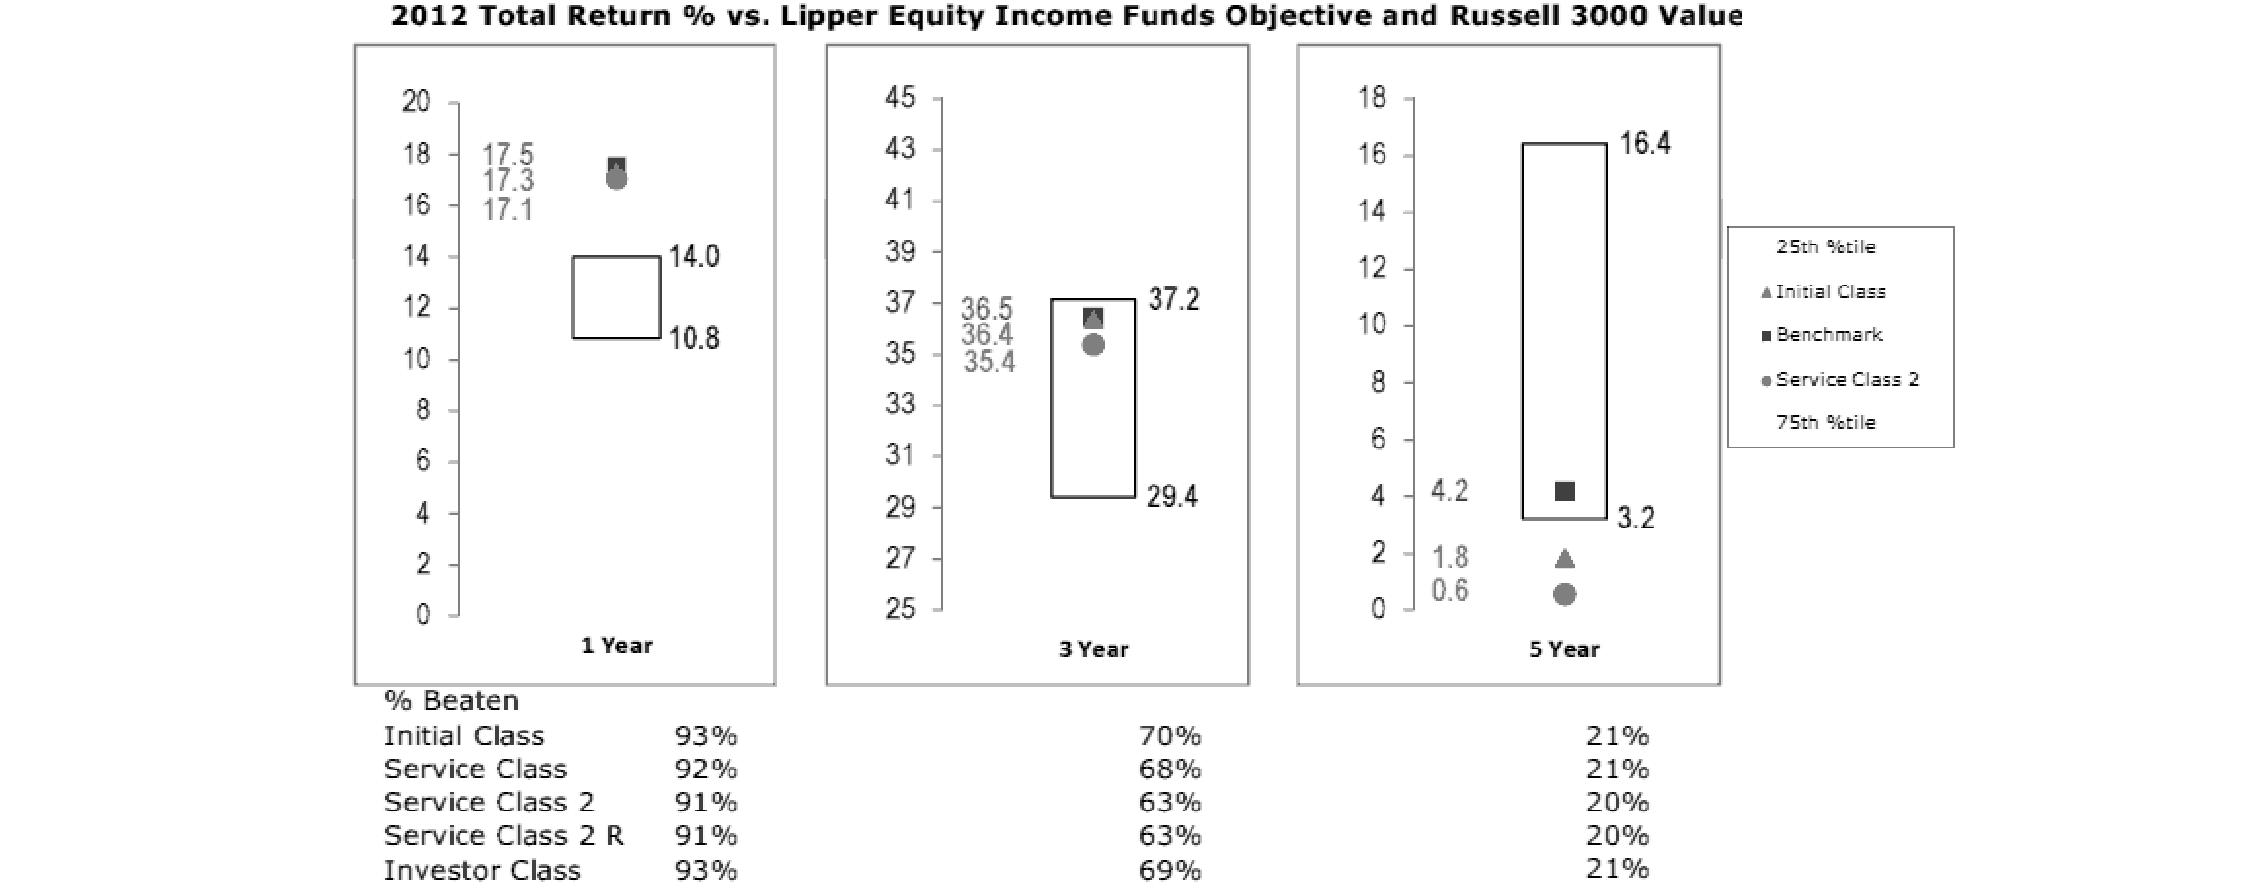
Based on its review, the Board concluded that the nature, extent, and quality of services provided to the fund under the Advisory Contracts should benefit the fund's shareholders.
Competitiveness of Management Fee and Total Expense Ratio. The Board considered the fund's management fee and total expense ratio compared to "mapped groups" of competitive funds and classes. Fidelity creates "mapped groups" by combining similar Lipper investment objective categories that have comparable management fee characteristics. Combining Lipper investment objective categories aids the Board's management fee and total expense ratio comparisons by broadening the competitive group used for comparison and by reducing the number of universes to which various Fidelity funds are compared.
Management Fee. The Board considered two proprietary management fee comparisons for the 12-month periods shown in the chart below. The group of Lipper funds used by the Board for management fee comparisons is referred to below as the "Total Mapped Group." The Total Mapped Group is broader than the Lipper peer group used by the Board for performance comparisons because the Total Mapped Group combines several Lipper investment objective categories while the Lipper peer group does not. The Total Mapped Group comparison focuses on a fund's standing in terms of gross management fees before expense reimbursements or caps relative to the total universe of funds with comparable investment mandates, regardless of whether their management fee structures also are comparable. Funds with comparable investment mandates offer exposure to similar types of securities. Funds with comparable management fee structures have similar management fee contractual arrangements (e.g., flat rate charged for advisory services, all-inclusive fee rate, etc.). "TMG %" represents the percentage of funds in the Total Mapped Group that had management fees that were lower than the fund's. For example, a TMG % of 13% means that 87% of the funds in the Total Mapped Group had higher management fees than the fund. The "Asset-Size Peer Group" (ASPG) comparison focuses on a fund's standing relative to a subset of non-Fidelity funds within the Total Mapped Group that are similar in size and management fee structure. The ASPG represents at least 15% of the funds in the Total Mapped Group with comparable asset size and management fee structures, subject to a minimum of 50 funds (or all funds in the Total Mapped Group if fewer than 50). Additional information, such as the ASPG quartile in which the fund's management fee ranked, is also included in the chart and considered by the Board.
Annual Report
Board Approval of Investment Advisory Contracts and Management Fees - continued
VIP Equity-Income Portfolio

The Board noted that the fund's management fee ranked below the median of its Total Mapped Group and below the median of its ASPG for 2012.
Based on its review, the Board concluded that the fund's management fee is fair and reasonable in light of the services that the fund receives and the other factors considered.
Total Expense Ratio. In its review of each class's total expense ratio, the Board considered the fund's management fee as well as other fund or class expenses, as applicable, such as transfer agent fees, pricing and bookkeeping fees, fund-paid 12b-1 fees, and custodial, legal, and audit fees. The Board also noted the effects of any waivers and reimbursements on fees and expenses. As part of its review, the Board also considered the current and historical total expense ratios of each class of the fund compared to competitive fund median expenses. Each class of the fund is compared to those funds and classes in the Total Mapped Group (used by the Board for management fee comparisons) that have a similar sales load structure.
The Board noted that the total expense ratio of each class ranked below its competitive median for 2012.
Fees Charged to Other Fidelity Clients. The Board also considered Fidelity fee structures and other information with respect to clients of FMR and its affiliates, such as other mutual funds advised or subadvised by FMR or its affiliates, pension plan clients, and other institutional clients. The Board noted the findings of the 2013 ad hoc joint committee (created with the board of other Fidelity funds), which reviewed and compared Fidelity's institutional investment advisory business with its business of providing services to the Fidelity funds, including the differences in services provided, fees charged, and costs incurred, as well as competition in their respective marketplaces.
Based on its review of total expense ratios and fees charged to other Fidelity clients, the Board concluded that the total expense ratio of each class of the fund was reasonable in light of the services that the fund and its shareholders receive and the other factors considered.
Costs of the Services and Profitability. The Board considered the revenues earned and the expenses incurred by Fidelity in conducting the business of developing, marketing, distributing, managing, administering and servicing the fund and servicing the fund's shareholders. The Board also considered the level of Fidelity's profits in respect of all the Fidelity funds.
On an annual basis, FMR presents to the Board Fidelity's profitability for the fund. Fidelity calculates the profitability for each fund, as well as aggregate profitability for groups of Fidelity funds and all Fidelity funds, using a series of detailed revenue and cost allocation methodologies which originate with the books and records of Fidelity on which Fidelity's audited financial statements are based. The Audit Committee of the Board reviews any significant changes from the prior year's methodologies.
PricewaterhouseCoopers LLP (PwC), independent registered public accounting firm and auditor to Fidelity and certain Fidelity funds, has been engaged annually by the Board as part of the Board's assessment of Fidelity's profitability analysis. PwC's engagement includes the review and assessment of the methodologies used by Fidelity in determining the revenues and expenses attributable to Fidelity's mutual fund business, and completion of agreed-upon procedures surrounding the mathematical accuracy of fund profitability and its conformity to allocation methodologies. After considering PwC's reports issued under the engagement and information provided by Fidelity, the Board concluded that while other allocation methods may also be reasonable, Fidelity's profitability methodologies are reasonable in all material respects.
Annual Report
The Board also reviewed Fidelity's non-fund businesses and fall-out benefits related to the mutual fund business as well as cases where Fidelity's affiliates may benefit from or be related to the fund's business.
The Board considered the costs of the services provided by and the profits realized by Fidelity in connection with the operation of the fund and was satisfied that the profitability was not excessive in the circumstances.
Economies of Scale. The Board considered whether there have been economies of scale in respect of the management of the Fidelity funds, whether the Fidelity funds (including the fund) have appropriately benefited from any such economies of scale, and whether there is potential for realization of any further economies of scale. The Board considered the extent to which the fund will benefit from economies of scale through increased services to the fund, through waivers or reimbursements, or through fee or expense reductions. The Board also noted that in 2009, it and the board of other Fidelity funds created an ad hoc committee (the Economies of Scale Committee) to analyze whether FMR attains economies of scale in respect of the management and servicing of the Fidelity funds, whether the Fidelity funds have appropriately benefited from such economies of scale, and whether there is potential for realization of any further economies of scale.
The Board recognized that the fund's management contract incorporates a "group fee" structure, which provides for lower group fee rates as total fund assets under FMR's management increase, and for higher group fee rates as total fund assets under FMR's management decrease. FMR calculates the group fee rates based on a tiered asset "breakpoint" schedule that varies based on asset class. The Board considered that the group fee is designed to deliver the benefits of economies of scale to fund shareholders when total Fidelity fund assets increase, even if assets of any particular fund are unchanged or have declined, because some portion of Fidelity's costs are attributable to services provided to all Fidelity funds, and all funds benefit if those costs can be allocated among more assets. The Board concluded that, given the group fee structure, fund shareholders will benefit from lower management fees as assets under FMR's management increase at the fund complex level, regardless of whether Fidelity achieves any such economies of scale.
The Board concluded, taking into account the analysis of the Economies of Scale Committee, that economies of scale, if any, are being appropriately shared between fund shareholders and Fidelity.
Amendment to Description of Group Fee Rate. At its July 2013 meeting, the Board voted to approve an amendment to the fund's management contract to modify the description of the "group fee rate" effective August 1, 2013. The Board noted that under the prior description in the contract, the group fee rate was based on the average net assets of all registered investment companies with which FMR has management contracts. Under the contract's tiered asset breakpoint schedule, the group fee rate is lower as total fund assets under FMR's management increase, and higher as total fund assets under FMR's management decrease. The Board considered that the prior description would have excluded the assets of 64 Fidelity sector funds from the group fee rate calculation once Fidelity SelectCo, LLC, an affiliate of FMR, assumed management responsibilities for those funds. The Board noted that modifying the description of the group fee rate to continue to include the assets of those 64 funds for purposes of determining group fee rate breakpoints would avoid an immediate adverse impact on the group fee rate for any fund.
Additional Information Requested by the Board. In order to develop fully the factual basis for consideration of the Fidelity funds' Advisory Contracts, the Board requested and received additional information on certain topics, including: (i) fund performance trends and Fidelity's long-term strategies for certain funds; (ii) the potential to further rationalize the Fidelity fund lineup with the possibility of achieving savings for the funds and Fidelity; (iii) the methodology with respect to competitive fund data and peer group classifications; (iv) the arrangements with, and performance of, certain sub-advisers on behalf of the Fidelity funds, as well as certain proposed participating affiliate arrangements; (v) the realization of fall-out benefits in certain Fidelity business units; (vi) Fidelity's group fee structures, including the rationale for the individual fee rates of certain categories of funds and the definition of group assets; (vii) trends regarding industry use of performance fee structures and the performance adjustment methodologies applicable to the Fidelity funds; (viii) additional competitive analysis regarding the total expenses for certain classes; and (ix) fund profitability methodology, including Fidelity's cost allocation methodology, and the impact of certain factors on fund profitability results.
Based on its evaluation of all of the conclusions noted above, and after considering all factors it believed relevant, the Board ultimately concluded that the advisory fee structures are fair and reasonable, and that the fund's Advisory Contracts should be renewed.
Annual Report
Investment Adviser
Fidelity Management & Research Company
Boston, MA
Investment Sub-Advisers
FMR Co., Inc.
Fidelity Management & Research (U.K.) Inc.
Fidelity Management & Research (Hong Kong) Limited
Fidelity Management & Research (Japan) Inc.
General Distributor
Fidelity Distributors Corporation
Smithfield, RI
Transfer and Service Agents
Fidelity Investments Institutional Operations Company, Inc.
Boston, MA
Fidelity Service Company, Inc.
Boston, MA
Custodian
The Northern Trust Company
Chicago, IL
VIPEI-ANN-0214
1.540027.116
Fidelity® Variable Insurance Products:
High Income Portfolio
Annual Report
December 31, 2013
(Fidelity Cover Art)
Contents
Performance | (Click Here) | How the fund has done over time. |
Management's Discussion of Fund Performance | (Click Here) | The Portfolio Manager's review of fund performance and strategy. |
Shareholder Expense Example | (Click Here) | An example of shareholder expenses. |
Investment Changes | (Click Here) | A summary of major shifts in the fund's investments over the past six months. |
Investments | (Click Here) | A complete list of the fund's investments with their market values. |
Financial Statements | (Click Here) | Statements of assets and liabilities, operations, and changes in net assets, as well as financial highlights. |
Notes | (Click Here) | Notes to the financial statements. |
Report of Independent Registered Public Accounting Firm | (Click Here) | |
Trustees and Officers | (Click Here) | |
Board Approval of Investment Advisory Contracts and Management Fees | (Click Here) | |
To view a fund's proxy voting guidelines and proxy voting record for the 12-month period ended June 30, visit http://www.fidelity.com/proxyvotingresults or visit the Securities and Exchange Commission's (SEC) web site at http://www.sec.gov. You may also call 1-877-208-0098 to request a free copy of the proxy voting guidelines.
Fidelity Variable Insurance Products are separate account options which are purchased through a variable insurance contract.
Standard & Poor's, S&P and S&P 500 are registered service marks of The McGraw-Hill Companies, Inc. and have been licensed for use by Fidelity Distributors Corporation.
Other third-party marks appearing herein are the property of their respective owners.
All other marks appearing herein are registered or unregistered trademarks or service marks of FMR LLC or an affiliated company. © 2014 FMR LLC. All rights reserved.
This report and the financial statements contained herein are submitted for the general information of the shareholders of the fund. This report is not authorized for distribution to prospective investors in the fund unless preceded or accompanied by an effective prospectus.
A fund files its complete schedule of portfolio holdings with the SEC for the first and third quarters of each fiscal year on Form N-Q. Forms N-Q are available on the SEC's web site at http://www.sec.gov. A fund's Forms N-Q may be reviewed and copied at the SEC's Public Reference Room in Washington, DC. Information regarding the operation of the SEC's Public Reference Room may be obtained by calling 1-800-SEC-0330. For a complete list of a fund's portfolio holdings, view the most recent holdings listing, semiannual report, or annual report on Fidelity's web site at http://www.fidelity.com, http://www.advisor.fidelity.com, or http://www.401k.com, as applicable.
NOT FDIC INSURED • MAY LOSE VALUE • NO BANK GUARANTEE
Neither the fund nor Fidelity Distributors Corporation is a bank.
Annual Report
Average annual total return reflects the change in the value of an investment, assuming reinvestment of the class' distributions from dividend income and capital gains (the profits earned upon the sale of securities that have grown in value, if any) and assuming a constant rate of performance each year. During periods of reimbursement by Fidelity, a fund's total return will be greater than it would be had the reimbursement not occurred. Performance numbers are net of all underlying fund operating expenses, but do not include any insurance charges imposed by your insurance company's separate account. If performance information included the effect of these additional charges, the total returns would have been lower. How a fund did yesterday is no guarantee of how it will do tomorrow.
Average Annual Total Returns
Periods ended December 31, 2013 | Past 1
year | Past 5
years | Past 10
years |
VIP High Income Portfolio - Initial Class | 5.95% | 15.58% | 7.13% |
VIP High Income Portfolio - Service Class | 5.87% | 15.44% | 7.03% |
VIP High Income Portfolio - Service Class 2 | 5.70% | 15.30% | 6.87% |
VIP High Income Portfolio - Investor Class A | 5.95% | 15.50% | 7.09% |
A The initial offering of Investor Class shares took place on July 21, 2005. Returns prior to July 21, 2005, are those of Initial Class, the original class of the fund. Had Investor Class's transfer agent fee been reflected, returns prior to July 21, 2005 would have been lower.
$10,000 Over 10 Years
Let's say hypothetically that $10,000 was invested in VIP High Income Portfolio - Initial Class on December 31, 2003. The chart shows how the value of your investment would have changed, and also shows how The BofA Merrill LynchSM US High Yield Constrained Index performed over the same period.
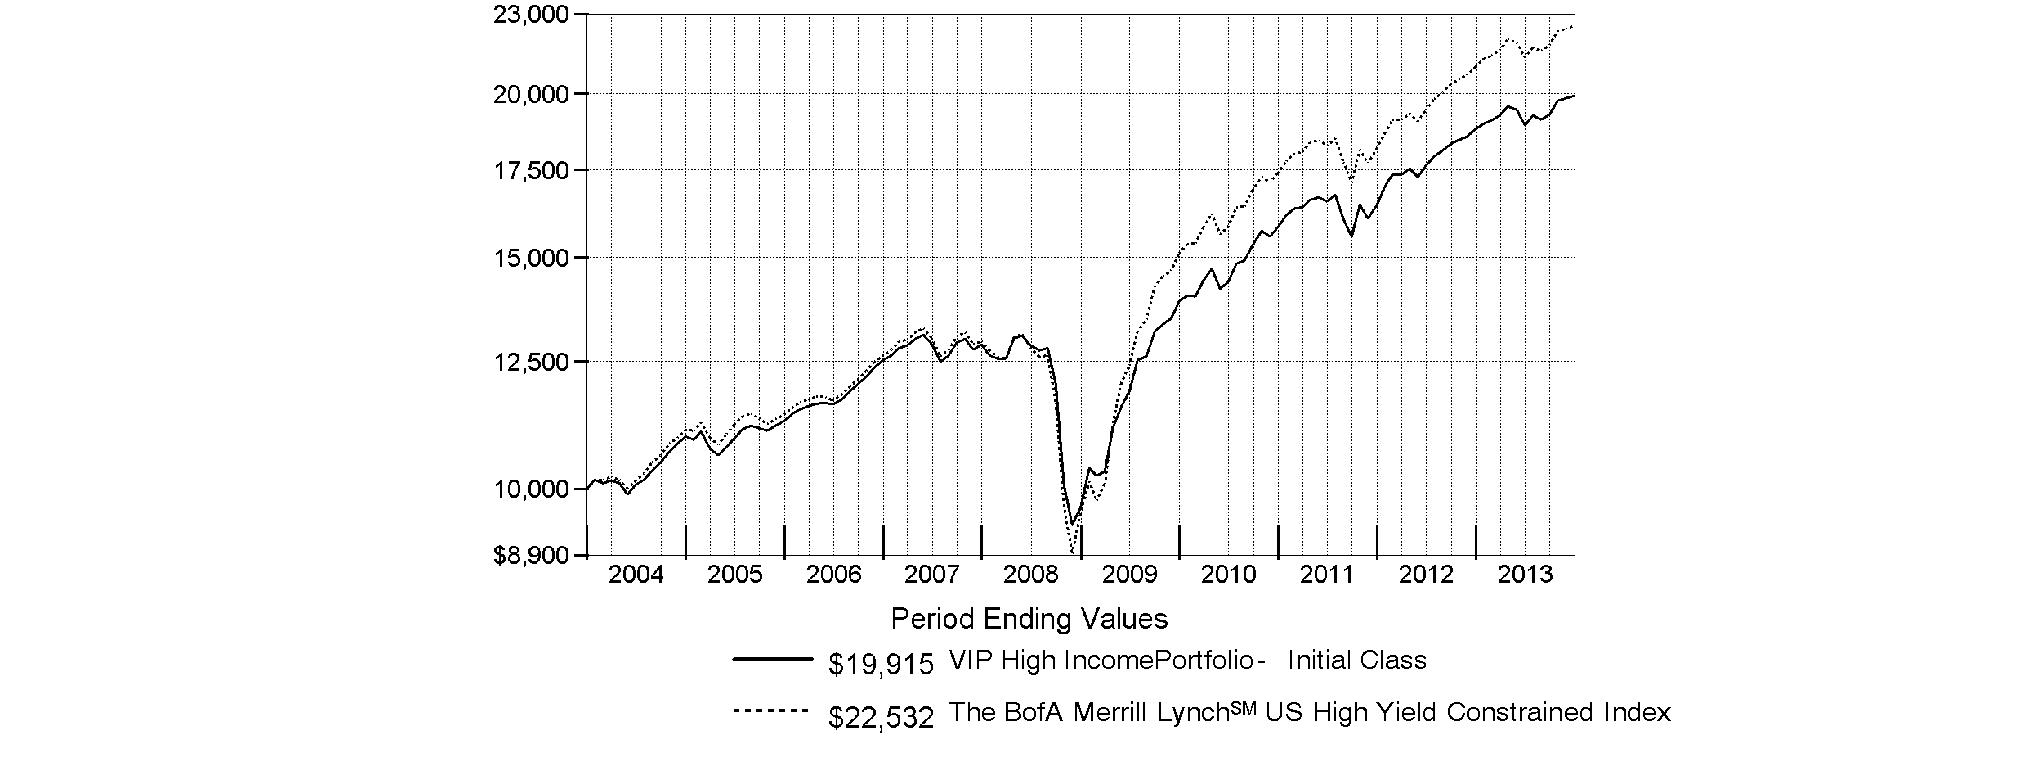
Annual Report
Market Recap: Global equity markets remained upbeat for the 12 months ending December 31, 2013, propelling the MSCI® ACWI® (All Country World Index) Index to a 23.24% return. Midyear turbulence gave way by autumn when policymakers in the U.S. and China had made clear their intentions to maintain accommodative monetary policies. That stance, combined with modest cyclical improvement around the globe and generally low valuations, underpinned the broad rally in equities, although the relative strength of the U.S. dollar generally tempered gains for U.S. investors holding foreign securities based in local currencies. During the period, the broad-market S&P 500® Index set a series of new highs, finishing the year up 32.39%. For the first time since 1995, the S&P® scored a "perfect 10," with all 10 economic sectors gaining at least 10% for the year. A resurgence in growth-oriented stocks lifted the Nasdaq Composite Index® to a 40.12% result for 2013, while the blue-chip Dow Jones Industrial AverageSM notched a relatively more modest 29.65% gain. International developed-markets equities rose in concert with their U.S. counterparts, with the MSCI® EAFE® Index gaining 22.92% for the period. Meanwhile, foreign exchange and commodity weakness curbed results in resource-heavy emerging markets (EM), especially in the year's waning months. More generally, concern over EM's slowing growth, its declining share of global trade and uncertainty surrounding U.S. central bank intentions were all factors hampering performance. The MSCI Emerging Markets Index returned -2.27% for the period. On the bond side, U.S. high-yield securities rallied with equities for much of the period, with The BofA Merrill LynchSM US High Yield Constrained Index returning 7.41% for 2013. The more rate-sensitive U.S. investment-grade bond category faced headwinds though, as reflected in the -2.02% return of the Barclays® U.S. Aggregate Bond Index. Within the Barclays index, investment-grade corporate credit returned -2.01%, while ultra-safe U.S. Treasuries saw a -2.75% result. Major non-U.S. developed markets performed only slightly better, with the Citigroup Non-USD Group-of-Seven (G7) Equal Weighted Index logging a -1.59% result. After several years of strong advances, EM debt reversed course in 2013, with the J.P. Morgan Emerging Markets Bond Index Global returning -6.58%.
Comments from Matthew Conti, Portfolio Manager of VIP High Income Portfolio: For the year, the fund's share classes underperformed the 7.41% return of the BofA Merrill Lynch index. (For specific portfolio results, please refer to the performance section of this report.) The fund underperformed the index due to its underweighting in lower-quality bonds, which were the top performers in the index during the period. Security selection in metals/mining and technology were negatives. Detractors included drilling services firm Boart Longyear Management and merchant power producer GenOn Energy. Boart suffered from declining commodity prices and GenOn because declining power usage depressed power prices. The fund's cash position, held for liquidity purposes, also detracted in an up market. On the plus side, security selection in energy and an overweighting in the food & drug retail industry helped. Drug store company Rite Aid and not owning Texas-based utility TXU were the top two contributors to performance relative to the index Rite-Aid benefited from increased sales of generic medications as several patents expired, because sales of generics are more profitable to the company than name-brand drugs. TXU lagged because of its imminent bankruptcy.
The views expressed above reflect those of the portfolio manager(s) only through the end of the period as stated on the cover of this report and do not necessarily represent the views of Fidelity or any other person in the Fidelity organization. Any such views are subject to change at any time based upon market or other conditions and Fidelity disclaims any responsibility to update such views. These views may not be relied on as investment advice and, because investment decisions for a Fidelity fund are based on numerous factors, may not be relied on as an indication of trading intent on behalf of any Fidelity fund.
Annual Report
As a shareholder of the Fund, you incur two types of costs: (1) transaction costs, including redemption fees and (2) ongoing costs, including management fees, distribution and/or service (12b-1) fees and other Fund expenses. This Example is intended to help you understand your ongoing costs (in dollars) of investing in the Fund and to compare these costs with the ongoing costs of investing in other mutual funds.
The Example is based on an investment of $1,000 invested at the beginning of the period and held for the entire period (July 1, 2013 to December 31, 2013).
Actual Expenses
The first line of the accompanying table for each class of the Fund provides information about actual account values and actual expenses. You may use the information in this line, together with the amount you invested, to estimate the expenses that you paid over the period. Simply divide your account value by $1,000.00 (for example, an $8,600 account value divided by $1,000.00 = 8.6), then multiply the result by the number in the first line for a class of the Fund under the heading entitled "Expenses Paid During Period" to estimate the expenses you paid on your account during this period. The estimate of expenses does not include any fees or other expenses of any variable annuity or variable life insurance product. If they were, the estimate of expenses you paid during the period would be higher, and your ending account value would be lower. In addition, the Fund, as a shareholder in the underlying Fidelity Central Funds, will indirectly bear its pro-rata share of the fees and expenses incurred by the underlying Fidelity Central Funds. These fees and expenses are not included in the Fund's annualized expense ratio used to calculate the expense estimate in the table below.
Hypothetical Example for Comparison Purposes
The second line of the accompanying table for each class of the Fund provides information about hypothetical account values and hypothetical expenses based on a Class' actual expense ratio and an assumed rate of return of 5% per year before expenses, which is not the Class' actual return. The hypothetical account values and expenses may not be used to estimate the actual ending account balance or expenses you paid for the period. You may use this information to compare the ongoing costs of investing in the Fund and other funds. To do so, compare this 5% hypothetical example with the 5% hypothetical examples that appear in the shareholder reports of the other funds. The estimate of expenses does not include any fees or other expenses of any variable annuity or variable life insurance product. If they were, the estimate of expenses you paid during the period would be higher, and your ending account value would be lower. In addition, the Fund, as a shareholder in the underlying Fidelity Central Funds, will indirectly bear its pro-rata share of the fees and expenses incurred by the underlying Fidelity Central Funds. These fees and expenses are not included in the Fund's annualized expense ratio used to calculate the expense estimate in the table below.
Please note that the expenses shown in the table are meant to highlight your ongoing costs only and do not reflect any transaction costs. Therefore, the second line of the table is useful in comparing ongoing costs only, and will not help you determine the relative total costs of owning different funds. In addition, if these transactional costs were included, your costs would have been higher.
| Annualized
Expense Ratio B | Beginning
Account Value
July 1, 2013 | Ending
Account Value
December 31, 2013 | Expenses Paid
During Period*
July 1, 2013
to December 31, 2013 |
Initial Class | .67% | | | |
Actual | | $ 1,000.00 | $ 1,052.90 | $ 3.47 |
HypotheticalA | | $ 1,000.00 | $ 1,021.83 | $ 3.41 |
Service Class | .76% | | | |
Actual | | $ 1,000.00 | $ 1,054.00 | $ 3.93 |
HypotheticalA | | $ 1,000.00 | $ 1,021.37 | $ 3.87 |
Service Class 2 | .92% | | | |
Actual | | $ 1,000.00 | $ 1,052.10 | $ 4.76 |
HypotheticalA | | $ 1,000.00 | $ 1,020.57 | $ 4.69 |
Initial Class R | .66% | | | |
Actual | | $ 1,000.00 | $ 1,054.90 | $ 3.42 |
HypotheticalA | | $ 1,000.00 | $ 1,021.88 | $ 3.36 |
Service Class R | .76% | | | |
Actual | | $ 1,000.00 | $ 1,054.50 | $ 3.94 |
HypotheticalA | | $ 1,000.00 | $ 1,021.37 | $ 3.87 |
Service Class 2R | .92% | | | |
Actual | | $ 1,000.00 | $ 1,053.80 | $ 4.76 |
HypotheticalA | | $ 1,000.00 | $ 1,020.57 | $ 4.69 |
Investor Class | .70% | | | |
Actual | | $ 1,000.00 | $ 1,053.00 | $ 3.62 |
HypotheticalA | | $ 1,000.00 | $ 1,021.68 | $ 3.57 |
A 5% return per year before expenses
B Annualized expense ratio reflects expenses net of applicable fee waivers.
* Expenses are equal to each Class' annualized expense ratio, multiplied by the average account value over the period, multiplied by 184/365 (to reflect the one-half year period).
Annual Report
Investment Changes (Unaudited)
Top Five Holdings as of December 31, 2013 |
(by issuer, excluding cash equivalents) | % of fund's
net assets | % of fund's net assets
6 months ago |
Rite Aid Corp. | 1.8 | 3.4 |
First Data Corp. | 1.7 | 2.0 |
Icahn Enterprises LP/Icahn Enterprises Finance Corp. | 1.5 | 0.9 |
Mirant Americas Generation LLC | 1.4 | 1.8 |
Reynolds Group Issuer, Inc./Reynolds Group Issuer LLC/Reynolds Group Issuer (Luxembourg) SA | 1.4 | 1.5 |
| 7.8 | |
Top Five Market Sectors as of December 31, 2013 |
| % of fund's
net assets | % of fund's net assets
6 months ago |
Energy | 12.9 | 12.9 |
Technology | 9.0 | 8.3 |
Telecommunications | 7.3 | 9.2 |
Diversified Financial Services | 6.0 | 5.3 |
Healthcare | 4.8 | 3.8 |
Quality Diversification (% of fund's net assets) |
As of December 31, 2013 | As of June 30, 2013 |
| BBB 1.1% | | | BBB 1.7% | |
 | BB 35.8% | | | BB 32.1% | |
| B 43.2% | | | B 46.4% | |
 | CCC,CC,C 14.7% | | | CCC,CC,C 15.7% | |
| Not Rated 0.6% | | | Not Rated 0.2% | |
 | Equities 0.0% | | | Equities 0.1% | |
| Short-Term
Investments and
Net Other Assets 4.6% | | | Short-Term
Investments and
Net Other Assets 3.8% | |

We have used ratings from Moody's Investors Service, Inc. Where Moody's® ratings are not available, we have used S&P® ratings. All ratings are as of the date indicated and do not reflect subsequent changes. |
Asset Allocation (% of fund's net assets) |
As of December 31, 2013* | As of June 30, 2013** |
| Nonconvertible
Bonds 89.3% | | | Nonconvertible
Bonds 93.2% | |
| Common Stocks 0.0% | | | Common Stocks 0.1% | |
| Bank Loan
Obligations 5.8% | | | Bank Loan
Obligations 2.8% | |
 | Other Investments 0.3% | | | Other Investments 0.1% | |
| Short-Term
Investments and
Net Other Assets (Liabilities) 4.6% | | | Short-Term
Investments and
Net Other Assets (Liabilities) 3.8% | |
* Foreign investments | 20.8% | | ** Foreign investments | 18.8% | |

Annual Report
Investments December 31, 2013
Showing Percentage of Net Assets
Nonconvertible Bonds - 89.3% |
| Principal Amount | | Value |
Aerospace - 0.8% |
GenCorp, Inc. 7.125% 3/15/21 | | $ 895,000 | | $ 957,650 |
TransDigm, Inc.: | | | | |
5.5% 10/15/20 | | 5,935,000 | | 5,801,463 |
7.5% 7/15/21 | | 2,750,000 | | 2,956,250 |
Triumph Group, Inc. 4.875% 4/1/21 | | 2,210,000 | | 2,143,700 |
| | 11,859,063 |
Air Transportation - 2.7% |
Air Canada 6.625% 5/15/18 (d) | | 4,995,000 | | 4,973,022 |
American Airlines, Inc. pass-thru certificates Series 2013-1B Class B, 5.625% 1/15/21 (d) | | 495,000 | | 496,238 |
Continental Airlines, Inc.: | | | | |
pass-thru trust certificates 9.798% 4/1/21 | | 2,844,624 | | 3,207,314 |
5.5% 4/29/22 | | 3,015,000 | | 3,105,450 |
6.125% 4/29/18 (d) | | 520,000 | | 543,400 |
9.25% 5/10/17 | | 655,343 | | 725,793 |
Delta Air Lines, Inc. pass-thru trust certificates: | | | | |
6.375% 7/2/17 (d) | | 1,985,000 | | 2,109,063 |
6.75% 5/23/17 | | 1,985,000 | | 2,118,988 |
8.021% 8/10/22 | | 1,533,010 | | 1,724,637 |
8.954% 8/10/14 | | 1,245,554 | | 1,261,124 |
Northwest Airlines, Inc. pass-thru trust certificates 8.028% 11/1/17 | | 553,780 | | 599,467 |
U.S. Airways Group, Inc. 6.125% 6/1/18 | | 3,130,000 | | 3,153,475 |
U.S. Airways pass-thru certificates: Series 2012-2C, 5.45% 6/3/18 | | 3,565,000 | | 3,502,613 |
Series 2013-1 Class B, 5.375% 5/15/23 | | 710,000 | | 699,350 |
United Air Lines, Inc. pass-thru trust certificates: | | | | |
Class B, 7.336% 7/2/19 | | 2,397,831 | | 2,541,701 |
9.75% 1/15/17 | | 1,610,949 | | 1,852,591 |
12% 1/15/16 (d) | | 454,648 | | 511,479 |
United Continental Holdings, Inc.: | | | | |
6% 12/1/20 | | 4,505,000 | | 4,493,738 |
6% 7/15/26 | | 2,605,000 | | 2,240,300 |
6% 7/15/28 | | 1,395,000 | | 1,185,750 |
6.375% 6/1/18 | | 300,000 | | 313,500 |
| | 41,358,993 |
Automotive - 2.9% |
American Axle & Manufacturing, Inc.: | | | | |
5.125% 2/15/19 | | 575,000 | | 590,813 |
6.25% 3/15/21 | | 6,980,000 | | 7,416,250 |
Chrysler Group LLC/CG Co-Issuer, Inc. 8% 6/15/19 | | 3,930,000 | | 4,342,650 |
Dana Holding Corp.: | | | | |
5.375% 9/15/21 | | 1,085,000 | | 1,089,069 |
|
| Principal Amount | | Value |
6% 9/15/23 | | $ 1,085,000 | | $ 1,087,713 |
6.5% 2/15/19 | | 1,505,000 | | 1,599,063 |
6.75% 2/15/21 | | 1,710,000 | | 1,838,250 |
General Motors Co.: | | | | |
3.5% 10/2/18 (d) | | 3,425,000 | | 3,502,063 |
6.25% 10/2/43 (d) | | 4,155,000 | | 4,316,006 |
General Motors Financial Co., Inc.: | | | | |
3.25% 5/15/18 (d) | | 6,900,000 | | 6,900,000 |
4.75% 8/15/17 (d) | | 3,370,000 | | 3,576,413 |
Jaguar Land Rover PLC 4.125% 12/15/18 (d) | | 2,675,000 | | 2,691,719 |
Schaeffler Holding Finance BV 6.875% 8/15/18
pay-in-kind (d)(g) | | 4,625,000 | | 4,902,500 |
| | 43,852,509 |
Banks & Thrifts - 1.8% |
Ally Financial, Inc.: | | | | |
2.75% 1/30/17 | | 3,010,000 | | 3,021,288 |
4.75% 9/10/18 | | 6,810,000 | | 7,124,963 |
Barclays Bank PLC 7.625% 11/21/22 | | 11,385,000 | | 12,125,025 |
GMAC LLC 8% 12/31/18 | | 2,465,000 | | 2,908,700 |
Synovus Financial Corp.: | | | | |
5.125% 6/15/17 | | 760,000 | | 784,700 |
7.875% 2/15/19 | | 1,568,000 | | 1,760,080 |
| | 27,724,756 |
Broadcasting - 1.6% |
AMC Networks, Inc. 4.75% 12/15/22 | | 5,725,000 | | 5,453,063 |
Clear Channel Communications, Inc.: | | | | |
4.9% 5/15/15 | | 4,585,000 | | 4,401,600 |
5.5% 12/15/16 | | 6,085,000 | | 5,354,800 |
Sirius XM Radio, Inc.: | | | | |
5.75% 8/1/21 (d) | | 2,315,000 | | 2,338,150 |
5.875% 10/1/20 (d) | | 2,410,000 | | 2,458,200 |
Starz LLC/Starz Finance Corp. 5% 9/15/19 | | 4,990,000 | | 5,102,275 |
| | 25,108,088 |
Building Materials - 2.8% |
Building Materials Corp. of America: | | | | |
6.75% 5/1/21 (d) | | 3,680,000 | | 3,983,600 |
6.875% 8/15/18 (d) | | 4,490,000 | | 4,770,625 |
Building Materials Holding Corp. 9% 9/15/18 (d) | | 4,410,000 | | 4,751,775 |
HD Supply, Inc.: | | | | |
7.5% 7/15/20 | | 7,655,000 | | 8,248,263 |
8.125% 4/15/19 | | 3,615,000 | | 4,026,206 |
Headwaters, Inc.: | | | | |
7.25% 1/15/19 (d) | | 905,000 | | 929,888 |
7.625% 4/1/19 | | 2,525,000 | | 2,720,688 |
Masco Corp. 5.95% 3/15/22 | | 1,815,000 | | 1,919,363 |
Nonconvertible Bonds - continued |
| Principal Amount | | Value |
Building Materials - continued |
Texas Industries, Inc. 9.25% 8/15/20 | | $ 7,285,000 | | $ 8,113,669 |
U.S. Concrete, Inc. 8.5% 12/1/18 (d) | | 1,160,000 | | 1,186,100 |
USG Corp.: | | | | |
5.875% 11/1/21 (d) | | 330,000 | | 343,200 |
7.875% 3/30/20 (d) | | 970,000 | | 1,091,250 |
| | 42,084,627 |
Cable TV - 3.1% |
Cablevision Systems Corp. 7.75% 4/15/18 | | 740,000 | | 826,025 |
CCO Holdings LLC/CCO Holdings Capital Corp.: | | | | |
6.5% 4/30/21 | | 2,155,000 | | 2,214,263 |
7% 1/15/19 | | 6,450,000 | | 6,796,688 |
Cequel Communications Escrow I LLC/Cequel Communications Escrow Capital Corp. 6.375% 9/15/20 (d) | | 3,395,000 | | 3,479,875 |
Cequel Communications Holdings I LLC/Cequel Capital Corp. 5.125% 12/15/21 (d) | | 4,290,000 | | 4,021,875 |
Cogeco Cable, Inc. 4.875% 5/1/20 (d) | | 710,000 | | 685,150 |
DISH DBS Corp. 4.25% 4/1/18 | | 1,705,000 | | 1,739,100 |
Harron Communications LP/Harron Finance Corp. 9.125% 4/1/20 (d) | | 2,085,000 | | 2,309,138 |
Lynx I Corp. 5.375% 4/15/21 (d) | | 2,550,000 | | 2,550,000 |
RCN Telecom Services LLC/RCN Capital Corp. 8.5% 8/15/20 (d) | | 2,195,000 | | 2,216,950 |
Unitymedia Hessen GmbH & Co. KG/Unitymedia NRW GmbH: | | | | |
5.5% 1/15/23 (d) | | 4,325,000 | | 4,195,250 |
7.5% 3/15/19 (d) | | 950,000 | | 1,033,125 |
UPCB Finance III Ltd. 6.625% 7/1/20 (d) | | 2,710,000 | | 2,879,375 |
UPCB Finance V Ltd. 7.25% 11/15/21 (d) | | 3,270,000 | | 3,547,950 |
WaveDivision Escrow LLC/WaveDivision Escrow Corp. 8.125% 9/1/20 (d) | | 7,920,000 | | 8,395,200 |
| | 46,889,964 |
Capital Goods - 0.4% |
Amsted Industries, Inc. 8.125% 3/15/18 (d) | | 2,030,000 | | 2,139,113 |
J.B. Poindexter & Co., Inc. 9% 4/1/22 (d) | | 3,830,000 | | 4,088,525 |
| | 6,227,638 |
Chemicals - 2.5% |
Ashland, Inc. 3.875% 4/15/18 | | 3,030,000 | | 3,067,875 |
INEOS Finance PLC 8.375% 2/15/19 (d) | | 5,495,000 | | 6,113,188 |
|
| Principal Amount | | Value |
Kinove German Bondco GmbH 9.625% 6/15/18 (d) | | $ 5,539,000 | | $ 6,120,595 |
LSB Industries, Inc. 7.75% 8/1/19 (d) | | 1,220,000 | | 1,281,000 |
Nufarm Australia Ltd. 6.375% 10/15/19 (d) | | 3,140,000 | | 3,249,900 |
OMNOVA Solutions, Inc. 7.875% 11/1/18 | | 2,575,000 | | 2,768,125 |
Rockwood Specialties Group, Inc. 4.625% 10/15/20 | | 2,850,000 | | 2,910,563 |
Trinseo Materials Operating SCA/Trinseo Materials Finance, Inc. 8.75% 2/1/19 (d) | | 9,195,000 | | 9,493,838 |
Tronox Finance LLC 6.375% 8/15/20 | | 3,675,000 | | 3,748,500 |
| | 38,753,584 |
Consumer Products - 0.3% |
First Quality Finance Co., Inc. 4.625% 5/15/21 (d) | | 5,415,000 | | 5,144,250 |
Containers - 2.7% |
Ardagh Packaging Finance PLC 7.375% 10/15/17 (d) | | 1,415,000 | | 1,521,125 |
Ardagh Packaging Finance PLC/Ardagh MP Holdings U.S.A., Inc.: | | | | |
7% 11/15/20 (d) | | 4,955,000 | | 5,004,550 |
7.375% 10/15/17 (d) | | 335,000 | | 359,706 |
Ball Corp. 4% 11/15/23 | | 3,285,000 | | 2,940,075 |
BOE Intermediate Holding Corp. 9.75% 11/1/17 pay-in-kind (d) | | 2,138,047 | | 2,193,013 |
Crown Americas LLC/Crown Americas Capital Corp. IV 4.5% 1/15/23 | | 8,240,000 | | 7,704,400 |
Reynolds Group Issuer, Inc./Reynolds Group Issuer LLC/Reynolds Group Issuer (Luxembourg) SA: | | | | |
5.75% 10/15/20 | | 8,455,000 | | 8,624,100 |
8.5% 5/15/18 (c) | | 6,290,000 | | 6,635,950 |
9.875% 8/15/19 | | 5,310,000 | | 5,907,375 |
| | 40,890,294 |
Diversified Financial Services - 6.0% |
Aircastle Ltd.: | | | | |
4.625% 12/15/18 | | 1,245,000 | | 1,254,338 |
6.25% 12/1/19 | | 1,740,000 | | 1,863,975 |
6.75% 4/15/17 | | 2,030,000 | | 2,263,450 |
9.75% 8/1/18 | | 3,295,000 | | 3,599,788 |
CIT Group, Inc.: | | | | |
5.25% 3/15/18 | | 4,935,000 | | 5,292,788 |
5.375% 5/15/20 | | 4,035,000 | | 4,287,188 |
5.5% 2/15/19 (d) | | 5,555,000 | | 5,957,738 |
FLY Leasing Ltd. 6.75% 12/15/20 | | 4,015,000 | | 4,065,188 |
Icahn Enterprises LP/Icahn Enterprises Finance Corp.: | | | | |
6% 8/1/20 (d) | | 9,685,000 | | 9,975,550 |
8% 1/15/18 | | 11,285,000 | | 11,736,400 |
Nonconvertible Bonds - continued |
| Principal Amount | | Value |
Diversified Financial Services - continued |
ILFC E-Capital Trust I 5.46% 12/21/65 (d)(g) | | $ 3,780,000 | | $ 3,458,700 |
ILFC E-Capital Trust II 6.25% 12/21/65 (d)(g) | | 3,865,000 | | 3,652,425 |
International Lease Finance Corp.: | | | | |
3.875% 4/15/18 | | 2,365,000 | | 2,370,913 |
4.625% 4/15/21 | | 2,020,000 | | 1,929,100 |
5.875% 4/1/19 | | 5,485,000 | | 5,841,525 |
5.875% 8/15/22 | | 3,480,000 | | 3,471,300 |
6.25% 5/15/19 | | 2,245,000 | | 2,430,213 |
8.75% 3/15/17 | | 2,110,000 | | 2,484,525 |
SLM Corp.: | | | | |
4.875% 6/17/19 | | 3,775,000 | | 3,761,610 |
5.5% 1/15/19 | | 8,540,000 | | 8,759,905 |
8% 3/25/20 | | 1,565,000 | | 1,772,363 |
8.45% 6/15/18 | | 1,560,000 | | 1,817,400 |
| | 92,046,382 |
Diversified Media - 1.4% |
Clear Channel Worldwide Holdings, Inc.: | | | | |
6.5% 11/15/22 | | 2,715,000 | | 2,752,331 |
6.5% 11/15/22 | | 4,990,000 | | 5,096,038 |
Darling Escrow Corp. 5.375% 1/15/22 (d)(f) | | 990,000 | | 997,425 |
MDC Partners, Inc. 6.75% 4/1/20 (d) | | 4,410,000 | | 4,613,963 |
Nielsen Co. S.a.r.l. (Luxembourg) 5.5% 10/1/21 (d) | | 3,610,000 | | 3,664,150 |
Nielsen Finance LLC/Nielsen Finance Co. 4.5% 10/1/20 | | 4,525,000 | | 4,400,563 |
| | 21,524,470 |
Electric Utilities - 4.8% |
Atlantic Power Corp. 9% 11/15/18 | | 8,740,000 | | 9,111,450 |
Dolphin Subsidiary II, Inc. 6.5% 10/15/16 | | 1,205,000 | | 1,304,413 |
GenOn Energy, Inc. 9.5% 10/15/18 | | 1,515,000 | | 1,715,738 |
Mirant Americas Generation LLC: | | | | |
8.5% 10/1/21 | | 6,785,000 | | 7,141,213 |
9.125% 5/1/31 | | 14,265,000 | | 14,514,638 |
NRG Energy, Inc. 7.625% 1/15/18 | | 5,090,000 | | 5,802,600 |
NSG Holdings II, LLC 7.75% 12/15/25 (d) | | 10,300,000 | | 10,969,500 |
Puget Energy, Inc.: | | | | |
5.625% 7/15/22 | | 3,925,000 | | 4,268,453 |
6.5% 12/15/20 | | 3,975,000 | | 4,522,894 |
The AES Corp.: | | | | |
4.875% 5/15/23 | | 3,475,000 | | 3,249,125 |
7.375% 7/1/21 | | 9,660,000 | | 10,891,650 |
| | 73,491,674 |
|
| Principal Amount | | Value |
Energy - 11.8% |
Access Midstream Partners LP/ACMP Finance Corp. 4.875% 5/15/23 | | $ 4,265,000 | | $ 4,115,725 |
Antero Resources Finance Corp.: | | | | |
5.375% 11/1/21 (d) | | 1,930,000 | | 1,949,300 |
6% 12/1/20 | | 6,300,000 | | 6,615,000 |
7.25% 8/1/19 | | 1,209,000 | | 1,299,675 |
Basic Energy Services, Inc. 7.75% 2/15/19 | | 615,000 | | 642,675 |
Chesapeake Energy Corp.: | | | | |
6.125% 2/15/21 | | 7,230,000 | | 7,754,175 |
6.875% 11/15/20 | | 1,250,000 | | 1,412,500 |
Chesapeake Midstream Partners LP/CHKM Finance Corp.: | | | | |
5.875% 4/15/21 | | 615,000 | | 654,975 |
6.125% 7/15/22 | | 1,745,000 | | 1,867,150 |
Chesapeake Oilfield Operating LLC 6.625% 11/15/19 (c) | | 1,680,000 | | 1,759,800 |
Crestwood Midstream Partners LP/Crestwood Midstream Finance Corp.: | | | | |
6.125% 3/1/22 (d) | | 1,175,000 | | 1,204,375 |
7.75% 4/1/19 | | 2,315,000 | | 2,511,775 |
Denbury Resources, Inc.: | | | | |
4.625% 7/15/23 | | 6,660,000 | | 6,010,650 |
6.375% 8/15/21 | | 2,550,000 | | 2,715,750 |
Edgen Murray Corp. 8.75% 11/1/20 (d) | | 2,285,000 | | 2,616,325 |
Endeavor Energy Resources LP/EER Finance, Inc. 7% 8/15/21 (d) | | 7,515,000 | | 7,590,150 |
Energy Partners Ltd. 8.25% 2/15/18 | | 2,795,000 | | 3,004,625 |
EP Energy LLC/Everest Acquisition Finance, Inc. 7.75% 9/1/22 | | 4,015,000 | | 4,496,800 |
Everest Acquisition LLC/Everest Acquisition Finance, Inc.: | | | | |
6.875% 5/1/19 | | 1,655,000 | | 1,781,194 |
9.375% 5/1/20 | | 8,685,000 | | 10,020,319 |
Expro Finance Luxembourg SCA 8.5% 12/15/16 (d) | | 3,312,000 | | 3,452,760 |
Exterran Holdings, Inc. 7.25% 12/1/18 | | 7,855,000 | | 8,296,844 |
Exterran Partners LP/EXLP Finance Corp. 6% 4/1/21 (d) | | 6,300,000 | | 6,252,750 |
Forbes Energy Services Ltd. 9% 6/15/19 | | 4,680,000 | | 4,586,400 |
Forest Oil Corp. 7.25% 6/15/19 | | 977,000 | | 951,354 |
Gibson Energy, Inc. 6.75% 7/15/21 (d) | | 3,425,000 | | 3,621,938 |
Hornbeck Offshore Services, Inc.: | | | | |
5% 3/1/21 | | 2,465,000 | | 2,415,700 |
5.875% 4/1/20 | | 1,240,000 | | 1,280,300 |
Kinder Morgan Holding Co. LLC: | | | | |
5% 2/15/21 (d) | | 2,525,000 | | 2,487,090 |
5.625% 11/15/23 (d) | | 3,645,000 | | 3,529,224 |
Nonconvertible Bonds - continued |
| Principal Amount | | Value |
Energy - continued |
Northern Tier Energy LLC/Northern Tier Finance Corp. 7.125% 11/15/20 | | $ 6,070,000 | | $ 6,343,150 |
Offshore Group Investment Ltd.: | | | | |
7.125% 4/1/23 | | 1,890,000 | | 1,927,800 |
7.5% 11/1/19 | | 7,160,000 | | 7,786,500 |
Oil States International, Inc. 6.5% 6/1/19 | | 3,300,000 | | 3,510,375 |
Pacific Drilling SA 5.375% 6/1/20 (d) | | 4,750,000 | | 4,773,750 |
Petroleum Geo-Services ASA 7.375% 12/15/18 (d) | | 3,225,000 | | 3,434,625 |
Precision Drilling Corp.: | | | | |
6.5% 12/15/21 | | 290,000 | | 308,850 |
6.625% 11/15/20 | | 2,505,000 | | 2,674,088 |
Samson Investment Co. 10.5% 2/15/20 (c)(d) | | 11,155,000 | | 12,158,950 |
SemGroup Corp. 7.5% 6/15/21 (d) | | 2,775,000 | | 2,934,563 |
Targa Resources Partners LP/Targa Resources Partners Finance Corp.: | | | | |
4.25% 11/15/23 (d) | | 2,445,000 | | 2,188,275 |
5.25% 5/1/23 | | 4,876,000 | | 4,723,625 |
6.375% 8/1/22 | | 592,000 | | 626,040 |
6.875% 2/1/21 | | 2,840,000 | | 3,053,000 |
Tesoro Logistics LP/Tesoro Logistics Finance Corp. 6.125% 10/15/21 | | 855,000 | | 880,650 |
Western Refining, Inc. 6.25% 4/1/21 | | 5,905,000 | | 5,949,288 |
Whiting Petroleum Corp.: | | | | |
5% 3/15/19 | | 4,610,000 | | 4,713,725 |
5.75% 3/15/21 | | 4,815,000 | | 4,983,525 |
| | 179,868,077 |
Entertainment/Film - 0.4% |
GLP Capital LP/GLP Financing II, Inc.: | | | | |
4.375% 11/1/18 (d) | | 1,735,000 | | 1,774,038 |
5.375% 11/1/23 (d) | | 1,310,000 | | 1,287,075 |
NAI Entertainment Holdings LLC/NAI Entertainment Finance Corp. 5% 8/1/18 (d) | | 2,970,000 | | 3,066,525 |
| | 6,127,638 |
Environmental - 1.5% |
ADS Waste Holdings, Inc. 8.25% 10/1/20 | | 5,875,000 | | 6,374,375 |
Clean Harbors, Inc.: | | | | |
5.125% 6/1/21 | | 3,450,000 | | 3,484,500 |
5.25% 8/1/20 | | 2,590,000 | | 2,667,700 |
Covanta Holding Corp. 7.25% 12/1/20 | | 5,165,000 | | 5,638,600 |
|
| Principal Amount | | Value |
Tervita Corp.: | | | | |
8% 11/15/18 (d) | | $ 2,675,000 | | $ 2,761,938 |
9.75% 11/1/19 (d) | | 1,495,000 | | 1,465,100 |
10.875% 2/15/18 (d) | | 875,000 | | 884,275 |
| | 23,276,488 |
Food & Drug Retail - 2.2% |
BI-LO LLC/BI-LO Finance Corp. 8.625% 9/15/18
pay-in-kind (d)(g) | | 1,340,000 | | 1,400,300 |
JBS Investments GmbH 7.75% 10/28/20 (d) | | 3,740,000 | | 3,768,050 |
Rite Aid Corp.: | | | | |
6.75% 6/15/21 | | 3,520,000 | | 3,691,600 |
9.25% 3/15/20 | | 21,255,000 | | 24,390,067 |
| | 33,250,017 |
Food/Beverage/Tobacco - 1.8% |
Barry Callebaut Services NV 5.5% 6/15/23 (d) | | 2,485,000 | | 2,534,700 |
DS Waters of America, Inc. 10% 9/1/21 (d) | | 1,485,000 | | 1,592,663 |
ESAL GmbH 6.25% 2/5/23 (d) | | 7,405,000 | | 6,645,988 |
FAGE Dairy Industry SA/FAGE U.S.A. Dairy Industry, Inc. 9.875% 2/1/20 (d) | | 1,340,000 | | 1,400,300 |
Hawk Acquisition Sub, Inc. 4.25% 10/15/20 (d) | | 4,950,000 | | 4,789,125 |
JBS U.S.A. LLC/JBS U.S.A. Finance, Inc.: | | | | |
7.25% 6/1/21 (d) | | 2,930,000 | | 3,047,200 |
8.25% 2/1/20 (d) | | 6,670,000 | | 7,236,950 |
| | 27,246,926 |
Gaming - 1.8% |
Ameristar Casinos, Inc. 7.5% 4/15/21 | | 7,590,000 | | 8,235,150 |
Golden Nugget Escrow, Inc. 8.5% 12/1/21 (d) | | 2,770,000 | | 2,797,700 |
MCE Finance Ltd. 5% 2/15/21 (d) | | 5,010,000 | | 4,884,750 |
MGM Mirage, Inc.: | | | | |
7.625% 1/15/17 | | 930,000 | | 1,057,875 |
8.625% 2/1/19 | | 2,760,000 | | 3,236,100 |
11.375% 3/1/18 | | 2,360,000 | | 2,997,200 |
PNK Finance Corp. 6.375% 8/1/21 (d) | | 2,605,000 | | 2,663,613 |
Seminole Hard Rock Entertainment, Inc. 5.875% 5/15/21 (d) | | 1,490,000 | | 1,463,925 |
| | 27,336,313 |
Healthcare - 4.6% |
Community Health Systems, Inc.: | | | | |
5.125% 8/15/18 | | 3,535,000 | | 3,649,888 |
8% 11/15/19 | | 8,020,000 | | 8,701,700 |
DaVita, Inc. 5.75% 8/15/22 | | 6,925,000 | | 7,011,563 |
DJO Finance LLC/DJO Finance Corp.: | | | | |
7.75% 4/15/18 | | 1,350,000 | | 1,373,625 |
Nonconvertible Bonds - continued |
| Principal Amount | | Value |
Healthcare - continued |
DJO Finance LLC/DJO Finance Corp.: - continued | | | | |
8.75% 3/15/18 | | $ 165,000 | | $ 181,088 |
9.875% 4/15/18 | | 2,425,000 | | 2,606,875 |
Emergency Medical Services Corp. 8.125% 6/1/19 | | 3,292,000 | | 3,567,705 |
HCA Holdings, Inc. 8% 10/1/18 | | 4,350,000 | | 5,138,438 |
HealthSouth Corp. 7.25% 10/1/18 | | 3,588,000 | | 3,834,675 |
MPT Operating Partnership LP/MPT Finance Corp. 6.875% 5/1/21 | | 2,595,000 | | 2,776,650 |
Omega Healthcare Investors, Inc.: | | | | |
6.75% 10/15/22 | | 235,000 | | 255,269 |
7.5% 2/15/20 | | 890,000 | | 970,100 |
Sabra Health Care LP/Sabra Capital Corp. 8.125% 11/1/18 | | 338,000 | | 365,040 |
Tenet Healthcare Corp.: | | | | |
6% 10/1/20 (d) | | 5,420,000 | | 5,657,125 |
6.25% 11/1/18 | | 1,435,000 | | 1,589,263 |
8.125% 4/1/22 | | 7,055,000 | | 7,601,763 |
Valeant Pharmaceuticals International: | | | | |
6.5% 7/15/16 (d) | | 1,314,000 | | 1,356,705 |
6.75% 8/15/18 (d) | | 4,195,000 | | 4,609,256 |
6.875% 12/1/18 (d) | | 4,655,000 | | 4,980,850 |
VPI Escrow Corp. 6.375% 10/15/20 (d) | | 3,960,000 | | 4,172,850 |
| | 70,400,428 |
Homebuilders/Real Estate - 2.8% |
CBRE Group, Inc. 6.625% 10/15/20 | | 2,575,000 | | 2,755,250 |
D.R. Horton, Inc.: | | | | |
3.625% 2/15/18 | | 3,605,000 | | 3,659,075 |
4.375% 9/15/22 | | 1,675,000 | | 1,561,938 |
4.75% 5/15/17 | | 880,000 | | 930,600 |
Howard Hughes Corp. 6.875% 10/1/21 (d) | | 2,870,000 | | 2,984,800 |
Lennar Corp. 4.125% 12/1/18 | | 3,605,000 | | 3,623,025 |
Standard Pacific Corp. 8.375% 5/15/18 | | 14,220,000 | | 16,708,500 |
Toll Brothers Finance Corp.: | | | | |
4% 12/31/18 | | 3,350,000 | | 3,408,625 |
4.375% 4/15/23 | | 5,520,000 | | 5,119,800 |
5.625% 1/15/24 | | 2,430,000 | | 2,448,225 |
| | 43,199,838 |
Hotels - 0.7% |
Hilton Worldwide Finance LLC/Hilton Worldwide Finance Corp. 5.625% 10/15/21 (d) | | 6,570,000 | | 6,816,375 |
Playa Resorts Holding BV 8% 8/15/20 (d) | | 3,515,000 | | 3,730,294 |
| | 10,546,669 |
|
| Principal Amount | | Value |
Insurance - 0.1% |
Hockey Merger Sub 2, Inc. 7.875% 10/1/21 (d) | | $ 2,055,000 | | $ 2,111,513 |
Leisure - 1.0% |
Cedar Fair LP/Magnum Management Corp. 5.25% 3/15/21 | | 2,230,000 | | 2,202,125 |
NCL Corp. Ltd. 5% 2/15/18 | | 5,690,000 | | 5,860,700 |
Royal Caribbean Cruises Ltd.: | | | | |
5.25% 11/15/22 | | 6,045,000 | | 6,045,000 |
7.5% 10/15/27 | | 595,000 | | 635,163 |
| | 14,742,988 |
Metals/Mining - 2.4% |
Beverage Packaging Holdings II SA (Luxembourg): | | | | |
5.625% 12/15/16 (d) | | 1,880,000 | | 1,917,600 |
6% 6/15/17 (d) | | 960,000 | | 972,000 |
Boart Longyear Management Pty Ltd.: | | | | |
7% 4/1/21 (d) | | 8,355,000 | | 6,245,363 |
10% 10/1/18 (d) | | 3,085,000 | | 3,185,263 |
CONSOL Energy, Inc.: | | | | |
8% 4/1/17 | | 2,000,000 | | 2,107,500 |
8.25% 4/1/20 | | 2,770,000 | | 2,998,525 |
FMG Resources (August 2006) Pty Ltd.: | | | | |
6.375% 2/1/16 (d) | | 3,145,000 | | 3,255,075 |
7% 11/1/15 (d) | | 5,401,000 | | 5,603,538 |
New Gold, Inc. 6.25% 11/15/22 (d) | | 7,295,000 | | 7,057,913 |
Walter Energy, Inc.: | | | | |
8.5% 4/15/21 | | 3,535,000 | | 2,942,888 |
9.5% 10/15/19 (d) | | 900,000 | | 949,500 |
| | 37,235,165 |
Paper - 0.4% |
Sappi Papier Holding GmbH 7.75% 7/15/17 (d) | | 4,920,000 | | 5,387,400 |
Publishing/Printing - 1.3% |
McGraw-Hill Global Education Holdings LLC/McGraw-Hill Global Education Finance 9.75% 4/1/21 (d) | | 8,095,000 | | 8,944,975 |
R.R. Donnelley & Sons Co.: | | | | |
6.5% 11/15/23 | | 2,220,000 | | 2,242,200 |
7% 2/15/22 | | 1,100,000 | | 1,182,500 |
7.25% 5/15/18 | | 2,320,000 | | 2,633,200 |
7.625% 6/15/20 | | 675,000 | | 734,063 |
8.25% 3/15/19 | | 2,966,000 | | 3,396,070 |
| | 19,133,008 |
Restaurants - 0.3% |
NPC International, Inc./NPC Operating Co. A, Inc./NPC Operating Co. B, Inc. 10.5% 1/15/20 | | 4,035,000 | | 4,660,425 |
Nonconvertible Bonds - continued |
| Principal Amount | | Value |
Services - 3.7% |
APX Group, Inc.: | | | | |
6.375% 12/1/19 | | $ 9,500,000 | | $ 9,642,500 |
8.75% 12/1/20 | | 8,335,000 | | 8,501,700 |
8.75% 12/1/20 (d) | | 480,000 | | 488,400 |
ARAMARK Corp. 5.75% 3/15/20 (d) | | 2,805,000 | | 2,931,225 |
Audatex North America, Inc.: | | | | |
6% 6/15/21 (d) | | 4,215,000 | | 4,415,213 |
6.125% 11/1/23 (d) | | 460,000 | | 473,800 |
Avis Budget Car Rental LLC/Avis Budget Finance, Inc. 2.9956% 12/1/17 (d)(g) | | 2,180,000 | | 2,190,900 |
Bankrate, Inc. 6.125% 8/15/18 (d) | | 2,580,000 | | 2,683,200 |
Brand Energy & Infrastructure Services, Inc. 8.5% 12/1/21 (d) | | 4,640,000 | | 4,715,400 |
FTI Consulting, Inc. 6.75% 10/1/20 | | 3,715,000 | | 4,012,200 |
Garda World Security Corp. 7.25% 11/15/21 (d) | | 2,200,000 | | 2,216,500 |
Hertz Corp. 4.25% 4/1/18 | | 3,145,000 | | 3,223,625 |
The Geo Group, Inc. 5.875% 1/15/22 (d) | | 7,310,000 | | 7,255,175 |
TransUnion Holding Co., Inc. 8.125% 6/15/18 pay-in-kind | | 4,340,000 | | 4,578,700 |
| | 57,328,538 |
Shipping - 1.1% |
Aguila 3 SA 7.875% 1/31/18 (d) | | 4,595,000 | | 4,870,700 |
Navios Maritime Acquisition Corp./Navios Acquisition Finance U.S., Inc. 8.125% 11/15/21 (d) | | 1,785,000 | | 1,820,700 |
Navios Maritime Holdings, Inc.: | | | | |
7.375% 1/15/22 (d) | | 7,410,000 | | 7,447,050 |
8.125% 2/15/19 | | 1,465,000 | | 1,505,288 |
Navios South American Logistics, Inc./Navios Logistics Finance U.S., Inc. 9.25% 4/15/19 | | 420,000 | | 453,075 |
| | 16,096,813 |
Steel - 1.5% |
JMC Steel Group, Inc. 8.25% 3/15/18 (d) | | 4,545,000 | | 4,590,450 |
Severstal Columbus LLC 10.25% 2/15/18 | | 10,610,000 | | 11,246,600 |
Steel Dynamics, Inc. 6.125% 8/15/19 | | 7,280,000 | | 7,880,600 |
| | 23,717,650 |
Super Retail - 0.9% |
Best Buy Co., Inc. 5% 8/1/18 | | 5,280,000 | | 5,537,664 |
Netflix, Inc. 5.375% 2/1/21 (d) | | 3,535,000 | | 3,579,188 |
|
| Principal Amount | | Value |
Sears Holdings Corp. 6.625% 10/15/18 | | $ 1,385,000 | | $ 1,253,425 |
The Bon-Ton Department Stores, Inc. 8% 6/15/21 | | 3,215,000 | | 3,239,113 |
| | 13,609,390 |
Technology - 8.2% |
Activision Blizzard, Inc. 5.625% 9/15/21 (d) | | 2,440,000 | | 2,525,400 |
ADT Corp. 6.25% 10/15/21 (d) | | 3,545,000 | | 3,722,250 |
BMC Software Finance, Inc. 8.125% 7/15/21 (d) | | 4,560,000 | | 4,696,800 |
Brocade Communications Systems, Inc. 4.625% 1/15/23 (d) | | 3,400,000 | | 3,145,000 |
Ceridian Corp. 11.25% 11/15/15 | | 4,475,000 | | 4,508,563 |
Compiler Finance Sub, Inc. 7% 5/1/21 (d) | | 515,000 | | 511,138 |
First Data Corp.: | | | | |
6.75% 11/1/20 (d) | | 3,280,000 | | 3,411,200 |
7.375% 6/15/19 (d) | | 3,400,000 | | 3,629,500 |
8.25% 1/15/21 (d) | | 6,555,000 | | 6,972,881 |
12.625% 1/15/21 | | 4,520,000 | | 5,305,350 |
Flextronics International Ltd. 4.625% 2/15/20 | | 3,020,000 | | 2,944,500 |
Lucent Technologies, Inc.: | | | | |
6.45% 3/15/29 | | 6,135,000 | | 5,429,475 |
6.5% 1/15/28 | | 3,265,000 | | 2,856,875 |
Nuance Communications, Inc. 5.375% 8/15/20 (d) | | 13,133,000 | | 12,837,508 |
NXP BV/NXP Funding LLC: | | | | |
3.75% 6/1/18 (d) | | 12,835,000 | | 12,931,263 |
5.75% 2/15/21 (d) | | 5,715,000 | | 5,972,175 |
Sanmina-SCI Corp. 7% 5/15/19 (d) | | 9,305,000 | | 9,898,194 |
Seagate HDD Cayman 3.75% 11/15/18 (d) | | 8,170,000 | | 8,261,913 |
SoftBank Corp. 4.5% 4/15/20 (d) | | 6,870,000 | | 6,698,250 |
Spansion LLC 7.875% 11/15/17 | | 5,850,000 | | 6,091,313 |
VeriSign, Inc. 4.625% 5/1/23 | | 3,295,000 | | 3,146,725 |
Viasystems, Inc. 7.875% 5/1/19 (d) | | 2,810,000 | | 3,038,313 |
WideOpenWest Finance LLC/WideOpenWest Capital Corp.: | | | | |
10.25% 7/15/19 | | 2,995,000 | | 3,324,450 |
13.375% 10/15/19 | | 2,705,000 | | 3,131,038 |
| | 124,990,074 |
Telecommunications - 6.8% |
Alcatel-Lucent U.S.A., Inc.: | | | | |
4.625% 7/1/17 (d) | | 1,100,000 | | 1,101,375 |
6.75% 11/15/20 (d) | | 3,640,000 | | 3,781,050 |
8.875% 1/1/20 (d) | | 6,325,000 | | 7,052,375 |
Altice Financing SA: | | | | |
6.5% 1/15/22 (d) | | 685,000 | | 691,850 |
7.875% 12/15/19 (d) | | 4,180,000 | | 4,545,750 |
Nonconvertible Bonds - continued |
| Principal Amount | | Value |
Telecommunications - continued |
Altice Finco SA: | | | | |
8.125% 1/15/24 (d) | | $ 415,000 | | $ 425,915 |
9.875% 12/15/20 (d) | | 2,465,000 | | 2,773,125 |
Digicel Group Ltd.: | | | | |
6% 4/15/21 (d) | | 5,265,000 | | 5,080,725 |
7% 2/15/20 (d) | | 295,000 | | 297,950 |
8.25% 9/1/17 (d) | | 5,395,000 | | 5,610,800 |
DigitalGlobe, Inc. 5.25% 2/1/21 (d) | | 9,505,000 | | 9,267,375 |
Intelsat Jackson Holdings SA 7.25% 4/1/19 | | 1,835,000 | | 1,981,800 |
Intelsat Luxembourg SA 7.75% 6/1/21 (d) | | 5,650,000 | | 6,059,625 |
Level 3 Financing, Inc. 3.842% 1/15/18 (d)(g) | | 3,065,000 | | 3,084,156 |
Neustar, Inc. 4.5% 1/15/23 | | 2,980,000 | | 2,689,450 |
Sprint Capital Corp.: | | | | |
6.875% 11/15/28 | | 1,155,000 | | 1,088,588 |
8.75% 3/15/32 | | 1,155,000 | | 1,238,738 |
Sprint Communications, Inc. 9% 11/15/18 (d) | | 6,240,000 | | 7,519,200 |
T-Mobile U.S.A., Inc.: | | | | |
5.25% 9/1/18 (d) | | 7,415,000 | | 7,754,607 |
6.464% 4/28/19 | | 6,010,000 | | 6,385,625 |
Telesat Canada/Telesat LLC 6% 5/15/17 (d) | | 4,310,000 | | 4,482,400 |
TW Telecom Holdings, Inc. 5.375% 10/1/22 | | 2,815,000 | | 2,765,738 |
Wind Acquisition Finance SA: | | | | |
7.25% 2/15/18 (d) | | 2,770,000 | | 2,915,425 |
11.75% 7/15/17 (d) | | 3,170,000 | | 3,372,088 |
Wind Acquisition Holdings Finance SA 12.25% 7/15/17 pay-in-kind (d)(g) | | 12,403,891 | | 12,354,448 |
| | 104,320,178 |
Textiles & Apparel - 0.2% |
The William Carter Co. 5.25% 8/15/21 (d) | | 3,490,000 | | 3,542,350 |
TOTAL NONCONVERTIBLE BONDS (Cost $1,326,059,757) |
1,365,084,178
|
Commercial Mortgage Securities - 0.0% |
|
LB Multi-family Mortgage Trust Series 1991-4 Class A1, 7.125% 4/25/21 (g)
(Cost $0) | | 13,676 | |
9,573
|
Common Stocks - 0.0% |
| Shares | | Value |
Telecommunications - 0.0% |
CUI Acquisition Corp. Class E (a)(d)
(Cost $1,273,881) | 1 | | $ 112,009 |
Bank Loan Obligations - 5.8% |
| Principal Amount | | |
Automotive - 0.1% |
Allison Transmission, Inc. Tranche B 3LN, term loan 3.75% 8/23/19 (g) | | $ 955,000 | | 957,388 |
Broadcasting - 0.1% |
ION Media Networks, Inc. Tranche B, term loan 12/18/20 (h) | | 1,330,000 | | 1,344,963 |
Cable TV - 0.2% |
Charter Communications Operating LLC Tranche F, term loan 3% 1/3/21 (g) | | 3,886,015 | | 3,847,155 |
Containers - 0.2% |
Ardagh Holdings U.S.A., Inc. Tranche B, term loan 12/17/19 (h) | | 165,000 | | 165,825 |
Berry Plastics Corp. Tranche E, term loan 12/18/20 (h) | | 1,565,000 | | 1,561,088 |
Reynolds Consumer Products Holdings, Inc. Tranche B, term loan 4% 12/1/18 (g) | | 910,000 | | 908,863 |
| | 2,635,776 |
Diversified Financial Services - 0.0% |
Moxie Patriot LLC Tranche B, term loan 12/19/20 (h) | | 400,000 | | 405,500 |
Energy - 1.1% |
Chesapeake Energy Corp. Tranche B, term loan 5.75% 12/2/17 (g) | | 4,710,000 | | 4,810,323 |
Energy Transfer Equity LP Tranche B, term loan 3.25% 12/2/19 (g) | | 3,645,000 | | 3,617,663 |
Fieldwood Energy, LLC: | | | | |
Tranche 2LN, term loan 8.375% 9/30/20 (g) | | 6,295,000 | | 6,389,425 |
Tranche B 1LN, term loan 3.875% 9/30/18 (g) | | 364,088 | | 366,363 |
Samson Investment Co. Tranche B 2LN, term loan 9/25/18 (h) | | 360,000 | | 360,000 |
Sheridan Investment Partners I term loan 12/16/20 (h) | | 524,775 | | 526,769 |
Sheridan Production Partners I: | | | | |
Tranche A, term loan 12/16/20 (h) | | 73,000 | | 73,277 |
Tranche M, term loan 12/16/20 (h) | | 27,225 | | 27,328 |
Western Refining, Inc. Tranche B, term loan 4.25% 11/12/20 (g) | | 250,000 | | 253,125 |
| | 16,424,273 |
Environmental - 0.0% |
Darling International, Inc. Tranche B, term loan 12/18/20 (h) | | 210,000 | | 211,050 |
Bank Loan Obligations - continued |
| Principal Amount | | Value |
Environmental - continued |
WTG Holdings III Corp.: | | | | |
Tranche 2LN, term loan 12/12/21 (h) | | $ 155,000 | | $ 154,225 |
Tranche B, term loan 12/12/20 (h) | | 165,000 | | 164,175 |
| | 529,450 |
Food/Beverage/Tobacco - 0.1% |
Del Monte Foods Consumer Products: | | | | |
Tranche 2LN, term loan 5/26/21 (h) | | 455,000 | | 459,550 |
Tranche B 1LN, term loan 11/26/20 (h) | | 915,000 | | 917,288 |
| | 1,376,838 |
Gaming - 0.2% |
Golden Nugget, Inc. Tranche B, term loan: | | | | |
11/21/19 (i) | | 145,500 | | 146,591 |
5.5% 11/21/19 (g) | | 339,500 | | 342,046 |
Las Vegas Sands LLC Tranche B, term loan 12/19/20 (h) | | 2,245,000 | | 2,241,969 |
| | 2,730,606 |
Healthcare - 0.2% |
Endo Luxembourg Finance I Comp term loan 12/12/20 (h) | | 3,735,000 | | 3,744,338 |
Hotels - 0.3% |
Hilton Worldwide Finance, LLC Tranche B, term loan 3.75% 10/25/20 (g) | | 4,576,368 | | 4,610,691 |
Insurance - 0.3% |
HUB International Ltd. Tranche B, term loan 4.75% 10/2/20 (g) | | 1,456,350 | | 1,476,375 |
StoneRiver Group LP: | | | | |
Tranche 2LN, term loan 8.5% 5/30/20 (g) | | 1,303,176 | | 1,309,692 |
Tranche B 1LN, term loan 4.5% 11/30/19 (g) | | 1,621,838 | | 1,621,838 |
| | 4,407,905 |
Leisure - 0.3% |
Equinox Holdings, Inc.: | | | | |
Tranche 2LN, term loan 9.75% 8/1/20 (g) | | 1,600,000 | | 1,620,000 |
Tranche B 1LN, term loan 4.5007% 2/1/20 (g) | | 2,962,613 | | 2,988,683 |
| | 4,608,683 |
Metals/Mining - 0.7% |
Alpha Natural Resources, Inc. Tranche B, term loan 3.5% 5/22/20 (g) | | 2,358,120 | | 2,316,853 |
|
| Principal Amount | | Value |
Fortescue Metals Group Ltd. Tranche B, term loan 4.25% 6/30/19 (g) | | $ 2,428,913 | | $ 2,459,274 |
Peabody Energy Corp. Tranche B, term loan 4.25% 9/24/20 (g) | | 5,441,363 | | 5,474,827 |
| | 10,250,954 |
Publishing/Printing - 0.3% |
ARC Document Solutions, Inc. Tranche B, term loan 12/20/18 (h) | | 4,880,000 | | 4,843,400 |
Services - 0.4% |
Brand Energy & Infrastructure Services, Inc. Tranche B, term loan 4.75% 11/26/20 (g) | | 4,520,000 | | 4,542,600 |
EFS Cogen Holdings I LLC Tranche B, term loan 12/17/20 (h) | | 195,000 | | 195,975 |
Filtration Group Corp.: | | | | |
Tranche 2LN, term loan 8.25% 11/21/21 (g) | | 60,000 | | 60,825 |
Tranche B 1LN, term loan 4.5% 11/21/20 (g) | | 75,000 | | 75,281 |
Garda World Security Corp.: | | | | |
term loan 4% 11/8/20 (g) | | 497,685 | | 498,307 |
Tranche DD, term loan 11/8/20 (i) | | 127,315 | | 127,474 |
Redtop Acquisitions Ltd.: | | | | |
Tranche 2LN, term loan 8.25% 6/3/21 (g) | | 185,000 | | 187,775 |
Tranche B 1LN, term loan 4.5% 12/3/20 (g) | | 105,000 | | 105,263 |
| | 5,793,500 |
Technology - 0.8% |
Dell International LLC Tranche B, term loan 4.5% 4/29/20 (g) | | 350,000 | | 350,875 |
First Data Corp. term loan 4.164% 3/24/18 (g) | | 6,685,000 | | 6,668,288 |
Infor U.S., Inc. Tranche B 5LN, term loan 6/3/20 (h) | | 860,000 | | 856,818 |
Kronos, Inc.: | | | | |
Tranche 2LN, term loan 9.75% 4/30/20 (g) | | 140,000 | | 146,300 |
Tranche B 1LN, term loan 4.5% 10/30/19 (g) | | 64,815 | | 65,463 |
NXP BV Tranche D, term loan 1/11/20 (h) | | 3,660,000 | | 3,660,000 |
| | 11,747,744 |
Telecommunications - 0.5% |
Alcatel-Lucent U.S.A., Inc. Tranche C 1LN, term loan 1/30/19 (h) | | 6,510,000 | | 6,542,550 |
Consolidated Communications, Inc. Tranche B, term loan 12/23/20 (h) | | 140,000 | | 140,000 |
Bank Loan Obligations - continued |
| Principal Amount | | Value |
Telecommunications - continued |
Crown Castle Operating Co. Tranche B, term loan 1/31/21 (h) | | $ 305,000 | | $ 305,000 |
Intelsat Jackson Holdings SA Tranche B 2LN, term loan 3.75% 6/30/19 (g) | | 1,260,000 | | 1,271,088 |
| | 8,258,638 |
TOTAL BANK LOAN OBLIGATIONS (Cost $87,245,499) |
88,517,802
|
Preferred Securities - 0.3% |
| | | |
Banks & Thrifts - 0.3% |
JPMorgan Chase & Co. 6% (e)(g)
(Cost $4,860,000) | 4,860,000 | |
4,770,231
|
Money Market Funds - 5.1% |
| Shares | | |
Fidelity Cash Central Fund, 0.11% (b)
(Cost $76,868,755) | 76,868,755 | |
76,868,755
|
TOTAL INVESTMENT PORTFOLIO - 100.5% (Cost $1,496,307,892) | | 1,535,362,548 |
NET OTHER ASSETS (LIABILITIES) - (0.5)% | | (6,982,662) |
NET ASSETS - 100% | $ 1,528,379,886 |
Legend |
(a) Non-income producing |
(b) Affiliated fund that is generally available only to investment companies and other accounts managed by Fidelity Investments. The rate quoted is the annualized seven-day yield of the fund at period end. A complete unaudited listing of the fund's holdings as of its most recent quarter end is available upon request. In addition, each Fidelity Central Fund's financial statements, which are not covered by the Fund's Report of Independent Registered Public Accounting Firm, are available on the SEC's website or upon request. |
(c) Security initially issued at one coupon which converts to a higher coupon at a specified date. The rate shown is the rate at period end. |
(d) Security exempt from registration under Rule 144A of the Securities Act of 1933. These securities may be resold in transactions exempt from registration, normally to qualified institutional buyers. At the end of the period, the value of these securities amounted to $605,037,802 or 39.6% of net assets. |
(e) Security is perpetual in nature with no stated maturity date. |
(f) Security or a portion of the security purchased on a delayed delivery or when-issued basis. |
(g) Coupon rates for floating and adjustable rate securities reflect the rates in effect at period end. |
(h) The coupon rate will be determined upon settlement of the loan after period end. |
(i) Position represents an unfunded loan commitment. At period end, the total principal amount and market value of unfunded commitments totaled $272,815 and $274,065, respectively. The coupon rate will be determined at time of settlement. |
Affiliated Central Funds |
Information regarding fiscal year to date income earned by the Fund from investments in Fidelity Central Funds is as follows: |
Fund | Income earned |
Fidelity Cash Central Fund | $ 95,258 |
Other Information |
The following is a summary of the inputs used, as of December 31, 2013, involving the Fund's assets and liabilities carried at fair value. The inputs or methodology used for valuing securities may not be an indication of the risk associated with investing in those securities. For more information on valuation inputs, and their aggregation into the levels used in the table below, please refer to the Investment Valuation section in the accompanying Notes to Financial Statements. |
Valuation Inputs at Reporting Date: |
Description | Total | Level 1 | Level 2 | Level 3 |
Investments in Securities: | | | | |
Equities: | | | | |
Telecommunication Services | $ 112,009 | $ - | $ - | $ 112,009 |
Corporate Bonds | 1,365,084,178 | - | 1,365,084,178 | - |
Commercial Mortgage Securities | 9,573 | - | - | 9,573 |
Bank Loan Obligations | 88,517,802 | - | 86,897,802 | 1,620,000 |
Preferred Securities | 4,770,231 | - | 4,770,231 | - |
Money Market Funds | 76,868,755 | 76,868,755 | - | - |
Total Investments in Securities: | $ 1,535,362,548 | $ 76,868,755 | $ 1,456,752,211 | $ 1,741,582 |
Distribution of investments by country or territory of incorporation, as a percentage of total net assets, is as follows (Unaudited): |
United States of America | 79.2% |
Luxembourg | 4.3% |
Canada | 3.2% |
Netherlands | 2.1% |
Bermuda | 1.9% |
Cayman Islands | 1.8% |
Australia | 1.6% |
United Kingdom | 1.4% |
Austria | 1.1% |
Others (Individually Less Than 1%) | 3.4% |
| 100.0% |
See accompanying notes which are an integral part of the financial statements.
Annual Report
Statement of Assets and Liabilities
| December 31, 2013 |
| | |
Assets | | |
Investment in securities, at value - See accompanying schedule: Unaffiliated issuers (cost $1,419,439,137) | $ 1,458,493,793 | |
Fidelity Central Funds (cost $76,868,755) | 76,868,755 | |
Total Investments (cost $1,496,307,892) | | $ 1,535,362,548 |
Cash | | 4,015,234 |
Receivable for investments sold | | 1,705,556 |
Receivable for fund shares sold | | 2,131,786 |
Interest receivable | | 23,220,622 |
Distributions receivable from Fidelity Central Funds | | 4,605 |
Prepaid expenses | | 3,227 |
Other receivables | | 11,207 |
Total assets | | 1,566,454,785 |
| | |
Liabilities | | |
Payable for investments purchased | | |
Regular delivery | $ 34,396,427 | |
Delayed delivery | 990,000 | |
Payable for fund shares redeemed | 1,694,753 | |
Accrued management fee | 704,961 | |
Distribution and service plan fees payable | 69,658 | |
Other affiliated payables | 139,510 | |
Other payables and accrued expenses | 79,590 | |
Total liabilities | | 38,074,899 |
| | |
Net Assets | | $ 1,528,379,886 |
Net Assets consist of: | | |
Paid in capital | | $ 1,547,379,547 |
Undistributed net investment income | | 1,216,415 |
Accumulated undistributed net realized gain (loss) on investments | | (59,270,732) |
Net unrealized appreciation (depreciation) on investments | | 39,054,656 |
Net Assets | | $ 1,528,379,886 |
Statement of Assets and Liabilities - continued
| December 31, 2013 |
| | |
Initial Class:
Net Asset Value, offering price and redemption price per share ($587,375,744 ÷ 101,188,593 shares) | | $ 5.80 |
| | |
Service Class:
Net Asset Value, offering price and redemption price per share ($68,982,149 ÷ 11,953,181 shares) | | $ 5.77 |
| | |
Service Class 2:
Net Asset Value, offering price and redemption price per share ($280,443,630 ÷ 49,707,292 shares) | | $ 5.64 |
| | |
Initial Class R:
Net Asset Value, offering price and redemption price per share ($29,558,387 ÷ 5,112,817 shares) | | $ 5.78 |
| | |
Service Class R:
Net Asset Value, offering price and redemption price per share ($58,041,804 ÷ 10,116,582 shares) | | $ 5.74 |
| | |
Service Class 2R:
Net Asset Value, offering price and redemption price per share ($4,347,801 ÷ 771,011 shares) | | $ 5.64 |
| | |
Investor Class:
Net Asset Value, offering price and redemption price per share ($499,630,371 ÷ 86,398,598 shares) | | $ 5.78 |
See accompanying notes which are an integral part of the financial statements.
Annual Report
Statement of Operations
| Year ended December 31, 2013 |
| | |
Investment Income | | |
Dividends | | $ 243,338 |
Interest | | 91,407,694 |
Income from Fidelity Central Funds | | 95,258 |
Total income | | 91,746,290 |
| | |
Expenses | | |
Management fee | $ 8,290,267 | |
Transfer agent fees | 1,218,349 | |
Distribution and service plan fees | 805,750 | |
Accounting fees and expenses | 500,134 | |
Custodian fees and expenses | 26,253 | |
Independent trustees' compensation | 8,102 | |
Audit | 81,461 | |
Legal | 15,196 | |
Interest | 1,289 | |
Miscellaneous | 13,741 | |
Total expenses before reductions | 10,960,542 | |
Expense reductions | (59,997) | 10,900,545 |
Net investment income (loss) | | 80,845,745 |
Realized and Unrealized Gain (Loss) Net realized gain (loss) on: | | |
Investment securities: | | |
Unaffiliated issuers | | 46,584,559 |
Change in net unrealized appreciation (depreciation) on investment securities | | (41,731,572) |
Net gain (loss) | | 4,852,987 |
Net increase (decrease) in net assets resulting from operations | | $ 85,698,732 |
Statement of Changes in Net Assets
| Year ended
December 31,
2013 | Year ended
December 31,
2012 |
Increase (Decrease) in Net Assets | | |
Operations | | |
Net investment income (loss) | $ 80,845,745 | $ 85,504,440 |
Net realized gain (loss) | 46,584,559 | 13,064,180 |
Change in net unrealized appreciation (depreciation) | (41,731,572) | 80,611,074 |
Net increase (decrease) in net assets resulting from operations | 85,698,732 | 179,179,694 |
Distributions to shareholders from net investment income | (86,921,876) | (84,934,228) |
Share transactions - net increase (decrease) | 16,318,361 | 164,623,275 |
Redemption fees | 28,583 | 64,369 |
Total increase (decrease) in net assets | 15,123,800 | 258,933,110 |
| | |
Net Assets | | |
Beginning of period | 1,513,256,086 | 1,254,322,976 |
End of period (including undistributed net investment income of $1,216,415 and undistributed net investment income of $6,819,718, respectively) | $ 1,528,379,886 | $ 1,513,256,086 |
See accompanying notes which are an integral part of the financial statements.
Annual Report
Financial Highlights - Initial Class
Years ended December 31, | 2013 | 2012 | 2011 | 2010 | 2009 |
Selected Per-Share Data | | | | | |
Net asset value, beginning of period | $ 5.81 | $ 5.39 | $ 5.57 | $ 5.29 | $ 3.96 |
Income from Investment Operations | | | | | |
Net investment income (loss) C | .330 | .361 | .391 | .439 | .438 |
Net realized and unrealized gain (loss) | .014 | .405 | (.171) | .288 | 1.298 |
Total from investment operations | .344 | .766 | .220 | .727 | 1.736 |
Distributions from net investment income | (.354) | (.346) | (.400) | (.448) | (.406) |
Redemption fees added to paid in capital C | - G | - G | - G | .001 | - G |
Net asset value, end of period | $ 5.80 | $ 5.81 | $ 5.39 | $ 5.57 | $ 5.29 |
Total Return A,B | 5.95% | 14.23% | 4.03% | 13.82% | 43.96% |
Ratios to Average Net Assets D,F | | | | | |
Expenses before reductions | .68% | .68% | .69% | .69% | .70% |
Expenses net of fee waivers, if any | .68% | .68% | .69% | .69% | .70% |
Expenses net of all reductions | .68% | .68% | .69% | .69% | .70% |
Net investment income (loss) | 5.55% | 6.22% | 6.85% | 7.84% | 9.02% |
Supplemental Data | | | | | |
Net assets, end of period (000 omitted) | $ 587,376 | $ 606,506 | $ 561,514 | $ 594,688 | $ 608,802 |
Portfolio turnover rate E | 85% | 55% | 79% | 81% | 70% |
A Total returns do not reflect charges attributable to your insurance company's separate account. Inclusion of these charges would reduce the total returns shown.
B Total returns would have been lower if certain expenses had not been reduced during the applicable periods shown.
C Calculated based on average shares outstanding during the period.
D Fees and expenses of any underlying Fidelity Central Funds are not included in the Fund's expense ratio. The Fund indirectly bears its proportionate share of the expenses of any underlying Fidelity Central Funds.
E Amount does not include the portfolio activity of any underlying Fidelity Central Funds.
F Expense ratios reflect operating expenses of the class. Expenses before reductions do not reflect amounts reimbursed by the investment adviser or reductions from brokerage service arrangements or reductions from other expense offset arrangements and do not represent the amount paid by the class during periods when reimbursements or reductions occur. Expenses net of fee waivers reflect expenses after reimbursement by the investment adviser but prior to reductions from brokerage service arrangements or other expense offset arrangements. Expenses net of all reductions represent the net expenses paid by the class.
G Amount represents less than $.001 per share.
Financial Highlights - Service Class
Years ended December 31, | 2013 | 2012 | 2011 | 2010 | 2009 |
Selected Per-Share Data | | | | | |
Net asset value, beginning of period | $ 5.78 | $ 5.36 | $ 5.54 | $ 5.26 | $ 3.95 |
Income from Investment Operations | | | | | |
Net investment income (loss) C | .323 | .353 | .384 | .431 | .429 |
Net realized and unrealized gain (loss) | .015 | .407 | (.171) | .290 | 1.281 |
Total from investment operations | .338 | .760 | .213 | .721 | 1.710 |
Distributions from net investment income | (.348) | (.340) | (.393) | (.442) | (.400) |
Redemption fees added to paid in capital C | - G | - G | - G | .001 | - G |
Net asset value, end of period | $ 5.77 | $ 5.78 | $ 5.36 | $ 5.54 | $ 5.26 |
Total Return A,B | 5.87% | 14.20% | 3.93% | 13.79% | 43.41% |
Ratios to Average Net Assets D,F | | | | | |
Expenses before reductions | .78% | .78% | .79% | .79% | .80% |
Expenses net of fee waivers, if any | .77% | .78% | .79% | .78% | .80% |
Expenses net of all reductions | .77% | .78% | .79% | .78% | .80% |
Net investment income (loss) | 5.46% | 6.13% | 6.75% | 7.74% | 8.92% |
Supplemental Data | | | | | |
Net assets, end of period (000 omitted) | $ 68,982 | $ 77,397 | $ 91,573 | $ 98,988 | $ 103,511 |
Portfolio turnover rate E | 85% | 55% | 79% | 81% | 70% |
A Total returns do not reflect charges attributable to your insurance company's separate account. Inclusion of these charges would reduce the total returns shown.
B Total returns would have been lower if certain expenses had not been reduced during the applicable periods shown.
C Calculated based on average shares outstanding during the period.
D Fees and expenses of any underlying Fidelity Central Funds are not included in the Fund's expense ratio. The Fund indirectly bears its proportionate share of the expenses of any underlying Fidelity Central Funds.
E Amount does not include the portfolio activity of any underlying Fidelity Central Funds.
F Expense ratios reflect operating expenses of the class. Expenses before reductions do not reflect amounts reimbursed by the investment adviser or reductions from brokerage service arrangements or reductions from other expense offset arrangements and do not represent the amount paid by the class during periods when reimbursements or reductions occur. Expenses net of fee waivers reflect expenses after reimbursement by the investment adviser but prior to reductions from brokerage service arrangements or other expense offset arrangements. Expenses net of all reductions represent the net expenses paid by the class.
G Amount represents less than $.001 per share.
See accompanying notes which are an integral part of the financial statements.
Annual Report
Financial Highlights - Service Class 2
Years ended December 31, | 2013 | 2012 | 2011 | 2010 | 2009 |
Selected Per-Share Data | | | | | |
Net asset value, beginning of period | $ 5.66 | $ 5.26 | $ 5.45 | $ 5.18 | $ 3.89 |
Income from Investment Operations | | | | | |
Net investment income (loss) C | .307 | .338 | .368 | .417 | .422 |
Net realized and unrealized gain (loss) | .014 | .396 | (.170) | .287 | 1.264 |
Total from investment operations | .321 | .734 | .198 | .704 | 1.686 |
Distributions from net investment income | (.341) | (.334) | (.388) | (.435) | (.396) |
Redemption fees added to paid in capital C | - G | - G | - G | .001 | - G |
Net asset value, end of period | $ 5.64 | $ 5.66 | $ 5.26 | $ 5.45 | $ 5.18 |
Total Return A,B | 5.70% | 13.97% | 3.72% | 13.67% | 43.46% |
Ratios to Average Net Assets D,F | | | | | |
Expenses before reductions | .93% | .93% | .94% | .94% | .95% |
Expenses net of fee waivers, if any | .92% | .93% | .94% | .94% | .95% |
Expenses net of all reductions | .92% | .93% | .94% | .94% | .95% |
Net investment income (loss) | 5.31% | 5.98% | 6.60% | 7.59% | 8.77% |
Supplemental Data | | | | | |
Net assets, end of period (000 omitted) | $ 280,444 | $ 281,065 | $ 220,333 | $ 182,465 | $ 181,377 |
Portfolio turnover rate E | 85% | 55% | 79% | 81% | 70% |
A Total returns do not reflect charges attributable to your insurance company's separate account. Inclusion of these charges would reduce the total returns shown.
B Total returns would have been lower if certain expenses had not been reduced during the applicable periods shown.
C Calculated based on average shares outstanding during the period.
D Fees and expenses of any underlying Fidelity Central Funds are not included in the Fund's expense ratio. The Fund indirectly bears its proportionate share of the expenses of any underlying Fidelity Central Funds.
E Amount does not include the portfolio activity of any underlying Fidelity Central Funds.
F Expense ratios reflect operating expenses of the class. Expenses before reductions do not reflect amounts reimbursed by the investment adviser or reductions from brokerage service arrangements or reductions from other expense offset arrangements and do not represent the amount paid by the class during periods when reimbursements or reductions occur. Expenses net of fee waivers reflect expenses after reimbursement by the investment adviser but prior to reductions from brokerage service arrangements or other expense offset arrangements. Expenses net of all reductions represent the net expenses paid by the class.
G Amount represents less than $.001 per share.
Financial Highlights - Initial Class R
Years ended December 31, | 2013 | 2012 | 2011 | 2010 | 2009 |
Selected Per-Share Data | | | | | |
Net asset value, beginning of period | $ 5.79 | $ 5.37 | $ 5.55 | $ 5.27 | $ 3.95 |
Income from Investment Operations | | | | | |
Net investment income (loss) C | .330 | .360 | .391 | .439 | .440 |
Net realized and unrealized gain (loss) | .014 | .407 | (.171) | .288 | 1.286 |
Total from investment operations | .344 | .767 | .220 | .727 | 1.726 |
Distributions from net investment income | (.354) | (.347) | (.400) | (.448) | (.406) |
Redemption fees added to paid in capital C | - G | - G | - G | .001 | - G |
Net asset value, end of period | $ 5.78 | $ 5.79 | $ 5.37 | $ 5.55 | $ 5.27 |
Total Return A,B | 5.97% | 14.30% | 4.05% | 13.88% | 43.82% |
Ratios to Average Net Assets D,F | | | | | |
Expenses before reductions | .68% | .68% | .68% | .69% | .70% |
Expenses net of fee waivers, if any | .67% | .68% | .68% | .68% | .70% |
Expenses net of all reductions | .67% | .68% | .68% | .68% | .69% |
Net investment income (loss) | 5.56% | 6.23% | 6.85% | 7.84% | 9.02% |
Supplemental Data | | | | | |
Net assets, end of period (000 omitted) | $ 29,558 | $ 35,605 | $ 31,627 | $ 34,946 | $ 34,080 |
Portfolio turnover rate E | 85% | 55% | 79% | 81% | 70% |
A Total returns do not reflect charges attributable to your insurance company's separate account. Inclusion of these charges would reduce the total returns shown.
B Total returns would have been lower if certain expenses had not been reduced during the applicable periods shown.
C Calculated based on average shares outstanding during the period.
D Fees and expenses of any underlying Fidelity Central Funds are not included in the Fund's expense ratio. The Fund indirectly bears its proportionate share of the expenses of any underlying Fidelity Central Funds.
E Amount does not include the portfolio activity of any underlying Fidelity Central Funds.
F Expense ratios reflect operating expenses of the class. Expenses before reductions do not reflect amounts reimbursed by the investment adviser or reductions from brokerage service arrangements or reductions from other expense offset arrangements and do not represent the amount paid by the class during periods when reimbursements or reductions occur. Expenses net of fee waivers reflect expenses after reimbursement by the investment adviser but prior to reductions from brokerage service arrangements or other expense offset arrangements. Expenses net of all reductions represent the net expenses paid by the class.
G Amount represents less than $.001 per share.
See accompanying notes which are an integral part of the financial statements.
Annual Report
Financial Highlights - Service Class R
Years ended December 31, | 2013 | 2012 | 2011 | 2010 | 2009 |
Selected Per-Share Data | | | | | |
Net asset value, beginning of period | $ 5.75 | $ 5.34 | $ 5.52 | $ 5.25 | $ 3.94 |
Income from Investment Operations | | | | | |
Net investment income (loss) C | .321 | .352 | .383 | .433 | .431 |
Net realized and unrealized gain (loss) | .018 | .400 | (.167) | .280 | 1.280 |
Total from investment operations | .339 | .752 | .216 | .713 | 1.711 |
Distributions from net investment income | (.349) | (.342) | (.396) | (.444) | (.401) |
Redemption fees added to paid in capital C | - G | - G | - G | .001 | - G |
Net asset value, end of period | $ 5.74 | $ 5.75 | $ 5.34 | $ 5.52 | $ 5.25 |
Total Return A,B | 5.92% | 14.10% | 3.99% | 13.66% | 43.56% |
Ratios to Average Net Assets D,F | | | | | |
Expenses before reductions | .78% | .78% | .78% | .79% | .80% |
Expenses net of fee waivers, if any | .77% | .78% | .78% | .78% | .80% |
Expenses net of all reductions | .77% | .78% | .78% | .78% | .80% |
Net investment income (loss) | 5.46% | 6.13% | 6.75% | 7.74% | 8.92% |
Supplemental Data | | | | | |
Net assets, end of period (000 omitted) | $ 58,042 | $ 69,893 | $ 63,557 | $ 68,806 | $ 47,873 |
Portfolio turnover rate E | 85% | 55% | 79% | 81% | 70% |
A Total returns do not reflect charges attributable to your insurance company's separate account. Inclusion of these charges would reduce the total returns shown.
B Total returns would have been lower if certain expenses had not been reduced during the applicable periods shown.
C Calculated based on average shares outstanding during the period.
D Fees and expenses of any underlying Fidelity Central Funds are not included in the Fund's expense ratio. The Fund indirectly bears its proportionate share of the expenses of any underlying Fidelity Central Funds.
E Amount does not include the portfolio activity of any underlying Fidelity Central Funds.
F Expense ratios reflect operating expenses of the class. Expenses before reductions do not reflect amounts reimbursed by the investment adviser or reductions from brokerage service arrangements or reductions from other expense offset arrangements and do not represent the amount paid by the class during periods when reimbursements or reductions occur. Expenses net of fee waivers reflect expenses after reimbursement by the investment adviser but prior to reductions from brokerage service arrangements or other expense offset arrangements. Expenses net of all reductions represent the net expenses paid by the class.
G Amount represents less than $.001 per share.
Financial Highlights - Service Class 2R
Years ended December 31, | 2013 | 2012 | 2011 | 2010 | 2009 |
Selected Per-Share Data | | | | | |
Net asset value, beginning of period | $ 5.65 | $ 5.26 | $ 5.45 | $ 5.17 | $ 3.89 |
Income from Investment Operations | | | | | |
Net investment income (loss) C | .307 | .340 | .369 | .415 | .416 |
Net realized and unrealized gain (loss) | .023 | .390 | (.175) | .293 | 1.257 |
Total from investment operations | .330 | .730 | .194 | .708 | 1.673 |
Distributions from net investment income | (.340) | (.340) | (.384) | (.429) | (.393) |
Redemption fees added to paid in capital C | - G | - G | - G | .001 | - G |
Net asset value, end of period | $ 5.64 | $ 5.65 | $ 5.26 | $ 5.45 | $ 5.17 |
Total Return A,B | 5.87% | 13.90% | 3.64% | 13.79% | 43.13% |
Ratios to Average Net Assets D,F | | | | | |
Expenses before reductions | .93% | .93% | .93% | .94% | .95% |
Expenses net of fee waivers, if any | .92% | .93% | .93% | .93% | .95% |
Expenses net of all reductions | .92% | .93% | .93% | .93% | .94% |
Net investment income (loss) | 5.31% | 5.98% | 6.60% | 7.59% | 8.77% |
Supplemental Data | | | | | |
Net assets, end of period (000 omitted) | $ 4,348 | $ 4,019 | $ 1,350 | $ 1,543 | $ 2,016 |
Portfolio turnover rate E | 85% | 55% | 79% | 81% | 70% |
A Total returns do not reflect charges attributable to your insurance company's separate account. Inclusion of these charges would reduce the total returns shown.
B Total returns would have been lower if certain expenses had not been reduced during the applicable periods shown.
C Calculated based on average shares outstanding during the period.
D Fees and expenses of any underlying Fidelity Central Funds are not included in the Fund's expense ratio. The Fund indirectly bears its proportionate share of the expenses of any underlying Fidelity Central Funds.
E Amount does not include the portfolio activity of any underlying Fidelity Central Funds.
F Expense ratios reflect operating expenses of the class. Expenses before reductions do not reflect amounts reimbursed by the investment adviser or reductions from brokerage service arrangements or reductions from other expense offset arrangements and do not represent the amount paid by the class during periods when reimbursements or reductions occur. Expenses net of fee waivers reflect expenses after reimbursement by the investment adviser but prior to reductions from brokerage service arrangements or other expense offset arrangements. Expenses net of all reductions represent the net expenses paid by the class.
G Amount represents less than $.001 per share.
See accompanying notes which are an integral part of the financial statements.
Annual Report
Financial Highlights - Investor Class
Years ended December 31, | 2013 | 2012 | 2011 | 2010 | 2009 |
Selected Per-Share Data | | | | | |
Net asset value, beginning of period | $ 5.79 | $ 5.37 | $ 5.56 | $ 5.27 | $ 3.96 |
Income from Investment Operations | | | | | |
Net investment income (loss) C | .327 | .358 | .388 | .437 | .441 |
Net realized and unrealized gain (loss) | .016 | .407 | (.180) | .298 | 1.274 |
Total from investment operations | .343 | .765 | .208 | .735 | 1.715 |
Distributions from net investment income | (.353) | (.345) | (.398) | (.446) | (.405) |
Redemption fees added to paid in capital C | - G | - G | - G | .001 | - G |
Net asset value, end of period | $ 5.78 | $ 5.79 | $ 5.37 | $ 5.56 | $ 5.27 |
Total Return A,B | 5.95% | 14.26% | 3.82% | 14.04% | 43.43% |
Ratios to Average Net Assets D,F | | | | | |
Expenses before reductions | .71% | .71% | .72% | .73% | .73% |
Expenses net of fee waivers, if any | .71% | .71% | .72% | .72% | .73% |
Expenses net of all reductions | .71% | .71% | .72% | .72% | .73% |
Net investment income (loss) | 5.52% | 6.20% | 6.82% | 7.81% | 8.99% |
Supplemental Data | | | | | |
Net assets, end of period (000 omitted) | $ 499,630 | $ 438,772 | $ 284,370 | $ 244,738 | $ 182,806 |
Portfolio turnover rate E | 85% | 55% | 79% | 81% | 70% |
A Total returns do not reflect charges attributable to your insurance company's separate account. Inclusion of these charges would reduce the total returns shown.
B Total returns would have been lower if certain expenses had not been reduced during the applicable periods shown.
C Calculated based on average shares outstanding during the period.
D Fees and expenses of any underlying Fidelity Central Funds are not included in the Fund's expense ratio. The Fund indirectly bears its proportionate share of the expenses of any underlying Fidelity Central Funds.
E Amount does not include the portfolio activity of any underlying Fidelity Central Funds.
F Expense ratios reflect operating expenses of the class. Expenses before reductions do not reflect amounts reimbursed by the investment adviser or reductions from brokerage service arrangements or reductions from other expense offset arrangements and do not represent the amount paid by the class during periods when reimbursements or reductions occur. Expenses net of fee waivers reflect expenses after reimbursement by the investment adviser but prior to reductions from brokerage service arrangements or other expense offset arrangements. Expenses net of all reductions represent the net expenses paid by the class.
G Amount represents less than $.001 per share.
See accompanying notes which are an integral part of the financial statements.
Annual Report
Notes to Financial Statements
For the period ended December 31, 2013
1. Organization.
VIP High Income Portfolio (the Fund) is a fund of Variable Insurance Products Fund (the Trust) and is authorized to issue an unlimited number of shares. The Trust is registered under the Investment Company Act of 1940, as amended (the 1940 Act), as an open-end management investment company organized as a Massachusetts business trust. Shares of the Fund may only be purchased by insurance companies for the purpose of funding variable annuity or variable life insurance contracts. The Fund offers the following classes of shares: Initial Class shares, Service Class shares, Service Class 2 shares, Initial Class R shares, Service Class R shares, Service Class 2R shares and Investor Class shares. All classes have equal rights and voting privileges, except for matters affecting a single class.
2. Investments in Fidelity Central Funds.
The Fund invests in Fidelity Central Funds, which are open-end investment companies generally available only to other investment companies and accounts managed by the investment adviser and its affiliates. The Fund's Schedule of Investments lists each of the Fidelity Central Funds held as of period end, if any, as an investment of the Fund, but does not include the underlying holdings of each Fidelity Central Fund. As an Investing Fund, the Fund indirectly bears its proportionate share of the expenses of the underlying Fidelity Central Funds.
The Money Market Central Funds seek preservation of capital and current income and are managed by Fidelity Investments Money Management, Inc. (FIMM), an affiliate of the investment adviser. Annualized expenses of the Money Market Central Funds as of their most recent shareholder report date are less than .01%.
A complete unaudited list of holdings for each Fidelity Central Fund is available upon request or at the Securities and Exchange Commission (the SEC) website at www.sec.gov. In addition, the financial statements of the Fidelity Central Funds, which are not covered by the Fund's Report of Independent Registered Public Accounting Firm, are available on the SEC website or upon request.
3. Significant Accounting Policies.
The financial statements have been prepared in conformity with accounting principles generally accepted in the United States of America (GAAP), which require management to make certain estimates and assumptions at the date of the financial statements. Actual results could differ from those estimates. Subsequent events, if any, through the date that the financial statements were issued have been evaluated in the preparation of the financial statements. The following summarizes the significant accounting policies of the Fund:
Investment Valuation. Investments are valued as of 4:00 p.m. Eastern time on the last calendar day of the period. In accordance with valuation policies and procedures approved by the Board of Trustees (the Board), the Fund attempts to obtain prices from one or more third party pricing vendors or brokers to value its investments. When current market prices, quotations or currency exchange rates are not readily available or reliable, investments will be fair valued in good faith by the Fidelity Management & Research Company (FMR) Fair Value Committee (the Committee), in accordance with procedures adopted by the Board. Factors used in determining fair value vary by investment type and may include market or investment specific events, changes in interest rates and credit quality. The frequency with which these procedures are used cannot be predicted and they may be utilized to a significant extent. The Committee oversees the Fund's valuation policies and procedures and is responsible for approving and reporting to the Board all fair value determinations.
The Fund categorizes the inputs to valuation techniques used to value its investments into a disclosure hierarchy consisting of three levels as shown below:
Level 1 - quoted prices in active markets for identical investments
Level 2 - other significant observable inputs (including quoted prices for similar investments, interest rates, prepayment speeds, etc.)
Level 3 - unobservable inputs (including the Fund's own assumptions based on the best information available)
Valuation techniques used to value the Fund's investments by major category are as follows:
Debt securities, including restricted securities, are valued based on evaluated prices received from third party pricing vendors or from brokers who make markets in such securities. Corporate bonds, bank loan obligations and preferred securities, are valued by pricing vendors who utilize matrix pricing which considers yield or price of bonds of comparable quality, coupon, maturity and type or by broker-supplied prices. Commercial mortgage securities are valued by pricing vendors who utilize matrix pricing which considers prepayment speed assumptions, attributes of the collateral, yield or price of bonds of comparable quality, coupon, maturity and type or by broker-supplied prices. When independent prices are unavailable or unreliable, debt securities may be valued utilizing pricing methodologies which consider similar factors that would be used by third party pricing vendors. Debt securities are generally categorized as Level 2 in the hierarchy but may be Level 3 depending on the circumstances. The Fund invests a significant portion of its assets in below investment grade securities. The value of these securities can be more volatile due to changes in the credit quality of the issuer and is sensitive to changes in economic, market and regulatory conditions.
Annual Report
3. Significant Accounting Policies - continued
Investment Valuation - continued
Equity securities, including restricted securities, for which market quotations are readily available, are valued at the last reported sale price or official closing price as reported by a third party pricing vendor on the primary market or exchange on which they are traded and are categorized as Level 1 in the hierarchy. In the event there were no sales during the day or closing prices are not available, securities are valued at the last quoted bid price or may be valued using the last available price and are generally categorized as Level 2 in the hierarchy. For equity securities, including restricted securities, where observable inputs are limited, assumptions about market activity and risk are used and these securities may be categorized as Level 3 in the hierarchy.
Investments in open-end mutual funds, including the Fidelity Central Funds, are valued at their closing net asset value (NAV) each business day and are categorized as Level 1 in the hierarchy.
Changes in valuation techniques may result in transfers in or out of an assigned level within the disclosure hierarchy. The aggregate value of investments by input level, as of December 31, 2013, is included at the end of the Fund's Schedule of Investments.
Investment Transactions and Income. For financial reporting purposes, the Fund's investment holdings and NAV include trades executed through the end of the last business day of the period. The NAV per share for processing shareholder transactions is calculated as of the close of business of the New York Stock Exchange (NYSE), normally 4:00 p.m. Eastern time and includes trades executed through the end of the prior business day. Gains and losses on securities sold are determined on the basis of identified cost and may include proceeds received from litigation. Dividend income is recorded on the ex-dividend date, except for certain dividends from foreign securities where the ex-dividend date may have passed, which are recorded as soon as the Fund is informed of the ex-dividend date. Non-cash dividends included in dividend income, if any, are recorded at the fair market value of the securities received. Interest income and distributions from the Fidelity Central Funds are accrued as earned. Interest income includes coupon interest and amortization of premium and accretion of discount on debt securities.
Class Allocations and Expenses. Investment income, realized and unrealized capital gains and losses, common expenses of the Fund, and certain fund-level expense reductions, if any, are allocated daily on a pro-rata basis to each class based on the relative net assets of each class to the total net assets of the Fund. Each class differs with respect to transfer agent and distribution and service plan fees incurred. Certain expense reductions may also differ by class. For the reporting period, the allocated portion of income and expenses to each class as a percent of its average net assets may vary due to the timing of recording these transactions in relation to fluctuating net assets of the classes. Expenses directly attributable to a fund are charged to that fund. Expenses attributable to more than one fund are allocated among the respective funds on the basis of relative net assets or other appropriate methods. Expense estimates are accrued in the period to which they relate and adjustments are made when actual amounts are known.
Income Tax Information and Distributions to Shareholders. Each year, the Fund intends to qualify as a regulated investment company under Subchapter M of the Internal Revenue Code, including distributing substantially all of its taxable income and realized gains. As a result, no provision for U.S. Federal income taxes is required. As of December 31, 2013, the Fund did not have any unrecognized tax benefits in the financial statements; nor is the Fund aware of any tax positions for which it is reasonably possible that the total amounts of unrecognized tax benefits will significantly change in the next twelve months. The Fund files a U.S. federal tax return, in addition to state and local tax returns as required. The Fund's federal income tax returns are subject to examination by the Internal Revenue Service (IRS) for a period of three fiscal years after they are filed. State and local tax returns may be subject to examination for an additional fiscal year depending on the jurisdiction.
Distributions are declared and recorded on the ex-dividend date. Income dividends and capital gain distributions are declared separately for each class. Income and capital gain distributions are determined in accordance with income tax regulations, which may differ from GAAP.
Capital accounts within the financial statements are adjusted for permanent book-tax differences. These adjustments have no impact on net assets or the results of operations. Capital accounts are not adjusted for temporary book-tax differences which will reverse in a subsequent period.
Book-tax differences are primarily due to market discount, deferred trustees compensation, capital loss carryforwards and losses deferred due to wash sales and excise tax regulations.
The federal tax cost of investment securities and unrealized appreciation (depreciation) as of period end were as follows:
Gross unrealized appreciation | $ 53,210,392 |
Gross unrealized depreciation | (12,963,627) |
Net unrealized appreciation (depreciation) on securities and other investments | $ 40,246,765 |
| |
Tax Cost | $ 1,495,115,783 |
Annual Report
Notes to Financial Statements - continued
3. Significant Accounting Policies - continued
Income Tax Information and Distributions to Shareholders - continued
The tax-based components of distributable earnings as of period end were as follows:
Capital loss carryforward | $ (58,936,967) |
Net unrealized appreciation (depreciation) | $ 40,246,765 |
Capital loss carryforwards are only available to offset future capital gains of the Fund to the extent provided by regulations and may be limited. Under the Regulated Investment Company Modernization Act of 2010 (the Act), the Fund is permitted to carry forward capital losses incurred in taxable years beginning after December 22, 2010 for an unlimited period and such capital losses are required to be used prior to any losses that expire. The capital loss carryforward information presented below, including any applicable limitation, is estimated as of fiscal period end and is subject to adjustment.
Fiscal year of expiration | |
2017 | $ (58,936,967) |
The tax character of distributions paid was as follows:
| December 31, 2013 | December 31, 2012 |
Ordinary Income | $ 86,921,876 | $ 84,934,228 |
Trading (Redemption) Fees. Initial Class R shares, Service Class R shares and Service Class 2R shares held by investors less than 60 days may be subject to a redemption fee equal to 1% of the NAV of shares redeemed. All redemption fees, which reduce the proceeds of the shareholder redemption, are retained by the Fund and accounted for as an addition to paid in capital.
Delayed Delivery Transactions and When-Issued Securities. During the period, the Fund transacted in securities on a delayed delivery or when-issued basis. Payment and delivery may take place after the customary settlement period for that security. The price of the underlying securities and the date when the securities will be delivered and paid for are fixed at the time the transaction is negotiated. The securities purchased on a delayed delivery or when-issued basis are identified as such in the Fund's Schedule of Investments. The Fund may receive compensation for interest forgone in the purchase of a delayed delivery or when-issued security. With respect to purchase commitments, the Fund identifies securities as segregated in its records with a value at least equal to the amount of the commitment. Losses may arise due to changes in the value of the underlying securities or if the counterparty does not perform under the contract's terms, or if the issuer does not issue the securities due to political, economic, or other factors.
Restricted Securities. The Fund may invest in securities that are subject to legal or contractual restrictions on resale. These securities generally may be resold in transactions exempt from registration or to the public if the securities are registered. Disposal of these securities may involve time-consuming negotiations and expense, and prompt sale at an acceptable price may be difficult. Information regarding restricted securities is included at the end of the Fund's Schedule of Investments.
Loans and Other Direct Debt Instruments. The Fund invests in direct debt instruments which are interests in amounts owed to lenders by corporate or other borrowers. These instruments may be in the form of loans, trade claims or other receivables and may include standby financing commitments such as revolving credit facilities that obligate the Fund to supply additional cash to the borrower on demand. Loans may be acquired through assignment or participation, or may be made directly to a borrower. The Fund may be contractually obligated to receive approval from the agent bank and/or borrower prior to the sale of these loans. The Fund also invests in unfunded loan commitments, which are contractual obligations for future funding. Information regarding unfunded commitments is included at the end of the Fund's Schedule of Investments.
4. Purchases and Sales of Investments.
Purchases and sales of securities, other than short-term securities, aggregated $1,269,172,018 and $1,179,884,778, respectively.
5. Fees and Other Transactions with Affiliates.
Management Fee. Fidelity Management & Research Company (the investment adviser) and its affiliates provide the Fund with investment management related services for which the Fund pays a monthly management fee. The management fee is the sum of an individual fund fee rate that is based on an annual rate of .45% of the Fund's average net assets and an annualized group fee rate that averaged .11% during the period. The group fee rate is based upon the average net assets of all the mutual funds advised by the investment adviser, including any mutual funds previously advised by the investment adviser that are currently advised by Fidelity SelectCo, LLC, an affiliate of the investment adviser. The group fee rate decreases as assets
Annual Report
5. Fees and Other Transactions with Affiliates - continued
Management Fee - continued
under management increase and increases as assets under management decrease. For the reporting period, the total annual management fee rate was .56% of the Fund's average net assets.
Distribution and Service Plan Fees. In accordance with Rule 12b-1 of the 1940 Act, the Fund has adopted separate 12b-1 Plans for each Service Class of shares. Each Service Class pays Fidelity Distributors Corporation (FDC), an affiliate of the investment adviser, a service fee. For the period, the service fee is based on an annual rate of .10% of Service Class' and Service Class R's average net assets and .25% of Service Class 2's and Service Class 2R's average net assets.
For the period, total fees, all of which were re-allowed to insurance companies for the distribution of shares and providing shareholder support services were as follows:
Service Class | $ 72,026 |
Service Class 2 | 669,990 |
Service Class R | 53,854 |
Service Class 2 R | 9,880 |
| $ 805,750 |
Transfer Agent Fees. Fidelity Investments Institutional Operations Company, Inc. (FIIOC), an affiliate of the investment adviser, is the Fund's transfer, dividend disbursing, and shareholder servicing agent. FIIOC receives an asset-based fee with respect to each class. Each class (with the exception of Investor Class) pays a transfer agent fee, excluding out of pocket expenses, equal to an annual rate of .07% of average net assets. Investor Class pays a monthly asset-based transfer agent fee of .10% of average net assets. In addition, FIIOC receives an asset-based fee of .0035% of average net assets for typesetting, printing and mailing of shareholder reports, except proxy statements. FIIOC voluntarily agreed to reimburse or waive this fee for the period January 1, 2013 through December 31, 2013 (see Expense Reductions note). For the period, transfer agent fees for each class, including printing and out of pocket expenses, were as follows:
Initial Class | $ 437,051 |
Service Class | 51,782 |
Service Class 2 | 191,829 |
Initial Class R | 22,129 |
Service Class R | 37,627 |
Service Class 2R | 2,763 |
Investor Class | 475,168 |
| $ 1,218,349 |
Effective February 1, 2014, the Board of Trustees approved an amendment to the transfer agent fee agreement whereby each class (with the exception of Investor Class) pays a single fee of .07% of average net assets for transfer agent services, typesetting, printing and mailing of shareholder reports, excluding mailing of proxy statements and out of pocket expenses. Investor Class pays a single fee of .10% of average net assets.
Accounting Fees. Fidelity Service Company, Inc. (FSC), an affiliate of the investment adviser, maintains the Fund's accounting records. The fee is based on the level of average net assets for each month.
Interfund Lending Program. Pursuant to an Exemptive Order issued by the SEC, the Fund, along with other registered investment companies having management contracts with FMR or other affiliated entities of FMR, may participate in an interfund lending program. This program provides an alternative credit facility allowing the funds to borrow from, or lend money to, other participating affiliated funds. At period end, there were no interfund loans outstanding. The Fund's activity in this program during the period for which loans were outstanding was as follows:
Borrower or Lender | Average Loan
Balance | Weighted Average Interest Rate | Interest
Expense |
Borrower | $ 24,831,167 | .31% | $ 1,289 |
6. Committed Line of Credit.
The Fund participates with other funds managed by the investment adviser or an affiliate in a $4.25 billion credit facility (the "line of credit") to be utilized for temporary or emergency purposes to fund shareholder redemptions or for other short-term liquidity purposes. The Fund has agreed to pay commitment fees on its pro-rata portion of the line of credit, which amounted to $3,236 and is reflected in Miscellaneous expenses on the Statement of Operations. During the period, there were no borrowings on this line of credit.
Annual Report
Notes to Financial Statements - continued
7. Expense Reductions.
The investment adviser or its affiliates agreed to reimburse or waive certain fees during the period as noted in the table below.
Initial Class | $ 23,163 |
Service Class | 2,839 |
Service Class 2 | 10,570 |
Initial Class R | 1,247 |
Service Class R | 2,120 |
Service Class 2R | 156 |
Investor Class | 17,960 |
| $ 58,055 |
In addition, through arrangements with the Fund's custodian, credits realized as a result of uninvested cash balances were used to reduce the Fund's expenses. During the period, these credits reduced the Fund's custody expenses by $1,942.
8. Distributions to Shareholders.
Distributions to shareholders of each class were as follows:
Years ended December 31, | 2013 | 2012 |
From net investment income | | |
Initial Class | $ 33,473,820 | $ 34,341,731 |
Service Class | 3,969,791 | 4,352,958 |
Service Class 2 | 16,115,842 | 15,615,687 |
Initial Class R | 1,722,419 | 2,033,316 |
Service Class R | 3,349,920 | 3,948,919 |
Service Class 2R | 230,462 | 215,852 |
Investor Class | 28,059,622 | 24,425,765 |
Total | $ 86,921,876 | $ 84,934,228 |
9. Share Transactions.
Transactions for each class of shares were as follows:
| Shares | Dollars |
Years ended December 31, | 2013 | 2012 | 2013 | 2012 |
Initial Class | | | | |
Shares sold | 14,039,906 | 13,853,360 | $ 83,416,151 | $ 80,405,792 |
Reinvestment of distributions | 5,790,037 | 5,923,006 | 33,473,820 | 34,341,731 |
Shares redeemed | (23,058,485) | (19,521,567) | (136,983,639) | (112,985,217) |
Net increase (decrease) | (3,228,542) | 254,799 | $ (20,093,668) | $ 1,762,306 |
Service Class | | | | |
Shares sold | 929,486 | 1,525,261 | $ 5,521,007 | $ 8,621,959 |
Reinvestment of distributions | 690,233 | 754,748 | 3,969,791 | 4,352,958 |
Shares redeemed | (3,064,824) | (5,957,709) | (18,085,383) | (33,943,822) |
Net increase (decrease) | (1,445,105) | (3,677,700) | $ (8,594,585) | $ (20,968,905) |
Service Class 2 | | | | |
Shares sold | 20,103,362 | 25,700,556 | $ 116,574,992 | $ 145,593,661 |
Reinvestment of distributions | 2,866,946 | 2,764,623 | 16,115,842 | 15,615,687 |
Shares redeemed | (22,951,503) | (20,664,331) | (132,172,105) | (115,959,882) |
Net increase (decrease) | 18,805 | 7,800,848 | $ 518,729 | $ 45,249,466 |
Initial Class R | | | | |
Shares sold | 852,998 | 2,462,639 | $ 5,061,609 | $ 14,321,536 |
Reinvestment of distributions | 298,955 | 351,902 | 1,722,419 | 2,033,316 |
Shares redeemed | (2,192,612) | (2,548,693) | (12,973,240) | (14,732,861) |
Net increase (decrease) | (1,040,659) | 265,848 | $ (6,189,212) | $ 1,621,991 |
Service Class R | | | | |
Shares sold | 5,190,571 | 8,023,964 | $ 30,731,567 | $ 46,504,431 |
Reinvestment of distributions | 585,519 | 688,191 | 3,349,920 | 3,948,919 |
Shares redeemed | (7,823,949) | (8,456,038) | (46,022,233) | (47,748,690) |
Net increase (decrease) | (2,047,859) | 256,117 | $ (11,940,746) | $ 2,704,660 |
Annual Report
9. Share Transactions - continued
| Shares | Dollars |
Years ended December 31, | 2013 | 2012 | 2013 | 2012 |
Service Class 2R | | | | |
Shares sold | 995,220 | 580,649 | $ 5,809,165 | $ 3,315,329 |
Reinvestment of distributions | 40,999 | 38,276 | 230,462 | 215,852 |
Shares redeemed | (976,234) | (164,440) | (5,617,855) | (925,854) |
Net increase (decrease) | 59,985 | 454,485 | $ 421,772 | $ 2,605,327 |
Investor Class | | | | |
Shares sold | 25,574,430 | 28,186,563 | $ 151,658,997 | $ 162,161,430 |
Reinvestment of distributions | 4,870,500 | 4,226,954 | 28,059,622 | 24,425,765 |
Shares redeemed | (19,845,132) | (9,530,114) | (117,522,548) | (54,938,765) |
Net increase (decrease) | 10,599,798 | 22,883,403 | $ 62,196,071 | $ 131,648,430 |
10. Other.
The Fund's organizational documents provide former and current trustees and officers with a limited indemnification against liabilities arising in connection with the performance of their duties to the Fund. In the normal course of business, the Fund may also enter into contracts that provide general indemnifications. The Fund's maximum exposure under these arrangements is unknown as this would be dependent on future claims that may be made against the Fund. The risk of material loss from such claims is considered remote.
At the end of the period, the investment adviser or its affiliates were the owners of record of 39% of the total outstanding shares of the Fund and one otherwise unaffiliated shareholder was the owner of record of 15% of the total outstanding shares of the Fund.
Annual Report
Report of Independent Registered Public Accounting Firm
To the Trustees of Variable Insurance Products Fund and the Shareholders of VIP High Income Portfolio:
In our opinion, the accompanying statement of assets and liabilities, including the schedule of investments, and the related statements of operations and of changes in net assets and the financial highlights present fairly, in all material respects, the financial position of VIP High Income Portfolio (a fund of Variable Insurance Products Fund) at December 31, 2013, the results of its operations for the year then ended, the changes in its net assets for each of the two years in the period then ended and the financial highlights for each of the five years in the period then ended, in conformity with accounting principles generally accepted in the United States of America. These financial statements and financial highlights (hereafter referred to as "financial statements") are the responsibility of the VIP High Income Portfolio's management. Our responsibility is to express an opinion on these financial statements based on our audits. We conducted our audits of these financial statements in accordance with the standards of the Public Company Accounting Oversight Board (United States). Those standards require that we plan and perform the audit to obtain reasonable assurance about whether the financial statements are free of material misstatement. An audit includes examining, on a test basis, evidence supporting the amounts and disclosures in the financial statements, assessing the accounting principles used and significant estimates made by management, and evaluating the overall financial statement presentation. We believe that our audits, which included confirmation of securities at December 31, 2013 by correspondence with the custodian, agent banks and brokers, provide a reasonable basis for our opinion.
PricewaterhouseCoopers LLP
Boston, Massachusetts
February 14, 2014
Annual Report
The Trustees, Member of the Advisory Board, and officers of the trust and fund, as applicable, are listed below. The Board of Trustees governs the fund and is responsible for protecting the interests of shareholders. The Trustees are experienced executives who meet periodically throughout the year to oversee the fund's activities, review contractual arrangements with companies that provide services to the fund, oversee management of the risks associated with such activities and contractual arrangements, and review the fund's performance. Except for James C. Curvey, Ned C. Lautenbach, Ronald P. O'Hanley and William S. Stavropoulos, each of the Trustees oversees 173 funds. Mr. Curvey oversees 396 funds. Mr. Lautenbach, Mr. O'Hanley and Mr. Stavropoulos each oversees 247 funds.
The Trustees hold office without limit in time except that (a) any Trustee may resign; (b) any Trustee may be removed by written instrument, signed by at least two-thirds of the number of Trustees prior to such removal; (c) any Trustee who requests to be retired or who has become incapacitated by illness or injury may be retired by written instrument signed by a majority of the other Trustees; and (d) any Trustee may be removed at any special meeting of shareholders by a two-thirds vote of the outstanding voting securities of the trust.Each Trustee who is not an interested person (as defined in the 1940 Act) of the trust and the fund (Independent Trustee), shall retire not later than the last day of the calendar year in which his or her 75th birthday occurs. The Independent Trustees may waive this mandatory retirement age policy with respect to individual Trustees. The officers and Advisory Board Member hold office without limit in time, except that any officer and Advisory Board Member may resign or may be removed by a vote of a majority of the Trustees at any regular meeting or any special meeting of the Trustees. Except as indicated, each individual has held the office shown or other offices in the same company for the past five years.
Experience, Skills, Attributes, and Qualifications of the Fund's Trustees. The Governance and Nominating Committee has adopted a statement of policy that describes the experience, qualifications, attributes, and skills that are necessary and desirable for potential Independent Trustee candidates (Statement of Policy). The Board believes that each Trustee satisfied at the time he or she was initially elected or appointed a Trustee, and continues to satisfy, the standards contemplated by the Statement of Policy. The Governance and Nominating Committee also engages professional search firms to help identify potential Independent Trustee candidates who have the experience, qualifications, attributes, and skills consistent with the Statement of Policy. From time to time, additional criteria based on the composition and skills of the current Independent Trustees, as well as experience or skills that may be appropriate in light of future changes to board composition, business conditions, and regulatory or other developments, have also been considered by the professional search firms and the Governance and Nominating Committee. In addition, the Board takes into account the Trustees' commitment and participation in Board and committee meetings, as well as their leadership of standing and ad hoc committees throughout their tenure.
In determining that a particular Trustee was and continues to be qualified to serve as a Trustee, the Board has considered a variety of criteria, none of which, in isolation, was controlling. The Board believes that, collectively, the Trustees have balanced and diverse experience, qualifications, attributes, and skills, which allow the Board to operate effectively in governing the fund and protecting the interests of shareholders. Information about the specific experience, skills, attributes, and qualifications of each Trustee, which in each case led to the Board's conclusion that the Trustee should serve (or continue to serve) as a trustee of the fund, is provided below.
Board Structure and Oversight Function. James C. Curvey is an interested person (as defined in the 1940 Act) and currently serves as Chairman. The Trustees have determined that an interested Chairman is appropriate and benefits shareholders because an interested Chairman has a personal and professional stake in the quality and continuity of services provided to the fund. Independent Trustees exercise their informed business judgment to appoint an individual of their choosing to serve as Chairman, regardless of whether the Trustee happens to be independent or a member of management. The Independent Trustees have determined that they can act independently and effectively without having an Independent Trustee serve as Chairman and that a key structural component for assuring that they are in a position to do so is for the Independent Trustees to constitute a substantial majority for the Board. The Independent Trustees also regularly meet in executive session. Ned C. Lautenbach serves as Chairman of the Independent Trustees and as such (i) acts as a liaison between the Independent Trustees and management with respect to matters important to the Independent Trustees and (ii) with management prepares agendas for Board meetings.
Fidelity funds are overseen by different Boards of Trustees. The fund's Board oversees Fidelity's equity and high income funds and another Board oversees Fidelity's investment-grade bond, money market, and asset allocation funds. The asset allocation funds may invest in Fidelity funds overseen by the fund's Board. The use of separate Boards, each with its own committee structure, allows the Trustees of each group of Fidelity funds to focus on the unique issues of the funds they oversee, including common research, investment, and operational issues. On occasion, the separate Boards establish joint committees to address issues of overlapping consequences for the Fidelity funds overseen by each Board.
The Trustees operate using a system of committees to facilitate the timely and efficient consideration of all matters of importance to the Trustees, the fund, and fund shareholders and to facilitate compliance with legal and regulatory requirements and oversight of the fund's activities and associated risks. The Board, acting through its committees, has charged FMR and its affiliates with (i) identifying events or circumstances the occurrence of which could have demonstrably adverse effects on the fund's business and/or reputation; (ii) implementing processes and controls to lessen the possibility that such events or circumstances occur or to mitigate the effects of such events or circumstances if they do occur; and (iii) creating and maintaining a system designed to evaluate continuously business and market conditions in order to facilitate the identification and implementation processes described in (i) and (ii) above. Because the day-to-day operations and activities of the fund are carried out by or through FMR, its affiliates and other service providers, the fund's exposure to risks is mitigated but not eliminated by the processes overseen by the Trustees. While each of the Board's committees has responsibility for overseeing different aspects of the fund's activities, oversight is exercised primarily through the Operations, Audit, and Compliance Committees. In addition, the Independent Trustees have worked with FMR to enhance the Board's oversight of investment and financial risks, legal and regulatory risks, technology risks, and operational risks, including the development of additional risk reporting to the Board. For example, a working group comprised of Independent Trustees and FMR has worked and continues to work to review the Fidelity funds' valuation-related activities, reporting and risk management. Appropriate personnel, including but not limited to the fund's Chief Compliance Officer (CCO), FMR's internal auditor, the independent accountants, the fund's Treasurer and portfolio management personnel, make periodic reports to the Board's committees, as appropriate, including an annual review of FMR's risk management program for the Fidelity funds. The responsibilities of each standing committee, including their oversight responsibilities, are described further under "Standing Committees of the Fund's Trustees."
Annual Report
The fund's Statement of Additional Information (SAI) includes more information about the Trustees. To request a free copy, call Fidelity at 1-877-208-0098.
Interested Trustees*:
Correspondence intended for each Trustee who is an interested person may be sent to Fidelity Investments, 245 Summer Street, Boston, Massachusetts 02210.
Name, Year of Birth; Principal Occupations and Other Relevant Experience+ |
James C. Curvey (1935) |
Year of Election or Appointment: 2007 Trustee Chairman of the Board of Trustees |
| Mr. Curvey also serves as Trustee of other Fidelity funds. Mr. Curvey is a Director of Fidelity Investments Money Management, Inc. (2009-present), Director of Fidelity Research & Analysis Co. (2009-present) and Director of FMR and FMR Co., Inc. (2007-present). Mr. Curvey is also Vice Chairman (2007-present) and Director of FMR LLC. In addition, Mr. Curvey serves as an Overseer for the Boston Symphony Orchestra and a member of the Trustees of Villanova University. Previously, Mr. Curvey was the Vice Chairman (2006-2007) and Director (2000-2007) of FMR Corp. |
Ronald P. O'Hanley (1957) |
Year of Election or Appointment: 2011 Trustee |
| Mr. O'Hanley also serves as Trustee of other Fidelity funds. He is Director of Fidelity SelectCo, LLC (2013-present), FMR Co., Inc. (2010-present), Director of Fidelity Investments Money Management, Inc. (2010-present), Director of Fidelity Research & Analysis Company (2010-present), President of Fidelity Asset Management and Corporate Services and a Member of Fidelity's Executive Committee (2010-present). Previously, Mr. O'Hanley served as President and Chief Executive Officer of BNY Mellon Asset Management (2007-2010). Mr. O'Hanley also served as Vice Chairman of Bank New York Mellon Corp. and a member of that firm's Executive Committee. Prior to the 2007 merger of The Bank of New York and Mellon Financial Corporation, he was Vice Chairman of Mellon Financial Corporation and President and Chief Executive Officer of Mellon Asset Management. He joined Mellon in February 1997. Mr. O'Hanley currently serves as Chairman of the Boston Public Library Foundation Board of Directors and sits on the Board of Directors of Beth Israel Deaconess Medical Center, the Board of Trustees of the Marine Biological Laboratory and the Advisory Board of the Maxwell School of Citizenship and Public Administration at Syracuse University. Mr. O'Hanley also chairs the Council on Asset Management for the Financial Services Roundtable and is a member of the Board of Directors of Institutional Investor's U.S. Institute. |
* Trustees have been determined to be "Interested Trustees" by virtue of, among other things, their affiliation with the or various entities under common control with FMR.
+ The information above includes each Trustee's principal occupation during the last five years and other information relating to the experience, attributes, and skills relevant to each Trustee's qualifications to serve as a Trustee, which led to the conclusion that each Trustee should serve as a Trustee for the fund.
Annual Report
Trustees and Officers - continued
Independent Trustees:
Correspondence intended for each Independent Trustee (that is, the Trustees other than the Interested Trustees) may be sent to Fidelity Investments, P.O. Box 55235, Boston, Massachusetts 02205-5235.
Name, Year of Birth; Principal Occupations and Other Relevant Experience+ |
Dennis J. Dirks (1948) |
Year of Election or Appointment: 2005 Trustee |
| Mr. Dirks also serves as Trustee of other Fidelity funds. Prior to his retirement in May 2003, Mr. Dirks was Chief Operating Officer and a member of the Board of The Depository Trust & Clearing Corporation (DTCC). He also served as President, Chief Operating Officer, and Board member of The Depository Trust Company (DTC) and President and Board member of the National Securities Clearing Corporation (NSCC). In addition, Mr. Dirks served as Chief Executive Officer and Board member of the Government Securities Clearing Corporation, Chief Executive Officer and Board member of the Mortgage-Backed Securities Clearing Corporation, as a Trustee and a member of the Finance Committee of Manhattan College (2005-2008), and as a Trustee and a member of the Finance Committee of AHRC of Nassau County (2006-2008). Mr. Dirks is a member of the Independent Directors Council (IDC) Governing Council (2010-present) and Board of Directors for The Brookville Center for Children's Services, Inc. (2009-present). |
Alan J. Lacy (1953) |
Year of Election or Appointment: 2008 Trustee |
| Mr. Lacy also serves as Trustee of other Fidelity funds. Mr. Lacy serves as Senior Adviser (2007-present) of Oak Hill Capital Partners, L.P. (private equity). Mr. Lacy also served as Chief Executive Officer (2000-2005) and Vice Chairman (2005-2006) of Sears Holdings Corporation and Sears, Roebuck and Co. (retail). In addition, Mr. Lacy serves as a member of the Board of Directors of Dave & Buster's Entertainment, Inc. (restaurant and entertainment complexes, 2010-present), Earth Fare, Inc. (retail grocery, 2012-present), The Hillman Companies, Inc. (hardware wholesalers, 2010-present), and Bristol-Myers Squibb Company (global pharmaceuticals, 2008-present). Mr. Lacy is a member of the Board of Trustees of The National Parks Conservation Association (2006-present). Previously, Mr. Lacy served as Chairman of the Board of Trustees of the National Parks Conservation Association (2008-2011) and as a member of the Board of Directors for the Western Union Company (global money transfer, 2006-2011). |
Ned C. Lautenbach (1944) |
Year of Election or Appointment: 2000 Trustee Chairman of the Independent Trustees |
| Mr. Lautenbach also serves as Trustee of other Fidelity funds. Mr. Lautenbach currently serves as the Lead Director of the Eaton Corporation Board of Directors (diversified industrial, 1997-present). Mr. Lautenbach is Chairman of the Board of Directors of the Philharmonic Center for the Arts in Naples, Florida (2012-present) and a member of the Council on Foreign Relations (1994-present). Previously, Mr. Lautenbach was a Partner/Advisory Partner at Clayton, Dubilier & Rice, LLC (private equity investment, 1998-2010), as well as a Director of Sony Corporation (2006-2007). |
Joseph Mauriello (1944) |
Year of Election or Appointment: 2008 Trustee |
| Mr. Mauriello also serves as Trustee of other Fidelity funds. Prior to his retirement in January 2006, Mr. Mauriello served in numerous senior management positions including Deputy Chairman and Chief Operating Officer (2004-2005), and Vice Chairman of Financial Services (2002-2004) of KPMG LLP US (professional services, 1965-2005). Mr. Mauriello currently serves as a member of the Board of Directors of XL Group plc. (global insurance and re-insurance, 2006-present). Previously, Mr. Mauriello served as a Director of the Hamilton Funds of the Bank of New York (2006-2007) and of Arcadia Resources Inc. (health care services and products, 2007-2012). |
Robert W. Selander (1950) |
Year of Election or Appointment: 2011 Trustee |
| Mr. Selander also serves as Trustee of other Fidelity funds. Previously, Mr. Selander served as a Member of the Advisory Board of other Fidelity funds (2011), and Executive Vice Chairman (2010), Chief Executive Officer (2009-2010), and President and Chief Executive Officer (1997-2009) of Mastercard, Inc. |
Cornelia M. Small (1944) |
Year of Election or Appointment: 2005 Trustee |
| Ms. Small also serves as Trustee of other Fidelity funds. Ms. Small is a member of the Board of Directors (2009-present) and Chair of the Investment Committee (2010-present) of the Teagle Foundation. Ms. Small also serves on the Investment Committee of the Berkshire Taconic Community Foundation (2008-present). Previously, Ms. Small served as Chairperson (2002-2008) and a member of the Investment Committee and Chairperson (2008-2012) and a member of the Board of Trustees of Smith College. In addition, Ms. Small served as Chief Investment Officer, Director of Global Equity Investments, and a member of the Board of Directors of Scudder, Stevens & Clark and Scudder Kemper Investments. |
William S. Stavropoulos (1939) |
Year of Election or Appointment: 2001 Trustee Vice Chairman of the Independent Trustees |
| Mr. Stavropoulos also serves as Trustee of other Fidelity funds. Mr. Stavropoulos serves as President and Founder of the Michigan Baseball Foundation, the Great Lakes Loons (2007-present). Mr. Stavropoulos is Chairman Emeritus of the Board of Directors of The Dow Chemical Company, where he previously served in numerous senior management positions, including President, CEO (1995-2000; 2002-2004), Chairman of the Executive Committee (2000-2006), and as a member of the Board of Directors (1990-2006). Currently, Mr. Stavropoulos is Chairman of the Board of Directors of Univar Inc. (global distributor of commodity and specialty chemicals), a Director of Teradata Corporation (data warehousing and technology solutions), and Maersk Inc. (industrial conglomerate), and a member of the Advisory Board for Metalmark Capital LLC (private equity investment, 2005-present). Mr. Stavropoulos is an operating advisor to Clayton, Dubilier & Rice, LLC (private equity investment). In addition, Mr. Stavropoulos is a member of the University of Notre Dame Advisory Council for the College of Science, a Trustee of the Rollin L. Gerstacker Foundation, and a Director of the Naples Philharmonic Center for the Arts. Previously, Mr. Stavropoulos served as a Director of Chemical Financial Corporation (bank holding company, 1993-2012) and Tyco International, Ltd. (multinational manufacturing and services, 2007-2012). |
David M. Thomas (1949) |
Year of Election or Appointment: 2008 Trustee |
| Mr. Thomas also serves as Trustee of other Fidelity funds. Mr. Thomas serves as Non-Executive Chairman of the Board of Directors of Fortune Brands Home and Security (home and security products, 2011-present), and as a member of the Board of Directors of Interpublic Group of Companies, Inc. (marketing communication, 2004-present). Previously, Mr. Thomas served as Executive Chairman (2005-2006) and Chairman and Chief Executive Officer (2000-2005) of IMS Health, Inc. (pharmaceutical and healthcare information solutions), and a Director of Fortune Brands, Inc. (consumer products, 2000-2011). |
+ The information above includes each Trustee's principal occupation during the last five years and other information relating to the experience, attributes, and skills relevant to each Trustee's qualifications to serve as a Trustee, which led to the conclusion that each Trustee should serve as a Trustee for the fund.
Advisory Board Member and Officers:
Correspondence intended for each officer and Peter S. Lynch may be sent to Fidelity Investments, 245 Summer Street, Boston, Massachusetts 02210. Officers appear below in alphabetical order.
Name, Year of Birth; Principal Occupation |
Peter S. Lynch (1944) |
Year of Election or Appointment: 2003 Member of the Advisory Board |
| Mr. Lynch also serves as Member of the Advisory Board of other Fidelity funds. Mr. Lynch is Vice Chairman and a Director of FMR and FMR Co., Inc. In addition, Mr. Lynch serves as a Trustee of Boston College and as the Chairman of the Inner-City Scholarship Fund. Previously, Mr. Lynch served on the Special Olympics International Board of Directors (1997-2006). |
Elizabeth Paige Baumann (1968) |
Year of Election or Appointment: 2012 Anti-Money Laundering (AML) Officer |
| Ms. Baumann also serves as AML Officer of other funds. She is Chief AML Officer of FMR LLC (2012-present) and is an employee of Fidelity Investments. Previously, Ms. Baumann served as Vice President and Deputy Anti-Money Laundering Officer (2007-2012). |
William C. Coffey (1969) |
Year of Election or Appointment: 2009 Assistant Secretary |
| Mr. Coffey also serves as Assistant Secretary of other funds. He is Senior Vice President and Deputy General Counsel of FMR LLC (2010-present), and is an employee of Fidelity Investments. Previously, Mr. Coffey served as Vice President and Associate General Counsel of FMR LLC (2005-2009). |
Jonathan Davis (1968) |
Year of Election or Appointment: 2010 Assistant Treasurer |
| Mr. Davis also serves as Assistant Treasurer of other funds. Mr. Davis is an employee of Fidelity Investments. Previously, Mr. Davis served as Vice President and Associate General Counsel of FMR LLC (2003-2010). |
Adrien E. Deberghes (1967) |
Year of Election or Appointment: 2008 Deputy Treasurer |
| Mr. Deberghes also serves as an officer of other funds. He is an employee of Fidelity Investments (2008-present). Prior to joining Fidelity Investments, Mr. Deberghes was Senior Vice President of Mutual Fund Administration at State Street Corporation (2007-2008), Senior Director of Mutual Fund Administration at Investors Bank & Trust (2005-2007), and Director of Finance for Dunkin' Brands (2000-2005). |
Stephanie J. Dorsey (1969) |
Year of Election or Appointment: 2010 Assistant Treasurer |
| Ms. Dorsey also serves as an officer of other funds. She is an employee of Fidelity Investments (2008-present) and has served in other fund officer roles. Prior to joining Fidelity Investments, Ms. Dorsey served as Treasurer (2004-2008) of the JPMorgan Mutual Funds and Vice President (2004-2008) of JPMorgan Chase Bank. |
Scott C. Goebel (1968) |
Year of Election or Appointment: 2008 Secretary and Chief Legal Officer (CLO) |
| Mr. Goebel serves as Secretary and CLO of other funds. Mr. Goebel also serves as Secretary of Fidelity Investments Money Management, Inc. (FIMM) (2010-present) and Fidelity Research and Analysis Company (FRAC) (2010-present); General Counsel, Secretary, and Senior Vice President of FMR (2008-present) and FMR Co., Inc. (2008-present); Chief Legal Officer of Fidelity Management & Research (Hong Kong) Limited (2008-present) and Assistant Secretary of Fidelity Management & Research (Japan) Inc. (2008-present), and Fidelity Management & Research (U.K.) Inc. (2008-present). Previously, Mr. Goebel served as Secretary and CLO of other Fidelity funds (2008-2013), Assistant Secretary of FIMM (2008-2010), FRAC (2008-2010), and certain funds (2007-2008); and as Vice President and Secretary of Fidelity Distributors Corporation (FDC) (2005-2007). Mr. Goebel has been employed by FMR LLC or an affiliate since 2001. |
Joseph A. Hanlon (1968) |
Year of Election or Appointment: 2012 Chief Compliance Officer |
| Mr. Hanlon also serves as Chief Compliance Officer of other funds. Mr. Hanlon serves as Compliance Officer of FMR, FMR Co., Inc., Fidelity Investments Money Management, Inc. (FIMM), Fidelity Research and Analysis Company (FRAC), and Fidelity Management & Research (Hong Kong) (2009-present), as Senior Vice President of the Fidelity Asset Management Division (2009-present), and is an employee of Fidelity Investments. Previously, Mr. Hanlon served as Compliance Officer of Fidelity Management & Research (Japan) Inc. (2009-2013), Strategic Advisers, Inc. (2009-2013), and Fidelity Management & Research (U.K.) Inc. (2009-2013). |
Thomas C. Hense (1964) |
Year of Election or Appointment: 2008/2010 Vice President |
| Mr. Hense also serves as Vice President of other funds (High Income (2008), Small Cap (2008), and Value (2010) funds). Previously, Mr. Hense served as a portfolio manager for Fidelity's Institutional Money Management Group (Pyramis) (2003-2008). |
Brian B. Hogan (1964) |
Year of Election or Appointment: 2009 Vice President |
| Mr. Hogan also serves as Vice President of other funds. Mr. Hogan serves as President of FMR's Equity Division (2009-present). Previously, Mr. Hogan served as Senior Vice President, Equity Research of FMR (2006-2009) and as a portfolio manager. |
Chris Maher (1972) |
Year of Election or Appointment: 2013 Assistant Treasurer |
| Mr. Maher serves as Assistant Treasurer of other funds. Mr. Maher is Vice President of Valuation Oversight and is an employee of Fidelity Investments. Previously, Mr. Maher served as Vice President of Asset Management Compliance (2013), Vice President of FMR's Program Management Group (2010-2013), and Vice President of Valuation Oversight (2008-2010). |
Christine Reynolds (1958) |
Year of Election or Appointment: 2008 Chief Financial Officer |
| Ms. Reynolds also serves as Chief Financial Officer of other funds. Ms. Reynolds became President of Fidelity Pricing and Cash Management Services (FPCMS) in August 2008. Ms. Reynolds served as Chief Operating Officer of FPCMS (2007-2008). Previously, Ms. Reynolds served as President, Treasurer, and Anti-Money Laundering officer of the Fidelity funds (2004-2007). |
Kenneth B. Robins (1969) |
Year of Election or Appointment: 2008 President and Treasurer |
| Mr. Robins also serves as an officer of other funds. Mr. Robins serves as Executive Vice President of Fidelity Investments Money Management, Inc. (FIMM) (2013-present) and is an employee of Fidelity Investments (2004-present). Previously, Mr. Robins served in other fund officer roles. |
Gary W. Ryan (1958) |
Year of Election or Appointment: 2005 Assistant Treasurer |
| Mr. Ryan also serves as Assistant Treasurer of other funds. Mr. Ryan is an employee of Fidelity Investments and has served in other fund officer roles. Previously, Mr. Ryan served as Vice President of Fund Reporting in Fidelity Pricing and Cash Management Services (FPCMS) (1999-2005). |
Stephen Sadoski (1971) |
Year of Election or Appointment: 2012 Deputy Treasurer |
| Mr. Sadoski also serves as Deputy Treasurer of other funds. He is an employee of Fidelity Investments (2012-present) and has served in another fund officer role. Prior to joining Fidelity Investments, Mr. Sadoski served as an assistant chief accountant in the Division of Investment Management of the Securities and Exchange Commission (SEC) (2009-2012) and as a senior manager at Deloitte & Touche LLP (1997-2009). |
Stacie M. Smith (1974) |
Year of Election or Appointment: 2013 Deputy Treasurer |
| Ms. Smith also serves as an officer of other funds. She is an employee of Fidelity Investments (2009-present) and has served in other fund officer roles. Prior to joining Fidelity Investments, Ms. Smith served as Senior Audit Manager of Ernst & Young LLP (1996-2009). |
Renee Stagnone (1975) |
Year of Election or Appointment: 2013 Deputy Treasurer |
| Ms. Stagnone also serves as Deputy Treasurer of other funds. Ms. Stagnone is an employee of Fidelity Investments. |
Joseph F. Zambello (1957) |
Year of Election or Appointment: 2011 Deputy Treasurer |
| Mr. Zambello also serves as Deputy Treasurer of other funds. Mr. Zambello is an employee of Fidelity Investments. Previously, Mr. Zambello served as Vice President of FMR's Program Management Group (2009-2011) and Vice President of the Transfer Agent Oversight Group (2005-2009). |
Annual Report
Board Approval of Investment Advisory Contracts and Management Fees
VIP High Income Portfolio
Each year, the Board of Trustees, including the Independent Trustees (together, the Board), votes on the renewal of the management contract and sub-advisory agreements (together, the Advisory Contracts) for the fund. The Board, assisted by the advice of fund counsel and Independent Trustees' counsel, requests and considers a broad range of information relevant to the renewal of the Advisory Contracts throughout the year.
The Board meets regularly and, at each of its meetings, covers an extensive agenda of topics and materials and considers factors that are relevant to its annual consideration of the renewal of the fund's Advisory Contracts, including the services and support provided to the fund and its shareholders. The Board has established various standing committees, each composed of and chaired by Independent Trustees with varying backgrounds, to which the Board has assigned specific subject matter responsibilities in order to enhance effective decision-making by the Board. The Board, acting directly and through its Committees, requests and receives information concerning the annual consideration of the renewal of the fund's Advisory Contracts. The Board also meets as needed to consider matters specifically related to the Board's annual consideration of the renewal of Advisory Contracts. Members of the Board may also meet with trustees of other Fidelity funds through ad hoc joint committees to discuss certain matters relevant to the Fidelity funds.
At its July 2013 meeting, the Board, including the Independent Trustees, unanimously determined to renew the fund's Advisory Contracts. In reaching its determination, the Board considered all factors it believed relevant, including (i) the nature, extent, and quality of the services to be provided to the fund and its shareholders (including the investment performance of the fund); (ii) the competitiveness of the fund's management fee and total expense ratio relative to peer funds; (iii) the total costs of the services to be provided by and the profits to be realized by Fidelity from its relationship with the fund; (iv) the extent to which economies of scale exist and would be realized as the fund grows; and (v) whether fee levels reflect these economies of scale, if any, for the benefit of fund shareholders.
In considering whether to renew the Advisory Contracts for the fund, the Board reached a determination, with the assistance of fund counsel and Independent Trustees' counsel and through the exercise of its business judgment, that the renewal of the Advisory Contracts was in the best interests of the fund and its shareholders and that the compensation payable under the Advisory Contracts was fair and reasonable. The Board's decision to renew the Advisory Contracts was not based on any single factor, but rather was based on a comprehensive consideration of all the information provided to the Board at its meetings throughout the year. The Board, in reaching its determination to renew the Advisory Contracts, was aware that shareholders in the fund have a broad range of investment choices available to them, including a wide choice among mutual funds offered by Fidelity's competitors, and that the fund's shareholders, who have the opportunity to review and weigh the disclosure provided by the fund in its prospectus and other public disclosures, have chosen to invest in this fund, which is a part of the Fidelity family of funds.
Nature, Extent, and Quality of Services Provided. The Board considered the staffing within the investment adviser, Fidelity Management & Research Company (FMR), and the sub-advisers (together, the Investment Advisers) as it relates to the fund, including the backgrounds of the fund's investment personnel, and also considered the fund's investment objective, strategies, and related investment philosophy. The Independent Trustees also had discussions with senior management of Fidelity's investment operations and investment groups. The Board considered the structure of the portfolio manager compensation program and whether this structure provides appropriate incentives to act in the best interests of the fund.
Resources Dedicated to Investment Management and Support Services. The Board and the Fund Oversight and Research Committees reviewed the general qualifications and capabilities of the Investment Advisers' investment staff, including its size, education, experience, and resources, as well as the Investment Advisers' approach to recruiting, training, managing, and compensating investment personnel. The Board noted that FMR has continued to increase the resources devoted to non-U.S. offices, including expansion of Fidelity's global investment organization. The Board also noted that Fidelity's analysts have extensive resources, tools and capabilities that allow them to conduct sophisticated quantitative and fundamental analysis, as well as credit analysis of issuers, counterparties and guarantors. Further, the Board believes that Fidelity's investment professionals have sufficient access to global information and data so as to provide competitive investment results over time, and that those professionals also have access to sophisticated tools that permit them to assess portfolio construction and risk and performance attribution characteristics continuously, as well as to transmit new information and research conclusions rapidly around the world. Additionally, in its deliberations, the Board considered the Investment Advisers' trading and risk management capabilities and resources, which are an integral part of the investment management process.
Shareholder and Administrative Services. The Board considered (i) the nature, extent, quality, and cost of advisory, administrative, and shareholder services performed by the Investment Advisers and their affiliates under the Advisory Contracts and under separate agreements covering transfer agency, pricing and bookkeeping, and securities lending services for the fund; (ii) the nature and extent of the supervision of third party service providers, principally custodians and subcustodians; and (iii) the resources devoted to, and the record of compliance with, the fund's compliance policies and procedures. The Board also reviewed the allocation of fund brokerage, including allocations to brokers affiliated with the Investment Advisers, the use of brokerage commissions to pay fund expenses, and the use of "soft" commission dollars to pay for research services.
The Board noted that the growth of fund assets over time across the complex allows Fidelity to reinvest in the development of services designed to enhance the value or convenience of the Fidelity funds as investment vehicles. These services include 24-hour access to account information and market information through telephone representatives and over the Internet, investor education materials and asset allocation tools, and the expanded availability of Fidelity Investor Centers.
Annual Report
Board Approval of Investment Advisory Contracts and Management Fees - continued
Investment in a Large Fund Family. The Board considered the benefits to shareholders of investing in a Fidelity fund, including the benefits of investing in a fund that is part of a large family of funds offering a variety of investment disciplines and providing a large variety of mutual fund investor services. The Board noted that Fidelity had taken, or had made recommendations that resulted in the Fidelity funds taking, a number of actions over the previous year that benefited particular funds, including (i) continuing to dedicate additional resources to investment research and to the support of the senior management team that oversees asset management; (ii) persisting in efforts to enhance Fidelity's global research capabilities; (iii) launching new funds and making other enhancements to meet client needs for global and income-oriented solutions; (iv) continuing to launch dedicated lower cost underlying funds to meet portfolio construction needs related to expanding underlying fund options for Fidelity funds of funds, specifically for the Freedom Fund product lines; (v) rationalizing product lines and gaining increased efficiencies through the mergers of several funds into other funds; (vi) strengthening Fidelity's index fund offerings by reducing investment minimums and adopting or lowering existing expense caps for certain funds and classes; (vii) enhancing Global Asset Allocation product offerings by launching new funds and strategies, including "open architecture" target date funds that utilize affiliated and unaffiliated sub-advisers; (viii) modifying the eligibility criteria for Institutional Class shares of Advisor funds to increase their marketability to a portion of the defined contribution plan market; (ix) creating a new low-cost retirement share class for certain Advisor funds to appeal to large retirement plans; (x) transitioning the management of certain Fidelity commodity funds to Geode Capital Management LLC, a registered commodity pool operator, while retaining administrative responsibilities for the funds; (xi) reorganizing a number of funds; and (xii) taking steps toward establishing a new Fidelity adviser to manage sector-based funds and products.
Investment Performance. The Board considered whether the fund has operated in accordance with its investment objective, as well as its record of compliance with its investment restrictions and its performance history.
The Board took into account discussions with the Investment Advisers about fund investment performance that occur at Board meetings throughout the year. In this regard the Board noted that as part of regularly scheduled fund reviews and other reports to the Board on fund performance, the Board periodically considers annualized return information for the fund, for different time periods, measured against a securities market index ("benchmark index") and a peer group of mutual funds with similar objectives ("peer group"). In its evaluation of fund investment performance, the Board gave particular attention to information indicating changes in performance of certain Fidelity funds for specific time periods and the Investment Advisers' explanations for any overperformance or, in the case of the fund, underperformance.
In addition to reviewing absolute and relative fund performance, the Independent Trustees periodically consider the appropriateness of fund performance metrics in evaluating the results achieved. In general, the Independent Trustees believe that fund performance should be evaluated based on net performance (after fees and expenses) of both the highest performing and lowest performing classes, where applicable, compared to appropriate benchmark indices, over appropriate time periods which may include full market cycles, and compared to peer groups, as applicable, over the same periods, taking into account relevant factors including the following: general market conditions; issuer-specific information; tactical opportunities for investment; and fund cash flows and other factors.
The Independent Trustees recognize that shareholders evaluate performance on a net basis over their own holding periods, for which one-, three-, and five-year periods are used as a proxy. For this reason, the performance information reviewed by the Board also included net cumulative calendar year total return information for the fund and an appropriate benchmark index and peer group for the most recent one-, three-, and five-year periods, as shown below. Returns are shown compared to the 25th percentile (top of box) and 75th percentile (bottom of box) of the peer universe.
Annual Report
VIP High Income Portfolio
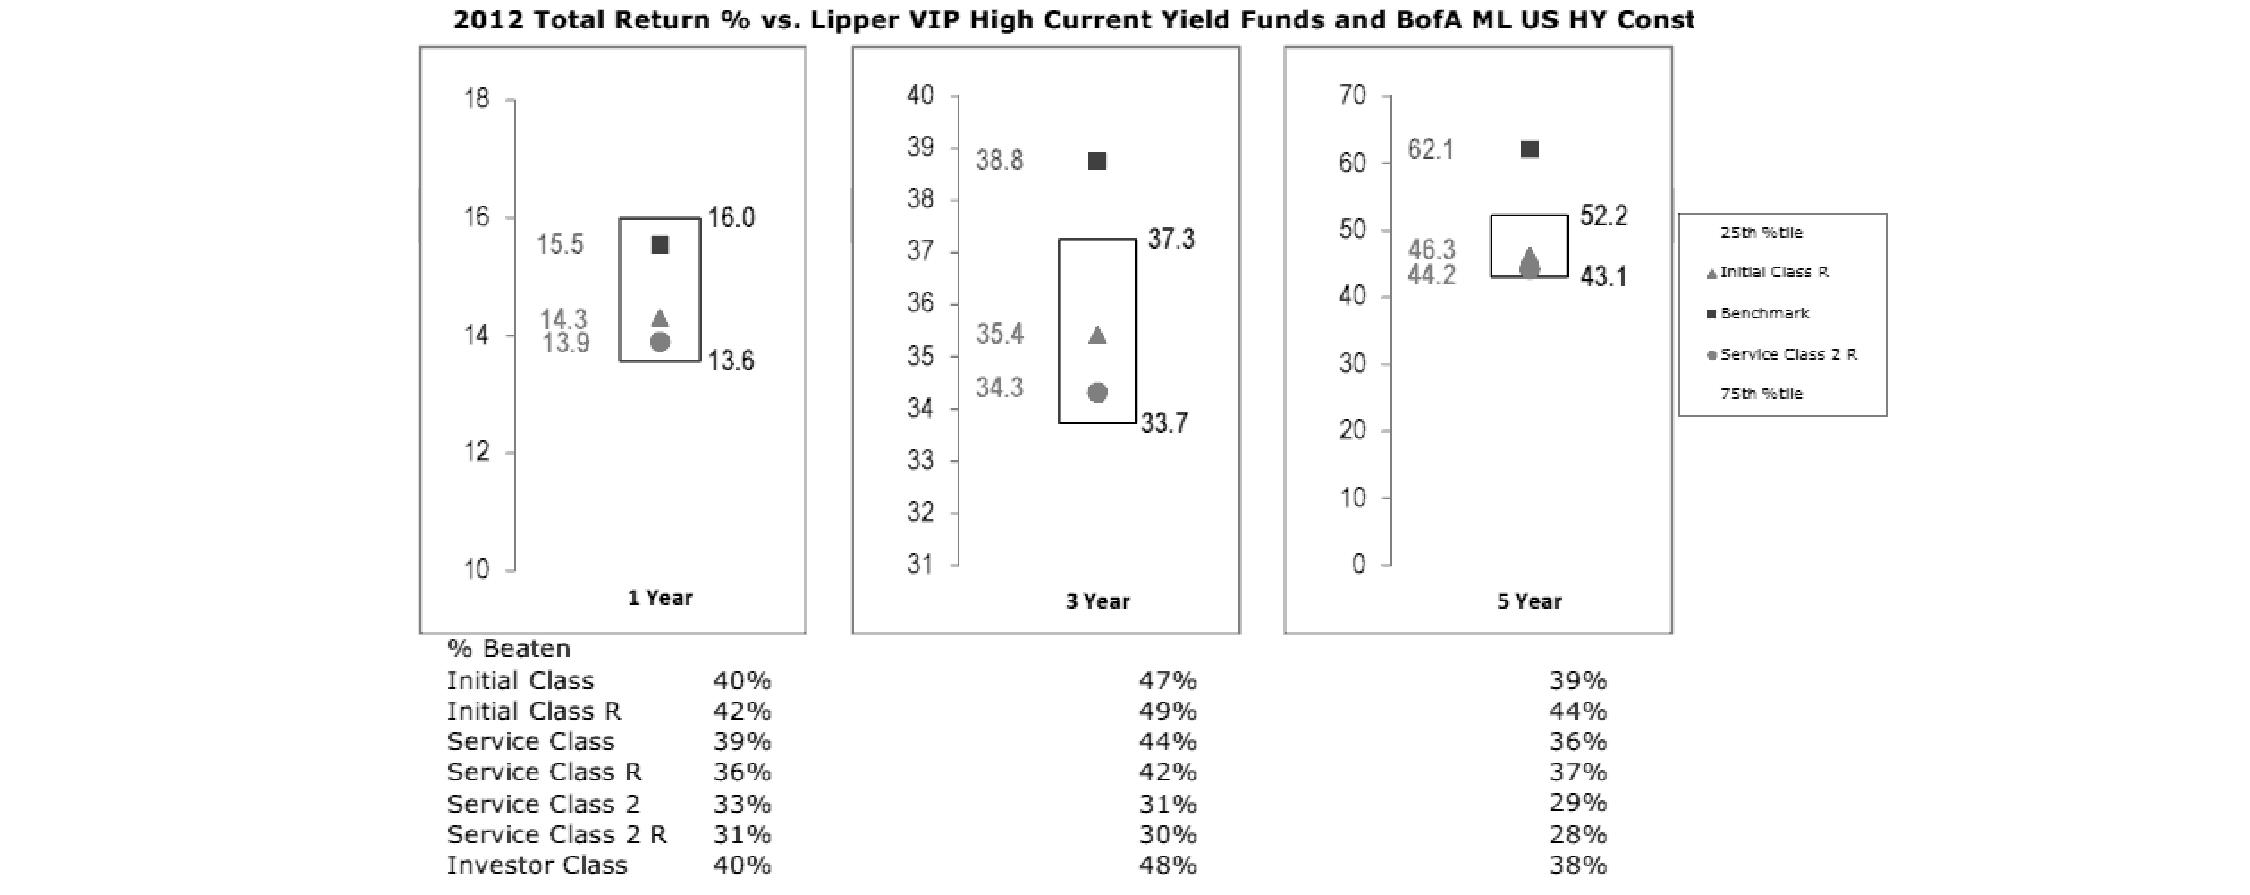
The Board has discussed the fund's underperformance with FMR and has engaged with FMR to consider what steps might be taken to remediate the fund's underperformance.
Based on its review, the Board concluded that the nature, extent, and quality of services provided to the fund under the Advisory Contracts should benefit the fund's shareholders.
Competitiveness of Management Fee and Total Expense Ratio. The Board considered the fund's management fee and total expense ratio compared to "mapped groups" of competitive funds and classes. Fidelity creates "mapped groups" by combining similar Lipper investment objective categories that have comparable management fee characteristics. Combining Lipper investment objective categories aids the Board's management fee and total expense ratio comparisons by broadening the competitive group used for comparison and by reducing the number of universes to which various Fidelity funds are compared.
Management Fee. The Board considered two proprietary management fee comparisons for the 12-month periods shown in the chart below. The group of Lipper funds used by the Board for management fee comparisons is referred to below as the "Total Mapped Group." The Total Mapped Group is broader than the Lipper peer group used by the Board for performance comparisons because the Total Mapped Group combines several Lipper investment objective categories while the Lipper peer group does not. The Total Mapped Group comparison focuses on a fund's standing in terms of gross management fees before expense reimbursements or caps relative to the total universe of funds with comparable investment mandates, regardless of whether their management fee structures also are comparable. Funds with comparable investment mandates offer exposure to similar types of securities. Funds with comparable management fee structures have similar management fee contractual arrangements (e.g., flat rate charged for advisory services, all-inclusive fee rate, etc.). "TMG %" represents the percentage of funds in the Total Mapped Group that had management fees that were lower than the fund's. For example, a TMG % of 25% means that 75% of the funds in the Total Mapped Group had higher management fees than the fund. The "Asset-Size Peer Group" (ASPG) comparison focuses on a fund's standing relative to a subset of non-Fidelity funds within the Total Mapped Group that are similar in size and management fee structure. The ASPG represents at least 15% of the funds in the Total Mapped Group with comparable asset size and management fee structures, subject to a minimum of 50 funds (or all funds in the Total Mapped Group if fewer than 50). Additional information, such as the ASPG quartile in which the fund's management fee ranked, is also included in the chart and considered by the Board.
Annual Report
Board Approval of Investment Advisory Contracts and Management Fees - continued
VIP High Income Portfolio

The Board noted that the fund's management fee ranked below the median of its Total Mapped Group and below the median of its ASPG for 2012.
Based on its review, the Board concluded that the fund's management fee is fair and reasonable in light of the services that the fund receives and the other factors considered.
Total Expense Ratio. In its review of each class's total expense ratio, the Board considered the fund's management fee as well as other fund or class expenses, as applicable, such as transfer agent fees, pricing and bookkeeping fees, fund-paid 12b-1 fees, and custodial, legal, and audit fees. The Board also noted the effects of any waivers and reimbursements on fees and expenses. As part of its review, the Board also considered the current and historical total expense ratios of each class of the fund compared to competitive fund median expenses. Each class of the fund is compared to those funds and classes in the Total Mapped Group (used by the Board for management fee comparisons) that have a similar sales load structure.
The Board noted that the total expense ratio of each of Initial Class, Initial Class R, Investor Class, Service Class, and Service Class R ranked below its competitive median for 2012 and the total expense ratio of each of Service Class 2 and Service Class 2 R ranked above its competitive median for 2012. The Board considered that, in general, various factors can affect total expense ratios. The Board noted that the fund offers multiple classes, each of which has a different 12b-1 fee structure, and that the multiple structures are intended to offer a range of pricing options for the intermediary market. The Board also noted that the total expense ratios of the classes vary primarily by the level of their 12b-1 fees, although differences in transfer agent fees may also cause expenses to vary from class to class.
Fees Charged to Other Fidelity Clients. The Board also considered Fidelity fee structures and other information with respect to clients of FMR and its affiliates, such as other mutual funds advised or subadvised by FMR or its affiliates, pension plan clients, and other institutional clients. The Board noted the findings of the 2013 ad hoc joint committee (created with the board of other Fidelity funds), which reviewed and compared Fidelity's institutional investment advisory business with its business of providing services to the Fidelity funds, including the differences in services provided, fees charged, and costs incurred, as well as competition in their respective marketplaces.
Based on its review of total expense ratios and fees charged to other Fidelity clients, the Board concluded that the total expense ratio of each class of the fund was reasonable, although in some cases above the median of the universe presented for comparison, in light of the services that the fund and its shareholders receive and the other factors considered.
Costs of the Services and Profitability. The Board considered the revenues earned and the expenses incurred by Fidelity in conducting the business of developing, marketing, distributing, managing, administering and servicing the fund and servicing the fund's shareholders. The Board also considered the level of Fidelity's profits in respect of all the Fidelity funds.
On an annual basis, FMR presents to the Board Fidelity's profitability for the fund. Fidelity calculates the profitability for each fund, as well as aggregate profitability for groups of Fidelity funds and all Fidelity funds, using a series of detailed revenue and cost allocation methodologies which originate with the books and records of Fidelity on which Fidelity's audited financial statements are based. The Audit Committee of the Board reviews any significant changes from the prior year's methodologies.
PricewaterhouseCoopers LLP (PwC), independent registered public accounting firm and auditor to Fidelity and certain Fidelity funds, has been engaged annually by the Board as part of the Board's assessment of Fidelity's profitability analysis. PwC's engagement includes the review and assessment of the methodologies used by Fidelity in determining the revenues and expenses attributable to Fidelity's mutual fund business, and completion of agreed-upon procedures surrounding the mathematical accuracy of fund profitability and its conformity to allocation methodologies. After considering PwC's reports issued under the engagement and information provided by Fidelity, the Board concluded that while other allocation methods may also be reasonable, Fidelity's profitability methodologies are reasonable in all material respects.
Annual Report
The Board also reviewed Fidelity's non-fund businesses and fall-out benefits related to the mutual fund business as well as cases where Fidelity's affiliates may benefit from or be related to the fund's business.
The Board considered the costs of the services provided by and the profits realized by Fidelity in connection with the operation of the fund and was satisfied that the profitability was not excessive in the circumstances.
Economies of Scale. The Board considered whether there have been economies of scale in respect of the management of the Fidelity funds, whether the Fidelity funds (including the fund) have appropriately benefited from any such economies of scale, and whether there is potential for realization of any further economies of scale. The Board considered the extent to which the fund will benefit from economies of scale through increased services to the fund, through waivers or reimbursements, or through fee or expense reductions. The Board also noted that in 2009, it and the board of other Fidelity funds created an ad hoc committee (the Economies of Scale Committee) to analyze whether FMR attains economies of scale in respect of the management and servicing of the Fidelity funds, whether the Fidelity funds have appropriately benefited from such economies of scale, and whether there is potential for realization of any further economies of scale.
The Board recognized that the fund's management contract incorporates a "group fee" structure, which provides for lower group fee rates as total fund assets under FMR's management increase, and for higher group fee rates as total fund assets under FMR's management decrease. FMR calculates the group fee rates based on a tiered asset "breakpoint" schedule that varies based on asset class. The Board considered that the group fee is designed to deliver the benefits of economies of scale to fund shareholders when total Fidelity fund assets increase, even if assets of any particular fund are unchanged or have declined, because some portion of Fidelity's costs are attributable to services provided to all Fidelity funds, and all funds benefit if those costs can be allocated among more assets. The Board concluded that, given the group fee structure, fund shareholders will benefit from lower management fees as assets under FMR's management increase at the fund complex level, regardless of whether Fidelity achieves any such economies of scale.
The Board concluded, taking into account the analysis of the Economies of Scale Committee, that economies of scale, if any, are being appropriately shared between fund shareholders and Fidelity.
Amendment to Description of Group Fee Rate. At its July 2013 meeting, the Board voted to approve an amendment to the fund's management contract to modify the description of the "group fee rate" effective August 1, 2013. The Board noted that under the prior description in the contract, the group fee rate was based on the average net assets of all registered investment companies with which FMR has management contracts. Under the contract's tiered asset breakpoint schedule, the group fee rate is lower as total fund assets under FMR's management increase, and higher as total fund assets under FMR's management decrease. The Board considered that the prior description would have excluded the assets of 64 Fidelity sector funds from the group fee rate calculation once Fidelity SelectCo, LLC, an affiliate of FMR, assumed management responsibilities for those funds. The Board noted that modifying the description of the group fee rate to continue to include the assets of those 64 funds for purposes of determining group fee rate breakpoints would avoid an immediate adverse impact on the group fee rate for any fund.
Additional Information Requested by the Board. In order to develop fully the factual basis for consideration of the Fidelity funds' Advisory Contracts, the Board requested and received additional information on certain topics, including: (i) fund performance trends and Fidelity's long-term strategies for certain funds; (ii) the potential to further rationalize the Fidelity fund lineup with the possibility of achieving savings for the funds and Fidelity; (iii) the methodology with respect to competitive fund data and peer group classifications; (iv) the arrangements with, and performance of, certain sub-advisers on behalf of the Fidelity funds, as well as certain proposed participating affiliate arrangements; (v) the realization of fall-out benefits in certain Fidelity business units; (vi) Fidelity's group fee structures, including the rationale for the individual fee rates of certain categories of funds and the definition of group assets; (vii) trends regarding industry use of performance fee structures and the performance adjustment methodologies applicable to the Fidelity funds; (viii) additional competitive analysis regarding the total expenses for certain classes; and (ix) fund profitability methodology, including Fidelity's cost allocation methodology, and the impact of certain factors on fund profitability results.
Based on its evaluation of all of the conclusions noted above, and after considering all factors it believed relevant, the Board ultimately concluded that the advisory fee structures are fair and reasonable, and that the fund's Advisory Contracts should be renewed.
Annual Report
Investment Adviser
Fidelity Management & Research Company
Boston, MA
Investment Sub-Advisers
FMR Co., Inc.
Fidelity Management & Research (U.K.) Inc.
Fidelity Management & Research (Hong Kong) Limited
Fidelity Management & Research (Japan) Inc.
General Distributor
Fidelity Distributors Corporation
Smithfield, RI
Transfer and Service Agents
Fidelity Investments Institutional Operations Company, Inc.
Boston, MA
Fidelity Service Company, Inc.
Boston, MA
Custodian
The Bank of New York Mellon
New York, NY
VIPHI-ANN-0214
1.540029.116
Fidelity® Variable Insurance Products:
Equity-Income Portfolio - Service Class 2R
Annual Report
December 31, 2013
(Fidelity Cover Art)
Contents
Performance | (Click Here) | How the fund has done over time. |
Management's Discussion of Fund Performance | (Click Here) | The Portfolio Manager's review of fund performance and strategy. |
Shareholder Expense Example | (Click Here) | An example of shareholder expenses. |
Investment Changes | (Click Here) | A summary of major shifts in the fund's investments over the past six months. |
Investments | (Click Here) | A complete list of the fund's investments with their market values. |
Financial Statements | (Click Here) | Statements of assets and liabilities, operations, and changes in net assets, as well as financial highlights. |
Notes | (Click Here) | Notes to the financial statements. |
Report of Independent Registered Public Accounting Firm | (Click Here) | |
Trustees and Officers | (Click Here) | |
Distributions | (Click Here) | |
Board Approval of Investment Advisory Contracts and Management Fees | (Click Here) | |
To view a fund's proxy voting guidelines and proxy voting record for the 12-month period ended June 30, visit http://www.fidelity.com/proxyvotingresults or visit the Securities and Exchange Commission's (SEC) web site at http://www.sec.gov. You may also call 1-877-208-0098 to request a free copy of the proxy voting guidelines.
Fidelity Variable Insurance Products are separate account options which are purchased through a variable insurance contract.
Standard & Poor's, S&P and S&P 500 are registered service marks of The McGraw-Hill Companies, Inc. and have been licensed for use by Fidelity Distributors Corporation.
Other third-party marks appearing herein are the property of their respective owners.
All other marks appearing herein are registered or unregistered trademarks or service marks of FMR LLC or an affiliated company. © 2014 FMR LLC. All rights reserved.
This report and the financial statements contained herein are submitted for the general information of the shareholders of the fund. This report is not authorized for distribution to prospective investors in the fund unless preceded or accompanied by an effective prospectus.
A fund files its complete schedule of portfolio holdings with the SEC for the first and third quarters of each fiscal year on Form N-Q. Forms N-Q are available on the SEC's web site at http://www.sec.gov. A fund's Forms N-Q may be reviewed and copied at the SEC's Public Reference Room in Washington, DC. Information regarding the operation of the SEC's Public Reference Room may be obtained by calling 1-800-SEC-0330. For a complete list of a fund's portfolio holdings, view the most recent holdings listing, semiannual report, or annual report on Fidelity's web site at http://www.fidelity.com, http://www.advisor.fidelity.com, or http://www.401k.com, as applicable.
NOT FDIC INSURED • MAY LOSE VALUE • NO BANK GUARANTEE
Neither the fund nor Fidelity Distributors Corporation is a bank.
Annual Report
Average annual total return reflects the change in the value of an investment, assuming reinvestment of the class' distributions from dividend income and capital gains (the profits earned upon the sale of securities that have grown in value, if any) and assuming a constant rate of performance each year. During periods of reimbursement by Fidelity, a fund's total return will be greater than it would be had the reimbursement not occurred. Performance numbers are net of all underlying fund operating expenses, but do not include any insurance charges imposed by your insurance company's separate account. If performance information included the effect of these additional charges, the total returns would have been lower. How a fund did yesterday is no guarantee of how it will do tomorrow.
Average Annual Total Returns
Periods ended December 31, 2013 | Past 1
year | Past 5
years | Past 10
years |
VIP Equity-Income PortfolioSM - Service Class 2R | 27.79% | 17.60% | 6.25% |
$10,000 Over 10 Years
Let's say hypothetically that $10,000 was invested in VIP Equity-Income PortfolioSM - Service Class 2R on December 31, 2003. The chart shows how the value of your investment would have changed, and also shows how the Russell 3000® Value Index performed over the same period.
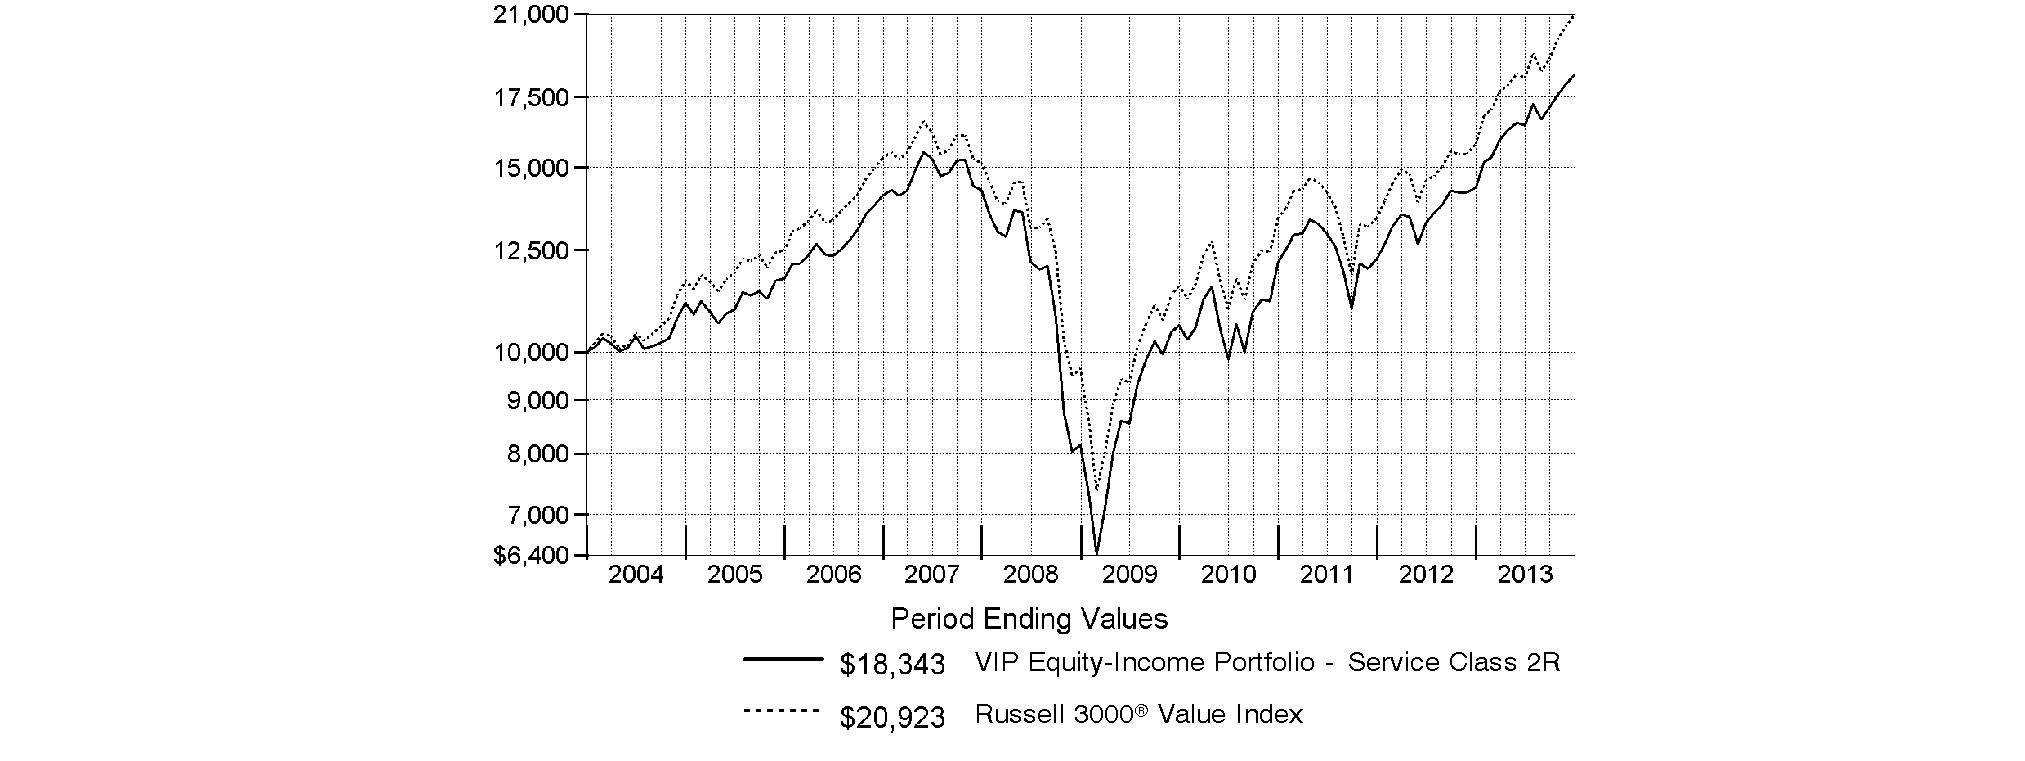
Annual Report
Market Recap: Global equity markets remained upbeat for the 12 months ending December 31, 2013, propelling the MSCI® ACWI® (All Country World Index) Index to a 23.24% return. Midyear turbulence gave way by autumn when policymakers in the U.S. and China had made clear their intentions to maintain accommodative monetary policies. That stance, combined with modest cyclical improvement around the globe and generally low valuations, underpinned the broad rally in equities, although the relative strength of the U.S. dollar generally tempered gains for U.S. investors holding foreign securities based in local currencies. During the period, the broad-market S&P 500® Index set a series of new highs, finishing the year up 32.39%. For the first time since 1995, the S&P® scored a "perfect 10," with all 10 economic sectors gaining at least 10% for the year. A resurgence in growth-oriented stocks lifted the Nasdaq Composite Index® to a 40.12% result for 2013, while the blue-chip Dow Jones Industrial AverageSM notched a relatively more modest 29.65% gain. International developed-markets equities rose in concert with their U.S. counterparts, with the MSCI® EAFE® Index gaining 22.92% for the period. Meanwhile, foreign exchange and commodity weakness curbed results in resource-heavy emerging markets (EM), especially in the year's waning months. More generally, concern over EM's slowing growth, its declining share of global trade and uncertainty surrounding U.S. central bank intentions were all factors hampering performance. The MSCI Emerging Markets Index returned -2.27% for the period. On the bond side, U.S. high-yield securities rallied with equities for much of the period, with The BofA Merrill LynchSM US High Yield Constrained Index returning 7.41% for 2013. The more rate-sensitive U.S. investment-grade bond category faced headwinds though, as reflected in the -2.02% return of the Barclays® U.S. Aggregate Bond Index. Within the Barclays index, investment-grade corporate credit returned -2.01%, while ultra-safe U.S. Treasuries saw a -2.75% result. Major non-U.S. developed markets performed only slightly better, with the Citigroup® Non-USD Group-of-Seven (G7) Equal Weighted Index logging a -1.59% result. After several years of strong advances, EM debt reversed course in 2013, with the J.P. Morgan Emerging Markets Bond Index Global returning -6.58%.
Comments from James Morrow, Lead Portfolio Manager of VIP Equity-Income Portfolio: For the year, the fund's share classes significantly trailed the benchmark Russell 3000® Value Index, which gained 32.69%. (For specific portfolio results, please refer to the performance section of this report.) Versus the index, stock selection was challenging, especially in information technology, industrials and energy. The fund's cash stake of 5% on average - a reflection of fewer attractive buying opportunities as the period progressed - also detracted. On the positive side, the fund benefited from helpful underweightings in the lagging real estate, utilities and materials sectors, and from overweighting the outperforming software & services industry. The biggest individual detractor was a sizable out-of-index stake in diversified technology stock IBM, which I liked for its competitive dividend, high-return business, solid earnings growth and attractive valuation. But in a market environment that rewarded fast-growing, momentum-oriented stocks, investors found steady growers like IBM to be relatively boring. I think owning "boring" stocks can be very profitable over the long term, which is why I added to my stake in IBM overall, but it was certainly a disappointment for the fund this past year. Other notable relative detractors were Netherlands-based energy producer Royal Dutch Shell and computer and peripherals maker Hewlett-Packard (HP). In the latter case, I avoided owning this benchmark component because I thought the company faced too many long-term headwinds. This decision did not work out well during the year, however, as HP's shares more than doubled. I did, however, invest in Royal Dutch Shell, an out-of-benchmark stock that lagged. Over time, I notably reduced the fund's stake, as I had hoped the company's dividend would grow more quickly. On the positive side, the fund benefited disproportionately from a couple of financials stocks - life insurance provider MetLife and a non-index stake in asset manager Blackstone Group, whose shares gained about 64% and 116%, respectively. Both are good examples of the types of businesses I like to own - they have healthy balance sheets, good dividends and strong competitive positions.
The views expressed above reflect those of the portfolio manager(s) only through the end of the period as stated on the cover of this report and do not necessarily represent the views of Fidelity or any other person in the Fidelity organization. Any such views are subject to change at any time based upon market or other conditions and Fidelity disclaims any responsibility to update such views. These views may not be relied on as investment advice and, because investment decisions for a Fidelity fund are based on numerous factors, may not be relied on as an indication of trading intent on behalf of any Fidelity fund.
Annual Report
As a shareholder of the Fund, you incur two types of costs: (1) transaction costs, including redemption fees and (2) ongoing costs, including management fees, distribution and/or service (12b-1) fees and other Fund expenses. This Example is intended to help you understand your ongoing costs (in dollars) of investing in the Fund and to compare these costs with the ongoing costs of investing in other mutual funds.
The Example is based on an investment of $1,000 invested at the beginning of the period and held for the entire period (July 1, 2013 to December 31, 2013).
Actual Expenses
The first line of the accompanying table for each class of the Fund provides information about actual account values and actual expenses. You may use the information in this line, together with the amount you invested, to estimate the expenses that you paid over the period. Simply divide your account value by $1,000.00 (for example, an $8,600 account value divided by $1,000.00 = 8.6), then multiply the result by the number in the first line for a class of the Fund under the heading entitled "Expenses Paid During Period" to estimate the expenses you paid on your account during this period. The estimate of expenses does not include any fees or other expenses of any variable annuity or variable life insurance product. If they were, the estimate of expenses you paid during the period would be higher, and your ending account value would be lower. In addition, the Fund, as a shareholder in the underlying Fidelity Central Funds, will indirectly bear its pro-rata share of the fees and expenses incurred by the underlying Fidelity Central Funds. These fees and expenses are not included in the Fund's annualized expense ratio used to calculate the expense estimate in the table below.
Hypothetical Example for Comparison Purposes
The second line of the accompanying table for each class of the Fund provides information about hypothetical account values and hypothetical expenses based on a Class' actual expense ratio and an assumed rate of return of 5% per year before expenses, which is not the Class' actual return. The hypothetical account values and expenses may not be used to estimate the actual ending account balance or expenses you paid for the period. You may use this information to compare the ongoing costs of investing in the Fund and other funds. To do so, compare this 5% hypothetical example with the 5% hypothetical examples that appear in the shareholder reports of the other funds. The estimate of expenses does not include any fees or other expenses of any variable annuity or variable life insurance product. If they were, the estimate of expenses you paid during the period would be higher, and your ending account value would be lower. In addition, the Fund, as a shareholder in the underlying Fidelity Central Funds, will indirectly bear its pro-rata share of the fees and expenses incurred by the underlying Fidelity Central Funds. These fees and expenses are not included in the Fund's annualized expense ratio used to calculate the expense estimate in the table below.
Please note that the expenses shown in the table are meant to highlight your ongoing costs only and do not reflect any transaction costs. Therefore, the second line of the table is useful in comparing ongoing costs only, and will not help you determine the relative total costs of owning different funds. In addition, if these transactional costs were included, your costs would have been higher.
| Annualized
Expense RatioB | Beginning
Account Value
July 1, 2013 | Ending
Account Value
December 31, 2013 | Expenses Paid
During Period*
July 1, 2013 to
December 31, 2013 |
Initial Class | .54% | | | |
Actual | | $ 1,000.00 | $ 1,117.70 | $ 2.88 |
HypotheticalA | | $ 1,000.00 | $ 1,022.48 | $ 2.75 |
Service Class | .64% | | | |
Actual | | $ 1,000.00 | $ 1,117.00 | $ 3.42 |
HypotheticalA | | $ 1,000.00 | $ 1,021.98 | $ 3.26 |
Service Class 2 | .79% | | | |
Actual | | $ 1,000.00 | $ 1,116.50 | $ 4.21 |
HypotheticalA | | $ 1,000.00 | $ 1,021.22 | $ 4.02 |
Service Class 2R | .79% | | | |
Actual | | $ 1,000.00 | $ 1,116.60 | $ 4.21 |
HypotheticalA | | $ 1,000.00 | $ 1,021.22 | $ 4.02 |
Investor Class | .62% | | | |
Actual | | $ 1,000.00 | $ 1,117.40 | $ 3.31 |
HypotheticalA | | $ 1,000.00 | $ 1,022.08 | $ 3.16 |
A 5% return per year before expenses
B Annualized expense ratio reflects expenses net of applicable fee waivers.
* Expenses are equal to each Class' annualized expense ratio, multiplied by the average account value over the period, multiplied by 184/365 (to reflect the one-half year period).
Annual Report
Investment Changes (Unaudited)
Top Ten Stocks as of December 31, 2013 |
| % of fund's
net assets | % of fund's net assets
6 months ago |
JPMorgan Chase & Co. | 4.1 | 3.9 |
Wells Fargo & Co.* | 3.1 | 2.9 |
Chevron Corp. | 3.0 | 2.9 |
General Electric Co. | 2.7 | 2.2 |
Exxon Mobil Corp. | 2.6 | 2.3 |
MetLife, Inc. | 2.4 | 2.1 |
Cisco Systems, Inc. | 2.3 | 2.3 |
Merck & Co., Inc. | 2.2 | 2.1 |
Procter & Gamble Co. | 2.1 | 2.5 |
Paychex, Inc. | 2.0 | 2.2 |
| 26.5 | |
* Security or a portion of the security is pledged as collateral for call options written.
Top Five Market Sectors as of December 31, 2013 |
| % of fund's
net assets | % of fund's net assets
6 months ago |
Financials | 22.2 | 22.3 |
Energy | 14.2 | 12.3 |
Health Care | 12.2 | 13.5 |
Information Technology | 11.9 | 11.1 |
Industrials | 10.5 | 10.4 |
Asset Allocation (% of fund's net assets) |
As of December 31, 2013* | As of June 30, 2013** |
| Stocks 94.6% | | | Stocks 93.2% | |
| Bonds 3.1% | | | Bonds 3.5% | |
| Short-Term
Investments and
Net Other Assets
(Liabilities) 2.2% | | | Short-Term
Investments and
Net Other Assets
(Liabilities) 3.3% | |
| Other Investments 0.1% | | | Other Investments 0.0% | |
* Foreign investments | 12.2% | | ** Foreign investments | 9.7% | |
* Written options | (0.1)% | | ** Written options | 0.0% | |

Annual Report
Investments December 31, 2013
Showing Percentage of Net Assets
Common Stocks - 92.9% |
| Shares | | Value |
CONSUMER DISCRETIONARY - 7.6% |
Auto Components - 0.2% |
Gentex Corp. | 492,457 | | $ 16,246,156 |
Automobiles - 0.2% |
General Motors Co. (a) | 301,766 | | 12,333,176 |
Hotels, Restaurants & Leisure - 1.6% |
McDonald's Corp. | 547,900 | | 53,162,737 |
Texas Roadhouse, Inc. Class A | 550,397 | | 15,301,037 |
Wynn Resorts Ltd. | 29,950 | | 5,816,590 |
Yum! Brands, Inc. | 388,000 | | 29,336,680 |
| | 103,617,044 |
Leisure Equipment & Products - 0.4% |
New Academy Holding Co. LLC unit (j)(k) | 127,200 | | 23,350,104 |
Media - 2.7% |
Comcast Corp. Class A (h) | 1,708,043 | | 88,758,455 |
Sinclair Broadcast Group, Inc. Class A | 279,207 | | 9,976,066 |
Time Warner, Inc. | 1,085,308 | | 75,667,674 |
| | 174,402,195 |
Multiline Retail - 1.7% |
Kohl's Corp. | 526,300 | | 29,867,525 |
Target Corp. | 1,261,103 | | 79,789,987 |
| | 109,657,512 |
Specialty Retail - 0.6% |
Adastria Holdings Co. Ltd. | 77,930 | | 2,812,218 |
American Eagle Outfitters, Inc. | 716,039 | | 10,310,962 |
Foot Locker, Inc. | 352,385 | | 14,602,834 |
Staples, Inc. (h) | 854,036 | | 13,570,632 |
| | 41,296,646 |
Textiles, Apparel & Luxury Goods - 0.2% |
Coach, Inc. | 174,394 | | 9,788,735 |
TOTAL CONSUMER DISCRETIONARY | | 490,691,568 |
CONSUMER STAPLES - 9.4% |
Beverages - 1.9% |
Molson Coors Brewing Co. Class B (h) | 470,900 | | 26,441,035 |
PepsiCo, Inc. | 284,757 | | 23,617,746 |
The Coca-Cola Co. | 1,746,721 | | 72,157,045 |
| | 122,215,826 |
Food & Staples Retailing - 2.0% |
CVS Caremark Corp. | 428,200 | | 30,646,274 |
Wal-Mart Stores, Inc. | 395,978 | | 31,159,509 |
Walgreen Co. | 1,197,846 | | 68,804,274 |
| | 130,610,057 |
Food Products - 1.0% |
B&G Foods, Inc. Class A | 65,051 | | 2,205,879 |
Kellogg Co. | 951,557 | | 58,111,586 |
| | 60,317,465 |
Household Products - 2.1% |
Procter & Gamble Co. | 1,658,919 | | 135,052,596 |
|
| Shares | | Value |
Tobacco - 2.4% |
Altria Group, Inc. | 1,194,896 | | $ 45,872,057 |
British American Tobacco PLC sponsored ADR | 138,097 | | 14,834,380 |
Lorillard, Inc. | 996,073 | | 50,480,980 |
Philip Morris International, Inc. | 503,784 | | 43,894,700 |
| | 155,082,117 |
TOTAL CONSUMER STAPLES | | 603,278,061 |
ENERGY - 13.6% |
Energy Equipment & Services - 1.8% |
Ensco PLC Class A | 364,023 | | 20,814,835 |
Halliburton Co. | 35,476 | | 1,800,407 |
National Oilwell Varco, Inc. | 320,906 | | 25,521,654 |
Noble Corp. | 637,502 | | 23,887,200 |
Schlumberger Ltd. | 324,602 | | 29,249,886 |
Trinidad Drilling Ltd. | 1,191,800 | | 11,051,287 |
| | 112,325,269 |
Oil, Gas & Consumable Fuels - 11.8% |
Access Midstream Partners LP | 181,200 | | 10,252,296 |
Apache Corp. | 586,861 | | 50,434,834 |
BG Group PLC | 160,400 | | 3,446,347 |
Canadian Natural Resources Ltd. | 814,600 | | 27,561,049 |
Chevron Corp. | 1,533,580 | | 191,559,478 |
CONSOL Energy, Inc. | 566,142 | | 21,536,042 |
EV Energy Partners LP | 626,524 | | 21,257,959 |
Exxon Mobil Corp. | 1,644,369 | | 166,410,143 |
Holly Energy Partners LP | 290,744 | | 9,399,754 |
HollyFrontier Corp. | 275,460 | | 13,687,607 |
Legacy Reserves LP | 289,401 | | 8,149,532 |
Markwest Energy Partners LP | 530,529 | | 35,083,883 |
Occidental Petroleum Corp. | 545,587 | | 51,885,324 |
Royal Dutch Shell PLC Class A sponsored ADR | 449,629 | | 32,045,059 |
Scorpio Tankers, Inc. | 327,173 | | 3,857,370 |
Suncor Energy, Inc. | 1,054,300 | | 36,961,292 |
The Williams Companies, Inc. | 1,719,249 | | 66,311,434 |
Tsakos Energy Navigation Ltd. | 563,289 | | 3,385,367 |
Western Gas Equity Partners LP | 43,077 | | 1,701,972 |
Williams Partners LP | 155,800 | | 7,923,988 |
| | 762,850,730 |
TOTAL ENERGY | | 875,175,999 |
FINANCIALS - 21.2% |
Capital Markets - 3.9% |
Aberdeen Asset Management PLC | 243,300 | | 2,014,463 |
Apollo Investment Corp. | 1,896,163 | | 16,079,462 |
Ashmore Group PLC | 3,084,342 | | 20,496,462 |
BlackRock, Inc. Class A | 52,357 | | 16,569,420 |
Carlyle Group LP | 215,500 | | 7,676,110 |
Charles Schwab Corp. | 1,117,300 | | 29,049,800 |
Common Stocks - continued |
| Shares | | Value |
FINANCIALS - continued |
Capital Markets - continued |
Greenhill & Co., Inc. | 185,003 | | $ 10,719,074 |
Invesco Ltd. | 267,400 | | 9,733,360 |
KKR & Co. LP | 2,188,157 | | 53,259,741 |
Morgan Stanley | 956,575 | | 29,998,192 |
The Blackstone Group LP | 1,788,326 | | 56,332,269 |
| | 251,928,353 |
Commercial Banks - 5.5% |
CIT Group, Inc. | 180,538 | | 9,411,446 |
Comerica, Inc. | 331,820 | | 15,774,723 |
M&T Bank Corp. (h) | 341,091 | | 39,709,814 |
PNC Financial Services Group, Inc. | 176,200 | | 13,669,596 |
Standard Chartered PLC (United Kingdom) | 904,693 | | 20,374,519 |
U.S. Bancorp | 1,463,138 | | 59,110,775 |
Wells Fargo & Co. (h) | 4,405,586 | | 200,013,604 |
| | 358,064,477 |
Diversified Financial Services - 4.9% |
JPMorgan Chase & Co. | 4,555,040 | | 266,378,735 |
KKR Financial Holdings LLC | 4,013,060 | | 48,919,201 |
| | 315,297,936 |
Insurance - 4.7% |
ACE Ltd. | 526,611 | | 54,520,037 |
AFLAC, Inc. | 209,149 | | 13,971,153 |
Brasil Insurance Participacoes e Administracao SA | 338,500 | | 2,642,036 |
esure Group PLC | 1,874,500 | | 7,753,987 |
Fidelity National Financial, Inc. Class A | 46,200 | | 1,499,190 |
MetLife, Inc. | 2,824,531 | | 152,298,712 |
MetLife, Inc. unit | 309,915 | | 9,759,223 |
Prudential Financial, Inc. | 296,662 | | 27,358,170 |
Validus Holdings Ltd. | 858,447 | | 34,586,830 |
| | 304,389,338 |
Real Estate Investment Trusts - 2.0% |
American Capital Agency Corp. | 1,454,548 | | 28,058,231 |
Annaly Capital Management, Inc. | 2,356,009 | | 23,489,410 |
Coresite Realty Corp. | 168,047 | | 5,409,433 |
First Potomac Realty Trust | 1,025,993 | | 11,932,299 |
Home Properties, Inc. | 372,672 | | 19,982,673 |
Rayonier, Inc. | 249,081 | | 10,486,310 |
Retail Properties America, Inc. | 1,038,232 | | 13,206,311 |
Two Harbors Investment Corp. | 1,464,834 | | 13,593,660 |
Ventas, Inc. | 109,690 | | 6,283,043 |
| | 132,441,370 |
Real Estate Management & Development - 0.1% |
Beazer Pre-Owned Rental Homes, Inc. (a)(k) | 257,800 | | 5,413,800 |
|
| Shares | | Value |
Thrifts & Mortgage Finance - 0.1% |
Radian Group, Inc. | 301,008 | | $ 4,250,233 |
TOTAL FINANCIALS | | 1,371,785,507 |
HEALTH CARE - 11.2% |
Biotechnology - 0.5% |
Amgen, Inc. | 308,900 | | 35,264,024 |
Health Care Equipment & Supplies - 0.7% |
Baxter International, Inc. | 166,600 | | 11,587,030 |
Covidien PLC | 282,500 | | 19,238,250 |
Hologic, Inc. (a) | 84,800 | | 1,895,280 |
St. Jude Medical, Inc. | 230,561 | | 14,283,254 |
| | 47,003,814 |
Health Care Providers & Services - 1.6% |
Aetna, Inc. | 358,305 | | 24,576,140 |
Quest Diagnostics, Inc. | 249,482 | | 13,357,266 |
UnitedHealth Group, Inc. | 465,423 | | 35,046,352 |
WellPoint, Inc. | 306,360 | | 28,304,600 |
| | 101,284,358 |
Health Care Technology - 0.1% |
Quality Systems, Inc. | 298,853 | | 6,293,844 |
Pharmaceuticals - 8.3% |
AbbVie, Inc. | 314,624 | | 16,615,293 |
Actavis PLC (a) | 154,653 | | 25,981,704 |
Astellas Pharma, Inc. | 206,600 | | 12,248,661 |
AstraZeneca PLC sponsored ADR | 1,050,300 | | 62,356,311 |
Eli Lilly & Co. (h) | 574,977 | | 29,323,827 |
Johnson & Johnson | 1,316,268 | | 120,556,986 |
Merck & Co., Inc. | 2,790,960 | | 139,687,548 |
Pfizer, Inc. | 2,465,912 | | 75,530,885 |
Sanofi SA | 186,368 | | 19,903,159 |
Teva Pharmaceutical Industries Ltd. sponsored ADR | 840,322 | | 33,680,106 |
| | 535,884,480 |
TOTAL HEALTH CARE | | 725,730,520 |
INDUSTRIALS - 10.0% |
Aerospace & Defense - 1.1% |
United Technologies Corp. | 645,976 | | 73,512,069 |
Air Freight & Logistics - 2.1% |
C.H. Robinson Worldwide, Inc. | 645,416 | | 37,653,569 |
United Parcel Service, Inc. Class B | 954,645 | | 100,314,097 |
| | 137,967,666 |
Commercial Services & Supplies - 1.1% |
Intrum Justitia AB | 659,308 | | 18,451,214 |
Republic Services, Inc. | 1,651,826 | | 54,840,623 |
| | 73,291,837 |
Electrical Equipment - 0.6% |
Eaton Corp. PLC | 138,200 | | 10,519,784 |
Common Stocks - continued |
| Shares | | Value |
INDUSTRIALS - continued |
Electrical Equipment - continued |
Emerson Electric Co. | 197,603 | | $ 13,867,779 |
Hubbell, Inc. Class B | 124,100 | | 13,514,490 |
| | 37,902,053 |
Industrial Conglomerates - 2.7% |
General Electric Co. | 6,290,176 | | 176,313,633 |
Machinery - 1.6% |
Cummins, Inc. (h) | 190,300 | | 26,826,591 |
Douglas Dynamics, Inc. | 587,191 | | 9,876,553 |
Harsco Corp. | 502,809 | | 14,093,736 |
Stanley Black & Decker, Inc. | 593,906 | | 47,922,275 |
Stanley Black & Decker, Inc. unit (a) | 13,400 | | 1,382,880 |
| | 100,102,035 |
Professional Services - 0.5% |
Acacia Research Corp. | 505,926 | | 7,356,164 |
Michael Page International PLC | 2,755,399 | | 22,266,478 |
| | 29,622,642 |
Road & Rail - 0.3% |
Union Pacific Corp. | 113,977 | | 19,148,136 |
TOTAL INDUSTRIALS | | 647,860,071 |
INFORMATION TECHNOLOGY - 11.3% |
Communications Equipment - 2.3% |
Cisco Systems, Inc. | 6,683,452 | | 150,043,497 |
Computers & Peripherals - 0.9% |
Apple, Inc. | 97,496 | | 54,705,981 |
EMC Corp. | 193,864 | | 4,875,680 |
| | 59,581,661 |
Electronic Equipment & Components - 0.2% |
TE Connectivity Ltd. | 232,090 | | 12,790,480 |
IT Services - 4.3% |
Accenture PLC Class A | 538,971 | | 44,314,196 |
IBM Corp. | 551,563 | | 103,456,672 |
Paychex, Inc. | 2,812,986 | | 128,075,253 |
| | 275,846,121 |
Office Electronics - 0.0% |
Xerox Corp. | 117,700 | | 1,432,409 |
Semiconductors & Semiconductor Equipment - 1.8% |
Applied Materials, Inc. | 2,427,200 | | 42,937,168 |
Broadcom Corp. Class A | 1,660,160 | | 49,223,744 |
KLA-Tencor Corp. | 170,591 | | 10,996,296 |
Siliconware Precision Industries Co. Ltd. sponsored ADR | 2,523,619 | | 15,091,242 |
| | 118,248,450 |
Software - 1.8% |
CA Technologies, Inc. | 465,919 | | 15,678,174 |
Microsoft Corp. | 2,599,503 | | 97,299,397 |
| | 112,977,571 |
TOTAL INFORMATION TECHNOLOGY | | 730,920,189 |
|
| Shares | | Value |
MATERIALS - 0.9% |
Chemicals - 0.4% |
RPM International, Inc. | 475,052 | | $ 19,719,409 |
Sociedad Quimica y Minera de Chile SA (PN-B) sponsored ADR (e) | 240,803 | | 6,231,982 |
Tronox Ltd. Class A | 125,500 | | 2,895,285 |
| | 28,846,676 |
Metals & Mining - 0.5% |
Commercial Metals Co. | 731,327 | | 14,867,878 |
Freeport-McMoRan Copper & Gold, Inc. | 416,394 | | 15,714,710 |
| | 30,582,588 |
TOTAL MATERIALS | | 59,429,264 |
TELECOMMUNICATION SERVICES - 4.0% |
Diversified Telecommunication Services - 3.0% |
AT&T, Inc. | 1,894,159 | | 66,598,630 |
CenturyLink, Inc. | 1,114,725 | | 35,503,991 |
Verizon Communications, Inc. | 1,796,900 | | 88,299,666 |
| | 190,402,287 |
Wireless Telecommunication Services - 1.0% |
Vodafone Group PLC | 16,451,698 | | 64,773,521 |
TOTAL TELECOMMUNICATION SERVICES | | 255,175,808 |
UTILITIES - 3.7% |
Electric Utilities - 3.2% |
American Electric Power Co., Inc. | 349,172 | | 16,320,299 |
FirstEnergy Corp. | 565,359 | | 18,645,540 |
Hawaiian Electric Industries, Inc. (e) | 563,987 | | 14,697,501 |
NextEra Energy, Inc. | 377,921 | | 32,357,596 |
Northeast Utilities | 375,355 | | 15,911,298 |
PPL Corp. | 1,296,647 | | 39,016,108 |
Southern Co. | 1,347,177 | | 55,382,446 |
Xcel Energy, Inc. | 545,889 | | 15,252,139 |
| | 207,582,927 |
Multi-Utilities - 0.5% |
CenterPoint Energy, Inc. | 86,821 | | 2,012,511 |
Sempra Energy | 327,109 | | 29,361,304 |
| | 31,373,815 |
TOTAL UTILITIES | | 238,956,742 |
TOTAL COMMON STOCKS (Cost $4,513,509,884) |
5,999,003,729
|
Preferred Stocks - 1.7% |
| Shares | | Value |
Convertible Preferred Stocks - 1.1% |
FINANCIALS - 0.1% |
Real Estate Investment Trusts - 0.1% |
Weyerhaeuser Co. Series A, 6.375% | 111,500 | | $ 6,204,975 |
HEALTH CARE - 0.1% |
Health Care Equipment & Supplies - 0.1% |
Alere, Inc. 3.00% | 29,880 | | 8,554,644 |
INDUSTRIALS - 0.2% |
Aerospace & Defense - 0.2% |
United Technologies Corp. 7.50% | 179,400 | | 11,745,318 |
TELECOMMUNICATION SERVICES - 0.1% |
Wireless Telecommunication Services - 0.1% |
Crown Castle International Corp. Series A, 4.50% (a) | 93,900 | | 9,387,183 |
UTILITIES - 0.6% |
Electric Utilities - 0.2% |
NextEra Energy, Inc.: | | | |
5.889% | 90,807 | | 5,135,136 |
Series E, 5.599% | 158,600 | | 9,132,188 |
| | 14,267,324 |
Multi-Utilities - 0.4% |
CenterPoint Energy, Inc. 2.00% ZENS | 188,700 | | 9,884,106 |
Dominion Resources, Inc.: | | | |
Series A, 6.125% | 112,300 | | 6,077,676 |
Series B, 6.00% | 112,400 | | 6,093,204 |
| | 22,054,986 |
TOTAL UTILITIES | | 36,322,310 |
TOTAL CONVERTIBLE PREFERRED STOCKS | | 72,214,430 |
Nonconvertible Preferred Stocks - 0.6% |
CONSUMER DISCRETIONARY - 0.2% |
Automobiles - 0.2% |
Volkswagen AG | 46,518 | | 13,064,541 |
FINANCIALS - 0.4% |
Consumer Finance - 0.4% |
Ally Financial, Inc.: | | | |
7.00% (f) | 22,163 | | 21,165,665 |
Series A, 8.50% | 121,466 | | 3,261,362 |
| | 24,427,027 |
TOTAL NONCONVERTIBLE PREFERRED STOCKS | | 37,491,568 |
TOTAL PREFERRED STOCKS (Cost $96,029,323) |
109,705,998
|
Corporate Bonds - 3.1% |
| Principal
Amount (d) | | Value |
Convertible Bonds - 3.0% |
CONSUMER DISCRETIONARY - 0.2% |
Automobiles - 0.2% |
Volkswagen International Finance NV 5.5% 11/9/15 (f) | EUR | 6,400,000 | | $ 10,932,523 |
ENERGY - 0.6% |
Oil, Gas & Consumable Fuels - 0.6% |
Alpha Natural Resources, Inc. 3.75% 12/15/17 | | 12,370,000 | | 12,788,106 |
Amyris, Inc. 3% 2/27/17 | | 1,383,000 | | 1,308,429 |
BPZ Energy, Inc. 8.5% 10/1/17 | | 2,410,000 | | 2,132,850 |
Chesapeake Energy Corp. 2.5% 5/15/37 | | 8,660,000 | | 8,803,756 |
Cobalt International Energy, Inc. 2.625% 12/1/19 | | 3,520,000 | | 3,115,200 |
Ship Finance International Ltd. 3.25% 2/1/18 | | 9,290,000 | | 9,684,825 |
| | 37,833,166 |
FINANCIALS - 0.4% |
Insurance - 0.2% |
Fidelity National Financial, Inc. 4.25% 8/15/18 | | 8,210,000 | | 13,382,300 |
Thrifts & Mortgage Finance - 0.2% |
MGIC Investment Corp. 9% 4/1/63 (f) | | 10,438,000 | | 11,946,291 |
TOTAL FINANCIALS | | 25,328,591 |
HEALTH CARE - 0.9% |
Biotechnology - 0.1% |
Theravance, Inc. 2.125% 1/15/23 | | 4,670,000 | | 6,748,150 |
Health Care Equipment & Supplies - 0.2% |
Teleflex, Inc. 3.875% 8/1/17 | | 7,650,000 | | 12,107,655 |
Health Care Providers & Services - 0.6% |
HealthSouth Corp. 2% 12/1/43 | | 13,908,000 | | 14,656,250 |
WellPoint, Inc. 2.75% 10/15/42 | | 17,660,000 | | 23,907,225 |
| | 38,563,475 |
TOTAL HEALTH CARE | | 57,419,280 |
INDUSTRIALS - 0.3% |
Commercial Services & Supplies - 0.1% |
Covanta Holding Corp. 3.25% 6/1/14 | | 5,860,000 | | 6,856,200 |
Construction & Engineering - 0.2% |
Layne Christensen Co. 4.25% 11/15/18 (f) | | 3,060,000 | | 3,075,300 |
Corporate Bonds - continued |
| Principal
Amount (d) | | Value |
Convertible Bonds - continued |
INDUSTRIALS - continued |
Construction & Engineering - continued |
MasTec, Inc.: | | | | |
4% 6/15/14 | | $ 4,000,000 | | $ 8,320,000 |
4.25% 12/15/14 | | 550,000 | | 1,179,063 |
| | 12,574,363 |
TOTAL INDUSTRIALS | | 19,430,563 |
INFORMATION TECHNOLOGY - 0.6% |
Communications Equipment - 0.2% |
InterDigital, Inc. 2.5% 3/15/16 | | 12,210,000 | | 12,423,675 |
Liberty Interactive LLC 0.75% 3/30/43 (f) | | 2,100,000 | | 2,604,105 |
| | 15,027,780 |
Semiconductors & Semiconductor Equipment - 0.3% |
GT Advanced Technologies, Inc. 3% 10/1/17 | | 13,190,000 | | 18,078,544 |
Software - 0.1% |
TiVo, Inc. 4% 3/15/16 (f) | | 5,210,000 | | 7,092,894 |
TOTAL INFORMATION TECHNOLOGY | | 40,199,218 |
MATERIALS - 0.0% |
Chemicals - 0.0% |
RPM International, Inc. 2.25% 12/15/20 | | 1,500,000 | | 1,660,313 |
TOTAL CONVERTIBLE BONDS | | 192,803,654 |
Nonconvertible Bonds - 0.1% |
FINANCIALS - 0.0% |
Diversified Financial Services - 0.0% |
ILFC E-Capital Trust I 5.46% 12/21/65 (f)(i) | | 540,000 | | 494,100 |
|
| Principal
Amount (d) | | Value |
MATERIALS - 0.1% |
Metals & Mining - 0.1% |
Boart Longyear Management Pty Ltd. 7% 4/1/21 (f) | | $ 3,700,000 | | $ 2,765,750 |
JMC Steel Group, Inc. 8.25% 3/15/18 (f) | | 50,000 | | 50,500 |
Walter Energy, Inc. 8.5% 4/15/21 | | 5,250,000 | | 4,370,625 |
| | 7,186,875 |
TOTAL NONCONVERTIBLE BONDS | | 7,680,975 |
TOTAL CORPORATE BONDS (Cost $173,393,536) |
200,484,629
|
Preferred Securities - 0.1% |
| | | |
FINANCIALS - 0.1% |
Diversified Financial Services - 0.1% |
Baggot Securities Ltd. 10.24% (f)(g) (Cost $3,931,922) | 2,560,000 | | 4,016,327 |
Money Market Funds - 2.8% |
| Shares | | |
Fidelity Cash Central Fund, 0.11% (b) | 177,023,094 | | 177,023,094 |
Fidelity Securities Lending Cash Central Fund, 0.11% (b)(c) | 5,737,500 | | 5,737,500 |
TOTAL MONEY MARKET FUNDS (Cost $182,760,594) |
182,760,594
|
TOTAL INVESTMENT PORTFOLIO - 100.6% (Cost $4,969,625,259) | | 6,495,971,277 |
NET OTHER ASSETS (LIABILITIES) - (0.6)% | | (37,459,566) |
NET ASSETS - 100% | $ 6,458,511,711 |
Written Options |
| Expiration
Date/Exercise
Price | | Number of
Contracts | | Premium | | Value |
Call Options |
Comcast Corp. Class A | 1/18/14 -
$49.00 | | 3,668 | | $ 398,968 | | $ (1,155,420) |
Cummins, Inc. | 1/18/14 -
$140.00 | | 476 | | 72,542 | | (129,710) |
Eli Lilly & Co. | 1/18/14 -
$52.50 | | 2,875 | | 112,412 | | (44,563) |
M&T Bank Corp. | 1/18/14 -
$115.00 | | 845 | | 166,803 | | (217,588) |
Staples, Inc. | 1/18/14 -
$17.00 | | 2,135 | | 69,174 | | (10,675) |
Well Fargo & Co. | 1/18/14 -
$44.00 | | 21,691 | | 1,047,459 | | (3,579,014) |
TOTAL WRITTEN OPTIONS | | $ 1,867,358 | | $ (5,136,970) |
Currency Abbreviations |
EUR | - | European Monetary Unit |
Legend |
(a) Non-income producing |
(b) Affiliated fund that is generally available only to investment companies and other accounts managed by Fidelity Investments. The rate quoted is the annualized seven-day yield of the fund at period end. A complete unaudited listing of the fund's holdings as of its most recent quarter end is available upon request. In addition, each Fidelity Central Fund's financial statements, which are not covered by the Fund's Report of Independent Registered Public Accounting Firm, are available on the SEC's website or upon request. |
(c) Investment made with cash collateral received from securities on loan. |
(d) Amount is stated in United States dollars unless otherwise noted. |
(e) Security or a portion of the security is on loan at period end. |
(f) Security exempt from registration under Rule 144A of the Securities Act of 1933. These securities may be resold in transactions exempt from registration, normally to qualified institutional buyers. At the end of the period, the value of these securities amounted to $64,143,455 or 1.0% of net assets. |
(g) Security is perpetual in nature with no stated maturity date. |
(h) Security or a portion of the security is pledged as collateral for call options written. At period end, the value of securities pledged amounted to $152,140,579. |
(i) Coupon rates for floating and adjustable rate securities reflect the rates in effect at period end. |
(j) Investment is owned by an entity that is treated as a corporation for U.S. tax purposes and is owned by the Fund. |
(k) Restricted securities - Investment in securities not registered under the Securities Act of 1933 (excluding 144A issues). At the end of the period, the value of restricted securities (excluding 144A issues) amounted to $28,763,904 or 0.4% of net assets. |
Additional information on each restricted holding is as follows: |
Security | Acquisition Date | Acquisition Cost |
Beazer Pre-Owned Rental Homes, Inc. | 5/3/12 - 10/23/12 | $ 5,156,000 |
New Academy Holding Co. LLC unit | 8/1/11 | $ 13,406,880 |
Affiliated Central Funds |
Information regarding fiscal year to date income earned by the Fund from investments in Fidelity Central Funds is as follows: |
Fund | Income earned |
Fidelity Cash Central Fund | $ 266,191 |
Fidelity Securities Lending Cash Central Fund | 977,799 |
Total | $ 1,243,990 |
Other Information |
The following is a summary of the inputs used, as of December 31, 2013, involving the Fund's assets and liabilities carried at fair value. The inputs or methodology used for valuing securities may not be an indication of the risk associated with investing in those securities. For more information on valuation inputs, and their aggregation into the levels used in the tables below, please refer to the Investment Valuation section in the accompanying Notes to Financial Statements. |
Valuation Inputs at Reporting Date: |
Description | Total | Level 1 | Level 2 | Level 3 |
Investments in Securities: | | | | |
Equities: | | | | |
Consumer Discretionary | $ 503,756,109 | $ 477,593,787 | $ 2,812,218 | $ 23,350,104 |
Consumer Staples | 603,278,061 | 603,278,061 | - | - |
Energy | 875,175,999 | 875,175,999 | - | - |
Financials | 1,402,417,509 | 1,357,231,810 | 39,771,899 | 5,413,800 |
Health Care | 734,285,164 | 702,133,344 | 32,151,820 | - |
Industrials | 659,605,389 | 659,605,389 | - | - |
Information Technology | 730,920,189 | 730,920,189 | - | - |
Materials | 59,429,264 | 59,429,264 | - | - |
Telecommunication Services | 264,562,991 | 190,402,287 | 74,160,704 | - |
Utilities | 275,279,052 | 251,127,622 | 24,151,430 | - |
Corporate Bonds | 200,484,629 | - | 200,484,629 | - |
Preferred Securities | 4,016,327 | - | 4,016,327 | - |
Money Market Funds | 182,760,594 | 182,760,594 | - | - |
Total Investments in Securities: | $ 6,495,971,277 | $ 6,089,658,346 | $ 377,549,027 | $ 28,763,904 |
Derivative Instruments: | | | | |
Liabilities | | | | |
Written Options | $ (5,136,970) | $ (5,136,970) | $ - | $ - |
The following is a summary of transfers between Level 1 and Level 2 for the period ended December 31, 2013. Transfers are assumed to have occurred at the beginning of the period, and are primarily attributable to the valuation techniques used for foreign equity securities, as discussed in the accompanying Notes to Financial Statements: |
Transfers | Total |
Level 1 to Level 2 | $ 7,582,185 |
Level 2 to Level 1 | $ 70,127,828 |
Value of Derivative Instruments |
The following table is a summary of the Fund's value of derivative instruments by primary risk exposure as of December 31, 2013. For additional information on derivative instruments, please refer to the Derivative Instruments section in the accompanying Notes to Financial Statements. |
Primary Risk Exposure /
Derivative Type | Value |
| Asset | Liability |
Equity Risk | | |
Written Options (a) | $ - | $ (5,136,970) |
Total Value of Derivatives | $ - | $ (5,136,970) |
(a) Gross value is presented in the Statement of Assets and Liabilities in the written options, at value line-item. |
Distribution of investments by country or territory of incorporation, as a percentage of total net assets, is as follows (Unaudited): |
United States of America | 87.8% |
United Kingdom | 4.6% |
Ireland | 1.7% |
Canada | 1.2% |
Switzerland | 1.1% |
Bermuda | 1.0% |
Others (Individually Less Than 1%) | 2.6% |
| 100.0% |
See accompanying notes which are an integral part of the financial statements.
Annual Report
Statement of Assets and Liabilities
| December 31, 2013 |
| | |
Assets | | |
Investment in securities, at value (including securities loaned of $5,556,830) - See accompanying schedule: Unaffiliated issuers (cost $4,786,864,665) | $ 6,313,210,683 | |
Fidelity Central Funds (cost $182,760,594) | 182,760,594 | |
Total Investments (cost $4,969,625,259) | | $ 6,495,971,277 |
Cash | | 614,311 |
Receivable for investments sold | | 13,287,124 |
Receivable for fund shares sold | | 2,071,839 |
Dividends receivable | | 10,872,039 |
Interest receivable | | 1,581,529 |
Distributions receivable from Fidelity Central Funds | | 24,388 |
Prepaid expenses | | 15,583 |
Other receivables | | 314,170 |
Total assets | | 6,524,752,260 |
| | |
Liabilities | | |
Payable for investments purchased | $ 46,313,941 | |
Payable for fund shares redeemed | 5,349,185 | |
Accrued management fee | 2,386,342 | |
Distribution and service plan fees payable | 393,585 | |
Written options, at value (premium received $1,867,358) | 5,136,970 | |
Other affiliated payables | 470,567 | |
Other payables and accrued expenses | 452,459 | |
Collateral on securities loaned, at value | 5,737,500 | |
Total liabilities | | 66,240,549 |
| | |
Net Assets | | $ 6,458,511,711 |
Net Assets consist of: | | |
Paid in capital | | $ 4,946,469,899 |
Distributions in excess of net investment income | | (72,000) |
Accumulated undistributed net realized gain (loss) on investments and foreign currency transactions | | (11,038,434) |
Net unrealized appreciation (depreciation) on investments and assets and liabilities in foreign currencies | | 1,523,152,246 |
Net Assets | | $ 6,458,511,711 |
Statement of Assets and Liabilities - continued
| December 31, 2013 |
| | |
Initial Class:
Net Asset Value, offering price and redemption price per share ($3,947,727,657 ÷ 169,497,923 shares) | | $ 23.29 |
| | |
Service Class:
Net Asset Value, offering price and redemption price per share ($391,895,679 ÷ 16,890,227 shares) | | $ 23.20 |
| | |
Service Class 2:
Net Asset Value, offering price and redemption price per share ($1,755,769,154 ÷ 76,740,063 shares) | | $ 22.88 |
| | |
Service Class 2R:
Net Asset Value, offering price and redemption price per share ($11,979,811 ÷ 526,873 shares) | | $ 22.74 |
| | |
Investor Class:
Net Asset Value, offering price and redemption price per share ($351,139,410 ÷ 15,128,261 shares) | | $ 23.21 |
See accompanying notes which are an integral part of the financial statements.
Annual Report
Financial Statements - continued
Statement of Operations
| Year ended December 31, 2013 |
| | |
Investment Income | | |
Dividends | | $ 173,396,541 |
Interest | | 7,797,673 |
Income from Fidelity Central Funds | | 1,243,990 |
Total income | | 182,438,204 |
| | |
Expenses | | |
Management fee | $ 27,811,092 | |
Transfer agent fees | 4,481,786 | |
Distribution and service plan fees | 4,613,549 | |
Accounting and security lending fees | 1,137,350 | |
Custodian fees and expenses | 106,206 | |
Independent trustees' compensation | 33,128 | |
Appreciation in deferred trustee compensation account | 482 | |
Audit | 88,697 | |
Legal | 22,919 | |
Miscellaneous | 54,366 | |
Total expenses before reductions | 38,349,575 | |
Expense reductions | (420,027) | 37,929,548 |
Net investment income (loss) | | 144,508,656 |
Realized and Unrealized Gain (Loss) Net realized gain (loss) on: | | |
Investment securities: | | |
Unaffiliated issuers | 424,202,903 | |
Foreign currency transactions | (125,453) | |
Written options | 2,748,674 | |
Total net realized gain (loss) | | 426,826,124 |
Change in net unrealized appreciation (depreciation) on: Investment securities | 933,618,681 | |
Assets and liabilities in foreign currencies | 54,684 | |
Written options | (3,269,612) | |
Total change in net unrealized appreciation (depreciation) | | 930,403,753 |
Net gain (loss) | | 1,357,229,877 |
Net increase (decrease) in net assets resulting from operations | | $ 1,501,738,533 |
Statement of Changes in Net Assets
| Year ended
December 31,
2013 | Year ended
December 31,
2012 |
Increase (Decrease) in Net Assets | | |
Operations | | |
Net investment income (loss) | $ 144,508,656 | $ 160,196,451 |
Net realized gain (loss) | 426,826,124 | 225,861,427 |
Change in net unrealized appreciation (depreciation) | 930,403,753 | 499,587,896 |
Net increase (decrease) in net assets resulting from operations | 1,501,738,533 | 885,645,774 |
Distributions to shareholders from net investment income | (147,533,373) | (160,836,253) |
Distributions to shareholders from net realized gain | (403,959,921) | (361,842,958) |
Total distributions | (551,493,294) | (522,679,211) |
Share transactions - net increase (decrease) | (90,118,096) | (98,030,068) |
Redemption fees | 144 | 2,080 |
Total increase (decrease) in net assets | 860,127,287 | 264,938,575 |
| | |
Net Assets | | |
Beginning of period | 5,598,384,424 | 5,333,445,849 |
End of period (including distributions in excess of net investment income of $72,000 and distributions in excess of net investment income of $131,517, respectively) | $ 6,458,511,711 | $ 5,598,384,424 |
See accompanying notes which are an integral part of the financial statements.
Annual Report
Financial Highlights - Initial Class
Years ended December 31, | 2013 | 2012 | 2011 | 2010 | 2009 |
Selected Per-Share Data | | | | | |
Net asset value, beginning of period | $ 19.94 | $ 18.69 | $ 19.02 | $ 16.81 | $ 13.18 |
Income from Investment Operations | | | | | |
Net investment income (loss) C | .56 | .59 | .48 | .30 | .33 |
Net realized and unrealized gain (loss) | 4.96 | 2.59 | (.31) | 2.24 | 3.64 |
Total from investment operations | 5.52 | 3.18 | .17 | 2.54 | 3.97 |
Distributions from net investment income | (.60) | (.63) F | (.50) | (.33) | (.34) |
Distributions from net realized gain | (1.57) | (1.30) F | - | - | - |
Total distributions | (2.17) | (1.93) | (.50) | (.33) | (.34) |
Redemption fees added to paid in capital C, H | - | - | - | - | - |
Net asset value, end of period | $ 23.29 | $ 19.94 | $ 18.69 | $ 19.02 | $ 16.81 |
Total Return A, B | 28.15% | 17.31% | .97% | 15.15% | 30.21% |
Ratios to Average Net Assets D, G | | | | | |
Expenses before reductions | .55% | .55% | .56% | .56% | .58% |
Expenses net of fee waivers, if any | .54% | .55% | .55% | .55% | .58% |
Expenses net of all reductions | .54% | .54% | .54% | .55% | .58% |
Net investment income (loss) | 2.43% | 2.94% | 2.48% | 1.71% | 2.29% |
Supplemental Data | | | | | |
Net assets, end of period (000 omitted) | $ 3,947,728 | $ 3,461,083 | $ 3,345,762 | $ 3,798,310 | $ 3,771,733 |
Portfolio turnover rate E | 32% | 48% | 96% | 29% | 29% |
A Total returns do not reflect charges attributable to your insurance company's separate account. Inclusion of these charges would reduce the total returns shown.
B Total returns would have been lower if certain expenses had not been reduced during the applicable periods shown.
C Calculated based on average shares outstanding during the period.
D Fees and expenses of any underlying Fidelity Central Funds are not included in the Fund's expense ratio. The Fund indirectly bears its proportionate share of the expenses of any underlying Fidelity Central Funds.
E Amount does not include the portfolio activity of any underlying Fidelity Central Funds.
F The amounts shown reflect certain reclassifications related to book to tax differences that were made in the year shown.
G Expense ratios reflect operating expenses of the class. Expenses before reductions do not reflect amounts reimbursed by the investment adviser or reductions from brokerage service arrangements or reductions from other expense offset arrangements and do not represent the amount paid by the class during periods when reimbursements or reductions occur. Expenses net of fee waivers reflect expenses after reimbursement by the investment adviser but prior to reductions from brokerage service arrangements or other expense offset arrangements. Expenses net of all reductions represent the net expenses paid by the class.
H Amount represents less than $.01 per share.
Financial Highlights - Service Class
Years ended December 31, | 2013 | 2012 | 2011 | 2010 | 2009 |
Selected Per-Share Data | | | | | |
Net asset value, beginning of period | $ 19.87 | $ 18.63 | $ 18.96 | $ 16.75 | $ 13.14 |
Income from Investment Operations | | | | | |
Net investment income (loss) C | .53 | .57 | .46 | .28 | .31 |
Net realized and unrealized gain (loss) | 4.94 | 2.57 | (.31) | 2.24 | 3.63 |
Total from investment operations | 5.47 | 3.14 | .15 | 2.52 | 3.94 |
Distributions from net investment income | (.57) | (.60) F | (.48) | (.31) | (.33) |
Distributions from net realized gain | (1.57) | (1.30) F | - | - | - |
Total distributions | (2.14) | (1.90) | (.48) | (.31) | (.33) |
Redemption fees added to paid in capital C, H | - | - | - | - | - |
Net asset value, end of period | $ 23.20 | $ 19.87 | $ 18.63 | $ 18.96 | $ 16.75 |
Total Return A, B | 28.01% | 17.19% | .86% | 15.09% | 30.03% |
Ratios to Average Net Assets D, G | | | | | |
Expenses before reductions | .65% | .65% | .66% | .66% | .68% |
Expenses net of fee waivers, if any | .64% | .65% | .66% | .65% | .68% |
Expenses net of all reductions | .64% | .64% | .64% | .65% | .68% |
Net investment income (loss) | 2.33% | 2.84% | 2.38% | 1.61% | 2.19% |
Supplemental Data | | | | | |
Net assets, end of period (000 omitted) | $ 391,896 | $ 350,493 | $ 347,999 | $ 414,431 | $ 430,383 |
Portfolio turnover rate E | 32% | 48% | 96% | 29% | 29% |
A Total returns do not reflect charges attributable to your insurance company's separate account. Inclusion of these charges would reduce the total returns shown.
B Total returns would have been lower if certain expenses had not been reduced during the applicable periods shown.
C Calculated based on average shares outstanding during the period.
D Fees and expenses of any underlying Fidelity Central Funds are not included in the Fund's expense ratio. The Fund indirectly bears its proportionate share of the expenses of any underlying Fidelity Central Funds.
E Amount does not include the portfolio activity of any underlying Fidelity Central Funds.
F The amounts shown reflect certain reclassifications related to book to tax differences that were made in the year shown.
G Expense ratios reflect operating expenses of the class. Expenses before reductions do not reflect amounts reimbursed by the investment adviser or reductions from brokerage service arrangements or reductions from other expense offset arrangements and do not represent the amount paid by the class during periods when reimbursements or reductions occur. Expenses net of fee waivers reflect expenses after reimbursement by the investment adviser but prior to reductions from brokerage service arrangements or other expense offset arrangements. Expenses net of all reductions represent the net expenses paid by the class.
H Amount represents less than $.01 per share.
See accompanying notes which are an integral part of the financial statements.
Annual Report
Financial Highlights - Service Class 2
Years ended December 31, | 2013 | 2012 | 2011 | 2010 | 2009 |
Selected Per-Share Data | | | | | |
Net asset value, beginning of period | $ 19.62 | $ 18.41 | $ 18.75 | $ 16.57 | $ 13.00 |
Income from Investment Operations | | | | | |
Net investment income (loss) C | .49 | .53 | .42 | .25 | .29 |
Net realized and unrealized gain (loss) | 4.88 | 2.55 | (.31) | 2.21 | 3.58 |
Total from investment operations | 5.37 | 3.08 | .11 | 2.46 | 3.87 |
Distributions from net investment income | (.54) | (.57) F | (.45) | (.28) | (.30) |
Distributions from net realized gain | (1.57) | (1.30) F | - | - | - |
Total distributions | (2.11) | (1.87) | (.45) | (.28) | (.30) |
Redemption fees added to paid in capital C, H | - | - | - | - | - |
Net asset value, end of period | $ 22.88 | $ 19.62 | $ 18.41 | $ 18.75 | $ 16.57 |
Total Return A, B | 27.83% | 17.05% | .66% | 14.92% | 29.88% |
Ratios to Average Net Assets D, G | | | | | |
Expenses before reductions | .80% | .80% | .81% | .81% | .83% |
Expenses net of fee waivers, if any | .79% | .80% | .81% | .80% | .83% |
Expenses net of all reductions | .79% | .79% | .80% | .80% | .83% |
Net investment income (loss) | 2.18% | 2.69% | 2.23% | 1.46% | 2.04% |
Supplemental Data | | | | | |
Net assets, end of period (000 omitted) | $ 1,755,769 | $ 1,560,856 | $ 1,457,230 | $ 1,619,356 | $ 1,558,421 |
Portfolio turnover rate E | 32% | 48% | 96% | 29% | 29% |
A Total returns do not reflect charges attributable to your insurance company's separate account. Inclusion of these charges would reduce the total returns shown.
B Total returns would have been lower if certain expenses had not been reduced during the applicable periods shown.
C Calculated based on average shares outstanding during the period.
D Fees and expenses of any underlying Fidelity Central Funds are not included in the Fund's expense ratio. The Fund indirectly bears its proportionate share of the expenses of any underlying Fidelity Central Funds.
E Amount does not include the portfolio activity of any underlying Fidelity Central Funds.
F The amounts shown reflect certain reclassifications related to book to tax differences that were made in the year shown.
G Expense ratios reflect operating expenses of the class. Expenses before reductions do not reflect amounts reimbursed by the investment adviser or reductions from brokerage service arrangements or reductions from other expense offset arrangements and do not represent the amount paid by the class during periods when reimbursements or reductions occur. Expenses net of fee waivers reflect expenses after reimbursement by the investment adviser but prior to reductions from brokerage service arrangements or other expense offset arrangements. Expenses net of all reductions represent the net expenses paid by the class.
H Amount represents less than $.01 per share.
Financial Highlights - Service Class 2R
Years ended December 31, | 2013 | 2012 | 2011 | 2010 | 2009 |
Selected Per-Share Data | | | | | |
Net asset value, beginning of period | $ 19.53 | $ 18.34 | $ 18.66 | $ 16.49 | $ 12.93 |
Income from Investment Operations | | | | | |
Net investment income (loss) C | .49 | .53 | .42 | .25 | .28 |
Net realized and unrealized gain (loss) | 4.84 | 2.54 | (.30) | 2.20 | 3.58 |
Total from investment operations | 5.33 | 3.07 | .12 | 2.45 | 3.86 |
Distributions from net investment income | (.55) | (.58) F | (.44) | (.28) | (.30) |
Distributions from net realized gain | (1.57) | (1.30) F | - | - | - |
Total distributions | (2.12) | (1.88) | (.44) | (.28) | (.30) |
Redemption fees added to paid in capital C, H | - | - | - | - | - |
Net asset value, end of period | $ 22.74 | $ 19.53 | $ 18.34 | $ 18.66 | $ 16.49 |
Total Return A, B | 27.79% | 17.05% | .70% | 14.90% | 29.95% |
Ratios to Average Net Assets D, G | | | | | |
Expenses before reductions | .79% | .80% | .81% | .81% | .83% |
Expenses net of fee waivers, if any | .79% | .80% | .80% | .80% | .83% |
Expenses net of all reductions | .79% | .79% | .79% | .80% | .83% |
Net investment income (loss) | 2.19% | 2.69% | 2.23% | 1.46% | 2.04% |
Supplemental Data | | | | | |
Net assets, end of period (000 omitted) | $ 11,980 | $ 5,640 | $ 3,956 | $ 5,405 | $ 5,259 |
Portfolio turnover rate E | 32% | 48% | 96% | 29% | 29% |
A Total returns do not reflect charges attributable to your insurance company's separate account. Inclusion of these charges would reduce the total returns shown.
B Total returns would have been lower if certain expenses had not been reduced during the applicable periods shown.
C Calculated based on average shares outstanding during the period.
D Fees and expenses of any underlying Fidelity Central Funds are not included in the Fund's expense ratio. The Fund indirectly bears its proportionate share of the expenses of any underlying Fidelity Central Funds.
E Amount does not include the portfolio activity of any underlying Fidelity Central Funds.
F The amounts shown reflect certain reclassifications related to book to tax differences that were made in the year shown.
G Expense ratios reflect operating expenses of the class. Expenses before reductions do not reflect amounts reimbursed by the investment adviser or reductions from brokerage service arrangements or reductions from other expense offset arrangements and do not represent the amount paid by the class during periods when reimbursements or reductions occur. Expenses net of fee waivers reflect expenses after reimbursement by the investment adviser but prior to reductions from brokerage service arrangements or other expense offset arrangements. Expenses net of all reductions represent the net expenses paid by the class.
H Amount represents less than $.01 per share.
See accompanying notes which are an integral part of the financial statements.
Annual Report
Financial Highlights - Investor Class
Years ended December 31, | 2013 | 2012 | 2011 | 2010 | 2009 |
Selected Per-Share Data | | | | | |
Net asset value, beginning of period | $ 19.89 | $ 18.64 | $ 18.97 | $ 16.77 | $ 13.15 |
Income from Investment Operations | | | | | |
Net investment income (loss) C | .54 | .57 | .46 | .28 | .31 |
Net realized and unrealized gain (loss) | 4.93 | 2.59 | (.31) | 2.23 | 3.64 |
Total from investment operations | 5.47 | 3.16 | .15 | 2.51 | 3.95 |
Distributions from net investment income | (.58) | (.61) F | (.48) | (.31) | (.33) |
Distributions from net realized gain | (1.57) | (1.30) F | - | - | - |
Total distributions | (2.15) | (1.91) | (.48) | (.31) | (.33) |
Redemption fees added to paid in capital C, H | - | - | - | - | - |
Net asset value, end of period | $ 23.21 | $ 19.89 | $ 18.64 | $ 18.97 | $ 16.77 |
Total Return A, B | 27.99% | 17.27% | .89% | 15.04% | 30.09% |
Ratios to Average Net Assets D, G | | | | | |
Expenses before reductions | .63% | .64% | .64% | .65% | .68% |
Expenses net of fee waivers, if any | .62% | .64% | .64% | .64% | .68% |
Expenses net of all reductions | .62% | .63% | .63% | .64% | .68% |
Net investment income (loss) | 2.35% | 2.85% | 2.39% | 1.62% | 2.19% |
Supplemental Data | | | | | |
Net assets, end of period (000 omitted) | $ 351,139 | $ 220,311 | $ 178,499 | $ 165,946 | $ 147,358 |
Portfolio turnover rate E | 32% | 48% | 96% | 29% | 29% |
A Total returns do not reflect charges attributable to your insurance company's separate account. Inclusion of these charges would reduce the total returns shown.
B Total returns would have been lower if certain expenses had not been reduced during the applicable periods shown.
C Calculated based on average shares outstanding during the period.
D Fees and expenses of any underlying Fidelity Central Funds are not included in the Fund's expense ratio. The Fund indirectly bears its proportionate share of the expenses of any underlying Fidelity Central Funds.
E Amount does not include the portfolio activity of any underlying Fidelity Central Funds.
F The amounts shown reflect certain reclassifications related to book to tax differences that were made in the year shown.
G Expense ratios reflect operating expenses of the class. Expenses before reductions do not reflect amounts reimbursed by the investment adviser or reductions from brokerage service arrangements or reductions from other expense offset arrangements and do not represent the amount paid by the class during periods when reimbursements or reductions occur. Expenses net of fee waivers reflect expenses after reimbursement by the investment adviser but prior to reductions from brokerage service arrangements or other expense offset arrangements. Expenses net of all reductions represent the net expenses paid by the class.
H Amount represents less than $.01 per share.
See accompanying notes which are an integral part of the financial statements.
Annual Report
Notes to Financial Statements
For the period ended December 31, 2013
1. Organization.
VIP Equity-Income Portfolio (the Fund) is a fund of Variable Insurance Products Fund (the Trust) and is authorized to issue an unlimited number of shares. The Trust is registered under the Investment Company Act of 1940, as amended (the 1940 Act), as an open-end management investment company organized as a Massachusetts business trust. Shares of the Fund may only be purchased by insurance companies for the purpose of funding variable annuity or variable life insurance contracts. The Fund offers the following classes of shares: Initial Class shares, Service Class shares, Service Class 2 shares, Service Class 2R shares and Investor Class shares. All classes have equal rights and voting privileges, except for matters affecting a single class.
2. Investments in Fidelity Central Funds.
The Fund invests in Fidelity Central Funds, which are open-end investment companies generally available only to other investment companies and accounts managed by the investment adviser and its affiliates. The Fund's Schedule of Investments lists each of the Fidelity Central Funds held as of period end, if any, as an investment of the Fund, but does not include the underlying holdings of each Fidelity Central Fund. As an Investing Fund, the Fund indirectly bears its proportionate share of the expenses of the underlying Fidelity Central Funds.
The Money Market Central Funds seek preservation of capital and current income and are managed by Fidelity Investments Money Management, Inc. (FIMM), an affiliate of the investment adviser. Annualized expenses of the Money Market Central Funds as of their most recent shareholder report date are less than .01%.
A complete unaudited list of holdings for each Fidelity Central Fund is available upon request or at the Securities and Exchange Commission (the SEC) website at www.sec.gov. In addition, the financial statements of the Fidelity Central Funds, which are not covered by the Fund's Report of Independent Registered Public Accounting Firm, are available on the SEC website or upon request.
3. Significant Accounting Policies.
The financial statements have been prepared in conformity with accounting principles generally accepted in the United States of America (GAAP), which require management to make certain estimates and assumptions at the date of the financial statements. Actual results could differ from those estimates. Subsequent events, if any, through the date that the financial statements were issued have been evaluated in the preparation of the financial statements. The following summarizes the significant accounting policies of the Fund:
Investment Valuation. Investments are valued as of 4:00 p.m. Eastern time on the last calendar day of the period. In accordance with valuation policies and procedures approved by the Board of Trustees (the Board), the Fund attempts to obtain prices from one or more third party pricing vendors or brokers to value its investments. When current market prices, quotations or currency exchange rates are not readily available or reliable, investments will be fair valued in good faith by the Fidelity Management & Research Company (FMR) Fair Value Committee (the Committee), in accordance with procedures adopted by the Board. Factors used in determining fair value vary by investment type and may include market or investment specific events, changes in interest rates and credit quality. The frequency with which these procedures are used cannot be predicted and they may be utilized to a significant extent. The Committee oversees the Fund's valuation policies and procedures and is responsible for approving and reporting to the Board all fair value determinations.
The Fund categorizes the inputs to valuation techniques used to value its investments into a disclosure hierarchy consisting of three levels as shown below:
Level 1 - quoted prices in active markets for identical investments
Level 2 - other significant observable inputs (including quoted prices for similar investments, interest rates, prepayment speeds, etc.)
Level 3 - unobservable inputs (including the Fund's own assumptions based on the best information available)
Valuation techniques used to value the Fund's investments by major category are as follows:
Equity securities, including restricted securities, for which market quotations are readily available, are valued at the last reported sale price or official closing price as reported by a third party pricing vendor on the primary market or exchange on which they are traded and are categorized as Level 1 in the hierarchy. In the event there were no sales during the day or closing prices are not available, securities are valued at the last quoted bid price or may be valued using the last available price and are generally categorized as Level 2 in the hierarchy. For foreign equity securities, when market or security specific events arise, comparisons to the valuation of American Depositary Receipts (ADRs), futures contracts, Exchange-Traded Funds (ETFs) and certain indexes as well as quoted prices for similar securities may be used and would be categorized as Level 2 in the hierarchy. Utilizing these techniques may result in transfers between Level 1 and Level 2. For equity securities, including restricted securities, where observable inputs are limited, assumptions about market activity and risk are used and these securities may be categorized as Level 3 in the hierarchy.
Annual Report
3. Significant Accounting Policies - continued
Investment Valuation - continued
Debt securities, including restricted securities, are valued based on evaluated prices received from third party pricing vendors or from brokers who make markets in such securities. Corporate bonds and preferred securities are valued by pricing vendors who utilize matrix pricing which considers yield or price of bonds of comparable quality, coupon, maturity and type or by broker-supplied prices. When independent prices are unavailable or unreliable, debt securities may be valued utilizing pricing methodologies which consider similar factors that would be used by third party pricing vendors. Debt securities are generally categorized as Level 2 in the hierarchy but may be Level 3 depending on the circumstances.
Exchange-traded options are valued using the last sale price or, in the absence of a sale, the last offering price and are categorized as Level 1 in the hierarchy. Investments in open-end mutual funds, including the Fidelity Central Funds, are valued at their closing net asset value (NAV) each business day and are categorized as Level 1 in the hierarchy.
Changes in valuation techniques may result in transfers in or out of an assigned level within the disclosure hierarchy. The aggregate value of investments by input level, as of December 31, 2013, including information on transfers between Levels 1 and 2, is included at the end of the Fund's Schedule of Investments.
Foreign Currency. The Fund may use foreign currency contracts to facilitate transactions in foreign-denominated securities. Gains and losses from these transactions may arise from changes in the value of the foreign currency or if the counterparties do not perform under the contracts' terms.
Foreign-denominated assets, including investment securities, and liabilities are translated into U.S. dollars at the exchange rates at period end. Purchases and sales of investment securities, income and dividends received and expenses denominated in foreign currencies are translated into U.S. dollars at the exchange rate in effect on the transaction date.
The effects of exchange rate fluctuations on investments are included with the net realized and unrealized gain (loss) on investment securities. Other foreign currency transactions resulting in realized and unrealized gain (loss) are disclosed separately.
Investment Transactions and Income. For financial reporting purposes, the Fund's investment holdings and NAV include trades executed through the end of the last business day of the period. The NAV per share for processing shareholder transactions is calculated as of the close of business of the New York Stock Exchange (NYSE), normally 4:00 p.m. Eastern time and includes trades executed through the end of the prior business day. Gains and losses on securities sold are determined on the basis of identified cost and may include proceeds received from litigation. Dividend income is recorded on the ex-dividend date, except for certain dividends from foreign securities where the ex-dividend date may have passed, which are recorded as soon as the Fund is informed of the ex-dividend date. Non-cash dividends included in dividend income, if any, are recorded at the fair market value of the securities received. Distributions received on securities that represent a return of capital or capital gain are recorded as a reduction of cost of investments and/or as a realized gain. Subsequent to ex-dividend date the Fund determines the components of these distributions, based upon receipt of tax filings or other correspondence relating to the underlying investment. Interest income and distributions from the Fidelity Central Funds are accrued as earned. Interest income includes coupon interest and amortization of premium and accretion of discount on debt securities. Investment income is recorded net of foreign taxes withheld where recovery of such taxes is uncertain.
Class Allocations and Expenses. Investment income, realized and unrealized capital gains and losses, common expenses of the Fund, and certain fund-level expense reductions, if any, are allocated daily on a pro-rata basis to each class based on the relative net assets of each class to the total net assets of the Fund. Each class differs with respect to transfer agent and distribution and service plan fees incurred. Certain expense reductions may also differ by class. For the reporting period, the allocated portion of income and expenses to each class as a percent of its average net assets may vary due to the timing of recording these transactions in relation to fluctuating net assets of the classes. Expenses directly attributable to a fund are charged to that fund. Expenses attributable to more than one fund are allocated among the respective funds on the basis of relative net assets or other appropriate methods. Expense estimates are accrued in the period to which they relate and adjustments are made when actual amounts are known.
Deferred Trustee Compensation. Under a Deferred Compensation Plan (the Plan), independent Trustees may elect to defer receipt of a portion of their annual compensation. Deferred amounts are invested in a cross-section of Fidelity funds, are marked-to-market and remain in the Fund until distributed in accordance with the Plan. The investment of deferred amounts and the offsetting payable to the Trustees are included in the accompanying Statement of Assets and Liabilities.
Income Tax Information and Distributions to Shareholders. Each year, the Fund intends to qualify as a regulated investment company under Subchapter M of the Internal Revenue Code, including distributing substantially all of its taxable income and realized gains. As a result, no provision for U.S. Federal income taxes is required. As of December 31, 2013, the Fund did not have any unrecognized tax benefits in the financial statements; nor is the Fund aware of any tax positions for which it is reasonably possible that the total amounts of unrecognized tax benefits will significantly change in the next twelve months. The Fund files a U.S. federal tax return, in addition to state and local tax returns as required. The Fund's federal income tax returns are subject to examination by the Internal Revenue Service (IRS) for a period of three fiscal years after they are filed. State and local tax
Annual Report
Notes to Financial Statements - continued
3. Significant Accounting Policies - continued
Income Tax Information and Distributions to Shareholders - continued
returns may be subject to examination for an additional fiscal year depending on the jurisdiction. Foreign taxes are provided for based on the Fund's understanding of the tax rules and rates that exist in the foreign markets in which it invests.
Distributions are declared and recorded on the ex-dividend date. Income dividends and capital gain distributions are declared separately for each class. Income and capital gain distributions are determined in accordance with income tax regulations, which may differ from GAAP.
Capital accounts within the financial statements are adjusted for permanent book-tax differences. These adjustments have no impact on net assets or the results of operations. Capital accounts are not adjusted for temporary book-tax differences which will reverse in a subsequent period.
Book-tax differences are primarily due to foreign currency transactions, market discount, contingent interest, partnerships, deferred trustees compensation, equity-debt classifications and losses deferred due to wash sales and excise tax regulations.
The federal tax cost of investment securities and unrealized appreciation (depreciation) as of period end were as follows:
Gross unrealized appreciation | $ 1,712,776,208 |
Gross unrealized depreciation | (219,402,686) |
Net unrealized appreciation (depreciation) on securities and other investments | $ 1,493,373,522 |
| |
Tax Cost | $ 5,002,597,755 |
The tax-based components of distributable earnings as of period end were as follows:
Undistributed ordinary income | $ 8,759,639 |
Undistributed long-term capital gain | $ 13,764,500 |
Net unrealized appreciation (depreciation) | $ 1,490,179,750 |
| December 31, 2013 | December 31, 2012 |
Ordinary Income | $ 279,000,432 | $ 250,126,867 |
Long-term Capital Gains | 272,492,862 | 272,552,344 |
Total | $ 551,493,294 | $ 522,679,211 |
Trading (Redemption) Fees. Service Class 2R shares held by investors less than 60 days may be subject to a redemption fee equal to 1% of the NAV of shares redeemed. All redemption fees, which reduce the proceeds of the shareholder redemption, are retained by the Fund and accounted for as an addition to paid in capital.
Restricted Securities. The Fund may invest in securities that are subject to legal or contractual restrictions on resale. These securities generally may be resold in transactions exempt from registration or to the public if the securities are registered. Disposal of these securities may involve time-consuming negotiations and expense, and prompt sale at an acceptable price may be difficult. Information regarding restricted securities is included at the end of the Fund's Schedule of Investments.
4. Derivative Instruments.
Risk Exposures and the Use of Derivative Instruments. The Fund's investment objective allows the Fund to enter into various types of derivative contracts, including options. Derivatives are investments whose value is primarily derived from underlying assets, indices or reference rates and may be transacted on an exchange or over-the-counter (OTC). Derivatives may involve a future commitment to buy or sell a specified asset based on specified terms, to exchange future cash flows at periodic intervals based on a notional principal amount, or for one party to make one or more payments upon the occurrence of specified events in exchange for periodic payments from the other party.
The Fund used derivatives to increase returns and to manage exposure to certain risks as defined below. The success of any strategy involving derivatives depends on analysis of numerous economic factors, and if the strategies for investment do not work as intended, the Fund may not achieve its objectives.
Annual Report
4. Derivative Instruments - continued
Risk Exposures and the Use of Derivative Instruments - continued
The Fund's use of derivatives increased or decreased its exposure to the following risk:
Equity Risk | Equity risk relates to the fluctuations in the value of financial instruments as a result of changes in market prices (other than those arising from interest rate risk or foreign exchange risk), whether caused by factors specific to an individual investment, its issuer, or all factors affecting all instruments traded in a market or market segment. |
The Fund is also exposed to additional risks from investing in derivatives, such as liquidity risk and counterparty credit risk. Liquidity risk is the risk that the Fund will be unable to close out the derivative in the open market in a timely manner. Counterparty credit risk is the risk that the counterparty will not be able to fulfill its obligation to the Fund. Counterparty credit risk related to exchange-traded options may be mitigated by the protection provided by the exchange on which they trade.
Investing in derivatives may involve greater risks than investing in the underlying assets directly and, to varying degrees, may involve risk of loss in excess of any initial investment and collateral received and amounts recognized in the Statement of Assets and Liabilities. In addition, there may be the risk that the change in value of the derivative contract does not correspond to the change in value of the underlying instrument.
Options. Options give the purchaser the right, but not the obligation, to buy (call) or sell (put) an underlying security or financial instrument at an agreed exercise or strike price between or on certain dates. Options obligate the seller (writer) to buy (put) or sell (call) an underlying instrument at the exercise or strike price or cash settle an underlying derivative instrument if the holder exercises the option on or before the expiration date.
The Fund used exchange-traded written covered call options to manage its exposure to the market. When the Fund writes a covered call option, the Fund holds the underlying instrument which must be delivered to the holder upon the exercise of the option.
Upon entering into a written options contract, the Fund will receive a premium. Premiums received are reflected as a liability on the Statement of Assets and Liabilities. Options are valued daily and any unrealized appreciation (depreciation) is reflected on the Statement of Assets and Liabilities. When a written option is exercised, the premium is added to the proceeds from the sale of the underlying instrument in determining the gain or loss realized on that investment. When an option is closed the Fund will realize a gain or loss depending on whether the proceeds or amount paid for the closing sale transaction are greater or less than the premium received. When an option expires, gains and losses are realized to the extent of premiums received. The net realized gain (loss) on closed and expired written options and the change in net unrealized appreciation (depreciation) on written options are reflected separately on the Statement of Operations.
Writing call options tends to decrease exposure to the underlying instrument and risk of loss is the change in value in excess of the premium received.
Any open options at period end are presented in the Schedule of Investments under the caption "Written Options" and are representative of volume of activity during the period.
During the period, the Fund recognized net realized gain (loss) of $2,748,674 and a change in net unrealized appreciation (depreciation) of $(3,269,612) related to its investment in written options. This amount is included in the Statement of Operations.
The following is a summary of the Fund's written options activity:
Written Options | Number of
Contracts | Amount of
Premiums |
Outstanding at beginning of period | - | $ - |
Options Opened | 112,703 | 7,533,155 |
Options Exercised | (36,096) | (2,608,708) |
Options Closed | (33,513) | (1,720,362) |
Options Expired | (11,404) | (1,336,727) |
Outstanding at end of period | 31,690 | $ 1,867,358 |
5. Purchases and Sales of Investments.
Purchases and sales of securities, other than short-term securities, aggregated $1,848,843,213 and $2,393,269,140, respectively.
6. Fees and Other Transactions with Affiliates.
Management Fee. Fidelity Management & Research Company (the investment adviser) and its affiliates provide the Fund with investment management related services for which the Fund pays a monthly management fee. The management fee is the sum of an individual fund fee rate that is based on an annual rate of .20% of the Fund's average net assets and an annualized group fee rate that averaged .25% during the period. The group fee rate is based upon the average net assets of all the mutual funds advised by the investment adviser, including any mutual funds previously advised by the
Annual Report
Notes to Financial Statements - continued
6. Fees and Other Transactions with Affiliates - continued
Management Fee - continued
investment adviser that are currently advised by Fidelity SelectCo, LLC, an affiliate of the investment adviser. The group fee rate decreases as assets under management increase and increases as assets under management decrease. For the reporting period, the total annual management fee rate was .45% of the Fund's average net assets.
Distribution and Service Plan Fees. In accordance with Rule 12b-1 of the 1940 Act, the Fund has adopted separate 12b-1 Plans for each Service Class of shares. Each Service Class pays Fidelity Distributors Corporation (FDC), an affiliate of the investment adviser, a service fee. For the period, the service fee is based on an annual rate of .10% of Service Class' average net assets and .25% of Service Class 2's and Service Class 2R's average net assets.
For the period, total fees, all of which were re-allowed to insurance companies for the distribution of shares and providing shareholder support services were as follows:
Service Class | $ 378,082 |
Service Class 2 | 4,213,523 |
Service Class 2 R | 21,944 |
| $ 4,613,549 |
Transfer Agent Fees. Fidelity Investments Institutional Operations Company, Inc. (FIIOC), an affiliate of the investment adviser, is the Fund's transfer, dividend disbursing, and shareholder servicing agent. FIIOC receives an asset-based fee with respect to each class. Each class (with the exception of Investor Class) pays a transfer agent fee, excluding out of pocket expenses, equal to an annual rate of .07% of average net assets. Investor Class pays a monthly asset-based transfer agent fee of .15% of average net assets. In addition, FIIOC receives an asset-based fee of .0035% of average net assets for typesetting, printing and mailing of shareholder reports, except proxy statements. FIIOC voluntarily agreed to reimburse or waive this fee for the period January 1, 2013 through December 31, 2013 (see Expense Reductions note). For the period, transfer agent fees for each class, including printing and out of pocket expenses, were as follows:
Initial Class | $ 2,602,767 |
Service Class | 261,102 |
Service Class 2 | 1,165,791 |
Service Class 2R | 6,010 |
Investor Class | 446,116 |
| $ 4,481,786 |
Effective February 1, 2014, the Board of Trustees approved an amendment to the transfer agent fee agreement whereby each class (with the exception of Investor Class) pays a single fee of .07% of average net assets for transfer agent services, typesetting, printing and mailing of shareholder reports, excluding mailing of proxy statements and out of pocket expense. Investor Class pays a single fee of .15% of average net assets.
Accounting and Security Lending Fees. Fidelity Service Company, Inc. (FSC), an affiliate of the investment adviser, maintains the Fund's accounting records. The accounting fee is based on the level of average net assets for each month. Under a separate contract, FSC administers the security lending program. The security lending fee is based on the number and duration of lending transactions.
Brokerage Commissions. The Fund placed a portion of its portfolio transactions with brokerage firms which are affiliates of the investment adviser. Brokerage commissions are included in net realized gain (loss) and change in net unrealized appreciation (depreciation) in the Statement of Operations. The commissions paid to these affiliated firms were $38,613 for the period.
7. Committed Line of Credit.
The Fund participates with other funds managed by the investment adviser or an affiliate in a $4.25 billion credit facility (the "line of credit") to be utilized for temporary or emergency purposes to fund shareholder redemptions or for other short-term liquidity purposes. The Fund has agreed to pay commitment fees on its pro-rata portion of the line of credit, which amounted to $12,942 and is reflected in Miscellaneous expenses on the Statement of Operations. During the period, there were no borrowings on this line of credit.
8. Security Lending.
The Fund lends portfolio securities through a lending agent from time to time in order to earn additional income. For equity securities, a lending agent is used and may loan securities to certain qualified borrowers, including Fidelity Capital Markets (FCM), a broker-dealer affiliated with the Fund. On the settlement date of the loan, the Fund receives collateral (in the form of U.S. Treasury obligations, letters of credit and/or cash) against the loaned securities and maintains collateral in an amount not less than 100% of the market value of the loaned securities during the period of the loan. The
Annual Report
8. Security Lending - continued
market value of the loaned securities is determined at the close of business of the Fund and any additional required collateral is delivered to the Fund on the next business day. If the borrower defaults on its obligation to return the securities loaned because of insolvency or other reasons, the Fund may apply collateral received from the borrower against the obligation. The Fund may experience delays and costs in recovering the securities loaned. Any cash collateral received is invested in the Fidelity Securities Lending Cash Central Fund. The value of loaned securities and cash collateral at period end are disclosed on the Fund's Statement of Assets and Liabilities. At period end, there were no security loans outstanding with FCM. Security lending income represents the income earned on investing cash collateral, less rebates paid to borrowers and any lending agent fees associated with the loan, plus any premium payments received for lending certain types of securities. Security lending income is presented in the Statement of Operations as a component of income from Fidelity Central Funds. Total security lending income during the period amounted to $977,799, including $43,766 from securities loaned to FCM.
9. Expense Reductions.
The investment adviser or its affiliates agreed to reimburse or waive certain fees during the period as noted in the table below.
Initial Class | $ 147,762 |
Service Class | 14,824 |
Service Class 2 | 66,075 |
Service Class 2R | 345 |
Investor Class | 11,526 |
| $ 240,532 |
Commissions paid to certain brokers with whom the investment adviser, or its affiliates, places trades on behalf of the Fund include an amount in addition to trade execution, which may be rebated back to the Fund to offset certain expenses. This amount totaled $177,294 for the period. In addition, through arrangements with the Fund's custodian, credits realized as a result of uninvested cash balances were used to reduce the Fund's expenses. During the period, these credits reduced the Fund's custody expenses by $2,201.
10. Distributions to Shareholders.
Distributions to shareholders of each class were as follows:
Years ended December 31, | 2013 | 2012 |
From net investment income | | |
Initial Class | $ 92,568,520 | $ 101,791,140 |
Service Class | 8,840,014 | 9,989,279 |
Service Class 2 | 37,705,026 | 42,628,835 |
Service Class 2R | 258,073 | 156,403 |
Investor Class | 8,161,740 | 6,270,596 |
Total | $ 147,533,373 | $ 160,836,253 |
From net realized gain | | |
Initial Class | $ 245,504,561 | $ 222,187,565 |
Service Class | 24,485,710 | 22,886,320 |
Service Class 2 | 111,276,322 | 103,060,364 |
Service Class 2R | 724,327 | 339,927 |
Investor Class | 21,969,001 | 13,368,782 |
Total | $ 403,959,921 | $ 361,842,958 |
11. Share Transactions.
Transactions for each class of shares were as follows:
| Shares | Dollars |
Years ended December 31, | 2013 | 2012 | 2013 | 2012 |
Initial Class | | | | |
Shares sold | 5,939,757 | 3,870,932 | $ 136,791,018 | $ 77,988,279 |
Reinvestment of distributions | 15,117,940 | 16,250,583 | 338,073,081 | 323,978,705 |
Shares redeemed | (25,104,941) | (25,610,108) | (577,075,155) | (515,027,646) |
Net increase (decrease) | (4,047,244) | (5,488,593) | $ (102,211,056) | $ (113,060,662) |
Annual Report
Notes to Financial Statements - continued
11. Share Transactions - continued
| Shares | Dollars |
Years ended December 31, | 2013 | 2012 | 2013 | 2012 |
Service Class | | | | |
Shares sold | 522,521 | 779,349 | $ 11,868,622 | $ 15,549,373 |
Reinvestment of distributions | 1,495,670 | 1,655,419 | 33,325,724 | 32,875,599 |
Shares redeemed | (2,763,995) | (3,480,467) | (62,879,133) | (69,732,701) |
Net increase (decrease) | (745,804) | (1,045,699) | $ (17,684,787) | $ (21,307,729) |
Service Class 2 | | | | |
Shares sold | 5,862,575 | 9,943,946 | $ 132,392,944 | $ 192,585,015 |
Reinvestment of distributions | 6,780,471 | 7,428,210 | 148,981,348 | 145,689,199 |
Shares redeemed | (15,448,401) | (16,965,629) | (348,570,665) | (333,504,543) |
Net increase (decrease) | (2,805,355) | 406,527 | $ (67,196,373) | $ 4,769,671 |
Service Class 2R | | | | |
Shares sold | 253,817 | 121,840 | $ 5,683,428 | $ 2,390,089 |
Reinvestment of distributions | 44,961 | 25,375 | 982,400 | 496,330 |
Shares redeemed | (60,780) | (74,064) | (1,351,791) | (1,477,846) |
Net increase (decrease) | 237,998 | 73,151 | $ 5,314,037 | $ 1,408,573 |
Investor Class | | | | |
Shares sold | 3,800,857 | 1,569,001 | $ 86,969,508 | $ 31,601,024 |
Reinvestment of distributions | 1,351,634 | 986,760 | 30,130,741 | 19,639,378 |
Shares redeemed | (1,103,166) | (1,052,779) | (25,440,166) | (21,080,323) |
Net increase (decrease) | 4,049,325 | 1,502,982 | $ 91,660,083 | $ 30,160,079 |
12. Other.
The Fund's organizational documents provide former and current trustees and officers with a limited indemnification against liabilities arising in connection with the performance of their duties to the Fund. In the normal course of business, the Fund may also enter into contracts that provide general indemnifications. The Fund's maximum exposure under these arrangements is unknown as this would be dependent on future claims that may be made against the Fund. The risk of material loss from such claims is considered remote.
At the end of the period, the investment adviser or its affiliates were the owners of record of 13% of the total outstanding shares of the Fund and one otherwise unaffiliated shareholder was the owner of record of 18% of the total outstanding shares of the Fund.
Annual Report
Report of Independent Registered Public Accounting Firm
To the Trustees of Variable Insurance Products Fund and the Shareholders of VIP Equity-Income Portfolio:
In our opinion, the accompanying statement of assets and liabilities, including the schedule of investments, and the related statements of operations and of changes in net assets and the financial highlights present fairly, in all material respects, the financial position of VIP Equity-Income Portfolio (a fund of Variable Insurance Products Fund) at December 31, 2013, the results of its operations for the year then ended, the changes in its net assets for each of the two years in the period then ended and the financial highlights for each of the five years in the period then ended, in conformity with accounting principles generally accepted in the United States of America. These financial statements and financial highlights (hereafter referred to as "financial statements") are the responsibility of the VIP Equity-Income Portfolio's management. Our responsibility is to express an opinion on these financial statements based on our audits. We conducted our audits of these financial statements in accordance with the standards of the Public Company Accounting Oversight Board (United States). Those standards require that we plan and perform the audit to obtain reasonable assurance about whether the financial statements are free of material misstatement. An audit includes examining, on a test basis, evidence supporting the amounts and disclosures in the financial statements, assessing the accounting principles used and significant estimates made by management, and evaluating the overall financial statement presentation. We believe that our audits, which included confirmation of securities at December 31, 2013 by correspondence with the custodian and brokers, provide a reasonable basis for our opinion.
PricewaterhouseCoopers LLP
Boston, Massachusetts
February 14, 2014
Annual Report
The Trustees, Member of the Advisory Board, and officers of the trust and fund, as applicable, are listed below. The Board of Trustees governs the fund and is responsible for protecting the interests of shareholders. The Trustees are experienced executives who meet periodically throughout the year to oversee the fund's activities, review contractual arrangements with companies that provide services to the fund, oversee management of the risks associated with such activities and contractual arrangements, and review the fund's performance. Except for James C. Curvey, Ned C. Lautenbach, Ronald P. O'Hanley, and William S. Stavropoulos, each of the Trustees oversees 173 funds. Mr. Curvey oversees 396 funds. Mr. Lautenbach, Mr. O'Hanley, and Mr. Stavropoulos each oversees 247 funds.
The Trustees hold office without limit in time except that (a) any Trustee may resign; (b) any Trustee may be removed by written instrument, signed by at least two-thirds of the number of Trustees prior to such removal; (c) any Trustee who requests to be retired or who has become incapacitated by illness or injury may be retired by written instrument signed by a majority of the other Trustees; and (d) any Trustee may be removed at any special meeting of shareholders by a two-thirds vote of the outstanding voting securities of the trust. Each Trustee who is not an interested person (as defined in the 1940 Act) of the trust and the fund (Independent Trustee), shall retire not later than the last day of the calendar year in which his or her 75th birthday occurs. The Independent Trustees may waive this mandatory retirement age policy with respect to individual Trustees. The officers and Advisory Board Member hold office without limit in time, except that any officer and Advisory Board Member may resign or may be removed by a vote of a majority of the Trustees at any regular meeting or any special meeting of the Trustees. Except as indicated, each individual has held the office shown or other offices in the same company for the past five years.
Experience, Skills, Attributes, and Qualifications of the Fund's Trustees. The Governance and Nominating Committee has adopted a statement of policy that describes the experience, qualifications, attributes, and skills that are necessary and desirable for potential Independent Trustee candidates (Statement of Policy). The Board believes that each Trustee satisfied at the time he or she was initially elected or appointed a Trustee, and continues to satisfy, the standards contemplated by the Statement of Policy. The Governance and Nominating Committee also engages professional search firms to help identify potential Independent Trustee candidates who have the experience, qualifications, attributes, and skills consistent with the Statement of Policy. From time to time, additional criteria based on the composition and skills of the current Independent Trustees, as well as experience or skills that may be appropriate in light of future changes to board composition, business conditions, and regulatory or other developments, have also been considered by the professional search firms and the Governance and Nominating Committee. In addition, the Board takes into account the Trustees' commitment and participation in Board and committee meetings, as well as their leadership of standing and ad hoc committees throughout their tenure.
In determining that a particular Trustee was and continues to be qualified to serve as a Trustee, the Board has considered a variety of criteria, none of which, in isolation, was controlling. The Board believes that, collectively, the Trustees have balanced and diverse experience, qualifications, attributes, and skills, which allow the Board to operate effectively in governing the fund and protecting the interests of shareholders. Information about the specific experience, skills, attributes, and qualifications of each Trustee, which in each case led to the Board's conclusion that the Trustee should serve (or continue to serve) as a trustee of the fund, is provided below.
Board Structure and Oversight Function. James C. Curvey is an interested person (as defined in the 1940 Act) and currently serves as Chairman. The Trustees have determined that an interested Chairman is appropriate and benefits shareholders because an interested Chairman has a personal and professional stake in the quality and continuity of services provided to the funds. Independent Trustees exercise their informed business judgment to appoint an individual of their choosing to serve as Chairman, regardless of whether the Trustee happens to be independent or a member of management. The Independent Trustees have determined that they can act independently and effectively without having an Independent Trustee serve as Chairman and that a key structural component for assuring that they are in a position to do so is for the Independent Trustees to constitute a substantial majority for the Board. The Independent Trustees also regularly meet in executive session. Ned C. Lautenbach serves as Chairman of the Independent Trustees and as such (i) acts as a liaison between the Independent Trustees and management with respect to matters important to the Independent Trustees and (ii) with management prepares agendas for Board meetings.
Fidelity funds are overseen by different Boards of Trustees. The fund's Board oversees Fidelity's equity and high income funds and another Board oversees Fidelity's investment-grade bond, money market, and asset allocation funds. The asset allocation funds may invest in Fidelity funds overseen by the fund's Board. The use of separate Boards, each with its own committee structure, allows the Trustees of each group of Fidelity funds to focus on the unique issues of the funds they oversee, including common research, investment, and operational issues. On occasion, the separate Boards establish joint committees to address issues of overlapping consequences for the Fidelity funds overseen by each Board.
The Trustees operate using a system of committees to facilitate the timely and efficient consideration of all matters of importance to the Trustees, the fund, and fund shareholders and to facilitate compliance with legal and regulatory requirements and oversight of the fund's activities and associated risks. The Board, acting through its committees, has charged FMR and its affiliates with (i) identifying events or circumstances the occurrence of which could have demonstrably adverse effects on the fund's business and/or reputation; (ii) implementing processes and controls to lessen the possibility that such events or circumstances occur or to mitigate the effects of such events or circumstances if they do occur; and (iii) creating and maintaining a system designed to evaluate continuously business and market conditions in order to facilitate the identification and implementation processes described in (i) and (ii) above. Because the day-to-day operations and activities of the fund are carried out by or through FMR, its affiliates and other service providers, the fund's exposure to risks is mitigated but not eliminated by the processes overseen by the Trustees. While each of the Board's committees has responsibility for overseeing different aspects of the funds' activities, oversight is exercised primarily through the Operations, Audit, and Compliance Committees. In addition, the Independent Trustees have worked with FMR to enhance the Board's oversight of investment and financial risks, legal and regulatory risks, technology risks, and operational risks, including the development of additional risk reporting to the Board. For example, a working group comprised of Independent Trustees and FMR has worked and continues to work to review the Fidelity fund's valuation-related activities, reporting and risk management. Appropriate personnel, including but not limited to the fund's Chief Compliance Officer (CCO), FMR's internal auditor, the independent accountants, the fund's Treasurer and portfolio management personnel, make periodic reports to the Board's committees, as appropriate, including an annual review of FMR's risk management program for the Fidelity funds. The responsibilities of each standing committee, including their oversight responsibilities, are described further under "Standing Committees of the Fund's Trustees."
Annual Report
Trustees and Officers - continued
The fund's Statements of Additional Information (SAI) includes more information about the Trustees. To request a free copy, call Fidelity at 1-877-208-0098.
Interested Trustees*:
Correspondence intended for each Trustee who is an interested person may be sent to Fidelity Investments, 245 Summer Street, Boston, Massachusetts 02210.
Name, Year of Birth; Principal Occupations and Other Relevant Experience+ |
James C. Curvey (1935) |
Year of Election or Appointment: 2007 Trustee Chairman of the Board of Trustees |
| Mr. Curvey also serves as Trustee of other Fidelity funds. Mr. Curvey is a Director of Fidelity Investments Money Management, Inc. (2009-present), Director of Fidelity Research & Analysis Co. (2009-present) and Director of FMR and FMR Co., Inc. (2007-present). Mr. Curvey is also Vice Chairman (2007-present) and Director of FMR LLC. In addition, Mr. Curvey serves as an Overseer for the Boston Symphony Orchestra and a member of the Trustees of Villanova University. Previously, Mr. Curvey was the Vice Chairman (2006-2007) and Director (2000-2007) of FMR Corp. |
Ronald P. O'Hanley (1957) |
Year of Election or Appointment: 2011 Trustee |
| Mr. O'Hanley also serves as Trustee of other Fidelity funds. He is Director of Fidelity SelectCo, LLC (2013-present), FMR Co., Inc. (2010-present), Director of Fidelity Investments Money Management, Inc. (2010-present), Director of Fidelity Research & Analysis Company (2010-present), President of Fidelity Asset Management and Corporate Services and a Member of Fidelity's Executive Committee (2010-present). Previously, Mr. O'Hanley served as President and Chief Executive Officer of BNY Mellon Asset Management (2007-2010). Mr. O'Hanley also served as Vice Chairman of Bank New York Mellon Corp. and a member of that firm's Executive Committee. Prior to the 2007 merger of The Bank of New York and Mellon Financial Corporation, he was Vice Chairman of Mellon Financial Corporation and President and Chief Executive Officer of Mellon Asset Management. He joined Mellon in February 1997. Mr. O'Hanley currently serves as Chairman of the Boston Public Library Foundation Board of Directors and sits on the Board of Directors of Beth Israel Deaconess Medical Center, the Board of Trustees of the Marine Biological Laboratory and the Advisory Board of the Maxwell School of Citizenship and Public Administration at Syracuse University. Mr. O'Hanley also chairs the Council on Asset Management for the Financial Services Roundtable and is a member of the Board of Directors of Institutional Investor's U.S. Institute. |
* Trustees have been determined to be "Interested Trustees" by virtue of, among other things, their affiliation with the trust or various entities under common control with FMR.
+ The information above includes each Trustee's principal occupation during the last five years and other information relating to the experience, attributes, and skills relevant to each Trustee's qualifications to serve as a Trustee, which led to the conclusion that each Trustee should serve as a Trustee for the fund.
Annual Report
Independent Trustees:
Correspondence intended for each Independent Trustee (that is, the Trustees other than the Interested Trustees) may be sent to Fidelity Investments, P.O. Box 55235, Boston, Massachusetts 02205-5235.
Name, Year of Birth; Principal Occupations and Other Relevant Experience+ |
Dennis J. Dirks (1948) |
Year of Election or Appointment: 2005 Trustee |
| Mr. Dirks also serves as Trustee of other Fidelity funds. Prior to his retirement in May 2003, Mr. Dirks was Chief Operating Officer and a member of the Board of The Depository Trust & Clearing Corporation (DTCC). He also served as President, Chief Operating Officer, and Board member of The Depository Trust Company (DTC) and President and Board member of the National Securities Clearing Corporation (NSCC). In addition, Mr. Dirks served as Chief Executive Officer and Board member of the Government Securities Clearing Corporation, Chief Executive Officer and Board member of the Mortgage-Backed Securities Clearing Corporation, as a Trustee and a member of the Finance Committee of Manhattan College (2005-2008), and as a Trustee and a member of the Finance Committee of AHRC of Nassau County (2006-2008). Mr. Dirks is a member of the Independent Directors Council (IDC) Governing Council (2010-present) and Board of Directors for The Brookville Center for Children's Services, Inc. (2009-present). |
Alan J. Lacy (1953) |
Year of Election or Appointment: 2008 Trustee |
| Mr. Lacy also serves as Trustee of other Fidelity funds. Mr. Lacy serves as Senior Adviser (2007-present) of Oak Hill Capital Partners, L.P. (private equity). Mr. Lacy also served as Chief Executive Officer (2000-2005) and Vice Chairman (2005-2006) of Sears Holdings Corporation and Sears, Roebuck and Co. (retail). In addition, Mr. Lacy serves as a member of the Board of Directors of Dave & Buster's Entertainment, Inc. (restaurant and entertainment complexes, 2010-present), Earth Fare, Inc. (retail grocery, 2012-present), The Hillman Companies, Inc. (hardware wholesalers, 2010-present), and Bristol-Myers Squibb Company (global pharmaceuticals, 2008-present). Mr. Lacy is a member of the Board of Trustees of The National Parks Conservation Association (2006-present). Previously, Mr. Lacy served as Chairman of the Board of Trustees of the National Parks Conservation Association (2008-2011) and as a member of the Board of Directors for the Western Union Company (global money transfer, 2006-2011). |
Ned C. Lautenbach (1944) |
Year of Election or Appointment: 2000 Trustee Chairman of the Independent Trustees |
| Mr. Lautenbach also serves as Trustee of other Fidelity funds. Mr. Lautenbach currently serves as the Lead Director of the Eaton Corporation Board of Directors (diversified industrial, 1997-present). Mr. Lautenbach is Chairman of the Board of Directors of the Philharmonic Center for the Arts in Naples, Florida (2012-present) and a member of the Council on Foreign Relations (1994-present). Previously, Mr. Lautenbach was a Partner/Advisory Partner at Clayton, Dubilier & Rice, LLC (private equity investment, 1998-2010), as well as a Director of Sony Corporation (2006-2007). |
Joseph Mauriello (1944) |
Year of Election or Appointment: 2008 Trustee |
| Mr. Mauriello also serves as Trustee of other Fidelity funds. Prior to his retirement in January 2006, Mr. Mauriello served in numerous senior management positions including Deputy Chairman and Chief Operating Officer (2004-2005), and Vice Chairman of Financial Services (2002-2004) of KPMG LLP US (professional services, 1965-2005). Mr. Mauriello currently serves as a member of the Board of Directors of XL Group plc. (global insurance and re-insurance, 2006-present). Previously, Mr. Mauriello served as a Director of the Hamilton Funds of the Bank of New York (2006-2007) and of Arcadia Resources Inc. (health care services and products, 2007-2012). |
Robert W. Selander (1950) |
Year of Election or Appointment: 2011 Trustee |
| Mr. Selander also serves as Trustee of other Fidelity funds. Previously, Mr. Selander served as a Member of the Advisory Board of other Fidelity funds (2011), and Executive Vice Chairman (2010), Chief Executive Officer (2009-2010), and President and Chief Executive Officer (1997-2009) of Mastercard, Inc. |
Cornelia M. Small (1944) |
Year of Election or Appointment: 2005 Trustee |
| Ms. Small also serves as Trustee of other Fidelity funds. Ms. Small is a member of the Board of Directors (2009-present) and Chair of the Investment Committee (2010-present) of the Teagle Foundation. Ms. Small also serves on the Investment Committee of the Berkshire Taconic Community Foundation (2008-present). Previously, Ms. Small served as Chairperson (2002-2008) and a member of the Investment Committee and Chairperson (2008-2012) and a member of the Board of Trustees of Smith College. In addition, Ms. Small served as Chief Investment Officer, Director of Global Equity Investments, and a member of the Board of Directors of Scudder, Stevens & Clark and Scudder Kemper Investments. |
William S. Stavropoulos (1939) |
Year of Election or Appointment: 2001 Trustee Vice Chairman of the Independent Trustees |
| Mr. Stavropoulos also serves as Trustee of other Fidelity funds. Mr. Stavropoulos serves as President and Founder of the Michigan Baseball Foundation, the Great Lakes Loons (2007-present). Mr. Stavropoulos is Chairman Emeritus of the Board of Directors of The Dow Chemical Company, where he previously served in numerous senior management positions, including President, CEO (1995-2000; 2002-2004), Chairman of the Executive Committee (2000-2006), and as a member of the Board of Directors (1990-2006). Currently, Mr. Stavropoulos is Chairman of the Board of Directors of Univar Inc. (global distributor of commodity and specialty chemicals), a Director of Teradata Corporation (data warehousing and technology solutions), and Maersk Inc. (industrial conglomerate), and a member of the Advisory Board for Metalmark Capital LLC (private equity investment, 2005-present). Mr. Stavropoulos is an operating advisor to Clayton, Dubilier & Rice, LLC (private equity investment). In addition, Mr. Stavropoulos is a member of the University of Notre Dame Advisory Council for the College of Science, a Trustee of the Rollin L. Gerstacker Foundation, and a Director of the Naples Philharmonic Center for the Arts. Previously, Mr. Stavropoulos served as a Director of Chemical Financial Corporation (bank holding company, 1993-2012) and Tyco International, Ltd. (multinational manufacturing and services, 2007-2012). |
David M. Thomas (1949) |
Year of Election or Appointment: 2008 Trustee |
| Mr. Thomas also serves as Trustee of other Fidelity funds. Mr. Thomas serves as Non-Executive Chairman of the Board of Directors of Fortune Brands Home and Security (home and security products, 2011-present), and as a member of the Board of Directors of Interpublic Group of Companies, Inc. (marketing communication, 2004-present). Previously, Mr. Thomas served as Executive Chairman (2005-2006) and Chairman and Chief Executive Officer (2000-2005) of IMS Health, Inc. (pharmaceutical and healthcare information solutions), and a Director of Fortune Brands, Inc. (consumer products, 2000-2011). |
+ The information above includes each Trustee's principal occupation during the last five years and other information relating to the experience, attributes, and skills relevant to each Trustee's qualifications to serve as a Trustee, which led to the conclusion that each Trustee should serve as a Trustee for the fund.
Advisory Board Members and Officers:
Correspondence intended for each officer and Peter S. Lynch may be sent to Fidelity Investments, 245 Summer Street, Boston, Massachusetts 02210. Officers appear below in alphabetical order.
Name, Year of Birth; Principal Occupation |
Peter S. Lynch (1944) |
Year of Election or Appointment: 2003 Member of the Advisory Board |
| Mr. Lynch also serves as Member of the Advisory Board of other Fidelity funds. Mr. Lynch is Vice Chairman and a Director of FMR and FMR Co., Inc. In addition, Mr. Lynch serves as a Trustee of Boston College and as the Chairman of the Inner-City Scholarship Fund. Previously, Mr. Lynch served on the Special Olympics International Board of Directors (1997-2006). |
Elizabeth Paige Baumann (1968) |
Year of Election or Appointment: 2012 Anti-Money Laundering (AML) Officer |
| Ms. Baumann also serves as AML Officer of other funds. She is Chief AML Officer of FMR LLC (2012-present) and is an employee of Fidelity Investments. Previously, Ms. Baumann served as Vice President and Deputy Anti-Money Laundering Officer (2007-2012). |
William C. Coffey (1969) |
Year of Election or Appointment: 2009 Assistant Secretary |
| Mr. Coffey also serves as Assistant Secretary of other funds. He is Senior Vice President and Deputy General Counsel of FMR LLC (2010-present), and is an employee of Fidelity Investments. Previously, Mr. Coffey served as Vice President and Associate General Counsel of FMR LLC (2005-2009). |
Jonathan Davis (1968) |
Year of Election or Appointment: 2010 Assistant Treasurer |
| Mr. Davis also serves as Assistant Treasurer of other funds. Mr. Davis is an employee of Fidelity Investments. Previously, Mr. Davis served as Vice President and Associate General Counsel of FMR LLC (2003-2010). |
Adrien E. Deberghes (1967) |
Year of Election or Appointment: 2008 Deputy Treasurer |
| Mr. Deberghes also serves as an officer of other funds. He is an employee of Fidelity Investments (2008-present). Prior to joining Fidelity Investments, Mr. Deberghes was Senior Vice President of Mutual Fund Administration at State Street Corporation (2007-2008), Senior Director of Mutual Fund Administration at Investors Bank & Trust (2005-2007), and Director of Finance for Dunkin' Brands (2000-2005). |
Stephanie J. Dorsey (1969) |
Year of Election or Appointment: 2010 Assistant Treasurer |
| Ms. Dorsey also serves as an officer of other funds. She is an employee of Fidelity Investments (2008-present) and has served in other fund officer roles. Prior to joining Fidelity Investments, Ms. Dorsey served as Treasurer (2004-2008) of the JPMorgan Mutual Funds and Vice President (2004-2008) of JPMorgan Chase Bank. |
Scott C. Goebel (1968) |
Year of Election or Appointment: 2008 Secretary and Chief Legal Officer (CLO) |
| Mr. Goebel serves as Secretary and CLO of other funds. Mr. Goebel also serves as Secretary of Fidelity Investments Money Management, Inc. (FIMM) (2010-present) and Fidelity Research and Analysis Company (FRAC) (2010-present); General Counsel, Secretary, and Senior Vice President of FMR (2008-present) and FMR Co., Inc. (2008-present); Chief Legal Officer of Fidelity Management & Research (Hong Kong) Limited (2008-present) and Assistant Secretary of Fidelity Management & Research (Japan) Inc. (2008-present), and Fidelity Management & Research (U.K.) Inc. (2008-present). Previously, Mr. Goebel served as Secretary and CLO of other Fidelity funds (2008-2013), Assistant Secretary of FIMM (2008-2010), FRAC (2008-2010), and certain funds (2007-2008); and as Vice President and Secretary of Fidelity Distributors Corporation (FDC) (2005-2007). Mr. Goebel has been employed by FMR LLC or an affiliate since 2001. |
Joseph A. Hanlon (1968) |
Year of Election or Appointment: 2012 Chief Compliance Officer |
| Mr. Hanlon also serves as Chief Compliance Officer of other funds. Mr. Hanlon serves as Compliance Officer of FMR, FMR Co., Inc., Fidelity Investments Money Management, Inc. (FIMM), Fidelity Research and Analysis Company (FRAC), and Fidelity Management & Research (Hong Kong) (2009-present), as Senior Vice President of the Fidelity Asset Management Division (2009-present), and is an employee of Fidelity Investments. Previously, Mr. Hanlon served as Compliance Officer of Fidelity Management & Research (Japan) Inc. (2009-2013), Strategic Advisers, Inc. (2009-2013), and Fidelity Management & Research (U.K.) Inc. (2009-2013). |
Bruce T. Herring (1965) |
Year of Election or Appointment: 2006 Vice President of certain Equity Funds |
| Mr. Herring also serves as Vice President of other funds. He serves as Chief Investment Officer of Fidelity Global Asset Allocation (GAA) (2013-present), Group Chief Investment Officer of FMR, and President of Fidelity Research & Analysis Company (2010-present). Previously, Mr. Herring served as Chief Investment Officer and Director of Fidelity Management & Research (U.K.) Inc. (2010-2013), Vice President (2005-2006) and Senior Vice President (2006-2007) of Fidelity Management & Research Company, Vice President of FMR Co., Inc. (2001-2007), and as a portfolio manager for Fidelity U.S. Equity Funds. |
Brian B. Hogan (1964) |
Year of Election or Appointment: 2009 Vice President |
| Mr. Hogan also serves as Vice President of other funds. Mr. Hogan serves as President of FMR's Equity Division (2009-present). Previously, Mr. Hogan served as Senior Vice President, Equity Research of FMR (2006-2009) and as a portfolio manager. |
Chris Maher (1972) |
Year of Election or Appointment: 2013 Assistant Treasurer |
| Mr. Maher serves as Assistant Treasurer of other funds. Mr. Maher is Vice President of Valuation Oversight and is an employee of Fidelity Investments. Previously, Mr. Maher served as Vice President of Asset Management Compliance (2013), Vice President of FMR's Program Management Group (2010-2013), and Vice President of Valuation Oversight (2008-2010). |
Christine Reynolds (1958) |
Year of Election or Appointment: 2008 Chief Financial Officer |
| Ms. Reynolds also serves as Chief Financial Officer of other funds. Ms. Reynolds became President of Fidelity Pricing and Cash Management Services (FPCMS) in August 2008. Ms. Reynolds served as Chief Operating Officer of FPCMS (2007-2008). Previously, Ms. Reynolds served as President, Treasurer, and Anti-Money Laundering officer of the Fidelity funds (2004-2007). |
Kenneth B. Robins (1969) |
Year of Election or Appointment: 2008 President and Treasurer |
| Mr. Robins also serves as an officer of other funds. Mr. Robins serves as Executive Vice President of Fidelity Investments Money Management, Inc. (FIMM) (2013-present) and is an employee of Fidelity Investments (2004-present). Previously, Mr. Robins served in other fund officer roles. |
Gary W. Ryan (1958) |
Year of Election or Appointment: 2005 Assistant Treasurer |
| Mr. Ryan also serves as Assistant Treasurer of other funds. Mr. Ryan is an employee of Fidelity Investments and has served in other fund officer roles. Previously, Mr. Ryan served as Vice President of Fund Reporting in Fidelity Pricing and Cash Management Services (FPCMS) (1999-2005). |
Stephen Sadoski (1971) |
Year of Election or Appointment: 2012 Deputy Treasurer |
| Mr. Sadoski also serves as Deputy Treasurer of other funds. He is an employee of Fidelity Investments (2012-present) and has served in another fund officer role. Prior to joining Fidelity Investments, Mr. Sadoski served as an assistant chief accountant in the Division of Investment Management of the Securities and Exchange Commission (SEC) (2009-2012) and as a senior manager at Deloitte & Touche LLP (1997-2009). |
Stacie M. Smith (1974) |
Year of Election or Appointment: 2013 Deputy Treasurer |
| Ms. Smith also serves as an officer of other funds. She is an employee of Fidelity Investments (2009-present) and has served in other fund officer roles. Prior to joining Fidelity Investments, Ms. Smith served as Senior Audit Manager of Ernst & Young LLP (1996-2009). |
Renee Stagnone (1975) |
Year of Election or Appointment: 2013 Deputy Treasurer |
| Ms. Stagnone also serves as Deputy Treasurer of other funds. Ms. Stagnone is an employee of Fidelity Investments. |
Joseph F. Zambello (1957) |
Year of Election or Appointment: 2011 Deputy Treasurer |
| Mr. Zambello also serves as Deputy Treasurer of other funds. Mr. Zambello is an employee of Fidelity Investments. Previously, Mr. Zambello served as Vice President of FMR's Program Management Group (2009-2011) and Vice President of the Transfer Agent Oversight Group (2005-2009). |
Annual Report
The Board of Trustees of VIP Equity-Income Portfolio voted to pay to shareholders of record at the opening of business on record date, the following distributions per share derived from capital gains realized from sales of portfolio securities:
| Pay Date | Record Date | Capital Gains |
Service Class 2R | 02/07/2014 | 02/07/2014 | $0.083 |
The fund hereby designates as a capital gain dividend with respect to the taxable year ended December 31, 2013 $286,257,362, or, if subsequently determined to be different, the net capital gain of such year.
Service Class 2R designates 10% and 49% of the dividends distributed in February and December 2013 respectively, during the fiscal year as qualifying for the dividends-received deduction for corporate shareholders.
Annual Report
Board Approval of Investment Advisory Contracts and Management Fees
VIP Equity-Income Portfolio
Each year, the Board of Trustees, including the Independent Trustees (together, the Board), votes on the renewal of the management contract and sub-advisory agreements (together, the Advisory Contracts) for the fund. The Board, assisted by the advice of fund counsel and Independent Trustees' counsel, requests and considers a broad range of information relevant to the renewal of the Advisory Contracts throughout the year.
The Board meets regularly and, at each of its meetings, covers an extensive agenda of topics and materials and considers factors that are relevant to its annual consideration of the renewal of the fund's Advisory Contracts, including the services and support provided to the fund and its shareholders. The Board has established various standing committees, each composed of and chaired by Independent Trustees with varying backgrounds, to which the Board has assigned specific subject matter responsibilities in order to enhance effective decision-making by the Board. The Board, acting directly and through its Committees, requests and receives information concerning the annual consideration of the renewal of the fund's Advisory Contracts. The Board also meets as needed to consider matters specifically related to the Board's annual consideration of the renewal of Advisory Contracts. Members of the Board may also meet with trustees of other Fidelity funds through ad hoc joint committees to discuss certain matters relevant to the Fidelity funds.
At its July 2013 meeting, the Board, including the Independent Trustees, unanimously determined to renew the fund's Advisory Contracts. In reaching its determination, the Board considered all factors it believed relevant, including (i) the nature, extent, and quality of the services to be provided to the fund and its shareholders (including the investment performance of the fund); (ii) the competitiveness of the fund's management fee and total expense ratio relative to peer funds; (iii) the total costs of the services to be provided by and the profits to be realized by Fidelity from its relationship with the fund; (iv) the extent to which economies of scale exist and would be realized as the fund grows; and (v) whether fee levels reflect these economies of scale, if any, for the benefit of fund shareholders.
In considering whether to renew the Advisory Contracts for the fund, the Board reached a determination, with the assistance of fund counsel and Independent Trustees' counsel and through the exercise of its business judgment, that the renewal of the Advisory Contracts was in the best interests of the fund and its shareholders and that the compensation payable under the Advisory Contracts was fair and reasonable. The Board's decision to renew the Advisory Contracts was not based on any single factor, but rather was based on a comprehensive consideration of all the information provided to the Board at its meetings throughout the year. The Board, in reaching its determination to renew the Advisory Contracts, was aware that shareholders in the fund have a broad range of investment choices available to them, including a wide choice among mutual funds offered by Fidelity's competitors, and that the fund's shareholders, who have the opportunity to review and weigh the disclosure provided by the fund in its prospectus and other public disclosures, have chosen to invest in this fund, which is part of the Fidelity family of funds.
Nature, Extent, and Quality of Services Provided. The Board considered the staffing within the investment adviser, Fidelity Management & Research Company (FMR), and the sub-advisers (together, the Investment Advisers) as it relates to the fund, including the backgrounds of the fund's investment personnel, and also considered the fund's investment objective, strategies, and related investment philosophy. The Independent Trustees also had discussions with senior management of Fidelity's investment operations and investment groups. The Board considered the structure of the portfolio manager compensation program and whether this structure provides appropriate incentives to act in the best interests of the fund.
Resources Dedicated to Investment Management and Support Services. The Board and the Fund Oversight and Research Committees reviewed the general qualifications and capabilities of the Investment Advisers' investment staff, including its size, education, experience, and resources, as well as the Investment Advisers' approach to recruiting, training, managing, and compensating investment personnel. The Board noted that FMR has continued to increase the resources devoted to non-U.S. offices, including expansion of Fidelity's global investment organization. The Board also noted that Fidelity's analysts have extensive resources, tools and capabilities that allow them to conduct sophisticated quantitative and fundamental analysis, as well as credit analysis of issuers, counterparties and guarantors. Further, the Board believes that Fidelity's investment professionals have sufficient access to global information and data so as to provide competitive investment results over time, and that those professionals also have access to sophisticated tools that permit them to assess portfolio construction and risk and performance attribution characteristics continuously, as well as to transmit new information and research conclusions rapidly around the world. Additionally, in its deliberations, the Board considered the Investment Advisers' trading and risk management capabilities and resources, which are an integral part of the investment management process.
Shareholder and Administrative Services. The Board considered (i) the nature, extent, quality, and cost of advisory, administrative, and shareholder services performed by the Investment Advisers and their affiliates under the Advisory Contracts and under separate agreements covering transfer agency, pricing and bookkeeping, and securities lending services for the fund; (ii) the nature and extent of the supervision of third party service providers, principally custodians and subcustodians; and (iii) the resources devoted to, and the record of compliance with, the fund's compliance policies and procedures. The Board also reviewed the allocation of fund brokerage, including allocations to brokers affiliated with the Investment Advisers, the use of brokerage commissions to pay fund expenses, and the use of "soft" commission dollars to pay for research services.
The Board noted that the growth of fund assets over time across the complex allows Fidelity to reinvest in the development of services designed to enhance the value or convenience of the Fidelity funds as investment vehicles. These services include 24-hour access to account information and market information through telephone representatives and over the Internet, investor education materials and asset allocation tools, and the expanded availability of Fidelity Investor Centers.
Annual Report
Board Approval of Investment Advisory Contracts and Management Fees - continued
Investment in a Large Fund Family. The Board considered the benefits to shareholders of investing in a Fidelity fund, including the benefits of investing in a fund that is part of a large family of funds offering a variety of investment disciplines and providing a large variety of mutual fund investor services. The Board noted that Fidelity had taken, or had made recommendations that resulted in the Fidelity funds taking, a number of actions over the previous year that benefited particular funds, including (i) continuing to dedicate additional resources to investment research and to the support of the senior management team that oversees asset management; (ii) persisting in efforts to enhance Fidelity's global research capabilities; (iii) launching new funds and making other enhancements to meet client needs for global and income-oriented solutions; (iv) continuing to launch dedicated lower cost underlying funds to meet portfolio construction needs related to expanding underlying fund options for Fidelity funds of funds, specifically for the Freedom Fund product lines; (v) rationalizing product lines and gaining increased efficiencies through the mergers of several funds into other funds; (vi) strengthening Fidelity's index fund offerings by reducing investment minimums and adopting or lowering existing expense caps for certain funds and classes; (vii) enhancing Global Asset Allocation product offerings by launching new funds and strategies, including "open architecture" target date funds that utilize affiliated and unaffiliated sub-advisers; (viii) modifying the eligibility criteria for Institutional Class shares of Advisor funds to increase their marketability to a portion of the defined contribution plan market; (ix) creating a new low-cost retirement share class for certain Advisor funds to appeal to large retirement plans; (x) transitioning the management of certain Fidelity commodity funds to Geode Capital Management LLC, a registered commodity pool operator, while retaining administrative responsibilities for the funds; (xi) reorganizing a number of funds; and (xii) taking steps toward establishing a new Fidelity adviser to manage sector-based funds and products.
Investment Performance. The Board considered whether the fund has operated in accordance with its investment objective, as well as its record of compliance with its investment restrictions and its performance history.
The Board took into account discussions with the Investment Advisers about fund investment performance that occur at Board meetings throughout the year. In this regard the Board noted that as part of regularly scheduled fund reviews and other reports to the Board on fund performance, the Board periodically considers annualized return information for the fund, for different time periods, measured against a securities market index ("benchmark index") and a peer group of mutual funds with similar objectives ("peer group"). In its evaluation of fund investment performance, the Board gave particular attention to information indicating changes in performance of certain Fidelity funds for specific time periods and the Investment Advisers' explanations for any overperformance or underperformance.
In addition to reviewing absolute and relative fund performance, the Independent Trustees periodically consider the appropriateness of fund performance metrics in evaluating the results achieved. In general, the Independent Trustees believe that fund performance should be evaluated based on net performance (after fees and expenses) of both the highest performing and lowest performing classes, where applicable, compared to appropriate benchmark indices, over appropriate time periods which may include full market cycles, and compared to peer groups, as applicable, over the same periods, taking into account relevant factors including the following: general market conditions; issuer-specific information; tactical opportunities for investment; and fund cash flows and other factors.
The Independent Trustees recognize that shareholders evaluate performance on a net basis over their own holding periods, for which one-, three-, and five-year periods are used as a proxy. For this reason, the performance information reviewed by the Board also included net cumulative calendar year total return information for the fund and an appropriate benchmark index and peer group for the most recent one-, three-, and five-year periods, as shown below. Returns are shown compared to the 25th percentile (top of box) and 75th percentile (bottom of box) of the peer universe.
Annual Report
VIP Equity-Income Portfolio

Based on its review, the Board concluded that the nature, extent, and quality of services provided to the fund under the Advisory Contracts should benefit the fund's shareholders.
Competitiveness of Management Fee and Total Expense Ratio. The Board considered the fund's management fee and total expense ratio compared to "mapped groups" of competitive funds and classes. Fidelity creates "mapped groups" by combining similar Lipper investment objective categories that have comparable management fee characteristics. Combining Lipper investment objective categories aids the Board's management fee and total expense ratio comparisons by broadening the competitive group used for comparison and by reducing the number of universes to which various Fidelity funds are compared.
Management Fee. The Board considered two proprietary management fee comparisons for the 12-month periods shown in the chart below. The group of Lipper funds used by the Board for management fee comparisons is referred to below as the "Total Mapped Group." The Total Mapped Group is broader than the Lipper peer group used by the Board for performance comparisons because the Total Mapped Group combines several Lipper investment objective categories while the Lipper peer group does not. The Total Mapped Group comparison focuses on a fund's standing in terms of gross management fees before expense reimbursements or caps relative to the total universe of funds with comparable investment mandates, regardless of whether their management fee structures also are comparable. Funds with comparable investment mandates offer exposure to similar types of securities. Funds with comparable management fee structures have similar management fee contractual arrangements (e.g., flat rate charged for advisory services, all-inclusive fee rate, etc.). "TMG %" represents the percentage of funds in the Total Mapped Group that had management fees that were lower than the fund's. For example, a TMG % of 13% means that 87% of the funds in the Total Mapped Group had higher management fees than the fund. The "Asset-Size Peer Group" (ASPG) comparison focuses on a fund's standing relative to a subset of non-Fidelity funds within the Total Mapped Group that are similar in size and management fee structure. The ASPG represents at least 15% of the funds in the Total Mapped Group with comparable asset size and management fee structures, subject to a minimum of 50 funds (or all funds in the Total Mapped Group if fewer than 50). Additional information, such as the ASPG quartile in which the fund's management fee ranked, is also included in the chart and considered by the Board.
Annual Report
Board Approval of Investment Advisory Contracts and Management Fees - continued
VIP Equity-Income Portfolio
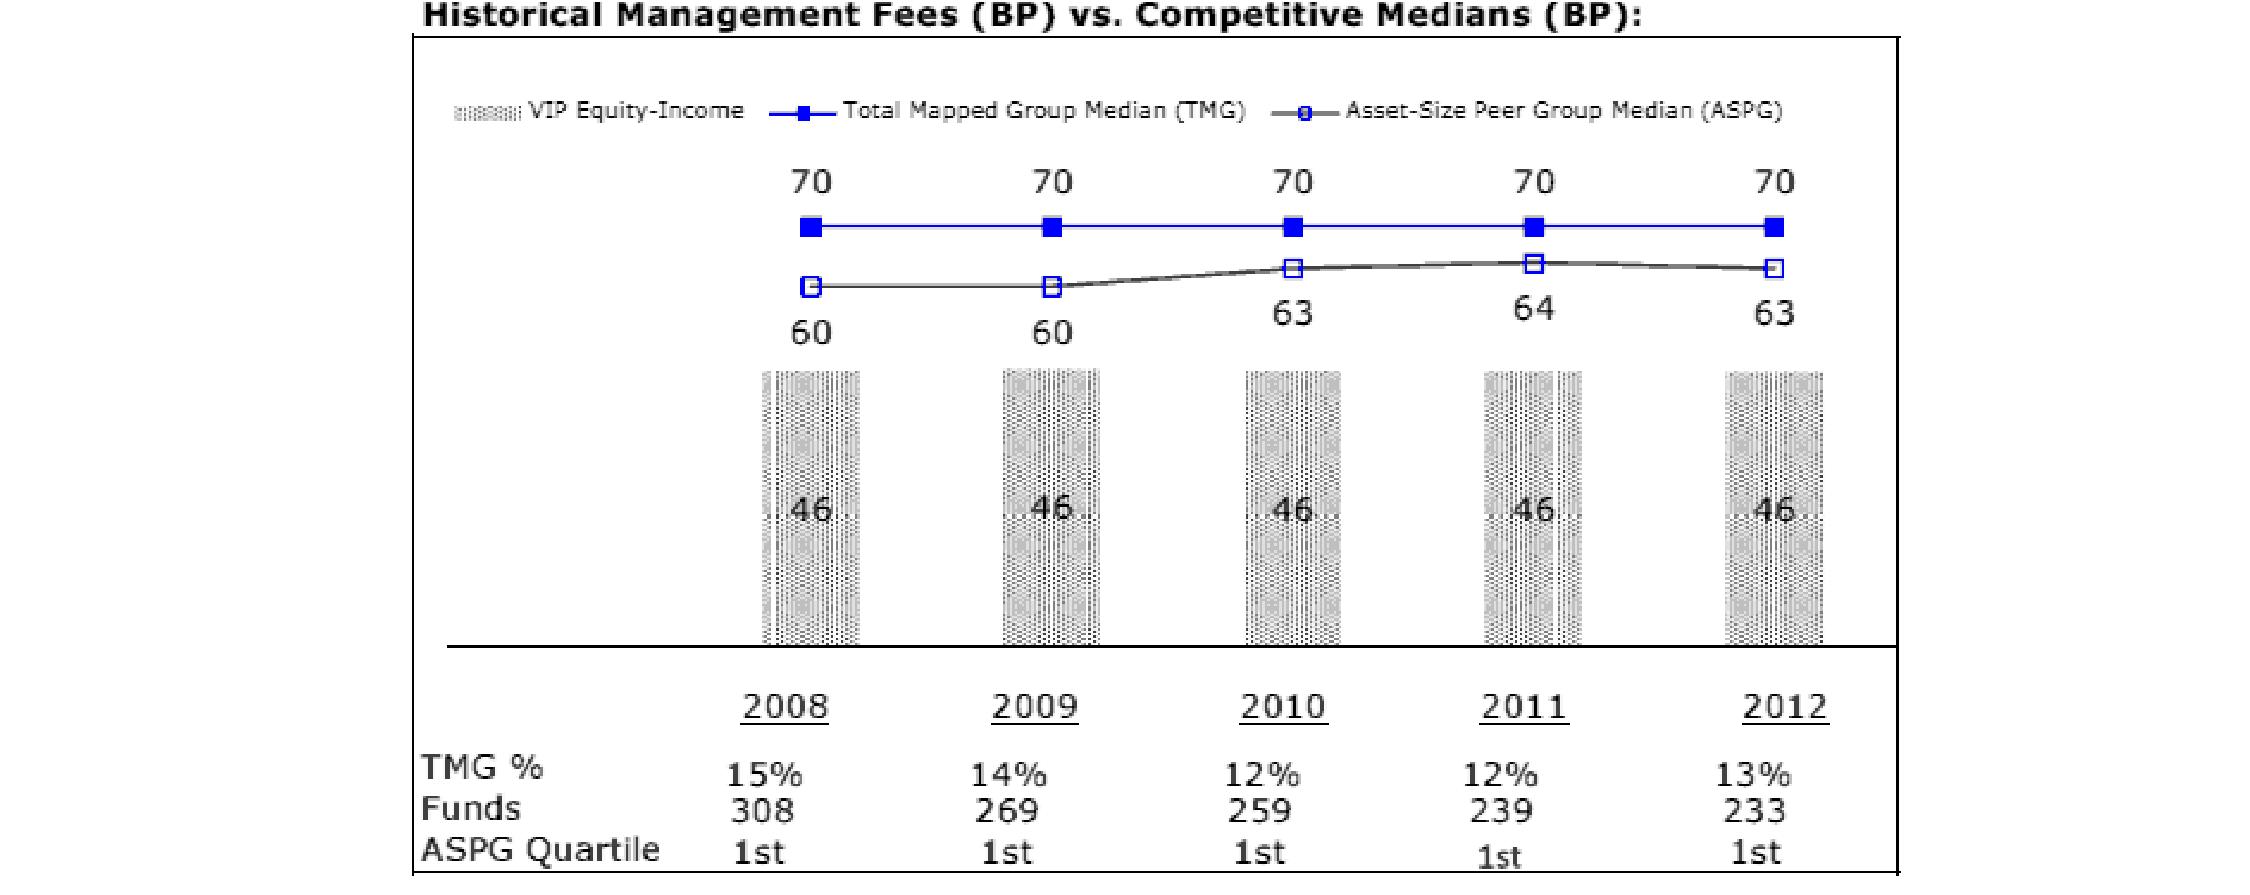
The Board noted that the fund's management fee ranked below the median of its Total Mapped Group and below the median of its ASPG for 2012.
Based on its review, the Board concluded that the fund's management fee is fair and reasonable in light of the services that the fund receives and the other factors considered.
Total Expense Ratio. In its review of each class's total expense ratio, the Board considered the fund's management fee as well as other fund or class expenses, as applicable, such as transfer agent fees, pricing and bookkeeping fees, fund-paid 12b-1 fees, and custodial, legal, and audit fees. The Board also noted the effects of any waivers and reimbursements on fees and expenses. As part of its review, the Board also considered the current and historical total expense ratios of each class of the fund compared to competitive fund median expenses. Each class of the fund is compared to those funds and classes in the Total Mapped Group (used by the Board for management fee comparisons) that have a similar sales load structure.
The Board noted that the total expense ratio of each class ranked below its competitive median for 2012.
Fees Charged to Other Fidelity Clients. The Board also considered Fidelity fee structures and other information with respect to clients of FMR and its affiliates, such as other mutual funds advised or subadvised by FMR or its affiliates, pension plan clients, and other institutional clients. The Board noted the findings of the 2013 ad hoc joint committee (created with the board of other Fidelity funds), which reviewed and compared Fidelity's institutional investment advisory business with its business of providing services to the Fidelity funds, including the differences in services provided, fees charged, and costs incurred, as well as competition in their respective marketplaces.
Based on its review of total expense ratios and fees charged to other Fidelity clients, the Board concluded that the total expense ratio of each class of the fund was reasonable in light of the services that the fund and its shareholders receive and the other factors considered.
Costs of the Services and Profitability. The Board considered the revenues earned and the expenses incurred by Fidelity in conducting the business of developing, marketing, distributing, managing, administering and servicing the fund and servicing the fund's shareholders. The Board also considered the level of Fidelity's profits in respect of all the Fidelity funds.
On an annual basis, FMR presents to the Board Fidelity's profitability for the fund. Fidelity calculates the profitability for each fund, as well as aggregate profitability for groups of Fidelity funds and all Fidelity funds, using a series of detailed revenue and cost allocation methodologies which originate with the books and records of Fidelity on which Fidelity's audited financial statements are based. The Audit Committee of the Board reviews any significant changes from the prior year's methodologies.
PricewaterhouseCoopers LLP (PwC), independent registered public accounting firm and auditor to Fidelity and certain Fidelity funds, has been engaged annually by the Board as part of the Board's assessment of Fidelity's profitability analysis. PwC's engagement includes the review and assessment of the methodologies used by Fidelity in determining the revenues and expenses attributable to Fidelity's mutual fund business, and completion of agreed-upon procedures surrounding the mathematical accuracy of fund profitability and its conformity to allocation methodologies. After considering PwC's reports issued under the engagement and information provided by Fidelity, the Board concluded that while other allocation methods may also be reasonable, Fidelity's profitability methodologies are reasonable in all material respects.
Annual Report
The Board also reviewed Fidelity's non-fund businesses and fall-out benefits related to the mutual fund business as well as cases where Fidelity's affiliates may benefit from or be related to the fund's business.
The Board considered the costs of the services provided by and the profits realized by Fidelity in connection with the operation of the fund and was satisfied that the profitability was not excessive in the circumstances.
Economies of Scale. The Board considered whether there have been economies of scale in respect of the management of the Fidelity funds, whether the Fidelity funds (including the fund) have appropriately benefited from any such economies of scale, and whether there is potential for realization of any further economies of scale. The Board considered the extent to which the fund will benefit from economies of scale through increased services to the fund, through waivers or reimbursements, or through fee or expense reductions. The Board also noted that in 2009, it and the board of other Fidelity funds created an ad hoc committee (the Economies of Scale Committee) to analyze whether FMR attains economies of scale in respect of the management and servicing of the Fidelity funds, whether the Fidelity funds have appropriately benefited from such economies of scale, and whether there is potential for realization of any further economies of scale.
The Board recognized that the fund's management contract incorporates a "group fee" structure, which provides for lower group fee rates as total fund assets under FMR's management increase, and for higher group fee rates as total fund assets under FMR's management decrease. FMR calculates the group fee rates based on a tiered asset "breakpoint" schedule that varies based on asset class. The Board considered that the group fee is designed to deliver the benefits of economies of scale to fund shareholders when total Fidelity fund assets increase, even if assets of any particular fund are unchanged or have declined, because some portion of Fidelity's costs are attributable to services provided to all Fidelity funds, and all funds benefit if those costs can be allocated among more assets. The Board concluded that, given the group fee structure, fund shareholders will benefit from lower management fees as assets under FMR's management increase at the fund complex level, regardless of whether Fidelity achieves any such economies of scale.
The Board concluded, taking into account the analysis of the Economies of Scale Committee, that economies of scale, if any, are being appropriately shared between fund shareholders and Fidelity.
Amendment to Description of Group Fee Rate. At its July 2013 meeting, the Board voted to approve an amendment to the fund's management contract to modify the description of the "group fee rate" effective August 1, 2013. The Board noted that under the prior description in the contract, the group fee rate was based on the average net assets of all registered investment companies with which FMR has management contracts. Under the contract's tiered asset breakpoint schedule, the group fee rate is lower as total fund assets under FMR's management increase, and higher as total fund assets under FMR's management decrease. The Board considered that the prior description would have excluded the assets of 64 Fidelity sector funds from the group fee rate calculation once Fidelity SelectCo, LLC, an affiliate of FMR, assumed management responsibilities for those funds. The Board noted that modifying the description of the group fee rate to continue to include the assets of those 64 funds for purposes of determining group fee rate breakpoints would avoid an immediate adverse impact on the group fee rate for any fund.
Additional Information Requested by the Board. In order to develop fully the factual basis for consideration of the Fidelity funds' Advisory Contracts, the Board requested and received additional information on certain topics, including: (i) fund performance trends and Fidelity's long-term strategies for certain funds; (ii) the potential to further rationalize the Fidelity fund lineup with the possibility of achieving savings for the funds and Fidelity; (iii) the methodology with respect to competitive fund data and peer group classifications; (iv) the arrangements with, and performance of, certain sub-advisers on behalf of the Fidelity funds, as well as certain proposed participating affiliate arrangements; (v) the realization of fall-out benefits in certain Fidelity business units; (vi) Fidelity's group fee structures, including the rationale for the individual fee rates of certain categories of funds and the definition of group assets; (vii) trends regarding industry use of performance fee structures and the performance adjustment methodologies applicable to the Fidelity funds; (viii) additional competitive analysis regarding the total expenses for certain classes; and (ix) fund profitability methodology, including Fidelity's cost allocation methodology, and the impact of certain factors on fund profitability results.
Based on its evaluation of all of the conclusions noted above, and after considering all factors it believed relevant, the Board ultimately concluded that the advisory fee structures are fair and reasonable, and that the fund's Advisory Contracts should be renewed.
Annual Report
Investment Adviser
Fidelity Management & Research Company
Boston, MA
Investment Sub-Advisers
FMR Co., Inc.
Fidelity Management & Research (U.K.) Inc.
Fidelity Management & Research (Hong Kong) Limited
Fidelity Management & Research (Japan) Inc.
General Distributor
Fidelity Distributors Corporation
Smithfield, RI
Transfer and Service Agents
Fidelity Investments Institutional Operations Company, Inc.
Boston, MA
Fidelity Service Company, Inc.
Boston, MA
Custodian
The Northern Trust Company
Chicago, IL
VIPEI2R-ANN-0214
1.782454.112
Fidelity® Variable Insurance Products:
Overseas Portfolio
Annual Report
December 31, 2013
(Fidelity Cover Art)
Contents
Performance | (Click Here) | How the fund has done over time. |
Management's Discussion of Fund Performance | (Click Here) | The Portfolio Manager's review of fund performance and strategy. |
Shareholder Expense Example | (Click Here) | An example of shareholder expenses. |
Investment Changes | (Click Here) | A summary of major shifts in the fund's investments over the past six months. |
Investments | (Click Here) | A complete list of the fund's investments with their market values. |
Financial Statements | (Click Here) | Statements of assets and liabilities, operations, and changes in net assets, as well as financial highlights. |
Notes | (Click Here) | Notes to the financial statements. |
Report of Independent Registered Public Accounting Firm | (Click Here) | |
Trustees and Officers | (Click Here) | |
Distributions | (Click Here) | |
Board Approval of Investment Advisory Contracts and Management Fees | (Click Here) | |
To view a fund's proxy voting guidelines and proxy voting record for the 12-month period ended June 30, visit http://www.fidelity.com/proxyvotingresults or visit the Securities and Exchange Commission's (SEC) web site at http://www.sec.gov. You may also call 1-877-208-0098 to request a free copy of the proxy voting guidelines.
Fidelity Variable Insurance Products are separate account options which are purchased through a variable insurance contract.
Standard & Poor's, S&P and S&P 500 are registered service marks of The McGraw-Hill Companies, Inc. and have been licensed for use by Fidelity Distributors Corporation.
Other third-party marks appearing herein are the property of their respective owners.
All other marks appearing herein are registered or unregistered trademarks or service marks of FMR LLC or an affiliated company. © 2014 FMR LLC. All rights reserved.
This report and the financial statements contained herein are submitted for the general information of the shareholders of the fund. This report is not authorized for distribution to prospective investors in the fund unless preceded or accompanied by an effective prospectus.
A fund files its complete schedule of portfolio holdings with the SEC for the first and third quarters of each fiscal year on Form N-Q. Forms N-Q are available on the SEC's web site at http://www.sec.gov. A fund's Forms N-Q may be reviewed and copied at the SEC's Public Reference Room in Washington, DC. Information regarding the operation of the SEC's Public Reference Room may be obtained by calling 1-800-SEC-0330. For a complete list of a fund's portfolio holdings, view the most recent holdings listing, semiannual report, or annual report on Fidelity's web site at http://www.fidelity.com, http://www.advisor.fidelity.com, or http://www.401k.com, as applicable.
NOT FDIC INSURED • MAY LOSE VALUE • NO BANK GUARANTEE
Neither the fund nor Fidelity Distributors Corporation is a bank.
Annual Report
Average annual total return reflects the change in the value of an investment, assuming reinvestment of the class' distributions from dividend income and capital gains (the profits earned upon the sale of securities that have grown in value, if any) and assuming a constant rate of performance each year. During periods of reimbursement by Fidelity, a fund's total return will be greater than it would be had the reimbursement not occurred. Performance numbers are net of all underlying fund operating expenses, but do not include any insurance charges imposed by your insurance company's separate account. If performance information included the effect of these additional charges, the total returns would have been lower. How a fund did yesterday is no guarantee of how it will do tomorrow.
Average Annual Total Returns
Periods ended December 31, 2013 | Past 1
year | Past 5
years | Past 10
years |
VIP Overseas Portfolio - Initial Class | 30.44% | 13.30% | 6.99% |
VIP Overseas Portfolio - Service Class | 30.38% | 13.20% | 6.89% |
VIP Overseas Portfolio - Service Class 2 | 30.17% | 13.03% | 6.73% |
$10,000 Over 10 Years
Let's say hypothetically that $10,000 was invested in VIP Overseas Portfolio - Initial Class on December 31, 2003. The chart shows how the value of your investment would have changed, and also shows how the MSCI® EAFE® Index performed over the same period.

Annual Report
Market Recap: Global equity markets remained upbeat for the 12 months ending December 31, 2013, propelling the MSCI® ACWI® (All Country World Index) Index to a 23.24% return. Midyear turbulence gave way by autumn when policymakers in the U.S. and China had made clear their intentions to maintain accommodative monetary policies. That stance, combined with modest cyclical improvement around the globe and generally low valuations, underpinned the broad rally in equities, although the relative strength of the U.S. dollar generally tempered gains for U.S. investors holding foreign securities based in local currencies. During the period, the broad-market S&P 500® Index set a series of new highs, finishing the year up 32.39%. For the first time since 1995, the S&P® scored a "perfect 10," with all 10 economic sectors gaining at least 10% for the year. A resurgence in growth-oriented stocks lifted the Nasdaq Composite Index® to a 40.12% result for 2013, while the blue-chip Dow Jones Industrial AverageSM notched a relatively more modest 29.65% gain. International developed-markets equities rose in concert with their U.S. counterparts, with the MSCI® EAFE® Index gaining 22.92% for the period. Meanwhile, foreign exchange and commodity weakness curbed results in resource-heavy emerging markets (EM), especially in the year's waning months. More generally, concern over EM's slowing growth, its declining share of global trade and uncertainty surrounding U.S. central bank intentions were all factors hampering performance. The MSCI Emerging Markets Index returned -2.27% for the period. On the bond side, U.S. high-yield securities rallied with equities for much of the period, with The BofA Merrill LynchSM US High Yield Constrained Index returning 7.41% for 2013. The more rate-sensitive U.S. investment-grade bond category faced headwinds though, as reflected in the -2.02% return of The Barclays® U.S. Aggregate Bond Index. Within the Barclays index, investment-grade corporate credit returned -2.01%, while ultra-safe U.S. Treasuries saw a -2.75% result. Major non-U.S. developed markets performed only slightly better, with the Citigroup® Non-USD Group-of-Seven (G7) Equal Weighted Index logging a -1.59% result. After several years of strong advances, EM debt reversed course in 2013, with the J.P. Morgan Emerging Markets Bond Index Global returning -6.58%.
Comments from Graeme Rockett, Portfolio Manager of VIP Overseas Portfolio: For the year, fund's share classes easily outpaced the 22.92% advance of the MSCI® EAFE® Index. (For specific portfolio results, please refer to the performance section of this report.) Versus the index, the fund found success among many Internet-related and e-commerce stocks, most notably SouFun Holdings, China's leading residential real estate Internet portal. Japanese telecommunications firm SoftBank also provided a nice boost to relative performance, as did a stake in U.K.-based online apparel retailer ASOS, where I saw long-term growth potential but began to trim my position once its share price exceeded my target. Conversely, it hurt to hold Hengdeli Holdings, a China-based retailer of high-end Swiss watches, but I remain committed to investing in luxury goods firms. Ireland-based alcoholic beverage producer C&C Group weighed on relative performance, as shares fell this period amid consecutive quarters of weak financial results. Many of the stocks I've mentioned were not in the index.
The views expressed above reflect those of the portfolio manager(s) only through the end of the period as stated on the cover of this report and do not necessarily represent the views of Fidelity or any other person in the Fidelity organization. Any such views are subject to change at any time based upon market or other conditions and Fidelity disclaims any responsibility to update such views. These views may not be relied on as investment advice and, because investment decisions for a Fidelity fund are based on numerous factors, may not be relied on as an indication of trading intent on behalf of any Fidelity fund.
Annual Report
As a shareholder of the Fund, you incur two types of costs: (1) transaction costs, including redemption fees and (2) ongoing costs, including management fees, distribution and/or service (12b-1) fees and other Fund expenses. This Example is intended to help you understand your ongoing costs (in dollars) of investing in the Fund and to compare these costs with the ongoing costs of investing in other mutual funds.
The Example is based on an investment of $1,000 invested at the beginning of the period and held for the entire period (July 1, 2013 to December 31, 2013).
Actual Expenses
The first line of the accompanying table for each class of the Fund provides information about actual account values and actual expenses. You may use the information in this line, together with the amount you invested, to estimate the expenses that you paid over the period. Simply divide your account value by $1,000.00 (for example, an $8,600 account value divided by $1,000.00 = 8.6), then multiply the result by the number in the first line for a class of the Fund under the heading entitled "Expenses Paid During Period" to estimate the expenses you paid on your account during this period. The estimate of expenses does not include any fees or other expenses of any variable annuity or variable life insurance product. If they were, the estimate of expenses you paid during the period would be higher, and your ending account value would be lower. In addition, the Fund, as a shareholder in the underlying Fidelity Central Funds, will indirectly bear its pro-rata share of the fees and expenses incurred by the underlying Fidelity Central Funds. These fees and expenses are not included in the Fund's annualized expense ratio used to calculate the expense estimate in the table below.
Hypothetical Example for Comparison Purposes
The second line of the accompanying table for each class of the Fund provides information about hypothetical account values and hypothetical expenses based on a Class' actual expense ratio and an assumed rate of return of 5% per year before expenses, which is not the Class' actual return. The hypothetical account values and expenses may not be used to estimate the actual ending account balance or expenses you paid for the period. You may use this information to compare the ongoing costs of investing in the Fund and other funds. To do so, compare this 5% hypothetical example with the 5% hypothetical examples that appear in the shareholder reports of the other funds. The estimate of expenses does not include any fees or other expenses of any variable annuity or variable life insurance product. If they were, the estimate of expenses you paid during the period would be higher, and your ending account value would be lower. In addition, the Fund, as a shareholder in the underlying Fidelity Central Funds, will indirectly bear its pro-rata share of the fees and expenses incurred by the underlying Fidelity Central Funds. These fees and expenses are not included in the Fund's annualized expense ratio used to calculate the expense estimate in the table below.
Please note that the expenses shown in the table are meant to highlight your ongoing costs only and do not reflect any transaction costs. Therefore, the second line of the table is useful in comparing ongoing costs only, and will not help you determine the relative total costs of owning different funds. In addition, if these transactional costs were included, your costs would have been higher.
| Annualized
Expense Ratio B | Beginning
Account Value
July 1, 2013 | Ending
Account Value
December 31, 2013 | Expenses Paid
During Period*
July 1, 2013
to December 31, 2013 |
Initial Class | .83% | | | |
Actual | | $ 1,000.00 | $ 1,233.10 | $ 4.67 |
HypotheticalA | | $ 1,000.00 | $ 1,021.02 | $ 4.23 |
Service Class | .93% | | | |
Actual | | $ 1,000.00 | $ 1,233.00 | $ 5.23 |
HypotheticalA | | $ 1,000.00 | $ 1,020.52 | $ 4.74 |
Service Class 2 | 1.08% | | | |
Actual | | $ 1,000.00 | $ 1,232.10 | $ 6.08 |
HypotheticalA | | $ 1,000.00 | $ 1,019.76 | $ 5.50 |
Initial Class R | .83% | | | |
Actual | | $ 1,000.00 | $ 1,233.80 | $ 4.67 |
HypotheticalA | | $ 1,000.00 | $ 1,021.02 | $ 4.23 |
Service Class R | .93% | | | |
Actual | | $ 1,000.00 | $ 1,232.90 | $ 5.23 |
HypotheticalA | | $ 1,000.00 | $ 1,020.52 | $ 4.74 |
Service Class 2R | 1.08% | | | |
Actual | | $ 1,000.00 | $ 1,232.10 | $ 6.08 |
HypotheticalA | | $ 1,000.00 | $ 1,019.76 | $ 5.50 |
Investor Class R | .91% | | | |
Actual | | $ 1,000.00 | $ 1,233.20 | $ 5.12 |
HypotheticalA | | $ 1,000.00 | $ 1,020.62 | $ 4.63 |
A 5% return per year before expenses
B Annualized expense ratio reflects expenses net of applicable fee waivers.
* Expenses are equal to each Class' annualized expense ratio, multiplied by the average account value over the period, multiplied by 184/365 (to reflect the one-half year period).
Annual Report
Investment Changes (Unaudited)
Geographic Diversification (% of fund's net assets) |
As of December 31, 2013 |
 | Japan | 18.9% | |
 | United Kingdom | 17.1% | |
 | United States of America* | 8.0% | |
 | France | 7.9% | |
 | Cayman Islands | 7.9% | |
 | Switzerland | 7.2% | |
 | Germany | 5.5% | |
 | Sweden | 3.2% | |
 | Ireland | 3.1% | |
 | Other | 21.2% | |

Percentages are based on country or territory of incorporation and are adjusted for the effect of futures contracts, if applicable. |
* Includes Short-Term Investments and Net Other Assets. |
As of June 30, 2013 |
| Japan | 20.9% | |
| United Kingdom | 20.4% | |
| France | 10.1% | |
| Switzerland | 7.8% | |
| Germany | 5.8% | |
| United States of America* | 5.7% | |
| Cayman Islands | 4.1% | |
| Ireland | 3.4% | |
| Australia | 3.2% | |
| Other | 18.6% | |

Percentages are based on country or territory of incorporation and are adjusted for the effect of futures contracts, if applicable. |
* Includes Short-Term Investments and Net Other Assets. |
Asset Allocation as of December 31, 2013 |
| % of fund's
net assets | % of fund's net assets
6 months ago |
Stocks | 98.1 | 99.6 |
Short-Term Investments and Net Other Assets (Liabilities) | 1.9 | 0.4 |
Top Ten Stocks as of December 31, 2013 |
| % of fund's
net assets | % of fund's net assets
6 months ago |
Nestle SA (Switzerland, Food Products) | 2.2 | 2.8 |
SoftBank Corp. (Japan, Wireless Telecommunication Services) | 2.1 | 1.8 |
Sanofi SA (France, Pharmaceuticals) | 2.0 | 2.4 |
Rakuten, Inc. (Japan, Internet & Catalog Retail) | 1.6 | 1.5 |
Naspers Ltd. Class N (South Africa, Media) | 1.6 | 0.3 |
SouFun Holdings Ltd. ADR (Cayman Islands, Internet Software & Services) | 1.5 | 0.6 |
Investment AB Kinnevik (B Shares) (Sweden, Diversified Financial Services) | 1.4 | 0.7 |
Tencent Holdings Ltd. (Cayman Islands, Internet Software & Services) | 1.4 | 1.3 |
Toyota Motor Corp. (Japan, Automobiles) | 1.4 | 1.7 |
ORIX Corp. (Japan, Diversified Financial Services) | 1.3 | 1.3 |
| 16.5 | |
Market Sectors as of December 31, 2013 |
| % of fund's
net assets | % of fund's net assets
6 months ago |
Consumer Discretionary | 27.2 | 24.0 |
Financials | 18.8 | 19.3 |
Information Technology | 15.0 | 12.3 |
Consumer Staples | 11.4 | 14.2 |
Industrials | 7.3 | 8.3 |
Health Care | 7.1 | 8.9 |
Materials | 5.6 | 6.2 |
Energy | 3.1 | 3.6 |
Telecommunication Services | 2.6 | 2.1 |
Utilities | 0.0 | 0.7 |
Annual Report
Investments December 31, 2013
Showing Percentage of Net Assets
Common Stocks - 96.7% |
| Shares | | Value |
Australia - 2.4% |
BHP Billiton Ltd. | 318,002 | | $ 10,841,624 |
Carsales.com Ltd. | 320,637 | | 2,917,364 |
CSL Ltd. | 169,506 | | 10,437,228 |
Fortescue Metals Group Ltd. | 258,379 | | 1,342,712 |
G8 Education Ltd. | 2,091,458 | | 5,901,183 |
iSelect Ltd. | 3,599,772 | | 4,644,572 |
Macquarie Group Ltd. | 99,742 | | 4,895,608 |
Rio Tinto Ltd. | 24,301 | | 1,479,394 |
Sydney Airport unit | 105,682 | | 358,581 |
TOTAL AUSTRALIA | | 42,818,266 |
Bailiwick of Jersey - 1.6% |
Experian PLC | 233,300 | | 4,303,751 |
Glencore Xstrata PLC | 1,246,535 | | 6,454,752 |
Informa PLC | 813,663 | | 7,727,254 |
WPP PLC | 478,707 | | 10,939,465 |
TOTAL BAILIWICK OF JERSEY | | 29,425,222 |
Belgium - 0.8% |
Ageas | 66,760 | | 2,842,502 |
Anheuser-Busch InBev SA NV | 33,577 | | 3,570,453 |
Hamon & Compagnie International SA (a)(d) | 62,254 | | 1,291,494 |
KBC Groupe SA | 31,157 | | 1,768,086 |
UCB SA | 72,400 | | 5,392,381 |
TOTAL BELGIUM | | 14,864,916 |
Bermuda - 0.7% |
Clear Media Ltd. | 2,035,000 | | 1,742,569 |
Oriental Watch Holdings Ltd. | 7,028,000 | | 1,857,988 |
Signet Jewelers Ltd. | 111,400 | | 8,767,180 |
TOTAL BERMUDA | | 12,367,737 |
Brazil - 0.7% |
Anhanguera Educacional Participacoes SA | 579,300 | | 3,691,535 |
Cielo SA | 301,440 | | 8,463,555 |
TOTAL BRAZIL | | 12,155,090 |
British Virgin Islands - 0.8% |
Gem Diamonds Ltd. (a) | 802,019 | | 1,929,070 |
Mail.Ru Group Ltd.: | | | |
GDR (e) | 6,600 | | 294,360 |
GDR (Reg. S) | 265,500 | | 11,841,300 |
TOTAL BRITISH VIRGIN ISLANDS | | 14,064,730 |
Canada - 0.3% |
Bauer Performance Sports Ltd. (a) | 55,161 | | 735,826 |
Entertainment One Ltd. (a) | 1,114,000 | | 4,781,536 |
TOTAL CANADA | | 5,517,362 |
Cayman Islands - 7.9% |
500 Com Ltd. sponsored ADR Class A | 74,744 | | 2,643,695 |
51job, Inc. sponsored ADR (a) | 36,000 | | 2,804,400 |
|
| Shares | | Value |
58.com, Inc. ADR | 167,200 | | $ 6,410,448 |
Autohome, Inc. ADR Class A | 39,900 | | 1,459,941 |
Baidu.com, Inc. sponsored ADR (a) | 94,500 | | 16,809,660 |
Biostime International Holdings Ltd. | 930,000 | | 8,293,399 |
Bitauto Holdings Ltd. ADR (a)(d) | 225,900 | | 7,219,764 |
Cimc Enric Holdings Ltd. | 2,430,000 | | 3,917,181 |
Fu Shou Yuan International Group Ltd. | 1,743,000 | | 1,153,114 |
Greatview Aseptic Pack Co. Ltd. | 4,056,000 | | 2,395,636 |
Hengdeli Holdings Ltd. | 33,689,800 | | 7,950,729 |
Home Inns & Hotels Management, Inc. sponsored ADR (a) | 41,000 | | 1,789,240 |
New Oriental Education & Technology Group, Inc. sponsored ADR | 137,500 | | 4,331,250 |
Noah Holdings Ltd. sponsored ADR (d) | 186,400 | | 3,355,200 |
Qunar Cayman Islands Ltd. sponsored ADR | 36,800 | | 976,304 |
Shenguan Holdings Group Ltd. | 2,636,000 | | 1,176,194 |
SouFun Holdings Ltd. ADR | 340,400 | | 28,052,364 |
Springland International Holdings Ltd. | 3,796,000 | | 1,953,244 |
Sungy Mobile Ltd. ADR | 79,400 | | 1,622,142 |
Tencent Holdings Ltd. | 396,900 | | 25,315,856 |
Vipshop Holdings Ltd. ADR (a) | 55,200 | | 4,619,136 |
WuXi PharmaTech Cayman, Inc. sponsored ADR (a) | 129,800 | | 4,981,724 |
Youku Tudou, Inc. ADR (a)(d) | 96,000 | | 2,908,800 |
TOTAL CAYMAN ISLANDS | | 142,139,421 |
China - 0.2% |
Travelsky Technology Ltd. (H Shares) | 2,837,000 | | 2,798,841 |
Denmark - 1.3% |
Danske Bank A/S (a) | 96,100 | | 2,204,571 |
Novo Nordisk A/S: | | | |
Series B | 16,125 | | 2,956,602 |
Series B sponsored ADR | 104,300 | | 19,270,468 |
TOTAL DENMARK | | 24,431,641 |
France - 7.9% |
AXA SA | 95,620 | | 2,658,513 |
AXA SA sponsored ADR | 135,400 | | 3,776,306 |
Beneteau SA (a) | 196,900 | | 3,675,778 |
BNP Paribas SA | 137,903 | | 10,747,250 |
Bollore (d) | 6,408 | | 3,761,127 |
Bollore (a) | 34 | | 19,551 |
Danone SA | 174,112 | | 12,531,994 |
Edenred SA | 116,400 | | 3,895,999 |
Gameloft Se (a) | 537,900 | | 6,060,510 |
Havas SA | 637,700 | | 5,249,667 |
Iliad SA | 19,126 | | 3,917,803 |
Ipsos SA | 134,292 | | 5,749,280 |
LVMH Moet Hennessy - Louis Vuitton SA | 95,996 | | 17,511,381 |
Pernod Ricard SA | 80,600 | | 9,182,090 |
Safran SA | 110,900 | | 7,706,065 |
Sanofi SA | 139,290 | | 14,875,467 |
Sanofi SA sponsored ADR | 386,922 | | 20,750,627 |
Common Stocks - continued |
| Shares | | Value |
France - continued |
Societe Generale Series A | 86,251 | | $ 5,009,635 |
Total SA | 87,900 | | 5,395,255 |
TOTAL FRANCE | | 142,474,298 |
Germany - 4.1% |
adidas AG | 78,800 | | 10,042,654 |
Allianz SE | 74,132 | | 13,293,535 |
Axel Springer Verlag AG | 148,700 | | 9,553,260 |
Bayer AG | 118,678 | | 16,644,900 |
Commerzbank AG (a) | 55,520 | | 894,397 |
Deutsche Bank AG | 58,446 | | 2,807,829 |
Linde AG | 23,487 | | 4,912,898 |
SAP AG | 165,366 | | 14,340,814 |
SAP AG sponsored ADR (d) | 16,200 | | 1,411,668 |
TOTAL GERMANY | | 73,901,955 |
Hong Kong - 1.3% |
AIA Group Ltd. | 2,299,400 | | 11,535,104 |
Television Broadcasts Ltd. | 1,659,300 | | 11,095,096 |
TOTAL HONG KONG | | 22,630,200 |
Ireland - 3.1% |
C&C Group PLC | 3,275,800 | | 19,152,702 |
CRH PLC | 423,883 | | 10,742,006 |
Glanbia PLC | 451,000 | | 6,986,162 |
Kingspan Group PLC (United Kingdom) | 573,400 | | 10,491,391 |
Paddy Power PLC (Ireland) | 97,900 | | 8,350,224 |
TOTAL IRELAND | | 55,722,485 |
Isle of Man - 0.3% |
Playtech Ltd. | 436,355 | | 5,325,430 |
Israel - 0.5% |
Rami Levi Chain Stores Hashikma Marketing 2006 Ltd. | 80,100 | | 4,378,738 |
SodaStream International Ltd. (a)(d) | 76,800 | | 3,812,352 |
TOTAL ISRAEL | | 8,191,090 |
Italy - 1.4% |
Assicurazioni Generali SpA | 158,500 | | 3,728,628 |
Eni SpA | 169,700 | | 4,100,574 |
Eni SpA sponsored ADR (d) | 67,900 | | 3,292,471 |
Lottomatica SpA | 82,800 | | 2,524,200 |
Moleskine SpA (d) | 1,277,502 | | 2,811,935 |
Tod's SpA (d) | 52,281 | | 8,731,449 |
TOTAL ITALY | | 25,189,257 |
Japan - 18.9% |
Cosmos Pharmaceutical Corp. | 119,600 | | 12,977,009 |
Daiwa Securities Group, Inc. | 490,000 | | 4,907,619 |
DENSO Corp. | 87,400 | | 4,617,228 |
Dentsu, Inc. | 431,700 | | 17,655,940 |
East Japan Railway Co. | 43,300 | | 3,449,183 |
Fuji Media Holdings, Inc. | 161,900 | | 3,315,541 |
|
| Shares | | Value |
Hitachi Ltd. | 2,281,000 | | $ 17,294,888 |
Honda Motor Co. Ltd. | 325,800 | | 13,448,088 |
Japan Tobacco, Inc. | 301,600 | | 9,813,689 |
JTEKT Corp. | 219,800 | | 3,750,429 |
Kakaku.com, Inc. | 439,800 | | 7,725,710 |
Keyence Corp. | 35,520 | | 15,209,143 |
Mitsubishi Corp. | 357,000 | | 6,853,658 |
Mitsubishi Electric Corp. | 750,000 | | 9,430,844 |
Mitsubishi UFJ Financial Group, Inc. | 2,528,400 | | 16,787,050 |
Mitsubishi UFJ Financial Group, Inc. sponsored ADR (d) | 489,200 | | 3,267,856 |
MS&AD Insurance Group Holdings, Inc. | 177,500 | | 4,771,018 |
NEXT Co. Ltd. (d) | 579,300 | | 6,154,375 |
Nomura Holdings, Inc. | 505,000 | | 3,902,545 |
Nomura Holdings, Inc. sponsored ADR | 57,600 | | 447,552 |
ORIX Corp. | 1,385,200 | | 24,340,553 |
Pigeon Corp. | 35,100 | | 1,702,334 |
Rakuten, Inc. | 1,957,800 | | 29,217,095 |
Shinsei Bank Ltd. | 679,000 | | 1,662,127 |
Ship Healthcare Holdings, Inc. | 97,600 | | 3,789,925 |
SMC Corp. | 21,000 | | 5,300,159 |
SoftBank Corp. | 422,300 | | 37,057,146 |
Start Today Co. Ltd. | 252,200 | | 6,271,082 |
Sumitomo Mitsui Financial Group, Inc. | 315,600 | | 16,412,267 |
Suzuki Motor Corp. | 128,100 | | 3,451,864 |
THK Co. Ltd. | 158,500 | | 3,958,626 |
Tokio Marine Holdings, Inc. | 136,600 | | 4,571,959 |
Toshiba Corp. | 672,000 | | 2,828,995 |
Toyota Motor Corp. | 314,000 | | 19,146,177 |
Toyota Motor Corp. sponsored ADR (d) | 47,500 | | 5,791,200 |
Yahoo! Japan Corp. | 1,840,100 | | 10,261,136 |
TOTAL JAPAN | | 341,542,010 |
Korea (South) - 0.9% |
Hotel Shilla Co. | 105,951 | | 6,673,839 |
Naver Corp. | 6,120 | | 4,197,000 |
Samsung Electronics Co. Ltd. | 4,728 | | 6,144,416 |
TOTAL KOREA (SOUTH) | | 17,015,255 |
Netherlands - 1.7% |
AEGON NV | 259,400 | | 2,458,212 |
ASML Holding NV | 34,111 | | 3,196,201 |
ING Groep NV (Certificaten Van Aandelen) (a) | 487,184 | | 6,805,248 |
Koninklijke Philips Electronics NV | 304,416 | | 11,208,963 |
Yandex NV (a) | 179,400 | | 7,741,110 |
TOTAL NETHERLANDS | | 31,409,734 |
Nigeria - 0.2% |
Guinness Nigeria PLC (a) | 941,861 | | 1,389,679 |
Nigerian Breweries PLC (a) | 1,827,733 | | 1,918,577 |
TOTAL NIGERIA | | 3,308,256 |
Norway - 1.5% |
DNB ASA | 447,800 | | 8,010,535 |
Common Stocks - continued |
| Shares | | Value |
Norway - continued |
Schibsted ASA (B Shares) | 271,000 | | $ 17,925,774 |
Statoil ASA | 14,100 | | 342,863 |
Statoil ASA sponsored ADR | 30,700 | | 740,791 |
TOTAL NORWAY | | 27,019,963 |
Philippines - 0.6% |
Alliance Global Group, Inc. | 9,464,300 | | 5,499,526 |
Melco Crown Philippines Resort (a) | 18,428,700 | | 5,678,032 |
TOTAL PHILIPPINES | | 11,177,558 |
South Africa - 1.9% |
Clicks Group Ltd. | 680,633 | | 4,074,065 |
Life Healthcare Group Holdings Ltd. | 621,600 | | 2,480,474 |
Naspers Ltd. Class N | 271,400 | | 28,356,255 |
TOTAL SOUTH AFRICA | | 34,910,794 |
Spain - 1.4% |
Antena 3 de Television SA | 483,400 | | 7,993,461 |
Banco Bilbao Vizcaya Argentaria SA | 592,060 | | 7,324,104 |
Banco Santander SA (Spain) | 328,166 | | 2,951,033 |
Grifols SA ADR | 189,000 | | 6,826,680 |
TOTAL SPAIN | | 25,095,278 |
Sweden - 3.2% |
Eniro AB (a) | 548,800 | | 4,231,285 |
Investment AB Kinnevik (B Shares) | 566,000 | | 26,215,070 |
Nordea Bank AB | 608,800 | | 8,201,765 |
Svenska Cellulosa AB (SCA) (B Shares) | 518,300 | | 15,955,503 |
Swedbank AB (A Shares) | 102,432 | | 2,882,560 |
TOTAL SWEDEN | | 57,486,183 |
Switzerland - 7.2% |
Compagnie Financiere Richemont SA Series A | 136,086 | | 13,546,816 |
Credit Suisse Group AG | 269,341 | | 8,312,773 |
Credit Suisse Group AG sponsored ADR (d) | 61,252 | | 1,901,262 |
Julius Baer Group Ltd. | 55,980 | | 2,688,395 |
Nestle SA | 530,327 | | 38,867,698 |
Sika AG (Bearer) | 2,410 | | 8,566,908 |
Swatch Group AG (Bearer) | 29,240 | | 19,322,886 |
Swiss Re Ltd. | 46,826 | | 4,307,016 |
Syngenta AG (Switzerland) | 38,450 | | 15,329,905 |
UBS AG | 591,162 | | 11,319,188 |
UBS AG (NY Shares) | 184,900 | | 3,559,325 |
Zurich Insurance Group AG | 11,638 | | 3,372,482 |
TOTAL SWITZERLAND | | 131,094,654 |
Taiwan - 0.4% |
MediaTek, Inc. | 323,000 | | 4,801,988 |
Wowprime Corp. | 191,300 | | 3,174,279 |
TOTAL TAIWAN | | 7,976,267 |
|
| Shares | | Value |
Thailand - 0.3% |
Thai Beverage PCL | 12,231,000 | | $ 5,233,757 |
United Kingdom - 17.1% |
Aberdeen Asset Management PLC | 840,800 | | 6,961,614 |
Alabama Noor Hospitals Group PLC (a) | 121,600 | | 1,807,238 |
Anglo American PLC ADR | 96,800 | | 1,054,152 |
ASOS PLC (a) | 54,700 | | 5,547,148 |
Aviva PLC | 329,400 | | 2,464,391 |
Barclays PLC | 2,571,808 | | 11,629,414 |
Barclays PLC sponsored ADR | 199,250 | | 3,612,403 |
BG Group PLC | 408,438 | | 8,775,679 |
BHP Billiton PLC | 357,097 | | 11,080,692 |
BP PLC | 464,793 | | 3,766,736 |
Brammer PLC (d) | 1,085,200 | | 8,086,666 |
Burberry Group PLC | 325,500 | | 8,171,418 |
Dechra Pharmaceuticals PLC | 159,300 | | 1,853,145 |
Diageo PLC | 524,328 | | 17,375,485 |
Dunelm Group PLC | 464,300 | | 6,919,718 |
Foxtons Group PLC | 435,300 | | 2,396,776 |
GlaxoSmithKline PLC | 447,200 | | 11,948,061 |
Hays PLC | 2,206,800 | | 4,743,347 |
HSBC Holdings PLC: | | | |
(United Kingdom) | 929,678 | | 10,202,430 |
sponsored ADR | 252,732 | | 13,933,115 |
ITV PLC | 2,806,800 | | 9,016,966 |
Johnson Matthey PLC | 154,198 | | 8,375,289 |
Legal & General Group PLC | 814,483 | | 3,003,651 |
Lloyds Banking Group PLC (a) | 11,162,744 | | 14,647,619 |
Merlin Entertainments PLC (a) | 111,800 | | 661,858 |
Perform Group PLC (a) | 726,600 | | 2,695,198 |
Prudential PLC | 271,361 | | 6,063,294 |
Reckitt Benckiser Group PLC | 111,600 | | 8,857,657 |
Rightmove PLC | 63,200 | | 2,867,575 |
Rio Tinto PLC | 142,915 | | 8,076,079 |
Rio Tinto PLC sponsored ADR (d) | 34,900 | | 1,969,407 |
Rolls-Royce Group PLC | 322,708 | | 6,813,451 |
Royal Bank of Scotland Group PLC (a) | 255,480 | | 1,438,816 |
Royal Dutch Shell PLC: | | | |
Class A (United Kingdom) | 444,744 | | 15,938,859 |
Class B (United Kingdom) | 380,537 | | 14,353,927 |
Royal Mail PLC | 117,700 | | 1,110,960 |
SABMiller PLC | 351,000 | | 18,024,204 |
Standard Chartered PLC (United Kingdom) | 263,560 | | 5,935,614 |
Sthree PLC | 229,400 | | 1,372,298 |
Taylor Wimpey PLC | 2,474,500 | | 4,568,878 |
Travis Perkins PLC | 469,800 | | 14,563,511 |
Vodafone Group PLC | 1,384,000 | | 5,449,076 |
William Hill PLC | 1,702,144 | | 11,328,216 |
TOTAL UNITED KINGDOM | | 309,462,031 |
United States of America - 6.1% |
BlackRock, Inc. Class A | 14,100 | | 4,462,227 |
Common Stocks - continued |
| Shares | | Value |
United States of America - continued |
Boston Beer Co., Inc. Class A (a) | 8,900 | | $ 2,151,931 |
Deckers Outdoor Corp. (a)(d) | 99,200 | | 8,378,432 |
Dunkin' Brands Group, Inc. | 136,400 | | 6,574,480 |
eBay, Inc. (a) | 61,200 | | 3,359,268 |
GNC Holdings, Inc. | 95,400 | | 5,576,130 |
Google, Inc. Class A (a) | 16,200 | | 18,155,502 |
LinkedIn Corp. (a) | 17,200 | | 3,729,476 |
MercadoLibre, Inc. (d) | 49,400 | | 5,324,826 |
Monsanto Co. | 53,603 | | 6,247,430 |
Nimble Storage, Inc. | 2,600 | | 117,780 |
priceline.com, Inc. (a) | 9,460 | | 10,996,304 |
Tiffany & Co., Inc. | 112,000 | | 10,391,360 |
TripAdvisor, Inc. (a) | 62,300 | | 5,160,309 |
Visa, Inc. Class A | 62,000 | | 13,806,160 |
Yahoo!, Inc. (a) | 149,200 | | 6,033,648 |
TOTAL UNITED STATES OF AMERICA | | 110,465,263 |
TOTAL COMMON STOCKS (Cost $1,257,501,496) |
1,747,214,944
|
Nonconvertible Preferred Stocks - 1.4% |
| | | |
Germany - 1.4% |
Sartorius AG (non-vtg.) | 39,500 | | 4,701,510 |
Volkswagen AG | 75,447 | | 21,189,226 |
TOTAL NONCONVERTIBLE PREFERRED STOCKS (Cost $11,922,010) |
25,890,736
|
Money Market Funds - 4.1% |
| Shares | | Value |
Fidelity Cash Central Fund, 0.11% (b) | 34,580,052 | | $ 34,580,052 |
Fidelity Securities Lending Cash Central Fund, 0.11% (b)(c) | 39,914,173 | | 39,914,173 |
TOTAL MONEY MARKET FUNDS (Cost $74,494,225) |
74,494,225
|
TOTAL INVESTMENT PORTFOLIO - 102.2% (Cost $1,343,917,731) | | 1,847,599,905 |
NET OTHER ASSETS (LIABILITIES) - (2.2)% | | (39,561,554) |
NET ASSETS - 100% | $ 1,808,038,351 |
Legend |
(a) Non-income producing |
(b) Affiliated fund that is generally available only to investment companies and other accounts managed by Fidelity Investments. The rate quoted is the annualized seven-day yield of the fund at period end. A complete unaudited listing of the fund's holdings as of its most recent quarter end is available upon request. In addition, each Fidelity Central Fund's financial statements, which are not covered by the Fund's Report of Independent Registered Public Accounting Firm, are available on the SEC's website or upon request. |
(c) Investment made with cash collateral received from securities on loan. |
(d) Security or a portion of the security is on loan at period end. |
(e) Security exempt from registration under Rule 144A of the Securities Act of 1933. These securities may be resold in transactions exempt from registration, normally to qualified institutional buyers. At the end of the period, the value of these securities amounted to $294,360 or 0.0% of net assets. |
Affiliated Central Funds |
Information regarding fiscal year to date income earned by the Fund from investments in Fidelity Central Funds is as follows: |
Fund | Income earned |
Fidelity Cash Central Fund | $ 11,058 |
Fidelity Securities Lending Cash Central Fund | 754,879 |
Total | $ 765,937 |
Other Information |
Categorizations in the Schedule of Investments are based on country or territory of incorporation. |
The following is a summary of the inputs used, as of December 31, 2013, involving the Fund's assets and liabilities carried at fair value. The inputs or methodology used for valuing securities may not be an indication of the risk associated with investing in those securities. For more information on valuation inputs, and their aggregation into the levels used in the table below, please refer to the Investment Valuation section in the accompanying Notes to Financial Statements. |
Valuation Inputs at Reporting Date: |
Description | Total | Level 1 | Level 2 | Level 3 |
Investments in Securities: | | | | |
Equities: | | | | |
Consumer Discretionary | $ 497,362,480 | $ 390,393,555 | $ 106,968,925 | $ - |
Consumer Staples | 203,613,320 | 119,306,652 | 84,306,668 | - |
Energy | 56,707,155 | 12,808,941 | 43,898,214 | - |
Financials | 338,801,156 | 173,021,667 | 165,779,489 | - |
Health Care | 128,716,430 | 95,146,375 | 33,570,055 | - |
Industrials | 130,332,091 | 83,551,234 | 46,780,857 | - |
Information Technology | 270,351,069 | 197,055,823 | 73,295,246 | - |
Materials | 100,797,954 | 44,727,648 | 56,070,306 | - |
Telecommunication Services | 46,424,025 | 3,917,803 | 42,506,222 | - |
Money Market Funds | 74,494,225 | 74,494,225 | - | - |
Total Investments in Securities: | $ 1,847,599,905 | $ 1,194,423,923 | $ 653,175,982 | $ - |
The following is a summary of transfers between Level 1 and Level 2 for the period ended December 31, 2013. Transfers are assumed to have occurred at the beginning of the period, and are primarily attributable to the valuation techniques used for foreign equity securities, as discussed in the accompanying Notes to Financial Statements: |
Transfers | Total |
Level 1 to Level 2 | $ 0 |
Level 2 to Level 1 | $ 530,708,933 |
See accompanying notes which are an integral part of the financial statements.
Annual Report
Statement of Assets and Liabilities
| December 31, 2013 |
| | |
Assets | | |
Investment in securities, at value (including securities loaned of $38,862,215) - See accompanying schedule: Unaffiliated issuers (cost $1,269,423,506) | $ 1,773,105,680 | |
Fidelity Central Funds (cost $74,494,225) | 74,494,225 | |
Total Investments (cost $1,343,917,731) | | $ 1,847,599,905 |
Receivable for securities sold on a delayed delivery basis | | 45,957 |
Receivable for fund shares sold | | 2,078,849 |
Dividends receivable | | 1,985,474 |
Distributions receivable from Fidelity Central Funds | | 38,668 |
Prepaid expenses | | 3,648 |
Other receivables | | 270,054 |
Total assets | | 1,852,022,555 |
| | |
Liabilities | | |
Payable for fund shares redeemed | $ 2,015,620 | |
Accrued management fee | 1,010,943 | |
Distribution and service plan fees payable | 96,432 | |
Other affiliated payables | 179,248 | |
Other payables and accrued expenses | 767,788 | |
Collateral on securities loaned, at value | 39,914,173 | |
Total liabilities | | 43,984,204 |
| | |
Net Assets | | $ 1,808,038,351 |
Net Assets consist of: | | |
Paid in capital | | $ 1,618,339,631 |
Undistributed net investment income | | 13,677 |
Accumulated undistributed net realized gain (loss) on investments and foreign currency transactions | | (314,000,732) |
Net unrealized appreciation (depreciation) on investments and assets and liabilities in foreign currencies | | 503,685,775 |
Net Assets | | $ 1,808,038,351 |
Statement of Assets and Liabilities - continued
| December 31, 2013 |
| | |
Initial Class:
Net Asset Value, offering price and redemption price per share ($829,382,064 ÷ 40,174,442 shares) | | $ 20.64 |
| | |
Service Class:
Net Asset Value, offering price and redemption price per share ($118,920,402 ÷ 5,783,426 shares) | | $ 20.56 |
| | |
Service Class 2:
Net Asset Value, offering price and redemption price per share ($316,863,435 ÷ 15,479,074 shares) | | $ 20.47 |
| | |
Initial Class R:
Net Asset Value, offering price and redemption price per share ($104,015,956 ÷ 5,051,121 shares) | | $ 20.59 |
| | |
Service Class R:
Net Asset Value, offering price and redemption price per share ($54,146,183 ÷ 2,638,136 shares) | | $ 20.52 |
| | |
Service Class 2R:
Net Asset Value, offering price and redemption price per share ($90,537,215 ÷ 4,467,861 shares) | | $ 20.26 |
| | |
Investor Class R:
Net Asset Value, offering price and redemption price per share ($294,173,096 ÷ 14,292,070 shares) | | $ 20.58 |
See accompanying notes which are an integral part of the financial statements.
Annual Report
Statement of Operations
| Year ended December 31, 2013 |
| | |
Investment Income | | |
Dividends | | $ 36,752,732 |
Interest | | 66 |
Income from Fidelity Central Funds | | 765,937 |
Income before foreign taxes withheld | | 37,518,735 |
Less foreign taxes withheld | | (2,422,130) |
Total income | | 35,096,605 |
| | |
Expenses | | |
Management fee | $ 11,038,211 | |
Transfer agent fees | 1,291,075 | |
Distribution and service plan fees | 1,148,207 | |
Accounting and security lending fees | 713,026 | |
Custodian fees and expenses | 199,215 | |
Independent trustees' compensation | 8,374 | |
Appreciation in deferred trustee compensation account | 166 | |
Audit | 69,243 | |
Legal | 13,751 | |
Interest | 284 | |
Miscellaneous | 13,370 | |
Total expenses before reductions | 14,494,922 | |
Expense reductions | (193,403) | 14,301,519 |
Net investment income (loss) | | 20,795,086 |
Realized and Unrealized Gain (Loss) Net realized gain (loss) on: | | |
Investment securities: | | |
Unaffiliated issuers | 94,303,083 | |
Foreign currency transactions | (512,423) | |
Total net realized gain (loss) | | 93,790,660 |
Change in net unrealized appreciation (depreciation) on: Investment securities | 309,720,761 | |
Assets and liabilities in foreign currencies | 33,566 | |
Total change in net unrealized appreciation (depreciation) | | 309,754,327 |
Net gain (loss) | | 403,544,987 |
Net increase (decrease) in net assets resulting from operations | | $ 424,340,073 |
Statement of Changes in Net Assets
| Year ended
December 31, 2013 | Year ended
December 31, 2012 |
Increase (Decrease) in Net Assets | | |
Operations | | |
Net investment income (loss) | $ 20,795,086 | $ 26,849,201 |
Net realized gain (loss) | 93,790,660 | 6,602,044 |
Change in net unrealized appreciation (depreciation) | 309,754,327 | 240,168,202 |
Net increase (decrease) in net assets resulting from operations | 424,340,073 | 273,619,447 |
Distributions to shareholders from net investment income | (20,735,911) | (26,228,448) |
Distributions to shareholders from net realized gain | (6,041,894) | (5,357,064) |
Total distributions | (26,777,805) | (31,585,512) |
Share transactions - net increase (decrease) | (86,109,747) | (136,580,307) |
Redemption fees | 19,250 | 11,237 |
Total increase (decrease) in net assets | 311,471,771 | 105,464,865 |
| | |
Net Assets | | |
Beginning of period | 1,496,566,580 | 1,391,101,715 |
End of period (including undistributed net investment income of $13,677 and distributions in excess of net investment income of $45,499, respectively) | $ 1,808,038,351 | $ 1,496,566,580 |
See accompanying notes which are an integral part of the financial statements.
Annual Report
Financial Highlights - Initial Class
Years ended December 31, | 2013 | 2012 | 2011 | 2010 | 2009 |
Selected Per-Share Data | | | | | |
Net asset value, beginning of period | $ 16.09 | $ 13.63 | $ 16.77 | $ 15.05 | $ 12.17 |
Income from Investment Operations | | | | | |
Net investment income (loss) C | .25 | .29 | .26 | .21 | .28 |
Net realized and unrealized gain (loss) | 4.63 | 2.53 | (3.14) | 1.76 | 2.93 |
Total from investment operations | 4.88 | 2.82 | (2.88) | 1.97 | 3.21 |
Distributions from net investment income | (.26) | (.30) F | (.23) | (.22) | (.29) |
Distributions from net realized gain | (.07) | (.06) F | (.03) | (.03) | (.04) |
Total distributions | (.33) | (.36) | (.26) | (.25) | (.33) |
Redemption fees added to paid in capital C,H | - | - | - | - | - |
Net asset value, end of period | $ 20.64 | $ 16.09 | $ 13.63 | $ 16.77 | $ 15.05 |
Total Return A,B | 30.44% | 20.74% | (17.16)% | 13.11% | 26.53% |
Ratios to Average Net Assets D,G | | | | | |
Expenses before reductions | .84% | .85% | .85% | .86% | .88% |
Expenses net of fee waivers, if any | .84% | .85% | .85% | .85% | .88% |
Expenses net of all reductions | .83% | .83% | .83% | .83% | .84% |
Net investment income (loss) | 1.41% | 1.94% | 1.59% | 1.41% | 2.17% |
Supplemental Data | | | | | |
Net assets, end of period (000 omitted) | $ 829,382 | $ 659,258 | $ 598,862 | $ 779,501 | $ 758,018 |
Portfolio turnover rate E | 34% | 41% | 45% | 50% | 78% |
A Total returns do not reflect charges attributable to your insurance company's separate account. Inclusion of these charges would reduce the total returns shown.
B Total returns would have been lower if certain expenses had not been reduced during the applicable periods shown.
C Calculated based on average shares outstanding during the period.
D Fees and expenses of any underlying Fidelity Central Funds are not included in the Fund's expense ratio. The Fund indirectly bears its proportionate share of the expenses of any underlying Fidelity Central Funds.
E Amount does not include the portfolio activity of any underlying Fidelity Central Funds.
F The amounts shown reflect certain reclassifications related to book to tax differences that were made in the year shown.
G Expense ratios reflect operating expenses of the class. Expenses before reductions do not reflect amounts reimbursed by the investment adviser or reductions from brokerage service arrangements or reductions from other expense offset arrangements and do not represent the amount paid by the class during periods when reimbursements or reductions occur. Expenses net of fee waivers reflect expenses after reimbursement by the investment adviser but prior to reductions from brokerage service arrangements or other expense offset arrangements. Expenses net of all reductions represent the net expenses paid by the class.
H Amount represents less than $.01 per share.
Financial Highlights - Service Class
Years ended December 31, | 2013 | 2012 | 2011 | 2010 | 2009 |
Selected Per-Share Data | | | | | |
Net asset value, beginning of period | $ 16.02 | $ 13.58 | $ 16.70 | $ 14.99 | $ 12.12 |
Income from Investment Operations | | | | | |
Net investment income (loss) C | .24 | .28 | .24 | .19 | .26 |
Net realized and unrealized gain (loss) | 4.61 | 2.50 | (3.12) | 1.75 | 2.93 |
Total from investment operations | 4.85 | 2.78 | (2.88) | 1.94 | 3.19 |
Distributions from net investment income | (.24) | (.29) F | (.21) | (.20) | (.28) |
Distributions from net realized gain | (.07) | (.06) F | (.03) | (.03) | (.04) |
Total distributions | (.31) | (.34) I | (.24) | (.23) | (.32) |
Redemption fees added to paid in capital C,H | - | - | - | - | - |
Net asset value, end of period | $ 20.56 | $ 16.02 | $ 13.58 | $ 16.70 | $ 14.99 |
Total Return A,B | 30.38% | 20.54% | (17.23)% | 12.99% | 26.44% |
Ratios to Average Net Assets D,G | | | | | |
Expenses before reductions | .94% | .95% | .95% | .96% | .98% |
Expenses net of fee waivers, if any | .94% | .95% | .95% | .95% | .98% |
Expenses net of all reductions | .93% | .93% | .93% | .93% | .94% |
Net investment income (loss) | 1.31% | 1.84% | 1.49% | 1.31% | 2.07% |
Supplemental Data | | | | | |
Net assets, end of period (000 omitted) | $ 118,920 | $ 110,468 | $ 108,921 | $ 162,394 | $ 171,252 |
Portfolio turnover rate E | 34% | 41% | 45% | 50% | 78% |
A Total returns do not reflect charges attributable to your insurance company's separate account. Inclusion of these charges would reduce the total returns shown.
B Total returns would have been lower if certain expenses had not been reduced during the applicable periods shown.
C Calculated based on average shares outstanding during the period.
D Fees and expenses of any underlying Fidelity Central Funds are not included in the Fund's expense ratio. The Fund indirectly bears its proportionate share of the expenses of any underlying Fidelity Central Funds.
E Amount does not include the portfolio activity of any underlying Fidelity Central Funds.
F The amounts shown reflect certain reclassifications related to book to tax differences that were made in the year shown.
G Expense ratios reflect operating expenses of the class. Expenses before reductions do not reflect amounts reimbursed by the investment adviser or reductions from brokerage service arrangements or reductions from other expense offset arrangements and do not represent the amount paid by the class during periods when reimbursements or reductions occur. Expenses net of fee waivers reflect expenses after reimbursement by the investment adviser but prior to reductions from brokerage service arrangements or other expense offset arrangements. Expenses net of all reductions represent the net expenses paid by the class.
H Amount represents less than $.01 per share.
I Total distributions of $.34 per share is comprised of distributions from net investment income of $.286 and distributions from net realized gain of $.059 per share.
See accompanying notes which are an integral part of the financial statements.
Annual Report
Financial Highlights - Service Class 2
Years ended December 31, | 2013 | 2012 | 2011 | 2010 | 2009 |
Selected Per-Share Data | | | | | |
Net asset value, beginning of period | $ 15.95 | $ 13.52 | $ 16.62 | $ 14.92 | $ 12.07 |
Income from Investment Operations | | | | | |
Net investment income (loss) C | .21 | .25 | .21 | .17 | .24 |
Net realized and unrealized gain (loss) | 4.59 | 2.50 | (3.09) | 1.74 | 2.91 |
Total from investment operations | 4.80 | 2.75 | (2.88) | 1.91 | 3.15 |
Distributions from net investment income | (.21) | (.26) F | (.19) | (.18) | (.26) |
Distributions from net realized gain | (.07) | (.06) F | (.03) | (.03) | (.04) |
Total distributions | (.28) | (.32) | (.22) | (.21) | (.30) |
Redemption fees added to paid in capital C,H | - | - | - | - | - |
Net asset value, end of period | $ 20.47 | $ 15.95 | $ 13.52 | $ 16.62 | $ 14.92 |
Total Return A,B | 30.17% | 20.38% | (17.34)% | 12.83% | 26.22% |
Ratios to Average Net Assets D,G | | | | | |
Expenses before reductions | 1.09% | 1.10% | 1.10% | 1.11% | 1.12% |
Expenses net of fee waivers, if any | 1.09% | 1.10% | 1.10% | 1.10% | 1.12% |
Expenses net of all reductions | 1.08% | 1.08% | 1.08% | 1.08% | 1.09% |
Net investment income (loss) | 1.16% | 1.69% | 1.34% | 1.16% | 1.93% |
Supplemental Data | | | | | |
Net assets, end of period (000 omitted) | $ 316,863 | $ 349,364 | $ 342,206 | $ 461,033 | $ 457,971 |
Portfolio turnover rate E | 34% | 41% | 45% | 50% | 78% |
A Total returns do not reflect charges attributable to your insurance company's separate account. Inclusion of these charges would reduce the total returns shown.
B Total returns would have been lower if certain expenses had not been reduced during the applicable periods shown.
C Calculated based on average shares outstanding during the period.
D Fees and expenses of any underlying Fidelity Central Funds are not included in the Fund's expense ratio. The Fund indirectly bears its proportionate share of the expenses of any underlying Fidelity Central Funds.
E Amount does not include the portfolio activity of any underlying Fidelity Central Funds.
F The amounts shown reflect certain reclassifications related to book to tax differences that were made in the year shown.
G Expense ratios reflect operating expenses of the class. Expenses before reductions do not reflect amounts reimbursed by the investment adviser or reductions from brokerage service arrangements or reductions from other expense offset arrangements and do not represent the amount paid by the class during periods when reimbursements or reductions occur. Expenses net of fee waivers reflect expenses after reimbursement by the investment adviser but prior to reductions from brokerage service arrangements or other expense offset arrangements. Expenses net of all reductions represent the net expenses paid by the class.
H Amount represents less than $.01 per share.
Financial Highlights - Initial Class R
Years ended December 31, | 2013 | 2012 | 2011 | 2010 | 2009 |
Selected Per-Share Data | | | | | |
Net asset value, beginning of period | $ 16.05 | $ 13.60 | $ 16.73 | $ 15.02 | $ 12.14 |
Income from Investment Operations | | | | | |
Net investment income (loss) C | .25 | .29 | .26 | .21 | .28 |
Net realized and unrealized gain (loss) | 4.62 | 2.52 | (3.13) | 1.75 | 2.93 |
Total from investment operations | 4.87 | 2.81 | (2.87) | 1.96 | 3.21 |
Distributions from net investment income | (.26) | (.30) F | (.23) | (.22) | (.29) |
Distributions from net realized gain | (.07) | (.06) F | (.03) | (.03) | (.04) |
Total distributions | (.33) | (.36) | (.26) | (.25) | (.33) |
Redemption fees added to paid in capital C,H | - | - | - | - | - |
Net asset value, end of period | $ 20.59 | $ 16.05 | $ 13.60 | $ 16.73 | $ 15.02 |
Total Return A,B | 30.45% | 20.71% | (17.14)% | 13.07% | 26.60% |
Ratios to Average Net Assets D,G | | | | | |
Expenses before reductions | .84% | .85% | .85% | .86% | .88% |
Expenses net of fee waivers, if any | .84% | .85% | .85% | .85% | .88% |
Expenses net of all reductions | .83% | .83% | .83% | .83% | .84% |
Net investment income (loss) | 1.41% | 1.94% | 1.59% | 1.41% | 2.17% |
Supplemental Data | | | | | |
Net assets, end of period (000 omitted) | $ 104,016 | $ 88,587 | $ 85,922 | $ 122,655 | $ 128,689 |
Portfolio turnover rate E | 34% | 41% | 45% | 50% | 78% |
A Total returns do not reflect charges attributable to your insurance company's separate account. Inclusion of these charges would reduce the total returns shown.
B Total returns would have been lower if certain expenses had not been reduced during the applicable periods shown.
C Calculated based on average shares outstanding during the period.
D Fees and expenses of any underlying Fidelity Central Funds are not included in the Fund's expense ratio. The Fund indirectly bears its proportionate share of the expenses of any underlying Fidelity Central Funds.
E Amount does not include the portfolio activity of any underlying Fidelity Central Funds.
F The amounts shown reflect certain reclassifications related to book to tax differences that were made in the year shown.
G Expense ratios reflect operating expenses of the class. Expenses before reductions do not reflect amounts reimbursed by the investment adviser or reductions from brokerage service arrangements or reductions from other expense offset arrangements and do not represent the amount paid by the class during periods when reimbursements or reductions occur. Expenses net of fee waivers reflect expenses after reimbursement by the investment adviser but prior to reductions from brokerage service arrangements or other expense offset arrangements. Expenses net of all reductions represent the net expenses paid by the class.
H Amount represents less than $.01 per share.
See accompanying notes which are an integral part of the financial statements.
Annual Report
Financial Highlights - Service Class R
Years ended December 31, | 2013 | 2012 | 2011 | 2010 | 2009 |
Selected Per-Share Data | | | | | |
Net asset value, beginning of period | $ 16.00 | $ 13.56 | $ 16.68 | $ 14.97 | $ 12.10 |
Income from Investment Operations | | | | | |
Net investment income (loss) C | .24 | .28 | .24 | .19 | .27 |
Net realized and unrealized gain (loss) | 4.59 | 2.51 | (3.12) | 1.75 | 2.92 |
Total from investment operations | 4.83 | 2.79 | (2.88) | 1.94 | 3.19 |
Distributions from net investment income | (.24) | (.29) F | (.21) | (.20) | (.28) |
Distributions from net realized gain | (.07) | (.06) F | (.03) | (.03) | (.04) |
Total distributions | (.31) | (.35) | (.24) | (.23) | (.32) |
Redemption fees added to paid in capital C,H | - | - | - | - | - |
Net asset value, end of period | $ 20.52 | $ 16.00 | $ 13.56 | $ 16.68 | $ 14.97 |
Total Return A,B | 30.30% | 20.58% | (17.24)% | 13.01% | 26.49% |
Ratios to Average Net Assets D,G | | | | | |
Expenses before reductions | .94% | .94% | .95% | .96% | .97% |
Expenses net of fee waivers, if any | .93% | .94% | .94% | .95% | .97% |
Expenses net of all reductions | .92% | .93% | .93% | .93% | .94% |
Net investment income (loss) | 1.31% | 1.84% | 1.49% | 1.31% | 2.08% |
Supplemental Data | | | | | |
Net assets, end of period (000 omitted) | $ 54,146 | $ 45,774 | $ 43,414 | $ 60,617 | $ 66,014 |
Portfolio turnover rate E | 34% | 41% | 45% | 50% | 78% |
A Total returns do not reflect charges attributable to your insurance company's separate account. Inclusion of these charges would reduce the total returns shown.
B Total returns would have been lower if certain expenses had not been reduced during the applicable periods shown.
C Calculated based on average shares outstanding during the period.
D Fees and expenses of any underlying Fidelity Central Funds are not included in the Fund's expense ratio. The Fund indirectly bears its proportionate share of the expenses of any underlying Fidelity Central Funds.
E Amount does not include the portfolio activity of any underlying Fidelity Central Funds.
F The amounts shown reflect certain reclassifications related to book to tax differences that were made in the year shown.
G Expense ratios reflect operating expenses of the class. Expenses before reductions do not reflect amounts reimbursed by the investment adviser or reductions from brokerage service arrangements or reductions from other expense offset arrangements and do not represent the amount paid by the class during periods when reimbursements or reductions occur. Expenses net of fee waivers reflect expenses after reimbursement by the investment adviser but prior to reductions from brokerage service arrangements or other expense offset arrangements. Expenses net of all reductions represent the net expenses paid by the class.
H Amount represents less than $.01 per share.
Financial Highlights - Service Class 2R
Years ended December 31, | 2013 | 2012 | 2011 | 2010 | 2009 |
Selected Per-Share Data | | | | | |
Net asset value, beginning of period | $ 15.80 | $ 13.40 | $ 16.48 | $ 14.80 | $ 11.98 |
Income from Investment Operations | | | | | |
Net investment income (loss) C | .21 | .25 | .21 | .17 | .25 |
Net realized and unrealized gain (loss) | 4.54 | 2.47 | (3.07) | 1.73 | 2.87 |
Total from investment operations | 4.75 | 2.72 | (2.86) | 1.90 | 3.12 |
Distributions from net investment income | (.22) | (.26) F | (.19) | (.19) | (.26) |
Distributions from net realized gain | (.07) | (.06) F | (.03) | (.03) | (.04) |
Total distributions | (.29) | (.32) | (.22) | (.22) | (.30) |
Redemption fees added to paid in capital C,H | - | - | - | - | - |
Net asset value, end of period | $ 20.26 | $ 15.80 | $ 13.40 | $ 16.48 | $ 14.80 |
Total Return A,B | 30.15% | 20.36% | (17.33)% | 12.82% | 26.20% |
Ratios to Average Net Assets D,G | | | | | |
Expenses before reductions | 1.09% | 1.09% | 1.10% | 1.11% | 1.12% |
Expenses net of fee waivers, if any | 1.08% | 1.09% | 1.09% | 1.10% | 1.12% |
Expenses net of all reductions | 1.07% | 1.08% | 1.08% | 1.08% | 1.09% |
Net investment income (loss) | 1.16% | 1.69% | 1.34% | 1.16% | 1.93% |
Supplemental Data | | | | | |
Net assets, end of period (000 omitted) | $ 90,537 | $ 67,674 | $ 58,968 | $ 69,393 | $ 64,200 |
Portfolio turnover rate E | 34% | 41% | 45% | 50% | 78% |
A Total returns do not reflect charges attributable to your insurance company's separate account. Inclusion of these charges would reduce the total returns shown.
B Total returns would have been lower if certain expenses had not been reduced during the applicable periods shown.
C Calculated based on average shares outstanding during the period.
D Fees and expenses of any underlying Fidelity Central Funds are not included in the Fund's expense ratio. The Fund indirectly bears its proportionate share of the expenses of any underlying Fidelity Central Funds.
E Amount does not include the portfolio activity of any underlying Fidelity Central Funds.
F The amounts shown reflect certain reclassifications related to book to tax differences that were made in the year shown.
G Expense ratios reflect operating expenses of the class. Expenses before reductions do not reflect amounts reimbursed by the investment adviser or reductions from brokerage service arrangements or reductions from other expense offset arrangements and do not represent the amount paid by the class during periods when reimbursements or reductions occur. Expenses net of fee waivers reflect expenses after reimbursement by the investment adviser but prior to reductions from brokerage service arrangements or other expense offset arrangements. Expenses net of all reductions represent the net expenses paid by the class.
H Amount represents less than $.01 per share.
See accompanying notes which are an integral part of the financial statements.
Annual Report
Financial Highlights - Investor Class R
Years ended December 31, | 2013 | 2012 | 2011 | 2010 | 2009 |
Selected Per-Share Data | | | | | |
Net asset value, beginning of period | $ 16.04 | $ 13.60 | $ 16.73 | $ 15.01 | $ 12.14 |
Income from Investment Operations | | | | | |
Net investment income (loss) C | .24 | .28 | .24 | .20 | .27 |
Net realized and unrealized gain (loss) | 4.62 | 2.51 | (3.12) | 1.76 | 2.92 |
Total from investment operations | 4.86 | 2.79 | (2.88) | 1.96 | 3.19 |
Distributions from net investment income | (.25) | (.29) F | (.22) | (.21) | (.28) |
Distributions from net realized gain | (.07) | (.06) F | (.03) | (.03) | (.04) |
Total distributions | (.32) | (.35) | (.25) | (.24) | (.32) |
Redemption fees added to paid in capital C,H | - | - | - | - | - |
Net asset value, end of period | $ 20.58 | $ 16.04 | $ 13.60 | $ 16.73 | $ 15.01 |
Total Return A,B | 30.40% | 20.54% | (17.22)% | 13.07% | 26.42% |
Ratios to Average Net Assets D,G | | | | | |
Expenses before reductions | .92% | .93% | .93% | .95% | .97% |
Expenses net of fee waivers, if any | .92% | .93% | .93% | .94% | .97% |
Expenses net of all reductions | .91% | .92% | .91% | .92% | .94% |
Net investment income (loss) | 1.33% | 1.85% | 1.51% | 1.32% | 2.08% |
Supplemental Data | | | | | |
Net assets, end of period (000 omitted) | $ 294,173 | $ 175,442 | $ 152,810 | $ 177,984 | $ 148,806 |
Portfolio turnover rate E | 34% | 41% | 45% | 50% | 78% |
A Total returns do not reflect charges attributable to your insurance company's separate account. Inclusion of these charges would reduce the total returns shown.
B Total returns would have been lower if certain expenses had not been reduced during the applicable periods shown.
C Calculated based on average shares outstanding during the period.
D Fees and expenses of any underlying Fidelity Central Funds are not included in the Fund's expense ratio. The Fund indirectly bears its proportionate share of the expenses of any underlying Fidelity Central Funds.
E Amount does not include the portfolio activity of any underlying Fidelity Central Funds.
F The amounts shown reflect certain reclassifications related to book to tax differences that were made in the year shown.
G Expense ratios reflect operating expenses of the class. Expenses before reductions do not reflect amounts reimbursed by the investment adviser or reductions from brokerage service arrangements or reductions from other expense offset arrangements and do not represent the amount paid by the class during periods when reimbursements or reductions occur. Expenses net of fee waivers reflect expenses after reimbursement by the investment adviser but prior to reductions from brokerage service arrangements or other expense offset arrangements. Expenses net of all reductions represent the net expenses paid by the class.
H Amount represents less than $.01 per share.
See accompanying notes which are an integral part of the financial statements.
Annual Report
Notes to Financial Statements
For the period ended December 31, 2013
1. Organization.
VIP Overseas Portfolio (the Fund) is a fund of Variable Insurance Products Fund (the Trust) and is authorized to issue an unlimited number of shares. The Trust is registered under the Investment Company Act of 1940, as amended (the 1940 Act), as an open-end management investment company organized as a Massachusetts business trust. Shares of the Fund may only be purchased by insurance companies for the purpose of funding variable annuity or variable life insurance contracts. The Fund offers the following classes of shares: Initial Class shares, Service Class shares, Service Class 2 shares, Initial Class R shares, Service Class R shares, Service Class 2R shares and Investor Class R shares. All classes have equal rights and voting privileges, except for matters affecting a single class. The Fund's investments in emerging markets can be subject to social, economic, regulatory, and political uncertainties and can be extremely volatile.
2. Investments in Fidelity Central Funds.
The Fund invests in Fidelity Central Funds, which are open-end investment companies generally available only to other investment companies and accounts managed by the investment adviser and its affiliates. The Fund's Schedule of Investments lists each of the Fidelity Central Funds held as of period end, if any, as an investment of the Fund, but does not include the underlying holdings of each Fidelity Central Fund. As an Investing Fund, the Fund indirectly bears its proportionate share of the expenses of the underlying Fidelity Central Funds.
The Money Market Central Funds seek preservation of capital and current income and are managed by Fidelity Investments Money Management, Inc. (FIMM), an affiliate of the investment adviser. Annualized expenses of the Money Market Central Funds as of their most recent shareholder report date are less than .01%.
A complete unaudited list of holdings for each Fidelity Central Fund is available upon request or at the Securities and Exchange Commission (the SEC) website at www.sec.gov. In addition, the financial statements of the Fidelity Central Funds, which are not covered by the Fund's Report of Independent Registered Public Accounting Firm, are available on the SEC website or upon request.
3. Significant Accounting Policies.
The financial statements have been prepared in conformity with accounting principles generally accepted in the United States of America (GAAP), which require management to make certain estimates and assumptions at the date of the financial statements. Actual results could differ from those estimates. Subsequent events, if any, through the date that the financial statements were issued have been evaluated in the preparation of the financial statements. The following summarizes the significant accounting policies of the Fund:
Investment Valuation. Investments are valued as of 4:00 p.m. Eastern time on the last calendar day of the period. In accordance with valuation policies and procedures approved by the Board of Trustees (the Board), the Fund attempts to obtain prices from one or more third party pricing vendors or brokers to value its investments. When current market prices, quotations or currency exchange rates are not readily available or reliable, investments will be fair valued in good faith by the Fidelity Management & Research Company (FMR) Fair Value Committee (the Committee), in accordance with procedures adopted by the Board. Factors used in determining fair value vary by investment type and may include market or investment specific events. The frequency with which these procedures are used cannot be predicted and they may be utilized to a significant extent. The Committee oversees the Fund's valuation policies and procedures and is responsible for approving and reporting to the Board all fair value determinations.
The Fund categorizes the inputs to valuation techniques used to value its investments into a disclosure hierarchy consisting of three levels as shown below:
Level 1 - quoted prices in active markets for identical investments
Level 2 - other significant observable inputs (including quoted prices for similar investments, interest rates, prepayment speeds, etc.)
Level 3 - unobservable inputs (including the Fund's own assumptions based on the best information available)
Valuation techniques used to value the Fund's investments by major category are as follows:
Equity securities, including restricted securities, for which market quotations are readily available, are valued at the last reported sale price or official closing price as reported by a third party pricing vendor on the primary market or exchange on which they are traded and are categorized as Level 1 in the hierarchy. In the event there were no sales during the day or closing prices are not available, securities are valued at the last quoted bid price or may be valued using the last available price and are generally categorized as Level 2 in the hierarchy. For foreign equity securities, when market or security specific events arise, comparisons to the valuation of American Depositary Receipts (ADRs), futures contracts, Exchange-Traded Funds (ETFs) and certain indexes as well as quoted prices for similar securities may be used and would be categorized as Level 2 in the hierarchy. Utilizing these techniques may result in transfers between Level 1 and Level 2. For equity securities, including restricted securities, where observable inputs are limited, assumptions about market activity and risk are used and these securities may be categorized as Level 3 in the hierarchy.
Annual Report
Notes to Financial Statements - continued
3. Significant Accounting Policies - continued
Investment Valuation - continued
Investments in open-end mutual funds, including the Fidelity Central Funds, are valued at their closing net asset value (NAV) each business day and are categorized as Level 1 in the hierarchy.
Changes in valuation techniques may result in transfers in or out of an assigned level within the disclosure hierarchy. The aggregate value of investments by input level, as of December 31, 2013, including information on transfers between Levels 1 and 2, is included at the end of the Fund's Schedule of Investments.
Foreign Currency. The Fund may use foreign currency contracts to facilitate transactions in foreign-denominated securities. Gains and losses from these transactions may arise from changes in the value of the foreign currency or if the counterparties do not perform under the contracts' terms.
Foreign-denominated assets, including investment securities, and liabilities are translated into U.S. dollars at the exchange rates at period end. Purchases and sales of investment securities, income and dividends received and expenses denominated in foreign currencies are translated into U.S. dollars at the exchange rate in effect on the transaction date.
The effects of exchange rate fluctuations on investments are included with the net realized and unrealized gain (loss) on investment securities. Other foreign currency transactions resulting in realized and unrealized gain (loss) are disclosed separately.
Investment Transactions and Income. For financial reporting purposes, the Fund's investment holdings and NAV include trades executed through the end of the last business day of the period. The NAV per share for processing shareholder transactions is calculated as of the close of business of the New York Stock Exchange (NYSE), normally 4:00 p.m. Eastern time and includes trades executed through the end of the prior business day. Gains and losses on securities sold are determined on the basis of identified cost and may include proceeds received from litigation. Dividend income is recorded on the ex-dividend date, except for certain dividends from foreign securities where the ex-dividend date may have passed, which are recorded as soon as the Fund is informed of the ex-dividend date. Non-cash dividends included in dividend income, if any, are recorded at the fair market value of the securities received. Interest income and distributions from the Fidelity Central Funds are accrued as earned. Interest income includes coupon interest and amortization of premium and accretion of discount on debt securities. Investment income is recorded net of foreign taxes withheld where recovery of such taxes is uncertain.
Class Allocations and Expenses. Investment income, realized and unrealized capital gains and losses, common expenses of the Fund, and certain fund-level expense reductions, if any, are allocated daily on a pro-rata basis to each class based on the relative net assets of each class to the total net assets of the Fund. Each class differs with respect to transfer agent and distribution and service plan fees incurred. Certain expense reductions may also differ by class. For the reporting period, the allocated portion of income and expenses to each class as a percent of its average net assets may vary due to the timing of recording these transactions in relation to fluctuating net assets of the classes. Expenses directly attributable to a fund are charged to that fund. Expenses attributable to more than one fund are allocated among the respective funds on the basis of relative net assets or other appropriate methods. Expense estimates are accrued in the period to which they relate and adjustments are made when actual amounts are known.
Deferred Trustee Compensation. Under a Deferred Compensation Plan (the Plan), independent Trustees may elect to defer receipt of a portion of their annual compensation. Deferred amounts are invested in a cross-section of Fidelity funds, are marked-to-market and remain in the Fund until distributed in accordance with the Plan. The investment of deferred amounts and the offsetting payable to the Trustees are included in the accompanying Statement of Assets and Liabilities.
Income Tax Information and Distributions to Shareholders. Each year, the Fund intends to qualify as a regulated investment company under Subchapter M of the Internal Revenue Code, including distributing substantially all of its taxable income and realized gains. As a result, no provision for U.S. Federal income taxes is required. As of December 31, 2013, the Fund did not have any unrecognized tax benefits in the financial statements; nor is the Fund aware of any tax positions for which it is reasonably possible that the total amounts of unrecognized tax benefits will significantly change in the next twelve months. The Fund files a U.S. federal tax return, in addition to state and local tax returns as required. The Fund's federal income tax returns are subject to examination by the Internal Revenue Service (IRS) for a period of three fiscal years after they are filed. State and local tax returns may be subject to examination for an additional fiscal year depending on the jurisdiction. Foreign taxes are provided for based on the Fund's understanding of the tax rules and rates that exist in the foreign markets in which it invests.
Distributions are declared and recorded on the ex-dividend date. Income dividends and capital gain distributions are declared separately for each class. Income and capital gain distributions are determined in accordance with income tax regulations, which may differ from GAAP. These differences resulted in distribution reclassifications for the period ended December 31, 2012.
Capital accounts within the financial statements are adjusted for permanent book-tax differences. These adjustments have no impact on net assets or the results of operations. Capital accounts are not adjusted for temporary book-tax differences which will reverse in a subsequent period.
Annual Report
3. Significant Accounting Policies - continued
Income Tax Information and Distributions to Shareholders - continued
Book-tax differences are primarily due to foreign currency transactions, passive foreign investment companies (PFIC), deferred trustees compensation, capital loss carryforwards and losses deferred due to wash sales and excise tax regulations.
The federal tax cost of investment securities and unrealized appreciation (depreciation) as of period end were as follows:
Gross unrealized appreciation | $ 556,965,468 |
Gross unrealized depreciation | (74,556,149) |
Net unrealized appreciation (depreciation) on securities and other investments | $ 482,409,319 |
| |
Tax Cost | $ 1,365,190,586 |
The tax-based components of distributable earnings as of period end were as follows:
Undistributed ordinary income | $ 290,529 |
Capital loss carryforward | $ (292,951,303) |
Net unrealized appreciation (depreciation) | $ 482,412,920 |
Capital loss carryforwards are only available to offset future capital gains of the Fund to the extent provided by regulations and may be limited. Under the Regulated Investment Company Modernization Act of 2010 (the Act), the Fund is permitted to carry forward capital losses incurred in taxable years beginning after December 22, 2010 for an unlimited period and such capital losses are required to be used prior to any losses that expire. The capital loss carryforward information presented below, including any applicable limitation, is estimated as of fiscal period end and is subject to adjustment.
Fiscal year of expiration | |
2016 | $ (12,503,833) |
2017 | (280,447,470) |
Total capital loss carryforward | $ (292,951,303) |
The tax character of distributions paid was as follows:
| December 31, 2013 | December 31, 2012 |
Ordinary Income | $ 26,777,805 | $ 31,585,512 |
Trading (Redemption) Fees. Initial Class R shares, Service Class R shares, Service Class 2R shares and Investor Class R shares held by investors less than 60 days may be subject to a redemption fee equal to 1% of the NAV of shares redeemed. All redemption fees, which reduce the proceeds of the shareholder redemption, are retained by the Fund and accounted for as an addition to paid in capital.
Delayed Delivery Transactions and When-Issued Securities. During the period, the Fund transacted in securities on a delayed delivery or when-issued basis. Payment and delivery may take place after the customary settlement period for that security. The price of the underlying securities and the date when the securities will be delivered and paid for are fixed at the time the transaction is negotiated. With respect to purchase commitments, the Fund identifies securities as segregated in its records with a value at least equal to the amount of the commitment. Losses may arise due to changes in the value of the underlying securities or if the counterparty does not perform under the contract's terms, or if the issuer does not issue the securities due to political, economic, or other factors.
Restricted Securities. The Fund may invest in securities that are subject to legal or contractual restrictions on resale. These securities generally may be resold in transactions exempt from registration or to the public if the securities are registered. Disposal of these securities may involve time-consuming negotiations and expense, and prompt sale at an acceptable price may be difficult. Information regarding restricted securities is included at the end of the Fund's Schedule of Investments.
4. Purchases and Sales of Investments.
Purchases and sales of securities, other than short-term securities, aggregated $532,962,696 and $646,936,207, respectively.
Annual Report
Notes to Financial Statements - continued
5. Fees and Other Transactions with Affiliates.
Management Fee. Fidelity Management & Research Company (the investment adviser) and its affiliates provide the Fund with investment management related services for which the Fund pays a monthly management fee. The management fee is the sum of an individual fund fee rate that is based on an annual rate of .45% of the Fund's average net assets and an annualized group fee rate that averaged .25% during the period. The group fee rate is based upon the average net assets of all the mutual funds advised by the investment adviser, including any mutual funds previously advised by the investment adviser that are currently advised by Fidelity SelectCo, LLC, an affiliate of the investment adviser. The group fee rate decreases as assets under management increase and increases as assets under management decrease. For the reporting period, the total annual management fee rate was .70% of the Fund's average net assets.
Distribution and Service Plan Fees. In accordance with Rule 12b-1 of the 1940 Act, the Fund has adopted separate 12b-1 Plans for each Service Class of shares. Each Service Class pays Fidelity Distributors Corporation (FDC), an affiliate of the investment adviser, a service fee. For the period, the service fee is based on an annual rate of .10% of Service Class' and Service Class R's average net assets and .25% of Service Class 2's and Service Class 2R's average net assets.
For the period, total fees, all of which were re-allowed to insurance companies for the distribution of shares and providing shareholder support services were as follows:
Service Class | $ 110,707 |
Service Class 2 | 799,337 |
Service Class R | 48,831 |
Service Class 2R | 189,332 |
| $ 1,148,207 |
Transfer Agent Fees. Fidelity Investments Institutional Operations Company, Inc. (FIIOC), an affiliate of the investment adviser, is the Fund's transfer, dividend disbursing, and shareholder servicing agent. FIIOC receives an asset-based fee with respect to each class. Each class (with the exception of Investor Class R) pays a transfer agent fee, excluding out of pocket expenses, equal to an annual rate of .07% of average net assets. Investor Class R pays a monthly asset-based transfer agent fee of .15% of average net assets. In addition, FIIOC receives an asset-based fee of ..0035% of average net assets for typesetting, printing and mailing of shareholder reports, except proxy statements. FIIOC voluntarily agreed to reimburse or waive this fee for the period January 1, 2013 through December 31, 2013 (see Expense Reductions note). For the period, transfer agent fees for each class, including printing and out of pocket expenses, were as follows:
Initial Class | $ 505,999 |
Service Class | 79,026 |
Service Class 2 | 226,507 |
Initial Class R | 66,258 |
Service Class R | 33,501 |
Service Class 2R | 51,945 |
Investor Class R | 327,839 |
| $ 1,291,075 |
Effective February 1, 2014, the Board of Trustees approved an amendment to the transfer agent fee agreement whereby each class (with the exception of Investor Class R) pays a single fee of .07% of average net assets for transfer agent services, typesetting, printing and mailing of shareholder reports, excluding mailing of proxy statements and out of pocket expenses. Investor Class R pays a single fee of .15% of average net assets.
Accounting and Security Lending Fees. Fidelity Service Company, Inc. (FSC), an affiliate of the investment adviser, maintains the Fund's accounting records. The accounting fee is based on the level of average net assets for each month. Under a separate contract, FSC administers the security lending program. The security lending fee is based on the number and duration of lending transactions.
Brokerage Commissions. The Fund placed a portion of its portfolio transactions with brokerage firms which are affiliates of the investment adviser. Brokerage commissions are included in net realized gain (loss) and change in net unrealized appreciation (depreciation) in the Statement of Operations. The commissions paid to these affiliated firms were $2,030 for the period.
Interfund Lending Program. Pursuant to an Exemptive Order issued by the SEC, the Fund, along with other registered investment companies having management contracts with FMR or other affiliated entities of FMR, may participate in an interfund lending program. This program provides an alternative credit facility allowing the funds to borrow from, or lend money to, other participating affiliated funds. At period end, there were no interfund loans outstanding. The Fund's activity in this program during the period for which loans were outstanding was as follows:
Borrower or Lender | Average Loan
Balance | Weighted Average Interest Rate | Interest
Expense |
Borrower | $ 4,028,429 | .36% | $ 284 |
Annual Report
6. Committed Line of Credit.
The Fund participates with other funds managed by the investment adviser or an affiliate in a $4.25 billion credit facility (the "line of credit") to be utilized for temporary or emergency purposes to fund shareholder redemptions or for other short-term liquidity purposes. The Fund has agreed to pay commitment fees on its pro-rata portion of the line of credit, which amounted to $3,292 and is reflected in Miscellaneous expenses on the Statement of Operations. During the period, there were no borrowings on this line of credit.
7. Security Lending.
The Fund lends portfolio securities through a lending agent from time to time in order to earn additional income. For equity securities, a lending agent is used and may loan securities to certain qualified borrowers, including Fidelity Capital Markets (FCM), a broker-dealer affiliated with the Fund. On the settlement date of the loan, the Fund receives collateral (in the form of U.S. Treasury obligations, letters of credit and/or cash) against the loaned securities and maintains collateral in an amount not less than 100% of the market value of the loaned securities during the period of the loan. The market value of the loaned securities is determined at the close of business of the Fund and any additional required collateral is delivered to the Fund on the next business day. If the borrower defaults on its obligation to return the securities loaned because of insolvency or other reasons, the Fund may apply collateral received from the borrower against the obligation. The Fund may experience delays and costs in recovering the securities loaned. Any cash collateral received is invested in the Fidelity Securities Lending Cash Central Fund. The value of loaned securities and cash collateral at period end are disclosed on the Fund's Statement of Assets and Liabilities. At period end, there were no security loans outstanding with FCM. Security lending income represents the income earned on investing cash collateral, less rebates paid to borrowers and any lending agent fees associated with the loan, plus any premium payments received for lending certain types of securities. Security lending income is presented in the Statement of Operations as a component of income from Fidelity Central Funds. Total security lending income during the period amounted to $754,879, including $20 from securities loaned to FCM.
8. Expense Reductions.
The investment adviser or its affiliates agreed to reimburse or waive certain fees during the period as noted in the table below.
Initial Class | $ 27,712 |
Service Class | 4,338 |
Service Class 2 | 12,514 |
Initial Class R | 3,653 |
Service Class R | 1,914 |
Service Class 2R | 2,969 |
Investor Class R | 8,402 |
| $ 61,502 |
Commissions paid to certain brokers with whom the investment adviser, or its affiliates, places trades on behalf of the Fund include an amount in addition to trade execution, which may be rebated back to the Fund to offset certain expenses. This amount totaled $131,901 for the period.
9. Distributions to Shareholders.
Distributions to shareholders of each class were as follows:
Years ended December 31, | 2013 | 2012 |
From net investment income | | |
Initial Class | $ 9,994,667 | $ 12,006,007 |
Service Class | 1,357,229 | 1,929,055 |
Service Class 2 | 3,168,706 | 5,676,951 |
Initial Class R | 1,290,936 | 1,647,375 |
Service Class R | 628,888 | 804,767 |
Service Class 2R | 959,606 | 1,102,032 |
Investor Class R | 3,335,879 | 3,062,261 |
Total | $ 20,735,911 | $ 26,228,448 |
From net realized gain | | |
Initial Class | $ 2,739,851 | $ 2,332,435 |
Service Class | 403,194 | 397,090 |
Service Class 2 | 1,092,127 | 1,276,004 |
Initial Class R | 353,886 | 320,038 |
Service Class R | 185,274 | 165,080 |
Service Class 2R | 312,532 | 244,876 |
Investor Class R | 955,030 | 621,541 |
Total | $ 6,041,894 | $ 5,357,064 |
Annual Report
Notes to Financial Statements - continued
10. Share Transactions.
Transactions for each class of shares were as follows:
| Shares | Dollars |
Years ended December 31, | 2013 | 2012 | 2013 | 2012 |
Initial Class | | | | |
Shares sold | 5,801,817 | 5,444,050 | $ 107,662,358 | $ 81,965,581 |
Reinvestment of distributions | 649,058 | 905,776 | 12,734,518 | 14,338,442 |
Shares redeemed | (7,255,257) | (9,304,668) | (129,071,396) | (141,203,928) |
Net increase (decrease) | (804,382) | (2,954,842) | $ (8,674,520) | $ (44,899,905) |
Service Class | | | | |
Shares sold | 428,272 | 308,352 | $ 7,746,361 | $ 4,623,052 |
Reinvestment of distributions | 90,093 | 147,504 | 1,760,423 | 2,326,145 |
Shares redeemed | (1,628,602) | (1,584,094) | (28,843,970) | (23,791,164) |
Net increase (decrease) | (1,110,237) | (1,128,238) | $ (19,337,186) | $ (16,841,967) |
Service Class 2 | | | | |
Shares sold | 1,340,055 | 1,454,591 | $ 23,878,028 | $ 21,413,096 |
Reinvestment of distributions | 218,953 | 442,863 | 4,260,833 | 6,952,955 |
Shares redeemed | (7,981,874) | (5,312,307) | (142,365,692) | (79,852,380) |
Net increase (decrease) | (6,422,866) | (3,414,853) | $ (114,226,831) | $ (51,486,329) |
Initial Class R | | | | |
Shares sold | 435,761 | 225,830 | $ 8,137,230 | $ 3,396,796 |
Reinvestment of distributions | 84,048 | 124,599 | 1,644,822 | 1,967,413 |
Shares redeemed | (988,816) | (1,149,012) | (17,709,460) | (17,268,375) |
Net increase (decrease) | (469,007) | (798,583) | $ (7,927,408) | $ (11,904,166) |
Service Class R | | | | |
Shares sold | 215,668 | 244,158 | $ 3,976,622 | $ 3,670,758 |
Reinvestment of distributions | 41,731 | 61,617 | 814,162 | 969,847 |
Shares redeemed | (480,725) | (647,072) | (8,684,273) | (9,806,526) |
Net increase (decrease) | (223,326) | (341,297) | $ (3,893,489) | $ (5,165,921) |
Service Class 2R | | | | |
Shares sold | 635,014 | 531,202 | $ 11,565,664 | $ 7,828,308 |
Reinvestment of distributions | 66,051 | 86,618 | 1,272,138 | 1,346,907 |
Shares redeemed | (515,803) | (737,328) | (9,082,206) | (10,984,899) |
Net increase (decrease) | 185,262 | (119,508) | $ 3,755,596 | $ (1,809,684) |
Investor Class R | | | | |
Shares sold | 4,240,579 | 1,329,601 | $ 79,414,168 | $ 19,962,890 |
Reinvestment of distributions | 219,372 | 233,300 | 4,290,909 | 3,683,801 |
Shares redeemed | (1,102,402) | (1,867,920) | (19,510,986) | (28,119,026) |
Net increase (decrease) | 3,357,549 | (305,019) | $ 64,194,091 | $ (4,472,335) |
11. Other.
The Fund's organizational documents provide former and current trustees and officers with a limited indemnification against liabilities arising in connection with the performance of their duties to the Fund. In the normal course of business, the Fund may also enter into contracts that provide general indemnifications. The Fund's maximum exposure under these arrangements is unknown as this would be dependent on future claims that may be made against the Fund. The risk of material loss from such claims is considered remote.
At the end of the period, the investment adviser or its affiliates were the owners of record of 18% of the total outstanding shares of the Fund and one otherwise unaffiliated shareholder was the owner of record of 18% of the total outstanding shares of the Fund.
Annual Report
Report of Independent Registered Public Accounting Firm
To the Trustees of Variable Insurance Products Fund and the Shareholders of VIP Overseas Portfolio:
In our opinion, the accompanying statement of assets and liabilities, including the schedule of investments, and the related statements of operations and of changes in net assets and the financial highlights present fairly, in all material respects, the financial position of VIP Overseas Portfolio (a fund of Variable Insurance Products Fund) at December 31, 2013, the results of its operations for the year then ended, the changes in its net assets for each of the two years in the period then ended and the financial highlights for each of the five years in the period then ended, in conformity with accounting principles generally accepted in the United States of America. These financial statements and financial highlights (hereafter referred to as "financial statements") are the responsibility of the VIP Overseas Portfolio's management. Our responsibility is to express an opinion on these financial statements based on our audits. We conducted our audits of these financial statements in accordance with the standards of the Public Company Accounting Oversight Board (United States). Those standards require that we plan and perform the audit to obtain reasonable assurance about whether the financial statements are free of material misstatement. An audit includes examining, on a test basis, evidence supporting the amounts and disclosures in the financial statements, assessing the accounting principles used and significant estimates made by management, and evaluating the overall financial statement presentation. We believe that our audits, which included confirmation of securities at December 31, 2013 by correspondence with the custodian and brokers, provide a reasonable basis for our opinion.
PricewaterhouseCoopers LLP
Boston, Massachusetts
February 14, 2014
Annual Report
The Trustees, Member of the Advisory Board, and officers of the trust and fund, as applicable, are listed below. The Board of Trustees governs the fund and is responsible for protecting the interests of shareholders. The Trustees are experienced executives who meet periodically throughout the year to oversee the fund's activities, review contractual arrangements with companies that provide services to the fund, oversee management of the risks associated with such activities and contractual arrangements, and review the fund's performance. Except for James C. Curvey, Ned C. Lautenbach, Ronald P. O'Hanley, and William S. Stavropoulos, each of the Trustees oversees 173 funds. Mr. Curvey oversees 396 funds. Mr. Lautenbach, Mr. O'Hanley, and Mr. Stavropoulos each oversees 247 funds.
The Trustees hold office without limit in time except that (a) any Trustee may resign; (b) any Trustee may be removed by written instrument, signed by at least two-thirds of the number of Trustees prior to such removal; (c) any Trustee who requests to be retired or who has become incapacitated by illness or injury may be retired by written instrument signed by a majority of the other Trustees; and (d) any Trustee may be removed at any special meeting of shareholders by a two-thirds vote of the outstanding voting securities of the trust. Each Trustee who is not an interested person (as defined in the 1940 Act) of the trust and the fund (Independent Trustee), shall retire not later than the last day of the calendar year in which his or her 75th birthday occurs. The Independent Trustees may waive this mandatory retirement age policy with respect to individual Trustees. The officers and Advisory Board Member hold office without limit in time, except that any officer and Advisory Board Member may resign or may be removed by a vote of a majority of the Trustees at any regular meeting or any special meeting of the Trustees. Except as indicated, each individual has held the office shown or other offices in the same company for the past five years.
Experience, Skills, Attributes, and Qualifications of the Fund's Trustees. The Governance and Nominating Committee has adopted a statement of policy that describes the experience, qualifications, attributes, and skills that are necessary and desirable for potential Independent Trustee candidates (Statement of Policy). The Board believes that each Trustee satisfied at the time he or she was initially elected or appointed a Trustee, and continues to satisfy, the standards contemplated by the Statement of Policy. The Governance and Nominating Committee also engages professional search firms to help identify potential Independent Trustee candidates who have the experience, qualifications, attributes, and skills consistent with the Statement of Policy. From time to time, additional criteria based on the composition and skills of the current Independent Trustees, as well as experience or skills that may be appropriate in light of future changes to board composition, business conditions, and regulatory or other developments, have also been considered by the professional search firms and the Governance and Nominating Committee. In addition, the Board takes into account the Trustees' commitment and participation in Board and committee meetings, as well as their leadership of standing and ad hoc committees throughout their tenure.
In determining that a particular Trustee was and continues to be qualified to serve as a Trustee, the Board has considered a variety of criteria, none of which, in isolation, was controlling. The Board believes that, collectively, the Trustees have balanced and diverse experience, qualifications, attributes, and skills, which allow the Board to operate effectively in governing the fund and protecting the interests of shareholders. Information about the specific experience, skills, attributes, and qualifications of each Trustee, which in each case led to the Board's conclusion that the Trustee should serve (or continue to serve) as a trustee of the fund, is provided below.
Board Structure and Oversight Function. James C. Curvey is an interested person (as defined in the 1940 Act) and currently serves as Chairman. The Trustees have determined that an interested Chairman is appropriate and benefits shareholders because an interested Chairman has a personal and professional stake in the quality and continuity of services provided to the fund. Independent Trustees exercise their informed business judgment to appoint an individual of their choosing to serve as Chairman, regardless of whether the Trustee happens to be independent or a member of management. The Independent Trustees have determined that they can act independently and effectively without having an Independent Trustee serve as Chairman and that a key structural component for assuring that they are in a position to do so is for the Independent Trustees to constitute a substantial majority for the Board. The Independent Trustees also regularly meet in executive session. Ned C. Lautenbach serves as Chairman of the Independent Trustees and as such (i) acts as a liaison between the Independent Trustees and management with respect to matters important to the Independent Trustees and (ii) with management prepares agendas for Board meetings.
Fidelity funds are overseen by different Boards of Trustees. The fund's Board oversees Fidelity's equity and high income funds and another Board oversees Fidelity's investment-grade bond, money market, and asset allocation funds. The asset allocation funds may invest in Fidelity funds overseen by the fund's Board. The use of separate Boards, each with its own committee structure, allows the Trustees of each group of Fidelity funds to focus on the unique issues of the funds they oversee, including common research, investment, and operational issues. On occasion, the separate Boards establish joint committees to address issues of overlapping consequences for the Fidelity funds overseen by each Board.
The Trustees operate using a system of committees to facilitate the timely and efficient consideration of all matters of importance to the Trustees, the fund, and fund shareholders and to facilitate compliance with legal and regulatory requirements and oversight of the fund's activities and associated risks. The Board, acting through its committees, has charged FMR and its affiliates with (i) identifying events or circumstances the occurrence of which could have demonstrably adverse effects on the fund's business and/or reputation; (ii) implementing processes and controls to lessen the possibility that such events or circumstances occur or to mitigate the effects of such events or circumstances if they do occur; and (iii) creating and maintaining a system designed to evaluate continuously business and market conditions in order to facilitate the identification and implementation processes described in (i) and (ii) above. Because the day-to-day operations and activities of the fund are carried out by or through FMR, its affiliates and other service providers, the fund's exposure to risks is mitigated but not eliminated by the processes overseen by the Trustees. While each of the Board's committees has responsibility for overseeing different aspects of the fund's activities, oversight is exercised primarily through the Operations, Audit, and Compliance Committees. In addition, the Independent Trustees have worked with FMR to enhance the Board's oversight of investment and financial risks, legal and regulatory risks, technology risks, and operational risks, including the development of additional risk reporting to the Board. For example, a working group comprised of Independent Trustees and FMR has worked and continues to work to review the Fidelity funds' valuation-related activities, reporting and risk management. Appropriate personnel, including but not limited to the fund's Chief Compliance Officer (CCO), FMR's internal auditor, the independent accountants, the fund's Treasurer and portfolio management personnel, make periodic reports to the Board's committees, as appropriate, including an annual review of FMR's risk management program for the Fidelity funds. The responsibilities of each standing committee, including their oversight responsibilities, are described further under "Standing Committees of the Fund's Trustees."
Annual Report
The fund's Statement of Additional Information (SAI) includes more information about the Trustees. To request a free copy, call Fidelity at 1-877-208-0098.
Interested Trustees*:
Correspondence intended for each Trustee who is an interested person may be sent to Fidelity Investments, 245 Summer Street, Boston, Massachusetts 02210.
Name, Year of Birth; Principal Occupations and Other Relevant Experience+ |
James C. Curvey (1935) |
Year of Election or Appointment: 2007 Trustee Chairman of the Board of Trustees |
| Mr. Curvey also serves as Trustee of other Fidelity funds. Mr. Curvey is a Director of Fidelity Investments Money Management, Inc. (2009-present), Director of Fidelity Research & Analysis Co. (2009-present) and Director of FMR and FMR Co., Inc. (2007-present). Mr. Curvey is also Vice Chairman (2007-present) and Director of FMR LLC. In addition, Mr. Curvey serves as an Overseer for the Boston Symphony Orchestra and a member of the Trustees of Villanova University. Previously, Mr. Curvey was the Vice Chairman (2006-2007) and Director (2000-2007) of FMR Corp. |
Ronald P. O'Hanley (1957) |
Year of Election or Appointment: 2011 Trustee |
| Mr. O'Hanley also serves as Trustee of other Fidelity funds. He is Director of Fidelity SelectCo, LLC (2013-present), FMR Co., Inc. (2010-present), Director of Fidelity Investments Money Management, Inc. (2010-present), Director of Fidelity Research & Analysis Company (2010-present), President of Fidelity Asset Management and Corporate Services and a Member of Fidelity's Executive Committee (2010-present). Previously, Mr. O'Hanley served as President and Chief Executive Officer of BNY Mellon Asset Management (2007-2010). Mr. O'Hanley also served as Vice Chairman of Bank New York Mellon Corp. and a member of that firm's Executive Committee. Prior to the 2007 merger of The Bank of New York and Mellon Financial Corporation, he was Vice Chairman of Mellon Financial Corporation and President and Chief Executive Officer of Mellon Asset Management. He joined Mellon in February 1997. Mr. O'Hanley currently serves as Chairman of the Boston Public Library Foundation Board of Directors and sits on the Board of Directors of Beth Israel Deaconess Medical Center, the Board of Trustees of the Marine Biological Laboratory and the Advisory Board of the Maxwell School of Citizenship and Public Administration at Syracuse University. Mr. O'Hanley also chairs the Council on Asset Management for the Financial Services Roundtable and is a member of the Board of Directors of Institutional Investor's U.S. Institute. |
* Trustees have been determined to be "Interested Trustees" by virtue of, among other things, their affiliation with the trust or various entities under common control with FMR.
+ The information above includes each Trustee's principal occupation during the last five years and other information relating to the experience, attributes, and skills relevant to each Trustee's qualifications to serve as a Trustee, which led to the conclusion that each Trustee should serve as a Trustee for the fund.
Annual Report
Trustees and Officers - continued
Independent Trustees:
Correspondence intended for each Independent Trustee (that is, the Trustees other than the Interested Trustees) may be sent to Fidelity Investments, P.O. Box 55235, Boston, Massachusetts 02205-5235.
Name, Year of Birth; Principal Occupations and Other Relevant Experience+ |
Dennis J. Dirks (1948) |
Year of Election or Appointment: 2005 Trustee |
| Mr. Dirks also serves as Trustee of other Fidelity funds. Prior to his retirement in May 2003, Mr. Dirks was Chief Operating Officer and a member of the Board of The Depository Trust & Clearing Corporation (DTCC). He also served as President, Chief Operating Officer, and Board member of The Depository Trust Company (DTC) and President and Board member of the National Securities Clearing Corporation (NSCC). In addition, Mr. Dirks served as Chief Executive Officer and Board member of the Government Securities Clearing Corporation, Chief Executive Officer and Board member of the Mortgage-Backed Securities Clearing Corporation, as a Trustee and a member of the Finance Committee of Manhattan College (2005-2008), and as a Trustee and a member of the Finance Committee of AHRC of Nassau County (2006-2008). Mr. Dirks is a member of the Independent Directors Council (IDC) Governing Council (2010-present) and Board of Directors for The Brookville Center for Children's Services, Inc. (2009-present). |
Alan J. Lacy (1953) |
Year of Election or Appointment: 2008 Trustee |
| Mr. Lacy also serves as Trustee of other Fidelity funds. Mr. Lacy serves as Senior Adviser (2007-present) of Oak Hill Capital Partners, L.P. (private equity). Mr. Lacy also served as Chief Executive Officer (2000-2005) and Vice Chairman (2005-2006) of Sears Holdings Corporation and Sears, Roebuck and Co. (retail). In addition, Mr. Lacy serves as a member of the Board of Directors of Dave & Buster's Entertainment, Inc. (restaurant and entertainment complexes, 2010-present), Earth Fare, Inc. (retail grocery, 2012-present), The Hillman Companies, Inc. (hardware wholesalers, 2010-present), and Bristol-Myers Squibb Company (global pharmaceuticals, 2008-present). Mr. Lacy is a member of the Board of Trustees of The National Parks Conservation Association (2006-present). Previously, Mr. Lacy served as Chairman of the Board of Trustees of the National Parks Conservation Association (2008-2011) and as a member of the Board of Directors for the Western Union Company (global money transfer, 2006-2011). |
Ned C. Lautenbach (1944) |
Year of Election or Appointment: 2000 Trustee Chairman of the Independent Trustees |
| Mr. Lautenbach also serves as Trustee of other Fidelity funds. Mr. Lautenbach currently serves as the Lead Director of the Eaton Corporation Board of Directors (diversified industrial, 1997-present). Mr. Lautenbach is Chairman of the Board of Directors of the Philharmonic Center for the Arts in Naples, Florida (2012-present) and a member of the Council on Foreign Relations (1994-present). Previously, Mr. Lautenbach was a Partner/Advisory Partner at Clayton, Dubilier & Rice, LLC (private equity investment, 1998-2010), as well as a Director of Sony Corporation (2006-2007). |
Joseph Mauriello (1944) |
Year of Election or Appointment: 2008 Trustee |
| Mr. Mauriello also serves as Trustee of other Fidelity funds. Prior to his retirement in January 2006, Mr. Mauriello served in numerous senior management positions including Deputy Chairman and Chief Operating Officer (2004-2005), and Vice Chairman of Financial Services (2002-2004) of KPMG LLP US (professional services, 1965-2005). Mr. Mauriello currently serves as a member of the Board of Directors of XL Group plc. (global insurance and re-insurance, 2006-present). Previously, Mr. Mauriello served as a Director of the Hamilton Funds of the Bank of New York (2006-2007) and of Arcadia Resources Inc. (health care services and products, 2007-2012). |
Robert W. Selander (1950) |
Year of Election or Appointment: 2011 Trustee |
| Mr. Selander also serves as Trustee of other Fidelity funds. Previously, Mr. Selander served as a Member of the Advisory Board of other Fidelity funds (2011), and Executive Vice Chairman (2010), Chief Executive Officer (2009-2010), and President and Chief Executive Officer (1997-2009) of Mastercard, Inc. |
Cornelia M. Small (1944) |
Year of Election or Appointment: 2005 Trustee |
| Ms. Small also serves as Trustee of other Fidelity funds. Ms. Small is a member of the Board of Directors (2009-present) and Chair of the Investment Committee (2010-present) of the Teagle Foundation. Ms. Small also serves on the Investment Committee of the Berkshire Taconic Community Foundation (2008-present). Previously, Ms. Small served as Chairperson (2002-2008) and a member of the Investment Committee and Chairperson (2008-2012) and a member of the Board of Trustees of Smith College. In addition, Ms. Small served as Chief Investment Officer, Director of Global Equity Investments, and a member of the Board of Directors of Scudder, Stevens & Clark and Scudder Kemper Investments. |
William S. Stavropoulos (1939) |
Year of Election or Appointment: 2001 Trustee Vice Chairman of the Independent Trustees |
| Mr. Stavropoulos also serves as Trustee of other Fidelity funds. Mr. Stavropoulos serves as President and Founder of the Michigan Baseball Foundation, the Great Lakes Loons (2007-present). Mr. Stavropoulos is Chairman Emeritus of the Board of Directors of The Dow Chemical Company, where he previously served in numerous senior management positions, including President, CEO (1995-2000; 2002-2004), Chairman of the Executive Committee (2000-2006), and as a member of the Board of Directors (1990-2006). Currently, Mr. Stavropoulos is Chairman of the Board of Directors of Univar Inc. (global distributor of commodity and specialty chemicals), a Director of Teradata Corporation (data warehousing and technology solutions), and Maersk Inc. (industrial conglomerate), and a member of the Advisory Board for Metalmark Capital LLC (private equity investment, 2005-present). Mr. Stavropoulos is an operating advisor to Clayton, Dubilier & Rice, LLC (private equity investment). In addition, Mr. Stavropoulos is a member of the University of Notre Dame Advisory Council for the College of Science, a Trustee of the Rollin L. Gerstacker Foundation, and a Director of the Naples Philharmonic Center for the Arts. Previously, Mr. Stavropoulos served as a Director of Chemical Financial Corporation (bank holding company, 1993-2012) and Tyco International, Ltd. (multinational manufacturing and services, 2007-2012). |
David M. Thomas (1949) |
Year of Election or Appointment: 2008 Trustee |
| Mr. Thomas also serves as Trustee of other Fidelity funds. Mr. Thomas serves as Non-Executive Chairman of the Board of Directors of Fortune Brands Home and Security (home and security products, 2011-present), and as a member of the Board of Directors of Interpublic Group of Companies, Inc. (marketing communication, 2004-present). Previously, Mr. Thomas served as Executive Chairman (2005-2006) and Chairman and Chief Executive Officer (2000-2005) of IMS Health, Inc. (pharmaceutical and healthcare information solutions), and a Director of Fortune Brands, Inc. (consumer products, 2000-2011). |
+ The information above includes each Trustee's principal occupation during the last five years and other information relating to the experience, attributes, and skills relevant to each Trustee's qualifications to serve as a Trustee, which led to the conclusion that each Trustee should serve as a Trustee for the fund.
Advisory Board Member and Officers:
Correspondence intended for each officer and Peter S. Lynch may be sent to Fidelity Investments, 245 Summer Street, Boston, Massachusetts 02210. Officers appear below in alphabetical order.
Name, Year of Birth; Principal Occupation |
Peter S. Lynch (1944) |
Year of Election or Appointment: 2003 Member of the Advisory Board |
| Mr. Lynch also serves as Member of the Advisory Board of other Fidelity funds. Mr. Lynch is Vice Chairman and a Director of FMR and FMR Co., Inc. In addition, Mr. Lynch serves as a Trustee of Boston College and as the Chairman of the Inner-City Scholarship Fund. Previously, Mr. Lynch served on the Special Olympics International Board of Directors (1997-2006). |
Elizabeth Paige Baumann (1968) |
Year of Election or Appointment: 2012 Anti-Money Laundering (AML) Officer |
| Ms. Baumann also serves as AML Officer of other funds. She is Chief AML Officer of FMR LLC (2012-present) and is an employee of Fidelity Investments. Previously, Ms. Baumann served as Vice President and Deputy Anti-Money Laundering Officer (2007-2012). |
William C. Coffey (1969) |
Year of Election or Appointment: 2009 Assistant Secretary |
| Mr. Coffey also serves as Assistant Secretary of other funds. He is Senior Vice President and Deputy General Counsel of FMR LLC (2010-present), and is an employee of Fidelity Investments. Previously, Mr. Coffey served as Vice President and Associate General Counsel of FMR LLC (2005-2009). |
Jonathan Davis (1968) |
Year of Election or Appointment: 2010 Assistant Treasurer |
| Mr. Davis also serves as Assistant Treasurer of other funds. Mr. Davis is an employee of Fidelity Investments. Previously, Mr. Davis served as Vice President and Associate General Counsel of FMR LLC (2003-2010). |
Adrien E. Deberghes (1967) |
Year of Election or Appointment: 2008 Deputy Treasurer |
| Mr. Deberghes also serves as an officer of other funds. He is an employee of Fidelity Investments (2008-present). Prior to joining Fidelity Investments, Mr. Deberghes was Senior Vice President of Mutual Fund Administration at State Street Corporation (2007-2008), Senior Director of Mutual Fund Administration at Investors Bank & Trust (2005-2007), and Director of Finance for Dunkin' Brands (2000-2005). |
Stephanie J. Dorsey (1969) |
Year of Election or Appointment: 2010 Assistant Treasurer |
| Ms. Dorsey also serves as an officer of other funds. She is an employee of Fidelity Investments (2008-present) and has served in other fund officer roles. Prior to joining Fidelity Investments, Ms. Dorsey served as Treasurer (2004-2008) of the JPMorgan Mutual Funds and Vice President (2004-2008) of JPMorgan Chase Bank. |
Scott C. Goebel (1968) |
Year of Election or Appointment: 2008 Secretary and Chief Legal Officer (CLO) |
| Mr. Goebel serves as Secretary and CLO of other funds. Mr. Goebel also serves as Secretary of Fidelity Investments Money Management, Inc. (FIMM) (2010-present) and Fidelity Research and Analysis Company (FRAC) (2010-present); General Counsel, Secretary, and Senior Vice President of FMR (2008-present) and FMR Co., Inc. (2008-present); Chief Legal Officer of Fidelity Management & Research (Hong Kong) Limited (2008-present) and Assistant Secretary of Fidelity Management & Research (Japan) Inc. (2008-present), and Fidelity Management & Research (U.K.) Inc. (2008-present). Previously, Mr. Goebel served as Secretary and CLO of other Fidelity funds (2008-2013), Assistant Secretary of FIMM (2008-2010), FRAC (2008-2010), and certain funds (2007-2008); and as Vice President and Secretary of Fidelity Distributors Corporation (FDC) (2005-2007). Mr. Goebel has been employed by FMR LLC or an affiliate since 2001. |
Joseph A. Hanlon (1968) |
Year of Election or Appointment: 2012 Chief Compliance Officer |
| Mr. Hanlon also serves as Chief Compliance Officer of other funds. Mr. Hanlon serves as Compliance Officer of FMR, FMR Co., Inc., Fidelity Investments Money Management, Inc. (FIMM), Fidelity Research and Analysis Company (FRAC), and Fidelity Management & Research (Hong Kong) (2009-present), as Senior Vice President of the Fidelity Asset Management Division (2009-present), and is an employee of Fidelity Investments. Previously, Mr. Hanlon served as Compliance Officer of Fidelity Management & Research (Japan) Inc. (2009-2013), Strategic Advisers, Inc. (2009-2013), and Fidelity Management & Research (U.K.) Inc. (2009-2013). |
Bruce T. Herring (1965) |
Year of Election or Appointment: 2006 Vice President of certain Equity Funds |
| Mr. Herring also serves as Vice President of other funds. He serves as Chief Investment Officer of Fidelity Global Asset Allocation (GAA) (2013-present), Group Chief Investment Officer of FMR, and President of Fidelity Research & Analysis Company (2010-present). Previously, Mr. Herring served as Chief Investment Officer and Director of Fidelity Management & Research (U.K.) Inc. (2010-2013), Vice President (2005-2006) and Senior Vice President (2006-2007) of Fidelity Management & Research Company, Vice President of FMR Co., Inc. (2001-2007), and as a portfolio manager for Fidelity U.S. Equity Funds. |
Brian B. Hogan (1964) |
Year of Election or Appointment: 2009 Vice President |
| Mr. Hogan also serves as Vice President of other funds. Mr. Hogan serves as President of FMR's Equity Division (2009-present). Previously, Mr. Hogan served as Senior Vice President, Equity Research of FMR (2006-2009) and as a portfolio manager. |
Chris Maher (1972) |
Year of Election or Appointment: 2013 Assistant Treasurer |
| Mr. Maher serves as Assistant Treasurer of other funds. Mr. Maher is Vice President of Valuation Oversight and is an employee of Fidelity Investments. Previously, Mr. Maher served as Vice President of Asset Management Compliance (2013), Vice President of FMR's Program Management Group (2010-2013), and Vice President of Valuation Oversight (2008-2010). |
Christine Reynolds (1958) |
Year of Election or Appointment: 2008 Chief Financial Officer |
| Ms. Reynolds also serves as Chief Financial Officer of other funds. Ms. Reynolds became President of Fidelity Pricing and Cash Management Services (FPCMS) in August 2008. Ms. Reynolds served as Chief Operating Officer of FPCMS (2007-2008). Previously, Ms. Reynolds served as President, Treasurer, and Anti-Money Laundering officer of the Fidelity funds (2004-2007). |
Kenneth B. Robins (1969) |
Year of Election or Appointment: 2008 President and Treasurer |
| Mr. Robins also serves as an officer of other funds. Mr. Robins serves as Executive Vice President of Fidelity Investments Money Management, Inc. (FIMM) (2013-present) and is an employee of Fidelity Investments (2004-present). Previously, Mr. Robins served in other fund officer roles. |
Gary W. Ryan (1958) |
Year of Election or Appointment: 2005 Assistant Treasurer |
| Mr. Ryan also serves as Assistant Treasurer of other funds. Mr. Ryan is an employee of Fidelity Investments and has served in other fund officer roles. Previously, Mr. Ryan served as Vice President of Fund Reporting in Fidelity Pricing and Cash Management Services (FPCMS) (1999-2005). |
Stephen Sadoski (1971) |
Year of Election or Appointment: 2012 Deputy Treasurer |
| Mr. Sadoski also serves as Deputy Treasurer of other funds. He is an employee of Fidelity Investments (2012-present) and has served in another fund officer role. Prior to joining Fidelity Investments, Mr. Sadoski served as an assistant chief accountant in the Division of Investment Management of the Securities and Exchange Commission (SEC) (2009-2012) and as a senior manager at Deloitte & Touche LLP (1997-2009). |
Stacie M. Smith (1974) |
Year of Election or Appointment: 2013 Deputy Treasurer |
| Ms. Smith also serves as an officer of other funds. She is an employee of Fidelity Investments (2009-present) and has served in other fund officer roles. Prior to joining Fidelity Investments, Ms. Smith served as Senior Audit Manager of Ernst & Young LLP (1996-2009). |
Renee Stagnone (1975) |
Year of Election or Appointment: 2013 Deputy Treasurer |
| Ms. Stagnone also serves as Deputy Treasurer of other funds. Ms. Stagnone is an employee of Fidelity Investments. |
Joseph F. Zambello (1957) |
Year of Election or Appointment: 2011 Deputy Treasurer |
| Mr. Zambello also serves as Deputy Treasurer of other funds. Mr. Zambello is an employee of Fidelity Investments. Previously, Mr. Zambello served as Vice President of FMR's Program Management Group (2009-2011) and Vice President of the Transfer Agent Oversight Group (2005-2009). |
Annual Report
The Board of Trustees of VIP Overseas Portfolio voted to pay to shareholders of record at the opening of business on record date, the following distributions per share derived from capital gains realized from sales of portfolio securities:
| Pay Date | Record Date | Capital Gains |
Initial Class | 02/14/14 | 02/14/14 | $0.005 |
Service Class | 02/14/14 | 02/14/14 | $0.005 |
Service Class 2 | 02/14/14 | 02/14/14 | $0.005 |
Initial Class, Service Class and Service Class 2 designates 2% of the dividends distributed during the fiscal year as qualifying for the dividends-received deduction for corporate shareholders.
The amounts per share which represent income derived from sources within, and taxes paid to, foreign countries or possessions of the United States are as follows:
| Pay Date | Income | Taxes |
Initial Class | 12/13/13 | $0.346 | $0.0163 |
Service Class | 12/13/13 | $0.326 | $0.0163 |
Service Class 2 | 12/13/13 | $0.293 | $0.0163 |
Annual Report
Board Approval of Investment Advisory Contracts and Management Fees
VIP Overseas Portfolio
Each year, the Board of Trustees, including the Independent Trustees (together, the Board), votes on the renewal of the management contract and sub-advisory agreements (together, the Advisory Contracts) for the fund. The Board, assisted by the advice of fund counsel and Independent Trustees' counsel, requests and considers a broad range of information relevant to the renewal of the Advisory Contracts throughout the year.
The Board meets regularly and, at each of its meetings, covers an extensive agenda of topics and materials and considers factors that are relevant to its annual consideration of the renewal of the fund's Advisory Contracts, including the services and support provided to the fund and its shareholders. The Board has established various standing committees, each composed of and chaired by Independent Trustees with varying backgrounds, to which the Board has assigned specific subject matter responsibilities in order to enhance effective decision-making by the Board. The Board, acting directly and through its Committees, requests and receives information concerning the annual consideration of the renewal of the fund's Advisory Contracts. The Board also meets as needed to consider matters specifically related to the Board's annual consideration of the renewal of Advisory Contracts. Members of the Board may also meet with trustees of other Fidelity funds through ad hoc joint committees to discuss certain matters relevant to the Fidelity funds.
At its July 2013 meeting, the Board, including the Independent Trustees, unanimously determined to renew the fund's Advisory Contracts. In reaching its determination, the Board considered all factors it believed relevant, including (i) the nature, extent, and quality of the services to be provided to the fund and its shareholders (including the investment performance of the fund); (ii) the competitiveness of the fund's management fee and total expense ratio relative to peer funds; (iii) the total costs of the services to be provided by and the profits to be realized by Fidelity from its relationship with the fund; (iv) the extent to which economies of scale exist and would be realized as the fund grows; and (v) whether fee levels reflect these economies of scale, if any, for the benefit of fund shareholders.
In considering whether to renew the Advisory Contracts for the fund, the Board reached a determination, with the assistance of fund counsel and Independent Trustees' counsel and through the exercise of its business judgment, that the renewal of the Advisory Contracts was in the best interests of the fund and its shareholders and that the compensation payable under the Advisory Contracts was fair and reasonable. The Board's decision to renew the Advisory Contracts was not based on any single factor, but rather was based on a comprehensive consideration of all the information provided to the Board at its meetings throughout the year. The Board, in reaching its determination to renew the Advisory Contracts, was aware that shareholders in the fund have a broad range of investment choices available to them, including a wide choice among mutual funds offered by Fidelity's competitors, and that the fund's shareholders, who have the opportunity to review and weigh the disclosure provided by the fund in its prospectus and other public disclosures, have chosen to invest in this fund, which is a part of the Fidelity family of funds.
Nature, Extent, and Quality of Services Provided. The Board considered the staffing within the investment adviser, Fidelity Management & Research Company (FMR), and the sub-advisers (together, the Investment Advisers) as it relates to the fund, including the backgrounds of the fund's investment personnel, and also considered the fund's investment objective, strategies, and related investment philosophy. The Independent Trustees also had discussions with senior management of Fidelity's investment operations and investment groups. The Board considered the structure of the portfolio manager compensation program and whether this structure provides appropriate incentives to act in the best interests of the fund.
Resources Dedicated to Investment Management and Support Services. The Board and the Fund Oversight and Research Committees reviewed the general qualifications and capabilities of the Investment Advisers' investment staff, including its size, education, experience, and resources, as well as the Investment Advisers' approach to recruiting, training, managing, and compensating investment personnel. The Board noted that FMR has continued to increase the resources devoted to non-U.S. offices, including expansion of Fidelity's global investment organization. The Board also noted that Fidelity's analysts have extensive resources, tools and capabilities that allow them to conduct sophisticated quantitative and fundamental analysis, as well as credit analysis of issuers, counterparties and guarantors. Further, the Board believes that Fidelity's investment professionals have sufficient access to global information and data so as to provide competitive investment results over time, and that those professionals also have access to sophisticated tools that permit them to assess portfolio construction and risk and performance attribution characteristics continuously, as well as to transmit new information and research conclusions rapidly around the world. Additionally, in its deliberations, the Board considered the Investment Advisers' trading and risk management capabilities and resources, which are an integral part of the investment management process.
Shareholder and Administrative Services. The Board considered (i) the nature, extent, quality, and cost of advisory, administrative, and shareholder services performed by the Investment Advisers and their affiliates under the Advisory Contracts and under separate agreements covering transfer agency, pricing and bookkeeping, and securities lending services for the fund; (ii) the nature and extent of the supervision of third party service providers, principally custodians and subcustodians; and (iii) the resources devoted to, and the record of compliance with, the fund's compliance policies and procedures. The Board also reviewed the allocation of fund brokerage, including allocations to brokers affiliated with the Investment Advisers, the use of brokerage commissions to pay fund expenses, and the use of "soft" commission dollars to pay for research services.
The Board noted that the growth of fund assets over time across the complex allows Fidelity to reinvest in the development of services designed to enhance the value or convenience of the Fidelity funds as investment vehicles. These services include 24-hour access to account information and market information through telephone representatives and over the Internet, investor education materials and asset allocation tools, and the expanded availability of Fidelity Investor Centers.
Annual Report
Investment in a Large Fund Family. The Board considered the benefits to shareholders of investing in a Fidelity fund, including the benefits of investing in a fund that is part of a large family of funds offering a variety of investment disciplines and providing a large variety of mutual fund investor services. The Board noted that Fidelity had taken, or had made recommendations that resulted in the Fidelity funds taking, a number of actions over the previous year that benefited particular funds, including (i) continuing to dedicate additional resources to investment research and to the support of the senior management team that oversees asset management; (ii) persisting in efforts to enhance Fidelity's global research capabilities; (iii) launching new funds and making other enhancements to meet client needs for global and income-oriented solutions; (iv) continuing to launch dedicated lower cost underlying funds to meet portfolio construction needs related to expanding underlying fund options for Fidelity funds of funds, specifically for the Freedom Fund product lines; (v) rationalizing product lines and gaining increased efficiencies through the mergers of several funds into other funds; (vi) strengthening Fidelity's index fund offerings by reducing investment minimums and adopting or lowering existing expense caps for certain funds and classes; (vii) enhancing Global Asset Allocation product offerings by launching new funds and strategies, including "open architecture" target date funds that utilize affiliated and unaffiliated sub-advisers; (viii) modifying the eligibility criteria for Institutional Class shares of Advisor funds to increase their marketability to a portion of the defined contribution plan market; (ix) creating a new low-cost retirement share class for certain Advisor funds to appeal to large retirement plans; (x) transitioning the management of certain Fidelity commodity funds to Geode Capital Management LLC, a registered commodity pool operator, while retaining administrative responsibilities for the funds; (xi) reorganizing a number of funds; and (xii) taking steps toward establishing a new Fidelity adviser to manage sector-based funds and products.
Investment Performance. The Board considered whether the fund has operated in accordance with its investment objective, as well as its record of compliance with its investment restrictions and its performance history.
The Board took into account discussions with the Investment Advisers about fund investment performance that occur at Board meetings throughout the year. In this regard the Board noted that as part of regularly scheduled fund reviews and other reports to the Board on fund performance, the Board periodically considers annualized return information for the fund, for different time periods, measured against a securities market index ("benchmark index") and a peer group of mutual funds with similar objectives ("peer group"). In its evaluation of fund investment performance, the Board gave particular attention to information indicating changes in performance of certain Fidelity funds for specific time periods and the Investment Advisers' explanations for any overperformance or underperformance.
In addition to reviewing absolute and relative fund performance, the Independent Trustees periodically consider the appropriateness of fund performance metrics in evaluating the results achieved. In general, the Independent Trustees believe that fund performance should be evaluated based on net performance (after fees and expenses) of both the highest performing and lowest performing classes, where applicable, compared to appropriate benchmark indices, over appropriate time periods which may include full market cycles, and compared to peer groups, as applicable, over the same periods, taking into account relevant factors including the following: general market conditions; issuer-specific information; tactical opportunities for investment; and fund cash flows and other factors.
The Independent Trustees recognize that shareholders evaluate performance on a net basis over their own holding periods, for which one-, three-, and five-year periods are used as a proxy. For this reason, the performance information reviewed by the Board also included net cumulative calendar year total return information for the fund and an appropriate benchmark index and peer group for the most recent one-, three-, and five-year periods, as shown below. Returns are shown compared to the 25th percentile (top of box) and 75th percentile (bottom of box) of the peer universe. Returns of the benchmark index are "net MA," i.e., adjusted for tax withholding rates applicable to U.S.-based mutual funds organized as Massachusetts business trusts.
Annual Report
Board Approval of Investment Advisory Contracts and Management Fees - continued
VIP Overseas Portfolio

Based on its review, the Board concluded that the nature, extent, and quality of services provided to the fund under the Advisory Contracts should benefit the fund's shareholders.
Competitiveness of Management Fee and Total Expense Ratio. The Board considered the fund's management fee and total expense ratio compared to "mapped groups" of competitive funds and classes. Fidelity creates "mapped groups" by combining similar Lipper investment objective categories that have comparable management fee characteristics. Combining Lipper investment objective categories aids the Board's management fee and total expense ratio comparisons by broadening the competitive group used for comparison and by reducing the number of universes to which various Fidelity funds are compared.
Management Fee. The Board considered two proprietary management fee comparisons for the 12-month periods shown in the chart below. The group of Lipper funds used by the Board for management fee comparisons is referred to below as the "Total Mapped Group." The Total Mapped Group comparison focuses on a fund's standing in terms of gross management fees before expense reimbursements or caps relative to the total universe of funds with comparable investment mandates, regardless of whether their management fee structures also are comparable. Funds with comparable investment mandates offer exposure to similar types of securities. Funds with comparable management fee structures have similar management fee contractual arrangements (e.g., flat rate charged for advisory services, all-inclusive fee rate, etc.). "TMG %" represents the percentage of funds in the Total Mapped Group that had management fees that were lower than the fund's. For example, a TMG % of 19% means that 81% of the funds in the Total Mapped Group had higher management fees than the fund. The "Asset-Size Peer Group" (ASPG) comparison focuses on a fund's standing relative to a subset of non-Fidelity funds within the Total Mapped Group that are similar in size and management fee structure. The ASPG represents at least 15% of the funds in the Total Mapped Group with comparable asset size and management fee structures, subject to a minimum of 50 funds (or all funds in the Total Mapped Group if fewer than 50). Additional information, such as the ASPG quartile in which the fund's management fee ranked, is also included in the chart and considered by the Board.
Annual Report
VIP Overseas Portfolio
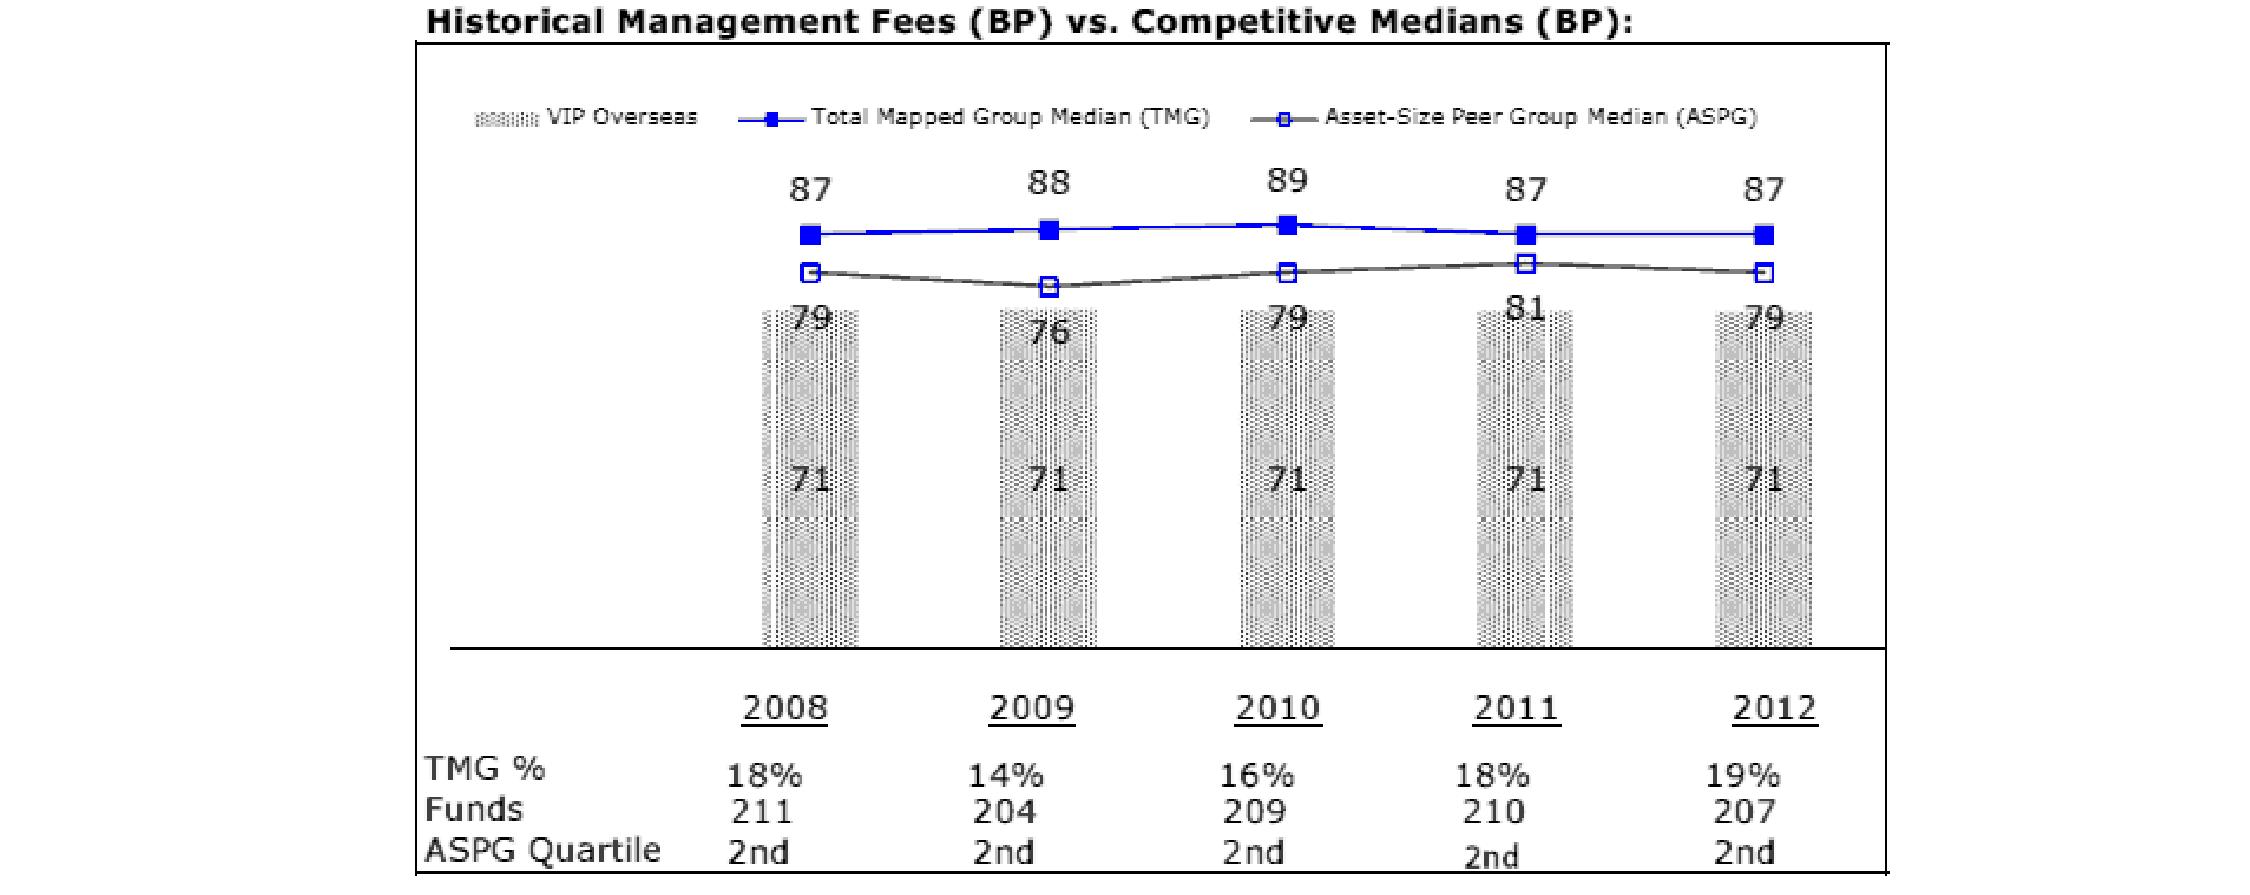
The Board noted that the fund's management fee ranked below the median of its Total Mapped Group and below the median of its ASPG for 2012.
Based on its review, the Board concluded that the fund's management fee is fair and reasonable in light of the services that the fund receives and the other factors considered.
Total Expense Ratio. In its review of each class's total expense ratio, the Board considered the fund's management fee as well as other fund or class expenses, as applicable, such as transfer agent fees, pricing and bookkeeping fees, fund-paid 12b-1 fees, and custodial, legal, and audit fees. The Board also noted the effects of any waivers and reimbursements on fees and expenses. As part of its review, the Board also considered the current and historical total expense ratios of each class of the fund compared to competitive fund median expenses. Each class of the fund is compared to those funds and classes in the Total Mapped Group (used by the Board for management fee comparisons) that have a similar sales load structure.
The Board noted that the total expense ratio of each of Initial Class, Initial Class R, Investor Class R, Service Class and Service Class R ranked below its competitive median for 2012 and the total expense ratio of each of Service Class 2 and Service Class 2 R ranked above its competitive median for 2012. The Board considered that, in general, various factors can affect total expense ratios. The Board noted that the fund offers multiple classes, each of which has a different 12b-1 fee structure, and that the multiple structures are intended to offer a range of pricing options for the intermediary market. The Board also noted that the total expense ratios of the classes vary primarily by the level of their 12b-1 fees, although differences in transfer agent fees may also cause expenses to vary from class to class.
Fees Charged to Other Fidelity Clients. The Board also considered Fidelity fee structures and other information with respect to clients of FMR and its affiliates, such as other mutual funds advised or subadvised by FMR or its affiliates, pension plan clients, and other institutional clients. The Board noted the findings of the 2013 ad hoc joint committee (created with the board of other Fidelity funds), which reviewed and compared Fidelity's institutional investment advisory business with its business of providing services to the Fidelity funds, including the differences in services provided, fees charged, and costs incurred, as well as competition in their respective marketplaces.
Based on its review of total expense ratios and fees charged to other Fidelity clients, the Board concluded that the total expense ratio of each class of the fund was reasonable, although in some cases above the median of the universe presented for comparison, in light of the services that the fund and its shareholders receive and the other factors considered.
Costs of the Services and Profitability. The Board considered the revenues earned and the expenses incurred by Fidelity in conducting the business of developing, marketing, distributing, managing, administering and servicing the fund and servicing the fund's shareholders. The Board also considered the level of Fidelity's profits in respect of all the Fidelity funds.
On an annual basis, FMR presents to the Board Fidelity's profitability for the fund. Fidelity calculates the profitability for each fund, as well as aggregate profitability for groups of Fidelity funds and all Fidelity funds, using a series of detailed revenue and cost allocation methodologies which originate with the books and records of Fidelity on which Fidelity's audited financial statements are based. The Audit Committee of the Board reviews any significant changes from the prior year's methodologies.
PricewaterhouseCoopers LLP (PwC), independent registered public accounting firm and auditor to Fidelity and certain Fidelity funds, has been engaged annually by the Board as part of the Board's assessment of Fidelity's profitability analysis. PwC's engagement includes the review and assessment of the methodologies used by Fidelity in determining the revenues and expenses attributable to Fidelity's mutual fund business, and completion of agreed-upon procedures surrounding the mathematical accuracy of fund profitability and its conformity to allocation methodologies. After considering PwC's reports issued under the engagement and information provided by Fidelity, the Board concluded that while other allocation methods may also be reasonable, Fidelity's profitability methodologies are reasonable in all material respects.
Annual Report
Board Approval of Investment Advisory Contracts and Management Fees - continued
The Board also reviewed Fidelity's non-fund businesses and fall-out benefits related to the mutual fund business as well as cases where Fidelity's affiliates may benefit from or be related to the fund's business.
The Board considered the costs of the services provided by and the profits realized by Fidelity in connection with the operation of the fund and was satisfied that the profitability was not excessive in the circumstances.
Economies of Scale. The Board considered whether there have been economies of scale in respect of the management of the Fidelity funds, whether the Fidelity funds (including the fund) have appropriately benefited from any such economies of scale, and whether there is potential for realization of any further economies of scale. The Board considered the extent to which the fund will benefit from economies of scale through increased services to the fund, through waivers or reimbursements, or through fee or expense reductions. The Board also noted that in 2009, it and the board of other Fidelity funds created an ad hoc committee (the Economies of Scale Committee) to analyze whether FMR attains economies of scale in respect of the management and servicing of the Fidelity funds, whether the Fidelity funds have appropriately benefited from such economies of scale, and whether there is potential for realization of any further economies of scale.
The Board recognized that the fund's management contract incorporates a "group fee" structure, which provides for lower group fee rates as total fund assets under FMR's management increase, and for higher group fee rates as total fund assets under FMR's management decrease. FMR calculates the group fee rates based on a tiered asset "breakpoint" schedule that varies based on asset class. The Board considered that the group fee is designed to deliver the benefits of economies of scale to fund shareholders when total Fidelity fund assets increase, even if assets of any particular fund are unchanged or have declined, because some portion of Fidelity's costs are attributable to services provided to all Fidelity funds, and all funds benefit if those costs can be allocated among more assets. The Board concluded that, given the group fee structure, fund shareholders will benefit from lower management fees as assets under FMR's management increase at the fund complex level, regardless of whether Fidelity achieves any such economies of scale.
The Board concluded, taking into account the analysis of the Economies of Scale Committee, that economies of scale, if any, are being appropriately shared between fund shareholders and Fidelity.
Amendment to Description of Group Fee Rate. At its July 2013 meeting, the Board voted to approve an amendment to the fund's management contract to modify the description of the "group fee rate" effective August 1, 2013. The Board noted that under the prior description in the contract, the group fee rate was based on the average net assets of all registered investment companies with which FMR has management contracts. Under the contract's tiered asset breakpoint schedule, the group fee rate is lower as total fund assets under FMR's management increase, and higher as total fund assets under FMR's management decrease. The Board considered that the prior description would have excluded the assets of 64 Fidelity sector funds from the group fee rate calculation once Fidelity SelectCo, LLC, an affiliate of FMR, assumed management responsibilities for those funds. The Board noted that modifying the description of the group fee rate to continue to include the assets of those 64 funds for purposes of determining group fee rate breakpoints would avoid an immediate adverse impact on the group fee rate for any fund.
Additional Information Requested by the Board. In order to develop fully the factual basis for consideration of the Fidelity funds' Advisory Contracts, the Board requested and received additional information on certain topics, including: (i) fund performance trends and Fidelity's long-term strategies for certain funds; (ii) the potential to further rationalize the Fidelity fund lineup with the possibility of achieving savings for the funds and Fidelity; (iii) the methodology with respect to competitive fund data and peer group classifications; (iv) the arrangements with, and performance of, certain sub-advisers on behalf of the Fidelity funds, as well as certain proposed participating affiliate arrangements; (v) the realization of fall-out benefits in certain Fidelity business units; (vi) Fidelity's group fee structures, including the rationale for the individual fee rates of certain categories of funds and the definition of group assets; (vii) trends regarding industry use of performance fee structures and the performance adjustment methodologies applicable to the Fidelity funds; (viii) additional competitive analysis regarding the total expenses for certain classes; and (ix) fund profitability methodology, including Fidelity's cost allocation methodology, and the impact of certain factors on fund profitability results.
Based on its evaluation of all of the conclusions noted above, and after considering all factors it believed relevant, the Board ultimately concluded that the advisory fee structures are fair and reasonable, and that the fund's Advisory Contracts should be renewed.
Annual Report
Investment Adviser
Fidelity Management & Research Company
Boston, MA
Investment Sub-Advisers
FMR Co., Inc.
Fidelity Management & Research (U.K.) Inc.
Fidelity Management & Research (Japan) Inc.
Fidelity Management & Research (Hong Kong) Limited
FIL Investment Advisors
FIL Investment Advisors (UK) Limited
FIL Investments (Japan) Limited
General Distributor
Fidelity Distributors Corporation
Smithfield, RI
Transfer and Service Agents
Fidelity Investments Institutional Operations Company, Inc.
Boston, MA
Fidelity Service Company, Inc.
Boston, MA
Custodian
JPMorgan Chase Bank
New York, NY
VIPOVRS-ANN-0214
1.540205.116
Fidelity® Variable Insurance Products:
High Income Portfolio - Class R
Annual Report
December 31, 2013
(Fidelity Cover Art)
Contents
Performance | (Click Here) | How the fund has done over time. |
Management's Discussion of Fund Performance | (Click Here) | The Portfolio Manager's review of fund performance and strategy. |
Shareholder Expense Example | (Click Here) | An example of shareholder expenses. |
Investment Changes | (Click Here) | A summary of major shifts in the fund's investments over the past six months. |
Investments | (Click Here) | A complete list of the fund's investments with their market values. |
Financial Statements | (Click Here) | Statements of assets and liabilities, operations, and changes in net assets, as well as financial highlights. |
Notes | (Click Here) | Notes to the financial statements. |
Report of Independent Registered Public Accounting Firm | (Click Here) | |
Trustees and Officers | (Click Here) | |
Board Approval of Investment Advisory Contracts and Management Fees | (Click Here) | |
To view a fund's proxy voting guidelines and proxy voting record for the 12-month period ended June 30, visit http://www.fidelity.com/proxyvotingresults or visit the Securities and Exchange Commission's (SEC) web site at http://www.sec.gov. You may also call 1-877-208-0098 to request a free copy of the proxy voting guidelines.
Fidelity Variable Insurance Products are separate account options which are purchased through a variable insurance contract.
Standard & Poor's, S&P and S&P 500 are registered service marks of The McGraw-Hill Companies, Inc. and have been licensed for use by Fidelity Distributors Corporation.
Other third-party marks appearing herein are the property of their respective owners.
All other marks appearing herein are registered or unregistered trademarks or service marks of FMR LLC or an affiliated company. © 2014 FMR LLC. All rights reserved.
This report and the financial statements contained herein are submitted for the general information of the shareholders of the fund. This report is not authorized for distribution to prospective investors in the fund unless preceded or accompanied by an effective prospectus.
A fund files its complete schedule of portfolio holdings with the SEC for the first and third quarters of each fiscal year on Form N-Q. Forms N-Q are available on the SEC's web site at http://www.sec.gov. A fund's Forms N-Q may be reviewed and copied at the SEC's Public Reference Room in Washington, DC. Information regarding the operation of the SEC's Public Reference Room may be obtained by calling 1-800-SEC-0330. For a complete list of a fund's portfolio holdings, view the most recent holdings listing, semiannual report, or annual report on Fidelity's web site at http://www.fidelity.com, http://www.advisor.fidelity.com, or http://www.401k.com, as applicable.
NOT FDIC INSURED • MAY LOSE VALUE • NO BANK GUARANTEE
Neither the fund nor Fidelity Distributors Corporation is a bank.
Annual Report
Average annual total return reflects the change in the value of an investment, assuming reinvestment of the class' distributions from dividend income and capital gains (the profits earned upon the sale of securities that have grown in value, if any) and assuming a constant rate of performance each year. During periods of reimbursement by Fidelity, a fund's total return will be greater than it would be had the reimbursement not occurred. Performance numbers are net of all underlying fund operating expenses, but do not include any insurance charges imposed by your insurance company's separate account. If performance information included the effect of these additional charges, the total returns would have been lower. How a fund did yesterday is no guarantee of how it will do tomorrow.
Average Annual Total Returns
Periods ended December 31, 2013 | Past 1
year | Past 5
years | Past 10
years |
VIP High Income Portfolio - Initial Class R A | 5.97% | 15.59% | 7.12% |
VIP High Income Portfolio - Service Class R B | 5.92% | 15.45% | 7.03% |
VIP High Income Portfolio - Service Class 2R C | 5.87% | 15.27% | 6.88% |
A The initial offering of Initial Class R shares took place on April 14, 2004. Returns prior to April 14, 2004, are those of Initial Class.
B The initial offering of Service Class R shares took place on April 14, 2004. Returns prior to April 14, 2004, are those of Service Class.
C The initial offering of Service Class 2R shares took place on April 14, 2004. Returns prior to April 14, 2004, are those of Service Class 2.
$10,000 Over 10 Years
Let's say hypothetically that $10,000 was invested in VIP High Income Portfolio - Initial Class R on December 31, 2003. The chart shows how the value of your investment would have changed, and also shows how The BofA Merrill LynchSM US High Yield Constrained Index performed over the same period. The initial offering of Initial Class R took place on April 14, 2004. See above for additional information regarding the performance of Initial Class R.

Annual Report
Market Recap: Global equity markets remained upbeat for the 12 months ending December 31, 2013, propelling the MSCI® ACWI® (All Country World Index) Index to a 23.24% return. Midyear turbulence gave way by autumn when policymakers in the U.S. and China had made clear their intentions to maintain accommodative monetary policies. That stance, combined with modest cyclical improvement around the globe and generally low valuations, underpinned the broad rally in equities, although the relative strength of the U.S. dollar generally tempered gains for U.S. investors holding foreign securities based in local currencies. During the period, the broad-market S&P 500® Index set a series of new highs, finishing the year up 32.39%. For the first time since 1995, the S&P® scored a "perfect 10," with all 10 economic sectors gaining at least 10% for the year. A resurgence in growth-oriented stocks lifted the Nasdaq Composite Index® to a 40.12% result for 2013, while the blue-chip Dow Jones Industrial AverageSM notched a relatively more modest 29.65% gain. International developed-markets equities rose in concert with their U.S. counterparts, with the MSCI® EAFE® Index gaining 22.92% for the period. Meanwhile, foreign exchange and commodity weakness curbed results in resource-heavy emerging markets (EM), especially in the year's waning months. More generally, concern over EM's slowing growth, its declining share of global trade and uncertainty surrounding U.S. central bank intentions were all factors hampering performance. The MSCI Emerging Markets Index returned -2.27% for the period. On the bond side, U.S. high-yield securities rallied with equities for much of the period, with The BofA Merrill LynchSM US High Yield Constrained Index returning 7.41% for 2013. The more rate-sensitive U.S. investment-grade bond category faced headwinds though, as reflected in the -2.02% return of the Barclays® U.S. Aggregate Bond Index. Within the Barclays index, investment-grade corporate credit returned -2.01%, while ultra-safe U.S. Treasuries saw a -2.75% result. Major non-U.S. developed markets performed only slightly better, with the Citigroup Non-USD Group-of-Seven (G7) Equal Weighted Index logging a -1.59% result. After several years of strong advances, EM debt reversed course in 2013, with the J.P. Morgan Emerging Markets Bond Index Global returning -6.58%.
Comments from Matthew Conti, Portfolio Manager of VIP High Income Portfolio: For the year, the fund's share classes underperformed the 7.41% return of the BofA Merrill Lynch index. (For specific portfolio results, please refer to the performance section of this report.) The fund underperformed the index due to its underweighting in lower-quality bonds, which were the top performers in the index during the period. Security selection in metals/mining and technology were negatives. Detractors included drilling services firm Boart Longyear Management and merchant power producer GenOn Energy. Boart suffered from declining commodity prices and GenOn because declining power usage depressed power prices. The fund's cash position, held for liquidity purposes, also detracted in an up market. On the plus side, security selection in energy and an overweighting in the food & drug retail industry helped. Drug store company Rite Aid and not owning Texas-based utility TXU were the top two contributors to performance relative to the index Rite-Aid benefited from increased sales of generic medications as several patents expired, because sales of generics are more profitable to the company than name-brand drugs. TXU lagged because of its imminent bankruptcy.
The views expressed above reflect those of the portfolio manager(s) only through the end of the period as stated on the cover of this report and do not necessarily represent the views of Fidelity or any other person in the Fidelity organization. Any such views are subject to change at any time based upon market or other conditions and Fidelity disclaims any responsibility to update such views. These views may not be relied on as investment advice and, because investment decisions for a Fidelity fund are based on numerous factors, may not be relied on as an indication of trading intent on behalf of any Fidelity fund.
Annual Report
As a shareholder of the Fund, you incur two types of costs: (1) transaction costs, including redemption fees and (2) ongoing costs, including management fees, distribution and/or service (12b-1) fees and other Fund expenses. This Example is intended to help you understand your ongoing costs (in dollars) of investing in the Fund and to compare these costs with the ongoing costs of investing in other mutual funds.
The Example is based on an investment of $1,000 invested at the beginning of the period and held for the entire period (July 1, 2013 to December 31, 2013).
Actual Expenses
The first line of the accompanying table for each class of the Fund provides information about actual account values and actual expenses. You may use the information in this line, together with the amount you invested, to estimate the expenses that you paid over the period. Simply divide your account value by $1,000.00 (for example, an $8,600 account value divided by $1,000.00 = 8.6), then multiply the result by the number in the first line for a class of the Fund under the heading entitled "Expenses Paid During Period" to estimate the expenses you paid on your account during this period. The estimate of expenses does not include any fees or other expenses of any variable annuity or variable life insurance product. If they were, the estimate of expenses you paid during the period would be higher, and your ending account value would be lower. In addition, the Fund, as a shareholder in the underlying Fidelity Central Funds, will indirectly bear its pro-rata share of the fees and expenses incurred by the underlying Fidelity Central Funds. These fees and expenses are not included in the Fund's annualized expense ratio used to calculate the expense estimate in the table below.
Hypothetical Example for Comparison Purposes
The second line of the accompanying table for each class of the Fund provides information about hypothetical account values and hypothetical expenses based on a Class' actual expense ratio and an assumed rate of return of 5% per year before expenses, which is not the Class' actual return. The hypothetical account values and expenses may not be used to estimate the actual ending account balance or expenses you paid for the period. You may use this information to compare the ongoing costs of investing in the Fund and other funds. To do so, compare this 5% hypothetical example with the 5% hypothetical examples that appear in the shareholder reports of the other funds. The estimate of expenses does not include any fees or other expenses of any variable annuity or variable life insurance product. If they were, the estimate of expenses you paid during the period would be higher, and your ending account value would be lower. In addition, the Fund, as a shareholder in the underlying Fidelity Central Funds, will indirectly bear its pro-rata share of the fees and expenses incurred by the underlying Fidelity Central Funds. These fees and expenses are not included in the Fund's annualized expense ratio used to calculate the expense estimate in the table below.
Please note that the expenses shown in the table are meant to highlight your ongoing costs only and do not reflect any transaction costs. Therefore, the second line of the table is useful in comparing ongoing costs only, and will not help you determine the relative total costs of owning different funds. In addition, if these transactional costs were included, your costs would have been higher.
| Annualized
Expense Ratio B | Beginning
Account Value
July 1, 2013 | Ending
Account Value
December 31, 2013 | Expenses Paid
During Period*
July 1, 2013
to December 31, 2013 |
Initial Class | .67% | | | |
Actual | | $ 1,000.00 | $ 1,052.90 | $ 3.47 |
HypotheticalA | | $ 1,000.00 | $ 1,021.83 | $ 3.41 |
Service Class | .76% | | | |
Actual | | $ 1,000.00 | $ 1,054.00 | $ 3.93 |
HypotheticalA | | $ 1,000.00 | $ 1,021.37 | $ 3.87 |
Service Class 2 | .92% | | | |
Actual | | $ 1,000.00 | $ 1,052.10 | $ 4.76 |
HypotheticalA | | $ 1,000.00 | $ 1,020.57 | $ 4.69 |
Initial Class R | .66% | | | |
Actual | | $ 1,000.00 | $ 1,054.90 | $ 3.42 |
HypotheticalA | | $ 1,000.00 | $ 1,021.88 | $ 3.36 |
Service Class R | .76% | | | |
Actual | | $ 1,000.00 | $ 1,054.50 | $ 3.94 |
HypotheticalA | | $ 1,000.00 | $ 1,021.37 | $ 3.87 |
Service Class 2R | .92% | | | |
Actual | | $ 1,000.00 | $ 1,053.80 | $ 4.76 |
HypotheticalA | | $ 1,000.00 | $ 1,020.57 | $ 4.69 |
Investor Class | .70% | | | |
Actual | | $ 1,000.00 | $ 1,053.00 | $ 3.62 |
HypotheticalA | | $ 1,000.00 | $ 1,021.68 | $ 3.57 |
A 5% return per year before expenses
B Annualized expense ratio reflects expenses net of applicable fee waivers.
* Expenses are equal to each Class' annualized expense ratio, multiplied by the average account value over the period, multiplied by 184/365 (to reflect the one-half year period).
Annual Report
Investment Changes (Unaudited)
Top Five Holdings as of December 31, 2013 |
(by issuer, excluding cash equivalents) | % of fund's
net assets | % of fund's net assets
6 months ago |
Rite Aid Corp. | 1.8 | 3.4 |
First Data Corp. | 1.7 | 2.0 |
Icahn Enterprises LP/Icahn Enterprises Finance Corp. | 1.5 | 0.9 |
Mirant Americas Generation LLC | 1.4 | 1.8 |
Reynolds Group Issuer, Inc./Reynolds Group Issuer LLC/Reynolds Group Issuer (Luxembourg) SA | 1.4 | 1.5 |
| 7.8 | |
Top Five Market Sectors as of December 31, 2013 |
| % of fund's
net assets | % of fund's net assets
6 months ago |
Energy | 12.9 | 12.9 |
Technology | 9.0 | 8.3 |
Telecommunications | 7.3 | 9.2 |
Diversified Financial Services | 6.0 | 5.3 |
Healthcare | 4.8 | 3.8 |
Quality Diversification (% of fund's net assets) |
As of December 31, 2013 | As of June 30, 2013 |
| BBB 1.1% | | | BBB 1.7% | |
| BB 35.8% | | | BB 32.1% | |
| B 43.2% | | | B 46.4% | |
| CCC,CC,C 14.7% | | | CCC,CC,C 15.7% | |
| Not Rated 0.6% | | | Not Rated 0.2% | |
| Equities 0.0% | | | Equities 0.1% | |
| Short-Term
Investments and
Net Other Assets 4.6% | | | Short-Term
Investments and
Net Other Assets 3.8% | |

We have used ratings from Moody's Investors Service, Inc. Where Moody's® ratings are not available, we have used S&P® ratings. All ratings are as of the date indicated and do not reflect subsequent changes. |
Asset Allocation (% of fund's net assets) |
As of December 31, 2013* | As of June 30, 2013** |
| Nonconvertible
Bonds 89.3% | | | Nonconvertible
Bonds 93.2% | |
| Common Stocks 0.0% | | | Common Stocks 0.1% | |
| Bank Loan
Obligations 5.8% | | | Bank Loan
Obligations 2.8% | |
| Other Investments 0.3% | | | Other Investments 0.1% | |
| Short-Term
Investments and
Net Other Assets (Liabilities) 4.6% | | | Short-Term
Investments and
Net Other Assets (Liabilities) 3.8% | |
* Foreign investments | 20.8% | | ** Foreign investments | 18.8% | |

Annual Report
Investments December 31, 2013
Showing Percentage of Net Assets
Nonconvertible Bonds - 89.3% |
| Principal Amount | | Value |
Aerospace - 0.8% |
GenCorp, Inc. 7.125% 3/15/21 | | $ 895,000 | | $ 957,650 |
TransDigm, Inc.: | | | | |
5.5% 10/15/20 | | 5,935,000 | | 5,801,463 |
7.5% 7/15/21 | | 2,750,000 | | 2,956,250 |
Triumph Group, Inc. 4.875% 4/1/21 | | 2,210,000 | | 2,143,700 |
| | 11,859,063 |
Air Transportation - 2.7% |
Air Canada 6.625% 5/15/18 (d) | | 4,995,000 | | 4,973,022 |
American Airlines, Inc. pass-thru certificates Series 2013-1B Class B, 5.625% 1/15/21 (d) | | 495,000 | | 496,238 |
Continental Airlines, Inc.: | | | | |
pass-thru trust certificates 9.798% 4/1/21 | | 2,844,624 | | 3,207,314 |
5.5% 4/29/22 | | 3,015,000 | | 3,105,450 |
6.125% 4/29/18 (d) | | 520,000 | | 543,400 |
9.25% 5/10/17 | | 655,343 | | 725,793 |
Delta Air Lines, Inc. pass-thru trust certificates: | | | | |
6.375% 7/2/17 (d) | | 1,985,000 | | 2,109,063 |
6.75% 5/23/17 | | 1,985,000 | | 2,118,988 |
8.021% 8/10/22 | | 1,533,010 | | 1,724,637 |
8.954% 8/10/14 | | 1,245,554 | | 1,261,124 |
Northwest Airlines, Inc. pass-thru trust certificates 8.028% 11/1/17 | | 553,780 | | 599,467 |
U.S. Airways Group, Inc. 6.125% 6/1/18 | | 3,130,000 | | 3,153,475 |
U.S. Airways pass-thru certificates: Series 2012-2C, 5.45% 6/3/18 | | 3,565,000 | | 3,502,613 |
Series 2013-1 Class B, 5.375% 5/15/23 | | 710,000 | | 699,350 |
United Air Lines, Inc. pass-thru trust certificates: | | | | |
Class B, 7.336% 7/2/19 | | 2,397,831 | | 2,541,701 |
9.75% 1/15/17 | | 1,610,949 | | 1,852,591 |
12% 1/15/16 (d) | | 454,648 | | 511,479 |
United Continental Holdings, Inc.: | | | | |
6% 12/1/20 | | 4,505,000 | | 4,493,738 |
6% 7/15/26 | | 2,605,000 | | 2,240,300 |
6% 7/15/28 | | 1,395,000 | | 1,185,750 |
6.375% 6/1/18 | | 300,000 | | 313,500 |
| | 41,358,993 |
Automotive - 2.9% |
American Axle & Manufacturing, Inc.: | | | | |
5.125% 2/15/19 | | 575,000 | | 590,813 |
6.25% 3/15/21 | | 6,980,000 | | 7,416,250 |
Chrysler Group LLC/CG Co-Issuer, Inc. 8% 6/15/19 | | 3,930,000 | | 4,342,650 |
Dana Holding Corp.: | | | | |
5.375% 9/15/21 | | 1,085,000 | | 1,089,069 |
|
| Principal Amount | | Value |
6% 9/15/23 | | $ 1,085,000 | | $ 1,087,713 |
6.5% 2/15/19 | | 1,505,000 | | 1,599,063 |
6.75% 2/15/21 | | 1,710,000 | | 1,838,250 |
General Motors Co.: | | | | |
3.5% 10/2/18 (d) | | 3,425,000 | | 3,502,063 |
6.25% 10/2/43 (d) | | 4,155,000 | | 4,316,006 |
General Motors Financial Co., Inc.: | | | | |
3.25% 5/15/18 (d) | | 6,900,000 | | 6,900,000 |
4.75% 8/15/17 (d) | | 3,370,000 | | 3,576,413 |
Jaguar Land Rover PLC 4.125% 12/15/18 (d) | | 2,675,000 | | 2,691,719 |
Schaeffler Holding Finance BV 6.875% 8/15/18
pay-in-kind (d)(g) | | 4,625,000 | | 4,902,500 |
| | 43,852,509 |
Banks & Thrifts - 1.8% |
Ally Financial, Inc.: | | | | |
2.75% 1/30/17 | | 3,010,000 | | 3,021,288 |
4.75% 9/10/18 | | 6,810,000 | | 7,124,963 |
Barclays Bank PLC 7.625% 11/21/22 | | 11,385,000 | | 12,125,025 |
GMAC LLC 8% 12/31/18 | | 2,465,000 | | 2,908,700 |
Synovus Financial Corp.: | | | | |
5.125% 6/15/17 | | 760,000 | | 784,700 |
7.875% 2/15/19 | | 1,568,000 | | 1,760,080 |
| | 27,724,756 |
Broadcasting - 1.6% |
AMC Networks, Inc. 4.75% 12/15/22 | | 5,725,000 | | 5,453,063 |
Clear Channel Communications, Inc.: | | | | |
4.9% 5/15/15 | | 4,585,000 | | 4,401,600 |
5.5% 12/15/16 | | 6,085,000 | | 5,354,800 |
Sirius XM Radio, Inc.: | | | | |
5.75% 8/1/21 (d) | | 2,315,000 | | 2,338,150 |
5.875% 10/1/20 (d) | | 2,410,000 | | 2,458,200 |
Starz LLC/Starz Finance Corp. 5% 9/15/19 | | 4,990,000 | | 5,102,275 |
| | 25,108,088 |
Building Materials - 2.8% |
Building Materials Corp. of America: | | | | |
6.75% 5/1/21 (d) | | 3,680,000 | | 3,983,600 |
6.875% 8/15/18 (d) | | 4,490,000 | | 4,770,625 |
Building Materials Holding Corp. 9% 9/15/18 (d) | | 4,410,000 | | 4,751,775 |
HD Supply, Inc.: | | | | |
7.5% 7/15/20 | | 7,655,000 | | 8,248,263 |
8.125% 4/15/19 | | 3,615,000 | | 4,026,206 |
Headwaters, Inc.: | | | | |
7.25% 1/15/19 (d) | | 905,000 | | 929,888 |
7.625% 4/1/19 | | 2,525,000 | | 2,720,688 |
Masco Corp. 5.95% 3/15/22 | | 1,815,000 | | 1,919,363 |
Nonconvertible Bonds - continued |
| Principal Amount | | Value |
Building Materials - continued |
Texas Industries, Inc. 9.25% 8/15/20 | | $ 7,285,000 | | $ 8,113,669 |
U.S. Concrete, Inc. 8.5% 12/1/18 (d) | | 1,160,000 | | 1,186,100 |
USG Corp.: | | | | |
5.875% 11/1/21 (d) | | 330,000 | | 343,200 |
7.875% 3/30/20 (d) | | 970,000 | | 1,091,250 |
| | 42,084,627 |
Cable TV - 3.1% |
Cablevision Systems Corp. 7.75% 4/15/18 | | 740,000 | | 826,025 |
CCO Holdings LLC/CCO Holdings Capital Corp.: | | | | |
6.5% 4/30/21 | | 2,155,000 | | 2,214,263 |
7% 1/15/19 | | 6,450,000 | | 6,796,688 |
Cequel Communications Escrow I LLC/Cequel Communications Escrow Capital Corp. 6.375% 9/15/20 (d) | | 3,395,000 | | 3,479,875 |
Cequel Communications Holdings I LLC/Cequel Capital Corp. 5.125% 12/15/21 (d) | | 4,290,000 | | 4,021,875 |
Cogeco Cable, Inc. 4.875% 5/1/20 (d) | | 710,000 | | 685,150 |
DISH DBS Corp. 4.25% 4/1/18 | | 1,705,000 | | 1,739,100 |
Harron Communications LP/Harron Finance Corp. 9.125% 4/1/20 (d) | | 2,085,000 | | 2,309,138 |
Lynx I Corp. 5.375% 4/15/21 (d) | | 2,550,000 | | 2,550,000 |
RCN Telecom Services LLC/RCN Capital Corp. 8.5% 8/15/20 (d) | | 2,195,000 | | 2,216,950 |
Unitymedia Hessen GmbH & Co. KG/Unitymedia NRW GmbH: | | | | |
5.5% 1/15/23 (d) | | 4,325,000 | | 4,195,250 |
7.5% 3/15/19 (d) | | 950,000 | | 1,033,125 |
UPCB Finance III Ltd. 6.625% 7/1/20 (d) | | 2,710,000 | | 2,879,375 |
UPCB Finance V Ltd. 7.25% 11/15/21 (d) | | 3,270,000 | | 3,547,950 |
WaveDivision Escrow LLC/WaveDivision Escrow Corp. 8.125% 9/1/20 (d) | | 7,920,000 | | 8,395,200 |
| | 46,889,964 |
Capital Goods - 0.4% |
Amsted Industries, Inc. 8.125% 3/15/18 (d) | | 2,030,000 | | 2,139,113 |
J.B. Poindexter & Co., Inc. 9% 4/1/22 (d) | | 3,830,000 | | 4,088,525 |
| | 6,227,638 |
Chemicals - 2.5% |
Ashland, Inc. 3.875% 4/15/18 | | 3,030,000 | | 3,067,875 |
INEOS Finance PLC 8.375% 2/15/19 (d) | | 5,495,000 | | 6,113,188 |
|
| Principal Amount | | Value |
Kinove German Bondco GmbH 9.625% 6/15/18 (d) | | $ 5,539,000 | | $ 6,120,595 |
LSB Industries, Inc. 7.75% 8/1/19 (d) | | 1,220,000 | | 1,281,000 |
Nufarm Australia Ltd. 6.375% 10/15/19 (d) | | 3,140,000 | | 3,249,900 |
OMNOVA Solutions, Inc. 7.875% 11/1/18 | | 2,575,000 | | 2,768,125 |
Rockwood Specialties Group, Inc. 4.625% 10/15/20 | | 2,850,000 | | 2,910,563 |
Trinseo Materials Operating SCA/Trinseo Materials Finance, Inc. 8.75% 2/1/19 (d) | | 9,195,000 | | 9,493,838 |
Tronox Finance LLC 6.375% 8/15/20 | | 3,675,000 | | 3,748,500 |
| | 38,753,584 |
Consumer Products - 0.3% |
First Quality Finance Co., Inc. 4.625% 5/15/21 (d) | | 5,415,000 | | 5,144,250 |
Containers - 2.7% |
Ardagh Packaging Finance PLC 7.375% 10/15/17 (d) | | 1,415,000 | | 1,521,125 |
Ardagh Packaging Finance PLC/Ardagh MP Holdings U.S.A., Inc.: | | | | |
7% 11/15/20 (d) | | 4,955,000 | | 5,004,550 |
7.375% 10/15/17 (d) | | 335,000 | | 359,706 |
Ball Corp. 4% 11/15/23 | | 3,285,000 | | 2,940,075 |
BOE Intermediate Holding Corp. 9.75% 11/1/17 pay-in-kind (d) | | 2,138,047 | | 2,193,013 |
Crown Americas LLC/Crown Americas Capital Corp. IV 4.5% 1/15/23 | | 8,240,000 | | 7,704,400 |
Reynolds Group Issuer, Inc./Reynolds Group Issuer LLC/Reynolds Group Issuer (Luxembourg) SA: | | | | |
5.75% 10/15/20 | | 8,455,000 | | 8,624,100 |
8.5% 5/15/18 (c) | | 6,290,000 | | 6,635,950 |
9.875% 8/15/19 | | 5,310,000 | | 5,907,375 |
| | 40,890,294 |
Diversified Financial Services - 6.0% |
Aircastle Ltd.: | | | | |
4.625% 12/15/18 | | 1,245,000 | | 1,254,338 |
6.25% 12/1/19 | | 1,740,000 | | 1,863,975 |
6.75% 4/15/17 | | 2,030,000 | | 2,263,450 |
9.75% 8/1/18 | | 3,295,000 | | 3,599,788 |
CIT Group, Inc.: | | | | |
5.25% 3/15/18 | | 4,935,000 | | 5,292,788 |
5.375% 5/15/20 | | 4,035,000 | | 4,287,188 |
5.5% 2/15/19 (d) | | 5,555,000 | | 5,957,738 |
FLY Leasing Ltd. 6.75% 12/15/20 | | 4,015,000 | | 4,065,188 |
Icahn Enterprises LP/Icahn Enterprises Finance Corp.: | | | | |
6% 8/1/20 (d) | | 9,685,000 | | 9,975,550 |
8% 1/15/18 | | 11,285,000 | | 11,736,400 |
Nonconvertible Bonds - continued |
| Principal Amount | | Value |
Diversified Financial Services - continued |
ILFC E-Capital Trust I 5.46% 12/21/65 (d)(g) | | $ 3,780,000 | | $ 3,458,700 |
ILFC E-Capital Trust II 6.25% 12/21/65 (d)(g) | | 3,865,000 | | 3,652,425 |
International Lease Finance Corp.: | | | | |
3.875% 4/15/18 | | 2,365,000 | | 2,370,913 |
4.625% 4/15/21 | | 2,020,000 | | 1,929,100 |
5.875% 4/1/19 | | 5,485,000 | | 5,841,525 |
5.875% 8/15/22 | | 3,480,000 | | 3,471,300 |
6.25% 5/15/19 | | 2,245,000 | | 2,430,213 |
8.75% 3/15/17 | | 2,110,000 | | 2,484,525 |
SLM Corp.: | | | | |
4.875% 6/17/19 | | 3,775,000 | | 3,761,610 |
5.5% 1/15/19 | | 8,540,000 | | 8,759,905 |
8% 3/25/20 | | 1,565,000 | | 1,772,363 |
8.45% 6/15/18 | | 1,560,000 | | 1,817,400 |
| | 92,046,382 |
Diversified Media - 1.4% |
Clear Channel Worldwide Holdings, Inc.: | | | | |
6.5% 11/15/22 | | 2,715,000 | | 2,752,331 |
6.5% 11/15/22 | | 4,990,000 | | 5,096,038 |
Darling Escrow Corp. 5.375% 1/15/22 (d)(f) | | 990,000 | | 997,425 |
MDC Partners, Inc. 6.75% 4/1/20 (d) | | 4,410,000 | | 4,613,963 |
Nielsen Co. S.a.r.l. (Luxembourg) 5.5% 10/1/21 (d) | | 3,610,000 | | 3,664,150 |
Nielsen Finance LLC/Nielsen Finance Co. 4.5% 10/1/20 | | 4,525,000 | | 4,400,563 |
| | 21,524,470 |
Electric Utilities - 4.8% |
Atlantic Power Corp. 9% 11/15/18 | | 8,740,000 | | 9,111,450 |
Dolphin Subsidiary II, Inc. 6.5% 10/15/16 | | 1,205,000 | | 1,304,413 |
GenOn Energy, Inc. 9.5% 10/15/18 | | 1,515,000 | | 1,715,738 |
Mirant Americas Generation LLC: | | | | |
8.5% 10/1/21 | | 6,785,000 | | 7,141,213 |
9.125% 5/1/31 | | 14,265,000 | | 14,514,638 |
NRG Energy, Inc. 7.625% 1/15/18 | | 5,090,000 | | 5,802,600 |
NSG Holdings II, LLC 7.75% 12/15/25 (d) | | 10,300,000 | | 10,969,500 |
Puget Energy, Inc.: | | | | |
5.625% 7/15/22 | | 3,925,000 | | 4,268,453 |
6.5% 12/15/20 | | 3,975,000 | | 4,522,894 |
The AES Corp.: | | | | |
4.875% 5/15/23 | | 3,475,000 | | 3,249,125 |
7.375% 7/1/21 | | 9,660,000 | | 10,891,650 |
| | 73,491,674 |
|
| Principal Amount | | Value |
Energy - 11.8% |
Access Midstream Partners LP/ACMP Finance Corp. 4.875% 5/15/23 | | $ 4,265,000 | | $ 4,115,725 |
Antero Resources Finance Corp.: | | | | |
5.375% 11/1/21 (d) | | 1,930,000 | | 1,949,300 |
6% 12/1/20 | | 6,300,000 | | 6,615,000 |
7.25% 8/1/19 | | 1,209,000 | | 1,299,675 |
Basic Energy Services, Inc. 7.75% 2/15/19 | | 615,000 | | 642,675 |
Chesapeake Energy Corp.: | | | | |
6.125% 2/15/21 | | 7,230,000 | | 7,754,175 |
6.875% 11/15/20 | | 1,250,000 | | 1,412,500 |
Chesapeake Midstream Partners LP/CHKM Finance Corp.: | | | | |
5.875% 4/15/21 | | 615,000 | | 654,975 |
6.125% 7/15/22 | | 1,745,000 | | 1,867,150 |
Chesapeake Oilfield Operating LLC 6.625% 11/15/19 (c) | | 1,680,000 | | 1,759,800 |
Crestwood Midstream Partners LP/Crestwood Midstream Finance Corp.: | | | | |
6.125% 3/1/22 (d) | | 1,175,000 | | 1,204,375 |
7.75% 4/1/19 | | 2,315,000 | | 2,511,775 |
Denbury Resources, Inc.: | | | | |
4.625% 7/15/23 | | 6,660,000 | | 6,010,650 |
6.375% 8/15/21 | | 2,550,000 | | 2,715,750 |
Edgen Murray Corp. 8.75% 11/1/20 (d) | | 2,285,000 | | 2,616,325 |
Endeavor Energy Resources LP/EER Finance, Inc. 7% 8/15/21 (d) | | 7,515,000 | | 7,590,150 |
Energy Partners Ltd. 8.25% 2/15/18 | | 2,795,000 | | 3,004,625 |
EP Energy LLC/Everest Acquisition Finance, Inc. 7.75% 9/1/22 | | 4,015,000 | | 4,496,800 |
Everest Acquisition LLC/Everest Acquisition Finance, Inc.: | | | | |
6.875% 5/1/19 | | 1,655,000 | | 1,781,194 |
9.375% 5/1/20 | | 8,685,000 | | 10,020,319 |
Expro Finance Luxembourg SCA 8.5% 12/15/16 (d) | | 3,312,000 | | 3,452,760 |
Exterran Holdings, Inc. 7.25% 12/1/18 | | 7,855,000 | | 8,296,844 |
Exterran Partners LP/EXLP Finance Corp. 6% 4/1/21 (d) | | 6,300,000 | | 6,252,750 |
Forbes Energy Services Ltd. 9% 6/15/19 | | 4,680,000 | | 4,586,400 |
Forest Oil Corp. 7.25% 6/15/19 | | 977,000 | | 951,354 |
Gibson Energy, Inc. 6.75% 7/15/21 (d) | | 3,425,000 | | 3,621,938 |
Hornbeck Offshore Services, Inc.: | | | | |
5% 3/1/21 | | 2,465,000 | | 2,415,700 |
5.875% 4/1/20 | | 1,240,000 | | 1,280,300 |
Kinder Morgan Holding Co. LLC: | | | | |
5% 2/15/21 (d) | | 2,525,000 | | 2,487,090 |
5.625% 11/15/23 (d) | | 3,645,000 | | 3,529,224 |
Nonconvertible Bonds - continued |
| Principal Amount | | Value |
Energy - continued |
Northern Tier Energy LLC/Northern Tier Finance Corp. 7.125% 11/15/20 | | $ 6,070,000 | | $ 6,343,150 |
Offshore Group Investment Ltd.: | | | | |
7.125% 4/1/23 | | 1,890,000 | | 1,927,800 |
7.5% 11/1/19 | | 7,160,000 | | 7,786,500 |
Oil States International, Inc. 6.5% 6/1/19 | | 3,300,000 | | 3,510,375 |
Pacific Drilling SA 5.375% 6/1/20 (d) | | 4,750,000 | | 4,773,750 |
Petroleum Geo-Services ASA 7.375% 12/15/18 (d) | | 3,225,000 | | 3,434,625 |
Precision Drilling Corp.: | | | | |
6.5% 12/15/21 | | 290,000 | | 308,850 |
6.625% 11/15/20 | | 2,505,000 | | 2,674,088 |
Samson Investment Co. 10.5% 2/15/20 (c)(d) | | 11,155,000 | | 12,158,950 |
SemGroup Corp. 7.5% 6/15/21 (d) | | 2,775,000 | | 2,934,563 |
Targa Resources Partners LP/Targa Resources Partners Finance Corp.: | | | | |
4.25% 11/15/23 (d) | | 2,445,000 | | 2,188,275 |
5.25% 5/1/23 | | 4,876,000 | | 4,723,625 |
6.375% 8/1/22 | | 592,000 | | 626,040 |
6.875% 2/1/21 | | 2,840,000 | | 3,053,000 |
Tesoro Logistics LP/Tesoro Logistics Finance Corp. 6.125% 10/15/21 | | 855,000 | | 880,650 |
Western Refining, Inc. 6.25% 4/1/21 | | 5,905,000 | | 5,949,288 |
Whiting Petroleum Corp.: | | | | |
5% 3/15/19 | | 4,610,000 | | 4,713,725 |
5.75% 3/15/21 | | 4,815,000 | | 4,983,525 |
| | 179,868,077 |
Entertainment/Film - 0.4% |
GLP Capital LP/GLP Financing II, Inc.: | | | | |
4.375% 11/1/18 (d) | | 1,735,000 | | 1,774,038 |
5.375% 11/1/23 (d) | | 1,310,000 | | 1,287,075 |
NAI Entertainment Holdings LLC/NAI Entertainment Finance Corp. 5% 8/1/18 (d) | | 2,970,000 | | 3,066,525 |
| | 6,127,638 |
Environmental - 1.5% |
ADS Waste Holdings, Inc. 8.25% 10/1/20 | | 5,875,000 | | 6,374,375 |
Clean Harbors, Inc.: | | | | |
5.125% 6/1/21 | | 3,450,000 | | 3,484,500 |
5.25% 8/1/20 | | 2,590,000 | | 2,667,700 |
Covanta Holding Corp. 7.25% 12/1/20 | | 5,165,000 | | 5,638,600 |
|
| Principal Amount | | Value |
Tervita Corp.: | | | | |
8% 11/15/18 (d) | | $ 2,675,000 | | $ 2,761,938 |
9.75% 11/1/19 (d) | | 1,495,000 | | 1,465,100 |
10.875% 2/15/18 (d) | | 875,000 | | 884,275 |
| | 23,276,488 |
Food & Drug Retail - 2.2% |
BI-LO LLC/BI-LO Finance Corp. 8.625% 9/15/18
pay-in-kind (d)(g) | | 1,340,000 | | 1,400,300 |
JBS Investments GmbH 7.75% 10/28/20 (d) | | 3,740,000 | | 3,768,050 |
Rite Aid Corp.: | | | | |
6.75% 6/15/21 | | 3,520,000 | | 3,691,600 |
9.25% 3/15/20 | | 21,255,000 | | 24,390,067 |
| | 33,250,017 |
Food/Beverage/Tobacco - 1.8% |
Barry Callebaut Services NV 5.5% 6/15/23 (d) | | 2,485,000 | | 2,534,700 |
DS Waters of America, Inc. 10% 9/1/21 (d) | | 1,485,000 | | 1,592,663 |
ESAL GmbH 6.25% 2/5/23 (d) | | 7,405,000 | | 6,645,988 |
FAGE Dairy Industry SA/FAGE U.S.A. Dairy Industry, Inc. 9.875% 2/1/20 (d) | | 1,340,000 | | 1,400,300 |
Hawk Acquisition Sub, Inc. 4.25% 10/15/20 (d) | | 4,950,000 | | 4,789,125 |
JBS U.S.A. LLC/JBS U.S.A. Finance, Inc.: | | | | |
7.25% 6/1/21 (d) | | 2,930,000 | | 3,047,200 |
8.25% 2/1/20 (d) | | 6,670,000 | | 7,236,950 |
| | 27,246,926 |
Gaming - 1.8% |
Ameristar Casinos, Inc. 7.5% 4/15/21 | | 7,590,000 | | 8,235,150 |
Golden Nugget Escrow, Inc. 8.5% 12/1/21 (d) | | 2,770,000 | | 2,797,700 |
MCE Finance Ltd. 5% 2/15/21 (d) | | 5,010,000 | | 4,884,750 |
MGM Mirage, Inc.: | | | | |
7.625% 1/15/17 | | 930,000 | | 1,057,875 |
8.625% 2/1/19 | | 2,760,000 | | 3,236,100 |
11.375% 3/1/18 | | 2,360,000 | | 2,997,200 |
PNK Finance Corp. 6.375% 8/1/21 (d) | | 2,605,000 | | 2,663,613 |
Seminole Hard Rock Entertainment, Inc. 5.875% 5/15/21 (d) | | 1,490,000 | | 1,463,925 |
| | 27,336,313 |
Healthcare - 4.6% |
Community Health Systems, Inc.: | | | | |
5.125% 8/15/18 | | 3,535,000 | | 3,649,888 |
8% 11/15/19 | | 8,020,000 | | 8,701,700 |
DaVita, Inc. 5.75% 8/15/22 | | 6,925,000 | | 7,011,563 |
DJO Finance LLC/DJO Finance Corp.: | | | | |
7.75% 4/15/18 | | 1,350,000 | | 1,373,625 |
Nonconvertible Bonds - continued |
| Principal Amount | | Value |
Healthcare - continued |
DJO Finance LLC/DJO Finance Corp.: - continued | | | | |
8.75% 3/15/18 | | $ 165,000 | | $ 181,088 |
9.875% 4/15/18 | | 2,425,000 | | 2,606,875 |
Emergency Medical Services Corp. 8.125% 6/1/19 | | 3,292,000 | | 3,567,705 |
HCA Holdings, Inc. 8% 10/1/18 | | 4,350,000 | | 5,138,438 |
HealthSouth Corp. 7.25% 10/1/18 | | 3,588,000 | | 3,834,675 |
MPT Operating Partnership LP/MPT Finance Corp. 6.875% 5/1/21 | | 2,595,000 | | 2,776,650 |
Omega Healthcare Investors, Inc.: | | | | |
6.75% 10/15/22 | | 235,000 | | 255,269 |
7.5% 2/15/20 | | 890,000 | | 970,100 |
Sabra Health Care LP/Sabra Capital Corp. 8.125% 11/1/18 | | 338,000 | | 365,040 |
Tenet Healthcare Corp.: | | | | |
6% 10/1/20 (d) | | 5,420,000 | | 5,657,125 |
6.25% 11/1/18 | | 1,435,000 | | 1,589,263 |
8.125% 4/1/22 | | 7,055,000 | | 7,601,763 |
Valeant Pharmaceuticals International: | | | | |
6.5% 7/15/16 (d) | | 1,314,000 | | 1,356,705 |
6.75% 8/15/18 (d) | | 4,195,000 | | 4,609,256 |
6.875% 12/1/18 (d) | | 4,655,000 | | 4,980,850 |
VPI Escrow Corp. 6.375% 10/15/20 (d) | | 3,960,000 | | 4,172,850 |
| | 70,400,428 |
Homebuilders/Real Estate - 2.8% |
CBRE Group, Inc. 6.625% 10/15/20 | | 2,575,000 | | 2,755,250 |
D.R. Horton, Inc.: | | | | |
3.625% 2/15/18 | | 3,605,000 | | 3,659,075 |
4.375% 9/15/22 | | 1,675,000 | | 1,561,938 |
4.75% 5/15/17 | | 880,000 | | 930,600 |
Howard Hughes Corp. 6.875% 10/1/21 (d) | | 2,870,000 | | 2,984,800 |
Lennar Corp. 4.125% 12/1/18 | | 3,605,000 | | 3,623,025 |
Standard Pacific Corp. 8.375% 5/15/18 | | 14,220,000 | | 16,708,500 |
Toll Brothers Finance Corp.: | | | | |
4% 12/31/18 | | 3,350,000 | | 3,408,625 |
4.375% 4/15/23 | | 5,520,000 | | 5,119,800 |
5.625% 1/15/24 | | 2,430,000 | | 2,448,225 |
| | 43,199,838 |
Hotels - 0.7% |
Hilton Worldwide Finance LLC/Hilton Worldwide Finance Corp. 5.625% 10/15/21 (d) | | 6,570,000 | | 6,816,375 |
Playa Resorts Holding BV 8% 8/15/20 (d) | | 3,515,000 | | 3,730,294 |
| | 10,546,669 |
|
| Principal Amount | | Value |
Insurance - 0.1% |
Hockey Merger Sub 2, Inc. 7.875% 10/1/21 (d) | | $ 2,055,000 | | $ 2,111,513 |
Leisure - 1.0% |
Cedar Fair LP/Magnum Management Corp. 5.25% 3/15/21 | | 2,230,000 | | 2,202,125 |
NCL Corp. Ltd. 5% 2/15/18 | | 5,690,000 | | 5,860,700 |
Royal Caribbean Cruises Ltd.: | | | | |
5.25% 11/15/22 | | 6,045,000 | | 6,045,000 |
7.5% 10/15/27 | | 595,000 | | 635,163 |
| | 14,742,988 |
Metals/Mining - 2.4% |
Beverage Packaging Holdings II SA (Luxembourg): | | | | |
5.625% 12/15/16 (d) | | 1,880,000 | | 1,917,600 |
6% 6/15/17 (d) | | 960,000 | | 972,000 |
Boart Longyear Management Pty Ltd.: | | | | |
7% 4/1/21 (d) | | 8,355,000 | | 6,245,363 |
10% 10/1/18 (d) | | 3,085,000 | | 3,185,263 |
CONSOL Energy, Inc.: | | | | |
8% 4/1/17 | | 2,000,000 | | 2,107,500 |
8.25% 4/1/20 | | 2,770,000 | | 2,998,525 |
FMG Resources (August 2006) Pty Ltd.: | | | | |
6.375% 2/1/16 (d) | | 3,145,000 | | 3,255,075 |
7% 11/1/15 (d) | | 5,401,000 | | 5,603,538 |
New Gold, Inc. 6.25% 11/15/22 (d) | | 7,295,000 | | 7,057,913 |
Walter Energy, Inc.: | | | | |
8.5% 4/15/21 | | 3,535,000 | | 2,942,888 |
9.5% 10/15/19 (d) | | 900,000 | | 949,500 |
| | 37,235,165 |
Paper - 0.4% |
Sappi Papier Holding GmbH 7.75% 7/15/17 (d) | | 4,920,000 | | 5,387,400 |
Publishing/Printing - 1.3% |
McGraw-Hill Global Education Holdings LLC/McGraw-Hill Global Education Finance 9.75% 4/1/21 (d) | | 8,095,000 | | 8,944,975 |
R.R. Donnelley & Sons Co.: | | | | |
6.5% 11/15/23 | | 2,220,000 | | 2,242,200 |
7% 2/15/22 | | 1,100,000 | | 1,182,500 |
7.25% 5/15/18 | | 2,320,000 | | 2,633,200 |
7.625% 6/15/20 | | 675,000 | | 734,063 |
8.25% 3/15/19 | | 2,966,000 | | 3,396,070 |
| | 19,133,008 |
Restaurants - 0.3% |
NPC International, Inc./NPC Operating Co. A, Inc./NPC Operating Co. B, Inc. 10.5% 1/15/20 | | 4,035,000 | | 4,660,425 |
Nonconvertible Bonds - continued |
| Principal Amount | | Value |
Services - 3.7% |
APX Group, Inc.: | | | | |
6.375% 12/1/19 | | $ 9,500,000 | | $ 9,642,500 |
8.75% 12/1/20 | | 8,335,000 | | 8,501,700 |
8.75% 12/1/20 (d) | | 480,000 | | 488,400 |
ARAMARK Corp. 5.75% 3/15/20 (d) | | 2,805,000 | | 2,931,225 |
Audatex North America, Inc.: | | | | |
6% 6/15/21 (d) | | 4,215,000 | | 4,415,213 |
6.125% 11/1/23 (d) | | 460,000 | | 473,800 |
Avis Budget Car Rental LLC/Avis Budget Finance, Inc. 2.9956% 12/1/17 (d)(g) | | 2,180,000 | | 2,190,900 |
Bankrate, Inc. 6.125% 8/15/18 (d) | | 2,580,000 | | 2,683,200 |
Brand Energy & Infrastructure Services, Inc. 8.5% 12/1/21 (d) | | 4,640,000 | | 4,715,400 |
FTI Consulting, Inc. 6.75% 10/1/20 | | 3,715,000 | | 4,012,200 |
Garda World Security Corp. 7.25% 11/15/21 (d) | | 2,200,000 | | 2,216,500 |
Hertz Corp. 4.25% 4/1/18 | | 3,145,000 | | 3,223,625 |
The Geo Group, Inc. 5.875% 1/15/22 (d) | | 7,310,000 | | 7,255,175 |
TransUnion Holding Co., Inc. 8.125% 6/15/18 pay-in-kind | | 4,340,000 | | 4,578,700 |
| | 57,328,538 |
Shipping - 1.1% |
Aguila 3 SA 7.875% 1/31/18 (d) | | 4,595,000 | | 4,870,700 |
Navios Maritime Acquisition Corp./Navios Acquisition Finance U.S., Inc. 8.125% 11/15/21 (d) | | 1,785,000 | | 1,820,700 |
Navios Maritime Holdings, Inc.: | | | | |
7.375% 1/15/22 (d) | | 7,410,000 | | 7,447,050 |
8.125% 2/15/19 | | 1,465,000 | | 1,505,288 |
Navios South American Logistics, Inc./Navios Logistics Finance U.S., Inc. 9.25% 4/15/19 | | 420,000 | | 453,075 |
| | 16,096,813 |
Steel - 1.5% |
JMC Steel Group, Inc. 8.25% 3/15/18 (d) | | 4,545,000 | | 4,590,450 |
Severstal Columbus LLC 10.25% 2/15/18 | | 10,610,000 | | 11,246,600 |
Steel Dynamics, Inc. 6.125% 8/15/19 | | 7,280,000 | | 7,880,600 |
| | 23,717,650 |
Super Retail - 0.9% |
Best Buy Co., Inc. 5% 8/1/18 | | 5,280,000 | | 5,537,664 |
Netflix, Inc. 5.375% 2/1/21 (d) | | 3,535,000 | | 3,579,188 |
|
| Principal Amount | | Value |
Sears Holdings Corp. 6.625% 10/15/18 | | $ 1,385,000 | | $ 1,253,425 |
The Bon-Ton Department Stores, Inc. 8% 6/15/21 | | 3,215,000 | | 3,239,113 |
| | 13,609,390 |
Technology - 8.2% |
Activision Blizzard, Inc. 5.625% 9/15/21 (d) | | 2,440,000 | | 2,525,400 |
ADT Corp. 6.25% 10/15/21 (d) | | 3,545,000 | | 3,722,250 |
BMC Software Finance, Inc. 8.125% 7/15/21 (d) | | 4,560,000 | | 4,696,800 |
Brocade Communications Systems, Inc. 4.625% 1/15/23 (d) | | 3,400,000 | | 3,145,000 |
Ceridian Corp. 11.25% 11/15/15 | | 4,475,000 | | 4,508,563 |
Compiler Finance Sub, Inc. 7% 5/1/21 (d) | | 515,000 | | 511,138 |
First Data Corp.: | | | | |
6.75% 11/1/20 (d) | | 3,280,000 | | 3,411,200 |
7.375% 6/15/19 (d) | | 3,400,000 | | 3,629,500 |
8.25% 1/15/21 (d) | | 6,555,000 | | 6,972,881 |
12.625% 1/15/21 | | 4,520,000 | | 5,305,350 |
Flextronics International Ltd. 4.625% 2/15/20 | | 3,020,000 | | 2,944,500 |
Lucent Technologies, Inc.: | | | | |
6.45% 3/15/29 | | 6,135,000 | | 5,429,475 |
6.5% 1/15/28 | | 3,265,000 | | 2,856,875 |
Nuance Communications, Inc. 5.375% 8/15/20 (d) | | 13,133,000 | | 12,837,508 |
NXP BV/NXP Funding LLC: | | | | |
3.75% 6/1/18 (d) | | 12,835,000 | | 12,931,263 |
5.75% 2/15/21 (d) | | 5,715,000 | | 5,972,175 |
Sanmina-SCI Corp. 7% 5/15/19 (d) | | 9,305,000 | | 9,898,194 |
Seagate HDD Cayman 3.75% 11/15/18 (d) | | 8,170,000 | | 8,261,913 |
SoftBank Corp. 4.5% 4/15/20 (d) | | 6,870,000 | | 6,698,250 |
Spansion LLC 7.875% 11/15/17 | | 5,850,000 | | 6,091,313 |
VeriSign, Inc. 4.625% 5/1/23 | | 3,295,000 | | 3,146,725 |
Viasystems, Inc. 7.875% 5/1/19 (d) | | 2,810,000 | | 3,038,313 |
WideOpenWest Finance LLC/WideOpenWest Capital Corp.: | | | | |
10.25% 7/15/19 | | 2,995,000 | | 3,324,450 |
13.375% 10/15/19 | | 2,705,000 | | 3,131,038 |
| | 124,990,074 |
Telecommunications - 6.8% |
Alcatel-Lucent U.S.A., Inc.: | | | | |
4.625% 7/1/17 (d) | | 1,100,000 | | 1,101,375 |
6.75% 11/15/20 (d) | | 3,640,000 | | 3,781,050 |
8.875% 1/1/20 (d) | | 6,325,000 | | 7,052,375 |
Altice Financing SA: | | | | |
6.5% 1/15/22 (d) | | 685,000 | | 691,850 |
7.875% 12/15/19 (d) | | 4,180,000 | | 4,545,750 |
Nonconvertible Bonds - continued |
| Principal Amount | | Value |
Telecommunications - continued |
Altice Finco SA: | | | | |
8.125% 1/15/24 (d) | | $ 415,000 | | $ 425,915 |
9.875% 12/15/20 (d) | | 2,465,000 | | 2,773,125 |
Digicel Group Ltd.: | | | | |
6% 4/15/21 (d) | | 5,265,000 | | 5,080,725 |
7% 2/15/20 (d) | | 295,000 | | 297,950 |
8.25% 9/1/17 (d) | | 5,395,000 | | 5,610,800 |
DigitalGlobe, Inc. 5.25% 2/1/21 (d) | | 9,505,000 | | 9,267,375 |
Intelsat Jackson Holdings SA 7.25% 4/1/19 | | 1,835,000 | | 1,981,800 |
Intelsat Luxembourg SA 7.75% 6/1/21 (d) | | 5,650,000 | | 6,059,625 |
Level 3 Financing, Inc. 3.842% 1/15/18 (d)(g) | | 3,065,000 | | 3,084,156 |
Neustar, Inc. 4.5% 1/15/23 | | 2,980,000 | | 2,689,450 |
Sprint Capital Corp.: | | | | |
6.875% 11/15/28 | | 1,155,000 | | 1,088,588 |
8.75% 3/15/32 | | 1,155,000 | | 1,238,738 |
Sprint Communications, Inc. 9% 11/15/18 (d) | | 6,240,000 | | 7,519,200 |
T-Mobile U.S.A., Inc.: | | | | |
5.25% 9/1/18 (d) | | 7,415,000 | | 7,754,607 |
6.464% 4/28/19 | | 6,010,000 | | 6,385,625 |
Telesat Canada/Telesat LLC 6% 5/15/17 (d) | | 4,310,000 | | 4,482,400 |
TW Telecom Holdings, Inc. 5.375% 10/1/22 | | 2,815,000 | | 2,765,738 |
Wind Acquisition Finance SA: | | | | |
7.25% 2/15/18 (d) | | 2,770,000 | | 2,915,425 |
11.75% 7/15/17 (d) | | 3,170,000 | | 3,372,088 |
Wind Acquisition Holdings Finance SA 12.25% 7/15/17 pay-in-kind (d)(g) | | 12,403,891 | | 12,354,448 |
| | 104,320,178 |
Textiles & Apparel - 0.2% |
The William Carter Co. 5.25% 8/15/21 (d) | | 3,490,000 | | 3,542,350 |
TOTAL NONCONVERTIBLE BONDS (Cost $1,326,059,757) |
1,365,084,178
|
Commercial Mortgage Securities - 0.0% |
|
LB Multi-family Mortgage Trust Series 1991-4 Class A1, 7.125% 4/25/21 (g)
(Cost $0) | | 13,676 | |
9,573
|
Common Stocks - 0.0% |
| Shares | | Value |
Telecommunications - 0.0% |
CUI Acquisition Corp. Class E (a)(d)
(Cost $1,273,881) | 1 | | $ 112,009 |
Bank Loan Obligations - 5.8% |
| Principal Amount | | |
Automotive - 0.1% |
Allison Transmission, Inc. Tranche B 3LN, term loan 3.75% 8/23/19 (g) | | $ 955,000 | | 957,388 |
Broadcasting - 0.1% |
ION Media Networks, Inc. Tranche B, term loan 12/18/20 (h) | | 1,330,000 | | 1,344,963 |
Cable TV - 0.2% |
Charter Communications Operating LLC Tranche F, term loan 3% 1/3/21 (g) | | 3,886,015 | | 3,847,155 |
Containers - 0.2% |
Ardagh Holdings U.S.A., Inc. Tranche B, term loan 12/17/19 (h) | | 165,000 | | 165,825 |
Berry Plastics Corp. Tranche E, term loan 12/18/20 (h) | | 1,565,000 | | 1,561,088 |
Reynolds Consumer Products Holdings, Inc. Tranche B, term loan 4% 12/1/18 (g) | | 910,000 | | 908,863 |
| | 2,635,776 |
Diversified Financial Services - 0.0% |
Moxie Patriot LLC Tranche B, term loan 12/19/20 (h) | | 400,000 | | 405,500 |
Energy - 1.1% |
Chesapeake Energy Corp. Tranche B, term loan 5.75% 12/2/17 (g) | | 4,710,000 | | 4,810,323 |
Energy Transfer Equity LP Tranche B, term loan 3.25% 12/2/19 (g) | | 3,645,000 | | 3,617,663 |
Fieldwood Energy, LLC: | | | | |
Tranche 2LN, term loan 8.375% 9/30/20 (g) | | 6,295,000 | | 6,389,425 |
Tranche B 1LN, term loan 3.875% 9/30/18 (g) | | 364,088 | | 366,363 |
Samson Investment Co. Tranche B 2LN, term loan 9/25/18 (h) | | 360,000 | | 360,000 |
Sheridan Investment Partners I term loan 12/16/20 (h) | | 524,775 | | 526,769 |
Sheridan Production Partners I: | | | | |
Tranche A, term loan 12/16/20 (h) | | 73,000 | | 73,277 |
Tranche M, term loan 12/16/20 (h) | | 27,225 | | 27,328 |
Western Refining, Inc. Tranche B, term loan 4.25% 11/12/20 (g) | | 250,000 | | 253,125 |
| | 16,424,273 |
Environmental - 0.0% |
Darling International, Inc. Tranche B, term loan 12/18/20 (h) | | 210,000 | | 211,050 |
Bank Loan Obligations - continued |
| Principal Amount | | Value |
Environmental - continued |
WTG Holdings III Corp.: | | | | |
Tranche 2LN, term loan 12/12/21 (h) | | $ 155,000 | | $ 154,225 |
Tranche B, term loan 12/12/20 (h) | | 165,000 | | 164,175 |
| | 529,450 |
Food/Beverage/Tobacco - 0.1% |
Del Monte Foods Consumer Products: | | | | |
Tranche 2LN, term loan 5/26/21 (h) | | 455,000 | | 459,550 |
Tranche B 1LN, term loan 11/26/20 (h) | | 915,000 | | 917,288 |
| | 1,376,838 |
Gaming - 0.2% |
Golden Nugget, Inc. Tranche B, term loan: | | | | |
11/21/19 (i) | | 145,500 | | 146,591 |
5.5% 11/21/19 (g) | | 339,500 | | 342,046 |
Las Vegas Sands LLC Tranche B, term loan 12/19/20 (h) | | 2,245,000 | | 2,241,969 |
| | 2,730,606 |
Healthcare - 0.2% |
Endo Luxembourg Finance I Comp term loan 12/12/20 (h) | | 3,735,000 | | 3,744,338 |
Hotels - 0.3% |
Hilton Worldwide Finance, LLC Tranche B, term loan 3.75% 10/25/20 (g) | | 4,576,368 | | 4,610,691 |
Insurance - 0.3% |
HUB International Ltd. Tranche B, term loan 4.75% 10/2/20 (g) | | 1,456,350 | | 1,476,375 |
StoneRiver Group LP: | | | | |
Tranche 2LN, term loan 8.5% 5/30/20 (g) | | 1,303,176 | | 1,309,692 |
Tranche B 1LN, term loan 4.5% 11/30/19 (g) | | 1,621,838 | | 1,621,838 |
| | 4,407,905 |
Leisure - 0.3% |
Equinox Holdings, Inc.: | | | | |
Tranche 2LN, term loan 9.75% 8/1/20 (g) | | 1,600,000 | | 1,620,000 |
Tranche B 1LN, term loan 4.5007% 2/1/20 (g) | | 2,962,613 | | 2,988,683 |
| | 4,608,683 |
Metals/Mining - 0.7% |
Alpha Natural Resources, Inc. Tranche B, term loan 3.5% 5/22/20 (g) | | 2,358,120 | | 2,316,853 |
|
| Principal Amount | | Value |
Fortescue Metals Group Ltd. Tranche B, term loan 4.25% 6/30/19 (g) | | $ 2,428,913 | | $ 2,459,274 |
Peabody Energy Corp. Tranche B, term loan 4.25% 9/24/20 (g) | | 5,441,363 | | 5,474,827 |
| | 10,250,954 |
Publishing/Printing - 0.3% |
ARC Document Solutions, Inc. Tranche B, term loan 12/20/18 (h) | | 4,880,000 | | 4,843,400 |
Services - 0.4% |
Brand Energy & Infrastructure Services, Inc. Tranche B, term loan 4.75% 11/26/20 (g) | | 4,520,000 | | 4,542,600 |
EFS Cogen Holdings I LLC Tranche B, term loan 12/17/20 (h) | | 195,000 | | 195,975 |
Filtration Group Corp.: | | | | |
Tranche 2LN, term loan 8.25% 11/21/21 (g) | | 60,000 | | 60,825 |
Tranche B 1LN, term loan 4.5% 11/21/20 (g) | | 75,000 | | 75,281 |
Garda World Security Corp.: | | | | |
term loan 4% 11/8/20 (g) | | 497,685 | | 498,307 |
Tranche DD, term loan 11/8/20 (i) | | 127,315 | | 127,474 |
Redtop Acquisitions Ltd.: | | | | |
Tranche 2LN, term loan 8.25% 6/3/21 (g) | | 185,000 | | 187,775 |
Tranche B 1LN, term loan 4.5% 12/3/20 (g) | | 105,000 | | 105,263 |
| | 5,793,500 |
Technology - 0.8% |
Dell International LLC Tranche B, term loan 4.5% 4/29/20 (g) | | 350,000 | | 350,875 |
First Data Corp. term loan 4.164% 3/24/18 (g) | | 6,685,000 | | 6,668,288 |
Infor U.S., Inc. Tranche B 5LN, term loan 6/3/20 (h) | | 860,000 | | 856,818 |
Kronos, Inc.: | | | | |
Tranche 2LN, term loan 9.75% 4/30/20 (g) | | 140,000 | | 146,300 |
Tranche B 1LN, term loan 4.5% 10/30/19 (g) | | 64,815 | | 65,463 |
NXP BV Tranche D, term loan 1/11/20 (h) | | 3,660,000 | | 3,660,000 |
| | 11,747,744 |
Telecommunications - 0.5% |
Alcatel-Lucent U.S.A., Inc. Tranche C 1LN, term loan 1/30/19 (h) | | 6,510,000 | | 6,542,550 |
Consolidated Communications, Inc. Tranche B, term loan 12/23/20 (h) | | 140,000 | | 140,000 |
Bank Loan Obligations - continued |
| Principal Amount | | Value |
Telecommunications - continued |
Crown Castle Operating Co. Tranche B, term loan 1/31/21 (h) | | $ 305,000 | | $ 305,000 |
Intelsat Jackson Holdings SA Tranche B 2LN, term loan 3.75% 6/30/19 (g) | | 1,260,000 | | 1,271,088 |
| | 8,258,638 |
TOTAL BANK LOAN OBLIGATIONS (Cost $87,245,499) |
88,517,802
|
Preferred Securities - 0.3% |
| | | |
Banks & Thrifts - 0.3% |
JPMorgan Chase & Co. 6% (e)(g)
(Cost $4,860,000) | 4,860,000 | |
4,770,231
|
Money Market Funds - 5.1% |
| Shares | | |
Fidelity Cash Central Fund, 0.11% (b)
(Cost $76,868,755) | 76,868,755 | |
76,868,755
|
TOTAL INVESTMENT PORTFOLIO - 100.5% (Cost $1,496,307,892) | | 1,535,362,548 |
NET OTHER ASSETS (LIABILITIES) - (0.5)% | | (6,982,662) |
NET ASSETS - 100% | $ 1,528,379,886 |
Legend |
(a) Non-income producing |
(b) Affiliated fund that is generally available only to investment companies and other accounts managed by Fidelity Investments. The rate quoted is the annualized seven-day yield of the fund at period end. A complete unaudited listing of the fund's holdings as of its most recent quarter end is available upon request. In addition, each Fidelity Central Fund's financial statements, which are not covered by the Fund's Report of Independent Registered Public Accounting Firm, are available on the SEC's website or upon request. |
(c) Security initially issued at one coupon which converts to a higher coupon at a specified date. The rate shown is the rate at period end. |
(d) Security exempt from registration under Rule 144A of the Securities Act of 1933. These securities may be resold in transactions exempt from registration, normally to qualified institutional buyers. At the end of the period, the value of these securities amounted to $605,037,802 or 39.6% of net assets. |
(e) Security is perpetual in nature with no stated maturity date. |
(f) Security or a portion of the security purchased on a delayed delivery or when-issued basis. |
(g) Coupon rates for floating and adjustable rate securities reflect the rates in effect at period end. |
(h) The coupon rate will be determined upon settlement of the loan after period end. |
(i) Position represents an unfunded loan commitment. At period end, the total principal amount and market value of unfunded commitments totaled $272,815 and $274,065, respectively. The coupon rate will be determined at time of settlement. |
Affiliated Central Funds |
Information regarding fiscal year to date income earned by the Fund from investments in Fidelity Central Funds is as follows: |
Fund | Income earned |
Fidelity Cash Central Fund | $ 95,258 |
Other Information |
The following is a summary of the inputs used, as of December 31, 2013, involving the Fund's assets and liabilities carried at fair value. The inputs or methodology used for valuing securities may not be an indication of the risk associated with investing in those securities. For more information on valuation inputs, and their aggregation into the levels used in the table below, please refer to the Investment Valuation section in the accompanying Notes to Financial Statements. |
Valuation Inputs at Reporting Date: |
Description | Total | Level 1 | Level 2 | Level 3 |
Investments in Securities: | | | | |
Equities: | | | | |
Telecommunication Services | $ 112,009 | $ - | $ - | $ 112,009 |
Corporate Bonds | 1,365,084,178 | - | 1,365,084,178 | - |
Commercial Mortgage Securities | 9,573 | - | - | 9,573 |
Bank Loan Obligations | 88,517,802 | - | 86,897,802 | 1,620,000 |
Preferred Securities | 4,770,231 | - | 4,770,231 | - |
Money Market Funds | 76,868,755 | 76,868,755 | - | - |
Total Investments in Securities: | $ 1,535,362,548 | $ 76,868,755 | $ 1,456,752,211 | $ 1,741,582 |
Distribution of investments by country or territory of incorporation, as a percentage of total net assets, is as follows (Unaudited): |
United States of America | 79.2% |
Luxembourg | 4.3% |
Canada | 3.2% |
Netherlands | 2.1% |
Bermuda | 1.9% |
Cayman Islands | 1.8% |
Australia | 1.6% |
United Kingdom | 1.4% |
Austria | 1.1% |
Others (Individually Less Than 1%) | 3.4% |
| 100.0% |
See accompanying notes which are an integral part of the financial statements.
Annual Report
Statement of Assets and Liabilities
| December 31, 2013 |
| | |
Assets | | |
Investment in securities, at value - See accompanying schedule: Unaffiliated issuers (cost $1,419,439,137) | $ 1,458,493,793 | |
Fidelity Central Funds (cost $76,868,755) | 76,868,755 | |
Total Investments (cost $1,496,307,892) | | $ 1,535,362,548 |
Cash | | 4,015,234 |
Receivable for investments sold | | 1,705,556 |
Receivable for fund shares sold | | 2,131,786 |
Interest receivable | | 23,220,622 |
Distributions receivable from Fidelity Central Funds | | 4,605 |
Prepaid expenses | | 3,227 |
Other receivables | | 11,207 |
Total assets | | 1,566,454,785 |
| | |
Liabilities | | |
Payable for investments purchased | | |
Regular delivery | $ 34,396,427 | |
Delayed delivery | 990,000 | |
Payable for fund shares redeemed | 1,694,753 | |
Accrued management fee | 704,961 | |
Distribution and service plan fees payable | 69,658 | |
Other affiliated payables | 139,510 | |
Other payables and accrued expenses | 79,590 | |
Total liabilities | | 38,074,899 |
| | |
Net Assets | | $ 1,528,379,886 |
Net Assets consist of: | | |
Paid in capital | | $ 1,547,379,547 |
Undistributed net investment income | | 1,216,415 |
Accumulated undistributed net realized gain (loss) on investments | | (59,270,732) |
Net unrealized appreciation (depreciation) on investments | | 39,054,656 |
Net Assets | | $ 1,528,379,886 |
Statement of Assets and Liabilities - continued
| December 31, 2013 |
| | |
Initial Class:
Net Asset Value, offering price and redemption price per share ($587,375,744 ÷ 101,188,593 shares) | | $ 5.80 |
| | |
Service Class:
Net Asset Value, offering price and redemption price per share ($68,982,149 ÷ 11,953,181 shares) | | $ 5.77 |
| | |
Service Class 2:
Net Asset Value, offering price and redemption price per share ($280,443,630 ÷ 49,707,292 shares) | | $ 5.64 |
| | |
Initial Class R:
Net Asset Value, offering price and redemption price per share ($29,558,387 ÷ 5,112,817 shares) | | $ 5.78 |
| | |
Service Class R:
Net Asset Value, offering price and redemption price per share ($58,041,804 ÷ 10,116,582 shares) | | $ 5.74 |
| | |
Service Class 2R:
Net Asset Value, offering price and redemption price per share ($4,347,801 ÷ 771,011 shares) | | $ 5.64 |
| | |
Investor Class:
Net Asset Value, offering price and redemption price per share ($499,630,371 ÷ 86,398,598 shares) | | $ 5.78 |
See accompanying notes which are an integral part of the financial statements.
Annual Report
Statement of Operations
| Year ended December 31, 2013 |
| | |
Investment Income | | |
Dividends | | $ 243,338 |
Interest | | 91,407,694 |
Income from Fidelity Central Funds | | 95,258 |
Total income | | 91,746,290 |
| | |
Expenses | | |
Management fee | $ 8,290,267 | |
Transfer agent fees | 1,218,349 | |
Distribution and service plan fees | 805,750 | |
Accounting fees and expenses | 500,134 | |
Custodian fees and expenses | 26,253 | |
Independent trustees' compensation | 8,102 | |
Audit | 81,461 | |
Legal | 15,196 | |
Interest | 1,289 | |
Miscellaneous | 13,741 | |
Total expenses before reductions | 10,960,542 | |
Expense reductions | (59,997) | 10,900,545 |
Net investment income (loss) | | 80,845,745 |
Realized and Unrealized Gain (Loss) Net realized gain (loss) on: | | |
Investment securities: | | |
Unaffiliated issuers | | 46,584,559 |
Change in net unrealized appreciation (depreciation) on investment securities | | (41,731,572) |
Net gain (loss) | | 4,852,987 |
Net increase (decrease) in net assets resulting from operations | | $ 85,698,732 |
Statement of Changes in Net Assets
| Year ended
December 31,
2013 | Year ended
December 31,
2012 |
Increase (Decrease) in Net Assets | | |
Operations | | |
Net investment income (loss) | $ 80,845,745 | $ 85,504,440 |
Net realized gain (loss) | 46,584,559 | 13,064,180 |
Change in net unrealized appreciation (depreciation) | (41,731,572) | 80,611,074 |
Net increase (decrease) in net assets resulting from operations | 85,698,732 | 179,179,694 |
Distributions to shareholders from net investment income | (86,921,876) | (84,934,228) |
Share transactions - net increase (decrease) | 16,318,361 | 164,623,275 |
Redemption fees | 28,583 | 64,369 |
Total increase (decrease) in net assets | 15,123,800 | 258,933,110 |
| | |
Net Assets | | |
Beginning of period | 1,513,256,086 | 1,254,322,976 |
End of period (including undistributed net investment income of $1,216,415 and undistributed net investment income of $6,819,718, respectively) | $ 1,528,379,886 | $ 1,513,256,086 |
See accompanying notes which are an integral part of the financial statements.
Annual Report
Financial Highlights - Initial Class
Years ended December 31, | 2013 | 2012 | 2011 | 2010 | 2009 |
Selected Per-Share Data | | | | | |
Net asset value, beginning of period | $ 5.81 | $ 5.39 | $ 5.57 | $ 5.29 | $ 3.96 |
Income from Investment Operations | | | | | |
Net investment income (loss) C | .330 | .361 | .391 | .439 | .438 |
Net realized and unrealized gain (loss) | .014 | .405 | (.171) | .288 | 1.298 |
Total from investment operations | .344 | .766 | .220 | .727 | 1.736 |
Distributions from net investment income | (.354) | (.346) | (.400) | (.448) | (.406) |
Redemption fees added to paid in capital C | - G | - G | - G | .001 | - G |
Net asset value, end of period | $ 5.80 | $ 5.81 | $ 5.39 | $ 5.57 | $ 5.29 |
Total Return A,B | 5.95% | 14.23% | 4.03% | 13.82% | 43.96% |
Ratios to Average Net Assets D,F | | | | | |
Expenses before reductions | .68% | .68% | .69% | .69% | .70% |
Expenses net of fee waivers, if any | .68% | .68% | .69% | .69% | .70% |
Expenses net of all reductions | .68% | .68% | .69% | .69% | .70% |
Net investment income (loss) | 5.55% | 6.22% | 6.85% | 7.84% | 9.02% |
Supplemental Data | | | | | |
Net assets, end of period (000 omitted) | $ 587,376 | $ 606,506 | $ 561,514 | $ 594,688 | $ 608,802 |
Portfolio turnover rate E | 85% | 55% | 79% | 81% | 70% |
A Total returns do not reflect charges attributable to your insurance company's separate account. Inclusion of these charges would reduce the total returns shown.
B Total returns would have been lower if certain expenses had not been reduced during the applicable periods shown.
C Calculated based on average shares outstanding during the period.
D Fees and expenses of any underlying Fidelity Central Funds are not included in the Fund's expense ratio. The Fund indirectly bears its proportionate share of the expenses of any underlying Fidelity Central Funds.
E Amount does not include the portfolio activity of any underlying Fidelity Central Funds.
F Expense ratios reflect operating expenses of the class. Expenses before reductions do not reflect amounts reimbursed by the investment adviser or reductions from brokerage service arrangements or reductions from other expense offset arrangements and do not represent the amount paid by the class during periods when reimbursements or reductions occur. Expenses net of fee waivers reflect expenses after reimbursement by the investment adviser but prior to reductions from brokerage service arrangements or other expense offset arrangements. Expenses net of all reductions represent the net expenses paid by the class.
G Amount represents less than $.001 per share.
Financial Highlights - Service Class
Years ended December 31, | 2013 | 2012 | 2011 | 2010 | 2009 |
Selected Per-Share Data | | | | | |
Net asset value, beginning of period | $ 5.78 | $ 5.36 | $ 5.54 | $ 5.26 | $ 3.95 |
Income from Investment Operations | | | | | |
Net investment income (loss) C | .323 | .353 | .384 | .431 | .429 |
Net realized and unrealized gain (loss) | .015 | .407 | (.171) | .290 | 1.281 |
Total from investment operations | .338 | .760 | .213 | .721 | 1.710 |
Distributions from net investment income | (.348) | (.340) | (.393) | (.442) | (.400) |
Redemption fees added to paid in capital C | - G | - G | - G | .001 | - G |
Net asset value, end of period | $ 5.77 | $ 5.78 | $ 5.36 | $ 5.54 | $ 5.26 |
Total Return A,B | 5.87% | 14.20% | 3.93% | 13.79% | 43.41% |
Ratios to Average Net Assets D,F | | | | | |
Expenses before reductions | .78% | .78% | .79% | .79% | .80% |
Expenses net of fee waivers, if any | .77% | .78% | .79% | .78% | .80% |
Expenses net of all reductions | .77% | .78% | .79% | .78% | .80% |
Net investment income (loss) | 5.46% | 6.13% | 6.75% | 7.74% | 8.92% |
Supplemental Data | | | | | |
Net assets, end of period (000 omitted) | $ 68,982 | $ 77,397 | $ 91,573 | $ 98,988 | $ 103,511 |
Portfolio turnover rate E | 85% | 55% | 79% | 81% | 70% |
A Total returns do not reflect charges attributable to your insurance company's separate account. Inclusion of these charges would reduce the total returns shown.
B Total returns would have been lower if certain expenses had not been reduced during the applicable periods shown.
C Calculated based on average shares outstanding during the period.
D Fees and expenses of any underlying Fidelity Central Funds are not included in the Fund's expense ratio. The Fund indirectly bears its proportionate share of the expenses of any underlying Fidelity Central Funds.
E Amount does not include the portfolio activity of any underlying Fidelity Central Funds.
F Expense ratios reflect operating expenses of the class. Expenses before reductions do not reflect amounts reimbursed by the investment adviser or reductions from brokerage service arrangements or reductions from other expense offset arrangements and do not represent the amount paid by the class during periods when reimbursements or reductions occur. Expenses net of fee waivers reflect expenses after reimbursement by the investment adviser but prior to reductions from brokerage service arrangements or other expense offset arrangements. Expenses net of all reductions represent the net expenses paid by the class.
G Amount represents less than $.001 per share.
See accompanying notes which are an integral part of the financial statements.
Annual Report
Financial Highlights - Service Class 2
Years ended December 31, | 2013 | 2012 | 2011 | 2010 | 2009 |
Selected Per-Share Data | | | | | |
Net asset value, beginning of period | $ 5.66 | $ 5.26 | $ 5.45 | $ 5.18 | $ 3.89 |
Income from Investment Operations | | | | | |
Net investment income (loss) C | .307 | .338 | .368 | .417 | .422 |
Net realized and unrealized gain (loss) | .014 | .396 | (.170) | .287 | 1.264 |
Total from investment operations | .321 | .734 | .198 | .704 | 1.686 |
Distributions from net investment income | (.341) | (.334) | (.388) | (.435) | (.396) |
Redemption fees added to paid in capital C | - G | - G | - G | .001 | - G |
Net asset value, end of period | $ 5.64 | $ 5.66 | $ 5.26 | $ 5.45 | $ 5.18 |
Total Return A,B | 5.70% | 13.97% | 3.72% | 13.67% | 43.46% |
Ratios to Average Net Assets D,F | | | | | |
Expenses before reductions | .93% | .93% | .94% | .94% | .95% |
Expenses net of fee waivers, if any | .92% | .93% | .94% | .94% | .95% |
Expenses net of all reductions | .92% | .93% | .94% | .94% | .95% |
Net investment income (loss) | 5.31% | 5.98% | 6.60% | 7.59% | 8.77% |
Supplemental Data | | | | | |
Net assets, end of period (000 omitted) | $ 280,444 | $ 281,065 | $ 220,333 | $ 182,465 | $ 181,377 |
Portfolio turnover rate E | 85% | 55% | 79% | 81% | 70% |
A Total returns do not reflect charges attributable to your insurance company's separate account. Inclusion of these charges would reduce the total returns shown.
B Total returns would have been lower if certain expenses had not been reduced during the applicable periods shown.
C Calculated based on average shares outstanding during the period.
D Fees and expenses of any underlying Fidelity Central Funds are not included in the Fund's expense ratio. The Fund indirectly bears its proportionate share of the expenses of any underlying Fidelity Central Funds.
E Amount does not include the portfolio activity of any underlying Fidelity Central Funds.
F Expense ratios reflect operating expenses of the class. Expenses before reductions do not reflect amounts reimbursed by the investment adviser or reductions from brokerage service arrangements or reductions from other expense offset arrangements and do not represent the amount paid by the class during periods when reimbursements or reductions occur. Expenses net of fee waivers reflect expenses after reimbursement by the investment adviser but prior to reductions from brokerage service arrangements or other expense offset arrangements. Expenses net of all reductions represent the net expenses paid by the class.
G Amount represents less than $.001 per share.
Financial Highlights - Initial Class R
Years ended December 31, | 2013 | 2012 | 2011 | 2010 | 2009 |
Selected Per-Share Data | | | | | |
Net asset value, beginning of period | $ 5.79 | $ 5.37 | $ 5.55 | $ 5.27 | $ 3.95 |
Income from Investment Operations | | | | | |
Net investment income (loss) C | .330 | .360 | .391 | .439 | .440 |
Net realized and unrealized gain (loss) | .014 | .407 | (.171) | .288 | 1.286 |
Total from investment operations | .344 | .767 | .220 | .727 | 1.726 |
Distributions from net investment income | (.354) | (.347) | (.400) | (.448) | (.406) |
Redemption fees added to paid in capital C | - G | - G | - G | .001 | - G |
Net asset value, end of period | $ 5.78 | $ 5.79 | $ 5.37 | $ 5.55 | $ 5.27 |
Total Return A,B | 5.97% | 14.30% | 4.05% | 13.88% | 43.82% |
Ratios to Average Net Assets D,F | | | | | |
Expenses before reductions | .68% | .68% | .68% | .69% | .70% |
Expenses net of fee waivers, if any | .67% | .68% | .68% | .68% | .70% |
Expenses net of all reductions | .67% | .68% | .68% | .68% | .69% |
Net investment income (loss) | 5.56% | 6.23% | 6.85% | 7.84% | 9.02% |
Supplemental Data | | | | | |
Net assets, end of period (000 omitted) | $ 29,558 | $ 35,605 | $ 31,627 | $ 34,946 | $ 34,080 |
Portfolio turnover rate E | 85% | 55% | 79% | 81% | 70% |
A Total returns do not reflect charges attributable to your insurance company's separate account. Inclusion of these charges would reduce the total returns shown.
B Total returns would have been lower if certain expenses had not been reduced during the applicable periods shown.
C Calculated based on average shares outstanding during the period.
D Fees and expenses of any underlying Fidelity Central Funds are not included in the Fund's expense ratio. The Fund indirectly bears its proportionate share of the expenses of any underlying Fidelity Central Funds.
E Amount does not include the portfolio activity of any underlying Fidelity Central Funds.
F Expense ratios reflect operating expenses of the class. Expenses before reductions do not reflect amounts reimbursed by the investment adviser or reductions from brokerage service arrangements or reductions from other expense offset arrangements and do not represent the amount paid by the class during periods when reimbursements or reductions occur. Expenses net of fee waivers reflect expenses after reimbursement by the investment adviser but prior to reductions from brokerage service arrangements or other expense offset arrangements. Expenses net of all reductions represent the net expenses paid by the class.
G Amount represents less than $.001 per share.
See accompanying notes which are an integral part of the financial statements.
Annual Report
Financial Highlights - Service Class R
Years ended December 31, | 2013 | 2012 | 2011 | 2010 | 2009 |
Selected Per-Share Data | | | | | |
Net asset value, beginning of period | $ 5.75 | $ 5.34 | $ 5.52 | $ 5.25 | $ 3.94 |
Income from Investment Operations | | | | | |
Net investment income (loss) C | .321 | .352 | .383 | .433 | .431 |
Net realized and unrealized gain (loss) | .018 | .400 | (.167) | .280 | 1.280 |
Total from investment operations | .339 | .752 | .216 | .713 | 1.711 |
Distributions from net investment income | (.349) | (.342) | (.396) | (.444) | (.401) |
Redemption fees added to paid in capital C | - G | - G | - G | .001 | - G |
Net asset value, end of period | $ 5.74 | $ 5.75 | $ 5.34 | $ 5.52 | $ 5.25 |
Total Return A,B | 5.92% | 14.10% | 3.99% | 13.66% | 43.56% |
Ratios to Average Net Assets D,F | | | | | |
Expenses before reductions | .78% | .78% | .78% | .79% | .80% |
Expenses net of fee waivers, if any | .77% | .78% | .78% | .78% | .80% |
Expenses net of all reductions | .77% | .78% | .78% | .78% | .80% |
Net investment income (loss) | 5.46% | 6.13% | 6.75% | 7.74% | 8.92% |
Supplemental Data | | | | | |
Net assets, end of period (000 omitted) | $ 58,042 | $ 69,893 | $ 63,557 | $ 68,806 | $ 47,873 |
Portfolio turnover rate E | 85% | 55% | 79% | 81% | 70% |
A Total returns do not reflect charges attributable to your insurance company's separate account. Inclusion of these charges would reduce the total returns shown.
B Total returns would have been lower if certain expenses had not been reduced during the applicable periods shown.
C Calculated based on average shares outstanding during the period.
D Fees and expenses of any underlying Fidelity Central Funds are not included in the Fund's expense ratio. The Fund indirectly bears its proportionate share of the expenses of any underlying Fidelity Central Funds.
E Amount does not include the portfolio activity of any underlying Fidelity Central Funds.
F Expense ratios reflect operating expenses of the class. Expenses before reductions do not reflect amounts reimbursed by the investment adviser or reductions from brokerage service arrangements or reductions from other expense offset arrangements and do not represent the amount paid by the class during periods when reimbursements or reductions occur. Expenses net of fee waivers reflect expenses after reimbursement by the investment adviser but prior to reductions from brokerage service arrangements or other expense offset arrangements. Expenses net of all reductions represent the net expenses paid by the class.
G Amount represents less than $.001 per share.
Financial Highlights - Service Class 2R
Years ended December 31, | 2013 | 2012 | 2011 | 2010 | 2009 |
Selected Per-Share Data | | | | | |
Net asset value, beginning of period | $ 5.65 | $ 5.26 | $ 5.45 | $ 5.17 | $ 3.89 |
Income from Investment Operations | | | | | |
Net investment income (loss) C | .307 | .340 | .369 | .415 | .416 |
Net realized and unrealized gain (loss) | .023 | .390 | (.175) | .293 | 1.257 |
Total from investment operations | .330 | .730 | .194 | .708 | 1.673 |
Distributions from net investment income | (.340) | (.340) | (.384) | (.429) | (.393) |
Redemption fees added to paid in capital C | - G | - G | - G | .001 | - G |
Net asset value, end of period | $ 5.64 | $ 5.65 | $ 5.26 | $ 5.45 | $ 5.17 |
Total Return A,B | 5.87% | 13.90% | 3.64% | 13.79% | 43.13% |
Ratios to Average Net Assets D,F | | | | | |
Expenses before reductions | .93% | .93% | .93% | .94% | .95% |
Expenses net of fee waivers, if any | .92% | .93% | .93% | .93% | .95% |
Expenses net of all reductions | .92% | .93% | .93% | .93% | .94% |
Net investment income (loss) | 5.31% | 5.98% | 6.60% | 7.59% | 8.77% |
Supplemental Data | | | | | |
Net assets, end of period (000 omitted) | $ 4,348 | $ 4,019 | $ 1,350 | $ 1,543 | $ 2,016 |
Portfolio turnover rate E | 85% | 55% | 79% | 81% | 70% |
A Total returns do not reflect charges attributable to your insurance company's separate account. Inclusion of these charges would reduce the total returns shown.
B Total returns would have been lower if certain expenses had not been reduced during the applicable periods shown.
C Calculated based on average shares outstanding during the period.
D Fees and expenses of any underlying Fidelity Central Funds are not included in the Fund's expense ratio. The Fund indirectly bears its proportionate share of the expenses of any underlying Fidelity Central Funds.
E Amount does not include the portfolio activity of any underlying Fidelity Central Funds.
F Expense ratios reflect operating expenses of the class. Expenses before reductions do not reflect amounts reimbursed by the investment adviser or reductions from brokerage service arrangements or reductions from other expense offset arrangements and do not represent the amount paid by the class during periods when reimbursements or reductions occur. Expenses net of fee waivers reflect expenses after reimbursement by the investment adviser but prior to reductions from brokerage service arrangements or other expense offset arrangements. Expenses net of all reductions represent the net expenses paid by the class.
G Amount represents less than $.001 per share.
See accompanying notes which are an integral part of the financial statements.
Annual Report
Financial Highlights - Investor Class
Years ended December 31, | 2013 | 2012 | 2011 | 2010 | 2009 |
Selected Per-Share Data | | | | | |
Net asset value, beginning of period | $ 5.79 | $ 5.37 | $ 5.56 | $ 5.27 | $ 3.96 |
Income from Investment Operations | | | | | |
Net investment income (loss) C | .327 | .358 | .388 | .437 | .441 |
Net realized and unrealized gain (loss) | .016 | .407 | (.180) | .298 | 1.274 |
Total from investment operations | .343 | .765 | .208 | .735 | 1.715 |
Distributions from net investment income | (.353) | (.345) | (.398) | (.446) | (.405) |
Redemption fees added to paid in capital C | - G | - G | - G | .001 | - G |
Net asset value, end of period | $ 5.78 | $ 5.79 | $ 5.37 | $ 5.56 | $ 5.27 |
Total Return A,B | 5.95% | 14.26% | 3.82% | 14.04% | 43.43% |
Ratios to Average Net Assets D,F | | | | | |
Expenses before reductions | .71% | .71% | .72% | .73% | .73% |
Expenses net of fee waivers, if any | .71% | .71% | .72% | .72% | .73% |
Expenses net of all reductions | .71% | .71% | .72% | .72% | .73% |
Net investment income (loss) | 5.52% | 6.20% | 6.82% | 7.81% | 8.99% |
Supplemental Data | | | | | |
Net assets, end of period (000 omitted) | $ 499,630 | $ 438,772 | $ 284,370 | $ 244,738 | $ 182,806 |
Portfolio turnover rate E | 85% | 55% | 79% | 81% | 70% |
A Total returns do not reflect charges attributable to your insurance company's separate account. Inclusion of these charges would reduce the total returns shown.
B Total returns would have been lower if certain expenses had not been reduced during the applicable periods shown.
C Calculated based on average shares outstanding during the period.
D Fees and expenses of any underlying Fidelity Central Funds are not included in the Fund's expense ratio. The Fund indirectly bears its proportionate share of the expenses of any underlying Fidelity Central Funds.
E Amount does not include the portfolio activity of any underlying Fidelity Central Funds.
F Expense ratios reflect operating expenses of the class. Expenses before reductions do not reflect amounts reimbursed by the investment adviser or reductions from brokerage service arrangements or reductions from other expense offset arrangements and do not represent the amount paid by the class during periods when reimbursements or reductions occur. Expenses net of fee waivers reflect expenses after reimbursement by the investment adviser but prior to reductions from brokerage service arrangements or other expense offset arrangements. Expenses net of all reductions represent the net expenses paid by the class.
G Amount represents less than $.001 per share.
See accompanying notes which are an integral part of the financial statements.
Annual Report
Notes to Financial Statements
For the period ended December 31, 2013
1. Organization.
VIP High Income Portfolio (the Fund) is a fund of Variable Insurance Products Fund (the Trust) and is authorized to issue an unlimited number of shares. The Trust is registered under the Investment Company Act of 1940, as amended (the 1940 Act), as an open-end management investment company organized as a Massachusetts business trust. Shares of the Fund may only be purchased by insurance companies for the purpose of funding variable annuity or variable life insurance contracts. The Fund offers the following classes of shares: Initial Class shares, Service Class shares, Service Class 2 shares, Initial Class R shares, Service Class R shares, Service Class 2R shares and Investor Class shares. All classes have equal rights and voting privileges, except for matters affecting a single class.
2. Investments in Fidelity Central Funds.
The Fund invests in Fidelity Central Funds, which are open-end investment companies generally available only to other investment companies and accounts managed by the investment adviser and its affiliates. The Fund's Schedule of Investments lists each of the Fidelity Central Funds held as of period end, if any, as an investment of the Fund, but does not include the underlying holdings of each Fidelity Central Fund. As an Investing Fund, the Fund indirectly bears its proportionate share of the expenses of the underlying Fidelity Central Funds.
The Money Market Central Funds seek preservation of capital and current income and are managed by Fidelity Investments Money Management, Inc. (FIMM), an affiliate of the investment adviser. Annualized expenses of the Money Market Central Funds as of their most recent shareholder report date are less than .01%.
A complete unaudited list of holdings for each Fidelity Central Fund is available upon request or at the Securities and Exchange Commission (the SEC) website at www.sec.gov. In addition, the financial statements of the Fidelity Central Funds, which are not covered by the Fund's Report of Independent Registered Public Accounting Firm, are available on the SEC website or upon request.
3. Significant Accounting Policies.
The financial statements have been prepared in conformity with accounting principles generally accepted in the United States of America (GAAP), which require management to make certain estimates and assumptions at the date of the financial statements. Actual results could differ from those estimates. Subsequent events, if any, through the date that the financial statements were issued have been evaluated in the preparation of the financial statements. The following summarizes the significant accounting policies of the Fund:
Investment Valuation. Investments are valued as of 4:00 p.m. Eastern time on the last calendar day of the period. In accordance with valuation policies and procedures approved by the Board of Trustees (the Board), the Fund attempts to obtain prices from one or more third party pricing vendors or brokers to value its investments. When current market prices, quotations or currency exchange rates are not readily available or reliable, investments will be fair valued in good faith by the Fidelity Management & Research Company (FMR) Fair Value Committee (the Committee), in accordance with procedures adopted by the Board. Factors used in determining fair value vary by investment type and may include market or investment specific events, changes in interest rates and credit quality. The frequency with which these procedures are used cannot be predicted and they may be utilized to a significant extent. The Committee oversees the Fund's valuation policies and procedures and is responsible for approving and reporting to the Board all fair value determinations.
The Fund categorizes the inputs to valuation techniques used to value its investments into a disclosure hierarchy consisting of three levels as shown below:
Level 1 - quoted prices in active markets for identical investments
Level 2 - other significant observable inputs (including quoted prices for similar investments, interest rates, prepayment speeds, etc.)
Level 3 - unobservable inputs (including the Fund's own assumptions based on the best information available)
Valuation techniques used to value the Fund's investments by major category are as follows:
Debt securities, including restricted securities, are valued based on evaluated prices received from third party pricing vendors or from brokers who make markets in such securities. Corporate bonds, bank loan obligations and preferred securities, are valued by pricing vendors who utilize matrix pricing which considers yield or price of bonds of comparable quality, coupon, maturity and type or by broker-supplied prices. Commercial mortgage securities are valued by pricing vendors who utilize matrix pricing which considers prepayment speed assumptions, attributes of the collateral, yield or price of bonds of comparable quality, coupon, maturity and type or by broker-supplied prices. When independent prices are unavailable or unreliable, debt securities may be valued utilizing pricing methodologies which consider similar factors that would be used by third party pricing vendors. Debt securities are generally categorized as Level 2 in the hierarchy but may be Level 3 depending on the circumstances. The Fund invests a significant portion of its assets in below investment grade securities. The value of these securities can be more volatile due to changes in the credit quality of the issuer and is sensitive to changes in economic, market and regulatory conditions.
Annual Report
3. Significant Accounting Policies - continued
Investment Valuation - continued
Equity securities, including restricted securities, for which market quotations are readily available, are valued at the last reported sale price or official closing price as reported by a third party pricing vendor on the primary market or exchange on which they are traded and are categorized as Level 1 in the hierarchy. In the event there were no sales during the day or closing prices are not available, securities are valued at the last quoted bid price or may be valued using the last available price and are generally categorized as Level 2 in the hierarchy. For equity securities, including restricted securities, where observable inputs are limited, assumptions about market activity and risk are used and these securities may be categorized as Level 3 in the hierarchy.
Investments in open-end mutual funds, including the Fidelity Central Funds, are valued at their closing net asset value (NAV) each business day and are categorized as Level 1 in the hierarchy.
Changes in valuation techniques may result in transfers in or out of an assigned level within the disclosure hierarchy. The aggregate value of investments by input level, as of December 31, 2013, is included at the end of the Fund's Schedule of Investments.
Investment Transactions and Income. For financial reporting purposes, the Fund's investment holdings and NAV include trades executed through the end of the last business day of the period. The NAV per share for processing shareholder transactions is calculated as of the close of business of the New York Stock Exchange (NYSE), normally 4:00 p.m. Eastern time and includes trades executed through the end of the prior business day. Gains and losses on securities sold are determined on the basis of identified cost and may include proceeds received from litigation. Dividend income is recorded on the ex-dividend date, except for certain dividends from foreign securities where the ex-dividend date may have passed, which are recorded as soon as the Fund is informed of the ex-dividend date. Non-cash dividends included in dividend income, if any, are recorded at the fair market value of the securities received. Interest income and distributions from the Fidelity Central Funds are accrued as earned. Interest income includes coupon interest and amortization of premium and accretion of discount on debt securities.
Class Allocations and Expenses. Investment income, realized and unrealized capital gains and losses, common expenses of the Fund, and certain fund-level expense reductions, if any, are allocated daily on a pro-rata basis to each class based on the relative net assets of each class to the total net assets of the Fund. Each class differs with respect to transfer agent and distribution and service plan fees incurred. Certain expense reductions may also differ by class. For the reporting period, the allocated portion of income and expenses to each class as a percent of its average net assets may vary due to the timing of recording these transactions in relation to fluctuating net assets of the classes. Expenses directly attributable to a fund are charged to that fund. Expenses attributable to more than one fund are allocated among the respective funds on the basis of relative net assets or other appropriate methods. Expense estimates are accrued in the period to which they relate and adjustments are made when actual amounts are known.
Income Tax Information and Distributions to Shareholders. Each year, the Fund intends to qualify as a regulated investment company under Subchapter M of the Internal Revenue Code, including distributing substantially all of its taxable income and realized gains. As a result, no provision for U.S. Federal income taxes is required. As of December 31, 2013, the Fund did not have any unrecognized tax benefits in the financial statements; nor is the Fund aware of any tax positions for which it is reasonably possible that the total amounts of unrecognized tax benefits will significantly change in the next twelve months. The Fund files a U.S. federal tax return, in addition to state and local tax returns as required. The Fund's federal income tax returns are subject to examination by the Internal Revenue Service (IRS) for a period of three fiscal years after they are filed. State and local tax returns may be subject to examination for an additional fiscal year depending on the jurisdiction.
Distributions are declared and recorded on the ex-dividend date. Income dividends and capital gain distributions are declared separately for each class. Income and capital gain distributions are determined in accordance with income tax regulations, which may differ from GAAP.
Capital accounts within the financial statements are adjusted for permanent book-tax differences. These adjustments have no impact on net assets or the results of operations. Capital accounts are not adjusted for temporary book-tax differences which will reverse in a subsequent period.
Book-tax differences are primarily due to market discount, deferred trustees compensation, capital loss carryforwards and losses deferred due to wash sales and excise tax regulations.
The federal tax cost of investment securities and unrealized appreciation (depreciation) as of period end were as follows:
Gross unrealized appreciation | $ 53,210,392 |
Gross unrealized depreciation | (12,963,627) |
Net unrealized appreciation (depreciation) on securities and other investments | $ 40,246,765 |
| |
Tax Cost | $ 1,495,115,783 |
Annual Report
Notes to Financial Statements - continued
3. Significant Accounting Policies - continued
Income Tax Information and Distributions to Shareholders - continued
The tax-based components of distributable earnings as of period end were as follows:
Capital loss carryforward | $ (58,936,967) |
Net unrealized appreciation (depreciation) | $ 40,246,765 |
Capital loss carryforwards are only available to offset future capital gains of the Fund to the extent provided by regulations and may be limited. Under the Regulated Investment Company Modernization Act of 2010 (the Act), the Fund is permitted to carry forward capital losses incurred in taxable years beginning after December 22, 2010 for an unlimited period and such capital losses are required to be used prior to any losses that expire. The capital loss carryforward information presented below, including any applicable limitation, is estimated as of fiscal period end and is subject to adjustment.
Fiscal year of expiration | |
2017 | $ (58,936,967) |
The tax character of distributions paid was as follows:
| December 31, 2013 | December 31, 2012 |
Ordinary Income | $ 86,921,876 | $ 84,934,228 |
Trading (Redemption) Fees. Initial Class R shares, Service Class R shares and Service Class 2R shares held by investors less than 60 days may be subject to a redemption fee equal to 1% of the NAV of shares redeemed. All redemption fees, which reduce the proceeds of the shareholder redemption, are retained by the Fund and accounted for as an addition to paid in capital.
Delayed Delivery Transactions and When-Issued Securities. During the period, the Fund transacted in securities on a delayed delivery or when-issued basis. Payment and delivery may take place after the customary settlement period for that security. The price of the underlying securities and the date when the securities will be delivered and paid for are fixed at the time the transaction is negotiated. The securities purchased on a delayed delivery or when-issued basis are identified as such in the Fund's Schedule of Investments. The Fund may receive compensation for interest forgone in the purchase of a delayed delivery or when-issued security. With respect to purchase commitments, the Fund identifies securities as segregated in its records with a value at least equal to the amount of the commitment. Losses may arise due to changes in the value of the underlying securities or if the counterparty does not perform under the contract's terms, or if the issuer does not issue the securities due to political, economic, or other factors.
Restricted Securities. The Fund may invest in securities that are subject to legal or contractual restrictions on resale. These securities generally may be resold in transactions exempt from registration or to the public if the securities are registered. Disposal of these securities may involve time-consuming negotiations and expense, and prompt sale at an acceptable price may be difficult. Information regarding restricted securities is included at the end of the Fund's Schedule of Investments.
Loans and Other Direct Debt Instruments. The Fund invests in direct debt instruments which are interests in amounts owed to lenders by corporate or other borrowers. These instruments may be in the form of loans, trade claims or other receivables and may include standby financing commitments such as revolving credit facilities that obligate the Fund to supply additional cash to the borrower on demand. Loans may be acquired through assignment or participation, or may be made directly to a borrower. The Fund may be contractually obligated to receive approval from the agent bank and/or borrower prior to the sale of these loans. The Fund also invests in unfunded loan commitments, which are contractual obligations for future funding. Information regarding unfunded commitments is included at the end of the Fund's Schedule of Investments.
4. Purchases and Sales of Investments.
Purchases and sales of securities, other than short-term securities, aggregated $1,269,172,018 and $1,179,884,778, respectively.
5. Fees and Other Transactions with Affiliates.
Management Fee. Fidelity Management & Research Company (the investment adviser) and its affiliates provide the Fund with investment management related services for which the Fund pays a monthly management fee. The management fee is the sum of an individual fund fee rate that is based on an annual rate of .45% of the Fund's average net assets and an annualized group fee rate that averaged .11% during the period. The group fee rate is based upon the average net assets of all the mutual funds advised by the investment adviser, including any mutual funds previously advised by the investment adviser that are currently advised by Fidelity SelectCo, LLC, an affiliate of the investment adviser. The group fee rate decreases as assets
Annual Report
5. Fees and Other Transactions with Affiliates - continued
Management Fee - continued
under management increase and increases as assets under management decrease. For the reporting period, the total annual management fee rate was .56% of the Fund's average net assets.
Distribution and Service Plan Fees. In accordance with Rule 12b-1 of the 1940 Act, the Fund has adopted separate 12b-1 Plans for each Service Class of shares. Each Service Class pays Fidelity Distributors Corporation (FDC), an affiliate of the investment adviser, a service fee. For the period, the service fee is based on an annual rate of .10% of Service Class' and Service Class R's average net assets and .25% of Service Class 2's and Service Class 2R's average net assets.
For the period, total fees, all of which were re-allowed to insurance companies for the distribution of shares and providing shareholder support services were as follows:
Service Class | $ 72,026 |
Service Class 2 | 669,990 |
Service Class R | 53,854 |
Service Class 2 R | 9,880 |
| $ 805,750 |
Transfer Agent Fees. Fidelity Investments Institutional Operations Company, Inc. (FIIOC), an affiliate of the investment adviser, is the Fund's transfer, dividend disbursing, and shareholder servicing agent. FIIOC receives an asset-based fee with respect to each class. Each class (with the exception of Investor Class) pays a transfer agent fee, excluding out of pocket expenses, equal to an annual rate of .07% of average net assets. Investor Class pays a monthly asset-based transfer agent fee of .10% of average net assets. In addition, FIIOC receives an asset-based fee of .0035% of average net assets for typesetting, printing and mailing of shareholder reports, except proxy statements. FIIOC voluntarily agreed to reimburse or waive this fee for the period January 1, 2013 through December 31, 2013 (see Expense Reductions note). For the period, transfer agent fees for each class, including printing and out of pocket expenses, were as follows:
Initial Class | $ 437,051 |
Service Class | 51,782 |
Service Class 2 | 191,829 |
Initial Class R | 22,129 |
Service Class R | 37,627 |
Service Class 2R | 2,763 |
Investor Class | 475,168 |
| $ 1,218,349 |
Effective February 1, 2014, the Board of Trustees approved an amendment to the transfer agent fee agreement whereby each class (with the exception of Investor Class) pays a single fee of .07% of average net assets for transfer agent services, typesetting, printing and mailing of shareholder reports, excluding mailing of proxy statements and out of pocket expenses. Investor Class pays a single fee of .10% of average net assets.
Accounting Fees. Fidelity Service Company, Inc. (FSC), an affiliate of the investment adviser, maintains the Fund's accounting records. The fee is based on the level of average net assets for each month.
Interfund Lending Program. Pursuant to an Exemptive Order issued by the SEC, the Fund, along with other registered investment companies having management contracts with FMR or other affiliated entities of FMR, may participate in an interfund lending program. This program provides an alternative credit facility allowing the funds to borrow from, or lend money to, other participating affiliated funds. At period end, there were no interfund loans outstanding. The Fund's activity in this program during the period for which loans were outstanding was as follows:
Borrower or Lender | Average Loan
Balance | Weighted Average Interest Rate | Interest
Expense |
Borrower | $ 24,831,167 | .31% | $ 1,289 |
6. Committed Line of Credit.
The Fund participates with other funds managed by the investment adviser or an affiliate in a $4.25 billion credit facility (the "line of credit") to be utilized for temporary or emergency purposes to fund shareholder redemptions or for other short-term liquidity purposes. The Fund has agreed to pay commitment fees on its pro-rata portion of the line of credit, which amounted to $3,236 and is reflected in Miscellaneous expenses on the Statement of Operations. During the period, there were no borrowings on this line of credit.
Annual Report
Notes to Financial Statements - continued
7. Expense Reductions.
The investment adviser or its affiliates agreed to reimburse or waive certain fees during the period as noted in the table below.
Initial Class | $ 23,163 |
Service Class | 2,839 |
Service Class 2 | 10,570 |
Initial Class R | 1,247 |
Service Class R | 2,120 |
Service Class 2R | 156 |
Investor Class | 17,960 |
| $ 58,055 |
In addition, through arrangements with the Fund's custodian, credits realized as a result of uninvested cash balances were used to reduce the Fund's expenses. During the period, these credits reduced the Fund's custody expenses by $1,942.
8. Distributions to Shareholders.
Distributions to shareholders of each class were as follows:
Years ended December 31, | 2013 | 2012 |
From net investment income | | |
Initial Class | $ 33,473,820 | $ 34,341,731 |
Service Class | 3,969,791 | 4,352,958 |
Service Class 2 | 16,115,842 | 15,615,687 |
Initial Class R | 1,722,419 | 2,033,316 |
Service Class R | 3,349,920 | 3,948,919 |
Service Class 2R | 230,462 | 215,852 |
Investor Class | 28,059,622 | 24,425,765 |
Total | $ 86,921,876 | $ 84,934,228 |
9. Share Transactions.
Transactions for each class of shares were as follows:
| Shares | Dollars |
Years ended December 31, | 2013 | 2012 | 2013 | 2012 |
Initial Class | | | | |
Shares sold | 14,039,906 | 13,853,360 | $ 83,416,151 | $ 80,405,792 |
Reinvestment of distributions | 5,790,037 | 5,923,006 | 33,473,820 | 34,341,731 |
Shares redeemed | (23,058,485) | (19,521,567) | (136,983,639) | (112,985,217) |
Net increase (decrease) | (3,228,542) | 254,799 | $ (20,093,668) | $ 1,762,306 |
Service Class | | | | |
Shares sold | 929,486 | 1,525,261 | $ 5,521,007 | $ 8,621,959 |
Reinvestment of distributions | 690,233 | 754,748 | 3,969,791 | 4,352,958 |
Shares redeemed | (3,064,824) | (5,957,709) | (18,085,383) | (33,943,822) |
Net increase (decrease) | (1,445,105) | (3,677,700) | $ (8,594,585) | $ (20,968,905) |
Service Class 2 | | | | |
Shares sold | 20,103,362 | 25,700,556 | $ 116,574,992 | $ 145,593,661 |
Reinvestment of distributions | 2,866,946 | 2,764,623 | 16,115,842 | 15,615,687 |
Shares redeemed | (22,951,503) | (20,664,331) | (132,172,105) | (115,959,882) |
Net increase (decrease) | 18,805 | 7,800,848 | $ 518,729 | $ 45,249,466 |
Initial Class R | | | | |
Shares sold | 852,998 | 2,462,639 | $ 5,061,609 | $ 14,321,536 |
Reinvestment of distributions | 298,955 | 351,902 | 1,722,419 | 2,033,316 |
Shares redeemed | (2,192,612) | (2,548,693) | (12,973,240) | (14,732,861) |
Net increase (decrease) | (1,040,659) | 265,848 | $ (6,189,212) | $ 1,621,991 |
Service Class R | | | | |
Shares sold | 5,190,571 | 8,023,964 | $ 30,731,567 | $ 46,504,431 |
Reinvestment of distributions | 585,519 | 688,191 | 3,349,920 | 3,948,919 |
Shares redeemed | (7,823,949) | (8,456,038) | (46,022,233) | (47,748,690) |
Net increase (decrease) | (2,047,859) | 256,117 | $ (11,940,746) | $ 2,704,660 |
Annual Report
9. Share Transactions - continued
| Shares | Dollars |
Years ended December 31, | 2013 | 2012 | 2013 | 2012 |
Service Class 2R | | | | |
Shares sold | 995,220 | 580,649 | $ 5,809,165 | $ 3,315,329 |
Reinvestment of distributions | 40,999 | 38,276 | 230,462 | 215,852 |
Shares redeemed | (976,234) | (164,440) | (5,617,855) | (925,854) |
Net increase (decrease) | 59,985 | 454,485 | $ 421,772 | $ 2,605,327 |
Investor Class | | | | |
Shares sold | 25,574,430 | 28,186,563 | $ 151,658,997 | $ 162,161,430 |
Reinvestment of distributions | 4,870,500 | 4,226,954 | 28,059,622 | 24,425,765 |
Shares redeemed | (19,845,132) | (9,530,114) | (117,522,548) | (54,938,765) |
Net increase (decrease) | 10,599,798 | 22,883,403 | $ 62,196,071 | $ 131,648,430 |
10. Other.
The Fund's organizational documents provide former and current trustees and officers with a limited indemnification against liabilities arising in connection with the performance of their duties to the Fund. In the normal course of business, the Fund may also enter into contracts that provide general indemnifications. The Fund's maximum exposure under these arrangements is unknown as this would be dependent on future claims that may be made against the Fund. The risk of material loss from such claims is considered remote.
At the end of the period, the investment adviser or its affiliates were the owners of record of 39% of the total outstanding shares of the Fund and one otherwise unaffiliated shareholder was the owner of record of 15% of the total outstanding shares of the Fund.
Annual Report
Report of Independent Registered Public Accounting Firm
To the Trustees of Variable Insurance Products Fund and the Shareholders of VIP High Income Portfolio:
In our opinion, the accompanying statement of assets and liabilities, including the schedule of investments, and the related statements of operations and of changes in net assets and the financial highlights present fairly, in all material respects, the financial position of VIP High Income Portfolio (a fund of Variable Insurance Products Fund) at December 31, 2013, the results of its operations for the year then ended, the changes in its net assets for each of the two years in the period then ended and the financial highlights for each of the five years in the period then ended, in conformity with accounting principles generally accepted in the United States of America. These financial statements and financial highlights (hereafter referred to as "financial statements") are the responsibility of the VIP High Income Portfolio's management. Our responsibility is to express an opinion on these financial statements based on our audits. We conducted our audits of these financial statements in accordance with the standards of the Public Company Accounting Oversight Board (United States). Those standards require that we plan and perform the audit to obtain reasonable assurance about whether the financial statements are free of material misstatement. An audit includes examining, on a test basis, evidence supporting the amounts and disclosures in the financial statements, assessing the accounting principles used and significant estimates made by management, and evaluating the overall financial statement presentation. We believe that our audits, which included confirmation of securities at December 31, 2013 by correspondence with the custodian, agent banks and brokers, provide a reasonable basis for our opinion.
PricewaterhouseCoopers LLP
Boston, Massachusetts
February 14, 2014
Annual Report
The Trustees, Member of the Advisory Board, and officers of the trust and fund, as applicable, are listed below. The Board of Trustees governs the fund and is responsible for protecting the interests of shareholders. The Trustees are experienced executives who meet periodically throughout the year to oversee the fund's activities, review contractual arrangements with companies that provide services to the fund, oversee management of the risks associated with such activities and contractual arrangements, and review the fund's performance. Except for James C. Curvey, Ned C. Lautenbach, Ronald P. O'Hanley and William S. Stavropoulos, each of the Trustees oversees 173 funds. Mr. Curvey oversees 396 funds. Mr. Lautenbach, Mr. O'Hanley and Mr. Stavropoulos each oversees 247 funds.
The Trustees hold office without limit in time except that (a) any Trustee may resign; (b) any Trustee may be removed by written instrument, signed by at least two-thirds of the number of Trustees prior to such removal; (c) any Trustee who requests to be retired or who has become incapacitated by illness or injury may be retired by written instrument signed by a majority of the other Trustees; and (d) any Trustee may be removed at any special meeting of shareholders by a two-thirds vote of the outstanding voting securities of the trust.Each Trustee who is not an interested person (as defined in the 1940 Act) of the trust and the fund (Independent Trustee), shall retire not later than the last day of the calendar year in which his or her 75th birthday occurs. The Independent Trustees may waive this mandatory retirement age policy with respect to individual Trustees. The officers and Advisory Board Member hold office without limit in time, except that any officer and Advisory Board Member may resign or may be removed by a vote of a majority of the Trustees at any regular meeting or any special meeting of the Trustees. Except as indicated, each individual has held the office shown or other offices in the same company for the past five years.
Experience, Skills, Attributes, and Qualifications of the Fund's Trustees. The Governance and Nominating Committee has adopted a statement of policy that describes the experience, qualifications, attributes, and skills that are necessary and desirable for potential Independent Trustee candidates (Statement of Policy). The Board believes that each Trustee satisfied at the time he or she was initially elected or appointed a Trustee, and continues to satisfy, the standards contemplated by the Statement of Policy. The Governance and Nominating Committee also engages professional search firms to help identify potential Independent Trustee candidates who have the experience, qualifications, attributes, and skills consistent with the Statement of Policy. From time to time, additional criteria based on the composition and skills of the current Independent Trustees, as well as experience or skills that may be appropriate in light of future changes to board composition, business conditions, and regulatory or other developments, have also been considered by the professional search firms and the Governance and Nominating Committee. In addition, the Board takes into account the Trustees' commitment and participation in Board and committee meetings, as well as their leadership of standing and ad hoc committees throughout their tenure.
In determining that a particular Trustee was and continues to be qualified to serve as a Trustee, the Board has considered a variety of criteria, none of which, in isolation, was controlling. The Board believes that, collectively, the Trustees have balanced and diverse experience, qualifications, attributes, and skills, which allow the Board to operate effectively in governing the fund and protecting the interests of shareholders. Information about the specific experience, skills, attributes, and qualifications of each Trustee, which in each case led to the Board's conclusion that the Trustee should serve (or continue to serve) as a trustee of the fund, is provided below.
Board Structure and Oversight Function. James C. Curvey is an interested person (as defined in the 1940 Act) and currently serves as Chairman. The Trustees have determined that an interested Chairman is appropriate and benefits shareholders because an interested Chairman has a personal and professional stake in the quality and continuity of services provided to the fund. Independent Trustees exercise their informed business judgment to appoint an individual of their choosing to serve as Chairman, regardless of whether the Trustee happens to be independent or a member of management. The Independent Trustees have determined that they can act independently and effectively without having an Independent Trustee serve as Chairman and that a key structural component for assuring that they are in a position to do so is for the Independent Trustees to constitute a substantial majority for the Board. The Independent Trustees also regularly meet in executive session. Ned C. Lautenbach serves as Chairman of the Independent Trustees and as such (i) acts as a liaison between the Independent Trustees and management with respect to matters important to the Independent Trustees and (ii) with management prepares agendas for Board meetings.
Fidelity funds are overseen by different Boards of Trustees. The fund's Board oversees Fidelity's equity and high income funds and another Board oversees Fidelity's investment-grade bond, money market, and asset allocation funds. The asset allocation funds may invest in Fidelity funds overseen by the fund's Board. The use of separate Boards, each with its own committee structure, allows the Trustees of each group of Fidelity funds to focus on the unique issues of the funds they oversee, including common research, investment, and operational issues. On occasion, the separate Boards establish joint committees to address issues of overlapping consequences for the Fidelity funds overseen by each Board.
The Trustees operate using a system of committees to facilitate the timely and efficient consideration of all matters of importance to the Trustees, the fund, and fund shareholders and to facilitate compliance with legal and regulatory requirements and oversight of the fund's activities and associated risks. The Board, acting through its committees, has charged FMR and its affiliates with (i) identifying events or circumstances the occurrence of which could have demonstrably adverse effects on the fund's business and/or reputation; (ii) implementing processes and controls to lessen the possibility that such events or circumstances occur or to mitigate the effects of such events or circumstances if they do occur; and (iii) creating and maintaining a system designed to evaluate continuously business and market conditions in order to facilitate the identification and implementation processes described in (i) and (ii) above. Because the day-to-day operations and activities of the fund are carried out by or through FMR, its affiliates and other service providers, the fund's exposure to risks is mitigated but not eliminated by the processes overseen by the Trustees. While each of the Board's committees has responsibility for overseeing different aspects of the fund's activities, oversight is exercised primarily through the Operations, Audit, and Compliance Committees. In addition, the Independent Trustees have worked with FMR to enhance the Board's oversight of investment and financial risks, legal and regulatory risks, technology risks, and operational risks, including the development of additional risk reporting to the Board. For example, a working group comprised of Independent Trustees and FMR has worked and continues to work to review the Fidelity funds' valuation-related activities, reporting and risk management. Appropriate personnel, including but not limited to the fund's Chief Compliance Officer (CCO), FMR's internal auditor, the independent accountants, the fund's Treasurer and portfolio management personnel, make periodic reports to the Board's committees, as appropriate, including an annual review of FMR's risk management program for the Fidelity funds. The responsibilities of each standing committee, including their oversight responsibilities, are described further under "Standing Committees of the Fund's Trustees."
Annual Report
The fund's Statement of Additional Information (SAI) includes more information about the Trustees. To request a free copy, call Fidelity at 1-877-208-0098.
Interested Trustees*:
Correspondence intended for each Trustee who is an interested person may be sent to Fidelity Investments, 245 Summer Street, Boston, Massachusetts 02210.
Name, Year of Birth; Principal Occupations and Other Relevant Experience+ |
James C. Curvey (1935) |
Year of Election or Appointment: 2007 Trustee Chairman of the Board of Trustees |
| Mr. Curvey also serves as Trustee of other Fidelity funds. Mr. Curvey is a Director of Fidelity Investments Money Management, Inc. (2009-present), Director of Fidelity Research & Analysis Co. (2009-present) and Director of FMR and FMR Co., Inc. (2007-present). Mr. Curvey is also Vice Chairman (2007-present) and Director of FMR LLC. In addition, Mr. Curvey serves as an Overseer for the Boston Symphony Orchestra and a member of the Trustees of Villanova University. Previously, Mr. Curvey was the Vice Chairman (2006-2007) and Director (2000-2007) of FMR Corp. |
Ronald P. O'Hanley (1957) |
Year of Election or Appointment: 2011 Trustee |
| Mr. O'Hanley also serves as Trustee of other Fidelity funds. He is Director of Fidelity SelectCo, LLC (2013-present), FMR Co., Inc. (2010-present), Director of Fidelity Investments Money Management, Inc. (2010-present), Director of Fidelity Research & Analysis Company (2010-present), President of Fidelity Asset Management and Corporate Services and a Member of Fidelity's Executive Committee (2010-present). Previously, Mr. O'Hanley served as President and Chief Executive Officer of BNY Mellon Asset Management (2007-2010). Mr. O'Hanley also served as Vice Chairman of Bank New York Mellon Corp. and a member of that firm's Executive Committee. Prior to the 2007 merger of The Bank of New York and Mellon Financial Corporation, he was Vice Chairman of Mellon Financial Corporation and President and Chief Executive Officer of Mellon Asset Management. He joined Mellon in February 1997. Mr. O'Hanley currently serves as Chairman of the Boston Public Library Foundation Board of Directors and sits on the Board of Directors of Beth Israel Deaconess Medical Center, the Board of Trustees of the Marine Biological Laboratory and the Advisory Board of the Maxwell School of Citizenship and Public Administration at Syracuse University. Mr. O'Hanley also chairs the Council on Asset Management for the Financial Services Roundtable and is a member of the Board of Directors of Institutional Investor's U.S. Institute. |
* Trustees have been determined to be "Interested Trustees" by virtue of, among other things, their affiliation with the or various entities under common control with FMR.
+ The information above includes each Trustee's principal occupation during the last five years and other information relating to the experience, attributes, and skills relevant to each Trustee's qualifications to serve as a Trustee, which led to the conclusion that each Trustee should serve as a Trustee for the fund.
Annual Report
Trustees and Officers - continued
Independent Trustees:
Correspondence intended for each Independent Trustee (that is, the Trustees other than the Interested Trustees) may be sent to Fidelity Investments, P.O. Box 55235, Boston, Massachusetts 02205-5235.
Name, Year of Birth; Principal Occupations and Other Relevant Experience+ |
Dennis J. Dirks (1948) |
Year of Election or Appointment: 2005 Trustee |
| Mr. Dirks also serves as Trustee of other Fidelity funds. Prior to his retirement in May 2003, Mr. Dirks was Chief Operating Officer and a member of the Board of The Depository Trust & Clearing Corporation (DTCC). He also served as President, Chief Operating Officer, and Board member of The Depository Trust Company (DTC) and President and Board member of the National Securities Clearing Corporation (NSCC). In addition, Mr. Dirks served as Chief Executive Officer and Board member of the Government Securities Clearing Corporation, Chief Executive Officer and Board member of the Mortgage-Backed Securities Clearing Corporation, as a Trustee and a member of the Finance Committee of Manhattan College (2005-2008), and as a Trustee and a member of the Finance Committee of AHRC of Nassau County (2006-2008). Mr. Dirks is a member of the Independent Directors Council (IDC) Governing Council (2010-present) and Board of Directors for The Brookville Center for Children's Services, Inc. (2009-present). |
Alan J. Lacy (1953) |
Year of Election or Appointment: 2008 Trustee |
| Mr. Lacy also serves as Trustee of other Fidelity funds. Mr. Lacy serves as Senior Adviser (2007-present) of Oak Hill Capital Partners, L.P. (private equity). Mr. Lacy also served as Chief Executive Officer (2000-2005) and Vice Chairman (2005-2006) of Sears Holdings Corporation and Sears, Roebuck and Co. (retail). In addition, Mr. Lacy serves as a member of the Board of Directors of Dave & Buster's Entertainment, Inc. (restaurant and entertainment complexes, 2010-present), Earth Fare, Inc. (retail grocery, 2012-present), The Hillman Companies, Inc. (hardware wholesalers, 2010-present), and Bristol-Myers Squibb Company (global pharmaceuticals, 2008-present). Mr. Lacy is a member of the Board of Trustees of The National Parks Conservation Association (2006-present). Previously, Mr. Lacy served as Chairman of the Board of Trustees of the National Parks Conservation Association (2008-2011) and as a member of the Board of Directors for the Western Union Company (global money transfer, 2006-2011). |
Ned C. Lautenbach (1944) |
Year of Election or Appointment: 2000 Trustee Chairman of the Independent Trustees |
| Mr. Lautenbach also serves as Trustee of other Fidelity funds. Mr. Lautenbach currently serves as the Lead Director of the Eaton Corporation Board of Directors (diversified industrial, 1997-present). Mr. Lautenbach is Chairman of the Board of Directors of the Philharmonic Center for the Arts in Naples, Florida (2012-present) and a member of the Council on Foreign Relations (1994-present). Previously, Mr. Lautenbach was a Partner/Advisory Partner at Clayton, Dubilier & Rice, LLC (private equity investment, 1998-2010), as well as a Director of Sony Corporation (2006-2007). |
Joseph Mauriello (1944) |
Year of Election or Appointment: 2008 Trustee |
| Mr. Mauriello also serves as Trustee of other Fidelity funds. Prior to his retirement in January 2006, Mr. Mauriello served in numerous senior management positions including Deputy Chairman and Chief Operating Officer (2004-2005), and Vice Chairman of Financial Services (2002-2004) of KPMG LLP US (professional services, 1965-2005). Mr. Mauriello currently serves as a member of the Board of Directors of XL Group plc. (global insurance and re-insurance, 2006-present). Previously, Mr. Mauriello served as a Director of the Hamilton Funds of the Bank of New York (2006-2007) and of Arcadia Resources Inc. (health care services and products, 2007-2012). |
Robert W. Selander (1950) |
Year of Election or Appointment: 2011 Trustee |
| Mr. Selander also serves as Trustee of other Fidelity funds. Previously, Mr. Selander served as a Member of the Advisory Board of other Fidelity funds (2011), and Executive Vice Chairman (2010), Chief Executive Officer (2009-2010), and President and Chief Executive Officer (1997-2009) of Mastercard, Inc. |
Cornelia M. Small (1944) |
Year of Election or Appointment: 2005 Trustee |
| Ms. Small also serves as Trustee of other Fidelity funds. Ms. Small is a member of the Board of Directors (2009-present) and Chair of the Investment Committee (2010-present) of the Teagle Foundation. Ms. Small also serves on the Investment Committee of the Berkshire Taconic Community Foundation (2008-present). Previously, Ms. Small served as Chairperson (2002-2008) and a member of the Investment Committee and Chairperson (2008-2012) and a member of the Board of Trustees of Smith College. In addition, Ms. Small served as Chief Investment Officer, Director of Global Equity Investments, and a member of the Board of Directors of Scudder, Stevens & Clark and Scudder Kemper Investments. |
William S. Stavropoulos (1939) |
Year of Election or Appointment: 2001 Trustee Vice Chairman of the Independent Trustees |
| Mr. Stavropoulos also serves as Trustee of other Fidelity funds. Mr. Stavropoulos serves as President and Founder of the Michigan Baseball Foundation, the Great Lakes Loons (2007-present). Mr. Stavropoulos is Chairman Emeritus of the Board of Directors of The Dow Chemical Company, where he previously served in numerous senior management positions, including President, CEO (1995-2000; 2002-2004), Chairman of the Executive Committee (2000-2006), and as a member of the Board of Directors (1990-2006). Currently, Mr. Stavropoulos is Chairman of the Board of Directors of Univar Inc. (global distributor of commodity and specialty chemicals), a Director of Teradata Corporation (data warehousing and technology solutions), and Maersk Inc. (industrial conglomerate), and a member of the Advisory Board for Metalmark Capital LLC (private equity investment, 2005-present). Mr. Stavropoulos is an operating advisor to Clayton, Dubilier & Rice, LLC (private equity investment). In addition, Mr. Stavropoulos is a member of the University of Notre Dame Advisory Council for the College of Science, a Trustee of the Rollin L. Gerstacker Foundation, and a Director of the Naples Philharmonic Center for the Arts. Previously, Mr. Stavropoulos served as a Director of Chemical Financial Corporation (bank holding company, 1993-2012) and Tyco International, Ltd. (multinational manufacturing and services, 2007-2012). |
David M. Thomas (1949) |
Year of Election or Appointment: 2008 Trustee |
| Mr. Thomas also serves as Trustee of other Fidelity funds. Mr. Thomas serves as Non-Executive Chairman of the Board of Directors of Fortune Brands Home and Security (home and security products, 2011-present), and as a member of the Board of Directors of Interpublic Group of Companies, Inc. (marketing communication, 2004-present). Previously, Mr. Thomas served as Executive Chairman (2005-2006) and Chairman and Chief Executive Officer (2000-2005) of IMS Health, Inc. (pharmaceutical and healthcare information solutions), and a Director of Fortune Brands, Inc. (consumer products, 2000-2011). |
+ The information above includes each Trustee's principal occupation during the last five years and other information relating to the experience, attributes, and skills relevant to each Trustee's qualifications to serve as a Trustee, which led to the conclusion that each Trustee should serve as a Trustee for the fund.
Advisory Board Member and Officers:
Correspondence intended for each officer and Peter S. Lynch may be sent to Fidelity Investments, 245 Summer Street, Boston, Massachusetts 02210. Officers appear below in alphabetical order.
Name, Year of Birth; Principal Occupation |
Peter S. Lynch (1944) |
Year of Election or Appointment: 2003 Member of the Advisory Board |
| Mr. Lynch also serves as Member of the Advisory Board of other Fidelity funds. Mr. Lynch is Vice Chairman and a Director of FMR and FMR Co., Inc. In addition, Mr. Lynch serves as a Trustee of Boston College and as the Chairman of the Inner-City Scholarship Fund. Previously, Mr. Lynch served on the Special Olympics International Board of Directors (1997-2006). |
Elizabeth Paige Baumann (1968) |
Year of Election or Appointment: 2012 Anti-Money Laundering (AML) Officer |
| Ms. Baumann also serves as AML Officer of other funds. She is Chief AML Officer of FMR LLC (2012-present) and is an employee of Fidelity Investments. Previously, Ms. Baumann served as Vice President and Deputy Anti-Money Laundering Officer (2007-2012). |
William C. Coffey (1969) |
Year of Election or Appointment: 2009 Assistant Secretary |
| Mr. Coffey also serves as Assistant Secretary of other funds. He is Senior Vice President and Deputy General Counsel of FMR LLC (2010-present), and is an employee of Fidelity Investments. Previously, Mr. Coffey served as Vice President and Associate General Counsel of FMR LLC (2005-2009). |
Jonathan Davis (1968) |
Year of Election or Appointment: 2010 Assistant Treasurer |
| Mr. Davis also serves as Assistant Treasurer of other funds. Mr. Davis is an employee of Fidelity Investments. Previously, Mr. Davis served as Vice President and Associate General Counsel of FMR LLC (2003-2010). |
Adrien E. Deberghes (1967) |
Year of Election or Appointment: 2008 Deputy Treasurer |
| Mr. Deberghes also serves as an officer of other funds. He is an employee of Fidelity Investments (2008-present). Prior to joining Fidelity Investments, Mr. Deberghes was Senior Vice President of Mutual Fund Administration at State Street Corporation (2007-2008), Senior Director of Mutual Fund Administration at Investors Bank & Trust (2005-2007), and Director of Finance for Dunkin' Brands (2000-2005). |
Stephanie J. Dorsey (1969) |
Year of Election or Appointment: 2010 Assistant Treasurer |
| Ms. Dorsey also serves as an officer of other funds. She is an employee of Fidelity Investments (2008-present) and has served in other fund officer roles. Prior to joining Fidelity Investments, Ms. Dorsey served as Treasurer (2004-2008) of the JPMorgan Mutual Funds and Vice President (2004-2008) of JPMorgan Chase Bank. |
Scott C. Goebel (1968) |
Year of Election or Appointment: 2008 Secretary and Chief Legal Officer (CLO) |
| Mr. Goebel serves as Secretary and CLO of other funds. Mr. Goebel also serves as Secretary of Fidelity Investments Money Management, Inc. (FIMM) (2010-present) and Fidelity Research and Analysis Company (FRAC) (2010-present); General Counsel, Secretary, and Senior Vice President of FMR (2008-present) and FMR Co., Inc. (2008-present); Chief Legal Officer of Fidelity Management & Research (Hong Kong) Limited (2008-present) and Assistant Secretary of Fidelity Management & Research (Japan) Inc. (2008-present), and Fidelity Management & Research (U.K.) Inc. (2008-present). Previously, Mr. Goebel served as Secretary and CLO of other Fidelity funds (2008-2013), Assistant Secretary of FIMM (2008-2010), FRAC (2008-2010), and certain funds (2007-2008); and as Vice President and Secretary of Fidelity Distributors Corporation (FDC) (2005-2007). Mr. Goebel has been employed by FMR LLC or an affiliate since 2001. |
Joseph A. Hanlon (1968) |
Year of Election or Appointment: 2012 Chief Compliance Officer |
| Mr. Hanlon also serves as Chief Compliance Officer of other funds. Mr. Hanlon serves as Compliance Officer of FMR, FMR Co., Inc., Fidelity Investments Money Management, Inc. (FIMM), Fidelity Research and Analysis Company (FRAC), and Fidelity Management & Research (Hong Kong) (2009-present), as Senior Vice President of the Fidelity Asset Management Division (2009-present), and is an employee of Fidelity Investments. Previously, Mr. Hanlon served as Compliance Officer of Fidelity Management & Research (Japan) Inc. (2009-2013), Strategic Advisers, Inc. (2009-2013), and Fidelity Management & Research (U.K.) Inc. (2009-2013). |
Thomas C. Hense (1964) |
Year of Election or Appointment: 2008/2010 Vice President |
| Mr. Hense also serves as Vice President of other funds (High Income (2008), Small Cap (2008), and Value (2010) funds). Previously, Mr. Hense served as a portfolio manager for Fidelity's Institutional Money Management Group (Pyramis) (2003-2008). |
Brian B. Hogan (1964) |
Year of Election or Appointment: 2009 Vice President |
| Mr. Hogan also serves as Vice President of other funds. Mr. Hogan serves as President of FMR's Equity Division (2009-present). Previously, Mr. Hogan served as Senior Vice President, Equity Research of FMR (2006-2009) and as a portfolio manager. |
Chris Maher (1972) |
Year of Election or Appointment: 2013 Assistant Treasurer |
| Mr. Maher serves as Assistant Treasurer of other funds. Mr. Maher is Vice President of Valuation Oversight and is an employee of Fidelity Investments. Previously, Mr. Maher served as Vice President of Asset Management Compliance (2013), Vice President of FMR's Program Management Group (2010-2013), and Vice President of Valuation Oversight (2008-2010). |
Christine Reynolds (1958) |
Year of Election or Appointment: 2008 Chief Financial Officer |
| Ms. Reynolds also serves as Chief Financial Officer of other funds. Ms. Reynolds became President of Fidelity Pricing and Cash Management Services (FPCMS) in August 2008. Ms. Reynolds served as Chief Operating Officer of FPCMS (2007-2008). Previously, Ms. Reynolds served as President, Treasurer, and Anti-Money Laundering officer of the Fidelity funds (2004-2007). |
Kenneth B. Robins (1969) |
Year of Election or Appointment: 2008 President and Treasurer |
| Mr. Robins also serves as an officer of other funds. Mr. Robins serves as Executive Vice President of Fidelity Investments Money Management, Inc. (FIMM) (2013-present) and is an employee of Fidelity Investments (2004-present). Previously, Mr. Robins served in other fund officer roles. |
Gary W. Ryan (1958) |
Year of Election or Appointment: 2005 Assistant Treasurer |
| Mr. Ryan also serves as Assistant Treasurer of other funds. Mr. Ryan is an employee of Fidelity Investments and has served in other fund officer roles. Previously, Mr. Ryan served as Vice President of Fund Reporting in Fidelity Pricing and Cash Management Services (FPCMS) (1999-2005). |
Stephen Sadoski (1971) |
Year of Election or Appointment: 2012 Deputy Treasurer |
| Mr. Sadoski also serves as Deputy Treasurer of other funds. He is an employee of Fidelity Investments (2012-present) and has served in another fund officer role. Prior to joining Fidelity Investments, Mr. Sadoski served as an assistant chief accountant in the Division of Investment Management of the Securities and Exchange Commission (SEC) (2009-2012) and as a senior manager at Deloitte & Touche LLP (1997-2009). |
Stacie M. Smith (1974) |
Year of Election or Appointment: 2013 Deputy Treasurer |
| Ms. Smith also serves as an officer of other funds. She is an employee of Fidelity Investments (2009-present) and has served in other fund officer roles. Prior to joining Fidelity Investments, Ms. Smith served as Senior Audit Manager of Ernst & Young LLP (1996-2009). |
Renee Stagnone (1975) |
Year of Election or Appointment: 2013 Deputy Treasurer |
| Ms. Stagnone also serves as Deputy Treasurer of other funds. Ms. Stagnone is an employee of Fidelity Investments. |
Joseph F. Zambello (1957) |
Year of Election or Appointment: 2011 Deputy Treasurer |
| Mr. Zambello also serves as Deputy Treasurer of other funds. Mr. Zambello is an employee of Fidelity Investments. Previously, Mr. Zambello served as Vice President of FMR's Program Management Group (2009-2011) and Vice President of the Transfer Agent Oversight Group (2005-2009). |
Annual Report
Board Approval of Investment Advisory Contracts and Management Fees
VIP High Income Portfolio
Each year, the Board of Trustees, including the Independent Trustees (together, the Board), votes on the renewal of the management contract and sub-advisory agreements (together, the Advisory Contracts) for the fund. The Board, assisted by the advice of fund counsel and Independent Trustees' counsel, requests and considers a broad range of information relevant to the renewal of the Advisory Contracts throughout the year.
The Board meets regularly and, at each of its meetings, covers an extensive agenda of topics and materials and considers factors that are relevant to its annual consideration of the renewal of the fund's Advisory Contracts, including the services and support provided to the fund and its shareholders. The Board has established various standing committees, each composed of and chaired by Independent Trustees with varying backgrounds, to which the Board has assigned specific subject matter responsibilities in order to enhance effective decision-making by the Board. The Board, acting directly and through its Committees, requests and receives information concerning the annual consideration of the renewal of the fund's Advisory Contracts. The Board also meets as needed to consider matters specifically related to the Board's annual consideration of the renewal of Advisory Contracts. Members of the Board may also meet with trustees of other Fidelity funds through ad hoc joint committees to discuss certain matters relevant to the Fidelity funds.
At its July 2013 meeting, the Board, including the Independent Trustees, unanimously determined to renew the fund's Advisory Contracts. In reaching its determination, the Board considered all factors it believed relevant, including (i) the nature, extent, and quality of the services to be provided to the fund and its shareholders (including the investment performance of the fund); (ii) the competitiveness of the fund's management fee and total expense ratio relative to peer funds; (iii) the total costs of the services to be provided by and the profits to be realized by Fidelity from its relationship with the fund; (iv) the extent to which economies of scale exist and would be realized as the fund grows; and (v) whether fee levels reflect these economies of scale, if any, for the benefit of fund shareholders.
In considering whether to renew the Advisory Contracts for the fund, the Board reached a determination, with the assistance of fund counsel and Independent Trustees' counsel and through the exercise of its business judgment, that the renewal of the Advisory Contracts was in the best interests of the fund and its shareholders and that the compensation payable under the Advisory Contracts was fair and reasonable. The Board's decision to renew the Advisory Contracts was not based on any single factor, but rather was based on a comprehensive consideration of all the information provided to the Board at its meetings throughout the year. The Board, in reaching its determination to renew the Advisory Contracts, was aware that shareholders in the fund have a broad range of investment choices available to them, including a wide choice among mutual funds offered by Fidelity's competitors, and that the fund's shareholders, who have the opportunity to review and weigh the disclosure provided by the fund in its prospectus and other public disclosures, have chosen to invest in this fund, which is a part of the Fidelity family of funds.
Nature, Extent, and Quality of Services Provided. The Board considered the staffing within the investment adviser, Fidelity Management & Research Company (FMR), and the sub-advisers (together, the Investment Advisers) as it relates to the fund, including the backgrounds of the fund's investment personnel, and also considered the fund's investment objective, strategies, and related investment philosophy. The Independent Trustees also had discussions with senior management of Fidelity's investment operations and investment groups. The Board considered the structure of the portfolio manager compensation program and whether this structure provides appropriate incentives to act in the best interests of the fund.
Resources Dedicated to Investment Management and Support Services. The Board and the Fund Oversight and Research Committees reviewed the general qualifications and capabilities of the Investment Advisers' investment staff, including its size, education, experience, and resources, as well as the Investment Advisers' approach to recruiting, training, managing, and compensating investment personnel. The Board noted that FMR has continued to increase the resources devoted to non-U.S. offices, including expansion of Fidelity's global investment organization. The Board also noted that Fidelity's analysts have extensive resources, tools and capabilities that allow them to conduct sophisticated quantitative and fundamental analysis, as well as credit analysis of issuers, counterparties and guarantors. Further, the Board believes that Fidelity's investment professionals have sufficient access to global information and data so as to provide competitive investment results over time, and that those professionals also have access to sophisticated tools that permit them to assess portfolio construction and risk and performance attribution characteristics continuously, as well as to transmit new information and research conclusions rapidly around the world. Additionally, in its deliberations, the Board considered the Investment Advisers' trading and risk management capabilities and resources, which are an integral part of the investment management process.
Shareholder and Administrative Services. The Board considered (i) the nature, extent, quality, and cost of advisory, administrative, and shareholder services performed by the Investment Advisers and their affiliates under the Advisory Contracts and under separate agreements covering transfer agency, pricing and bookkeeping, and securities lending services for the fund; (ii) the nature and extent of the supervision of third party service providers, principally custodians and subcustodians; and (iii) the resources devoted to, and the record of compliance with, the fund's compliance policies and procedures. The Board also reviewed the allocation of fund brokerage, including allocations to brokers affiliated with the Investment Advisers, the use of brokerage commissions to pay fund expenses, and the use of "soft" commission dollars to pay for research services.
The Board noted that the growth of fund assets over time across the complex allows Fidelity to reinvest in the development of services designed to enhance the value or convenience of the Fidelity funds as investment vehicles. These services include 24-hour access to account information and market information through telephone representatives and over the Internet, investor education materials and asset allocation tools, and the expanded availability of Fidelity Investor Centers.
Annual Report
Board Approval of Investment Advisory Contracts and Management Fees - continued
Investment in a Large Fund Family. The Board considered the benefits to shareholders of investing in a Fidelity fund, including the benefits of investing in a fund that is part of a large family of funds offering a variety of investment disciplines and providing a large variety of mutual fund investor services. The Board noted that Fidelity had taken, or had made recommendations that resulted in the Fidelity funds taking, a number of actions over the previous year that benefited particular funds, including (i) continuing to dedicate additional resources to investment research and to the support of the senior management team that oversees asset management; (ii) persisting in efforts to enhance Fidelity's global research capabilities; (iii) launching new funds and making other enhancements to meet client needs for global and income-oriented solutions; (iv) continuing to launch dedicated lower cost underlying funds to meet portfolio construction needs related to expanding underlying fund options for Fidelity funds of funds, specifically for the Freedom Fund product lines; (v) rationalizing product lines and gaining increased efficiencies through the mergers of several funds into other funds; (vi) strengthening Fidelity's index fund offerings by reducing investment minimums and adopting or lowering existing expense caps for certain funds and classes; (vii) enhancing Global Asset Allocation product offerings by launching new funds and strategies, including "open architecture" target date funds that utilize affiliated and unaffiliated sub-advisers; (viii) modifying the eligibility criteria for Institutional Class shares of Advisor funds to increase their marketability to a portion of the defined contribution plan market; (ix) creating a new low-cost retirement share class for certain Advisor funds to appeal to large retirement plans; (x) transitioning the management of certain Fidelity commodity funds to Geode Capital Management LLC, a registered commodity pool operator, while retaining administrative responsibilities for the funds; (xi) reorganizing a number of funds; and (xii) taking steps toward establishing a new Fidelity adviser to manage sector-based funds and products.
Investment Performance. The Board considered whether the fund has operated in accordance with its investment objective, as well as its record of compliance with its investment restrictions and its performance history.
The Board took into account discussions with the Investment Advisers about fund investment performance that occur at Board meetings throughout the year. In this regard the Board noted that as part of regularly scheduled fund reviews and other reports to the Board on fund performance, the Board periodically considers annualized return information for the fund, for different time periods, measured against a securities market index ("benchmark index") and a peer group of mutual funds with similar objectives ("peer group"). In its evaluation of fund investment performance, the Board gave particular attention to information indicating changes in performance of certain Fidelity funds for specific time periods and the Investment Advisers' explanations for any overperformance or, in the case of the fund, underperformance.
In addition to reviewing absolute and relative fund performance, the Independent Trustees periodically consider the appropriateness of fund performance metrics in evaluating the results achieved. In general, the Independent Trustees believe that fund performance should be evaluated based on net performance (after fees and expenses) of both the highest performing and lowest performing classes, where applicable, compared to appropriate benchmark indices, over appropriate time periods which may include full market cycles, and compared to peer groups, as applicable, over the same periods, taking into account relevant factors including the following: general market conditions; issuer-specific information; tactical opportunities for investment; and fund cash flows and other factors.
The Independent Trustees recognize that shareholders evaluate performance on a net basis over their own holding periods, for which one-, three-, and five-year periods are used as a proxy. For this reason, the performance information reviewed by the Board also included net cumulative calendar year total return information for the fund and an appropriate benchmark index and peer group for the most recent one-, three-, and five-year periods, as shown below. Returns are shown compared to the 25th percentile (top of box) and 75th percentile (bottom of box) of the peer universe.
Annual Report
VIP High Income Portfolio

The Board has discussed the fund's underperformance with FMR and has engaged with FMR to consider what steps might be taken to remediate the fund's underperformance.
Based on its review, the Board concluded that the nature, extent, and quality of services provided to the fund under the Advisory Contracts should benefit the fund's shareholders.
Competitiveness of Management Fee and Total Expense Ratio. The Board considered the fund's management fee and total expense ratio compared to "mapped groups" of competitive funds and classes. Fidelity creates "mapped groups" by combining similar Lipper investment objective categories that have comparable management fee characteristics. Combining Lipper investment objective categories aids the Board's management fee and total expense ratio comparisons by broadening the competitive group used for comparison and by reducing the number of universes to which various Fidelity funds are compared.
Management Fee. The Board considered two proprietary management fee comparisons for the 12-month periods shown in the chart below. The group of Lipper funds used by the Board for management fee comparisons is referred to below as the "Total Mapped Group." The Total Mapped Group is broader than the Lipper peer group used by the Board for performance comparisons because the Total Mapped Group combines several Lipper investment objective categories while the Lipper peer group does not. The Total Mapped Group comparison focuses on a fund's standing in terms of gross management fees before expense reimbursements or caps relative to the total universe of funds with comparable investment mandates, regardless of whether their management fee structures also are comparable. Funds with comparable investment mandates offer exposure to similar types of securities. Funds with comparable management fee structures have similar management fee contractual arrangements (e.g., flat rate charged for advisory services, all-inclusive fee rate, etc.). "TMG %" represents the percentage of funds in the Total Mapped Group that had management fees that were lower than the fund's. For example, a TMG % of 25% means that 75% of the funds in the Total Mapped Group had higher management fees than the fund. The "Asset-Size Peer Group" (ASPG) comparison focuses on a fund's standing relative to a subset of non-Fidelity funds within the Total Mapped Group that are similar in size and management fee structure. The ASPG represents at least 15% of the funds in the Total Mapped Group with comparable asset size and management fee structures, subject to a minimum of 50 funds (or all funds in the Total Mapped Group if fewer than 50). Additional information, such as the ASPG quartile in which the fund's management fee ranked, is also included in the chart and considered by the Board.
Annual Report
Board Approval of Investment Advisory Contracts and Management Fees - continued
VIP High Income Portfolio
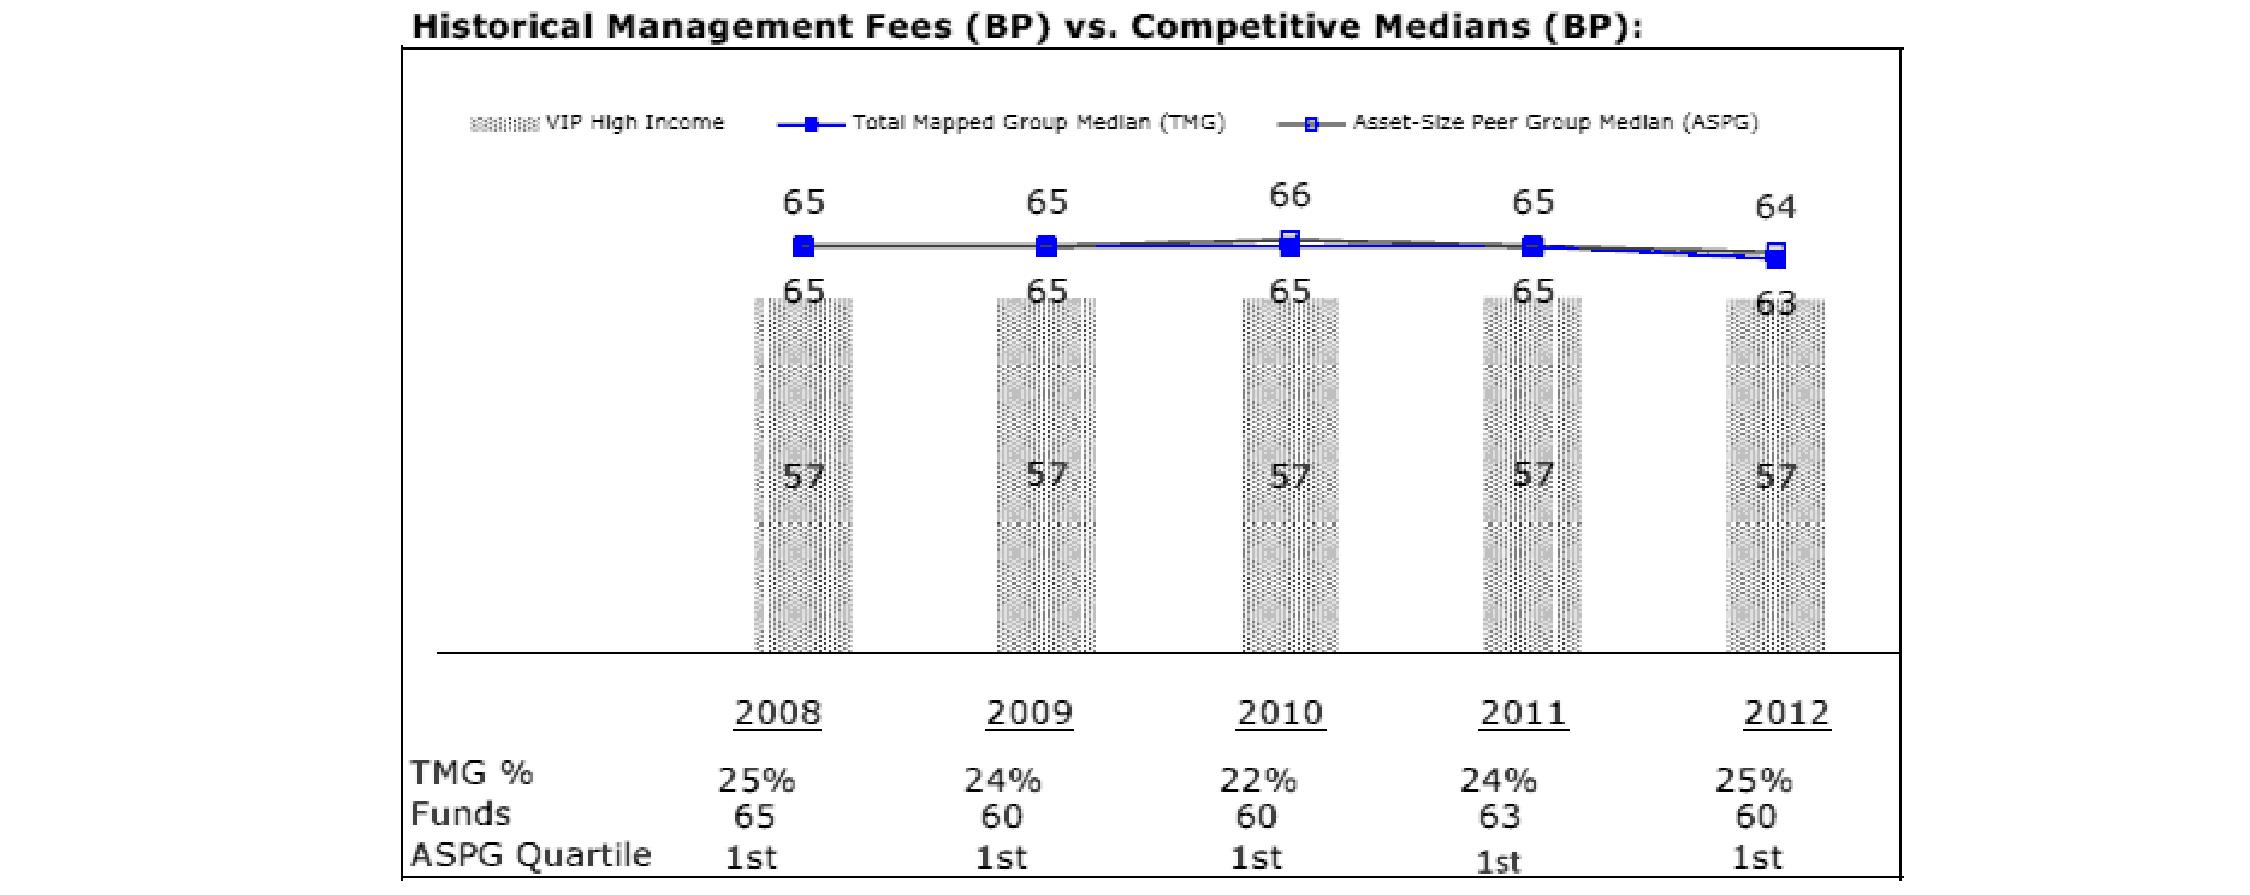
The Board noted that the fund's management fee ranked below the median of its Total Mapped Group and below the median of its ASPG for 2012.
Based on its review, the Board concluded that the fund's management fee is fair and reasonable in light of the services that the fund receives and the other factors considered.
Total Expense Ratio. In its review of each class's total expense ratio, the Board considered the fund's management fee as well as other fund or class expenses, as applicable, such as transfer agent fees, pricing and bookkeeping fees, fund-paid 12b-1 fees, and custodial, legal, and audit fees. The Board also noted the effects of any waivers and reimbursements on fees and expenses. As part of its review, the Board also considered the current and historical total expense ratios of each class of the fund compared to competitive fund median expenses. Each class of the fund is compared to those funds and classes in the Total Mapped Group (used by the Board for management fee comparisons) that have a similar sales load structure.
The Board noted that the total expense ratio of each of Initial Class, Initial Class R, Investor Class, Service Class, and Service Class R ranked below its competitive median for 2012 and the total expense ratio of each of Service Class 2 and Service Class 2 R ranked above its competitive median for 2012. The Board considered that, in general, various factors can affect total expense ratios. The Board noted that the fund offers multiple classes, each of which has a different 12b-1 fee structure, and that the multiple structures are intended to offer a range of pricing options for the intermediary market. The Board also noted that the total expense ratios of the classes vary primarily by the level of their 12b-1 fees, although differences in transfer agent fees may also cause expenses to vary from class to class.
Fees Charged to Other Fidelity Clients. The Board also considered Fidelity fee structures and other information with respect to clients of FMR and its affiliates, such as other mutual funds advised or subadvised by FMR or its affiliates, pension plan clients, and other institutional clients. The Board noted the findings of the 2013 ad hoc joint committee (created with the board of other Fidelity funds), which reviewed and compared Fidelity's institutional investment advisory business with its business of providing services to the Fidelity funds, including the differences in services provided, fees charged, and costs incurred, as well as competition in their respective marketplaces.
Based on its review of total expense ratios and fees charged to other Fidelity clients, the Board concluded that the total expense ratio of each class of the fund was reasonable, although in some cases above the median of the universe presented for comparison, in light of the services that the fund and its shareholders receive and the other factors considered.
Costs of the Services and Profitability. The Board considered the revenues earned and the expenses incurred by Fidelity in conducting the business of developing, marketing, distributing, managing, administering and servicing the fund and servicing the fund's shareholders. The Board also considered the level of Fidelity's profits in respect of all the Fidelity funds.
On an annual basis, FMR presents to the Board Fidelity's profitability for the fund. Fidelity calculates the profitability for each fund, as well as aggregate profitability for groups of Fidelity funds and all Fidelity funds, using a series of detailed revenue and cost allocation methodologies which originate with the books and records of Fidelity on which Fidelity's audited financial statements are based. The Audit Committee of the Board reviews any significant changes from the prior year's methodologies.
PricewaterhouseCoopers LLP (PwC), independent registered public accounting firm and auditor to Fidelity and certain Fidelity funds, has been engaged annually by the Board as part of the Board's assessment of Fidelity's profitability analysis. PwC's engagement includes the review and assessment of the methodologies used by Fidelity in determining the revenues and expenses attributable to Fidelity's mutual fund business, and completion of agreed-upon procedures surrounding the mathematical accuracy of fund profitability and its conformity to allocation methodologies. After considering PwC's reports issued under the engagement and information provided by Fidelity, the Board concluded that while other allocation methods may also be reasonable, Fidelity's profitability methodologies are reasonable in all material respects.
Annual Report
The Board also reviewed Fidelity's non-fund businesses and fall-out benefits related to the mutual fund business as well as cases where Fidelity's affiliates may benefit from or be related to the fund's business.
The Board considered the costs of the services provided by and the profits realized by Fidelity in connection with the operation of the fund and was satisfied that the profitability was not excessive in the circumstances.
Economies of Scale. The Board considered whether there have been economies of scale in respect of the management of the Fidelity funds, whether the Fidelity funds (including the fund) have appropriately benefited from any such economies of scale, and whether there is potential for realization of any further economies of scale. The Board considered the extent to which the fund will benefit from economies of scale through increased services to the fund, through waivers or reimbursements, or through fee or expense reductions. The Board also noted that in 2009, it and the board of other Fidelity funds created an ad hoc committee (the Economies of Scale Committee) to analyze whether FMR attains economies of scale in respect of the management and servicing of the Fidelity funds, whether the Fidelity funds have appropriately benefited from such economies of scale, and whether there is potential for realization of any further economies of scale.
The Board recognized that the fund's management contract incorporates a "group fee" structure, which provides for lower group fee rates as total fund assets under FMR's management increase, and for higher group fee rates as total fund assets under FMR's management decrease. FMR calculates the group fee rates based on a tiered asset "breakpoint" schedule that varies based on asset class. The Board considered that the group fee is designed to deliver the benefits of economies of scale to fund shareholders when total Fidelity fund assets increase, even if assets of any particular fund are unchanged or have declined, because some portion of Fidelity's costs are attributable to services provided to all Fidelity funds, and all funds benefit if those costs can be allocated among more assets. The Board concluded that, given the group fee structure, fund shareholders will benefit from lower management fees as assets under FMR's management increase at the fund complex level, regardless of whether Fidelity achieves any such economies of scale.
The Board concluded, taking into account the analysis of the Economies of Scale Committee, that economies of scale, if any, are being appropriately shared between fund shareholders and Fidelity.
Amendment to Description of Group Fee Rate. At its July 2013 meeting, the Board voted to approve an amendment to the fund's management contract to modify the description of the "group fee rate" effective August 1, 2013. The Board noted that under the prior description in the contract, the group fee rate was based on the average net assets of all registered investment companies with which FMR has management contracts. Under the contract's tiered asset breakpoint schedule, the group fee rate is lower as total fund assets under FMR's management increase, and higher as total fund assets under FMR's management decrease. The Board considered that the prior description would have excluded the assets of 64 Fidelity sector funds from the group fee rate calculation once Fidelity SelectCo, LLC, an affiliate of FMR, assumed management responsibilities for those funds. The Board noted that modifying the description of the group fee rate to continue to include the assets of those 64 funds for purposes of determining group fee rate breakpoints would avoid an immediate adverse impact on the group fee rate for any fund.
Additional Information Requested by the Board. In order to develop fully the factual basis for consideration of the Fidelity funds' Advisory Contracts, the Board requested and received additional information on certain topics, including: (i) fund performance trends and Fidelity's long-term strategies for certain funds; (ii) the potential to further rationalize the Fidelity fund lineup with the possibility of achieving savings for the funds and Fidelity; (iii) the methodology with respect to competitive fund data and peer group classifications; (iv) the arrangements with, and performance of, certain sub-advisers on behalf of the Fidelity funds, as well as certain proposed participating affiliate arrangements; (v) the realization of fall-out benefits in certain Fidelity business units; (vi) Fidelity's group fee structures, including the rationale for the individual fee rates of certain categories of funds and the definition of group assets; (vii) trends regarding industry use of performance fee structures and the performance adjustment methodologies applicable to the Fidelity funds; (viii) additional competitive analysis regarding the total expenses for certain classes; and (ix) fund profitability methodology, including Fidelity's cost allocation methodology, and the impact of certain factors on fund profitability results.
Based on its evaluation of all of the conclusions noted above, and after considering all factors it believed relevant, the Board ultimately concluded that the advisory fee structures are fair and reasonable, and that the fund's Advisory Contracts should be renewed.
Annual Report
Investment Adviser
Fidelity Management & Research Company
Boston, MA
Investment Sub-Advisers
FMR Co., Inc.
Fidelity Management & Research (U.K.) Inc.
Fidelity Management & Research (Hong Kong) Limited
Fidelity Management & Research (Japan) Inc.
General Distributor
Fidelity Distributors Corporation
Smithfield, RI
Transfer and Service Agents
Fidelity Investments Institutional Operations Company, Inc.
Boston, MA
Fidelity Service Company, Inc.
Boston, MA
Custodian
The Bank of New York Mellon
New York, NY
VIPHIR-ANN-0214
1.811842.109
Fidelity® Variable Insurance Products:
Overseas Portfolio - Class R
Annual Report
December 31, 2013
(Fidelity Cover Art)
Contents
Performance | (Click Here) | How the fund has done over time. |
Management's Discussion of Fund Performance | (Click Here) | The Portfolio Manager's review of fund performance and strategy. |
Shareholder Expense Example | (Click Here) | An example of shareholder expenses. |
Investment Changes | (Click Here) | A summary of major shifts in the fund's investments over the past six months. |
Investments | (Click Here) | A complete list of the fund's investments with their market values. |
Financial Statements | (Click Here) | Statements of assets and liabilities, operations, and changes in net assets, as well as financial highlights. |
Notes | (Click Here) | Notes to the financial statements. |
Report of Independent Registered Public Accounting Firm | (Click Here) | |
Trustees and Officers | (Click Here) | |
Distributions | (Click Here) | |
Board Approval of Investment Advisory Contracts and Management Fees | (Click Here) | |
To view a fund's proxy voting guidelines and proxy voting record for the 12-month period ended June 30, visit http://www.fidelity.com/proxyvotingresults or visit the Securities and Exchange Commission's (SEC) web site at http://www.sec.gov. You may also call 1-877-208-0098 to request a free copy of the proxy voting guidelines.
Fidelity Variable Insurance Products are separate account options which are purchased through a variable insurance contract.
Standard & Poor's, S&P and S&P 500 are registered service marks of The McGraw-Hill Companies, Inc. and have been licensed for use by Fidelity Distributors Corporation.
Other third-party marks appearing herein are the property of their respective owners.
All other marks appearing herein are registered or unregistered trademarks or service marks of FMR LLC or an affiliated company. © 2014 FMR LLC. All rights reserved.
This report and the financial statements contained herein are submitted for the general information of the shareholders of the fund. This report is not authorized for distribution to prospective investors in the fund unless preceded or accompanied by an effective prospectus.
A fund files its complete schedule of portfolio holdings with the SEC for the first and third quarters of each fiscal year on Form N-Q. Forms N-Q are available on the SEC's web site at http://www.sec.gov. A fund's Forms N-Q may be reviewed and copied at the SEC's Public Reference Room in Washington, DC. Information regarding the operation of the SEC's Public Reference Room may be obtained by calling 1-800-SEC-0330. For a complete list of a fund's portfolio holdings, view the most recent holdings listing, semiannual report, or annual report on Fidelity's web site at http://www.fidelity.com, http://www.advisor.fidelity.com, or http://www.401k.com, as applicable.
NOT FDIC INSURED • MAY LOSE VALUE • NO BANK GUARANTEE
Neither the fund nor Fidelity Distributors Corporation is a bank.
Annual Report
Average annual total return reflects the change in the value of an investment, assuming reinvestment of the class' distributions from dividend income and capital gains (the profits earned upon the sale of securities that have grown in value, if any) and assuming a constant rate of performance each year. During periods of reimbursement by Fidelity, a fund's total return will be greater than it would be had the reimbursement not occurred. Performance numbers are net of all underlying fund operating expenses, but do not include any insurance charges imposed by your insurance company's separate account. If performance information included the effect of these additional charges, the total returns would have been lower. How a fund did yesterday is no guarantee of how it will do tomorrow.
Average Annual Total Returns
Periods ended December 31, 2013 | Past 1
year | Past 5
years | Past 10
years |
VIP Overseas Portfolio - Initial Class R | 30.45% | 13.31% | 7.00% |
VIP Overseas Portfolio - Service Class R | 30.30% | 13.20% | 6.89% |
VIP Overseas Portfolio - Service Class 2R | 30.15% | 13.02% | 6.73% |
VIP Overseas Portfolio - Investor Class R A | 30.40% | 13.21% | 6.91% |
A The initial offering of Investor Class R shares took place on July 21, 2005. Returns prior to July 21, 2005 are those of Initial Class. Had Investor Class R's transfer agent fee been reflected, returns prior to July 21, 2005 would have been lower.
$10,000 Over 10 Years
Let's say hypothetically that $10,000 was invested in VIP Overseas Portfolio - Initial Class R on December 31, 2003. The chart shows how the value of your investment would have changed, and also shows how the MSCI® EAFE® Index performed over the same period.
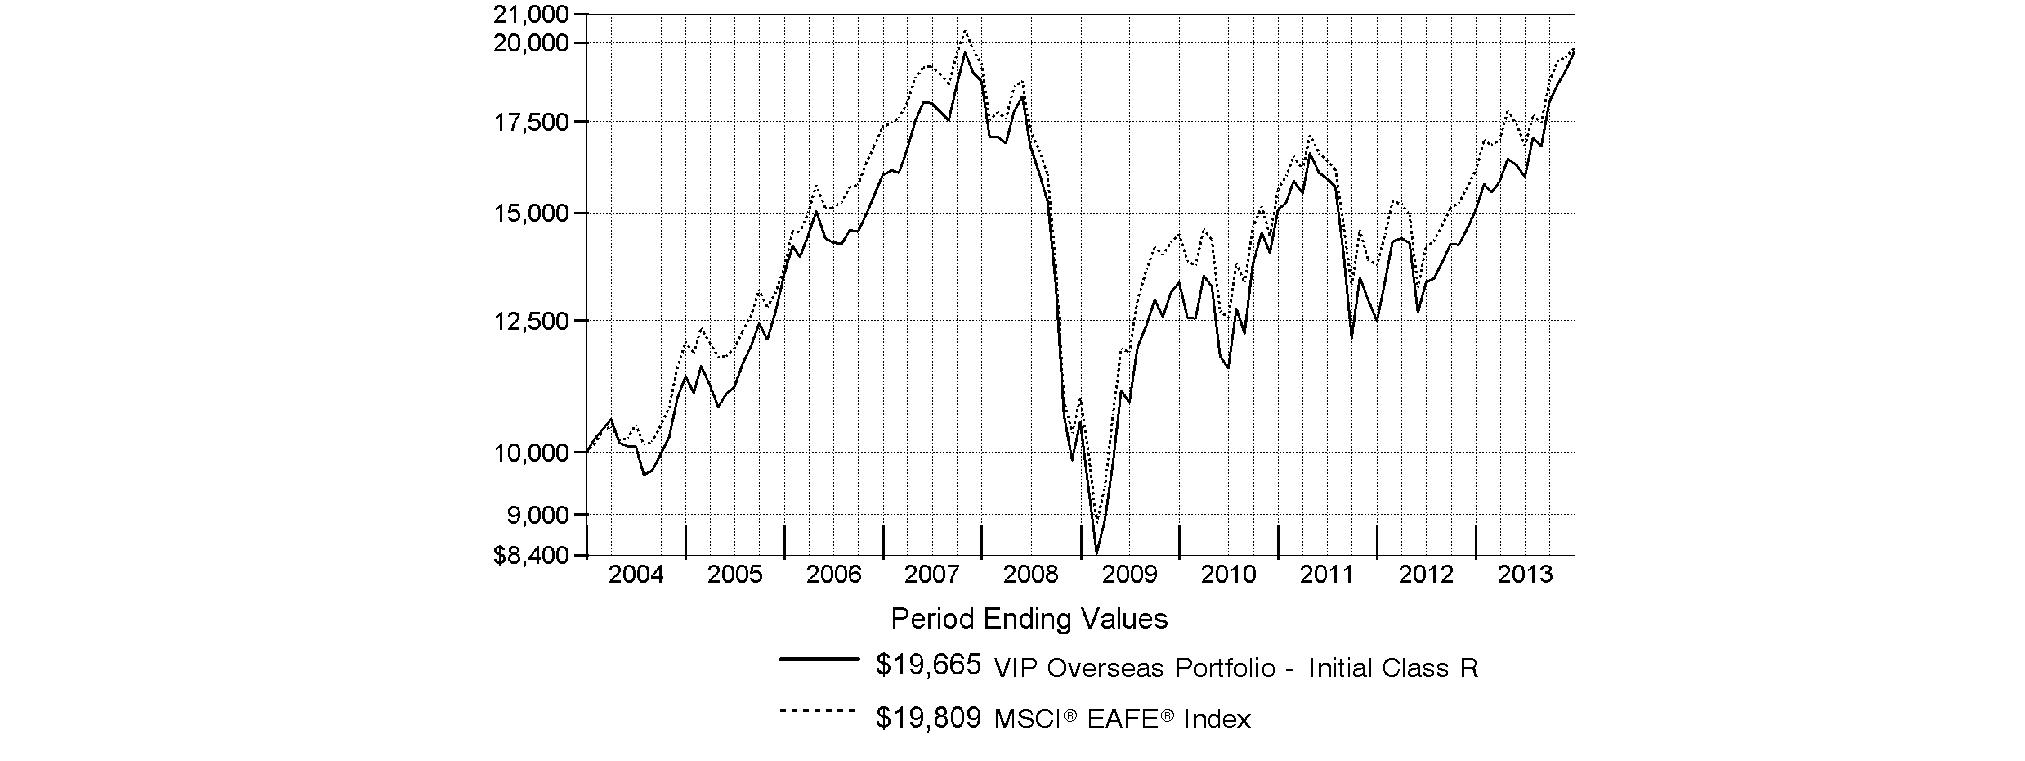
Annual Report
Market Recap: Global equity markets remained upbeat for the 12 months ending December 31, 2013, propelling the MSCI® ACWI® (All Country World Index) Index to a 23.24% return. Midyear turbulence gave way by autumn when policymakers in the U.S. and China had made clear their intentions to maintain accommodative monetary policies. That stance, combined with modest cyclical improvement around the globe and generally low valuations, underpinned the broad rally in equities, although the relative strength of the U.S. dollar generally tempered gains for U.S. investors holding foreign securities based in local currencies. During the period, the broad-market S&P 500® Index set a series of new highs, finishing the year up 32.39%. For the first time since 1995, the S&P® scored a "perfect 10," with all 10 economic sectors gaining at least 10% for the year. A resurgence in growth-oriented stocks lifted the Nasdaq Composite Index® to a 40.12% result for 2013, while the blue-chip Dow Jones Industrial AverageSM notched a relatively more modest 29.65% gain. International developed-markets equities rose in concert with their U.S. counterparts, with the MSCI® EAFE® Index gaining 22.92% for the period. Meanwhile, foreign exchange and commodity weakness curbed results in resource-heavy emerging markets (EM), especially in the year's waning months. More generally, concern over EM's slowing growth, its declining share of global trade and uncertainty surrounding U.S. central bank intentions were all factors hampering performance. The MSCI Emerging Markets Index returned -2.27% for the period. On the bond side, U.S. high-yield securities rallied with equities for much of the period, with The BofA Merrill LynchSM US High Yield Constrained Index returning 7.41% for 2013. The more rate-sensitive U.S. investment-grade bond category faced headwinds though, as reflected in the -2.02% return of The Barclays® U.S. Aggregate Bond Index. Within the Barclays index, investment-grade corporate credit returned -2.01%, while ultra-safe U.S. Treasuries saw a -2.75% result. Major non-U.S. developed markets performed only slightly better, with the Citigroup® Non-USD Group-of-Seven (G7) Equal Weighted Index logging a -1.59% result. After several years of strong advances, EM debt reversed course in 2013, with the J.P. Morgan Emerging Markets Bond Index Global returning -6.58%.
Comments from Graeme Rockett, Portfolio Manager of VIP Overseas Portfolio: For the year, fund's share classes easily outpaced the 22.92% advance of the MSCI® EAFE® Index. (For specific portfolio results, please refer to the performance section of this report.) Versus the index, the fund found success among many Internet-related and e-commerce stocks, most notably SouFun Holdings, China's leading residential real estate Internet portal. Japanese telecommunications firm SoftBank also provided a nice boost to relative performance, as did a stake in U.K.-based online apparel retailer ASOS, where I saw long-term growth potential but began to trim my position once its share price exceeded my target. Conversely, it hurt to hold Hengdeli Holdings, a China-based retailer of high-end Swiss watches, but I remain committed to investing in luxury goods firms. Ireland-based alcoholic beverage producer C&C Group weighed on relative performance, as shares fell this period amid consecutive quarters of weak financial results. Many of the stocks I've mentioned were not in the index.
The views expressed above reflect those of the portfolio manager(s) only through the end of the period as stated on the cover of this report and do not necessarily represent the views of Fidelity or any other person in the Fidelity organization. Any such views are subject to change at any time based upon market or other conditions and Fidelity disclaims any responsibility to update such views. These views may not be relied on as investment advice and, because investment decisions for a Fidelity fund are based on numerous factors, may not be relied on as an indication of trading intent on behalf of any Fidelity fund.
Annual Report
As a shareholder of the Fund, you incur two types of costs: (1) transaction costs, including redemption fees and (2) ongoing costs, including management fees, distribution and/or service (12b-1) fees and other Fund expenses. This Example is intended to help you understand your ongoing costs (in dollars) of investing in the Fund and to compare these costs with the ongoing costs of investing in other mutual funds.
The Example is based on an investment of $1,000 invested at the beginning of the period and held for the entire period (July 1, 2013 to December 31, 2013).
Actual Expenses
The first line of the accompanying table for each class of the Fund provides information about actual account values and actual expenses. You may use the information in this line, together with the amount you invested, to estimate the expenses that you paid over the period. Simply divide your account value by $1,000.00 (for example, an $8,600 account value divided by $1,000.00 = 8.6), then multiply the result by the number in the first line for a class of the Fund under the heading entitled "Expenses Paid During Period" to estimate the expenses you paid on your account during this period. The estimate of expenses does not include any fees or other expenses of any variable annuity or variable life insurance product. If they were, the estimate of expenses you paid during the period would be higher, and your ending account value would be lower. In addition, the Fund, as a shareholder in the underlying Fidelity Central Funds, will indirectly bear its pro-rata share of the fees and expenses incurred by the underlying Fidelity Central Funds. These fees and expenses are not included in the Fund's annualized expense ratio used to calculate the expense estimate in the table below.
Hypothetical Example for Comparison Purposes
The second line of the accompanying table for each class of the Fund provides information about hypothetical account values and hypothetical expenses based on a Class' actual expense ratio and an assumed rate of return of 5% per year before expenses, which is not the Class' actual return. The hypothetical account values and expenses may not be used to estimate the actual ending account balance or expenses you paid for the period. You may use this information to compare the ongoing costs of investing in the Fund and other funds. To do so, compare this 5% hypothetical example with the 5% hypothetical examples that appear in the shareholder reports of the other funds. The estimate of expenses does not include any fees or other expenses of any variable annuity or variable life insurance product. If they were, the estimate of expenses you paid during the period would be higher, and your ending account value would be lower. In addition, the Fund, as a shareholder in the underlying Fidelity Central Funds, will indirectly bear its pro-rata share of the fees and expenses incurred by the underlying Fidelity Central Funds. These fees and expenses are not included in the Fund's annualized expense ratio used to calculate the expense estimate in the table below.
Please note that the expenses shown in the table are meant to highlight your ongoing costs only and do not reflect any transaction costs. Therefore, the second line of the table is useful in comparing ongoing costs only, and will not help you determine the relative total costs of owning different funds. In addition, if these transactional costs were included, your costs would have been higher.
| Annualized
Expense Ratio B | Beginning
Account Value
July 1, 2013 | Ending
Account Value
December 31, 2013 | Expenses Paid
During Period*
July 1, 2013
to December 31, 2013 |
Initial Class | .83% | | | |
Actual | | $ 1,000.00 | $ 1,233.10 | $ 4.67 |
HypotheticalA | | $ 1,000.00 | $ 1,021.02 | $ 4.23 |
Service Class | .93% | | | |
Actual | | $ 1,000.00 | $ 1,233.00 | $ 5.23 |
HypotheticalA | | $ 1,000.00 | $ 1,020.52 | $ 4.74 |
Service Class 2 | 1.08% | | | |
Actual | | $ 1,000.00 | $ 1,232.10 | $ 6.08 |
HypotheticalA | | $ 1,000.00 | $ 1,019.76 | $ 5.50 |
Initial Class R | .83% | | | |
Actual | | $ 1,000.00 | $ 1,233.80 | $ 4.67 |
HypotheticalA | | $ 1,000.00 | $ 1,021.02 | $ 4.23 |
Service Class R | .93% | | | |
Actual | | $ 1,000.00 | $ 1,232.90 | $ 5.23 |
HypotheticalA | | $ 1,000.00 | $ 1,020.52 | $ 4.74 |
Service Class 2R | 1.08% | | | |
Actual | | $ 1,000.00 | $ 1,232.10 | $ 6.08 |
HypotheticalA | | $ 1,000.00 | $ 1,019.76 | $ 5.50 |
Investor Class R | .91% | | | |
Actual | | $ 1,000.00 | $ 1,233.20 | $ 5.12 |
HypotheticalA | | $ 1,000.00 | $ 1,020.62 | $ 4.63 |
A 5% return per year before expenses
B Annualized expense ratio reflects expenses net of applicable fee waivers.
* Expenses are equal to each Class' annualized expense ratio, multiplied by the average account value over the period, multiplied by 184/365 (to reflect the one-half year period).
Annual Report
Investment Changes (Unaudited)
Geographic Diversification (% of fund's net assets) |
As of December 31, 2013 |
| Japan | 18.9% | |
| United Kingdom | 17.1% | |
| United States of America* | 8.0% | |
| France | 7.9% | |
| Cayman Islands | 7.9% | |
| Switzerland | 7.2% | |
| Germany | 5.5% | |
| Sweden | 3.2% | |
| Ireland | 3.1% | |
| Other | 21.2% | |

Percentages are based on country or territory of incorporation and are adjusted for the effect of futures contracts, if applicable. |
* Includes Short-Term Investments and Net Other Assets. |
As of June 30, 2013 |
| Japan | 20.9% | |
| United Kingdom | 20.4% | |
| France | 10.1% | |
| Switzerland | 7.8% | |
| Germany | 5.8% | |
| United States of America* | 5.7% | |
| Cayman Islands | 4.1% | |
| Ireland | 3.4% | |
| Australia | 3.2% | |
| Other | 18.6% | |

Percentages are based on country or territory of incorporation and are adjusted for the effect of futures contracts, if applicable. |
* Includes Short-Term Investments and Net Other Assets. |
Asset Allocation as of December 31, 2013 |
| % of fund's
net assets | % of fund's net assets
6 months ago |
Stocks | 98.1 | 99.6 |
Short-Term Investments and Net Other Assets (Liabilities) | 1.9 | 0.4 |
Top Ten Stocks as of December 31, 2013 |
| % of fund's
net assets | % of fund's net assets
6 months ago |
Nestle SA (Switzerland, Food Products) | 2.2 | 2.8 |
SoftBank Corp. (Japan, Wireless Telecommunication Services) | 2.1 | 1.8 |
Sanofi SA (France, Pharmaceuticals) | 2.0 | 2.4 |
Rakuten, Inc. (Japan, Internet & Catalog Retail) | 1.6 | 1.5 |
Naspers Ltd. Class N (South Africa, Media) | 1.6 | 0.3 |
SouFun Holdings Ltd. ADR (Cayman Islands, Internet Software & Services) | 1.5 | 0.6 |
Investment AB Kinnevik (B Shares) (Sweden, Diversified Financial Services) | 1.4 | 0.7 |
Tencent Holdings Ltd. (Cayman Islands, Internet Software & Services) | 1.4 | 1.3 |
Toyota Motor Corp. (Japan, Automobiles) | 1.4 | 1.7 |
ORIX Corp. (Japan, Diversified Financial Services) | 1.3 | 1.3 |
| 16.5 | |
Market Sectors as of December 31, 2013 |
| % of fund's
net assets | % of fund's net assets
6 months ago |
Consumer Discretionary | 27.2 | 24.0 |
Financials | 18.8 | 19.3 |
Information Technology | 15.0 | 12.3 |
Consumer Staples | 11.4 | 14.2 |
Industrials | 7.3 | 8.3 |
Health Care | 7.1 | 8.9 |
Materials | 5.6 | 6.2 |
Energy | 3.1 | 3.6 |
Telecommunication Services | 2.6 | 2.1 |
Utilities | 0.0 | 0.7 |
Annual Report
Investments December 31, 2013
Showing Percentage of Net Assets
Common Stocks - 96.7% |
| Shares | | Value |
Australia - 2.4% |
BHP Billiton Ltd. | 318,002 | | $ 10,841,624 |
Carsales.com Ltd. | 320,637 | | 2,917,364 |
CSL Ltd. | 169,506 | | 10,437,228 |
Fortescue Metals Group Ltd. | 258,379 | | 1,342,712 |
G8 Education Ltd. | 2,091,458 | | 5,901,183 |
iSelect Ltd. | 3,599,772 | | 4,644,572 |
Macquarie Group Ltd. | 99,742 | | 4,895,608 |
Rio Tinto Ltd. | 24,301 | | 1,479,394 |
Sydney Airport unit | 105,682 | | 358,581 |
TOTAL AUSTRALIA | | 42,818,266 |
Bailiwick of Jersey - 1.6% |
Experian PLC | 233,300 | | 4,303,751 |
Glencore Xstrata PLC | 1,246,535 | | 6,454,752 |
Informa PLC | 813,663 | | 7,727,254 |
WPP PLC | 478,707 | | 10,939,465 |
TOTAL BAILIWICK OF JERSEY | | 29,425,222 |
Belgium - 0.8% |
Ageas | 66,760 | | 2,842,502 |
Anheuser-Busch InBev SA NV | 33,577 | | 3,570,453 |
Hamon & Compagnie International SA (a)(d) | 62,254 | | 1,291,494 |
KBC Groupe SA | 31,157 | | 1,768,086 |
UCB SA | 72,400 | | 5,392,381 |
TOTAL BELGIUM | | 14,864,916 |
Bermuda - 0.7% |
Clear Media Ltd. | 2,035,000 | | 1,742,569 |
Oriental Watch Holdings Ltd. | 7,028,000 | | 1,857,988 |
Signet Jewelers Ltd. | 111,400 | | 8,767,180 |
TOTAL BERMUDA | | 12,367,737 |
Brazil - 0.7% |
Anhanguera Educacional Participacoes SA | 579,300 | | 3,691,535 |
Cielo SA | 301,440 | | 8,463,555 |
TOTAL BRAZIL | | 12,155,090 |
British Virgin Islands - 0.8% |
Gem Diamonds Ltd. (a) | 802,019 | | 1,929,070 |
Mail.Ru Group Ltd.: | | | |
GDR (e) | 6,600 | | 294,360 |
GDR (Reg. S) | 265,500 | | 11,841,300 |
TOTAL BRITISH VIRGIN ISLANDS | | 14,064,730 |
Canada - 0.3% |
Bauer Performance Sports Ltd. (a) | 55,161 | | 735,826 |
Entertainment One Ltd. (a) | 1,114,000 | | 4,781,536 |
TOTAL CANADA | | 5,517,362 |
Cayman Islands - 7.9% |
500 Com Ltd. sponsored ADR Class A | 74,744 | | 2,643,695 |
51job, Inc. sponsored ADR (a) | 36,000 | | 2,804,400 |
|
| Shares | | Value |
58.com, Inc. ADR | 167,200 | | $ 6,410,448 |
Autohome, Inc. ADR Class A | 39,900 | | 1,459,941 |
Baidu.com, Inc. sponsored ADR (a) | 94,500 | | 16,809,660 |
Biostime International Holdings Ltd. | 930,000 | | 8,293,399 |
Bitauto Holdings Ltd. ADR (a)(d) | 225,900 | | 7,219,764 |
Cimc Enric Holdings Ltd. | 2,430,000 | | 3,917,181 |
Fu Shou Yuan International Group Ltd. | 1,743,000 | | 1,153,114 |
Greatview Aseptic Pack Co. Ltd. | 4,056,000 | | 2,395,636 |
Hengdeli Holdings Ltd. | 33,689,800 | | 7,950,729 |
Home Inns & Hotels Management, Inc. sponsored ADR (a) | 41,000 | | 1,789,240 |
New Oriental Education & Technology Group, Inc. sponsored ADR | 137,500 | | 4,331,250 |
Noah Holdings Ltd. sponsored ADR (d) | 186,400 | | 3,355,200 |
Qunar Cayman Islands Ltd. sponsored ADR | 36,800 | | 976,304 |
Shenguan Holdings Group Ltd. | 2,636,000 | | 1,176,194 |
SouFun Holdings Ltd. ADR | 340,400 | | 28,052,364 |
Springland International Holdings Ltd. | 3,796,000 | | 1,953,244 |
Sungy Mobile Ltd. ADR | 79,400 | | 1,622,142 |
Tencent Holdings Ltd. | 396,900 | | 25,315,856 |
Vipshop Holdings Ltd. ADR (a) | 55,200 | | 4,619,136 |
WuXi PharmaTech Cayman, Inc. sponsored ADR (a) | 129,800 | | 4,981,724 |
Youku Tudou, Inc. ADR (a)(d) | 96,000 | | 2,908,800 |
TOTAL CAYMAN ISLANDS | | 142,139,421 |
China - 0.2% |
Travelsky Technology Ltd. (H Shares) | 2,837,000 | | 2,798,841 |
Denmark - 1.3% |
Danske Bank A/S (a) | 96,100 | | 2,204,571 |
Novo Nordisk A/S: | | | |
Series B | 16,125 | | 2,956,602 |
Series B sponsored ADR | 104,300 | | 19,270,468 |
TOTAL DENMARK | | 24,431,641 |
France - 7.9% |
AXA SA | 95,620 | | 2,658,513 |
AXA SA sponsored ADR | 135,400 | | 3,776,306 |
Beneteau SA (a) | 196,900 | | 3,675,778 |
BNP Paribas SA | 137,903 | | 10,747,250 |
Bollore (d) | 6,408 | | 3,761,127 |
Bollore (a) | 34 | | 19,551 |
Danone SA | 174,112 | | 12,531,994 |
Edenred SA | 116,400 | | 3,895,999 |
Gameloft Se (a) | 537,900 | | 6,060,510 |
Havas SA | 637,700 | | 5,249,667 |
Iliad SA | 19,126 | | 3,917,803 |
Ipsos SA | 134,292 | | 5,749,280 |
LVMH Moet Hennessy - Louis Vuitton SA | 95,996 | | 17,511,381 |
Pernod Ricard SA | 80,600 | | 9,182,090 |
Safran SA | 110,900 | | 7,706,065 |
Sanofi SA | 139,290 | | 14,875,467 |
Sanofi SA sponsored ADR | 386,922 | | 20,750,627 |
Common Stocks - continued |
| Shares | | Value |
France - continued |
Societe Generale Series A | 86,251 | | $ 5,009,635 |
Total SA | 87,900 | | 5,395,255 |
TOTAL FRANCE | | 142,474,298 |
Germany - 4.1% |
adidas AG | 78,800 | | 10,042,654 |
Allianz SE | 74,132 | | 13,293,535 |
Axel Springer Verlag AG | 148,700 | | 9,553,260 |
Bayer AG | 118,678 | | 16,644,900 |
Commerzbank AG (a) | 55,520 | | 894,397 |
Deutsche Bank AG | 58,446 | | 2,807,829 |
Linde AG | 23,487 | | 4,912,898 |
SAP AG | 165,366 | | 14,340,814 |
SAP AG sponsored ADR (d) | 16,200 | | 1,411,668 |
TOTAL GERMANY | | 73,901,955 |
Hong Kong - 1.3% |
AIA Group Ltd. | 2,299,400 | | 11,535,104 |
Television Broadcasts Ltd. | 1,659,300 | | 11,095,096 |
TOTAL HONG KONG | | 22,630,200 |
Ireland - 3.1% |
C&C Group PLC | 3,275,800 | | 19,152,702 |
CRH PLC | 423,883 | | 10,742,006 |
Glanbia PLC | 451,000 | | 6,986,162 |
Kingspan Group PLC (United Kingdom) | 573,400 | | 10,491,391 |
Paddy Power PLC (Ireland) | 97,900 | | 8,350,224 |
TOTAL IRELAND | | 55,722,485 |
Isle of Man - 0.3% |
Playtech Ltd. | 436,355 | | 5,325,430 |
Israel - 0.5% |
Rami Levi Chain Stores Hashikma Marketing 2006 Ltd. | 80,100 | | 4,378,738 |
SodaStream International Ltd. (a)(d) | 76,800 | | 3,812,352 |
TOTAL ISRAEL | | 8,191,090 |
Italy - 1.4% |
Assicurazioni Generali SpA | 158,500 | | 3,728,628 |
Eni SpA | 169,700 | | 4,100,574 |
Eni SpA sponsored ADR (d) | 67,900 | | 3,292,471 |
Lottomatica SpA | 82,800 | | 2,524,200 |
Moleskine SpA (d) | 1,277,502 | | 2,811,935 |
Tod's SpA (d) | 52,281 | | 8,731,449 |
TOTAL ITALY | | 25,189,257 |
Japan - 18.9% |
Cosmos Pharmaceutical Corp. | 119,600 | | 12,977,009 |
Daiwa Securities Group, Inc. | 490,000 | | 4,907,619 |
DENSO Corp. | 87,400 | | 4,617,228 |
Dentsu, Inc. | 431,700 | | 17,655,940 |
East Japan Railway Co. | 43,300 | | 3,449,183 |
Fuji Media Holdings, Inc. | 161,900 | | 3,315,541 |
|
| Shares | | Value |
Hitachi Ltd. | 2,281,000 | | $ 17,294,888 |
Honda Motor Co. Ltd. | 325,800 | | 13,448,088 |
Japan Tobacco, Inc. | 301,600 | | 9,813,689 |
JTEKT Corp. | 219,800 | | 3,750,429 |
Kakaku.com, Inc. | 439,800 | | 7,725,710 |
Keyence Corp. | 35,520 | | 15,209,143 |
Mitsubishi Corp. | 357,000 | | 6,853,658 |
Mitsubishi Electric Corp. | 750,000 | | 9,430,844 |
Mitsubishi UFJ Financial Group, Inc. | 2,528,400 | | 16,787,050 |
Mitsubishi UFJ Financial Group, Inc. sponsored ADR (d) | 489,200 | | 3,267,856 |
MS&AD Insurance Group Holdings, Inc. | 177,500 | | 4,771,018 |
NEXT Co. Ltd. (d) | 579,300 | | 6,154,375 |
Nomura Holdings, Inc. | 505,000 | | 3,902,545 |
Nomura Holdings, Inc. sponsored ADR | 57,600 | | 447,552 |
ORIX Corp. | 1,385,200 | | 24,340,553 |
Pigeon Corp. | 35,100 | | 1,702,334 |
Rakuten, Inc. | 1,957,800 | | 29,217,095 |
Shinsei Bank Ltd. | 679,000 | | 1,662,127 |
Ship Healthcare Holdings, Inc. | 97,600 | | 3,789,925 |
SMC Corp. | 21,000 | | 5,300,159 |
SoftBank Corp. | 422,300 | | 37,057,146 |
Start Today Co. Ltd. | 252,200 | | 6,271,082 |
Sumitomo Mitsui Financial Group, Inc. | 315,600 | | 16,412,267 |
Suzuki Motor Corp. | 128,100 | | 3,451,864 |
THK Co. Ltd. | 158,500 | | 3,958,626 |
Tokio Marine Holdings, Inc. | 136,600 | | 4,571,959 |
Toshiba Corp. | 672,000 | | 2,828,995 |
Toyota Motor Corp. | 314,000 | | 19,146,177 |
Toyota Motor Corp. sponsored ADR (d) | 47,500 | | 5,791,200 |
Yahoo! Japan Corp. | 1,840,100 | | 10,261,136 |
TOTAL JAPAN | | 341,542,010 |
Korea (South) - 0.9% |
Hotel Shilla Co. | 105,951 | | 6,673,839 |
Naver Corp. | 6,120 | | 4,197,000 |
Samsung Electronics Co. Ltd. | 4,728 | | 6,144,416 |
TOTAL KOREA (SOUTH) | | 17,015,255 |
Netherlands - 1.7% |
AEGON NV | 259,400 | | 2,458,212 |
ASML Holding NV | 34,111 | | 3,196,201 |
ING Groep NV (Certificaten Van Aandelen) (a) | 487,184 | | 6,805,248 |
Koninklijke Philips Electronics NV | 304,416 | | 11,208,963 |
Yandex NV (a) | 179,400 | | 7,741,110 |
TOTAL NETHERLANDS | | 31,409,734 |
Nigeria - 0.2% |
Guinness Nigeria PLC (a) | 941,861 | | 1,389,679 |
Nigerian Breweries PLC (a) | 1,827,733 | | 1,918,577 |
TOTAL NIGERIA | | 3,308,256 |
Norway - 1.5% |
DNB ASA | 447,800 | | 8,010,535 |
Common Stocks - continued |
| Shares | | Value |
Norway - continued |
Schibsted ASA (B Shares) | 271,000 | | $ 17,925,774 |
Statoil ASA | 14,100 | | 342,863 |
Statoil ASA sponsored ADR | 30,700 | | 740,791 |
TOTAL NORWAY | | 27,019,963 |
Philippines - 0.6% |
Alliance Global Group, Inc. | 9,464,300 | | 5,499,526 |
Melco Crown Philippines Resort (a) | 18,428,700 | | 5,678,032 |
TOTAL PHILIPPINES | | 11,177,558 |
South Africa - 1.9% |
Clicks Group Ltd. | 680,633 | | 4,074,065 |
Life Healthcare Group Holdings Ltd. | 621,600 | | 2,480,474 |
Naspers Ltd. Class N | 271,400 | | 28,356,255 |
TOTAL SOUTH AFRICA | | 34,910,794 |
Spain - 1.4% |
Antena 3 de Television SA | 483,400 | | 7,993,461 |
Banco Bilbao Vizcaya Argentaria SA | 592,060 | | 7,324,104 |
Banco Santander SA (Spain) | 328,166 | | 2,951,033 |
Grifols SA ADR | 189,000 | | 6,826,680 |
TOTAL SPAIN | | 25,095,278 |
Sweden - 3.2% |
Eniro AB (a) | 548,800 | | 4,231,285 |
Investment AB Kinnevik (B Shares) | 566,000 | | 26,215,070 |
Nordea Bank AB | 608,800 | | 8,201,765 |
Svenska Cellulosa AB (SCA) (B Shares) | 518,300 | | 15,955,503 |
Swedbank AB (A Shares) | 102,432 | | 2,882,560 |
TOTAL SWEDEN | | 57,486,183 |
Switzerland - 7.2% |
Compagnie Financiere Richemont SA Series A | 136,086 | | 13,546,816 |
Credit Suisse Group AG | 269,341 | | 8,312,773 |
Credit Suisse Group AG sponsored ADR (d) | 61,252 | | 1,901,262 |
Julius Baer Group Ltd. | 55,980 | | 2,688,395 |
Nestle SA | 530,327 | | 38,867,698 |
Sika AG (Bearer) | 2,410 | | 8,566,908 |
Swatch Group AG (Bearer) | 29,240 | | 19,322,886 |
Swiss Re Ltd. | 46,826 | | 4,307,016 |
Syngenta AG (Switzerland) | 38,450 | | 15,329,905 |
UBS AG | 591,162 | | 11,319,188 |
UBS AG (NY Shares) | 184,900 | | 3,559,325 |
Zurich Insurance Group AG | 11,638 | | 3,372,482 |
TOTAL SWITZERLAND | | 131,094,654 |
Taiwan - 0.4% |
MediaTek, Inc. | 323,000 | | 4,801,988 |
Wowprime Corp. | 191,300 | | 3,174,279 |
TOTAL TAIWAN | | 7,976,267 |
|
| Shares | | Value |
Thailand - 0.3% |
Thai Beverage PCL | 12,231,000 | | $ 5,233,757 |
United Kingdom - 17.1% |
Aberdeen Asset Management PLC | 840,800 | | 6,961,614 |
Alabama Noor Hospitals Group PLC (a) | 121,600 | | 1,807,238 |
Anglo American PLC ADR | 96,800 | | 1,054,152 |
ASOS PLC (a) | 54,700 | | 5,547,148 |
Aviva PLC | 329,400 | | 2,464,391 |
Barclays PLC | 2,571,808 | | 11,629,414 |
Barclays PLC sponsored ADR | 199,250 | | 3,612,403 |
BG Group PLC | 408,438 | | 8,775,679 |
BHP Billiton PLC | 357,097 | | 11,080,692 |
BP PLC | 464,793 | | 3,766,736 |
Brammer PLC (d) | 1,085,200 | | 8,086,666 |
Burberry Group PLC | 325,500 | | 8,171,418 |
Dechra Pharmaceuticals PLC | 159,300 | | 1,853,145 |
Diageo PLC | 524,328 | | 17,375,485 |
Dunelm Group PLC | 464,300 | | 6,919,718 |
Foxtons Group PLC | 435,300 | | 2,396,776 |
GlaxoSmithKline PLC | 447,200 | | 11,948,061 |
Hays PLC | 2,206,800 | | 4,743,347 |
HSBC Holdings PLC: | | | |
(United Kingdom) | 929,678 | | 10,202,430 |
sponsored ADR | 252,732 | | 13,933,115 |
ITV PLC | 2,806,800 | | 9,016,966 |
Johnson Matthey PLC | 154,198 | | 8,375,289 |
Legal & General Group PLC | 814,483 | | 3,003,651 |
Lloyds Banking Group PLC (a) | 11,162,744 | | 14,647,619 |
Merlin Entertainments PLC (a) | 111,800 | | 661,858 |
Perform Group PLC (a) | 726,600 | | 2,695,198 |
Prudential PLC | 271,361 | | 6,063,294 |
Reckitt Benckiser Group PLC | 111,600 | | 8,857,657 |
Rightmove PLC | 63,200 | | 2,867,575 |
Rio Tinto PLC | 142,915 | | 8,076,079 |
Rio Tinto PLC sponsored ADR (d) | 34,900 | | 1,969,407 |
Rolls-Royce Group PLC | 322,708 | | 6,813,451 |
Royal Bank of Scotland Group PLC (a) | 255,480 | | 1,438,816 |
Royal Dutch Shell PLC: | | | |
Class A (United Kingdom) | 444,744 | | 15,938,859 |
Class B (United Kingdom) | 380,537 | | 14,353,927 |
Royal Mail PLC | 117,700 | | 1,110,960 |
SABMiller PLC | 351,000 | | 18,024,204 |
Standard Chartered PLC (United Kingdom) | 263,560 | | 5,935,614 |
Sthree PLC | 229,400 | | 1,372,298 |
Taylor Wimpey PLC | 2,474,500 | | 4,568,878 |
Travis Perkins PLC | 469,800 | | 14,563,511 |
Vodafone Group PLC | 1,384,000 | | 5,449,076 |
William Hill PLC | 1,702,144 | | 11,328,216 |
TOTAL UNITED KINGDOM | | 309,462,031 |
United States of America - 6.1% |
BlackRock, Inc. Class A | 14,100 | | 4,462,227 |
Common Stocks - continued |
| Shares | | Value |
United States of America - continued |
Boston Beer Co., Inc. Class A (a) | 8,900 | | $ 2,151,931 |
Deckers Outdoor Corp. (a)(d) | 99,200 | | 8,378,432 |
Dunkin' Brands Group, Inc. | 136,400 | | 6,574,480 |
eBay, Inc. (a) | 61,200 | | 3,359,268 |
GNC Holdings, Inc. | 95,400 | | 5,576,130 |
Google, Inc. Class A (a) | 16,200 | | 18,155,502 |
LinkedIn Corp. (a) | 17,200 | | 3,729,476 |
MercadoLibre, Inc. (d) | 49,400 | | 5,324,826 |
Monsanto Co. | 53,603 | | 6,247,430 |
Nimble Storage, Inc. | 2,600 | | 117,780 |
priceline.com, Inc. (a) | 9,460 | | 10,996,304 |
Tiffany & Co., Inc. | 112,000 | | 10,391,360 |
TripAdvisor, Inc. (a) | 62,300 | | 5,160,309 |
Visa, Inc. Class A | 62,000 | | 13,806,160 |
Yahoo!, Inc. (a) | 149,200 | | 6,033,648 |
TOTAL UNITED STATES OF AMERICA | | 110,465,263 |
TOTAL COMMON STOCKS (Cost $1,257,501,496) |
1,747,214,944
|
Nonconvertible Preferred Stocks - 1.4% |
| | | |
Germany - 1.4% |
Sartorius AG (non-vtg.) | 39,500 | | 4,701,510 |
Volkswagen AG | 75,447 | | 21,189,226 |
TOTAL NONCONVERTIBLE PREFERRED STOCKS (Cost $11,922,010) |
25,890,736
|
Money Market Funds - 4.1% |
| Shares | | Value |
Fidelity Cash Central Fund, 0.11% (b) | 34,580,052 | | $ 34,580,052 |
Fidelity Securities Lending Cash Central Fund, 0.11% (b)(c) | 39,914,173 | | 39,914,173 |
TOTAL MONEY MARKET FUNDS (Cost $74,494,225) |
74,494,225
|
TOTAL INVESTMENT PORTFOLIO - 102.2% (Cost $1,343,917,731) | | 1,847,599,905 |
NET OTHER ASSETS (LIABILITIES) - (2.2)% | | (39,561,554) |
NET ASSETS - 100% | $ 1,808,038,351 |
Legend |
(a) Non-income producing |
(b) Affiliated fund that is generally available only to investment companies and other accounts managed by Fidelity Investments. The rate quoted is the annualized seven-day yield of the fund at period end. A complete unaudited listing of the fund's holdings as of its most recent quarter end is available upon request. In addition, each Fidelity Central Fund's financial statements, which are not covered by the Fund's Report of Independent Registered Public Accounting Firm, are available on the SEC's website or upon request. |
(c) Investment made with cash collateral received from securities on loan. |
(d) Security or a portion of the security is on loan at period end. |
(e) Security exempt from registration under Rule 144A of the Securities Act of 1933. These securities may be resold in transactions exempt from registration, normally to qualified institutional buyers. At the end of the period, the value of these securities amounted to $294,360 or 0.0% of net assets. |
Affiliated Central Funds |
Information regarding fiscal year to date income earned by the Fund from investments in Fidelity Central Funds is as follows: |
Fund | Income earned |
Fidelity Cash Central Fund | $ 11,058 |
Fidelity Securities Lending Cash Central Fund | 754,879 |
Total | $ 765,937 |
Other Information |
Categorizations in the Schedule of Investments are based on country or territory of incorporation. |
The following is a summary of the inputs used, as of December 31, 2013, involving the Fund's assets and liabilities carried at fair value. The inputs or methodology used for valuing securities may not be an indication of the risk associated with investing in those securities. For more information on valuation inputs, and their aggregation into the levels used in the table below, please refer to the Investment Valuation section in the accompanying Notes to Financial Statements. |
Valuation Inputs at Reporting Date: |
Description | Total | Level 1 | Level 2 | Level 3 |
Investments in Securities: | | | | |
Equities: | | | | |
Consumer Discretionary | $ 497,362,480 | $ 390,393,555 | $ 106,968,925 | $ - |
Consumer Staples | 203,613,320 | 119,306,652 | 84,306,668 | - |
Energy | 56,707,155 | 12,808,941 | 43,898,214 | - |
Financials | 338,801,156 | 173,021,667 | 165,779,489 | - |
Health Care | 128,716,430 | 95,146,375 | 33,570,055 | - |
Industrials | 130,332,091 | 83,551,234 | 46,780,857 | - |
Information Technology | 270,351,069 | 197,055,823 | 73,295,246 | - |
Materials | 100,797,954 | 44,727,648 | 56,070,306 | - |
Telecommunication Services | 46,424,025 | 3,917,803 | 42,506,222 | - |
Money Market Funds | 74,494,225 | 74,494,225 | - | - |
Total Investments in Securities: | $ 1,847,599,905 | $ 1,194,423,923 | $ 653,175,982 | $ - |
The following is a summary of transfers between Level 1 and Level 2 for the period ended December 31, 2013. Transfers are assumed to have occurred at the beginning of the period, and are primarily attributable to the valuation techniques used for foreign equity securities, as discussed in the accompanying Notes to Financial Statements: |
Transfers | Total |
Level 1 to Level 2 | $ 0 |
Level 2 to Level 1 | $ 530,708,933 |
See accompanying notes which are an integral part of the financial statements.
Annual Report
Statement of Assets and Liabilities
| December 31, 2013 |
| | |
Assets | | |
Investment in securities, at value (including securities loaned of $38,862,215) - See accompanying schedule: Unaffiliated issuers (cost $1,269,423,506) | $ 1,773,105,680 | |
Fidelity Central Funds (cost $74,494,225) | 74,494,225 | |
Total Investments (cost $1,343,917,731) | | $ 1,847,599,905 |
Receivable for securities sold on a delayed delivery basis | | 45,957 |
Receivable for fund shares sold | | 2,078,849 |
Dividends receivable | | 1,985,474 |
Distributions receivable from Fidelity Central Funds | | 38,668 |
Prepaid expenses | | 3,648 |
Other receivables | | 270,054 |
Total assets | | 1,852,022,555 |
| | |
Liabilities | | |
Payable for fund shares redeemed | $ 2,015,620 | |
Accrued management fee | 1,010,943 | |
Distribution and service plan fees payable | 96,432 | |
Other affiliated payables | 179,248 | |
Other payables and accrued expenses | 767,788 | |
Collateral on securities loaned, at value | 39,914,173 | |
Total liabilities | | 43,984,204 |
| | |
Net Assets | | $ 1,808,038,351 |
Net Assets consist of: | | |
Paid in capital | | $ 1,618,339,631 |
Undistributed net investment income | | 13,677 |
Accumulated undistributed net realized gain (loss) on investments and foreign currency transactions | | (314,000,732) |
Net unrealized appreciation (depreciation) on investments and assets and liabilities in foreign currencies | | 503,685,775 |
Net Assets | | $ 1,808,038,351 |
Statement of Assets and Liabilities - continued
| December 31, 2013 |
| | |
Initial Class:
Net Asset Value, offering price and redemption price per share ($829,382,064 ÷ 40,174,442 shares) | | $ 20.64 |
| | |
Service Class:
Net Asset Value, offering price and redemption price per share ($118,920,402 ÷ 5,783,426 shares) | | $ 20.56 |
| | |
Service Class 2:
Net Asset Value, offering price and redemption price per share ($316,863,435 ÷ 15,479,074 shares) | | $ 20.47 |
| | |
Initial Class R:
Net Asset Value, offering price and redemption price per share ($104,015,956 ÷ 5,051,121 shares) | | $ 20.59 |
| | |
Service Class R:
Net Asset Value, offering price and redemption price per share ($54,146,183 ÷ 2,638,136 shares) | | $ 20.52 |
| | |
Service Class 2R:
Net Asset Value, offering price and redemption price per share ($90,537,215 ÷ 4,467,861 shares) | | $ 20.26 |
| | |
Investor Class R:
Net Asset Value, offering price and redemption price per share ($294,173,096 ÷ 14,292,070 shares) | | $ 20.58 |
See accompanying notes which are an integral part of the financial statements.
Annual Report
Statement of Operations
| Year ended December 31, 2013 |
| | |
Investment Income | | |
Dividends | | $ 36,752,732 |
Interest | | 66 |
Income from Fidelity Central Funds | | 765,937 |
Income before foreign taxes withheld | | 37,518,735 |
Less foreign taxes withheld | | (2,422,130) |
Total income | | 35,096,605 |
| | |
Expenses | | |
Management fee | $ 11,038,211 | |
Transfer agent fees | 1,291,075 | |
Distribution and service plan fees | 1,148,207 | |
Accounting and security lending fees | 713,026 | |
Custodian fees and expenses | 199,215 | |
Independent trustees' compensation | 8,374 | |
Appreciation in deferred trustee compensation account | 166 | |
Audit | 69,243 | |
Legal | 13,751 | |
Interest | 284 | |
Miscellaneous | 13,370 | |
Total expenses before reductions | 14,494,922 | |
Expense reductions | (193,403) | 14,301,519 |
Net investment income (loss) | | 20,795,086 |
Realized and Unrealized Gain (Loss) Net realized gain (loss) on: | | |
Investment securities: | | |
Unaffiliated issuers | 94,303,083 | |
Foreign currency transactions | (512,423) | |
Total net realized gain (loss) | | 93,790,660 |
Change in net unrealized appreciation (depreciation) on: Investment securities | 309,720,761 | |
Assets and liabilities in foreign currencies | 33,566 | |
Total change in net unrealized appreciation (depreciation) | | 309,754,327 |
Net gain (loss) | | 403,544,987 |
Net increase (decrease) in net assets resulting from operations | | $ 424,340,073 |
Statement of Changes in Net Assets
| Year ended
December 31, 2013 | Year ended
December 31, 2012 |
Increase (Decrease) in Net Assets | | |
Operations | | |
Net investment income (loss) | $ 20,795,086 | $ 26,849,201 |
Net realized gain (loss) | 93,790,660 | 6,602,044 |
Change in net unrealized appreciation (depreciation) | 309,754,327 | 240,168,202 |
Net increase (decrease) in net assets resulting from operations | 424,340,073 | 273,619,447 |
Distributions to shareholders from net investment income | (20,735,911) | (26,228,448) |
Distributions to shareholders from net realized gain | (6,041,894) | (5,357,064) |
Total distributions | (26,777,805) | (31,585,512) |
Share transactions - net increase (decrease) | (86,109,747) | (136,580,307) |
Redemption fees | 19,250 | 11,237 |
Total increase (decrease) in net assets | 311,471,771 | 105,464,865 |
| | |
Net Assets | | |
Beginning of period | 1,496,566,580 | 1,391,101,715 |
End of period (including undistributed net investment income of $13,677 and distributions in excess of net investment income of $45,499, respectively) | $ 1,808,038,351 | $ 1,496,566,580 |
See accompanying notes which are an integral part of the financial statements.
Annual Report
Financial Highlights - Initial Class
Years ended December 31, | 2013 | 2012 | 2011 | 2010 | 2009 |
Selected Per-Share Data | | | | | |
Net asset value, beginning of period | $ 16.09 | $ 13.63 | $ 16.77 | $ 15.05 | $ 12.17 |
Income from Investment Operations | | | | | |
Net investment income (loss) C | .25 | .29 | .26 | .21 | .28 |
Net realized and unrealized gain (loss) | 4.63 | 2.53 | (3.14) | 1.76 | 2.93 |
Total from investment operations | 4.88 | 2.82 | (2.88) | 1.97 | 3.21 |
Distributions from net investment income | (.26) | (.30) F | (.23) | (.22) | (.29) |
Distributions from net realized gain | (.07) | (.06) F | (.03) | (.03) | (.04) |
Total distributions | (.33) | (.36) | (.26) | (.25) | (.33) |
Redemption fees added to paid in capital C,H | - | - | - | - | - |
Net asset value, end of period | $ 20.64 | $ 16.09 | $ 13.63 | $ 16.77 | $ 15.05 |
Total Return A,B | 30.44% | 20.74% | (17.16)% | 13.11% | 26.53% |
Ratios to Average Net Assets D,G | | | | | |
Expenses before reductions | .84% | .85% | .85% | .86% | .88% |
Expenses net of fee waivers, if any | .84% | .85% | .85% | .85% | .88% |
Expenses net of all reductions | .83% | .83% | .83% | .83% | .84% |
Net investment income (loss) | 1.41% | 1.94% | 1.59% | 1.41% | 2.17% |
Supplemental Data | | | | | |
Net assets, end of period (000 omitted) | $ 829,382 | $ 659,258 | $ 598,862 | $ 779,501 | $ 758,018 |
Portfolio turnover rate E | 34% | 41% | 45% | 50% | 78% |
A Total returns do not reflect charges attributable to your insurance company's separate account. Inclusion of these charges would reduce the total returns shown.
B Total returns would have been lower if certain expenses had not been reduced during the applicable periods shown.
C Calculated based on average shares outstanding during the period.
D Fees and expenses of any underlying Fidelity Central Funds are not included in the Fund's expense ratio. The Fund indirectly bears its proportionate share of the expenses of any underlying Fidelity Central Funds.
E Amount does not include the portfolio activity of any underlying Fidelity Central Funds.
F The amounts shown reflect certain reclassifications related to book to tax differences that were made in the year shown.
G Expense ratios reflect operating expenses of the class. Expenses before reductions do not reflect amounts reimbursed by the investment adviser or reductions from brokerage service arrangements or reductions from other expense offset arrangements and do not represent the amount paid by the class during periods when reimbursements or reductions occur. Expenses net of fee waivers reflect expenses after reimbursement by the investment adviser but prior to reductions from brokerage service arrangements or other expense offset arrangements. Expenses net of all reductions represent the net expenses paid by the class.
H Amount represents less than $.01 per share.
Financial Highlights - Service Class
Years ended December 31, | 2013 | 2012 | 2011 | 2010 | 2009 |
Selected Per-Share Data | | | | | |
Net asset value, beginning of period | $ 16.02 | $ 13.58 | $ 16.70 | $ 14.99 | $ 12.12 |
Income from Investment Operations | | | | | |
Net investment income (loss) C | .24 | .28 | .24 | .19 | .26 |
Net realized and unrealized gain (loss) | 4.61 | 2.50 | (3.12) | 1.75 | 2.93 |
Total from investment operations | 4.85 | 2.78 | (2.88) | 1.94 | 3.19 |
Distributions from net investment income | (.24) | (.29) F | (.21) | (.20) | (.28) |
Distributions from net realized gain | (.07) | (.06) F | (.03) | (.03) | (.04) |
Total distributions | (.31) | (.34) I | (.24) | (.23) | (.32) |
Redemption fees added to paid in capital C,H | - | - | - | - | - |
Net asset value, end of period | $ 20.56 | $ 16.02 | $ 13.58 | $ 16.70 | $ 14.99 |
Total Return A,B | 30.38% | 20.54% | (17.23)% | 12.99% | 26.44% |
Ratios to Average Net Assets D,G | | | | | |
Expenses before reductions | .94% | .95% | .95% | .96% | .98% |
Expenses net of fee waivers, if any | .94% | .95% | .95% | .95% | .98% |
Expenses net of all reductions | .93% | .93% | .93% | .93% | .94% |
Net investment income (loss) | 1.31% | 1.84% | 1.49% | 1.31% | 2.07% |
Supplemental Data | | | | | |
Net assets, end of period (000 omitted) | $ 118,920 | $ 110,468 | $ 108,921 | $ 162,394 | $ 171,252 |
Portfolio turnover rate E | 34% | 41% | 45% | 50% | 78% |
A Total returns do not reflect charges attributable to your insurance company's separate account. Inclusion of these charges would reduce the total returns shown.
B Total returns would have been lower if certain expenses had not been reduced during the applicable periods shown.
C Calculated based on average shares outstanding during the period.
D Fees and expenses of any underlying Fidelity Central Funds are not included in the Fund's expense ratio. The Fund indirectly bears its proportionate share of the expenses of any underlying Fidelity Central Funds.
E Amount does not include the portfolio activity of any underlying Fidelity Central Funds.
F The amounts shown reflect certain reclassifications related to book to tax differences that were made in the year shown.
G Expense ratios reflect operating expenses of the class. Expenses before reductions do not reflect amounts reimbursed by the investment adviser or reductions from brokerage service arrangements or reductions from other expense offset arrangements and do not represent the amount paid by the class during periods when reimbursements or reductions occur. Expenses net of fee waivers reflect expenses after reimbursement by the investment adviser but prior to reductions from brokerage service arrangements or other expense offset arrangements. Expenses net of all reductions represent the net expenses paid by the class.
H Amount represents less than $.01 per share.
I Total distributions of $.34 per share is comprised of distributions from net investment income of $.286 and distributions from net realized gain of $.059 per share.
See accompanying notes which are an integral part of the financial statements.
Annual Report
Financial Highlights - Service Class 2
Years ended December 31, | 2013 | 2012 | 2011 | 2010 | 2009 |
Selected Per-Share Data | | | | | |
Net asset value, beginning of period | $ 15.95 | $ 13.52 | $ 16.62 | $ 14.92 | $ 12.07 |
Income from Investment Operations | | | | | |
Net investment income (loss) C | .21 | .25 | .21 | .17 | .24 |
Net realized and unrealized gain (loss) | 4.59 | 2.50 | (3.09) | 1.74 | 2.91 |
Total from investment operations | 4.80 | 2.75 | (2.88) | 1.91 | 3.15 |
Distributions from net investment income | (.21) | (.26) F | (.19) | (.18) | (.26) |
Distributions from net realized gain | (.07) | (.06) F | (.03) | (.03) | (.04) |
Total distributions | (.28) | (.32) | (.22) | (.21) | (.30) |
Redemption fees added to paid in capital C,H | - | - | - | - | - |
Net asset value, end of period | $ 20.47 | $ 15.95 | $ 13.52 | $ 16.62 | $ 14.92 |
Total Return A,B | 30.17% | 20.38% | (17.34)% | 12.83% | 26.22% |
Ratios to Average Net Assets D,G | | | | | |
Expenses before reductions | 1.09% | 1.10% | 1.10% | 1.11% | 1.12% |
Expenses net of fee waivers, if any | 1.09% | 1.10% | 1.10% | 1.10% | 1.12% |
Expenses net of all reductions | 1.08% | 1.08% | 1.08% | 1.08% | 1.09% |
Net investment income (loss) | 1.16% | 1.69% | 1.34% | 1.16% | 1.93% |
Supplemental Data | | | | | |
Net assets, end of period (000 omitted) | $ 316,863 | $ 349,364 | $ 342,206 | $ 461,033 | $ 457,971 |
Portfolio turnover rate E | 34% | 41% | 45% | 50% | 78% |
A Total returns do not reflect charges attributable to your insurance company's separate account. Inclusion of these charges would reduce the total returns shown.
B Total returns would have been lower if certain expenses had not been reduced during the applicable periods shown.
C Calculated based on average shares outstanding during the period.
D Fees and expenses of any underlying Fidelity Central Funds are not included in the Fund's expense ratio. The Fund indirectly bears its proportionate share of the expenses of any underlying Fidelity Central Funds.
E Amount does not include the portfolio activity of any underlying Fidelity Central Funds.
F The amounts shown reflect certain reclassifications related to book to tax differences that were made in the year shown.
G Expense ratios reflect operating expenses of the class. Expenses before reductions do not reflect amounts reimbursed by the investment adviser or reductions from brokerage service arrangements or reductions from other expense offset arrangements and do not represent the amount paid by the class during periods when reimbursements or reductions occur. Expenses net of fee waivers reflect expenses after reimbursement by the investment adviser but prior to reductions from brokerage service arrangements or other expense offset arrangements. Expenses net of all reductions represent the net expenses paid by the class.
H Amount represents less than $.01 per share.
Financial Highlights - Initial Class R
Years ended December 31, | 2013 | 2012 | 2011 | 2010 | 2009 |
Selected Per-Share Data | | | | | |
Net asset value, beginning of period | $ 16.05 | $ 13.60 | $ 16.73 | $ 15.02 | $ 12.14 |
Income from Investment Operations | | | | | |
Net investment income (loss) C | .25 | .29 | .26 | .21 | .28 |
Net realized and unrealized gain (loss) | 4.62 | 2.52 | (3.13) | 1.75 | 2.93 |
Total from investment operations | 4.87 | 2.81 | (2.87) | 1.96 | 3.21 |
Distributions from net investment income | (.26) | (.30) F | (.23) | (.22) | (.29) |
Distributions from net realized gain | (.07) | (.06) F | (.03) | (.03) | (.04) |
Total distributions | (.33) | (.36) | (.26) | (.25) | (.33) |
Redemption fees added to paid in capital C,H | - | - | - | - | - |
Net asset value, end of period | $ 20.59 | $ 16.05 | $ 13.60 | $ 16.73 | $ 15.02 |
Total Return A,B | 30.45% | 20.71% | (17.14)% | 13.07% | 26.60% |
Ratios to Average Net Assets D,G | | | | | |
Expenses before reductions | .84% | .85% | .85% | .86% | .88% |
Expenses net of fee waivers, if any | .84% | .85% | .85% | .85% | .88% |
Expenses net of all reductions | .83% | .83% | .83% | .83% | .84% |
Net investment income (loss) | 1.41% | 1.94% | 1.59% | 1.41% | 2.17% |
Supplemental Data | | | | | |
Net assets, end of period (000 omitted) | $ 104,016 | $ 88,587 | $ 85,922 | $ 122,655 | $ 128,689 |
Portfolio turnover rate E | 34% | 41% | 45% | 50% | 78% |
A Total returns do not reflect charges attributable to your insurance company's separate account. Inclusion of these charges would reduce the total returns shown.
B Total returns would have been lower if certain expenses had not been reduced during the applicable periods shown.
C Calculated based on average shares outstanding during the period.
D Fees and expenses of any underlying Fidelity Central Funds are not included in the Fund's expense ratio. The Fund indirectly bears its proportionate share of the expenses of any underlying Fidelity Central Funds.
E Amount does not include the portfolio activity of any underlying Fidelity Central Funds.
F The amounts shown reflect certain reclassifications related to book to tax differences that were made in the year shown.
G Expense ratios reflect operating expenses of the class. Expenses before reductions do not reflect amounts reimbursed by the investment adviser or reductions from brokerage service arrangements or reductions from other expense offset arrangements and do not represent the amount paid by the class during periods when reimbursements or reductions occur. Expenses net of fee waivers reflect expenses after reimbursement by the investment adviser but prior to reductions from brokerage service arrangements or other expense offset arrangements. Expenses net of all reductions represent the net expenses paid by the class.
H Amount represents less than $.01 per share.
See accompanying notes which are an integral part of the financial statements.
Annual Report
Financial Highlights - Service Class R
Years ended December 31, | 2013 | 2012 | 2011 | 2010 | 2009 |
Selected Per-Share Data | | | | | |
Net asset value, beginning of period | $ 16.00 | $ 13.56 | $ 16.68 | $ 14.97 | $ 12.10 |
Income from Investment Operations | | | | | |
Net investment income (loss) C | .24 | .28 | .24 | .19 | .27 |
Net realized and unrealized gain (loss) | 4.59 | 2.51 | (3.12) | 1.75 | 2.92 |
Total from investment operations | 4.83 | 2.79 | (2.88) | 1.94 | 3.19 |
Distributions from net investment income | (.24) | (.29) F | (.21) | (.20) | (.28) |
Distributions from net realized gain | (.07) | (.06) F | (.03) | (.03) | (.04) |
Total distributions | (.31) | (.35) | (.24) | (.23) | (.32) |
Redemption fees added to paid in capital C,H | - | - | - | - | - |
Net asset value, end of period | $ 20.52 | $ 16.00 | $ 13.56 | $ 16.68 | $ 14.97 |
Total Return A,B | 30.30% | 20.58% | (17.24)% | 13.01% | 26.49% |
Ratios to Average Net Assets D,G | | | | | |
Expenses before reductions | .94% | .94% | .95% | .96% | .97% |
Expenses net of fee waivers, if any | .93% | .94% | .94% | .95% | .97% |
Expenses net of all reductions | .92% | .93% | .93% | .93% | .94% |
Net investment income (loss) | 1.31% | 1.84% | 1.49% | 1.31% | 2.08% |
Supplemental Data | | | | | |
Net assets, end of period (000 omitted) | $ 54,146 | $ 45,774 | $ 43,414 | $ 60,617 | $ 66,014 |
Portfolio turnover rate E | 34% | 41% | 45% | 50% | 78% |
A Total returns do not reflect charges attributable to your insurance company's separate account. Inclusion of these charges would reduce the total returns shown.
B Total returns would have been lower if certain expenses had not been reduced during the applicable periods shown.
C Calculated based on average shares outstanding during the period.
D Fees and expenses of any underlying Fidelity Central Funds are not included in the Fund's expense ratio. The Fund indirectly bears its proportionate share of the expenses of any underlying Fidelity Central Funds.
E Amount does not include the portfolio activity of any underlying Fidelity Central Funds.
F The amounts shown reflect certain reclassifications related to book to tax differences that were made in the year shown.
G Expense ratios reflect operating expenses of the class. Expenses before reductions do not reflect amounts reimbursed by the investment adviser or reductions from brokerage service arrangements or reductions from other expense offset arrangements and do not represent the amount paid by the class during periods when reimbursements or reductions occur. Expenses net of fee waivers reflect expenses after reimbursement by the investment adviser but prior to reductions from brokerage service arrangements or other expense offset arrangements. Expenses net of all reductions represent the net expenses paid by the class.
H Amount represents less than $.01 per share.
Financial Highlights - Service Class 2R
Years ended December 31, | 2013 | 2012 | 2011 | 2010 | 2009 |
Selected Per-Share Data | | | | | |
Net asset value, beginning of period | $ 15.80 | $ 13.40 | $ 16.48 | $ 14.80 | $ 11.98 |
Income from Investment Operations | | | | | |
Net investment income (loss) C | .21 | .25 | .21 | .17 | .25 |
Net realized and unrealized gain (loss) | 4.54 | 2.47 | (3.07) | 1.73 | 2.87 |
Total from investment operations | 4.75 | 2.72 | (2.86) | 1.90 | 3.12 |
Distributions from net investment income | (.22) | (.26) F | (.19) | (.19) | (.26) |
Distributions from net realized gain | (.07) | (.06) F | (.03) | (.03) | (.04) |
Total distributions | (.29) | (.32) | (.22) | (.22) | (.30) |
Redemption fees added to paid in capital C,H | - | - | - | - | - |
Net asset value, end of period | $ 20.26 | $ 15.80 | $ 13.40 | $ 16.48 | $ 14.80 |
Total Return A,B | 30.15% | 20.36% | (17.33)% | 12.82% | 26.20% |
Ratios to Average Net Assets D,G | | | | | |
Expenses before reductions | 1.09% | 1.09% | 1.10% | 1.11% | 1.12% |
Expenses net of fee waivers, if any | 1.08% | 1.09% | 1.09% | 1.10% | 1.12% |
Expenses net of all reductions | 1.07% | 1.08% | 1.08% | 1.08% | 1.09% |
Net investment income (loss) | 1.16% | 1.69% | 1.34% | 1.16% | 1.93% |
Supplemental Data | | | | | |
Net assets, end of period (000 omitted) | $ 90,537 | $ 67,674 | $ 58,968 | $ 69,393 | $ 64,200 |
Portfolio turnover rate E | 34% | 41% | 45% | 50% | 78% |
A Total returns do not reflect charges attributable to your insurance company's separate account. Inclusion of these charges would reduce the total returns shown.
B Total returns would have been lower if certain expenses had not been reduced during the applicable periods shown.
C Calculated based on average shares outstanding during the period.
D Fees and expenses of any underlying Fidelity Central Funds are not included in the Fund's expense ratio. The Fund indirectly bears its proportionate share of the expenses of any underlying Fidelity Central Funds.
E Amount does not include the portfolio activity of any underlying Fidelity Central Funds.
F The amounts shown reflect certain reclassifications related to book to tax differences that were made in the year shown.
G Expense ratios reflect operating expenses of the class. Expenses before reductions do not reflect amounts reimbursed by the investment adviser or reductions from brokerage service arrangements or reductions from other expense offset arrangements and do not represent the amount paid by the class during periods when reimbursements or reductions occur. Expenses net of fee waivers reflect expenses after reimbursement by the investment adviser but prior to reductions from brokerage service arrangements or other expense offset arrangements. Expenses net of all reductions represent the net expenses paid by the class.
H Amount represents less than $.01 per share.
See accompanying notes which are an integral part of the financial statements.
Annual Report
Financial Highlights - Investor Class R
Years ended December 31, | 2013 | 2012 | 2011 | 2010 | 2009 |
Selected Per-Share Data | | | | | |
Net asset value, beginning of period | $ 16.04 | $ 13.60 | $ 16.73 | $ 15.01 | $ 12.14 |
Income from Investment Operations | | | | | |
Net investment income (loss) C | .24 | .28 | .24 | .20 | .27 |
Net realized and unrealized gain (loss) | 4.62 | 2.51 | (3.12) | 1.76 | 2.92 |
Total from investment operations | 4.86 | 2.79 | (2.88) | 1.96 | 3.19 |
Distributions from net investment income | (.25) | (.29) F | (.22) | (.21) | (.28) |
Distributions from net realized gain | (.07) | (.06) F | (.03) | (.03) | (.04) |
Total distributions | (.32) | (.35) | (.25) | (.24) | (.32) |
Redemption fees added to paid in capital C,H | - | - | - | - | - |
Net asset value, end of period | $ 20.58 | $ 16.04 | $ 13.60 | $ 16.73 | $ 15.01 |
Total Return A,B | 30.40% | 20.54% | (17.22)% | 13.07% | 26.42% |
Ratios to Average Net Assets D,G | | | | | |
Expenses before reductions | .92% | .93% | .93% | .95% | .97% |
Expenses net of fee waivers, if any | .92% | .93% | .93% | .94% | .97% |
Expenses net of all reductions | .91% | .92% | .91% | .92% | .94% |
Net investment income (loss) | 1.33% | 1.85% | 1.51% | 1.32% | 2.08% |
Supplemental Data | | | | | |
Net assets, end of period (000 omitted) | $ 294,173 | $ 175,442 | $ 152,810 | $ 177,984 | $ 148,806 |
Portfolio turnover rate E | 34% | 41% | 45% | 50% | 78% |
A Total returns do not reflect charges attributable to your insurance company's separate account. Inclusion of these charges would reduce the total returns shown.
B Total returns would have been lower if certain expenses had not been reduced during the applicable periods shown.
C Calculated based on average shares outstanding during the period.
D Fees and expenses of any underlying Fidelity Central Funds are not included in the Fund's expense ratio. The Fund indirectly bears its proportionate share of the expenses of any underlying Fidelity Central Funds.
E Amount does not include the portfolio activity of any underlying Fidelity Central Funds.
F The amounts shown reflect certain reclassifications related to book to tax differences that were made in the year shown.
G Expense ratios reflect operating expenses of the class. Expenses before reductions do not reflect amounts reimbursed by the investment adviser or reductions from brokerage service arrangements or reductions from other expense offset arrangements and do not represent the amount paid by the class during periods when reimbursements or reductions occur. Expenses net of fee waivers reflect expenses after reimbursement by the investment adviser but prior to reductions from brokerage service arrangements or other expense offset arrangements. Expenses net of all reductions represent the net expenses paid by the class.
H Amount represents less than $.01 per share.
See accompanying notes which are an integral part of the financial statements.
Annual Report
Notes to Financial Statements
For the period ended December 31, 2013
1. Organization.
VIP Overseas Portfolio (the Fund) is a fund of Variable Insurance Products Fund (the Trust) and is authorized to issue an unlimited number of shares. The Trust is registered under the Investment Company Act of 1940, as amended (the 1940 Act), as an open-end management investment company organized as a Massachusetts business trust. Shares of the Fund may only be purchased by insurance companies for the purpose of funding variable annuity or variable life insurance contracts. The Fund offers the following classes of shares: Initial Class shares, Service Class shares, Service Class 2 shares, Initial Class R shares, Service Class R shares, Service Class 2R shares and Investor Class R shares. All classes have equal rights and voting privileges, except for matters affecting a single class. The Fund's investments in emerging markets can be subject to social, economic, regulatory, and political uncertainties and can be extremely volatile.
2. Investments in Fidelity Central Funds.
The Fund invests in Fidelity Central Funds, which are open-end investment companies generally available only to other investment companies and accounts managed by the investment adviser and its affiliates. The Fund's Schedule of Investments lists each of the Fidelity Central Funds held as of period end, if any, as an investment of the Fund, but does not include the underlying holdings of each Fidelity Central Fund. As an Investing Fund, the Fund indirectly bears its proportionate share of the expenses of the underlying Fidelity Central Funds.
The Money Market Central Funds seek preservation of capital and current income and are managed by Fidelity Investments Money Management, Inc. (FIMM), an affiliate of the investment adviser. Annualized expenses of the Money Market Central Funds as of their most recent shareholder report date are less than .01%.
A complete unaudited list of holdings for each Fidelity Central Fund is available upon request or at the Securities and Exchange Commission (the SEC) website at www.sec.gov. In addition, the financial statements of the Fidelity Central Funds, which are not covered by the Fund's Report of Independent Registered Public Accounting Firm, are available on the SEC website or upon request.
3. Significant Accounting Policies.
The financial statements have been prepared in conformity with accounting principles generally accepted in the United States of America (GAAP), which require management to make certain estimates and assumptions at the date of the financial statements. Actual results could differ from those estimates. Subsequent events, if any, through the date that the financial statements were issued have been evaluated in the preparation of the financial statements. The following summarizes the significant accounting policies of the Fund:
Investment Valuation. Investments are valued as of 4:00 p.m. Eastern time on the last calendar day of the period. In accordance with valuation policies and procedures approved by the Board of Trustees (the Board), the Fund attempts to obtain prices from one or more third party pricing vendors or brokers to value its investments. When current market prices, quotations or currency exchange rates are not readily available or reliable, investments will be fair valued in good faith by the Fidelity Management & Research Company (FMR) Fair Value Committee (the Committee), in accordance with procedures adopted by the Board. Factors used in determining fair value vary by investment type and may include market or investment specific events. The frequency with which these procedures are used cannot be predicted and they may be utilized to a significant extent. The Committee oversees the Fund's valuation policies and procedures and is responsible for approving and reporting to the Board all fair value determinations.
The Fund categorizes the inputs to valuation techniques used to value its investments into a disclosure hierarchy consisting of three levels as shown below:
Level 1 - quoted prices in active markets for identical investments
Level 2 - other significant observable inputs (including quoted prices for similar investments, interest rates, prepayment speeds, etc.)
Level 3 - unobservable inputs (including the Fund's own assumptions based on the best information available)
Valuation techniques used to value the Fund's investments by major category are as follows:
Equity securities, including restricted securities, for which market quotations are readily available, are valued at the last reported sale price or official closing price as reported by a third party pricing vendor on the primary market or exchange on which they are traded and are categorized as Level 1 in the hierarchy. In the event there were no sales during the day or closing prices are not available, securities are valued at the last quoted bid price or may be valued using the last available price and are generally categorized as Level 2 in the hierarchy. For foreign equity securities, when market or security specific events arise, comparisons to the valuation of American Depositary Receipts (ADRs), futures contracts, Exchange-Traded Funds (ETFs) and certain indexes as well as quoted prices for similar securities may be used and would be categorized as Level 2 in the hierarchy. Utilizing these techniques may result in transfers between Level 1 and Level 2. For equity securities, including restricted securities, where observable inputs are limited, assumptions about market activity and risk are used and these securities may be categorized as Level 3 in the hierarchy.
Annual Report
Notes to Financial Statements - continued
3. Significant Accounting Policies - continued
Investment Valuation - continued
Investments in open-end mutual funds, including the Fidelity Central Funds, are valued at their closing net asset value (NAV) each business day and are categorized as Level 1 in the hierarchy.
Changes in valuation techniques may result in transfers in or out of an assigned level within the disclosure hierarchy. The aggregate value of investments by input level, as of December 31, 2013, including information on transfers between Levels 1 and 2, is included at the end of the Fund's Schedule of Investments.
Foreign Currency. The Fund may use foreign currency contracts to facilitate transactions in foreign-denominated securities. Gains and losses from these transactions may arise from changes in the value of the foreign currency or if the counterparties do not perform under the contracts' terms.
Foreign-denominated assets, including investment securities, and liabilities are translated into U.S. dollars at the exchange rates at period end. Purchases and sales of investment securities, income and dividends received and expenses denominated in foreign currencies are translated into U.S. dollars at the exchange rate in effect on the transaction date.
The effects of exchange rate fluctuations on investments are included with the net realized and unrealized gain (loss) on investment securities. Other foreign currency transactions resulting in realized and unrealized gain (loss) are disclosed separately.
Investment Transactions and Income. For financial reporting purposes, the Fund's investment holdings and NAV include trades executed through the end of the last business day of the period. The NAV per share for processing shareholder transactions is calculated as of the close of business of the New York Stock Exchange (NYSE), normally 4:00 p.m. Eastern time and includes trades executed through the end of the prior business day. Gains and losses on securities sold are determined on the basis of identified cost and may include proceeds received from litigation. Dividend income is recorded on the ex-dividend date, except for certain dividends from foreign securities where the ex-dividend date may have passed, which are recorded as soon as the Fund is informed of the ex-dividend date. Non-cash dividends included in dividend income, if any, are recorded at the fair market value of the securities received. Interest income and distributions from the Fidelity Central Funds are accrued as earned. Interest income includes coupon interest and amortization of premium and accretion of discount on debt securities. Investment income is recorded net of foreign taxes withheld where recovery of such taxes is uncertain.
Class Allocations and Expenses. Investment income, realized and unrealized capital gains and losses, common expenses of the Fund, and certain fund-level expense reductions, if any, are allocated daily on a pro-rata basis to each class based on the relative net assets of each class to the total net assets of the Fund. Each class differs with respect to transfer agent and distribution and service plan fees incurred. Certain expense reductions may also differ by class. For the reporting period, the allocated portion of income and expenses to each class as a percent of its average net assets may vary due to the timing of recording these transactions in relation to fluctuating net assets of the classes. Expenses directly attributable to a fund are charged to that fund. Expenses attributable to more than one fund are allocated among the respective funds on the basis of relative net assets or other appropriate methods. Expense estimates are accrued in the period to which they relate and adjustments are made when actual amounts are known.
Deferred Trustee Compensation. Under a Deferred Compensation Plan (the Plan), independent Trustees may elect to defer receipt of a portion of their annual compensation. Deferred amounts are invested in a cross-section of Fidelity funds, are marked-to-market and remain in the Fund until distributed in accordance with the Plan. The investment of deferred amounts and the offsetting payable to the Trustees are included in the accompanying Statement of Assets and Liabilities.
Income Tax Information and Distributions to Shareholders. Each year, the Fund intends to qualify as a regulated investment company under Subchapter M of the Internal Revenue Code, including distributing substantially all of its taxable income and realized gains. As a result, no provision for U.S. Federal income taxes is required. As of December 31, 2013, the Fund did not have any unrecognized tax benefits in the financial statements; nor is the Fund aware of any tax positions for which it is reasonably possible that the total amounts of unrecognized tax benefits will significantly change in the next twelve months. The Fund files a U.S. federal tax return, in addition to state and local tax returns as required. The Fund's federal income tax returns are subject to examination by the Internal Revenue Service (IRS) for a period of three fiscal years after they are filed. State and local tax returns may be subject to examination for an additional fiscal year depending on the jurisdiction. Foreign taxes are provided for based on the Fund's understanding of the tax rules and rates that exist in the foreign markets in which it invests.
Distributions are declared and recorded on the ex-dividend date. Income dividends and capital gain distributions are declared separately for each class. Income and capital gain distributions are determined in accordance with income tax regulations, which may differ from GAAP. These differences resulted in distribution reclassifications for the period ended December 31, 2012.
Capital accounts within the financial statements are adjusted for permanent book-tax differences. These adjustments have no impact on net assets or the results of operations. Capital accounts are not adjusted for temporary book-tax differences which will reverse in a subsequent period.
Annual Report
3. Significant Accounting Policies - continued
Income Tax Information and Distributions to Shareholders - continued
Book-tax differences are primarily due to foreign currency transactions, passive foreign investment companies (PFIC), deferred trustees compensation, capital loss carryforwards and losses deferred due to wash sales and excise tax regulations.
The federal tax cost of investment securities and unrealized appreciation (depreciation) as of period end were as follows:
Gross unrealized appreciation | $ 556,965,468 |
Gross unrealized depreciation | (74,556,149) |
Net unrealized appreciation (depreciation) on securities and other investments | $ 482,409,319 |
| |
Tax Cost | $ 1,365,190,586 |
The tax-based components of distributable earnings as of period end were as follows:
Undistributed ordinary income | $ 290,529 |
Capital loss carryforward | $ (292,951,303) |
Net unrealized appreciation (depreciation) | $ 482,412,920 |
Capital loss carryforwards are only available to offset future capital gains of the Fund to the extent provided by regulations and may be limited. Under the Regulated Investment Company Modernization Act of 2010 (the Act), the Fund is permitted to carry forward capital losses incurred in taxable years beginning after December 22, 2010 for an unlimited period and such capital losses are required to be used prior to any losses that expire. The capital loss carryforward information presented below, including any applicable limitation, is estimated as of fiscal period end and is subject to adjustment.
Fiscal year of expiration | |
2016 | $ (12,503,833) |
2017 | (280,447,470) |
Total capital loss carryforward | $ (292,951,303) |
The tax character of distributions paid was as follows:
| December 31, 2013 | December 31, 2012 |
Ordinary Income | $ 26,777,805 | $ 31,585,512 |
Trading (Redemption) Fees. Initial Class R shares, Service Class R shares, Service Class 2R shares and Investor Class R shares held by investors less than 60 days may be subject to a redemption fee equal to 1% of the NAV of shares redeemed. All redemption fees, which reduce the proceeds of the shareholder redemption, are retained by the Fund and accounted for as an addition to paid in capital.
Delayed Delivery Transactions and When-Issued Securities. During the period, the Fund transacted in securities on a delayed delivery or when-issued basis. Payment and delivery may take place after the customary settlement period for that security. The price of the underlying securities and the date when the securities will be delivered and paid for are fixed at the time the transaction is negotiated. With respect to purchase commitments, the Fund identifies securities as segregated in its records with a value at least equal to the amount of the commitment. Losses may arise due to changes in the value of the underlying securities or if the counterparty does not perform under the contract's terms, or if the issuer does not issue the securities due to political, economic, or other factors.
Restricted Securities. The Fund may invest in securities that are subject to legal or contractual restrictions on resale. These securities generally may be resold in transactions exempt from registration or to the public if the securities are registered. Disposal of these securities may involve time-consuming negotiations and expense, and prompt sale at an acceptable price may be difficult. Information regarding restricted securities is included at the end of the Fund's Schedule of Investments.
4. Purchases and Sales of Investments.
Purchases and sales of securities, other than short-term securities, aggregated $532,962,696 and $646,936,207, respectively.
Annual Report
Notes to Financial Statements - continued
5. Fees and Other Transactions with Affiliates.
Management Fee. Fidelity Management & Research Company (the investment adviser) and its affiliates provide the Fund with investment management related services for which the Fund pays a monthly management fee. The management fee is the sum of an individual fund fee rate that is based on an annual rate of .45% of the Fund's average net assets and an annualized group fee rate that averaged .25% during the period. The group fee rate is based upon the average net assets of all the mutual funds advised by the investment adviser, including any mutual funds previously advised by the investment adviser that are currently advised by Fidelity SelectCo, LLC, an affiliate of the investment adviser. The group fee rate decreases as assets under management increase and increases as assets under management decrease. For the reporting period, the total annual management fee rate was .70% of the Fund's average net assets.
Distribution and Service Plan Fees. In accordance with Rule 12b-1 of the 1940 Act, the Fund has adopted separate 12b-1 Plans for each Service Class of shares. Each Service Class pays Fidelity Distributors Corporation (FDC), an affiliate of the investment adviser, a service fee. For the period, the service fee is based on an annual rate of .10% of Service Class' and Service Class R's average net assets and .25% of Service Class 2's and Service Class 2R's average net assets.
For the period, total fees, all of which were re-allowed to insurance companies for the distribution of shares and providing shareholder support services were as follows:
Service Class | $ 110,707 |
Service Class 2 | 799,337 |
Service Class R | 48,831 |
Service Class 2R | 189,332 |
| $ 1,148,207 |
Transfer Agent Fees. Fidelity Investments Institutional Operations Company, Inc. (FIIOC), an affiliate of the investment adviser, is the Fund's transfer, dividend disbursing, and shareholder servicing agent. FIIOC receives an asset-based fee with respect to each class. Each class (with the exception of Investor Class R) pays a transfer agent fee, excluding out of pocket expenses, equal to an annual rate of .07% of average net assets. Investor Class R pays a monthly asset-based transfer agent fee of .15% of average net assets. In addition, FIIOC receives an asset-based fee of ..0035% of average net assets for typesetting, printing and mailing of shareholder reports, except proxy statements. FIIOC voluntarily agreed to reimburse or waive this fee for the period January 1, 2013 through December 31, 2013 (see Expense Reductions note). For the period, transfer agent fees for each class, including printing and out of pocket expenses, were as follows:
Initial Class | $ 505,999 |
Service Class | 79,026 |
Service Class 2 | 226,507 |
Initial Class R | 66,258 |
Service Class R | 33,501 |
Service Class 2R | 51,945 |
Investor Class R | 327,839 |
| $ 1,291,075 |
Effective February 1, 2014, the Board of Trustees approved an amendment to the transfer agent fee agreement whereby each class (with the exception of Investor Class R) pays a single fee of .07% of average net assets for transfer agent services, typesetting, printing and mailing of shareholder reports, excluding mailing of proxy statements and out of pocket expenses. Investor Class R pays a single fee of .15% of average net assets.
Accounting and Security Lending Fees. Fidelity Service Company, Inc. (FSC), an affiliate of the investment adviser, maintains the Fund's accounting records. The accounting fee is based on the level of average net assets for each month. Under a separate contract, FSC administers the security lending program. The security lending fee is based on the number and duration of lending transactions.
Brokerage Commissions. The Fund placed a portion of its portfolio transactions with brokerage firms which are affiliates of the investment adviser. Brokerage commissions are included in net realized gain (loss) and change in net unrealized appreciation (depreciation) in the Statement of Operations. The commissions paid to these affiliated firms were $2,030 for the period.
Interfund Lending Program. Pursuant to an Exemptive Order issued by the SEC, the Fund, along with other registered investment companies having management contracts with FMR or other affiliated entities of FMR, may participate in an interfund lending program. This program provides an alternative credit facility allowing the funds to borrow from, or lend money to, other participating affiliated funds. At period end, there were no interfund loans outstanding. The Fund's activity in this program during the period for which loans were outstanding was as follows:
Borrower or Lender | Average Loan
Balance | Weighted Average Interest Rate | Interest
Expense |
Borrower | $ 4,028,429 | .36% | $ 284 |
Annual Report
6. Committed Line of Credit.
The Fund participates with other funds managed by the investment adviser or an affiliate in a $4.25 billion credit facility (the "line of credit") to be utilized for temporary or emergency purposes to fund shareholder redemptions or for other short-term liquidity purposes. The Fund has agreed to pay commitment fees on its pro-rata portion of the line of credit, which amounted to $3,292 and is reflected in Miscellaneous expenses on the Statement of Operations. During the period, there were no borrowings on this line of credit.
7. Security Lending.
The Fund lends portfolio securities through a lending agent from time to time in order to earn additional income. For equity securities, a lending agent is used and may loan securities to certain qualified borrowers, including Fidelity Capital Markets (FCM), a broker-dealer affiliated with the Fund. On the settlement date of the loan, the Fund receives collateral (in the form of U.S. Treasury obligations, letters of credit and/or cash) against the loaned securities and maintains collateral in an amount not less than 100% of the market value of the loaned securities during the period of the loan. The market value of the loaned securities is determined at the close of business of the Fund and any additional required collateral is delivered to the Fund on the next business day. If the borrower defaults on its obligation to return the securities loaned because of insolvency or other reasons, the Fund may apply collateral received from the borrower against the obligation. The Fund may experience delays and costs in recovering the securities loaned. Any cash collateral received is invested in the Fidelity Securities Lending Cash Central Fund. The value of loaned securities and cash collateral at period end are disclosed on the Fund's Statement of Assets and Liabilities. At period end, there were no security loans outstanding with FCM. Security lending income represents the income earned on investing cash collateral, less rebates paid to borrowers and any lending agent fees associated with the loan, plus any premium payments received for lending certain types of securities. Security lending income is presented in the Statement of Operations as a component of income from Fidelity Central Funds. Total security lending income during the period amounted to $754,879, including $20 from securities loaned to FCM.
8. Expense Reductions.
The investment adviser or its affiliates agreed to reimburse or waive certain fees during the period as noted in the table below.
Initial Class | $ 27,712 |
Service Class | 4,338 |
Service Class 2 | 12,514 |
Initial Class R | 3,653 |
Service Class R | 1,914 |
Service Class 2R | 2,969 |
Investor Class R | 8,402 |
| $ 61,502 |
Commissions paid to certain brokers with whom the investment adviser, or its affiliates, places trades on behalf of the Fund include an amount in addition to trade execution, which may be rebated back to the Fund to offset certain expenses. This amount totaled $131,901 for the period.
9. Distributions to Shareholders.
Distributions to shareholders of each class were as follows:
Years ended December 31, | 2013 | 2012 |
From net investment income | | |
Initial Class | $ 9,994,667 | $ 12,006,007 |
Service Class | 1,357,229 | 1,929,055 |
Service Class 2 | 3,168,706 | 5,676,951 |
Initial Class R | 1,290,936 | 1,647,375 |
Service Class R | 628,888 | 804,767 |
Service Class 2R | 959,606 | 1,102,032 |
Investor Class R | 3,335,879 | 3,062,261 |
Total | $ 20,735,911 | $ 26,228,448 |
From net realized gain | | |
Initial Class | $ 2,739,851 | $ 2,332,435 |
Service Class | 403,194 | 397,090 |
Service Class 2 | 1,092,127 | 1,276,004 |
Initial Class R | 353,886 | 320,038 |
Service Class R | 185,274 | 165,080 |
Service Class 2R | 312,532 | 244,876 |
Investor Class R | 955,030 | 621,541 |
Total | $ 6,041,894 | $ 5,357,064 |
Annual Report
Notes to Financial Statements - continued
10. Share Transactions.
Transactions for each class of shares were as follows:
| Shares | Dollars |
Years ended December 31, | 2013 | 2012 | 2013 | 2012 |
Initial Class | | | | |
Shares sold | 5,801,817 | 5,444,050 | $ 107,662,358 | $ 81,965,581 |
Reinvestment of distributions | 649,058 | 905,776 | 12,734,518 | 14,338,442 |
Shares redeemed | (7,255,257) | (9,304,668) | (129,071,396) | (141,203,928) |
Net increase (decrease) | (804,382) | (2,954,842) | $ (8,674,520) | $ (44,899,905) |
Service Class | | | | |
Shares sold | 428,272 | 308,352 | $ 7,746,361 | $ 4,623,052 |
Reinvestment of distributions | 90,093 | 147,504 | 1,760,423 | 2,326,145 |
Shares redeemed | (1,628,602) | (1,584,094) | (28,843,970) | (23,791,164) |
Net increase (decrease) | (1,110,237) | (1,128,238) | $ (19,337,186) | $ (16,841,967) |
Service Class 2 | | | | |
Shares sold | 1,340,055 | 1,454,591 | $ 23,878,028 | $ 21,413,096 |
Reinvestment of distributions | 218,953 | 442,863 | 4,260,833 | 6,952,955 |
Shares redeemed | (7,981,874) | (5,312,307) | (142,365,692) | (79,852,380) |
Net increase (decrease) | (6,422,866) | (3,414,853) | $ (114,226,831) | $ (51,486,329) |
Initial Class R | | | | |
Shares sold | 435,761 | 225,830 | $ 8,137,230 | $ 3,396,796 |
Reinvestment of distributions | 84,048 | 124,599 | 1,644,822 | 1,967,413 |
Shares redeemed | (988,816) | (1,149,012) | (17,709,460) | (17,268,375) |
Net increase (decrease) | (469,007) | (798,583) | $ (7,927,408) | $ (11,904,166) |
Service Class R | | | | |
Shares sold | 215,668 | 244,158 | $ 3,976,622 | $ 3,670,758 |
Reinvestment of distributions | 41,731 | 61,617 | 814,162 | 969,847 |
Shares redeemed | (480,725) | (647,072) | (8,684,273) | (9,806,526) |
Net increase (decrease) | (223,326) | (341,297) | $ (3,893,489) | $ (5,165,921) |
Service Class 2R | | | | |
Shares sold | 635,014 | 531,202 | $ 11,565,664 | $ 7,828,308 |
Reinvestment of distributions | 66,051 | 86,618 | 1,272,138 | 1,346,907 |
Shares redeemed | (515,803) | (737,328) | (9,082,206) | (10,984,899) |
Net increase (decrease) | 185,262 | (119,508) | $ 3,755,596 | $ (1,809,684) |
Investor Class R | | | | |
Shares sold | 4,240,579 | 1,329,601 | $ 79,414,168 | $ 19,962,890 |
Reinvestment of distributions | 219,372 | 233,300 | 4,290,909 | 3,683,801 |
Shares redeemed | (1,102,402) | (1,867,920) | (19,510,986) | (28,119,026) |
Net increase (decrease) | 3,357,549 | (305,019) | $ 64,194,091 | $ (4,472,335) |
11. Other.
The Fund's organizational documents provide former and current trustees and officers with a limited indemnification against liabilities arising in connection with the performance of their duties to the Fund. In the normal course of business, the Fund may also enter into contracts that provide general indemnifications. The Fund's maximum exposure under these arrangements is unknown as this would be dependent on future claims that may be made against the Fund. The risk of material loss from such claims is considered remote.
At the end of the period, the investment adviser or its affiliates were the owners of record of 18% of the total outstanding shares of the Fund and one otherwise unaffiliated shareholder was the owner of record of 18% of the total outstanding shares of the Fund.
Annual Report
Report of Independent Registered Public Accounting Firm
To the Trustees of Variable Insurance Products Fund and the Shareholders of VIP Overseas Portfolio:
In our opinion, the accompanying statement of assets and liabilities, including the schedule of investments, and the related statements of operations and of changes in net assets and the financial highlights present fairly, in all material respects, the financial position of VIP Overseas Portfolio (a fund of Variable Insurance Products Fund) at December 31, 2013, the results of its operations for the year then ended, the changes in its net assets for each of the two years in the period then ended and the financial highlights for each of the five years in the period then ended, in conformity with accounting principles generally accepted in the United States of America. These financial statements and financial highlights (hereafter referred to as "financial statements") are the responsibility of the VIP Overseas Portfolio's management. Our responsibility is to express an opinion on these financial statements based on our audits. We conducted our audits of these financial statements in accordance with the standards of the Public Company Accounting Oversight Board (United States). Those standards require that we plan and perform the audit to obtain reasonable assurance about whether the financial statements are free of material misstatement. An audit includes examining, on a test basis, evidence supporting the amounts and disclosures in the financial statements, assessing the accounting principles used and significant estimates made by management, and evaluating the overall financial statement presentation. We believe that our audits, which included confirmation of securities at December 31, 2013 by correspondence with the custodian and brokers, provide a reasonable basis for our opinion.
PricewaterhouseCoopers LLP
Boston, Massachusetts
February 14, 2014
Annual Report
The Trustees, Member of the Advisory Board, and officers of the trust and fund, as applicable, are listed below. The Board of Trustees governs the fund and is responsible for protecting the interests of shareholders. The Trustees are experienced executives who meet periodically throughout the year to oversee the fund's activities, review contractual arrangements with companies that provide services to the fund, oversee management of the risks associated with such activities and contractual arrangements, and review the fund's performance. Except for James C. Curvey, Ned C. Lautenbach, Ronald P. O'Hanley, and William S. Stavropoulos, each of the Trustees oversees 173 funds. Mr. Curvey oversees 396 funds. Mr. Lautenbach, Mr. O'Hanley, and Mr. Stavropoulos each oversees 247 funds.
The Trustees hold office without limit in time except that (a) any Trustee may resign; (b) any Trustee may be removed by written instrument, signed by at least two-thirds of the number of Trustees prior to such removal; (c) any Trustee who requests to be retired or who has become incapacitated by illness or injury may be retired by written instrument signed by a majority of the other Trustees; and (d) any Trustee may be removed at any special meeting of shareholders by a two-thirds vote of the outstanding voting securities of the trust. Each Trustee who is not an interested person (as defined in the 1940 Act) of the trust and the fund (Independent Trustee), shall retire not later than the last day of the calendar year in which his or her 75th birthday occurs. The Independent Trustees may waive this mandatory retirement age policy with respect to individual Trustees. The officers and Advisory Board Member hold office without limit in time, except that any officer and Advisory Board Member may resign or may be removed by a vote of a majority of the Trustees at any regular meeting or any special meeting of the Trustees. Except as indicated, each individual has held the office shown or other offices in the same company for the past five years.
Experience, Skills, Attributes, and Qualifications of the Fund's Trustees. The Governance and Nominating Committee has adopted a statement of policy that describes the experience, qualifications, attributes, and skills that are necessary and desirable for potential Independent Trustee candidates (Statement of Policy). The Board believes that each Trustee satisfied at the time he or she was initially elected or appointed a Trustee, and continues to satisfy, the standards contemplated by the Statement of Policy. The Governance and Nominating Committee also engages professional search firms to help identify potential Independent Trustee candidates who have the experience, qualifications, attributes, and skills consistent with the Statement of Policy. From time to time, additional criteria based on the composition and skills of the current Independent Trustees, as well as experience or skills that may be appropriate in light of future changes to board composition, business conditions, and regulatory or other developments, have also been considered by the professional search firms and the Governance and Nominating Committee. In addition, the Board takes into account the Trustees' commitment and participation in Board and committee meetings, as well as their leadership of standing and ad hoc committees throughout their tenure.
In determining that a particular Trustee was and continues to be qualified to serve as a Trustee, the Board has considered a variety of criteria, none of which, in isolation, was controlling. The Board believes that, collectively, the Trustees have balanced and diverse experience, qualifications, attributes, and skills, which allow the Board to operate effectively in governing the fund and protecting the interests of shareholders. Information about the specific experience, skills, attributes, and qualifications of each Trustee, which in each case led to the Board's conclusion that the Trustee should serve (or continue to serve) as a trustee of the fund, is provided below.
Board Structure and Oversight Function. James C. Curvey is an interested person (as defined in the 1940 Act) and currently serves as Chairman. The Trustees have determined that an interested Chairman is appropriate and benefits shareholders because an interested Chairman has a personal and professional stake in the quality and continuity of services provided to the fund. Independent Trustees exercise their informed business judgment to appoint an individual of their choosing to serve as Chairman, regardless of whether the Trustee happens to be independent or a member of management. The Independent Trustees have determined that they can act independently and effectively without having an Independent Trustee serve as Chairman and that a key structural component for assuring that they are in a position to do so is for the Independent Trustees to constitute a substantial majority for the Board. The Independent Trustees also regularly meet in executive session. Ned C. Lautenbach serves as Chairman of the Independent Trustees and as such (i) acts as a liaison between the Independent Trustees and management with respect to matters important to the Independent Trustees and (ii) with management prepares agendas for Board meetings.
Fidelity funds are overseen by different Boards of Trustees. The fund's Board oversees Fidelity's equity and high income funds and another Board oversees Fidelity's investment-grade bond, money market, and asset allocation funds. The asset allocation funds may invest in Fidelity funds overseen by the fund's Board. The use of separate Boards, each with its own committee structure, allows the Trustees of each group of Fidelity funds to focus on the unique issues of the funds they oversee, including common research, investment, and operational issues. On occasion, the separate Boards establish joint committees to address issues of overlapping consequences for the Fidelity funds overseen by each Board.
The Trustees operate using a system of committees to facilitate the timely and efficient consideration of all matters of importance to the Trustees, the fund, and fund shareholders and to facilitate compliance with legal and regulatory requirements and oversight of the fund's activities and associated risks. The Board, acting through its committees, has charged FMR and its affiliates with (i) identifying events or circumstances the occurrence of which could have demonstrably adverse effects on the fund's business and/or reputation; (ii) implementing processes and controls to lessen the possibility that such events or circumstances occur or to mitigate the effects of such events or circumstances if they do occur; and (iii) creating and maintaining a system designed to evaluate continuously business and market conditions in order to facilitate the identification and implementation processes described in (i) and (ii) above. Because the day-to-day operations and activities of the fund are carried out by or through FMR, its affiliates and other service providers, the fund's exposure to risks is mitigated but not eliminated by the processes overseen by the Trustees. While each of the Board's committees has responsibility for overseeing different aspects of the fund's activities, oversight is exercised primarily through the Operations, Audit, and Compliance Committees. In addition, the Independent Trustees have worked with FMR to enhance the Board's oversight of investment and financial risks, legal and regulatory risks, technology risks, and operational risks, including the development of additional risk reporting to the Board. For example, a working group comprised of Independent Trustees and FMR has worked and continues to work to review the Fidelity funds' valuation-related activities, reporting and risk management. Appropriate personnel, including but not limited to the fund's Chief Compliance Officer (CCO), FMR's internal auditor, the independent accountants, the fund's Treasurer and portfolio management personnel, make periodic reports to the Board's committees, as appropriate, including an annual review of FMR's risk management program for the Fidelity funds. The responsibilities of each standing committee, including their oversight responsibilities, are described further under "Standing Committees of the Fund's Trustees."
Annual Report
The fund's Statement of Additional Information (SAI) includes more information about the Trustees. To request a free copy, call Fidelity at 1-877-208-0098.
Interested Trustees*:
Correspondence intended for each Trustee who is an interested person may be sent to Fidelity Investments, 245 Summer Street, Boston, Massachusetts 02210.
Name, Year of Birth; Principal Occupations and Other Relevant Experience+ |
James C. Curvey (1935) |
Year of Election or Appointment: 2007 Trustee Chairman of the Board of Trustees |
| Mr. Curvey also serves as Trustee of other Fidelity funds. Mr. Curvey is a Director of Fidelity Investments Money Management, Inc. (2009-present), Director of Fidelity Research & Analysis Co. (2009-present) and Director of FMR and FMR Co., Inc. (2007-present). Mr. Curvey is also Vice Chairman (2007-present) and Director of FMR LLC. In addition, Mr. Curvey serves as an Overseer for the Boston Symphony Orchestra and a member of the Trustees of Villanova University. Previously, Mr. Curvey was the Vice Chairman (2006-2007) and Director (2000-2007) of FMR Corp. |
Ronald P. O'Hanley (1957) |
Year of Election or Appointment: 2011 Trustee |
| Mr. O'Hanley also serves as Trustee of other Fidelity funds. He is Director of Fidelity SelectCo, LLC (2013-present), FMR Co., Inc. (2010-present), Director of Fidelity Investments Money Management, Inc. (2010-present), Director of Fidelity Research & Analysis Company (2010-present), President of Fidelity Asset Management and Corporate Services and a Member of Fidelity's Executive Committee (2010-present). Previously, Mr. O'Hanley served as President and Chief Executive Officer of BNY Mellon Asset Management (2007-2010). Mr. O'Hanley also served as Vice Chairman of Bank New York Mellon Corp. and a member of that firm's Executive Committee. Prior to the 2007 merger of The Bank of New York and Mellon Financial Corporation, he was Vice Chairman of Mellon Financial Corporation and President and Chief Executive Officer of Mellon Asset Management. He joined Mellon in February 1997. Mr. O'Hanley currently serves as Chairman of the Boston Public Library Foundation Board of Directors and sits on the Board of Directors of Beth Israel Deaconess Medical Center, the Board of Trustees of the Marine Biological Laboratory and the Advisory Board of the Maxwell School of Citizenship and Public Administration at Syracuse University. Mr. O'Hanley also chairs the Council on Asset Management for the Financial Services Roundtable and is a member of the Board of Directors of Institutional Investor's U.S. Institute. |
* Trustees have been determined to be "Interested Trustees" by virtue of, among other things, their affiliation with the trust or various entities under common control with FMR.
+ The information above includes each Trustee's principal occupation during the last five years and other information relating to the experience, attributes, and skills relevant to each Trustee's qualifications to serve as a Trustee, which led to the conclusion that each Trustee should serve as a Trustee for the fund.
Annual Report
Trustees and Officers - continued
Independent Trustees:
Correspondence intended for each Independent Trustee (that is, the Trustees other than the Interested Trustees) may be sent to Fidelity Investments, P.O. Box 55235, Boston, Massachusetts 02205-5235.
Name, Year of Birth; Principal Occupations and Other Relevant Experience+ |
Dennis J. Dirks (1948) |
Year of Election or Appointment: 2005 Trustee |
| Mr. Dirks also serves as Trustee of other Fidelity funds. Prior to his retirement in May 2003, Mr. Dirks was Chief Operating Officer and a member of the Board of The Depository Trust & Clearing Corporation (DTCC). He also served as President, Chief Operating Officer, and Board member of The Depository Trust Company (DTC) and President and Board member of the National Securities Clearing Corporation (NSCC). In addition, Mr. Dirks served as Chief Executive Officer and Board member of the Government Securities Clearing Corporation, Chief Executive Officer and Board member of the Mortgage-Backed Securities Clearing Corporation, as a Trustee and a member of the Finance Committee of Manhattan College (2005-2008), and as a Trustee and a member of the Finance Committee of AHRC of Nassau County (2006-2008). Mr. Dirks is a member of the Independent Directors Council (IDC) Governing Council (2010-present) and Board of Directors for The Brookville Center for Children's Services, Inc. (2009-present). |
Alan J. Lacy (1953) |
Year of Election or Appointment: 2008 Trustee |
| Mr. Lacy also serves as Trustee of other Fidelity funds. Mr. Lacy serves as Senior Adviser (2007-present) of Oak Hill Capital Partners, L.P. (private equity). Mr. Lacy also served as Chief Executive Officer (2000-2005) and Vice Chairman (2005-2006) of Sears Holdings Corporation and Sears, Roebuck and Co. (retail). In addition, Mr. Lacy serves as a member of the Board of Directors of Dave & Buster's Entertainment, Inc. (restaurant and entertainment complexes, 2010-present), Earth Fare, Inc. (retail grocery, 2012-present), The Hillman Companies, Inc. (hardware wholesalers, 2010-present), and Bristol-Myers Squibb Company (global pharmaceuticals, 2008-present). Mr. Lacy is a member of the Board of Trustees of The National Parks Conservation Association (2006-present). Previously, Mr. Lacy served as Chairman of the Board of Trustees of the National Parks Conservation Association (2008-2011) and as a member of the Board of Directors for the Western Union Company (global money transfer, 2006-2011). |
Ned C. Lautenbach (1944) |
Year of Election or Appointment: 2000 Trustee Chairman of the Independent Trustees |
| Mr. Lautenbach also serves as Trustee of other Fidelity funds. Mr. Lautenbach currently serves as the Lead Director of the Eaton Corporation Board of Directors (diversified industrial, 1997-present). Mr. Lautenbach is Chairman of the Board of Directors of the Philharmonic Center for the Arts in Naples, Florida (2012-present) and a member of the Council on Foreign Relations (1994-present). Previously, Mr. Lautenbach was a Partner/Advisory Partner at Clayton, Dubilier & Rice, LLC (private equity investment, 1998-2010), as well as a Director of Sony Corporation (2006-2007). |
Joseph Mauriello (1944) |
Year of Election or Appointment: 2008 Trustee |
| Mr. Mauriello also serves as Trustee of other Fidelity funds. Prior to his retirement in January 2006, Mr. Mauriello served in numerous senior management positions including Deputy Chairman and Chief Operating Officer (2004-2005), and Vice Chairman of Financial Services (2002-2004) of KPMG LLP US (professional services, 1965-2005). Mr. Mauriello currently serves as a member of the Board of Directors of XL Group plc. (global insurance and re-insurance, 2006-present). Previously, Mr. Mauriello served as a Director of the Hamilton Funds of the Bank of New York (2006-2007) and of Arcadia Resources Inc. (health care services and products, 2007-2012). |
Robert W. Selander (1950) |
Year of Election or Appointment: 2011 Trustee |
| Mr. Selander also serves as Trustee of other Fidelity funds. Previously, Mr. Selander served as a Member of the Advisory Board of other Fidelity funds (2011), and Executive Vice Chairman (2010), Chief Executive Officer (2009-2010), and President and Chief Executive Officer (1997-2009) of Mastercard, Inc. |
Cornelia M. Small (1944) |
Year of Election or Appointment: 2005 Trustee |
| Ms. Small also serves as Trustee of other Fidelity funds. Ms. Small is a member of the Board of Directors (2009-present) and Chair of the Investment Committee (2010-present) of the Teagle Foundation. Ms. Small also serves on the Investment Committee of the Berkshire Taconic Community Foundation (2008-present). Previously, Ms. Small served as Chairperson (2002-2008) and a member of the Investment Committee and Chairperson (2008-2012) and a member of the Board of Trustees of Smith College. In addition, Ms. Small served as Chief Investment Officer, Director of Global Equity Investments, and a member of the Board of Directors of Scudder, Stevens & Clark and Scudder Kemper Investments. |
William S. Stavropoulos (1939) |
Year of Election or Appointment: 2001 Trustee Vice Chairman of the Independent Trustees |
| Mr. Stavropoulos also serves as Trustee of other Fidelity funds. Mr. Stavropoulos serves as President and Founder of the Michigan Baseball Foundation, the Great Lakes Loons (2007-present). Mr. Stavropoulos is Chairman Emeritus of the Board of Directors of The Dow Chemical Company, where he previously served in numerous senior management positions, including President, CEO (1995-2000; 2002-2004), Chairman of the Executive Committee (2000-2006), and as a member of the Board of Directors (1990-2006). Currently, Mr. Stavropoulos is Chairman of the Board of Directors of Univar Inc. (global distributor of commodity and specialty chemicals), a Director of Teradata Corporation (data warehousing and technology solutions), and Maersk Inc. (industrial conglomerate), and a member of the Advisory Board for Metalmark Capital LLC (private equity investment, 2005-present). Mr. Stavropoulos is an operating advisor to Clayton, Dubilier & Rice, LLC (private equity investment). In addition, Mr. Stavropoulos is a member of the University of Notre Dame Advisory Council for the College of Science, a Trustee of the Rollin L. Gerstacker Foundation, and a Director of the Naples Philharmonic Center for the Arts. Previously, Mr. Stavropoulos served as a Director of Chemical Financial Corporation (bank holding company, 1993-2012) and Tyco International, Ltd. (multinational manufacturing and services, 2007-2012). |
David M. Thomas (1949) |
Year of Election or Appointment: 2008 Trustee |
| Mr. Thomas also serves as Trustee of other Fidelity funds. Mr. Thomas serves as Non-Executive Chairman of the Board of Directors of Fortune Brands Home and Security (home and security products, 2011-present), and as a member of the Board of Directors of Interpublic Group of Companies, Inc. (marketing communication, 2004-present). Previously, Mr. Thomas served as Executive Chairman (2005-2006) and Chairman and Chief Executive Officer (2000-2005) of IMS Health, Inc. (pharmaceutical and healthcare information solutions), and a Director of Fortune Brands, Inc. (consumer products, 2000-2011). |
+ The information above includes each Trustee's principal occupation during the last five years and other information relating to the experience, attributes, and skills relevant to each Trustee's qualifications to serve as a Trustee, which led to the conclusion that each Trustee should serve as a Trustee for the fund.
Advisory Board Member and Officers:
Correspondence intended for each officer and Peter S. Lynch may be sent to Fidelity Investments, 245 Summer Street, Boston, Massachusetts 02210. Officers appear below in alphabetical order.
Name, Year of Birth; Principal Occupation |
Peter S. Lynch (1944) |
Year of Election or Appointment: 2003 Member of the Advisory Board |
| Mr. Lynch also serves as Member of the Advisory Board of other Fidelity funds. Mr. Lynch is Vice Chairman and a Director of FMR and FMR Co., Inc. In addition, Mr. Lynch serves as a Trustee of Boston College and as the Chairman of the Inner-City Scholarship Fund. Previously, Mr. Lynch served on the Special Olympics International Board of Directors (1997-2006). |
Elizabeth Paige Baumann (1968) |
Year of Election or Appointment: 2012 Anti-Money Laundering (AML) Officer |
| Ms. Baumann also serves as AML Officer of other funds. She is Chief AML Officer of FMR LLC (2012-present) and is an employee of Fidelity Investments. Previously, Ms. Baumann served as Vice President and Deputy Anti-Money Laundering Officer (2007-2012). |
William C. Coffey (1969) |
Year of Election or Appointment: 2009 Assistant Secretary |
| Mr. Coffey also serves as Assistant Secretary of other funds. He is Senior Vice President and Deputy General Counsel of FMR LLC (2010-present), and is an employee of Fidelity Investments. Previously, Mr. Coffey served as Vice President and Associate General Counsel of FMR LLC (2005-2009). |
Jonathan Davis (1968) |
Year of Election or Appointment: 2010 Assistant Treasurer |
| Mr. Davis also serves as Assistant Treasurer of other funds. Mr. Davis is an employee of Fidelity Investments. Previously, Mr. Davis served as Vice President and Associate General Counsel of FMR LLC (2003-2010). |
Adrien E. Deberghes (1967) |
Year of Election or Appointment: 2008 Deputy Treasurer |
| Mr. Deberghes also serves as an officer of other funds. He is an employee of Fidelity Investments (2008-present). Prior to joining Fidelity Investments, Mr. Deberghes was Senior Vice President of Mutual Fund Administration at State Street Corporation (2007-2008), Senior Director of Mutual Fund Administration at Investors Bank & Trust (2005-2007), and Director of Finance for Dunkin' Brands (2000-2005). |
Stephanie J. Dorsey (1969) |
Year of Election or Appointment: 2010 Assistant Treasurer |
| Ms. Dorsey also serves as an officer of other funds. She is an employee of Fidelity Investments (2008-present) and has served in other fund officer roles. Prior to joining Fidelity Investments, Ms. Dorsey served as Treasurer (2004-2008) of the JPMorgan Mutual Funds and Vice President (2004-2008) of JPMorgan Chase Bank. |
Scott C. Goebel (1968) |
Year of Election or Appointment: 2008 Secretary and Chief Legal Officer (CLO) |
| Mr. Goebel serves as Secretary and CLO of other funds. Mr. Goebel also serves as Secretary of Fidelity Investments Money Management, Inc. (FIMM) (2010-present) and Fidelity Research and Analysis Company (FRAC) (2010-present); General Counsel, Secretary, and Senior Vice President of FMR (2008-present) and FMR Co., Inc. (2008-present); Chief Legal Officer of Fidelity Management & Research (Hong Kong) Limited (2008-present) and Assistant Secretary of Fidelity Management & Research (Japan) Inc. (2008-present), and Fidelity Management & Research (U.K.) Inc. (2008-present). Previously, Mr. Goebel served as Secretary and CLO of other Fidelity funds (2008-2013), Assistant Secretary of FIMM (2008-2010), FRAC (2008-2010), and certain funds (2007-2008); and as Vice President and Secretary of Fidelity Distributors Corporation (FDC) (2005-2007). Mr. Goebel has been employed by FMR LLC or an affiliate since 2001. |
Joseph A. Hanlon (1968) |
Year of Election or Appointment: 2012 Chief Compliance Officer |
| Mr. Hanlon also serves as Chief Compliance Officer of other funds. Mr. Hanlon serves as Compliance Officer of FMR, FMR Co., Inc., Fidelity Investments Money Management, Inc. (FIMM), Fidelity Research and Analysis Company (FRAC), and Fidelity Management & Research (Hong Kong) (2009-present), as Senior Vice President of the Fidelity Asset Management Division (2009-present), and is an employee of Fidelity Investments. Previously, Mr. Hanlon served as Compliance Officer of Fidelity Management & Research (Japan) Inc. (2009-2013), Strategic Advisers, Inc. (2009-2013), and Fidelity Management & Research (U.K.) Inc. (2009-2013). |
Bruce T. Herring (1965) |
Year of Election or Appointment: 2006 Vice President of certain Equity Funds |
| Mr. Herring also serves as Vice President of other funds. He serves as Chief Investment Officer of Fidelity Global Asset Allocation (GAA) (2013-present), Group Chief Investment Officer of FMR, and President of Fidelity Research & Analysis Company (2010-present). Previously, Mr. Herring served as Chief Investment Officer and Director of Fidelity Management & Research (U.K.) Inc. (2010-2013), Vice President (2005-2006) and Senior Vice President (2006-2007) of Fidelity Management & Research Company, Vice President of FMR Co., Inc. (2001-2007), and as a portfolio manager for Fidelity U.S. Equity Funds. |
Brian B. Hogan (1964) |
Year of Election or Appointment: 2009 Vice President |
| Mr. Hogan also serves as Vice President of other funds. Mr. Hogan serves as President of FMR's Equity Division (2009-present). Previously, Mr. Hogan served as Senior Vice President, Equity Research of FMR (2006-2009) and as a portfolio manager. |
Chris Maher (1972) |
Year of Election or Appointment: 2013 Assistant Treasurer |
| Mr. Maher serves as Assistant Treasurer of other funds. Mr. Maher is Vice President of Valuation Oversight and is an employee of Fidelity Investments. Previously, Mr. Maher served as Vice President of Asset Management Compliance (2013), Vice President of FMR's Program Management Group (2010-2013), and Vice President of Valuation Oversight (2008-2010). |
Christine Reynolds (1958) |
Year of Election or Appointment: 2008 Chief Financial Officer |
| Ms. Reynolds also serves as Chief Financial Officer of other funds. Ms. Reynolds became President of Fidelity Pricing and Cash Management Services (FPCMS) in August 2008. Ms. Reynolds served as Chief Operating Officer of FPCMS (2007-2008). Previously, Ms. Reynolds served as President, Treasurer, and Anti-Money Laundering officer of the Fidelity funds (2004-2007). |
Kenneth B. Robins (1969) |
Year of Election or Appointment: 2008 President and Treasurer |
| Mr. Robins also serves as an officer of other funds. Mr. Robins serves as Executive Vice President of Fidelity Investments Money Management, Inc. (FIMM) (2013-present) and is an employee of Fidelity Investments (2004-present). Previously, Mr. Robins served in other fund officer roles. |
Gary W. Ryan (1958) |
Year of Election or Appointment: 2005 Assistant Treasurer |
| Mr. Ryan also serves as Assistant Treasurer of other funds. Mr. Ryan is an employee of Fidelity Investments and has served in other fund officer roles. Previously, Mr. Ryan served as Vice President of Fund Reporting in Fidelity Pricing and Cash Management Services (FPCMS) (1999-2005). |
Stephen Sadoski (1971) |
Year of Election or Appointment: 2012 Deputy Treasurer |
| Mr. Sadoski also serves as Deputy Treasurer of other funds. He is an employee of Fidelity Investments (2012-present) and has served in another fund officer role. Prior to joining Fidelity Investments, Mr. Sadoski served as an assistant chief accountant in the Division of Investment Management of the Securities and Exchange Commission (SEC) (2009-2012) and as a senior manager at Deloitte & Touche LLP (1997-2009). |
Stacie M. Smith (1974) |
Year of Election or Appointment: 2013 Deputy Treasurer |
| Ms. Smith also serves as an officer of other funds. She is an employee of Fidelity Investments (2009-present) and has served in other fund officer roles. Prior to joining Fidelity Investments, Ms. Smith served as Senior Audit Manager of Ernst & Young LLP (1996-2009). |
Renee Stagnone (1975) |
Year of Election or Appointment: 2013 Deputy Treasurer |
| Ms. Stagnone also serves as Deputy Treasurer of other funds. Ms. Stagnone is an employee of Fidelity Investments. |
Joseph F. Zambello (1957) |
Year of Election or Appointment: 2011 Deputy Treasurer |
| Mr. Zambello also serves as Deputy Treasurer of other funds. Mr. Zambello is an employee of Fidelity Investments. Previously, Mr. Zambello served as Vice President of FMR's Program Management Group (2009-2011) and Vice President of the Transfer Agent Oversight Group (2005-2009). |
Annual Report
The Board of Trustees of VIP Overseas Portfolio voted to pay to shareholders of record at the opening of business on record date, the following distributions per share derived from capital gains realized from sales of portfolio securities:
| Pay Date | Record Date | Capital Gains |
Initial Class R | 02/14/14 | 02/14/14 | $0.005 |
Service Class R | 02/14/14 | 02/14/14 | $0.005 |
Service Class 2R | 02/14/14 | 02/14/14 | $0.005 |
Investor Class R | 02/14/14 | 02/14/14 | $0.005 |
Initial Class R, Service Class R, Service Class 2R and Investor Class R designates 2% of the dividends distributed during the fiscal year as qualifying for the dividends-received deduction for corporate shareholders.
The amounts per share which represent income derived from sources within, and taxes paid to, foreign countries or possessions of the United States are as follows:
| Pay Date | Income | Taxes |
Initial Class R | 12/13/13 | $0.346 | $0.0163 |
Service Class R | 12/13/13 | $0.328 | $0.0163 |
Service Class 2R | 12/13/13 | $0.305 | $0.0163 |
Investor Class R | 12/13/13 | $0.335 | $0.0163 |
Annual Report
Board Approval of Investment Advisory Contracts and Management Fees
VIP Overseas Portfolio
Each year, the Board of Trustees, including the Independent Trustees (together, the Board), votes on the renewal of the management contract and sub-advisory agreements (together, the Advisory Contracts) for the fund. The Board, assisted by the advice of fund counsel and Independent Trustees' counsel, requests and considers a broad range of information relevant to the renewal of the Advisory Contracts throughout the year.
The Board meets regularly and, at each of its meetings, covers an extensive agenda of topics and materials and considers factors that are relevant to its annual consideration of the renewal of the fund's Advisory Contracts, including the services and support provided to the fund and its shareholders. The Board has established various standing committees, each composed of and chaired by Independent Trustees with varying backgrounds, to which the Board has assigned specific subject matter responsibilities in order to enhance effective decision-making by the Board. The Board, acting directly and through its Committees, requests and receives information concerning the annual consideration of the renewal of the fund's Advisory Contracts. The Board also meets as needed to consider matters specifically related to the Board's annual consideration of the renewal of Advisory Contracts. Members of the Board may also meet with trustees of other Fidelity funds through ad hoc joint committees to discuss certain matters relevant to the Fidelity funds.
At its July 2013 meeting, the Board, including the Independent Trustees, unanimously determined to renew the fund's Advisory Contracts. In reaching its determination, the Board considered all factors it believed relevant, including (i) the nature, extent, and quality of the services to be provided to the fund and its shareholders (including the investment performance of the fund); (ii) the competitiveness of the fund's management fee and total expense ratio relative to peer funds; (iii) the total costs of the services to be provided by and the profits to be realized by Fidelity from its relationship with the fund; (iv) the extent to which economies of scale exist and would be realized as the fund grows; and (v) whether fee levels reflect these economies of scale, if any, for the benefit of fund shareholders.
In considering whether to renew the Advisory Contracts for the fund, the Board reached a determination, with the assistance of fund counsel and Independent Trustees' counsel and through the exercise of its business judgment, that the renewal of the Advisory Contracts was in the best interests of the fund and its shareholders and that the compensation payable under the Advisory Contracts was fair and reasonable. The Board's decision to renew the Advisory Contracts was not based on any single factor, but rather was based on a comprehensive consideration of all the information provided to the Board at its meetings throughout the year. The Board, in reaching its determination to renew the Advisory Contracts, was aware that shareholders in the fund have a broad range of investment choices available to them, including a wide choice among mutual funds offered by Fidelity's competitors, and that the fund's shareholders, who have the opportunity to review and weigh the disclosure provided by the fund in its prospectus and other public disclosures, have chosen to invest in this fund, which is a part of the Fidelity family of funds.
Nature, Extent, and Quality of Services Provided. The Board considered the staffing within the investment adviser, Fidelity Management & Research Company (FMR), and the sub-advisers (together, the Investment Advisers) as it relates to the fund, including the backgrounds of the fund's investment personnel, and also considered the fund's investment objective, strategies, and related investment philosophy. The Independent Trustees also had discussions with senior management of Fidelity's investment operations and investment groups. The Board considered the structure of the portfolio manager compensation program and whether this structure provides appropriate incentives to act in the best interests of the fund.
Resources Dedicated to Investment Management and Support Services. The Board and the Fund Oversight and Research Committees reviewed the general qualifications and capabilities of the Investment Advisers' investment staff, including its size, education, experience, and resources, as well as the Investment Advisers' approach to recruiting, training, managing, and compensating investment personnel. The Board noted that FMR has continued to increase the resources devoted to non-U.S. offices, including expansion of Fidelity's global investment organization. The Board also noted that Fidelity's analysts have extensive resources, tools and capabilities that allow them to conduct sophisticated quantitative and fundamental analysis, as well as credit analysis of issuers, counterparties and guarantors. Further, the Board believes that Fidelity's investment professionals have sufficient access to global information and data so as to provide competitive investment results over time, and that those professionals also have access to sophisticated tools that permit them to assess portfolio construction and risk and performance attribution characteristics continuously, as well as to transmit new information and research conclusions rapidly around the world. Additionally, in its deliberations, the Board considered the Investment Advisers' trading and risk management capabilities and resources, which are an integral part of the investment management process.
Shareholder and Administrative Services. The Board considered (i) the nature, extent, quality, and cost of advisory, administrative, and shareholder services performed by the Investment Advisers and their affiliates under the Advisory Contracts and under separate agreements covering transfer agency, pricing and bookkeeping, and securities lending services for the fund; (ii) the nature and extent of the supervision of third party service providers, principally custodians and subcustodians; and (iii) the resources devoted to, and the record of compliance with, the fund's compliance policies and procedures. The Board also reviewed the allocation of fund brokerage, including allocations to brokers affiliated with the Investment Advisers, the use of brokerage commissions to pay fund expenses, and the use of "soft" commission dollars to pay for research services.
The Board noted that the growth of fund assets over time across the complex allows Fidelity to reinvest in the development of services designed to enhance the value or convenience of the Fidelity funds as investment vehicles. These services include 24-hour access to account information and market information through telephone representatives and over the Internet, investor education materials and asset allocation tools, and the expanded availability of Fidelity Investor Centers.
Annual Report
Investment in a Large Fund Family. The Board considered the benefits to shareholders of investing in a Fidelity fund, including the benefits of investing in a fund that is part of a large family of funds offering a variety of investment disciplines and providing a large variety of mutual fund investor services. The Board noted that Fidelity had taken, or had made recommendations that resulted in the Fidelity funds taking, a number of actions over the previous year that benefited particular funds, including (i) continuing to dedicate additional resources to investment research and to the support of the senior management team that oversees asset management; (ii) persisting in efforts to enhance Fidelity's global research capabilities; (iii) launching new funds and making other enhancements to meet client needs for global and income-oriented solutions; (iv) continuing to launch dedicated lower cost underlying funds to meet portfolio construction needs related to expanding underlying fund options for Fidelity funds of funds, specifically for the Freedom Fund product lines; (v) rationalizing product lines and gaining increased efficiencies through the mergers of several funds into other funds; (vi) strengthening Fidelity's index fund offerings by reducing investment minimums and adopting or lowering existing expense caps for certain funds and classes; (vii) enhancing Global Asset Allocation product offerings by launching new funds and strategies, including "open architecture" target date funds that utilize affiliated and unaffiliated sub-advisers; (viii) modifying the eligibility criteria for Institutional Class shares of Advisor funds to increase their marketability to a portion of the defined contribution plan market; (ix) creating a new low-cost retirement share class for certain Advisor funds to appeal to large retirement plans; (x) transitioning the management of certain Fidelity commodity funds to Geode Capital Management LLC, a registered commodity pool operator, while retaining administrative responsibilities for the funds; (xi) reorganizing a number of funds; and (xii) taking steps toward establishing a new Fidelity adviser to manage sector-based funds and products.
Investment Performance. The Board considered whether the fund has operated in accordance with its investment objective, as well as its record of compliance with its investment restrictions and its performance history.
The Board took into account discussions with the Investment Advisers about fund investment performance that occur at Board meetings throughout the year. In this regard the Board noted that as part of regularly scheduled fund reviews and other reports to the Board on fund performance, the Board periodically considers annualized return information for the fund, for different time periods, measured against a securities market index ("benchmark index") and a peer group of mutual funds with similar objectives ("peer group"). In its evaluation of fund investment performance, the Board gave particular attention to information indicating changes in performance of certain Fidelity funds for specific time periods and the Investment Advisers' explanations for any overperformance or underperformance.
In addition to reviewing absolute and relative fund performance, the Independent Trustees periodically consider the appropriateness of fund performance metrics in evaluating the results achieved. In general, the Independent Trustees believe that fund performance should be evaluated based on net performance (after fees and expenses) of both the highest performing and lowest performing classes, where applicable, compared to appropriate benchmark indices, over appropriate time periods which may include full market cycles, and compared to peer groups, as applicable, over the same periods, taking into account relevant factors including the following: general market conditions; issuer-specific information; tactical opportunities for investment; and fund cash flows and other factors.
The Independent Trustees recognize that shareholders evaluate performance on a net basis over their own holding periods, for which one-, three-, and five-year periods are used as a proxy. For this reason, the performance information reviewed by the Board also included net cumulative calendar year total return information for the fund and an appropriate benchmark index and peer group for the most recent one-, three-, and five-year periods, as shown below. Returns are shown compared to the 25th percentile (top of box) and 75th percentile (bottom of box) of the peer universe. Returns of the benchmark index are "net MA," i.e., adjusted for tax withholding rates applicable to U.S.-based mutual funds organized as Massachusetts business trusts.
Annual Report
Board Approval of Investment Advisory Contracts and Management Fees - continued
VIP Overseas Portfolio
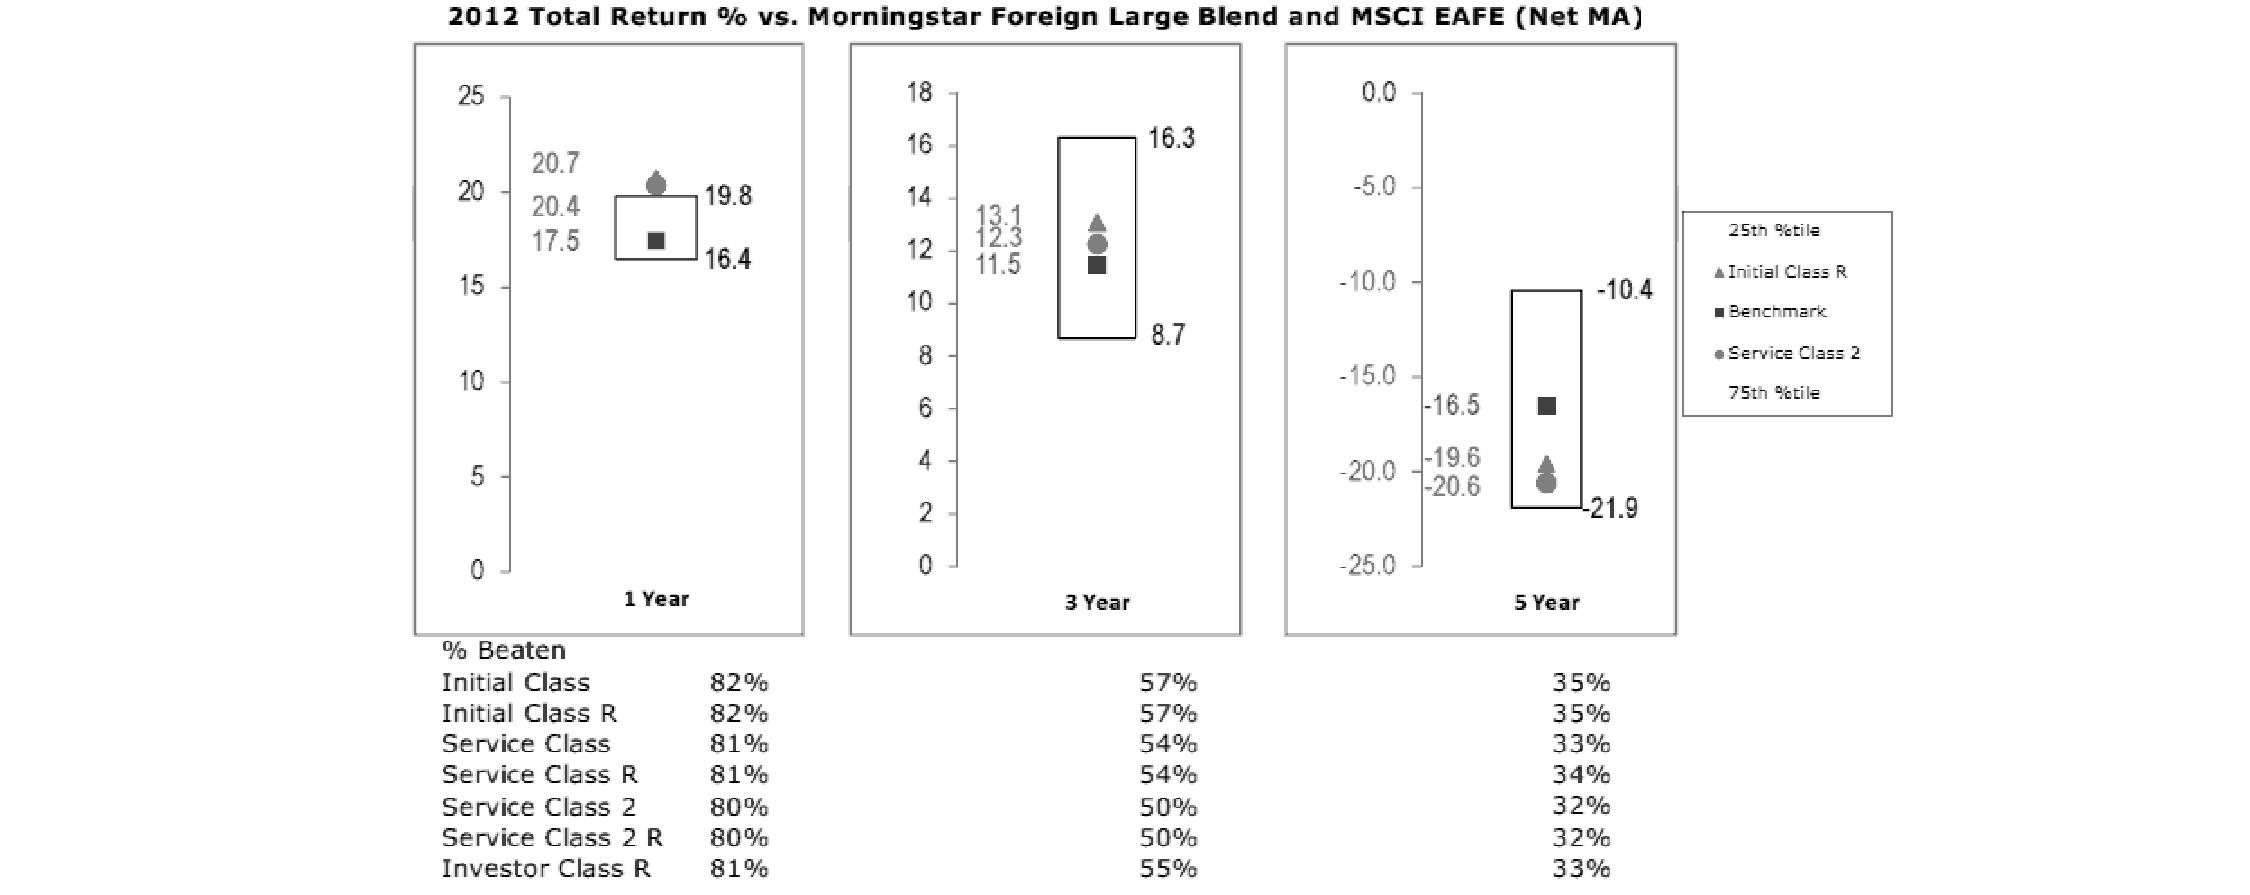
Based on its review, the Board concluded that the nature, extent, and quality of services provided to the fund under the Advisory Contracts should benefit the fund's shareholders.
Competitiveness of Management Fee and Total Expense Ratio. The Board considered the fund's management fee and total expense ratio compared to "mapped groups" of competitive funds and classes. Fidelity creates "mapped groups" by combining similar Lipper investment objective categories that have comparable management fee characteristics. Combining Lipper investment objective categories aids the Board's management fee and total expense ratio comparisons by broadening the competitive group used for comparison and by reducing the number of universes to which various Fidelity funds are compared.
Management Fee. The Board considered two proprietary management fee comparisons for the 12-month periods shown in the chart below. The group of Lipper funds used by the Board for management fee comparisons is referred to below as the "Total Mapped Group." The Total Mapped Group comparison focuses on a fund's standing in terms of gross management fees before expense reimbursements or caps relative to the total universe of funds with comparable investment mandates, regardless of whether their management fee structures also are comparable. Funds with comparable investment mandates offer exposure to similar types of securities. Funds with comparable management fee structures have similar management fee contractual arrangements (e.g., flat rate charged for advisory services, all-inclusive fee rate, etc.). "TMG %" represents the percentage of funds in the Total Mapped Group that had management fees that were lower than the fund's. For example, a TMG % of 19% means that 81% of the funds in the Total Mapped Group had higher management fees than the fund. The "Asset-Size Peer Group" (ASPG) comparison focuses on a fund's standing relative to a subset of non-Fidelity funds within the Total Mapped Group that are similar in size and management fee structure. The ASPG represents at least 15% of the funds in the Total Mapped Group with comparable asset size and management fee structures, subject to a minimum of 50 funds (or all funds in the Total Mapped Group if fewer than 50). Additional information, such as the ASPG quartile in which the fund's management fee ranked, is also included in the chart and considered by the Board.
Annual Report
VIP Overseas Portfolio

The Board noted that the fund's management fee ranked below the median of its Total Mapped Group and below the median of its ASPG for 2012.
Based on its review, the Board concluded that the fund's management fee is fair and reasonable in light of the services that the fund receives and the other factors considered.
Total Expense Ratio. In its review of each class's total expense ratio, the Board considered the fund's management fee as well as other fund or class expenses, as applicable, such as transfer agent fees, pricing and bookkeeping fees, fund-paid 12b-1 fees, and custodial, legal, and audit fees. The Board also noted the effects of any waivers and reimbursements on fees and expenses. As part of its review, the Board also considered the current and historical total expense ratios of each class of the fund compared to competitive fund median expenses. Each class of the fund is compared to those funds and classes in the Total Mapped Group (used by the Board for management fee comparisons) that have a similar sales load structure.
The Board noted that the total expense ratio of each of Initial Class, Initial Class R, Investor Class R, Service Class and Service Class R ranked below its competitive median for 2012 and the total expense ratio of each of Service Class 2 and Service Class 2 R ranked above its competitive median for 2012. The Board considered that, in general, various factors can affect total expense ratios. The Board noted that the fund offers multiple classes, each of which has a different 12b-1 fee structure, and that the multiple structures are intended to offer a range of pricing options for the intermediary market. The Board also noted that the total expense ratios of the classes vary primarily by the level of their 12b-1 fees, although differences in transfer agent fees may also cause expenses to vary from class to class.
Fees Charged to Other Fidelity Clients. The Board also considered Fidelity fee structures and other information with respect to clients of FMR and its affiliates, such as other mutual funds advised or subadvised by FMR or its affiliates, pension plan clients, and other institutional clients. The Board noted the findings of the 2013 ad hoc joint committee (created with the board of other Fidelity funds), which reviewed and compared Fidelity's institutional investment advisory business with its business of providing services to the Fidelity funds, including the differences in services provided, fees charged, and costs incurred, as well as competition in their respective marketplaces.
Based on its review of total expense ratios and fees charged to other Fidelity clients, the Board concluded that the total expense ratio of each class of the fund was reasonable, although in some cases above the median of the universe presented for comparison, in light of the services that the fund and its shareholders receive and the other factors considered.
Costs of the Services and Profitability. The Board considered the revenues earned and the expenses incurred by Fidelity in conducting the business of developing, marketing, distributing, managing, administering and servicing the fund and servicing the fund's shareholders. The Board also considered the level of Fidelity's profits in respect of all the Fidelity funds.
On an annual basis, FMR presents to the Board Fidelity's profitability for the fund. Fidelity calculates the profitability for each fund, as well as aggregate profitability for groups of Fidelity funds and all Fidelity funds, using a series of detailed revenue and cost allocation methodologies which originate with the books and records of Fidelity on which Fidelity's audited financial statements are based. The Audit Committee of the Board reviews any significant changes from the prior year's methodologies.
PricewaterhouseCoopers LLP (PwC), independent registered public accounting firm and auditor to Fidelity and certain Fidelity funds, has been engaged annually by the Board as part of the Board's assessment of Fidelity's profitability analysis. PwC's engagement includes the review and assessment of the methodologies used by Fidelity in determining the revenues and expenses attributable to Fidelity's mutual fund business, and completion of agreed-upon procedures surrounding the mathematical accuracy of fund profitability and its conformity to allocation methodologies. After considering PwC's reports issued under the engagement and information provided by Fidelity, the Board concluded that while other allocation methods may also be reasonable, Fidelity's profitability methodologies are reasonable in all material respects.
Annual Report
Board Approval of Investment Advisory Contracts and Management Fees - continued
The Board also reviewed Fidelity's non-fund businesses and fall-out benefits related to the mutual fund business as well as cases where Fidelity's affiliates may benefit from or be related to the fund's business.
The Board considered the costs of the services provided by and the profits realized by Fidelity in connection with the operation of the fund and was satisfied that the profitability was not excessive in the circumstances.
Economies of Scale. The Board considered whether there have been economies of scale in respect of the management of the Fidelity funds, whether the Fidelity funds (including the fund) have appropriately benefited from any such economies of scale, and whether there is potential for realization of any further economies of scale. The Board considered the extent to which the fund will benefit from economies of scale through increased services to the fund, through waivers or reimbursements, or through fee or expense reductions. The Board also noted that in 2009, it and the board of other Fidelity funds created an ad hoc committee (the Economies of Scale Committee) to analyze whether FMR attains economies of scale in respect of the management and servicing of the Fidelity funds, whether the Fidelity funds have appropriately benefited from such economies of scale, and whether there is potential for realization of any further economies of scale.
The Board recognized that the fund's management contract incorporates a "group fee" structure, which provides for lower group fee rates as total fund assets under FMR's management increase, and for higher group fee rates as total fund assets under FMR's management decrease. FMR calculates the group fee rates based on a tiered asset "breakpoint" schedule that varies based on asset class. The Board considered that the group fee is designed to deliver the benefits of economies of scale to fund shareholders when total Fidelity fund assets increase, even if assets of any particular fund are unchanged or have declined, because some portion of Fidelity's costs are attributable to services provided to all Fidelity funds, and all funds benefit if those costs can be allocated among more assets. The Board concluded that, given the group fee structure, fund shareholders will benefit from lower management fees as assets under FMR's management increase at the fund complex level, regardless of whether Fidelity achieves any such economies of scale.
The Board concluded, taking into account the analysis of the Economies of Scale Committee, that economies of scale, if any, are being appropriately shared between fund shareholders and Fidelity.
Amendment to Description of Group Fee Rate. At its July 2013 meeting, the Board voted to approve an amendment to the fund's management contract to modify the description of the "group fee rate" effective August 1, 2013. The Board noted that under the prior description in the contract, the group fee rate was based on the average net assets of all registered investment companies with which FMR has management contracts. Under the contract's tiered asset breakpoint schedule, the group fee rate is lower as total fund assets under FMR's management increase, and higher as total fund assets under FMR's management decrease. The Board considered that the prior description would have excluded the assets of 64 Fidelity sector funds from the group fee rate calculation once Fidelity SelectCo, LLC, an affiliate of FMR, assumed management responsibilities for those funds. The Board noted that modifying the description of the group fee rate to continue to include the assets of those 64 funds for purposes of determining group fee rate breakpoints would avoid an immediate adverse impact on the group fee rate for any fund.
Additional Information Requested by the Board. In order to develop fully the factual basis for consideration of the Fidelity funds' Advisory Contracts, the Board requested and received additional information on certain topics, including: (i) fund performance trends and Fidelity's long-term strategies for certain funds; (ii) the potential to further rationalize the Fidelity fund lineup with the possibility of achieving savings for the funds and Fidelity; (iii) the methodology with respect to competitive fund data and peer group classifications; (iv) the arrangements with, and performance of, certain sub-advisers on behalf of the Fidelity funds, as well as certain proposed participating affiliate arrangements; (v) the realization of fall-out benefits in certain Fidelity business units; (vi) Fidelity's group fee structures, including the rationale for the individual fee rates of certain categories of funds and the definition of group assets; (vii) trends regarding industry use of performance fee structures and the performance adjustment methodologies applicable to the Fidelity funds; (viii) additional competitive analysis regarding the total expenses for certain classes; and (ix) fund profitability methodology, including Fidelity's cost allocation methodology, and the impact of certain factors on fund profitability results.
Based on its evaluation of all of the conclusions noted above, and after considering all factors it believed relevant, the Board ultimately concluded that the advisory fee structures are fair and reasonable, and that the fund's Advisory Contracts should be renewed.
Annual Report
Investment Adviser
Fidelity Management & Research Company
Boston, MA
Investment Sub-Advisers
FMR Co., Inc.
Fidelity Management & Research (U.K.) Inc.
Fidelity Management & Research (Japan) Inc.
Fidelity Management & Research (Hong Kong) Limited
FIL Investment Advisors
FIL Investment Advisors (UK) Limited
FIL Investments (Japan) Limited
General Distributor
Fidelity Distributors Corporation
Smithfield, RI
Transfer and Service Agents
Fidelity Investments Institutional Operations Company, Inc.
Boston, MA
Fidelity Service Company, Inc.
Boston, MA
Custodian
JPMorgan Chase Bank
New York, NY
VIPOVRSR-ANN-0214
1.781996.111
Item 2. Code of Ethics
As of the end of the period, December 31, 2013, Variable Insurance Products Fund (the trust) has adopted a code of ethics, as defined in Item 2 of Form N-CSR, that applies to its President and Treasurer and its Chief Financial Officer. A copy of the code of ethics is filed as an exhibit to this Form N-CSR.
Item 3. Audit Committee Financial Expert
The Board of Trustees of the trust has determined that Joseph Mauriello is an audit committee financial expert, as defined in Item 3 of Form N-CSR. Mr. Mauriello is independent for purposes of Item 3 of Form N-CSR.
Item 4. Principal Accountant Fees and Services
Fees and Services
The following table presents fees billed by Deloitte & Touche LLP, the member firms of Deloitte Touche Tohmatsu, and their respective affiliates (collectively, "Deloitte Entities") in each of the last two fiscal years for services rendered to Value Portfolio (the "Fund"):
Services Billed by Deloitte Entities
December 31, 2013 FeesA
| Audit Fees | Audit-Related Fees | Tax Fees | All Other Fees |
Value Portfolio | $44,000 | $- | $7,500 | $600 |
December 31, 2012 FeesA
| Audit Fees | Audit-Related Fees | Tax Fees | All Other Fees |
Value Portfolio | $42,000 | $- | $7,000 | $400 |
A Amounts may reflect rounding.
The following table presents fees billed by PricewaterhouseCoopers LLP ("PwC") in each of the last two fiscal years for services rendered to Equity-Income Portfolio, Growth Portfolio, High Income Portfolio and Overseas Portfolio (the "Funds"):
Services Billed by PwC
December 31, 2013 FeesA
| Audit Fees | Audit-Related Fees | Tax Fees | All Other Fees |
Equity-Income Portfolio | $69,000 | $- | $3,500 | $3,700 |
Growth Portfolio | $63,000 | $- | $3,100 | $3,000 |
High Income Portfolio | $81,000 | $- | $3,300 | $2,000 |
Overseas Portfolio | $64,000 | $- | $5,400 | $2,000 |
December 31, 2012 FeesA
| Audit Fees | Audit-Related Fees | Tax Fees | All Other Fees |
Equity-Income Portfolio | $68,000 | $- | $5,100 | $3,800 |
Growth Portfolio | $62,000 | $- | $3,300 | $3,100 |
High Income Portfolio | $77,000 | $- | $3,300 | $2,100 |
Overseas Portfolio | $63,000 | $- | $5,300 | $2,100 |
A Amounts may reflect rounding.
The following table presents fees billed by PwC and Deloitte Entities that were required to be approved by the Audit Committee for services that relate directly to the operations and financial reporting of the Funds and that are rendered on behalf of Fidelity Management & Research Company ("FMR") and entities controlling, controlled by, or under common control with FMR (not including any sub-adviser whose role is primarily portfolio management and is subcontracted with or overseen by another investment adviser) that provide ongoing services to the Funds ("Fund Service Providers"):
Services Billed by Deloitte Entities
| December 31, 2013A | December 31, 2012A |
Audit-Related Fees | $765,000 | $910,000 |
Tax Fees | $- | $- |
All Other Fees | $795,000 | $955,000 |
A Amounts may reflect rounding.
Services Billed by PwC
| December 31, 2013A | December 31, 2012A |
Audit-Related Fees | $4,920,000 | $4,805,000 |
Tax Fees | $- | $- |
All Other Fees | $50,000 | $- |
A Amounts may reflect rounding.
"Audit-Related Fees" represent fees billed for assurance and related services that are reasonably related to the performance of the fund audit or the review of the fund's financial statements and that are not reported under Audit Fees.
"Tax Fees" represent fees billed for tax compliance, tax advice or tax planning that relate directly to the operations and financial reporting of the fund.
"All Other Fees" represent fees billed for services provided to the fund or Fund Service Provider, a significant portion of which are assurance related, that relate directly to the operations and financial reporting of the fund, excluding those services that are reported under Audit Fees, Audit-Related Fees or Tax Fees.
Assurance services must be performed by an independent public accountant.
* * *
The aggregate non-audit fees billed by PwC and Deloitte Entities for services rendered to the Funds, FMR (not including any sub-adviser whose role is primarily portfolio management and is subcontracted with or overseen by another investment adviser), and any Fund Service Provider for each of the last two fiscal years of the Funds are as follows:
Billed By | December 31, 2013 A | December 31, 2012 A |
PwC | $5,545,000 | $5,640,000 |
Deloitte Entities | $1,690,000 | $1,900,000 |
A Amounts may reflect rounding.
The trust's Audit Committee has considered non-audit services that were not pre-approved that were provided by PwC and Deloitte Entities to Fund Service Providers to be compatible with maintaining the independence of PwC and Deloitte Entities in their audits of the Funds, taking into account representations from PwC and Deloitte Entities, in accordance with Public Company Accounting Oversight Board rules, regarding their independence from the Funds and their related entities and FMR's review of the appropriateness and permissibility under applicable law of such non-audit services prior to their provision to the Fund Service Providers.
Audit Committee Pre-Approval Policies and Procedures
The trust's Audit Committee must pre-approve all audit and non-audit services provided by a fund's independent registered public accounting firm relating to the operations or financial reporting of the fund. Prior to the commencement of any audit or non-audit services to a fund, the Audit Committee reviews the services to determine whether they are appropriate and permissible under applicable law.
The Audit Committee has adopted policies and procedures to, among other purposes, provide a framework for the Committee's consideration of non-audit services by the audit firms that audit the Fidelity funds. The policies and procedures require that any non-audit service provided by a fund audit firm to a Fidelity fund and any non-audit service provided by a fund auditor to a Fund Service Provider that relates directly to the operations and financial reporting of a Fidelity fund ("Covered Service") are subject to approval by the Audit Committee before such service is provided.
All Covered Services must be approved in advance of provision of the service either: (i) by formal resolution of the Audit Committee, or (ii) by oral or written approval of the service by the Chair of the Audit Committee (or if the Chair is unavailable, such other member of the Audit Committee as may be designated by the Chair to act in the Chair's absence). The approval contemplated by (ii) above is permitted where the Treasurer determines that action on such an engagement is necessary before the next meeting of the Audit Committee.
Non-audit services provided by a fund audit firm to a Fund Service Provider that do not relate directly to the operations and financial reporting of a Fidelity fund are reported to the Audit Committee on a periodic basis.
Non-Audit Services Approved Pursuant to Rule 2-01(c)(7)(i)(C) and (ii) of Regulation S-X ("De Minimis Exception")
There were no non-audit services approved or required to be approved by the Audit Committee pursuant to the De Minimis Exception during the Funds' last two fiscal years relating to services provided to (i) the Funds or (ii) any Fund Service Provider that relate directly to the operations and financial reporting of the Funds.
Item 5. Audit Committee of Listed Registrants
Not applicable.
Item 6. Investments
(a) Not applicable.
(b) Not applicable
Item 7. Disclosure of Proxy Voting Policies and Procedures for Closed-End Management Investment Companies
Not applicable.
Item 8. Portfolio Managers of Closed-End Management Investment Companies
Not applicable.
Item 9. Purchase of Equity Securities by Closed-End Management Investment Company and Affiliated Purchasers
Not applicable.
Item 10. Submission of Matters to a Vote of Security Holders
There were no material changes to the procedures by which shareholders may recommend nominees to the trust's Board of Trustees.
Item 11. Controls and Procedures
(a)(i) The President and Treasurer and the Chief Financial Officer have concluded that the trust's disclosure controls and procedures (as defined in Rule 30a-3(c) under the Investment Company Act) provide reasonable assurances that material information relating to the trust is made known to them by the appropriate persons, based on their evaluation of these controls and procedures as of a date within 90 days of the filing date of this report.
(a)(ii) There was no change in the trust's internal control over financial reporting (as defined in Rule 30a-3(d) under the Investment Company Act) that occurred during the second fiscal quarter of the period covered by this report that has materially affected, or is reasonably likely to materially affect, the trust's internal control over financial reporting.
Item 12. Exhibits
(a) | (1) | Code of Ethics pursuant to Item 2 of Form N-CSR is filed and attached hereto as EX-99.CODE ETH. |
(a) | (2) | Certification pursuant to Rule 30a-2(a) under the Investment Company Act of 1940 (17 CFR 270.30a-2(a)) is filed and attached hereto as Exhibit 99.CERT. |
(a) | (3) | Not applicable. |
(b) | | Certification pursuant to Rule 30a-2(b) under the Investment Company Act of 1940 (17 CFR 270.30a-2(b)) is furnished and attached hereto as Exhibit 99.906CERT. |
SIGNATURES
Pursuant to the requirements of the Securities Exchange Act of 1934 and the Investment Company Act of 1940, the registrant has duly caused this report to be signed on its behalf by the undersigned, thereunto duly authorized.
Variable Insurance Products Fund
By: | /s/Kenneth B. Robins |
| Kenneth B. Robins |
| President and Treasurer |
| |
Date: | February 21, 2014 |
Pursuant to the requirements of the Securities Exchange Act of 1934 and the Investment Company Act of 1940, this report has been signed below by the following persons on behalf of the registrant and in the capacities and on the dates indicated.
By: | /s/Kenneth B. Robins |
| Kenneth B. Robins |
| President and Treasurer |
| |
Date: | February 21, 2014 |
By: | /s/Christine Reynolds |
| Christine Reynolds |
| Chief Financial Officer |
| |
Date: | February 21, 2014 |