UNITED STATES
SECURITIES AND EXCHANGE COMMISSION
Washington, D.C. 20549
FORM N-CSR
CERTIFIED SHAREHOLDER REPORT OF REGISTERED
MANAGEMENT INVESTMENT COMPANIES
Investment Company Act file number 811-3329
Variable Insurance Products Fund
(Exact name of registrant as specified in charter)
245 Summer St., Boston, Massachusetts 02210
(Address of principal executive offices) (Zip code)
Scott C. Goebel, Secretary
245 Summer St.
Boston, Massachusetts 02210
(Name and address of agent for service)
Registrant's telephone number, including area code: 617-563-7000
Date of fiscal year end: | December 31 |
|
|
Date of reporting period: | December 31, 2014 |
This report on Form N-CSR relates solely to the Registrant's VIP Floating Rate High Income series (the "Fund").
Item 1. Reports to Stockholders
Fidelity® Variable Insurance Products:
Floating Rate High Income Portfolio
Annual Report
December 31, 2014
(Fidelity Cover Art)
Contents
Performance | How the fund has done over time. | |
Management's Discussion of Fund Performance | The Portfolio Managers' review of fund performance and strategy. | |
Shareholder Expense Example | An example of shareholder expenses. | |
Investment Changes | A summary of major shifts in the fund's investments over the past six months. | |
Investments | A complete list of the fund's investments with their market values. | |
Financial Statements | Statements of assets and liabilities, operations, and changes in net assets, as well as financial highlights. | |
Notes | Notes to the financial statements. | |
Report of Independent Registered Public Accounting Firm |
| |
Trustees and Officers |
| |
Board Approval of Investment Advisory Contracts and Management Fees |
|
To view a fund's proxy voting guidelines and proxy voting record for the 12-month period ended June 30, visit http://www.fidelity.com/proxyvotingresults or visit the Securities and Exchange Commission's (SEC) web site at http://www.sec.gov. You may also call 1-877-208-0098 to request a free copy of the proxy voting guidelines.
Fidelity Variable Insurance Products are separate account options which are purchased through a variable insurance contract.
Standard & Poor's, S&P and S&P 500 are registered service marks of The McGraw-Hill Companies, Inc. and have been licensed for use by Fidelity Distributors Corporation.
Other third-party marks appearing herein are the property of their respective owners.
All other marks appearing herein are registered or unregistered trademarks or service marks of FMR LLC or an affiliated company. © 2015 FMR LLC. All rights reserved.
This report and the financial statements contained herein are submitted for the general information of the shareholders of the fund. This report is not authorized for distribution to prospective investors in the fund unless preceded or accompanied by an effective prospectus.
A fund files its complete schedule of portfolio holdings with the SEC for the first and third quarters of each fiscal year on Form N-Q. Forms N-Q are available on the SEC's web site at http://www.sec.gov. A fund's Forms N-Q may be reviewed and copied at the SEC's Public Reference Room in Washington, DC. Information regarding the operation of the SEC's Public Reference Room may be obtained by calling 1-800-SEC-0330. For a complete list of a fund's portfolio holdings, view the most recent holdings listing, semiannual report, or annual report on Fidelity's web site at http://www.fidelity.com, http://www.advisor.fidelity.com, or http://www.401k.com, as applicable.
NOT FDIC INSURED • MAY LOSE VALUE • NO BANK GUARANTEE
Neither the fund nor Fidelity Distributors Corporation is a bank.
Annual Report
Performance: The Bottom Line
Average annual total return reflects the change in the value of an investment, assuming reinvestment of the class' distributions from dividend income and capital gains (the profits earned upon the sale of securities that have grown in value, if any) and assuming a constant rate of performance each year. During periods of reimbursement by Fidelity, a fund's total return will be greater than it would be had the reimbursement not occurred. Performance numbers are net of all underlying fund operating expenses, but do not include any insurance charges imposed by your insurance company's separate account. If performance information included the effect of these additional charges, the total returns would have been lower. How a fund did yesterday is no guarantee of how it will do tomorrow.
Average annual total returns take VIP Floating Rate High Income Portfolio - Initial Class's and Investor Class's cumulative total return and show you what would have happened if Initial Class and Investor Class shares had performed at a constant rate each year. These numbers will be reported once the fund is a year old.
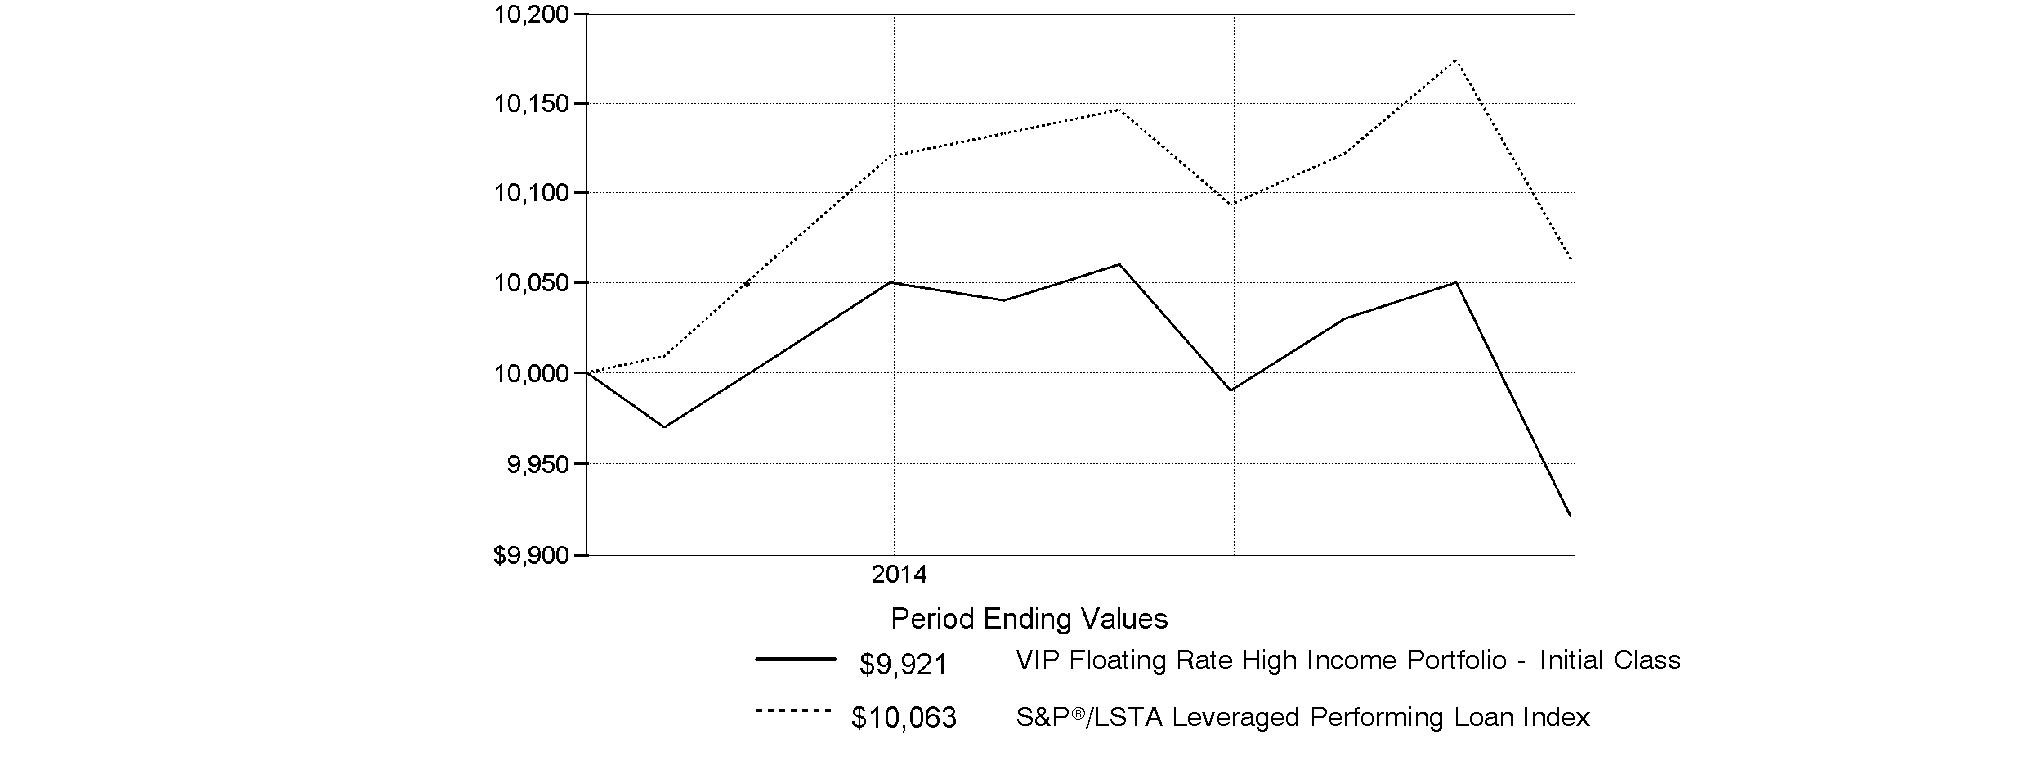
$10,000 Over Life of Fund
Let's say hypothetically that $10,000 was invested in VIP Floating Rate High Income Portfolio - Initial Class on April 9, 2014, when the fund started. The chart shows how the value of your investment would have changed, and also shows how the S&P®/LSTA Leveraged Performing Loan Index performed over the same period.
Annual Report
Managements' Discussion of Fund Performance
Market Recap: Global stocks and bonds posted gains for 2014 despite tepid returns outside the United States, amid recessionary pressure in parts of Asia, as well as anemic economic growth in Europe. The U.S. stock market closed near an all-time high for the 12 months ending December 31, 2014, supported by low interest rates and strong corporate profits. The large-cap S&P 500® Index returned 13.69%, achieving a double-digit return for the third consecutive year. The Barclays® U.S. Aggregate Bond Index, meanwhile, rose 5.97%, significantly outperforming the global taxable investment-grade bond market. Investment-grade credit did particularly well, returning 7.53%, supported by solid corporate fundamentals and a low default rate. The MSCI EAFE Index, a measure of non-U.S. developed stock markets, returned -4.77% for the year, hampered by late-period deflationary concerns in the eurozone. Meanwhile, The Barclays® Global Aggregate GDP Weighted Index, a measure of worldwide investment-grade bond performance, gained 0.77% in U.S. dollar terms. Turning to emerging-market stocks, The MSCI Emerging Markets Index returned -1.82% for the year, held back by continued concerns that a slowing Chinese economy may dampen earnings for companies that do business there.
Comments from Eric Mollenhauer and Kevin Nielsen, Co-Portfolio Managers of VIP Floating Rate High Income Portfolio: From its inception on April 9, 2014, through December 31, 2014, the fund's share classes trailed the 0.63% gain of the S&P®/LSTA Leveraged Performing Loan Index. Relative to the benchmark, a modest average overweighting in the poor-performing oil & gas industry, coupled with adverse security selection in retailers, lodging & casinos, and publishing, were the primary detractors. In terms of individual holdings, we selectively invested in the oil & gas industry, but the group was hurt by expectations of lower future demand due to the sharp decline in oil prices. Against this backdrop, the fund's largest individual detractors were three exploration & production (E&P) companies: Fieldwood Energy, Vantage Drilling and Cactus Wellhead. An out-of-benchmark position in a BBB-rated loan issued by Fortescue Metals Group, an iron ore producer in Australia, also detracted from relative performance. Given this loan's significant asset coverage and investment-grade credit rating, we were surprised by the volatility of its performance. However, commodities-related credits were hit hard late in the period, and Fortescue's loans were no exception. Our position in TNT Crane & Rigging also disappointed. On the plus side, we saw a large number of relatively small contributors, led by Drumm Investors, which operates skilled nursing facilities under the Golden Living brand. Below-plan business performance forced the company to renegotiate its loan agreement and increase the loan's stated interest rate. The higher rate sparked investor demand for the loan, driving its price up. Steering clear of index component Education Management, a provider of higher-education programs for working adults, proved advantageous. Underweighting Seadrill Operating and not holding index constituents Templar Energy and Ocean Rig - all E&P-related companies - aided relative performance and partially offset the negative impact of other holdings in the oil & gas industry.
The views expressed above reflect those of the portfolio manager(s) only through the end of the period as stated on the cover of this report and do not necessarily represent the views of Fidelity or any other person in the Fidelity organization. Any such views are subject to change at any time based upon market or other conditions and Fidelity disclaims any responsibility to update such views. These views may not be relied on as investment advice and, because investment decisions for a Fidelity fund are based on numerous factors, may not be relied on as an indication of trading intent on behalf of any Fidelity fund.
Annual Report
Shareholder Expense Example
As a shareholder of the Fund, you incur two types of costs: (1) transaction costs and (2) ongoing costs, including management fees and other Fund expenses. This Example is intended to help you understand your ongoing costs (in dollars) of investing in the Fund and to compare these costs with the ongoing costs of investing in other mutual funds.
The Example is based on an investment of $1,000 invested at the beginning of the period and held for the entire period (July 1, 2014 to December 31, 2014).
Actual Expenses
The first line of the accompanying table for each class of the Fund provides information about actual account values and actual expenses. You may use the information in this line, together with the amount you invested, to estimate the expenses that you paid over the period. Simply divide your account value by $1,000.00 (for example, an $8,600 account value divided by $1,000.00 = 8.6), then multiply the result by the number in the first line for a class of the Fund under the heading entitled "Expenses Paid During Period" to estimate the expenses you paid on your account during this period. The estimate of expenses does not include any fees or other expenses of any variable annuity or variable life insurance product. If they were, the estimate of expenses you paid during the period would be higher, and your ending account value would be lower. In addition, the Fund, as a shareholder in the underlying Fidelity Central Funds, will indirectly bear its pro-rata share of the fees and expenses incurred by the underlying Fidelity Central Funds. These fees and expenses are not included in the Fund's annualized expense ratio used to calculate the expense estimate in the table below.
Hypothetical Example for Comparison Purposes
The second line of the accompanying table for each class of the Fund provides information about hypothetical account values and hypothetical expenses based on a Class' actual expense ratio and an assumed rate of return of 5% per year before expenses, which is not the Class' actual return. The hypothetical account values and expenses may not be used to estimate the actual ending account balance or expenses you paid for the period. You may use this information to compare the ongoing costs of investing in the Fund and other funds. To do so, compare this 5% hypothetical example with the 5% hypothetical examples that appear in the shareholder reports of the other funds. The estimate of expenses does not include any fees or other expenses of any variable annuity or variable life insurance product. If they were, the estimate of expenses you paid during the period would be higher, and your ending account value would be lower. In addition, the Fund, as a shareholder in the underlying Fidelity Central Funds, will indirectly bear its pro-rata share of the fees and expenses incurred by the underlying Fidelity Central Funds. These fees and expenses are not included in the Fund's annualized expense ratio used to calculate the expense estimate in the table below.
Please note that the expenses shown in the table are meant to highlight your ongoing costs only and do not reflect any transaction costs. Therefore, the second line of the table is useful in comparing ongoing costs only, and will not help you determine the relative total costs of owning different funds.
| Annualized | Beginning | Ending | Expenses Paid |
Initial Class | .77% |
|
|
|
Actual |
| $ 1,000.00 | $ 987.10 | $ 3.86 |
HypotheticalA |
| $ 1,000.00 | $ 1,021.32 | $ 3.92 |
Investor Class | .80% |
|
|
|
Actual |
| $ 1,000.00 | $ 986.70 | $ 4.01 |
HypotheticalA |
| $ 1,000.00 | $ 1,021.17 | $ 4.08 |
A 5% return per year before expenses
B Annualized expense ratio reflects expenses net of applicable fee waivers.
* Expenses are equal to each Class' annualized expense ratio, multiplied by the average account value over the period, multiplied by 184/365 (to reflect the one-half year period).
Annual Report
Investment Changes (Unaudited)
Top Five Holdings as of December 31, 2014 | ||
(by issuer, excluding cash equivalents) | % of fund's | % of fund's net assets |
HCA Holdings, Inc. | 2.0 | 0.8 |
Dell International LLC | 1.9 | 1.4 |
Level 3 Financing, Inc. | 1.6 | 0.7 |
Albertson's LLC | 1.6 | 0.0 |
TransUnion LLC | 1.4 | 0.7 |
| 8.5 | |
Top Five Market Sectors as of December 31, 2014 | ||
| % of fund's | % of fund's net assets |
Healthcare | 9.3 | 8.1 |
Technology | 8.7 | 7.4 |
Containers | 7.5 | 8.7 |
Energy | 6.2 | 4.1 |
Utilities | 5.5 | 5.6 |
Quality Diversification (% of fund's net assets) | |||||||
As of December 31, 2014 | As of June 30, 2014 | ||||||
 | BBB 1.2% |
| | BBB 1.4% |
| ||
 | BB 28.6% |
| | BB 21.1% |
| ||
 | B 52.5% |
| | B 53.5% |
| ||
 | CCC,CC,C 3.9% |
| | CCC,CC,C 4.3% |
| ||
 | Not Rated 2.9% |
|  | Not Rated 8.4% |
| ||
 | Short-Term |
| | Short-Term |
| ||

We have used ratings from Moody's Investors Service, Inc. Where Moody's® ratings are not available, we have used S&P® ratings. All ratings are as of the date indicated and do not reflect subsequent changes. |
Asset Allocation (% of fund's net assets) | |||||||
As of December 31, 2014 * | As of June 30, 2014 ** | ||||||
| Bank Loan |
| | Bank Loan |
| ||
 | Nonconvertible |
| | Nonconvertible |
| ||
| Short-Term |
| | Short-Term |
| ||
* Foreign investments | 13.2% |
| ** Foreign investments | 11.0% |
| ||

Annual Report
Investments December 31, 2014
Showing Percentage of Net Assets
Bank Loan Obligations (d) - 85.5% | ||||
| Principal Amount | Value | ||
Aerospace - 1.8% | ||||
Gemini HDPE LLC Tranche B, term loan 4.75% 8/7/21 (c) | $ 498,751 | $ 478,801 | ||
TransDigm, Inc.: | ||||
Tranche C, term loan 3.75% 2/28/20 (c) | 993,664 | 971,307 | ||
Tranche D, term loan 3.75% 6/4/21 (c) | 462,675 | 451,108 | ||
| 1,901,216 | |||
Air Transportation - 1.4% | ||||
American Airlines, Inc. Tranche B, term loan 4.25% 10/10/21 (c) | 250,000 | 249,598 | ||
Landmark Worldwide Tranche 1LN, term loan 4.75% 10/25/19 (c) | 1,243,698 | 1,218,824 | ||
| 1,468,422 | |||
Automotive & Auto Parts - 1.5% | ||||
Federal-Mogul Corp. Tranche C, term loan 4.75% 4/15/21 (c) | 498,750 | 495,009 | ||
North American Lifting Holdings, Inc.: | ||||
Tranche 1LN, term loan 5.5% 11/27/20 (c) | 746,514 | 668,130 | ||
Tranche 2LN, term loan 10% 11/27/21 (c) | 500,000 | 452,500 | ||
| 1,615,639 | |||
Broadcasting - 0.9% | ||||
Clear Channel Communications, Inc. Tranche D, term loan 6.9193% 1/30/19 (c) | 500,000 | 471,875 | ||
ION Media Networks, Inc. Tranche B, term loan 4.75% 12/18/20 (c) | 500,000 | 495,000 | ||
| 966,875 | |||
Building Materials - 0.5% | ||||
Interline Brands, Inc. Tranche B, term loan 4% 3/17/21 (c) | 496,250 | 481,983 | ||
Cable/Satellite TV - 3.2% | ||||
Charter Communications Operating LLC Tranche E, term loan 3% 7/1/20 (c) | 496,222 | 478,854 | ||
Liberty Cablevision of Puerto Rico: | ||||
Tranche 1LN, term loan 4.5% 1/7/22 (c) | 60,000 | 59,400 | ||
Tranche 2LN, term loan 7.75% 7/7/23 (c) | 240,000 | 237,024 | ||
Tranche A 1LN, term loan 1/7/22 (e) | 250,000 | 242,500 | ||
Numericable LLC: | ||||
Tranche B 1LN, term loan 4.5% 5/8/20 (c) | 592,450 | 592,450 | ||
Tranche B 2LN, term loan 4.5% 5/8/20 (c) | 512,550 | 512,550 | ||
Virgin Media Finance PLC Tranche B, term loan 3.5% 6/7/20 (c) | 1,250,000 | 1,228,125 | ||
| 3,350,903 | |||
| ||||
| Principal Amount | Value | ||
Capital Goods - 0.7% | ||||
Doosan Infracore, Inc. Tranche B, term loan 4.5% 5/28/21 (c) | $ 73,446 | $ 72,895 | ||
Husky Injection Molding Systems Ltd. Tranche 1LN, term loan 4.25% 6/30/21 (c) | 246,198 | 238,504 | ||
Mueller Water Products, Inc. Tranche B, term loan 4% 11/25/21 (c) | 220,000 | 220,000 | ||
SRAM LLC. Tranche B, term loan 4.0125% 4/10/20 (c) | 232,226 | 222,937 | ||
| 754,336 | |||
Chemicals - 1.8% | ||||
Arizona Chem U.S., Inc.: | ||||
Tranche 2LN, term loan 7.5% 6/12/22 (c) | 20,000 | 19,575 | ||
Tranche B 1LN, term loan 4.5% 6/12/21 (c) | 65,397 | 63,517 | ||
Eco Services Operations LLC Tranche B, term loan 4.75% 12/1/21 (c) | 375,000 | 372,188 | ||
Hilex Poly Co. LLC Tranche B 1LN, term loan 6% 12/5/21 (c) | 500,000 | 492,415 | ||
Orion Engineered Carbons GMBH Tranche B, term loan 5% 7/25/21 (c) | 498,750 | 496,880 | ||
Styrolution U.S. Holding LLC Tranche B, term loan 6.5% 11/7/19 (c) | 450,000 | 434,250 | ||
| 1,878,825 | |||
Consumer Products - 0.9% | ||||
Hercules Achievement, Inc. Tranche B, term loan 6% 12/11/21 (c) | 750,000 | 745,313 | ||
Kate Spade & Co. Tranche B, term loan 4% 4/10/21 (c) | 250,000 | 240,000 | ||
| 985,313 | |||
Containers - 6.6% | ||||
Anchor Glass Container Corp. Tranche B, term loan 4.3246% 6/30/21 (c) | 620,000 | 613,800 | ||
Ardagh Holdings U.S.A., Inc. Tranche B, term loan 4% 12/17/19 (c) | 496,250 | 485,705 | ||
Berlin Packaging, LLC: | ||||
Tranche 2LN, term loan 7.75% 10/1/22 (c) | 250,000 | 246,250 | ||
Tranche B 1LN, term loan 4.5% 10/1/21 (c) | 498,750 | 496,256 | ||
Berry Plastics Corp. Tranche E, term loan 3.75% 1/6/21 (c) | 1,359,167 | 1,304,800 | ||
BWAY Holding Co. Tranche B, term loan 5.5515% 8/14/20 (c) | 820,875 | 812,666 | ||
Consolidated Container Co. Tranche 2LN, term loan 7.75% 1/3/20 (c) | 1,000,000 | 952,500 | ||
Bank Loan Obligations (d) - continued | ||||
| Principal Amount | Value | ||
Containers - continued | ||||
Reynolds Consumer Products Holdings, Inc. Tranche B, term loan 4% 12/1/18 (c) | $ 1,241,848 | $ 1,207,697 | ||
Signode Packaging Systems, Inc. Tranche B, term loan 3.75% 5/1/21 (c) | 169,956 | 163,158 | ||
U.S. Devices Prescription Co.: | ||||
Tranche 2LN, term loan 8% 5/2/22 (c) | 250,000 | 248,125 | ||
Tranche B 1LN, term loan 4.25% 5/2/21 (c) | 497,500 | 490,038 | ||
| 7,020,995 | |||
Diversified Financial Services - 2.1% | ||||
IBC Capital U.S. LLC Tranche B 1LN, term loan 4.75% 11/15/21 (c) | 280,000 | 278,600 | ||
Ocwen Loan Servicing, LLC Tranche B, term loan 5% 2/15/18 (c) | 493,759 | 461,665 | ||
TransUnion LLC Tranche B, term loan 4% 4/9/21 (c) | 1,491,237 | 1,480,053 | ||
| 2,220,318 | |||
Diversified Media - 0.2% | ||||
Block Communications, Inc. Tranche B, term loan 5.75% 11/7/21 (c) | 249,375 | 248,452 | ||
Energy - 5.6% | ||||
Alon U.S.A. Partners LP term loan 9.25% 11/26/18 (c) | 746,193 | 746,193 | ||
Drillships Ocean Ventures, Inc. Tranche B, term loan 5.5% 7/25/21 (c) | 299,250 | 243,889 | ||
Empire Generating Co. LLC: | ||||
Tranche B, term loan 5.25% 3/14/21 (c) | 462,797 | 455,855 | ||
Tranche C, term loan 5.25% 3/14/21 (c) | 32,532 | 32,044 | ||
Expro Finservices S.a.r.l. Tranche B, term loan 5.75% 9/2/21 (c) | 498,750 | 405,858 | ||
Fieldwood Energy, LLC Tranche 2LN, term loan 8.375% 9/30/20 (c) | 250,000 | 181,563 | ||
Floatel International Ltd. Tranche B, term loan 6% 6/27/20 (c) | 158,800 | 129,422 | ||
Moxie Patriot LLC Tranche B, term loan 6.75% 12/19/20 (c) | 750,000 | 745,313 | ||
Offshore Group Investment Ltd. Tranche B, term loan 5% 10/25/17 (c) | 241,841 | 195,741 | ||
Overseas Shipholding Group, Inc. Tranche B, term loan 5.25% 8/5/19 (c) | 124,375 | 120,955 | ||
Panda Sherman Power, LLC term loan 9% 9/14/18 (c) | 498,906 | 491,921 | ||
Preferred Proppants LLC Tranche B, term loan 6.75% 7/27/20 (c) | 249,375 | 221,944 | ||
| ||||
| Principal Amount | Value | ||
Seadrill Operating LP Tranche B, term loan 4% 2/21/21 (c) | $ 153,835 | $ 118,453 | ||
Terra-Gen Finance Co. LLC Tranche B, term loan 5.25% 12/9/21 (c) | 410,000 | 408,463 | ||
TerraForm Power Operating LLC Tranche B, term loan 4.75% 7/23/19 (c) | 179,100 | 178,876 | ||
TPF II Power, LLC Tranche B, term loan 5.5% 10/2/21 (c) | 730,000 | 730,000 | ||
Vantage Drilling Co. Tranche B, term loan 5.75% 3/28/19 (c) | 744,318 | 554,517 | ||
| 5,961,007 | |||
Environmental - 1.3% | ||||
ADS Waste Holdings, Inc. Tranche B 2LN, term loan 3.75% 10/9/19 (c) | 491,984 | 478,454 | ||
Tervita Corp. Tranche B 1LN, term loan 6.25% 5/15/18 (c) | 996,834 | 917,087 | ||
| 1,395,541 | |||
Food & Drug Retail - 4.2% | ||||
Albertson's LLC: | ||||
Tranche B 3LN, term loan 4% 8/25/19 (c) | 250,000 | 245,000 | ||
Tranche B 4LN, term loan: | ||||
4.5% 8/25/21 (c) | 1,345,000 | 1,341,638 | ||
4.5% 8/25/21 (c) | 150,000 | 147,750 | ||
Ferrara Candy Co., Inc. Tranche B, term loan 7.5% 6/18/18 (c) | 496,183 | 478,817 | ||
GOBP Holdings, Inc. Tranche B 1LN, term loan 5.75% 10/21/21 (c) | 375,000 | 374,063 | ||
Performance Food Group, Inc. Tranche 2LN, term loan 6.25% 11/14/19 (c) | 1,241,181 | 1,214,806 | ||
PRA Holdings, Inc. Tranche B, term loan 4.5% 9/23/20 (c) | 411,609 | 406,463 | ||
Stater Bros. Markets Tranche B, term loan 4.75% 5/12/21 (c) | 249,375 | 245,634 | ||
| 4,454,171 | |||
Food/Beverage/Tobacco - 2.4% | ||||
Blue Ribbon LLC Tranche B 1LN, term loan 5.75% 11/13/21 (c) | 250,000 | 248,125 | ||
Flavors Holdings, Inc. Tranche B 1LN, term loan 6.75% 4/3/20 (c) | 246,875 | 235,766 | ||
H.J. Heinz Co. Tranche B 2LN, term loan 3.5% 6/7/20 (c) | 1,294,511 | 1,286,421 | ||
Post Holdings, Inc. Tranche B, term loan 3.75% 6/2/21 (c) | 49,750 | 49,501 | ||
Shearer's Foods, Inc.: | ||||
Tranche 2LN, term loan 7.75% 6/30/22 (c) | 255,000 | 247,988 | ||
Tranche B 1LN, term loan 4.5% 6/30/21 (c) | 508,725 | 502,366 | ||
| 2,570,167 | |||
Bank Loan Obligations (d) - continued | ||||
| Principal Amount | Value | ||
Gaming - 5.2% | ||||
Aristocrat International (Pty) Ltd. Tranche B, term loan 4.75% 10/20/21 (c) | $ 500,000 | $ 488,750 | ||
Caesars Entertainment Resort Properties LLC Tranche B 1LN, term loan 7% 10/11/20 (c) | 540,279 | 502,686 | ||
Caesars Growth Properties Holdings, LLC Tranche 1LN, term loan 6.25% 5/8/21 (c) | 1,318,998 | 1,200,289 | ||
CCM Merger, Inc. Tranche B, term loan 4.5% 8/8/21 (c) | 249,158 | 244,798 | ||
Golden Nugget, Inc. Tranche B, term loan: | ||||
5.5% 11/21/19 (c) | 348,241 | 343,888 | ||
5.5% 11/21/19 (c) | 149,246 | 147,381 | ||
Mohegan Tribal Gaming Authority Tranche B, term loan 5.5% 11/19/19 (c) | 496,241 | 475,949 | ||
Scientific Games Corp.: | ||||
Tranch B 2LN, term loan 6% 10/21/21 (c) | 250,000 | 245,625 | ||
Tranche B, term loan 6% 10/18/20 (c) | 993,728 | 976,338 | ||
Station Casinos LLC Tranche B, term loan 4.25% 3/1/20 (c) | 977,849 | 952,229 | ||
| 5,577,933 | |||
Healthcare - 8.3% | ||||
AmSurg Corp. Tranche B, term loan 3.75% 7/16/21 (c) | 597,000 | 591,030 | ||
Auris Luxembourg III S.a.r.l. Tranche B, term loan 12/12/21 (e) | 250,000 | 249,063 | ||
Community Health Systems, Inc. Tranche D, term loan 4.25% 1/27/21 (c) | 744,984 | 741,259 | ||
DaVita HealthCare Partners, Inc. Tranche B, term loan 3.5% 6/24/21 (c) | 744,380 | 736,936 | ||
Dialysis Newco, Inc.: | ||||
Tranche 2LN, term loan 7.75% 10/22/21 (c) | 250,000 | 248,125 | ||
Tranche B 1LN, term loan 4.5% 4/23/21 (c) | 89,550 | 88,655 | ||
Drumm Investors LLC Tranche B, term loan 6.75% 5/4/18 (c) | 1,176,933 | 1,176,933 | ||
HCA Holdings, Inc. Tranche B 4LN, term loan 3.0051% 5/1/18 (c) | 1,051,741 | 1,041,223 | ||
INC Research LLC Tranche B, term loan 4.75% 11/13/21 (c) | 265,000 | 264,006 | ||
MPH Acquisition Holdings LLC Tranche B, term loan 3.75% 3/31/21 (c) | 454,545 | 440,909 | ||
Patheon, Inc. Tranche B, term loan 4.25% 3/11/21 (c) | 497,500 | 481,331 | ||
| ||||
| Principal Amount | Value | ||
Pharmedium Healthcare Corp. Tranche B 1LN, term loan 4.25% 1/28/21 (c) | $ 474,028 | $ 452,697 | ||
Polymer Group, Inc. Tranche B, term loan 5.25% 12/19/19 (c) | 737,227 | 725,247 | ||
Skilled Healthcare Group, Inc. term loan 7% 4/9/16 (c) | 595,968 | 594,478 | ||
U.S. Renal Care, Inc. Tranche B 2LN, term loan 4.25% 7/3/19 (c) | 978,163 | 961,045 | ||
| 8,792,937 | |||
Homebuilders/Real Estate - 1.4% | ||||
DTZ U.S. Borrower LLC: | ||||
Tranche B 1LN, term loan 11/4/21 (e) | 313,333 | 311,767 | ||
Tranche B, term loan 11/4/21 (e) | 186,667 | 185,733 | ||
Realogy Group LLC Tranche B, term loan 3.75% 3/5/20 (c) | 992,481 | 972,632 | ||
| 1,470,132 | |||
Hotels - 0.4% | ||||
La Quinta Intermediate Holdings LLC Tranche B LN, Tranche B, term loan 4% 4/14/21 (c) | 451,283 | 446,770 | ||
Insurance - 0.4% | ||||
HUB International Ltd. Tranche B 1LN, term loan 4.25% 10/2/20 (c) | 496,250 | 478,881 | ||
Leisure - 1.1% | ||||
24 Hour Fitness Worldwide, Inc. Tranche B, term loan 4.75% 5/30/21 (c) | 383,075 | 367,752 | ||
ClubCorp Club Operations, Inc. Tranche B, term loan 4.5% 7/24/20 (c) | 500,000 | 491,565 | ||
Equinox Holdings, Inc. Tranche B 1LN, term loan 5.0004% 2/1/20 (c) | 14,925 | 14,738 | ||
Great Wolf Resorts, Inc. Tranche B, term loan 5.75% 8/6/20 (c) | 249,367 | 246,719 | ||
| 1,120,774 | |||
Metals/Mining - 2.8% | ||||
American Rock Salt Co. LLC Tranche B 1LN, term loan 4.75% 5/20/21 (c) | 701,475 | 683,938 | ||
Arch Coal, Inc. Tranche B, term loan 6.25% 5/16/18 (c) | 498,724 | 411,447 | ||
Doncasters Group, LLC Tranche B 1LN, term loan 4.5% 4/9/20 (c) | 59,546 | 58,504 | ||
Fortescue Metals Group Ltd. Tranche B, term loan 3.75% 6/30/19 (c) | 993,712 | 896,825 | ||
Murray Energy Corp. Tranche B 1LN, term loan 5.25% 12/5/19 (c) | 748,116 | 720,996 | ||
Walter Energy, Inc. Tranche B, term loan 7.25% 4/1/18 (c) | 250,000 | 192,500 | ||
| 2,964,210 | |||
Bank Loan Obligations (d) - continued | ||||
| Principal Amount | Value | ||
Paper - 0.1% | ||||
Xerium Technologies, Inc. Tranche B, term loan 6.25% 5/17/19 (c) | $ 69,823 | $ 69,823 | ||
Publishing/Printing - 1.1% | ||||
Getty Images, Inc. Tranche B, term loan 4.75% 10/18/19 (c) | 744,304 | 686,620 | ||
Proquest LLC Tranche B, term loan 5.25% 10/24/21 (c) | 500,000 | 494,375 | ||
| 1,180,995 | |||
Restaurants - 1.3% | ||||
Burger King Worldwide, Inc. Tranche B, term loan 4.5% 10/27/21 (c) | 1,000,000 | 990,000 | ||
CEC Entertainment, Inc. Tranche B, term loan 4% 2/14/21 (c) | 247,503 | 241,316 | ||
Red Lobster Hospitality LLC Tranche B, term loan 6.25% 7/28/21 (c) | 134,663 | 133,653 | ||
TGI Friday's, Inc. Tranche B 1LN, term loan 5.25% 7/15/20 (c) | 64,314 | 63,993 | ||
| 1,428,962 | |||
Services - 4.9% | ||||
ARAMARK Corp. Tranche F, term loan 3.25% 2/24/21 (c) | 496,250 | 489,427 | ||
Bright Horizons Family Solutions Tranche B 2LN, term loan 1/30/20 (e) | 500,000 | 496,875 | ||
Cactus Wellhead LLC Tranche B, term loan 7% 7/31/20 (c) | 748,125 | 591,019 | ||
Coinmach Service Corp. Tranche B, term loan 4.2532% 11/14/19 (c) | 496,861 | 486,924 | ||
Creative Artists Agency LLC Tranche B, term loan 6.75% 12/17/21 (c) | 500,000 | 500,000 | ||
Laureate Education, Inc. Tranche B, term loan 5% 6/16/18 (c) | 1,488,501 | 1,414,076 | ||
Lineage Logistics Holdings, LLC. Tranche B, term loan 4.5% 4/7/21 (c) | 497,494 | 480,081 | ||
Nord Anglia Education Tranche B, term loan 4.5% 3/31/21 (c) | 247,503 | 246,575 | ||
The ServiceMaster Co. Tranche B, term loan 4.25% 7/1/21 (c) | 496,250 | 486,325 | ||
| 5,191,302 | |||
Steel - 0.5% | ||||
Essar Steel Algoma, Inc. Tranche B, term loan 7.5% 8/16/19 (c) | 498,750 | 494,386 | ||
Super Retail - 3.7% | ||||
BJ's Wholesale Club, Inc. Tranche B 1LN, term loan 4.5% 9/26/19 (c) | 496,241 | 486,316 | ||
J. Crew Group, Inc. Tranche B LN, term loan 4% 3/5/21 (c) | 995,000 | 927,838 | ||
JC Penney Corp., Inc. Tranche B, term loan: | ||||
5% 6/20/19 (c) | 558,600 | 537,653 | ||
| ||||
| Principal Amount | Value | ||
6% 5/22/18 (c) | $ 744,332 | $ 725,724 | ||
Sears Holdings Corp. Tranche ABL, term loan 5.5% 6/30/18 (c) | 997,481 | 957,582 | ||
Sports Authority, Inc. Tranche B, term loan 7.5% 11/16/17 (c) | 338,771 | 294,731 | ||
| 3,929,844 | |||
Technology - 8.7% | ||||
BMC Software Finance, Inc. Tranche B, term loan 5% 9/10/20 (c) | 496,241 | 471,429 | ||
Ceridian HCM Holding, Inc. Tranche B 2LN, term loan 4.5% 9/15/20 (c) | 70,000 | 69,300 | ||
Computer Discount Warehouse (CDW) LLC, Tranche B, term loan 3.25% 4/29/20 (c) | 993,682 | 963,872 | ||
Datapipe, Inc. Tranche B 1LN, term loan 5.25% 3/15/19 (c) | 246,881 | 241,326 | ||
Dell International LLC Tranche B, term loan 4.5% 4/29/20 (c) | 1,988,703 | 1,983,726 | ||
Fibertech Networks, LLC Tranche B 1LN, term loan 4% 12/18/19 (c) | 249,366 | 245,625 | ||
First Data Corp. Tranche B, term loan 3.667% 3/24/18 (c) | 1,500,000 | 1,455,150 | ||
G.I. Peak Merger Sub Corp.: | ||||
Tranche 2LN, term loan 8.25% 6/17/22 (c) | 50,000 | 48,250 | ||
Tranche B 1LN, term loan 5% 6/17/21 (c) | 119,400 | 117,012 | ||
Infor U.S., Inc. Tranche B 5LN, term loan 3.75% 6/3/20 (c) | 978,679 | 944,425 | ||
Kronos, Inc.: | ||||
Tranche 2LN, term loan 9.75% 4/30/20 (c) | 499,590 | 509,581 | ||
Tranche B 1LN, term loan 4.5% 10/30/19 (c) | 825,023 | 812,648 | ||
Renaissance Learning, Inc. Tranche 1LN, term loan 4.5% 4/9/21 (c) | 744,375 | 727,627 | ||
TIBCO Software, Inc. term loan 5.5% 12/5/15 (c) | 500,000 | 485,000 | ||
Vantiv LLC Tranche B, term loan 3.75% 6/13/21 (c) | 109,450 | 108,629 | ||
WP Mustang Holdings, LLC. Tranche B 1LN, term loan 5.5% 5/29/21 (c) | 74,625 | 73,785 | ||
| 9,257,385 | |||
Telecommunications - 4.8% | ||||
Altice Financing SA Tranche B, term loan 5.5% 6/24/19 (c) | 1,243,098 | 1,219,790 | ||
Digicel International Finance Ltd. Tranche D-2, term loan 3.7331% 3/31/19 (c) | 100,000 | 97,000 | ||
FairPoint Communications, Inc. Tranche B, term loan 7.5% 2/14/19 (c) | 249,365 | 248,119 | ||
FPL FiberNet, LLC. Tranche A, term loan 3.4906% 7/22/19 (c) | 245,313 | 245,313 | ||
Bank Loan Obligations (d) - continued | ||||
| Principal Amount | Value | ||
Telecommunications - continued | ||||
Intelsat Jackson Holdings SA Tranche B 2LN, term loan 3.75% 6/30/19 (c) | $ 500,000 | $ 491,250 | ||
Level 3 Financing, Inc.: | ||||
Tranche B 3LN, term loan 4% 8/1/19 (c) | 1,000,000 | 991,300 | ||
Tranche B 4LN, term loan 4% 1/15/20 (c) | 500,000 | 495,000 | ||
Tranche B 5LN, term loan 4.5% 1/31/22 (c) | 250,000 | 250,325 | ||
LTS Buyer LLC Tranche B 1LN, term loan 4% 4/11/20 (c) | 496,222 | 483,816 | ||
Securus Technologies Holdings, Inc. Tranche B 1LN, term loan 4.75% 4/30/20 (c) | 496,232 | 490,029 | ||
TCH-2 Holdings, LLC. Tranche B 1LN, term loan 5.5% 5/12/21 (c) | 44,781 | 43,885 | ||
| 5,055,827 | |||
Transportation Ex Air/Rail - 0.2% | ||||
YRC Worldwide, Inc. Tranche B, term loan 8.25% 2/13/19 (c) | 245,620 | 244,392 | ||
Utilities - 5.5% | ||||
Alinta Energy Finance Pty. Ltd. Tranche B, term loan: | ||||
2.3796% 8/13/18 (c)(f) | 61,799 | 61,490 | ||
6.375% 8/13/19 (c) | 933,435 | 928,768 | ||
Bayonne Energy Center, LLC Tranche B, term loan 5% 8/19/21 (c) | 232,721 | 230,394 | ||
Calpine Construction Finance Co. LP Tranche B 1LN, term loan 3% 5/3/20 (c) | 496,222 | 475,753 | ||
Energy Future Holdings Corp. Tranche 1LN, term loan 4.25% 6/19/16 (c) | 115,000 | 115,144 | ||
EquiPower Resources Holdings LLC Tranche B 1LN, term loan 4.25% 12/21/18 (c) | 236,703 | 235,224 | ||
Essential Power LLC Tranche B, term loan 4.75% 8/8/19 (c) | 992,202 | 969,878 | ||
Exgen Texas Power LLC Tranche B, term loan 5.75% 9/18/21 (c) | 498,611 | 491,132 | ||
Green Energy Partners/Stonewall LLC Tranche B 1LN, term loan 6.5% 11/13/21 (c) | 265,000 | 264,669 | ||
Houston Fuel Oil Terminal Co. Tranche B, term loan 4.25% 8/19/21 (c) | 433,913 | 414,386 | ||
InterGen NV Tranche B, term loan 5.5% 6/13/20 (c) | 746,212 | 738,750 | ||
| ||||
| Principal Amount | Value | ||
Southcross Energy Partners LP Tranche B, term loan 5.25% 8/4/21 (c) | $ 44,775 | $ 41,417 | ||
Southcross Holdings Borrower LP Tranche B, term loan 6% 8/4/21 (c) | 79,600 | 70,446 | ||
Southeast Powergen LLC Tranche B, term loan 4.5% 12/2/21 (c) | 85,000 | 84,150 | ||
USIC Holdings, Inc. Tranche B, term loan 4% 7/10/20 (c) | 742,437 | 720,164 | ||
| 5,841,765 | |||
TOTAL BANK LOAN OBLIGATIONS (Cost $93,377,835) | 90,820,481 | |||
Nonconvertible Bonds - 3.6% | ||||
| ||||
Cable/Satellite TV - 0.5% | ||||
Numericable Group SA 4.875% 5/15/19 (b) | 500,000 | 495,625 | ||
Containers - 0.9% | ||||
Ardagh Packaging Finance PLC/Ardagh MP Holdings U.S.A., Inc. 3.2406% 12/15/19 (b)(c) | 1,000,000 | 965,000 | ||
Energy - 0.6% | ||||
American Energy-Permian Basin LLC/ AEPB Finance Corp. 6.7324% 8/1/19 (b)(c) | 280,000 | 205,800 | ||
Chesapeake Energy Corp. 3.4806% 4/15/19 (c) | 35,000 | 34,300 | ||
Citgo Petroleum Corp. 6.25% 8/15/22 (b) | 135,000 | 137,025 | ||
Northern Tier Energy LLC/Northern Tier Finance Corp. 7.125% 11/15/20 (b) | 285,000 | 287,850 | ||
| 664,975 | |||
Food/Beverage/Tobacco - 0.5% | ||||
C&S Group Enterprises LLC 5.375% 7/15/22 (b) | 510,000 | 506,175 | ||
Healthcare - 1.0% | ||||
HCA Holdings, Inc.: | ||||
3.75% 3/15/19 | 500,000 | 500,625 | ||
4.25% 10/15/19 | 500,000 | 507,500 | ||
| 1,008,125 | |||
Paper - 0.1% | ||||
Mercer International, Inc. 7% 12/1/19 (b) | 80,000 | 80,800 | ||
Publishing/Printing - 0.0% | ||||
Cenveo Corp. 6% 8/1/19 (b) | 40,000 | 36,200 | ||
Telecommunications - 0.0% | ||||
FairPoint Communications, Inc. 8.75% 8/15/19 (b) | 40,000 | 40,200 | ||
Nonconvertible Bonds - continued | ||||
| Principal Amount | Value | ||
Utilities - 0.0% | ||||
The AES Corp. 3.2336% 6/1/19 (c) | $ 45,000 | $ 43,875 | ||
TOTAL NONCONVERTIBLE BONDS (Cost $3,974,642) | 3,840,975 | |||
Money Market Funds - 6.2% | |||
Shares |
| ||
Fidelity Cash Central Fund, 0.13% (a) | 6,576,608 | 6,576,608 | |
TOTAL INVESTMENT PORTFOLIO - 95.3% (Cost $103,929,085) | 101,238,064 | ||
NET OTHER ASSETS (LIABILITIES) - 4.7% | 4,974,746 | ||
NET ASSETS - 100% | $ 106,212,810 | ||
Legend |
(a) Affiliated fund that is generally available only to investment companies and other accounts managed by Fidelity Investments. The rate quoted is the annualized seven-day yield of the fund at period end. A complete unaudited listing of the fund's holdings as of its most recent quarter end is available upon request. In addition, each Fidelity Central Fund's financial statements, which are not covered by the Fund's Report of Independent Registered Public Accounting Firm, are available on the SEC's website or upon request. |
(b) Security exempt from registration under Rule 144A of the Securities Act of 1933. These securities may be resold in transactions exempt from registration, normally to qualified institutional buyers. At the end of the period, the value of these securities amounted to $2,754,675 or 2.6% of net assets. |
(c) Coupon rates for floating and adjustable rate securities reflect the rates in effect at period end. |
(d) Remaining maturities of bank loan obligations may be less than the stated maturities shown as a result of contractual or optional prepayments by the borrower. Such prepayments cannot be predicted with certainty. |
(e) The coupon rate will be determined upon settlement of the loan after period end. |
(f) Position or a portion of the position represents an unfunded loan commitment. At period end, the total principal amount and market value of unfunded commitments totaled $45,937 and $45,708, respectively. |
Affiliated Central Funds |
Information regarding fiscal year to date income earned by the Fund from investments in Fidelity Central Funds is as follows: |
Fund | Income earned |
Fidelity Cash Central Fund | $ 11,061 |
Other Information |
The following is a summary of the inputs used, as of December 31, 2014, involving the Fund's assets and liabilities carried at fair value. The inputs or methodology used for valuing securities may not be an indication of the risk associated with investing in those securities. For more information on valuation inputs, and their aggregation into the levels used in the table below, please refer to the Investment Valuation section in the accompanying Notes to Financial Statements. |
Valuation Inputs at Reporting Date: | ||||
Description | Total | Level 1 | Level 2 | Level 3 |
Investments in Securities: | ||||
Bank Loan Obligations | $ 90,820,481 | $ - | $ 90,230,043 | $ 590,438 |
Corporate Bonds | 3,840,975 | - | 3,840,975 | - |
Money Market Funds | 6,576,608 | 6,576,608 | - | - |
Total Investments in Securities: | $ 101,238,064 | $ 6,576,608 | $ 94,071,018 | $ 590,438 |
Distribution of investments by country or territory of incorporation, as a percentage of total net assets, is as follows (Unaudited): |
United States of America | 86.8% |
Canada | 3.4% |
Australia | 2.3% |
United Kingdom | 2.1% |
Luxembourg | 1.9% |
Others (Individually Less Than 1%) | 3.5% |
| 100.0% |
See accompanying notes which are an integral part of the financial statements.
Annual Report
Financial Statements
Statement of Assets and Liabilities
| December 31, 2014 | |
|
|
|
Assets | ||
Investment in securities, at value - See accompanying schedule: Unaffiliated issuers (cost $97,352,477) | $ 94,661,456 |
|
Fidelity Central Funds (cost $6,576,608) | 6,576,608 |
|
Total Investments (cost $103,929,085) |
| $ 101,238,064 |
Receivable for investments sold | 4,641,856 | |
Receivable for fund shares sold | 258,778 | |
Interest receivable | 926,018 | |
Distributions receivable from Fidelity Central Funds | 768 | |
Prepaid expenses | 353 | |
Total assets | 107,065,837 | |
|
|
|
Liabilities | ||
Payable for investments purchased | $ 723,346 | |
Payable for fund shares redeemed | 110 | |
Accrued management fee | 52,342 | |
Other affiliated payables | 13,514 | |
Other payables and accrued expenses | 63,715 | |
Total liabilities | 853,027 | |
|
|
|
Net Assets | $ 106,212,810 | |
Net Assets consist of: |
| |
Paid in capital | $ 109,520,771 | |
Distributions in excess of net investment income | (59,625) | |
Accumulated undistributed net realized gain (loss) on investments | (557,315) | |
Net unrealized appreciation (depreciation) on investments | (2,691,021) | |
Net Assets | $ 106,212,810 | |
Statement of Assets and Liabilities - continued
| December 31, 2014 | |
|
|
|
Initial Class: | $ 9.73 | |
|
|
|
Investor Class: | $ 9.73 | |
See accompanying notes which are an integral part of the financial statements.
Annual Report
Financial Statements - continued
Statement of Operations
| For the period April 9, 2014 | |
|
|
|
Investment Income |
|
|
Interest |
| $ 2,485,387 |
Income from Fidelity Central Funds |
| 11,061 |
Total income |
| 2,496,448 |
|
|
|
Expenses | ||
Management fee | $ 340,859 | |
Transfer agent fees | 60,824 | |
Accounting fees and expenses | 29,889 | |
Custodian fees and expenses | 6,416 | |
Independent trustees' compensation | 204 | |
Audit | 64,327 | |
Legal | 95 | |
Miscellaneous | 472 | |
Total expenses before reductions | 503,086 | |
Expense reductions | (16,816) | 486,270 |
Net investment income (loss) | 2,010,178 | |
Realized and Unrealized Gain (Loss) Net realized gain (loss) on: | ||
Investment securities: |
|
|
Unaffiliated issuers | (555,528) | |
Change in net unrealized appreciation (depreciation) on investment securities | (2,691,021) | |
Net gain (loss) | (3,246,549) | |
Net increase (decrease) in net assets resulting from operations | $ (1,236,371) | |
Statement of Changes in Net Assets
| For the period |
Increase (Decrease) in Net Assets |
|
Operations |
|
Net investment income (loss) | $ 2,010,178 |
Net realized gain (loss) | (555,528) |
Change in net unrealized appreciation (depreciation) | (2,691,021) |
Net increase (decrease) in net assets resulting from operations | (1,236,371) |
Distributions to shareholders from net investment income | (2,069,592) |
Share transactions - net increase (decrease) | 109,518,773 |
Total increase (decrease) in net assets | 106,212,810 |
|
|
Net Assets | |
Beginning of period | - |
End of period (including distributions in excess of net investment income of $59,625) | $ 106,212,810 |
See accompanying notes which are an integral part of the financial statements.
Annual Report
Financial Highlights - Initial Class
Year ended December 31, | 2014 H |
Selected Per-Share Data |
|
Net asset value, beginning of period | $ 10.00 |
Income from Investment Operations |
|
Net investment income (loss) E | .242 |
Net realized and unrealized gain (loss) | (.322) |
Total from investment operations | (.080) |
Distributions from net investment income | (.190) |
Net asset value, end of period | $ 9.73 |
Total ReturnB, C, D | (.79)% |
Ratios to Average Net Assets F, I |
|
Expenses before reductions | .84% A |
Expenses net of fee waivers, if any | .77% A |
Expenses net of all reductions | .77% A |
Net investment income (loss) | 3.31% A |
Supplemental Data |
|
Net assets, end of period (000 omitted) | $ 10,912 |
Portfolio Turnover rate G | 41% A |
A Annualized
B Total returns for periods of less than one year are not annualized.
C Total returns do not reflect charges attributable to your insurance company's separate account. Inclusion of these charges would reduce the total returns shown.
D Total returns would have been lower if certain expenses had not been reduced during the applicable periods shown.
E Calculated based on average shares outstanding during the period.
F Fees and expenses of any underlying Fidelity Central Funds are not included in the Fund's expense ratio. The Fund indirectly bears its proportionate share of the expenses of any underlying Fidelity Central Funds.
G Amount does not include the portfolio activity of any underlying Fidelity Central Funds.
H For the period April 9, 2014 (commencement of operations) to December 31, 2014.
I Expense ratios reflect operating expenses of the class. Expenses before reductions do not reflect amounts reimbursed by the investment adviser or reductions from expense offset arrangements and do not represent the amount paid by the class during periods when reimbursements or reductions occur. Expense ratios before reductions for start-up periods may not be representative of longer-term operating periods. Expenses net of fee waivers reflect expenses after reimbursement by the investment adviser but prior to reductions from expense offset arrangements. Expenses net of all reductions represent the net expenses paid by the class.
Financial Highlights - Investor Class
Year ended December 31, | 2014 H |
Selected Per-Share Data |
|
Net asset value, beginning of period | $ 10.00 |
Income from Investment Operations |
|
Net investment income (loss) E | .238 |
Net realized and unrealized gain (loss) | (.322) |
Total from investment operations | (.084) |
Distributions from net investment income | (.186) |
Net asset value, end of period | $ 9.73 |
Total ReturnB, C, D | (.83)% |
Ratios to Average Net Assets F, I |
|
Expenses before reductions | .82% A |
Expenses net of fee waivers, if any | .80% A |
Expenses net of all reductions | .80% A |
Net investment income (loss) | 3.28% A |
Supplemental Data |
|
Net assets, end of period (000 omitted) | $ 95,300 |
Portfolio Turnover rate G | 41% A |
A Annualized
B Total returns for periods of less than one year are not annualized.
C Total returns do not reflect charges attributable to your insurance company's separate account. Inclusion of these charges would reduce the total returns shown.
D Total returns would have been lower if certain expenses had not been reduced during the applicable periods shown.
E Calculated based on average shares outstanding during the period.
F Fees and expenses of any underlying Fidelity Central Funds are not included in the Fund's expense ratio. The Fund indirectly bears its proportionate share of the expenses of any underlying Fidelity Central Funds.
G Amount does not include the portfolio activity of any underlying Fidelity Central Funds.
H For the period April 9, 2014 (commencement of operations) to December 31, 2014.
I Expense ratios reflect operating expenses of the class. Expenses before reductions do not reflect amounts reimbursed by the investment adviser or reductions from expense offset arrangements and do not represent the amount paid by the class during periods when reimbursements or reductions occur. Expense ratios before reductions for start-up periods may not be representative of longer-term operating periods. Expenses net of fee waivers reflect expenses after reimbursement by the investment adviser but prior to reductions from expense offset arrangements. Expenses net of all reductions represent the net expenses paid by the class.
See accompanying notes which are an integral part of the financial statements.
Annual Report
Notes to Financial Statements
For the period ended December 31, 2014
1. Organization.
VIP Floating Rate High Income Portfolio (the Fund) is a fund of Variable Insurance Products Fund (the Trust) and is authorized to issue an unlimited number of shares. The Trust is registered under the Investment Company Act of 1940, as amended (the 1940 Act), as an open-end management investment company organized as a Massachusetts business trust. Shares of the Fund may only be purchased by insurance companies for the purpose of funding variable annuity or variable life insurance contracts. The Fund offers the following classes of shares: Initial Class shares and Investor Class shares. All classes have equal rights and voting privileges, except for matters affecting a single class.
2. Investments in Fidelity Central Funds.
The Fund invests in Fidelity Central Funds, which are open-end investment companies generally available only to other investment companies and accounts managed by the investment adviser and its affiliates. The Fund's Schedule of Investments lists each of the Fidelity Central Funds held as of period end, if any, as an investment of the Fund, but does not include the underlying holdings of each Fidelity Central Fund. As an Investing Fund, the Fund indirectly bears its proportionate share of the expenses of the underlying Fidelity Central Funds.
The Money Market Central Funds seek preservation of capital and current income and are managed by Fidelity Investments Money Management, Inc. (FIMM), an affiliate of the investment adviser. Annualized expenses of the Money Market Central Funds as of their most recent shareholder report date are less than .01%.
A complete unaudited list of holdings for each Fidelity Central Fund is available upon request or at the Securities and Exchange Commission (the SEC) website at www.sec.gov. In addition, the financial statements of the Fidelity Central Funds, which are not covered by the Fund's Report of Independent Registered Public Accounting Firm, are available on the SEC website or upon request.
3. Significant Accounting Policies.
The financial statements have been prepared in conformity with accounting principles generally accepted in the United States of America (GAAP), which require management to make certain estimates and assumptions at the date of the financial statements. Actual results could differ from those estimates. Subsequent events, if any, through the date that the financial statements were issued have been evaluated in the preparation of the financial statements. The following summarizes the significant accounting policies of the Fund:
Investment Valuation. Investments are valued as of 4:00 p.m. Eastern time on the last calendar day of the period. In accordance with valuation policies and procedures approved by the Board of Trustees (the Board), the Fund attempts to obtain prices from one or more third party pricing vendors or brokers to value its investments. When current market prices, quotations or currency exchange rates are not readily available or reliable, investments will be fair valued in good faith by the Fidelity Management & Research Company (FMR) Fair Value Committee (the Committee), in accordance with procedures adopted by the Board. Factors used in determining fair value vary by investment type and may include market or investment specific events, changes in interest rates and credit quality. The frequency with which these procedures are used cannot be predicted and they may be utilized to a significant extent. The Committee oversees the Fund's valuation policies and procedures and is responsible for approving and reporting to the Board all fair value determinations.
The Fund categorizes the inputs to valuation techniques used to value its investments into a disclosure hierarchy consisting of three levels as shown below:
Level 1 - quoted prices in active markets for identical investments
Level 2 - other significant observable inputs (including quoted prices for similar investments, interest rates, prepayment speeds, etc.)
Level 3 - unobservable inputs (including the Fund's own assumptions based on the best information available)
Valuation techniques used to value the Fund's investments by major category are as follows:
Debt securities, including restricted securities, are valued based on evaluated prices received from third party pricing vendors or from brokers who make markets in such securities. Corporate bonds and bank loan obligations are valued by pricing vendors who utilize matrix pricing which considers yield or price of bonds of comparable quality, coupon, maturity and type or by broker-supplied prices. When independent prices are unavailable or unreliable, debt securities may be valued utilizing pricing methodologies which consider similar factors that would be used by third party pricing vendors. Debt securities are generally categorized as Level 2 in the hierarchy but may be Level 3 depending on the circumstances. The Fund invests a significant portion of its assets in below investment grade securities. The value of these securities can be more volatile due to changes in the credit quality of the issuer and is sensitive to changes in economic, market and regulatory conditions.
Investments in open-end mutual funds, including the Fidelity Central Funds, are valued at their closing net asset value (NAV) each business day and are categorized as Level 1 in the hierarchy.
Annual Report
3. Significant Accounting Policies - continued
Investment Valuation - continued
Changes in valuation techniques may result in transfers in or out of an assigned level within the disclosure hierarchy. The aggregate value of investments by input level, as of December 31, 2014, is included at the end of the Fund's Schedule of Investments.
Investment Transactions and Income. For financial reporting purposes, the Fund's investment holdings and NAV include trades executed through the end of the last business day of the period. The NAV per share for processing shareholder transactions is calculated as of the close of business of the New York Stock Exchange (NYSE), normally 4:00 p.m. Eastern time and includes trades executed through the end of the prior business day. Gains and losses on securities sold are determined on the basis of identified cost. Income and capital gain distributions from Fidelity Central Funds, if any, are recorded on the ex-dividend date. Interest income is accrued as earned and includes coupon interest and amortization of premium and accretion of discount on debt securities as applicable.
Class Allocations and Expenses. Investment income, realized and unrealized capital gains and losses, common expenses of the Fund, and certain fund-level expense reductions, if any, are allocated daily on a pro-rata basis to each class based on the relative net assets of each class to the total net assets of the Fund. Each class differs with respect to transfer agent fees incurred. Certain expense reductions may also differ by class. For the reporting period, the allocated portion of income and expenses to each class as a percent of its average net assets may vary due to the timing of recording these transactions in relation to fluctuating net assets of the classes. Expenses directly attributable to a fund are charged to that fund. Expenses attributable to more than one fund are allocated among the respective funds on the basis of relative net assets or other appropriate methods. Expense estimates are accrued in the period to which they relate and adjustments are made when actual amounts are known.
Income Tax Information and Distributions to Shareholders. Each year, the Fund intends to qualify as a regulated investment company under Subchapter M of the Internal Revenue Code, including distributing substantially all of its taxable income and realized gains. As a result, no provision for U.S. Federal income taxes is required. As of December 31, 2014, the Fund did not have any unrecognized tax benefits in the financial statements; nor is the Fund aware of any tax positions for which it is reasonably possible that the total amounts of unrecognized tax benefits will significantly change in the next twelve months. The Fund files a U.S. federal tax return, in addition to state and local tax returns as required. The Fund's federal income tax returns are subject to examination by the Internal Revenue Service (IRS) for a period of three fiscal years after they are filed. State and local tax returns may be subject to examination for an additional fiscal year depending on the jurisdiction.
Distributions are declared and recorded on the ex-dividend date. Income dividends and capital gain distributions are declared separately for each class. Income and capital gain distributions are determined in accordance with income tax regulations, which may differ from GAAP.
Capital accounts within the financial statements are adjusted for permanent book-tax differences. These adjustments have no impact on net assets or the results of operations. Capital accounts are not adjusted for temporary book-tax differences which will reverse in a subsequent period.
Book-tax differences are primarily due to market discount, capital loss carryforwards and losses deferred due to wash sales.
The federal tax cost of investment securities and unrealized appreciation (depreciation) as of period end were as follows:
Gross unrealized appreciation | $ 93,367 |
Gross unrealized depreciation | (2,755,279) |
Net unrealized appreciation (depreciation) on securities | $ (2,661,912) |
|
|
Tax Cost | $ 103,899,976 |
The tax-based components of distributable earnings as of period end were as follows:
Capital loss carryforward | $ (557,315) |
Net unrealized appreciation (depreciation) on securities and other investments | $ (2,661,912) |
Capital loss carryforwards are only available to offset future capital gains of the Fund to the extent provided by regulations and may be limited. Under the Regulated Investment Company Modernization Act of 2010 (the Act), the Fund is permitted to carry forward capital losses incurred in taxable years beginning after December 22, 2010 for an unlimited period and such capital losses are required to be used prior to any losses that expire. The capital loss carryforward information presented below, including any applicable limitation, is estimated as of fiscal period end and is subject to adjustment.
No expiration |
|
Short-term |
Annual Report
Notes to Financial Statements - continued
3. Significant Accounting Policies - continued
Income Tax Information and Distributions to Shareholders - continued
The tax character of distributions paid was as follows:
| December 31, 2014 |
Ordinary Income | $ 2,069,592 |
Restricted Securities. The Fund may invest in securities that are subject to legal or contractual restrictions on resale. These securities generally may be resold in transactions exempt from registration or to the public if the securities are registered. Disposal of these securities may involve time-consuming negotiations and expense, and prompt sale at an acceptable price may be difficult. Information regarding restricted securities is included at the end of the Fund's Schedule of Investments.
Loans and Other Direct Debt Instruments. The Fund invests in direct debt instruments which are interests in amounts owed to lenders by corporate or other borrowers. These instruments may be in the form of loans, trade claims or other receivables and may include standby financing commitments such as revolving credit facilities that obligate the Fund to supply additional cash to the borrower on demand. Loans may be acquired through assignment or participation. The Fund also invests in unfunded loan commitments, which are contractual obligations for future funding. Information regarding unfunded commitments is included at the end of the Fund's Schedule of Investments.
New Accounting Pronouncement. In June 2014, the Financial Accounting Standards Board issued Accounting Standard Update No. 2014-11, Repurchase-to-Maturity Transactions, Repurchase Financings, and Disclosures. The Update amends the accounting for certain repurchase agreements and expands disclosure requirements for reverse repurchase agreements, securities lending and other similar transactions. The disclosure requirements are effective for annual and interim reporting periods beginning after December 15, 2014. Management is currently evaluating the impact of the Update on the Fund's financial statements and related disclosures.
4. Purchases and Sales of Investments.
Purchases and sales of securities (including principal repayments of bank loan obligations), other than short-term securities, aggregated $121,431,539 and $23,086,243, respectively.
5. Fees and Other Transactions with Affiliates.
Management Fee. Fidelity Management & Research Company (the investment adviser) and its affiliates provide the Fund with investment management related services for which the Fund pays a monthly management fee. The management fee is the sum of an individual fund fee rate that is based on an annual rate of .45% of the Fund's average net assets and an annualized group fee rate that averaged .11% during the period. The group fee rate is based upon the average net assets of all the mutual funds advised by the investment adviser, including any mutual funds previously advised by the investment adviser that are currently advised by Fidelity SelectCo, LLC, an affiliate of the investment adviser. The group fee rate decreases as assets under management increase and increases as assets under management decrease. For the reporting period, the total annualized management fee rate was .56% of the Fund's average net assets.
Transfer Agent Fees. Fidelity Investments Institutional Operations Company, Inc. (FIIOC), an affiliate of the investment adviser, is the Fund's transfer, dividend disbursing, and shareholder servicing agent. FIIOC receives an asset-based fee with respect to each class. Each class (with the exception of Investor Class) pays a fee for transfer agent services, typesetting, printing and mailing of shareholder reports, excluding mailing of proxy statements and out of pocket expenses, equal to an annual rate of .07% (.10% for Investor Class) of class-level average net assets. For the period, transfer agent fees for each class, including out of pocket expenses, were as follows:
Initial Class | $ 6,521 |
Investor Class | 54,303 |
| $ 60,824 |
Accounting Fees. Fidelity Service Company, Inc. (FSC), an affiliate of the investment adviser, maintains the Fund's accounting records. The fee is based on the level of average net assets for each month.
6. Expense Reductions.
The investment adviser contractually agreed to reimburse each class to the extent annual operating expenses exceeded certain levels of average net assets as noted in the table below. This reimbursement will remain in place through April 30, 2015. Some expenses, for example interest expense, are excluded from this reimbursement.
Annual Report
6. Expense Reductions - continued
The following classes were in reimbursement during the period:
| Expense | Reimbursement |
Initial Class | .77% | $ 5,514 |
Investor Class | .80% | 10,657 |
|
| $ 16,171 |
In addition, through arrangements with the Fund's custodian, credits realized as a result of uninvested cash balances were used to reduce the Fund's expenses. During the period, these credits reduced the Fund's custody expenses by $645.
7. Distributions to Shareholders.
Distributions to shareholders of each class were as follows:
Years ended December 31, | 2014 A |
From net investment income |
|
Initial Class | $ 214,685 |
Investor Class | 1,854,907 |
Total | $ 2,069,592 |
A For the period April 9, 2014 (commencement of operations) to December 31, 2014.
8. Share Transactions.
Transactions for each class of shares were as follows:
| Shares A | Dollars A |
Years ended December 31, | 2014 | 2014 |
Initial Class |
|
|
Shares sold | 1,329,755 | $ 13,309,635 |
Reinvestment of distributions | 22,155 | 214,685 |
Shares redeemed | (230,663) | (2,298,327) |
Net increase (decrease) | 1,121,247 | $ 11,225,993 |
Investor Class |
|
|
Shares sold | 11,605,606 | $ 116,302,705 |
Reinvestment of distributions | 191,425 | 1,854,907 |
Shares redeemed | (2,006,875) | (19,864,832) |
Net increase (decrease) | 9,790,156 | $ 98,292,780 |
A For the period April 9, 2014 (commencement of operations) to December 31, 2014.
9. Other.
The Fund's organizational documents provide former and current trustees and officers with a limited indemnification against liabilities arising in connection with the performance of their duties to the Fund. In the normal course of business, the Fund may also enter into contracts that provide general indemnifications. The Fund's maximum exposure under these arrangements is unknown as this would be dependent on future claims that may be made against the Fund. The risk of material loss from such claims is considered remote.
At the end of the period, the investment adviser or its affiliates were the owners of record of 100% of the total outstanding shares of the Fund.
Annual Report
Report of Independent Registered Public Accounting Firm
To the Trustees of Variable Insurance Products Fund and the Shareholders of VIP Floating Rate High Income Portfolio:
In our opinion, the accompanying statement of assets and liabilities, including the schedule of investments, and the related statements of operations and of changes in net assets and the financial highlights present fairly, in all material respects, the financial position of VIP Floating Rate High Income Portfolio (a fund of Variable Insurance Products Fund) at December 31, 2014, the results of its operations, the changes in its net assets and the financial highlights for the period April 9, 2014 (commencement of operations) through December 31, 2014, in conformity with accounting principles generally accepted in the United States of America. These financial statements and financial highlights (hereafter referred to as "financial statements") are the responsibility of the VIP Floating Rate High Income Portfolio's management. Our responsibility is to express an opinion on these financial statements based on our audit. We conducted our audits of these financial statements in accordance with the standards of the Public Company Accounting Oversight Board (United States). Those standards require that we plan and perform the audit to obtain reasonable assurance about whether the financial statements are free of material misstatement. An audit includes examining, on a test basis, evidence supporting the amounts and disclosures in the financial statements, assessing the accounting principles used and significant estimates made by management, and evaluating the overall financial statement presentation. We believe that our audit, which included confirmation of securities at December 31, 2014 by correspondence with the custodian, agent banks and brokers, provides a reasonable basis for our opinion.
PricewaterhouseCoopers LLP
Boston, Massachusetts
February 24, 2015
Annual Report
Trustees and Officers
The Trustees, Member of the Advisory Board, and officers of the trust and fund, as applicable, are listed below. The Board of Trustees governs the fund and is responsible for protecting the interests of shareholders. The Trustees are experienced executives who meet periodically throughout the year to oversee the fund's activities, review contractual arrangements with companies that provide services to the fund, oversee management of the risks associated with such activities and contractual arrangements, and review the fund's performance. Except for James C. Curvey, each of the Trustees oversees 174 funds. Mr. Curvey oversees 407 funds.
The Trustees hold office without limit in time except that (a) any Trustee may resign; (b) any Trustee may be removed by written instrument, signed by at least two-thirds of the number of Trustees prior to such removal; (c) any Trustee who requests to be retired or who has become incapacitated by illness or injury may be retired by written instrument signed by a majority of the other Trustees; and (d) any Trustee may be removed at any special meeting of shareholders by a two-thirds vote of the outstanding voting securities of the trust. Each Trustee who is not an interested person (as defined in the 1940 Act) of the trust and the fund (Independent Trustee), shall retire not later than the last day of the calendar year in which his or her 75th birthday occurs. The Independent Trustees may waive this mandatory retirement age policy with respect to individual Trustees. The officers and Advisory Board Member hold office without limit in time, except that any officer and Advisory Board Member may resign or may be removed by a vote of a majority of the Trustees at any regular meeting or any special meeting of the Trustees. Except as indicated, each individual has held the office shown or other offices in the same company for the past five years.
Experience, Skills, Attributes, and Qualifications of the Fund's Trustees. The Governance and Nominating Committee has adopted a statement of policy that describes the experience, qualifications, attributes, and skills that are necessary and desirable for potential Independent Trustee candidates (Statement of Policy). The Board believes that each Trustee satisfied at the time he or she was initially elected or appointed a Trustee, and continues to satisfy, the standards contemplated by the Statement of Policy. The Governance and Nominating Committee also engages professional search firms to help identify potential Independent Trustee candidates who have the experience, qualifications, attributes, and skills consistent with the Statement of Policy. From time to time, additional criteria based on the composition and skills of the current Independent Trustees, as well as experience or skills that may be appropriate in light of future changes to board composition, business conditions, and regulatory or other developments, have also been considered by the professional search firms and the Governance and Nominating Committee. In addition, the Board takes into account the Trustees' commitment and participation in Board and committee meetings, as well as their leadership of standing and ad hoc committees throughout their tenure.
In determining that a particular Trustee was and continues to be qualified to serve as a Trustee, the Board has considered a variety of criteria, none of which, in isolation, was controlling. The Board believes that, collectively, the Trustees have balanced and diverse experience, qualifications, attributes, and skills, which allow the Board to operate effectively in governing the fund and protecting the interests of shareholders. Information about the specific experience, skills, attributes, and qualifications of each Trustee, which in each case led to the Board's conclusion that the Trustee should serve (or continue to serve) as a trustee of the fund, is provided below.
Board Structure and Oversight Function. James C. Curvey is an interested person (as defined in the 1940 Act) and currently serves as Chairman. The Trustees have determined that an interested Chairman is appropriate and benefits shareholders because an interested Chairman has a personal and professional stake in the quality and continuity of services provided to the fund. Independent Trustees exercise their informed business judgment to appoint an individual of their choosing to serve as Chairman, regardless of whether the Trustee happens to be independent or a member of management. The Independent Trustees have determined that they can act independently and effectively without having an Independent Trustee serve as Chairman and that a key structural component for assuring that they are in a position to do so is for the Independent Trustees to constitute a substantial majority for the Board. The Independent Trustees also regularly meet in executive session. Ned C. Lautenbach serves as Chairman of the Independent Trustees and as such (i) acts as a liaison between the Independent Trustees and management with respect to matters important to the Independent Trustees and (ii) with management prepares agendas for Board meetings.
Fidelity funds are overseen by different Boards of Trustees. The fund's Board oversees Fidelity's equity and high income funds and another Board oversees Fidelity's investment-grade bond, money market, and asset allocation funds. The asset allocation funds may invest in Fidelity funds overseen by the fund's Board. The use of separate Boards, each with its own committee structure, allows the Trustees of each group of Fidelity funds to focus on the unique issues of the funds they oversee, including common research, investment, and operational issues. On occasion, the separate Boards establish joint committees to address issues of overlapping consequences for the Fidelity funds overseen by each Board.
The Trustees operate using a system of committees to facilitate the timely and efficient consideration of all matters of importance to the Trustees, the fund, and fund shareholders and to facilitate compliance with legal and regulatory requirements and oversight of the fund's activities and associated risks. The Board, acting through its committees, has charged FMR and its affiliates with (i) identifying events or circumstances the occurrence of which could have demonstrably adverse effects on the fund's business and/or reputation; (ii) implementing processes and controls to lessen the possibility that such events or circumstances occur or to mitigate the effects of such events or circumstances if they do occur; and (iii) creating and maintaining a system designed to evaluate continuously business and market conditions in order to facilitate the identification and implementation processes described in (i) and (ii) above. Because the day-to-day operations and activities of the fund are carried out by or through FMR, its affiliates and other service providers, the fund's exposure to risks is mitigated but not eliminated by the processes overseen by the Trustees. While each of the Board's committees has responsibility for overseeing different aspects of the fund's activities, oversight is exercised primarily through the Operations, Audit, and Compliance Committees. In addition, the Independent Trustees have worked with FMR to enhance the Board's oversight of investment and financial risks, legal and regulatory risks, technology risks, and operational risks, including the development of additional risk reporting to the Board. For example, a working group comprised of Independent Trustees and FMR has worked and continues to work to review the Fidelity funds' valuation-related activities, reporting and risk management. Appropriate personnel, including but not limited to the fund's Chief Compliance Officer (CCO), FMR's internal auditor, the independent accountants, the fund's Treasurer and portfolio management personnel, make periodic reports to the Board's committees, as appropriate, including an annual review of FMR's risk management program for the Fidelity funds. The responsibilities of each standing committee, including their oversight responsibilities, are described further under "Standing Committees of the Fund's Trustees."
Annual Report
The fund's Statement of Additional Information (SAI) includes more information about the Trustees. To request a free copy, call Fidelity at 1-877-208-0098.
Interested Trustees*:
Correspondence intended for each Trustee who is an interested person may be sent to Fidelity Investments, 245 Summer Street, Boston, Massachusetts 02210.
Name, Year of Birth; Principal Occupations and Other Relevant Experience+ | |
James C. Curvey (1935) | |
Year of Election or Appointment: 2007 Trustee Chairman of the Board of Trustees | |
| Mr. Curvey also serves as Trustee of other Fidelity funds. Mr. Curvey is a Director of Fidelity Research & Analysis Co. (2009-present), and Vice Chairman (2007-present) and Director of FMR LLC. In addition, Mr. Curvey serves as an Overseer for the Boston Symphony Orchestra and a member of the board of Artis-Naples, Naples, Florida, and as a Trustee for Brewster Academy, Wolfeboro, New Hampshire. Previously, Mr. Curvey served as a Director of Fidelity Investments Money Management, Inc. (2009-2014), a Director of FMR (2007-2014), and a Director of FMR Co., Inc. (2007-2014). |
Charles S. Morrison (1960) | |
Year of Election or Appointment: 2014 Trustee | |
| Mr. Morrison also serves as Trustee of other funds. He serves as a Director of Fidelity Investments Money Management, Inc. (FIMM) (2014-present), Director of Fidelity SelectCo, LLC (2014-present), President, Asset Management (2014-present), and is an employee of Fidelity Investments. Previously, Mr. Morrison served as Vice President of Fidelity's Fixed Income and Asset Allocation Funds (2012-2014), President, Fixed Income (2011-2014), Vice President of Fidelity's Money Market Funds (2005-2009), President, Money Market Group Leader of FMR (2009), and Senior Vice President, Money Market Group of FMR (2004-2009). Mr. Morrison also served as Vice President of Fidelity's Bond Funds (2002-2005), certain Balanced Funds (2002-2005), and certain Asset Allocation Funds (2002-2007), and as Senior Vice President (2002-2005) of Fidelity's Bond Division. |
* Trustees have been determined to be "Interested Trustees" by virtue of, among other things, their affiliation with the trust or various entities under common control with FMR.
+ The information above includes each Trustee's principal occupation during the last five years and other information relating to the experience, attributes, and skills relevant to each Trustee's qualifications to serve as a Trustee, which led to the conclusion that each Trustee should serve as a Trustee for the fund.
Independent Trustees:
Correspondence intended for each Independent Trustee (that is, the Trustees other than the Interested Trustees) may be sent to Fidelity Investments, P.O. Box 55235, Boston, Massachusetts 02205-5235.
Name, Year of Birth; Principal Occupations and Other Relevant Experience+ | |
Dennis J. Dirks (1948) | |
Year of Election or Appointment: 2005 Trustee | |
| Mr. Dirks also serves as Trustee of other Fidelity funds. Prior to his retirement in May 2003, Mr. Dirks was Chief Operating Officer and a member of the Board of The Depository Trust & Clearing Corporation (DTCC). He also served as President, Chief Operating Officer, and Board member of The Depository Trust Company (DTC) and President and Board member of the National Securities Clearing Corporation (NSCC). In addition, Mr. Dirks served as Chief Executive Officer and Board member of the Government Securities Clearing Corporation, Chief Executive Officer and Board member of the Mortgage-Backed Securities Clearing Corporation, as a Trustee and a member of the Finance Committee of Manhattan College (2005-2008), and as a Trustee and a member of the Finance Committee of AHRC of Nassau County (2006-2008). Mr. Dirks is a member of the Independent Directors Council (IDC) Governing Council (2010-present) and Board of Directors for The Brookville Center for Children's Services, Inc. (2009-present). |
Alan J. Lacy (1953) | |
Year of Election or Appointment: 2008 Trustee | |
| Mr. Lacy also serves as Trustee of other Fidelity funds. Mr. Lacy serves as a member of the Board of Directors of Dave & Buster's Entertainment, Inc. (restaurant and entertainment complexes, 2010-present) and Bristol-Myers Squibb Company (global pharmaceuticals, 2008-present). In addition, Mr. Lacy served as Senior Adviser (2007-2014) of Oak Hill Capital Partners, L.P. (private equity) and also served as Chief Executive Officer (2000-2005) and Vice Chairman (2005-2006) of Sears Holdings Corporation and Sears, Roebuck and Co. (retail). Mr. Lacy is a member of the Board of Trustees of The National Parks Conservation Association (2006-present). Previously, Mr. Lacy served as Chairman of the Board of Trustees of the National Parks Conservation Association (2008-2011) and as a member of the Board of Directors for The Western Union Company (global money transfer, 2006-2011), The Hillman Companies, Inc. (hardware wholesalers, 2010-2014), and Earth Fare, Inc. (retail grocery, 2010-2014). |
Ned C. Lautenbach (1944) | |
Year of Election or Appointment: 2000 Trustee Chairman of the Independent Trustees | |
| Mr. Lautenbach also serves as Trustee of other Fidelity funds. Mr. Lautenbach currently serves as the Lead Director of the Eaton Corporation Board of Directors (diversified industrial, 1997-present). Mr. Lautenbach is Chairman of the Board of Directors of Artis-Naples in Naples, Florida (2012-present), a member of the Council on Foreign Relations (1994-present), and a member of the Board of Governors, State University System of Florida (2013-present). Previously, Mr. Lautenbach was a Partner/Advisory Partner at Clayton, Dubilier & Rice, LLC (private equity investment, 1998-2010), as well as a Director of Sony Corporation (2006-2007). |
Joseph Mauriello (1944) | |
Year of Election or Appointment: 2008 Trustee | |
| Mr. Mauriello also serves as Trustee of other Fidelity funds. Prior to his retirement in January 2006, Mr. Mauriello served in numerous senior management positions including Deputy Chairman and Chief Operating Officer (2004-2005), and Vice Chairman of Financial Services (2002-2004) of KPMG LLP US (professional services, 1965-2005). Mr. Mauriello currently serves as a member of the Board of Directors of XL Group plc. (global insurance and re-insurance, 2006-present). Previously, Mr. Mauriello served as a Director of the Hamilton Funds of the Bank of New York (2006-2007) and of Arcadia Resources Inc. (health care services and products, 2007-2012). |
Robert W. Selander (1950) | |
Year of Election or Appointment: 2011 Trustee | |
| Mr. Selander also serves as Trustee of other Fidelity funds. Mr. Selander serves as a Director of The Western Union Company (global money transfer, 2014-present). Previously, Mr. Selander served as a Member of the Advisory Board of other Fidelity funds (2011), and Executive Vice Chairman (2010), Chief Executive Officer (2009-2010), and President and Chief Executive Officer (1997-2009) of Mastercard, Inc. |
Cornelia M. Small (1944) | |
Year of Election or Appointment: 2005 Trustee | |
| Ms. Small also serves as Trustee of other Fidelity funds. Ms. Small is a member of the Board of Directors (2009-present) and Chair of the Investment Committee (2010-present) of the Teagle Foundation. Ms. Small also serves on the Investment Committee of the Berkshire Taconic Community Foundation (2008-present). Previously, Ms. Small served as Chairperson (2002-2008) and a member of the Investment Committee and Chairperson (2008-2012) and a member of the Board of Trustees of Smith College. In addition, Ms. Small served as Chief Investment Officer, Director of Global Equity Investments, and a member of the Board of Directors of Scudder, Stevens & Clark and Scudder Kemper Investments. |
William S. Stavropoulos (1939) | |
Year of Election or Appointment: 2001 Trustee Vice Chairman of the Independent Trustees | |
| Mr. Stavropoulos also serves as Trustee of other Fidelity funds. Mr. Stavropoulos serves as President and Founder of the Michigan Baseball Foundation, the Great Lakes Loons (2007-present). Mr. Stavropoulos is Chairman Emeritus of the Board of Directors of The Dow Chemical Company, where he previously served in numerous senior management positions, including President, CEO (1995-2000; 2002-2004), Chairman of the Executive Committee (2000-2006), and as a member of the Board of Directors (1990-2006). Currently, Mr. Stavropoulos is Chairman of the Board of Directors of Univar Inc. (global distributor of commodity and specialty chemicals), a Director of Teradata Corporation (data warehousing and technology solutions), and Maersk Inc. (industrial conglomerate), and a member of the Advisory Board for Metalmark Capital LLC (private equity investment, 2005-present). Mr. Stavropoulos is an operating advisor to Clayton, Dubilier & Rice, LLC (private equity investment). In addition, Mr. Stavropoulos is a member of the University of Notre Dame Advisory Council for the College of Science, a Trustee of the Rollin L. Gerstacker Foundation, and a Director of the Naples Philharmonic Center for the Arts. Previously, Mr. Stavropoulos served as a Director of Chemical Financial Corporation (bank holding company, 1993-2012) and Tyco International, Ltd. (multinational manufacturing and services, 2007-2012). |
David M. Thomas (1949) | |
Year of Election or Appointment: 2008 Trustee | |
| Mr. Thomas also serves as Trustee of other Fidelity funds. Mr. Thomas serves as Non-Executive Chairman of the Board of Directors of Fortune Brands Home and Security (home and security products, 2011-present), as a member of the Board of Directors (2004-present) and Presiding Director (2013-present) of Interpublic Group of Companies, Inc. (marketing communication), and as a member of the Board of Trustees of the University of Florida (2013-present). Previously, Mr. Thomas served as Executive Chairman (2005-2006) and Chairman and Chief Executive Officer (2000-2005) of IMS Health, Inc. (pharmaceutical and healthcare information solutions), and a Director of Fortune Brands, Inc. (consumer products, 2000-2011). |
+ The information above includes each Trustee's principal occupation during the last five years and other information relating to the experience, attributes, and skills relevant to each Trustee's qualifications to serve as a Trustee, which led to the conclusion that each Trustee should serve as a Trustee for the fund.
Advisory Board Member and Officers:
Correspondence intended for each officer and Peter S. Lynch may be sent to Fidelity Investments, 245 Summer Street, Boston, Massachusetts 02210. Officers appear below in alphabetical order.
Name, Year of Birth; Principal Occupation | |
Peter S. Lynch (1944) | |
Year of Election or Appointment: 2003 Member of the Advisory Board | |
| Mr. Lynch also serves as Member of the Advisory Board of other Fidelity funds. Mr. Lynch is Vice Chairman and a Director of FMR and FMR Co., Inc. In addition, Mr. Lynch serves as a Trustee of Boston College and as the Chairman of the Inner-City Scholarship Fund. Previously, Mr. Lynch served on the Special Olympics International Board of Directors (1997-2006). |
Elizabeth Paige Baumann (1968) | |
Year of Election or Appointment: 2012 Anti-Money Laundering (AML) Officer | |
| Ms. Baumann also serves as AML Officer of other funds. She is Chief AML Officer of FMR LLC (2012-present) and is an employee of Fidelity Investments. Previously, Ms. Baumann served as Vice President and Deputy Anti-Money Laundering Officer (2007-2012). |
William C. Coffey (1969) | |
Year of Election or Appointment: 2009 Assistant Secretary | |
| Mr. Coffey also serves as Assistant Secretary of other funds. He is Senior Vice President and Deputy General Counsel of FMR LLC (2010-present), and is an employee of Fidelity Investments. Previously, Mr. Coffey served as Vice President and Associate General Counsel of FMR LLC (2005-2009). |
Jonathan Davis (1968) | |
Year of Election or Appointment: 2010 Assistant Treasurer | |
| Mr. Davis also serves as Assistant Treasurer of other funds. Mr. Davis is an employee of Fidelity Investments. Previously, Mr. Davis served as Vice President and Associate General Counsel of FMR LLC (2003-2010). |
Adrien E. Deberghes (1967) | |
Year of Election or Appointment: 2008 Deputy Treasurer | |
| Mr. Deberghes also serves as an officer of other funds. He is an employee of Fidelity Investments (2008-present). Prior to joining Fidelity Investments, Mr. Deberghes was Senior Vice President of Mutual Fund Administration at State Street Corporation (2007-2008), Senior Director of Mutual Fund Administration at Investors Bank & Trust (2005-2007), and Director of Finance for Dunkin' Brands (2000-2005). |
Stephanie J. Dorsey (1969) | |
Year of Election or Appointment: 2010 Assistant Treasurer | |
| Ms. Dorsey also serves as an officer of other funds. She is an employee of Fidelity Investments (2008-present) and has served in other fund officer roles. Prior to joining Fidelity Investments, Ms. Dorsey served as Treasurer (2004-2008) of the JPMorgan Mutual Funds and Vice President (2004-2008) of JPMorgan Chase Bank. |
Howard J. Galligan III (1966) | |
Year of Election or Appointment: 2014 Chief Financial Officer | |
| Mr. Galligan also serves as Chief Financial Officer of other funds. Mr. Galligan serves as President of Fidelity Pricing and Cash Management Services (FPCMS) (2014-present) and as a Director of Strategic Advisers, Inc. (2008-present). Previously, Mr. Galligan served as Chief Administrative Officer of Asset Management (2011-2014) and Chief Operating Officer and Senior Vice President of Investment Support for Strategic Advisers, Inc. (2003-2011). |
Scott C. Goebel (1968) | |
Year of Election or Appointment: 2008 Secretary and Chief Legal Officer (CLO) | |
| Mr. Goebel serves as Secretary and CLO of other funds. Mr. Goebel also serves as Secretary of Fidelity SelectCo, LLC (2013-present), Fidelity Investments Money Management, Inc. (FIMM) (2010-present) and Fidelity Research and Analysis Company (FRAC) (2010-present); General Counsel, Secretary, and Senior Vice President of FMR (2008-present) and FMR Co., Inc. (2008-present); Chief Legal Officer of Fidelity Management & Research (Hong Kong) Limited (2008-present); and Assistant Secretary of Fidelity Management & Research (Japan) Limited (2008-present) and Fidelity Management & Research (U.K.) Inc. (2008-present). Previously, Mr. Goebel served as Secretary and CLO of other Fidelity funds (2008-2013), Assistant Secretary of FIMM (2008-2010), FRAC (2008-2010), and certain funds (2007-2008); and as Vice President and Secretary of Fidelity Distributors Corporation (FDC) (2005-2007). Mr. Goebel has been employed by FMR LLC or an affiliate since 2001. |
Thomas C. Hense (1964) | |
Year of Election or Appointment: 2014 Vice President | |
| Mr. Hense also serves as Vice President of other funds (High Income (2008), Small Cap (2008), and Value (2010) funds). Previously, Mr. Hense served as a portfolio manager for Fidelity's Institutional Money Management Group (Pyramis) (2003-2008). |
Brian B. Hogan (1964) | |
Year of Election or Appointment: 2014 Vice President | |
| Mr. Hogan also serves as Trustee or Vice President of other funds. Mr. Hogan serves as a Director of Fidelity SelectCo, LLC (2014-present) and President of FMR's Equity Division (2009-present). Previously, Mr. Hogan served as Senior Vice President, Equity Research of FMR (2006-2009) and as a portfolio manager. |
Chris Maher (1972) | |
Year of Election or Appointment: 2013 Assistant Treasurer | |
| Mr. Maher serves as Assistant Treasurer of other funds. Mr. Maher is Vice President of Valuation Oversight and is an employee of Fidelity Investments. Previously, Mr. Maher served as Vice President of Asset Management Compliance (2013), Vice President of FMR's Program Management Group (2010-2013), and Vice President of Valuation Oversight (2008-2010). |
Kenneth B. Robins (1969) | |
Year of Election or Appointment: 2008 President and Treasurer | |
| Mr. Robins also serves as an officer of other funds. Mr. Robins serves as Executive Vice President of Fidelity Investments Money Management, Inc. (FIMM) (2013-present) and is an employee of Fidelity Investments (2004-present). Previously, Mr. Robins served in other fund officer roles. |
Stephen Sadoski (1971) | |
Year of Election or Appointment: 2012 Deputy Treasurer | |
| Mr. Sadoski also serves as Deputy Treasurer of other funds. He is an employee of Fidelity Investments (2012-present) and has served in another fund officer role. Prior to joining Fidelity Investments, Mr. Sadoski served as an assistant chief accountant in the Division of Investment Management of the Securities and Exchange Commission (SEC) (2009-2012) and as a senior manager at Deloitte & Touche LLP (1997-2009). |
Stacie M. Smith (1974) | |
Year of Election or Appointment: 2013 Deputy Treasurer | |
| Ms. Smith also serves as an officer of other funds. She is an employee of Fidelity Investments (2009-present) and has served in other fund officer roles. Prior to joining Fidelity Investments, Ms. Smith served as Senior Audit Manager of Ernst & Young LLP (1996-2009). |
Renee Stagnone (1975) | |
Year of Election or Appointment: 2013 Deputy Treasurer | |
| Ms. Stagnone also serves as Deputy Treasurer of other funds. Ms. Stagnone is an employee of Fidelity Investments. |
Linda J. Wondrack (1964) | |
Year of Election or Appointment: 2014 Chief Compliance Officer | |
| Ms. Wondrack also serves as Chief Compliance Officer of other funds. Ms. Wondrack is Executive Vice President and head of the Ethics Office and Asset Management Compliance for Fidelity Investments (2012-present). Ms. Wondrack also serves as Chief Compliance Officer of Fidelity SelectCo, LLC (2014-present); Chief Compliance Officer of Impresa Management LLC (2013-present); and Chief Compliance Officer of FMR Co., Inc., Fidelity Investments Money Management, Inc., Fidelity Management & Research (Japan) Limited, Fidelity Management & Research (U.K.) Inc., Fidelity Management & Research (Hong Kong), Fidelity Management & Research Company, Pyramis Global Advisors, LLC, and Strategic Advisers, Inc., Ballyrock Investment Advisors LLC, and Northern Neck Investors LLC (2012-present). Previously, Ms. Wondrack served as Senior Vice President and Chief Compliance Officer for Columbia Management Investment Advisers, LLC (2005-2012); Chief Compliance Officer for certain funds within the Columbia Family of Funds (2007-2012); and Senior Vice President of Compliance Risk Management at Bank of America (2005-2010). |
Joseph F. Zambello (1957) | |
Year of Election or Appointment: 2011 Deputy Treasurer | |
| Mr. Zambello also serves as Deputy Treasurer of other funds. Mr. Zambello is an employee of Fidelity Investments. Previously, Mr. Zambello served as Vice President of FMR's Program Management Group (2009-2011) and Vice President of the Transfer Agent Oversight Group (2005-2009). |
Annual Report
Board Approval of Investment Advisory Contracts and Management Fees
VIP Floating Rate High Income Portfolio
In connection with separate internal corporate reorganizations involving Fidelity Management & Research (U.K.) Inc. (FMR U.K.) and Fidelity Management & Research (Japan) Inc. (FMR Japan), the Board approved certain non-material amendments to the funds' subadvisory agreements with FMR U.K. and FMR Japan to reflect that, after these reorganizations, FMR Investment Management (UK) Limited and Fidelity Management & Research (Japan) Limited will carry on the business of FMR U.K. and FMR Japan, respectively. The Board noted that no changes to the portfolio managers or to the foreign research or investment advisory services provided to the fund were expected in connection with either reorganization and that the same personnel and resources will be available to the fund with the new entities. After considering all of the factors it believed relevant, the Board concluded that the amended sub-advisory agreements should be approved.
Annual Report
Investment Adviser
Fidelity Management & Research Company
Boston, MA
Investment Sub-Advisers
FMR Co., Inc.
Fidelity Management & Research (U.K.) Inc.
Fidelity Management & Research (Hong Kong) Limited
Fidelity Management & Research (Japan) Limited
General Distributor
Fidelity Distributors Corporation
Smithfield, RI
Transfer and Service Agents
Fidelity Investments Institutional Operations Company, Inc.
Boston, MA
Fidelity Service Company, Inc.
Boston, MA
Custodian
State Street Bank & Trust Company
Quincy, MA
VIPFHI-ANN-0215
1.9859331.100
Item 2. Code of Ethics
As of the end of the period, December 31, 2014, Variable Insurance Products Fund (the trust) has adopted a code of ethics, as defined in Item 2 of Form N-CSR, that applies to its President and Treasurer and its Chief Financial Officer. A copy of the code of ethics is filed as an exhibit to this Form N-CSR.
Item 3. Audit Committee Financial Expert
The Board of Trustees of the trust has determined that Joseph Mauriello is an audit committee financial expert, as defined in Item 3 of Form N-CSR. Mr. Mauriello is independent for purposes of Item 3 of Form N-CSR.
Item 4. Principal Accountant Fees and Services
Fees and Services
The following table presents fees billed by PricewaterhouseCoopers LLP ("PwC") in each of the last two fiscal years for services rendered to VIP Floating Rate High Income (the "Fund"):
Services Billed by PwC
December 31, 2014 FeesA,B
| Audit Fees | Audit-Related Fees | Tax Fees | All Other Fees |
VIP Floating Rate High Income | $59,000 | $- | $3,600 | $1,200 |
December 31, 2013 FeesA,B
| Audit Fees | Audit-Related Fees | Tax Fees | All Other Fees |
VIP Floating Rate High Income | $- | $- | $- | $- |
A Amounts may reflect rounding.
B VIP Floating Rate High Income commenced operations on April 9, 2014.
The following table presents fees billed by PwC that were required to be approved by the Audit Committee for services that relate directly to the operations and financial reporting of the Fund and that are rendered on behalf of Fidelity Management & Research Company ("FMR") and entities controlling, controlled by, or under common control with FMR (not including any sub-adviser whose role is primarily portfolio management and is subcontracted with or overseen by another investment adviser) that provide ongoing services to the Fund ("Fund Service Providers"):
Services Billed by PwC
| December 31, 2014A,B | December 31, 2013A,B |
Audit-Related Fees | $5,950,000 | $4,920,000 |
Tax Fees | $- | $- |
All Other Fees | $- | $50,000 |
A Amounts may reflect rounding.
B May include amounts billed prior to the VIP Floating Rate High Income's commencement of operations.
"Audit-Related Fees" represent fees billed for assurance and related services that are reasonably related to the performance of the fund audit or the review of the fund's financial statements and that are not reported under Audit Fees.
"Tax Fees" represent fees billed for tax compliance, tax advice or tax planning that relate directly to the operations and financial reporting of the fund.
"All Other Fees" represent fees billed for services provided to the fund or Fund Service Provider, a significant portion of which are assurance related, that relate directly to the operations and financial reporting of the fund, excluding those services that are reported under Audit Fees, Audit-Related Fees or Tax Fees.
Assurance services must be performed by an independent public accountant.
* * *
The aggregate non-audit fees billed by PwC for services rendered to the Fund, FMR (not including any sub-adviser whose role is primarily portfolio management and is subcontracted with or overseen by another investment adviser), and any Fund Service Provider for each of the last two fiscal years of the Fund are as follows:
Billed By | December 31, 2014 A,B | December 31, 2013 A,B |
PwC | $8,105,000 | $5,520,000 |
A Amounts may reflect rounding.
B May include amounts billed prior to the VIP Floating Rate High Income's commencement of operations.
The trust's Audit Committee has considered non-audit services that were not pre-approved that were provided by PwC to Fund Service Providers to be compatible with maintaining the independence of PwC in its audit of the Fund, taking into account representations from PwC, in accordance with Public Company Accounting Oversight Board rules, regarding its independence from the Fund and its related entities and FMR's review of the appropriateness and permissibility under applicable law of such non-audit services prior to their provision to the Fund Service Providers.
Audit Committee Pre-Approval Policies and Procedures
The trust's Audit Committee must pre-approve all audit and non-audit services provided by a fund's independent registered public accounting firm relating to the operations or financial reporting of the fund. Prior to the commencement of any audit or non-audit services to a fund, the Audit Committee reviews the services to determine whether they are appropriate and permissible under applicable law.
The Audit Committee has adopted policies and procedures to, among other purposes, provide a framework for the Committee's consideration of non-audit services by the audit firms that audit the Fidelity funds. The policies and procedures require that any non-audit service provided by a fund audit firm to a Fidelity fund and any non-audit service provided by a fund auditor to a Fund Service Provider that relates directly to the operations and financial reporting of a Fidelity fund ("Covered Service") are subject to approval by the Audit Committee before such service is provided.
All Covered Services must be approved in advance of provision of the service either: (i) by formal resolution of the Audit Committee, or (ii) by oral or written approval of the service by the Chair of the Audit Committee (or if the Chair is unavailable, such other member of the Audit Committee as may be designated by the Chair to act in the Chair's absence). The approval contemplated by (ii) above is permitted where the Treasurer determines that action on such an engagement is necessary before the next meeting of the Audit Committee.
Non-audit services provided by a fund audit firm to a Fund Service Provider that do not relate directly to the operations and financial reporting of a Fidelity fund are reported to the Audit Committee on a periodic basis.
Non-Audit Services Approved Pursuant to Rule 2-01(c)(7)(i)(C) and (ii) of Regulation S-X ("De Minimis Exception")
There were no non-audit services approved or required to be approved by the Audit Committee pursuant to the De Minimis Exception during the Fund's last two fiscal years relating to services provided to (i) the Fund or (ii) any Fund Service Provider that relate directly to the operations and financial reporting of the Fund.
Item 5. Audit Committee of Listed Registrants
Not applicable.
Item 6. Investments
(a) Not applicable.
(b) Not applicable
Item 7. Disclosure of Proxy Voting Policies and Procedures for Closed-End Management Investment Companies
Not applicable.
Item 8. Portfolio Managers of Closed-End Management Investment Companies
Not applicable.
Item 9. Purchase of Equity Securities by Closed-End Management Investment Company and Affiliated Purchasers
Not applicable.
Item 10. Submission of Matters to a Vote of Security Holders
There were no material changes to the procedures by which shareholders may recommend nominees to the trust's Board of Trustees.
Item 11. Controls and Procedures
(a)(i) The President and Treasurer and the Chief Financial Officer have concluded that the disclosure controls and procedures (as defined in Rule 30a-3(c) under the Investment Company Act) for the Fund provide reasonable assurances that material information relating to the Fund is made known to them by the appropriate persons, based on their evaluation of these controls and procedures as of a date within 90 days of the filing date of this report.
(a)(ii) There was no change in the Fund's internal control over financial reporting (as defined in Rule 30a-3(d) under the Investment Company Act) that occurred during the second fiscal quarter of the period covered by this report that has materially affected, or is reasonably likely to materially affect, the Fund's internal control over financial reporting.
Item 12. Exhibits
(a) | (1) | Code of Ethics pursuant to Item 2 of Form N-CSR is filed and attached hereto as EX-99.CODE ETH. |
(a) | (2) | Certification pursuant to Rule 30a-2(a) under the Investment Company Act of 1940 (17 CFR 270.30a-2(a)) is filed and attached hereto as Exhibit 99.CERT. |
(a) | (3) | Not applicable. |
(b) |
| Certification pursuant to Rule 30a-2(b) under the Investment Company Act of 1940 (17 CFR 270.30a-2(b)) is furnished and attached hereto as Exhibit 99.906CERT. |
SIGNATURES
Pursuant to the requirements of the Securities Exchange Act of 1934 and the Investment Company Act of 1940, the registrant has duly caused this report to be signed on its behalf by the undersigned, thereunto duly authorized.
Variable Insurance Products Fund
By: | /s/ Kenneth B. Robins |
| Kenneth B. Robins |
| President and Treasurer |
|
|
Date: | February 27, 2015 |
Pursuant to the requirements of the Securities Exchange Act of 1934 and the Investment Company Act of 1940, this report has been signed below by the following persons on behalf of the registrant and in the capacities and on the dates indicated.
By: | /s/ Kenneth B. Robins |
| Kenneth B. Robins |
| President and Treasurer |
|
|
Date: | February 27, 2015 |
By: | /s/Howard. J. Galligan III |
| Howard J. Galligan III |
| Chief Financial Officer |
|
|
Date: | February 27, 2015 |