Fidelity® Variable Insurance Products: Floating Rate High Income Portfolio
Annual Report December 31, 2015 |
 |
Contents
To view a fund's proxy voting guidelines and proxy voting record for the 12-month period ended June 30, visit http://www.fidelity.com/proxyvotingresults or visit the Securities and Exchange Commission's (SEC) web site at http://www.sec.gov.
You may also call 1-877-208-0098 to request a free copy of the proxy voting guidelines.
Fidelity® Variable Insurance Products are separate account options which are purchased through a variable insurance contract.
Standard & Poor's, S&P and S&P 500 are registered service marks of The McGraw-Hill Companies, Inc. and have been licensed for use by Fidelity Distributors Corporation.
Other third-party marks appearing herein are the property of their respective owners.
All other marks appearing herein are registered or unregistered trademarks or service marks of FMR LLC or an affiliated company. © 2016 FMR LLC. All rights reserved.
This report and the financial statements contained herein are submitted for the general information of the shareholders of the Fund. This report is not authorized for distribution to prospective investors in the Fund unless preceded or accompanied by an effective prospectus.
A fund files its complete schedule of portfolio holdings with the SEC for the first and third quarters of each fiscal year on Form N-Q. Forms N-Q are available on the SEC’s web site at http://www.sec.gov. A fund's Forms N-Q may be reviewed and copied at the SEC’s Public Reference Room in Washington, DC. Information regarding the operation of the SEC's Public Reference Room may be obtained by calling 1-800-SEC-0330.
For a complete list of a fund's portfolio holdings, view the most recent holdings listing, semiannual report, or annual report on Fidelity's web site at http://www.fidelity.com, http://www.advisor.fidelity.com, or http://www.401k.com, as applicable.
NOT FDIC INSURED •MAY LOSE VALUE •NO BANK GUARANTEE
Neither the Fund nor Fidelity Distributors Corporation is a bank.
Performance: The Bottom Line
Average annual total return reflects the change in the value of an investment, assuming reinvestment of distributions from dividend income and capital gains (the profits earned upon the sale of securities that have grown in value, if any) and assuming a constant rate of performance each year. During periods of reimbursement by Fidelity, a fund’s total return will be greater than it would be had the reimbursement not occurred. Performance numbers are net of all underlying fund operating expenses, but do not include any insurance charges imposed by your insurance company’s separate account. If performance information included the effect of these additional charges, the total returns would have been lower. How a fund did yesterday is no guarantee of how it will do tomorrow.
Average Annual Total Returns
| For the periods ended December 31, 2015 | Past 1 year | Life of FundA |
| Initial Class | (0.09)% | (0.51)% |
| Investor Class | (0.09)% | (0.53)% |
A From April 9, 2014
$10,000 Over Life of Fund
Let's say hypothetically that $10,000 was invested in VIP Floating Rate High Income Portfolio - Initial Class on April 9, 2014, when the fund started.
The chart shows how the value of your investment would have changed, and also shows how the S&P®/LSTA Leveraged Performing Loan Index performed over the same period.
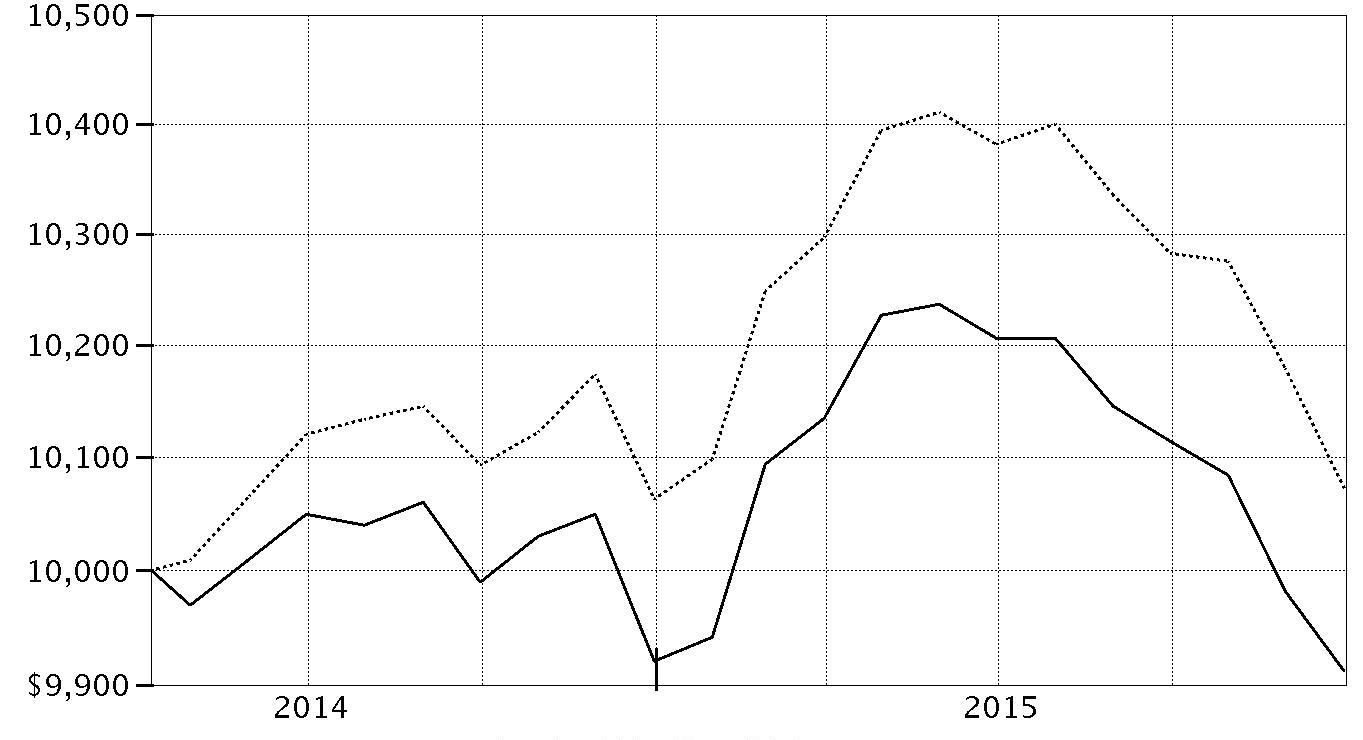
| Period Ending Values |
| $9,912 | VIP Floating Rate High Income Portfolio - Initial Class |
| $10,073 | S&P®/LSTA Leveraged Performing Loan Index |
Management's Discussion of Fund Performance
Market Recap: Floating-rate bank loans registered a slightly positive return for the 12 months ending December 31, 2015, with nearly all the gain occurring in the first half of the year. The S&P
®/LSTA Leveraged Performing Loan Index rose 0.10%, easily outpacing high-yield bonds, but trailing the broad investment-grade fixed-income market. Following a sharp drop in December 2014, bank loans rebounded during the early months of 2015. In February, the asset class posted its strongest monthly return since January 2012, bolstered by renewed investor demand for higher-yielding securities amid low bond yields globally, record U.S. stock prices and strengthening loan demand against the backdrop of light supply. The asset class continued to perform well through the end of May, aided by reduced supply, moderating retail fund outflows and robust demand from collateralized loan obligations. The tide shifted during the summer, however, as investors broadly retreated from riskier assets on concern about slowing economic growth in China and the potential impact the slowdown there could have on other economies. Loans continued to struggle in the fourth quarter due to relatively anemic demand. Within the index, more-defensive groups, such as food-related industries and gaming & lodging, were among the top performers, whereas oil & gas, nonferrous metals/minerals, and steel sharply underperformed.
Comments from Co-Portfolio Managers Eric Mollenhauer and Kevin Nielsen: For the year, the fund's share classes marginally lagged the benchmark, the S&P
®/LSTA Leveraged Performing Loan Index, primarily due to adverse security selection in steel, nonferrous metals/minerals, leisure goods/activities/movies and retailers. The main individual detractors were Canadian steel producer Essar Steel, coal mine operator Murray Energy, Securus Technologies, which provides pay telephone services to prison inmates, and clothing retailer J. Crew Group. On the plus side, selections in oil & gas and health care, along with an overweighting in the strong-performing containers & glass products group, provided the biggest boost versus the benchmark. A modest overweighting in oil & gas – the poorest-performing industry during the period – partially offset the benefit of our security selection there. The top individual contributors were oil & gas exploration & production (E&P) companies and index components American Energy–Marcellus and Templar Energy, which we avoided because we believed the risk/reward potential of their loans was too speculative. Elsewhere within this group, underweighting Seadrill Partners, a provider of drill-ships to E&P companies, also helped. Within health care, largely avoiding index constituent Millennium Health (formerly Millennium Labs), the nation's largest drug-testing laboratory, proved advantageous. We ultimately sold the fund's small position here. In an effort to reduce portfolio volatility, we cut our exposure to oil & gas, nonferrous metals/minerals, and steel. Given severely depressed loan prices, and the cyclical nature of these groups, we believe there may be meaningful upside potential in the names we continued to hold.
The views expressed above reflect those of the portfolio manager(s) only through the end of the period as stated on the cover of this report and do not necessarily represent the views of Fidelity or any other person in the Fidelity organization. Any such views are subject to change at any time based upon market or other conditions and Fidelity disclaims any responsibility to update such views. These views may not be relied on as investment advice and, because investment decisions for a Fidelity fund are based on numerous factors, may not be relied on as an indication of trading intent on behalf of any Fidelity fund.
Investment Summary (Unaudited)
Top Five Holdings as of December 31, 2015
| (by issuer, excluding cash equivalents) | % of fund's net assets | % of fund's net assets 6 months ago |
| First Data Corp. | 1.6 | 1.3 |
| Community Health Systems, Inc. | 1.6 | 1.5 |
| Albertson's LLC | 1.6 | 1.5 |
| Altice Financing SA | 1.4 | 1.4 |
| HCA Holdings, Inc. | 1.4 | 1.4 |
| | 7.6 | |
Top Five Market Sectors as of December 31, 2015
| | % of fund's net assets | % of fund's net assets 6 months ago |
| Technology | 11.4 | 9.0 |
| Healthcare | 10.4 | 11.8 |
| Containers | 6.1 | 6.6 |
| Gaming | 6.1 | 5.3 |
| Services | 6.1 | 5.7 |
Quality Diversification (% of fund's net assets)
| As of December 31, 2015 |
| | BBB | 1.5% |
| | BB | 30.9% |
| | B | 49.8% |
| | CCC,CC,C | 4.4% |
| | D | 0.1% |
| | Not Rated | 1.5% |
| | Short-Term Investments and Net Other Assets | 11.8% |

| As of June 30, 2015 |
| | BBB | 1.1% |
| | BB | 32.5% |
| | B | 52.3% |
| | CCC,CC,C | 5.0% |
| | Not Rated | 2.7% |
| | Short-Term Investments and Net Other Assets | 6.4% |

We have used ratings from Moody's Investors Service, Inc. Where Moody's® ratings are not available, we have used S&P® ratings. All ratings are as of the date indicated and do not reflect subsequent changes.
Asset Allocation (% of fund's net assets)
| As of December 31, 2015* |
| | Bank Loan Obligations | 83.8% |
| | Nonconvertible Bonds | 4.4% |
| | Short-Term Investments and Net Other Assets (Liabilities) | 11.8% |

* Foreign investments - 10.7%
| As of June 30, 2015* |
| | Bank Loan Obligations | 90.2% |
| | Nonconvertible Bonds | 3.4% |
| | Short-Term Investments and Net Other Assets (Liabilities) | 6.4% |

* Foreign investments - 10.3%
Investments December 31, 2015
Showing Percentage of Net Assets
| Bank Loan Obligations - 83.8%(a) | | | |
| | | Principal Amount | Value |
| Aerospace - 1.1% | | | |
| Gemini HDPE LLC Tranche B, term loan 4.75% 8/7/21 (b) | | $493,756 | $486,967 |
| TransDigm, Inc.: | | | |
| Tranche D, term loan 3.75% 6/4/21 (b) | | 458,025 | 445,429 |
| Tranche E, term loan 3.5% 5/14/22 (b) | | 374,103 | 361,545 |
|
| TOTAL AEROSPACE | | | 1,293,941 |
|
| Air Transportation - 0.2% | | | |
| Landmark Worldwide Tranche 1LN, term loan 4.75% 10/25/19 (b) | | 241,228 | 239,771 |
| Automotive & Auto Parts - 0.7% | | | |
| North American Lifting Holdings, Inc.: | | | |
| Tranche 1LN, term loan 5.5% 11/27/20 (b) | | 240,253 | 172,581 |
| Tranche 2LN, term loan 10% 11/27/21 (b) | | 500,000 | 370,000 |
| The Gates Corp. Tranche B 1LN, term loan 4.25% 7/3/21 (b) | | 269,318 | 252,004 |
|
| TOTAL AUTOMOTIVE & AUTO PARTS | | | 794,585 |
|
| Broadcasting - 0.7% | | | |
| Clear Channel Communications, Inc. Tranche D, term loan 7.1739% 1/30/19 (b) | | 500,000 | 348,930 |
| ION Media Networks, Inc. Tranche B, term loan 4.75% 12/18/20 (b) | | 495,000 | 486,338 |
|
| TOTAL BROADCASTING | | | 835,268 |
|
| Building Materials - 1.2% | | | |
| Builders FirstSource, Inc. Tranche 1LN, term loan 6% 7/31/22 (b) | | 274,370 | 270,940 |
| GYP Holdings III Corp. Tranche 1LN, term loan 4.75% 4/1/21 (b) | | 248,111 | 236,120 |
| Jeld-Wen, Inc. Tranche B, term loan 4.75% 7/1/22 (b) | | 124,688 | 122,350 |
| LBM Borrower LLC Tranche B 1LN, term loan 6.25% 8/20/22 (b) | | 249,375 | 236,283 |
| Ls Deco LLC Tranche B, term loan 5.5% 5/21/22 (b) | | 244,063 | 241,622 |
| Nortek, Inc. Tranche B, term loan 3.5% 10/30/20 (b) | | 248,743 | 242,681 |
|
| TOTAL BUILDING MATERIALS | | | 1,349,996 |
|
| Cable/Satellite TV - 3.0% | | | |
| Charter Communications Operating LLC: | | | |
| Tranche E, term loan 3% 7/1/20 (b) | | 491,184 | 481,463 |
| Tranche I, term loan 3.5% 1/24/23 (b) | | 625,000 | 623,700 |
| CSC Holdings LLC Tranche B, term loan 5% 10/9/22 (b) | | 500,000 | 498,595 |
| Liberty Cablevision of Puerto Rico: | | | |
| Tranche 1LN, term loan 4.5% 1/7/22 (b) | | 250,000 | 241,563 |
| Tranche 2LN, term loan 7.75% 7/7/23 (b) | | 240,000 | 225,600 |
| Numericable LLC: | | | |
| Tranche B 1LN, term loan 4.5% 5/8/20 (b) | | 187,967 | 180,636 |
| Tranche B 2LN, term loan 4.5% 5/8/20 (b) | | 162,615 | 156,273 |
| Tranche B 6LN, term loan 4.75% 2/10/23 (b) | | 500,000 | 479,465 |
| Virgin Media Investment Holdings Ltd. Tranche B, term loan 3.5% 6/30/23 (b) | | 504,991 | 493,866 |
|
| TOTAL CABLE/SATELLITE TV | | | 3,381,161 |
|
| Capital Goods - 0.5% | | | |
| Onex Wizard U.S. Acquisition, Inc. Tranche B, term loan 4.25% 3/13/22 (b) | | 441,973 | 434,310 |
| SRAM LLC. Tranche B, term loan 4.0159% 4/10/20 (b) | | 226,201 | 186,428 |
|
| TOTAL CAPITAL GOODS | | | 620,738 |
|
| Chemicals - 2.6% | | | |
| A. Schulman, Inc. Tranche B, term loan 4% 6/1/22 (b) | | 194,025 | 191,842 |
| Arizona Chem U.S., Inc.: | | | |
| Tranche 2LN, term loan 7.5% 6/12/22 (b) | | 20,000 | 19,950 |
| Tranche B 1LN, term loan 4.5236% 6/12/21 (b) | | 60,123 | 59,806 |
| Aruba Investments, Inc. Tranche B, term loan 4.5% 2/2/22 (b) | | 163,729 | 160,046 |
| Chromaflo Technologies Corp. Tranche B 1LN, term loan 4.5% 12/2/19 (b) | | 372,151 | 355,404 |
| Hilex Poly Co. LLC Tranche B 1LN, term loan 6% 12/5/21 (b) | | 496,250 | 494,017 |
| MacDermid, Inc.: | | | |
| Tranche B 2LN, term loan 5.5% 6/7/20 (b) | | 247,500 | 238,838 |
| Tranche B 3LN, term loan 5.5% 6/7/20 (b) | | 124,688 | 120,729 |
| OCI Beaumont, LLC Tranche B 3LN, term loan 6.5% 8/20/19 (b) | | 248,736 | 249,980 |
| Orion Engineered Carbons GMBH Tranche B, term loan 5% 7/25/21 (b) | | 456,047 | 454,337 |
| Royal Holdings, Inc. Tranche B 2LN, term loan 8.5% 6/19/23 (b) | | 100,000 | 97,917 |
| Trinseo Materials Operating SCA/Trinseo Materials Finance, Inc. Tranche B 1LN, term loan 4.25% 11/5/21 (b) | | 169,150 | 166,317 |
| Tronox Pigments (Netherlands) B.V. Tranche B, term loan 4.5% 3/19/20 (b) | | 258,673 | 228,279 |
| Univar, Inc. Tranche B, term loan 4.25% 7/1/22 (b) | | 134,663 | 130,080 |
|
| TOTAL CHEMICALS | | | 2,967,542 |
|
| Consumer Products - 1.0% | | | |
| At Home Holding III, Inc. Tranche B 1LN, term loan 5% 6/3/22 (b) | | 124,375 | 120,022 |
| Hercules Achievement, Inc. Tranche B, term loan 5% 12/11/21 (b) | | 742,500 | 734,459 |
| Kate Spade & Co. Tranche B, term loan 4% 4/10/21 (b) | | 247,494 | 237,698 |
|
| TOTAL CONSUMER PRODUCTS | | | 1,092,179 |
|
| Containers - 5.0% | | | |
| Anchor Glass Container Corp. Tranche B, term loan 4.5435% 7/1/22 (b) | | 443,183 | 440,967 |
| Ardagh Holdings U.S.A., Inc. Tranche B, term loan 4% 12/17/19 (b) | | 243,769 | 239,137 |
| Berlin Packaging, LLC: | | | |
| Tranche 2LN, term loan 7.75% 10/1/22 (b) | | 250,000 | 236,250 |
| Tranche B 1LN, term loan 4.5273% 10/1/21 (b) | | 493,945 | 488,389 |
| Berry Plastics Corp.: | | | |
| Tranche E, term loan 3.75% 1/6/21 (b) | | 859,167 | 845,532 |
| Tranche F, term loan 4% 10/1/22 (b) | | 365,134 | 361,483 |
| BWAY Holding Co. Tranche B, term loan 5.5% 8/14/20 (b) | | 812,625 | 777,585 |
| Charter NEX U.S. Holdings, Inc. Tranche B 1LN, term loan 5.25% 2/5/22 (b) | | 239,491 | 235,599 |
| Consolidated Container Co. Tranche 2LN, term loan 7.75% 1/3/20 (b) | | 1,000,000 | 850,000 |
| Hostess Brands LLC: | | | |
| Tranche B 1LN, term loan 4.5% 8/3/22 (b) | | 119,700 | 118,952 |
| Tranche B 2LN, term loan 8.5% 8/3/23 (b) | | 15,000 | 14,831 |
| Owens-Brockway Glass Container, Inc. Tranche B, term loan 3.5% 9/1/22 (b) | | 374,063 | 371,960 |
| Reynolds Consumer Products Holdings, Inc. Tranche B, term loan 4.5% 12/1/18 (b) | | 500,000 | 494,480 |
| Signode Packaging Systems, Inc. Tranche B, term loan 3.75% 5/1/21 (b) | | 139,742 | 134,501 |
| Tekni-Plex, Inc. Tranche 2LN, term loan 8.75% 6/1/23 (b) | | 125,000 | 117,500 |
|
| TOTAL CONTAINERS | | | 5,727,166 |
|
| Diversified Financial Services - 1.9% | | | |
| AlixPartners LLP Tranche B, term loan 4.5% 7/28/22 (b) | | 234,413 | 232,216 |
| Assuredpartners, Inc. Tranche B 1LN, term loan 5.75% 10/22/22 (b) | | 325,000 | 322,293 |
| Fly Funding II Sarl Tranche B, term loan 3.5% 8/9/19 (b) | | 236,842 | 234,118 |
| Flying Fortress Holdings, Inc. Tranche B, term loan 3.5% 4/30/20 (b) | | 500,000 | 498,440 |
| IBC Capital U.S. LLC Tranche B 1LN, term loan 4.75% 9/11/21 (b) | | 277,900 | 250,110 |
| Ocwen Loan Servicing, LLC Tranche B, term loan 5.5% 2/15/18 (b) | | 167,932 | 167,267 |
| TransUnion LLC Tranche B 2LN, term loan 3.5% 4/9/21 (b) | | 496,212 | 481,117 |
|
| TOTAL DIVERSIFIED FINANCIAL SERVICES | | | 2,185,561 |
|
| Energy - 3.9% | | | |
| Alon U.S.A. Partners LP term loan 9.25% 11/26/18 (b) | | 738,579 | 734,886 |
| Atlantic Power Ltd. Partnership Tranche B LN, term loan 4.75% 2/24/21 (b) | | 218,462 | 216,550 |
| Chelsea Petroleum Products I LLC Tranche B, term loan 6.5% 10/28/22 (b) | | 250,000 | 242,500 |
| Citgo Holding, Inc. Tranche B, term loan 9.5% 5/12/18 (b) | | 121,008 | 119,898 |
| CPI Acquisition, Inc. Tranche B, term loan 5.5% 8/17/22 (b) | | 179,598 | 177,241 |
| Crestwood Holdings Partners LLC Tranche B, term loan 7% 6/19/19 (b) | | 559,315 | 354,231 |
| Drillships Ocean Ventures, Inc. Tranche B, term loan 5.5% 7/25/21 (b) | | 470,808 | 220,103 |
| Empire Generating Co. LLC: | | | |
| Tranche B, term loan 5.25% 3/14/21 (b) | | 443,564 | 354,851 |
| Tranche C, term loan 5.25% 3/14/21 (b) | | 32,532 | 26,026 |
| Expro Finservices S.a.r.l. Tranche B, term loan 5.75% 9/2/21 (b) | | 190,737 | 126,681 |
| Fieldwood Energy, LLC Tranche 2LN, term loan 8.375% 9/30/20 (b) | | 135,000 | 20,250 |
| Floatel International Ltd. Tranche B, term loan 6% 6/27/20 (b) | | 157,200 | 68,854 |
| MRC Global, Inc. Tranche B, term loan 4.75% 11/9/19 (b) | | 335,838 | 307,292 |
| Overseas Shipholding Group, Inc. Tranche B, term loan 5.25% 8/5/19 (b) | | 123,125 | 117,892 |
| Panda Sherman Power, LLC term loan 9% 9/14/18 (b) | | 493,906 | 439,576 |
| Penn Products Terminals LLC Tranche B, term loan 4.75% 4/13/22 (b) | | 133,988 | 125,278 |
| Seadrill Operating LP Tranche B, term loan 4% 2/21/21 (b) | | 152,281 | 62,942 |
| Terra-Gen Finance Co. LLC Tranche B, term loan 5.25% 12/9/21 (b) | | 397,058 | 369,264 |
| TerraForm AP Acquisition Holdings LLC Tranche B, term loan 5% 6/26/22 (b) | | 360,396 | 338,772 |
|
| TOTAL ENERGY | | | 4,423,087 |
|
| Entertainment/Film - 0.5% | | | |
| AMC Entertainment, Inc. Tranche B, term loan 4% 12/15/22 (b) | | 250,000 | 249,465 |
| CDS U.S. Intermediate Holdings, Inc.: | | | |
| Tranche B 1LN, term loan 5% 7/8/22 (b) | | 134,663 | 126,695 |
| Tranche B 2LN, term loan 9.25% 7/8/23 (b) | | 50,000 | 47,000 |
| Regal Cinemas Corp. Tranche B, term loan 3.803% 4/1/22 (b) | | 109,450 | 108,980 |
|
| TOTAL ENTERTAINMENT/FILM | | | 532,140 |
|
| Environmental - 0.4% | | | |
| ADS Waste Holdings, Inc. Tranche B 2LN, term loan 3.75% 10/9/19 (b) | | 224,121 | 216,557 |
| The Brickman Group, Ltd. Tranche B 1LN, term loan 4% 12/18/20 (b) | | 248,734 | 240,397 |
|
| TOTAL ENVIRONMENTAL | | | 456,954 |
|
| Food & Drug Retail - 3.2% | | | |
| Albertson's LLC: | | | |
| Tranche B 3LN, term loan 5.125% 8/25/19 (b) | | 240,625 | 237,889 |
| Tranche B 4LN, term loan 5.5% 8/25/21 (b) | | 1,483,788 | 1,469,513 |
| Tranche B 5LN, term loan 12/21/22 (c) | | 125,000 | 124,125 |
| Ferrara Candy Co., Inc. Tranche B, term loan 7.5% 6/18/18 (b) | | 491,105 | 487,422 |
| GOBP Holdings, Inc. Tranche B 1LN, term loan 4.75% 10/21/21 (b) | | 460,573 | 442,150 |
| Performance Food Group, Inc. Tranche 2LN, term loan 6.25% 11/14/19 (b) | | 509,047 | 506,924 |
| PRA Holdings, Inc. Tranche B, term loan 4.5% 9/23/20 (b) | | 389,024 | 383,328 |
|
| TOTAL FOOD & DRUG RETAIL | | | 3,651,351 |
|
| Food/Beverage/Tobacco - 1.3% | | | |
| B&G Foods, Inc. Tranche B, term loan 3.75% 10/2/22 (b) | | 250,000 | 249,453 |
| Blue Ribbon LLC Tranche B 1LN, term loan 5.5% 11/13/21 (b) | | 227,848 | 226,994 |
| JBS U.S.A. LLC Tranche B, term loan 4% 10/30/22 (b) | | 250,000 | 249,063 |
| Post Holdings, Inc. Tranche B, term loan 3.75% 6/2/21 (b) | | 77,002 | 76,797 |
| Shearer's Foods, Inc.: | | | |
| Tranche 2LN, term loan 7.75% 6/30/22 (b) | | 255,000 | 239,700 |
| Tranche B 1LN, term loan 4.9375% 6/30/21 (b) | | 503,625 | 491,034 |
|
| TOTAL FOOD/BEVERAGE/TOBACCO | | | 1,533,041 |
|
| Gaming - 5.9% | | | |
| American Casino & Entertainment Properties LLC Tranche B, term loan 4.75% 7/7/22 (b) | | 373,125 | 371,259 |
| Aristocrat International (Pty) Ltd. Tranche B, term loan 4.75% 10/20/21 (b) | | 469,231 | 466,551 |
| Caesars Entertainment Resort Properties LLC Tranche B 1LN, term loan 7% 10/11/20 (b) | | 411,712 | 372,859 |
| Caesars Growth Properties Holdings, LLC Tranche 1LN, term loan 6.25% 5/8/21 (b) | | 1,553,230 | 1,359,076 |
| CCM Merger, Inc. Tranche B, term loan 4.5% 8/8/21 (b) | | 225,103 | 223,527 |
| Eldorado Resorts, Inc. Tranche B, term loan 4.25% 7/23/22 (b) | | 218,900 | 216,711 |
| Golden Nugget, Inc. Tranche B, term loan: | | | |
| 5.5% 11/21/19 (b) | | 330,653 | 327,347 |
| 5.5% 11/21/19 (b) | | 141,709 | 140,291 |
| Graton Economic Development Authority Tranche B, term loan 4.75% 9/1/22 (b) | | 363,752 | 359,660 |
| MGM Mirage, Inc. Tranche B, term loan 3.5% 12/20/19 (b) | | 124,041 | 122,180 |
| Mohegan Tribal Gaming Authority Tranche B, term loan 5.5% 6/15/18 (b) | | 598,263 | 583,946 |
| Scientific Games Corp.: | | | |
| Tranche B 2LN, term loan 6% 10/1/21 (b) | | 247,500 | 224,871 |
| Tranche B, term loan 6% 10/18/20 (b) | | 1,108,372 | 1,011,390 |
| Station Casinos LLC Tranche B, term loan 4.25% 3/1/20 (b) | | 928,968 | 908,651 |
|
| TOTAL GAMING | | | 6,688,319 |
|
| Healthcare - 9.1% | | | |
| Alere, Inc. Tranche B, term loan 4.25% 6/18/22 (b) | | 152,999 | 151,357 |
| Alvogen Pharma U.S., Inc. Tranche B 1LN, term loan 6% 4/2/22 (b) | | 148,939 | 145,029 |
| AMAG Pharmaceuticals, Inc. Tranche B, term loan 4.75% 8/17/21 (b) | | 246,875 | 235,353 |
| AmSurg Corp. Tranche B, term loan 3.5% 7/16/21 (b) | | 591,000 | 584,351 |
| Community Health Systems, Inc.: | | | |
| Tranche G, term loan 3.75% 12/31/19 (b) | | 383,224 | 372,927 |
| Tranche H, term loan 4% 1/27/21 (b) | | 1,358,026 | 1,334,749 |
| Concordia Healthcare Corp. Tranche B 1LN, term loan 5.25% 10/21/21 (b) | | 170,000 | 162,882 |
| ConvaTec, Inc. Tranche B, term loan 4.25% 6/15/20 (b) | | 129,350 | 126,844 |
| CT Technologies Intermediate, Inc. Tranche B 1LN, term loan 5.25% 12/1/21 (b) | | 248,750 | 238,800 |
| DaVita HealthCare Partners, Inc. Tranche B, term loan 3.5% 6/24/21 (b) | | 488,788 | 486,138 |
| DJO Finance LLC Tranche B 1LN, term loan 4.25% 6/7/20 (b) | | 124,688 | 120,986 |
| Drumm Investors LLC Tranche B, term loan 6.75% 5/4/18 (b) | | 250,113 | 246,154 |
| Envision Healthcare Corp. Tranche B 2LN, term loan 4.5% 10/28/22 (b) | | 250,000 | 248,125 |
| Genesis HealthCare Corp. Tranche B, term loan 10% 12/4/17 (b) | | 250,000 | 252,500 |
| Genoa, a QoL Healthcare Co. LLC Tranche 1LN, term loan 4.5% 4/30/22 (b) | | 49,476 | 47,991 |
| HCA Holdings, Inc. Tranche B 4LN, term loan 3.3567% 5/1/18 (b) | | 546,154 | 545,132 |
| HCR Healthcare LLC Tranche B, term loan 5% 4/6/18 (b) | | 495,127 | 467,588 |
| Hill-Rom Holdings, Inc. Tranche B, term loan 3.5% 9/8/22 (b) | | 364,688 | 364,297 |
| Horizon Pharmaceuticals, Inc. Tranche B, term loan 4.5% 5/7/21 (b) | | 318,712 | 298,792 |
| Jaguar Holding Co. II / Pharmaceutical Product Development LLC Tranche B, term loan 4.25% 8/18/22 (b) | | 248,438 | 240,985 |
| Kindred Healthcare, Inc. Tranche B, term loan 4.25% 4/9/21 (b) | | 475,176 | 457,357 |
| Onex Schumacher Finance LP Tranche B 1LN, term loan 5% 7/31/22 (b) | | 374,063 | 367,827 |
| Patheon, Inc. Tranche B, term loan 4.25% 3/11/21 (b) | | 616,244 | 593,135 |
| U.S. Renal Care, Inc.: | | | |
| Tranche 2LN, term loan 11/17/23 (c) | | 250,000 | 245,313 |
| Tranche B 1LN, term loan 11/17/22 (c) | | 625,000 | 618,750 |
| Valeant Pharmaceuticals International, Inc.: | | | |
| Tranche A 3LN, term loan 10/20/18 (c) | | 125,000 | 120,313 |
| Tranche BD 2LN, term loan 3.5% 2/13/19 (b) | | 750,000 | 721,875 |
| Tranche E, term loan 3.75% 8/5/20 (b) | | 625,000 | 598,438 |
|
| TOTAL HEALTHCARE | | | 10,393,988 |
|
| Homebuilders/Real Estate - 1.5% | | | |
| Communications Sales & Leasing, Inc. Tranche B, term loan 5% 10/24/22 (b) | | 124,375 | 114,619 |
| DTZ U.S. Borrower LLC: | | | |
| Tranche 2LN, term loan 9.25% 11/4/22 (b) | | 125,000 | 122,916 |
| Tranche B 1LN, term loan 4.25% 11/4/21 (b) | | 495,013 | 482,172 |
| Realogy Group LLC Tranche B, term loan 3.75% 3/5/20 (b) | | 982,456 | 973,447 |
|
| TOTAL HOMEBUILDERS/REAL ESTATE | | | 1,693,154 |
|
| Hotels - 1.3% | | | |
| ESH Hospitality, Inc. Tranche B, term loan 5% 6/24/19 (b) | | 225,000 | 225,563 |
| Four Seasons Holdings, Inc.: | | | |
| Tranche 2LN, term loan 6.25% 12/27/20 (b) | | 375,000 | 369,686 |
| Tranche B 1LN, term loan 3.5% 6/27/20 (b) | | 498,375 | 488,408 |
| La Quinta Intermediate Holdings LLC Tranche B LN, term loan 3.75% 4/14/21 (b) | | 414,920 | 403,510 |
|
| TOTAL HOTELS | | | 1,487,167 |
|
| Insurance - 0.6% | | | |
| Alliant Holdings Intermediate LLC Tranche B, term loan 4.5% 8/14/22 (b) | | 278,600 | 271,287 |
| HUB International Ltd. Tranche B 1LN, term loan 4% 10/2/20 (b) | | 491,250 | 462,389 |
|
| TOTAL INSURANCE | | | 733,676 |
|
| Leisure - 0.8% | | | |
| 24 Hour Fitness Worldwide, Inc. Tranche B, term loan 4.75% 5/30/21 (b) | | 502,969 | 468,390 |
| LTF Merger Sub, Inc. Tranche B, term loan 4.25% 6/10/22 (b) | | 333,325 | 324,369 |
| Planet Fitness Holdings, LLC. Tranche B, term loan 4.75% 3/31/21 (b) | | 116,722 | 114,679 |
|
| TOTAL LEISURE | | | 907,438 |
|
| Metals/Mining - 1.5% | | | |
| American Rock Salt Co. LLC Tranche B 1LN, term loan 4.75% 5/20/21 (b) | | 694,425 | 661,877 |
| Doncasters Group, LLC Tranche B 1LN, term loan 4.5% 4/9/20 (b) | | 57,421 | 55,483 |
| Fortescue Metals Group Ltd. Tranche B, term loan 4.25% 6/30/19 (b) | | 437,073 | 322,932 |
| Murray Energy Corp.: | | | |
| Tranche B 1LN, term loan 7% 4/16/17 (b) | | 458,369 | 350,653 |
| Tranche B 2LN, term loan 7.5% 4/16/20 (b) | | 372,157 | 235,921 |
| Peabody Energy Corp. Tranche B, term loan 4.25% 9/24/20 (b) | | 124,364 | 58,451 |
| Walter Energy, Inc. Tranche B, term loan 4/1/18 (c) | | 250,000 | 66,668 |
|
| TOTAL METALS/MINING | | | 1,751,985 |
|
| Paper - 0.3% | | | |
| Caraustar Industries, Inc. Tranche B, term loan 8% 5/1/19 (b) | | 323,430 | 320,195 |
| Publishing/Printing - 2.0% | | | |
| Cengage Learning Acquisitions, Inc. Tranche 1LN, term loan 7% 3/31/20 (b) | | 249,370 | 242,513 |
| Getty Images, Inc. Tranche B, term loan 4.75% 10/18/19 (b) | | 487,352 | 303,864 |
| Houghton Mifflin Harcourt Publishing, Inc. Tranche B, term loan 4% 5/29/21 (b) | | 497,500 | 476,356 |
| Merrill Communications LLC Tranche B, term loan 6.25% 6/1/22 (b) | | 358,595 | 304,805 |
| Proquest LLC Tranche B, term loan 5.75% 10/24/21 (b) | | 494,992 | 484,473 |
| Springer Science+Business Media Deutschland GmbH Tranche B 9LN, term loan 4.75% 8/14/20 (b) | | 495,627 | 473,819 |
|
| TOTAL PUBLISHING/PRINTING | | | 2,285,830 |
|
| Restaurants - 1.4% | | | |
| Burger King Worldwide, Inc. Tranche B, term loan 3.75% 12/12/21 (b) | | 755,156 | 747,604 |
| CEC Entertainment, Inc. Tranche B, term loan 4.25% 2/14/21 (b) | | 245,009 | 231,534 |
| Landry's Restaurants, Inc. Tranche B, term loan 4% 4/24/18 (b) | | 202,972 | 201,641 |
| Red Lobster Hospitality LLC Tranche B, term loan 6.25% 7/28/21 (b) | | 257,059 | 254,489 |
| TGI Friday's, Inc. Tranche B 1LN, term loan 5.25% 7/15/20 (b) | | 176,054 | 175,614 |
|
| TOTAL RESTAURANTS | | | 1,610,882 |
|
| Services - 6.1% | | | |
| Acosta, Inc. Tranche B, term loan 4.25% 9/26/21 (b) | | 872,183 | 827,641 |
| ARAMARK Corp. Tranche F, term loan 3.25% 2/24/21 (b) | | 491,250 | 485,723 |
| Brand Energy & Infrastructure Services, Inc. Tranche B, term loan 4.75% 11/26/20 (b) | | 248,101 | 233,912 |
| Cactus Wellhead LLC Tranche B, term loan 7% 7/31/20 (b) | | 245,638 | 174,403 |
| Coinmach Service Corp. Tranche B, term loan 4.25% 11/14/19 (b) | | 615,642 | 590,093 |
| Creative Artists Agency LLC Tranche B, term loan 5.5038% 12/17/21 (b) | | 549,586 | 546,839 |
| Karman Buyer Corp.: | | | |
| Tranche 1LN, term loan 4.25% 7/25/21 (b) | | 321,928 | 308,961 |
| Tranche 2LN, term loan 7.5% 7/25/22 (b) | | 125,000 | 111,339 |
| KC Mergersub, Inc.: | | | |
| Tranche 1LN, term loan 6% 8/13/22 (b) | | 374,063 | 364,711 |
| Tranche L 2LN, term loan 10.25% 8/13/23 (b) | | 100,000 | 98,000 |
| Laureate Education, Inc. Tranche B, term loan 5% 6/16/18 (b) | | 1,473,169 | 1,215,364 |
| Lineage Logistics Holdings, LLC. Tranche B, term loan 4.5% 4/7/21 (b) | | 492,481 | 443,233 |
| Nord Anglia Education Tranche B, term loan 5% 3/31/21 (b) | | 243,122 | 236,740 |
| Research Now Group, Inc. Tranche B 1LN, term loan 5.5031% 3/18/21 (b) | | 89,325 | 87,985 |
| Science Applications International Corp. Tranche B, term loan 3.75% 5/4/22 (b) | | 248,750 | 248,750 |
| The ServiceMaster Co. Tranche B, term loan 4.25% 7/1/21 (b) | | 493,750 | 487,578 |
| Wash Multifamily Acquisition, Inc.: | | | |
| Tranche B 1LN, term loan 4.25% 5/14/22 (b) | | 422,875 | 411,246 |
| Tranche B 2LN, term loan 8% 5/14/23 (b) | | 40,000 | 37,700 |
|
| TOTAL SERVICES | | | 6,910,218 |
|
| Steel - 0.4% | | | |
| Essar Steel Algoma, Inc. Tranche B, term loan 5.4375% 8/16/19 (b) | | 495,000 | 117,810 |
| JMC Steel Group, Inc. term loan 4.75% 4/1/17 (b) | | 334,322 | 320,949 |
|
| TOTAL STEEL | | | 438,759 |
|
| Super Retail - 4.6% | | | |
| Academy Ltd. Tranche B, term loan 5% 7/2/22 (b) | | 235,051 | 226,237 |
| Bass Pro Group LLC Tranche B, term loan 4% 6/5/20 (b) | | 374,058 | 359,406 |
| BJ's Wholesale Club, Inc. Tranche B 1LN, term loan 4.5% 9/26/19 (b) | | 491,651 | 469,935 |
| Davids Bridal, Inc. Tranche B, term loan 5.25% 10/11/19 (b) | | 250,000 | 205,750 |
| Dollar Tree, Inc. Tranche B 1LN, term loan 3.5% 7/6/22 (b) | | 248,125 | 247,041 |
| J. Crew Group, Inc. Tranche B LN, term loan 4% 3/5/21 (b) | | 485,000 | 312,704 |
| JC Penney Corp., Inc. Tranche B, term loan 6% 5/22/18 (b) | | 860,822 | 844,251 |
| Party City Holdings, Inc. Tranche B, term loan 4.25% 8/19/22 (b) | | 408,975 | 396,452 |
| PetSmart, Inc. Tranche B, term loan 4.25% 3/11/22 (b) | | 871,560 | 847,374 |
| Sears Holdings Corp. Tranche ABL, term loan 5.5% 6/30/18 (b) | | 861,769 | 805,754 |
| Sports Authority, Inc. Tranche B, term loan 7.5% 11/16/17 (b) | | 328,771 | 98,631 |
| Staples, Inc. Tranche B, term loan 4/24/21 (c) | | 250,000 | 246,770 |
| Vogue International LLC Tranche B, term loan 5.75% 2/14/20 (b) | | 123,741 | 123,200 |
|
| TOTAL SUPER RETAIL | | | 5,183,505 |
|
| Technology - 11.4% | | | |
| Avago Technologies Cayman Finance Ltd. Tranche B, term loan 12/31/22 (c) | | 500,000 | 494,065 |
| Blue Coat Systems, Inc. Tranche B, term loan 4.5% 5/22/22 (b) | | 585,000 | 564,039 |
| BMC Software Finance, Inc. Tranche B, term loan: | | | |
| 5% 9/10/20 (b) | | 491,228 | 400,105 |
| 5% 9/10/20 (b) | | 748,022 | 613,909 |
| Ceridian HCM Holding, Inc. Tranche B 2LN, term loan 4.5% 9/15/20 (b) | | 371,560 | 314,433 |
| Computer Discount Warehouse (CDW) LLC, Tranche B, term loan 3.25% 4/29/20 (b) | | 983,572 | 957,507 |
| Datapipe, Inc. Tranche B 1LN, term loan 5.25% 3/15/19 (b) | | 492,501 | 486,192 |
| Dell International LLC Tranche B 2LN, term loan 4% 4/29/20 (b) | | 1,369,372 | 1,358,362 |
| Epicor Software Corp. Tranche B, term loan 4.75% 6/1/22 (b) | | 373,125 | 363,398 |
| First Data Corp.: | | | |
| Tranche B, term loan 3.9175% 3/24/18 (b) | | 1,500,000 | 1,478,534 |
| Tranche B, term loan 4.1675% 7/10/22 (b) | | 375,000 | 369,281 |
| G.I. Peak Merger Sub Corp.: | | | |
| Tranche 2LN, term loan 8.25% 6/17/22 (b) | | 50,000 | 46,000 |
| Tranche B 1LN, term loan 5% 6/17/21 (b) | | 118,200 | 115,934 |
| Infor U.S., Inc. Tranche B 5LN, term loan 3.75% 6/3/20 (b) | | 380,143 | 356,068 |
| Informatica Corp. Tranche B, term loan 4.5% 8/6/22 (b) | | 359,100 | 344,865 |
| Kronos, Inc.: | | | |
| Tranche 2LN, term loan 9.75% 4/30/20 (b) | | 499,590 | 495,428 |
| Tranche B 1LN, term loan 4.5% 10/30/19 (b) | | 824,619 | 809,677 |
| Lux FinCo U.S. SPV: | | | |
| Tranche 2LN, term loan 9.5% 10/16/23 (b) | | 125,000 | 122,188 |
| Tranche B 1LN, term loan 5% 10/16/22 (b) | | 130,000 | 126,425 |
| Microsemi Corp. Tranche B, term loan 12/16/22 (c) | | 250,000 | 245,125 |
| NXP BV Tranche B 2LN, term loan 3.75% 12/7/20 (b) | | 250,000 | 248,563 |
| Presidio, Inc. Tranche B, term loan 5.25% 2/2/22 (b) | | 237,786 | 231,100 |
| Renaissance Learning, Inc. Tranche 1LN, term loan 4.5% 4/9/21 (b) | | 487,510 | 465,572 |
| Shaw Data Centre LP Tranche B, term loan 4.5% 3/30/22 (b) | | 194,025 | 190,509 |
| Sophia L.P. Tranche B, term loan 4.75% 9/30/22 (b) | | 498,750 | 492,047 |
| SS&C Technologies, Inc.: | | | |
| Tranche B 1LN, term loan 4.0068% 7/8/22 (b) | | 289,238 | 286,707 |
| Tranche B 2LN, term loan 4.0175% 7/8/22 (b) | | 42,566 | 42,193 |
| Transfirst, Inc. Tranche B 1LN, term loan 4.75% 11/12/21 (b) | | 24,812 | 24,569 |
| TTM Technologies, Inc. Tranche B 1LN, term loan 6% 5/31/21 (b) | | 749,063 | 676,029 |
| WP Mustang Holdings, LLC. Tranche B 1LN, term loan 5.5% 5/29/21 (b) | | 322,612 | 320,757 |
|
| TOTAL TECHNOLOGY | | | 13,039,581 |
|
| Telecommunications - 5.4% | | | |
| Altice Financing SA: | | | |
| Tranche B 2LN, term loan 5.25% 1/30/22 (b) | | 373,125 | 371,144 |
| Tranche B, term loan 5.5% 6/24/19 (b) | | 1,230,542 | 1,220,550 |
| Digicel International Finance Ltd. Tranche D 2LN, term loan 4.1031% 3/31/19 (b) | | 100,000 | 90,000 |
| FairPoint Communications, Inc. Tranche B, term loan 7.5% 2/14/19 (b) | | 246,827 | 244,729 |
| Integra Telecom Holdings, Inc. Tranche B 1LN, term loan 5.25% 8/14/20 (b) | | 372,188 | 359,161 |
| Intelsat Jackson Holdings SA Tranche B 2LN, term loan 3.75% 6/30/19 (b) | | 1,125,000 | 1,061,516 |
| Level 3 Financing, Inc.: | | | |
| Tranche B 2LN, term loan 3.5% 5/31/22 (b) | | 250,000 | 245,813 |
| Tranche B 4LN, term loan 4% 1/15/20 (b) | | 500,000 | 497,945 |
| LTS Buyer LLC Tranche B 1LN, term loan 4% 4/11/20 (b) | | 864,271 | 839,639 |
| Mitel U.S. Holdings, Inc. Tranche B, term loan 5.5% 4/29/22 (b) | | 189,050 | 186,530 |
| Sable International Finance Ltd.: | | | |
| Tranche B 1LN, term loan 12/2/22 (c) | | 68,750 | 67,224 |
| Tranche B 2LN, term loan 12/2/22 (c) | | 56,250 | 55,002 |
| Securus Technologies Holdings, Inc.: | | | |
| Tranche 2LN, term loan 9% 4/30/21 (b) | | 250,000 | 134,500 |
| Tranche B 1LN, term loan 4.75% 4/30/20 (b) | | 491,208 | 349,985 |
| T-Mobile U.S.A., Inc. Tranche B, term loan 3.5% 11/9/22 (b) | | 390,000 | 389,575 |
|
| TOTAL TELECOMMUNICATIONS | | | 6,113,313 |
|
| Transportation Ex Air/Rail - 0.4% | | | |
| American Commercial Barge Line Tranche B 1LN, term loan 9.75% 11/12/20 (b) | | 175,000 | 161,000 |
| Navios Partners Finance (U.S.), Inc. Tranche B, term loan 5.25% 6/27/18 (b) | | 125,000 | 119,166 |
| YRC Worldwide, Inc. Tranche B, term loan 8.25% 2/13/19 (b) | | 193,267 | 167,498 |
|
| TOTAL TRANSPORTATION EX AIR/RAIL | | | 447,664 |
|
| Utilities - 3.9% | | | |
| Alinta Energy Finance Pty. Ltd. Tranche B, term loan: | | | |
| 6.375% 8/13/18 (b) | | 30,483 | 30,090 |
| 6.375% 8/13/19 (b) | | 458,655 | 452,730 |
| Energy Future Holdings Corp. Tranche 1LN, term loan 4.25% 6/19/16 (b) | | 115,000 | 114,454 |
| Essential Power LLC Tranche B, term loan 4.75% 8/8/19 (b) | | 608,780 | 598,888 |
| Green Energy Partners/Stonewall LLC Tranche B 1LN, term loan 6.5% 11/13/21 (b) | | 265,000 | 243,800 |
| Houston Fuel Oil Terminal Co. Tranche B, term loan 4.25% 8/19/21 (b) | | 554,247 | 509,907 |
| InterGen NV Tranche B, term loan 5.5% 6/13/20 (b) | | 738,636 | 665,696 |
| Longview Power LLC Tranche B, term loan 7% 4/13/21 (b) | | 248,750 | 213,925 |
| Moxie Patriot LLC Tranche B, term loan 6.75% 12/19/20 (b) | | 750,000 | 686,250 |
| Southcross Energy Partners LP Tranche B, term loan 5.25% 8/4/21 (b) | | 44,325 | 33,465 |
| Southcross Holdings Borrower LP Tranche B, term loan 6% 8/4/21 (b) | | 136,997 | 74,892 |
| Tempus Public Foundation Generation Holdings LLC Tranche B, term loan 4.75% 12/31/17 (b) | | 487,911 | 429,362 |
| USIC Holdings, Inc. Tranche B, term loan 4% 7/10/20 (b) | | 235,529 | 219,631 |
| Veresen Midstream LP Tranche B, term loan 5.25% 3/31/22 (b) | | 178,650 | 175,970 |
|
| TOTAL UTILITIES | | | 4,449,060 |
|
| TOTAL BANK LOAN OBLIGATIONS | | | |
| (Cost $101,473,681) | | | 95,539,215 |
|
| Nonconvertible Bonds - 4.4% | | | |
| Banks & Thrifts - 0.2% | | | |
| Ally Financial, Inc. 3.25% 11/5/18 | | 250,000 | 245,313 |
| Containers - 1.1% | | | |
| Ardagh Packaging Finance PLC/Ardagh MP Holdings U.S.A., Inc. 3.512% 12/15/19 (b)(d) | | 1,000,000 | 977,500 |
| Reynolds Group Issuer, Inc./Reynolds Group Issuer LLC/Reynolds Group Issuer (Luxembourg) SA 6.875% 2/15/21 | | 250,000 | 257,500 |
|
| TOTAL CONTAINERS | | | 1,235,000 |
|
| Diversified Financial Services - 0.3% | | | |
| AerCap Ireland Capital Ltd./AerCap Global Aviation Trust 4.625% 10/30/20 | | 320,000 | 327,600 |
| Energy - 0.6% | | | |
| American Energy-Permian Basin LLC/ AEPB Finance Corp. 6.8341% 8/1/19 (b)(d) | | 155,000 | 57,738 |
| Chesapeake Energy Corp. 8% 12/15/22 (d) | | 21,000 | 10,290 |
| Citgo Petroleum Corp. 6.25% 8/15/22 (d) | | 385,000 | 369,600 |
| Northern Tier Energy LLC/Northern Tier Finance Corp. 7.125% 11/15/20 | | 285,000 | 287,850 |
|
| TOTAL ENERGY | | | 725,478 |
|
| Gaming - 0.2% | | | |
| Paris Las Vegas Holding LLC/Harrah's Las Vegas LLC/Flamingo Las Vegas Holdings, Inc. 8% 10/1/20 | | 250,000 | 237,500 |
| Healthcare - 1.3% | | | |
| Community Health Systems, Inc. 5.125% 8/15/18 | | 125,000 | 125,625 |
| Endo Finance LLC/Endo Ltd./Endo Finco, Inc. 6% 7/15/23 (d) | | 200,000 | 199,000 |
| HCA Holdings, Inc.: | | | |
| 3.75% 3/15/19 | | 500,000 | 503,750 |
| 4.25% 10/15/19 | | 500,000 | 510,000 |
| Tenet Healthcare Corp. 4.012% 6/15/20 (b)(d) | | 170,000 | 165,750 |
|
| TOTAL HEALTHCARE | | | 1,504,125 |
|
| Metals/Mining - 0.1% | | | |
| Murray Energy Corp. 11.25% 4/15/21 (d) | | 250,000 | 45,625 |
| Peabody Energy Corp. 10% 3/15/22 (d) | | 125,000 | 23,750 |
|
| TOTAL METALS/MINING | | | 69,375 |
|
| Paper - 0.1% | | | |
| Mercer International, Inc. 7% 12/1/19 | | 80,000 | 80,200 |
| Publishing/Printing - 0.0% | | | |
| Cenveo Corp. 6% 8/1/19 (d) | | 40,000 | 28,200 |
| Telecommunications - 0.5% | | | |
| FairPoint Communications, Inc. 8.75% 8/15/19 (d) | | 40,000 | 39,400 |
| Numericable Group SA 4.875% 5/15/19 (d) | | 500,000 | 495,625 |
|
| TOTAL TELECOMMUNICATIONS | | | 535,025 |
|
| Utilities - 0.0% | | | |
| The AES Corp. 3.4142% 6/1/19 (b) | | 45,000 | 41,288 |
| TOTAL NONCONVERTIBLE BONDS | | | |
| (Cost $5,471,299) | | | 5,029,104 |
| | | Shares | Value |
|
| Common Stocks - 0.0% | | | |
| Diversified Financial Services - 0.0% | | | |
| CA Acquisition LLC Class B (e) | | | |
| (Cost $157) | | 157 | 157 |
|
| Money Market Funds - 10.5% | | | |
| Fidelity Cash Central Fund, 0.33% (f) | | | |
| (Cost $11,966,554) | | 11,966,554 | 11,966,554 |
| TOTAL INVESTMENT PORTFOLIO - 98.7% | | | |
| (Cost $118,911,691) | | | 112,535,030 |
| NET OTHER ASSETS (LIABILITIES) - 1.3% | | | 1,466,585 |
| NET ASSETS - 100% | | | $114,001,615 |
Legend
(a) Remaining maturities of bank loan obligations may be less than the stated maturities shown as a result of contractual or optional prepayments by the borrower. Such prepayments cannot be predicted with certainty.
(b) Coupon rates for floating and adjustable rate securities reflect the rates in effect at period end.
(c) The coupon rate will be determined upon settlement of the loan after period end.
(d) Security exempt from registration under Rule 144A of the Securities Act of 1933. These securities may be resold in transactions exempt from registration, normally to qualified institutional buyers. At the end of the period, the value of these securities amounted to $2,412,478 or 2.1% of net assets.
(e) Restricted securities - Investment in securities not registered under the Securities Act of 1933 (excluding 144A issues). At the end of the period, the value of restricted securities (excluding 144A issues) amounted to $157 or 0.0% of net assets.
(f) Affiliated fund that is generally available only to investment companies and other accounts managed by Fidelity Investments. The rate quoted is the annualized seven-day yield of the fund at period end. A complete unaudited listing of the fund's holdings as of its most recent quarter end is available upon request. In addition, each Fidelity Central Fund's financial statements, which are not covered by the Fund's Report of Independent Registered Public Accounting Firm, are available on the SEC's website or upon request.
Additional information on each restricted holding is as follows:
| Security | Acquisition Date | Acquisition Cost |
| CA Acquisition LLC Class B | 12/9/15 | $157 |
Affiliated Central Funds
Information regarding fiscal year to date income earned by the Fund from investments in Fidelity Central Funds is as follows:
| Fund | Income earned |
| Fidelity Cash Central Fund | $19,431 |
| Total | $19,431 |
Investment Valuation
The following is a summary of the inputs used, as of December 31, 2015, involving the Fund's assets and liabilities carried at fair value. The inputs or methodology used for valuing securities may not be an indication of the risk associated with investing in those securities. For more information on valuation inputs, and their aggregation into the levels used below, please refer to the Investment Valuation section in the accompanying Notes to Financial Statements.
| | Valuation Inputs at Reporting Date: |
| Description | Total | Level 1 | Level 2 | Level 3 |
| Investments in Securities: | | | | |
| Equities: | | | | |
| Financials | $157 | $-- | $-- | $157 |
| Bank Loan Obligations | 95,539,215 | -- | 94,438,215 | 1,101,000 |
| Corporate Bonds | 5,029,104 | -- | 5,029,104 | -- |
| Money Market Funds | 11,966,554 | 11,966,554 | -- | -- |
| Total Investments in Securities: | $112,535,030 | $11,966,554 | $99,467,319 | $1,101,157 |
Other Information
Distribution of investments by country or territory of incorporation, as a percentage of Total Net Assets, is as follows (Unaudited):
| United States of America | 89.3% |
| Luxembourg | 2.8% |
| Canada | 2.3% |
| Ireland | 1.2% |
| Australia | 1.1% |
| Netherlands | 1.0% |
| Others (Individually Less Than 1%) | 2.3% |
| | 100.0% |
See accompanying notes which are an integral part of the financial statements.
Financial Statements
Statement of Assets and Liabilities
| | | December 31, 2015 |
| Assets | | |
Investment in securities, at value — See accompanying schedule:
Unaffiliated issuers (cost $106,945,137) | $100,568,476 | |
| Fidelity Central Funds (cost $11,966,554) | 11,966,554 | |
| Total Investments (cost $118,911,691) | | $112,535,030 |
| Receivable for investments sold | | 2,751,782 |
| Receivable for fund shares sold | | 50,820 |
| Interest receivable | | 1,033,639 |
| Distributions receivable from Fidelity Central Funds | | 2,218 |
| Prepaid expenses | | 226 |
| Other receivables | | 2,917 |
| Total assets | | 116,376,632 |
| Liabilities | | |
| Payable to custodian bank | $12,114 | |
| Payable for investments purchased | 2,215,765 | |
| Payable for fund shares redeemed | 14,108 | |
| Accrued management fee | 54,066 | |
| Other affiliated payables | 14,376 | |
| Other payables and accrued expenses | 64,588 | |
| Total liabilities | | 2,375,017 |
| Net Assets | | $114,001,615 |
| Net Assets consist of: | | |
| Paid in capital | | $122,261,092 |
| Undistributed net investment income | | 127,976 |
| Accumulated undistributed net realized gain (loss) on investments | | (2,010,792) |
| Net unrealized appreciation (depreciation) on investments | | (6,376,661) |
| Net Assets | | $114,001,615 |
| Initial Class: | | |
| Net Asset Value, offering price and redemption price per share ($7,326,325 ÷ 784,719 shares) | | $9.34 |
| Investor Class: | | |
| Net Asset Value, offering price and redemption price per share ($106,675,290 ÷ 11,425,102 shares) | | $9.34 |
See accompanying notes which are an integral part of the financial statements.
Statement of Operations
| | | Year ended December 31, 2015 |
| Investment Income | | |
| Interest | | $5,420,860 |
| Income from Fidelity Central Funds | | 19,431 |
| Total income | | 5,440,291 |
| Expenses | | |
| Management fee | $637,121 | |
| Transfer agent fees | 113,095 | |
| Accounting fees and expenses | 55,939 | |
| Custodian fees and expenses | 14,130 | |
| Independent trustees' compensation | 483 | |
| Audit | 73,941 | |
| Legal | 1,910 | |
| Miscellaneous | 660 | |
| Total expenses before reductions | 897,279 | |
| Expense reductions | (797) | 896,482 |
| Net investment income (loss) | | 4,543,809 |
| Realized and Unrealized Gain (Loss) | | |
| Net realized gain (loss) on: | | |
| Investment securities: | | |
| Unaffiliated issuers | (1,488,772) | |
| Total net realized gain (loss) | | (1,488,772) |
| Change in net unrealized appreciation (depreciation) on investment securities | | (3,685,640) |
| Net gain (loss) | | (5,174,412) |
| Net increase (decrease) in net assets resulting from operations | | $(630,603) |
See accompanying notes which are an integral part of the financial statements.
Statement of Changes in Net Assets
| | Year ended December 31, 2015 | For the period April 9, 2014 (commencement of operations) to December 31, 2014 |
| Increase (Decrease) in Net Assets | | |
| Operations | | |
| Net investment income (loss) | $4,543,809 | $2,010,178 |
| Net realized gain (loss) | (1,488,772) | (555,528) |
| Change in net unrealized appreciation (depreciation) | (3,685,640) | (2,691,021) |
| Net increase (decrease) in net assets resulting from operations | (630,603) | (1,236,371) |
| Distributions to shareholders from net investment income | (4,320,742) | (2,069,592) |
| Distributions to shareholders from tax return of capital | (278,899) | – |
| Total distributions | (4,599,641) | (2,069,592) |
| Share transactions - net increase (decrease) | 13,019,049 | 109,518,773 |
| Total increase (decrease) in net assets | 7,788,805 | 106,212,810 |
| Net Assets | | |
| Beginning of period | 106,212,810 | – |
| End of period (including undistributed net investment income of $127,976 and distributions in excess of net investment income of $59,625, respectively) | $114,001,615 | $106,212,810 |
See accompanying notes which are an integral part of the financial statements.
Financial Highlights — VIP Floating Rate High Income Portfolio Initial Class
| | | |
| Years ended December 31, | 2015 | 2014 A |
| Selected Per–Share Data | | |
| Net asset value, beginning of period | $9.73 | $10.00 |
| Income from Investment Operations | | |
| Net investment income (loss)B | .400 | .242 |
| Net realized and unrealized gain (loss) | (.408) | (.322) |
| Total from investment operations | (.008) | (.080) |
| Distributions from net investment income | (.359) | (.190) |
| Tax return of capital | (.023) | – |
| Total distributions | (.382) | (.190) |
| Net asset value, end of period | $9.34 | $9.73 |
| Total ReturnC,D,E | (.09)% | (.79)% |
| Ratios to Average Net AssetsF,G | | |
| Expenses before reductions | .76% | .84%H |
| Expenses net of fee waivers, if any | .76% | .77%H |
| Expenses net of all reductions | .76% | .77%H |
| Net investment income (loss) | 4.03% | 3.31%H |
| Supplemental Data | | |
| Net assets, end of period (000 omitted) | $7,326 | $10,912 |
| Portfolio turnover rateI | 55% | 41%H |
A For the period April 9, 2014 (commencement of operations) to December 31, 2014.
B Calculated based on average shares outstanding during the period.
C Total returns for periods of less than one year are not annualized.
D Total returns do not reflect charges attributable to your insurance company's separate account. Inclusion of these charges would reduce the total returns shown.
E Total returns would have been lower if certain expenses had not been reduced during the applicable periods shown.
F Fees and expenses of any underlying Fidelity Central Funds are not included in the Fund's expense ratio. The Fund indirectly bears its proportionate share of the expenses of any underlying Fidelity Central Funds.
G Expense ratios reflect operating expenses of the class. Expenses before reductions do not reflect amounts reimbursed by the investment adviser or reductions from expense offset arrangements and do not represent the amount paid by the class during periods when reimbursements or reductions occur. Expense ratios before reductions for start-up periods may not be representative of longer-term operating periods. Expenses net of fee waivers reflect expenses after reimbursement by the investment adviser but prior to reductions from expense offset arrangements. Expenses net of all reductions represent the net expenses paid by the class.
H Annualized
I Amount does not include the portfolio activity of any underlying Fidelity Central Funds.
See accompanying notes which are an integral part of the financial statements.
Financial Highlights — VIP Floating Rate High Income Portfolio Investor Class
| | | |
| Years ended December 31, | 2015 | 2014 A |
| Selected Per–Share Data | | |
| Net asset value, beginning of period | $9.73 | $10.00 |
| Income from Investment Operations | | |
| Net investment income (loss)B | .394 | .238 |
| Net realized and unrealized gain (loss) | (.402) | (.322) |
| Total from investment operations | (.008) | (.084) |
| Distributions from net investment income | (.359) | (.186) |
| Tax return of capital | (.023) | – |
| Total distributions | (.382) | (.186) |
| Net asset value, end of period | $9.34 | $9.73 |
| Total ReturnC,D,E | (.09)% | (.83)% |
| Ratios to Average Net AssetsF,G | | |
| Expenses before reductions | .79% | .82%H |
| Expenses net of fee waivers, if any | .79% | .80%H |
| Expenses net of all reductions | .79% | .80%H |
| Net investment income (loss) | 3.99% | 3.28%H |
| Supplemental Data | | |
| Net assets, end of period (000 omitted) | $106,675 | $95,300 |
| Portfolio turnover rateI | 55% | 41%H |
A For the period April 9, 2014 (commencement of operations) to December 31, 2014.
B Calculated based on average shares outstanding during the period.
C Total returns for periods of less than one year are not annualized.
D Total returns do not reflect charges attributable to your insurance company's separate account. Inclusion of these charges would reduce the total returns shown.
E Total returns would have been lower if certain expenses had not been reduced during the applicable periods shown.
F Fees and expenses of any underlying Fidelity Central Funds are not included in the Fund's expense ratio. The Fund indirectly bears its proportionate share of the expenses of any underlying Fidelity Central Funds.
G Expense ratios reflect operating expenses of the class. Expenses before reductions do not reflect amounts reimbursed by the investment adviser or reductions from expense offset arrangements and do not represent the amount paid by the class during periods when reimbursements or reductions occur. Expense ratios before reductions for start-up periods may not be representative of longer-term operating periods. Expenses net of fee waivers reflect expenses after reimbursement by the investment adviser but prior to reductions from expense offset arrangements. Expenses net of all reductions represent the net expenses paid by the class.
H Annualized
I Amount does not include the portfolio activity of any underlying Fidelity Central Funds.
See accompanying notes which are an integral part of the financial statements.
Notes to Financial Statements
For the period ended December 31, 2015
1. Organization.
VIP Floating Rate High Income Portfolio (the Fund) is a fund of Variable Insurance Products Fund (the Trust) and is authorized to issue an unlimited number of shares. The Trust is registered under the Investment Company Act of 1940, as amended (the 1940 Act), as an open-end management investment company organized as a Massachusetts business trust. Shares of the Fund may only be purchased by insurance companies for the purpose of funding variable annuity or variable life insurance contracts. The Fund offers the following classes of shares: Initial Class shares and Investor Class shares. All classes have equal rights and voting privileges, except for matters affecting a single class.
2. Investments in Fidelity Central Funds.
The Fund invests in Fidelity Central Funds, which are open-end investment companies generally available only to other investment companies and accounts managed by the investment adviser and its affiliates. The Fund's Schedule of Investments lists each of the Fidelity Central Funds held as of period end, if any, as an investment of the Fund, but does not include the underlying holdings of each Fidelity Central Fund. As an Investing Fund, the Fund indirectly bears its proportionate share of the expenses of the underlying Fidelity Central Funds.
The Money Market Central Funds seek preservation of capital and current income and are managed by Fidelity Investments Money Management, Inc. (FIMM), an affiliate of the investment adviser. Annualized expenses of the Money Market Central Funds as of their most recent shareholder report date are less than .005%.
A complete unaudited list of holdings for each Fidelity Central Fund is available upon request or at the Securities and Exchange Commission (the SEC) website at www.sec.gov. In addition, the financial statements of the Fidelity Central Funds, which are not covered by the Fund's Report of Independent Registered Public Accounting Firm, are available on the SEC website or upon request.
3. Significant Accounting Policies.
The financial statements have been prepared in conformity with accounting principles generally accepted in the United States of America (GAAP), which require management to make certain estimates and assumptions at the date of the financial statements. Actual results could differ from those estimates. Subsequent events, if any, through the date that the financial statements were issued have been evaluated in the preparation of the financial statements. The following summarizes the significant accounting policies of the Fund:
Investment Valuation. Investments are valued as of 4:00 p.m. Eastern time on the last calendar day of the period. The Board of Trustees (the Board) has delegated the day to day responsibility for the valuation of the Fund's investments to the Fidelity Management & Research Company (FMR) Fair Value Committee (the Committee). In accordance with valuation policies and procedures approved by the Board, the Fund attempts to obtain prices from one or more third party pricing vendors or brokers to value its investments. When current market prices, quotations or currency exchange rates are not readily available or reliable, investments will be fair valued in good faith by the Committee, in accordance with procedures adopted by the Board. Factors used in determining fair value vary by investment type and may include market or investment specific events, changes in interest rates and credit quality. The frequency with which these procedures are used cannot be predicted and they may be utilized to a significant extent. The Committee oversees the Fund's valuation policies and procedures and reports to the Board on the Committee's activities and fair value determinations. The Board monitors the appropriateness of the procedures used in valuing the Fund's investments and ratifies the fair value determinations of the Committee.
The Fund categorizes the inputs to valuation techniques used to value its investments into a disclosure hierarchy consisting of three levels as shown below:
- Level 1 – quoted prices in active markets for identical investments
- Level 2 – other significant observable inputs (including quoted prices for similar investments, interest rates, prepayment speeds, etc.)
- Level 3 – unobservable inputs (including the Fund's own assumptions based on the best information available)
Valuation techniques used to value the Fund's investments by major category are as follows:
Debt securities, including restricted securities, are valued based on evaluated prices received from third party pricing vendors or from brokers who make markets in such securities. Corporate bonds and bank loan obligations are valued by pricing vendors who utilize matrix pricing which considers yield or price of bonds of comparable quality, coupon, maturity and type or by broker-supplied prices. When independent prices are unavailable or unreliable, debt securities may be valued utilizing pricing methodologies which consider similar factors that would be used by third party pricing vendors. Debt securities are generally categorized as Level 2 in the hierarchy but may be Level 3 depending on the circumstances. The Fund invests a significant portion of its assets in below investment grade securities. The value of these securities can be more volatile due to changes in the credit quality of the issuer and is sensitive to changes in economic, market and regulatory conditions.
Equity securities, including restricted securities, for which market quotations are readily available, are valued at the last reported sale price or official closing price as reported by a third party pricing vendor on the primary market or exchange on which they are traded and are categorized as Level 1 in the hierarchy. In the event there were no sales during the day or closing prices are not available, securities are valued at the last quoted bid price or may be valued using the last available price and are generally categorized as Level 2 in the hierarchy. For equity securities, including restricted securities, where observable inputs are limited, assumptions about market activity and risk are used and these securities may be categorized as Level 3 in the hierarchy.
Investments in open-end mutual funds, including the Fidelity Central Funds, are valued at their closing net asset value (NAV) each business day and are categorized as Level 1 in the hierarchy.
Changes in valuation techniques may result in transfers in or out of an assigned level within the disclosure hierarchy. The aggregate value of investments by input level as of December 31, 2015 is included at the end of the Fund's Schedule of Investments.
Investment Transactions and Income. For financial reporting purposes, the Fund's investment holdings and NAV include trades executed through the end of the last business day of the period. The NAV per share for processing shareholder transactions is calculated as of the close of business of the New York Stock Exchange (NYSE), normally 4:00 p.m. Eastern time and includes trades executed through the end of the prior business day. Gains and losses on securities sold are determined on the basis of identified cost. Income and capital gain distributions from Fidelity Central Funds, if any, are recorded on the ex-dividend date. Interest income is accrued as earned and includes coupon interest and amortization of premium and accretion of discount on debt securities as applicable. Debt obligations may be placed on non-accrual status and related interest income may be reduced by ceasing current accruals and writing off interest receivables when the collection of all or a portion of interest has become doubtful based on consistently applied procedures. A debt obligation is removed from non-accrual status when the issuer resumes interest payments or when collectability of interest is reasonably assured.
Class Allocations and Expenses. Investment income, realized and unrealized capital gains and losses, common expenses of the Fund, and certain fund-level expense reductions, if any, are allocated daily on a pro-rata basis to each class based on the relative net assets of each class to the total net assets of the Fund. Each class differs with respect to transfer agent fees incurred. Certain expense reductions may also differ by class. For the reporting period, the allocated portion of income and expenses to each class as a percent of its average net assets may vary due to the timing of recording these transactions in relation to fluctuating net assets of the classes. Expenses directly attributable to a fund are charged to that fund. Expenses attributable to more than one fund are allocated among the respective funds on the basis of relative net assets or other appropriate methods. Expense estimates are accrued in the period to which they relate and adjustments are made when actual amounts are known.
Income Tax Information and Distributions to Shareholders. Each year, the Fund intends to qualify as a regulated investment company under Subchapter M of the Internal Revenue Code, including distributing substantially all of its taxable income and realized gains. As a result, no provision for U.S. Federal income taxes is required. As of December 31, 2015, the Fund did not have any unrecognized tax benefits in the financial statements; nor is the Fund aware of any tax positions for which it is reasonably possible that the total amounts of unrecognized tax benefits will significantly change in the next twelve months. The Fund files a U.S. federal tax return, in addition to state and local tax returns as required. The Fund's federal income tax returns are subject to examination by the Internal Revenue Service (IRS) for a period of three fiscal years after they are filed. State and local tax returns may be subject to examination for an additional fiscal year depending on the jurisdiction.
Distributions are declared and recorded on the ex-dividend date. Income dividends and capital gain distributions are declared separately for each class. Income and capital gain distributions are determined in accordance with income tax regulations, which may differ from GAAP.
For the period ended December 31, 2015, the Fund's distributions exceeded the aggregate amount of taxable income and net realized gains resulting in a return of capital for tax purposes. This was due to reductions in taxable income available for distribution after certain distributions had been made.
Capital accounts within the financial statements are adjusted for permanent book-tax differences. These adjustments have no impact on net assets or the results of operations. Capital accounts are not adjusted for temporary book-tax differences which will reverse in a subsequent period.
Book-tax differences are primarily due to market discount, capital loss carryforwards, losses deferred due to wash sales and tax return of capital distribution.
The federal tax cost of investment securities and unrealized appreciation (depreciation) as of period end were as follows:
| Gross unrealized appreciation | $83,219 |
| Gross unrealized depreciation | (6,346,369) |
| Net unrealized appreciation (depreciation) on securities | $(6,263,150) |
| Tax Cost | $118,798,180 |
The tax-based components of distributable earnings as of period end were as follows:
| Capital loss carryforward | $(1,996,328) |
| Net unrealized appreciation (depreciation) on securities and other investments | $(6,263,150) |
Capital loss carryforwards are only available to offset future capital gains of the Fund to the extent provided by regulations and may be limited. Under the Regulated Investment Company Modernization Act of 2010 (the Act), the Fund is permitted to carry forward capital losses incurred in taxable years beginning after December 22, 2010 for an unlimited period and such capital losses are required to be used prior to any losses that expire. The capital loss carryforward information presented below, including any applicable limitation, is estimated as of fiscal period end and is subject to adjustment.
| No expiration | |
| Short-term | $(1,216,059) |
| Long-term | (780,269) |
| Total capital loss carryforward | $(1,996,328) |
The tax character of distributions paid was as follows:
| | December 31, 2015 | December 31, 2014 |
| Ordinary Income | $4,320,742 | $ 2,069,592 |
| Tax Return of Capital | 278,899 | – |
| Total | $4,599,641 | $ 2,069,592 |
Restricted Securities. The Fund may invest in securities that are subject to legal or contractual restrictions on resale. These securities generally may be resold in transactions exempt from registration or to the public if the securities are registered. Disposal of these securities may involve time-consuming negotiations and expense, and prompt sale at an acceptable price may be difficult. Information regarding restricted securities is included at the end of the Fund's Schedule of Investments.
Loans and Other Direct Debt Instruments. The Fund invests in direct debt instruments which are interests in amounts owed to lenders by corporate or other borrowers. These instruments may be in the form of loans, trade claims or other receivables and may include standby financing commitments such as revolving credit facilities that obligate the Fund to supply additional cash to the borrower on demand. Loans may be acquired through assignment or participation. The Fund did not have any unfunded loan commitments, which are contractual obligations for future funding, at period end.
4. Purchase and Sales of Investments.
Purchases and sales of securities (including principal repayments of bank loan obligations), other than short-term securities, aggregated $67,230,195 and $56,208,905, respectively.
5. Fees and Other Transactions with Affiliates.
Management Fee. Fidelity Management & Research Company (the investment adviser) and its affiliates provide the Fund with investment management related services for which the Fund pays a monthly management fee. The management fee is the sum of an individual fund fee rate that is based on an annual rate of .45% of the Fund's average net assets and an annualized group fee rate that averaged .11% during the period. The group fee rate is based upon the average net assets of all the mutual funds advised by the investment adviser, including any mutual funds previously advised by the investment adviser that are currently advised by Fidelity SelectCo, LLC, an affiliate of the investment adviser. The group fee rate decreases as assets under management increase and increases as assets under management decrease. For the reporting period, the total annual management fee rate was .56% of the Fund's average net assets.
Transfer Agent Fees. Fidelity Investments Institutional Operations Company, Inc. (FIIOC), an affiliate of the investment adviser, is the Fund's transfer, dividend disbursing, and shareholder servicing agent. FIIOC receives an asset-based fee with respect to each class. Each class (with the exception of Investor Class) pays a fee for transfer agent services, typesetting, printing and mailing of shareholder reports, excluding mailing of proxy statements and out of pocket expenses, equal to an annual rate of .07% (.10% for Investor Class) of class-level average net assets. For the period, transfer agent fees for each class, including out of pocket expenses, were as follows:
| Initial Class | $7,150 |
| Investor Class | 105,945 |
| | $113,095 |
Accounting Fees. Fidelity Service Company, Inc. (FSC), an affiliate of the investment adviser, maintains the Fund's accounting records. The fee is based on the level of average net assets for each month.
Interfund Trades. The Fund may purchase from or sell securities to other Fidelity Funds under procedures adopted by the Board. The procedures have been designed to ensure these interfund trades are executed in accordance with Rule 17a-7 of the 1940 Act. Interfund trades are included within the respective purchases and sales amounts shown in the Purchases and Sales of Investments note.
6. Committed Line of Credit.
The Fund participates with other funds managed by the investment adviser or an affiliate in a $4.25 billion credit facility (the "line of credit") to be utilized for temporary or emergency purposes to fund shareholder redemptions or for other short-term liquidity purposes. The Fund has agreed to pay commitment fees on its pro-rata portion of the line of credit, which amounted to $69 and is reflected in Miscellaneous expenses on the Statement of Operations. During the period, the Fund did not borrow on this line of credit.
7. Expense Reductions.
Through arrangements with the Fund's custodian, credits realized as a result of certain uninvested cash balances were used to reduce the Fund's expenses. During the period, these credits reduced the Fund's custody expenses by $542.
In addition, during the period the investment adviser reimbursed and/or waived a portion of fund-level operating expenses in the amount of $255.
8. Distributions to Shareholders.
Distributions to shareholders of each class were as follows:
| Years ended December 31, | 2015 | 2014(a) |
| From net investment income | | |
| Initial Class | $296,942 | $214,685 |
| Investor Class | 4,023,800 | 1,854,907 |
| Total | $4,320,742 | $2,069,592 |
| Tax Return of Capital | | |
| Initial Class | $19,168 | $– |
| Investor Class | 259,731 | – |
| Total | $278,899 | $– |
(a) For the period April 9, 2014 (commencement of operations) to December 31, 2014.
9. Share Transactions.
Transactions for each class of shares were as follows:
| | Shares | Shares | Dollars | Dollars |
| Years ended December 31, | 2015 | 2014(a) | 2015 | 2014(a) |
| Initial Class | | | | |
| Shares sold | 455,195 | 1,329,755 | $4,513,876 | $13,309,635 |
| Reinvestment of distributions | 33,773 | 22,155 | 316,118 | 214,685 |
| Shares redeemed | (825,496) | (230,663) | (8,145,575) | (2,298,327) |
| Net increase (decrease) | (336,528) | 1,121,247 | $(3,315,581) | $11,225,993 |
| Investor Class | | | | |
| Shares sold | 5,810,167 | 11,605,606 | $57,815,256 | $116,302,705 |
| Reinvestment of distributions | 457,641 | 191,425 | 4,283,523 | 1,854,907 |
| Shares redeemed | (4,632,862) | (2,006,875) | (45,764,149) | (19,864,832) |
| Net increase (decrease) | 1,634,946 | 9,790,156 | $16,334,630 | $98,292,780 |
(a) For the period April 9, 2014 (commencement of operations) to December 31, 2014.
10. Other.
The Fund's organizational documents provide former and current trustees and officers with a limited indemnification against liabilities arising in connection with the performance of their duties to the Fund. In the normal course of business, the Fund may also enter into contracts that provide general indemnifications. The Fund's maximum exposure under these arrangements is unknown as this would be dependent on future claims that may be made against the Fund. The risk of material loss from such claims is considered remote.
At the end of the period, the investment adviser or its affiliates were the owners of record of 100% of the total outstanding shares of the Fund.
Report of Independent Registered Public Accounting Firm
To the Trustees of Variable Insurance Products Fund and Shareholders of VIP Floating Rate High Income Portfolio:
In our opinion, the accompanying statement of assets and liabilities, including the schedule of investments, and the related statements of operations and of changes in net assets and the financial highlights present fairly, in all material respects, the financial position of VIP Floating Rate High Income Portfolio (a fund of Variable Insurance Products Fund) at December 31, 2015, the results of its operations for the year then ended, the changes in its net assets for each of the periods indicated and the financial highlights for each of the periods indicated, in conformity with accounting principles generally accepted in the United States of America. These financial statements and financial highlights (hereafter referred to as “financial statements”) are the responsibility of the VIP Floating Rate High Income Portfolio’s management. Our responsibility is to express an opinion on these financial statements based on our audits. We conducted our audits of these financial statements in accordance with the standards of the Public Company Accounting Oversight Board (United States). Those standards require that we plan and perform the audit to obtain reasonable assurance about whether the financial statements are free of material misstatement. An audit includes examining, on a test basis, evidence supporting the amounts and disclosures in the financial statements, assessing the accounting principles used and significant estimates made by management, and evaluating the overall financial statement presentation. We believe that our audits, which included confirmation of securities at December 31, 2015 by correspondence with the custodian and brokers, provide a reasonable basis for our opinion.
PricewaterhouseCoopers LLP
Boston, Massachusetts
February 23, 2016
Trustees and Officers
The Trustees, Members of the Advisory Board (if any), and officers of the trust and fund, as applicable, are listed below. The Board of Trustees governs the fund and is responsible for protecting the interests of shareholders. The Trustees are experienced executives who meet periodically throughout the year to oversee the fund's activities, review contractual arrangements with companies that provide services to the fund, oversee management of the risks associated with such activities and contractual arrangements, and review the fund's performance. Each of the Trustees oversees 170 funds.
The Trustees hold office without limit in time except that (a) any Trustee may resign; (b) any Trustee may be removed by written instrument, signed by at least two-thirds of the number of Trustees prior to such removal; (c) any Trustee who requests to be retired or who has become incapacitated by illness or injury may be retired by written instrument signed by a majority of the other Trustees; and (d) any Trustee may be removed at any special meeting of shareholders by a two-thirds vote of the outstanding voting securities of the trust. Each Trustee who is not an interested person (as defined in the 1940 Act) of the trust and the fund is referred to herein as an Independent Trustee. Each Independent Trustee shall retire not later than the last day of the calendar year in which his or her 75th birthday occurs. The Independent Trustees may waive this mandatory retirement age policy with respect to individual Trustees. Officers and Advisory Board Members hold office without limit in time, except that any officer or Advisory Board Member may resign or may be removed by a vote of a majority of the Trustees at any regular meeting or any special meeting of the Trustees. Except as indicated, each individual has held the office shown or other offices in the same company for the past five years.
The fund’s Statement of Additional Information (SAI) includes more information about the Trustees. To request a free copy, call Fidelity at 1-877-208-0098.
Experience, Skills, Attributes, and Qualifications of the Trustees. The Governance and Nominating Committee has adopted a statement of policy that describes the experience, qualifications, attributes, and skills that are necessary and desirable for potential Independent Trustee candidates (Statement of Policy). The Board believes that each Trustee satisfied at the time he or she was initially elected or appointed a Trustee, and continues to satisfy, the standards contemplated by the Statement of Policy. The Governance and Nominating Committee also engages professional search firms to help identify potential Independent Trustee candidates who have the experience, qualifications, attributes, and skills consistent with the Statement of Policy. From time to time, additional criteria based on the composition and skills of the current Independent Trustees, as well as experience or skills that may be appropriate in light of future changes to board composition, business conditions, and regulatory or other developments, have also been considered by the professional search firms and the Governance and Nominating Committee. In addition, the Board takes into account the Trustees' commitment and participation in Board and committee meetings, as well as their leadership of standing and ad hoc committees throughout their tenure.
In determining that a particular Trustee was and continues to be qualified to serve as a Trustee, the Board has considered a variety of criteria, none of which, in isolation, was controlling. The Board believes that, collectively, the Trustees have balanced and diverse experience, qualifications, attributes, and skills, which allow the Board to operate effectively in governing the fund and protecting the interests of shareholders. Information about the specific experience, skills, attributes, and qualifications of each Trustee, which in each case led to the Board's conclusion that the Trustee should serve (or continue to serve) as a trustee of the fund, is provided below.
Board Structure and Oversight Function. James C. Curvey is an interested person and currently serves as Chairman. The Trustees have determined that an interested Chairman is appropriate and benefits shareholders because an interested Chairman has a personal and professional stake in the quality and continuity of services provided to the fund. Independent Trustees exercise their informed business judgment to appoint an individual of their choosing to serve as Chairman, regardless of whether the Trustee happens to be independent or a member of management. The Independent Trustees have determined that they can act independently and effectively without having an Independent Trustee serve as Chairman and that a key structural component for assuring that they are in a position to do so is for the Independent Trustees to constitute a substantial majority for the Board. The Independent Trustees also regularly meet in executive session. Ned C. Lautenbach serves as Chairman of the Independent Trustees and as such (i) acts as a liaison between the Independent Trustees and management with respect to matters important to the Independent Trustees and (ii) with management prepares agendas for Board meetings.
Fidelity® funds are overseen by different Boards of Trustees. The fund's Board oversees Fidelity's high income and certain equity funds, and other Boards oversee Fidelity's investment-grade bond, money market, asset allocation, and sector funds. The asset allocation funds may invest in Fidelity® funds overseen by the fund's Board. The use of separate Boards, each with its own committee structure, allows the Trustees of each group of Fidelity® funds to focus on the unique issues of the funds they oversee, including common research, investment, and operational issues. On occasion, the separate Boards establish joint committees to address issues of overlapping consequences for the Fidelity® funds overseen by each Board.
The Trustees operate using a system of committees to facilitate the timely and efficient consideration of all matters of importance to the Trustees, the fund, and fund shareholders and to facilitate compliance with legal and regulatory requirements and oversight of the fund's activities and associated risks. The Board, acting through its committees, has charged FMR and its affiliates with (i) identifying events or circumstances the occurrence of which could have demonstrably adverse effects on the fund's business and/or reputation; (ii) implementing processes and controls to lessen the possibility that such events or circumstances occur or to mitigate the effects of such events or circumstances if they do occur; and (iii) creating and maintaining a system designed to evaluate continuously business and market conditions in order to facilitate the identification and implementation processes described in (i) and (ii) above. Because the day-to-day operations and activities of the fund are carried out by or through FMR, its affiliates, and other service providers, the fund's exposure to risks is mitigated but not eliminated by the processes overseen by the Trustees. While each of the Board's committees has responsibility for overseeing different aspects of the fund's activities, oversight is exercised primarily through the Operations, Audit, and Compliance Committees. In addition, the Independent Trustees have worked with FMR to enhance the Board's oversight of investment and financial risks, legal and regulatory risks, technology risks, and operational risks, including the development of additional risk reporting to the Board. For example, a working group comprised of Independent Trustees and FMR has worked and continues to work to review the Fidelity® funds' valuation-related activities, reporting and risk management. Appropriate personnel, including but not limited to the fund's Chief Compliance Officer (CCO), FMR's internal auditor, the independent accountants, the fund's Treasurer and portfolio management personnel, make periodic reports to the Board's committees, as appropriate, including an annual review of Fidelity's risk management program for the Fidelity® funds. The responsibilities of each standing committee, including their oversight responsibilities, are described further under "Standing Committees of the Trustees."
Interested Trustees*:
Correspondence intended for a Trustee who is an interested person may be sent to Fidelity Investments, 245 Summer Street, Boston, Massachusetts 02210.
Name, Year of Birth; Principal Occupations and Other Relevant Experience+
James C. Curvey (1935)
Year of Election or Appointment: 2007
Trustee
Chairman of the Board of Trustees
Mr. Curvey also serves as Trustee of other Fidelity® funds. Mr. Curvey is a Director of Fidelity Research & Analysis Co. (investment adviser firm, 2009-present), and Vice Chairman (2007-present) and Director of FMR LLC (diversified financial services company). In addition, Mr. Curvey serves as an Overseer for the Boston Symphony Orchestra and a member of the board of Artis-Naples, Naples, Florida, and as a Trustee for Brewster Academy, Wolfeboro, New Hampshire. Previously, Mr. Curvey served as a Director of Fidelity Investments Money Management, Inc. (investment adviser firm, 2009-2014) and a Director of FMR and FMR Co., Inc. (investment adviser firms, 2007-2014).
Charles S. Morrison (1960)
Year of Election or Appointment: 2014
Trustee
Mr. Morrison also serves as Trustee of other funds. He serves as a Director of Fidelity Investments Money Management, Inc. (FIMM) (investment adviser firm, 2014-present), Director of Fidelity SelectCo, LLC (investment adviser firm, 2014-present), President, Asset Management (2014-present), and is an employee of Fidelity Investments. Previously, Mr. Morrison served as Vice President of Fidelity's Fixed Income and Asset Allocation Funds (2012-2014), President, Fixed Income (2011-2014), Vice President of Fidelity's Money Market Funds (2005-2009), President, Money Market Group Leader of FMR (investment adviser firm, 2009), and Senior Vice President, Money Market Group of FMR (2004-2009). Mr. Morrison also served as Vice President of Fidelity's Bond Funds (2002-2005), certain Balanced Funds (2002-2005), and certain Asset Allocation Funds (2002-2007), and as Senior Vice President (2002-2005) of Fidelity's Bond Division.
* Determined to be an “Interested Trustee” by virtue of, among other things, his or her affiliation with the trust or various entities under common control with FMR.
+ The information includes the Trustee's principal occupation during the last five years and other information relating to the experience, attributes, and skills relevant to the Trustee's qualifications to serve as a Trustee, which led to the conclusion that the Trustee should serve as a Trustee for the fund.
Independent Trustees:
Correspondence intended for an Independent Trustee may be sent to Fidelity Investments, P.O. Box 55235, Boston, Massachusetts 02205-5235.
Name, Year of Birth; Principal Occupations and Other Relevant Experience+
Dennis J. Dirks (1948)
Year of Election or Appointment: 2005
Trustee
Mr. Dirks also serves as Trustee of other Fidelity® funds. Prior to his retirement in May 2003, Mr. Dirks was Chief Operating Officer and a member of the Board of The Depository Trust & Clearing Corporation (DTCC). He also served as President, Chief Operating Officer, and Board member of The Depository Trust Company (DTC) and President and Board member of the National Securities Clearing Corporation (NSCC). In addition, Mr. Dirks served as Chief Executive Officer and Board member of the Government Securities Clearing Corporation, Chief Executive Officer and Board member of the Mortgage-Backed Securities Clearing Corporation, as a Trustee and a member of the Finance Committee of Manhattan College (2005-2008), as a Trustee and a member of the Finance Committee of AHRC of Nassau County (2006-2008), and as a member of the Independent Directors Council (IDC) Governing Council (2010-2015). Mr. Dirks is a member of the Board of Directors for The Brookville Center for Children's Services, Inc. (2009-present).
Alan J. Lacy (1953)
Year of Election or Appointment: 2008
Trustee
Mr. Lacy also serves as Trustee of other Fidelity® funds. Mr. Lacy serves as Chairman (2014-present) and a member (2010-present) of the Board of Directors of Dave & Buster's Entertainment, Inc. (restaurant and entertainment complexes) and a Director of Bristol-Myers Squibb Company (global pharmaceuticals, 2008-present). He is a Trustee of the California Chapter of The Nature Conservancy (2015-present) and a Director of the Center for Advanced Study in the Behavioral Sciences at Stanford University (2015-present). In addition, Mr. Lacy served as Senior Adviser (2007-2014) of Oak Hill Capital Partners, L.P. (private equity) and also served as Chief Executive Officer (2005) and Vice Chairman (2005-2006) of Sears Holdings Corporation (retail) and Chief Executive Officer and Chairman of the Board of Sears, Roebuck and Co. (retail, 2000-2005). Previously, Mr. Lacy served as Chairman (2008-2011) and a member (2006-2015) of the Board of Trustees of the National Parks Conservation Association and as a member of the Board of Directors for The Western Union Company (global money transfer, 2006-2011), The Hillman Companies, Inc. (hardware wholesalers, 2010-2014), and Earth Fare, Inc. (retail grocery, 2010-2014).
Ned C. Lautenbach (1944)
Year of Election or Appointment: 2000
Trustee
Chairman of the Independent Trustees
Mr. Lautenbach also serves as Trustee of other Fidelity® funds. Mr. Lautenbach currently serves as the Lead Director of the Eaton Corporation Board of Directors (diversified industrial, 1997-present). Mr. Lautenbach is Chairman of the Board of Directors of Artis-Naples in Naples, Florida (2012-present), a member of the Council on Foreign Relations (1994-present), and a member of the Board of Governors, State University System of Florida (2013-present). Previously, Mr. Lautenbach was a Partner/Advisory Partner at Clayton, Dubilier & Rice, LLC (private equity investment, 1998-2010), as well as a Director of Sony Corporation (2006-2007).
Joseph Mauriello (1944)
Year of Election or Appointment: 2008
Trustee
Mr. Mauriello also serves as Trustee of other Fidelity® funds. Prior to his retirement in January 2006, Mr. Mauriello served in numerous senior management positions including Deputy Chairman and Chief Operating Officer (2004-2005), and Vice Chairman of Financial Services (2002-2004) of KPMG LLP US (professional services, 1965-2005). Mr. Mauriello currently serves as a member of the Board of Directors of XL Group plc. (global insurance and re-insurance, 2006-present) and the Independent Directors Council (IDC) Governing Council (2015-present). Previously, Mr. Mauriello served as a Director of the Hamilton Funds of the Bank of New York (2006-2007) and of Arcadia Resources Inc. (health care services and products, 2007-2012).
Robert W. Selander (1950)
Year of Election or Appointment: 2011
Trustee
Mr. Selander also serves as Trustee of other Fidelity® funds. Mr. Selander serves as a Director of The Western Union Company (global money transfer, 2014-present) and a non-executive Chairman of Health Equity, Inc. (health savings custodian, 2015-present). Previously, Mr. Selander served as a Member of the Advisory Board of other Fidelity® funds (2011), and Executive Vice Chairman (2010), Chief Executive Officer (2009-2010), and President and Chief Executive Officer (1997-2009) of Mastercard, Inc.
Cornelia M. Small (1944)
Year of Election or Appointment: 2005
Trustee
Ms. Small also serves as Trustee of other Fidelity® funds. Ms. Small is a member of the Board of Directors (2009-present) and Chair of the Investment Committee (2010-present) of the Teagle Foundation. Ms. Small also serves on the Investment Committee of the Berkshire Taconic Community Foundation (2008-present). Previously, Ms. Small served as Chairperson (2002-2008) and a member of the Investment Committee and Chairperson (2008-2012) and a member of the Board of Trustees of Smith College. In addition, Ms. Small served as Chief Investment Officer, Director of Global Equity Investments, and a member of the Board of Directors of Scudder, Stevens & Clark and Scudder Kemper Investments.
William S. Stavropoulos (1939)
Year of Election or Appointment: 2001
Trustee
Vice Chairman of the Independent Trustees
Mr. Stavropoulos also serves as Trustee of other Fidelity® funds. Mr. Stavropoulos serves as President and Founder of the Michigan Baseball Foundation, the Great Lakes Loons (2007-present). Mr. Stavropoulos is Chairman Emeritus of the Board of Directors of The Dow Chemical Company, where he previously served in numerous senior management positions, including President, CEO (1995-2000; 2002-2004), Chairman of the Executive Committee (2000-2006), and as a member of the Board of Directors (1990-2006). Currently, Mr. Stavropoulos is Chairman of the Board of Directors of Univar Inc. (global distributor of commodity and specialty chemicals), a Director of Teradata Corporation (data warehousing and technology solutions), and Maersk Inc. (industrial conglomerate), and a member of the Advisory Board for Metalmark Capital LLC (private equity investment, 2005-present). Mr. Stavropoulos is an operating advisor to Clayton, Dubilier & Rice, LLC (private equity investment). In addition, Mr. Stavropoulos is a member of the University of Notre Dame Advisory Council for the College of Science, a Trustee of the Rollin L. Gerstacker Foundation, and a Director of the Naples Philharmonic Center for the Arts. Previously, Mr. Stavropoulos served as a Director of Chemical Financial Corporation (bank holding company, 1993-2012) and Tyco International, Ltd. (multinational manufacturing and services, 2007-2012).
David M. Thomas (1949)
Year of Election or Appointment: 2008
Trustee
Mr. Thomas also serves as Trustee of other Fidelity® funds. Mr. Thomas serves as Non-Executive Chairman of the Board of Directors of Fortune Brands Home and Security (home and security products, 2011-present), as a member of the Board of Directors (2004-present) and Presiding Director (2013-present) of Interpublic Group of Companies, Inc. (marketing communication), and as a member of the Board of Trustees of the University of Florida (2013-present). Previously, Mr. Thomas served as Executive Chairman (2005-2006) and Chairman and Chief Executive Officer (2000-2005) of IMS Health, Inc. (pharmaceutical and healthcare information solutions), and a Director of Fortune Brands, Inc. (consumer products, 2000-2011).
+ The information includes the Trustee's principal occupation during the last five years and other information relating to the experience, attributes, and skills relevant to the Trustee's qualifications to serve as a Trustee, which led to the conclusion that the Trustee should serve as a Trustee for the fund.
Advisory Board Members and Officers:
Correspondence intended for an officer or Peter S. Lynch may be sent to Fidelity Investments, 245 Summer Street, Boston, Massachusetts 02210. Officers appear below in alphabetical order.
Name, Year of Birth; Principal Occupation
Peter S. Lynch (1944)
Year of Election or Appointment: 2003
Member of the Advisory Board
Mr. Lynch also serves as Member of the Advisory Board of other Fidelity® funds. Mr. Lynch is Vice Chairman and a Director of FMR (investment adviser firm) and FMR Co., Inc. (investment adviser firm). In addition, Mr. Lynch serves as a Trustee of Boston College and as the Chairman of the Inner-City Scholarship Fund. Previously, Mr. Lynch served on the Special Olympics International Board of Directors (1997-2006).
Marc R. Bryant (1966)
Year of Election or Appointment: 2015
Secretary and Chief Legal Officer (CLO)
Mr. Bryant also serves as Secretary and CLO of other funds. Mr. Bryant serves as CLO, Secretary, and Senior Vice President of Fidelity Management & Research Company (investment adviser firm, 2015-present) and FMR Co., Inc. (investment adviser firm, 2015-present); Secretary of Fidelity SelectCo, LLC (investment adviser firm, 2015-present) and Fidelity Investments Money Management, Inc. (investment adviser firm, 2015-present); and CLO of Fidelity Management & Research (Hong Kong) Limited (investment adviser firm, 2015-present). He is Senior Vice President and Deputy General Counsel of FMR LLC (diversified financial services company). Previously, Mr. Bryant served as Secretary and CLO of Fidelity Rutland Square Trust II (2010-2014) and Assistant Secretary of Fidelity's Fixed Income and Asset Allocation Funds (2013-2015). Prior to joining Fidelity Investments, Mr. Bryant served as a Senior Vice President and the Head of Global Retail Legal for AllianceBernstein L.P. (2006-2010), and as the General Counsel for ProFund Advisors LLC (2001-2006).
William C. Coffey (1969)
Year of Election or Appointment: 2009
Assistant Secretary
Mr. Coffey also serves as Assistant Secretary of other funds. He is Senior Vice President and Deputy General Counsel of FMR LLC (diversified financial services company, 2010-present), and is an employee of Fidelity Investments. Previously, Mr. Coffey served as Vice President and Associate General Counsel of FMR LLC (2005-2009).
Jonathan Davis (1968)
Year of Election or Appointment: 2010
Assistant Treasurer
Mr. Davis also serves as Assistant Treasurer of other funds, and is an employee of Fidelity Investments. Previously, Mr. Davis served as Vice President and Associate General Counsel of FMR LLC (diversified financial services company, 2003-2010).
Adrien E. Deberghes (1967)
Year of Election or Appointment: 2008
Deputy Treasurer
Mr. Deberghes also serves as an officer of other funds. He is an employee of Fidelity Investments (2008-present). Prior to joining Fidelity Investments, Mr. Deberghes was Senior Vice President of Mutual Fund Administration at State Street Corporation (2007-2008), Senior Director of Mutual Fund Administration at Investors Bank & Trust (2005-2007), and Director of Finance for Dunkin' Brands (2000-2005).
Stephanie J. Dorsey (1969)
Year of Election or Appointment: 2010
Assistant Treasurer
Ms. Dorsey also serves as an officer of other funds. She is an employee of Fidelity Investments (2008-present) and has served in other fund officer roles. Prior to joining Fidelity Investments, Ms. Dorsey served as Treasurer (2004-2008) of the JPMorgan Mutual Funds and Vice President (2004-2008) of JPMorgan Chase Bank.
Howard J. Galligan III (1966)
Year of Election or Appointment: 2014
Chief Financial Officer
Mr. Galligan also serves as Chief Financial Officer of other funds. Mr. Galligan serves as President of Fidelity Pricing and Cash Management Services (FPCMS) (2014-present) and as a Director of Strategic Advisers, Inc. (investment adviser firm, 2008-present). Previously, Mr. Galligan served as Chief Administrative Officer of Asset Management (2011-2014) and Chief Operating Officer and Senior Vice President of Investment Support for Strategic Advisers, Inc. (2003-2011).
Scott C. Goebel (1968)
Year of Election or Appointment: 2015
Vice President
Mr. Goebel serves as Vice President of other funds and is an employee of Fidelity Investments (2001-present). Previously, Mr. Goebel served as Secretary of Fidelity SelectCo, LLC (investment adviser firm, 2013-2015), Fidelity Investments Money Management, Inc. (FIMM) (investment adviser firm, 2010-2015), and Fidelity Research and Analysis Company (FRAC) (investment adviser firm, 2010-2015); General Counsel, Secretary, and Senior Vice President of Fidelity Management & Research Company (investment adviser firm, 2008-2015) and FMR Co., Inc. (investment adviser firm, 2008-2015); Assistant Secretary of Fidelity Management & Research (Japan) Limited (investment adviser firm, 2008-2015) and FMR Investment Management (U.K.) Limited (investment adviser firm, 2008-2015); Chief Legal Officer (CLO) of Fidelity Management & Research (Hong Kong) Limited (investment adviser firm, 2008-2015); Secretary and CLO of certain Fidelity® funds (2008-2015); Assistant Secretary of FIMM (2008-2010), FRAC (2008-2010), and certain funds (2007-2008); and as Vice President and Secretary of Fidelity Distributors Corporation (FDC) (2005-2007).
Thomas C. Hense (1964)
Year of Election or Appointment: 2008, 2010, or 2015
Vice President
Mr. Hense serves as Vice President of Fidelity Advisor® Multi-Asset Income Fund (2015) and other funds (High Income (2008), Small Cap (2008), and Value (2010) funds), and is an employee of Fidelity Investments (1993-present). Previously, Mr. Hense served as a portfolio manager for Fidelity's Institutional Money Management Group (Pyramis) (2003-2008).
Brian B. Hogan (1964)
Year of Election or Appointment: 2009
Vice President
Mr. Hogan also serves as Trustee or Vice President of other funds. Mr. Hogan serves as a Director of Fidelity SelectCo, LLC (investment adviser firm, 2014-present) and President of the Equity Division of FMR (investment adviser firm, 2009-present). Previously, Mr. Hogan served as Senior Vice President, Equity Research of FMR (2006-2009) and as a portfolio manager.
Chris Maher (1972)
Year of Election or Appointment: 2013
Assistant Treasurer
Mr. Maher serves as Assistant Treasurer of other funds. Mr. Maher is Vice President of Valuation Oversight and is an employee of Fidelity Investments. Previously, Mr. Maher served as Vice President of Asset Management Compliance (2013), Vice President of the Program Management Group of FMR (investment adviser firm, 2010-2013), and Vice President of Valuation Oversight (2008-2010).
John F. Papandrea (1972)
Year of Election or Appointment: 2016
Anti-Money Laundering (AML) Officer
Mr. Papandrea also serves as AML Officer of other funds. Mr. Papandrea is Vice President of FMR LLC (diversified financial services company, 2008-present) and is an employee of Fidelity Investments (2005-present).
Kenneth B. Robins (1969)
Year of Election or Appointment: 2008
President and Treasurer
Mr. Robins also serves as an officer of other funds. Mr. Robins serves as Executive Vice President of Fidelity Investments Money Management, Inc. (FIMM) (investment adviser firm, 2013-present) and is an employee of Fidelity Investments (2004-present). Previously, Mr. Robins served in other fund officer roles.
Stacie M. Smith (1974)
Year of Election or Appointment: 2013
Deputy Treasurer
Ms. Smith also serves as an officer of other funds. She is an employee of Fidelity Investments (2009-present) and has served in other fund officer roles. Prior to joining Fidelity Investments, Ms. Smith served as Senior Audit Manager of Ernst & Young LLP (1996-2009).
Renee Stagnone (1975)
Year of Election or Appointment: 2013
Deputy Treasurer
Ms. Stagnone also serves as Deputy Treasurer of other funds. Ms. Stagnone is an employee of Fidelity Investments (1997-present).
Linda J. Wondrack (1964)
Year of Election or Appointment: 2014
Chief Compliance Officer
Ms. Wondrack also serves as Chief Compliance Officer of other funds. Ms. Wondrack is Executive Vice President and head of the Ethics Office and Asset Management Compliance for Fidelity Investments (2012-present). Ms. Wondrack also serves as Chief Compliance Officer of Fidelity SelectCo, LLC (investment adviser firm, 2014-present); Chief Compliance Officer of Impresa Management LLC (2013-present); and Chief Compliance Officer of FMR Co., Inc. (investment adviser firm), Fidelity Investments Money Management, Inc. (investment adviser firm), FMR Investment Management (U.K.) Limited (investment adviser firm), Fidelity Management & Research (Hong Kong) (investment adviser firm), Fidelity Management & Research Company (investment adviser firm), FIAM LLC (investment adviser firm), and Strategic Advisers, Inc. (investment adviser firm), Ballyrock Investment Advisors LLC, and Northern Neck Investors LLC (2012-present). Previously, Ms. Wondrack served as Chief Compliance Officer of Fidelity Management & Research (Japan) Limited (investment adviser firm, 2012-2016); Senior Vice President and Chief Compliance Officer for Columbia Management Investment Advisers, LLC (2005-2012); Chief Compliance Officer for certain funds within the Columbia Family of Funds (2007-2012); and Senior Vice President of Compliance Risk Management at Bank of America (2005-2010).
Joseph F. Zambello (1957)
Year of Election or Appointment: 2011
Deputy Treasurer
Mr. Zambello also serves as Deputy Treasurer of other funds. Mr. Zambello is an employee of Fidelity Investments (1991-present). Previously, Mr. Zambello served as Vice President of the Program Management Group of FMR (investment adviser firm, 2009-2011) and Vice President of the Transfer Agent Oversight Group (2005-2009).
Shareholder Expense Example
As a shareholder of the Fund, you incur two types of costs: (1) transaction costs, and (2) ongoing costs, including management fees and other Fund expenses. This Example is intended to help you understand your ongoing costs (in dollars) of investing in the Fund and to compare these costs with the ongoing costs of investing in other mutual funds.
The Example is based on an investment of $1,000 invested at the beginning of the period and held for the entire period (July 1, 2015 to December 31, 2015).
Actual Expenses
The first line of the accompanying table for each class of the Fund provides information about actual account values and actual expenses. You may use the information in this line, together with the amount you invested, to estimate the expenses that you paid over the period. Simply divide your account value by $1,000.00 (for example, an $8,600 account value divided by $1,000.00 = 8.6), then multiply the result by the number in the first line for a class of the Fund under the heading entitled "Expenses Paid During Period" to estimate the expenses you paid on your account during this period. The estimate of expenses does not include any fees or other expenses of any variable annuity or variable life insurance product. If they were, the estimate of expenses you paid during the period would be higher, and your ending account value would be lower. In addition, the Fund, as a shareholder in the underlying Fidelity Central Funds, will indirectly bear its pro-rata share of the fees and expenses incurred by the underlying Fidelity Central Funds. These fees and expenses are not included in the Fund's annualized expense ratio used to calculate the expense estimate in the table below.
Hypothetical Example for Comparison Purposes
The second line of the accompanying table for each class of the Fund provides information about hypothetical account values and hypothetical expenses based on a Class' actual expense ratio and an assumed rate of return of 5% per year before expenses, which is not the Class' actual return. The hypothetical account values and expenses may not be used to estimate the actual ending account balance or expenses you paid for the period. You may use this information to compare the ongoing costs of investing in the Fund and other funds. To do so, compare this 5% hypothetical example with the 5% hypothetical examples that appear in the shareholder reports of the other funds. The estimate of expenses does not include any fees or other expenses of any variable annuity or variable life insurance product. If they were, the estimate of expenses you paid during the period would be higher, and your ending account value would be lower. In addition, the Fund, as a shareholder in the underlying Fidelity Central Funds, will indirectly bear its pro-rata share of the fees and expenses incurred by the underlying Fidelity Central Funds. These fees and expenses are not included in the Fund's annualized expense ratio used to calculate the expense estimate in the table below.
Please note that the expenses shown in the table are meant to highlight your ongoing costs only and do not reflect any transaction costs. Therefore, the second line of the table is useful in comparing ongoing costs only, and will not help you determine the relative total costs of owning different funds.
| | Annualized Expense Ratio-A | Beginning
Account Value
July 1, 2015 | Ending
Account Value
December 31, 2015 | Expenses Paid
During Period-B
July 1, 2015
to December 31, 2015 |
| Initial Class | .75% | | | |
| Actual | | $1,000.00 | $971.10 | $3.73 |
| Hypothetical-C | | $1,000.00 | $1,021.42 | $3.82 |
| Investor Class | .78% | | | |
| Actual | | $1,000.00 | $971.10 | $3.88 |
| Hypothetical-C | | $1,000.00 | $1,021.27 | $3.97 |
A Annualized expense ratio reflects expenses net of applicable fee waivers.
B Expenses are equal to each Class' annualized expense ratio, multiplied by the average account value over the period, multiplied by 184/365 (to reflect the one-half year period).
C 5% return per year before expenses
Board Approval of Investment Advisory Contracts and Management Fees
VIP Floating Rate High Income Portfolio
Each year, the Board of Trustees, including the Independent Trustees (together, the Board), votes on the renewal of the management contract with Fidelity Management & Research Company (FMR) and the sub-advisory agreements (together, the Advisory Contracts) for the fund. The Board, assisted by the advice of fund counsel and Independent Trustees' counsel, requests and considers a broad range of information relevant to the renewal of the Advisory Contracts throughout the year.
The Board meets regularly and, at each of its meetings, covers an extensive agenda of topics and materials and considers factors that are relevant to its annual consideration of the renewal of the fund's Advisory Contracts, including the services and support provided to the fund and its shareholders. The Board has established various standing committees (Committees), each composed of and chaired by Independent Trustees with varying backgrounds, to which the Board has assigned specific subject matter responsibilities in order to enhance effective decision-making by the Board. The Board, acting directly and through its Committees, requests and receives information concerning the annual consideration of the renewal of the fund's Advisory Contracts. The Board also meets as needed to consider matters specifically related to the Board's annual consideration of the renewal of the Advisory Contracts. Members of the Board may also meet with trustees of other Fidelity funds through ad hoc joint committees to discuss certain matters relevant to all of the Fidelity funds.
At its July 2015 meeting, the Board unanimously determined to renew the fund's Advisory Contracts. In reaching its determination, the Board considered all factors it believed relevant, including (i) the nature, extent, and quality of the services to be provided to the fund and its shareholders (including the investment performance of the fund); (ii) the competitiveness of the fund's management fee and total expense ratio relative to peer funds; (iii) the total costs of the services to be provided by and the profits to be realized by Fidelity from its relationship with the fund; and (iv) the extent to which (if any) economies of scale exist and would be realized as the fund grows, and whether any economies of scale are appropriately shared with fund shareholders.
In considering whether to renew the Advisory Contracts for the fund, the Board reached a determination, with the assistance of fund counsel and Independent Trustees' counsel and through the exercise of its business judgment, that the renewal of the Advisory Contracts was in the best interests of the fund and its shareholders and that the compensation payable under the Advisory Contracts was fair and reasonable. The Board's decision to renew the Advisory Contracts was not based on any single factor, but rather was based on a comprehensive consideration of all the information provided to the Board at its meetings throughout the year. The Board, in reaching its determination to renew the Advisory Contracts, was aware that shareholders of the fund have a broad range of investment choices available to them, including a wide choice among funds offered by Fidelity's competitors, and that the fund's shareholders, who have the opportunity to review and weigh the disclosure provided by the fund in its prospectus and other public disclosures, have chosen to invest in this fund, which is part of the Fidelity family of funds.
Nature, Extent, and Quality of Services Provided. The Board considered Fidelity's staffing as it relates to the fund, including the backgrounds of investment personnel of Fidelity, and also considered the fund's investment objective, strategies, and related investment philosophy. The Independent Trustees also had discussions with senior management of Fidelity's investment operations and investment groups. The Board considered the structure of the portfolio manager compensation program and whether this structure provides appropriate incentives to act in the best interests of the fund. Additionally, the Board considered the portfolio managers' investments, if any, in the funds that they manage.
Resources Dedicated to Investment Management and Support Services. The Board and the Fund Oversight and Research Committees reviewed the general qualifications and capabilities of Fidelity's investment staff, including its size, education, experience, and resources, as well as Fidelity's approach to recruiting, training, managing, and compensating investment personnel. The Board noted that Fidelity has continued to increase the resources devoted to non-U.S. offices, including expansion of Fidelity's global investment organization. The Board also noted that Fidelity's analysts have extensive resources, tools and capabilities that allow them to conduct sophisticated quantitative and fundamental analysis, as well as credit analysis of issuers, counterparties and guarantors. Further, the Board considered that Fidelity's investment professionals have sufficient access to global information and data so as to provide competitive investment results over time, and that those professionals also have access to sophisticated tools that permit them to assess portfolio construction and risk and performance attribution characteristics continuously, as well as to transmit new information and research conclusions rapidly around the world. Additionally, in its deliberations, the Board considered Fidelity's trading, risk management, and compliance capabilities and resources, which are integral parts of the investment management process.
Shareholder and Administrative Services. The Board considered (i) the nature, extent, quality, and cost of advisory, administrative, and shareholder services performed by FMR, the sub-advisers (together with FMR, the Investment Advisers), and their affiliates under the Advisory Contracts and under separate agreements covering transfer agency, pricing and bookkeeping, and securities lending services for the fund; (ii) the nature and extent of the supervision of third party service providers, principally custodians and subcustodians; and (iii) the resources devoted to, and the record of compliance with, the fund's compliance policies and procedures. The Board also reviewed the allocation of fund brokerage, including allocations to brokers affiliated with the Investment Advisers, the use of brokerage commissions to pay fund expenses, and the use of "soft" commission dollars to pay for research services.
The Board noted that the growth of fund assets over time across the complex allows Fidelity to reinvest in the development of services designed to enhance the value or convenience of the Fidelity funds as investment vehicles. These services include 24-hour access to account information and market information through telephone representatives and over the Internet, investor education materials and asset allocation tools, and the expanded availability of Fidelity Investor Centers.
In 2014, the Board formed an ad hoc Committee on Transfer Agency Fees to review the variety of transfer agency fee structures throughout the industry and Fidelity's competitive positioning with respect to industry participants.
Investment in a Large Fund Family. The Board considered the benefits to shareholders of investing in a Fidelity fund, including the benefits of investing in a fund that is part of a large family of funds offering a variety of investment disciplines and providing a large variety of mutual fund investor services. The Board noted that Fidelity had taken, or had made recommendations that resulted in the Fidelity funds taking, a number of actions over the previous year that benefited particular funds, including (i) continuing to dedicate additional resources to investment research and to the support of the senior management team that oversees asset management; (ii) continuing efforts to enhance Fidelity's global research capabilities; (iii) launching new funds and making other enhancements to meet client needs; (iv) reducing management fees and total expenses for certain index funds and diversified international funds; (v) continuing to launch dedicated lower cost underlying funds to meet portfolio construction needs related to expanding underlying fund options for Fidelity funds of funds, specifically for the Freedom Fund product lines; (vi) rationalizing product lines and gaining increased efficiencies through fund mergers; (vii) launching active fixed-income exchange-traded funds; (viii) continuing to develop, acquire and implement systems and technology to improve services to the funds and information security and to increase efficiency; (ix) implementing investment enhancements to further strengthen Fidelity's target date product line to increase investors' probability of success in achieving their goals; (x) modifying the eligibility criteria for certain share classes to accommodate roll-over assets from employer-sponsored retirement plans; (xi) launching a new Class W of the Freedom Index Funds to attract and retain Fidelity record-kept retirement plan assets; and (xii) implementing changes to Fidelity's money market product line in response to recent money market regulatory reforms.
Investment Performance. The Board considered whether the fund has operated in accordance with its investment objective, as well as its record of compliance with its investment restrictions. As the fund recently commenced operations, the Board did not believe that it was appropriate to assign significant weight to its limited investment performance.
Based on its review, the Board concluded that the nature, extent, and quality of services provided to the fund under the Advisory Contracts should benefit the shareholders of the fund.
Competitiveness of Management Fee and Total Expense Ratio. The Board considered the fund's management fee and total expense ratio compared to "mapped groups" of competitive funds and classes created for the purpose of facilitating the Trustees' competitive analysis of management fees and total expenses. Fidelity creates "mapped groups" by combining similar Lipper investment objective categories that have comparable investment mandates. Combining Lipper investment objective categories aids the Board's management fee and total expense ratio comparisons by broadening the competitive group used for comparison.
Management Fee. The Board considered two proprietary management fee comparisons for the period of the fund's operations shown in basis points (BP) in the chart below. The group of Lipper funds used by the Board for management fee comparisons is referred to below as the "Total Mapped Group." The Total Mapped Group comparison focuses on a fund's standing in terms of gross management fees before expense reimbursements or caps relative to the total universe of funds with comparable investment mandates, regardless of whether their management fee structures also are comparable. Funds with comparable investment mandates offer exposure to similar types of securities. Funds with comparable management fee structures have similar management fee contractual arrangements (
e.g., flat rate charged for advisory services, all-inclusive fee rate,
etc.). "TMG %" represents the percentage of funds in the Total Mapped Group that had management fees that were lower than the fund's. For example, a hypothetical TMG % of 20% would mean that 80% of the funds in the Total Mapped Group had higher, and 20% had lower, management fees than the fund. The fund's actual TMG % and the number of funds in the Total Mapped Group are in the chart below. The "Asset-Size Peer Group" (ASPG) comparison focuses on a fund's standing relative to a subset of non-Fidelity funds within the Total Mapped Group that are similar in size and management fee structure without taking into account performance adjustments, if any. For example, if a fund is in the first quartile of the ASPG, the fund's management fee ranks in the least expensive or lowest 25% of funds in the ASPG. The ASPG represents at least 15% of the funds in the Total Mapped Group with comparable asset size and management fee structures, subject to a minimum of 50 funds (or all funds in the Total Mapped Group if fewer than 50). Additional information, such as the ASPG quartile in which the fund's management fee rate ranked, is also included in the chart and considered by the Board.
VIP Floating Rate High Income Portfolio

The Board noted that the fund's management fee rate ranked below the median of its Total Mapped Group and below the median of its ASPG for the period.
The Board noted that, in 2014, the ad hoc Committee on Group Fee was formed by it and other Fidelity fund boards to conduct an in-depth review of the "group fee" component of the management fee of funds with such management fee structures. Committee focus included the mechanics of the group fee, the competitive landscape of group fee structures, Fidelity funds with no group fee component and investment products not included in group fee assets. The Board also considered that, for funds subject to the group fee, FMR agreed to voluntarily waive fees over a specified period of time in amounts designed to account for assets converted from certain funds to certain collective investment trusts.
The Board also noted that, in 2013, the ad hoc Committee on Management Fees was formed to conduct an in-depth review of the management fee rates of Fidelity's active equity mutual funds. The Committee focused on the following areas: (i) standard fee structures; (ii) research consumption and trading evolution; (iii) management fee competitiveness/profitability by category; and (iv) factors that drive institutional pricing.
Based on its review, the Board concluded that the fund's management fee is fair and reasonable in light of the services that the fund receives and the other factors considered.
Total Expense Ratio. In its review of each class's total expense ratio, the Board considered the fund's management fee as well as other fund or class expenses, as applicable, such as transfer agent fees, pricing and bookkeeping fees, and custodial, legal, and audit fees. The Board also noted that Fidelity may agree to waive fees and expenses from time to time, and the extent to which, if any, it has done so for the fund. As part of its review, the Board also considered the current total expense ratios of each class of the fund compared to competitive fund median expenses. Each class of the fund is compared to those funds and classes in the Total Mapped Group (used by the Board for management fee comparisons) that have a similar sales load structure.
The Board noted that the total expense ratio of Initial Class ranked below its competitive median for the period and the total expense ratio of Investor Class ranked equal to its competitive median for the period.
The Board further considered that FMR contractually agreed to reimburse Initial Class and Investor Class of the fund to the extent that total expenses (excluding interest, certain taxes, certain securities lending costs, brokerage commissions, extraordinary expenses, and acquired fund fees and expenses, if any), as a percentage of their respective average net assets, exceed 0.77% and 0.80% through April 30, 2016.
Fees Charged to Other Fidelity Clients. The Board also considered Fidelity fee structures and other information with respect to clients of Fidelity, such as other funds advised or subadvised by Fidelity, pension plan clients, and other institutional clients with similar mandates. The Board noted the findings of the 2013 ad hoc joint committee (created with the board of other Fidelity funds), which reviewed and compared Fidelity's institutional investment advisory business with its business of providing services to the Fidelity funds, including the differences in services provided, fees charged, and costs incurred, as well as competition in their respective marketplaces.
Based on its review of total expense ratios and fees charged to other Fidelity clients, the Board concluded that the total expense ratio of each class of the fund was reasonable in light of the services that the fund and its shareholders receive and the other factors considered.
Costs of the Services and Profitability. The Board considered the revenues earned and the expenses incurred by Fidelity in conducting the business of developing, marketing, distributing, managing, administering and servicing the fund and servicing the fund's shareholders. The Board also considered the level of Fidelity's profits in respect of all the Fidelity funds.
On an annual basis, Fidelity presents to the Board information about the profitability of its relationship with the fund. Fidelity calculates profitability information for each fund, as well as aggregate profitability information for groups of Fidelity funds and all Fidelity funds, using a series of detailed revenue and cost allocation methodologies which originate with the books and records of Fidelity on which Fidelity's audited financial statements are based. The Audit Committee of the Board reviews any significant changes from the prior year's methodologies.
PricewaterhouseCoopers LLP (PwC), independent registered public accounting firm and auditor to Fidelity and certain Fidelity funds, has been engaged annually by the Board as part of the Board's assessment of Fidelity's profitability analysis. PwC's engagement includes the review and assessment of the methodologies used by Fidelity in determining the revenues and expenses attributable to Fidelity's mutual fund business, and completion of agreed-upon procedures in respect of the mathematical accuracy of fund profitability and its conformity to established allocation methodologies. After considering PwC's reports issued under the engagement and information provided by Fidelity, the Board concluded that while other allocation methods may also be reasonable, Fidelity's profitability methodologies are reasonable in all material respects.
The Board also reviewed Fidelity's non-fund businesses and fall-out benefits related to the mutual fund business as well as cases where Fidelity's affiliates may benefit from or be related to the fund's business.
The Board considered the costs of the services provided by and the profits realized by Fidelity in connection with the operation of the fund and was satisfied that the profitability was not excessive.
Economies of Scale. The Board considered whether there have been economies of scale in respect of the management of the Fidelity funds, whether the Fidelity funds (including the fund) have appropriately benefited from any such economies of scale, and whether there is potential for realization of any further economies of scale. The Board considered the extent to which the fund will benefit from economies of scale as assets grow through increased services to the fund, through waivers or reimbursements, or through fee or expense ratio reductions. The Board also noted that in 2013, it and the boards of other Fidelity funds created an ad hoc committee (the Economies of Scale Committee) to analyze whether Fidelity attains economies of scale in respect of the management and servicing of the Fidelity funds, whether the Fidelity funds have appropriately benefited from such economies of scale, and whether there is potential for realization of any further economies of scale.
The Board recognized that the fund's management contract incorporates a "group fee" structure, which provides for lower group fee rates as total group assets increase, and for higher group fee rates as total group assets decrease (with "group assets" defined to include fund assets under FMR's management plus sector fund assets previously under FMR's management and currently managed by Fidelity SelectCo, LLC). FMR calculates the group fee rates based on a tiered asset "breakpoint" schedule that varies based on asset class. The Board considered that the group fee is designed to deliver the benefits of economies of scale to fund shareholders when total Fidelity fund assets increase, even if assets of any particular fund are unchanged or have declined, because some portion of Fidelity's costs are attributable to services provided to all Fidelity funds, and all funds benefit if those costs can be allocated among more assets. The Board concluded that, given the group fee structure, fund shareholders will benefit from lower management fees as group assets increase at the fund complex level, regardless of whether Fidelity achieves any such economies of scale.
The Board concluded, taking into account the analysis of the Economies of Scale Committee, that economies of scale, if any, are being appropriately shared between fund shareholders and Fidelity.
Additional Information Requested by the Board. In order to develop fully the factual basis for consideration of the Fidelity funds' Advisory Contracts, the Board requested and received additional information on certain topics, including: (i) fund performance trends and Fidelity's long-term strategies for certain funds; (ii) the various share classes employed by Fidelity and the attributes of each class, together with similar information on the distribution and servicing payments made by Fidelity or the funds to third-party participants in the distribution channels; (iii) fund profitability, and fund performance in relation to fund profitability; (iv) the methodology with respect to evaluating competitive fund data and peer group classifications and fee comparisons; (v) annual fund profitability margins, with particular focus on certain funds with negative margins; (vi) the realization of fall-out benefits in certain Fidelity business units;
(vii) economies of scale and the way in which they are shared with fund shareholders;(viii) Fidelity's group fee structures, including the group fee schedule of breakpoints;(ix) the impact of cost containment measures on the funds; and (x) the transfer agent fee structure.
Based on its evaluation of all of the conclusions noted above, and after considering all factors it believed relevant, the Board concluded that the advisory fee structures are fair and reasonable, and that the fund's Advisory Contracts should be renewed.

VIPFHI-ANN-0216
1.9859331.101