UNITED STATES
SECURITIES AND EXCHANGE COMMISSION
Washington, D.C. 20549
FORM N-CSR
CERTIFIED SHAREHOLDER REPORT OF REGISTERED
MANAGEMENT INVESTMENT COMPANIES
Investment Company Act file number 811-3329
Variable Insurance Products Fund
(Exact name of registrant as specified in charter)
245 Summer St., Boston, Massachusetts 02210
(Address of principal executive offices) (Zip code)
Marc Bryant, Secretary
245 Summer St.
Boston, Massachusetts 02210
(Name and address of agent for service)
Registrant's telephone number, including area code:
617-563-7000
| |
Date of fiscal year end: | December 31 |
| |
Date of reporting period: | December 31, 2017 |
This report on Form N-CSR relates solely to the Registrant’s VIP Equity-Income Portfolio, VIP Growth Portfolio, VIP High Income Portfolio, VIP Overseas Portfolio and VIP Value Portfolio series (each, a “Fund” and collectively, the “Funds”).
Item 1.
Reports to Stockholders
Fidelity® Variable Insurance Products: High Income Portfolio
Annual Report December 31, 2017 |
 |
Contents
To view a fund's proxy voting guidelines and proxy voting record for the 12-month period ended June 30, visit http://www.fidelity.com/proxyvotingresults or visit the Securities and Exchange Commission's (SEC) web site at http://www.sec.gov.
You may also call 1-877-208-0098 to request a free copy of the proxy voting guidelines.
Fidelity® Variable Insurance Products are separate account options which are purchased through a variable insurance contract.
Standard & Poor's, S&P and S&P 500 are registered service marks of The McGraw-Hill Companies, Inc. and have been licensed for use by Fidelity Distributors Corporation.
Other third-party marks appearing herein are the property of their respective owners.
All other marks appearing herein are registered or unregistered trademarks or service marks of FMR LLC or an affiliated company. © 2018 FMR LLC. All rights reserved.
This report and the financial statements contained herein are submitted for the general information of the shareholders of the Fund. This report is not authorized for distribution to prospective investors in the Fund unless preceded or accompanied by an effective prospectus.
A fund files its complete schedule of portfolio holdings with the SEC for the first and third quarters of each fiscal year on Form N-Q. Forms N-Q are available on the SEC’s web site at http://www.sec.gov. A fund's Forms N-Q may be reviewed and copied at the SEC’s Public Reference Room in Washington, DC. Information regarding the operation of the SEC's Public Reference Room may be obtained by calling 1-800-SEC-0330.
For a complete list of a fund's portfolio holdings, view the most recent holdings listing, semiannual report, or annual report on Fidelity's web site at http://www.fidelity.com, http://www.institutional.fidelity.com, or http://www.401k.com, as applicable.
NOT FDIC INSURED •MAY LOSE VALUE •NO BANK GUARANTEE
Neither the Fund nor Fidelity Distributors Corporation is a bank.
Performance: The Bottom Line
Average annual total return reflects the change in the value of an investment, assuming reinvestment of distributions from dividend income and capital gains (the profits earned upon the sale of securities that have grown in value, if any) and assuming a constant rate of performance each year. During periods of reimbursement by Fidelity, a fund’s total return will be greater than it would be had the reimbursement not occurred. Performance numbers are net of all underlying fund operating expenses, but do not include any insurance charges imposed by your insurance company’s separate account. If performance information included the effect of these additional charges, the total returns would have been lower. How a fund did yesterday is no guarantee of how it will do tomorrow.
Average Annual Total Returns
| For the periods ended December 31, 2017 | Past 1 year | Past 5 years | Past 10 years |
| Initial Class | 7.13% | 4.87% | 6.36% |
| Service Class | 7.07% | 4.75% | 6.26% |
| Service Class 2 | 6.91% | 4.59% | 6.09% |
| Investor Class | 6.95% | 4.82% | 6.33% |
$10,000 Over 10 Years
Let's say hypothetically that $10,000 was invested in VIP High Income Portfolio - Initial Class on December 31, 2007.
The chart shows how the value of your investment would have changed, and also shows how the The BofA Merrill Lynch℠ US High Yield Constrained Index performed over the same period.
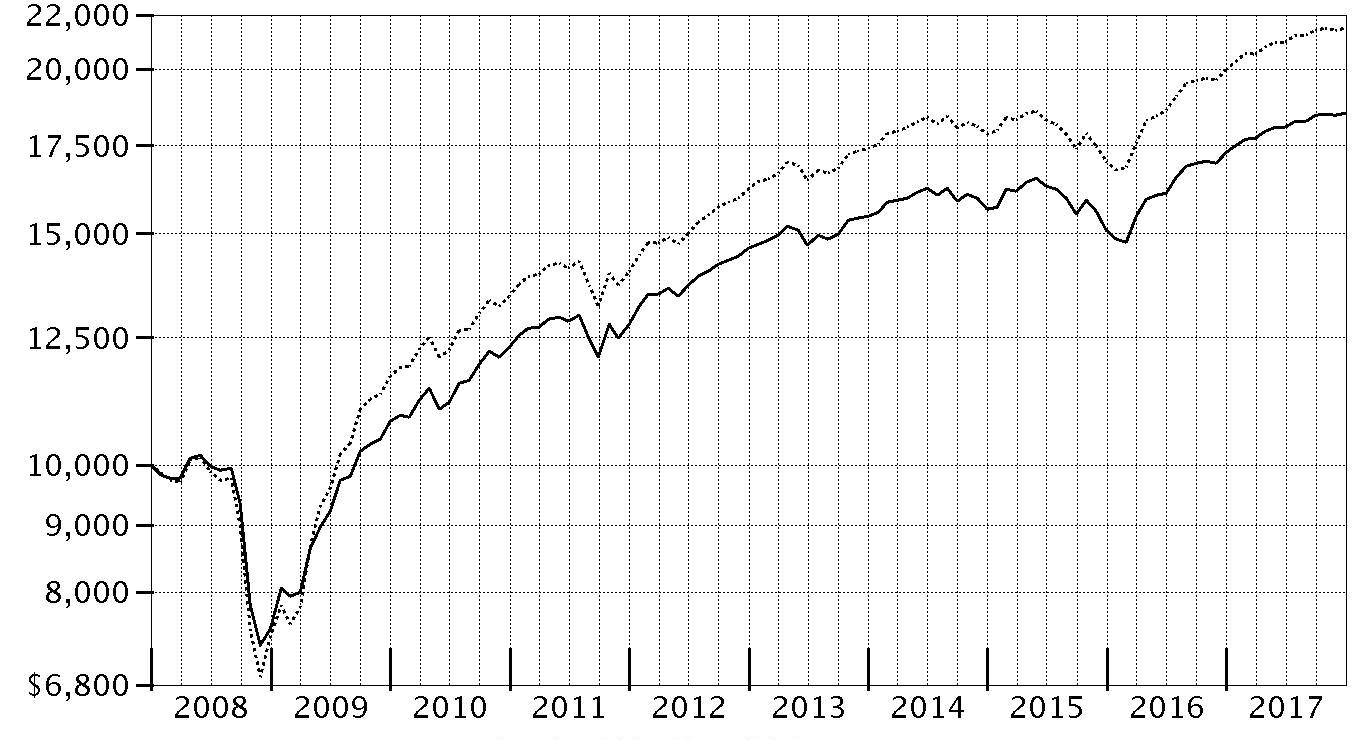
| Period Ending Values |
| $18,523 | VIP High Income Portfolio - Initial Class |
| $21,501 | The BofA Merrill Lynch℠ US High Yield Constrained Index |
Management's Discussion of Fund Performance
Market Recap: U.S. corporate high-yield bonds gained 7.48% in 2017, as measured by The BofA Merrill Lynch℠ US High Yield Constrained Index. Generally supported by a resurgence in investor risk appetite, high-yield bonds began the year on a strong note and maintained momentum into late July, rising along with other risk assets and supported by the view that the new administration’s agenda would be stimulative for the U.S. economy. Although heightened geopolitical risk and some industry-specific developments hampered high yield for a brief stretch in early August, the favorable environment for risk assets in the first half of the period generally prevailed overall, as the index continued on an uptrend through the end of the year. Accordingly, lower-quality bonds within the index advanced about 11%, topping credits rated BB (+7%) and B (+6%). By industry, gains were broad-based, with metals/mining (+11%), chemicals (+11%) and steel (+8%) boosted by firming commodities prices and the potential for increased infrastructure spending in the U.S. Other big movers included banks & thrifts (+12%), utilities (+12%) and services (+9%). The index’s largest component the past year, energy, exactly matched the market with a gain of 7.48%. Notable laggards included super retail (+2%) and food & drug retail (-2%), while the defensive-oriented telecommunications segment gained about 5%.
Comments from Portfolio Manager Matthew Conti: For the year, the fund's share classes gained about 7%, roughly in line with the BofA Merrill Lynch benchmark. I am pleased that my more-conservative approach toward credit risk held up reasonably well in 2017 despite lower-quality securities faring best. The fund’s core high-yield bond portfolio outpaced the benchmark, primarily due to security selection among bonds rated B and BB. My picks among bonds rated CCC helped relative performance to a lesser extent, but the benefit was more than offset by an underweighting in this outperforming credit tier. A non-benchmark allocation to floating-rate bank loans lagged high yield and detracted from the fund’s relative result. By industry, security selection was positive overall, led by gaming and telecommunications. I made a good call in avoiding benchmark constituent Frontier Communications until December. The fund's biggest individual relative contributor, Frontier’s bonds struggled because the old-line telephone services company faced a number of challenges. Our holdings in Scientific Games International benefited the fund, as the maker of lottery and slot machines saw good interest in its new games. Conversely, selections in super retail and food/beverage/tobacco detracted, as did the fund’s cash position of 3%, on average, in a strong market. The biggest relative detractor was natural gas exploration & production company Southwestern Energy, which was hampered by investor concern about a potential oversupply of natural gas. In health care, our position in hospital operator Community Health Systems detracted. In late October, the firm announced disappointing financial results that it attributed to 12.4% fewer admissions than during its fiscal third quarter a year ago.
The views expressed above reflect those of the portfolio manager(s) only through the end of the period as stated on the cover of this report and do not necessarily represent the views of Fidelity or any other person in the Fidelity organization. Any such views are subject to change at any time based upon market or other conditions and Fidelity disclaims any responsibility to update such views. These views may not be relied on as investment advice and, because investment decisions for a Fidelity fund are based on numerous factors, may not be relied on as an indication of trading intent on behalf of any Fidelity fund.
Investment Summary (Unaudited)
Top Five Holdings as of December 31, 2017
| (by issuer, excluding cash equivalents) | % of fund's net assets |
| CCO Holdings LLC/CCO Holdings Capital Corp. | 2.6 |
| Icahn Enterprises LP/Icahn Enterprises Finance Corp. | 2.4 |
| Valeant Pharmaceuticals International, Inc. | 1.9 |
| APX Group, Inc. | 1.5 |
| TransDigm, Inc. | 1.4 |
| | 9.8 |
Top Five Market Sectors as of December 31, 2017
| | % of fund's net assets |
| Energy | 16.9 |
| Telecommunications | 8.2 |
| Cable/Satellite TV | 6.8 |
| Healthcare | 6.7 |
| Technology | 6.1 |
Quality Diversification (% of fund's net assets)
| As of December 31, 2017 |
| | BBB | 1.0% |
| | BB | 42.8% |
| | B | 41.5% |
| | CCC,CC,C | 9.8% |
| | Not Rated | 1.7% |
| | Equities | 0.4% |
| | Short-Term Investments and Net Other Assets | 2.8% |

We have used ratings from Moody's Investors Service, Inc. Where Moody's® ratings are not available, we have used S&P® ratings. All ratings are as of the date indicated and do not reflect subsequent changes.
Asset Allocation (% of fund's net assets)
| As of December 31, 2017* |
| | Nonconvertible Bonds | 83.9% |
| | Convertible Bonds, Preferred Stocks | 0.5% |
| | Common Stocks | 0.2% |
| | Bank Loan Obligations | 9.4% |
| | Other Investments | 3.2% |
| | Short-Term Investments and Net Other Assets (Liabilities) | 2.8% |

* Foreign investments - 23.3%
Investments December 31, 2017
Showing Percentage of Net Assets
| Corporate Bonds - 84.2% | | | |
| | | Principal Amount | Value |
| Convertible Bonds - 0.3% | | | |
| Broadcasting - 0.3% | | | |
| DISH Network Corp.: | | | |
| 2.375% 3/15/24 (a) | | $1,560,000 | $1,498,575 |
| 3.375% 8/15/26 | | 1,580,000 | 1,719,238 |
| | | | 3,217,813 |
| Nonconvertible Bonds - 83.9% | | | |
| Aerospace - 1.7% | | | |
| Bombardier, Inc. 6.125% 1/15/23 (a) | | 2,795,000 | 2,739,100 |
| DAE Funding LLC: | | | |
| 4% 8/1/20 (a) | | 705,000 | 712,050 |
| 4.5% 8/1/22 (a) | | 4,065,000 | 3,993,863 |
| 5% 8/1/24 (a) | | 4,710,000 | 4,651,125 |
| TransDigm, Inc.: | | | |
| 6% 7/15/22 | | 1,725,000 | 1,759,500 |
| 6.375% 6/15/26 | | 4,340,000 | 4,383,400 |
| | | | 18,239,038 |
| Air Transportation - 1.7% | | | |
| Air Canada 7.75% 4/15/21 (a) | | 895,000 | 1,015,825 |
| Allegiant Travel Co. 5.5% 7/15/19 | | 3,335,000 | 3,422,544 |
| Continental Airlines, Inc. pass-thru trust certificates 9.798% 4/1/21 | | 1,340,217 | 1,470,888 |
| Delta Air Lines, Inc. pass-thru trust certificates 8.021% 2/10/24 | | 926,754 | 1,039,539 |
| U.S. Airways pass-thru certificates: | | | |
| Series 2012-2C, 5.45% 6/3/18 | | 3,565,000 | 3,636,300 |
| Series 2013-1 Class B, 5.375% 11/15/21 | | 579,040 | 609,862 |
| United Air Lines, Inc. pass-thru trust certificates Class B, 7.336% 7/2/19 | | 1,699,359 | 1,809,818 |
| United Continental Holdings, Inc. 4.25% 10/1/22 | | 4,585,000 | 4,613,656 |
| | | | 17,618,432 |
| Automotive & Auto Parts - 0.5% | | | |
| American Tire Distributors, Inc. 10.25% 3/1/22 (a) | | 1,040,000 | 1,071,200 |
| Delphi Technologies PLC 5% 10/1/25 (a) | | 1,330,000 | 1,346,625 |
| Jaguar Land Rover PLC 4.5% 10/1/27 (a) | | 870,000 | 856,950 |
| ZF North America Capital, Inc. 4.75% 4/29/25 (a) | | 1,775,000 | 1,879,281 |
| | | | 5,154,056 |
| Broadcasting - 1.3% | | | |
| AMC Networks, Inc.: | | | |
| 4.75% 12/15/22 | | 925,000 | 944,656 |
| 4.75% 8/1/25 | | 2,265,000 | 2,245,181 |
| 5% 4/1/24 | | 1,680,000 | 1,701,000 |
| Gray Television, Inc. 5.875% 7/15/26 (a) | | 1,020,000 | 1,045,500 |
| Sirius XM Radio, Inc.: | | | |
| 3.875% 8/1/22 (a) | | 3,655,000 | 3,664,138 |
| 5% 8/1/27 (a) | | 3,455,000 | 3,463,638 |
| | | | 13,064,113 |
| Building Materials - 1.0% | | | |
| Building Materials Corp. of America 4.75% 1/15/28 (a) | | 2,165,000 | 2,170,001 |
| CEMEX Finance LLC 6% 4/1/24 (a) | | 2,715,000 | 2,857,538 |
| CEMEX S.A.B. de CV: | | | |
| 5.7% 1/11/25 (a) | | 1,100,000 | 1,160,500 |
| 7.75% 4/16/26 (a) | | 2,030,000 | 2,298,975 |
| Eagle Materials, Inc. 4.5% 8/1/26 | | 2,145,000 | 2,236,163 |
| | | | 10,723,177 |
| Cable/Satellite TV - 5.6% | | | |
| Altice SA: | | | |
| 7.625% 2/15/25 (a) | | 1,180,000 | 1,129,850 |
| 7.75% 5/15/22 (a) | | 12,865,000 | 12,671,978 |
| Altice U.S. Finance SA 5.5% 5/15/26 (a) | | 2,945,000 | 3,000,219 |
| Cablevision Systems Corp. 5.875% 9/15/22 | | 570,000 | 561,450 |
| CCO Holdings LLC/CCO Holdings Capital Corp.: | | | |
| 4% 3/1/23 (a) | | 3,830,000 | 3,791,700 |
| 5% 2/1/28 (a) | | 8,430,000 | 8,198,175 |
| 5.125% 5/1/23 (a) | | 1,065,000 | 1,086,300 |
| 5.125% 5/1/27 (a) | | 5,530,000 | 5,447,050 |
| 5.5% 5/1/26 (a) | | 8,285,000 | 8,492,125 |
| CSC Holdings, Inc. 5.5% 4/15/27 (a) | | 2,245,000 | 2,289,900 |
| Unitymedia Hessen GmbH & Co. KG/Unitymedia NRW GmbH 5% 1/15/25 (a) | | 1,685,000 | 1,727,125 |
| Virgin Media Secured Finance PLC 5.5% 8/15/26 (a) | | 3,170,000 | 3,249,250 |
| Ziggo Bond Finance BV: | | | |
| 5.875% 1/15/25 (a) | | 1,810,000 | 1,778,325 |
| 6% 1/15/27 (a) | | 3,095,000 | 3,017,625 |
| Ziggo Secured Finance BV 5.5% 1/15/27 (a) | | 2,505,000 | 2,486,213 |
| | | | 58,927,285 |
| Capital Goods - 0.3% | | | |
| J.B. Poindexter & Co., Inc. 9% 4/1/22 (a) | | 3,072,000 | 3,187,200 |
| Chemicals - 3.0% | | | |
| CF Industries Holdings, Inc.: | | | |
| 3.4% 12/1/21 (a) | | 1,070,000 | 1,080,859 |
| 3.45% 6/1/23 | | 1,110,000 | 1,094,738 |
| 4.5% 12/1/26 (a) | | 770,000 | 802,441 |
| 5.15% 3/15/34 | | 170,000 | 173,400 |
| Evolution Escrow Issuer LLC 7.5% 3/15/22 (a) | | 1,875,000 | 1,959,375 |
| Kraton Polymers LLC/Kraton Polymers Capital Corp. 7% 4/15/25 (a) | | 3,080,000 | 3,295,600 |
| NOVA Chemicals Corp.: | | | |
| 4.875% 6/1/24 (a) | | 2,305,000 | 2,299,238 |
| 5.25% 6/1/27 (a) | | 2,115,000 | 2,109,713 |
| Nufarm Australia Ltd. 6.375% 10/15/19 (a) | | 2,050,000 | 2,085,875 |
| Olin Corp. 5.125% 9/15/27 | | 2,270,000 | 2,389,175 |
| Platform Specialty Products Corp. 5.875% 12/1/25 (a) | | 1,240,000 | 1,230,700 |
| TPC Group, Inc. 8.75% 12/15/20 (a) | | 5,100,000 | 5,100,000 |
| Trinseo Materials Operating SCA/Trinseo Materials Finance, Inc. 5.375% 9/1/25 (a) | | 2,810,000 | 2,908,350 |
| Tronox Finance PLC 5.75% 10/1/25 (a) | | 555,000 | 570,263 |
| Valvoline, Inc. 4.375% 8/15/25 | | 2,355,000 | 2,378,550 |
| Versum Materials, Inc. 5.5% 9/30/24 (a) | | 1,540,000 | 1,647,800 |
| | | | 31,126,077 |
| Consumer Products - 0.1% | | | |
| Mattel, Inc. 6.75% 12/31/25 (a) | | 915,000 | 927,307 |
| Containers - 2.2% | | | |
| Ardagh Packaging Finance PLC/Ardagh MP Holdings U.S.A., Inc.: | | | |
| 4.625% 5/15/23 (a) | | 5,155,000 | 5,259,647 |
| 7.25% 5/15/24 (a) | | 1,275,000 | 1,388,156 |
| Crown Americas LLC/Crown Americas Capital Corp. V 4.25% 9/30/26 | | 3,105,000 | 3,058,425 |
| OI European Group BV 4% 3/15/23 (a) | | 2,850,000 | 2,853,848 |
| Owens-Brockway Glass Container, Inc. 5.375% 1/15/25 (a) | | 4,115,000 | 4,341,325 |
| Reynolds Group Issuer, Inc./Reynolds Group Issuer LLC/Reynolds Group Issuer (Luxembourg) SA: | | | |
| 3 month U.S. LIBOR + 3.500% 4.8592% 7/15/21 (a)(b)(c) | | 1,470,000 | 1,492,050 |
| 5.75% 10/15/20 | | 2,897,632 | 2,941,097 |
| Silgan Holdings, Inc. 4.75% 3/15/25 (a) | | 1,680,000 | 1,722,000 |
| | | | 23,056,548 |
| Diversified Financial Services - 5.7% | | | |
| Chobani LLC/Finance Corp., Inc. 7.5% 4/15/25 (a) | | 1,725,000 | 1,828,500 |
| FLY Leasing Ltd.: | | | |
| 5.25% 10/15/24 | | 955,000 | 955,000 |
| 6.375% 10/15/21 | | 2,890,000 | 3,012,825 |
| Icahn Enterprises LP/Icahn Enterprises Finance Corp.: | | | |
| 5.875% 2/1/22 | | 8,165,000 | 8,267,063 |
| 6% 8/1/20 | | 2,390,000 | 2,457,936 |
| 6.25% 2/1/22 (a) | | 2,815,000 | 2,878,338 |
| 6.25% 2/1/22 | | 5,575,000 | 5,700,438 |
| 6.375% 12/15/25 (a) | | 2,140,000 | 2,140,214 |
| 6.75% 2/1/24 | | 4,500,000 | 4,623,750 |
| ILFC E-Capital Trust I 3 month U.S. LIBOR + 1.550% 4.37% 12/21/65 (a)(b)(c) | | 4,595,000 | 4,480,125 |
| ILFC E-Capital Trust II 3 month U.S. LIBOR + 1.800% 4.62% 12/21/65 (a)(b)(c) | | 7,445,000 | 7,184,425 |
| James Hardie International Finance Ltd.: | | | |
| 4.75% 1/15/25 (a) | | 770,000 | 775,775 |
| 5% 1/15/28 (a) | | 775,000 | 780,813 |
| MSCI, Inc. 4.75% 8/1/26 (a) | | 6,120,000 | 6,426,000 |
| Quicken Loans, Inc. 5.25% 1/15/28 (a) | | 2,135,000 | 2,107,672 |
| Radiate Holdco LLC/Radiate Financial Service Ltd. 6.625% 2/15/25 (a) | | 1,190,000 | 1,124,550 |
| SLM Corp. 5.5% 1/25/23 | | 2,490,000 | 2,483,775 |
| Tempo Acquisition LLC 6.75% 6/1/25 (a) | | 2,920,000 | 2,949,200 |
| | | | 60,176,399 |
| Diversified Media - 0.5% | | | |
| E.W. Scripps Co. 5.125% 5/15/25 (a) | | 760,000 | 756,200 |
| MDC Partners, Inc. 6.5% 5/1/24 (a) | | 3,485,000 | 3,502,425 |
| Nielsen Finance LLC/Nielsen Finance Co. 5% 4/15/22 (a) | | 770,000 | 792,138 |
| | | | 5,050,763 |
| Energy - 16.1% | | | |
| Antero Resources Corp.: | | | |
| 5% 3/1/25 | | 2,500,000 | 2,550,000 |
| 5.125% 12/1/22 | | 5,515,000 | 5,625,300 |
| 5.625% 6/1/23 (Reg. S) | | 2,500,000 | 2,600,000 |
| Calfrac Holdings LP 7.5% 12/1/20 (a) | | 2,040,000 | 2,009,400 |
| California Resources Corp. 8% 12/15/22 (a) | | 3,055,000 | 2,520,375 |
| Cheniere Corpus Christi Holdings LLC: | | | |
| 5.125% 6/30/27 | | 1,290,000 | 1,334,376 |
| 5.875% 3/31/25 | | 2,935,000 | 3,180,806 |
| 7% 6/30/24 | | 1,555,000 | 1,769,784 |
| Chesapeake Energy Corp.: | | | |
| 4.875% 4/15/22 | | 1,915,000 | 1,814,463 |
| 5.75% 3/15/23 | | 3,275,000 | 3,029,375 |
| 8% 12/15/22 (a) | | 4,309,000 | 4,648,334 |
| 8% 1/15/25 (a) | | 1,660,000 | 1,676,600 |
| 8% 6/15/27 (a) | | 2,000,000 | 1,920,000 |
| Consolidated Energy Finance SA: | | | |
| 3 month U.S. LIBOR + 3.750% 5.3385% 6/15/22 (a)(b)(c) | | 7,095,000 | 7,068,576 |
| 6.875% 6/15/25 (a) | | 2,230,000 | 2,363,800 |
| Continental Resources, Inc.: | | | |
| 3.8% 6/1/24 | | 2,465,000 | 2,437,269 |
| 4.375% 1/15/28 (a) | | 2,350,000 | 2,319,920 |
| 4.5% 4/15/23 | | 4,965,000 | 5,064,300 |
| 4.9% 6/1/44 | | 775,000 | 740,125 |
| Covey Park Energy LLC 7.5% 5/15/25 (a) | | 2,875,000 | 2,996,325 |
| Crestwood Midstream Partners LP/Crestwood Midstream Finance Corp. 5.75% 4/1/25 | | 2,080,000 | 2,147,600 |
| CVR Refining LLC/Coffeyville Finance, Inc. 6.5% 11/1/22 | | 5,810,000 | 5,984,300 |
| Denbury Resources, Inc. 9% 5/15/21 (a) | | 2,415,000 | 2,466,319 |
| Diamond Offshore Drilling, Inc. 7.875% 8/15/25 | | 1,775,000 | 1,857,094 |
| Endeavor Energy Resources LP/EER Finance, Inc.: | | | |
| 5.5% 1/30/26 (a) | | 455,000 | 462,963 |
| 5.75% 1/30/28 (a) | | 455,000 | 467,285 |
| Energy Transfer Equity LP 4.25% 3/15/23 | | 2,325,000 | 2,307,563 |
| Ensco PLC: | | | |
| 4.5% 10/1/24 | | 2,965,000 | 2,490,600 |
| 5.2% 3/15/25 | | 6,385,000 | 5,427,250 |
| 8% 1/31/24 | | 2,205,000 | 2,210,513 |
| EP Energy LLC/Everest Acquisition Finance, Inc. 8% 11/29/24 (a) | | 3,800,000 | 3,923,500 |
| Exterran Energy Solutions LP 8.125% 5/1/25 (a) | | 1,175,000 | 1,263,125 |
| Exterran Partners LP/EXLP Finance Corp. 6% 4/1/21 | | 6,300,000 | 6,300,000 |
| Forum Energy Technologies, Inc. 6.25% 10/1/21 | | 2,845,000 | 2,852,113 |
| FTS International, Inc.: | | | |
| 3 month U.S. LIBOR + 7.500% 9.0885% 6/15/20 (a)(b)(c) | | 762,000 | 777,240 |
| 6.25% 5/1/22 | | 1,015,000 | 982,013 |
| Hess Infrastructure Partners LP 5.625% 2/15/26 (a) | | 1,445,000 | 1,491,963 |
| Hilcorp Energy I LP/Hilcorp Finance Co.: | | | |
| 5% 12/1/24 (a) | | 3,140,000 | 3,108,600 |
| 5.75% 10/1/25 (a) | | 1,995,000 | 2,039,888 |
| Jonah Energy LLC 7.25% 10/15/25 (a) | | 1,650,000 | 1,662,375 |
| Nabors Industries, Inc. 5.5% 1/15/23 | | 4,662,000 | 4,522,140 |
| Newfield Exploration Co. 5.375% 1/1/26 | | 765,000 | 808,988 |
| NextEra Energy Partners LP: | | | |
| 4.25% 9/15/24 (a) | | 810,000 | 824,175 |
| 4.5% 9/15/27 (a) | | 565,000 | 562,175 |
| NGL Energy Partners LP/NGL Energy Finance Corp. 6.125% 3/1/25 | | 540,000 | 526,500 |
| NGPL PipeCo LLC: | | | |
| 4.375% 8/15/22 (a) | | 310,000 | 315,231 |
| 4.875% 8/15/27 (a) | | 310,000 | 321,625 |
| Noble Holding International Ltd.: | | | |
| 4.625% 3/1/21 | | 3,196,000 | 2,988,260 |
| 5.25% 3/15/42 | | 1,160,000 | 739,500 |
| 7.7% 4/1/25 (b) | | 1,695,000 | 1,419,563 |
| 7.75% 1/15/24 | | 2,345,000 | 2,016,700 |
| NuStar Logistics LP 5.625% 4/28/27 | | 855,000 | 869,963 |
| Parsley Energy LLC/Parsley: | | | |
| 5.25% 8/15/25 (a) | | 410,000 | 411,025 |
| 5.375% 1/15/25 (a) | | 645,000 | 651,450 |
| PBF Logistics LP/PBF Logistics Finance, Inc.: | | | |
| 6.875% 5/15/23 | | 2,475,000 | 2,549,250 |
| 6.875% 5/15/23 (a) | | 1,840,000 | 1,895,200 |
| Precision Drilling Corp.: | | | |
| 5.25% 11/15/24 | | 775,000 | 730,438 |
| 6.5% 12/15/21 | | 503,000 | 512,431 |
| 7.125% 1/15/26 (a) | | 965,000 | 984,300 |
| Range Resources Corp.: | | | |
| 4.875% 5/15/25 | | 1,010,000 | 974,650 |
| 5% 8/15/22 | | 3,400,000 | 3,383,000 |
| 5% 3/15/23 | | 3,200,000 | 3,184,000 |
| SemGroup Corp. 7.25% 3/15/26 (a) | | 1,135,000 | 1,160,538 |
| SESI LLC 7.75% 9/15/24 (a) | | 745,000 | 791,563 |
| Southwestern Energy Co. 4.1% 3/15/22 | | 920,000 | 906,200 |
| Summit Midstream Holdings LLC 5.75% 4/15/25 | | 1,980,000 | 1,996,612 |
| Sunoco LP/Sunoco Finance Corp.: | | | |
| 5.5% 8/1/20 | | 4,145,000 | 4,265,723 |
| 6.375% 4/1/23 | | 2,050,000 | 2,160,188 |
| Targa Resources Partners LP/Targa Resources Partners Finance Corp.: | | | |
| 5% 1/15/28 (a) | | 3,100,000 | 3,092,250 |
| 5.125% 2/1/25 | | 665,000 | 680,794 |
| 5.25% 5/1/23 | | 400,000 | 409,000 |
| 5.375% 2/1/27 | | 665,000 | 682,456 |
| 6.75% 3/15/24 | | 3,065,000 | 3,287,213 |
| TerraForm Power Operating LLC: | | | |
| 4.25% 1/31/23 (a) | | 550,000 | 545,875 |
| 5% 1/31/28 (a) | | 550,000 | 544,500 |
| The Williams Companies, Inc.: | | | |
| 3.7% 1/15/23 | | 2,185,000 | 2,174,075 |
| 4.55% 6/24/24 | | 2,915,000 | 3,024,313 |
| Whiting Petroleum Corp.: | | | |
| 5% 3/15/19 | | 1,440,000 | 1,476,720 |
| 5.75% 3/15/21 | | 820,000 | 841,525 |
| 6.25% 4/1/23 | | 1,060,000 | 1,087,825 |
| 6.625% 1/15/26 (a) | | 730,000 | 744,600 |
| | | | 168,953,966 |
| Entertainment/Film - 0.3% | | | |
| AMC Entertainment Holdings, Inc. 5.875% 11/15/26 | | 940,000 | 925,900 |
| New Cotai LLC/New Cotai Capital Corp. 10.625% 5/1/19 pay-in-kind (a)(b) | | 2,673,723 | 2,573,458 |
| | | | 3,499,358 |
| Environmental - 0.4% | | | |
| CD&R Waterworks Merger Sub LLC 6.125% 8/15/25 (a) | | 480,000 | 487,200 |
| LBC Tank Terminals Holding Netherlands BV 6.875% 5/15/23 (a) | | 3,630,000 | 3,779,738 |
| | | | 4,266,938 |
| Food & Drug Retail - 0.8% | | | |
| Albertsons Companies LLC/Safeway, Inc./New Albertson's, Inc./Albertson's LLC: | | | |
| 5.75% 3/15/25 | | 1,650,000 | 1,488,300 |
| 6.625% 6/15/24 | | 1,300,000 | 1,231,750 |
| Albertsons, Inc.: | | | |
| 6.625% 6/1/28 | | 400,000 | 316,000 |
| 7.45% 8/1/29 | | 365,000 | 321,200 |
| 7.75% 6/15/26 | | 430,000 | 387,000 |
| 8% 5/1/31 | | 3,242,000 | 2,925,905 |
| 8.7% 5/1/30 | | 315,000 | 294,525 |
| FAGE International SA/FAGE U.S.A. Dairy Industry, Inc. 5.625% 8/15/26 (a) | | 315,000 | 303,975 |
| Tops Holding LLC/Tops Markets II Corp. 8% 6/15/22 (a) | | 2,005,000 | 1,082,700 |
| | | | 8,351,355 |
| Food/Beverage/Tobacco - 2.0% | | | |
| C&S Group Enterprises LLC 5.375% 7/15/22 (a) | | 4,360,000 | 4,109,300 |
| Cott Holdings, Inc. 5.5% 4/1/25 (a) | | 1,195,000 | 1,227,863 |
| Lamb Weston Holdings, Inc.: | | | |
| 4.625% 11/1/24 (a) | | 4,465,000 | 4,598,950 |
| 4.875% 11/1/26 (a) | | 905,000 | 945,725 |
| Post Holdings, Inc.: | | | |
| 5% 8/15/26 (a) | | 1,950,000 | 1,918,313 |
| 5.625% 1/15/28 (a) | | 1,715,000 | 1,724,090 |
| 5.75% 3/1/27 (a) | | 1,635,000 | 1,663,613 |
| Vector Group Ltd. 6.125% 2/1/25 (a) | | 4,500,000 | 4,657,500 |
| | | | 20,845,354 |
| Gaming - 2.2% | | | |
| CRC Escrow Issuer LLC/CRC Finance LLC 5.25% 10/15/25 (a) | | 3,525,000 | 3,551,438 |
| MCE Finance Ltd. 4.875% 6/6/25 (a) | | 2,075,000 | 2,097,746 |
| MGM Growth Properties Operating Partnership LP: | | | |
| 4.5% 9/1/26 | | 5,695,000 | 5,666,525 |
| 4.5% 1/15/28 (a) | | 895,000 | 877,100 |
| Scientific Games Corp.: | | | |
| 5% 10/15/25 (a) | | 350,000 | 350,875 |
| 6.625% 5/15/21 | | 2,710,000 | 2,798,075 |
| 7% 1/1/22 (a) | | 225,000 | 237,094 |
| Station Casinos LLC 5% 10/1/25 (a) | | 2,575,000 | 2,587,875 |
| Wynn Las Vegas LLC/Wynn Las Vegas Capital Corp. 5.25% 5/15/27 (a) | | 1,515,000 | 1,535,831 |
| Wynn Macau Ltd.: | | | |
| 4.875% 10/1/24 (a) | | 890,000 | 894,450 |
| 5.5% 10/1/27 (a) | | 2,660,000 | 2,689,925 |
| | | | 23,286,934 |
| Healthcare - 6.7% | | | |
| AMAG Pharmaceuticals, Inc. 7.875% 9/1/23 (a) | | 2,170,000 | 2,113,038 |
| Catalent Pharma Solutions 4.875% 1/15/26 (a) | | 400,000 | 401,500 |
| Community Health Systems, Inc.: | | | |
| 6.25% 3/31/23 | | 4,215,000 | 3,793,500 |
| 6.875% 2/1/22 | | 9,120,000 | 5,244,000 |
| CTR Partnership LP/CareTrust Capital Corp. 5.25% 6/1/25 | | 2,645,000 | 2,697,900 |
| HCA Holdings, Inc.: | | | |
| 4.5% 2/15/27 | | 3,855,000 | 3,874,275 |
| 5% 3/15/24 | | 1,655,000 | 1,721,200 |
| 5.25% 6/15/26 | | 3,000,000 | 3,180,000 |
| 5.875% 2/15/26 | | 1,670,000 | 1,766,025 |
| HealthSouth Corp.: | | | |
| 5.125% 3/15/23 | | 815,000 | 833,338 |
| 5.75% 9/15/25 | | 1,945,000 | 2,022,800 |
| Kindred Healthcare, Inc.: | | | |
| 8% 1/15/20 | | 560,000 | 606,732 |
| 8.75% 1/15/23 | | 940,000 | 996,400 |
| MPT Operating Partnership LP/MPT Finance Corp.: | | | |
| 5% 10/15/27 | | 1,345,000 | 1,370,219 |
| 5.25% 8/1/26 | | 1,515,000 | 1,568,025 |
| 6.375% 3/1/24 | | 1,275,000 | 1,348,313 |
| Ortho-Clinical Diagnostics, Inc. 6.625% 5/15/22 (a) | | 850,000 | 854,250 |
| Polaris Intermediate Corp. 8.5% 12/1/22 pay-in-kind (a)(b) | | 2,135,000 | 2,215,063 |
| Sabra Health Care LP/Sabra Capital Corp. 5.375% 6/1/23 | | 765,000 | 780,300 |
| Service Corp. International 4.625% 12/15/27 | | 2,135,000 | 2,166,214 |
| Teleflex, Inc.: | | | |
| 4.625% 11/15/27 | | 465,000 | 468,976 |
| 4.875% 6/1/26 | | 4,115,000 | 4,248,738 |
| Tenet Healthcare Corp.: | | | |
| 4.375% 10/1/21 | | 2,250,000 | 2,244,375 |
| 4.625% 7/15/24 (a) | | 1,540,000 | 1,501,500 |
| 6.75% 6/15/23 | | 940,000 | 911,800 |
| THC Escrow Corp. III 5.125% 5/1/25 (a) | | 1,030,000 | 1,004,250 |
| Valeant Pharmaceuticals International, Inc.: | | | |
| 5.375% 3/15/20 (a) | | 2,130,000 | 2,132,663 |
| 5.5% 11/1/25 (a) | | 1,725,000 | 1,755,188 |
| 5.625% 12/1/21 (a) | | 5,825,000 | 5,693,938 |
| 5.875% 5/15/23 (a) | | 6,000,000 | 5,565,000 |
| 6.125% 4/15/25 (a) | | 4,615,000 | 4,222,725 |
| 9% 12/15/25 (a) | | 1,105,000 | 1,151,631 |
| | | | 70,453,876 |
| Homebuilders/Real Estate - 3.2% | | | |
| Beazer Homes U.S.A., Inc. 5.875% 10/15/27 (a) | | 1,525,000 | 1,532,625 |
| CalAtlantic Group, Inc.: | | | |
| 5% 6/15/27 | | 2,300,000 | 2,386,250 |
| 5.25% 6/1/26 | | 2,530,000 | 2,675,475 |
| Howard Hughes Corp. 5.375% 3/15/25 (a) | | 2,200,000 | 2,255,000 |
| Lennar Corp.: | | | |
| 4.125% 1/15/22 | | 1,670,000 | 1,703,400 |
| 4.75% 11/29/27 (a) | | 1,535,000 | 1,580,743 |
| M.D.C. Holdings, Inc. 6% 1/15/43 | | 775,000 | 755,625 |
| M/I Homes, Inc.: | | | |
| 5.625% 8/1/25 | | 650,000 | 659,698 |
| 6.75% 1/15/21 | | 2,925,000 | 3,027,375 |
| Mattamy Group Corp.: | | | |
| 6.5% 10/1/25 (a) | | 1,060,000 | 1,120,950 |
| 6.875% 12/15/23 (a) | | 3,920,000 | 4,145,400 |
| PulteGroup, Inc. 5% 1/15/27 | | 1,490,000 | 1,557,050 |
| Starwood Property Trust, Inc. 4.75% 3/15/25 (a) | | 1,015,000 | 1,007,388 |
| Taylor Morrison Communities, Inc./Monarch Communities, Inc. 5.875% 4/15/23 (a) | | 1,395,000 | 1,473,469 |
| Toll Brothers Finance Corp. 4.875% 3/15/27 | | 1,965,000 | 2,038,688 |
| TRI Pointe Homes, Inc. 5.25% 6/1/27 | | 1,690,000 | 1,733,433 |
| VEREIT Operating Partnership LP: | | | |
| 4.125% 6/1/21 | | 1,035,000 | 1,074,299 |
| 4.875% 6/1/26 | | 1,035,000 | 1,095,329 |
| William Lyon Homes, Inc. 7% 8/15/22 | | 1,708,000 | 1,759,240 |
| | | | 33,581,437 |
| Hotels - 0.6% | | | |
| Hilton Escrow Issuer LLC 4.25% 9/1/24 | | 4,225,000 | 4,267,250 |
| Hilton Worldwide Finance LLC/Hilton Worldwide Finance Corp.: | | | |
| 4.625% 4/1/25 | | 1,515,000 | 1,556,663 |
| 4.875% 4/1/27 | | 895,000 | 936,394 |
| | | | 6,760,307 |
| Insurance - 0.2% | | | |
| Acrisure LLC 7% 11/15/25 (a) | | 1,775,000 | 1,710,674 |
| Leisure - 0.7% | | | |
| Carlson Travel, Inc. 9.5% 12/15/24 (a) | | 1,970,000 | 1,585,850 |
| Hilton Grand Vacations Borrower LLC/Hilton Grand Vacations Borrower, Inc. 6.125% 12/1/24 (a) | | 765,000 | 835,763 |
| Silversea Cruises 7.25% 2/1/25 (a) | | 845,000 | 910,488 |
| Studio City Co. Ltd.: | | | |
| 5.875% 11/30/19 (a) | | 840,000 | 877,800 |
| 7.25% 11/30/21 (a) | | 1,895,000 | 1,999,225 |
| Viking Cruises Ltd. 5.875% 9/15/27 (a) | | 1,170,000 | 1,190,475 |
| | | | 7,399,601 |
| Metals/Mining - 2.7% | | | |
| Constellium NV 5.875% 2/15/26 (a) | | 1,780,000 | 1,813,375 |
| First Quantum Minerals Ltd.: | | | |
| 7.25% 5/15/22 (a) | | 1,360,000 | 1,425,688 |
| 7.25% 4/1/23 (a) | | 4,110,000 | 4,428,525 |
| 7.5% 4/1/25 (a) | | 1,980,000 | 2,148,300 |
| FMG Resources (August 2006) Pty Ltd.: | | | |
| 4.75% 5/15/22 (a) | | 2,885,000 | 2,921,063 |
| 5.125% 5/15/24 (a) | | 1,255,000 | 1,270,688 |
| Freeport-McMoRan, Inc.: | | | |
| 3.55% 3/1/22 | | 2,055,000 | 2,031,881 |
| 3.875% 3/15/23 | | 2,770,000 | 2,756,150 |
| 4.55% 11/14/24 | | 2,735,000 | 2,780,675 |
| 5.4% 11/14/34 | | 540,000 | 549,450 |
| SunCoke Energy Partners LP/SunCoke Energy Partners Finance Corp. 7.5% 6/15/25 (a) | | 5,425,000 | 5,669,125 |
| | | | 27,794,920 |
| Publishing/Printing - 0.7% | | | |
| MHGE Parent LLC/MHGE Parent Finance, Inc. 8.5% 8/1/19 pay-in-kind (a)(b) | | 4,455,000 | 4,431,389 |
| Multi-Color Corp. 4.875% 11/1/25 (a) | | 2,815,000 | 2,825,556 |
| | | | 7,256,945 |
| Restaurants - 1.8% | | | |
| 1011778 BC Unlimited Liability Co./New Red Finance, Inc.: | | | |
| 4.25% 5/15/24 (a) | | 2,535,000 | 2,528,663 |
| 5% 10/15/25 (a) | | 5,080,000 | 5,118,100 |
| Golden Nugget, Inc. 6.75% 10/15/24 (a) | | 4,515,000 | 4,594,013 |
| KFC Holding Co./Pizza Hut Holding LLC: | | | |
| 4.75% 6/1/27(a) | | 955,000 | 976,488 |
| 5.25% 6/1/26 (a) | | 2,380,000 | 2,504,950 |
| Yum! Brands, Inc.: | | | |
| 3.875% 11/1/23 | | 1,475,000 | 1,484,219 |
| 5.35% 11/1/43 | | 1,910,000 | 1,843,150 |
| | | | 19,049,583 |
| Services - 3.5% | | | |
| APX Group, Inc.: | | | |
| 6.375% 12/1/19 | | 3,711,000 | 3,766,665 |
| 7.625% 9/1/23 | | 1,750,000 | 1,841,875 |
| 8.75% 12/1/20 | | 9,315,000 | 9,501,300 |
| Aramark Services, Inc.: | | | |
| 4.75% 6/1/26 | | 4,250,000 | 4,313,750 |
| 5.125% 1/15/24 | | 1,475,000 | 1,548,013 |
| Ashtead Capital, Inc.: | | | |
| 4.125% 8/15/25 (a) | | 910,000 | 919,100 |
| 4.375% 8/15/27 (a) | | 960,000 | 974,400 |
| Avantor, Inc.: | | | |
| 6% 10/1/24 (a) | | 1,760,000 | 1,753,400 |
| 9% 10/1/25 (a) | | 3,185,000 | 3,137,225 |
| Brand Energy & Infrastructure Services, Inc. 8.5% 7/15/25 (a) | | 2,320,000 | 2,436,000 |
| CDK Global, Inc. 4.875% 6/1/27 (a) | | 1,105,000 | 1,118,813 |
| IHS Markit Ltd. 4% 3/1/26 (a) | | 470,000 | 469,413 |
| Laureate Education, Inc. 8.25% 5/1/25 (a) | | 2,835,000 | 3,005,100 |
| Prime Security One MS, Inc. 4.875% 7/15/32 (a) | | 1,520,000 | 1,436,400 |
| | | | 36,221,454 |
| Steel - 1.1% | | | |
| Big River Steel LLC/BRS Finance Corp. 7.25% 9/1/25 (a) | | 960,000 | 1,015,200 |
| Cliffs Natural Resources, Inc.: | | | |
| 4.875% 1/15/24 (a) | | 2,135,000 | 2,129,663 |
| 5.75% 3/1/25 (a) | | 2,880,000 | 2,739,600 |
| Commercial Metals Co. 5.375% 7/15/27 | | 3,005,000 | 3,065,100 |
| Steel Dynamics, Inc. 4.125% 9/15/25 (a) | | 2,545,000 | 2,564,088 |
| | | | 11,513,651 |
| Super Retail - 1.1% | | | |
| JC Penney Corp., Inc. 7.4% 4/1/37 | | 7,795,000 | 5,027,775 |
| Netflix, Inc.: | | | |
| 4.375% 11/15/26 | | 3,355,000 | 3,279,513 |
| 4.875% 4/15/28 (a) | | 2,805,000 | 2,748,900 |
| | | | 11,056,188 |
| Technology - 4.2% | | | |
| Ceridian HCM Holding, Inc. 11% 3/15/21 (a) | | 265,000 | 276,925 |
| EMC Corp. 2.65% 6/1/20 | | 3,715,000 | 3,667,929 |
| Gartner, Inc. 5.125% 4/1/25 (a) | | 795,000 | 830,775 |
| Greeneden U.S. Holdings II LLC 10% 11/30/24 (a) | | 820,000 | 895,850 |
| j2 Cloud Services LLC/j2 Global Communications, Inc. 6% 7/15/25 (a) | | 825,000 | 868,313 |
| Micron Technology, Inc.: | | | |
| 5.25% 1/15/24 (a) | | 1,690,000 | 1,755,488 |
| 5.5% 2/1/25 | | 210,000 | 219,713 |
| 5.625% 1/15/26 (a) | | 1,825,000 | 1,920,813 |
| Nuance Communications, Inc.: | | | |
| 5.375% 8/15/20 (a) | | 311,000 | 315,276 |
| 5.625% 12/15/26 | | 3,135,000 | 3,264,319 |
| NXP BV/NXP Funding LLC: | | | |
| 3.875% 9/1/22 (a) | | 3,695,000 | 3,736,569 |
| 4.125% 6/1/21 (a) | | 4,450,000 | 4,539,000 |
| 4.625% 6/15/22 (a) | | 690,000 | 721,913 |
| 4.625% 6/1/23 (a) | | 3,015,000 | 3,153,690 |
| Open Text Corp. 5.875% 6/1/26 (a) | | 6,385,000 | 6,879,838 |
| Sensata Technologies BV 5% 10/1/25 (a) | | 4,960,000 | 5,245,200 |
| Sensata Technologies UK Financing Co. PLC 6.25% 2/15/26 (a) | | 740,000 | 804,750 |
| Solera LLC/Solera Finance, Inc. 10.5% 3/1/24 (a) | | 3,650,000 | 4,106,177 |
| Symantec Corp. 5% 4/15/25 (a) | | 445,000 | 462,800 |
| VeriSign, Inc. 5.25% 4/1/25 | | 600,000 | 653,250 |
| | | | 44,318,588 |
| Telecommunications - 6.6% | | | |
| Altice Financing SA: | | | |
| 6.625% 2/15/23 (a) | | 2,595,000 | 2,717,225 |
| 7.5% 5/15/26 (a) | | 845,000 | 899,925 |
| Altice Finco SA 7.625% 2/15/25 (a) | | 5,535,000 | 5,631,863 |
| Equinix, Inc. 5.375% 5/15/27 | | 985,000 | 1,053,950 |
| Frontier Communications Corp. 11% 9/15/25 | | 3,360,000 | 2,469,600 |
| Gogo Intermediate Holdings LLC/Gogo Finance Co., Inc. 12.5% 7/1/22 (a) | | 3,410,000 | 3,849,038 |
| Inmarsat Finance PLC 4.875% 5/15/22 (a) | | 1,275,000 | 1,271,813 |
| Level 3 Financing, Inc. 5.25% 3/15/26 | | 2,350,000 | 2,306,643 |
| SBA Communications Corp. 4.875% 9/1/24 | | 1,235,000 | 1,268,963 |
| SFR Group SA 6% 5/15/22 (a) | | 4,540,000 | 4,596,750 |
| Sprint Capital Corp. 6.875% 11/15/28 | | 4,070,000 | 4,095,438 |
| Sprint Communications, Inc. 6% 11/15/22 | | 6,010,000 | 6,010,000 |
| Sprint Corp.: | | | |
| 7.25% 9/15/21 | | 3,060,000 | 3,239,775 |
| 7.625% 2/15/25 | | 3,375,000 | 3,535,313 |
| 7.875% 9/15/23 | | 3,795,000 | 4,041,675 |
| T-Mobile U.S.A., Inc.: | | | |
| 4% 4/15/22 | | 2,980,000 | 3,056,363 |
| 5.125% 4/15/25 | | 2,295,000 | 2,383,931 |
| 6.625% 4/1/23 | | 315,000 | 328,388 |
| Telecom Italia Capital SA: | | | |
| 6% 9/30/34 | | 2,004,000 | 2,249,490 |
| 6.375% 11/15/33 | | 1,640,000 | 1,906,500 |
| Telenet Finance Luxembourg Notes SARL 5.5% 3/1/28 (a) | | 2,400,000 | 2,394,000 |
| Wind Tre SpA 5% 1/20/26 (a) | | 4,165,000 | 3,917,266 |
| Zayo Group LLC/Zayo Capital, Inc.: | | | |
| 5.75% 1/15/27 (a) | | 3,585,000 | 3,656,700 |
| 6.375% 5/15/25 | | 1,765,000 | 1,866,488 |
| | | | 68,747,097 |
| Transportation Ex Air/Rail - 0.8% | | | |
| Navios Maritime Acquisition Corp./Navios Acquisition Finance U.S., Inc. 8.125% 11/15/21 (a) | | 7,065,000 | 5,987,588 |
| Navios Maritime Holdings, Inc.: | | | |
| 7.375% 1/15/22 (a) | | 930,000 | 746,325 |
| 11.25% 8/15/22 (a) | | 1,840,000 | 1,775,600 |
| | | | 8,509,513 |
| Utilities - 4.6% | | | |
| Calpine Corp. 5.25% 6/1/26 (a) | | 1,275,000 | 1,249,513 |
| Dolphin Subsidiary II, Inc. 7.25% 10/15/21 | | 4,377,000 | 4,858,470 |
| DPL, Inc. 6.75% 10/1/19 | | 2,625,000 | 2,749,688 |
| Dynegy, Inc. 8.125% 1/30/26 (a) | | 1,885,000 | 2,059,363 |
| Global Partners LP/GLP Finance Corp.: | | | |
| 6.25% 7/15/22 | | 3,046,000 | 3,129,765 |
| 7% 6/15/23 | | 5,750,000 | 5,908,125 |
| InterGen NV 7% 6/30/23 (a) | | 1,625,000 | 1,572,188 |
| NRG Energy, Inc.: | | | |
| 5.75% 1/15/28 (a) | | 1,190,000 | 1,201,900 |
| 6.25% 5/1/24 | | 755,000 | 790,863 |
| 6.625% 1/15/27 | | 900,000 | 951,750 |
| NRG Yield Operating LLC 5% 9/15/26 | | 2,150,000 | 2,182,250 |
| NSG Holdings II LLC/NSG Holdings, Inc. 7.75% 12/15/25 (a) | | 11,111,272 | 12,194,621 |
| The AES Corp.: | | | |
| 4.875% 5/15/23 | | 4,135,000 | 4,212,531 |
| 5.125% 9/1/27 | | 1,680,000 | 1,764,000 |
| 6% 5/15/26 | | 3,205,000 | 3,461,400 |
| | | | 48,286,427 |
|
| TOTAL NONCONVERTIBLE BONDS | | | 879,114,561 |
|
| TOTAL CORPORATE BONDS | | | |
| (Cost $863,794,208) | | | 882,332,374 |
| | | Shares | Value |
|
| Common Stocks - 0.2% | | | |
| Energy - 0.2% | | | |
| Forbes Energy Services Ltd. | | 146,156 | 1,446,944 |
| Southwestern Energy Co. (d) | | 64,100 | 357,678 |
|
| TOTAL ENERGY | | | 1,804,622 |
|
| Telecommunications - 0.0% | | | |
| CUI Acquisition Corp. Class E (d)(e) | | 1 | 35,011 |
| TOTAL COMMON STOCKS | | | |
| (Cost $8,813,229) | | | 1,839,633 |
|
| Convertible Preferred Stocks - 0.2% | | | |
| Energy - 0.2% | | | |
| Southwestern Energy Co. Series B 6.25% | | | |
| (Cost $2,641,725) | | 149,000 | 1,774,024 |
| | | Principal Amount | Value |
|
| Bank Loan Obligations - 9.4% | | | |
| Aerospace - 0.8% | | | |
| TransDigm, Inc.: | | | |
| Tranche B, term loan 3 month U.S. LIBOR + 2.750% 4.3617% 6/9/23 (b)(c) | | 6,239,365 | 6,246,291 |
| Tranche G, term loan 3 month U.S. LIBOR + 3.000% 4.6652% 8/22/24 (b)(c) | | 2,283,525 | 2,293,047 |
|
| TOTAL AEROSPACE | | | 8,539,338 |
|
| Air Transportation - 0.2% | | | |
| American Airlines, Inc. Tranche B, term loan 3 month U.S. LIBOR + 2.000% 3.477% 12/14/23 (b)(c) | | 2,435,400 | 2,431,138 |
| Cable/Satellite TV - 1.2% | | | |
| Numericable LLC Tranche B 12LN, term loan 3 month U.S. LIBOR + 3.000% 4.3491% 1/1/26 (b)(c) | | 2,050,000 | 1,971,198 |
| Unitymedia Finance LLC Tranche B, term loan 3 month U.S. LIBOR + 2.250% 3.727% 9/30/25 (b)(c) | | 2,495,000 | 2,495,948 |
| WideOpenWest Finance LLC Tranche B, term loan 3 month U.S. LIBOR + 3.250% 4.7511% 8/19/23 (b)(c) | | 3,356,588 | 3,321,981 |
| Zayo Group LLC term loan 3 month U.S. LIBOR + 2.000% 3.5521% 1/19/21 (b)(c) | | 1,116,563 | 1,118,952 |
| Ziggo Secured Finance Partnership Tranche E, term loan 3 month U.S. LIBOR + 2.500% 3.977% 4/15/25 (b)(c) | | 4,020,000 | 3,984,825 |
|
| TOTAL CABLE/SATELLITE TV | | | 12,892,904 |
|
| Chemicals - 0.0% | | | |
| Tronox Blocked Borrower LLC Tranche B, term loan 3 month U.S. LIBOR + 3.000% 4.3231% 9/22/24 (b)(c) | | 142,093 | 142,904 |
| Tronox Finance LLC Tranche B, term loan 3 month U.S. LIBOR + 3.000% 4.6934% 9/22/24 (b)(c) | | 327,907 | 329,779 |
|
| TOTAL CHEMICALS | | | 472,683 |
|
| Containers - 0.4% | | | |
| Reynolds Group Holdings, Inc. Tranche B, term loan 3 month U.S. LIBOR + 2.750% 4.319% 2/5/23 (b)(c) | | 3,801,971 | 3,817,749 |
| Diversified Financial Services - 0.2% | | | |
| IBC Capital U.S. LLC: | | | |
| Tranche 2LN, term loan 3 month U.S. LIBOR + 7.000% 8.5361% 9/9/22 (b)(c) | | 1,575,000 | 1,539,563 |
| Tranche B 1LN, term loan 3 month U.S. LIBOR + 3.750% 5.2861% 9/10/21 (b)(c) | | 389,000 | 388,417 |
|
| TOTAL DIVERSIFIED FINANCIAL SERVICES | | | 1,927,980 |
|
| Energy - 0.2% | | | |
| California Resources Corp. Tranche B, term loan 3 month U.S. LIBOR + 4.750% 6.2408% 11/17/22 (b)(c) | | 1,020,000 | 1,014,900 |
| Forbes Energy Services LLC Tranche B, term loan 12% 4/13/21 (b)(e) | | 1,438,906 | 1,449,697 |
|
| TOTAL ENERGY | | | 2,464,597 |
|
| Entertainment/Film - 0.2% | | | |
| AMC Entertainment, Inc. Tranche B, term loan 3 month U.S. LIBOR + 2.250% 3.727% 12/15/22 (b)(c) | | 1,835,318 | 1,841,356 |
| Environmental - 0.1% | | | |
| Hd Supply Waterworks Ltd. Tranche B, term loan 3 month U.S. LIBOR + 3.000% 4.455% 8/1/24 (b)(c) | | 935,000 | 941,433 |
| Food & Drug Retail - 0.0% | | | |
| Albertson's LLC Tranche B, term loan 3 month U.S. LIBOR + 3.000% 4.4623% 6/22/23 (b)(c) | | 517,997 | 506,772 |
| Food/Beverage/Tobacco - 0.1% | | | |
| Post Holdings, Inc. Tranche B, term loan 3 month U.S. LIBOR + 2.250% 3.82% 5/24/24 (b)(c) | | 507,450 | 508,993 |
| Gaming - 0.7% | | | |
| CityCenter Holdings LLC Tranche B, term loan 3 month U.S. LIBOR + 2.500% 3.8498% 4/18/24 (b)(c) | | 1,920,350 | 1,928,031 |
| Golden Entertainment, Inc. Tranche B, term loan: | | | |
| 3 month U.S. LIBOR + 3.000% 4.51% 10/20/24 (b)(c) | | 3,085,000 | 3,087,561 |
| 3 month U.S. LIBOR + 7.000% 8.51% 10/20/25 (b)(c) | | 1,025,000 | 1,031,406 |
| Scientific Games Corp. Tranche B, term loan 3 month U.S. LIBOR + 3.250% 4.704% 8/14/24 (b)(c) | | 832,913 | 839,159 |
|
| TOTAL GAMING | | | 6,886,157 |
|
| Insurance - 0.2% | | | |
| Acrisure LLC Tranche B, term loan 3 month U.S. LIBOR + 4.250% 5.6473% 11/22/23 (b)(c) | | 19,950 | 20,125 |
| USI, Inc. Tranche B, term loan 3 month U.S. LIBOR + 3.000% 4.3498% 5/16/24 (b)(c) | | 2,398,988 | 2,393,998 |
|
| TOTAL INSURANCE | | | 2,414,123 |
|
| Publishing/Printing - 0.2% | | | |
| Springer Science+Business Media Deutschland GmbH Tranche B 13LN, term loan 3 month U.S. LIBOR + 3.500% 4.9788% 8/15/22 (b)(c) | | 1,566,171 | 1,569,648 |
| Services - 0.7% | | | |
| Almonde, Inc.: | | | |
| Tranche 2LN, term loan 3 month U.S. LIBOR + 7.250% 8.7288% 6/13/25 (b)(c) | | 130,000 | 130,033 |
| Tranche B 1LN, term loan 3 month U.S. LIBOR + 3.500% 4.9788% 6/13/24 (b)(c) | | 593,512 | 594,955 |
| Aramark Services, Inc. Tranche B-1, term loan 3 month U.S. LIBOR + 2.000% 3.569% 3/7/25 (b)(c) | | 795,000 | 795,000 |
| Brand Energy & Infrastructure Services, Inc. Tranche B, term loan 3 month U.S. LIBOR + 4.250% 5.615% 6/21/24 (b)(c) | | 3,348,175 | 3,359,057 |
| Lineage Logistics Holdings, LLC. Tranche B, term loan 3 month U.S. LIBOR + 3.500% 5.069% 4/7/21 (b)(c) | | 2,604,662 | 2,610,366 |
|
| TOTAL SERVICES | | | 7,489,411 |
|
| Super Retail - 0.4% | | | |
| Red Ventures LLC: | | | |
| Tranche 2LN, term loan 3 month U.S. LIBOR + 8.000% 9.569% 11/8/25 (b)(c) | | 743,125 | 740,806 |
| Tranche B 1LN, term loan 3 month U.S. LIBOR + 4.000% 5.569% 11/8/24 (b)(c) | | 3,072,300 | 3,066,923 |
|
| TOTAL SUPER RETAIL | | | 3,807,729 |
|
| Technology - 1.9% | | | |
| Ceridian HCM Holding, Inc. Tranche B 2LN, term loan 3 month U.S. LIBOR + 3.500% 5.0521% 9/15/20 (b)(c) | | 2,208,000 | 2,212,593 |
| Epicor Software Corp. Tranche B, term loan 3 month U.S. LIBOR + 3.750% 5.1% 6/1/22 (b)(c) | | 2,043,592 | 2,047,250 |
| Go Daddy Operating Co. LLC Tranche B, term loan 3 month U.S. LIBOR + 2.250% 3.5998% 2/15/24 (b)(c) | | 2,821,183 | 2,826,966 |
| Kronos, Inc. Tranche B 1LN, term loan 3 month U.S. LIBOR + 3.500% 4.9026% 11/1/23 (b)(c) | | 4,143,228 | 4,168,875 |
| Landesk Group, Inc. term loan: | | | |
| 3 month U.S. LIBOR + 4.250% 5.82% 1/20/24 (b)(c) | | 1,262,902 | 1,198,569 |
| 3 month U.S. LIBOR + 9.000% 10.57% 1/20/25 (b)(c) | | 830,000 | 790,575 |
| Uber Technologies, Inc. Tranche B, term loan 3 month U.S. LIBOR + 4.000% 5.5521% 7/13/23 (b)(c) | | 6,744,625 | 6,776,662 |
|
| TOTAL TECHNOLOGY | | | 20,021,490 |
|
| Telecommunications - 1.6% | | | |
| Altice Financing SA Tranche B, term loan: | | | |
| 3 month U.S. LIBOR + 2.750% 4.1092% 7/15/25 (b)(c) | | 1,009,925 | 987,919 |
| 3 month U.S. LIBOR + 2.750% 4.1119% 1/31/26 (b)(c) | | 2,100,000 | 2,053,800 |
| Level 3 Financing, Inc. Tranche B, term loan 3 month U.S. LIBOR + 2.250% 3.6959% 2/22/24 (b)(c) | | 2,490,000 | 2,490,000 |
| Radiate Holdco LLC Tranche B, term loan 3 month U.S. LIBOR + 3.000% 4.569% 2/1/24 (b)(c) | | 3,037,050 | 3,011,569 |
| Securus Technologies, Inc. Tranche B, term loan: | | | |
| 3 month U.S. LIBOR + 4.500% 5.8498% 11/1/24 (b)(c) | | 3,360,000 | 3,391,517 |
| 3 month U.S. LIBOR + 8.250% 9.5998% 11/1/25 (b)(c) | | 1,120,000 | 1,129,453 |
| SFR Group SA Tranche B 11LN, term loan 3 month U.S. LIBOR + 2.750% 4.1301% 7/31/25 (b)(c) | | 3,019,825 | 2,879,403 |
| Sprint Communications, Inc. Tranche B, term loan 3 month U.S. LIBOR + 2.250% 4.125% 2/3/24 (b)(c) | | 858,513 | 857,869 |
|
| TOTAL TELECOMMUNICATIONS | | | 16,801,530 |
|
| Utilities - 0.3% | | | |
| Exgen Renewables Iv LLC Tranche B, term loan 3 month U.S. LIBOR + 3.000% 4.4676% 11/16/24 (b)(c) | | 810,000 | 818,100 |
| The AES Corp. Tranche B, term loan 3 month U.S. LIBOR + 2.000% 3.454% 5/24/22 (b)(c) | | 2,451,475 | 2,455,569 |
|
| TOTAL UTILITIES | | | 3,273,669 |
|
| TOTAL BANK LOAN OBLIGATIONS | | | |
| (Cost $98,388,423) | | | 98,608,700 |
|
| Preferred Securities - 3.2% | | | |
| Banks & Thrifts - 3.0% | | | |
| Bank of America Corp. 6.25% (b)(f) | | 1,550,000 | 1,744,406 |
| Barclays Bank PLC 7.625% 11/21/22 | | 4,085,000 | 4,661,541 |
| Barclays PLC 6.625% (b)(f) | | 2,260,000 | 2,326,395 |
| Citigroup, Inc.: | | | |
| 5.95% (b)(f) | | 1,775,000 | 1,894,767 |
| 5.95% (b)(f) | | 2,590,000 | 2,778,358 |
| Credit Agricole SA: | | | |
| 6.625% (a)(b)(f) | | 4,325,000 | 4,494,351 |
| 7.875% (a)(b)(f) | | 2,125,000 | 2,408,090 |
| Goldman Sachs Group, Inc. 5% (b)(f) | | 4,495,000 | 4,460,962 |
| JPMorgan Chase & Co. 5.3% (b)(f) | | 840,000 | 878,666 |
| Royal Bank of Scotland Group PLC: | | | |
| 7.5% (b)(f) | | 3,080,000 | 3,258,383 |
| 8.625% (b)(f) | | 2,065,000 | 2,326,696 |
|
| TOTAL BANKS & THRIFTS | | | 31,232,615 |
|
| Energy - 0.2% | | | |
| Andeavor Logistics LP 6.875% (b)(f) | | 2,630,000 | 2,681,638 |
| TOTAL PREFERRED SECURITIES | | | |
| (Cost $31,680,347) | | | 33,914,253 |
| | | Shares | Value |
|
| Money Market Funds - 1.3% | | | |
| Fidelity Cash Central Fund, 1.36% (g) | | | |
| (Cost $13,462,087) | | 13,460,215 | 13,462,907 |
| TOTAL INVESTMENT IN SECURITIES - 98.5% | | | |
| (Cost $1,018,780,019) | | | 1,031,931,891 |
| NET OTHER ASSETS (LIABILITIES) - 1.5% | | | 15,617,360 |
| NET ASSETS - 100% | | | $1,047,549,251 |
Legend
(a) Security exempt from registration under Rule 144A of the Securities Act of 1933. These securities may be resold in transactions exempt from registration, normally to qualified institutional buyers. At the end of the period, the value of these securities amounted to $499,782,012 or 47.7% of net assets.
(b) Coupon rates for floating and adjustable rate securities reflect the rates in effect at period end.
(c) Coupon is indexed to a floating interest rate which may be multiplied by a specified factor and/or subject to caps or floors.
(d) Non-income producing
(e) Level 3 security
(f) Security is perpetual in nature with no stated maturity date.
(g) Affiliated fund that is generally available only to investment companies and other accounts managed by Fidelity Investments. The rate quoted is the annualized seven-day yield of the fund at period end. A complete unaudited listing of the fund's holdings as of its most recent quarter end is available upon request. In addition, each Fidelity Central Fund's financial statements, which are not covered by the Fund's Report of Independent Registered Public Accounting Firm, are available on the SEC's website or upon request.
Affiliated Central Funds
Information regarding fiscal year to date income earned by the Fund from investments in Fidelity Central Funds is as follows:
| Fund | Income earned |
| Fidelity Cash Central Fund | $451,176 |
| Total | $451,176 |
Amounts in the income column in the above table include any capital gain distributions from underlying funds, which are presented in the corresponding line-item in the Statement of Operations if applicable.
Investment Valuation
The following is a summary of the inputs used, as of December 31, 2017, involving the Fund's assets and liabilities carried at fair value. The inputs or methodology used for valuing securities may not be an indication of the risk associated with investing in those securities. For more information on valuation inputs, and their aggregation into the levels used below, please refer to the Investment Valuation section in the accompanying Notes to Financial Statements.
| | Valuation Inputs at Reporting Date: |
| Description | Total | Level 1 | Level 2 | Level 3 |
| Investments in Securities: | | | | |
| Equities: | | | | |
| Energy | $3,578,646 | $1,804,622 | $1,774,024 | $-- |
| Telecommunication Services | 35,011 | -- | -- | 35,011 |
| Corporate Bonds | 882,332,374 | -- | 882,332,374 | -- |
| Bank Loan Obligations | 98,608,700 | -- | 97,159,003 | 1,449,697 |
| Preferred Securities | 33,914,253 | -- | 33,914,253 | -- |
| Money Market Funds | 13,462,907 | 13,462,907 | -- | -- |
| Total Investments in Securities: | $1,031,931,891 | $15,267,529 | $1,015,179,654 | $1,484,708 |
Other Information
Distribution of investments by country or territory of incorporation, as a percentage of Total Net Assets, is as follows (Unaudited):
| United States of America | 76.7% |
| Canada | 5.7% |
| Luxembourg | 4.3% |
| Netherlands | 3.3% |
| United Kingdom | 2.8% |
| France | 1.4% |
| Cayman Islands | 1.3% |
| Multi-National | 1.0% |
| Others (Individually Less Than 1%) | 3.5% |
| | 100.0% |
See accompanying notes which are an integral part of the financial statements.
Financial Statements
Statement of Assets and Liabilities
| | | December 31, 2017 |
| Assets | | |
Investment in securities, at value — See accompanying schedule:
Unaffiliated issuers (cost $1,005,317,932) | $1,018,468,984 | |
| Fidelity Central Funds (cost $13,462,087) | 13,462,907 | |
| Total Investment in Securities (cost $1,018,780,019) | | $1,031,931,891 |
| Cash | | 2,813 |
| Receivable for investments sold | | 3,148,361 |
| Receivable for fund shares sold | | 441,824 |
| Dividends receivable | | 116,406 |
| Interest receivable | | 13,194,351 |
| Distributions receivable from Fidelity Central Funds | | 18,976 |
| Prepaid expenses | | 2,004 |
| Total assets | | 1,048,856,626 |
| Liabilities | | |
| Payable for investments purchased | $290,575 | |
| Payable for fund shares redeemed | 295,507 | |
| Accrued management fee | 485,759 | |
| Transfer agent fee payable | 72,277 | |
| Distribution and service plan fees payable | 40,449 | |
| Other affiliated payables | 31,539 | |
| Audit fee payable | 85,909 | |
| Other payables and accrued expenses | 5,360 | |
| Total liabilities | | 1,307,375 |
| Net Assets | | $1,047,549,251 |
| Net Assets consist of: | | |
| Paid in capital | | $1,076,603,654 |
| Undistributed net investment income | | 13,466,962 |
| Accumulated undistributed net realized gain (loss) on investments | | (55,673,237) |
| Net unrealized appreciation (depreciation) on investments | | 13,151,872 |
| Net Assets | | $1,047,549,251 |
| Initial Class: | | |
| Net Asset Value, offering price and redemption price per share ($355,469,422 ÷ 65,146,154 shares) | | $5.46 |
| Service Class: | | |
| Net Asset Value, offering price and redemption price per share ($68,103,846 ÷ 12,570,905 shares) | | $5.42 |
| Service Class 2: | | |
| Net Asset Value, offering price and redemption price per share ($166,992,725 ÷ 31,697,287 shares) | | $5.27 |
| Investor Class: | | |
| Net Asset Value, offering price and redemption price per share ($456,983,258 ÷ 84,162,809 shares) | | $5.43 |
See accompanying notes which are an integral part of the financial statements.
Statement of Operations
| | | Year ended December 31, 2017 |
| Investment Income | | |
| Dividends | | $3,387,832 |
| Interest | | 64,736,737 |
| Income from Fidelity Central Funds | | 451,176 |
| Total income | | 68,575,745 |
| Expenses | | |
| Management fee | $6,498,518 | |
| Transfer agent fees | 953,072 | |
| Distribution and service plan fees | 556,087 | |
| Accounting fees and expenses | 407,587 | |
| Custodian fees and expenses | 23,303 | |
| Independent trustees' fees and expenses | 4,723 | |
| Audit | 101,346 | |
| Legal | 4,303 | |
| Miscellaneous | 9,919 | |
| Total expenses before reductions | 8,558,858 | |
| Expense reductions | (17,373) | 8,541,485 |
| Net investment income (loss) | | 60,034,260 |
| Realized and Unrealized Gain (Loss) | | |
| Net realized gain (loss) on: | | |
| Investment securities: | | |
| Unaffiliated issuers | 29,009,801 | |
| Fidelity Central Funds | 2,236 | |
| Total net realized gain (loss) | | 29,012,037 |
| Change in net unrealized appreciation (depreciation) on: | | |
| Investment securities: | | |
| Unaffiliated issuers | (9,941,867) | |
| Fidelity Central Funds | (2,236) | |
| Total change in net unrealized appreciation (depreciation) | | (9,944,103) |
| Net gain (loss) | | 19,067,934 |
| Net increase (decrease) in net assets resulting from operations | | $79,102,194 |
See accompanying notes which are an integral part of the financial statements.
Statement of Changes in Net Assets
| | Year ended December 31, 2017 | Year ended December 31, 2016 |
| Increase (Decrease) in Net Assets | | |
| Operations | | |
| Net investment income (loss) | $60,034,260 | $70,010,377 |
| Net realized gain (loss) | 29,012,037 | (52,044,970) |
| Change in net unrealized appreciation (depreciation) | (9,944,103) | 143,352,250 |
| Net increase (decrease) in net assets resulting from operations | 79,102,194 | 161,317,657 |
| Distributions to shareholders from net investment income | (56,233,439) | (61,629,096) |
| Share transactions - net increase (decrease) | (176,795,452) | 31,318,507 |
| Total increase (decrease) in net assets | (153,926,697) | 131,007,068 |
| Net Assets | | |
| Beginning of period | 1,201,475,948 | 1,070,468,880 |
| End of period | $1,047,549,251 | $1,201,475,948 |
| Other Information | | |
| Undistributed net investment income end of period | $13,466,962 | $10,333,686 |
See accompanying notes which are an integral part of the financial statements.
Financial Highlights
VIP High Income Portfolio Initial Class
| Years ended December 31, | 2017 | 2016 | 2015 | 2014 | 2013 |
| Selected Per–Share Data | | | | | |
| Net asset value, beginning of period | $5.38 | $4.95 | $5.52 | $5.80 | $5.81 |
| Income from Investment Operations | | | | | |
| Net investment income (loss)A | .290 | .320 | .333 | .317 | .330 |
| Net realized and unrealized gain (loss) | .091 | .402 | (.531) | (.251) | .014 |
| Total from investment operations | .381 | .722 | (.198) | .066 | .344 |
| Distributions from net investment income | (.301) | (.292) | (.364) | (.347) | (.354) |
| Tax return of capital | – | – | (.008) | – | – |
| Total distributions | (.301) | (.292) | (.372) | (.347) | (.354) |
| Redemption fees added to paid in capitalA | – | – | –B | .001 | –B |
| Net asset value, end of period | $5.46 | $5.38 | $4.95 | $5.52 | $5.80 |
| Total ReturnC,D | 7.13% | 14.61% | (3.63)% | 1.16% | 5.95% |
| Ratios to Average Net AssetsE,F | | | | | |
| Expenses before reductions | .67% | .68% | .68% | .68% | .68% |
| Expenses net of fee waivers, if any | .67% | .68% | .68% | .68% | .68% |
| Expenses net of all reductions | .67% | .68% | .68% | .68% | .68% |
| Net investment income (loss) | 5.22% | 6.05% | 5.94% | 5.31% | 5.55% |
| Supplemental Data | | | | | |
| Net assets, end of period (000 omitted) | $355,469 | $457,620 | $437,798 | $493,390 | $587,376 |
| Portfolio turnover rateG | 70% | 73% | 69% | 79% | 85% |
A Calculated based on average shares outstanding during the period.
B Amount represents less than $.0005 per share.
C Total returns do not reflect charges attributable to your insurance company's separate account. Inclusion of these charges would reduce the total returns shown.
D Total returns would have been lower if certain expenses had not been reduced during the applicable periods shown.
E Fees and expenses of any underlying Fidelity Central Funds are not included in the Fund's expense ratio. The Fund indirectly bears its proportionate share of the expenses of any underlying Fidelity Central Funds.
F Expense ratios reflect operating expenses of the class. Expenses before reductions do not reflect amounts reimbursed by the investment adviser or reductions from brokerage service arrangements or reductions from other expense offset arrangements and do not represent the amount paid by the class during periods when reimbursements or reductions occur. Expenses net of fee waivers reflect expenses after reimbursement by the investment adviser but prior to reductions from brokerage service arrangements or other expense offset arrangements. Expenses net of all reductions represent the net expenses paid by the class.
G Amount does not include the portfolio activity of any underlying Fidelity Central Funds.
See accompanying notes which are an integral part of the financial statements.
VIP High Income Portfolio Service Class
| Years ended December 31, | 2017 | 2016 | 2015 | 2014 | 2013 |
| Selected Per–Share Data | | | | | |
| Net asset value, beginning of period | $5.34 | $4.92 | $5.49 | $5.77 | $5.78 |
| Income from Investment Operations | | | | | |
| Net investment income (loss)A | .283 | .311 | .324 | .309 | .323 |
| Net realized and unrealized gain (loss) | .092 | .395 | (.528) | (.248) | .015 |
| Total from investment operations | .375 | .706 | (.204) | .061 | .338 |
| Distributions from net investment income | (.295) | (.286) | (.358) | (.342) | (.348) |
| Tax return of capital | – | – | (.008) | – | – |
| Total distributions | (.295) | (.286) | (.366) | (.342) | (.348) |
| Redemption fees added to paid in capitalA | – | – | –B | .001 | –B |
| Net asset value, end of period | $5.42 | $5.34 | $4.92 | $5.49 | $5.77 |
| Total ReturnC,D | 7.07% | 14.37% | (3.76)% | 1.07% | 5.87% |
| Ratios to Average Net AssetsE,F | | | | | |
| Expenses before reductions | .77% | .78% | .78% | .78% | .78% |
| Expenses net of fee waivers, if any | .77% | .78% | .78% | .78% | .77% |
| Expenses net of all reductions | .77% | .78% | .77% | .78% | .77% |
| Net investment income (loss) | 5.12% | 5.95% | 5.84% | 5.22% | 5.46% |
| Supplemental Data | | | | | |
| Net assets, end of period (000 omitted) | $68,104 | $84,945 | $73,313 | $59,961 | $68,982 |
| Portfolio turnover rateG | 70% | 73% | 69% | 79% | 85% |
A Calculated based on average shares outstanding during the period.
B Amount represents less than $.0005 per share.
C Total returns do not reflect charges attributable to your insurance company's separate account. Inclusion of these charges would reduce the total returns shown.
D Total returns would have been lower if certain expenses had not been reduced during the applicable periods shown.
E Fees and expenses of any underlying Fidelity Central Funds are not included in the Fund's expense ratio. The Fund indirectly bears its proportionate share of the expenses of any underlying Fidelity Central Funds.
F Expense ratios reflect operating expenses of the class. Expenses before reductions do not reflect amounts reimbursed by the investment adviser or reductions from brokerage service arrangements or reductions from other expense offset arrangements and do not represent the amount paid by the class during periods when reimbursements or reductions occur. Expenses net of fee waivers reflect expenses after reimbursement by the investment adviser but prior to reductions from brokerage service arrangements or other expense offset arrangements. Expenses net of all reductions represent the net expenses paid by the class.
G Amount does not include the portfolio activity of any underlying Fidelity Central Funds.
See accompanying notes which are an integral part of the financial statements.
VIP High Income Portfolio Service Class 2
| Years ended December 31, | 2017 | 2016 | 2015 | 2014 | 2013 |
| Selected Per–Share Data | | | | | |
| Net asset value, beginning of period | $5.20 | $4.80 | $5.36 | $5.64 | $5.66 |
| Income from Investment Operations | | | | | |
| Net investment income (loss)A | .267 | .296 | .309 | .294 | .307 |
| Net realized and unrealized gain (loss) | .090 | .383 | (.514) | (.244) | .014 |
| Total from investment operations | .357 | .679 | (.205) | .050 | .321 |
| Distributions from net investment income | (.287) | (.279) | (.347) | (.331) | (.341) |
| Tax return of capital | – | – | (.008) | – | – |
| Total distributions | (.287) | (.279) | (.355) | (.331) | (.341) |
| Redemption fees added to paid in capitalA | – | – | –B | .001 | –B |
| Net asset value, end of period | $5.27 | $5.20 | $4.80 | $5.36 | $5.64 |
| Total ReturnC,D | 6.91% | 14.17% | (3.87)% | .90% | 5.70% |
| Ratios to Average Net AssetsE,F | | | | | |
| Expenses before reductions | .92% | .93% | .93% | .93% | .93% |
| Expenses net of fee waivers, if any | .92% | .93% | .93% | .93% | .92% |
| Expenses net of all reductions | .92% | .93% | .93% | .93% | .92% |
| Net investment income (loss) | 4.97% | 5.80% | 5.68% | 5.06% | 5.31% |
| Supplemental Data | | | | | |
| Net assets, end of period (000 omitted) | $166,993 | $189,179 | $160,639 | $190,873 | $280,444 |
| Portfolio turnover rateG | 70% | 73% | 69% | 79% | 85% |
A Calculated based on average shares outstanding during the period.
B Amount represents less than $.0005 per share.
C Total returns do not reflect charges attributable to your insurance company's separate account. Inclusion of these charges would reduce the total returns shown.
D Total returns would have been lower if certain expenses had not been reduced during the applicable periods shown.
E Fees and expenses of any underlying Fidelity Central Funds are not included in the Fund's expense ratio. The Fund indirectly bears its proportionate share of the expenses of any underlying Fidelity Central Funds.
F Expense ratios reflect operating expenses of the class. Expenses before reductions do not reflect amounts reimbursed by the investment adviser or reductions from brokerage service arrangements or reductions from other expense offset arrangements and do not represent the amount paid by the class during periods when reimbursements or reductions occur. Expenses net of fee waivers reflect expenses after reimbursement by the investment adviser but prior to reductions from brokerage service arrangements or other expense offset arrangements. Expenses net of all reductions represent the net expenses paid by the class.
G Amount does not include the portfolio activity of any underlying Fidelity Central Funds.
See accompanying notes which are an integral part of the financial statements.
VIP High Income Portfolio Investor Class
| Years ended December 31, | 2017 | 2016 | 2015 | 2014 | 2013 |
| Selected Per–Share Data | | | | | |
| Net asset value, beginning of period | $5.36 | $4.93 | $5.50 | $5.78 | $5.79 |
| Income from Investment Operations | | | | | |
| Net investment income (loss)A | .287 | .317 | .329 | .314 | .327 |
| Net realized and unrealized gain (loss) | .083 | .403 | (.529) | (.250) | .016 |
| Total from investment operations | .370 | .720 | (.200) | .064 | .343 |
| Distributions from net investment income | (.300) | (.290) | (.362) | (.345) | (.353) |
| Tax return of capital | – | – | (.008) | – | – |
| Total distributions | (.300) | (.290) | (.370) | (.345) | (.353) |
| Redemption fees added to paid in capitalA | – | – | –B | .001 | –B |
| Net asset value, end of period | $5.43 | $5.36 | $4.93 | $5.50 | $5.78 |
| Total ReturnC,D | 6.95% | 14.64% | (3.68)% | 1.12% | 5.95% |
| Ratios to Average Net AssetsE,F | | | | | |
| Expenses before reductions | .71% | .71% | .71% | .71% | .71% |
| Expenses net of fee waivers, if any | .71% | .71% | .71% | .71% | .71% |
| Expenses net of all reductions | .71% | .71% | .71% | .71% | .71% |
| Net investment income (loss) | 5.18% | 6.02% | 5.90% | 5.28% | 5.52% |
| Supplemental Data | | | | | |
| Net assets, end of period (000 omitted) | $456,983 | $469,732 | $398,719 | $448,590 | $499,630 |
| Portfolio turnover rateG | 70% | 73% | 69% | 79% | 85% |
A Calculated based on average shares outstanding during the period.
B Amount represents less than $.0005 per share.
C Total returns do not reflect charges attributable to your insurance company's separate account. Inclusion of these charges would reduce the total returns shown.
D Total returns would have been lower if certain expenses had not been reduced during the applicable periods shown.
E Fees and expenses of any underlying Fidelity Central Funds are not included in the Fund's expense ratio. The Fund indirectly bears its proportionate share of the expenses of any underlying Fidelity Central Funds.
F Expense ratios reflect operating expenses of the class. Expenses before reductions do not reflect amounts reimbursed by the investment adviser or reductions from brokerage service arrangements or reductions from other expense offset arrangements and do not represent the amount paid by the class during periods when reimbursements or reductions occur. Expenses net of fee waivers reflect expenses after reimbursement by the investment adviser but prior to reductions from brokerage service arrangements or other expense offset arrangements. Expenses net of all reductions represent the net expenses paid by the class.
G Amount does not include the portfolio activity of any underlying Fidelity Central Funds.
See accompanying notes which are an integral part of the financial statements.
Notes to Financial Statements
For the period ended December 31, 2017
1. Organization.
VIP High Income Portfolio (the Fund) is a fund of Variable Insurance Products Fund (the Trust) and is authorized to issue an unlimited number of shares. The Trust is registered under the Investment Company Act of 1940, as amended (the 1940 Act), as an open-end management investment company organized as a Massachusetts business trust. Shares of the Fund may only be purchased by insurance companies for the purpose of funding variable annuity or variable life insurance contracts. The Fund offers the following classes of shares: Initial Class shares, Service Class shares, Service Class 2 shares and Investor Class shares. All classes have equal rights and voting privileges, except for matters affecting a single class.
2. Investments in Fidelity Central Funds.
The Fund invests in Fidelity Central Funds, which are open-end investment companies generally available only to other investment companies and accounts managed by the investment adviser and its affiliates. The Fund's Schedule of Investments lists each of the Fidelity Central Funds held as of period end, if any, as an investment of the Fund, but does not include the underlying holdings of each Fidelity Central Fund. As an Investing Fund, the Fund indirectly bears its proportionate share of the expenses of the underlying Fidelity Central Funds.
The Money Market Central Funds seek preservation of capital and current income and are managed by Fidelity Investments Money Management, Inc. (FIMM), an affiliate of the investment adviser. Annualized expenses of the Money Market Central Funds as of their most recent shareholder report date are less than .005%.
A complete unaudited list of holdings for each Fidelity Central Fund is available upon request or at the Securities and Exchange Commission (the SEC) website at www.sec.gov. In addition, the financial statements of the Fidelity Central Funds, which are not covered by the Fund's Report of Independent Registered Public Accounting Firm, are available on the SEC website or upon request.
3. Significant Accounting Policies.
The Fund is an investment company and applies the accounting and reporting guidance of the Financial Accounting Standards Board (FASB) Accounting Standards Codification Topic 946 Financial Services – Investments Companies. The financial statements have been prepared in conformity with accounting principles generally accepted in the United States of America (GAAP), which require management to make certain estimates and assumptions at the date of the financial statements. Actual results could differ from those estimates. Subsequent events, if any, through the date that the financial statements were issued have been evaluated in the preparation of the financial statements. The following summarizes the significant accounting policies of the Fund:
Investment Valuation. Investments are valued as of 4:00 p.m. Eastern time on the last calendar day of the period. The Board of Trustees (the Board) has delegated the day to day responsibility for the valuation of the Fund's investments to the Fair Value Committee (the Committee) established by the Fund's investment adviser. In accordance with valuation policies and procedures approved by the Board, the Fund attempts to obtain prices from one or more third party pricing vendors or brokers to value its investments. When current market prices, quotations or currency exchange rates are not readily available or reliable, investments will be fair valued in good faith by the Committee, in accordance with procedures adopted by the Board. Factors used in determining fair value vary by investment type and may include market or investment specific events, changes in interest rates and credit quality. The frequency with which these procedures are used cannot be predicted and they may be utilized to a significant extent. The Committee oversees the Fund's valuation policies and procedures and reports to the Board on the Committee's activities and fair value determinations. The Board monitors the appropriateness of the procedures used in valuing the Fund's investments and ratifies the fair value determinations of the Committee.
The Fund categorizes the inputs to valuation techniques used to value its investments into a disclosure hierarchy consisting of three levels as shown below:
- Level 1 – quoted prices in active markets for identical investments
- Level 2 – other significant observable inputs (including quoted prices for similar investments, interest rates, prepayment speeds, etc.)
- Level 3 – unobservable inputs (including the Fund's own assumptions based on the best information available)
Valuation techniques used to value the Fund's investments by major category are as follows:
Debt securities, including restricted securities, are valued based on evaluated prices received from third party pricing vendors or from brokers who make markets in such securities. Corporate bonds, bank loan obligations and preferred securities are valued by pricing vendors who utilize matrix pricing which considers yield or price of bonds of comparable quality, coupon, maturity and type or by broker-supplied prices. When independent prices are unavailable or unreliable, debt securities may be valued utilizing pricing methodologies which consider similar factors that would be used by third party pricing vendors. Debt securities are generally categorized as Level 2 in the hierarchy but may be Level 3 depending on the circumstances. The Fund invests a significant portion of its assets in below investment grade securities. The value of these securities can be more volatile due to changes in the credit quality of the issuer and is sensitive to changes in economic, market and regulatory conditions.
Equity securities, including restricted securities, for which market quotations are readily available, are valued at the last reported sale price or official closing price as reported by a third party pricing vendor on the primary market or exchange on which they are traded and are categorized as Level 1 in the hierarchy. In the event there were no sales during the day or closing prices are not available, securities are valued at the last quoted bid price or may be valued using the last available price and are generally categorized as Level 2 in the hierarchy. Utilizing these techniques may result in transfers between Level 1 and Level 2. For equity securities, including restricted securities, where observable inputs are limited, assumptions about market activity and risk are used and these securities may be categorized as Level 3 in the hierarchy.
Investments in open-end mutual funds, including the Fidelity Central Funds, are valued at their closing net asset value (NAV) each business day and are categorized as Level 1 in the hierarchy.
Changes in valuation techniques may result in transfers in or out of an assigned level within the disclosure hierarchy. The aggregate value of investments by input level as of December 31, 2017 is included at the end of the Fund's Schedule of Investments.
Investment Transactions and Income. For financial reporting purposes, the Fund's investment holdings and NAV include trades executed through the end of the last business day of the period. The NAV per share for processing shareholder transactions is calculated as of the close of business of the New York Stock Exchange (NYSE), normally 4:00 p.m. Eastern time and includes trades executed through the end of the prior business day. Gains and losses on securities sold are determined on the basis of identified cost and includes proceeds received from litigation. Dividend income is recorded on the ex-dividend date, except for certain dividends from foreign securities where the ex-dividend date may have passed, which are recorded as soon as the Fund is informed of the ex-dividend date. Non-cash dividends included in dividend income, if any, are recorded at the fair market value of the securities received. Income and capital gain distributions from Fidelity Central Funds, if any, are recorded on the ex-dividend date. Interest income is accrued as earned and includes coupon interest and amortization of premium and accretion of discount on debt securities as applicable. Paid in Kind (PIK) income is recorded at the fair market value of the securities received. Debt obligations may be placed on non-accrual status and related interest income may be reduced by ceasing current accruals and writing off interest receivables when the collection of all or a portion of interest has become doubtful based on consistently applied procedures. A debt obligation is removed from non-accrual status when the issuer resumes interest payments or when collectability of interest is reasonably assured.
Class Allocations and Expenses. Investment income, realized and unrealized capital gains and losses, common expenses of the Fund, and certain fund-level expense reductions, if any, are allocated daily on a pro-rata basis to each class based on the relative net assets of each class to the total net assets of the Fund. Each class differs with respect to transfer agent and distribution and service plan fees incurred. Certain expense reductions may also differ by class. For the reporting period, the allocated portion of income and expenses to each class as a percent of its average net assets may vary due to the timing of recording these transactions in relation to fluctuating net assets of the classes. Expenses directly attributable to a fund are charged to that fund. Expenses attributable to more than one fund are allocated among the respective funds on the basis of relative net assets or other appropriate methods. Expense estimates are accrued in the period to which they relate and adjustments are made when actual amounts are known.
Income Tax Information and Distributions to Shareholders. Each year, the Fund intends to qualify as a regulated investment company under Subchapter M of the Internal Revenue Code, including distributing substantially all of its taxable income and realized gains. As a result, no provision for U.S. Federal income taxes is required. As of December 31, 2017, the Fund did not have any unrecognized tax benefits in the financial statements; nor is the Fund aware of any tax positions for which it is reasonably possible that the total amounts of unrecognized tax benefits will significantly change in the next twelve months. The Fund files a U.S. federal tax return, in addition to state and local tax returns as required. The Fund's federal income tax returns are subject to examination by the Internal Revenue Service (IRS) for a period of three fiscal years after they are filed. State and local tax returns may be subject to examination for an additional fiscal year depending on the jurisdiction.
Distributions are declared and recorded on the ex-dividend date. Income dividends and capital gain distributions are declared separately for each class. Income and capital gain distributions are determined in accordance with income tax regulations, which may differ from GAAP.
Capital accounts within the financial statements are adjusted for permanent book-tax differences. These adjustments have no impact on net assets or the results of operations. Capital accounts are not adjusted for temporary book-tax differences which will reverse in a subsequent period.
Book-tax differences are primarily due to market discount, deferred trustees compensation, capital loss carryforwards, defaulted bonds, expiring capital loss carryforwards and losses deferred due to wash sales.
As of period end, the cost and unrealized appreciation (depreciation) in securities, and derivatives if applicable, for federal income tax purposes were as follows:
| Gross unrealized appreciation | $35,773,419 |
| Gross unrealized depreciation | (19,110,833) |
| Net unrealized appreciation (depreciation) | $16,662,586 |
| Tax Cost | $1,015,269,305 |
The tax-based components of distributable earnings as of period end were as follows:
| Undistributed ordinary income | $9,638,015 |
| Capital loss carryforward | $(55,354,480) |
| Net unrealized appreciation (depreciation) on securities and other investments | $16,662,586 |
Capital loss carryforwards are only available to offset future capital gains of the Fund to the extent provided by regulations and may be limited. Under the Regulated Investment Company Modernization Act of 2010 (the Act), the Fund is permitted to carry forward capital losses incurred in taxable years beginning after December 22, 2010 for an unlimited period and such capital losses are required to be used prior to any losses that expire. The capital loss carryforward information presented below, including any applicable limitation, is estimated as of fiscal period end and is subject to adjustment.
| Fiscal year of expiration | |
| No expiration | |
| Short-term | $(21,646,811) |
| Long-term | (33,707,669) |
| Total capital loss carryforward | $(55,354,480) |
The tax character of distributions paid was as follows:
| | December 31, 2017 | December 31, 2016 |
| Ordinary Income | $56,233,439 | $ 61,629,096 |
Restricted Securities. The Fund may invest in securities that are subject to legal or contractual restrictions on resale. These securities generally may be resold in transactions exempt from registration or to the public if the securities are registered. Disposal of these securities may involve time-consuming negotiations and expense, and prompt sale at an acceptable price may be difficult. Information regarding restricted securities is included at the end of the Fund's Schedule of Investments.
Loans and Other Direct Debt Instruments. The Fund invests in direct debt instruments which are interests in amounts owed to lenders by corporate or other borrowers. These instruments may be in the form of loans, trade claims or other receivables and may include standby financing commitments such as revolving credit facilities that obligate the Fund to supply additional cash to the borrower on demand. Loans may be acquired through assignment or participation. The Fund did not have any unfunded loan commitments, which are contractual obligations for future funding, at period end.
New Accounting Pronouncement. In March 2017, the Financial Accounting Standards Board (FASB) issued an Accounting Standards Update (ASU), ASU 2017-08, which amends the amortization period for certain callable debt securities that are held at a premium. The amendment requires the premium to be amortized to the earliest call date. The amendments do not require an accounting change for securities held at a discount. The ASU is effective for annual periods beginning after December 15, 2018. Management is currently evaluating the potential impact of these changes to the financial statements.
4. Purchases and Sales of Investments.
Purchases and sales of securities, other than short-term securities, aggregated $781,678,353 and $912,390,115, respectively.
5. Fees and Other Transactions with Affiliates.
Management Fee. Fidelity Management & Research Company (the investment adviser) and its affiliates provide the Fund with investment management related services for which the Fund pays a monthly management fee. The management fee is the sum of an individual fund fee rate that is based on an annual rate of .45% of the Fund's average net assets and an annualized group fee rate that averaged .11% during the period. The group fee rate is based upon the average net assets of all the mutual funds advised by the investment adviser, including any mutual funds previously advised by the investment adviser that are currently advised by Fidelity SelectCo, LLC, an affiliate of the investment adviser. The group fee rate decreases as assets under management increase and increases as assets under management decrease. For the reporting period, the total annual management fee rate was .56% of the Fund's average net assets.
Distribution and Service Plan Fees. In accordance with Rule 12b-1 of the 1940 Act, the Fund has adopted separate 12b-1 Plans for each Service Class of shares. Each Service Class pays Fidelity Distributors Corporation (FDC), an affiliate of the investment adviser, a service fee. For the period, the service fee is based on an annual rate of .10% of Service Class' average net assets and .25% of Service Class 2's average net assets.
For the period, total fees, all of which were re-allowed to insurance companies for the distribution of shares and providing shareholder support services, were as follows:
| Service Class | $87,093 |
| Service Class 2 | 468,994 |
| | $556,087 |
Transfer Agent Fees. Fidelity Investments Institutional Operations Company, Inc. (FIIOC), an affiliate of the investment adviser, is the Fund's transfer, dividend disbursing, and shareholder servicing agent. FIIOC receives an asset-based fee with respect to each class. Each class pays a fee for transfer agent services, typesetting and printing and mailing of shareholder reports, excluding mailing of proxy statements, equal to an annual rate of class-level average net assets. The annual rate for Investor Class is .10% and the annual rate for all other classes is .07%. For the period, transfer agent fees for each class were as follows:
| Initial Class | $283,136 |
| Service Class | 59,223 |
| Service Class 2 | 127,566 |
| Investor Class | 483,147 |
| | $953,072 |
Accounting Fees. Fidelity Service Company, Inc. (FSC), an affiliate of the investment adviser, maintains the Fund's accounting records. The fee is based on the level of average net assets for each month.
Interfund Trades. The Fund may purchase from or sell securities to other Fidelity Funds under procedures adopted by the Board. The procedures have been designed to ensure these interfund trades are executed in accordance with Rule 17a-7 of the 1940 Act. Interfund trades are included within the respective purchases and sales amounts shown in the Purchases and Sales of Investments note.
6. Committed Line of Credit.
The Fund participates with other funds managed by the investment adviser or an affiliate in a $4.25 billion credit facility (the "line of credit") to be utilized for temporary or emergency purposes to fund shareholder redemptions or for other short-term liquidity purposes. The Fund has agreed to pay commitment fees on its pro-rata portion of the line of credit, which amounted to $3,814 and is reflected in Miscellaneous expenses on the Statement of Operations. During the period, the Fund did not borrow on this line of credit.
7. Expense Reductions.
Through arrangements with the Fund's custodian, credits realized as a result of certain uninvested cash balances were used to reduce the Fund's expenses. During the period, these credits reduced the Fund's custody expenses by $10,286.
In addition, during the period the investment adviser reimbursed and/or waived a portion of fund-level operating expenses in the amount of $7,087.
8. Distributions to Shareholders.
Distributions to shareholders of each class were as follows:
| | Year ended
December 31, 2017 | Year ended
December 31, 2016 |
| From net investment income | | |
| Initial Class | $19,408,280 | $23,586,857 |
| Service Class | 3,673,597 | 4,321,010 |
| Service Class 2 | 8,815,623 | 9,639,796 |
| Investor Class | 24,335,939 | 24,081,433 |
| Total | $56,233,439 | $61,629,096 |
9. Share Transactions.
Transactions for each class of shares were as follows:
| | Shares | Shares | Dollars | Dollars |
| | Year ended December 31, 2017 | Year ended December 31, 2016 | Year ended December 31, 2017 | Year ended December 31, 2016 |
| Initial Class | | | | |
| Shares sold | 4,812,818 | 9,401,861 | $26,697,768 | $49,415,288 |
| Reinvestment of distributions | 3,567,699 | 4,400,533 | 19,408,280 | 23,586,857 |
| Shares redeemed | (28,297,958) | (17,109,109) | (158,020,104) | (90,347,202) |
| Net increase (decrease) | (19,917,441) | (3,306,715) | $(111,914,056) | $(17,345,057) |
| Service Class | | | | |
| Shares sold | 3,988,619 | 7,556,884 | $22,280,065 | $37,266,654 |
| Reinvestment of distributions | 680,296 | 812,220 | 3,673,597 | 4,321,010 |
| Shares redeemed | (7,994,716) | (7,368,588) | (44,737,116) | (38,556,019) |
| Net increase (decrease) | (3,325,801) | 1,000,516 | $(18,783,454) | $3,031,645 |
| Service Class 2 | | | | |
| Shares sold | 16,969,214 | 29,130,411 | $91,713,990 | $144,750,387 |
| Reinvestment of distributions | 1,678,790 | 1,860,964 | 8,815,623 | 9,639,796 |
| Shares redeemed | (23,296,723) | (28,095,349) | (125,967,136) | (143,680,685) |
| Net increase (decrease) | (4,648,719) | 2,896,026 | $(25,437,523) | $10,709,498 |
| Investor Class | | | | |
| Shares sold | 11,517,683 | 17,104,429 | $63,295,750 | $88,796,463 |
| Reinvestment of distributions | 4,497,398 | 4,518,093 | 24,335,939 | 24,081,433 |
| Shares redeemed | (19,550,789) | (14,741,065) | (108,292,108) | (77,955,475) |
| Net increase (decrease) | (3,535,708) | 6,881,457 | $(20,660,419) | $34,922,421 |
10. Other.
The Fund's organizational documents provide former and current trustees and officers with a limited indemnification against liabilities arising in connection with the performance of their duties to the Fund. In the normal course of business, the Fund may also enter into contracts that provide general indemnifications. The Fund's maximum exposure under these arrangements is unknown as this would be dependent on future claims that may be made against the Fund. The risk of material loss from such claims is considered remote.
At the end of the period, the investment adviser or its affiliates were the owners of record of 51% of the total outstanding shares of the Fund and one otherwise unaffiliated shareholder was the owner of record of 14% of the total outstanding shares of the Fund.
Report of Independent Registered Public Accounting Firm
To the Board of Trustees of Variable Insurance Products Fund and Shareholders of VIP High Income Portfolio:
Opinion on the Financial Statements
We have audited the accompanying statement of assets and liabilities, including the schedule of investments, of VIP High Income Portfolio (one of the funds constituting Variable Insurance Products Fund, referred to hereafter as the “Fund”) as of December 31, 2017, the related statement of operations for the year ended December 31, 2017, the statement of changes in net assets for each of the two years in the period ended December 31, 2017, including the related notes, and the financial highlights for each of the five years in the period ended December 31, 2017 (collectively referred to as the “financial statements”). In our opinion, the financial statements present fairly, in all material respects, the financial position of the Fund as of December 31, 2017, the results of its operations for the year then ended, the changes in its net assets for each of the two years in the period ended December 31, 2017 and the financial highlights for each of the five years in the period ended December 31, 2017 in conformity with accounting principles generally accepted in the United States of America.
Basis for Opinion
These financial statements are the responsibility of the Fund’s management. Our responsibility is to express an opinion on the Fund’s financial statements based on our audits. We are a public accounting firm registered with the Public Company Accounting Oversight Board (United States) (“PCAOB”) and are required to be independent with respect to the Fund in accordance with the U.S. federal securities laws and the applicable rules and regulations of the Securities and Exchange Commission and the PCAOB.
We conducted our audits of these financial statements in accordance with the standards of the PCAOB. Those standards require that we plan and perform the audit to obtain reasonable assurance about whether the financial statements are free of material misstatement, whether due to error or fraud.
Our audits included performing procedures to assess the risks of material misstatement of the financial statements, whether due to error or fraud, and performing procedures that respond to those risks. Such procedures included examining, on a test basis, evidence regarding the amounts and disclosures in the financial statements. Our audits also included evaluating the accounting principles used and significant estimates made by management, as well as evaluating the overall presentation of the financial statements. Our procedures included confirmation of securities owned as of December 31, 2017 by correspondence with the custodian, agent banks and brokers; when replies were not received from brokers, we performed other auditing procedures. We believe that our audits provide a reasonable basis for our opinion.
PricewaterhouseCoopers LLP
Boston, Massachusetts
February 15, 2018
We have served as the auditor of one or more investment companies in the Fidelity group of funds since 1932.
Trustees and Officers
The Trustees, Members of the Advisory Board (if any), and officers of the trust and fund, as applicable, are listed below. The Board of Trustees governs the fund and is responsible for protecting the interests of shareholders. The Trustees are experienced executives who meet periodically throughout the year to oversee the fund's activities, review contractual arrangements with companies that provide services to the fund, oversee management of the risks associated with such activities and contractual arrangements, and review the fund's performance. Except for Jonathan Chiel, each of the Trustees oversees 190 funds. Mr. Chiel oversees 145 funds.
The Trustees hold office without limit in time except that (a) any Trustee may resign; (b) any Trustee may be removed by written instrument, signed by at least two-thirds of the number of Trustees prior to such removal; (c) any Trustee who requests to be retired or who has become incapacitated by illness or injury may be retired by written instrument signed by a majority of the other Trustees; and (d) any Trustee may be removed at any special meeting of shareholders by a two-thirds vote of the outstanding voting securities of the trust. Each Trustee who is not an interested person (as defined in the 1940 Act) of the trust and the fund is referred to herein as an Independent Trustee. Each Independent Trustee shall retire not later than the last day of the calendar year in which his or her 75th birthday occurs. The Independent Trustees may waive this mandatory retirement age policy with respect to individual Trustees. Officers and Advisory Board Members hold office without limit in time, except that any officer or Advisory Board Member may resign or may be removed by a vote of a majority of the Trustees at any regular meeting or any special meeting of the Trustees. Except as indicated, each individual has held the office shown or other offices in the same company for the past five years.
The fund’s Statement of Additional Information (SAI) includes more information about the Trustees. To request a free copy, call Fidelity at 1-877-208-0098.
Experience, Skills, Attributes, and Qualifications of the Trustees. The Governance and Nominating Committee has adopted a statement of policy that describes the experience, qualifications, attributes, and skills that are necessary and desirable for potential Independent Trustee candidates (Statement of Policy). The Board believes that each Trustee satisfied at the time he or she was initially elected or appointed a Trustee, and continues to satisfy, the standards contemplated by the Statement of Policy. The Governance and Nominating Committee also engages professional search firms to help identify potential Independent Trustee candidates who have the experience, qualifications, attributes, and skills consistent with the Statement of Policy. From time to time, additional criteria based on the composition and skills of the current Independent Trustees, as well as experience or skills that may be appropriate in light of future changes to board composition, business conditions, and regulatory or other developments, have also been considered by the professional search firms and the Governance and Nominating Committee. In addition, the Board takes into account the Trustees' commitment and participation in Board and committee meetings, as well as their leadership of standing and ad hoc committees throughout their tenure.
In determining that a particular Trustee was and continues to be qualified to serve as a Trustee, the Board has considered a variety of criteria, none of which, in isolation, was controlling. The Board believes that, collectively, the Trustees have balanced and diverse experience, qualifications, attributes, and skills, which allow the Board to operate effectively in governing the fund and protecting the interests of shareholders. Information about the specific experience, skills, attributes, and qualifications of each Trustee, which in each case led to the Board's conclusion that the Trustee should serve (or continue to serve) as a trustee of the fund, is provided below.
Board Structure and Oversight Function. James C. Curvey is an interested person and currently serves as Chairman. The Trustees have determined that an interested Chairman is appropriate and benefits shareholders because an interested Chairman has a personal and professional stake in the quality and continuity of services provided to the fund. Independent Trustees exercise their informed business judgment to appoint an individual of their choosing to serve as Chairman, regardless of whether the Trustee happens to be independent or a member of management. The Independent Trustees have determined that they can act independently and effectively without having an Independent Trustee serve as Chairman and that a key structural component for assuring that they are in a position to do so is for the Independent Trustees to constitute a substantial majority for the Board. The Independent Trustees also regularly meet in executive session. Ned C. Lautenbach serves as Chairman of the Independent Trustees and as such (i) acts as a liaison between the Independent Trustees and management with respect to matters important to the Independent Trustees and (ii) with management prepares agendas for Board meetings.
Fidelity® funds are overseen by different Boards of Trustees. The fund's Board oversees Fidelity's high income and certain equity funds, and other Boards oversee Fidelity's investment-grade bond, money market, asset allocation, and sector funds. The asset allocation funds may invest in Fidelity® funds overseen by the fund's Board. The use of separate Boards, each with its own committee structure, allows the Trustees of each group of Fidelity® funds to focus on the unique issues of the funds they oversee, including common research, investment, and operational issues. On occasion, the separate Boards establish joint committees to address issues of overlapping consequences for the Fidelity® funds overseen by each Board.
The Trustees operate using a system of committees to facilitate the timely and efficient consideration of all matters of importance to the Trustees, the fund, and fund shareholders and to facilitate compliance with legal and regulatory requirements and oversight of the fund's activities and associated risks. The Board, acting through its committees, has charged FMR and its affiliates with (i) identifying events or circumstances the occurrence of which could have demonstrably adverse effects on the fund's business and/or reputation; (ii) implementing processes and controls to lessen the possibility that such events or circumstances occur or to mitigate the effects of such events or circumstances if they do occur; and (iii) creating and maintaining a system designed to evaluate continuously business and market conditions in order to facilitate the identification and implementation processes described in (i) and (ii) above. Because the day-to-day operations and activities of the fund are carried out by or through FMR, its affiliates, and other service providers, the fund's exposure to risks is mitigated but not eliminated by the processes overseen by the Trustees. While each of the Board's committees has responsibility for overseeing different aspects of the fund's activities, oversight is exercised primarily through the Operations, Audit, and Compliance Committees. In addition, the Independent Trustees have worked with FMR to enhance the Board's oversight of investment and financial risks, legal and regulatory risks, technology risks, and operational risks, including the development of additional risk reporting to the Board. For example, a working group comprised of Independent Trustees and FMR has worked and continues to work to review the Fidelity® funds' valuation-related activities, reporting and risk management. Appropriate personnel, including but not limited to the fund's Chief Compliance Officer (CCO), FMR's internal auditor, the independent accountants, the fund's Treasurer and portfolio management personnel, make periodic reports to the Board's committees, as appropriate, including an annual review of Fidelity's risk management program for the Fidelity® funds. The responsibilities of each standing committee, including their oversight responsibilities, are described further under "Standing Committees of the Trustees."
Interested Trustees*:
Correspondence intended for a Trustee who is an interested person may be sent to Fidelity Investments, 245 Summer Street, Boston, Massachusetts 02210.
Name, Year of Birth; Principal Occupations and Other Relevant Experience+
Jonathan Chiel (1957)
Year of Election or Appointment: 2016
Trustee
Mr. Chiel also serves as Trustee of other Fidelity® funds. Mr. Chiel is Executive Vice President and General Counsel for FMR LLC (diversified financial services company, 2012-present). Previously, Mr. Chiel served as general counsel (2004-2012) and senior vice president and deputy general counsel (2000-2004) for John Hancock Financial Services; a partner with Choate, Hall & Stewart (1996-2000) (law firm); and an Assistant United States Attorney for the United States Attorney’s Office of the District of Massachusetts (1986-95), including Chief of the Criminal Division (1993-1995). Mr. Chiel is a director on the boards of the Boston Bar Foundation and the Maimonides School.
James C. Curvey (1935)
Year of Election or Appointment: 2007
Trustee
Chairman of the Board of Trustees
Mr. Curvey also serves as Trustee of other Fidelity® funds. Mr. Curvey is a Director of Fidelity Research & Analysis Co. (investment adviser firm, 2009-present), and Vice Chairman (2007-present) and Director of FMR LLC (diversified financial services company). In addition, Mr. Curvey serves as an Overseer for the Boston Symphony Orchestra and a member of the board of Artis-Naples, Naples, Florida, and as a Trustee for Brewster Academy, Wolfeboro, New Hampshire. Previously, Mr. Curvey served as a Director of Fidelity Investments Money Management, Inc. (investment adviser firm, 2009-2014) and a Director of FMR and FMR Co., Inc. (investment adviser firms, 2007-2014).
Charles S. Morrison (1960)
Year of Election or Appointment: 2014
Trustee
Mr. Morrison also serves as Trustee of other funds. He serves as President of Fidelity SelectCo, LLC (investment adviser firm, 2017-present) and Fidelity Management & Research Company (FMR) (investment adviser firm, 2016-present), a Director of Fidelity Investments Money Management, Inc. (FIMM) (investment adviser firm, 2014-present), Director of Fidelity SelectCo, LLC (investment adviser firm, 2014-present), President, Asset Management (2014-present), and is an employee of Fidelity Investments. Previously, Mr. Morrison served as Vice President of Fidelity's Fixed Income and Asset Allocation Funds (2012-2014), President, Fixed Income (2011-2014), Vice President of Fidelity's Money Market Funds (2005-2009), President, Money Market Group Leader of FMR (investment adviser firm, 2009), and Senior Vice President, Money Market Group of FMR (2004-2009). Mr. Morrison also served as Vice President of Fidelity's Bond Funds (2002-2005), certain Balanced Funds (2002-2005), and certain Asset Allocation Funds (2002-2007), and as Senior Vice President (2002-2005) of Fidelity's Bond Division.
* Determined to be an “Interested Trustee” by virtue of, among other things, his or her affiliation with the trust or various entities under common control with FMR.
+ The information includes the Trustee's principal occupation during the last five years and other information relating to the experience, attributes, and skills relevant to the Trustee's qualifications to serve as a Trustee, which led to the conclusion that the Trustee should serve as a Trustee for the fund.
Independent Trustees:
Correspondence intended for an Independent Trustee may be sent to Fidelity Investments, P.O. Box 55235, Boston, Massachusetts 02205-5235.
Name, Year of Birth; Principal Occupations and Other Relevant Experience+
Dennis J. Dirks (1948)
Year of Election or Appointment: 2005
Trustee
Mr. Dirks also serves as Trustee of other Fidelity® funds. Prior to his retirement in May 2003, Mr. Dirks was Chief Operating Officer and a member of the Board of The Depository Trust & Clearing Corporation (DTCC). He also served as President, Chief Operating Officer, and Board member of The Depository Trust Company (DTC) and President and Board member of the National Securities Clearing Corporation (NSCC). In addition, Mr. Dirks served as Chief Executive Officer and Board member of the Government Securities Clearing Corporation, Chief Executive Officer and Board member of the Mortgage-Backed Securities Clearing Corporation, as a Trustee and a member of the Finance Committee of Manhattan College (2005-2008), as a Trustee and a member of the Finance Committee of AHRC of Nassau County (2006-2008), as a member of the Independent Directors Council (IDC) Governing Council (2010-2015), and as a member of the Board of Directors for The Brookville Center for Children’s Services, Inc. (2009-2017). Mr. Dirks is a member of the Finance Committee (2016-present) and Board of Directors (2017-present) of the Asolo Repertory Theatre.
Alan J. Lacy (1953)
Year of Election or Appointment: 2008
Trustee
Mr. Lacy also serves as Trustee of other Fidelity® funds. Mr. Lacy serves as a Director of Bristol-Myers Squibb Company (global pharmaceuticals, 2008-present). He is a Trustee of the California Chapter of The Nature Conservancy (2015-present) and a Director of the Center for Advanced Study in the Behavioral Sciences at Stanford University (2015-present). In addition, Mr. Lacy served as Senior Adviser (2007-2014) of Oak Hill Capital Partners, L.P. (private equity) and also served as Chief Executive Officer (2005) and Vice Chairman (2005-2006) of Sears Holdings Corporation (retail) and Chief Executive Officer and Chairman of the Board of Sears, Roebuck and Co. (retail, 2000-2005). Previously, Mr. Lacy served as Chairman (2014-2017) and a member (2010-2017) of the Board of Directors of Dave & Buster’s Entertainment, Inc. (restaurant and entertainment complexes), as Chairman (2008-2011) and a member (2006-2015) of the Board of Trustees of the National Parks Conservation Association, and as a member of the Board of Directors for The Hillman Companies, Inc. (hardware wholesalers, 2010-2014), Earth Fare, Inc. (retail grocery, 2010-2014), and The Western Union Company (global money transfer, 2006-2011).
Ned C. Lautenbach (1944)
Year of Election or Appointment: 2000
Trustee
Chairman of the Independent Trustees
Mr. Lautenbach also serves as Trustee of other Fidelity® funds. Mr. Lautenbach currently serves as Vice Chair of the Board of Governors, State University System of Florida (2013-present) and is a member of the Council on Foreign Relations (1994-present). He is also a member and has most recently served as Chairman of the Board of Directors of Artis-Naples (2012-present). Previously, Mr. Lautenbach served as a member and then Lead Director of the Board of Directors of Eaton Corporation (diversified industrial, 1997-2016). He was also a Partner and Advisory Partner at Clayton, Dubilier & Rice, LLC (private equity investment, 1998-2010), as well as a Director of Sony Corporation (2006-2007). In addition, Mr. Lautenbach also had a 30-year career with IBM (technology company) during which time he served as Senior Vice President and a member of the Corporate Executive Committee (1968-1998).
Joseph Mauriello (1944)
Year of Election or Appointment: 2008
Trustee
Mr. Mauriello also serves as Trustee of other Fidelity® funds. Prior to his retirement in January 2006, Mr. Mauriello served in numerous senior management positions including Deputy Chairman and Chief Operating Officer (2004-2005), and Vice Chairman of Financial Services (2002-2004) of KPMG LLP US (professional services, 1965-2005). Mr. Mauriello currently serves as a member of the Board of Directors of XL Group plc. (global insurance and re-insurance, 2006-present) and the Independent Directors Council (IDC) Governing Council (2015-present). Previously, Mr. Mauriello served as a Director of the Hamilton Funds of the Bank of New York (2006-2007) and of Arcadia Resources Inc. (health care services and products, 2007-2012).
Cornelia M. Small (1944)
Year of Election or Appointment: 2005
Trustee
Ms. Small also serves as Trustee of other Fidelity® funds. Ms. Small is a member of the Board of Directors (2009-present) and Chair of the Investment Committee (2010-present) of the Teagle Foundation. Ms. Small also serves on the Investment Committee of the Berkshire Taconic Community Foundation (2008-present). Previously, Ms. Small served as Chairperson (2002-2008) and a member of the Investment Committee and Chairperson (2008-2012) and a member of the Board of Trustees of Smith College. In addition, Ms. Small served as Chief Investment Officer, Director of Global Equity Investments, and a member of the Board of Directors of Scudder, Stevens & Clark and Scudder Kemper Investments.
William S. Stavropoulos (1939)
Year of Election or Appointment: 2001
Trustee
Vice Chairman of the Independent Trustees
Mr. Stavropoulos also serves as Trustee of other Fidelity® funds. Mr. Stavropoulos serves as President and Founder of the Michigan Baseball Foundation, the Great Lakes Loons (2007-present). Mr. Stavropoulos is Chairman Emeritus of the Board of Directors of The Dow Chemical Company, where he previously served in numerous senior management positions, including President, CEO (1995-2000; 2002-2004), Chairman of the Executive Committee (2000-2006), and as a member of the Board of Directors (1990-2006). Currently, Mr. Stavropoulos is Chairman of the Board of Directors of Univar Inc. (global distributor of commodity and specialty chemicals), a Director of Teradata Corporation (data warehousing and technology solutions), and a member of the Advisory Board for Metalmark Capital LLC (private equity investment, 2005-present). Mr. Stavropoulos is an operating advisor to Clayton, Dubilier & Rice, LLC (private equity investment). In addition, Mr. Stavropoulos is a member of the University of Notre Dame Advisory Council for the College of Science, a Trustee of the Rollin L. Gerstacker Foundation, and a Director of Artis-Naples in Naples, Florida. Previously, Mr. Stavropoulos served as a Director of Chemical Financial Corporation (bank holding company, 1993-2012) and Tyco International, Ltd. (multinational manufacturing and services, 2007-2012).
David M. Thomas (1949)
Year of Election or Appointment: 2008
Trustee
Mr. Thomas also serves as Trustee of other Fidelity® funds. Mr. Thomas serves as Non-Executive Chairman of the Board of Directors of Fortune Brands Home and Security (home and security products, 2011-present), as a member of the Board of Directors (2004-present) and Presiding Director (2013-present) of Interpublic Group of Companies, Inc. (marketing communication), and as a member of the Board of Trustees of the University of Florida (2013-present). Previously, Mr. Thomas served as Executive Chairman (2005-2006) and Chairman and Chief Executive Officer (2000-2005) of IMS Health, Inc. (pharmaceutical and healthcare information solutions), and a Director of Fortune Brands, Inc. (consumer products, 2000-2011).
+ The information includes the Trustee's principal occupation during the last five years and other information relating to the experience, attributes, and skills relevant to the Trustee's qualifications to serve as a Trustee, which led to the conclusion that the Trustee should serve as a Trustee for the fund.
Advisory Board Members and Officers:
Correspondence intended for an officer or Peter S. Lynch may be sent to Fidelity Investments, 245 Summer Street, Boston, Massachusetts 02210. Officers appear below in alphabetical order.
Name, Year of Birth; Principal Occupation
Peter S. Lynch (1944)
Year of Election or Appointment: 2003
Member of the Advisory Board
Mr. Lynch also serves as Member of the Advisory Board of other Fidelity® funds. Mr. Lynch is Vice Chairman and a Director of FMR (investment adviser firm) and FMR Co., Inc. (investment adviser firm). In addition, Mr. Lynch serves as a Trustee of Boston College and as the Chairman of the Inner-City Scholarship Fund. Previously, Mr. Lynch served on the Special Olympics International Board of Directors (1997-2006).
Elizabeth Paige Baumann (1968)
Year of Election or Appointment: 2017
Anti-Money Laundering (AML) Officer
Ms. Baumann also serves as AML Officer of other funds. She is Chief AML Officer (2012-present) and Senior Vice President (2014-present) of FMR LLC (diversified financial services company) and is an employee of Fidelity Investments. Previously, Ms. Baumann served as AML Officer of the funds (2012-2016), and Vice President (2007-2014) and Deputy Anti-Money Laundering Officer (2007-2012) of FMR LLC.
Marc R. Bryant (1966)
Year of Election or Appointment: 2015
Secretary and Chief Legal Officer (CLO)
Mr. Bryant also serves as Secretary and CLO of other funds. Mr. Bryant serves as CLO, Secretary, and Senior Vice President of Fidelity Management & Research Company (investment adviser firm, 2015-present) and FMR Co., Inc. (investment adviser firm, 2015-present); Secretary of Fidelity SelectCo, LLC (investment adviser firm, 2015-present) and Fidelity Investments Money Management, Inc. (investment adviser firm, 2015-present); and CLO of Fidelity Management & Research (Hong Kong) Limited and FMR Investment Management (UK) Limited (investment adviser firms, 2015-present) and Fidelity Management & Research (Japan) Limited (investment adviser firm, 2016-present). He is Senior Vice President and Deputy General Counsel of FMR LLC (diversified financial services company). Previously, Mr. Bryant served as Secretary and CLO of Fidelity Rutland Square Trust II (2010-2014) and Assistant Secretary of Fidelity's Fixed Income and Asset Allocation Funds (2013-2015). Prior to joining Fidelity Investments, Mr. Bryant served as a Senior Vice President and the Head of Global Retail Legal for AllianceBernstein L.P. (2006-2010), and as the General Counsel for ProFund Advisors LLC (2001-2006).
William C. Coffey (1969)
Year of Election or Appointment: 2009
Assistant Secretary
Mr. Coffey also serves as Assistant Secretary of other funds. He is Senior Vice President and Deputy General Counsel of FMR LLC (diversified financial services company, 2010-present), and is an employee of Fidelity Investments. Previously, Mr. Coffey served as Vice President and Associate General Counsel of FMR LLC (2005-2009).
Jonathan Davis (1968)
Year of Election or Appointment: 2010
Assistant Treasurer
Mr. Davis also serves as Assistant Treasurer of other funds. Mr. Davis serves as Assistant Treasurer of FMR Capital, Inc. (2017-present) and is an employee of Fidelity Investments. Previously, Mr. Davis served as Vice President and Associate General Counsel of FMR LLC (diversified financial services company, 2003-2010).
Adrien E. Deberghes (1967)
Year of Election or Appointment: 2016
Assistant Treasurer
Mr. Deberghes also serves as an officer of other funds. He serves as Assistant Treasurer of FMR Capital, Inc. (2017-present), Executive Vice President of Fidelity Investments Money Management, Inc. (FIMM) (investment adviser firm, 2016-present), and is an employee of Fidelity Investments (2008-present). Prior to joining Fidelity Investments, Mr. Deberghes was Senior Vice President of Mutual Fund Administration at State Street Corporation (2007-2008), Senior Director of Mutual Fund Administration at Investors Bank & Trust (2005-2007), and Director of Finance for Dunkin' Brands (2000-2005). Previously, Mr. Deberghes served in other fund officer roles.
Stephanie J. Dorsey (1969)
Year of Election or Appointment: 2010
Assistant Treasurer
Ms. Dorsey also serves as an officer of other funds. Ms. Dorsey serves as Assistant Treasurer of FMR Capital, Inc. (2017-present), is an employee of Fidelity Investments (2008-present), and has served in other fund officer roles. Prior to joining Fidelity Investments, Ms. Dorsey served as Treasurer (2004-2008) of the JPMorgan Mutual Funds and Vice President (2004-2008) of JPMorgan Chase Bank.
Howard J. Galligan III (1966)
Year of Election or Appointment: 2014
Chief Financial Officer
Mr. Galligan also serves as Chief Financial Officer of other funds. Mr. Galligan serves as President of Fidelity Pricing and Cash Management Services (FPCMS) (2014-present) and as a Director of Strategic Advisers, Inc. (investment adviser firm, 2008-present). Previously, Mr. Galligan served as Chief Administrative Officer of Asset Management (2011-2014) and Chief Operating Officer and Senior Vice President of Investment Support for Strategic Advisers, Inc. (2003-2011).
Thomas C. Hense (1964)
Year of Election or Appointment: 2008, 2010, or 2015
Vice President
Mr. Hense serves as Vice President of Fidelity Advisor® Multi-Asset Income Fund (2015) and other funds (High Income (2008), Small Cap (2008), and Value (2010) funds), and is an employee of Fidelity Investments (1993-present). Previously, Mr. Hense served as a portfolio manager for Fidelity's Institutional Money Management Group (Pyramis) (2003-2008).
Brian B. Hogan (1964)
Year of Election or Appointment: 2009
Vice President
Mr. Hogan also serves as Trustee or Vice President of other funds. Mr. Hogan serves as a Director of FMR Investment Management (UK) Limited (investment adviser firm, 2015-present) and Fidelity SelectCo, LLC (investment adviser firm, 2014-present) and President of the Equity Division of FMR (investment adviser firm, 2009-present). Previously, Mr. Hogan served as Senior Vice President, Equity Research of FMR (2006-2009) and as a portfolio manager. Mr. Brian B. Hogan is not related to Mr. Colm A. Hogan.
Colm A. Hogan (1973)
Year of Election or Appointment: 2016
Deputy Treasurer
Mr. Hogan also serves as an officer of other funds. Mr. Hogan serves as Assistant Treasurer of FMR Capital, Inc. (2017-present) and is an employee of Fidelity Investments (2005-present). Mr. Colm A. Hogan is not related to Mr. Brian B. Hogan.
Chris Maher (1972)
Year of Election or Appointment: 2013
Assistant Treasurer
Mr. Maher serves as Assistant Treasurer of other funds. Mr. Maher is Vice President of Valuation Oversight, serves as Assistant Treasurer of FMR Capital, Inc. (2017-present), and is an employee of Fidelity Investments. Previously, Mr. Maher served as Vice President of Asset Management Compliance (2013), Vice President of the Program Management Group of FMR (investment adviser firm, 2010-2013), and Vice President of Valuation Oversight (2008-2010).
Rieco E. Mello (1969)
Year of Election or Appointment: 2017
Assistant Treasurer
Mr. Mello also serves as Assistant Treasurer of other funds. Mr. Mello serves as Assistant Treasurer of FMR Capital, Inc. (2017-present) and is an employee of Fidelity Investments (1995-present).
Kenneth B. Robins (1969)
Year of Election or Appointment: 2016
Chief Compliance Officer
Mr. Robins also serves as an officer of other funds. Mr. Robins serves as Compliance Officer of Fidelity Management & Research Company and FMR Co., Inc. (investment adviser firms, 2016-present) and is an employee of Fidelity Investments (2004-present). Previously, Mr. Robins served as Executive Vice President of Fidelity Investments Money Management, Inc. (investment adviser firm, 2013-2016) and served in other fund officer roles.
Stacie M. Smith (1974)
Year of Election or Appointment: 2016
President and Treasurer
Ms. Smith also serves as an officer of other funds. Ms. Smith serves as Assistant Treasurer of FMR Capital, Inc. (2017-present), is an employee of Fidelity Investments (2009-present), and has served in other fund officer roles. Prior to joining Fidelity Investments, Ms. Smith served as Senior Audit Manager of Ernst & Young LLP (accounting firm, 1996-2009). Previously, Ms. Smith served as Deputy Treasurer of certain Fidelity® funds (2013-2016).
Marc L. Spector (1972)
Year of Election or Appointment: 2016
Assistant Treasurer
Mr. Spector also serves as an officer of other funds. Mr. Spector serves as Assistant Treasurer of FMR Capital, Inc. (2017-present) and is an employee of Fidelity Investments (2016-present). Prior to joining Fidelity Investments, Mr. Spector served as Director at the Siegfried Group (accounting firm, 2013-2016), and prior to Siegfried Group as audit senior manager at Deloitte & Touche (accounting firm, 2005-2013).
Renee Stagnone (1975)
Year of Election or Appointment: 2016
Assistant Treasurer
Ms. Stagnone also serves as an officer of other funds. Ms. Stagnone serves as Assistant Treasurer of FMR Capital, Inc. (2017-present) and is an employee of Fidelity Investments (1997-present). Previously, Ms. Stagnone served as Deputy Treasurer of certain Fidelity® funds (2013-2016).
Shareholder Expense Example
As a shareholder of the Fund, you incur two types of costs: (1) transaction costs, and (2) ongoing costs, including management fees, distribution and/or service (12b-1) fees and other Fund expenses. This Example is intended to help you understand your ongoing costs (in dollars) of investing in the Fund and to compare these costs with the ongoing costs of investing in other mutual funds.
The Example is based on an investment of $1,000 invested at the beginning of the period and held for the entire period (July 1, 2017 to December 31, 2017).
Actual Expenses
The first line of the accompanying table for each class of the Fund provides information about actual account values and actual expenses. You may use the information in this line, together with the amount you invested, to estimate the expenses that you paid over the period. Simply divide your account value by $1,000.00 (for example, an $8,600 account value divided by $1,000.00 = 8.6), then multiply the result by the number in the first line for a class of the Fund under the heading entitled "Expenses Paid During Period" to estimate the expenses you paid on your account during this period. The estimate of expenses does not include any fees or other expenses of any variable annuity or variable life insurance product. If they were, the estimate of expenses you paid during the period would be higher, and your ending account value would be lower. In addition, the Fund, as a shareholder in the underlying Fidelity Central Funds, will indirectly bear its pro-rata share of the fees and expenses incurred by the underlying Fidelity Central Funds. These fees and expenses are not included in the Fund's annualized expense ratio used to calculate the expense estimate in the table below.
Hypothetical Example for Comparison Purposes
The second line of the accompanying table for each class of the Fund provides information about hypothetical account values and hypothetical expenses based on a Class' actual expense ratio and an assumed rate of return of 5% per year before expenses, which is not the Class' actual return. The hypothetical account values and expenses may not be used to estimate the actual ending account balance or expenses you paid for the period. You may use this information to compare the ongoing costs of investing in the Fund and other funds. To do so, compare this 5% hypothetical example with the 5% hypothetical examples that appear in the shareholder reports of the other funds. The estimate of expenses does not include any fees or other expenses of any variable annuity or variable life insurance product. If they were, the estimate of expenses you paid during the period would be higher, and your ending account value would be lower. In addition, the Fund, as a shareholder in the underlying Fidelity Central Funds, will indirectly bear its pro-rata share of the fees and expenses incurred by the underlying Fidelity Central Funds. These fees and expenses are not included in the Fund's annualized expense ratio used to calculate the expense estimate in the table below.
Please note that the expenses shown in the table are meant to highlight your ongoing costs only and do not reflect any transaction costs. Therefore, the second line of the table is useful in comparing ongoing costs only, and will not help you determine the relative total costs of owning different funds.
| | Annualized Expense Ratio-A | Beginning
Account Value
July 1, 2017 | Ending
Account Value
December 31, 2017 | Expenses Paid
During Period-B
July 1, 2017
to December 31, 2017 |
| Initial Class | .67% | | | |
| Actual | | $1,000.00 | $1,025.40 | $3.42 |
| Hypothetical-C | | $1,000.00 | $1,021.83 | $3.41 |
| Service Class | .77% | | | |
| Actual | | $1,000.00 | $1,024.50 | $3.93 |
| Hypothetical-C | | $1,000.00 | $1,021.32 | $3.92 |
| Service Class 2 | .92% | | | |
| Actual | | $1,000.00 | $1,023.90 | $4.69 |
| Hypothetical-C | | $1,000.00 | $1,020.57 | $4.69 |
| Investor Class | .70% | | | |
| Actual | | $1,000.00 | $1,023.50 | $3.57 |
| Hypothetical-C | | $1,000.00 | $1,021.68 | $3.57 |
A Annualized expense ratio reflects expenses net of applicable fee waivers.
B Expenses are equal to each Class' annualized expense ratio, multiplied by the average account value over the period, multiplied by 184/365 (to reflect the one-half year period).
C 5% return per year before expenses
Board Approval of Investment Advisory Contracts and Management Fees
VIP High Income Portfolio
Each year, the Board of Trustees, including the Independent Trustees (together, the Board), votes on the renewal of the management contract with Fidelity Management & Research Company (FMR) and the sub-advisory agreements (together, the Advisory Contracts) for the fund. FMR and the sub-advisers are referred to herein as the Investment Advisers. The Board, assisted by the advice of fund counsel and Independent Trustees' counsel, requests and considers a broad range of information relevant to the renewal of the Advisory Contracts throughout the year.
The Board meets regularly and, at each of its meetings, covers an extensive agenda of topics and materials and considers factors that are relevant to its annual consideration of the renewal of the fund's Advisory Contracts, including the services and support provided to the fund and its shareholders. The Board has established various standing committees (Committees), each composed of and chaired by Independent Trustees with varying backgrounds, to which the Board has assigned specific subject matter responsibilities in order to enhance effective decision-making by the Board. The Board, acting directly and through its Committees, requests and receives information concerning the annual consideration of the renewal of the fund's Advisory Contracts. The Board also meets as needed to review matters specifically related to the Board's annual consideration of the renewal of the Advisory Contracts. Members of the Board may also meet with trustees of other Fidelity funds through ad hoc joint committees to discuss certain matters relevant to all of the Fidelity funds.
At its July 2017 meeting, the Board unanimously determined to renew the fund's Advisory Contracts. In reaching its determination, the Board considered all factors it believed relevant, including (i) the nature, extent, and quality of the services to be provided to the fund and its shareholders (including the investment performance of the fund); (ii) the competitiveness of the fund's management fee and total expense ratio relative to peer funds; (iii) the total costs of the services to be provided by and the profits to be realized by Fidelity from its relationships with the fund; and (iv) the extent to which, if any, economies of scale exist and would be realized as the fund grows, and whether any economies of scale are appropriately shared with fund shareholders.
In considering whether to renew the Advisory Contracts for the fund, the Board reached a determination, with the assistance of fund counsel and Independent Trustees' counsel and through the exercise of its business judgment, that the renewal of the Advisory Contracts was in the best interests of the fund and its shareholders and that the compensation payable under the Advisory Contracts was fair and reasonable. The Board's decision to renew the Advisory Contracts was not based on any single factor, but rather was based on a comprehensive consideration of all the information provided to the Board at its meetings throughout the year. The Board, in reaching its determination to renew the Advisory Contracts, was aware that shareholders of the fund have a broad range of investment choices available to them, including a wide choice among funds offered by Fidelity's competitors, and that the fund's shareholders, who have the opportunity to review and weigh the disclosure provided by the fund in its prospectus and other public disclosures, have chosen to invest in this fund, which is part of the Fidelity family of funds.
Amendment to Group Fee Rate. The Board also approved an amendment to the management contract for the fund to add an additional breakpoint to the group fee schedule, effective October 1, 2017. The Board noted that the additional breakpoint would result in lower management fee rates as Fidelity's assets under management increase.
Nature, Extent, and Quality of Services Provided. The Board considered Fidelity's staffing as it relates to the fund, including the backgrounds of investment personnel of Fidelity, and also considered the fund's investment objective, strategies, and related investment philosophy. The Independent Trustees also had discussions with senior management of Fidelity's investment operations and investment groups. The Board considered the structure of the investment personnel compensation program and whether this structure provides appropriate incentives to act in the best interests of the fund. Additionally, the Board considered the portfolio managers' investments, if any, in the funds that they manage.
Resources Dedicated to Investment Management and Support Services. The Board and the Fund Oversight and Research Committees reviewed the general qualifications and capabilities of Fidelity's investment staff, including its size, education, experience, and resources, as well as Fidelity's approach to recruiting, training, managing, and compensating investment personnel. The Board noted that Fidelity has continued to increase the resources devoted to non-U.S. offices, including expansion of Fidelity's global investment organization. The Board also noted that Fidelity's analysts have extensive resources, tools and capabilities that allow them to conduct sophisticated quantitative and fundamental analysis, as well as credit analysis of issuers, counterparties and guarantors. Further, the Board considered that Fidelity's investment professionals have sufficient access to global information and data so as to provide competitive investment results over time, and that those professionals also have access to sophisticated tools that permit them to assess portfolio construction and risk and performance attribution characteristics continuously, as well as to transmit new information and research conclusions rapidly around the world. Additionally, in its deliberations, the Board considered Fidelity's trading, risk management, compliance, and technology and operations capabilities and resources, which are integral parts of the investment management process.
Shareholder and Administrative Services. The Board considered (i) the nature, extent, quality, and cost of advisory, administrative, and shareholder services performed by the Investment Advisers and their affiliates under the Advisory Contracts and under separate agreements covering transfer agency, pricing and bookkeeping, and securities lending services for the fund; (ii) the nature and extent of the supervision of third party service providers, principally custodians, subcustodians, and pricing vendors; and (iii) the resources devoted to, and the record of compliance with, the fund's compliance policies and procedures. The Board also reviewed the allocation of fund brokerage, including allocations to brokers affiliated with the Investment Advisers, the use of brokerage commissions to pay fund expenses, and the use of "soft" commission dollars to pay for research services.
The Board noted that the growth of fund assets over time across the complex allows Fidelity to reinvest in the development of services designed to enhance the value or convenience of the Fidelity funds as investment vehicles. These services include 24-hour access to account information and market information through telephone representatives and over the Internet, investor education materials and asset allocation tools, and the expanded availability of Fidelity Investor Centers.
In 2014, the Board formed an ad hoc Committee on Transfer Agency Fees to review the variety of transfer agency fee structures throughout the industry and Fidelity's competitive positioning with respect to industry participants.
Investment in a Large Fund Family. The Board considered the benefits to shareholders of investing in a Fidelity fund, including the benefits of investing in a fund that is part of a large family of funds offering a variety of investment disciplines and providing a large variety of mutual fund investor services. The Board noted that Fidelity had taken, or had made recommendations that resulted in the Fidelity funds taking, a number of actions over the previous year that benefited particular funds, including: (i) continuing to dedicate additional resources to Fidelity's investment research process, and to the support of the senior management team that oversees asset management; (ii) continuing efforts to enhance Fidelity's global research capabilities; (iii) launching new funds and making other enhancements to meet client needs; (iv) launching new share classes of existing funds; (v) eliminating purchase minimums and broadening eligibility requirements for certain lower-priced share classes; (vi) reducing management fees and total expenses for certain growth equity funds and index funds; (vii) lowering expense caps for certain existing funds and classes to reduce expenses borne by shareholders; (viii) eliminating short-term redemption fees for certain funds; (ix) introducing a new pricing structure for certain funds of funds that is expected to reduce overall expenses paid by shareholders; (x) rationalizing product lines and gaining increased efficiencies through proposals for fund mergers and share class consolidations; (xi) continuing to develop, acquire and implement systems and technology to improve services to the funds and shareholders, strengthen information security, and increase efficiency; and (xii) implementing enhancements to further strengthen Fidelity's product line to increase investors' probability of success in achieving their investment goals, including retirement income goals.
Investment Performance. The Board considered whether the fund has operated in accordance with its investment objective, as well as its record of compliance with its investment restrictions and its performance history.
The Board took into account discussions with representatives of the Investment Advisers about fund investment performance that occur at Board meetings throughout the year. In this regard the Board noted that as part of regularly scheduled fund reviews and other reports to the Board on fund performance, the Board considers annualized return information for the fund for different time periods, measured against a securities market index ("benchmark index") and a peer group of funds with similar objectives ("peer group"), if any. In its evaluation of fund investment performance, the Board gave particular attention to information indicating changes in performance of certain Fidelity funds for specific time periods and discussed with the Investment Advisers the reasons for any overperformance or underperformance.
In addition to reviewing absolute and relative fund performance, the Independent Trustees periodically consider the appropriateness of fund performance metrics in evaluating the results achieved. In general, the Independent Trustees believe that fund performance should be evaluated based on net performance (after fees and expenses) of both the highest performing and lowest performing fund share classes, where applicable, compared to appropriate benchmark indices, over appropriate time periods that may include full market cycles, and compared to peer groups, as applicable, over the same periods, taking into account relevant factors including the following: general market conditions; issuer-specific information; and fund cash flows and other factors.
The Independent Trustees recognize that shareholders evaluate performance on a net basis over their own holding periods, for which one-, three-, and five-year periods are often used as a proxy. For this reason, the performance information reviewed by the Board also included net cumulative calendar year total return information for the fund and an appropriate benchmark index and peer group for the most recent one-, three-, and five-year periods, as shown below. Returns are shown compared to the 25th percentile (top of box, 75% beaten) and 75th percentile (bottom of box, 25% beaten) of the peer universe.
VIP High Income Portfolio
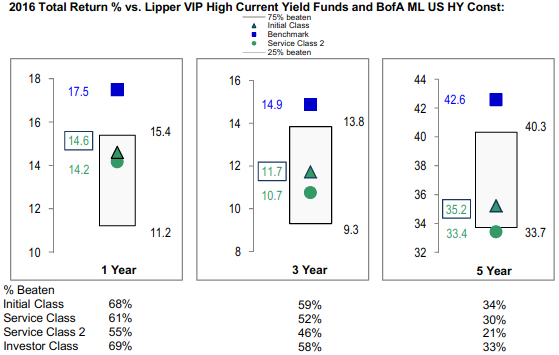
Based on its review, the Board concluded that the nature, extent, and quality of services provided to the fund under the Advisory Contracts should continue to benefit the shareholders of the fund.
Competitiveness of Management Fee and Total Expense Ratio. The Board considered the fund's management fee and total expense ratio compared to "mapped groups" of competitive funds and classes created for the purpose of facilitating the Trustees' competitive analysis of management fees and total expenses. Fidelity creates "mapped groups" by combining similar Lipper investment objective categories that have comparable investment mandates. Combining Lipper investment objective categories aids the Board's management fee and total expense ratio comparisons by broadening the competitive group used for comparison.
Management Fee. The Board considered two proprietary management fee comparisons for the 12-month periods shown in basis points (BP) in the chart below. The group of Lipper funds used by the Board for management fee comparisons is referred to below as the "Total Mapped Group." The Total Mapped Group is broader than the Lipper peer group used by the Board for performance comparisons because the Total Mapped Group combines several Lipper investment objective categories while the Lipper peer group does not. The Total Mapped Group comparison focuses on a fund's standing in terms of gross management fees before expense reimbursements or caps relative to the total universe of funds with comparable investment mandates, regardless of whether their management fee structures also are comparable. Funds with comparable investment mandates offer exposure to similar types of securities. Funds with comparable management fee structures have similar management fee contractual arrangements (
e.g., flat rate charged for advisory services, all-inclusive fee rate,
etc.). "TMG %" represents the percentage of funds in the Total Mapped Group that had management fees that were lower than the fund's. For example, a hypothetical TMG % of 20% would mean that 80% of the funds in the Total Mapped Group had higher, and 20% had lower, management fees than the fund. The fund's actual TMG %s and the number of funds in the Total Mapped Group are in the chart below. The "Asset-Size Peer Group" (ASPG) comparison focuses on a fund's standing relative to a subset of non-Fidelity funds within the Total Mapped Group that are similar in size and management fee structure. For example, if a fund is in the first quartile of the ASPG, the fund's management fee ranks in the least expensive or lowest 25% of funds in the ASPG. The ASPG represents at least 15% of the funds in the Total Mapped Group with comparable asset size and management fee structures, subject to a minimum of 50 funds (or all funds in the Total Mapped Group if fewer than 50). Additional information, such as the ASPG quartile in which the fund's management fee rate ranked, is also included in the chart and considered by the Board.
VIP High Income Portfolio
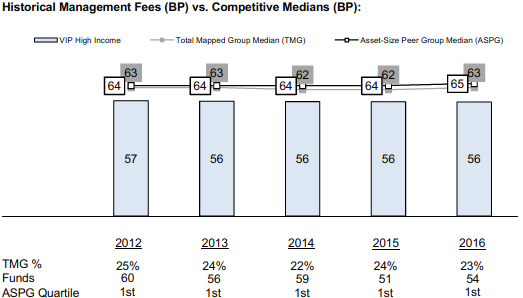
The Board noted that the fund's management fee rate ranked below the median of its Total Mapped Group and below the median of its ASPG for 2016.
The Board noted that, in 2014, the Board and the boards of other Fidelity funds formed the ad hoc Committee on Group Fee to conduct an in-depth review of the "group fee" component of the management fee of funds with such management fee structures. The Committee's focus included the mechanics of the group fee, the competitive landscape of group fee structures, Fidelity funds with no group fee component and investment products not included in group fee assets. The Board also considered that, for funds subject to the group fee, FMR agreed to voluntarily waive fees over a specified period of time in amounts designed to account for assets converted from certain funds to certain collective investment trusts.
The Board also noted that, in 2013, the ad hoc Committee on Management Fees was formed to conduct an in-depth review of the management fee rates of Fidelity's active equity mutual funds. The Committee focused on the following areas: (i) standard fee structures; (ii) research consumption and trading evolution; (iii) management fee competitiveness/profitability by category; and (iv) factors that drive institutional pricing.
Based on its review, the Board concluded that the fund's management fee is fair and reasonable in light of the services that the fund receives and the other factors considered.
Total Expense Ratio. In its review of each class's total expense ratio, the Board considered the fund's management fee rate as well as other fund or class expenses, as applicable, such as transfer agent fees, pricing and bookkeeping fees, fund-paid 12b-1 fees, and custodial, legal, and audit fees. The Board also noted that Fidelity may agree to waive fees and expenses from time to time, and the extent to which, if any, it has done so for the fund. As part of its review, the Board also considered the current and historical total expense ratios of each class of the fund compared to competitive fund median expenses. Each class of the fund is compared to those funds and classes in the Total Mapped Group (used by the Board for management fee comparisons) that have a similar sales load structure.
The Board noted that the total expense ratio of each of Initial Class, Investor Class, and Service Class ranked below the competitive median for 2016 and the total expense ratio of Service Class 2 ranked above the competitive median for 2016. The Board considered that, in general, various factors can affect total expense ratios. The Board noted that the total expense ratio of Service Class 2 was above the competitive median because of its 12b-1 fees. The Board noted that the fund offers multiple classes, each of which has a different 12b-1 fee structure, and that the multiple structures are intended to offer a range of pricing options for the intermediary market. The Board also noted that the total expense ratios of the classes vary primarily by the level of their 12b-1 fees, although differences in transfer agent fees may also cause expenses to vary from class to class.
Fees Charged to Other Fidelity Clients. The Board also considered Fidelity fee structures and other information with respect to clients of Fidelity, such as other funds advised or subadvised by Fidelity, pension plan clients, and other institutional clients with similar mandates. The Board noted that an ad hoc joint committee created by it and the boards of other Fidelity funds periodically (most recently in 2013) reviews and compares Fidelity's institutional investment advisory business with its business of providing services to the Fidelity funds, including the differences in services provided, fees charged, and costs incurred, as well as competition in their respective marketplaces.
Based on its review of total expense ratios and fees charged to other Fidelity clients, the Board concluded that, although Service Class 2 was above the median of the universe presented for comparison, the total expense ratio of each class of the fund was reasonable in light of the services that the fund and its shareholders receive and the other factors considered.
Costs of the Services and Profitability. The Board considered the revenues earned and the expenses incurred by Fidelity in conducting the business of developing, marketing, distributing, managing, administering and servicing the fund and servicing the fund's shareholders. The Board also considered the level of Fidelity's profits in respect of all the Fidelity funds.
On an annual basis, Fidelity presents to the Board information about the profitability of its relationships with the fund. Fidelity calculates profitability information for each fund, as well as aggregate profitability information for groups of Fidelity funds and all Fidelity funds, using a series of detailed revenue and cost allocation methodologies which originate with the books and records of Fidelity on which Fidelity's audited financial statements are based. The Audit Committee of the Board reviews any significant changes from the prior year's methodologies.
PricewaterhouseCoopers LLP (PwC), independent registered public accounting firm and auditor to Fidelity and certain Fidelity funds, has been engaged annually by the Board as part of the Board's assessment of Fidelity's profitability analysis. PwC's engagement includes the review and assessment of the methodologies used by Fidelity in determining the revenues and expenses attributable to Fidelity's mutual fund business, and completion of agreed-upon procedures in respect of the mathematical accuracy of the fund profitability information and its conformity to established allocation methodologies. After considering PwC's reports issued under the engagement and information provided by Fidelity, the Board concluded that while other allocation methods may also be reasonable, Fidelity's profitability methodologies are reasonable in all material respects.
The Board also reviewed Fidelity's non-fund businesses and potential fall-out benefits related to the mutual fund business as well as cases where Fidelity's affiliates may benefit from or be related to the fund's business.
The Board considered the costs of the services provided by and the profits realized by Fidelity in connection with the operation of the fund and was satisfied that the profitability was not excessive.
Economies of Scale. The Board considered whether there have been economies of scale in respect of the management of the Fidelity funds, whether the Fidelity funds (including the fund) have appropriately benefited from any such economies of scale, and whether there is potential for realization of any further economies of scale. The Board considered the extent to which the fund will benefit from economies of scale as assets grow through increased services to the fund, through waivers or reimbursements, or through fee or expense ratio reductions. The Board also noted that a committee (the Economies of Scale Committee) created by it and the boards of other Fidelity funds periodically (most recently in 2013) analyzes whether Fidelity attains economies of scale in respect of the management and servicing of the Fidelity funds, whether the Fidelity funds have appropriately benefited from such economies of scale, and whether there is potential for realization of any further economies of scale.
The Board recognized that the fund's management contract incorporates a "group fee" structure, which provides for lower group fee rates as total group assets increase, and for higher group fee rates as total group assets decrease (with "group assets" defined to include fund assets under FMR's management plus the assets of sector funds previously under FMR's management). FMR calculates the group fee rates based on a tiered asset "breakpoint" schedule that varies based on asset class. The Board considered that the group fee is designed to deliver the benefits of economies of scale to fund shareholders when total Fidelity fund assets increase, even if assets of any particular fund are unchanged or have declined, because some portion of Fidelity's costs are attributable to services provided to all Fidelity funds, and all funds benefit if those costs can be allocated among more assets. The Board concluded that, given the group fee structure, fund shareholders will benefit from lower management fees as group assets increase at the fund complex level, regardless of whether Fidelity achieves any such economies of scale.
The Board concluded, taking into account the analysis of the Economies of Scale Committee, that economies of scale, if any, are being appropriately shared between fund shareholders and Fidelity.
Additional Information Requested by the Board. In order to develop fully the factual basis for consideration of the Fidelity funds' advisory contracts, the Board requested and received additional information on certain topics, including: (i) fund performance trends, in particular the underperformance of certain funds, and Fidelity's long-term strategies for certain funds; (ii) Fidelity's fund profitability methodology, profitability trends for certain funds, and the impact of certain factors on fund profitability results, including the impact of market trends on actively managed funds; (iii) the use of performance fees and the calculation of performance adjustments, including the impact of underperformance and fund outflows on performance adjustments; (iv) metrics for evaluating index fund performance; (v) Fidelity's group fee structure, including the group fee breakpoint schedules; (vi) the terms of Fidelity's contractual and voluntary expense cap arrangements with the funds; (vii) the methodology with respect to evaluating competitive fund data and peer group classifications and fee comparisons; (viii) the expense structures for different funds and classes; (ix) Fidelity's arrangements with affiliated sub-advisers on behalf of the funds; (x) information regarding other accounts managed by Fidelity, including institutional accounts and collective investment trusts; (xi) recent changes to the fee structure for certain funds of funds; and (xii) the impact of the Department of Labor's new fiduciary rule on the funds' comparative expense information.
Based on its evaluation of all of the conclusions noted above, and after considering all factors it believed relevant, the Board concluded that the advisory fee structures are fair and reasonable, and that the fund's Advisory Contracts should be renewed.

VIPHI-ANN-0218
1.540029.120
Fidelity® Variable Insurance Products: Value Portfolio
Annual Report December 31, 2017 |
|
Contents
To view a fund's proxy voting guidelines and proxy voting record for the 12-month period ended June 30, visit http://www.fidelity.com/proxyvotingresults or visit the Securities and Exchange Commission's (SEC) web site at http://www.sec.gov.
You may also call 1-877-208-0098 to request a free copy of the proxy voting guidelines.
Fidelity® Variable Insurance Products are separate account options which are purchased through a variable insurance contract.
Standard & Poor's, S&P and S&P 500 are registered service marks of The McGraw-Hill Companies, Inc. and have been licensed for use by Fidelity Distributors Corporation.
Other third-party marks appearing herein are the property of their respective owners.
All other marks appearing herein are registered or unregistered trademarks or service marks of FMR LLC or an affiliated company. © 2018 FMR LLC. All rights reserved.
This report and the financial statements contained herein are submitted for the general information of the shareholders of the Fund. This report is not authorized for distribution to prospective investors in the Fund unless preceded or accompanied by an effective prospectus.
A fund files its complete schedule of portfolio holdings with the SEC for the first and third quarters of each fiscal year on Form N-Q. Forms N-Q are available on the SEC’s web site at http://www.sec.gov. A fund's Forms N-Q may be reviewed and copied at the SEC’s Public Reference Room in Washington, DC. Information regarding the operation of the SEC's Public Reference Room may be obtained by calling 1-800-SEC-0330.
For a complete list of a fund's portfolio holdings, view the most recent holdings listing, semiannual report, or annual report on Fidelity's web site at http://www.fidelity.com, http://www.institutional.fidelity.com, or http://www.401k.com, as applicable.
NOT FDIC INSURED •MAY LOSE VALUE •NO BANK GUARANTEE
Neither the Fund nor Fidelity Distributors Corporation is a bank.
Performance: The Bottom Line
Average annual total return reflects the change in the value of an investment, assuming reinvestment of distributions from dividend income and capital gains (the profits earned upon the sale of securities that have grown in value, if any) and assuming a constant rate of performance each year. During periods of reimbursement by Fidelity, a fund’s total return will be greater than it would be had the reimbursement not occurred. Performance numbers are net of all underlying fund operating expenses, but do not include any insurance charges imposed by your insurance company’s separate account. If performance information included the effect of these additional charges, the total returns would have been lower. How a fund did yesterday is no guarantee of how it will do tomorrow.
Average Annual Total Returns
| For the periods ended December 31, 2017 | Past 1 year | Past 5 years | Past 10 years |
| Initial Class | 15.58% | 13.67% | 7.24% |
| Service Class | 15.53% | 13.55% | 7.14% |
| Service Class 2 | 15.36% | 13.39% | 6.97% |
| Investor Class | 15.52% | 13.58% | 7.15% |
$10,000 Over 10 Years
Let's say hypothetically that $10,000 was invested in VIP Value Portfolio - Initial Class on December 31, 2007.
The chart shows how the value of your investment would have changed, and also shows how the Russell 3000® Value Index performed over the same period.
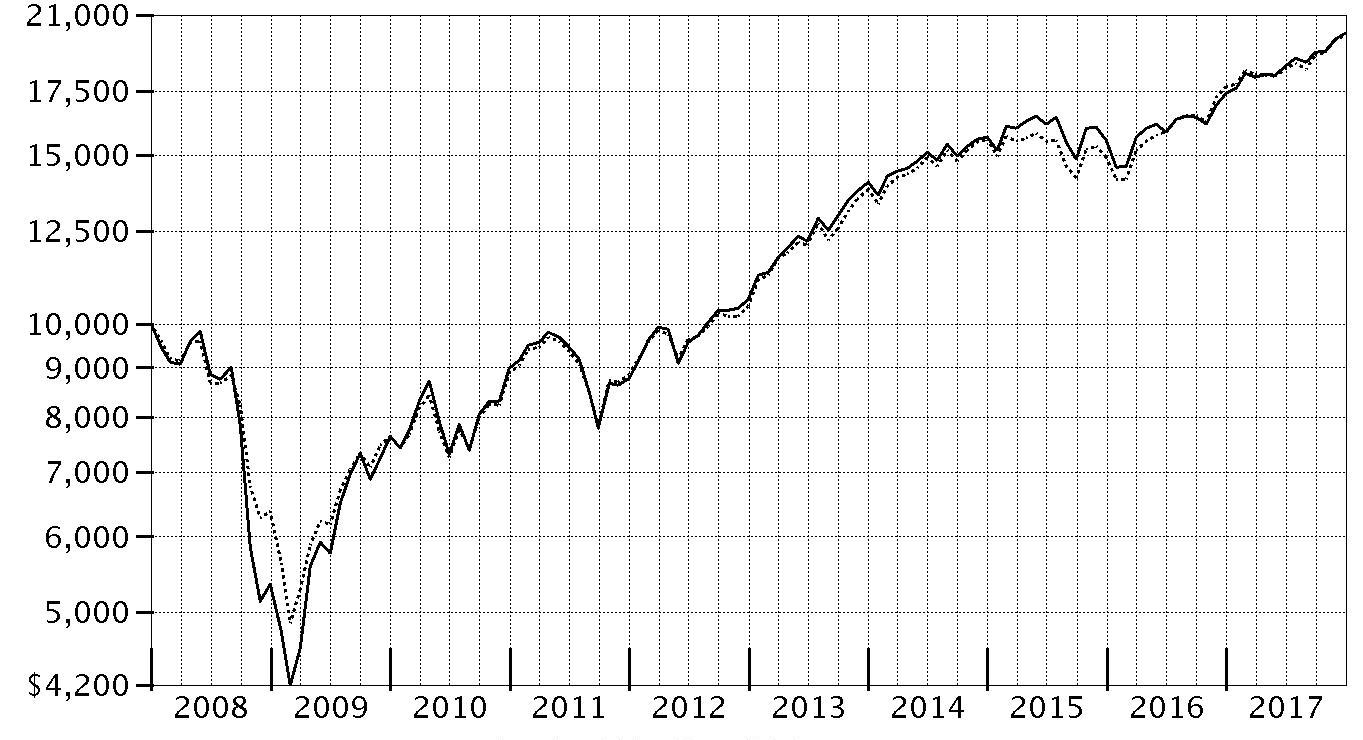
| Period Ending Values |
| $20,113 | VIP Value Portfolio - Initial Class |
| $20,020 | Russell 3000® Value Index |
Management's Discussion of Fund Performance
Market Recap: U.S. equities gained 21.83% in 2017, as the S&P 500
® index rose steadily and closed the year just shy of an all-time high after a particularly strong three-month finish. Early on, equities rallied on optimism for President Trump’s pro-business agenda but leveled off in March amid fading optimism and stalled efforts by Congress to repeal and replace the Affordable Care Act. Upward momentum soon returned and continued through year-end with consumer sentiment and other market indicators staying positive. The lone exception was a brief cooldown in August, when geopolitical tension escalated and uncertainty grew regarding the future of health care, tax reform and the debt ceiling. Sector-wise, information technology fared best by a wide margin, rising 39% amid strong earnings growth from several major index constituents. A 24% gain in materials was spurred by increased demand, especially from China. Consumer discretionary gained 23%, despite many brick-and-mortar retailers suffering from online competition, and financials edged the broader market on an uptick in bond yields. Conversely, the defensive energy and telecom services sectors returned about -1% each. Rising interest rates held back real estate (+11%), while consumer staples (+13%) and utilities (+12%) struggled due to investors’ general preference for risk assets.
Comments from Portfolio Manager Matthew Friedman: For the year, the fund’s share classes advanced about 15% to 16%, handily outpacing the 13.19% return of the benchmark Russell 3000
® Value Index. Among sectors, the biggest contribution versus the benchmark came from picks in industrials. Here, by far the fund’s biggest individual relative contributor was not owning large index component General Electric. Shares of the industrial conglomerate were hampered by investors' concerns about some of the company's businesses and its cash flow. Elsewhere, Avis Budget Group – a non-benchmark position I established in May – benefited as the competitive landscape for car-rental companies became more rational. Not owning index member Exxon Mobil notably helped, as shares of the multinational oil and gas giant returned -4% in 2017. Conversely, choices in health care hurt most by a considerable margin. The fund’s biggest detractor was untimely ownership of Israel-based Teva Pharmaceutical Industries, the world's largest maker of generic drugs. The non-benchmark stock was hurt by excess debt from the company's 2016 acquisition of Actavis' generics business and drug-pricing pressure. Another health care stock that hurt was drugmaker Endo International. I sold our stakes in Teva and Endo by period end.
The views expressed above reflect those of the portfolio manager(s) only through the end of the period as stated on the cover of this report and do not necessarily represent the views of Fidelity or any other person in the Fidelity organization. Any such views are subject to change at any time based upon market or other conditions and Fidelity disclaims any responsibility to update such views. These views may not be relied on as investment advice and, because investment decisions for a Fidelity fund are based on numerous factors, may not be relied on as an indication of trading intent on behalf of any Fidelity fund.
Investment Summary (Unaudited)
Top Ten Stocks as of December 31, 2017
| | % of fund's net assets |
| Berkshire Hathaway, Inc. Class B | 3.5 |
| Wells Fargo & Co. | 3.1 |
| U.S. Bancorp | 2.3 |
| Discover Financial Services | 2.3 |
| Synchrony Financial | 2.3 |
| Chubb Ltd. | 2.1 |
| Qualcomm, Inc. | 1.9 |
| Chevron Corp. | 1.9 |
| Amgen, Inc. | 1.9 |
| Capital One Financial Corp. | 1.8 |
| | 23.1 |
Top Five Market Sectors as of December 31, 2017
| | % of fund's net assets |
| Financials | 26.0 |
| Energy | 11.6 |
| Health Care | 11.0 |
| Information Technology | 9.5 |
| Industrials | 9.1 |
Asset Allocation (% of fund's net assets)
| As of December 31, 2017* |
| | Stocks | 99.2% |
| | Short-Term Investments and Net Other Assets (Liabilities) | 0.8% |

* Foreign investments - 19.0%
Investments December 31, 2017
Showing Percentage of Net Assets
| Common Stocks - 99.2% | | | |
| | | Shares | Value |
| CONSUMER DISCRETIONARY - 7.6% | | | |
| Diversified Consumer Services - 1.9% | | | |
| Houghton Mifflin Harcourt Co. (a) | | 231,400 | $2,152,020 |
| Service Corp. International | | 113,200 | 4,224,624 |
| | | | 6,376,644 |
| Hotels, Restaurants & Leisure - 1.9% | | | |
| U.S. Foods Holding Corp. (a) | | 95,000 | 3,033,350 |
| Wyndham Worldwide Corp. | | 31,700 | 3,673,079 |
| | | | 6,706,429 |
| Leisure Products - 0.9% | | | |
| Mattel, Inc. (b) | | 202,000 | 3,106,760 |
| Media - 2.9% | | | |
| Liberty Global PLC Class C (a) | | 126,600 | 4,284,144 |
| Omnicom Group, Inc. | | 41,600 | 3,029,728 |
| Sinclair Broadcast Group, Inc. Class A (b) | | 69,600 | 2,634,360 |
| | | | 9,948,232 |
|
| TOTAL CONSUMER DISCRETIONARY | | | 26,138,065 |
|
| CONSUMER STAPLES - 8.1% | | | |
| Food & Staples Retailing - 2.8% | | | |
| CVS Health Corp. | | 70,800 | 5,133,000 |
| Safeway, Inc.: | | | |
| rights (a)(c) | | 4,600 | 0 |
| rights (a)(c) | | 4,600 | 828 |
| Walgreens Boots Alliance, Inc. | | 62,200 | 4,516,964 |
| | | | 9,650,792 |
| Food Products - 2.9% | | | |
| Darling International, Inc. (a) | | 246,800 | 4,474,484 |
| The J.M. Smucker Co. | | 29,100 | 3,615,384 |
| TreeHouse Foods, Inc. (a) | | 39,900 | 1,973,454 |
| | | | 10,063,322 |
| Personal Products - 0.7% | | | |
| Coty, Inc. Class A | | 121,400 | 2,414,646 |
| Tobacco - 1.7% | | | |
| British American Tobacco PLC sponsored ADR | | 87,100 | 5,834,829 |
|
| TOTAL CONSUMER STAPLES | | | 27,963,589 |
|
| ENERGY - 11.6% | | | |
| Energy Equipment & Services - 1.3% | | | |
| Baker Hughes, a GE Co. Class A | | 56,400 | 1,784,496 |
| Dril-Quip, Inc. (a) | | 59,100 | 2,819,070 |
| | | | 4,603,566 |
| Oil, Gas & Consumable Fuels - 10.3% | | | |
| Boardwalk Pipeline Partners, LP | | 183,700 | 2,371,567 |
| Cabot Oil & Gas Corp. | | 74,200 | 2,122,120 |
| Cheniere Energy, Inc. (a) | | 47,300 | 2,546,632 |
| Chevron Corp. | | 53,292 | 6,671,625 |
| ConocoPhillips Co. | | 86,400 | 4,742,496 |
| EQT Corp. | | 38,200 | 2,174,344 |
| Lundin Petroleum AB | | 163,700 | 3,747,712 |
| Phillips 66 Co. | | 29,400 | 2,973,810 |
| Suncor Energy, Inc. | | 104,400 | 3,832,983 |
| Teekay LNG Partners LP | | 144,600 | 2,913,690 |
| Teekay Offshore Partners LP | | 579,100 | 1,366,676 |
| | | | 35,463,655 |
|
| TOTAL ENERGY | | | 40,067,221 |
|
| FINANCIALS - 26.0% | | | |
| Banks - 7.1% | | | |
| PNC Financial Services Group, Inc. | | 39,400 | 5,685,026 |
| U.S. Bancorp | | 146,947 | 7,873,420 |
| Wells Fargo & Co. | | 177,700 | 10,781,059 |
| | | | 24,339,505 |
| Capital Markets - 4.4% | | | |
| Ares Management LP | | 64,700 | 1,294,000 |
| BlackRock, Inc. Class A | | 9,068 | 4,658,322 |
| Legg Mason, Inc. | | 72,200 | 3,030,956 |
| State Street Corp. | | 41,100 | 4,011,771 |
| The Blackstone Group LP | | 65,500 | 2,097,310 |
| | | | 15,092,359 |
| Consumer Finance - 7.2% | | | |
| Capital One Financial Corp. | | 63,900 | 6,363,162 |
| Discover Financial Services | | 102,100 | 7,853,532 |
| OneMain Holdings, Inc. (a) | | 109,500 | 2,845,905 |
| Synchrony Financial | | 201,000 | 7,760,610 |
| | | | 24,823,209 |
| Diversified Financial Services - 3.5% | | | |
| Berkshire Hathaway, Inc. Class B (a) | | 61,200 | 12,131,066 |
| Insurance - 3.8% | | | |
| American International Group, Inc. | | 65,900 | 3,926,322 |
| Chubb Ltd. | | 50,400 | 7,364,952 |
| FNF Group | | 44,300 | 1,738,332 |
| | | | 13,029,606 |
|
| TOTAL FINANCIALS | | | 89,415,745 |
|
| HEALTH CARE - 11.0% | | | |
| Biotechnology - 3.3% | | | |
| Amgen, Inc. | | 37,600 | 6,538,640 |
| Shire PLC sponsored ADR | | 18,200 | 2,823,184 |
| United Therapeutics Corp. (a) | | 13,700 | 2,026,915 |
| | | | 11,388,739 |
| Health Care Providers & Services - 0.8% | | | |
| McKesson Corp. | | 18,600 | 2,900,670 |
| Pharmaceuticals - 6.9% | | | |
| Allergan PLC | | 29,300 | 4,792,894 |
| GlaxoSmithKline PLC sponsored ADR | | 111,900 | 3,969,093 |
| Jazz Pharmaceuticals PLC (a) | | 38,374 | 5,167,059 |
| Merck & Co., Inc. | | 48,900 | 2,751,603 |
| Novartis AG sponsored ADR | | 36,600 | 3,072,936 |
| Sanofi SA sponsored ADR | | 91,700 | 3,943,100 |
| | | | 23,696,685 |
|
| TOTAL HEALTH CARE | | | 37,986,094 |
|
| INDUSTRIALS - 9.1% | | | |
| Aerospace & Defense - 1.0% | | | |
| Huntington Ingalls Industries, Inc. | | 14,500 | 3,417,650 |
| Airlines - 0.7% | | | |
| American Airlines Group, Inc. | | 48,900 | 2,544,267 |
| Commercial Services & Supplies - 0.9% | | | |
| KAR Auction Services, Inc. | | 58,700 | 2,964,937 |
| Construction & Engineering - 1.1% | | | |
| AECOM (a) | | 99,785 | 3,707,013 |
| Machinery - 1.2% | | | |
| Allison Transmission Holdings, Inc. | | 98,900 | 4,259,623 |
| Road & Rail - 2.0% | | | |
| Avis Budget Group, Inc. (a) | | 98,200 | 4,309,016 |
| Knight-Swift Transportation Holdings, Inc. Class A | | 58,564 | 2,560,418 |
| | | | 6,869,434 |
| Trading Companies & Distributors - 2.2% | | | |
| AerCap Holdings NV (a) | | 85,100 | 4,477,111 |
| HD Supply Holdings, Inc. (a) | | 78,400 | 3,138,352 |
| | | | 7,615,463 |
|
| TOTAL INDUSTRIALS | | | 31,378,387 |
|
| INFORMATION TECHNOLOGY - 9.5% | | | |
| Communications Equipment - 1.1% | | | |
| CommScope Holding Co., Inc. (a) | | 99,000 | 3,745,170 |
| Electronic Equipment & Components - 1.8% | | | |
| Jabil, Inc. | | 98,900 | 2,596,125 |
| TE Connectivity Ltd. | | 38,200 | 3,630,528 |
| | | | 6,226,653 |
| IT Services - 3.9% | | | |
| Amdocs Ltd. | | 51,200 | 3,352,576 |
| Cognizant Technology Solutions Corp. Class A | | 49,500 | 3,515,490 |
| DXC Technology Co. | | 41,000 | 3,890,900 |
| First Data Corp. Class A (a) | | 154,000 | 2,573,340 |
| | | | 13,332,306 |
| Semiconductors & Semiconductor Equipment - 2.7% | | | |
| Analog Devices, Inc. | | 30,200 | 2,688,706 |
| Qualcomm, Inc. | | 106,200 | 6,798,924 |
| | | | 9,487,630 |
|
| TOTAL INFORMATION TECHNOLOGY | | | 32,791,759 |
|
| MATERIALS - 6.0% | | | |
| Chemicals - 5.5% | | | |
| DowDuPont, Inc. | | 82,681 | 5,888,541 |
| Eastman Chemical Co. | | 27,200 | 2,519,808 |
| LyondellBasell Industries NV Class A | | 32,300 | 3,563,336 |
| Potash Corp. of Saskatchewan, Inc. | | 135,300 | 2,774,888 |
| Westlake Chemical Corp. | | 38,500 | 4,101,405 |
| | | | 18,847,978 |
| Containers & Packaging - 0.5% | | | |
| Graphic Packaging Holding Co. | | 109,000 | 1,684,050 |
|
| TOTAL MATERIALS | | | 20,532,028 |
|
| REAL ESTATE - 5.4% | | | |
| Equity Real Estate Investment Trusts (REITs) - 5.4% | | | |
| American Tower Corp. | | 34,600 | 4,936,382 |
| Equity Lifestyle Properties, Inc. | | 35,500 | 3,160,210 |
| Essex Property Trust, Inc. | | 14,300 | 3,451,591 |
| Extra Space Storage, Inc. | | 48,000 | 4,197,600 |
| Outfront Media, Inc. | | 124,900 | 2,897,680 |
| | | | 18,643,463 |
| UTILITIES - 4.9% | | | |
| Electric Utilities - 3.6% | | | |
| Exelon Corp. | | 99,400 | 3,917,354 |
| NextEra Energy, Inc. | | 29,900 | 4,670,081 |
| Xcel Energy, Inc. | | 83,300 | 4,007,563 |
| | | | 12,594,998 |
| Multi-Utilities - 1.3% | | | |
| Sempra Energy | | 40,900 | 4,373,028 |
|
| TOTAL UTILITIES | | | 16,968,026 |
|
| TOTAL COMMON STOCKS | | | |
| (Cost $285,529,281) | | | 341,884,377 |
|
| Money Market Funds - 2.4% | | | |
| Fidelity Cash Central Fund, 1.36% (d) | | 2,323,817 | 2,324,281 |
| Fidelity Securities Lending Cash Central Fund 1.36% (d)(e) | | 5,889,232 | 5,890,409 |
| TOTAL MONEY MARKET FUNDS | | | |
| (Cost $8,214,102) | | | 8,214,690 |
| TOTAL INVESTMENT IN SECURITIES - 101.6% | | | |
| (Cost $293,743,383) | | | 350,099,067 |
| NET OTHER ASSETS (LIABILITIES) - (1.6)% | | | (5,448,152) |
| NET ASSETS - 100% | | | $344,650,915 |
Legend
(a) Non-income producing
(b) Security or a portion of the security is on loan at period end.
(c) Level 3 security
(d) Affiliated fund that is generally available only to investment companies and other accounts managed by Fidelity Investments. The rate quoted is the annualized seven-day yield of the fund at period end. A complete unaudited listing of the fund's holdings as of its most recent quarter end is available upon request. In addition, each Fidelity Central Fund's financial statements, which are not covered by the Fund's Report of Independent Registered Public Accounting Firm, are available on the SEC's website or upon request.
(e) Investment made with cash collateral received from securities on loan.
Affiliated Central Funds
Information regarding fiscal year to date income earned by the Fund from investments in Fidelity Central Funds is as follows:
| Fund | Income earned |
| Fidelity Cash Central Fund | $17,981 |
| Fidelity Securities Lending Cash Central Fund | 132,307 |
| Total | $150,288 |
Amounts in the income column in the above table include any capital gain distributions from underlying funds, which are presented in the corresponding line-item in the Statement of Operations if applicable.
Investment Valuation
The following is a summary of the inputs used, as of December 31, 2017, involving the Fund's assets and liabilities carried at fair value. The inputs or methodology used for valuing securities may not be an indication of the risk associated with investing in those securities. For more information on valuation inputs, and their aggregation into the levels used below, please refer to the Investment Valuation section in the accompanying Notes to Financial Statements.
| | Valuation Inputs at Reporting Date: |
| Description | Total | Level 1 | Level 2 | Level 3 |
| Investments in Securities: | | | | |
| Equities: | | | | |
| Consumer Discretionary | $26,138,065 | $26,138,065 | $-- | $-- |
| Consumer Staples | 27,963,589 | 27,962,761 | -- | 828 |
| Energy | 40,067,221 | 40,067,221 | -- | -- |
| Financials | 89,415,745 | 89,415,745 | -- | -- |
| Health Care | 37,986,094 | 37,986,094 | -- | -- |
| Industrials | 31,378,387 | 31,378,387 | -- | -- |
| Information Technology | 32,791,759 | 32,791,759 | -- | -- |
| Materials | 20,532,028 | 20,532,028 | -- | -- |
| Real Estate | 18,643,463 | 18,643,463 | -- | -- |
| Utilities | 16,968,026 | 16,968,026 | -- | -- |
| Money Market Funds | 8,214,690 | 8,214,690 | -- | -- |
| Total Investments in Securities: | $350,099,067 | $350,098,239 | $-- | $828 |
Other Information
Distribution of investments by country or territory of incorporation, as a percentage of Total Net Assets, is as follows (Unaudited):
| United States of America | 81.0% |
| Switzerland | 4.1% |
| Ireland | 2.9% |
| United Kingdom | 2.4% |
| Netherlands | 2.4% |
| Canada | 1.9% |
| Marshall Islands | 1.3% |
| France | 1.1% |
| Sweden | 1.1% |
| Bailiwick of Guernsey | 1.0% |
| Others (Individually Less Than 1%) | 0.8% |
| | 100.0% |
See accompanying notes which are an integral part of the financial statements.
Financial Statements
Statement of Assets and Liabilities
| | | December 31, 2017 |
| Assets | | |
Investment in securities, at value (including securities loaned of $5,735,797) — See accompanying schedule:
Unaffiliated issuers (cost $285,529,281) | $341,884,377 | |
| Fidelity Central Funds (cost $8,214,102) | 8,214,690 | |
| Total Investment in Securities (cost $293,743,383) | | $350,099,067 |
| Receivable for investments sold | | 9,566 |
| Receivable for fund shares sold | | 493,321 |
| Dividends receivable | | 495,381 |
| Distributions receivable from Fidelity Central Funds | | 3,861 |
| Prepaid expenses | | 573 |
| Other receivables | | 15,331 |
| Total assets | | 351,117,100 |
| Liabilities | | |
| Payable for fund shares redeemed | $367,388 | |
| Accrued management fee | 154,119 | |
| Distribution and service plan fees payable | 1,994 | |
| Other affiliated payables | 43,622 | |
| Other payables and accrued expenses | 8,637 | |
| Collateral on securities loaned | 5,890,425 | |
| Total liabilities | | 6,466,185 |
| Net Assets | | $344,650,915 |
| Net Assets consist of: | | |
| Paid in capital | | $275,823,284 |
| Undistributed net investment income | | 544,658 |
| Accumulated undistributed net realized gain (loss) on investments and foreign currency transactions | | 11,926,802 |
| Net unrealized appreciation (depreciation) on investments and assets and liabilities in foreign currencies | | 56,356,171 |
| Net Assets | | $344,650,915 |
| Initial Class: | | |
| Net Asset Value, offering price and redemption price per share ($130,365,415 ÷ 7,967,810 shares) | | $16.36 |
| Service Class: | | |
| Net Asset Value, offering price and redemption price per share ($368,184 ÷ 22,512 shares) | | $16.36 |
| Service Class 2: | | |
| Net Asset Value, offering price and redemption price per share ($9,474,258 ÷ 586,662 shares) | | $16.15 |
| Investor Class: | | |
| Net Asset Value, offering price and redemption price per share ($204,443,058 ÷ 12,516,947 shares) | | $16.33 |
See accompanying notes which are an integral part of the financial statements.
Statement of Operations
| | | Year ended December 31, 2017 |
| Investment Income | | |
| Dividends | | $5,760,579 |
| Special dividends | | 838,250 |
| Income from Fidelity Central Funds | | 150,288 |
| Total income | | 6,749,117 |
| Expenses | | |
| Management fee | $1,824,255 | |
| Transfer agent fees | 380,518 | |
| Distribution and service plan fees | 23,888 | |
| Accounting and security lending fees | 131,757 | |
| Custodian fees and expenses | 15,329 | |
| Independent trustees' fees and expenses | 1,328 | |
| Audit | 60,146 | |
| Legal | 9,437 | |
| Miscellaneous | 2,467 | |
| Total expenses before reductions | 2,449,125 | |
| Expense reductions | (11,420) | 2,437,705 |
| Net investment income (loss) | | 4,311,412 |
| Realized and Unrealized Gain (Loss) | | |
| Net realized gain (loss) on: | | |
| Investment securities: | | |
| Unaffiliated issuers | 22,474,531 | |
| Fidelity Central Funds | (1,032) | |
| Foreign currency transactions | (7) | |
| Total net realized gain (loss) | | 22,473,492 |
| Change in net unrealized appreciation (depreciation) on: | | |
| Investment securities: | | |
| Unaffiliated issuers | 21,691,516 | |
| Fidelity Central Funds | 429 | |
| Assets and liabilities in foreign currencies | 677 | |
| Total change in net unrealized appreciation (depreciation) | | 21,692,622 |
| Net gain (loss) | | 44,166,114 |
| Net increase (decrease) in net assets resulting from operations | | $48,477,526 |
See accompanying notes which are an integral part of the financial statements.
Statement of Changes in Net Assets
| | Year ended December 31, 2017 | Year ended December 31, 2016 |
| Increase (Decrease) in Net Assets | | |
| Operations | | |
| Net investment income (loss) | $4,311,412 | $4,044,168 |
| Net realized gain (loss) | 22,473,492 | (32,458) |
| Change in net unrealized appreciation (depreciation) | 21,692,622 | 32,148,857 |
| Net increase (decrease) in net assets resulting from operations | 48,477,526 | 36,160,567 |
| Distributions to shareholders from net investment income | (4,225,252) | (3,248,298) |
| Distributions to shareholders from net realized gain | (9,151,368) | (1,680,072) |
| Total distributions | (13,376,620) | (4,928,370) |
| Share transactions - net increase (decrease) | (21,148,773) | (10,012,931) |
| Total increase (decrease) in net assets | 13,952,133 | 21,219,266 |
| Net Assets | | |
| Beginning of period | 330,698,782 | 309,479,516 |
| End of period | $344,650,915 | $330,698,782 |
| Other Information | | |
| Undistributed net investment income end of period | $544,658 | $628,031 |
See accompanying notes which are an integral part of the financial statements.
Financial Highlights
VIP Value Portfolio Initial Class
| Years ended December 31, | 2017 | 2016 | 2015 | 2014 | 2013 |
| Selected Per–Share Data | | | | | |
| Net asset value, beginning of period | $14.74 | $13.36 | $16.04 | $15.18 | $12.60 |
| Income from Investment Operations | | | | | |
| Net investment income (loss)A | .21B | .18 | .21 | .24C | .19 |
| Net realized and unrealized gain (loss) | 2.07 | 1.43 | (.35) | 1.47 | 3.84 |
| Total from investment operations | 2.28 | 1.61 | (.14) | 1.71 | 4.03 |
| Distributions from net investment income | (.21) | (.15) | (.21) | (.22) | (.17) |
| Distributions from net realized gain | (.45) | (.07) | (2.33) | (.63) | (1.27) |
| Total distributions | (.66) | (.23)D | (2.54) | (.85) | (1.45)E |
| Net asset value, end of period | $16.36 | $14.74 | $13.36 | $16.04 | $15.18 |
| Total ReturnF,G | 15.58% | 12.08% | (.75)% | 11.41% | 32.46% |
| Ratios to Average Net AssetsH,I | | | | | |
| Expenses before reductions | .68% | .69% | .69% | .69% | .71% |
| Expenses net of fee waivers, if any | .68% | .69% | .69% | .69% | .70% |
| Expenses net of all reductions | .67% | .69% | .68% | .69% | .70% |
| Net investment income (loss) | 1.34%B | 1.33% | 1.35% | 1.54%C | 1.27% |
| Supplemental Data | | | | | |
| Net assets, end of period (000 omitted) | $130,365 | $126,526 | $129,151 | $130,678 | $115,004 |
| Portfolio turnover rateJ | 55% | 63% | 78%K | 53% | 96% |
A Calculated based on average shares outstanding during the period.
B Net Investment income per share reflects a large, non-recurring dividend which amounted to $.04 per share. Excluding this non-recurring dividend, the ratio of net investment income (loss) to average net assets would have been 1.09%.
C Net Investment income per share reflects a large, non-recurring dividend which amounted to $.05 per share. Excluding this non-recurring dividend, the ratio of net investment income (loss) to average net assets would have been 1.22%.
D Total distributions of $.23 per share is comprised of distributions from net investment income of $.152 and distributions from net realized gain of $.074 per share.
E Total distributions of $1.45 per share is comprised of distributions from net investment income of $.172 and distributions from net realized gain of $1.274 per share.
F Total returns do not reflect charges attributable to your insurance company's separate account. Inclusion of these charges would reduce the total returns shown.
G Total returns would have been lower if certain expenses had not been reduced during the applicable periods shown.
H Fees and expenses of any underlying Fidelity Central Funds are not included in the Fund's expense ratio. The Fund indirectly bears its proportionate share of the expenses of any underlying Fidelity Central Funds.
I Expense ratios reflect operating expenses of the class. Expenses before reductions do not reflect amounts reimbursed by the investment adviser or reductions from brokerage service arrangements or reductions from other expense offset arrangements and do not represent the amount paid by the class during periods when reimbursements or reductions occur. Expenses net of fee waivers reflect expenses after reimbursement by the investment adviser but prior to reductions from brokerage service arrangements or other expense offset arrangements. Expenses net of all reductions represent the net expenses paid by the class.
J Amount does not include the portfolio activity of any underlying Fidelity Central Funds.
K The portfolio turnover rate does not include the assets acquired in the merger.
See accompanying notes which are an integral part of the financial statements.
VIP Value Portfolio Service Class
| Years ended December 31, | 2017 | 2016 | 2015 | 2014 | 2013 |
| Selected Per–Share Data | | | | | |
| Net asset value, beginning of period | $14.73 | $13.36 | $16.04 | $15.18 | $12.60 |
| Income from Investment Operations | | | | | |
| Net investment income (loss)A | .19B | .17 | .19 | .23C | .17 |
| Net realized and unrealized gain (loss) | 2.08 | 1.41 | (.34) | 1.47 | 3.84 |
| Total from investment operations | 2.27 | 1.58 | (.15) | 1.70 | 4.01 |
| Distributions from net investment income | (.20) | (.14) | (.20) | (.21) | (.15) |
| Distributions from net realized gain | (.45) | (.07) | (2.33) | (.63) | (1.27) |
| Total distributions | (.64)D | (.21) | (2.53) | (.84) | (1.43)E |
| Net asset value, end of period | $16.36 | $14.73 | $13.36 | $16.04 | $15.18 |
| Total ReturnF,G | 15.53% | 11.90% | (.82)% | 11.31% | 32.29% |
| Ratios to Average Net AssetsH,I | | | | | |
| Expenses before reductions | .78% | .79% | .78% | .79% | .80% |
| Expenses net of fee waivers, if any | .78% | .79% | .78% | .79% | .80% |
| Expenses net of all reductions | .77% | .79% | .78% | .79% | .79% |
| Net investment income (loss) | 1.24%B | 1.23% | 1.25% | 1.44%C | 1.18% |
| Supplemental Data | | | | | |
| Net assets, end of period (000 omitted) | $368 | $400 | $520 | $230 | $214 |
| Portfolio turnover rateJ | 55% | 63% | 78%K | 53% | 96% |
A Calculated based on average shares outstanding during the period.
B Net Investment income per share reflects a large, non-recurring dividend which amounted to $.04 per share. Excluding this non-recurring dividend, the ratio of net investment income (loss) to average net assets would have been .99%.
C Net Investment income per share reflects a large, non-recurring dividend which amounted to $.05 per share. Excluding this non-recurring dividend, the ratio of net investment income (loss) to average net assets would have been 1.12%.
D Total distributions of $.64 per share is comprised of distributions from net investment income of $.195 and distributions from net realized gain of $.449 per share.
E Total distributions of $1.43 per share is comprised of distributions from net investment income of $.152 and distributions from net realized gain of $1.274 per share.
F Total returns do not reflect charges attributable to your insurance company's separate account. Inclusion of these charges would reduce the total returns shown.
G Total returns would have been lower if certain expenses had not been reduced during the applicable periods shown.
H Fees and expenses of any underlying Fidelity Central Funds are not included in the Fund's expense ratio. The Fund indirectly bears its proportionate share of the expenses of any underlying Fidelity Central Funds.
I Expense ratios reflect operating expenses of the class. Expenses before reductions do not reflect amounts reimbursed by the investment adviser or reductions from brokerage service arrangements or reductions from other expense offset arrangements and do not represent the amount paid by the class during periods when reimbursements or reductions occur. Expenses net of fee waivers reflect expenses after reimbursement by the investment adviser but prior to reductions from brokerage service arrangements or other expense offset arrangements. Expenses net of all reductions represent the net expenses paid by the class.
J Amount does not include the portfolio activity of any underlying Fidelity Central Funds.
K The portfolio turnover rate does not include the assets acquired in the merger.
See accompanying notes which are an integral part of the financial statements.
VIP Value Portfolio Service Class 2
| Years ended December 31, | 2017 | 2016 | 2015 | 2014 | 2013 |
| Selected Per–Share Data | | | | | |
| Net asset value, beginning of period | $14.55 | $13.21 | $15.89 | $15.05 | $12.50 |
| Income from Investment Operations | | | | | |
| Net investment income (loss)A | .17B | .15 | .17 | .20C | .15 |
| Net realized and unrealized gain (loss) | 2.05 | 1.39 | (.34) | 1.45 | 3.81 |
| Total from investment operations | 2.22 | 1.54 | (.17) | 1.65 | 3.96 |
| Distributions from net investment income | (.17) | (.13) | (.18) | (.18) | (.14) |
| Distributions from net realized gain | (.45) | (.07) | (2.33) | (.63) | (1.27) |
| Total distributions | (.62) | (.20) | (2.51) | (.81) | (1.41) |
| Net asset value, end of period | $16.15 | $14.55 | $13.21 | $15.89 | $15.05 |
| Total ReturnD,E | 15.36% | 11.71% | (.97)% | 11.11% | 32.18% |
| Ratios to Average Net AssetsF,G | | | | | |
| Expenses before reductions | .93% | .94% | .93% | .94% | .96% |
| Expenses net of fee waivers, if any | .93% | .94% | .93% | .94% | .96% |
| Expenses net of all reductions | .92% | .94% | .93% | .94% | .95% |
| Net investment income (loss) | 1.09%B | 1.08% | 1.10% | 1.29%C | 1.01% |
| Supplemental Data | | | | | |
| Net assets, end of period (000 omitted) | $9,474 | $9,050 | $9,026 | $7,945 | $5,831 |
| Portfolio turnover rateH | 55% | 63% | 78%I | 53% | 96% |
A Calculated based on average shares outstanding during the period.
B Net Investment income per share reflects a large, non-recurring dividend which amounted to $.04 per share. Excluding this non-recurring dividend, the ratio of net investment income (loss) to average net assets would have been .84%.
C Net Investment income per share reflects a large, non-recurring dividend which amounted to $.05 per share. Excluding this non-recurring dividend, the ratio of net investment income (loss) to average net assets would have been .97%.
D Total returns do not reflect charges attributable to your insurance company's separate account. Inclusion of these charges would reduce the total returns shown.
E Total returns would have been lower if certain expenses had not been reduced during the applicable periods shown.
F Fees and expenses of any underlying Fidelity Central Funds are not included in the Fund's expense ratio. The Fund indirectly bears its proportionate share of the expenses of any underlying Fidelity Central Funds.
G Expense ratios reflect operating expenses of the class. Expenses before reductions do not reflect amounts reimbursed by the investment adviser or reductions from brokerage service arrangements or reductions from other expense offset arrangements and do not represent the amount paid by the class during periods when reimbursements or reductions occur. Expenses net of fee waivers reflect expenses after reimbursement by the investment adviser but prior to reductions from brokerage service arrangements or other expense offset arrangements. Expenses net of all reductions represent the net expenses paid by the class.
H Amount does not include the portfolio activity of any underlying Fidelity Central Funds.
I The portfolio turnover rate does not include the assets acquired in the merger.
See accompanying notes which are an integral part of the financial statements.
VIP Value Portfolio Investor Class
| Years ended December 31, | 2017 | 2016 | 2015 | 2014 | 2013 |
| Selected Per–Share Data | | | | | |
| Net asset value, beginning of period | $14.71 | $13.35 | $16.02 | $15.17 | $12.59 |
| Income from Investment Operations | | | | | |
| Net investment income (loss)A | .20B | .17 | .19 | .23C | .18 |
| Net realized and unrealized gain (loss) | 2.07 | 1.41 | (.33) | 1.46 | 3.84 |
| Total from investment operations | 2.27 | 1.58 | (.14) | 1.69 | 4.02 |
| Distributions from net investment income | (.20) | (.14) | (.20) | (.21) | (.16) |
| Distributions from net realized gain | (.45) | (.07) | (2.33) | (.63) | (1.27) |
| Total distributions | (.65) | (.22)D | (2.53) | (.84) | (1.44)E |
| Net asset value, end of period | $16.33 | $14.71 | $13.35 | $16.02 | $15.17 |
| Total ReturnF,G | 15.52% | 11.88% | (.76)% | 11.28% | 32.42% |
| Ratios to Average Net AssetsH,I | | | | | |
| Expenses before reductions | .76% | .77% | .77% | .77% | .78% |
| Expenses net of fee waivers, if any | .76% | .77% | .76% | .77% | .78% |
| Expenses net of all reductions | .75% | .77% | .76% | .77% | .78% |
| Net investment income (loss) | 1.26%B | 1.25% | 1.27% | 1.46%C | 1.19% |
| Supplemental Data | | | | | |
| Net assets, end of period (000 omitted) | $204,443 | $194,723 | $170,782 | $154,089 | $110,911 |
| Portfolio turnover rateJ | 55% | 63% | 78%K | 53% | 96% |
A Calculated based on average shares outstanding during the period.
B Net Investment income per share reflects a large, non-recurring dividend which amounted to $.04 per share. Excluding this non-recurring dividend, the ratio of net investment income (loss) to average net assets would have been 1.01%.
C Net Investment income per share reflects a large, non-recurring dividend which amounted to $.05 per share. Excluding this non-recurring dividend, the ratio of net investment income (loss) to average net assets would have been 1.14%.
D Total distributions of $.22 per share is comprised of distributions from net investment income of $.144 and distributions from net realized gain of $.074 per share.
E Total distributions of $1.44 per share is comprised of distributions from net investment income of $.163 and distributions from net realized gain of $1.274 per share.
F Total returns do not reflect charges attributable to your insurance company's separate account. Inclusion of these charges would reduce the total returns shown.
G Total returns would have been lower if certain expenses had not been reduced during the applicable periods shown.
H Fees and expenses of any underlying Fidelity Central Funds are not included in the Fund's expense ratio. The Fund indirectly bears its proportionate share of the expenses of any underlying Fidelity Central Funds.
I Expense ratios reflect operating expenses of the class. Expenses before reductions do not reflect amounts reimbursed by the investment adviser or reductions from brokerage service arrangements or reductions from other expense offset arrangements and do not represent the amount paid by the class during periods when reimbursements or reductions occur. Expenses net of fee waivers reflect expenses after reimbursement by the investment adviser but prior to reductions from brokerage service arrangements or other expense offset arrangements. Expenses net of all reductions represent the net expenses paid by the class.
J Amount does not include the portfolio activity of any underlying Fidelity Central Funds.
K The portfolio turnover rate does not include the assets acquired in the merger.
See accompanying notes which are an integral part of the financial statements.
Notes to Financial Statements
For the period ended December 31, 2017
1. Organization.
VIP Value Portfolio (the Fund) is a fund of Variable Insurance Products Fund (the Trust) and is authorized to issue an unlimited number of shares. The Trust is registered under the Investment Company Act of 1940, as amended (the 1940 Act), as an open-end management investment company organized as a Massachusetts business trust. Shares of the Fund may only be purchased by insurance companies for the purpose of funding variable annuity or variable life insurance contracts. The Fund offers the following classes of shares: Initial Class shares, Service Class shares, Service Class 2 shares and Investor Class shares. All classes have equal rights and voting privileges, except for matters affecting a single class.
2. Investments in Fidelity Central Funds.
The Fund invests in Fidelity Central Funds, which are open-end investment companies generally available only to other investment companies and accounts managed by the investment adviser and its affiliates. The Fund's Schedule of Investments lists each of the Fidelity Central Funds held as of period end, if any, as an investment of the Fund, but does not include the underlying holdings of each Fidelity Central Fund. As an Investing Fund, the Fund indirectly bears its proportionate share of the expenses of the underlying Fidelity Central Funds.
The Money Market Central Funds seek preservation of capital and current income and are managed by Fidelity Investments Money Management, Inc. (FIMM), an affiliate of the investment adviser. Annualized expenses of the Money Market Central Funds as of their most recent shareholder report date are less than .005%.
A complete unaudited list of holdings for each Fidelity Central Fund is available upon request or at the Securities and Exchange Commission (the SEC) website at www.sec.gov. In addition, the financial statements of the Fidelity Central Funds, which are not covered by the Fund's Report of Independent Registered Public Accounting Firm, are available on the SEC website or upon request.
3. Significant Accounting Policies.
The Fund is an investment company and applies the accounting and reporting guidance of the Financial Accounting Standards Board (FASB) Accounting Standards Codification Topic 946 Financial Services – Investments Companies. The financial statements have been prepared in conformity with accounting principles generally accepted in the United States of America (GAAP), which require management to make certain estimates and assumptions at the date of the financial statements. Actual results could differ from those estimates. Subsequent events, if any, through the date that the financial statements were issued have been evaluated in the preparation of the financial statements. The following summarizes the significant accounting policies of the Fund:
Investment Valuation. Investments are valued as of 4:00 p.m. Eastern time on the last calendar day of the period. The Board of Trustees (the Board) has delegated the day to day responsibility for the valuation of the Fund's investments to the Fair Value Committee (the Committee) established by the Fund's investment adviser. In accordance with valuation policies and procedures approved by the Board, the Fund attempts to obtain prices from one or more third party pricing vendors or brokers to value its investments. When current market prices, quotations or currency exchange rates are not readily available or reliable, investments will be fair valued in good faith by the Committee, in accordance with procedures adopted by the Board. Factors used in determining fair value vary by investment type and may include market or investment specific events. The frequency with which these procedures are used cannot be predicted and they may be utilized to a significant extent. The Committee oversees the Fund's valuation policies and procedures and reports to the Board on the Committee's activities and fair value determinations. The Board monitors the appropriateness of the procedures used in valuing the Fund's investments and ratifies the fair value determinations of the Committee.
The Fund categorizes the inputs to valuation techniques used to value its investments into a disclosure hierarchy consisting of three levels as shown below:
- Level 1 – quoted prices in active markets for identical investments
- Level 2 – other significant observable inputs (including quoted prices for similar investments, interest rates, prepayment speeds, etc.)
- Level 3 – unobservable inputs (including the Fund's own assumptions based on the best information available)
Valuation techniques used to value the Fund's investments by major category are as follows:
Equity securities, including restricted securities, for which market quotations are readily available, are valued at the last reported sale price or official closing price as reported by a third party pricing vendor on the primary market or exchange on which they are traded and are categorized as Level 1 in the hierarchy. In the event there were no sales during the day or closing prices are not available, securities are valued at the last quoted bid price or may be valued using the last available price and are generally categorized as Level 2 in the hierarchy. For foreign equity securities, when market or security specific events arise, comparisons to the valuation of American Depositary Receipts (ADRs), futures contracts, Exchange-Traded Funds (ETFs) and certain indexes as well as quoted prices for similar securities may be used and would be categorized as Level 2 in the hierarchy. Utilizing these techniques may result in transfers between Level 1 and Level 2. For equity securities, including restricted securities, where observable inputs are limited, assumptions about market activity and risk are used and these securities may be categorized as Level 3 in the hierarchy.
Investments in open-end mutual funds, including the Fidelity Central Funds, are valued at their closing net asset value (NAV) each business day and are categorized as Level 1 in the hierarchy
Changes in valuation techniques may result in transfers in or out of an assigned level within the disclosure hierarchy. The aggregate value of investments by input level as of December 31, 2017 is included at the end of the Fund's Schedule of Investments.
Foreign Currency. The Fund may use foreign currency contracts to facilitate transactions in foreign-denominated securities. Gains and losses from these transactions may arise from changes in the value of the foreign currency or if the counterparties do not perform under the contracts' terms.
Foreign-denominated assets, including investment securities, and liabilities are translated into U.S. dollars at the exchange rates at period end. Purchases and sales of investment securities, income and dividends received and expenses denominated in foreign currencies are translated into U.S. dollars at the exchange rate in effect on the transaction date.
The effects of exchange rate fluctuations on investments are included with the net realized and unrealized gain (loss) on investment securities. Other foreign currency transactions resulting in realized and unrealized gain (loss) are disclosed separately.
Investment Transactions and Income. For financial reporting purposes, the Fund's investment holdings and NAV include trades executed through the end of the last business day of the period. The NAV per share for processing shareholder transactions is calculated as of the close of business of the New York Stock Exchange (NYSE), normally 4:00 p.m. Eastern time and includes trades executed through the end of the prior business day. Gains and losses on securities sold are determined on the basis of identified cost and includes proceeds received from litigation. Dividend income is recorded on the ex-dividend date, except for certain dividends from foreign securities where the ex-dividend date may have passed, which are recorded as soon as the Fund is informed of the ex-dividend date. Non-cash dividends included in dividend income, if any, are recorded at the fair market value of the securities received. Income and capital gain distributions from Fidelity Central Funds, if any, are recorded on the ex-dividend date. Certain distributions received by the Fund represent a return of capital or capital gain. The Fund determines the components of these distributions subsequent to the ex-dividend date, based upon receipt of tax filings or other correspondence relating to the underlying investment. These distributions are recorded as a reduction of cost of investments and/or as a realized gain. Large, non-recurring dividends recognized by the Fund are presented separately on the Statement of Operations as "Special Dividends" and the impact of these dividends is presented in the Financial Highlights. Investment income is recorded net of foreign taxes withheld where recovery of such taxes is uncertain.
Class Allocations and Expenses. Investment income, realized and unrealized capital gains and losses, common expenses of the Fund, and certain fund-level expense reductions, if any, are allocated daily on a pro-rata basis to each class based on the relative net assets of each class to the total net assets of the Fund. Each class differs with respect to transfer agent and distribution and service plan fees incurred. Certain expense reductions may also differ by class. For the reporting period, the allocated portion of income and expenses to each class as a percent of its average net assets may vary due to the timing of recording these transactions in relation to fluctuating net assets of the classes. Expenses directly attributable to a fund are charged to that fund. Expenses attributable to more than one fund are allocated among the respective funds on the basis of relative net assets or other appropriate methods. Expense estimates are accrued in the period to which they relate and adjustments are made when actual amounts are known.
Income Tax Information and Distributions to Shareholders. Each year, the Fund intends to qualify as a regulated investment company under Subchapter M of the Internal Revenue Code, including distributing substantially all of its taxable income and realized gains. As a result, no provision for U.S. Federal income taxes is required. As of December 31, 2017, the Fund did not have any unrecognized tax benefits in the financial statements; nor is the Fund aware of any tax positions for which it is reasonably possible that the total amounts of unrecognized tax benefits will significantly change in the next twelve months. The Fund files a U.S. federal tax return, in addition to state and local tax returns as required. The Fund's federal income tax returns are subject to examination by the Internal Revenue Service (IRS) for a period of three fiscal years after they are filed. State and local tax returns may be subject to examination for an additional fiscal year depending on the jurisdiction. Foreign taxes are provided for based on the Fund's understanding of the tax rules and rates that exist in the foreign markets in which it invests.
Distributions are declared and recorded on the ex-dividend date. Income dividends and capital gain distributions are declared separately for each class. Income and capital gain distributions are determined in accordance with income tax regulations, which may differ from GAAP.
Capital accounts within the financial statements are adjusted for permanent book-tax differences. These adjustments have no impact on net assets or the results of operations. Capital accounts are not adjusted for temporary book-tax differences which will reverse in a subsequent period.
Book-tax differences are primarily due to foreign currency transactions, partnerships, and losses deferred due to wash sales, and excise tax regulations.
As of period end, the cost and unrealized appreciation (depreciation) in securities, and derivatives if applicable, for federal income tax purposes were as follows:
| Gross unrealized appreciation | $68,279,780 |
| Gross unrealized depreciation | (11,736,098) |
| Net unrealized appreciation (depreciation) | $56,543,682 |
| Tax Cost | $293,555,385 |
The tax-based components of distributable earnings as of period end were as follows:
| Undistributed ordinary income | $1,643,931 |
| Undistributed long-term capital gain | $10,639,533 |
| Net unrealized appreciation (depreciation) on securities and other investments | $56,544,169 |
The tax character of distributions paid was as follows:
| | December 31, 2017 | December 31, 2016 |
| Ordinary Income | $13,376,620 | $ 3,960,421 |
| Long-term Capital Gains | – | 967,949 |
| Total | $13,376,620 | $ 4,928,370 |
4. Purchases and Sales of Investments.
Purchases and sales of securities, other than short-term securities, aggregated $182,353,963 and $210,614,104 respectively.
5. Fees and Other Transactions with Affiliates.
Management Fee. Fidelity Management & Research Company (the investment adviser) and its affiliates provide the Fund with investment management related services for which the Fund pays a monthly management fee. The management fee is the sum of an individual fund fee rate that is based on an annual rate of .30% of the Fund's average net assets and an annualized group fee rate that averaged .24% during the period. The group fee rate is based upon the average net assets of all the mutual funds advised by the investment adviser, including any mutual funds previously advised by the investment adviser that are currently advised by Fidelity SelectCo, LLC, an affiliate of the investment adviser. The group fee rate decreases as assets under management increase and increases as assets under management decrease. For the reporting period, the total annual management fee rate was .54% of the Fund's average net assets.
Distribution and Service Plan Fees. In accordance with Rule 12b-1 of the 1940 Act, the Fund has adopted separate 12b-1 Plans for each Service Class of shares. Each Service Class pays Fidelity Distributors Corporation (FDC), an affiliate of the investment adviser, a service fee. For the period, the service fee is based on an annual rate of .10% of Service Class' average net assets and .25% of Service Class 2's average net assets.
For the period, total fees, all of which were re-allowed to insurance companies for the distribution of shares and providing shareholder support services, were as follows:
| Service Class | $392 |
| Service Class 2 | 23,496 |
| | $23,888 |
Transfer Agent Fees. Fidelity Investments Institutional Operations Company, Inc. (FIIOC), an affiliate of the investment adviser, is the Fund's transfer, dividend disbursing, and shareholder servicing agent. FIIOC receives an asset-based fee with respect to each class. Each class pays a fee for transfer agent services, typesetting and printing and mailing of shareholder reports, excluding mailing of proxy statements, equal to an annual rate of class-level average net assets. The annual rate for Investor Class is .15% and the annual rate for all other classes is .07%. For the period, transfer agent fees for each class were as follows:
| Initial Class | $84,504 |
| Service Class | 258 |
| Service Class 2 | 6,196 |
| Investor Class | 289,560 |
| | $380,518 |
Accounting and Security Lending Fees. Fidelity Service Company, Inc. (FSC), an affiliate of the investment adviser, maintains the Fund's accounting records. The accounting fee is based on the level of average net assets for each month. Under a separate contract, FSC administers the security lending program. The security lending fee is based on the number and duration of lending transactions.
Brokerage Commissions. The Fund placed a portion of its portfolio transactions with brokerage firms which are affiliates of the investment adviser. Brokerage commissions are included in net realized gain (loss) and change in net unrealized appreciation (depreciation) in the Statement of Operations. The commissions paid to these affiliated firms were $7,323 for the period.
Interfund Trades. The Fund may purchase from or sell securities to other Fidelity Funds under procedures adopted by the Board. The procedures have been designed to ensure these interfund trades are executed in accordance with Rule 17a-7 of the 1940 Act. Interfund trades are included within the respective purchases and sales amounts shown in the Purchases and Sales of Investments note.
6. Committed Line of Credit.
The Fund participates with other funds managed by the investment adviser or an affiliate in a $4.25 billion credit facility (the "line of credit") to be utilized for temporary or emergency purposes to fund shareholder redemptions or for other short-term liquidity purposes. The Fund has agreed to pay commitment fees on its pro-rata portion of the line of credit, which amounted to $1,064 and is reflected in Miscellaneous expenses on the Statement of Operations. During the period, the Fund did not borrow on this line of credit.
7. Security Lending.
The Fund lends portfolio securities through a lending agent from time to time in order to earn additional income. For equity securities, a lending agent is used and may loan securities to certain qualified borrowers, including Fidelity Capital Markets (FCM), a broker-dealer affiliated with the Fund. On the settlement date of the loan, the Fund receives collateral (in the form of U.S. Treasury obligations, letters of credit and/or cash) against the loaned securities and maintains collateral in an amount not less than 100% of the market value of the loaned securities during the period of the loan. The market value of the loaned securities is determined at the close of business of the Fund and any additional required collateral is delivered to the Fund on the next business day. The Fund or borrower may terminate the loan at any time, and if the borrower defaults on its obligation to return the securities loaned because of insolvency or other reasons, the Fund may apply collateral received from the borrower against the obligation. The Fund may experience delays and costs in recovering the securities loaned. Any cash collateral received is invested in the Fidelity Securities Lending Cash Central Fund. The value of loaned securities and cash collateral at period end are disclosed on the Fund's Statement of Assets and Liabilities. At period end, there were no security loans outstanding with FCM. Security lending income represents the income earned on investing cash collateral, less rebates paid to borrowers and any lending agent fees associated with the loan, plus any premium payments received for lending certain types of securities. Security lending income is presented in the Statement of Operations as a component of income from Fidelity Central Funds. Total security lending income during the period amounted to $132,307, including $23 from securities loaned to FCM.
8. Expense Reductions.
Commissions paid to certain brokers with whom the investment adviser, or its affiliates, places trades on behalf of the Fund include an amount in addition to trade execution, which may be rebated back to the Fund to offset certain expenses. This amount totaled $8,455 for the period.
In addition, during the period the investment adviser reimbursed and/or waived a portion of fund-level operating expenses in the amount of $2,965.
9. Distributions to Shareholders.
Distributions to shareholders of each class were as follows:
| | Year ended December 31, 2017 | Year ended December 31, 2016 |
| From net investment income | | |
| Initial Class | $1,675,473 | $1,291,402 |
| Service Class | 4,429 | 3,726 |
| Service Class 2 | 100,362 | 76,312 |
| Investor Class | 2,444,988 | 1,876,858 |
| Total | $4,225,252 | $3,248,298 |
| From net realized gain | | |
| Initial Class | $3,476,918 | $678,785 |
| Service Class | 9,850 | 2,511 |
| Service Class 2 | 253,688 | 45,648 |
| Investor Class | 5,410,912 | 953,128 |
| Total | $9,151,368 | $1,680,072 |
10. Share Transactions.
Transactions for each class of shares were as follows:
| | Shares | Shares | Dollars | Dollars |
| | Year ended December 31, 2017 | Year ended December 31, 2016 | Year ended December 31, 2017 | Year ended December 31, 2016 |
| Initial Class | | | | |
| Shares sold | 1,179,492 | 1,389,439 | $18,495,462 | $18,854,781 |
| Reinvestment of distributions | 321,427 | 138,411 | 5,152,391 | 1,970,187 |
| Shares redeemed | (2,118,307) | (2,606,038) | (33,276,481) | (35,821,563) |
| Net increase (decrease) | (617,388) | (1,078,188) | $(9,628,628) | $(14,996,595) |
| Service Class | | | | |
| Shares sold | 1 | 5 | $22 | $61 |
| Reinvestment of distributions | 891 | 444 | 14,279 | 6,237 |
| Shares redeemed | (5,555) | (12,204) | (88,594) | (164,490) |
| Net increase (decrease) | (4,663) | (11,755) | $(74,293) | $(158,192) |
| Service Class 2 | | | | |
| Shares sold | 149,201 | 258,586 | $2,269,208 | $3,428,570 |
| Reinvestment of distributions | 22,362 | 8,693 | 354,050 | 121,960 |
| Shares redeemed | (206,693) | (328,715) | (3,191,721) | (4,317,938) |
| Net increase (decrease) | (35,130) | (61,436) | $(568,463) | $(767,408) |
| Investor Class | | | | |
| Shares sold | 1,379,999 | 3,052,244 | $21,590,812 | $41,662,069 |
| Reinvestment of distributions | 490,613 | 198,479 | 7,855,900 | 2,829,986 |
| Shares redeemed | (2,587,901) | (2,811,946) | (40,324,101) | (38,582,791) |
| Net increase (decrease) | (717,289) | 438,777 | $(10,877,389) | $5,909,264 |
11. Other.
The Fund's organizational documents provide former and current trustees and officers with a limited indemnification against liabilities arising in connection with the performance of their duties to the Fund. In the normal course of business, the Fund may also enter into contracts that provide general indemnifications. The Fund's maximum exposure under these arrangements is unknown as this would be dependent on future claims that may be made against the Fund. The risk of material loss from such claims is considered remote.
At the end of the period, the investment adviser or its affiliates were the owners of record of 51% of the total outstanding shares of the Fund. In addition, at the end of the period, VIP Freedom 2020 Portfolio was the owner of record of approximately 11% of the total outstanding shares of the Fund. Mutual funds managed by the investment adviser or its affiliates were the owners of record, in the aggregate, of approximately 45% of the total outstanding shares of the Fund.
Report of Independent Registered Public Accounting Firm
To the Trustees of Variable Insurance Products Fund and Shareholders of VIP Value Portfolio:
Opinion on the Financial Statements and Financial Highlights
We have audited the accompanying statement of assets and liabilities of VIP Value Portfolio (the "Fund"), a fund of Variable Insurance Products Fund, including the schedule of investments, as of December 31, 2017, and the related statement of operations for the year then ended, the statement of changes in net assets for each of the two years in the period then ended, the financial highlights for each of the five years in the period then ended, and the related notes. In our opinion, the financial statements and financial highlights present fairly, in all material respects, the financial position of the Fund as of December 31, 2017, and the results of its operations for the year then ended, the changes in its net assets for each of the two years in the period then ended, and the financial highlights for each of the five years in the period then ended, in conformity with accounting principles generally accepted in the United States of America.
Basis for Opinion
These financial statements and financial highlights are the responsibility of the Fund's management. Our responsibility is to express an opinion on the Fund's financial statements and financial highlights based on our audits. We are a public accounting firm registered with the Public Company Accounting Oversight Board (United States) (PCAOB) and are required to be independent with respect to the Fund in accordance with the U.S. federal securities laws and the applicable rules and regulations of the Securities and Exchange Commission and the PCAOB.
We conducted our audits in accordance with the standards of the PCAOB. Those standards require that we plan and perform the audit to obtain reasonable assurance about whether the financial statements and financial highlights are free of material misstatement, whether due to error or fraud. The Fund is not required to have, nor were we engaged to perform, an audit of its internal control over financial reporting. As part of our audits we are required to obtain an understanding of internal control over financial reporting but not for the purpose of expressing an opinion on the effectiveness of the Fund’s internal control over financial reporting. Accordingly, we express no such opinion.
Our audits included performing procedures to assess the risks of material misstatement of the financial statements and financial highlights, whether due to error or fraud, and performing procedures that respond to those risks. Such procedures included examining, on a test basis, evidence regarding the amounts and disclosures in the financial statements and financial highlights. Our audits also included evaluating the accounting principles used and significant estimates made by management, as well as evaluating the overall presentation of the financial statements and financial highlights. Our procedures included confirmation of securities owned as of December 31, 2017, by correspondence with the custodians and brokers; when replies were not received from brokers, we performed other auditing procedures. We believe that our audits provide a reasonable basis for our opinion.
DELOITTE & TOUCHE LLP
Boston, Massachusetts
February 14, 2018
We have served as the auditor of one or more of the Fidelity investment companies since 1999.
Trustees and Officers
The Trustees, Members of the Advisory Board (if any), and officers of the trust and fund, as applicable, are listed below. The Board of Trustees governs the fund and is responsible for protecting the interests of shareholders. The Trustees are experienced executives who meet periodically throughout the year to oversee the fund's activities, review contractual arrangements with companies that provide services to the fund, oversee management of the risks associated with such activities and contractual arrangements, and review the fund's performance. Except for Jonathan Chiel, each of the Trustees oversees 190 funds, Mr. Chiel oversees 145 funds.
The Trustees hold office without limit in time except that (a) any Trustee may resign; (b) any Trustee may be removed by written instrument, signed by at least two-thirds of the number of Trustees prior to such removal; (c) any Trustee who requests to be retired or who has become incapacitated by illness or injury may be retired by written instrument signed by a majority of the other Trustees; and (d) any Trustee may be removed at any special meeting of shareholders by a two-thirds vote of the outstanding voting securities of the trust. Each Trustee who is not an interested person (as defined in the 1940 Act) of the trust and the fund is referred to herein as an Independent Trustee. Each Independent Trustee shall retire not later than the last day of the calendar year in which his or her 75th birthday occurs. The Independent Trustees may waive this mandatory retirement age policy with respect to individual Trustees. Officers and Advisory Board Members hold office without limit in time, except that any officer or Advisory Board Member may resign or may be removed by a vote of a majority of the Trustees at any regular meeting or any special meeting of the Trustees. Except as indicated, each individual has held the office shown or other offices in the same company for the past five years.
The fund’s Statement of Additional Information (SAI) includes more information about the Trustees. To request a free copy, call Fidelity at 1-877-208-0098.
Experience, Skills, Attributes, and Qualifications of the Trustees. The Governance and Nominating Committee has adopted a statement of policy that describes the experience, qualifications, attributes, and skills that are necessary and desirable for potential Independent Trustee candidates (Statement of Policy). The Board believes that each Trustee satisfied at the time he or she was initially elected or appointed a Trustee, and continues to satisfy, the standards contemplated by the Statement of Policy. The Governance and Nominating Committee also engages professional search firms to help identify potential Independent Trustee candidates who have the experience, qualifications, attributes, and skills consistent with the Statement of Policy. From time to time, additional criteria based on the composition and skills of the current Independent Trustees, as well as experience or skills that may be appropriate in light of future changes to board composition, business conditions, and regulatory or other developments, have also been considered by the professional search firms and the Governance and Nominating Committee. In addition, the Board takes into account the Trustees' commitment and participation in Board and committee meetings, as well as their leadership of standing and ad hoc committees throughout their tenure.
In determining that a particular Trustee was and continues to be qualified to serve as a Trustee, the Board has considered a variety of criteria, none of which, in isolation, was controlling. The Board believes that, collectively, the Trustees have balanced and diverse experience, qualifications, attributes, and skills, which allow the Board to operate effectively in governing the fund and protecting the interests of shareholders. Information about the specific experience, skills, attributes, and qualifications of each Trustee, which in each case led to the Board's conclusion that the Trustee should serve (or continue to serve) as a trustee of the fund, is provided below.
Board Structure and Oversight Function. James C. Curvey is an interested person and currently serves as Chairman. The Trustees have determined that an interested Chairman is appropriate and benefits shareholders because an interested Chairman has a personal and professional stake in the quality and continuity of services provided to the fund. Independent Trustees exercise their informed business judgment to appoint an individual of their choosing to serve as Chairman, regardless of whether the Trustee happens to be independent or a member of management. The Independent Trustees have determined that they can act independently and effectively without having an Independent Trustee serve as Chairman and that a key structural component for assuring that they are in a position to do so is for the Independent Trustees to constitute a substantial majority for the Board. The Independent Trustees also regularly meet in executive session. Ned C. Lautenbach serves as Chairman of the Independent Trustees and as such (i) acts as a liaison between the Independent Trustees and management with respect to matters important to the Independent Trustees and (ii) with management prepares agendas for Board meetings.
Fidelity® funds are overseen by different Boards of Trustees. The fund's Board oversees Fidelity's high income and certain equity funds, and other Boards oversee Fidelity's investment-grade bond, money market, asset allocation, and sector funds. The asset allocation funds may invest in Fidelity® funds overseen by the fund's Board. The use of separate Boards, each with its own committee structure, allows the Trustees of each group of Fidelity® funds to focus on the unique issues of the funds they oversee, including common research, investment, and operational issues. On occasion, the separate Boards establish joint committees to address issues of overlapping consequences for the Fidelity® funds overseen by each Board.
The Trustees operate using a system of committees to facilitate the timely and efficient consideration of all matters of importance to the Trustees, the fund, and fund shareholders and to facilitate compliance with legal and regulatory requirements and oversight of the fund's activities and associated risks. The Board, acting through its committees, has charged FMR and its affiliates with (i) identifying events or circumstances the occurrence of which could have demonstrably adverse effects on the fund's business and/or reputation; (ii) implementing processes and controls to lessen the possibility that such events or circumstances occur or to mitigate the effects of such events or circumstances if they do occur; and (iii) creating and maintaining a system designed to evaluate continuously business and market conditions in order to facilitate the identification and implementation processes described in (i) and (ii) above. Because the day-to-day operations and activities of the fund are carried out by or through FMR, its affiliates, and other service providers, the fund's exposure to risks is mitigated but not eliminated by the processes overseen by the Trustees. While each of the Board's committees has responsibility for overseeing different aspects of the fund's activities, oversight is exercised primarily through the Operations, Audit, and Compliance Committees. In addition, the Independent Trustees have worked with FMR to enhance the Board's oversight of investment and financial risks, legal and regulatory risks, technology risks, and operational risks, including the development of additional risk reporting to the Board. For example, a working group comprised of Independent Trustees and FMR has worked and continues to work to review the Fidelity® funds' valuation-related activities, reporting and risk management. Appropriate personnel, including but not limited to the fund's Chief Compliance Officer (CCO), FMR's internal auditor, the independent accountants, the fund's Treasurer and portfolio management personnel, make periodic reports to the Board's committees, as appropriate, including an annual review of Fidelity's risk management program for the Fidelity® funds. The responsibilities of each standing committee, including their oversight responsibilities, are described further under "Standing Committees of the Trustees."
Interested Trustees*:
Correspondence intended for a Trustee who is an interested person may be sent to Fidelity Investments, 245 Summer Street, Boston, Massachusetts 02210.
Name, Year of Birth; Principal Occupations and Other Relevant Experience+
Jonathan Chiel (1957)
Year of Election or Appointment: 2016
Trustee
Mr. Chiel also serves as Trustee of other Fidelity® funds. Mr. Chiel is Executive Vice President and General Counsel for FMR LLC (diversified financial services company, 2012-present). Previously, Mr. Chiel served as general counsel (2004-2012) and senior vice president and deputy general counsel (2000-2004) for John Hancock Financial Services; a partner with Choate, Hall & Stewart (1996-2000) (law firm); and an Assistant United States Attorney for the United States Attorney’s Office of the District of Massachusetts (1986-95), including Chief of the Criminal Division (1993-1995). Mr. Chiel is a director on the boards of the Boston Bar Foundation and the Maimonides School.
James C. Curvey (1935)
Year of Election or Appointment: 2007
Trustee
Chairman of the Board of Trustees
Mr. Curvey also serves as Trustee of other Fidelity® funds. Mr. Curvey is a Director of Fidelity Research & Analysis Co. (investment adviser firm, 2009-present), and Vice Chairman (2007-present) and Director of FMR LLC (diversified financial services company). In addition, Mr. Curvey serves as an Overseer for the Boston Symphony Orchestra and a member of the board of Artis-Naples, Naples, Florida, and as a Trustee for Brewster Academy, Wolfeboro, New Hampshire. Previously, Mr. Curvey served as a Director of Fidelity Investments Money Management, Inc. (investment adviser firm, 2009-2014) and a Director of FMR and FMR Co., Inc. (investment adviser firms, 2007-2014).
Charles S. Morrison (1960)
Year of Election or Appointment: 2014
Trustee
Mr. Morrison also serves as Trustee of other funds. He serves as President of Fidelity SelectCo, LLC (investment adviser firm, 2017-present) and Fidelity Management & Research Company (FMR) (investment adviser firm, 2016-present), a Director of Fidelity Investments Money Management, Inc. (FIMM) (investment adviser firm, 2014-present), Director of Fidelity SelectCo, LLC (investment adviser firm, 2014-present), President, Asset Management (2014-present), and is an employee of Fidelity Investments. Previously, Mr. Morrison served as Vice President of Fidelity's Fixed Income and Asset Allocation Funds (2012-2014), President, Fixed Income (2011-2014), Vice President of Fidelity's Money Market Funds (2005-2009), President, Money Market Group Leader of FMR (investment adviser firm, 2009), and Senior Vice President, Money Market Group of FMR (2004-2009). Mr. Morrison also served as Vice President of Fidelity's Bond Funds (2002-2005), certain Balanced Funds (2002-2005), and certain Asset Allocation Funds (2002-2007), and as Senior Vice President (2002-2005) of Fidelity's Bond Division.
* Determined to be an “Interested Trustee” by virtue of, among other things, his or her affiliation with the trust or various entities under common control with FMR.
+ The information includes the Trustee's principal occupation during the last five years and other information relating to the experience, attributes, and skills relevant to the Trustee's qualifications to serve as a Trustee, which led to the conclusion that the Trustee should serve as a Trustee for the fund.
Independent Trustees:
Correspondence intended for an Independent Trustee may be sent to Fidelity Investments, P.O. Box 55235, Boston, Massachusetts 02205-5235.
Name, Year of Birth; Principal Occupations and Other Relevant Experience+
Dennis J. Dirks (1948)
Year of Election or Appointment: 2005
Trustee
Mr. Dirks also serves as Trustee of other Fidelity® funds. Prior to his retirement in May 2003, Mr. Dirks was Chief Operating Officer and a member of the Board of The Depository Trust & Clearing Corporation (DTCC). He also served as President, Chief Operating Officer, and Board member of The Depository Trust Company (DTC) and President and Board member of the National Securities Clearing Corporation (NSCC). In addition, Mr. Dirks served as Chief Executive Officer and Board member of the Government Securities Clearing Corporation, Chief Executive Officer and Board member of the Mortgage-Backed Securities Clearing Corporation, as a Trustee and a member of the Finance Committee of Manhattan College (2005-2008), as a Trustee and a member of the Finance Committee of AHRC of Nassau County (2006-2008), as a member of the Independent Directors Council (IDC) Governing Council (2010-2015), and as a member of the Board of Directors for The Brookville Center for Children’s Services, Inc. (2009-2017). Mr. Dirks is a member of the Finance Committee (2016-present) and Board of Directors (2017-present) of the Asolo Repertory Theatre.
Alan J. Lacy (1953)
Year of Election or Appointment: 2008
Trustee
Mr. Lacy also serves as Trustee of other Fidelity® funds. Mr. Lacy serves as a Director of Bristol-Myers Squibb Company (global pharmaceuticals, 2008-present). He is a Trustee of the California Chapter of The Nature Conservancy (2015-present) and a Director of the Center for Advanced Study in the Behavioral Sciences at Stanford University (2015-present). In addition, Mr. Lacy served as Senior Adviser (2007-2014) of Oak Hill Capital Partners, L.P. (private equity) and also served as Chief Executive Officer (2005) and Vice Chairman (2005-2006) of Sears Holdings Corporation (retail) and Chief Executive Officer and Chairman of the Board of Sears, Roebuck and Co. (retail, 2000-2005). Previously, Mr. Lacy served as Chairman (2014-2017) and a member (2010-2017) of the Board of Directors of Dave & Buster’s Entertainment, Inc. (restaurant and entertainment complexes), as Chairman (2008-2011) and a member (2006-2015) of the Board of Trustees of the National Parks Conservation Association, and as a member of the Board of Directors for The Hillman Companies, Inc. (hardware wholesalers, 2010-2014), Earth Fare, Inc. (retail grocery, 2010-2014), and The Western Union Company (global money transfer, 2006-2011).
Ned C. Lautenbach (1944)
Year of Election or Appointment: 2000
Trustee
Chairman of the Independent Trustees
Mr. Lautenbach also serves as Trustee of other Fidelity® funds. Mr. Lautenbach currently serves as Vice Chair of the Board of Governors, State University System of Florida (2013-present) and is a member of the Council on Foreign Relations (1994-present). He is also a member and has most recently served as Chairman of the Board of Directors of Artis-Naples (2012-present). Previously, Mr. Lautenbach served as a member and then Lead Director of the Board of Directors of Eaton Corporation (diversified industrial, 1997-2016). He was also a Partner and Advisory Partner at Clayton, Dubilier & Rice, LLC (private equity investment, 1998-2010), as well as a Director of Sony Corporation (2006-2007). In addition, Mr. Lautenbach also had a 30-year career with IBM (technology company) during which time he served as Senior Vice President and a member of the Corporate Executive Committee (1968-1998).
Joseph Mauriello (1944)
Year of Election or Appointment: 2008
Trustee
Mr. Mauriello also serves as Trustee of other Fidelity® funds. Prior to his retirement in January 2006, Mr. Mauriello served in numerous senior management positions including Deputy Chairman and Chief Operating Officer (2004-2005), and Vice Chairman of Financial Services (2002-2004) of KPMG LLP US (professional services, 1965-2005). Mr. Mauriello currently serves as a member of the Board of Directors of XL Group plc. (global insurance and re-insurance, 2006-present) and the Independent Directors Council (IDC) Governing Council (2015-present). Previously, Mr. Mauriello served as a Director of the Hamilton Funds of the Bank of New York (2006-2007) and of Arcadia Resources Inc. (health care services and products, 2007-2012).
Cornelia M. Small (1944)
Year of Election or Appointment: 2005
Trustee
Ms. Small also serves as Trustee of other Fidelity® funds. Ms. Small is a member of the Board of Directors (2009-present) and Chair of the Investment Committee (2010-present) of the Teagle Foundation. Ms. Small also serves on the Investment Committee of the Berkshire Taconic Community Foundation (2008-present). Previously, Ms. Small served as Chairperson (2002-2008) and a member of the Investment Committee and Chairperson (2008-2012) and a member of the Board of Trustees of Smith College. In addition, Ms. Small served as Chief Investment Officer, Director of Global Equity Investments, and a member of the Board of Directors of Scudder, Stevens & Clark and Scudder Kemper Investments.
William S. Stavropoulos (1939)
Year of Election or Appointment: 2001
Trustee
Vice Chairman of the Independent Trustees
Mr. Stavropoulos also serves as Trustee of other Fidelity® funds. Mr. Stavropoulos serves as President and Founder of the Michigan Baseball Foundation, the Great Lakes Loons (2007-present). Mr. Stavropoulos is Chairman Emeritus of the Board of Directors of The Dow Chemical Company, where he previously served in numerous senior management positions, including President, CEO (1995-2000; 2002-2004), Chairman of the Executive Committee (2000-2006), and as a member of the Board of Directors (1990-2006). Currently, Mr. Stavropoulos is Chairman of the Board of Directors of Univar Inc. (global distributor of commodity and specialty chemicals), a Director of Teradata Corporation (data warehousing and technology solutions), and a member of the Advisory Board for Metalmark Capital LLC (private equity investment, 2005-present). Mr. Stavropoulos is an operating advisor to Clayton, Dubilier & Rice, LLC (private equity investment). In addition, Mr. Stavropoulos is a member of the University of Notre Dame Advisory Council for the College of Science, a Trustee of the Rollin L. Gerstacker Foundation, and a Director of Artis-Naples in Naples, Florida. Previously, Mr. Stavropoulos served as a Director of Chemical Financial Corporation (bank holding company, 1993-2012) and Tyco International, Ltd. (multinational manufacturing and services, 2007-2012).
David M. Thomas (1949)
Year of Election or Appointment: 2008
Trustee
Mr. Thomas also serves as Trustee of other Fidelity® funds. Mr. Thomas serves as Non-Executive Chairman of the Board of Directors of Fortune Brands Home and Security (home and security products, 2011-present), as a member of the Board of Directors (2004-present) and Presiding Director (2013-present) of Interpublic Group of Companies, Inc. (marketing communication), and as a member of the Board of Trustees of the University of Florida (2013-present). Previously, Mr. Thomas served as Executive Chairman (2005-2006) and Chairman and Chief Executive Officer (2000-2005) of IMS Health, Inc. (pharmaceutical and healthcare information solutions), and a Director of Fortune Brands, Inc. (consumer products, 2000-2011).
+ The information includes the Trustee's principal occupation during the last five years and other information relating to the experience, attributes, and skills relevant to the Trustee's qualifications to serve as a Trustee, which led to the conclusion that the Trustee should serve as a Trustee for the fund.
Advisory Board Members and Officers:
Correspondence intended for an officer or Peter S. Lynch may be sent to Fidelity Investments, 245 Summer Street, Boston, Massachusetts 02210. Officers appear below in alphabetical order.
Name, Year of Birth; Principal Occupation
Peter S. Lynch (1944)
Year of Election or Appointment: 2003
Member of the Advisory Board
Mr. Lynch also serves as Member of the Advisory Board of other Fidelity® funds. Mr. Lynch is Vice Chairman and a Director of FMR (investment adviser firm) and FMR Co., Inc. (investment adviser firm). In addition, Mr. Lynch serves as a Trustee of Boston College and as the Chairman of the Inner-City Scholarship Fund. Previously, Mr. Lynch served on the Special Olympics International Board of Directors (1997-2006).
Elizabeth Paige Baumann (1968)
Year of Election or Appointment: 2017
Anti-Money Laundering (AML) Officer
Ms. Baumann also serves as AML Officer of other funds. She is Chief AML Officer (2012-present) and Senior Vice President (2014-present) of FMR LLC (diversified financial services company) and is an employee of Fidelity Investments. Previously, Ms. Baumann served as AML Officer of the funds (2012-2016), and Vice President (2007-2014) and Deputy Anti-Money Laundering Officer (2007-2012) of FMR LLC.
Marc R. Bryant (1966)
Year of Election or Appointment: 2015
Secretary and Chief Legal Officer (CLO)
Mr. Bryant also serves as Secretary and CLO of other funds. Mr. Bryant serves as CLO, Secretary, and Senior Vice President of Fidelity Management & Research Company (investment adviser firm, 2015-present) and FMR Co., Inc. (investment adviser firm, 2015-present); Secretary of Fidelity SelectCo, LLC (investment adviser firm, 2015-present) and Fidelity Investments Money Management, Inc. (investment adviser firm, 2015-present); and CLO of Fidelity Management & Research (Hong Kong) Limited and FMR Investment Management (UK) Limited (investment adviser firms, 2015-present) and Fidelity Management & Research (Japan) Limited (investment adviser firm, 2016-present). He is Senior Vice President and Deputy General Counsel of FMR LLC (diversified financial services company). Previously, Mr. Bryant served as Secretary and CLO of Fidelity Rutland Square Trust II (2010-2014) and Assistant Secretary of Fidelity's Fixed Income and Asset Allocation Funds (2013-2015). Prior to joining Fidelity Investments, Mr. Bryant served as a Senior Vice President and the Head of Global Retail Legal for AllianceBernstein L.P. (2006-2010), and as the General Counsel for ProFund Advisors LLC (2001-2006).
William C. Coffey (1969)
Year of Election or Appointment: 2009
Assistant Secretary
Mr. Coffey also serves as Assistant Secretary of other funds. He is Senior Vice President and Deputy General Counsel of FMR LLC (diversified financial services company, 2010-present), and is an employee of Fidelity Investments. Previously, Mr. Coffey served as Vice President and Associate General Counsel of FMR LLC (2005-2009).
Jonathan Davis (1968)
Year of Election or Appointment: 2010
Assistant Treasurer
Mr. Davis also serves as Assistant Treasurer of other funds. Mr. Davis serves as Assistant Treasurer of FMR Capital, Inc. (2017-present) and is an employee of Fidelity Investments. Previously, Mr. Davis served as Vice President and Associate General Counsel of FMR LLC (diversified financial services company, 2003-2010).
Adrien E. Deberghes (1967)
Year of Election or Appointment: 2016
Assistant Treasurer
Mr. Deberghes also serves as an officer of other funds. He serves as Assistant Treasurer of FMR Capital, Inc. (2017-present), Executive Vice President of Fidelity Investments Money Management, Inc. (FIMM) (investment adviser firm, 2016-present), and is an employee of Fidelity Investments (2008-present). Prior to joining Fidelity Investments, Mr. Deberghes was Senior Vice President of Mutual Fund Administration at State Street Corporation (2007-2008), Senior Director of Mutual Fund Administration at Investors Bank & Trust (2005-2007), and Director of Finance for Dunkin' Brands (2000-2005). Previously, Mr. Deberghes served in other fund officer roles.
Stephanie J. Dorsey (1969)
Year of Election or Appointment: 2010
Assistant Treasurer
Ms. Dorsey also serves as an officer of other funds. Ms. Dorsey serves as Assistant Treasurer of FMR Capital, Inc. (2017-present), is an employee of Fidelity Investments (2008-present), and has served in other fund officer roles. Prior to joining Fidelity Investments, Ms. Dorsey served as Treasurer (2004-2008) of the JPMorgan Mutual Funds and Vice President (2004-2008) of JPMorgan Chase Bank.
Howard J. Galligan III (1966)
Year of Election or Appointment: 2014
Chief Financial Officer
Mr. Galligan also serves as Chief Financial Officer of other funds. Mr. Galligan serves as President of Fidelity Pricing and Cash Management Services (FPCMS) (2014-present) and as a Director of Strategic Advisers, Inc. (investment adviser firm, 2008-present). Previously, Mr. Galligan served as Chief Administrative Officer of Asset Management (2011-2014) and Chief Operating Officer and Senior Vice President of Investment Support for Strategic Advisers, Inc. (2003-2011).
Thomas C. Hense (1964)
Year of Election or Appointment: 2008, 2010, or 2015
Vice President
Mr. Hense serves as Vice President of Fidelity Advisor® Multi-Asset Income Fund (2015) and other funds (High Income (2008), Small Cap (2008), and Value (2010) funds), and is an employee of Fidelity Investments (1993-present). Previously, Mr. Hense served as a portfolio manager for Fidelity's Institutional Money Management Group (Pyramis) (2003-2008).
Brian B. Hogan (1964)
Year of Election or Appointment: 2009
Vice President
Mr. Hogan also serves as Trustee or Vice President of other funds. Mr. Hogan serves as a Director of FMR Investment Management (UK) Limited (investment adviser firm, 2015-present) and Fidelity SelectCo, LLC (investment adviser firm, 2014-present) and President of the Equity Division of FMR (investment adviser firm, 2009-present). Previously, Mr. Hogan served as Senior Vice President, Equity Research of FMR (2006-2009) and as a portfolio manager. Mr. Brian B. Hogan is not related to Mr. Colm A. Hogan.
Colm A. Hogan (1973)
Year of Election or Appointment: 2016
Deputy Treasurer
Mr. Hogan also serves as an officer of other funds. Mr. Hogan serves as Assistant Treasurer of FMR Capital, Inc. (2017-present) and is an employee of Fidelity Investments (2005-present). Mr. Colm A. Hogan is not related to Mr. Brian B. Hogan.
Chris Maher (1972)
Year of Election or Appointment: 2013
Assistant Treasurer
Mr. Maher serves as Assistant Treasurer of other funds. Mr. Maher is Vice President of Valuation Oversight, serves as Assistant Treasurer of FMR Capital, Inc. (2017-present), and is an employee of Fidelity Investments. Previously, Mr. Maher served as Vice President of Asset Management Compliance (2013), Vice President of the Program Management Group of FMR (investment adviser firm, 2010-2013), and Vice President of Valuation Oversight (2008-2010).
Rieco E. Mello (1969)
Year of Election or Appointment: 2017
Assistant Treasurer
Mr. Mello also serves as Assistant Treasurer of other funds. Mr. Mello serves as Assistant Treasurer of FMR Capital, Inc. (2017-present) and is an employee of Fidelity Investments (1995-present).
Kenneth B. Robins (1969)
Year of Election or Appointment: 2016
Chief Compliance Officer
Mr. Robins also serves as an officer of other funds. Mr. Robins serves as Compliance Officer of Fidelity Management & Research Company and FMR Co., Inc. (investment adviser firms, 2016-present) and is an employee of Fidelity Investments (2004-present). Previously, Mr. Robins served as Executive Vice President of Fidelity Investments Money Management, Inc. (investment adviser firm, 2013-2016) and served in other fund officer roles.
Stacie M. Smith (1974)
Year of Election or Appointment: 2016
President and Treasurer
Ms. Smith also serves as an officer of other funds. Ms. Smith serves as Assistant Treasurer of FMR Capital, Inc. (2017-present), is an employee of Fidelity Investments (2009-present), and has served in other fund officer roles. Prior to joining Fidelity Investments, Ms. Smith served as Senior Audit Manager of Ernst & Young LLP (accounting firm, 1996-2009). Previously, Ms. Smith served as Deputy Treasurer of certain Fidelity® funds (2013-2016).
Marc L. Spector (1972)
Year of Election or Appointment: 2016
Assistant Treasurer
Mr. Spector also serves as an officer of other funds. Mr. Spector serves as Assistant Treasurer of FMR Capital, Inc. (2017-present) and is an employee of Fidelity Investments (2016-present). Prior to joining Fidelity Investments, Mr. Spector served as Director at the Siegfried Group (accounting firm, 2013-2016), and prior to Siegfried Group as audit senior manager at Deloitte & Touche (accounting firm, 2005-2013).
Renee Stagnone (1975)
Year of Election or Appointment: 2016
Assistant Treasurer
Ms. Stagnone also serves as an officer of other funds. Ms. Stagnone serves as Assistant Treasurer of FMR Capital, Inc. (2017-present) and is an employee of Fidelity Investments (1997-present). Previously, Ms. Stagnone served as Deputy Treasurer of certain Fidelity® funds (2013-2016).
Shareholder Expense Example
As a shareholder of the Fund, you incur two types of costs: (1) transaction costs, and (2) ongoing costs, including management fees, distribution and/or service (12b-1) fees and other Fund expenses. This Example is intended to help you understand your ongoing costs (in dollars) of investing in the Fund and to compare these costs with the ongoing costs of investing in other mutual funds.
The Example is based on an investment of $1,000 invested at the beginning of the period and held for the entire period (July 1, 2017 to December 31, 2017).
Actual Expenses
The first line of the accompanying table for each class of the Fund provides information about actual account values and actual expenses. You may use the information in this line, together with the amount you invested, to estimate the expenses that you paid over the period. Simply divide your account value by $1,000.00 (for example, an $8,600 account value divided by $1,000.00 = 8.6), then multiply the result by the number in the first line for a class of the Fund under the heading entitled "Expenses Paid During Period" to estimate the expenses you paid on your account during this period. The estimate of expenses does not include any fees or other expenses of any variable annuity or variable life insurance product. If they were, the estimate of expenses you paid during the period would be higher, and your ending account value would be lower. In addition, the Fund, as a shareholder in the underlying Fidelity Central Funds, will indirectly bear its pro-rata share of the fees and expenses incurred by the underlying Fidelity Central Funds. These fees and expenses are not included in the Fund's annualized expense ratio used to calculate the expense estimate in the table below.
Hypothetical Example for Comparison Purposes
The second line of the accompanying table for each class of the Fund provides information about hypothetical account values and hypothetical expenses based on a Class' actual expense ratio and an assumed rate of return of 5% per year before expenses, which is not the Class' actual return. The hypothetical account values and expenses may not be used to estimate the actual ending account balance or expenses you paid for the period. You may use this information to compare the ongoing costs of investing in the Fund and other funds. To do so, compare this 5% hypothetical example with the 5% hypothetical examples that appear in the shareholder reports of the other funds. The estimate of expenses does not include any fees or other expenses of any variable annuity or variable life insurance product. If they were, the estimate of expenses you paid during the period would be higher, and your ending account value would be lower. In addition, the Fund, as a shareholder in the underlying Fidelity Central Funds, will indirectly bear its pro-rata share of the fees and expenses incurred by the underlying Fidelity Central Funds. These fees and expenses are not included in the Fund's annualized expense ratio used to calculate the expense estimate in the table below.
Please note that the expenses shown in the table are meant to highlight your ongoing costs only and do not reflect any transaction costs. Therefore, the second line of the table is useful in comparing ongoing costs only, and will not help you determine the relative total costs of owning different funds.
| | Annualized Expense Ratio-A | Beginning
Account Value
July 1, 2017 | Ending
Account Value
December 31, 2017 | Expenses Paid
During Period-B
July 1, 2017
to December 31, 2017 |
| Initial Class | .67% | | | |
| Actual | | $1,000.00 | $1,082.20 | $3.52 |
| Hypothetical-C | | $1,000.00 | $1,021.83 | $3.41 |
| Service Class | .77% | | | |
| Actual | | $1,000.00 | $1,081.90 | $4.04 |
| Hypothetical-C | | $1,000.00 | $1,021.32 | $3.92 |
| Service Class 2 | .92% | | | |
| Actual | | $1,000.00 | $1,081.00 | $4.83 |
| Hypothetical-C | | $1,000.00 | $1,020.57 | $4.69 |
| Investor Class | .76% | | | |
| Actual | | $1,000.00 | $1,081.70 | $3.99 |
| Hypothetical-C | | $1,000.00 | $1,021.37 | $3.87 |
A Annualized expense ratio reflects expenses net of applicable fee waivers.
B Expenses are equal to each Class' annualized expense ratio, multiplied by the average account value over the period, multiplied by 184/365 (to reflect the one-half year period).
C 5% return per year before expenses
Distributions (Unaudited)
The Board of Trustees of VIP Value Portfolio voted to pay to shareholders of record at the opening of business on record date, the following distributions per share derived from capital gains realized from sales of portfolio securities, and dividends derived from net investment income:
| | Pay Date | Record Date | Dividends | Capital Gains |
| VIP Value Portfolio | | | | |
| Initial Class | 02/09/18 | 02/09/18 | $0.027 | $0.563 |
| Service Class | 02/09/18 | 02/09/18 | $0.025 | $0.563 |
| Service Class 2 | 02/09/18 | 02/09/18 | $0.021 | $0.563 |
| Investor Class | 02/09/18 | 02/09/18 | $0.025 | $0.563 |
|
The fund hereby designates as a capital gain dividend with respect to the taxable year ended December 31, 2017, $10,639,533, or, if subsequently determined to be different, the net capital gain of such year.
Initial Class designates 26% and 35%; Service Class designates 27% and 36%; Service Class 2 designates 31% and 38%; and Investor Class designates 27% and 36% of the dividends distributed in February and December, 2017, respectively, during the fiscal year as qualifying for the dividends–received deduction for corporate shareholders.
Board Approval of Investment Advisory Contracts and Management Fees
VIP Value Portfolio
Each year, the Board of Trustees, including the Independent Trustees (together, the Board), votes on the renewal of the management contract with Fidelity Management & Research Company (FMR) and the sub-advisory agreements (together, the Advisory Contracts) for the fund. FMR and the sub-advisers are referred to herein as the Investment Advisers. The Board, assisted by the advice of fund counsel and Independent Trustees' counsel, requests and considers a broad range of information relevant to the renewal of the Advisory Contracts throughout the year.
The Board meets regularly and, at each of its meetings, covers an extensive agenda of topics and materials and considers factors that are relevant to its annual consideration of the renewal of the fund's Advisory Contracts, including the services and support provided to the fund and its shareholders. The Board has established various standing committees (Committees), each composed of and chaired by Independent Trustees with varying backgrounds, to which the Board has assigned specific subject matter responsibilities in order to enhance effective decision-making by the Board. The Board, acting directly and through its Committees, requests and receives information concerning the annual consideration of the renewal of the fund's Advisory Contracts. The Board also meets as needed to review matters specifically related to the Board's annual consideration of the renewal of the Advisory Contracts. Members of the Board may also meet with trustees of other Fidelity funds through ad hoc joint committees to discuss certain matters relevant to all of the Fidelity funds.
At its July 2017 meeting, the Board unanimously determined to renew the fund's Advisory Contracts. In reaching its determination, the Board considered all factors it believed relevant, including (i) the nature, extent, and quality of the services to be provided to the fund and its shareholders (including the investment performance of the fund); (ii) the competitiveness of the fund's management fee and total expense ratio relative to peer funds; (iii) the total costs of the services to be provided by and the profits to be realized by Fidelity from its relationships with the fund; and (iv) the extent to which, if any, economies of scale exist and would be realized as the fund grows, and whether any economies of scale are appropriately shared with fund shareholders.
In considering whether to renew the Advisory Contracts for the fund, the Board reached a determination, with the assistance of fund counsel and Independent Trustees' counsel and through the exercise of its business judgment, that the renewal of the Advisory Contracts was in the best interests of the fund and its shareholders and that the compensation payable under the Advisory Contracts was fair and reasonable. The Board's decision to renew the Advisory Contracts was not based on any single factor, but rather was based on a comprehensive consideration of all the information provided to the Board at its meetings throughout the year. The Board, in reaching its determination to renew the Advisory Contracts, was aware that shareholders of the fund have a broad range of investment choices available to them, including a wide choice among funds offered by Fidelity's competitors, and that the fund's shareholders, who have the opportunity to review and weigh the disclosure provided by the fund in its prospectus and other public disclosures, have chosen to invest in this fund, which is part of the Fidelity family of funds.
Amendment to Group Fee Rate. The Board also approved an amendment to the management contract for the fund to add an additional breakpoint to the group fee schedule, effective October 1, 2017. The Board noted that the additional breakpoint would result in lower management fee rates as Fidelity's assets under management increase.
Nature, Extent, and Quality of Services Provided. The Board considered Fidelity's staffing as it relates to the fund, including the backgrounds of investment personnel of Fidelity, and also considered the fund's investment objective, strategies, and related investment philosophy. The Independent Trustees also had discussions with senior management of Fidelity's investment operations and investment groups. The Board considered the structure of the investment personnel compensation program and whether this structure provides appropriate incentives to act in the best interests of the fund. Additionally, the Board considered the portfolio managers' investments, if any, in the funds that they manage.
Resources Dedicated to Investment Management and Support Services. The Board and the Fund Oversight and Research Committees reviewed the general qualifications and capabilities of Fidelity's investment staff, including its size, education, experience, and resources, as well as Fidelity's approach to recruiting, training, managing, and compensating investment personnel. The Board noted that Fidelity has continued to increase the resources devoted to non-U.S. offices, including expansion of Fidelity's global investment organization. The Board also noted that Fidelity's analysts have extensive resources, tools and capabilities that allow them to conduct sophisticated quantitative and fundamental analysis, as well as credit analysis of issuers, counterparties and guarantors. Further, the Board considered that Fidelity's investment professionals have sufficient access to global information and data so as to provide competitive investment results over time, and that those professionals also have access to sophisticated tools that permit them to assess portfolio construction and risk and performance attribution characteristics continuously, as well as to transmit new information and research conclusions rapidly around the world. Additionally, in its deliberations, the Board considered Fidelity's trading, risk management, compliance, and technology and operations capabilities and resources, which are integral parts of the investment management process.
Shareholder and Administrative Services. The Board considered (i) the nature, extent, quality, and cost of advisory, administrative, and shareholder services performed by the Investment Advisers and their affiliates under the Advisory Contracts and under separate agreements covering transfer agency, pricing and bookkeeping, and securities lending services for the fund; (ii) the nature and extent of the supervision of third party service providers, principally custodians, subcustodians, and pricing vendors; and (iii) the resources devoted to, and the record of compliance with, the fund's compliance policies and procedures. The Board also reviewed the allocation of fund brokerage, including allocations to brokers affiliated with the Investment Advisers, the use of brokerage commissions to pay fund expenses, and the use of "soft" commission dollars to pay for research services.
The Board noted that the growth of fund assets over time across the complex allows Fidelity to reinvest in the development of services designed to enhance the value or convenience of the Fidelity funds as investment vehicles. These services include 24-hour access to account information and market information through telephone representatives and over the Internet, investor education materials and asset allocation tools, and the expanded availability of Fidelity Investor Centers.
In 2014, the Board formed an ad hoc Committee on Transfer Agency Fees to review the variety of transfer agency fee structures throughout the industry and Fidelity's competitive positioning with respect to industry participants.
Investment in a Large Fund Family. The Board considered the benefits to shareholders of investing in a Fidelity fund, including the benefits of investing in a fund that is part of a large family of funds offering a variety of investment disciplines and providing a large variety of mutual fund investor services. The Board noted that Fidelity had taken, or had made recommendations that resulted in the Fidelity funds taking, a number of actions over the previous year that benefited particular funds, including: (i) continuing to dedicate additional resources to Fidelity's investment research process, and to the support of the senior management team that oversees asset management; (ii) continuing efforts to enhance Fidelity's global research capabilities; (iii) launching new funds and making other enhancements to meet client needs; (iv) launching new share classes of existing funds; (v) eliminating purchase minimums and broadening eligibility requirements for certain lower-priced share classes; (vi) reducing management fees and total expenses for certain growth equity funds and index funds; (vii) lowering expense caps for certain existing funds and classes to reduce expenses borne by shareholders; (viii) eliminating short-term redemption fees for certain funds; (ix) introducing a new pricing structure for certain funds of funds that is expected to reduce overall expenses paid by shareholders; (x) rationalizing product lines and gaining increased efficiencies through proposals for fund mergers and share class consolidations; (xi) continuing to develop, acquire and implement systems and technology to improve services to the funds and shareholders, strengthen information security, and increase efficiency; and (xii) implementing enhancements to further strengthen Fidelity's product line to increase investors' probability of success in achieving their investment goals, including retirement income goals.
Investment Performance. The Board considered whether the fund has operated in accordance with its investment objective, as well as its record of compliance with its investment restrictions and its performance history. The Board noted that there was a portfolio management change for the fund in September 2016.
The Board took into account discussions with representatives of the Investment Advisers about fund investment performance that occur at Board meetings throughout the year. In this regard the Board noted that as part of regularly scheduled fund reviews and other reports to the Board on fund performance, the Board considers annualized return information for the fund for different time periods, measured against a securities market index ("benchmark index") and a peer group of funds with similar objectives ("peer group"), if any. In its evaluation of fund investment performance, the Board gave particular attention to information indicating changes in performance of certain Fidelity funds for specific time periods and discussed with the Investment Advisers the reasons for any overperformance or underperformance.
In addition to reviewing absolute and relative fund performance, the Independent Trustees periodically consider the appropriateness of fund performance metrics in evaluating the results achieved. In general, the Independent Trustees believe that fund performance should be evaluated based on net performance (after fees and expenses) of both the highest performing and lowest performing fund share classes, where applicable, compared to appropriate benchmark indices, over appropriate time periods that may include full market cycles, and compared to peer groups, as applicable, over the same periods, taking into account relevant factors including the following: general market conditions; issuer-specific information; and fund cash flows and other factors.
The Independent Trustees recognize that shareholders evaluate performance on a net basis over their own holding periods, for which one-, three-, and five-year periods are often used as a proxy. For this reason, the performance information reviewed by the Board also included net cumulative calendar year total return information for the fund and an appropriate benchmark index and peer group for the most recent one-, three-, and five-year periods, as shown below. Returns are shown compared to the 25th percentile (top of box, 75% beaten) and 75th percentile (bottom of box, 25% beaten) of the peer universe.
VIP Value Portfolio
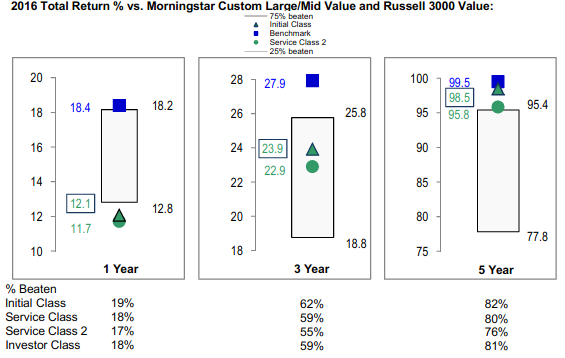
Based on its review, the Board concluded that the nature, extent, and quality of services provided to the fund under the Advisory Contracts should continue to benefit the shareholders of the fund.
Competitiveness of Management Fee and Total Expense Ratio. The Board considered the fund's management fee and total expense ratio compared to "mapped groups" of competitive funds and classes created for the purpose of facilitating the Trustees' competitive analysis of management fees and total expenses. Fidelity creates "mapped groups" by combining similar Lipper investment objective categories that have comparable investment mandates. Combining Lipper investment objective categories aids the Board's management fee and total expense ratio comparisons by broadening the competitive group used for comparison.
Management Fee. The Board considered two proprietary management fee comparisons for the 12-month periods shown in basis points (BP) in the chart below. The group of Lipper funds used by the Board for management fee comparisons is referred to below as the "Total Mapped Group." The Total Mapped Group comparison focuses on a fund's standing in terms of gross management fees before expense reimbursements or caps relative to the total universe of funds with comparable investment mandates, regardless of whether their management fee structures also are comparable. Funds with comparable investment mandates offer exposure to similar types of securities. Funds with comparable management fee structures have similar management fee contractual arrangements (
e.g., flat rate charged for advisory services, all-inclusive fee rate,
etc.). "TMG %" represents the percentage of funds in the Total Mapped Group that had management fees that were lower than the fund's. For example, a hypothetical TMG % of 20% would mean that 80% of the funds in the Total Mapped Group had higher, and 20% had lower, management fees than the fund. The fund's actual TMG %s and the number of funds in the Total Mapped Group are in the chart below. The "Asset-Size Peer Group" (ASPG) comparison focuses on a fund's standing relative to a subset of non-Fidelity funds within the Total Mapped Group that are similar in size and management fee structure. For example, if a fund is in the first quartile of the ASPG, the fund's management fee ranks in the least expensive or lowest 25% of funds in the ASPG. The ASPG represents at least 15% of the funds in the Total Mapped Group with comparable asset size and management fee structures, subject to a minimum of 50 funds (or all funds in the Total Mapped Group if fewer than 50). Additional information, such as the ASPG quartile in which the fund's management fee rate ranked, is also included in the chart and considered by the Board.
VIP Value Portfolio
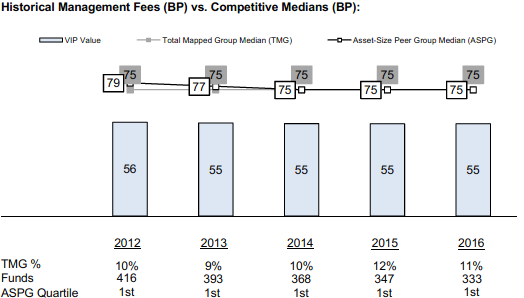
The Board noted that the fund's management fee rate ranked below the median of its Total Mapped Group and below the median of its ASPG for 2016.
The Board noted that, in 2014, the Board and the boards of other Fidelity funds formed the ad hoc Committee on Group Fee to conduct an in-depth review of the "group fee" component of the management fee of funds with such management fee structures. The Committee's focus included the mechanics of the group fee, the competitive landscape of group fee structures, Fidelity funds with no group fee component and investment products not included in group fee assets. The Board also considered that, for funds subject to the group fee, FMR agreed to voluntarily waive fees over a specified period of time in amounts designed to account for assets converted from certain funds to certain collective investment trusts.
The Board also noted that, in 2013, the ad hoc Committee on Management Fees was formed to conduct an in-depth review of the management fee rates of Fidelity's active equity mutual funds. The Committee focused on the following areas: (i) standard fee structures; (ii) research consumption and trading evolution; (iii) management fee competitiveness/profitability by category; and (iv) factors that drive institutional pricing.
Based on its review, the Board concluded that the fund's management fee is fair and reasonable in light of the services that the fund receives and the other factors considered.
Total Expense Ratio. In its review of each class's total expense ratio, the Board considered the fund's management fee rate as well as other fund or class expenses, as applicable, such as transfer agent fees, pricing and bookkeeping fees, fund-paid 12b-1 fees, and custodial, legal, and audit fees. The Board also noted that Fidelity may agree to waive fees and expenses from time to time, and the extent to which, if any, it has done so for the fund. As part of its review, the Board also considered the current and historical total expense ratios of each class of the fund compared to competitive fund median expenses. Each class of the fund is compared to those funds and classes in the Total Mapped Group (used by the Board for management fee comparisons) that have a similar sales load structure.
The Board noted that the total expense ratio of each of Initial Class, Investor Class, and Service Class ranked below the competitive median for 2016 and the total expense ratio of Service Class 2 ranked above the competitive median for 2016. The Board considered that, in general, various factors can affect total expense ratios. The Board noted that the total expense ratio of Service Class 2 was above the competitive median because of its 12b-1 fees. The Board noted that the fund offers multiple classes, each of which has a different 12b-1 fee structure, and that the multiple structures are intended to offer a range of pricing options for the intermediary market. The Board also noted that the total expense ratios of the classes vary primarily by the level of their 12b-1 fees, although differences in transfer agent fees may also cause expenses to vary from class to class.
Fees Charged to Other Fidelity Clients. The Board also considered Fidelity fee structures and other information with respect to clients of Fidelity, such as other funds advised or subadvised by Fidelity, pension plan clients, and other institutional clients with similar mandates. The Board noted that an ad hoc joint committee created by it and the boards of other Fidelity funds periodically (most recently in 2013) reviews and compares Fidelity's institutional investment advisory business with its business of providing services to the Fidelity funds, including the differences in services provided, fees charged, and costs incurred, as well as competition in their respective marketplaces.
Based on its review of total expense ratios and fees charged to other Fidelity clients, the Board concluded that, although Service Class 2 was above the median of the universe presented for comparison, the total expense ratio of each class of the fund was reasonable in light of the services that the fund and its shareholders receive and the other factors considered.
Costs of the Services and Profitability. The Board considered the revenues earned and the expenses incurred by Fidelity in conducting the business of developing, marketing, distributing, managing, administering and servicing the fund and servicing the fund's shareholders. The Board also considered the level of Fidelity's profits in respect of all the Fidelity funds.
On an annual basis, Fidelity presents to the Board information about the profitability of its relationships with the fund. Fidelity calculates profitability information for each fund, as well as aggregate profitability information for groups of Fidelity funds and all Fidelity funds, using a series of detailed revenue and cost allocation methodologies which originate with the books and records of Fidelity on which Fidelity's audited financial statements are based. The Audit Committee of the Board reviews any significant changes from the prior year's methodologies.
PricewaterhouseCoopers LLP (PwC), independent registered public accounting firm and auditor to Fidelity and certain Fidelity funds, has been engaged annually by the Board as part of the Board's assessment of Fidelity's profitability analysis. PwC's engagement includes the review and assessment of the methodologies used by Fidelity in determining the revenues and expenses attributable to Fidelity's mutual fund business, and completion of agreed-upon procedures in respect of the mathematical accuracy of the fund profitability information and its conformity to established allocation methodologies. After considering PwC's reports issued under the engagement and information provided by Fidelity, the Board concluded that while other allocation methods may also be reasonable, Fidelity's profitability methodologies are reasonable in all material respects.
The Board also reviewed Fidelity's non-fund businesses and potential fall-out benefits related to the mutual fund business as well as cases where Fidelity's affiliates may benefit from or be related to the fund's business.
The Board considered the costs of the services provided by and the profits realized by Fidelity in connection with the operation of the fund and was satisfied that the profitability was not excessive.
Economies of Scale. The Board considered whether there have been economies of scale in respect of the management of the Fidelity funds, whether the Fidelity funds (including the fund) have appropriately benefited from any such economies of scale, and whether there is potential for realization of any further economies of scale. The Board considered the extent to which the fund will benefit from economies of scale as assets grow through increased services to the fund, through waivers or reimbursements, or through fee or expense ratio reductions. The Board also noted that a committee (the Economies of Scale Committee) created by it and the boards of other Fidelity funds periodically (most recently in 2013) analyzes whether Fidelity attains economies of scale in respect of the management and servicing of the Fidelity funds, whether the Fidelity funds have appropriately benefited from such economies of scale, and whether there is potential for realization of any further economies of scale.
The Board recognized that the fund's management contract incorporates a "group fee" structure, which provides for lower group fee rates as total group assets increase, and for higher group fee rates as total group assets decrease (with "group assets" defined to include fund assets under FMR's management plus the assets of sector funds previously under FMR's management). FMR calculates the group fee rates based on a tiered asset "breakpoint" schedule that varies based on asset class. The Board considered that the group fee is designed to deliver the benefits of economies of scale to fund shareholders when total Fidelity fund assets increase, even if assets of any particular fund are unchanged or have declined, because some portion of Fidelity's costs are attributable to services provided to all Fidelity funds, and all funds benefit if those costs can be allocated among more assets. The Board concluded that, given the group fee structure, fund shareholders will benefit from lower management fees as group assets increase at the fund complex level, regardless of whether Fidelity achieves any such economies of scale.
The Board concluded, taking into account the analysis of the Economies of Scale Committee, that economies of scale, if any, are being appropriately shared between fund shareholders and Fidelity.
Additional Information Requested by the Board. In order to develop fully the factual basis for consideration of the Fidelity funds' advisory contracts, the Board requested and received additional information on certain topics, including: (i) fund performance trends, in particular the underperformance of certain funds, and Fidelity's long-term strategies for certain funds; (ii) Fidelity's fund profitability methodology, profitability trends for certain funds, and the impact of certain factors on fund profitability results, including the impact of market trends on actively managed funds; (iii) the use of performance fees and the calculation of performance adjustments, including the impact of underperformance and fund outflows on performance adjustments; (iv) metrics for evaluating index fund performance; (v) Fidelity's group fee structure, including the group fee breakpoint schedules; (vi) the terms of Fidelity's contractual and voluntary expense cap arrangements with the funds; (vii) the methodology with respect to evaluating competitive fund data and peer group classifications and fee comparisons; (viii) the expense structures for different funds and classes; (ix) Fidelity's arrangements with affiliated sub-advisers on behalf of the funds; (x) information regarding other accounts managed by Fidelity, including institutional accounts and collective investment trusts; (xi) recent changes to the fee structure for certain funds of funds; and (xii) the impact of the Department of Labor's new fiduciary rule on the funds' comparative expense information.
Based on its evaluation of all of the conclusions noted above, and after considering all factors it believed relevant, the Board concluded that the advisory fee structures are fair and reasonable, and that the fund's Advisory Contracts should be renewed.
VIPVAL-ANN-0218
1.768949.116
Fidelity® Variable Insurance Products: Equity-Income Portfolio
Annual Report December 31, 2017 |
|
Contents
To view a fund's proxy voting guidelines and proxy voting record for the 12-month period ended June 30, visit http://www.fidelity.com/proxyvotingresults or visit the Securities and Exchange Commission's (SEC) web site at http://www.sec.gov.
You may also call 1-877-208-0098 to request a free copy of the proxy voting guidelines.
Fidelity® Variable Insurance Products are separate account options which are purchased through a variable insurance contract.
Standard & Poor's, S&P and S&P 500 are registered service marks of The McGraw-Hill Companies, Inc. and have been licensed for use by Fidelity Distributors Corporation.
Other third-party marks appearing herein are the property of their respective owners.
All other marks appearing herein are registered or unregistered trademarks or service marks of FMR LLC or an affiliated company. © 2018 FMR LLC. All rights reserved.
This report and the financial statements contained herein are submitted for the general information of the shareholders of the Fund. This report is not authorized for distribution to prospective investors in the Fund unless preceded or accompanied by an effective prospectus.
A fund files its complete schedule of portfolio holdings with the SEC for the first and third quarters of each fiscal year on Form N-Q. Forms N-Q are available on the SEC’s web site at http://www.sec.gov. A fund's Forms N-Q may be reviewed and copied at the SEC’s Public Reference Room in Washington, DC. Information regarding the operation of the SEC's Public Reference Room may be obtained by calling 1-800-SEC-0330.
For a complete list of a fund's portfolio holdings, view the most recent holdings listing, semiannual report, or annual report on Fidelity's web site at http://www.fidelity.com, http://www.institutional.fidelity.com, or http://www.401k.com, as applicable.
NOT FDIC INSURED •MAY LOSE VALUE •NO BANK GUARANTEE
Neither the Fund nor Fidelity Distributors Corporation is a bank.
Performance: The Bottom Line
Average annual total return reflects the change in the value of an investment, assuming reinvestment of distributions from dividend income and capital gains (the profits earned upon the sale of securities that have grown in value, if any) and assuming a constant rate of performance each year. During periods of reimbursement by Fidelity, a fund’s total return will be greater than it would be had the reimbursement not occurred. Performance numbers are net of all underlying fund operating expenses, but do not include any insurance charges imposed by your insurance company’s separate account. If performance information included the effect of these additional charges, the total returns would have been lower. How a fund did yesterday is no guarantee of how it will do tomorrow.
Average Annual Total Returns
| For the periods ended December 31, 2017 | Past 1 year | Past 5 years | Past 10 years |
| Initial Class | 12.89% | 12.26% | 6.14% |
| Service Class | 12.80% | 12.15% | 6.04% |
| Service Class 2 | 12.65% | 11.98% | 5.88% |
| Investor Class | 12.83% | 12.16% | 6.06% |
$10,000 Over 10 Years
Let's say hypothetically that $10,000 was invested in VIP Equity-Income Portfolio℠ - Initial Class on December 31, 2007.
The chart shows how the value of your investment would have changed, and also shows how the Russell 3000® Value Index performed over the same period.
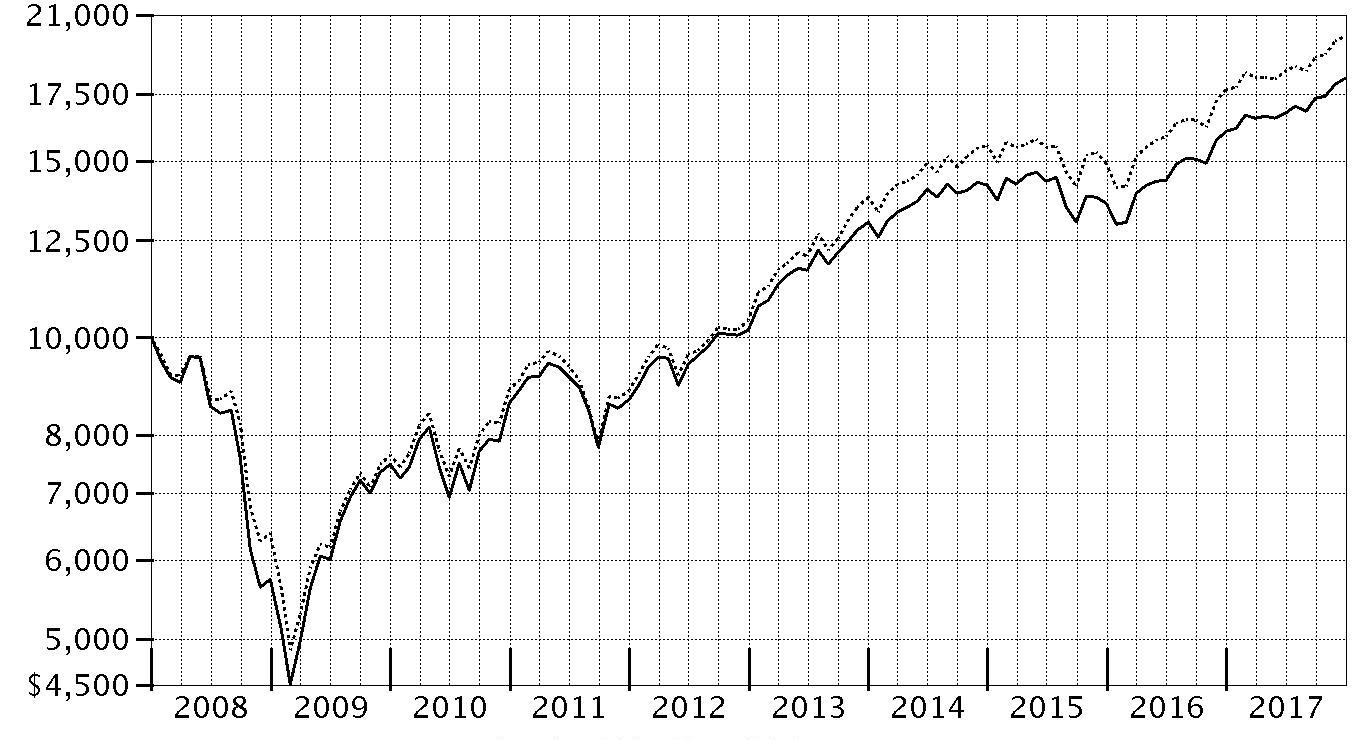
| Period Ending Values |
| $18,155 | VIP Equity-Income Portfolio℠ - Initial Class |
| $20,020 | Russell 3000® Value Index |
Management's Discussion of Fund Performance
Market Recap: U.S. equities gained 21.83% in 2017, as the S&P 500
® index rose steadily and closed the year just shy of an all-time high after a particularly strong three-month finish. Early on, equities rallied on optimism for President Trump’s pro-business agenda but leveled off in March amid fading optimism and stalled efforts by Congress to repeal and replace the Affordable Care Act. Upward momentum soon returned and continued through year-end with consumer sentiment and other market indicators staying positive. The lone exception was a brief cooldown in August, when geopolitical tension escalated and uncertainty grew regarding the future of health care, tax reform and the debt ceiling. Sector-wise, information technology fared best by a wide margin, rising 39% amid strong earnings growth from several major index constituents. A 24% gain in materials was spurred by increased demand, especially from China. Consumer discretionary gained 23%, despite many brick-and-mortar retailers suffering from online competition, and financials edged the broader market on an uptick in bond yields. Conversely, the defensive energy and telecom services sectors returned about -1% each. Rising interest rates held back real estate (+11%), while consumer staples (+13%) and utilities (+12%) struggled due to investors’ general preference for risk assets.
Comments from Lead Portfolio Manager Ramona Persaud: For the year, the fund's share classes gained roughly 13%, about in line with the 13.19% advance of the benchmark Russell 3000
® Value Index. Versus the benchmark, security selection in health care and industrials notably detracted, as did the fund's 6% stake in cash, on average. On the positive side, the fund benefited most from security selection in the financials and consumer discretionary sectors, while positioning in real estate and energy also added value versus the benchmark in 2017. The fund’s biggest individual detractor was an out-of-benchmark position in Israel-based Teva Pharmaceutical Industries, the world's largest maker of generic drugs. The stock suffered as the company continued to integrate its 2016 acquisition of Actavis' generics business, and by drug-pricing pressure stemming from poor industry fundamentals and turnover in the broader product cycle for generics. We sold our stake in Teva by period end. Having no exposure to the common stock of chipmaker and benchmark component Intel also dragged on relative performance, as the stock rallied in late October on strong quarterly financial results owed to growth in Intel’s “internet of things” and memory businesses. Conversely, being underexposed to sizable benchmark stock Exxon Mobil helped relative results most. The multinational oil and gas giant was a victim of the bear market in energy and the ongoing glut in U.S. oil and natural gas supplies. Elsewhere, it helped to hold a non-benchmark position in Italian-controlled carmaker Fiat Chrysler Automobiles, as its stock was boosted on rumors of a Chinese automaker making a bid to purchase the firm. No deal was made by year-end and the fund did not hold Fiat as of December 31. Lastly, the fund's foreign holdings contributed overall, aided in part by a broadly weaker U.S. dollar.
The views expressed above reflect those of the portfolio manager(s) only through the end of the period as stated on the cover of this report and do not necessarily represent the views of Fidelity or any other person in the Fidelity organization. Any such views are subject to change at any time based upon market or other conditions and Fidelity disclaims any responsibility to update such views. These views may not be relied on as investment advice and, because investment decisions for a Fidelity fund are based on numerous factors, may not be relied on as an indication of trading intent on behalf of any Fidelity fund.
Note to shareholders: On December 30, 2017, Ramona Persaud became Lead Manager of the fund, after having served as Co-Manager since April 2017. Ramona succeeds Jim Morrow, who, after more than 18 years at Fidelity, retired at the end of 2017.
Investment Summary (Unaudited)
Top Ten Stocks as of December 31, 2017
| | % of fund's net assets |
| JPMorgan Chase & Co. | 4.9 |
| Wells Fargo & Co. | 4.2 |
| Johnson & Johnson | 4.0 |
| Cisco Systems, Inc. | 3.6 |
| Procter & Gamble Co. | 3.1 |
| Verizon Communications, Inc. | 2.9 |
| Bank of America Corp. | 2.8 |
| Chubb Ltd. | 2.6 |
| Exelon Corp. | 2.4 |
| Comcast Corp. Class A | 2.4 |
| | 32.9 |
Top Five Market Sectors as of December 31, 2017
| | % of fund's net assets |
| Financials | 24.5 |
| Information Technology | 12.1 |
| Consumer Staples | 11.8 |
| Energy | 11.0 |
| Health Care | 9.9 |
Asset Allocation (% of fund's net assets)
| As of December 31, 2017 * |
| | Stocks | 96.9% |
| | Bonds | 0.2% |
| | Short-Term Investments and Net Other Assets (Liabilities) | 2.9% |

* Foreign investments - 12.7%
Investments December 31, 2017
Showing Percentage of Net Assets
| Common Stocks - 96.9% | | | |
| | | Shares | Value |
| CONSUMER DISCRETIONARY - 6.3% | | | |
| Automobiles - 1.2% | | | |
| General Motors Co. | | 1,671,500 | $68,514,785 |
| Hotels, Restaurants & Leisure - 1.9% | | | |
| Bluegreen Corp. | | 214,400 | 3,914,944 |
| Dunkin' Brands Group, Inc. | | 784,500 | 50,576,715 |
| McDonald's Corp. | | 156,900 | 27,005,628 |
| Wyndham Worldwide Corp. | | 211,000 | 24,448,570 |
| | | | 105,945,857 |
| Media - 2.4% | | | |
| Comcast Corp. Class A | | 3,348,286 | 134,098,854 |
| Multiline Retail - 0.3% | | | |
| Macy's, Inc. (a) | | 681,000 | 17,154,390 |
| Specialty Retail - 0.5% | | | |
| Home Depot, Inc. | | 93,900 | 17,796,867 |
| L Brands, Inc. | | 197,700 | 11,905,494 |
| | | | 29,702,361 |
|
| TOTAL CONSUMER DISCRETIONARY | | | 355,416,247 |
|
| CONSUMER STAPLES - 11.8% | | | |
| Beverages - 1.8% | | | |
| Dr. Pepper Snapple Group, Inc. | | 253,000 | 24,556,180 |
| Molson Coors Brewing Co. Class B | | 493,200 | 40,476,924 |
| The Coca-Cola Co. | | 743,300 | 34,102,604 |
| | | | 99,135,708 |
| Food & Staples Retailing - 3.1% | | | |
| CVS Health Corp. | | 799,000 | 57,927,500 |
| Sysco Corp. | | 211,800 | 12,862,614 |
| Wal-Mart Stores, Inc. | | 1,061,878 | 104,860,453 |
| | | | 175,650,567 |
| Food Products - 1.7% | | | |
| Hilton Food Group PLC | | 476,300 | 5,556,180 |
| Mondelez International, Inc. | | 448,900 | 19,212,920 |
| Morinaga & Co. Ltd. | | 104,600 | 5,300,785 |
| Nestle SA (Reg. S) | | 123,424 | 10,611,534 |
| The Hain Celestial Group, Inc. (b) | | 209,200 | 8,867,988 |
| The J.M. Smucker Co. | | 165,100 | 20,512,024 |
| The Kraft Heinz Co. | | 355,000 | 27,604,800 |
| | | | 97,666,231 |
| Household Products - 3.7% | | | |
| Essity AB Class B | | 237,300 | 6,740,245 |
| Kimberly-Clark Corp. | | 228,100 | 27,522,546 |
| Procter & Gamble Co. | | 1,901,419 | 174,702,378 |
| | | | 208,965,169 |
| Personal Products - 0.6% | | | |
| Unilever NV (Certificaten Van Aandelen) (Bearer) | | 584,900 | 32,931,626 |
| Tobacco - 0.9% | | | |
| British American Tobacco PLC: | | | |
| (United Kingdom) | | 334,600 | 22,669,326 |
| sponsored ADR | | 274,003 | 18,355,461 |
| Imperial Tobacco Group PLC | | 289,727 | 12,384,598 |
| | | | 53,409,385 |
|
| TOTAL CONSUMER STAPLES | | | 667,758,686 |
|
| ENERGY - 10.9% | | | |
| Energy Equipment & Services - 0.5% | | | |
| Schlumberger Ltd. | | 397,500 | 26,787,525 |
| Oil, Gas & Consumable Fuels - 10.4% | | | |
| Chevron Corp. | | 980,080 | 122,696,215 |
| ConocoPhillips Co. | | 1,611,300 | 88,444,257 |
| Enterprise Products Partners LP | | 797,400 | 21,139,074 |
| Imperial Oil Ltd. | | 744,000 | 23,219,666 |
| Kinder Morgan, Inc. | | 2,004,200 | 36,215,894 |
| Phillips 66 Co. | | 283,800 | 28,706,370 |
| Suncor Energy, Inc. | | 1,709,200 | 62,752,251 |
| The Williams Companies, Inc. | | 3,806,849 | 116,070,826 |
| Williams Partners LP | | 2,448,756 | 94,962,758 |
| | | | 594,207,311 |
|
| TOTAL ENERGY | | | 620,994,836 |
|
| FINANCIALS - 24.5% | | | |
| Banks - 14.9% | | | |
| Bank of America Corp. | | 5,411,400 | 159,744,528 |
| Comerica, Inc. | | 75,348 | 6,540,960 |
| JPMorgan Chase & Co. | | 2,583,964 | 276,329,109 |
| KeyCorp | | 893,813 | 18,028,208 |
| Lakeland Financial Corp. | | 140,500 | 6,812,845 |
| Regions Financial Corp. | | 775,500 | 13,400,640 |
| SunTrust Banks, Inc. | | 807,900 | 52,182,261 |
| U.S. Bancorp | | 1,376,638 | 73,760,264 |
| Wells Fargo & Co. | | 3,939,286 | 238,996,482 |
| | | | 845,795,297 |
| Capital Markets - 4.9% | | | |
| KKR & Co. LP | | 5,550,021 | 116,883,442 |
| State Street Corp. | | 368,202 | 35,940,197 |
| The Blackstone Group LP | | 3,707,226 | 118,705,377 |
| TPG Specialty Lending, Inc. | | 280,231 | 5,548,574 |
| | | | 277,077,590 |
| Consumer Finance - 0.3% | | | |
| Capital One Financial Corp. | | 156,400 | 15,574,312 |
| Diversified Financial Services - 0.1% | | | |
| New Academy Holding Co. LLC unit (b)(c)(d)(e) | | 127,200 | 4,342,608 |
| Insurance - 3.8% | | | |
| Chubb Ltd. | | 1,004,571 | 146,797,960 |
| MetLife, Inc. | | 1,417,970 | 71,692,563 |
| | | | 218,490,523 |
| Mortgage Real Estate Investment Trusts - 0.1% | | | |
| KKR Real Estate Finance Trust, Inc. (a) | | 343,400 | 6,871,434 |
| Thrifts & Mortgage Finance - 0.4% | | | |
| Radian Group, Inc. | | 1,203,870 | 24,811,761 |
|
| TOTAL FINANCIALS | | | 1,392,963,525 |
|
| HEALTH CARE - 9.8% | | | |
| Biotechnology - 1.6% | | | |
| Amgen, Inc. | | 527,771 | 91,779,377 |
| Health Care Equipment & Supplies - 0.9% | | | |
| Becton, Dickinson & Co. | | 152,200 | 32,579,932 |
| Koninklijke Philips Electronics NV | | 520,600 | 19,657,170 |
| | | | 52,237,102 |
| Health Care Providers & Services - 0.2% | | | |
| HealthSouth Corp. | | 1 | 49 |
| UnitedHealth Group, Inc. | | 39,300 | 8,664,078 |
| | | | 8,664,127 |
| Pharmaceuticals - 7.1% | | | |
| AstraZeneca PLC (United Kingdom) | | 512,811 | 35,386,832 |
| Bristol-Myers Squibb Co. | | 222,100 | 13,610,288 |
| GlaxoSmithKline PLC | | 1,974,000 | 34,957,944 |
| Johnson & Johnson | | 1,616,368 | 225,838,937 |
| Merck & Co., Inc. | | 410,900 | 23,121,343 |
| Pfizer, Inc. | | 969,212 | 35,104,859 |
| Sanofi SA | | 384,961 | 33,142,057 |
| | | | 401,162,260 |
|
| TOTAL HEALTH CARE | | | 553,842,866 |
|
| INDUSTRIALS - 6.3% | | | |
| Aerospace & Defense - 2.6% | | | |
| General Dynamics Corp. | | 195,000 | 39,672,750 |
| Raytheon Co. | | 162,700 | 30,563,195 |
| United Technologies Corp. | | 605,771 | 77,278,206 |
| | | | 147,514,151 |
| Air Freight & Logistics - 1.2% | | | |
| Deutsche Post AG | | 383,039 | 18,268,677 |
| United Parcel Service, Inc. Class B | | 434,437 | 51,763,169 |
| | | | 70,031,846 |
| Commercial Services & Supplies - 0.6% | | | |
| KAR Auction Services, Inc. | | 444,200 | 22,436,542 |
| Waste Connection, Inc. (Canada) | | 142,427 | 10,102,459 |
| | | | 32,539,001 |
| Electrical Equipment - 0.9% | | | |
| AMETEK, Inc. | | 98,500 | 7,138,295 |
| Eaton Corp. PLC | | 458,300 | 36,210,283 |
| Regal Beloit Corp. | | 106,800 | 8,180,880 |
| | | | 51,529,458 |
| Industrial Conglomerates - 0.7% | | | |
| General Electric Co. | | 681,847 | 11,898,230 |
| Roper Technologies, Inc. | | 112,600 | 29,163,400 |
| | | | 41,061,630 |
| Machinery - 0.3% | | | |
| Allison Transmission Holdings, Inc. | | 325,800 | 14,032,206 |
|
| TOTAL INDUSTRIALS | | | 356,708,292 |
|
| INFORMATION TECHNOLOGY - 12.1% | | | |
| Communications Equipment - 3.6% | | | |
| Cisco Systems, Inc. | | 5,279,531 | 202,206,037 |
| Electronic Equipment & Components - 1.2% | | | |
| Dell Technologies, Inc. (b) | | 393,641 | 31,995,140 |
| TE Connectivity Ltd. | | 383,561 | 36,453,637 |
| | | | 68,448,777 |
| IT Services - 1.4% | | | |
| First Data Corp. Class A (b) | | 2,728,096 | 45,586,484 |
| Paychex, Inc. | | 492,969 | 33,561,330 |
| | | | 79,147,814 |
| Semiconductors & Semiconductor Equipment - 3.2% | | | |
| Analog Devices, Inc. | | 184,100 | 16,390,423 |
| Qualcomm, Inc. | | 1,917,439 | 122,754,445 |
| Taiwan Semiconductor Manufacturing Co. Ltd. sponsored ADR | | 898,100 | 35,609,665 |
| United Microelectronics Corp. | | 13,218,000 | 6,295,866 |
| | | | 181,050,399 |
| Software - 2.0% | | | |
| Micro Focus International PLC | | 991,723 | 33,782,334 |
| Microsoft Corp. | | 936,024 | 80,067,493 |
| | | | 113,849,827 |
| Technology Hardware, Storage & Peripherals - 0.7% | | | |
| Apple, Inc. | | 250,300 | 42,358,269 |
|
| TOTAL INFORMATION TECHNOLOGY | | | 687,061,123 |
|
| MATERIALS - 3.4% | | | |
| Chemicals - 2.4% | | | |
| DowDuPont, Inc. | | 904,100 | 64,390,002 |
| LyondellBasell Industries NV Class A | | 434,600 | 47,945,072 |
| Monsanto Co. | | 93,900 | 10,965,642 |
| Potash Corp. of Saskatchewan, Inc. | | 603,000 | 12,367,017 |
| | | | 135,667,733 |
| Containers & Packaging - 1.0% | | | |
| Ball Corp. | | 197,700 | 7,482,945 |
| WestRock Co. | | 811,300 | 51,282,273 |
| | | | 58,765,218 |
|
| TOTAL MATERIALS | | | 194,432,951 |
|
| REAL ESTATE - 1.8% | | | |
| Equity Real Estate Investment Trusts (REITs) - 1.8% | | | |
| American Tower Corp. | | 224,200 | 31,986,614 |
| Crown Castle International Corp. | | 309,900 | 34,401,999 |
| Duke Realty Corp. | | 378,500 | 10,298,985 |
| Public Storage | | 104,600 | 21,861,400 |
| Ventas, Inc. | | 100,790 | 6,048,408 |
| | | | 104,597,406 |
| TELECOMMUNICATION SERVICES - 4.6% | | | |
| Diversified Telecommunication Services - 4.6% | | | |
| AT&T, Inc. | | 2,463,993 | 95,800,048 |
| Verizon Communications, Inc. | | 3,118,759 | 165,075,914 |
| | | | 260,875,962 |
| Wireless Telecommunication Services - 0.0% | | | |
| T-Mobile U.S., Inc. (b) | | 22,139 | 1,406,048 |
|
| TOTAL TELECOMMUNICATION SERVICES | | | 262,282,010 |
|
| UTILITIES - 5.4% | | | |
| Electric Utilities - 4.7% | | | |
| Duke Energy Corp. | | 260,000 | 21,868,600 |
| Exelon Corp. | | 3,528,900 | 139,073,949 |
| PPL Corp. | | 1,668,700 | 51,646,265 |
| Southern Co. | | 677,577 | 32,584,678 |
| Xcel Energy, Inc. | | 468,800 | 22,553,968 |
| | | | 267,727,460 |
| Multi-Utilities - 0.7% | | | |
| CenterPoint Energy, Inc. | | 681,500 | 19,327,340 |
| Public Service Enterprise Group, Inc. | | 324,300 | 16,701,450 |
| | | | 36,028,790 |
|
| TOTAL UTILITIES | | | 303,756,250 |
|
| TOTAL COMMON STOCKS | | | |
| (Cost $3,994,617,670) | | | 5,499,814,192 |
|
| Convertible Preferred Stocks - 0.0% | | | |
| HEALTH CARE - 0.0% | | | |
| Health Care Equipment & Supplies - 0.0% | | | |
| Becton, Dickinson & Co. Series A 6.125% | | 20,700 | 1,204,119 |
| Pharmaceuticals - 0.0% | | | |
| Allergan PLC 5.50% | | 1,150 | 672,031 |
|
| TOTAL HEALTH CARE | | | 1,876,150 |
|
| REAL ESTATE - 0.0% | | | |
| Equity Real Estate Investment Trusts (REITs) - 0.0% | | | |
| American Tower Corp. 5.50% | | 9,700 | 1,220,988 |
| UTILITIES - 0.0% | | | |
| Independent Power and Renewable Electricity Producers - 0.0% | | | |
| Dynegy, Inc. 7.00% | | 12,900 | 1,017,165 |
| TOTAL CONVERTIBLE PREFERRED STOCKS | | | |
| (Cost $4,258,675) | | | 4,114,303 |
| | | Principal Amount | Value |
|
| Corporate Bonds - 0.2% | | | |
| Convertible Bonds - 0.1% | | | |
| CONSUMER DISCRETIONARY - 0.0% | | | |
| Media - 0.0% | | | |
| DISH Network Corp. 3.375% 8/15/26 | | 1,530,000 | 1,664,831 |
| ENERGY - 0.1% | | | |
| Oil, Gas & Consumable Fuels - 0.1% | | | |
| Amyris, Inc. 9.5% 4/15/19 pay-in-kind | | 1,729,000 | 1,210,300 |
| Scorpio Tankers, Inc. 2.375% 7/1/19 (f) | | 1,750,000 | 1,572,813 |
| | | | 2,783,113 |
| INFORMATION TECHNOLOGY - 0.0% | | | |
| Internet Software & Services - 0.0% | | | |
| Yahoo!, Inc. 0% 12/1/18 | | 850,000 | 1,145,906 |
| Semiconductors & Semiconductor Equipment - 0.0% | | | |
| Intel Corp. 3.25% 8/1/39 | | 695,000 | 1,543,769 |
| TOTAL INFORMATION TECHNOLOGY | | | 2,689,675 |
|
| TOTAL CONVERTIBLE BONDS | | | 7,137,619 |
|
| Nonconvertible Bonds - 0.1% | | | |
| FINANCIALS - 0.0% | | | |
| Thrifts & Mortgage Finance - 0.0% | | | |
| Prime Securities Services Borrower LLC/Prime Finance, Inc. 9.25% 5/15/23 (f) | | 1,390,000 | 1,542,900 |
| HEALTH CARE - 0.1% | | | |
| Pharmaceuticals - 0.1% | | | |
| Valeant Pharmaceuticals International, Inc. 5.875% 5/15/23 (f) | | 1,720,000 | 1,595,300 |
|
| TOTAL NONCONVERTIBLE BONDS | | | 3,138,200 |
|
| TOTAL CORPORATE BONDS | | | |
| (Cost $10,132,652) | | | 10,275,819 |
| | | Shares | Value |
|
| Money Market Funds - 3.0% | | | |
| Fidelity Cash Central Fund, 1.36% (g) | | 160,878,188 | 160,910,364 |
| Fidelity Securities Lending Cash Central Fund 1.36% (g)(h) | | 8,424,770 | 8,426,455 |
| TOTAL MONEY MARKET FUNDS | | | |
| (Cost $169,333,050) | | | 169,336,819 |
| TOTAL INVESTMENT IN SECURITIES - 100.1% | | | |
| (Cost $4,178,342,047) | | | 5,683,541,133 |
| NET OTHER ASSETS (LIABILITIES) - (0.1)% | | | (7,237,268) |
| NET ASSETS - 100% | | | $5,676,303,865 |
Legend
(a) Security or a portion of the security is on loan at period end.
(b) Non-income producing
(c) Investment is owned by an entity that is treated as a U.S. Corporation for tax purposes in which the Fund holds a percentage ownership.
(d) Restricted securities - Investment in securities not registered under the Securities Act of 1933 (excluding 144A issues). At the end of the period, the value of restricted securities (excluding 144A issues) amounted to $4,342,608 or 0.1% of net assets.
(e) Level 3 security
(f) Security exempt from registration under Rule 144A of the Securities Act of 1933. These securities may be resold in transactions exempt from registration, normally to qualified institutional buyers. At the end of the period, the value of these securities amounted to $4,711,013 or 0.1% of net assets.
(g) Affiliated fund that is generally available only to investment companies and other accounts managed by Fidelity Investments. The rate quoted is the annualized seven-day yield of the fund at period end. A complete unaudited listing of the fund's holdings as of its most recent quarter end is available upon request. In addition, each Fidelity Central Fund's financial statements, which are not covered by the Fund's Report of Independent Registered Public Accounting Firm, are available on the SEC's website or upon request.
(h) Investment made with cash collateral received from securities on loan.
Additional information on each restricted holding is as follows:
| Security | Acquisition Date | Acquisition Cost |
| New Academy Holding Co. LLC unit | 8/1/11 | $13,406,880 |
Affiliated Central Funds
Information regarding fiscal year to date income earned by the Fund from investments in Fidelity Central Funds is as follows:
| Fund | Income earned |
| Fidelity Cash Central Fund | $1,712,110 |
| Fidelity Securities Lending Cash Central Fund | 332,931 |
| Total | $2,045,041 |
Amounts in the income column in the above table include any capital gain distributions from underlying funds, which are presented in the corresponding line-item in the Statement of Operations if applicable.
Investment Valuation
The following is a summary of the inputs used, as of December 31, 2017, involving the Fund's assets and liabilities carried at fair value. The inputs or methodology used for valuing securities may not be an indication of the risk associated with investing in those securities. For more information on valuation inputs, and their aggregation into the levels used below, please refer to the Investment Valuation section in the accompanying Notes to Financial Statements.
| | Valuation Inputs at Reporting Date: |
| Description | Total | Level 1 | Level 2 | Level 3 |
| Investments in Securities: | | | | |
| Equities: | | | | |
| Consumer Discretionary | $355,416,247 | $355,416,247 | $-- | $-- |
| Consumer Staples | 667,758,686 | 624,215,526 | 43,543,160 | -- |
| Energy | 620,994,836 | 620,994,836 | -- | -- |
| Financials | 1,392,963,525 | 1,388,620,917 | -- | 4,342,608 |
| Health Care | 555,719,016 | 430,698,863 | 125,020,153 | -- |
| Industrials | 356,708,292 | 356,708,292 | -- | -- |
| Information Technology | 687,061,123 | 680,765,257 | 6,295,866 | -- |
| Materials | 194,432,951 | 194,432,951 | -- | -- |
| Real Estate | 105,818,394 | 104,597,406 | 1,220,988 | -- |
| Telecommunication Services | 262,282,010 | 262,282,010 | -- | -- |
| Utilities | 304,773,415 | 303,756,250 | 1,017,165 | -- |
| Corporate Bonds | 10,275,819 | -- | 10,275,819 | -- |
| Money Market Funds | 169,336,819 | 169,336,819 | -- | -- |
| Total Investments in Securities: | $5,683,541,133 | $5,491,825,374 | $187,373,151 | $4,342,608 |
Other Information
Distribution of investments by country or territory of incorporation, as a percentage of Total Net Assets, is as follows (Unaudited):
| United States of America | 87.3% |
| Switzerland | 3.4% |
| United Kingdom | 2.5% |
| Canada | 2.0% |
| Netherlands | 1.8% |
| Others (Individually Less Than 1%) | 3.0% |
| | 100.0% |
See accompanying notes which are an integral part of the financial statements.
Financial Statements
Statement of Assets and Liabilities
| | | December 31, 2017 |
| Assets | | |
Investment in securities, at value (including securities loaned of $8,085,761) — See accompanying schedule:
Unaffiliated issuers (cost $4,009,008,997) | $5,514,204,314 | |
| Fidelity Central Funds (cost $169,333,050) | 169,336,819 | |
| Total Investment in Securities (cost $4,178,342,047) | | $5,683,541,133 |
| Foreign currency held at value (cost $224,422) | | 224,431 |
| Receivable for fund shares sold | | 1,012,846 |
| Dividends receivable | | 6,431,465 |
| Interest receivable | | 113,717 |
| Distributions receivable from Fidelity Central Funds | | 194,752 |
| Prepaid expenses | | 9,745 |
| Other receivables | | 505,681 |
| Total assets | | 5,692,033,770 |
| Liabilities | | |
| Payable to custodian bank | $1,298,499 | |
| Payable for fund shares redeemed | 2,562,635 | |
| Accrued management fee | 2,085,868 | |
| Distribution and service plan fees payable | 329,123 | |
| Other affiliated payables | 438,139 | |
| Other payables and accrued expenses | 591,966 | |
| Collateral on securities loaned | 8,423,675 | |
| Total liabilities | | 15,729,905 |
| Net Assets | | $5,676,303,865 |
| Net Assets consist of: | | |
| Paid in capital | | $3,947,771,081 |
| Distributions in excess of net investment income | | (10,715,106) |
| Accumulated undistributed net realized gain (loss) on investments and foreign currency transactions | | 234,020,899 |
| Net unrealized appreciation (depreciation) on investments and assets and liabilities in foreign currencies | | 1,505,226,991 |
| Net Assets | | $5,676,303,865 |
| Initial Class: | | |
| Net Asset Value, offering price and redemption price per share ($3,440,094,916 ÷ 143,982,825 shares) | | $23.89 |
| Service Class: | | |
| Net Asset Value, offering price and redemption price per share ($326,564,705 ÷ 13,740,135 shares) | | $23.77 |
| Service Class 2: | | |
| Net Asset Value, offering price and redemption price per share ($1,452,633,260 ÷ 62,299,416 shares) | | $23.32 |
| Investor Class: | | |
| Net Asset Value, offering price and redemption price per share ($457,010,984 ÷ 19,226,435 shares) | | $23.77 |
See accompanying notes which are an integral part of the financial statements.
Statement of Operations
| | | Year ended December 31, 2017 |
| Investment Income | | |
| Dividends | | $152,444,041 |
| Interest | | 938,714 |
| Income from Fidelity Central Funds | | 2,045,041 |
| Total income | | 155,427,796 |
| Expenses | | |
| Management fee | $25,367,701 | |
| Transfer agent fees | 4,121,388 | |
| Distribution and service plan fees | 3,885,839 | |
| Accounting and security lending fees | 1,116,113 | |
| Custodian fees and expenses | 112,760 | |
| Independent trustees' fees and expenses | 22,714 | |
| Appreciation in deferred trustee compensation account | 375 | |
| Audit | 86,516 | |
| Legal | 25,304 | |
| Miscellaneous | 46,487 | |
| Total expenses before reductions | 34,785,197 | |
| Expense reductions | (119,907) | 34,665,290 |
| Net investment income (loss) | | 120,762,506 |
| Realized and Unrealized Gain (Loss) | | |
| Net realized gain (loss) on: | | |
| Investment securities: | | |
| Unaffiliated issuers | 249,893,072 | |
| Fidelity Central Funds | 35,315 | |
| Foreign currency transactions | (62,002) | |
| Written options | 6,479,040 | |
| Total net realized gain (loss) | | 256,345,425 |
| Change in net unrealized appreciation (depreciation) on: | | |
| Investment securities: | | |
| Unaffiliated issuers | 297,041,241 | |
| Fidelity Central Funds | (35,646) | |
| Assets and liabilities in foreign currencies | 35,245 | |
| Written options | 10,928,146 | |
| Total change in net unrealized appreciation (depreciation) | | 307,968,986 |
| Net gain (loss) | | 564,314,411 |
| Net increase (decrease) in net assets resulting from operations | | $685,076,917 |
See accompanying notes which are an integral part of the financial statements.
Statement of Changes in Net Assets
| | Year ended December 31, 2017 | Year ended December 31, 2016 |
| Increase (Decrease) in Net Assets | | |
| Operations | | |
| Net investment income (loss) | $120,762,506 | $123,857,767 |
| Net realized gain (loss) | 256,345,425 | 86,923,575 |
| Change in net unrealized appreciation (depreciation) | 307,968,986 | 692,097,356 |
| Net increase (decrease) in net assets resulting from operations | 685,076,917 | 902,878,698 |
| Distributions to shareholders from net investment income | (90,590,382) | (120,005,164) |
| Distributions to shareholders from net realized gain | (118,331,218) | (349,257,965) |
| Total distributions | (208,921,600) | (469,263,129) |
| Share transactions - net increase (decrease) | (502,055,122) | 21,742,678 |
| Total increase (decrease) in net assets | (25,899,805) | 455,358,247 |
| Net Assets | | |
| Beginning of period | 5,702,203,670 | 5,246,845,423 |
| End of period | $5,676,303,865 | $5,702,203,670 |
| Other Information | | |
| Distributions in excess of net investment income end of period | $(10,715,106) | $(21,216,677) |
See accompanying notes which are an integral part of the financial statements.
Financial Highlights
VIP Equity-Income Portfolio Initial Class
| Years ended December 31, | 2017 | 2016 | 2015 | 2014 | 2013 |
| Selected Per–Share Data | | | | | |
| Net asset value, beginning of period | $21.97 | $20.46 | $24.30 | $23.29 | $19.94 |
| Income from Investment Operations | | | | | |
| Net investment income (loss)A | .50 | .49 | .63 | .71B | .56 |
| Net realized and unrealized gain (loss) | 2.29 | 2.85 | (1.57)C | 1.35 | 4.96 |
| Total from investment operations | 2.79 | 3.34 | (.94) | 2.06 | 5.52 |
| Distributions from net investment income | (.40) | (.48) | (.71) | (.71) | (.60) |
| Distributions from net realized gain | (.47) | (1.34) | (2.19) | (.34) | (1.57) |
| Total distributions | (.87) | (1.83)D | (2.90) | (1.05) | (2.17) |
| Redemption fees added to paid in capitalA | – | – | –E | –E | –E |
| Net asset value, end of period | $23.89 | $21.97 | $20.46 | $24.30 | $23.29 |
| Total ReturnF,G | 12.89% | 18.02% | (4.08)%C | 8.85% | 28.15% |
| Ratios to Average Net AssetsH,I | | | | | |
| Expenses before reductions | .53% | .54% | .54% | .54% | .55% |
| Expenses net of fee waivers, if any | .53% | .54% | .54% | .54% | .54% |
| Expenses net of all reductions | .53% | .54% | .53% | .54% | .54% |
| Net investment income (loss) | 2.19% | 2.39% | 2.85% | 2.94%B | 2.43% |
| Supplemental Data | | | | | |
| Net assets, end of period (000 omitted) | $3,440,095 | $3,550,158 | $3,238,580 | $3,817,228 | $3,947,728 |
| Portfolio turnover rateJ | 36% | 38% | 46% | 40% | 32% |
A Calculated based on average shares outstanding during the period.
B Net Investment income per share reflects a large, non-recurring dividend which amounted to $.08 per share. Excluding this non-recurring dividend, the ratio of net investment income (loss) to average net assets would have been 2.59%.
C Net realized and unrealized gain (loss) per share reflects proceeds received from litigation which amounted to $.02 per share. Excluding these litigation proceeds, the total return would have been (4.18)%.
D Total distributions of $1.83 per share is comprised of distributions from net investment income of $.484 and distributions from net realized gain of $1.342 per share.
E Amount represents less than $.005 per share.
F Total returns do not reflect charges attributable to your insurance company's separate account. Inclusion of these charges would reduce the total returns shown.
G Total returns would have been lower if certain expenses had not been reduced during the applicable periods shown.
H Fees and expenses of any underlying Fidelity Central Funds are not included in the Fund's expense ratio. The Fund indirectly bears its proportionate share of the expenses of any underlying Fidelity Central Funds.
I Expense ratios reflect operating expenses of the class. Expenses before reductions do not reflect amounts reimbursed by the investment adviser or reductions from brokerage service arrangements or reductions from other expense offset arrangements and do not represent the amount paid by the class during periods when reimbursements or reductions occur. Expenses net of fee waivers reflect expenses after reimbursement by the investment adviser but prior to reductions from brokerage service arrangements or other expense offset arrangements. Expenses net of all reductions represent the net expenses paid by the class.
J Amount does not include the portfolio activity of any underlying Fidelity Central Funds.
See accompanying notes which are an integral part of the financial statements.
VIP Equity-Income Portfolio Service Class
| Years ended December 31, | 2017 | 2016 | 2015 | 2014 | 2013 |
| Selected Per–Share Data | | | | | |
| Net asset value, beginning of period | $21.86 | $20.37 | $24.20 | $23.20 | $19.87 |
| Income from Investment Operations | | | | | |
| Net investment income (loss)A | .47 | .46 | .61 | .69B | .53 |
| Net realized and unrealized gain (loss) | 2.29 | 2.84 | (1.56)C | 1.34 | 4.94 |
| Total from investment operations | 2.76 | 3.30 | (.95) | 2.03 | 5.47 |
| Distributions from net investment income | (.38) | (.47) | (.69) | (.68) | (.57) |
| Distributions from net realized gain | (.47) | (1.34) | (2.19) | (.34) | (1.57) |
| Total distributions | (.85) | (1.81) | (2.88) | (1.03)D | (2.14) |
| Redemption fees added to paid in capitalA | – | – | –E | –E | –E |
| Net asset value, end of period | $23.77 | $21.86 | $20.37 | $24.20 | $23.20 |
| Total ReturnF,G | 12.80% | 17.90% | (4.17)%C | 8.74% | 28.01% |
| Ratios to Average Net AssetsH,I | | | | | |
| Expenses before reductions | .63% | .64% | .64% | .64% | .65% |
| Expenses net of fee waivers, if any | .63% | .64% | .64% | .64% | .64% |
| Expenses net of all reductions | .63% | .64% | .63% | .64% | .64% |
| Net investment income (loss) | 2.09% | 2.29% | 2.75% | 2.84%B | 2.33% |
| Supplemental Data | | | | | |
| Net assets, end of period (000 omitted) | $326,565 | $325,602 | $309,669 | $369,024 | $391,896 |
| Portfolio turnover rateJ | 36% | 38% | 46% | 40% | 32% |
A Calculated based on average shares outstanding during the period.
B Net Investment income per share reflects a large, non-recurring dividend which amounted to $.08 per share. Excluding this non-recurring dividend, the ratio of net investment income (loss) to average net assets would have been 2.49%.
C Net realized and unrealized gain (loss) per share reflects proceeds received from litigation which amounted to $.02 per share. Excluding these litigation proceeds, the total return would have been (4.27)%.
D Total distributions of $1.03 per share is comprised of distributions from net investment income of $.684 and distributions from net realized gain of $.342 per share.
E Amount represents less than $.005 per share.
F Total returns do not reflect charges attributable to your insurance company's separate account. Inclusion of these charges would reduce the total returns shown.
G Total returns would have been lower if certain expenses had not been reduced during the applicable periods shown.
H Fees and expenses of any underlying Fidelity Central Funds are not included in the Fund's expense ratio. The Fund indirectly bears its proportionate share of the expenses of any underlying Fidelity Central Funds.
I Expense ratios reflect operating expenses of the class. Expenses before reductions do not reflect amounts reimbursed by the investment adviser or reductions from brokerage service arrangements or reductions from other expense offset arrangements and do not represent the amount paid by the class during periods when reimbursements or reductions occur. Expenses net of fee waivers reflect expenses after reimbursement by the investment adviser but prior to reductions from brokerage service arrangements or other expense offset arrangements. Expenses net of all reductions represent the net expenses paid by the class.
J Amount does not include the portfolio activity of any underlying Fidelity Central Funds.
See accompanying notes which are an integral part of the financial statements.
VIP Equity-Income Portfolio Service Class 2
| Years ended December 31, | 2017 | 2016 | 2015 | 2014 | 2013 |
| Selected Per–Share Data | | | | | |
| Net asset value, beginning of period | $21.46 | $20.04 | $23.85 | $22.88 | $19.62 |
| Income from Investment Operations | | | | | |
| Net investment income (loss)A | .43 | .42 | .57 | .64B | .49 |
| Net realized and unrealized gain (loss) | 2.24 | 2.78 | (1.54)C | 1.32 | 4.88 |
| Total from investment operations | 2.67 | 3.20 | (.97) | 1.96 | 5.37 |
| Distributions from net investment income | (.34) | (.44) | (.65) | (.65) | (.54) |
| Distributions from net realized gain | (.47) | (1.34) | (2.19) | (.34) | (1.57) |
| Total distributions | (.81) | (1.78) | (2.84) | (.99) | (2.11) |
| Redemption fees added to paid in capitalA | – | – | –D | –D | –D |
| Net asset value, end of period | $23.32 | $21.46 | $20.04 | $23.85 | $22.88 |
| Total ReturnE,F | 12.65% | 17.71% | (4.32)%C | 8.57% | 27.83% |
| Ratios to Average Net AssetsG,H | | | | | |
| Expenses before reductions | .78% | .79% | .79% | .79% | .80% |
| Expenses net of fee waivers, if any | .78% | .79% | .79% | .79% | .79% |
| Expenses net of all reductions | .78% | .79% | .78% | .79% | .79% |
| Net investment income (loss) | 1.94% | 2.14% | 2.60% | 2.69%B | 2.18% |
| Supplemental Data | | | | | |
| Net assets, end of period (000 omitted) | $1,452,633 | $1,397,762 | $1,348,912 | $1,702,854 | $1,755,769 |
| Portfolio turnover rateI | 36% | 38% | 46% | 40% | 32% |
A Calculated based on average shares outstanding during the period.
B Net Investment income per share reflects a large, non-recurring dividend which amounted to $.08 per share. Excluding this non-recurring dividend, the ratio of net investment income (loss) to average net assets would have been 2.34%.
C Net realized and unrealized gain (loss) per share reflects proceeds received from litigation which amounted to $.02 per share. Excluding these litigation proceeds, the total return would have been (4.42)%.
D Amount represents less than $.005 per share.
E Total returns do not reflect charges attributable to your insurance company's separate account. Inclusion of these charges would reduce the total returns shown.
F Total returns would have been lower if certain expenses had not been reduced during the applicable periods shown.
G Fees and expenses of any underlying Fidelity Central Funds are not included in the Fund's expense ratio. The Fund indirectly bears its proportionate share of the expenses of any underlying Fidelity Central Funds.
H Expense ratios reflect operating expenses of the class. Expenses before reductions do not reflect amounts reimbursed by the investment adviser or reductions from brokerage service arrangements or reductions from other expense offset arrangements and do not represent the amount paid by the class during periods when reimbursements or reductions occur. Expenses net of fee waivers reflect expenses after reimbursement by the investment adviser but prior to reductions from brokerage service arrangements or other expense offset arrangements. Expenses net of all reductions represent the net expenses paid by the class.
I Amount does not include the portfolio activity of any underlying Fidelity Central Funds.
See accompanying notes which are an integral part of the financial statements.
VIP Equity-Income Portfolio Investor Class
| Years ended December 31, | 2017 | 2016 | 2015 | 2014 | 2013 |
| Selected Per–Share Data | | | | | |
| Net asset value, beginning of period | $21.86 | $20.37 | $24.21 | $23.21 | $19.89 |
| Income from Investment Operations | | | | | |
| Net investment income (loss)A | .48 | .47 | .61 | .69B | .54 |
| Net realized and unrealized gain (loss) | 2.28 | 2.83 | (1.56)C | 1.34 | 4.93 |
| Total from investment operations | 2.76 | 3.30 | (.95) | 2.03 | 5.47 |
| Distributions from net investment income | (.38) | (.47) | (.70) | (.69) | (.58) |
| Distributions from net realized gain | (.47) | (1.34) | (2.19) | (.34) | (1.57) |
| Total distributions | (.85) | (1.81) | (2.89) | (1.03) | (2.15) |
| Redemption fees added to paid in capitalA | – | – | –D | –D | –D |
| Net asset value, end of period | $23.77 | $21.86 | $20.37 | $24.21 | $23.21 |
| Total ReturnE,F | 12.83% | 17.93% | (4.18)%C | 8.77% | 27.99% |
| Ratios to Average Net AssetsG,H | | | | | |
| Expenses before reductions | .62% | .62% | .62% | .62% | .63% |
| Expenses net of fee waivers, if any | .61% | .62% | .62% | .62% | .62% |
| Expenses net of all reductions | .61% | .62% | .61% | .62% | .62% |
| Net investment income (loss) | 2.11% | 2.31% | 2.77% | 2.86%B | 2.35% |
| Supplemental Data | | | | | |
| Net assets, end of period (000 omitted) | $457,011 | $428,682 | $349,685 | $388,773 | $351,139 |
| Portfolio turnover rateI | 36% | 38% | 46% | 40% | 32% |
A Calculated based on average shares outstanding during the period.
B Net Investment income per share reflects a large, non-recurring dividend which amounted to $.08 per share. Excluding this non-recurring dividend, the ratio of net investment income (loss) to average net assets would have been 2.51%.
C Net realized and unrealized gain (loss) per share reflects proceeds received from litigation which amounted to $.02 per share. Excluding these litigation proceeds, the total return would have been (4.28)%.
D Amount represents less than $.005 per share.
E Total returns do not reflect charges attributable to your insurance company's separate account. Inclusion of these charges would reduce the total returns shown.
F Total returns would have been lower if certain expenses had not been reduced during the applicable periods shown.
G Fees and expenses of any underlying Fidelity Central Funds are not included in the Fund's expense ratio. The Fund indirectly bears its proportionate share of the expenses of any underlying Fidelity Central Funds.
H Expense ratios reflect operating expenses of the class. Expenses before reductions do not reflect amounts reimbursed by the investment adviser or reductions from brokerage service arrangements or reductions from other expense offset arrangements and do not represent the amount paid by the class during periods when reimbursements or reductions occur. Expenses net of fee waivers reflect expenses after reimbursement by the investment adviser but prior to reductions from brokerage service arrangements or other expense offset arrangements. Expenses net of all reductions represent the net expenses paid by the class.
I Amount does not include the portfolio activity of any underlying Fidelity Central Funds.
See accompanying notes which are an integral part of the financial statements.
Notes to Financial Statements
For the period ended December 31, 2017
1. Organization.
VIP Equity-Income Portfolio (the Fund) is a fund of Variable Insurance Products Fund (the Trust) and is authorized to issue an unlimited number of shares. The Trust is registered under the Investment Company Act of 1940, as amended (the 1940 Act), as an open-end management investment company organized as a Massachusetts business trust. Shares of the Fund may only be purchased by insurance companies for the purpose of funding variable annuity or variable life insurance contracts. The Fund offers the following classes of shares: Initial Class shares, Service Class shares, Service Class 2 shares and Investor Class shares. All classes have equal rights and voting privileges, except for matters affecting a single class.
2. Investments in Fidelity Central Funds.
The Fund invests in Fidelity Central Funds, which are open-end investment companies generally available only to other investment companies and accounts managed by the investment adviser and its affiliates. The Fund's Schedule of Investments lists each of the Fidelity Central Funds held as of period end, if any, as an investment of the Fund, but does not include the underlying holdings of each Fidelity Central Fund. As an Investing Fund, the Fund indirectly bears its proportionate share of the expenses of the underlying Fidelity Central Funds.
The Money Market Central Funds seek preservation of capital and current income and are managed by Fidelity Investments Money Management, Inc. (FIMM), an affiliate of the investment adviser. Annualized expenses of the Money Market Central Funds as of their most recent shareholder report date are less than .005%.
A complete unaudited list of holdings for each Fidelity Central Fund is available upon request or at the Securities and Exchange Commission (the SEC) website at www.sec.gov. In addition, the financial statements of the Fidelity Central Funds, which are not covered by the Fund's Report of Independent Registered Public Accounting Firm, are available on the SEC website or upon request.
3. Significant Accounting Policies.
The Fund is an investment company and applies the accounting and reporting guidance of the Financial Accounting Standards Board (FASB) Accounting Standards Codification Topic 946 Financial Services – Investments Companies. The financial statements have been prepared in conformity with accounting principles generally accepted in the United States of America (GAAP), which require management to make certain estimates and assumptions at the date of the financial statements. Actual results could differ from those estimates. Subsequent events, if any, through the date that the financial statements were issued have been evaluated in the preparation of the financial statements. The following summarizes the significant accounting policies of the Fund:
Investment Valuation. Investments are valued as of 4:00 p.m. Eastern time on the last calendar day of the period. The Board of Trustees (the Board) has delegated the day to day responsibility for the valuation of the Fund's investments to the Fair Value Committee (the Committee) established by the Fund's investment adviser. In accordance with valuation policies and procedures approved by the Board, the Fund attempts to obtain prices from one or more third party pricing vendors or brokers to value its investments. When current market prices, quotations or currency exchange rates are not readily available or reliable, investments will be fair valued in good faith by the Committee, in accordance with procedures adopted by the Board. Factors used in determining fair value vary by investment type and may include market or investment specific events, changes in interest rates and credit quality. The frequency with which these procedures are used cannot be predicted and they may be utilized to a significant extent. The Committee oversees the Fund's valuation policies and procedures and reports to the Board on the Committee's activities and fair value determinations. The Board monitors the appropriateness of the procedures used in valuing the Fund's investments and ratifies the fair value determinations of the Committee.
The Fund categorizes the inputs to valuation techniques used to value its investments into a disclosure hierarchy consisting of three levels as shown below:
- Level 1 – quoted prices in active markets for identical investments
- Level 2 – other significant observable inputs (including quoted prices for similar investments, interest rates, prepayment speeds, etc.)
- Level 3 – unobservable inputs (including the Fund's own assumptions based on the best information available)
Valuation techniques used to value the Fund's investments by major category are as follows:
Equity securities, including restricted securities, for which market quotations are readily available, are valued at the last reported sale price or official closing price as reported by a third party pricing vendor on the primary market or exchange on which they are traded and are categorized as Level 1 in the hierarchy. In the event there were no sales during the day or closing prices are not available, securities are valued at the last quoted bid price or may be valued using the last available price and are generally categorized as Level 2 in the hierarchy. For foreign equity securities, when market or security specific events arise, comparisons to the valuation of American Depositary Receipts (ADRs), futures contracts, Exchange-Traded Funds (ETFs) and certain indexes as well as quoted prices for similar securities may be used and would be categorized as Level 2 in the hierarchy. Utilizing these techniques may result in transfers between Level 1 and Level 2. For equity securities, including restricted securities, where observable inputs are limited, assumptions about market activity and risk are used and these securities may be categorized as Level 3 in the hierarchy.
Debt securities, including restricted securities, are valued based on evaluated prices received from third party pricing vendors or from brokers who make markets in such securities. Corporate bonds are valued by pricing vendors who utilize matrix pricing which considers yield or price of bonds of comparable quality, coupon, maturity and type or by broker-supplied prices. When independent prices are unavailable or unreliable, debt securities may be valued utilizing pricing methodologies which consider similar factors that would be used by third party pricing vendors. Debt securities are generally categorized as Level 2 in the hierarchy but may be Level 3 depending on the circumstances.
Investments in open-end mutual funds, including the Fidelity Central Funds, are valued at their closing net asset value (NAV) each business day and are categorized as Level 1 in the hierarchy.
Changes in valuation techniques may result in transfers in or out of an assigned level within the disclosure hierarchy. The aggregate value of investments by input level as of December 31, 2017 is included at the end of the Fund's Schedule of Investments.
Foreign Currency. The Fund may use foreign currency contracts to facilitate transactions in foreign-denominated securities. Gains and losses from these transactions may arise from changes in the value of the foreign currency or if the counterparties do not perform under the contracts' terms.
Foreign-denominated assets, including investment securities, and liabilities are translated into U.S. dollars at the exchange rates at period end. Purchases and sales of investment securities, income and dividends received and expenses denominated in foreign currencies are translated into U.S. dollars at the exchange rate in effect on the transaction date.
The effects of exchange rate fluctuations on investments are included with the net realized and unrealized gain (loss) on investment securities. Other foreign currency transactions resulting in realized and unrealized gain (loss) are disclosed separately.
Investment Transactions and Income. For financial reporting purposes, the Fund's investment holdings and NAV include trades executed through the end of the last business day of the period. The NAV per share for processing shareholder transactions is calculated as of the close of business of the New York Stock Exchange (NYSE), normally 4:00 p.m. Eastern time and includes trades executed through the end of the prior business day. Gains and losses on securities sold are determined on the basis of identified cost and includes proceeds received from litigation. Dividend income is recorded on the ex-dividend date, except for certain dividends from foreign securities where the ex-dividend date may have passed, which are recorded as soon as the Fund is informed of the ex-dividend date. Non-cash dividends included in dividend income, if any, are recorded at the fair market value of the securities received. Income and capital gain distributions from Fidelity Central Funds, if any, are recorded on the ex-dividend date. Certain distributions received by the Fund represent a return of capital or capital gain. The Fund determines the components of these distributions subsequent to the ex-dividend date, based upon receipt of tax filings or other correspondence relating to the underlying investment. These distributions are recorded as a reduction of cost of investments and/or as a realized gain. Interest income is accrued as earned and includes coupon interest and amortization of premium and accretion of discount on debt securities as applicable. Paid in Kind (PIK) income is recorded at the fair market value of the securities received. Investment income is recorded net of foreign taxes withheld where recovery of such taxes is uncertain.
Class Allocations and Expenses. Investment income, realized and unrealized capital gains and losses, common expenses of the Fund, and certain fund-level expense reductions, if any, are allocated daily on a pro-rata basis to each class based on the relative net assets of each class to the total net assets of the Fund. Each class differs with respect to transfer agent and distribution and service plan fees incurred. Certain expense reductions may also differ by class. For the reporting period, the allocated portion of income and expenses to each class as a percent of its average net assets may vary due to the timing of recording these transactions in relation to fluctuating net assets of the classes. Expenses directly attributable to a fund are charged to that fund. Expenses attributable to more than one fund are allocated among the respective funds on the basis of relative net assets or other appropriate methods. Expense estimates are accrued in the period to which they relate and adjustments are made when actual amounts are known.
Deferred Trustee Compensation. Under a Deferred Compensation Plan (the Plan), independent Trustees may elect to defer receipt of a portion of their annual compensation. Deferred amounts are invested in a cross-section of Fidelity funds, are marked-to-market and remain in the Fund until distributed in accordance with the Plan. The investment of deferred amounts and the offsetting payable to the Trustees are included in the accompanying Statement of Assets and Liabilities.
Income Tax Information and Distributions to Shareholders. Each year, the Fund intends to qualify as a regulated investment company under Subchapter M of the Internal Revenue Code, including distributing substantially all of its taxable income and realized gains. As a result, no provision for U.S. Federal income taxes is required. As of December 31, 2017, the Fund did not have any unrecognized tax benefits in the financial statements; nor is the Fund aware of any tax positions for which it is reasonably possible that the total amounts of unrecognized tax benefits will significantly change in the next twelve months. The Fund files a U.S. federal tax return, in addition to state and local tax returns as required. The Fund's federal income tax returns are subject to examination by the Internal Revenue Service (IRS) for a period of three fiscal years after they are filed. State and local tax returns may be subject to examination for an additional fiscal year depending on the jurisdiction. Foreign taxes are provided for based on the Fund's understanding of the tax rules and rates that exist in the foreign markets in which it invests.
Distributions are declared and recorded on the ex-dividend date. Income dividends and capital gain distributions are declared separately for each class. Income and capital gain distributions are determined in accordance with income tax regulations, which may differ from GAAP.
Capital accounts within the financial statements are adjusted for permanent book-tax differences. These adjustments have no impact on net assets or the results of operations. Capital accounts are not adjusted for temporary book-tax differences which will reverse in a subsequent period.
Book-tax differences are primarily due to foreign currency transactions, market discount, equity-debt classifications, contingent interest, certain conversion ratio adjustments, deferred trustees compensation, partnerships and losses deferred due to wash sales and excise tax regulations.
As of period end, the cost and unrealized appreciation (depreciation) in securities, and derivatives if applicable, for federal income tax purposes were as follows:
| Gross unrealized appreciation | $1,591,316,046 |
| Gross unrealized depreciation | (93,270,878) |
| Net unrealized appreciation (depreciation) | $1,498,045,168 |
| Tax Cost | $4,185,495,965 |
The tax-based components of distributable earnings as of period end were as follows:
| Undistributed ordinary income | $13,339,079 |
| Undistributed long-term capital gain | $244,894,673 |
| Net unrealized appreciation (depreciation) on securities and other investments | $1,474,186,359 |
The Fund intends to elect to defer to its next fiscal year $3,379,653 of capital losses recognized during the period November 1, 2017 to December 31, 2017.
The tax character of distributions paid was as follows:
| | December 31, 2017 | December 31, 2016 |
| Ordinary Income | $147,883,301 | $ 132,489,253 |
| Long-term Capital Gains | 61,038,299 | 336,773,876 |
| Total | $208,921,600 | $ 469,263,129 |
Restricted Securities. The Fund may invest in securities that are subject to legal or contractual restrictions on resale. These securities generally may be resold in transactions exempt from registration or to the public if the securities are registered. Disposal of these securities may involve time-consuming negotiations and expense, and prompt sale at an acceptable price may be difficult. Information regarding restricted securities is included at the end of the Fund's Schedule of Investments.
4. Derivative Instruments.
Risk Exposures and the Use of Derivative Instruments. The Fund's investment objective allows the Fund to enter into various types of derivative contracts, including options. Derivatives are investments whose value is primarily derived from underlying assets, indices or reference rates and may be transacted on an exchange or over-the-counter (OTC). Derivatives may involve a future commitment to buy or sell a specified asset based on specified terms, to exchange future cash flows at periodic intervals based on a notional principal amount, or for one party to make one or more payments upon the occurrence of specified events in exchange for periodic payments from the other party.
The Fund used derivatives to increase returns and to manage exposure to certain risks as defined below. The success of any strategy involving derivatives depends on analysis of numerous economic factors, and if the strategies for investment do not work as intended, the Fund may not achieve its objectives.
The Fund's use of derivatives increased or decreased its exposure to the following risk:
| Equity Risk | Equity risk relates to the fluctuations in the value of financial instruments as a result of changes in market prices (other than those arising from interest rate risk or foreign exchange risk), whether caused by factors specific to an individual investment, its issuer, or all factors affecting all instruments traded in a market or market segment.
|
The Fund is also exposed to additional risks from investing in derivatives, such as liquidity risk and counterparty credit risk. Liquidity risk is the risk that the Fund will be unable to close out the derivative in the open market in a timely manner. Counterparty credit risk is the risk that the counterparty will not be able to fulfill its obligation to the Fund. Counterparty credit risk related to exchange-traded options may be mitigated by the protection provided by the exchange on which they trade.
Investing in derivatives may involve greater risks than investing in the underlying assets directly and, to varying degrees, may involve risk of loss in excess of any initial investment and collateral received and amounts recognized in the Statement of Assets and Liabilities. In addition, there may be the risk that the change in value of the derivative contract does not correspond to the change in value of the underlying instrument.
Options. Options give the purchaser the right, but not the obligation, to buy (call) or sell (put) an underlying security or financial instrument at an agreed exercise or strike price between or on certain dates. Options obligate the seller (writer) to buy (put) or sell (call) an underlying instrument at the exercise or strike price or cash settle an underlying derivative instrument if the holder exercises the option on or before the expiration date.
The Fund used exchange-traded and OTC written covered call options to manage its exposure to the market. When the Fund writes a covered call option, the Fund holds the underlying instrument which must be delivered to the holder upon the exercise of the option.
Upon entering into a written options contract, the Fund will receive a premium. Premiums received are reflected as a liability on the Statement of Assets and Liabilities. Options are valued daily and any unrealized appreciation (depreciation) is reflected on the Statement of Assets and Liabilities. When a written option is exercised, the premium is added to the proceeds from the sale of the underlying instrument in determining the gain or loss realized on that investment. When an option is closed the Fund will realize a gain or loss depending on whether the proceeds or amount paid for the closing sale transaction are greater or less than the premium received. When an option expires, gains and losses are realized to the extent of premiums received. The net realized gain (loss) on closed and expired written options and the change in net unrealized appreciation (depreciation) on written options are presented in the Statement of Operations.
Writing call options tends to decrease exposure to the underlying instrument and risk of loss is the change in value in excess of the premium received.
Any open options at period end are presented in the Schedule of Investments under the caption "Written Options".
5. Purchases and Sales of Investments.
Purchases and sales of securities, other than short-term securities, aggregated $1,993,369,648 and $2,487,929,584, respectively.
6. Fees and Other Transactions with Affiliates.
Management Fee. Fidelity Management & Research Company (the investment adviser) and its affiliates provide the Fund with investment management related services for which the Fund pays a monthly management fee. The management fee is the sum of an individual fund fee rate that is based on an annual rate of .20% of the Fund's average net assets and an annualized group fee rate that averaged .24% during the period. The group fee rate is based upon the average net assets of all the mutual funds advised by the investment adviser, including any mutual funds previously advised by the investment adviser that are currently advised by Fidelity SelectCo, LLC, an affiliate of the investment adviser. The group fee rate decreases as assets under management increase and increases as assets under management decrease. For the reporting period, the total annual management fee rate was .44% of the Fund's average net assets.
Distribution and Service Plan Fees. In accordance with Rule 12b-1 of the 1940 Act, the Fund has adopted separate 12b-1 Plans for each Service Class of shares. Each Service Class pays Fidelity Distributors Corporation (FDC), an affiliate of the investment adviser, a service fee. For the period, the service fee is based on an annual rate of .10% of Service Class' average net assets and .25% of Service Class 2's average net assets.
For the period, total fees, all of which were re-allowed to insurance companies for the distribution of shares and providing shareholder support services, were as follows:
| Service Class | $322,771 |
| Service Class 2 | 3,563,068 |
| | $3,885,839 |
Transfer Agent Fees. Fidelity Investments Institutional Operations Company, Inc. (FIIOC), an affiliate of the investment adviser, is the Fund's transfer, dividend disbursing, and shareholder servicing agent. FIIOC receives an asset-based fee with respect to each class. Each class pays a fee for transfer agent services, typesetting and printing and mailing of shareholder reports, excluding mailing of proxy statements, equal to an annual rate of class-level average net assets. The annual rate for Investor Class is .15% and the annual rate for all other classes is .07%. For the period, transfer agent fees for each class were as follows:
| Initial Class | $2,320,919 |
| Service Class | 212,782 |
| Service Class 2 | 939,552 |
| Investor Class | 648,135 |
| | $4,121,388 |
Accounting and Security Lending Fees. Fidelity Service Company, Inc. (FSC), an affiliate of the investment adviser, maintains the Fund's accounting records. The accounting fee is based on the level of average net assets for each month. Under a separate contract, FSC administers the security lending program. The security lending fee is based on the number and duration of lending transactions.
Brokerage Commissions. The Fund placed a portion of its portfolio transactions with brokerage firms which are affiliates of the investment adviser. Brokerage commissions are included in net realized gain (loss) and change in net unrealized appreciation (depreciation) in the Statement of Operations. The commissions paid to these affiliated firms were $66,378 for the period.
Interfund Trades. The Fund may purchase from or sell securities to other Fidelity Funds under procedures adopted by the Board. The procedures have been designed to ensure these interfund trades are executed in accordance with Rule 17a-7 of the 1940 Act. Interfund trades are included within the respective purchases and sales amounts shown in the Purchases and Sales of Investments note.
7. Committed Line of Credit.
The Fund participates with other funds managed by the investment adviser or an affiliate in a $4.25 billion credit facility (the "line of credit") to be utilized for temporary or emergency purposes to fund shareholder redemptions or for other short-term liquidity purposes. The Fund has agreed to pay commitment fees on its pro-rata portion of the line of credit, which amounted to $18,189 and is reflected in Miscellaneous expenses on the Statement of Operations. During the period, the Fund did not borrow on this line of credit.
8. Security Lending.
The Fund lends portfolio securities through a lending agent from time to time in order to earn additional income. For equity securities, a lending agent is used and may loan securities to certain qualified borrowers, including Fidelity Capital Markets (FCM), a broker-dealer affiliated with the Fund. On the settlement date of the loan, the Fund receives collateral (in the form of U.S. Treasury obligations, letters of credit and/or cash) against the loaned securities and maintains collateral in an amount not less than 100% of the market value of the loaned securities during the period of the loan. The market value of the loaned securities is determined at the close of business of the Fund and any additional required collateral is delivered to the Fund on the next business day. The Fund or borrower may terminate the loan at any time, and if the borrower defaults on its obligation to return the securities loaned because of insolvency or other reasons, the Fund may apply collateral received from the borrower against the obligation. The Fund may experience delays and costs in recovering the securities loaned. Any cash collateral received is invested in the Fidelity Securities Lending Cash Central Fund. The value of loaned securities and cash collateral at period end are disclosed on the Fund's Statement of Assets and Liabilities. At period end, there were no security loans outstanding with FCM. Security lending income represents the income earned on investing cash collateral, less rebates paid to borrowers and any lending agent fees associated with the loan, plus any premium payments received for lending certain types of securities. Security lending income is presented in the Statement of Operations as a component of income from Fidelity Central Funds. Total security lending income during the period amounted to $332,931, including $7,339 from securities loaned to FCM.
9. Expense Reductions.
Commissions paid to certain brokers with whom the investment adviser, or its affiliates, places trades on behalf of the Fund include an amount in addition to trade execution, which may be rebated back to the Fund to offset certain expenses. This amount totaled $68,480 for the period.
In addition, during the period the investment adviser reimbursed and/or waived a portion of fund-level operating expenses in the amount of $51,427.
10. Distributions to Shareholders.
Distributions to shareholders of each class were as follows:
| | Year ended
December 31, 2017 | Year ended December 31, 2016 |
| From net investment income | | |
| Initial Class | $57,100,690 | $76,420,473 |
| Service Class | 5,119,022 | 6,783,305 |
| Service Class 2 | 21,140,938 | 28,029,228 |
| Investor Class | 7,229,732 | 8,772,158 |
| Total | $90,590,382 | $120,005,164 |
| From net realized gain | | |
| Initial Class | $72,446,182 | $217,386,548 |
| Service Class | 6,724,532 | 20,018,928 |
| Service Class 2 | 29,918,354 | 89,027,272 |
| Investor Class | 9,242,150 | 22,825,217 |
| Total | $118,331,218 | $349,257,965 |
11. Share Transactions.
Transactions for each class of shares were as follows:
| | Shares | Shares | Dollars | Dollars |
| | Year ended December 31, 2017 | Year ended December 31, 2016 | Year ended December 31, 2017 | Year ended December 31, 2016 |
| Initial Class | | | | |
| Shares sold | 3,501,530 | 10,465,829 | $79,596,634 | $204,419,055 |
| Reinvestment of distributions | 5,661,287 | 15,663,229 | 129,546,872 | 293,807,021 |
| Shares redeemed | (26,762,957) | (22,834,249) | (612,741,909) | (465,514,021) |
| Net increase (decrease) | (17,600,140) | 3,294,809 | $(403,598,403) | $32,712,055 |
| Service Class | | | | |
| Shares sold | 454,316 | 604,190 | $10,221,020 | $12,342,797 |
| Reinvestment of distributions | 520,108 | 1,437,644 | 11,843,554 | 26,802,233 |
| Shares redeemed | (2,128,567) | (2,349,262) | (48,094,891) | (47,575,832) |
| Net increase (decrease) | (1,154,143) | (307,428) | $(26,030,317) | $(8,430,802) |
| Service Class 2 | | | | |
| Shares sold | 7,005,495 | 6,855,915 | $153,649,419 | $138,866,433 |
| Reinvestment of distributions | 2,285,662 | 6,412,106 | 51,059,292 | 117,056,500 |
| Shares redeemed | (12,115,246) | (15,456,004) | (268,609,638) | (307,480,948) |
| Net increase (decrease) | (2,824,089) | (2,187,983) | $(63,900,927) | $(51,558,015) |
| Investor Class | | | | |
| Shares sold | 1,617,443 | 3,061,155 | $36,296,179 | $63,799,569 |
| Reinvestment of distributions | 723,059 | 1,683,814 | 16,471,882 | 31,597,375 |
| Shares redeemed | (2,720,297) | (2,301,679) | (61,293,536) | (46,377,504) |
| Net increase (decrease) | (379,795) | 2,443,290 | $(8,525,475) | $49,019,440 |
12. Other.
The Fund's organizational documents provide former and current trustees and officers with a limited indemnification against liabilities arising in connection with the performance of their duties to the Fund. In the normal course of business, the Fund may also enter into contracts that provide general indemnifications. The Fund's maximum exposure under these arrangements is unknown as this would be dependent on future claims that may be made against the Fund. The risk of material loss from such claims is considered remote.
At the end of the period, the investment adviser or its affiliates were the owners of record of 15% of the total outstanding shares of the Fund and one otherwise unaffiliated shareholder was the owner of record of 19% of the total outstanding shares of the Fund.
Report of Independent Registered Public Accounting Firm
To the Board of Trustees of Variable Insurance Products Fund and Shareholders of VIP Equity-Income Portfolio:
Opinion on the Financial Statements
We have audited the accompanying statement of assets and liabilities, including the schedule of investments, of VIP Equity-Income Portfolio (one of the funds constituting Variable Insurance Products Fund, referred to hereafter as the “Fund”) as of December 31, 2017, the related statement of operations for the year ended December 31, 2017, the statement of changes in net assets for each of the two years in the period ended December 31, 2017, including the related notes, and the financial highlights for each of the five years in the period ended December 31, 2017 (collectively referred to as the “financial statements”). In our opinion, the financial statements present fairly, in all material respects, the financial position of the Fund as of December 31, 2017, the results of its operations for the year then ended, the changes in its net assets for each of the two years in the period ended December 31, 2017 and the financial highlights for each of the five years in the period ended December 31, 2017 in conformity with accounting principles generally accepted in the United States of America.
Basis for Opinion
These financial statements are the responsibility of the Fund’s management. Our responsibility is to express an opinion on the Fund’s financial statements based on our audits. We are a public accounting firm registered with the Public Company Accounting Oversight Board (United States) (“PCAOB”) and are required to be independent with respect to the Fund in accordance with the U.S. federal securities laws and the applicable rules and regulations of the Securities and Exchange Commission and the PCAOB.
We conducted our audits of these financial statements in accordance with the standards of the PCAOB. Those standards require that we plan and perform the audit to obtain reasonable assurance about whether the financial statements are free of material misstatement, whether due to error or fraud.
Our audits included performing procedures to assess the risks of material misstatement of the financial statements, whether due to error or fraud, and performing procedures that respond to those risks. Such procedures included examining, on a test basis, evidence regarding the amounts and disclosures in the financial statements. Our audits also included evaluating the accounting principles used and significant estimates made by management, as well as evaluating the overall presentation of the financial statements. Our procedures included confirmation of securities owned as of December 31, 2017 by correspondence with the custodian. We believe that our audits provide a reasonable basis for our opinion.
PricewaterhouseCoopers LLP
Boston, Massachusetts
February 14, 2018
We have served as the auditor of one or more investment companies in the Fidelity group of funds since 1932.
Trustees and Officers
The Trustees, Members of the Advisory Board (if any), and officers of the trust and fund, as applicable, are listed below. The Board of Trustees governs the fund and is responsible for protecting the interests of shareholders. The Trustees are experienced executives who meet periodically throughout the year to oversee the fund's activities, review contractual arrangements with companies that provide services to the fund, oversee management of the risks associated with such activities and contractual arrangements, and review the fund's performance. Except for Jonathan Chiel, each of the Trustees oversees 190 funds. Mr. Chiel oversees 145 funds.
The Trustees hold office without limit in time except that (a) any Trustee may resign; (b) any Trustee may be removed by written instrument, signed by at least two-thirds of the number of Trustees prior to such removal; (c) any Trustee who requests to be retired or who has become incapacitated by illness or injury may be retired by written instrument signed by a majority of the other Trustees; and (d) any Trustee may be removed at any special meeting of shareholders by a two-thirds vote of the outstanding voting securities of the trust. Each Trustee who is not an interested person (as defined in the 1940 Act) of the trust and the fund is referred to herein as an Independent Trustee. Each Independent Trustee shall retire not later than the last day of the calendar year in which his or her 75th birthday occurs. The Independent Trustees may waive this mandatory retirement age policy with respect to individual Trustees. Officers and Advisory Board Members hold office without limit in time, except that any officer or Advisory Board Member may resign or may be removed by a vote of a majority of the Trustees at any regular meeting or any special meeting of the Trustees. Except as indicated, each individual has held the office shown or other offices in the same company for the past five years.
The fund’s Statement of Additional Information (SAI) includes more information about the Trustees. To request a free copy, call Fidelity at 1-877-208-0098.
Experience, Skills, Attributes, and Qualifications of the Trustees. The Governance and Nominating Committee has adopted a statement of policy that describes the experience, qualifications, attributes, and skills that are necessary and desirable for potential Independent Trustee candidates (Statement of Policy). The Board believes that each Trustee satisfied at the time he or she was initially elected or appointed a Trustee, and continues to satisfy, the standards contemplated by the Statement of Policy. The Governance and Nominating Committee also engages professional search firms to help identify potential Independent Trustee candidates who have the experience, qualifications, attributes, and skills consistent with the Statement of Policy. From time to time, additional criteria based on the composition and skills of the current Independent Trustees, as well as experience or skills that may be appropriate in light of future changes to board composition, business conditions, and regulatory or other developments, have also been considered by the professional search firms and the Governance and Nominating Committee. In addition, the Board takes into account the Trustees' commitment and participation in Board and committee meetings, as well as their leadership of standing and ad hoc committees throughout their tenure.
In determining that a particular Trustee was and continues to be qualified to serve as a Trustee, the Board has considered a variety of criteria, none of which, in isolation, was controlling. The Board believes that, collectively, the Trustees have balanced and diverse experience, qualifications, attributes, and skills, which allow the Board to operate effectively in governing the fund and protecting the interests of shareholders. Information about the specific experience, skills, attributes, and qualifications of each Trustee, which in each case led to the Board's conclusion that the Trustee should serve (or continue to serve) as a trustee of the fund, is provided below.
Board Structure and Oversight Function. James C. Curvey is an interested person and currently serves as Chairman. The Trustees have determined that an interested Chairman is appropriate and benefits shareholders because an interested Chairman has a personal and professional stake in the quality and continuity of services provided to the fund. Independent Trustees exercise their informed business judgment to appoint an individual of their choosing to serve as Chairman, regardless of whether the Trustee happens to be independent or a member of management. The Independent Trustees have determined that they can act independently and effectively without having an Independent Trustee serve as Chairman and that a key structural component for assuring that they are in a position to do so is for the Independent Trustees to constitute a substantial majority for the Board. The Independent Trustees also regularly meet in executive session. Ned C. Lautenbach serves as Chairman of the Independent Trustees and as such (i) acts as a liaison between the Independent Trustees and management with respect to matters important to the Independent Trustees and (ii) with management prepares agendas for Board meetings.
Fidelity® funds are overseen by different Boards of Trustees. The fund's Board oversees Fidelity's high income and certain equity funds, and other Boards oversee Fidelity's investment-grade bond, money market, asset allocation, and sector funds. The asset allocation funds may invest in Fidelity® funds overseen by the fund's Board. The use of separate Boards, each with its own committee structure, allows the Trustees of each group of Fidelity® funds to focus on the unique issues of the funds they oversee, including common research, investment, and operational issues. On occasion, the separate Boards establish joint committees to address issues of overlapping consequences for the Fidelity® funds overseen by each Board.
The Trustees operate using a system of committees to facilitate the timely and efficient consideration of all matters of importance to the Trustees, the fund, and fund shareholders and to facilitate compliance with legal and regulatory requirements and oversight of the fund's activities and associated risks. The Board, acting through its committees, has charged FMR and its affiliates with (i) identifying events or circumstances the occurrence of which could have demonstrably adverse effects on the fund's business and/or reputation; (ii) implementing processes and controls to lessen the possibility that such events or circumstances occur or to mitigate the effects of such events or circumstances if they do occur; and (iii) creating and maintaining a system designed to evaluate continuously business and market conditions in order to facilitate the identification and implementation processes described in (i) and (ii) above. Because the day-to-day operations and activities of the fund are carried out by or through FMR, its affiliates, and other service providers, the fund's exposure to risks is mitigated but not eliminated by the processes overseen by the Trustees. While each of the Board's committees has responsibility for overseeing different aspects of the fund's activities, oversight is exercised primarily through the Operations, Audit, and Compliance Committees. In addition, the Independent Trustees have worked with FMR to enhance the Board's oversight of investment and financial risks, legal and regulatory risks, technology risks, and operational risks, including the development of additional risk reporting to the Board. For example, a working group comprised of Independent Trustees and FMR has worked and continues to work to review the Fidelity® funds' valuation-related activities, reporting and risk management. Appropriate personnel, including but not limited to the fund's Chief Compliance Officer (CCO), FMR's internal auditor, the independent accountants, the fund's Treasurer and portfolio management personnel, make periodic reports to the Board's committees, as appropriate, including an annual review of Fidelity's risk management program for the Fidelity® funds. The responsibilities of each standing committee, including their oversight responsibilities, are described further under "Standing Committees of the Trustees."
Interested Trustees*:
Correspondence intended for a Trustee who is an interested person may be sent to Fidelity Investments, 245 Summer Street, Boston, Massachusetts 02210.
Name, Year of Birth; Principal Occupations and Other Relevant Experience+
Jonathan Chiel (1957)
Year of Election or Appointment: 2016
Trustee
Mr. Chiel also serves as Trustee of other Fidelity® funds. Mr. Chiel is Executive Vice President and General Counsel for FMR LLC (diversified financial services company, 2012-present). Previously, Mr. Chiel served as general counsel (2004-2012) and senior vice president and deputy general counsel (2000-2004) for John Hancock Financial Services; a partner with Choate, Hall & Stewart (1996-2000) (law firm); and an Assistant United States Attorney for the United States Attorney’s Office of the District of Massachusetts (1986-95), including Chief of the Criminal Division (1993-1995). Mr. Chiel is a director on the boards of the Boston Bar Foundation and the Maimonides School.
James C. Curvey (1935)
Year of Election or Appointment: 2007
Trustee
Chairman of the Board of Trustees
Mr. Curvey also serves as Trustee of other Fidelity® funds. Mr. Curvey is a Director of Fidelity Research & Analysis Co. (investment adviser firm, 2009-present), and Vice Chairman (2007-present) and Director of FMR LLC (diversified financial services company). In addition, Mr. Curvey serves as an Overseer for the Boston Symphony Orchestra and a member of the board of Artis-Naples, Naples, Florida, and as a Trustee for Brewster Academy, Wolfeboro, New Hampshire. Previously, Mr. Curvey served as a Director of Fidelity Investments Money Management, Inc. (investment adviser firm, 2009-2014) and a Director of FMR and FMR Co., Inc. (investment adviser firms, 2007-2014).
Charles S. Morrison (1960)
Year of Election or Appointment: 2014
Trustee
Mr. Morrison also serves as Trustee of other funds. He serves as President of Fidelity SelectCo, LLC (investment adviser firm, 2017-present) and Fidelity Management & Research Company (FMR) (investment adviser firm, 2016-present), a Director of Fidelity Investments Money Management, Inc. (FIMM) (investment adviser firm, 2014-present), Director of Fidelity SelectCo, LLC (investment adviser firm, 2014-present), President, Asset Management (2014-present), and is an employee of Fidelity Investments. Previously, Mr. Morrison served as Vice President of Fidelity's Fixed Income and Asset Allocation Funds (2012-2014), President, Fixed Income (2011-2014), Vice President of Fidelity's Money Market Funds (2005-2009), President, Money Market Group Leader of FMR (investment adviser firm, 2009), and Senior Vice President, Money Market Group of FMR (2004-2009). Mr. Morrison also served as Vice President of Fidelity's Bond Funds (2002-2005), certain Balanced Funds (2002-2005), and certain Asset Allocation Funds (2002-2007), and as Senior Vice President (2002-2005) of Fidelity's Bond Division.
* Determined to be an “Interested Trustee” by virtue of, among other things, his or her affiliation with the trust or various entities under common control with FMR.
+ The information includes the Trustee's principal occupation during the last five years and other information relating to the experience, attributes, and skills relevant to the Trustee's qualifications to serve as a Trustee, which led to the conclusion that the Trustee should serve as a Trustee for the fund.
Independent Trustees:
Correspondence intended for an Independent Trustee may be sent to Fidelity Investments, P.O. Box 55235, Boston, Massachusetts 02205-5235.
Name, Year of Birth; Principal Occupations and Other Relevant Experience+
Dennis J. Dirks (1948)
Year of Election or Appointment: 2005
Trustee
Mr. Dirks also serves as Trustee of other Fidelity® funds. Prior to his retirement in May 2003, Mr. Dirks was Chief Operating Officer and a member of the Board of The Depository Trust & Clearing Corporation (DTCC). He also served as President, Chief Operating Officer, and Board member of The Depository Trust Company (DTC) and President and Board member of the National Securities Clearing Corporation (NSCC). In addition, Mr. Dirks served as Chief Executive Officer and Board member of the Government Securities Clearing Corporation, Chief Executive Officer and Board member of the Mortgage-Backed Securities Clearing Corporation, as a Trustee and a member of the Finance Committee of Manhattan College (2005-2008), as a Trustee and a member of the Finance Committee of AHRC of Nassau County (2006-2008), as a member of the Independent Directors Council (IDC) Governing Council (2010-2015), and as a member of the Board of Directors for The Brookville Center for Children’s Services, Inc. (2009-2017). Mr. Dirks is a member of the Finance Committee (2016-present) and Board of Directors (2017-present) of the Asolo Repertory Theatre.
Alan J. Lacy (1953)
Year of Election or Appointment: 2008
Trustee
Mr. Lacy also serves as Trustee of other Fidelity® funds. Mr. Lacy serves as a Director of Bristol-Myers Squibb Company (global pharmaceuticals, 2008-present). He is a Trustee of the California Chapter of The Nature Conservancy (2015-present) and a Director of the Center for Advanced Study in the Behavioral Sciences at Stanford University (2015-present). In addition, Mr. Lacy served as Senior Adviser (2007-2014) of Oak Hill Capital Partners, L.P. (private equity) and also served as Chief Executive Officer (2005) and Vice Chairman (2005-2006) of Sears Holdings Corporation (retail) and Chief Executive Officer and Chairman of the Board of Sears, Roebuck and Co. (retail, 2000-2005). Previously, Mr. Lacy served as Chairman (2014-2017) and a member (2010-2017) of the Board of Directors of Dave & Buster’s Entertainment, Inc. (restaurant and entertainment complexes), as Chairman (2008-2011) and a member (2006-2015) of the Board of Trustees of the National Parks Conservation Association, and as a member of the Board of Directors for The Hillman Companies, Inc. (hardware wholesalers, 2010-2014), Earth Fare, Inc. (retail grocery, 2010-2014), and The Western Union Company (global money transfer, 2006-2011).
Ned C. Lautenbach (1944)
Year of Election or Appointment: 2000
Trustee
Chairman of the Independent Trustees
Mr. Lautenbach also serves as Trustee of other Fidelity® funds. Mr. Lautenbach currently serves as Vice Chair of the Board of Governors, State University System of Florida (2013-present) and is a member of the Council on Foreign Relations (1994-present). He is also a member and has most recently served as Chairman of the Board of Directors of Artis-Naples (2012-present). Previously, Mr. Lautenbach served as a member and then Lead Director of the Board of Directors of Eaton Corporation (diversified industrial, 1997-2016). He was also a Partner and Advisory Partner at Clayton, Dubilier & Rice, LLC (private equity investment, 1998-2010), as well as a Director of Sony Corporation (2006-2007). In addition, Mr. Lautenbach also had a 30-year career with IBM (technology company) during which time he served as Senior Vice President and a member of the Corporate Executive Committee (1968-1998).
Joseph Mauriello (1944)
Year of Election or Appointment: 2008
Trustee
Mr. Mauriello also serves as Trustee of other Fidelity® funds. Prior to his retirement in January 2006, Mr. Mauriello served in numerous senior management positions including Deputy Chairman and Chief Operating Officer (2004-2005), and Vice Chairman of Financial Services (2002-2004) of KPMG LLP US (professional services, 1965-2005). Mr. Mauriello currently serves as a member of the Board of Directors of XL Group plc. (global insurance and re-insurance, 2006-present) and the Independent Directors Council (IDC) Governing Council (2015-present). Previously, Mr. Mauriello served as a Director of the Hamilton Funds of the Bank of New York (2006-2007) and of Arcadia Resources Inc. (health care services and products, 2007-2012).
Cornelia M. Small (1944)
Year of Election or Appointment: 2005
Trustee
Ms. Small also serves as Trustee of other Fidelity® funds. Ms. Small is a member of the Board of Directors (2009-present) and Chair of the Investment Committee (2010-present) of the Teagle Foundation. Ms. Small also serves on the Investment Committee of the Berkshire Taconic Community Foundation (2008-present). Previously, Ms. Small served as Chairperson (2002-2008) and a member of the Investment Committee and Chairperson (2008-2012) and a member of the Board of Trustees of Smith College. In addition, Ms. Small served as Chief Investment Officer, Director of Global Equity Investments, and a member of the Board of Directors of Scudder, Stevens & Clark and Scudder Kemper Investments.
William S. Stavropoulos (1939)
Year of Election or Appointment: 2001
Trustee
Vice Chairman of the Independent Trustees
Mr. Stavropoulos also serves as Trustee of other Fidelity® funds. Mr. Stavropoulos serves as President and Founder of the Michigan Baseball Foundation, the Great Lakes Loons (2007-present). Mr. Stavropoulos is Chairman Emeritus of the Board of Directors of The Dow Chemical Company, where he previously served in numerous senior management positions, including President, CEO (1995-2000; 2002-2004), Chairman of the Executive Committee (2000-2006), and as a member of the Board of Directors (1990-2006). Currently, Mr. Stavropoulos is Chairman of the Board of Directors of Univar Inc. (global distributor of commodity and specialty chemicals), a Director of Teradata Corporation (data warehousing and technology solutions), and a member of the Advisory Board for Metalmark Capital LLC (private equity investment, 2005-present). Mr. Stavropoulos is an operating advisor to Clayton, Dubilier & Rice, LLC (private equity investment). In addition, Mr. Stavropoulos is a member of the University of Notre Dame Advisory Council for the College of Science, a Trustee of the Rollin L. Gerstacker Foundation, and a Director of Artis-Naples in Naples, Florida. Previously, Mr. Stavropoulos served as a Director of Chemical Financial Corporation (bank holding company, 1993-2012) and Tyco International, Ltd. (multinational manufacturing and services, 2007-2012).
David M. Thomas (1949)
Year of Election or Appointment: 2008
Trustee
Mr. Thomas also serves as Trustee of other Fidelity® funds. Mr. Thomas serves as Non-Executive Chairman of the Board of Directors of Fortune Brands Home and Security (home and security products, 2011-present), as a member of the Board of Directors (2004-present) and Presiding Director (2013-present) of Interpublic Group of Companies, Inc. (marketing communication), and as a member of the Board of Trustees of the University of Florida (2013-present). Previously, Mr. Thomas served as Executive Chairman (2005-2006) and Chairman and Chief Executive Officer (2000-2005) of IMS Health, Inc. (pharmaceutical and healthcare information solutions), and a Director of Fortune Brands, Inc. (consumer products, 2000-2011).
+ The information includes the Trustee's principal occupation during the last five years and other information relating to the experience, attributes, and skills relevant to the Trustee's qualifications to serve as a Trustee, which led to the conclusion that the Trustee should serve as a Trustee for the fund.
Advisory Board Members and Officers:
Correspondence intended for an officer or Peter S. Lynch may be sent to Fidelity Investments, 245 Summer Street, Boston, Massachusetts 02210. Officers appear below in alphabetical order.
Name, Year of Birth; Principal Occupation
Peter S. Lynch (1944)
Year of Election or Appointment: 2003
Member of the Advisory Board
Mr. Lynch also serves as Member of the Advisory Board of other Fidelity® funds. Mr. Lynch is Vice Chairman and a Director of FMR (investment adviser firm) and FMR Co., Inc. (investment adviser firm). In addition, Mr. Lynch serves as a Trustee of Boston College and as the Chairman of the Inner-City Scholarship Fund. Previously, Mr. Lynch served on the Special Olympics International Board of Directors (1997-2006).
Elizabeth Paige Baumann (1968)
Year of Election or Appointment: 2017
Anti-Money Laundering (AML) Officer
Ms. Baumann also serves as AML Officer of other funds. She is Chief AML Officer (2012-present) and Senior Vice President (2014-present) of FMR LLC (diversified financial services company) and is an employee of Fidelity Investments. Previously, Ms. Baumann served as AML Officer of the funds (2012-2016), and Vice President (2007-2014) and Deputy Anti-Money Laundering Officer (2007-2012) of FMR LLC.
Marc R. Bryant (1966)
Year of Election or Appointment: 2015
Secretary and Chief Legal Officer (CLO)
Mr. Bryant also serves as Secretary and CLO of other funds. Mr. Bryant serves as CLO, Secretary, and Senior Vice President of Fidelity Management & Research Company (investment adviser firm, 2015-present) and FMR Co., Inc. (investment adviser firm, 2015-present); Secretary of Fidelity SelectCo, LLC (investment adviser firm, 2015-present) and Fidelity Investments Money Management, Inc. (investment adviser firm, 2015-present); and CLO of Fidelity Management & Research (Hong Kong) Limited and FMR Investment Management (UK) Limited (investment adviser firms, 2015-present) and Fidelity Management & Research (Japan) Limited (investment adviser firm, 2016-present). He is Senior Vice President and Deputy General Counsel of FMR LLC (diversified financial services company). Previously, Mr. Bryant served as Secretary and CLO of Fidelity Rutland Square Trust II (2010-2014) and Assistant Secretary of Fidelity's Fixed Income and Asset Allocation Funds (2013-2015). Prior to joining Fidelity Investments, Mr. Bryant served as a Senior Vice President and the Head of Global Retail Legal for AllianceBernstein L.P. (2006-2010), and as the General Counsel for ProFund Advisors LLC (2001-2006).
William C. Coffey (1969)
Year of Election or Appointment: 2009
Assistant Secretary
Mr. Coffey also serves as Assistant Secretary of other funds. He is Senior Vice President and Deputy General Counsel of FMR LLC (diversified financial services company, 2010-present), and is an employee of Fidelity Investments. Previously, Mr. Coffey served as Vice President and Associate General Counsel of FMR LLC (2005-2009).
Jonathan Davis (1968)
Year of Election or Appointment: 2010
Assistant Treasurer
Mr. Davis also serves as Assistant Treasurer of other funds. Mr. Davis serves as Assistant Treasurer of FMR Capital, Inc. (2017-present) and is an employee of Fidelity Investments. Previously, Mr. Davis served as Vice President and Associate General Counsel of FMR LLC (diversified financial services company, 2003-2010).
Adrien E. Deberghes (1967)
Year of Election or Appointment: 2016
Assistant Treasurer
Mr. Deberghes also serves as an officer of other funds. He serves as Assistant Treasurer of FMR Capital, Inc. (2017-present), Executive Vice President of Fidelity Investments Money Management, Inc. (FIMM) (investment adviser firm, 2016-present), and is an employee of Fidelity Investments (2008-present). Prior to joining Fidelity Investments, Mr. Deberghes was Senior Vice President of Mutual Fund Administration at State Street Corporation (2007-2008), Senior Director of Mutual Fund Administration at Investors Bank & Trust (2005-2007), and Director of Finance for Dunkin' Brands (2000-2005). Previously, Mr. Deberghes served in other fund officer roles.
Stephanie J. Dorsey (1969)
Year of Election or Appointment: 2010
Assistant Treasurer
Ms. Dorsey also serves as an officer of other funds. Ms. Dorsey serves as Assistant Treasurer of FMR Capital, Inc. (2017-present), is an employee of Fidelity Investments (2008-present), and has served in other fund officer roles. Prior to joining Fidelity Investments, Ms. Dorsey served as Treasurer (2004-2008) of the JPMorgan Mutual Funds and Vice President (2004-2008) of JPMorgan Chase Bank.
Howard J. Galligan III (1966)
Year of Election or Appointment: 2014
Chief Financial Officer
Mr. Galligan also serves as Chief Financial Officer of other funds. Mr. Galligan serves as President of Fidelity Pricing and Cash Management Services (FPCMS) (2014-present) and as a Director of Strategic Advisers, Inc. (investment adviser firm, 2008-present). Previously, Mr. Galligan served as Chief Administrative Officer of Asset Management (2011-2014) and Chief Operating Officer and Senior Vice President of Investment Support for Strategic Advisers, Inc. (2003-2011).
Thomas C. Hense (1964)
Year of Election or Appointment: 2008, 2010, or 2015
Vice President
Mr. Hense serves as Vice President of Fidelity Advisor® Multi-Asset Income Fund (2015) and other funds (High Income (2008), Small Cap (2008), and Value (2010) funds), and is an employee of Fidelity Investments (1993-present). Previously, Mr. Hense served as a portfolio manager for Fidelity's Institutional Money Management Group (Pyramis) (2003-2008).
Brian B. Hogan (1964)
Year of Election or Appointment: 2009
Vice President
Mr. Hogan also serves as Trustee or Vice President of other funds. Mr. Hogan serves as a Director of FMR Investment Management (UK) Limited (investment adviser firm, 2015-present) and Fidelity SelectCo, LLC (investment adviser firm, 2014-present) and President of the Equity Division of FMR (investment adviser firm, 2009-present). Previously, Mr. Hogan served as Senior Vice President, Equity Research of FMR (2006-2009) and as a portfolio manager. Mr. Brian B. Hogan is not related to Mr. Colm A. Hogan.
Colm A. Hogan (1973)
Year of Election or Appointment: 2016
Deputy Treasurer
Mr. Hogan also serves as an officer of other funds. Mr. Hogan serves as Assistant Treasurer of FMR Capital, Inc. (2017-present) and is an employee of Fidelity Investments (2005-present). Mr. Colm A. Hogan is not related to Mr. Brian B. Hogan.
Chris Maher (1972)
Year of Election or Appointment: 2013
Assistant Treasurer
Mr. Maher serves as Assistant Treasurer of other funds. Mr. Maher is Vice President of Valuation Oversight, serves as Assistant Treasurer of FMR Capital, Inc. (2017-present), and is an employee of Fidelity Investments. Previously, Mr. Maher served as Vice President of Asset Management Compliance (2013), Vice President of the Program Management Group of FMR (investment adviser firm, 2010-2013), and Vice President of Valuation Oversight (2008-2010).
Rieco E. Mello (1969)
Year of Election or Appointment: 2017
Assistant Treasurer
Mr. Mello also serves as Assistant Treasurer of other funds. Mr. Mello serves as Assistant Treasurer of FMR Capital, Inc. (2017-present) and is an employee of Fidelity Investments (1995-present).
Kenneth B. Robins (1969)
Year of Election or Appointment: 2016
Chief Compliance Officer
Mr. Robins also serves as an officer of other funds. Mr. Robins serves as Compliance Officer of Fidelity Management & Research Company and FMR Co., Inc. (investment adviser firms, 2016-present) and is an employee of Fidelity Investments (2004-present). Previously, Mr. Robins served as Executive Vice President of Fidelity Investments Money Management, Inc. (investment adviser firm, 2013-2016) and served in other fund officer roles.
Stacie M. Smith (1974)
Year of Election or Appointment: 2016
President and Treasurer
Ms. Smith also serves as an officer of other funds. Ms. Smith serves as Assistant Treasurer of FMR Capital, Inc. (2017-present), is an employee of Fidelity Investments (2009-present), and has served in other fund officer roles. Prior to joining Fidelity Investments, Ms. Smith served as Senior Audit Manager of Ernst & Young LLP (accounting firm, 1996-2009). Previously, Ms. Smith served as Deputy Treasurer of certain Fidelity® funds (2013-2016).
Marc L. Spector (1972)
Year of Election or Appointment: 2016
Assistant Treasurer
Mr. Spector also serves as an officer of other funds. Mr. Spector serves as Assistant Treasurer of FMR Capital, Inc. (2017-present) and is an employee of Fidelity Investments (2016-present). Prior to joining Fidelity Investments, Mr. Spector served as Director at the Siegfried Group (accounting firm, 2013-2016), and prior to Siegfried Group as audit senior manager at Deloitte & Touche (accounting firm, 2005-2013).
Renee Stagnone (1975)
Year of Election or Appointment: 2016
Assistant Treasurer
Ms. Stagnone also serves as an officer of other funds. Ms. Stagnone serves as Assistant Treasurer of FMR Capital, Inc. (2017-present) and is an employee of Fidelity Investments (1997-present). Previously, Ms. Stagnone served as Deputy Treasurer of certain Fidelity® funds (2013-2016).
Shareholder Expense Example
As a shareholder of the Fund, you incur two types of costs: (1) transaction costs, and (2) ongoing costs, including management fees, distribution and/or service (12b-1) fees and other Fund expenses. This Example is intended to help you understand your ongoing costs (in dollars) of investing in the Fund and to compare these costs with the ongoing costs of investing in other mutual funds.
The Example is based on an investment of $1,000 invested at the beginning of the period and held for the entire period (July 1, 2017 to December 31, 2017).
Actual Expenses
The first line of the accompanying table for each class of the Fund provides information about actual account values and actual expenses. You may use the information in this line, together with the amount you invested, to estimate the expenses that you paid over the period. Simply divide your account value by $1,000.00 (for example, an $8,600 account value divided by $1,000.00 = 8.6), then multiply the result by the number in the first line for a class of the Fund under the heading entitled "Expenses Paid During Period" to estimate the expenses you paid on your account during this period. The estimate of expenses does not include any fees or other expenses of any variable annuity or variable life insurance product. If they were, the estimate of expenses you paid during the period would be higher, and your ending account value would be lower. In addition, the Fund, as a shareholder in the underlying Fidelity Central Funds, will indirectly bear its pro-rata share of the fees and expenses incurred by the underlying Fidelity Central Funds. These fees and expenses are not included in the Fund's annualized expense ratio used to calculate the expense estimate in the table below.
Hypothetical Example for Comparison Purposes
The second line of the accompanying table for each class of the Fund provides information about hypothetical account values and hypothetical expenses based on a Class' actual expense ratio and an assumed rate of return of 5% per year before expenses, which is not the Class' actual return. The hypothetical account values and expenses may not be used to estimate the actual ending account balance or expenses you paid for the period. You may use this information to compare the ongoing costs of investing in the Fund and other funds. To do so, compare this 5% hypothetical example with the 5% hypothetical examples that appear in the shareholder reports of the other funds. The estimate of expenses does not include any fees or other expenses of any variable annuity or variable life insurance product. If they were, the estimate of expenses you paid during the period would be higher, and your ending account value would be lower. In addition, the Fund, as a shareholder in the underlying Fidelity Central Funds, will indirectly bear its pro-rata share of the fees and expenses incurred by the underlying Fidelity Central Funds. These fees and expenses are not included in the Fund's annualized expense ratio used to calculate the expense estimate in the table below.
Please note that the expenses shown in the table are meant to highlight your ongoing costs only and do not reflect any transaction costs. Therefore, the second line of the table is useful in comparing ongoing costs only, and will not help you determine the relative total costs of owning different funds.
| | Annualized Expense Ratio-A | Beginning
Account Value
July 1, 2017 | Ending
Account Value
December 31, 2017 | Expenses Paid
During Period-B
July 1, 2017
to December 31, 2017 |
| Initial Class | .53% | | | |
| Actual | | $1,000.00 | $1,083.90 | $2.78 |
| Hypothetical-C | | $1,000.00 | $1,022.53 | $2.70 |
| Service Class | .63% | | | |
| Actual | | $1,000.00 | $1,083.40 | $3.31 |
| Hypothetical-C | | $1,000.00 | $1,022.03 | $3.21 |
| Service Class 2 | .78% | | | |
| Actual | | $1,000.00 | $1,082.40 | $4.09 |
| Hypothetical-C | | $1,000.00 | $1,021.27 | $3.97 |
| Investor Class | .61% | | | |
| Actual | | $1,000.00 | $1,083.20 | $3.20 |
| Hypothetical-C | | $1,000.00 | $1,022.13 | $3.11 |
A Annualized expense ratio reflects expenses net of applicable fee waivers.
B Expenses are equal to each Class' annualized expense ratio, multiplied by the average account value over the period, multiplied by 184/365 (to reflect the one-half year period).
C 5% return per year before expenses
Distributions (Unaudited)
The Board of Trustees of VIP Equity-Income Portfolio voted to pay to shareholders of record at the opening of business on record date, the following distributions per share derived from capital gains realized from sales of portfolio securities, and dividends derived from net investment income:
| | Pay Date | Record Date | Dividends | Capital Gains |
| VIP Equity-Income Portfolio | | | | |
| Initial Class | 02/09/18 | 02/09/18 | $0.062 | $1.040 |
| Service Class | 02/09/18 | 02/09/18 | $0.058 | $1.040 |
| Service Class 2 | 02/09/18 | 02/09/18 | $0.053 | $1.040 |
| Investor Class | 02/09/18 | 02/09/18 | $0.059 | $1.040 |
|
The fund hereby designates as a capital gain dividend with respect to the taxable year ended December 31, 2017, $245,094,790, or, if subsequently determined to be different, the net capital gain of such year.
Initial Class designates 92%; Service Class designates 95%; Service Class 2 designates 100% and Investor Class designates 94% of the dividends distributed in December 2017, as qualifying for the dividends-received deduction for corporate shareholders.
Board Approval of Investment Advisory Contracts and Management Fees
VIP Equity-Income Portfolio
Each year, the Board of Trustees, including the Independent Trustees (together, the Board), votes on the renewal of the management contract with Fidelity Management & Research Company (FMR) and the sub-advisory agreements (together, the Advisory Contracts) for the fund. FMR and the sub-advisers are referred to herein as the Investment Advisers. The Board, assisted by the advice of fund counsel and Independent Trustees' counsel, requests and considers a broad range of information relevant to the renewal of the Advisory Contracts throughout the year.
The Board meets regularly and, at each of its meetings, covers an extensive agenda of topics and materials and considers factors that are relevant to its annual consideration of the renewal of the fund's Advisory Contracts, including the services and support provided to the fund and its shareholders. The Board has established various standing committees (Committees), each composed of and chaired by Independent Trustees with varying backgrounds, to which the Board has assigned specific subject matter responsibilities in order to enhance effective decision-making by the Board. The Board, acting directly and through its Committees, requests and receives information concerning the annual consideration of the renewal of the fund's Advisory Contracts. The Board also meets as needed to review matters specifically related to the Board's annual consideration of the renewal of the Advisory Contracts. Members of the Board may also meet with trustees of other Fidelity funds through ad hoc joint committees to discuss certain matters relevant to all of the Fidelity funds.
At its July 2017 meeting, the Board unanimously determined to renew the fund's Advisory Contracts. In reaching its determination, the Board considered all factors it believed relevant, including (i) the nature, extent, and quality of the services to be provided to the fund and its shareholders (including the investment performance of the fund); (ii) the competitiveness of the fund's management fee and total expense ratio relative to peer funds; (iii) the total costs of the services to be provided by and the profits to be realized by Fidelity from its relationships with the fund; and (iv) the extent to which, if any, economies of scale exist and would be realized as the fund grows, and whether any economies of scale are appropriately shared with fund shareholders.
In considering whether to renew the Advisory Contracts for the fund, the Board reached a determination, with the assistance of fund counsel and Independent Trustees' counsel and through the exercise of its business judgment, that the renewal of the Advisory Contracts was in the best interests of the fund and its shareholders and that the compensation payable under the Advisory Contracts was fair and reasonable. The Board's decision to renew the Advisory Contracts was not based on any single factor, but rather was based on a comprehensive consideration of all the information provided to the Board at its meetings throughout the year. The Board, in reaching its determination to renew the Advisory Contracts, was aware that shareholders of the fund have a broad range of investment choices available to them, including a wide choice among funds offered by Fidelity's competitors, and that the fund's shareholders, who have the opportunity to review and weigh the disclosure provided by the fund in its prospectus and other public disclosures, have chosen to invest in this fund, which is part of the Fidelity family of funds.
Amendment to Group Fee Rate. The Board also approved an amendment to the management contract for the fund to add an additional breakpoint to the group fee schedule, effective October 1, 2017. The Board noted that the additional breakpoint would result in lower management fee rates as Fidelity's assets under management increase.
Nature, Extent, and Quality of Services Provided. The Board considered Fidelity's staffing as it relates to the fund, including the backgrounds of investment personnel of Fidelity, and also considered the fund's investment objective, strategies, and related investment philosophy. The Independent Trustees also had discussions with senior management of Fidelity's investment operations and investment groups. The Board considered the structure of the investment personnel compensation program and whether this structure provides appropriate incentives to act in the best interests of the fund. Additionally, the Board considered the portfolio managers' investments, if any, in the funds that they manage.
Resources Dedicated to Investment Management and Support Services. The Board and the Fund Oversight and Research Committees reviewed the general qualifications and capabilities of Fidelity's investment staff, including its size, education, experience, and resources, as well as Fidelity's approach to recruiting, training, managing, and compensating investment personnel. The Board noted that Fidelity has continued to increase the resources devoted to non-U.S. offices, including expansion of Fidelity's global investment organization. The Board also noted that Fidelity's analysts have extensive resources, tools and capabilities that allow them to conduct sophisticated quantitative and fundamental analysis, as well as credit analysis of issuers, counterparties and guarantors. Further, the Board considered that Fidelity's investment professionals have sufficient access to global information and data so as to provide competitive investment results over time, and that those professionals also have access to sophisticated tools that permit them to assess portfolio construction and risk and performance attribution characteristics continuously, as well as to transmit new information and research conclusions rapidly around the world. Additionally, in its deliberations, the Board considered Fidelity's trading, risk management, compliance, and technology and operations capabilities and resources, which are integral parts of the investment management process.
Shareholder and Administrative Services. The Board considered (i) the nature, extent, quality, and cost of advisory, administrative, and shareholder services performed by the Investment Advisers and their affiliates under the Advisory Contracts and under separate agreements covering transfer agency, pricing and bookkeeping, and securities lending services for the fund; (ii) the nature and extent of the supervision of third party service providers, principally custodians, subcustodians, and pricing vendors; and (iii) the resources devoted to, and the record of compliance with, the fund's compliance policies and procedures. The Board also reviewed the allocation of fund brokerage, including allocations to brokers affiliated with the Investment Advisers, the use of brokerage commissions to pay fund expenses, and the use of "soft" commission dollars to pay for research services.
The Board noted that the growth of fund assets over time across the complex allows Fidelity to reinvest in the development of services designed to enhance the value or convenience of the Fidelity funds as investment vehicles. These services include 24-hour access to account information and market information through telephone representatives and over the Internet, investor education materials and asset allocation tools, and the expanded availability of Fidelity Investor Centers.
In 2014, the Board formed an ad hoc Committee on Transfer Agency Fees to review the variety of transfer agency fee structures throughout the industry and Fidelity's competitive positioning with respect to industry participants.
Investment in a Large Fund Family. The Board considered the benefits to shareholders of investing in a Fidelity fund, including the benefits of investing in a fund that is part of a large family of funds offering a variety of investment disciplines and providing a large variety of mutual fund investor services. The Board noted that Fidelity had taken, or had made recommendations that resulted in the Fidelity funds taking, a number of actions over the previous year that benefited particular funds, including: (i) continuing to dedicate additional resources to Fidelity's investment research process, and to the support of the senior management team that oversees asset management; (ii) continuing efforts to enhance Fidelity's global research capabilities; (iii) launching new funds and making other enhancements to meet client needs; (iv) launching new share classes of existing funds; (v) eliminating purchase minimums and broadening eligibility requirements for certain lower-priced share classes; (vi) reducing management fees and total expenses for certain growth equity funds and index funds; (vii) lowering expense caps for certain existing funds and classes to reduce expenses borne by shareholders; (viii) eliminating short-term redemption fees for certain funds; (ix) introducing a new pricing structure for certain funds of funds that is expected to reduce overall expenses paid by shareholders; (x) rationalizing product lines and gaining increased efficiencies through proposals for fund mergers and share class consolidations; (xi) continuing to develop, acquire and implement systems and technology to improve services to the funds and shareholders, strengthen information security, and increase efficiency; and (xii) implementing enhancements to further strengthen Fidelity's product line to increase investors' probability of success in achieving their investment goals, including retirement income goals.
Investment Performance. The Board considered whether the fund has operated in accordance with its investment objective, as well as its record of compliance with its investment restrictions and its performance history. The Board noted that there was a portfolio management change for the fund in April 2017.
The Board took into account discussions with representatives of the Investment Advisers about fund investment performance that occur at Board meetings throughout the year. In this regard the Board noted that as part of regularly scheduled fund reviews and other reports to the Board on fund performance, the Board considers annualized return information for the fund for different time periods, measured against a securities market index ("benchmark index") and a peer group of funds with similar objectives ("peer group"), if any. In its evaluation of fund investment performance, the Board gave particular attention to information indicating changes in performance of certain Fidelity funds for specific time periods and discussed with the Investment Advisers the reasons for any overperformance or underperformance.
In addition to reviewing absolute and relative fund performance, the Independent Trustees periodically consider the appropriateness of fund performance metrics in evaluating the results achieved. In general, the Independent Trustees believe that fund performance should be evaluated based on net performance (after fees and expenses) of both the highest performing and lowest performing fund share classes, where applicable, compared to appropriate benchmark indices, over appropriate time periods that may include full market cycles, and compared to peer groups, as applicable, over the same periods, taking into account relevant factors including the following: general market conditions; issuer-specific information; and fund cash flows and other factors.
The Independent Trustees recognize that shareholders evaluate performance on a net basis over their own holding periods, for which one-, three-, and five-year periods are often used as a proxy. For this reason, the performance information reviewed by the Board also included net cumulative calendar year total return information for the fund and an appropriate benchmark index and peer group for the most recent one-, three-, and five-year periods, as shown below. Returns are shown compared to the 25th percentile (top of box, 75% beaten) and 75th percentile (bottom of box, 25% beaten) of the peer universe.
VIP Equity-Income Portfolio
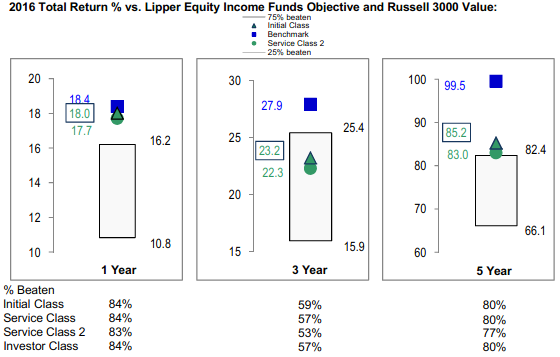
Based on its review, the Board concluded that the nature, extent, and quality of services provided to the fund under the Advisory Contracts should continue to benefit the shareholders of the fund.
Competitiveness of Management Fee and Total Expense Ratio. The Board considered the fund's management fee and total expense ratio compared to "mapped groups" of competitive funds and classes created for the purpose of facilitating the Trustees' competitive analysis of management fees and total expenses. Fidelity creates "mapped groups" by combining similar Lipper investment objective categories that have comparable investment mandates. Combining Lipper investment objective categories aids the Board's management fee and total expense ratio comparisons by broadening the competitive group used for comparison.
Management Fee. The Board considered two proprietary management fee comparisons for the 12-month periods shown in basis points (BP) in the chart below. The group of Lipper funds used by the Board for management fee comparisons is referred to below as the "Total Mapped Group." The Total Mapped Group is broader than the Lipper peer group used by the Board for performance comparisons because the Total Mapped Group combines several Lipper investment objective categories while the Lipper peer group does not. The Total Mapped Group comparison focuses on a fund's standing in terms of gross management fees before expense reimbursements or caps relative to the total universe of funds with comparable investment mandates, regardless of whether their management fee structures also are comparable. Funds with comparable investment mandates offer exposure to similar types of securities. Funds with comparable management fee structures have similar management fee contractual arrangements (
e.g., flat rate charged for advisory services, all-inclusive fee rate,
etc.). "TMG %" represents the percentage of funds in the Total Mapped Group that had management fees that were lower than the fund's. For example, a hypothetical TMG % of 20% would mean that 80% of the funds in the Total Mapped Group had higher, and 20% had lower, management fees than the fund. The fund's actual TMG %s and the number of funds in the Total Mapped Group are in the chart below. The "Asset-Size Peer Group" (ASPG) comparison focuses on a fund's standing relative to a subset of non-Fidelity funds within the Total Mapped Group that are similar in size and management fee structure. For example, if a fund is in the first quartile of the ASPG, the fund's management fee ranks in the least expensive or lowest 25% of funds in the ASPG. The ASPG represents at least 15% of the funds in the Total Mapped Group with comparable asset size and management fee structures, subject to a minimum of 50 funds (or all funds in the Total Mapped Group if fewer than 50). Additional information, such as the ASPG quartile in which the fund's management fee rate ranked, is also included in the chart and considered by the Board.
VIP Equity-Income Portfolio
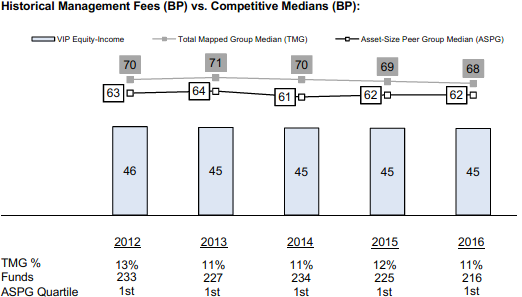
The Board noted that the fund's management fee rate ranked below the median of its Total Mapped Group and below the median of its ASPG for 2016.
The Board noted that, in 2014, the Board and the boards of other Fidelity funds formed the ad hoc Committee on Group Fee to conduct an in-depth review of the "group fee" component of the management fee of funds with such management fee structures. The Committee's focus included the mechanics of the group fee, the competitive landscape of group fee structures, Fidelity funds with no group fee component and investment products not included in group fee assets. The Board also considered that, for funds subject to the group fee, FMR agreed to voluntarily waive fees over a specified period of time in amounts designed to account for assets converted from certain funds to certain collective investment trusts.
The Board also noted that, in 2013, the ad hoc Committee on Management Fees was formed to conduct an in-depth review of the management fee rates of Fidelity's active equity mutual funds. The Committee focused on the following areas: (i) standard fee structures; (ii) research consumption and trading evolution; (iii) management fee competitiveness/profitability by category; and (iv) factors that drive institutional pricing.
Based on its review, the Board concluded that the fund's management fee is fair and reasonable in light of the services that the fund receives and the other factors considered.
Total Expense Ratio. In its review of each class's total expense ratio, the Board considered the fund's management fee rate as well as other fund or class expenses, as applicable, such as transfer agent fees, pricing and bookkeeping fees, fund-paid 12b-1 fees, and custodial, legal, and audit fees. The Board also noted that Fidelity may agree to waive fees and expenses from time to time, and the extent to which, if any, it has done so for the fund. As part of its review, the Board also considered the current and historical total expense ratios of each class of the fund compared to competitive fund median expenses. Each class of the fund is compared to those funds and classes in the Total Mapped Group (used by the Board for management fee comparisons) that have a similar sales load structure.
The Board noted that the total expense ratio of each class ranked below the competitive median for 2016.
Fees Charged to Other Fidelity Clients. The Board also considered Fidelity fee structures and other information with respect to clients of Fidelity, such as other funds advised or subadvised by Fidelity, pension plan clients, and other institutional clients with similar mandates. The Board noted that an ad hoc joint committee created by it and the boards of other Fidelity funds periodically (most recently in 2013) reviews and compares Fidelity's institutional investment advisory business with its business of providing services to the Fidelity funds, including the differences in services provided, fees charged, and costs incurred, as well as competition in their respective marketplaces.
Based on its review of total expense ratios and fees charged to other Fidelity clients, the Board concluded that the total expense ratio of each class of the fund was reasonable in light of the services that the fund and its shareholders receive and the other factors considered.
Costs of the Services and Profitability. The Board considered the revenues earned and the expenses incurred by Fidelity in conducting the business of developing, marketing, distributing, managing, administering and servicing the fund and servicing the fund's shareholders. The Board also considered the level of Fidelity's profits in respect of all the Fidelity funds.
On an annual basis, Fidelity presents to the Board information about the profitability of its relationships with the fund. Fidelity calculates profitability information for each fund, as well as aggregate profitability information for groups of Fidelity funds and all Fidelity funds, using a series of detailed revenue and cost allocation methodologies which originate with the books and records of Fidelity on which Fidelity's audited financial statements are based. The Audit Committee of the Board reviews any significant changes from the prior year's methodologies.
PricewaterhouseCoopers LLP (PwC), independent registered public accounting firm and auditor to Fidelity and certain Fidelity funds, has been engaged annually by the Board as part of the Board's assessment of Fidelity's profitability analysis. PwC's engagement includes the review and assessment of the methodologies used by Fidelity in determining the revenues and expenses attributable to Fidelity's mutual fund business, and completion of agreed-upon procedures in respect of the mathematical accuracy of the fund profitability information and its conformity to established allocation methodologies. After considering PwC's reports issued under the engagement and information provided by Fidelity, the Board concluded that while other allocation methods may also be reasonable, Fidelity's profitability methodologies are reasonable in all material respects.
The Board also reviewed Fidelity's non-fund businesses and potential fall-out benefits related to the mutual fund business as well as cases where Fidelity's affiliates may benefit from or be related to the fund's business.
The Board considered the costs of the services provided by and the profits realized by Fidelity in connection with the operation of the fund and was satisfied that the profitability was not excessive.
Economies of Scale. The Board considered whether there have been economies of scale in respect of the management of the Fidelity funds, whether the Fidelity funds (including the fund) have appropriately benefited from any such economies of scale, and whether there is potential for realization of any further economies of scale. The Board considered the extent to which the fund will benefit from economies of scale as assets grow through increased services to the fund, through waivers or reimbursements, or through fee or expense ratio reductions. The Board also noted that a committee (the Economies of Scale Committee) created by it and the boards of other Fidelity funds periodically (most recently in 2013) analyzes whether Fidelity attains economies of scale in respect of the management and servicing of the Fidelity funds, whether the Fidelity funds have appropriately benefited from such economies of scale, and whether there is potential for realization of any further economies of scale.
The Board recognized that the fund's management contract incorporates a "group fee" structure, which provides for lower group fee rates as total group assets increase, and for higher group fee rates as total group assets decrease (with "group assets" defined to include fund assets under FMR's management plus the assets of sector funds previously under FMR's management). FMR calculates the group fee rates based on a tiered asset "breakpoint" schedule that varies based on asset class. The Board considered that the group fee is designed to deliver the benefits of economies of scale to fund shareholders when total Fidelity fund assets increase, even if assets of any particular fund are unchanged or have declined, because some portion of Fidelity's costs are attributable to services provided to all Fidelity funds, and all funds benefit if those costs can be allocated among more assets. The Board concluded that, given the group fee structure, fund shareholders will benefit from lower management fees as group assets increase at the fund complex level, regardless of whether Fidelity achieves any such economies of scale.
The Board concluded, taking into account the analysis of the Economies of Scale Committee, that economies of scale, if any, are being appropriately shared between fund shareholders and Fidelity.
Additional Information Requested by the Board. In order to develop fully the factual basis for consideration of the Fidelity funds' advisory contracts, the Board requested and received additional information on certain topics, including: (i) fund performance trends, in particular the underperformance of certain funds, and Fidelity's long-term strategies for certain funds; (ii) Fidelity's fund profitability methodology, profitability trends for certain funds, and the impact of certain factors on fund profitability results, including the impact of market trends on actively managed funds; (iii) the use of performance fees and the calculation of performance adjustments, including the impact of underperformance and fund outflows on performance adjustments; (iv) metrics for evaluating index fund performance; (v) Fidelity's group fee structure, including the group fee breakpoint schedules; (vi) the terms of Fidelity's contractual and voluntary expense cap arrangements with the funds; (vii) the methodology with respect to evaluating competitive fund data and peer group classifications and fee comparisons; (viii) the expense structures for different funds and classes; (ix) Fidelity's arrangements with affiliated sub-advisers on behalf of the funds; (x) information regarding other accounts managed by Fidelity, including institutional accounts and collective investment trusts; (xi) recent changes to the fee structure for certain funds of funds; and (xii) the impact of the Department of Labor's new fiduciary rule on the funds' comparative expense information.
Based on its evaluation of all of the conclusions noted above, and after considering all factors it believed relevant, the Board concluded that the advisory fee structures are fair and reasonable, and that the fund's Advisory Contracts should be renewed.
VIPEI-ANN-0218
1.540027.120
Fidelity® Variable Insurance Products: Growth Portfolio
Annual Report December 31, 2017 |
|
Contents
To view a fund's proxy voting guidelines and proxy voting record for the 12-month period ended June 30, visit http://www.fidelity.com/proxyvotingresults or visit the Securities and Exchange Commission's (SEC) web site at http://www.sec.gov.
You may also call 1-877-208-0098 to request a free copy of the proxy voting guidelines.
Fidelity® Variable Insurance Products are separate account options which are purchased through a variable insurance contract.
Standard & Poor's, S&P and S&P 500 are registered service marks of The McGraw-Hill Companies, Inc. and have been licensed for use by Fidelity Distributors Corporation.
Other third-party marks appearing herein are the property of their respective owners.
All other marks appearing herein are registered or unregistered trademarks or service marks of FMR LLC or an affiliated company. © 2018 FMR LLC. All rights reserved.
This report and the financial statements contained herein are submitted for the general information of the shareholders of the Fund. This report is not authorized for distribution to prospective investors in the Fund unless preceded or accompanied by an effective prospectus.
A fund files its complete schedule of portfolio holdings with the SEC for the first and third quarters of each fiscal year on Form N-Q. Forms N-Q are available on the SEC’s web site at http://www.sec.gov. A fund's Forms N-Q may be reviewed and copied at the SEC’s Public Reference Room in Washington, DC. Information regarding the operation of the SEC's Public Reference Room may be obtained by calling 1-800-SEC-0330.
For a complete list of a fund's portfolio holdings, view the most recent holdings listing, semiannual report, or annual report on Fidelity's web site at http://www.fidelity.com, http://www.institutional.fidelity.com, or http://www.401k.com, as applicable.
NOT FDIC INSURED •MAY LOSE VALUE •NO BANK GUARANTEE
Neither the Fund nor Fidelity Distributors Corporation is a bank.
Performance: The Bottom Line
Average annual total return reflects the change in the value of an investment, assuming reinvestment of distributions from dividend income and capital gains (the profits earned upon the sale of securities that have grown in value, if any) and assuming a constant rate of performance each year. During periods of reimbursement by Fidelity, a fund’s total return will be greater than it would be had the reimbursement not occurred. Performance numbers are net of all underlying fund operating expenses, but do not include any insurance charges imposed by your insurance company’s separate account. If performance information included the effect of these additional charges, the total returns would have been lower. How a fund did yesterday is no guarantee of how it will do tomorrow.
Average Annual Total Returns
| For the periods ended December 31, 2017 | Past 1 year | Past 5 years | Past 10 years |
| Initial Class | 35.13% | 17.24% | 7.92% |
| Service Class | 35.00% | 17.13% | 7.81% |
| Service Class 2 | 34.81% | 16.95% | 7.65% |
| Investor Class | 35.03% | 17.14% | 7.82% |
$10,000 Over 10 Years
Let's say hypothetically that $10,000 was invested in VIP Growth Portfolio - Initial Class on December 31, 2007.
The chart shows how the value of your investment would have changed, and also shows how the Russell 3000® Growth Index performed over the same period.

| Period Ending Values |
| $21,425 | VIP Growth Portfolio - Initial Class |
| $25,781 | Russell 3000® Growth Index |
Management's Discussion of Fund Performance
Market Recap: U.S. equities gained 21.83% in 2017, as the S&P 500
® index rose steadily and closed the year just shy of an all-time high after a particularly strong three-month finish. Early on, equities rallied on optimism for President Trump’s pro-business agenda but leveled off in March amid fading optimism and stalled efforts by Congress to repeal and replace the Affordable Care Act. Upward momentum soon returned and continued through year-end with consumer sentiment and other market indicators staying positive. The lone exception was a brief cooldown in August, when geopolitical tension escalated and uncertainty grew regarding the future of health care, tax reform and the debt ceiling. Sector-wise, information technology fared best by a wide margin, rising 39% amid strong earnings growth from several major index constituents. A 24% gain in materials was spurred by increased demand, especially from China. Consumer discretionary gained 23%, despite many brick-and-mortar retailers suffering from online competition, and financials edged the broader market on an uptick in bond yields. Conversely, the defensive energy and telecom services sectors returned about -1% each. Rising interest rates held back real estate (+11%), while consumer staples (+13%) and utilities (+12%) struggled due to investors’ general preference for risk assets.
Comments from Co-Portfolio Manager Asher Anolic: For the year, the fund's share classes advanced about 35%, handily outpacing the 29.59% return the benchmark Russell 3000
® Growth Index. Versus the benchmark, security selection and an overweighting in the strong-performing information technology sector, especially choices among software & services companies, contributed the most to fund performance. Social-media giant Facebook (+52%), the fund's largest holding, contributed more than any other individual position this period. Stocks of some electronic-payment processors also contributed to our relative result, including Square (+154%) and PayPal Holdings (+87%). Payment processors continued to benefit from industry consolidation, as well as consumers' shift from cash towards credit- and online-based purchases. Square got a further boost in November when it began testing acceptance of the Bitcoin digital currency on its payment application. Conversely, underweighting large index constituent Apple detracted most. Apple shares rose roughly 48% for the 12 months, driven by better-than-expected sales for iPhone
® devices overall, and strong preorders for the iPhone
® X. Elsewhere, our cash position of about 3% of fund assets, on average, dragged notably on fund performance amid a strongly rising market.
The views expressed above reflect those of the portfolio manager(s) only through the end of the period as stated on the cover of this report and do not necessarily represent the views of Fidelity or any other person in the Fidelity organization. Any such views are subject to change at any time based upon market or other conditions and Fidelity disclaims any responsibility to update such views. These views may not be relied on as investment advice and, because investment decisions for a Fidelity fund are based on numerous factors, may not be relied on as an indication of trading intent on behalf of any Fidelity fund.
Note to Shareholders: On July 1, 2017, Asher Anolic assumed co-manager responsibilities for the fund and will serve as interim Portfolio Manager while Jason Weiner is on a leave of absence from January 1 through mid-June 2018.
Investment Summary (Unaudited)
Top Ten Stocks as of December 31, 2017
| | % of fund's net assets |
| Alphabet, Inc. Class A | 6.7 |
| Microsoft Corp. | 5.0 |
| Amazon.com, Inc. | 4.8 |
| Home Depot, Inc. | 3.2 |
| Facebook, Inc. Class A | 3.1 |
| Charles Schwab Corp. | 3.0 |
| Apple, Inc. | 2.9 |
| Visa, Inc. Class A | 2.4 |
| Adobe Systems, Inc. | 2.2 |
| JPMorgan Chase & Co. | 1.9 |
| | 35.2 |
Top Five Market Sectors as of December 31, 2017
| | % of fund's net assets |
| Information Technology | 41.5 |
| Financials | 12.3 |
| Consumer Discretionary | 12.0 |
| Health Care | 10.3 |
| Industrials | 8.1 |
Asset Allocation (% of fund's net assets)
| As of December 31, 2017* |
| | Stocks | 97.8% |
| | Short-Term Investments and Net Other Assets (Liabilities) | 2.2% |

* Foreign investments - 11.6%
Investments December 31, 2017
Showing Percentage of Net Assets
| Common Stocks - 97.0% | | | |
| | | Shares | Value |
| CONSUMER DISCRETIONARY - 12.0% | | | |
| Diversified Consumer Services - 0.5% | | | |
| Grand Canyon Education, Inc. (a) | | 326,500 | $29,231,545 |
| Hotels, Restaurants & Leisure - 0.4% | | | |
| Marriott International, Inc. Class A | | 94,900 | 12,880,777 |
| Wingstop, Inc. | | 252,200 | 9,830,756 |
| | | | 22,711,533 |
| Household Durables - 1.1% | | | |
| Gree Electric Appliances, Inc. of Zhuhai Class A | | 530,800 | 3,564,962 |
| Panasonic Corp. | | 3,690,000 | 53,851,552 |
| | | | 57,416,514 |
| Internet & Direct Marketing Retail - 5.0% | | | |
| Amazon.com, Inc. (a) | | 217,300 | 254,125,831 |
| Priceline Group, Inc. (a) | | 5,600 | 9,731,344 |
| | | | 263,857,175 |
| Media - 1.1% | | | |
| Charter Communications, Inc. Class A (a) | | 173,500 | 58,289,060 |
| China Literature Ltd. (a)(b) | | 980 | 10,455 |
| | | | 58,299,515 |
| Specialty Retail - 3.2% | | | |
| Home Depot, Inc. | | 888,132 | 168,327,658 |
| Textiles, Apparel & Luxury Goods - 0.7% | | | |
| Kering SA | | 7,700 | 3,630,866 |
| LVMH Moet Hennessy - Louis Vuitton SA | | 112,115 | 32,906,357 |
| | | | 36,537,223 |
|
| TOTAL CONSUMER DISCRETIONARY | | | 636,381,163 |
|
| CONSUMER STAPLES - 4.4% | | | |
| Beverages - 1.1% | | | |
| Constellation Brands, Inc. Class A (sub. vtg.) | | 116,300 | 26,582,691 |
| Fever-Tree Drinks PLC | | 128,331 | 3,945,269 |
| Kweichow Moutai Co. Ltd. (A Shares) | | 151,370 | 16,226,332 |
| Pernod Ricard SA ADR | | 408,400 | 12,917,692 |
| | | | 59,671,984 |
| Food Products - 0.5% | | | |
| Danone SA | | 328,128 | 27,494,145 |
| Hostess Brands, Inc. Class A (a) | | 94,600 | 1,401,026 |
| | | | 28,895,171 |
| Household Products - 0.2% | | | |
| Reckitt Benckiser Group PLC | | 113,200 | 10,560,821 |
| Personal Products - 1.9% | | | |
| Coty, Inc. Class A | | 1,072,900 | 21,339,981 |
| Estee Lauder Companies, Inc. Class A | | 300,300 | 38,210,172 |
| Unilever NV (NY Reg.) | | 698,300 | 39,328,256 |
| | | | 98,878,409 |
| Tobacco - 0.7% | | | |
| British American Tobacco PLC sponsored ADR | | 541,000 | 36,241,590 |
|
| TOTAL CONSUMER STAPLES | | | 234,247,975 |
|
| ENERGY - 2.3% | | | |
| Oil, Gas & Consumable Fuels - 2.3% | | | |
| Cheniere Energy, Inc. (a) | | 1,720,800 | 92,647,872 |
| Reliance Industries Ltd. | | 2,052,288 | 29,609,334 |
| | | | 122,257,206 |
| FINANCIALS - 12.1% | | | |
| Banks - 5.8% | | | |
| Bank of America Corp. | | 2,097,400 | 61,915,248 |
| Citigroup, Inc. | | 596,200 | 44,363,242 |
| First Republic Bank | | 517,700 | 44,853,528 |
| HDFC Bank Ltd. | | 117,289 | 3,469,173 |
| HDFC Bank Ltd. sponsored ADR | | 105,600 | 10,736,352 |
| Home Bancshares, Inc. | | 466,900 | 10,855,425 |
| Huntington Bancshares, Inc. | | 1,960,100 | 28,539,056 |
| JPMorgan Chase & Co. | | 932,800 | 99,753,632 |
| Metro Bank PLC (a) | | 85,000 | 4,113,097 |
| | | | 308,598,753 |
| Capital Markets - 6.3% | | | |
| CBOE Holdings, Inc. | | 37,183 | 4,632,630 |
| Charles Schwab Corp. | | 3,113,800 | 159,955,906 |
| CME Group, Inc. | | 556,697 | 81,305,597 |
| Goldman Sachs Group, Inc. | | 56,900 | 14,495,844 |
| JMP Group, Inc. | | 240,100 | 1,344,560 |
| MSCI, Inc. | | 242,200 | 30,647,988 |
| The Blackstone Group LP | | 1,194,500 | 38,247,890 |
| | | | 330,630,415 |
|
| TOTAL FINANCIALS | | | 639,229,168 |
|
| HEALTH CARE - 10.2% | | | |
| Biotechnology - 3.9% | | | |
| Amgen, Inc. | | 312,700 | 54,378,530 |
| Biogen, Inc. (a) | | 135,300 | 43,102,521 |
| Cytokinetics, Inc. (a) | | 325,120 | 2,649,728 |
| Insmed, Inc. (a) | | 1,312,783 | 40,932,574 |
| Samsung Biologics Co. Ltd. (a)(b) | | 3,460 | 1,202,633 |
| TESARO, Inc. (a) | | 184,400 | 15,281,228 |
| Vertex Pharmaceuticals, Inc. (a) | | 323,098 | 48,419,466 |
| | | | 205,966,680 |
| Health Care Equipment & Supplies - 4.4% | | | |
| Becton, Dickinson & Co. | | 171,300 | 36,668,478 |
| Boston Scientific Corp. (a) | | 2,323,900 | 57,609,481 |
| Danaher Corp. | | 519,226 | 48,194,557 |
| Intuitive Surgical, Inc. (a) | | 191,700 | 69,958,998 |
| ResMed, Inc. | | 163,100 | 13,812,939 |
| Sartorius Stedim Biotech | | 84,900 | 6,141,577 |
| | | | 232,386,030 |
| Health Care Providers & Services - 0.2% | | | |
| HealthSouth Corp. | | 8 | 395 |
| National Vision Holdings, Inc. | | 18,700 | 759,407 |
| OptiNose, Inc. | | 24,000 | 453,600 |
| UnitedHealth Group, Inc. | | 51,700 | 11,397,782 |
| | | | 12,611,184 |
| Health Care Technology - 0.1% | | | |
| Veeva Systems, Inc. Class A (a) | | 89,800 | 4,964,144 |
| Pharmaceuticals - 1.6% | | | |
| Allergan PLC | | 90,900 | 14,869,422 |
| Astellas Pharma, Inc. | | 1,001,200 | 12,718,519 |
| Johnson & Johnson | | 368,900 | 51,542,708 |
| Mallinckrodt PLC (a) | | 368,300 | 8,308,848 |
| | | | 87,439,497 |
|
| TOTAL HEALTH CARE | | | 543,367,535 |
|
| INDUSTRIALS - 8.1% | | | |
| Aerospace & Defense - 0.4% | | | |
| Axon Enterprise, Inc. (a)(c) | | 243,821 | 6,461,257 |
| TransDigm Group, Inc. | | 56,096 | 15,405,084 |
| | | | 21,866,341 |
| Commercial Services & Supplies - 0.6% | | | |
| Copart, Inc. (a) | | 451,600 | 19,504,604 |
| Prosegur Compania de Seguridad SA (Reg.) | | 1,403,300 | 11,028,559 |
| | | | 30,533,163 |
| Electrical Equipment - 2.4% | | | |
| AMETEK, Inc. | | 746,900 | 54,127,843 |
| Fortive Corp. | | 794,213 | 57,461,311 |
| Nidec Corp. | | 126,400 | 17,735,824 |
| | | | 129,324,978 |
| Industrial Conglomerates - 2.1% | | | |
| 3M Co. | | 369,200 | 86,898,604 |
| Roper Technologies, Inc. | | 83,417 | 21,605,003 |
| | | | 108,503,607 |
| Machinery - 1.2% | | | |
| Allison Transmission Holdings, Inc. | | 1,420,600 | 61,185,242 |
| Rational AG | | 5,900 | 3,802,901 |
| | | | 64,988,143 |
| Professional Services - 1.4% | | | |
| IHS Markit Ltd. (a) | | 648,300 | 29,270,745 |
| Robert Half International, Inc. | | 301,000 | 16,717,540 |
| TransUnion Holding Co., Inc. (a) | | 535,561 | 29,434,433 |
| | | | 75,422,718 |
|
| TOTAL INDUSTRIALS | | | 430,638,950 |
|
| INFORMATION TECHNOLOGY - 41.0% | | | |
| Electronic Equipment & Components - 0.1% | | | |
| CDW Corp. | | 93,933 | 6,527,404 |
| Internet Software & Services - 15.6% | | | |
| Alibaba Group Holding Ltd. sponsored ADR (a) | | 419,900 | 72,403,357 |
| Alphabet, Inc. Class A (a) | | 338,198 | 356,257,775 |
| CommerceHub, Inc.: | | | |
| Series A (a) | | 217,394 | 4,780,494 |
| Series C (a) | | 468,154 | 9,639,291 |
| Facebook, Inc. Class A (a) | | 934,509 | 164,903,458 |
| GoDaddy, Inc. (a) | | 558,959 | 28,104,459 |
| NetEase, Inc. ADR | | 46,600 | 16,080,262 |
| Shopify, Inc. Class A (a) | | 68,700 | 6,947,062 |
| Stamps.com, Inc. (a) | | 395,691 | 74,389,908 |
| Tencent Holdings Ltd. | | 1,231,000 | 63,714,042 |
| VeriSign, Inc. (a)(c) | | 284,300 | 32,535,292 |
| | | | 829,755,400 |
| IT Services - 7.9% | | | |
| Cognizant Technology Solutions Corp. Class A | | 762,405 | 54,146,003 |
| Fidelity National Information Services, Inc. | | 284,300 | 26,749,787 |
| Global Payments, Inc. | | 439,100 | 44,015,384 |
| MasterCard, Inc. Class A | | 208,800 | 31,603,968 |
| PayPal Holdings, Inc. (a) | | 1,328,700 | 97,818,894 |
| Square, Inc. (a) | | 732,400 | 25,392,308 |
| Vantiv, Inc. (a) | | 129,788 | 9,545,907 |
| Visa, Inc. Class A | | 1,127,872 | 128,599,965 |
| | | | 417,872,216 |
| Semiconductors & Semiconductor Equipment - 2.5% | | | |
| ASML Holding NV | | 127,500 | 22,162,050 |
| Broadcom Ltd. | | 99,400 | 25,535,860 |
| Maxim Integrated Products, Inc. | | 470,387 | 24,591,832 |
| Monolithic Power Systems, Inc. | | 117,888 | 13,245,896 |
| Qualcomm, Inc. | | 690,900 | 44,231,418 |
| | | | 129,767,056 |
| Software - 12.0% | | | |
| Activision Blizzard, Inc. | | 485,832 | 30,762,882 |
| Adobe Systems, Inc. (a) | | 675,600 | 118,392,144 |
| Autodesk, Inc. (a) | | 255,400 | 26,773,582 |
| Blackbaud, Inc. | | 36,780 | 3,475,342 |
| Computer Modelling Group Ltd. | | 926,000 | 7,072,076 |
| Electronic Arts, Inc. (a) | | 210,221 | 22,085,818 |
| Intuit, Inc. | | 347,100 | 54,765,438 |
| Microsoft Corp. | | 3,128,900 | 267,646,106 |
| Red Hat, Inc. (a) | | 251,900 | 30,253,190 |
| Salesforce.com, Inc. (a) | | 750,262 | 76,699,284 |
| | | | 637,925,862 |
| Technology Hardware, Storage & Peripherals - 2.9% | | | |
| Apple, Inc. | | 904,400 | 153,051,612 |
|
| TOTAL INFORMATION TECHNOLOGY | | | 2,174,899,550 |
|
| MATERIALS - 3.9% | | | |
| Chemicals - 2.4% | | | |
| CF Industries Holdings, Inc. | | 866,800 | 36,873,672 |
| Sherwin-Williams Co. | | 74,100 | 30,383,964 |
| The Chemours Co. LLC | | 570,100 | 28,539,206 |
| Umicore SA | | 619,113 | 29,308,860 |
| | | | 125,105,702 |
| Construction Materials - 1.5% | | | |
| Eagle Materials, Inc. | | 600,100 | 67,991,330 |
| Summit Materials, Inc. | | 451,014 | 14,179,880 |
| | | | 82,171,210 |
|
| TOTAL MATERIALS | | | 207,276,912 |
|
| REAL ESTATE - 3.0% | | | |
| Equity Real Estate Investment Trusts (REITs) - 2.2% | | | |
| American Tower Corp. | | 616,300 | 87,927,521 |
| Equinix, Inc. | | 31,900 | 14,457,718 |
| SBA Communications Corp. Class A (a) | | 91,500 | 14,947,440 |
| | | | 117,332,679 |
| Real Estate Management & Development - 0.8% | | | |
| Realogy Holdings Corp. | | 1,565,801 | 41,493,727 |
|
| TOTAL REAL ESTATE | | | 158,826,406 |
|
| TOTAL COMMON STOCKS | | | |
| (Cost $3,544,384,976) | | | 5,147,124,865 |
|
| Preferred Stocks - 0.8% | | | |
| Convertible Preferred Stocks - 0.6% | | | |
| CONSUMER DISCRETIONARY - 0.0% | | | |
| Household Durables - 0.0% | | | |
| Blu Homes, Inc. Series A, 5.00% (a)(d)(e) | | 1,049,416 | 20,988 |
| HEALTH CARE - 0.1% | | | |
| Biotechnology - 0.1% | | | |
| BioNTech AG Series A (d)(e)(f) | | 22,085 | 4,836,805 |
| INFORMATION TECHNOLOGY - 0.5% | | | |
| Internet Software & Services - 0.4% | | | |
| Uber Technologies, Inc. Series D, 8.00% (a)(d)(e) | | 636,240 | 22,217,501 |
| IT Services - 0.1% | | | |
| AppNexus, Inc. Series E (a)(d)(e) | | 181,657 | 3,582,276 |
| TOTAL INFORMATION TECHNOLOGY | | | 25,799,777 |
|
| TOTAL CONVERTIBLE PREFERRED STOCKS | | | 30,657,570 |
|
| Nonconvertible Preferred Stocks - 0.2% | | | |
| FINANCIALS - 0.2% | | | |
| Banks - 0.2% | | | |
| Itau Unibanco Holding SA sponsored ADR | | 1,001,000 | 13,013,000 |
| TOTAL PREFERRED STOCKS | | | |
| (Cost $36,910,322) | | | 43,670,570 |
|
| Money Market Funds - 2.8% | | | |
| Fidelity Cash Central Fund, 1.36% (g) | | 115,303,035 | 115,326,095 |
| Fidelity Securities Lending Cash Central Fund 1.36% (g)(h) | | 33,115,974 | 33,122,597 |
| TOTAL MONEY MARKET FUNDS | | | |
| (Cost $148,445,415) | | | 148,448,692 |
| TOTAL INVESTMENT IN SECURITIES - 100.6% | | | |
| (Cost $3,729,740,713) | | | 5,339,244,127 |
| NET OTHER ASSETS (LIABILITIES) - (0.6)% | | | (32,269,113) |
| NET ASSETS - 100% | | | $5,306,975,014 |
Legend
(a) Non-income producing
(b) Security exempt from registration under Rule 144A of the Securities Act of 1933. These securities may be resold in transactions exempt from registration, normally to qualified institutional buyers. At the end of the period, the value of these securities amounted to $1,213,088 or 0.0% of net assets.
(c) Security or a portion of the security is on loan at period end.
(d) Restricted securities - Investment in securities not registered under the Securities Act of 1933 (excluding 144A issues). At the end of the period, the value of restricted securities (excluding 144A issues) amounted to $30,657,570 or 0.6% of net assets.
(e) Level 3 security
(f) Security or a portion of the security purchased on a delayed delivery or when-issued basis. Interest rate to be determined at settlement date.
(g) Affiliated fund that is generally available only to investment companies and other accounts managed by Fidelity Investments. The rate quoted is the annualized seven-day yield of the fund at period end. A complete unaudited listing of the fund's holdings as of its most recent quarter end is available upon request. In addition, each Fidelity Central Fund's financial statements, which are not covered by the Fund's Report of Independent Registered Public Accounting Firm, are available on the SEC's website or upon request.
(h) Investment made with cash collateral received from securities on loan.
Additional information on each restricted holding is as follows:
| Security | Acquisition Date | Acquisition Cost |
| AppNexus, Inc. Series E | 8/1/14 | $3,638,989 |
| BioNTech AG Series A | 12/29/17 | $4,836,805 |
| Blu Homes, Inc. Series A, 5.00% | 6/21/13 | $4,848,302 |
| Uber Technologies, Inc. Series D, 8.00% | 6/6/14 | $9,870,023 |
Affiliated Central Funds
Information regarding fiscal year to date income earned by the Fund from investments in Fidelity Central Funds is as follows:
| Fund | Income earned |
| Fidelity Cash Central Fund | $1,417,426 |
| Fidelity Securities Lending Cash Central Fund | 2,315,278 |
| Total | $3,732,704 |
Amounts in the income column in the above table include any capital gain distributions from underlying funds, which are presented in the corresponding line-item in the Statement of Operations if applicable.
Other Affiliated Issuers
An affiliated company is a company in which the Fund has ownership of at least 5% of the voting securities. Fiscal year to date transactions with companies which are or were affiliates are as follows:
| Affiliate | Value, beginning of period | Purchases | Sales Proceeds | Dividend Income | Realized Gain (loss) | Change in Unrealized appreciation (depreciation) | Value, end of period |
| CommerceHub, Inc. Series A | $9,484,444 | $-- | $9,273,051 | $-- | $3,224,866 | $1,344,235 | $-- |
| CommerceHub, Inc. Series C | 7,361,995 | 896,002 | 1,588,913 | -- | 452,993 | 2,517,215 | -- |
| Total | $16,846,439 | $896,002 | $10,861,964 | $-- | $3,677,859 | $3,861,450 | $-- |
Investment Valuation
The following is a summary of the inputs used, as of December 31, 2017, involving the Fund's assets and liabilities carried at fair value. The inputs or methodology used for valuing securities may not be an indication of the risk associated with investing in those securities. For more information on valuation inputs, and their aggregation into the levels used below, please refer to the Investment Valuation section in the accompanying Notes to Financial Statements.
| | Valuation Inputs at Reporting Date: |
| Description | Total | Level 1 | Level 2 | Level 3 |
| Investments in Securities: | | | | |
| Equities: | | | | |
| Consumer Discretionary | $636,402,151 | $549,623,254 | $86,757,909 | $20,988 |
| Consumer Staples | 234,247,975 | 196,193,009 | 38,054,966 | -- |
| Energy | 122,257,206 | 122,257,206 | -- | -- |
| Financials | 652,242,168 | 648,772,995 | 3,469,173 | -- |
| Health Care | 548,204,340 | 530,649,016 | 12,718,519 | 4,836,805 |
| Industrials | 430,638,950 | 430,638,950 | -- | -- |
| Information Technology | 2,200,699,327 | 2,111,185,508 | 63,714,042 | 25,799,777 |
| Materials | 207,276,912 | 207,276,912 | -- | -- |
| Real Estate | 158,826,406 | 158,826,406 | -- | -- |
| Money Market Funds | 148,448,692 | 148,448,692 | -- | -- |
| Total Investments in Securities: | $5,339,244,127 | $5,103,871,948 | $204,714,609 | $30,657,570 |
Other Information
Distribution of investments by country or territory of incorporation, as a percentage of Total Net Assets, is as follows (Unaudited):
| United States of America | 88.4% |
| Cayman Islands | 2.9% |
| Japan | 1.5% |
| France | 1.5% |
| Netherlands | 1.2% |
| Others (Individually Less Than 1%) | 4.5% |
| | 100.0% |
See accompanying notes which are an integral part of the financial statements.
Financial Statements
Statement of Assets and Liabilities
| | | December 31, 2017 |
| Assets | | |
Investment in securities, at value (including securities loaned of $32,068,237) — See accompanying schedule:
Unaffiliated issuers (cost $3,581,295,298) | $5,190,795,435 | |
| Fidelity Central Funds (cost $148,445,415) | 148,448,692 | |
| Total Investment in Securities (cost $3,729,740,713) | | $5,339,244,127 |
| Receivable for investments sold | | 4,939,073 |
| Receivable for fund shares sold | | 3,693,670 |
| Dividends receivable | | 3,188,456 |
| Distributions receivable from Fidelity Central Funds | | 144,929 |
| Prepaid expenses | | 8,619 |
| Other receivables | | 212,969 |
| Total assets | | 5,351,431,843 |
| Liabilities | | |
| Payable for investments purchased on a delayed delivery basis | $4,836,805 | |
| Payable for fund shares redeemed | 3,174,161 | |
| Accrued management fee | 2,383,575 | |
| Distribution and service plan fees payable | 272,647 | |
| Other affiliated payables | 414,155 | |
| Other payables and accrued expenses | 267,408 | |
| Collateral on securities loaned | 33,108,078 | |
| Total liabilities | | 44,456,829 |
| Net Assets | | $5,306,975,014 |
| Net Assets consist of: | | |
| Paid in capital | | $2,937,237,971 |
| Undistributed net investment income | | 3,334,020 |
| Accumulated undistributed net realized gain (loss) on investments and foreign currency transactions | | 756,894,660 |
| Net unrealized appreciation (depreciation) on investments and assets and liabilities in foreign currencies | | 1,609,508,363 |
| Net Assets | | $5,306,975,014 |
| Initial Class: | | |
| Net Asset Value, offering price and redemption price per share ($3,165,086,357 ÷ 42,740,100 shares) | | $74.05 |
| Service Class: | | |
| Net Asset Value, offering price and redemption price per share ($624,380,540 ÷ 8,464,900 shares) | | $73.76 |
| Service Class 2: | | |
| Net Asset Value, offering price and redemption price per share ($1,069,116,606 ÷ 14,674,185 shares) | | $72.86 |
| Investor Class: | | |
| Net Asset Value, offering price and redemption price per share ($448,391,511 ÷ 6,081,191 shares) | | $73.73 |
See accompanying notes which are an integral part of the financial statements.
Statement of Operations
| | | Year ended December 31, 2017 |
| Investment Income | | |
| Dividends | | $38,943,194 |
| Interest | | 4,832 |
| Income from Fidelity Central Funds (including $2,315,278 from security lending) | | 3,732,704 |
| Total income | | 42,680,730 |
| Expenses | | |
| Management fee | $27,031,335 | |
| Transfer agent fees | 3,571,445 | |
| Distribution and service plan fees | 2,910,967 | |
| Accounting and security lending fees | 1,098,104 | |
| Custodian fees and expenses | 124,770 | |
| Independent trustees' fees and expenses | 19,411 | |
| Appreciation in deferred trustee compensation account | 929 | |
| Audit | 75,400 | |
| Legal | 19,387 | |
| Miscellaneous | 39,263 | |
| Total expenses before reductions | 34,891,011 | |
| Expense reductions | (155,735) | 34,735,276 |
| Net investment income (loss) | | 7,945,454 |
| Realized and Unrealized Gain (Loss) | | |
| Net realized gain (loss) on: | | |
| Investment securities: | | |
| Unaffiliated issuers | 822,849,651 | |
| Fidelity Central Funds | 2,008 | |
| Other affiliated issuers | 3,677,859 | |
| Foreign currency transactions | (146,852) | |
| Futures contracts | 1,955,902 | |
| Total net realized gain (loss) | | 828,338,568 |
| Change in net unrealized appreciation (depreciation) on: | | |
| Investment securities: | | |
| Unaffiliated issuers | 614,667,773 | |
| Fidelity Central Funds | 987 | |
| Other affiliated issuers | 3,861,450 | |
| Assets and liabilities in foreign currencies | 4,034 | |
| Total change in net unrealized appreciation (depreciation) | | 618,534,244 |
| Net gain (loss) | | 1,446,872,812 |
| Net increase (decrease) in net assets resulting from operations | | $1,454,818,266 |
See accompanying notes which are an integral part of the financial statements.
Statement of Changes in Net Assets
| | Year ended December 31, 2017 | Year ended December 31, 2016 |
| Increase (Decrease) in Net Assets | | |
| Operations | | |
| Net investment income (loss) | $7,945,454 | $6,305,180 |
| Net realized gain (loss) | 828,338,568 | 290,346,428 |
| Change in net unrealized appreciation (depreciation) | 618,534,244 | (276,240,900) |
| Net increase (decrease) in net assets resulting from operations | 1,454,818,266 | 20,410,708 |
| Distributions to shareholders from net investment income | (8,567,146) | (1,063,792) |
| Distributions to shareholders from net realized gain | (350,370,184) | (440,759,902) |
| Total distributions | (358,937,330) | (441,823,694) |
| Share transactions - net increase (decrease) | (82,598,099) | (124,731,037) |
| Total increase (decrease) in net assets | 1,013,282,837 | (546,144,023) |
| Net Assets | | |
| Beginning of period | 4,293,692,177 | 4,839,836,200 |
| End of period | $5,306,975,014 | $4,293,692,177 |
| Other Information | | |
| Undistributed net investment income end of period | $3,334,020 | $5,005,107 |
See accompanying notes which are an integral part of the financial statements.
Financial Highlights
VIP Growth Portfolio Initial Class
| Years ended December 31, | 2017 | 2016 | 2015 | 2014 | 2013 |
| Selected Per–Share Data | | | | | |
| Net asset value, beginning of period | $59.31 | $65.75 | $63.48 | $57.14 | $42.05 |
| Income from Investment Operations | | | | | |
| Net investment income (loss)A | .15 | .12 | .19 | .20 | .14 |
| Net realized and unrealized gain (loss) | 19.66 | (.48)B | 4.24 | 6.26 | 15.13 |
| Total from investment operations | 19.81 | (.36) | 4.43 | 6.46 | 15.27 |
| Distributions from net investment income | (.15) | (.02) | (.17) | (.12) | (.15) |
| Distributions from net realized gain | (4.92) | (6.06) | (1.98) | – | (.04) |
| Total distributions | (5.07) | (6.08) | (2.16)C | (.12) | (.18)D |
| Redemption fees added to paid in capitalA | – | – | –E | –E | –E |
| Net asset value, end of period | $74.05 | $59.31 | $65.75 | $63.48 | $57.14 |
| Total ReturnF,G | 35.13% | .80% | 7.17% | 11.30% | 36.34% |
| Ratios to Average Net AssetsH,I | | | | | |
| Expenses before reductions | .64% | .64% | .64% | .65% | .66% |
| Expenses net of fee waivers, if any | .64% | .64% | .64% | .65% | .65% |
| Expenses net of all reductions | .63% | .64% | .64% | .64% | .65% |
| Net investment income (loss) | .22% | .21% | .29% | .34% | .28% |
| Supplemental Data | | | | | |
| Net assets, end of period (000 omitted) | $3,165,086 | $2,736,295 | $3,045,732 | $3,143,666 | $3,179,928 |
| Portfolio turnover rateJ | 50% | 61% | 63% | 46% | 74% |
A Calculated based on average shares outstanding during the period.
B The amount shown for a share outstanding does not correspond with the aggregate net gain (loss) on investments for the period due to the timing of sales and repurchases of shares in relation to fluctuating market values of the investments of the Fund.
C Total distributions of $2.16 per share is comprised of distributions from net investment income of $.171 and distributions from net realized gain of $1.984 per share.
D Total distributions of $.18 per share is comprised of distributions from net investment income of $.147 and distributions from net realized gain of $.035 per share.
E Amount represents less than $.005 per share.
F Total returns do not reflect charges attributable to your insurance company's separate account. Inclusion of these charges would reduce the total returns shown.
G Total returns would have been lower if certain expenses had not been reduced during the applicable periods shown.
H Fees and expenses of any underlying Fidelity Central Funds are not included in the Fund's expense ratio. The Fund indirectly bears its proportionate share of the expenses of any underlying Fidelity Central Funds.
I Expense ratios reflect operating expenses of the class. Expenses before reductions do not reflect amounts reimbursed by the investment adviser or reductions from brokerage service arrangements or reductions from other expense offset arrangements and do not represent the amount paid by the class during periods when reimbursements or reductions occur. Expenses net of fee waivers reflect expenses after reimbursement by the investment adviser but prior to reductions from brokerage service arrangements or other expense offset arrangements. Expenses net of all reductions represent the net expenses paid by the class.
J Amount does not include the portfolio activity of any underlying Fidelity Central Funds.
See accompanying notes which are an integral part of the financial statements.
VIP Growth Portfolio Service Class
| Years ended December 31, | 2017 | 2016 | 2015 | 2014 | 2013 |
| Selected Per–Share Data | | | | | |
| Net asset value, beginning of period | $59.10 | $65.57 | $63.32 | $57.00 | $41.95 |
| Income from Investment Operations | | | | | |
| Net investment income (loss)A | .08 | .06 | .12 | .14 | .09 |
| Net realized and unrealized gain (loss) | 19.59 | (.47)B | 4.22 | 6.24 | 15.09 |
| Total from investment operations | 19.67 | (.41) | 4.34 | 6.38 | 15.18 |
| Distributions from net investment income | (.09) | – | (.11) | (.06) | (.10) |
| Distributions from net realized gain | (4.92) | (6.06) | (1.98) | – | (.04) |
| Total distributions | (5.01) | (6.06) | (2.09) | (.06) | (.13)C |
| Redemption fees added to paid in capitalA | – | – | –D | –D | –D |
| Net asset value, end of period | $73.76 | $59.10 | $65.57 | $63.32 | $57.00 |
| Total ReturnE,F | 35.00% | .71% | 7.05% | 11.19% | 36.20% |
| Ratios to Average Net AssetsG,H | | | | | |
| Expenses before reductions | .74% | .74% | .74% | .75% | .76% |
| Expenses net of fee waivers, if any | .74% | .74% | .74% | .75% | .75% |
| Expenses net of all reductions | .73% | .74% | .74% | .74% | .75% |
| Net investment income (loss) | .12% | .11% | .19% | .24% | .18% |
| Supplemental Data | | | | | |
| Net assets, end of period (000 omitted) | $624,381 | $482,603 | $527,178 | $521,455 | $491,959 |
| Portfolio turnover rateI | 50% | 61% | 63% | 46% | 74% |
A Calculated based on average shares outstanding during the period.
B The amount shown for a share outstanding does not correspond with the aggregate net gain (loss) on investments for the period due to the timing of sales and repurchases of shares in relation to fluctuating market values of the investments of the Fund.
C Total distributions of $.13 per share is comprised of distributions from net investment income of $.097 and distributions from net realized gain of $.035 per share.
D Amount represents less than $.005 per share.
E Total returns do not reflect charges attributable to your insurance company's separate account. Inclusion of these charges would reduce the total returns shown.
F Total returns would have been lower if certain expenses had not been reduced during the applicable periods shown.
G Fees and expenses of any underlying Fidelity Central Funds are not included in the Fund's expense ratio. The Fund indirectly bears its proportionate share of the expenses of any underlying Fidelity Central Funds.
H Expense ratios reflect operating expenses of the class. Expenses before reductions do not reflect amounts reimbursed by the investment adviser or reductions from brokerage service arrangements or reductions from other expense offset arrangements and do not represent the amount paid by the class during periods when reimbursements or reductions occur. Expenses net of fee waivers reflect expenses after reimbursement by the investment adviser but prior to reductions from brokerage service arrangements or other expense offset arrangements. Expenses net of all reductions represent the net expenses paid by the class.
I Amount does not include the portfolio activity of any underlying Fidelity Central Funds.
See accompanying notes which are an integral part of the financial statements.
VIP Growth Portfolio Service Class 2
| Years ended December 31, | 2017 | 2016 | 2015 | 2014 | 2013 |
| Selected Per–Share Data | | | | | |
| Net asset value, beginning of period | $58.44 | $65.01 | $62.80 | $56.57 | $41.64 |
| Income from Investment Operations | | | | | |
| Net investment income (loss)A | (.02) | (.03) | .02 | .05 | .01 |
| Net realized and unrealized gain (loss) | 19.36 | (.48)B | 4.20 | 6.18 | 14.98 |
| Total from investment operations | 19.34 | (.51) | 4.22 | 6.23 | 14.99 |
| Distributions from net investment income | (.06) | – | (.02) | – | (.02) |
| Distributions from net realized gain | (4.86) | (6.06) | (1.98) | – | (.04) |
| Total distributions | (4.92) | (6.06) | (2.01)C | – | (.06) |
| Redemption fees added to paid in capitalA | – | – | –D | –D | –D |
| Net asset value, end of period | $72.86 | $58.44 | $65.01 | $62.80 | $56.57 |
| Total ReturnE,F | 34.81% | .55% | 6.90% | 11.01% | 36.00% |
| Ratios to Average Net AssetsG,H | | | | | |
| Expenses before reductions | .89% | .89% | .89% | .90% | .91% |
| Expenses net of fee waivers, if any | .89% | .89% | .89% | .90% | .90% |
| Expenses net of all reductions | .88% | .89% | .89% | .89% | .90% |
| Net investment income (loss) | (.03)% | (.04)% | .04% | .09% | .03% |
| Supplemental Data | | | | | |
| Net assets, end of period (000 omitted) | $1,069,117 | $783,297 | $958,371 | $845,165 | $739,551 |
| Portfolio turnover rateI | 50% | 61% | 63% | 46% | 74% |
A Calculated based on average shares outstanding during the period.
B The amount shown for a share outstanding does not correspond with the aggregate net gain (loss) on investments for the period due to the timing of sales and repurchases of shares in relation to fluctuating market values of the investments of the Fund.
C Total distributions of $2.01 per share is comprised of distributions from net investment income of $.021 and distributions from net realized gain of $.1.984 per share.
D Amount represents less than $.005 per share.
E Total returns do not reflect charges attributable to your insurance company's separate account. Inclusion of these charges would reduce the total returns shown.
F Total returns would have been lower if certain expenses had not been reduced during the applicable periods shown.
G Fees and expenses of any underlying Fidelity Central Funds are not included in the Fund's expense ratio. The Fund indirectly bears its proportionate share of the expenses of any underlying Fidelity Central Funds.
H Expense ratios reflect operating expenses of the class. Expenses before reductions do not reflect amounts reimbursed by the investment adviser or reductions from brokerage service arrangements or reductions from other expense offset arrangements and do not represent the amount paid by the class during periods when reimbursements or reductions occur. Expenses net of fee waivers reflect expenses after reimbursement by the investment adviser but prior to reductions from brokerage service arrangements or other expense offset arrangements. Expenses net of all reductions represent the net expenses paid by the class.
I Amount does not include the portfolio activity of any underlying Fidelity Central Funds.
See accompanying notes which are an integral part of the financial statements.
VIP Growth Portfolio Investor Class
| Years ended December 31, | 2017 | 2016 | 2015 | 2014 | 2013 |
| Selected Per–Share Data | | | | | |
| Net asset value, beginning of period | $59.08 | $65.55 | $63.30 | $56.99 | $41.95 |
| Income from Investment Operations | | | | | |
| Net investment income (loss)A | .10 | .07 | .13 | .15 | .10 |
| Net realized and unrealized gain (loss) | 19.58 | (.48)B | 4.23 | 6.24 | 15.09 |
| Total from investment operations | 19.68 | (.41) | 4.36 | 6.39 | 15.19 |
| Distributions from net investment income | (.10) | – | (.13) | (.08) | (.11) |
| Distributions from net realized gain | (4.92) | (6.06) | (1.98) | – | (.04) |
| Total distributions | (5.03)C | (6.06) | (2.11) | (.08) | (.15) |
| Redemption fees added to paid in capitalA | – | – | –D | –D | –D |
| Net asset value, end of period | $73.73 | $59.08 | $65.55 | $63.30 | $56.99 |
| Total ReturnE,F | 35.03% | .71% | 7.09% | 11.20% | 36.22% |
| Ratios to Average Net AssetsG,H | | | | | |
| Expenses before reductions | .72% | .73% | .72% | .73% | .74% |
| Expenses net of fee waivers, if any | .72% | .72% | .72% | .73% | .73% |
| Expenses net of all reductions | .71% | .72% | .72% | .73% | .73% |
| Net investment income (loss) | .14% | .12% | .21% | .25% | .20% |
| Supplemental Data | | | | | |
| Net assets, end of period (000 omitted) | $448,392 | $291,497 | $308,555 | $269,599 | $214,067 |
| Portfolio turnover rateI | 50% | 61% | 63% | 46% | 74% |
A Calculated based on average shares outstanding during the period.
B The amount shown for a share outstanding does not correspond with the aggregate net gain (loss) on investments for the period due to the timing of sales and repurchases of shares in relation to fluctuating market values of the investments of the Fund.
C Total distributions of $5.03 per share is comprised of distributions from net investment income of $.104 and distributions from net realized gain of $4.921 per share.
D Amount represents less than $.005 per share.
E Total returns do not reflect charges attributable to your insurance company's separate account. Inclusion of these charges would reduce the total returns shown.
F Total returns would have been lower if certain expenses had not been reduced during the applicable periods shown.
G Fees and expenses of any underlying Fidelity Central Funds are not included in the Fund's expense ratio. The Fund indirectly bears its proportionate share of the expenses of any underlying Fidelity Central Funds.
H Expense ratios reflect operating expenses of the class. Expenses before reductions do not reflect amounts reimbursed by the investment adviser or reductions from brokerage service arrangements or reductions from other expense offset arrangements and do not represent the amount paid by the class during periods when reimbursements or reductions occur. Expenses net of fee waivers reflect expenses after reimbursement by the investment adviser but prior to reductions from brokerage service arrangements or other expense offset arrangements. Expenses net of all reductions represent the net expenses paid by the class.
I Amount does not include the portfolio activity of any underlying Fidelity Central Funds.
See accompanying notes which are an integral part of the financial statements.
Notes to Financial Statements
For the period ended December 31, 2017
1. Organization.
VIP Growth Portfolio (the Fund) is a fund of Variable Insurance Products Fund (the Trust) and is authorized to issue an unlimited number of shares. The Trust is registered under the Investment Company Act of 1940, as amended (the 1940 Act), as an open-end management investment company organized as a Massachusetts business trust. Shares of the Fund may only be purchased by insurance companies for the purpose of funding variable annuity or variable life insurance contracts. The Fund offers the following classes of shares: Initial Class shares, Service Class shares, Service Class 2 shares and Investor Class shares. All classes have equal rights and voting privileges, except for matters affecting a single class.
2. Investments in Fidelity Central Funds.
The Fund invests in Fidelity Central Funds, which are open-end investment companies generally available only to other investment companies and accounts managed by the investment adviser and its affiliates. The Fund's Schedule of Investments lists each of the Fidelity Central Funds held as of period end, if any, as an investment of the Fund, but does not include the underlying holdings of each Fidelity Central Fund. As an Investing Fund, the Fund indirectly bears its proportionate share of the expenses of the underlying Fidelity Central Funds.
The Money Market Central Funds seek preservation of capital and current income and are managed by Fidelity Investments Money Management, Inc. (FIMM), an affiliate of the investment adviser. Annualized expenses of the Money Market Central Funds as of their most recent shareholder report date are less than .005%.
A complete unaudited list of holdings for each Fidelity Central Fund is available upon request or at the Securities and Exchange Commission (the SEC) website at www.sec.gov. In addition, the financial statements of the Fidelity Central Funds, which are not covered by the Fund's Report of Independent Registered Public Accounting Firm, are available on the SEC website or upon request.
3. Significant Accounting Policies.
The Fund is an investment company and applies the accounting and reporting guidance of the Financial Accounting Standards Board (FASB) Accounting Standards Codification Topic 946 Financial Services – Investments Companies. The financial statements have been prepared in conformity with accounting principles generally accepted in the United States of America (GAAP), which require management to make certain estimates and assumptions at the date of the financial statements. Actual results could differ from those estimates. Subsequent events, if any, through the date that the financial statements were issued have been evaluated in the preparation of the financial statements. The following summarizes the significant accounting policies of the Fund:
Investment Valuation. Investments are valued as of 4:00 p.m. Eastern time on the last calendar day of the period. The Board of Trustees (the Board) has delegated the day to day responsibility for the valuation of the Fund's investments to the Fair Value Committee (the Committee) established by the Fund's investment adviser. In accordance with valuation policies and procedures approved by the Board, the Fund attempts to obtain prices from one or more third party pricing vendors or brokers to value its investments. When current market prices, quotations or currency exchange rates are not readily available or reliable, investments will be fair valued in good faith by the Committee, in accordance with procedures adopted by the Board. Factors used in determining fair value vary by investment type and may include market or investment specific events. The frequency with which these procedures are used cannot be predicted and they may be utilized to a significant extent. The Committee oversees the Fund's valuation policies and procedures and reports to the Board on the Committee's activities and fair value determinations. The Board monitors the appropriateness of the procedures used in valuing the Fund's investments and ratifies the fair value determinations of the Committee.
The Fund categorizes the inputs to valuation techniques used to value its investments into a disclosure hierarchy consisting of three levels as shown below:
- Level 1 – quoted prices in active markets for identical investments
- Level 2 – other significant observable inputs (including quoted prices for similar investments, interest rates, prepayment speeds, etc.)
- Level 3 – unobservable inputs (including the Fund's own assumptions based on the best information available)
Valuation techniques used to value the Fund's investments by major category are as follows:
Equity securities, including restricted securities, for which market quotations are readily available, are valued at the last reported sale price or official closing price as reported by a third party pricing vendor on the primary market or exchange on which they are traded and are categorized as Level 1 in the hierarchy. In the event there were no sales during the day or closing prices are not available, securities are valued at the last quoted bid price or may be valued using the last available price and are generally categorized as Level 2 in the hierarchy. For foreign equity securities, when market or security specific events arise, comparisons to the valuation of American Depositary Receipts (ADRs), futures contracts, Exchange-Traded Funds (ETFs) and certain indexes as well as quoted prices for similar securities may be used and would be categorized as Level 2 in the hierarchy. Utilizing these techniques may result in transfers between Level 1 and Level 2. For equity securities, including restricted securities, where observable inputs are limited, assumptions about market activity and risk are used and these securities may be categorized as Level 3 in the hierarchy.
Investments in open-end mutual funds, including the Fidelity Central Funds, are valued at their closing net asset value (NAV) each business day and are categorized as Level 1 in the hierarchy.
Changes in valuation techniques may result in transfers in or out of an assigned level within the disclosure hierarchy. The aggregate value of investments by input level as of December 31, 2017 is included at the end of the Fund's Schedule of Investments.
Foreign Currency. The Fund may use foreign currency contracts to facilitate transactions in foreign-denominated securities. Gains and losses from these transactions may arise from changes in the value of the foreign currency or if the counterparties do not perform under the contracts' terms.
Foreign-denominated assets, including investment securities, and liabilities are translated into U.S. dollars at the exchange rates at period end. Purchases and sales of investment securities, income and dividends received and expenses denominated in foreign currencies are translated into U.S. dollars at the exchange rate in effect on the transaction date.
The effects of exchange rate fluctuations on investments are included with the net realized and unrealized gain (loss) on investment securities. Other foreign currency transactions resulting in realized and unrealized gain (loss) are disclosed separately.
Investment Transactions and Income. For financial reporting purposes, the Fund's investment holdings and NAV include trades executed through the end of the last business day of the period. The NAV per share for processing shareholder transactions is calculated as of the close of business of the New York Stock Exchange (NYSE), normally 4:00 p.m. Eastern time and includes trades executed through the end of the prior business day. Gains and losses on securities sold are determined on the basis of identified cost and includes proceeds received from litigation. Dividend income is recorded on the ex-dividend date, except for certain dividends from foreign securities where the ex-dividend date may have passed, which are recorded as soon as the Fund is informed of the ex-dividend date. Non-cash dividends included in dividend income, if any, are recorded at the fair market value of the securities received. Income and capital gain distributions from Fidelity Central Funds, if any, are recorded on the ex-dividend date. Certain distributions received by the Fund represent a return of capital or capital gain. The Fund determines the components of these distributions subsequent to the ex-dividend date, based upon receipt of tax filings or other correspondence relating to the underlying investment. These distributions are recorded as a reduction of cost of investments and/or as a realized gain. Interest income is accrued as earned and includes coupon interest and amortization of premium and accretion of discount on debt securities as applicable. Investment income is recorded net of foreign taxes withheld where recovery of such taxes is uncertain.
Class Allocations and Expenses. Investment income, realized and unrealized capital gains and losses, common expenses of the Fund, and certain fund-level expense reductions, if any, are allocated daily on a pro-rata basis to each class based on the relative net assets of each class to the total net assets of the Fund. Each class differs with respect to transfer agent and distribution and service plan fees incurred. Certain expense reductions may also differ by class. For the reporting period, the allocated portion of income and expenses to each class as a percent of its average net assets may vary due to the timing of recording these transactions in relation to fluctuating net assets of the classes. Expenses directly attributable to a fund are charged to that fund. Expenses attributable to more than one fund are allocated among the respective funds on the basis of relative net assets or other appropriate methods. Expense estimates are accrued in the period to which they relate and adjustments are made when actual amounts are known.
Deferred Trustee Compensation. Under a Deferred Compensation Plan (the Plan), independent Trustees may elect to defer receipt of a portion of their annual compensation. Deferred amounts are invested in a cross-section of Fidelity funds, are marked-to-market and remain in the Fund until distributed in accordance with the Plan. The investment of deferred amounts and the offsetting payable to the Trustees are included in the accompanying Statement of Assets and Liabilities.
Income Tax Information and Distributions to Shareholders. Each year, the Fund intends to qualify as a regulated investment company under Subchapter M of the Internal Revenue Code, including distributing substantially all of its taxable income and realized gains. As a result, no provision for U.S. Federal income taxes is required. As of December 31, 2017, the Fund did not have any unrecognized tax benefits in the financial statements; nor is the Fund aware of any tax positions for which it is reasonably possible that the total amounts of unrecognized tax benefits will significantly change in the next twelve months. The Fund files a U.S. federal tax return, in addition to state and local tax returns as required. The Fund's federal income tax returns are subject to examination by the Internal Revenue Service (IRS) for a period of three fiscal years after they are filed. State and local tax returns may be subject to examination for an additional fiscal year depending on the jurisdiction. Foreign taxes are provided for based on the Fund's understanding of the tax rules and rates that exist in the foreign markets in which it invests.
Distributions are declared and recorded on the ex-dividend date. Income dividends and capital gain distributions are declared separately for each class. Income and capital gain distributions are determined in accordance with income tax regulations, which may differ from GAAP.
Capital accounts within the financial statements are adjusted for permanent book-tax differences. These adjustments have no impact on net assets or the results of operations. Capital accounts are not adjusted for temporary book-tax differences which will reverse in a subsequent period.
Book-tax differences are primarily due to futures contracts, foreign currency transactions, passive foreign investment companies (PFIC), market discount, partnerships, deferred trustees compensation and losses deferred due to wash sales and excise tax regulations.
As of period end, the cost and unrealized appreciation (depreciation) in securities, and derivatives if applicable, for federal income tax purposes were as follows:
| Gross unrealized appreciation | $1,640,799,461 |
| Gross unrealized depreciation | (34,484,166) |
| Net unrealized appreciation (depreciation) | $1,606,315,295 |
| Tax Cost | $3,732,928,832 |
The tax-based components of distributable earnings as of period end were as follows:
| Undistributed ordinary income | $3,527,067 |
| Undistributed long-term capital gain | $761,417,395 |
| Net unrealized appreciation (depreciation) on securities and other investments | $1,606,316,012 |
The Fund intends to elect to defer to its next fiscal year $1,334,615 of capital losses recognized during the period November 1, 2017 to December 31, 2017.
The tax character of distributions paid was as follows:
| | December 31, 2017 | December 31, 2016 |
| Ordinary Income | $77,081,411 | $ 1,063,792 |
| Long-term Capital Gains | 281,855,919 | 440,759,902 |
| Total | $358,937,330 | $ 441,823,694 |
Delayed Delivery Transactions and When-Issued Securities. During the period, the Fund transacted in securities on a delayed delivery or when-issued basis. Payment and delivery may take place after the customary settlement period for that security. The price of the underlying securities and the date when the securities will be delivered and paid for are fixed at the time the transaction is negotiated. The securities purchased on a delayed delivery or when-issued basis are identified as such in the Fund's Schedule of Investments. With respect to purchase commitments, the Fund identifies securities as segregated in its records with a value at least equal to the amount of the commitment. Losses may arise due to changes in the value of the underlying securities or if the counterparty does not perform under the contract's terms, or if the issuer does not issue the securities due to political, economic, or other factors.
Restricted Securities. The Fund may invest in securities that are subject to legal or contractual restrictions on resale. These securities generally may be resold in transactions exempt from registration or to the public if the securities are registered. Disposal of these securities may involve time-consuming negotiations and expense, and prompt sale at an acceptable price may be difficult. Information regarding restricted securities is included at the end of the Fund's Schedule of Investments.
4. Derivative Instruments.
Risk Exposures and the Use of Derivative Instruments. The Fund's investment objective allows the Fund to enter into various types of derivative contracts, including futures contracts. Derivatives are investments whose value is primarily derived from underlying assets, indices or reference rates and may be transacted on an exchange or over-the-counter (OTC). Derivatives may involve a future commitment to buy or sell a specified asset based on specified terms, to exchange future cash flows at periodic intervals based on a notional principal amount, or for one party to make one or more payments upon the occurrence of specified events in exchange for periodic payments from the other party.
The Fund used derivatives to increase returns and to manage exposure to certain risks as defined below. The success of any strategy involving derivatives depends on analysis of numerous economic factors, and if the strategies for investment do not work as intended, the Fund may not achieve its objectives.
The Fund's use of derivatives increased or decreased its exposure to the following risk:
| Equity Risk | Equity risk relates to the fluctuations in the value of financial instruments as a result of changes in market prices (other than those arising from interest rate risk or foreign exchange risk), whether caused by factors specific to an individual investment, its issuer, or all factors affecting all instruments traded in a market or market segment.
|
The Fund is also exposed to additional risks from investing in derivatives, such as liquidity risk and counterparty credit risk. Liquidity risk is the risk that the Fund will be unable to close out the derivative in the open market in a timely manner. Counterparty credit risk is the risk that the counterparty will not be able to fulfill its obligation to the Fund. Counterparty credit risk related to exchange-traded futures contracts may be mitigated by the protection provided by the exchange on which they trade.
Investing in derivatives may involve greater risks than investing in the underlying assets directly and, to varying degrees, may involve risk of loss in excess of any initial investment and collateral received and amounts recognized in the Statement of Assets and Liabilities. In addition, there may be the risk that the change in value of the derivative contract does not correspond to the change in value of the underlying instrument.
Futures Contracts. A futures contract is an agreement between two parties to buy or sell a specified underlying instrument for a fixed price at a specified future date. The Fund used futures contracts to manage its exposure to the stock market.
Upon entering into a futures contract, a fund is required to deposit either cash or securities (initial margin) with a clearing broker in an amount equal to a certain percentage of the face value of the contract. Futures contracts are marked-to-market daily and subsequent daily payments (variation margin) are made or received by a fund depending on the daily fluctuations in the value of the futures contracts and are recorded as unrealized appreciation or (depreciation). This receivable and/or payable, if any, is included in daily variation margin on futures contracts in the Statement of Assets and Liabilities. Realized gain or (loss) is recorded upon the expiration or closing of a futures contract. The net realized gain (loss) and change in net unrealized appreciation (depreciation) on futures contracts during the period is presented in the Statement of Operations.
Any open futures contracts at period end are presented in the Schedule of Investments under the caption "Futures Contracts". The notional amount at value reflects each contract's exposure to the underlying instrument or index at period end.
5. Purchases and Sales of Investments.
Purchases and sales of securities, other than short-term securities, aggregated $2,410,648,831 and $2,891,178,444, respectively.
6. Fees and Other Transactions with Affiliates.
Management Fee. Fidelity Management & Research Company (the investment adviser) and its affiliates provide the Fund with investment management related services for which the Fund pays a monthly management fee. The management fee is the sum of an individual fund fee rate that is based on an annual rate of .30% of the Fund's average net assets and an annualized group fee rate that averaged .24% during the period. The group fee rate is based upon the average net assets of all the mutual funds advised by the investment adviser, including any mutual funds previously advised by the investment adviser that are currently advised by Fidelity SelectCo, LLC, an affiliate of the investment adviser. The group fee rate decreases as assets under management increase and increases as assets under management decrease. For the reporting period, the total annual management fee rate was .54% of the Fund's average net assets.
Distribution and Service Plan Fees. In accordance with Rule 12b-1 of the 1940 Act, the Fund has adopted separate 12b-1 Plans for each Service Class of shares. Each Service Class pays Fidelity Distributors Corporation (FDC), an affiliate of the investment adviser, a service fee. For the period, the service fee is based on an annual rate of .10% of Service Class' average net assets and .25% of Service Class 2's average net assets.
For the period, total fees, all of which were re-allowed to insurance companies for the distribution of shares and providing shareholder support services, were as follows:
| Service Class | $569,316 |
| Service Class 2 | 2,341,651 |
| | $2,910,967 |
Transfer Agent Fees. Fidelity Investments Institutional Operations Company, Inc. (FIIOC), an affiliate of the investment adviser, is the Fund's transfer, dividend disbursing, and shareholder servicing agent. FIIOC receives an asset-based fee with respect to each class. Each class pays a fee for transfer agent services, typesetting and printing and mailing of shareholder reports, excluding mailing of proxy statements, equal to an annual rate of class-level average net assets. The annual rate for Investor Class is .15% and the annual rate for all other classes is .07%. For the period, transfer agent fees for each class were as follows:
| Initial Class | $2,039,685 |
| Service Class | 375,271 |
| Service Class 2 | 617,388 |
| Investor Class | 539,101 |
| | $3,571,445 |
Accounting and Security Lending Fees. Fidelity Service Company, Inc. (FSC), an affiliate of the investment adviser, maintains the Fund's accounting records. The accounting fee is based on the level of average net assets for each month. Under a separate contract, FSC administers the security lending program. The security lending fee is based on the number and duration of lending transactions.
Brokerage Commissions. The Fund placed a portion of its portfolio transactions with brokerage firms which are affiliates of the investment adviser. Brokerage commissions are included in net realized gain (loss) and change in net unrealized appreciation (depreciation) in the Statement of Operations. The commissions paid to these affiliated firms were $75,690 for the period.
Interfund Trades. The Fund may purchase from or sell securities to other Fidelity Funds under procedures adopted by the Board. The procedures have been designed to ensure these interfund trades are executed in accordance with Rule 17a-7 of the 1940 Act. Interfund trades are included within the respective purchases and sales amounts shown in the Purchases and Sales of Investments note.
7. Committed Line of Credit.
The Fund participates with other funds managed by the investment adviser or an affiliate in a $4.25 billion credit facility (the "line of credit") to be utilized for temporary or emergency purposes to fund shareholder redemptions or for other short-term liquidity purposes. The Fund has agreed to pay commitment fees on its pro-rata portion of the line of credit, which amounted to $15,041 and is reflected in Miscellaneous expenses on the Statement of Operations. During the period, the Fund did not borrow on this line of credit.
8. Security Lending.
The Fund lends portfolio securities through a lending agent from time to time in order to earn additional income. For equity securities, a lending agent is used and may loan securities to certain qualified borrowers, including Fidelity Capital Markets (FCM), a broker-dealer affiliated with the Fund. On the settlement date of the loan, the Fund receives collateral (in the form of U.S. Treasury obligations, letters of credit and/or cash) against the loaned securities and maintains collateral in an amount not less than 100% of the market value of the loaned securities during the period of the loan. The market value of the loaned securities is determined at the close of business of the Fund and any additional required collateral is delivered to the Fund on the next business day. The Fund or borrower may terminate the loan at any time, and if the borrower defaults on its obligation to return the securities loaned because of insolvency or other reasons, the Fund may apply collateral received from the borrower against the obligation. The Fund may experience delays and costs in recovering the securities loaned. Any cash collateral received is invested in the Fidelity Securities Lending Cash Central Fund. The value of loaned securities and cash collateral at period end are disclosed on the Fund's Statement of Assets and Liabilities. At period end, there were no security loans outstanding with FCM. Security lending income represents the income earned on investing cash collateral, less rebates paid to borrowers and any lending agent fees associated with the loan, plus any premium payments received for lending certain types of securities. Security lending income is presented in the Statement of Operations as a component of income from Fidelity Central Funds, and includes $22 from securities loaned to FCM.
9. Expense Reductions.
Commissions paid to certain brokers with whom the investment adviser, or its affiliates, places trades on behalf of the Fund include an amount in addition to trade execution, which may be rebated back to the Fund to offset certain expenses. This amount totaled $116,342 for the period. In addition, through arrangements with the Fund's custodian, credits realized as a result of certain uninvested cash balances were used to reduce the Fund's expenses. During the period, these credits reduced the Fund's custody expenses by $380.
In addition, during the period the investment adviser reimbursed and/or waived a portion of fund-level operating expenses in the amount of $39,013.
10. Distributions to Shareholders.
Distributions to shareholders of each class were as follows:
| | Year ended
December 31, 2017 | Year ended
December 31, 2016 |
| From net investment income | | |
| Initial Class | $6,582,091 | $1,063,792 |
| Service Class | 699,983 | – |
| Service Class 2 | 744,111 | – |
| Investor Class | 540,961 | – |
| Total | $8,567,146 | $1,063,792 |
| From net realized gain | | |
| Initial Class | $219,487,438 | $278,171,056 |
| Service Class | 40,072,239 | 48,192,555 |
| Service Class 2 | 65,611,272 | 85,729,729 |
| Investor Class | 25,199,235 | 28,666,562 |
| Total | $350,370,184 | $440,759,902 |
11. Share Transactions.
Transactions for each class of shares were as follows:
| | Shares | Shares | Dollars | Dollars |
| | Year ended December 31, 2017 | Year ended December 31, 2016 | Year ended December 31, 2017 | Year ended December 31, 2016 |
| Initial Class | | | | |
| Shares sold | 1,496,273 | 1,165,209 | $101,133,216 | $67,357,709 |
| Reinvestment of distributions | 3,635,136 | 5,388,844 | 226,069,529 | 279,234,848 |
| Shares redeemed | (8,529,956) | (6,741,730) | (586,806,149) | (392,172,286) |
| Net increase (decrease) | (3,398,547) | (187,677) | $(259,603,404) | $(45,579,729) |
| Service Class | | | | |
| Shares sold | 646,963 | 477,397 | $43,354,450 | $27,622,874 |
| Reinvestment of distributions | 657,074 | 933,422 | 40,772,222 | 48,192,555 |
| Shares redeemed | (1,005,654) | (1,283,877) | (67,216,694) | (74,490,952) |
| Net increase (decrease) | 298,383 | 126,942 | $16,909,978 | $1,324,477 |
| Service Class 2 | | | | |
| Shares sold | 3,028,603 | 2,005,328 | $201,763,654 | $114,931,466 |
| Reinvestment of distributions | 1,083,357 | 1,676,701 | 66,355,383 | 85,729,722 |
| Shares redeemed | (2,841,547) | (5,020,399) | (185,550,582) | (290,421,071) |
| Net increase (decrease) | 1,270,413 | (1,338,370) | $82,568,455 | $(89,759,883) |
| Investor Class | | | | |
| Shares sold | 1,345,325 | 516,557 | $92,962,412 | $29,744,569 |
| Reinvestment of distributions | 413,367 | 555,446 | 25,740,196 | 28,666,562 |
| Shares redeemed | (611,576) | (845,451) | (41,175,736) | (49,127,033) |
| Net increase (decrease) | 1,147,116 | 226,552 | $77,526,872 | $9,284,098 |
12. Other.
The Fund's organizational documents provide former and current trustees and officers with a limited indemnification against liabilities arising in connection with the performance of their duties to the Fund. In the normal course of business, the Fund may also enter into contracts that provide general indemnifications. The Fund's maximum exposure under these arrangements is unknown as this would be dependent on future claims that may be made against the Fund. The risk of material loss from such claims is considered remote.
At the end of the period, the investment adviser or its affiliates were the owners of record of 17% of the total outstanding shares of the Fund and two otherwise unaffiliated shareholders were the owners of record of 37% of the total outstanding shares of the Fund.
Report of Independent Registered Public Accounting Firm
To the Trustees of Variable Insurance Products Fund and Shareholders of VIP Growth Portfolio:
Opinion on the Financial Statements
We have audited the accompanying statement of assets and liabilities, including the schedule of investments, of VIP Growth Portfolio (one of the funds constituting Variable Insurance Products Fund, referred to hereafter as the “Fund”) as of December 31, 2017, the related statement of operations for the year ended December 31, 2017, the statement of changes in net assets for each of the two years in the period ended December 31, 2017, including the related notes, and the financial highlights for each of the five years in the period ended December 31, 2017 (collectively referred to as the “financial statements”). In our opinion, the financial statements present fairly, in all material respects, the financial position of the Fund as of December 31, 2017, the results of its operations for the year then ended, the changes in its net assets for each of the two years in the period ended December 31, 2017 and the financial highlights for each of the five years in the period ended December 31, 2017 in conformity with accounting principles generally accepted in the United States of America.
Basis for Opinion
These financial statements are the responsibility of the Fund’s management. Our responsibility is to express an opinion on the Fund’s financial statements based on our audits. We are a public accounting firm registered with the Public Company Accounting Oversight Board (United States) (“PCAOB”) and are required to be independent with respect to the Fund in accordance with the U.S. federal securities laws and the applicable rules and regulations of the Securities and Exchange Commission and the PCAOB.
We conducted our audits of these financial statements in accordance with the standards of the PCAOB. Those standards require that we plan and perform the audit to obtain reasonable assurance about whether the financial statements are free of material misstatement, whether due to error or fraud.
Our audits included performing procedures to assess the risks of material misstatement of the financial statements, whether due to error or fraud, and performing procedures that respond to those risks. Such procedures included examining, on a test basis, evidence regarding the amounts and disclosures in the financial statements. Our audits also included evaluating the accounting principles used and significant estimates made by management, as well as evaluating the overall presentation of the financial statements. Our procedures included confirmation of securities owned as of December 31, 2017 by correspondence with the custodian and brokers; when replies were not received from brokers, we performed other auditing procedures. We believe that our audits provide a reasonable basis for our opinion.
PricewaterhouseCoopers LLP
Boston, Massachusetts
February 12, 2018
We have served as the auditor of one or more investment companies in the Fidelity group of funds since 1932.
Trustees and Officers
The Trustees, Members of the Advisory Board (if any), and officers of the trust and fund, as applicable, are listed below. The Board of Trustees governs the fund and is responsible for protecting the interests of shareholders. The Trustees are experienced executives who meet periodically throughout the year to oversee the fund's activities, review contractual arrangements with companies that provide services to the fund, oversee management of the risks associated with such activities and contractual arrangements, and review the fund's performance. Except for Jonathan Chiel, each of the Trustees oversees 190 funds. Mr. Chiel oversees 145 funds.
The Trustees hold office without limit in time except that (a) any Trustee may resign; (b) any Trustee may be removed by written instrument, signed by at least two-thirds of the number of Trustees prior to such removal; (c) any Trustee who requests to be retired or who has become incapacitated by illness or injury may be retired by written instrument signed by a majority of the other Trustees; and (d) any Trustee may be removed at any special meeting of shareholders by a two-thirds vote of the outstanding voting securities of the trust. Each Trustee who is not an interested person (as defined in the 1940 Act) of the trust and the fund is referred to herein as an Independent Trustee. Each Independent Trustee shall retire not later than the last day of the calendar year in which his or her 75th birthday occurs. The Independent Trustees may waive this mandatory retirement age policy with respect to individual Trustees. Officers and Advisory Board Members hold office without limit in time, except that any officer or Advisory Board Member may resign or may be removed by a vote of a majority of the Trustees at any regular meeting or any special meeting of the Trustees. Except as indicated, each individual has held the office shown or other offices in the same company for the past five years.
The fund’s Statement of Additional Information (SAI) includes more information about the Trustees. To request a free copy, call Fidelity at 1-877-208-0098.
Experience, Skills, Attributes, and Qualifications of the Trustees. The Governance and Nominating Committee has adopted a statement of policy that describes the experience, qualifications, attributes, and skills that are necessary and desirable for potential Independent Trustee candidates (Statement of Policy). The Board believes that each Trustee satisfied at the time he or she was initially elected or appointed a Trustee, and continues to satisfy, the standards contemplated by the Statement of Policy. The Governance and Nominating Committee also engages professional search firms to help identify potential Independent Trustee candidates who have the experience, qualifications, attributes, and skills consistent with the Statement of Policy. From time to time, additional criteria based on the composition and skills of the current Independent Trustees, as well as experience or skills that may be appropriate in light of future changes to board composition, business conditions, and regulatory or other developments, have also been considered by the professional search firms and the Governance and Nominating Committee. In addition, the Board takes into account the Trustees' commitment and participation in Board and committee meetings, as well as their leadership of standing and ad hoc committees throughout their tenure.
In determining that a particular Trustee was and continues to be qualified to serve as a Trustee, the Board has considered a variety of criteria, none of which, in isolation, was controlling. The Board believes that, collectively, the Trustees have balanced and diverse experience, qualifications, attributes, and skills, which allow the Board to operate effectively in governing the fund and protecting the interests of shareholders. Information about the specific experience, skills, attributes, and qualifications of each Trustee, which in each case led to the Board's conclusion that the Trustee should serve (or continue to serve) as a trustee of the fund, is provided below.
Board Structure and Oversight Function. James C. Curvey is an interested person and currently serves as Chairman. The Trustees have determined that an interested Chairman is appropriate and benefits shareholders because an interested Chairman has a personal and professional stake in the quality and continuity of services provided to the fund. Independent Trustees exercise their informed business judgment to appoint an individual of their choosing to serve as Chairman, regardless of whether the Trustee happens to be independent or a member of management. The Independent Trustees have determined that they can act independently and effectively without having an Independent Trustee serve as Chairman and that a key structural component for assuring that they are in a position to do so is for the Independent Trustees to constitute a substantial majority for the Board. The Independent Trustees also regularly meet in executive session. Ned C. Lautenbach serves as Chairman of the Independent Trustees and as such (i) acts as a liaison between the Independent Trustees and management with respect to matters important to the Independent Trustees and (ii) with management prepares agendas for Board meetings.
Fidelity® funds are overseen by different Boards of Trustees. The fund's Board oversees Fidelity's high income and certain equity funds, and other Boards oversee Fidelity's investment-grade bond, money market, asset allocation, and sector funds. The asset allocation funds may invest in Fidelity® funds overseen by the fund's Board. The use of separate Boards, each with its own committee structure, allows the Trustees of each group of Fidelity® funds to focus on the unique issues of the funds they oversee, including common research, investment, and operational issues. On occasion, the separate Boards establish joint committees to address issues of overlapping consequences for the Fidelity® funds overseen by each Board.
The Trustees operate using a system of committees to facilitate the timely and efficient consideration of all matters of importance to the Trustees, the fund, and fund shareholders and to facilitate compliance with legal and regulatory requirements and oversight of the fund's activities and associated risks. The Board, acting through its committees, has charged FMR and its affiliates with (i) identifying events or circumstances the occurrence of which could have demonstrably adverse effects on the fund's business and/or reputation; (ii) implementing processes and controls to lessen the possibility that such events or circumstances occur or to mitigate the effects of such events or circumstances if they do occur; and (iii) creating and maintaining a system designed to evaluate continuously business and market conditions in order to facilitate the identification and implementation processes described in (i) and (ii) above. Because the day-to-day operations and activities of the fund are carried out by or through FMR, its affiliates, and other service providers, the fund's exposure to risks is mitigated but not eliminated by the processes overseen by the Trustees. While each of the Board's committees has responsibility for overseeing different aspects of the fund's activities, oversight is exercised primarily through the Operations, Audit, and Compliance Committees. In addition, the Independent Trustees have worked with FMR to enhance the Board's oversight of investment and financial risks, legal and regulatory risks, technology risks, and operational risks, including the development of additional risk reporting to the Board. For example, a working group comprised of Independent Trustees and FMR has worked and continues to work to review the Fidelity® funds' valuation-related activities, reporting and risk management. Appropriate personnel, including but not limited to the fund's Chief Compliance Officer (CCO), FMR's internal auditor, the independent accountants, the fund's Treasurer and portfolio management personnel, make periodic reports to the Board's committees, as appropriate, including an annual review of Fidelity's risk management program for the Fidelity® funds. The responsibilities of each standing committee, including their oversight responsibilities, are described further under "Standing Committees of the Trustees."
Interested Trustees*:
Correspondence intended for a Trustee who is an interested person may be sent to Fidelity Investments, 245 Summer Street, Boston, Massachusetts 02210.
Name, Year of Birth; Principal Occupations and Other Relevant Experience+
Jonathan Chiel (1957)
Year of Election or Appointment: 2016
Trustee
Mr. Chiel also serves as Trustee of other Fidelity® funds. Mr. Chiel is Executive Vice President and General Counsel for FMR LLC (diversified financial services company, 2012-present). Previously, Mr. Chiel served as general counsel (2004-2012) and senior vice president and deputy general counsel (2000-2004) for John Hancock Financial Services; a partner with Choate, Hall & Stewart (1996-2000) (law firm); and an Assistant United States Attorney for the United States Attorney’s Office of the District of Massachusetts (1986-95), including Chief of the Criminal Division (1993-1995). Mr. Chiel is a director on the boards of the Boston Bar Foundation and the Maimonides School.
James C. Curvey (1935)
Year of Election or Appointment: 2007
Trustee
Chairman of the Board of Trustees
Mr. Curvey also serves as Trustee of other Fidelity® funds. Mr. Curvey is a Director of Fidelity Research & Analysis Co. (investment adviser firm, 2009-present), and Vice Chairman (2007-present) and Director of FMR LLC (diversified financial services company). In addition, Mr. Curvey serves as an Overseer for the Boston Symphony Orchestra and a member of the board of Artis-Naples, Naples, Florida, and as a Trustee for Brewster Academy, Wolfeboro, New Hampshire. Previously, Mr. Curvey served as a Director of Fidelity Investments Money Management, Inc. (investment adviser firm, 2009-2014) and a Director of FMR and FMR Co., Inc. (investment adviser firms, 2007-2014).
Charles S. Morrison (1960)
Year of Election or Appointment: 2014
Trustee
Mr. Morrison also serves as Trustee of other funds. He serves as President of Fidelity SelectCo, LLC (investment adviser firm, 2017-present) and Fidelity Management & Research Company (FMR) (investment adviser firm, 2016-present), a Director of Fidelity Investments Money Management, Inc. (FIMM) (investment adviser firm, 2014-present), Director of Fidelity SelectCo, LLC (investment adviser firm, 2014-present), President, Asset Management (2014-present), and is an employee of Fidelity Investments. Previously, Mr. Morrison served as Vice President of Fidelity's Fixed Income and Asset Allocation Funds (2012-2014), President, Fixed Income (2011-2014), Vice President of Fidelity's Money Market Funds (2005-2009), President, Money Market Group Leader of FMR (investment adviser firm, 2009), and Senior Vice President, Money Market Group of FMR (2004-2009). Mr. Morrison also served as Vice President of Fidelity's Bond Funds (2002-2005), certain Balanced Funds (2002-2005), and certain Asset Allocation Funds (2002-2007), and as Senior Vice President (2002-2005) of Fidelity's Bond Division.
* Determined to be an “Interested Trustee” by virtue of, among other things, his or her affiliation with the trust or various entities under common control with FMR.
+ The information includes the Trustee's principal occupation during the last five years and other information relating to the experience, attributes, and skills relevant to the Trustee's qualifications to serve as a Trustee, which led to the conclusion that the Trustee should serve as a Trustee for the fund.
Independent Trustees:
Correspondence intended for an Independent Trustee may be sent to Fidelity Investments, P.O. Box 55235, Boston, Massachusetts 02205-5235.
Name, Year of Birth; Principal Occupations and Other Relevant Experience+
Dennis J. Dirks (1948)
Year of Election or Appointment: 2005
Trustee
Mr. Dirks also serves as Trustee of other Fidelity® funds. Prior to his retirement in May 2003, Mr. Dirks was Chief Operating Officer and a member of the Board of The Depository Trust & Clearing Corporation (DTCC). He also served as President, Chief Operating Officer, and Board member of The Depository Trust Company (DTC) and President and Board member of the National Securities Clearing Corporation (NSCC). In addition, Mr. Dirks served as Chief Executive Officer and Board member of the Government Securities Clearing Corporation, Chief Executive Officer and Board member of the Mortgage-Backed Securities Clearing Corporation, as a Trustee and a member of the Finance Committee of Manhattan College (2005-2008), as a Trustee and a member of the Finance Committee of AHRC of Nassau County (2006-2008), as a member of the Independent Directors Council (IDC) Governing Council (2010-2015), and as a member of the Board of Directors for The Brookville Center for Children’s Services, Inc. (2009-2017). Mr. Dirks is a member of the Finance Committee (2016-present) and Board of Directors (2017-present) of the Asolo Repertory Theatre.
Alan J. Lacy (1953)
Year of Election or Appointment: 2008
Trustee
Mr. Lacy also serves as Trustee of other Fidelity® funds. Mr. Lacy serves as a Director of Bristol-Myers Squibb Company (global pharmaceuticals, 2008-present). He is a Trustee of the California Chapter of The Nature Conservancy (2015-present) and a Director of the Center for Advanced Study in the Behavioral Sciences at Stanford University (2015-present). In addition, Mr. Lacy served as Senior Adviser (2007-2014) of Oak Hill Capital Partners, L.P. (private equity) and also served as Chief Executive Officer (2005) and Vice Chairman (2005-2006) of Sears Holdings Corporation (retail) and Chief Executive Officer and Chairman of the Board of Sears, Roebuck and Co. (retail, 2000-2005). Previously, Mr. Lacy served as Chairman (2014-2017) and a member (2010-2017) of the Board of Directors of Dave & Buster’s Entertainment, Inc. (restaurant and entertainment complexes), as Chairman (2008-2011) and a member (2006-2015) of the Board of Trustees of the National Parks Conservation Association, and as a member of the Board of Directors for The Hillman Companies, Inc. (hardware wholesalers, 2010-2014), Earth Fare, Inc. (retail grocery, 2010-2014), and The Western Union Company (global money transfer, 2006-2011).
Ned C. Lautenbach (1944)
Year of Election or Appointment: 2000
Trustee
Chairman of the Independent Trustees
Mr. Lautenbach also serves as Trustee of other Fidelity® funds. Mr. Lautenbach currently serves as Vice Chair of the Board of Governors, State University System of Florida (2013-present) and is a member of the Council on Foreign Relations (1994-present). He is also a member and has most recently served as Chairman of the Board of Directors of Artis-Naples (2012-present). Previously, Mr. Lautenbach served as a member and then Lead Director of the Board of Directors of Eaton Corporation (diversified industrial, 1997-2016). He was also a Partner and Advisory Partner at Clayton, Dubilier & Rice, LLC (private equity investment, 1998-2010), as well as a Director of Sony Corporation (2006-2007). In addition, Mr. Lautenbach also had a 30-year career with IBM (technology company) during which time he served as Senior Vice President and a member of the Corporate Executive Committee (1968-1998).
Joseph Mauriello (1944)
Year of Election or Appointment: 2008
Trustee
Mr. Mauriello also serves as Trustee of other Fidelity® funds. Prior to his retirement in January 2006, Mr. Mauriello served in numerous senior management positions including Deputy Chairman and Chief Operating Officer (2004-2005), and Vice Chairman of Financial Services (2002-2004) of KPMG LLP US (professional services, 1965-2005). Mr. Mauriello currently serves as a member of the Board of Directors of XL Group plc. (global insurance and re-insurance, 2006-present) and the Independent Directors Council (IDC) Governing Council (2015-present). Previously, Mr. Mauriello served as a Director of the Hamilton Funds of the Bank of New York (2006-2007) and of Arcadia Resources Inc. (health care services and products, 2007-2012).
Cornelia M. Small (1944)
Year of Election or Appointment: 2005
Trustee
Ms. Small also serves as Trustee of other Fidelity® funds. Ms. Small is a member of the Board of Directors (2009-present) and Chair of the Investment Committee (2010-present) of the Teagle Foundation. Ms. Small also serves on the Investment Committee of the Berkshire Taconic Community Foundation (2008-present). Previously, Ms. Small served as Chairperson (2002-2008) and a member of the Investment Committee and Chairperson (2008-2012) and a member of the Board of Trustees of Smith College. In addition, Ms. Small served as Chief Investment Officer, Director of Global Equity Investments, and a member of the Board of Directors of Scudder, Stevens & Clark and Scudder Kemper Investments.
William S. Stavropoulos (1939)
Year of Election or Appointment: 2001
Trustee
Vice Chairman of the Independent Trustees
Mr. Stavropoulos also serves as Trustee of other Fidelity® funds. Mr. Stavropoulos serves as President and Founder of the Michigan Baseball Foundation, the Great Lakes Loons (2007-present). Mr. Stavropoulos is Chairman Emeritus of the Board of Directors of The Dow Chemical Company, where he previously served in numerous senior management positions, including President, CEO (1995-2000; 2002-2004), Chairman of the Executive Committee (2000-2006), and as a member of the Board of Directors (1990-2006). Currently, Mr. Stavropoulos is Chairman of the Board of Directors of Univar Inc. (global distributor of commodity and specialty chemicals), a Director of Teradata Corporation (data warehousing and technology solutions), and a member of the Advisory Board for Metalmark Capital LLC (private equity investment, 2005-present). Mr. Stavropoulos is an operating advisor to Clayton, Dubilier & Rice, LLC (private equity investment). In addition, Mr. Stavropoulos is a member of the University of Notre Dame Advisory Council for the College of Science, a Trustee of the Rollin L. Gerstacker Foundation, and a Director of Artis-Naples in Naples, Florida. Previously, Mr. Stavropoulos served as a Director of Chemical Financial Corporation (bank holding company, 1993-2012) and Tyco International, Ltd. (multinational manufacturing and services, 2007-2012).
David M. Thomas (1949)
Year of Election or Appointment: 2008
Trustee
Mr. Thomas also serves as Trustee of other Fidelity® funds. Mr. Thomas serves as Non-Executive Chairman of the Board of Directors of Fortune Brands Home and Security (home and security products, 2011-present), as a member of the Board of Directors (2004-present) and Presiding Director (2013-present) of Interpublic Group of Companies, Inc. (marketing communication), and as a member of the Board of Trustees of the University of Florida (2013-present). Previously, Mr. Thomas served as Executive Chairman (2005-2006) and Chairman and Chief Executive Officer (2000-2005) of IMS Health, Inc. (pharmaceutical and healthcare information solutions), and a Director of Fortune Brands, Inc. (consumer products, 2000-2011).
+ The information includes the Trustee's principal occupation during the last five years and other information relating to the experience, attributes, and skills relevant to the Trustee's qualifications to serve as a Trustee, which led to the conclusion that the Trustee should serve as a Trustee for the fund.
Advisory Board Members and Officers:
Correspondence intended for an officer or Peter S. Lynch may be sent to Fidelity Investments, 245 Summer Street, Boston, Massachusetts 02210. Officers appear below in alphabetical order.
Name, Year of Birth; Principal Occupation
Peter S. Lynch (1944)
Year of Election or Appointment: 2003
Member of the Advisory Board
Mr. Lynch also serves as Member of the Advisory Board of other Fidelity® funds. Mr. Lynch is Vice Chairman and a Director of FMR (investment adviser firm) and FMR Co., Inc. (investment adviser firm). In addition, Mr. Lynch serves as a Trustee of Boston College and as the Chairman of the Inner-City Scholarship Fund. Previously, Mr. Lynch served on the Special Olympics International Board of Directors (1997-2006).
Elizabeth Paige Baumann (1968)
Year of Election or Appointment: 2017
Anti-Money Laundering (AML) Officer
Ms. Baumann also serves as AML Officer of other funds. She is Chief AML Officer (2012-present) and Senior Vice President (2014-present) of FMR LLC (diversified financial services company) and is an employee of Fidelity Investments. Previously, Ms. Baumann served as AML Officer of the funds (2012-2016), and Vice President (2007-2014) and Deputy Anti-Money Laundering Officer (2007-2012) of FMR LLC.
Marc R. Bryant (1966)
Year of Election or Appointment: 2015
Secretary and Chief Legal Officer (CLO)
Mr. Bryant also serves as Secretary and CLO of other funds. Mr. Bryant serves as CLO, Secretary, and Senior Vice President of Fidelity Management & Research Company (investment adviser firm, 2015-present) and FMR Co., Inc. (investment adviser firm, 2015-present); Secretary of Fidelity SelectCo, LLC (investment adviser firm, 2015-present) and Fidelity Investments Money Management, Inc. (investment adviser firm, 2015-present); and CLO of Fidelity Management & Research (Hong Kong) Limited and FMR Investment Management (UK) Limited (investment adviser firms, 2015-present) and Fidelity Management & Research (Japan) Limited (investment adviser firm, 2016-present). He is Senior Vice President and Deputy General Counsel of FMR LLC (diversified financial services company). Previously, Mr. Bryant served as Secretary and CLO of Fidelity Rutland Square Trust II (2010-2014) and Assistant Secretary of Fidelity's Fixed Income and Asset Allocation Funds (2013-2015). Prior to joining Fidelity Investments, Mr. Bryant served as a Senior Vice President and the Head of Global Retail Legal for AllianceBernstein L.P. (2006-2010), and as the General Counsel for ProFund Advisors LLC (2001-2006).
William C. Coffey (1969)
Year of Election or Appointment: 2009
Assistant Secretary
Mr. Coffey also serves as Assistant Secretary of other funds. He is Senior Vice President and Deputy General Counsel of FMR LLC (diversified financial services company, 2010-present), and is an employee of Fidelity Investments. Previously, Mr. Coffey served as Vice President and Associate General Counsel of FMR LLC (2005-2009).
Jonathan Davis (1968)
Year of Election or Appointment: 2010
Assistant Treasurer
Mr. Davis also serves as Assistant Treasurer of other funds. Mr. Davis serves as Assistant Treasurer of FMR Capital, Inc. (2017-present) and is an employee of Fidelity Investments. Previously, Mr. Davis served as Vice President and Associate General Counsel of FMR LLC (diversified financial services company, 2003-2010).
Adrien E. Deberghes (1967)
Year of Election or Appointment: 2016
Assistant Treasurer
Mr. Deberghes also serves as an officer of other funds. He serves as Assistant Treasurer of FMR Capital, Inc. (2017-present), Executive Vice President of Fidelity Investments Money Management, Inc. (FIMM) (investment adviser firm, 2016-present), and is an employee of Fidelity Investments (2008-present). Prior to joining Fidelity Investments, Mr. Deberghes was Senior Vice President of Mutual Fund Administration at State Street Corporation (2007-2008), Senior Director of Mutual Fund Administration at Investors Bank & Trust (2005-2007), and Director of Finance for Dunkin' Brands (2000-2005). Previously, Mr. Deberghes served in other fund officer roles.
Stephanie J. Dorsey (1969)
Year of Election or Appointment: 2010
Assistant Treasurer
Ms. Dorsey also serves as an officer of other funds. Ms. Dorsey serves as Assistant Treasurer of FMR Capital, Inc. (2017-present), is an employee of Fidelity Investments (2008-present), and has served in other fund officer roles. Prior to joining Fidelity Investments, Ms. Dorsey served as Treasurer (2004-2008) of the JPMorgan Mutual Funds and Vice President (2004-2008) of JPMorgan Chase Bank.
Howard J. Galligan III (1966)
Year of Election or Appointment: 2014
Chief Financial Officer
Mr. Galligan also serves as Chief Financial Officer of other funds. Mr. Galligan serves as President of Fidelity Pricing and Cash Management Services (FPCMS) (2014-present) and as a Director of Strategic Advisers, Inc. (investment adviser firm, 2008-present). Previously, Mr. Galligan served as Chief Administrative Officer of Asset Management (2011-2014) and Chief Operating Officer and Senior Vice President of Investment Support for Strategic Advisers, Inc. (2003-2011).
Brian B. Hogan (1964)
Year of Election or Appointment: 2009
Vice President
Mr. Hogan also serves as Trustee or Vice President of other funds. Mr. Hogan serves as a Director of FMR Investment Management (UK) Limited (investment adviser firm, 2015-present) and Fidelity SelectCo, LLC (investment adviser firm, 2014-present) and President of the Equity Division of FMR (investment adviser firm, 2009-present). Previously, Mr. Hogan served as Senior Vice President, Equity Research of FMR (2006-2009) and as a portfolio manager. Mr. Brian B. Hogan is not related to Mr. Colm A. Hogan.
Colm A. Hogan (1973)
Year of Election or Appointment: 2016
Deputy Treasurer
Mr. Hogan also serves as an officer of other funds. Mr. Hogan serves as Assistant Treasurer of FMR Capital, Inc. (2017-present) and is an employee of Fidelity Investments (2005-present). Mr. Colm A. Hogan is not related to Mr. Brian B. Hogan.
Chris Maher (1972)
Year of Election or Appointment: 2013
Assistant Treasurer
Mr. Maher serves as Assistant Treasurer of other funds. Mr. Maher is Vice President of Valuation Oversight, serves as Assistant Treasurer of FMR Capital, Inc. (2017-present), and is an employee of Fidelity Investments. Previously, Mr. Maher served as Vice President of Asset Management Compliance (2013), Vice President of the Program Management Group of FMR (investment adviser firm, 2010-2013), and Vice President of Valuation Oversight (2008-2010).
Rieco E. Mello (1969)
Year of Election or Appointment: 2017
Assistant Treasurer
Mr. Mello also serves as Assistant Treasurer of other funds. Mr. Mello serves as Assistant Treasurer of FMR Capital, Inc. (2017-present) and is an employee of Fidelity Investments (1995-present).
Melissa M. Reilly (1971)
Year of Election or Appointment: 2014
Vice President of certain Equity Funds
Ms. Reilly also serves as Vice President of other funds. Ms. Reilly is an employee of Fidelity Investments (2004-present).
Kenneth B. Robins (1969)
Year of Election or Appointment: 2016
Chief Compliance Officer
Mr. Robins also serves as an officer of other funds. Mr. Robins serves as Compliance Officer of Fidelity Management & Research Company and FMR Co., Inc. (investment adviser firms, 2016-present) and is an employee of Fidelity Investments (2004-present). Previously, Mr. Robins served as Executive Vice President of Fidelity Investments Money Management, Inc. (investment adviser firm, 2013-2016) and served in other fund officer roles.
Stacie M. Smith (1974)
Year of Election or Appointment: 2016
President and Treasurer
Ms. Smith also serves as an officer of other funds. Ms. Smith serves as Assistant Treasurer of FMR Capital, Inc. (2017-present), is an employee of Fidelity Investments (2009-present), and has served in other fund officer roles. Prior to joining Fidelity Investments, Ms. Smith served as Senior Audit Manager of Ernst & Young LLP (accounting firm, 1996-2009). Previously, Ms. Smith served as Deputy Treasurer of certain Fidelity® funds (2013-2016).
Marc L. Spector (1972)
Year of Election or Appointment: 2016
Assistant Treasurer
Mr. Spector also serves as an officer of other funds. Mr. Spector serves as Assistant Treasurer of FMR Capital, Inc. (2017-present) and is an employee of Fidelity Investments (2016-present). Prior to joining Fidelity Investments, Mr. Spector served as Director at the Siegfried Group (accounting firm, 2013-2016), and prior to Siegfried Group as audit senior manager at Deloitte & Touche (accounting firm, 2005-2013).
Renee Stagnone (1975)
Year of Election or Appointment: 2016
Assistant Treasurer
Ms. Stagnone also serves as an officer of other funds. Ms. Stagnone serves as Assistant Treasurer of FMR Capital, Inc. (2017-present) and is an employee of Fidelity Investments (1997-present). Previously, Ms. Stagnone served as Deputy Treasurer of certain Fidelity® funds (2013-2016).
Shareholder Expense Example
As a shareholder of the Fund, you incur two types of costs: (1) transaction costs, and (2) ongoing costs, including management fees, distribution and/or service (12b-1) fees and other Fund expenses. This Example is intended to help you understand your ongoing costs (in dollars) of investing in the Fund and to compare these costs with the ongoing costs of investing in other mutual funds.
The Example is based on an investment of $1,000 invested at the beginning of the period and held for the entire period (July 1, 2017 to December 31, 2017).
Actual Expenses
The first line of the accompanying table for each class of the Fund provides information about actual account values and actual expenses. You may use the information in this line, together with the amount you invested, to estimate the expenses that you paid over the period. Simply divide your account value by $1,000.00 (for example, an $8,600 account value divided by $1,000.00 = 8.6), then multiply the result by the number in the first line for a class of the Fund under the heading entitled "Expenses Paid During Period" to estimate the expenses you paid on your account during this period. The estimate of expenses does not include any fees or other expenses of any variable annuity or variable life insurance product. If they were, the estimate of expenses you paid during the period would be higher, and your ending account value would be lower. In addition, the Fund, as a shareholder in the underlying Fidelity Central Funds, will indirectly bear its pro-rata share of the fees and expenses incurred by the underlying Fidelity Central Funds. These fees and expenses are not included in the Fund's annualized expense ratio used to calculate the expense estimate in the table below.
Hypothetical Example for Comparison Purposes
The second line of the accompanying table for each class of the Fund provides information about hypothetical account values and hypothetical expenses based on a Class' actual expense ratio and an assumed rate of return of 5% per year before expenses, which is not the Class' actual return. The hypothetical account values and expenses may not be used to estimate the actual ending account balance or expenses you paid for the period. You may use this information to compare the ongoing costs of investing in the Fund and other funds. To do so, compare this 5% hypothetical example with the 5% hypothetical examples that appear in the shareholder reports of the other funds. The estimate of expenses does not include any fees or other expenses of any variable annuity or variable life insurance product. If they were, the estimate of expenses you paid during the period would be higher, and your ending account value would be lower. In addition, the Fund, as a shareholder in the underlying Fidelity Central Funds, will indirectly bear its pro-rata share of the fees and expenses incurred by the underlying Fidelity Central Funds. These fees and expenses are not included in the Fund's annualized expense ratio used to calculate the expense estimate in the table below.
Please note that the expenses shown in the table are meant to highlight your ongoing costs only and do not reflect any transaction costs. Therefore, the second line of the table is useful in comparing ongoing costs only, and will not help you determine the relative total costs of owning different funds.
| | Annualized Expense Ratio-A | Beginning
Account Value
July 1, 2017 | Ending
Account Value
December 31, 2017 | Expenses Paid
During Period-B
July 1, 2017
to December 31, 2017 |
| Initial Class | .64% | | | |
| Actual | | $1,000.00 | $1,122.60 | $3.42 |
| Hypothetical-C | | $1,000.00 | $1,021.98 | $3.26 |
| Service Class | .74% | | | |
| Actual | | $1,000.00 | $1,122.00 | $3.96 |
| Hypothetical-C | | $1,000.00 | $1,021.48 | $3.77 |
| Service Class 2 | .89% | | | |
| Actual | | $1,000.00 | $1,121.30 | $4.76 |
| Hypothetical-C | | $1,000.00 | $1,020.72 | $4.53 |
| Investor Class | .72% | | | |
| Actual | | $1,000.00 | $1,122.10 | $3.85 |
| Hypothetical-C | | $1,000.00 | $1,021.58 | $3.67 |
A Annualized expense ratio reflects expenses net of applicable fee waivers.
B Expenses are equal to each Class' annualized expense ratio, multiplied by the average account value over the period, multiplied by 184/365 (to reflect the one-half year period).
C 5% return per year before expenses
Distributions (Unaudited)
The Board of Trustees of VIP Growth Portfolio voted to pay to shareholders of record at the opening of business on record date, the following distributions per share derived from capital gains realized from sales of portfolio securities, and dividends derived from net investment income:
| | Pay Date | Record Date | Dividends | Capital Gains |
| VIP Growth Portfolio | | | | |
| Initial Class | 02/09/18 | 02/09/18 | $0.059 | $10.700 |
| Service Class | 02/09/18 | 02/09/18 | $0.048 | $10.700 |
| Service Class 2 | 02/09/18 | 02/09/18 | $0.031 | $10.700 |
| Investor Class | 02/09/18 | 02/09/18 | $0.051 | $10.700 |
| | | | | |
The fund hereby designates as a capital gain dividend with respect to the taxable year ended December 31 2017, $761,417,394, or, if subsequently determined to be different, the net capital gain of such year.
Initial Class designates 91%, and 41%; Service Class designates 100%, and 43%; Service Class 2 designates 100%, and 47%; and Investor Class designates 100%, and 43%; of the dividends distributed in February and December, 2017, respectively during the fiscal year as qualifying for the dividends–received deduction for corporate shareholders.
Board Approval of Investment Advisory Contracts and Management Fees
VIP Growth Portfolio
Each year, the Board of Trustees, including the Independent Trustees (together, the Board), votes on the renewal of the management contract with Fidelity Management & Research Company (FMR) and the sub-advisory agreements (together, the Advisory Contracts) for the fund. FMR and the sub-advisers are referred to herein as the Investment Advisers. The Board, assisted by the advice of fund counsel and Independent Trustees' counsel, requests and considers a broad range of information relevant to the renewal of the Advisory Contracts throughout the year.
The Board meets regularly and, at each of its meetings, covers an extensive agenda of topics and materials and considers factors that are relevant to its annual consideration of the renewal of the fund's Advisory Contracts, including the services and support provided to the fund and its shareholders. The Board has established various standing committees (Committees), each composed of and chaired by Independent Trustees with varying backgrounds, to which the Board has assigned specific subject matter responsibilities in order to enhance effective decision-making by the Board. The Board, acting directly and through its Committees, requests and receives information concerning the annual consideration of the renewal of the fund's Advisory Contracts. The Board also meets as needed to review matters specifically related to the Board's annual consideration of the renewal of the Advisory Contracts. Members of the Board may also meet with trustees of other Fidelity funds through ad hoc joint committees to discuss certain matters relevant to all of the Fidelity funds.
At its July 2017 meeting, the Board unanimously determined to renew the fund's Advisory Contracts. In reaching its determination, the Board considered all factors it believed relevant, including (i) the nature, extent, and quality of the services to be provided to the fund and its shareholders (including the investment performance of the fund); (ii) the competitiveness of the fund's management fee and total expense ratio relative to peer funds; (iii) the total costs of the services to be provided by and the profits to be realized by Fidelity from its relationships with the fund; and (iv) the extent to which, if any, economies of scale exist and would be realized as the fund grows, and whether any economies of scale are appropriately shared with fund shareholders.
In considering whether to renew the Advisory Contracts for the fund, the Board reached a determination, with the assistance of fund counsel and Independent Trustees' counsel and through the exercise of its business judgment, that the renewal of the Advisory Contracts was in the best interests of the fund and its shareholders and that the compensation payable under the Advisory Contracts was fair and reasonable. The Board's decision to renew the Advisory Contracts was not based on any single factor, but rather was based on a comprehensive consideration of all the information provided to the Board at its meetings throughout the year. The Board, in reaching its determination to renew the Advisory Contracts, was aware that shareholders of the fund have a broad range of investment choices available to them, including a wide choice among funds offered by Fidelity's competitors, and that the fund's shareholders, who have the opportunity to review and weigh the disclosure provided by the fund in its prospectus and other public disclosures, have chosen to invest in this fund, which is part of the Fidelity family of funds.
Amendment to Group Fee Rate. The Board also approved an amendment to the management contract for the fund to add an additional breakpoint to the group fee schedule, effective October 1, 2017. The Board noted that the additional breakpoint would result in lower management fee rates as Fidelity's assets under management increase.
Nature, Extent, and Quality of Services Provided. The Board considered Fidelity's staffing as it relates to the fund, including the backgrounds of investment personnel of Fidelity, and also considered the fund's investment objective, strategies, and related investment philosophy. The Independent Trustees also had discussions with senior management of Fidelity's investment operations and investment groups. The Board considered the structure of the investment personnel compensation program and whether this structure provides appropriate incentives to act in the best interests of the fund. Additionally, the Board considered the portfolio managers' investments, if any, in the funds that they manage.
Resources Dedicated to Investment Management and Support Services. The Board and the Fund Oversight and Research Committees reviewed the general qualifications and capabilities of Fidelity's investment staff, including its size, education, experience, and resources, as well as Fidelity's approach to recruiting, training, managing, and compensating investment personnel. The Board noted that Fidelity has continued to increase the resources devoted to non-U.S. offices, including expansion of Fidelity's global investment organization. The Board also noted that Fidelity's analysts have extensive resources, tools and capabilities that allow them to conduct sophisticated quantitative and fundamental analysis, as well as credit analysis of issuers, counterparties and guarantors. Further, the Board considered that Fidelity's investment professionals have sufficient access to global information and data so as to provide competitive investment results over time, and that those professionals also have access to sophisticated tools that permit them to assess portfolio construction and risk and performance attribution characteristics continuously, as well as to transmit new information and research conclusions rapidly around the world. Additionally, in its deliberations, the Board considered Fidelity's trading, risk management, compliance, and technology and operations capabilities and resources, which are integral parts of the investment management process.
Shareholder and Administrative Services. The Board considered (i) the nature, extent, quality, and cost of advisory, administrative, and shareholder services performed by the Investment Advisers and their affiliates under the Advisory Contracts and under separate agreements covering transfer agency, pricing and bookkeeping, and securities lending services for the fund; (ii) the nature and extent of the supervision of third party service providers, principally custodians, subcustodians, and pricing vendors; and (iii) the resources devoted to, and the record of compliance with, the fund's compliance policies and procedures. The Board also reviewed the allocation of fund brokerage, including allocations to brokers affiliated with the Investment Advisers, the use of brokerage commissions to pay fund expenses, and the use of "soft" commission dollars to pay for research services.
The Board noted that the growth of fund assets over time across the complex allows Fidelity to reinvest in the development of services designed to enhance the value or convenience of the Fidelity funds as investment vehicles. These services include 24-hour access to account information and market information through telephone representatives and over the Internet, investor education materials and asset allocation tools, and the expanded availability of Fidelity Investor Centers.
In 2014, the Board formed an ad hoc Committee on Transfer Agency Fees to review the variety of transfer agency fee structures throughout the industry and Fidelity's competitive positioning with respect to industry participants.
Investment in a Large Fund Family. The Board considered the benefits to shareholders of investing in a Fidelity fund, including the benefits of investing in a fund that is part of a large family of funds offering a variety of investment disciplines and providing a large variety of mutual fund investor services. The Board noted that Fidelity had taken, or had made recommendations that resulted in the Fidelity funds taking, a number of actions over the previous year that benefited particular funds, including: (i) continuing to dedicate additional resources to Fidelity's investment research process, and to the support of the senior management team that oversees asset management; (ii) continuing efforts to enhance Fidelity's global research capabilities; (iii) launching new funds and making other enhancements to meet client needs; (iv) launching new share classes of existing funds; (v) eliminating purchase minimums and broadening eligibility requirements for certain lower-priced share classes; (vi) reducing management fees and total expenses for certain growth equity funds and index funds; (vii) lowering expense caps for certain existing funds and classes to reduce expenses borne by shareholders; (viii) eliminating short-term redemption fees for certain funds; (ix) introducing a new pricing structure for certain funds of funds that is expected to reduce overall expenses paid by shareholders; (x) rationalizing product lines and gaining increased efficiencies through proposals for fund mergers and share class consolidations; (xi) continuing to develop, acquire and implement systems and technology to improve services to the funds and shareholders, strengthen information security, and increase efficiency; and (xii) implementing enhancements to further strengthen Fidelity's product line to increase investors' probability of success in achieving their investment goals, including retirement income goals.
Investment Performance. The Board considered whether the fund has operated in accordance with its investment objective, as well as its record of compliance with its investment restrictions and its performance history. The Board noted that there was a portfolio management change for the fund in June 2017.
The Board took into account discussions with representatives of the Investment Advisers about fund investment performance that occur at Board meetings throughout the year. In this regard the Board noted that as part of regularly scheduled fund reviews and other reports to the Board on fund performance, the Board considers annualized return information for the fund for different time periods, measured against a securities market index ("benchmark index") and a peer group of funds with similar objectives ("peer group"), if any. In its evaluation of fund investment performance, the Board gave particular attention to information indicating changes in performance of certain Fidelity funds for specific time periods and discussed with the Investment Advisers the reasons for any overperformance or underperformance.
In addition to reviewing absolute and relative fund performance, the Independent Trustees periodically consider the appropriateness of fund performance metrics in evaluating the results achieved. In general, the Independent Trustees believe that fund performance should be evaluated based on net performance (after fees and expenses) of both the highest performing and lowest performing fund share classes, where applicable, compared to appropriate benchmark indices, over appropriate time periods that may include full market cycles, and compared to peer groups, as applicable, over the same periods, taking into account relevant factors including the following: general market conditions; issuer-specific information; and fund cash flows and other factors.
The Independent Trustees recognize that shareholders evaluate performance on a net basis over their own holding periods, for which one-, three-, and five-year periods are often used as a proxy. For this reason, the performance information reviewed by the Board also included net cumulative calendar year total return information for the fund and an appropriate benchmark index and peer group for the most recent one-, three-, and five-year periods, as shown below. Returns are shown compared to the 25th percentile (top of box, 75% beaten) and 75th percentile (bottom of box, 25% beaten) of the peer universe.
VIP Growth Portfolio
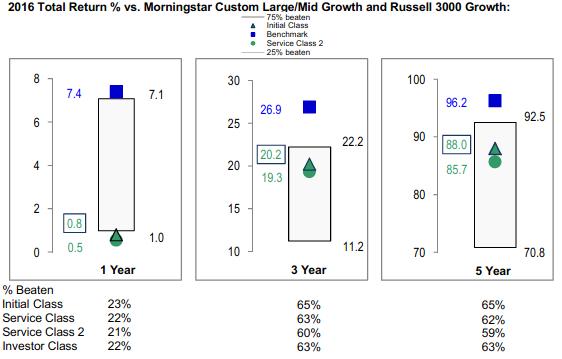
Based on its review, the Board concluded that the nature, extent, and quality of services provided to the fund under the Advisory Contracts should continue to benefit the shareholders of the fund.
Competitiveness of Management Fee and Total Expense Ratio. The Board considered the fund's management fee and total expense ratio compared to "mapped groups" of competitive funds and classes created for the purpose of facilitating the Trustees' competitive analysis of management fees and total expenses. Fidelity creates "mapped groups" by combining similar Lipper investment objective categories that have comparable investment mandates. Combining Lipper investment objective categories aids the Board's management fee and total expense ratio comparisons by broadening the competitive group used for comparison.
Management Fee. The Board considered two proprietary management fee comparisons for the 12-month periods shown in basis points (BP) in the chart below. The group of Lipper funds used by the Board for management fee comparisons is referred to below as the "Total Mapped Group." The Total Mapped Group comparison focuses on a fund's standing in terms of gross management fees before expense reimbursements or caps relative to the total universe of funds with comparable investment mandates, regardless of whether their management fee structures also are comparable. Funds with comparable investment mandates offer exposure to similar types of securities. Funds with comparable management fee structures have similar management fee contractual arrangements (
e.g., flat rate charged for advisory services, all-inclusive fee rate,
etc.). "TMG %" represents the percentage of funds in the Total Mapped Group that had management fees that were lower than the fund's. For example, a hypothetical TMG % of 20% would mean that 80% of the funds in the Total Mapped Group had higher, and 20% had lower, management fees than the fund. The fund's actual TMG %s and the number of funds in the Total Mapped Group are in the chart below. The "Asset-Size Peer Group" (ASPG) comparison focuses on a fund's standing relative to a subset of non-Fidelity funds within the Total Mapped Group that are similar in size and management fee structure. For example, if a fund is in the first quartile of the ASPG, the fund's management fee ranks in the least expensive or lowest 25% of funds in the ASPG. The ASPG represents at least 15% of the funds in the Total Mapped Group with comparable asset size and management fee structures, subject to a minimum of 50 funds (or all funds in the Total Mapped Group if fewer than 50). Additional information, such as the ASPG quartile in which the fund's management fee rate ranked, is also included in the chart and considered by the Board.
VIP Growth Portfolio
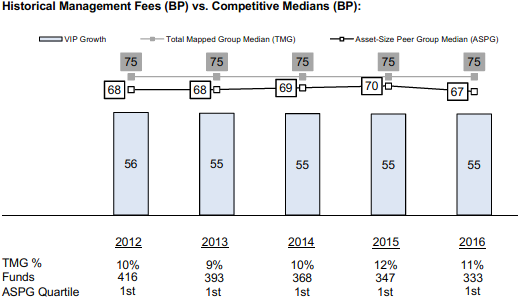
The Board noted that the fund's management fee rate ranked below the median of its Total Mapped Group and below the median of its ASPG for 2016.
The Board noted that, in 2014, the Board and the boards of other Fidelity funds formed the ad hoc Committee on Group Fee to conduct an in-depth review of the "group fee" component of the management fee of funds with such management fee structures. The Committee's focus included the mechanics of the group fee, the competitive landscape of group fee structures, Fidelity funds with no group fee component and investment products not included in group fee assets. The Board also considered that, for funds subject to the group fee, FMR agreed to voluntarily waive fees over a specified period of time in amounts designed to account for assets converted from certain funds to certain collective investment trusts.
The Board also noted that, in 2013, the ad hoc Committee on Management Fees was formed to conduct an in-depth review of the management fee rates of Fidelity's active equity mutual funds. The Committee focused on the following areas: (i) standard fee structures; (ii) research consumption and trading evolution; (iii) management fee competitiveness/profitability by category; and (iv) factors that drive institutional pricing.
Based on its review, the Board concluded that the fund's management fee is fair and reasonable in light of the services that the fund receives and the other factors considered.
Total Expense Ratio. In its review of each class's total expense ratio, the Board considered the fund's management fee rate as well as other fund or class expenses, as applicable, such as transfer agent fees, pricing and bookkeeping fees, fund-paid 12b-1 fees, and custodial, legal, and audit fees. The Board also noted that Fidelity may agree to waive fees and expenses from time to time, and the extent to which, if any, it has done so for the fund. As part of its review, the Board also considered the current and historical total expense ratios of each class of the fund compared to competitive fund median expenses. Each class of the fund is compared to those funds and classes in the Total Mapped Group (used by the Board for management fee comparisons) that have a similar sales load structure.
The Board noted that the total expense ratio of each class ranked below the competitive median for 2016.
Fees Charged to Other Fidelity Clients. The Board also considered Fidelity fee structures and other information with respect to clients of Fidelity, such as other funds advised or subadvised by Fidelity, pension plan clients, and other institutional clients with similar mandates. The Board noted that an ad hoc joint committee created by it and the boards of other Fidelity funds periodically (most recently in 2013) reviews and compares Fidelity's institutional investment advisory business with its business of providing services to the Fidelity funds, including the differences in services provided, fees charged, and costs incurred, as well as competition in their respective marketplaces.
Based on its review of total expense ratios and fees charged to other Fidelity clients, the Board concluded that the total expense ratio of each class of the fund was reasonable in light of the services that the fund and its shareholders receive and the other factors considered.
Costs of the Services and Profitability. The Board considered the revenues earned and the expenses incurred by Fidelity in conducting the business of developing, marketing, distributing, managing, administering and servicing the fund and servicing the fund's shareholders. The Board also considered the level of Fidelity's profits in respect of all the Fidelity funds.
On an annual basis, Fidelity presents to the Board information about the profitability of its relationships with the fund. Fidelity calculates profitability information for each fund, as well as aggregate profitability information for groups of Fidelity funds and all Fidelity funds, using a series of detailed revenue and cost allocation methodologies which originate with the books and records of Fidelity on which Fidelity's audited financial statements are based. The Audit Committee of the Board reviews any significant changes from the prior year's methodologies.
PricewaterhouseCoopers LLP (PwC), independent registered public accounting firm and auditor to Fidelity and certain Fidelity funds, has been engaged annually by the Board as part of the Board's assessment of Fidelity's profitability analysis. PwC's engagement includes the review and assessment of the methodologies used by Fidelity in determining the revenues and expenses attributable to Fidelity's mutual fund business, and completion of agreed-upon procedures in respect of the mathematical accuracy of the fund profitability information and its conformity to established allocation methodologies. After considering PwC's reports issued under the engagement and information provided by Fidelity, the Board concluded that while other allocation methods may also be reasonable, Fidelity's profitability methodologies are reasonable in all material respects.
The Board also reviewed Fidelity's non-fund businesses and potential fall-out benefits related to the mutual fund business as well as cases where Fidelity's affiliates may benefit from or be related to the fund's business.
The Board considered the costs of the services provided by and the profits realized by Fidelity in connection with the operation of the fund and was satisfied that the profitability was not excessive.
Economies of Scale. The Board considered whether there have been economies of scale in respect of the management of the Fidelity funds, whether the Fidelity funds (including the fund) have appropriately benefited from any such economies of scale, and whether there is potential for realization of any further economies of scale. The Board considered the extent to which the fund will benefit from economies of scale as assets grow through increased services to the fund, through waivers or reimbursements, or through fee or expense ratio reductions. The Board also noted that a committee (the Economies of Scale Committee) created by it and the boards of other Fidelity funds periodically (most recently in 2013) analyzes whether Fidelity attains economies of scale in respect of the management and servicing of the Fidelity funds, whether the Fidelity funds have appropriately benefited from such economies of scale, and whether there is potential for realization of any further economies of scale.
The Board recognized that the fund's management contract incorporates a "group fee" structure, which provides for lower group fee rates as total group assets increase, and for higher group fee rates as total group assets decrease (with "group assets" defined to include fund assets under FMR's management plus the assets of sector funds previously under FMR's management). FMR calculates the group fee rates based on a tiered asset "breakpoint" schedule that varies based on asset class. The Board considered that the group fee is designed to deliver the benefits of economies of scale to fund shareholders when total Fidelity fund assets increase, even if assets of any particular fund are unchanged or have declined, because some portion of Fidelity's costs are attributable to services provided to all Fidelity funds, and all funds benefit if those costs can be allocated among more assets. The Board concluded that, given the group fee structure, fund shareholders will benefit from lower management fees as group assets increase at the fund complex level, regardless of whether Fidelity achieves any such economies of scale.
The Board concluded, taking into account the analysis of the Economies of Scale Committee, that economies of scale, if any, are being appropriately shared between fund shareholders and Fidelity.
Additional Information Requested by the Board. In order to develop fully the factual basis for consideration of the Fidelity funds' advisory contracts, the Board requested and received additional information on certain topics, including: (i) fund performance trends, in particular the underperformance of certain funds, and Fidelity's long-term strategies for certain funds; (ii) Fidelity's fund profitability methodology, profitability trends for certain funds, and the impact of certain factors on fund profitability results, including the impact of market trends on actively managed funds; (iii) the use of performance fees and the calculation of performance adjustments, including the impact of underperformance and fund outflows on performance adjustments; (iv) metrics for evaluating index fund performance; (v) Fidelity's group fee structure, including the group fee breakpoint schedules; (vi) the terms of Fidelity's contractual and voluntary expense cap arrangements with the funds; (vii) the methodology with respect to evaluating competitive fund data and peer group classifications and fee comparisons; (viii) the expense structures for different funds and classes; (ix) Fidelity's arrangements with affiliated sub-advisers on behalf of the funds; (x) information regarding other accounts managed by Fidelity, including institutional accounts and collective investment trusts; (xi) recent changes to the fee structure for certain funds of funds; and (xii) the impact of the Department of Labor's new fiduciary rule on the funds' comparative expense information.
Based on its evaluation of all of the conclusions noted above, and after considering all factors it believed relevant, the Board concluded that the advisory fee structures are fair and reasonable, and that the fund's Advisory Contracts should be renewed.
VIPGRWT-ANN-0218
1.540077.120
Fidelity® Variable Insurance Products: Overseas Portfolio
Annual Report December 31, 2017 |
|
Contents
To view a fund's proxy voting guidelines and proxy voting record for the 12-month period ended June 30, visit http://www.fidelity.com/proxyvotingresults or visit the Securities and Exchange Commission's (SEC) web site at http://www.sec.gov.
You may also call 1-877-208-0098 to request a free copy of the proxy voting guidelines.
Fidelity® Variable Insurance Products are separate account options which are purchased through a variable insurance contract.
Standard & Poor's, S&P and S&P 500 are registered service marks of The McGraw-Hill Companies, Inc. and have been licensed for use by Fidelity Distributors Corporation.
Other third-party marks appearing herein are the property of their respective owners.
All other marks appearing herein are registered or unregistered trademarks or service marks of FMR LLC or an affiliated company. © 2018 FMR LLC. All rights reserved.
This report and the financial statements contained herein are submitted for the general information of the shareholders of the Fund. This report is not authorized for distribution to prospective investors in the Fund unless preceded or accompanied by an effective prospectus.
A fund files its complete schedule of portfolio holdings with the SEC for the first and third quarters of each fiscal year on Form N-Q. Forms N-Q are available on the SEC’s web site at http://www.sec.gov. A fund's Forms N-Q may be reviewed and copied at the SEC’s Public Reference Room in Washington, DC. Information regarding the operation of the SEC's Public Reference Room may be obtained by calling 1-800-SEC-0330.
For a complete list of a fund's portfolio holdings, view the most recent holdings listing, semiannual report, or annual report on Fidelity's web site at http://www.fidelity.com, http://www.institutional.fidelity.com, or http://www.401k.com, as applicable.
NOT FDIC INSURED •MAY LOSE VALUE •NO BANK GUARANTEE
Neither the Fund nor Fidelity Distributors Corporation is a bank.
Performance: The Bottom Line
Average annual total return reflects the change in the value of an investment, assuming reinvestment of distributions from dividend income and capital gains (the profits earned upon the sale of securities that have grown in value, if any) and assuming a constant rate of performance each year. During periods of reimbursement by Fidelity, a fund’s total return will be greater than it would be had the reimbursement not occurred. Performance numbers are net of all underlying fund operating expenses, but do not include any insurance charges imposed by your insurance company’s separate account. If performance information included the effect of these additional charges, the total returns would have been lower. How a fund did yesterday is no guarantee of how it will do tomorrow.
Average Annual Total Returns
| For the periods ended December 31, 2017 | Past 1 year | Past 5 years | Past 10 years |
| Initial Class | 30.28% | 8.97% | 2.14% |
| Service Class | 30.10% | 8.87% | 2.04% |
| Service Class 2 | 29.99% | 8.71% | 1.89% |
| Investor Class | 30.18% | 8.89% | 2.05% |
$10,000 Over 10 Years
Let's say hypothetically that $10,000 was invested in VIP Overseas Portfolio - Initial Class on December 31, 2007.
The chart shows how the value of your investment would have changed, and also shows how the MSCI EAFE Index performed over the same period.
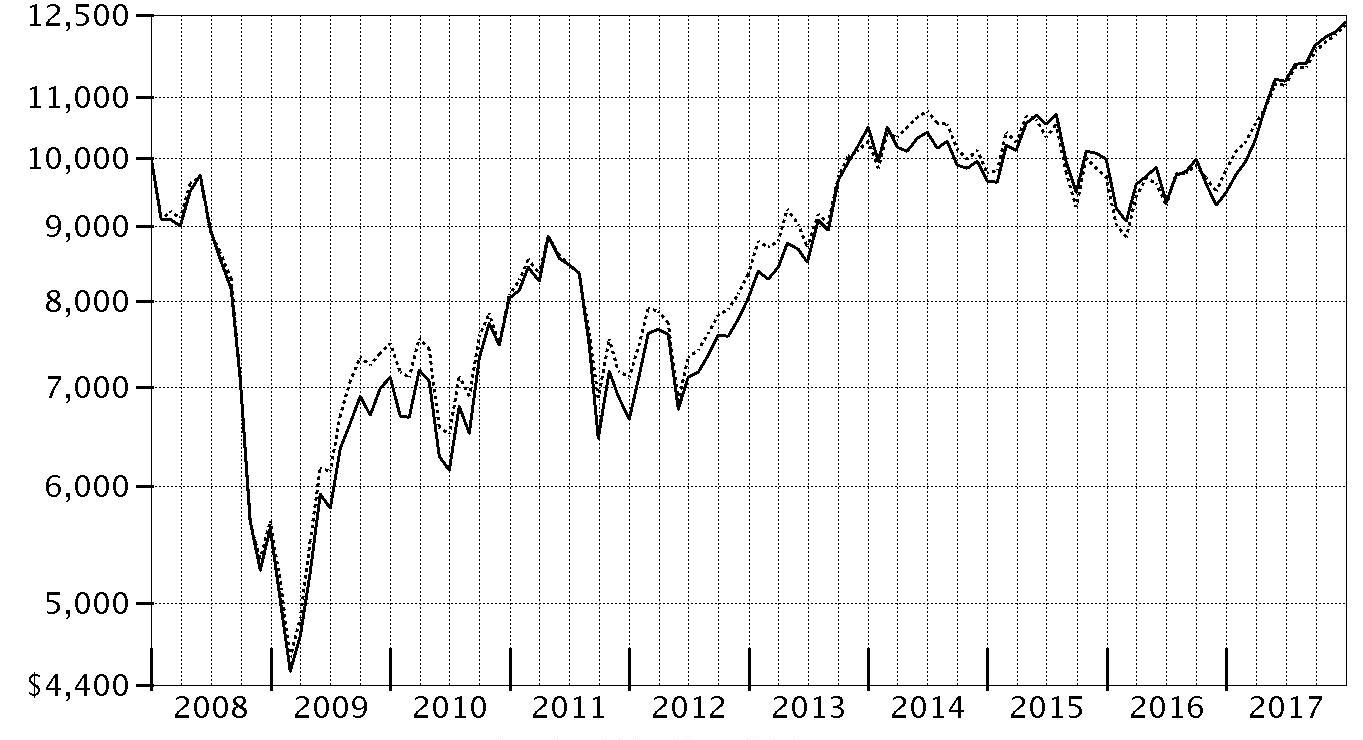
| Period Ending Values |
| $12,358 | VIP Overseas Portfolio - Initial Class |
| $12,309 | MSCI EAFE Index |
Management's Discussion of Fund Performance
Market Recap: The MSCI ACWI (All Country World Index) ex USA Index gained 27.40% in 2017, helped partly by a generally weak U.S. dollar. Certain election results in continental Europe (+28%) suggested ebbing political uncertainty and near-term risk there, whereas the U.K. (+21%) faced more-mixed conditions ahead of its expected exit from the European Union. Japan (+24%), despite central-bank easing and recent pressure from regional yen strength, lagged the rest of the Asia-Pacific group (+26%). Commodity-price volatility slowed Canada (+17%), but emerging markets (+36%) sped ahead. Sector-wise, information technology (+52%) was driven by a surge among software, semiconductor and internet-related names. Financials (+27%) rode rising interest rates that, at the same time, held back consumer staples (+24%), utilities (+19%) and telecommunication services (+15%) – so-called “bond proxy” sectors. Real estate (+27%) bucked the trend, largely due to demand in China. Similarly, materials (+33%) and industrials (+30%) responded to Chinese demand, as well as to price gains for certain commodities. In the energy sector (+17%), oil prices lost ground in the first half of 2017 before rebounding through December 31 to end well above where they started 12 months ago. Lastly, health care (+19%) dealt with early-year turmoil around drug pricing and health care legislation.
Comments from Portfolio Manager Vincent Montemaggiore: For the year, the fund’s share classes gained roughly 30%, well ahead of the 25.29% advance of the benchmark MSCI EAFE Index. Versus the benchmark, active management added value in seven of 11 market sectors. From a sector view, stock picking in financials and industrials, along with positioning in information technology, contributed most. Similarly, all major geographies were relative contributors, led by Japan and the Europe ex U.K. region. At the stock level, our top relative contributor was an out-of-benchmark position in Japan-based Outsourcing, a temp-staffing firm that benefited from that nation’s tight labor market. Also lifting our results was a stake in Wirecard, a Germany-based online-payments business benefiting from the secular shift toward e-commerce. The stock was added to the EAFE index later in the year, which likely triggered additional buying in the market. I exited the stock, judging it had about reached full valuation after our position gained 150% in this period alone. A non-benchmark stake in France-based asset manager Amundi also helped. Conversely, picks in the energy and health care sectors detracted. A small cash position also dragged on results in a strong market. Among individual holdings, the largest relative detractor was a non-benchmark position in U.K.-based Kambi Group, a business-to-business provider of turnkey sports-betting solutions. Delays in recouping the capital invested to build out the company's platform, coupled with weakness in the sports-betting industry this period, resulted in a weak stock price and prompted me to liquidate the fund's position. Overweighting U.K.-based advertising agency WPP also worked against our relative result.
The views expressed above reflect those of the portfolio manager(s) only through the end of the period as stated on the cover of this report and do not necessarily represent the views of Fidelity or any other person in the Fidelity organization. Any such views are subject to change at any time based upon market or other conditions and Fidelity disclaims any responsibility to update such views. These views may not be relied on as investment advice and, because investment decisions for a Fidelity fund are based on numerous factors, may not be relied on as an indication of trading intent on behalf of any Fidelity fund.
Investment Summary (Unaudited)
Geographic Diversification (% of fund's net assets)
| As of December 31, 2017 |
| | United Kingdom | 21.7% |
| | Japan | 18.4% |
| | Germany | 8.3% |
| | France | 8.1% |
| | Switzerland | 5.8% |
| | United States of America* | 4.7% |
| | Ireland | 4.2% |
| | Netherlands | 4.1% |
| | Sweden | 4.0% |
| | Other | 20.7% |
* Includes Short-Term investments and Net Other Assets (Liabilities).
Percentages are based on country or territory of incorporation and are adjusted for the effect of futures contracts, if applicable.
Asset Allocation as of December 31, 2017
| | % of fund's net assets |
| Stocks | 98.7 |
| Short-Term Investments and Net Other Assets (Liabilities) | 1.3 |
Top Ten Stocks as of December 31, 2017
| | % of fund's net assets |
| Nestle SA (Reg. S) (Switzerland, Food Products) | 2.0 |
| British American Tobacco PLC (United Kingdom) (United Kingdom, Tobacco) | 1.5 |
| Bayer AG (Germany, Pharmaceuticals) | 1.4 |
| SAP SE (Germany, Software) | 1.4 |
| Unilever NV (NY Reg.) (Netherlands, Personal Products) | 1.3 |
| Prudential PLC (United Kingdom, Insurance) | 1.2 |
| Total SA (France, Oil, Gas & Consumable Fuels) | 1.2 |
| Deutsche Post AG (Germany, Air Freight & Logistics) | 1.2 |
| Reckitt Benckiser Group PLC (United Kingdom, Household Products) | 1.2 |
| Amadeus IT Holding SA Class A (Spain, IT Services) | 1.1 |
| | 13.5 |
Top Market Sectors as of December 31, 2017
| | % of fund's net assets |
| Financials | 22.5 |
| Industrials | 17.3 |
| Consumer Staples | 13.0 |
| Information Technology | 11.4 |
| Health Care | 11.3 |
| Consumer Discretionary | 11.2 |
| Materials | 7.4 |
| Energy | 2.6 |
| Real Estate | 0.7 |
| Telecommunication Services | 0.7 |
Investments December 31, 2017
Showing Percentage of Net Assets
| Common Stocks - 97.8% | | | |
| | | Shares | Value |
| Australia - 2.1% | | | |
| Adelaide Brighton Ltd. | | 1,257,456 | $6,396,968 |
| Amcor Ltd. | | 1,125,420 | 13,540,440 |
| Aub Group Ltd. | | 591,453 | 6,091,552 |
| Australia & New Zealand Banking Group Ltd. | | 122,657 | 2,750,508 |
| Life Healthcare Group Ltd. | | 11,161 | 23,077 |
| Netwealth Group Ltd. | | 137,463 | 780,820 |
| Pact Group Holdings Ltd. | | 1,390,302 | 6,161,568 |
| realestate.com.au Ltd. | | 22,245 | 1,330,388 |
|
| TOTAL AUSTRALIA | | | 37,075,321 |
|
| Austria - 0.4% | | | |
| Andritz AG | | 113,700 | 6,423,474 |
| Bailiwick of Jersey - 1.5% | | | |
| Sanne Group PLC | | 580,626 | 6,357,690 |
| Wolseley PLC | | 176,947 | 12,733,636 |
| WPP PLC | | 413,440 | 7,469,098 |
|
| TOTAL BAILIWICK OF JERSEY | | | 26,560,424 |
|
| Belgium - 1.8% | | | |
| Anheuser-Busch InBev SA NV | | 134,718 | 15,040,112 |
| KBC Groep NV | | 205,479 | 17,531,742 |
|
| TOTAL BELGIUM | | | 32,571,854 |
|
| Bermuda - 1.6% | | | |
| Credicorp Ltd. (United States) | | 30,200 | 6,264,386 |
| Hiscox Ltd. | | 518,300 | 10,244,819 |
| IHS Markit Ltd. (a) | | 239,972 | 10,834,736 |
| SmarTone Telecommunications Holdings Ltd. | | 1,368,500 | 1,650,009 |
|
| TOTAL BERMUDA | | | 28,993,950 |
|
| Canada - 0.5% | | | |
| Constellation Software, Inc. | | 15,870 | 9,620,730 |
| Cayman Islands - 0.1% | | | |
| HKBN Ltd. | | 312,500 | 395,182 |
| Value Partners Group Ltd. | | 1,770,000 | 1,880,364 |
|
| TOTAL CAYMAN ISLANDS | | | 2,275,546 |
|
| China - 0.1% | | | |
| Yunnan Baiyao Group Co. Ltd. | | 89,200 | 1,395,444 |
| Denmark - 1.0% | | | |
| DSV de Sammensluttede Vognmaend A/S | | 124,800 | 9,827,595 |
| NNIT A/S (b) | | 169,486 | 4,684,650 |
| Scandinavian Tobacco Group A/S (b) | | 80,680 | 1,560,366 |
| SimCorp A/S | | 17,600 | 1,002,156 |
|
| TOTAL DENMARK | | | 17,074,767 |
|
| Finland - 0.1% | | | |
| Amer Group PLC (A Shares) | | 44,200 | 1,224,541 |
| France - 8.1% | | | |
| Altarea SCA | | 6,800 | 1,697,884 |
| ALTEN | | 76,770 | 6,411,950 |
| Amundi SA (b) | | 162,253 | 13,754,090 |
| Capgemini SA | | 120,400 | 14,285,841 |
| Compagnie de St. Gobain | | 229,800 | 12,677,860 |
| Edenred SA | | 316,300 | 9,176,614 |
| Elis SA | | 324,145 | 8,951,118 |
| Maisons du Monde SA (b) | | 280,800 | 12,718,650 |
| Publicis Groupe SA | | 96,806 | 6,562,215 |
| Sanofi SA | | 216,514 | 18,640,120 |
| Sodexo SA | | 76,317 | 10,260,301 |
| SR Teleperformance SA | | 39,400 | 5,646,890 |
| Total SA | | 392,726 | 21,678,452 |
| Total SA rights (a)(c)(d) | | 392,726 | 292,152 |
|
| TOTAL FRANCE | | | 142,754,137 |
|
| Germany - 7.4% | | | |
| adidas AG | | 57,365 | 11,504,833 |
| Axel Springer Verlag AG | | 169,000 | 13,206,713 |
| Bayer AG | | 198,406 | 24,654,572 |
| Bertrandt AG | | 16,182 | 1,973,634 |
| Deutsche Post AG | | 443,712 | 21,162,417 |
| Fresenius Medical Care AG & Co. KGaA | | 111,700 | 11,729,590 |
| Fresenius SE & Co. KGaA | | 203,086 | 15,855,785 |
| Hannover Reuck SE | | 58,100 | 7,312,714 |
| SAP SE | | 214,996 | 24,052,757 |
|
| TOTAL GERMANY | | | 131,453,015 |
|
| Hong Kong - 1.1% | | | |
| AIA Group Ltd. | | 2,103,900 | 17,947,988 |
| Dah Sing Banking Group Ltd. | | 603,600 | 1,310,284 |
| Dah Sing Financial Holdings Ltd. | | 139,200 | 891,731 |
|
| TOTAL HONG KONG | | | 20,150,003 |
|
| India - 0.4% | | | |
| Axis Bank Ltd. | | 830,694 | 7,338,187 |
| PC Jeweller Ltd. | | 77,364 | 553,509 |
|
| TOTAL INDIA | | | 7,891,696 |
|
| Indonesia - 0.7% | | | |
| PT Astra International Tbk | | 2,761,400 | 1,689,303 |
| PT Bank Rakyat Indonesia Tbk | | 39,749,500 | 10,664,321 |
|
| TOTAL INDONESIA | | | 12,353,624 |
|
| Ireland - 4.2% | | | |
| CRH PLC | | 266,000 | 9,546,738 |
| DCC PLC (United Kingdom) | | 96,650 | 9,741,228 |
| Kerry Group PLC Class A | | 114,600 | 12,856,513 |
| Kingspan Group PLC (Ireland) | | 259,800 | 11,348,204 |
| Medtronic PLC | | 131,000 | 10,578,250 |
| Paddy Power Betfair PLC (Ireland) | | 105,000 | 12,497,638 |
| United Drug PLC (United Kingdom) | | 747,902 | 8,532,640 |
|
| TOTAL IRELAND | | | 75,101,211 |
|
| Israel - 0.8% | | | |
| Frutarom Industries Ltd. | | 153,400 | 14,393,718 |
| Italy - 1.4% | | | |
| Banca Generali SpA | | 212,100 | 7,059,502 |
| Intesa Sanpaolo SpA | | 3,732,230 | 12,383,020 |
| Prada SpA | | 1,724,300 | 6,245,825 |
|
| TOTAL ITALY | | | 25,688,347 |
|
| Japan - 18.4% | | | |
| AEON Financial Service Co. Ltd. | | 393,800 | 9,170,900 |
| Arc Land Sakamoto Co. Ltd. | | 208,220 | 3,374,393 |
| Arcland Service Holdings Co. Ltd. | | 412,360 | 9,760,498 |
| Astellas Pharma, Inc. | | 97,100 | 1,233,488 |
| Bridgestone Corp. | | 265,400 | 12,337,832 |
| Daiichikosho Co. Ltd. | | 144,800 | 7,222,330 |
| Daikin Industries Ltd. | | 115,100 | 13,621,997 |
| Daito Trust Construction Co. Ltd. | | 47,010 | 9,585,576 |
| Dentsu, Inc. | | 153,200 | 6,492,390 |
| Fujitsu Ltd. | | 985,000 | 7,017,169 |
| GMO Internet, Inc. (c) | | 217,900 | 3,707,249 |
| Hoya Corp. | | 309,300 | 15,449,216 |
| Ichigo, Inc. | | 296,100 | 1,122,118 |
| Iriso Electronics Co. Ltd. | | 102,600 | 6,128,227 |
| KDDI Corp. (e) | | 186,200 | 4,625,121 |
| Keyence Corp. | | 24,256 | 13,588,096 |
| KH Neochem Co. Ltd. | | 309,600 | 7,927,189 |
| KOMEDA Holdings Co. Ltd. | | 195,150 | 3,592,111 |
| Miroku Jyoho Service Co., Ltd. | | 195,900 | 5,285,432 |
| Misumi Group, Inc. | | 301,770 | 8,784,607 |
| Morinaga & Co. Ltd. | | 141,800 | 7,185,960 |
| Nabtesco Corp. | | 307,000 | 11,770,490 |
| Nakanishi, Inc. | | 183,200 | 9,560,382 |
| Nitori Holdings Co. Ltd. | | 77,600 | 11,064,069 |
| NOF Corp. | | 217,000 | 5,825,826 |
| OBIC Co. Ltd. | | 116,800 | 8,583,128 |
| Olympus Corp. | | 259,200 | 9,937,821 |
| ORIX Corp. | | 1,019,430 | 17,231,013 |
| Otsuka Corp. | | 101,300 | 7,767,757 |
| Outsourcing, Inc. | | 588,000 | 10,718,899 |
| PALTAC Corp. | | 14,300 | 652,336 |
| Paramount Bed Holdings Co. Ltd. | | 30,100 | 1,490,641 |
| Recruit Holdings Co. Ltd. | | 444,960 | 11,057,360 |
| Renesas Electronics Corp. (a) | | 118,100 | 1,376,217 |
| S Foods, Inc. | | 111,700 | 5,075,696 |
| SMC Corp. | | 25,300 | 10,414,147 |
| Software Service, Inc. | | 3,129 | 192,725 |
| Sundrug Co. Ltd. | | 175,700 | 8,171,005 |
| The Suruga Bank Ltd. | | 360,750 | 7,738,476 |
| Toto Ltd. | | 14,700 | 867,584 |
| Tsubaki Nakashima Co. Ltd. | | 244,500 | 5,826,337 |
| Tsuruha Holdings, Inc. | | 81,400 | 11,067,655 |
| VT Holdings Co. Ltd. | | 411,984 | 2,051,236 |
| Welcia Holdings Co. Ltd. | | 217,900 | 9,417,999 |
|
| TOTAL JAPAN | | | 325,070,698 |
|
| Kenya - 0.3% | | | |
| Safaricom Ltd. | | 19,310,400 | 5,007,787 |
| Korea (South) - 0.3% | | | |
| LG Chemical Ltd. | | 13,685 | 5,192,575 |
| Luxembourg - 0.1% | | | |
| B&M European Value Retail S.A. | | 233,934 | 1,337,924 |
| Netherlands - 4.1% | | | |
| ASR Nederland NV | | 39,900 | 1,642,318 |
| Grandvision NV (b) | | 214,900 | 5,490,868 |
| IMCD Group BV | | 205,205 | 12,909,064 |
| ING Groep NV (Certificaten Van Aandelen) | | 756,549 | 13,887,772 |
| Intertrust NV (b) | | 90,454 | 1,696,343 |
| Koninklijke Philips Electronics NV | | 351,128 | 13,258,130 |
| Unilever NV (NY Reg.) | | 405,861 | 22,858,092 |
|
| TOTAL NETHERLANDS | | | 71,742,587 |
|
| New Zealand - 0.6% | | | |
| EBOS Group Ltd. | | 445,830 | 5,861,053 |
| Trade Maine Group Ltd. | | 1,505,290 | 5,163,307 |
|
| TOTAL NEW ZEALAND | | | 11,024,360 |
|
| Norway - 1.2% | | | |
| Schibsted ASA: | | | |
| (A Shares) | | 262,700 | 7,506,080 |
| (B Shares) | | 73,622 | 1,954,741 |
| Skandiabanken ASA (b) | | 85,500 | 843,483 |
| Statoil ASA | | 483,403 | 10,348,899 |
|
| TOTAL NORWAY | | | 20,653,203 |
|
| Panama - 0.4% | | | |
| Copa Holdings SA Class A | | 46,694 | 6,259,798 |
| Spain - 3.3% | | | |
| Aedas Homes SAU (b) | | 28,400 | 1,042,718 |
| Amadeus IT Holding SA Class A | | 272,341 | 19,642,046 |
| CaixaBank SA | | 2,123,500 | 9,871,773 |
| Grifols SA ADR | | 594,900 | 13,635,108 |
| Masmovil Ibercom SA (a) | | 12,561 | 1,324,769 |
| Neinor Homes SLU (b) | | 68,200 | 1,497,485 |
| Prosegur Cash SA (b) | | 3,759,700 | 12,071,640 |
|
| TOTAL SPAIN | | | 59,085,539 |
|
| Sweden - 4.0% | | | |
| Addlife AB | | 154,508 | 3,211,422 |
| Alfa Laval AB | | 349,700 | 8,261,738 |
| Essity AB Class B | | 412,500 | 11,716,607 |
| HEXPOL AB (B Shares) | | 880,800 | 8,928,152 |
| Indutrade AB | | 331,700 | 9,041,475 |
| Nordea Bank AB | | 1,418,200 | 17,167,566 |
| Svenska Cellulosa AB (SCA) (B Shares) | | 375,800 | 3,873,400 |
| Swedbank AB (A Shares) | | 386,662 | 9,328,231 |
|
| TOTAL SWEDEN | | | 71,528,591 |
|
| Switzerland - 5.8% | | | |
| Credit Suisse Group AG | | 781,817 | 13,944,272 |
| Julius Baer Group Ltd. | | 215,640 | 13,186,831 |
| Nestle SA (Reg. S) | | 410,122 | 35,260,752 |
| Roche Holding AG (participation certificate) | | 59,969 | 15,163,484 |
| Sika AG | | 1,157 | 9,189,984 |
| UBS Group AG | | 836,860 | 15,406,915 |
|
| TOTAL SWITZERLAND | | | 102,152,238 |
|
| Taiwan - 0.9% | | | |
| Taiwan Semiconductor Manufacturing Co. Ltd. | | 991,600 | 7,616,173 |
| United Microelectronics Corp. | | 17,026,000 | 8,109,655 |
|
| TOTAL TAIWAN | | | 15,725,828 |
|
| United Kingdom - 21.7% | | | |
| Admiral Group PLC | | 420,900 | 11,376,928 |
| Aggreko PLC | | 56,000 | 604,111 |
| Aon PLC | | 60,300 | 8,080,200 |
| Ascential PLC | | 1,781,603 | 9,268,127 |
| BCA Marketplace PLC | | 396,800 | 1,093,980 |
| Booker Group PLC | | 2,480,268 | 7,668,600 |
| British American Tobacco PLC (United Kingdom) | | 391,270 | 26,508,749 |
| Charter Court Financial Services Group PLC | | 280,100 | 1,067,405 |
| Cineworld Group PLC | | 1,248,100 | 10,127,584 |
| Close Brothers Group PLC | | 41,030 | 802,144 |
| Coca-Cola European Partners PLC | | 170,700 | 6,802,395 |
| Compass Group PLC | | 644,573 | 13,924,324 |
| ConvaTec Group PLC (b) | | 2,332,100 | 6,470,547 |
| Conviviality PLC | | 1,095,500 | 5,971,823 |
| Cranswick PLC | | 131,245 | 5,913,179 |
| Dechra Pharmaceuticals PLC | | 113,200 | 3,203,463 |
| Diploma PLC | | 490,800 | 8,263,291 |
| DS Smith PLC | | 1,107,500 | 7,738,132 |
| Equiniti Group PLC (b) | | 605,239 | 2,331,367 |
| Essentra PLC | | 405,615 | 2,899,760 |
| Halma PLC | | 601,271 | 10,228,756 |
| Hastings Group Holdings PLC (b) | | 1,569,119 | 6,779,347 |
| Hilton Food Group PLC | | 389,469 | 4,543,271 |
| Intertek Group PLC | | 161,910 | 11,345,485 |
| James Fisher and Sons PLC | | 237,000 | 5,007,774 |
| John Wood Group PLC | | 1,071,500 | 9,403,457 |
| Liberty Global PLC Class C (a) | | 43,600 | 1,475,424 |
| LivaNova PLC (a) | | 55,426 | 4,429,646 |
| Lloyds Banking Group PLC | | 1,897,179 | 1,739,681 |
| London Stock Exchange Group PLC | | 171,280 | 8,771,452 |
| Melrose Industries PLC | | 4,051,623 | 11,607,974 |
| Micro Focus International PLC | | 377,931 | 12,873,949 |
| Prudential PLC | | 857,916 | 21,971,501 |
| Reckitt Benckiser Group PLC | | 221,665 | 20,679,898 |
| Rio Tinto PLC | | 278,692 | 14,619,512 |
| Rolls-Royce Holdings PLC | | 761,262 | 8,705,617 |
| Rotork PLC | | 1,638,826 | 5,905,592 |
| Sabre Insurance Group PLC (a)(b) | | 426,600 | 1,566,649 |
| Schroders PLC | | 224,467 | 10,655,734 |
| Sinclair Pharma PLC (a) | | 2,934,841 | 1,035,197 |
| Spectris PLC | | 284,835 | 9,564,255 |
| St. James's Place Capital PLC | | 830,600 | 13,748,788 |
| Standard Life PLC | | 2,327,999 | 13,722,983 |
| The Weir Group PLC | | 391,700 | 11,227,565 |
| Ultra Electronics Holdings PLC | | 329,000 | 5,983,365 |
| Victrex PLC | | 240,200 | 8,555,193 |
| Volution Group PLC | | 2,188,595 | 6,057,610 |
| Zpg PLC | | 411,545 | 1,836,971 |
|
| TOTAL UNITED KINGDOM | | | 384,158,755 |
|
| United States of America - 3.4% | | | |
| Alphabet, Inc. Class C (a) | | 7,772 | 8,132,621 |
| Middleby Corp. (a) | | 59,800 | 8,070,010 |
| Moody's Corp. | | 57,100 | 8,428,531 |
| S&P Global, Inc. | | 98,486 | 16,683,528 |
| Sherwin-Williams Co. | | 21,800 | 8,938,872 |
| Total System Services, Inc. | | 86,000 | 6,801,740 |
| Vantiv, Inc. (a) | | 42,600 | 3,133,230 |
|
| TOTAL UNITED STATES OF AMERICA | | | 60,188,532 |
|
| TOTAL COMMON STOCKS | | | |
| (Cost $1,347,743,498) | | | 1,732,130,217 |
|
| Nonconvertible Preferred Stocks - 0.9% | | | |
| Germany - 0.9% | | | |
| Henkel AG & Co. KGaA | | | |
| (Cost $15,103,431) | | 116,324 | 15,401,699 |
|
| Money Market Funds - 1.4% | | | |
| Fidelity Cash Central Fund, 1.36% (f) | | 22,130,469 | 22,134,896 |
| Fidelity Securities Lending Cash Central Fund 1.36% (f)(g) | | 3,885,507 | 3,886,284 |
| TOTAL MONEY MARKET FUNDS | | | |
| (Cost $26,020,791) | | | 26,021,180 |
| TOTAL INVESTMENT IN SECURITIES - 100.1% | | | |
| (Cost $1,388,867,720) | | | 1,773,553,096 |
| NET OTHER ASSETS (LIABILITIES) - (0.1)% | | | (2,638,436) |
| NET ASSETS - 100% | | | $1,770,914,660 |
Categorizations in the Schedule of Investments are based on country or territory of incorporation.
Legend
(a) Non-income producing
(b) Security exempt from registration under Rule 144A of the Securities Act of 1933. These securities may be resold in transactions exempt from registration, normally to qualified institutional buyers. At the end of the period, the value of these securities amounted to $72,508,203 or 4.1% of net assets.
(c) Security or a portion of the security is on loan at period end.
(d) Security or a portion of the security purchased on a delayed delivery or when-issued basis.
(e) A portion of the security sold on a delayed delivery basis.
(f) Affiliated fund that is generally available only to investment companies and other accounts managed by Fidelity Investments. The rate quoted is the annualized seven-day yield of the fund at period end. A complete unaudited listing of the fund's holdings as of its most recent quarter end is available upon request. In addition, each Fidelity Central Fund's financial statements, which are not covered by the Fund's Report of Independent Registered Public Accounting Firm, are available on the SEC's website or upon request.
(g) Investment made with cash collateral received from securities on loan.
Affiliated Central Funds
Information regarding fiscal year to date income earned by the Fund from investments in Fidelity Central Funds is as follows:
| Fund | Income earned |
| Fidelity Cash Central Fund | $193,100 |
| Fidelity Securities Lending Cash Central Fund | 646,599 |
| Total | $839,699 |
Amounts in the income column in the above table include any capital gain distributions from underlying funds, which are presented in the corresponding line-item in the Statement of Operations if applicable.
Investment Valuation
The following is a summary of the inputs used, as of December 31, 2017, involving the Fund's assets and liabilities carried at fair value. The inputs or methodology used for valuing securities may not be an indication of the risk associated with investing in those securities. For more information on valuation inputs, and their aggregation into the levels used below, please refer to the Investment Valuation section in the accompanying Notes to Financial Statements.
| | Valuation Inputs at Reporting Date: |
| Description | Total | Level 1 | Level 2 | Level 3 |
| Investments in Securities: | | | | |
| Equities: | | | | |
| Consumer Discretionary | $199,319,665 | $185,288,352 | $14,031,313 | $-- |
| Consumer Staples | 232,140,005 | 161,159,243 | 70,980,762 | -- |
| Energy | 46,730,734 | 14,703,383 | 32,027,351 | -- |
| Financials | 399,010,145 | 312,025,295 | 86,984,850 | -- |
| Health Care | 200,226,451 | 115,547,067 | 84,679,384 | -- |
| Industrials | 309,497,865 | 309,497,865 | -- | -- |
| Information Technology | 200,427,860 | 160,649,275 | 39,778,585 | -- |
| Materials | 133,728,027 | 109,561,777 | 24,166,250 | -- |
| Real Estate | 13,448,296 | 13,448,296 | -- | -- |
| Telecommunication Services | 13,002,868 | 8,377,747 | 4,625,121 | -- |
| Money Market Funds | 26,021,180 | 26,021,180 | -- | -- |
| Total Investments in Securities: | $1,773,553,096 | $1,416,279,480 | $357,273,616 | $-- |
The following is a summary of transfers between Level 1 and Level 2 for the period ended December 31, 2017. Transfers are assumed to have occurred at the beginning of the period, and are primarily attributable to the valuation techniques used for foreign equity securities, as discussed in the accompanying Notes to Financial Statements:
| Transfers | Total |
| Level 1 to Level 2 | $28,197,516 |
| Level 2 to Level 1 | $59,481,251 |
See accompanying notes which are an integral part of the financial statements.
Financial Statements
Statement of Assets and Liabilities
| | | December 31, 2017 |
| Assets | | |
Investment in securities, at value (including securities loaned of $3,703,709) — See accompanying schedule:
Unaffiliated issuers (cost $1,362,846,929) | $1,747,531,916 | |
| Fidelity Central Funds (cost $26,020,791) | 26,021,180 | |
| Total Investment in Securities (cost $1,388,867,720) | | $1,773,553,096 |
| Cash | | 6,144 |
| Foreign currency held at value (cost $456) | | 459 |
| Receivable for investments sold | | |
| Regular delivery | | 2,128,839 |
| Delayed delivery | | 253,832 |
| Receivable for fund shares sold | | 468,547 |
| Dividends receivable | | 3,397,298 |
| Distributions receivable from Fidelity Central Funds | | 42,766 |
| Prepaid expenses | | 2,878 |
| Other receivables | | 187,544 |
| Total assets | | 1,780,041,403 |
| Liabilities | | |
| Payable for investments purchased | | |
| Regular delivery | $1,423,937 | |
| Delayed delivery | 292,152 | |
| Payable for fund shares redeemed | 2,127,548 | |
| Accrued management fee | 967,844 | |
| Distribution and service plan fees payable | 85,719 | |
| Other affiliated payables | 191,280 | |
| Other payables and accrued expenses | 152,711 | |
| Collateral on securities loaned | 3,885,552 | |
| Total liabilities | | 9,126,743 |
| Net Assets | | $1,770,914,660 |
| Net Assets consist of: | | |
| Paid in capital | | $1,394,700,281 |
| Undistributed net investment income | | 264,635 |
| Accumulated undistributed net realized gain (loss) on investments and foreign currency transactions | | (8,755,386) |
| Net unrealized appreciation (depreciation) on investments and assets and liabilities in foreign currencies | | 384,705,130 |
| Net Assets | | $1,770,914,660 |
| Initial Class: | | |
| Net Asset Value, offering price and redemption price per share ($822,993,646 ÷ 35,983,189 shares) | | $22.87 |
| Service Class: | | |
| Net Asset Value, offering price and redemption price per share ($141,046,636 ÷ 6,193,515 shares) | | $22.77 |
| Service Class 2: | | |
| Net Asset Value, offering price and redemption price per share ($361,445,806 ÷ 15,952,727 shares) | | $22.66 |
| Investor Class: | | |
| Net Asset Value, offering price and redemption price per share ($445,428,572 ÷ 19,541,441 shares) | | $22.79 |
See accompanying notes which are an integral part of the financial statements.
Statement of Operations
| | | Year ended December 31, 2017 |
| Investment Income | | |
| Dividends | | $39,329,768 |
| Income from Fidelity Central Funds | | 839,699 |
| Income before foreign taxes withheld | | 40,169,467 |
| Less foreign taxes withheld | | (3,359,187) |
| Total income | | 36,810,280 |
| Expenses | | |
| Management fee | $10,979,005 | |
| Transfer agent fees | 1,390,783 | |
| Distribution and service plan fees | 980,048 | |
| Accounting and security lending fees | 737,728 | |
| Custodian fees and expenses | 207,165 | |
| Independent trustees' fees and expenses | 6,418 | |
| Appreciation in deferred trustee compensation account | 198 | |
| Audit | 80,053 | |
| Legal | 7,081 | |
| Miscellaneous | 12,698 | |
| Total expenses before reductions | 14,401,177 | |
| Expense reductions | (345,279) | 14,055,898 |
| Net investment income (loss) | | 22,754,382 |
| Realized and Unrealized Gain (Loss) | | |
| Net realized gain (loss) on: | | |
| Investment securities: | | |
| Unaffiliated issuers | 56,679,020 | |
| Fidelity Central Funds | (3,413) | |
| Foreign currency transactions | 376,685 | |
| Total net realized gain (loss) | | 57,052,292 |
| Change in net unrealized appreciation (depreciation) on: | | |
| Investment securities: | | |
| Unaffiliated issuers | 343,250,045 | |
| Fidelity Central Funds | 327 | |
| Assets and liabilities in foreign currencies | 249,217 | |
| Total change in net unrealized appreciation (depreciation) | | 343,499,589 |
| Net gain (loss) | | 400,551,881 |
| Net increase (decrease) in net assets resulting from operations | | $423,306,263 |
See accompanying notes which are an integral part of the financial statements.
Statement of Changes in Net Assets
| | Year ended December 31, 2017 | Year ended December 31, 2016 |
| Increase (Decrease) in Net Assets | | |
| Operations | | |
| Net investment income (loss) | $22,754,382 | $21,776,297 |
| Net realized gain (loss) | 57,052,292 | 70,359,827 |
| Change in net unrealized appreciation (depreciation) | 343,499,589 | (168,670,726) |
| Net increase (decrease) in net assets resulting from operations | 423,306,263 | (76,534,602) |
| Distributions to shareholders from net investment income | (22,319,167) | (20,406,573) |
| Distributions to shareholders from net realized gain | (1,537,352) | (2,536,025) |
| Total distributions | (23,856,519) | (22,942,598) |
| Share transactions - net increase (decrease) | (56,155,320) | (31,263,014) |
| Total increase (decrease) in net assets | 343,294,424 | (130,740,214) |
| Net Assets | | |
| Beginning of period | 1,427,620,236 | 1,558,360,450 |
| End of period | $1,770,914,660 | $1,427,620,236 |
| Other Information | | |
| Undistributed net investment income end of period | $264,635 | $13,342 |
See accompanying notes which are an integral part of the financial statements.
Financial Highlights
VIP Overseas Portfolio Initial Class
| Years ended December 31, | 2017 | 2016 | 2015 | 2014 | 2013 |
| Selected Per–Share Data | | | | | |
| Net asset value, beginning of period | $17.81 | $19.08 | $18.70 | $20.64 | $16.09 |
| Income from Investment Operations | | | | | |
| Net investment income (loss)A | .31 | .28 | .29 | .32B | .25 |
| Net realized and unrealized gain (loss) | 5.08 | (1.25) | .38 | (1.98) | 4.63 |
| Total from investment operations | 5.39 | (.97) | .67 | (1.66) | 4.88 |
| Distributions from net investment income | (.31) | (.27) | (.27) | (.27) | (.26) |
| Distributions from net realized gain | (.02) | (.03) | (.02) | (.01) | (.07) |
| Total distributions | (.33) | (.30) | (.29) | (.28) | (.33) |
| Redemption fees added to paid in capitalA | – | – | –C | –C | –C |
| Net asset value, end of period | $22.87 | $17.81 | $19.08 | $18.70 | $20.64 |
| Total ReturnD,E | 30.28% | (5.06)% | 3.62% | (8.08)% | 30.44% |
| Ratios to Average Net AssetsF,G | | | | | |
| Expenses before reductions | .80% | .80% | .80% | .82% | .84% |
| Expenses net of fee waivers, if any | .80% | .80% | .80% | .82% | .84% |
| Expenses net of all reductions | .78% | .80% | .80% | .82% | .83% |
| Net investment income (loss) | 1.46% | 1.56% | 1.46% | 1.62%B | 1.41% |
| Supplemental Data | | | | | |
| Net assets, end of period (000 omitted) | $822,994 | $702,946 | $758,522 | $726,566 | $829,382 |
| Portfolio turnover rateH | 35% | 102% | 29% | 39% | 34% |
A Calculated based on average shares outstanding during the period.
B Net Investment income per share reflects a large, non-recurring dividend which amounted to $.08 per share. Excluding this non-recurring dividend, the ratio of net investment income (loss) to average net assets would have been 1.24%.
C Amount represents less than $.005 per share.
D Total returns do not reflect charges attributable to your insurance company's separate account. Inclusion of these charges would reduce the total returns shown.
E Total returns would have been lower if certain expenses had not been reduced during the applicable periods shown.
F Fees and expenses of any underlying Fidelity Central Funds are not included in the Fund's expense ratio. The Fund indirectly bears its proportionate share of the expenses of any underlying Fidelity Central Funds.
G Expense ratios reflect operating expenses of the class. Expenses before reductions do not reflect amounts reimbursed by the investment adviser or reductions from brokerage service arrangements or reductions from other expense offset arrangements and do not represent the amount paid by the class during periods when reimbursements or reductions occur. Expenses net of fee waivers reflect expenses after reimbursement by the investment adviser but prior to reductions from brokerage service arrangements or other expense offset arrangements. Expenses net of all reductions represent the net expenses paid by the class.
H Amount does not include the portfolio activity of any underlying Fidelity Central Funds.
See accompanying notes which are an integral part of the financial statements.
VIP Overseas Portfolio Service Class
| Years ended December 31, | 2017 | 2016 | 2015 | 2014 | 2013 |
| Selected Per–Share Data | | | | | |
| Net asset value, beginning of period | $17.74 | $19.00 | $18.63 | $20.56 | $16.02 |
| Income from Investment Operations | | | | | |
| Net investment income (loss)A | .28 | .27 | .27 | .30B | .24 |
| Net realized and unrealized gain (loss) | 5.05 | (1.24) | .37 | (1.97) | 4.61 |
| Total from investment operations | 5.33 | (.97) | .64 | (1.67) | 4.85 |
| Distributions from net investment income | (.28) | (.25) | (.25) | (.25) | (.24) |
| Distributions from net realized gain | (.02) | (.03) | (.02) | (.01) | (.07) |
| Total distributions | (.30) | (.29)C | (.27) | (.26) | (.31) |
| Redemption fees added to paid in capitalA | – | – | –D | –D | –D |
| Net asset value, end of period | $22.77 | $17.74 | $19.00 | $18.63 | $20.56 |
| Total ReturnE,F | 30.10% | (5.12)% | 3.49% | (8.16)% | 30.38% |
| Ratios to Average Net AssetsG,H | | | | | |
| Expenses before reductions | .90% | .90% | .90% | .92% | .94% |
| Expenses net of fee waivers, if any | .90% | .90% | .90% | .92% | .94% |
| Expenses net of all reductions | .88% | .90% | .90% | .92% | .93% |
| Net investment income (loss) | 1.36% | 1.46% | 1.36% | 1.52%B | 1.31% |
| Supplemental Data | | | | | |
| Net assets, end of period (000 omitted) | $141,047 | $118,444 | $138,766 | $100,058 | $118,920 |
| Portfolio turnover rateI | 35% | 102% | 29% | 39% | 34% |
A Calculated based on average shares outstanding during the period.
B Net Investment income per share reflects a large, non-recurring dividend which amounted to $.07 per share. Excluding this non-recurring dividends, the ratio of net investment income (loss) to average net assets would have been 1.14%.
C Total distributions of $.29 per share is comprised of distributions from net investment income of $.253 and distributions from net realized gain of $.032 per share.
D Amount represents less than $.005 per share.
E Total returns do not reflect charges attributable to your insurance company's separate account. Inclusion of these charges would reduce the total returns shown.
F Total returns would have been lower if certain expenses had not been reduced during the applicable periods shown.
G Fees and expenses of any underlying Fidelity Central Funds are not included in the Fund's expense ratio. The Fund indirectly bears its proportionate share of the expenses of any underlying Fidelity Central Funds.
H Expense ratios reflect operating expenses of the class. Expenses before reductions do not reflect amounts reimbursed by the investment adviser or reductions from brokerage service arrangements or reductions from other expense offset arrangements and do not represent the amount paid by the class during periods when reimbursements or reductions occur. Expenses net of fee waivers reflect expenses after reimbursement by the investment adviser but prior to reductions from brokerage service arrangements or other expense offset arrangements. Expenses net of all reductions represent the net expenses paid by the class.
I Amount does not include the portfolio activity of any underlying Fidelity Central Funds.
See accompanying notes which are an integral part of the financial statements.
VIP Overseas Portfolio Service Class 2
| Years ended December 31, | 2017 | 2016 | 2015 | 2014 | 2013 |
| Selected Per–Share Data | | | | | |
| Net asset value, beginning of period | $17.65 | $18.92 | $18.55 | $20.47 | $15.95 |
| Income from Investment Operations | | | | | |
| Net investment income (loss)A | .25 | .24 | .24 | .27B | .21 |
| Net realized and unrealized gain (loss) | 5.04 | (1.25) | .38 | (1.96) | 4.59 |
| Total from investment operations | 5.29 | (1.01) | .62 | (1.69) | 4.80 |
| Distributions from net investment income | (.26) | (.23) | (.23) | (.22) | (.21) |
| Distributions from net realized gain | (.02) | (.03) | (.02) | (.01) | (.07) |
| Total distributions | (.28) | (.26) | (.25) | (.23) | (.28) |
| Redemption fees added to paid in capitalA | – | – | –C | –C | –C |
| Net asset value, end of period | $22.66 | $17.65 | $18.92 | $18.55 | $20.47 |
| Total ReturnD,E | 29.99% | (5.32)% | 3.35% | (8.30)% | 30.17% |
| Ratios to Average Net AssetsF,G | | | | | |
| Expenses before reductions | 1.05% | 1.05% | 1.05% | 1.07% | 1.09% |
| Expenses net of fee waivers, if any | 1.05% | 1.05% | 1.05% | 1.07% | 1.09% |
| Expenses net of all reductions | 1.03% | 1.05% | 1.05% | 1.07% | 1.08% |
| Net investment income (loss) | 1.21% | 1.31% | 1.21% | 1.37%B | 1.16% |
| Supplemental Data | | | | | |
| Net assets, end of period (000 omitted) | $361,446 | $302,443 | $345,818 | $266,860 | $316,863 |
| Portfolio turnover rateH | 35% | 102% | 29% | 39% | 34% |
A Calculated based on average shares outstanding during the period.
B Net Investment income per share reflects a large, non-recurring dividend which amounted to $.07 per share. Excluding this non-recurring dividends, the ratio of net investment income (loss) to average net assets would have been .99%.
C Amount represents less than $.005 per share.
D Total returns do not reflect charges attributable to your insurance company's separate account. Inclusion of these charges would reduce the total returns shown.
E Total returns would have been lower if certain expenses had not been reduced during the applicable periods shown.
F Fees and expenses of any underlying Fidelity Central Funds are not included in the Fund's expense ratio. The Fund indirectly bears its proportionate share of the expenses of any underlying Fidelity Central Funds.
G Expense ratios reflect operating expenses of the class. Expenses before reductions do not reflect amounts reimbursed by the investment adviser or reductions from brokerage service arrangements or reductions from other expense offset arrangements and do not represent the amount paid by the class during periods when reimbursements or reductions occur. Expenses net of fee waivers reflect expenses after reimbursement by the investment adviser but prior to reductions from brokerage service arrangements or other expense offset arrangements. Expenses net of all reductions represent the net expenses paid by the class.
H Amount does not include the portfolio activity of any underlying Fidelity Central Funds.
See accompanying notes which are an integral part of the financial statements.
VIP Overseas Portfolio Investor Class
| Years ended December 31, | 2017 | 2016 | 2015 | 2014 | 2013 |
| Selected Per–Share Data | | | | | |
| Net asset value, beginning of period | $17.75 | $19.02 | $18.64 | $20.58 | $16.04 |
| Income from Investment Operations | | | | | |
| Net investment income (loss)A | .29 | .27 | .27 | .30B | .24 |
| Net realized and unrealized gain (loss) | 5.06 | (1.25) | .39 | (1.98) | 4.62 |
| Total from investment operations | 5.35 | (.98) | .66 | (1.68) | 4.86 |
| Distributions from net investment income | (.29) | (.26) | (.26) | (.26) | (.25) |
| Distributions from net realized gain | (.02) | (.03) | (.02) | (.01) | (.07) |
| Total distributions | (.31) | (.29) | (.28) | (.26)C | (.32) |
| Redemption fees added to paid in capitalA | – | – | –D | –D | –D |
| Net asset value, end of period | $22.79 | $17.75 | $19.02 | $18.64 | $20.58 |
| Total ReturnE,F | 30.18% | (5.14)% | 3.55% | (8.17)% | 30.40% |
| Ratios to Average Net AssetsG,H | | | | | |
| Expenses before reductions | .88% | .88% | .88% | .90% | .92% |
| Expenses net of fee waivers, if any | .88% | .88% | .88% | .90% | .92% |
| Expenses net of all reductions | .86% | .88% | .88% | .90% | .91% |
| Net investment income (loss) | 1.38% | 1.48% | 1.38% | 1.54%B | 1.33% |
| Supplemental Data | | | | | |
| Net assets, end of period (000 omitted) | $445,429 | $303,787 | $315,254 | $279,760 | $294,173 |
| Portfolio turnover rateI | 35% | 102% | 29% | 39% | 34% |
A Calculated based on average shares outstanding during the period.
B Net Investment income per share reflects a large, non-recurring dividend which amounted to $.07 per share. Excluding this non-recurring dividends, the ratio of net investment income (loss) to average net assets would have been 1.16%.
C Total distributions of $.26 per share is comprised of distributions from net investment income of $.257 and distributions from net realized gain of $.005 per share.
D Amount represents less than $.005 per share.
E Total returns do not reflect charges attributable to your insurance company's separate account. Inclusion of these charges would reduce the total returns shown.
F Total returns would have been lower if certain expenses had not been reduced during the applicable periods shown.
G Fees and expenses of any underlying Fidelity Central Funds are not included in the Fund's expense ratio. The Fund indirectly bears its proportionate share of the expenses of any underlying Fidelity Central Funds.
H Expense ratios reflect operating expenses of the class. Expenses before reductions do not reflect amounts reimbursed by the investment adviser or reductions from brokerage service arrangements or reductions from other expense offset arrangements and do not represent the amount paid by the class during periods when reimbursements or reductions occur. Expenses net of fee waivers reflect expenses after reimbursement by the investment adviser but prior to reductions from brokerage service arrangements or other expense offset arrangements. Expenses net of all reductions represent the net expenses paid by the class.
I Amount does not include the portfolio activity of any underlying Fidelity Central Funds.
See accompanying notes which are an integral part of the financial statements.
Notes to Financial Statements
For the period ended December 31, 2017
1. Organization.
VIP Overseas Portfolio (the Fund) is a fund of Variable Insurance Products Fund (the Trust) and is authorized to issue an unlimited number of shares. The Trust is registered under the Investment Company Act of 1940, as amended (the 1940 Act), as an open-end management investment company organized as a Massachusetts business trust. Shares of the Fund may only be purchased by insurance companies for the purpose of funding variable annuity or variable life insurance contracts. The Fund offers the following classes of shares: Initial Class shares, Service Class shares, Service Class 2 shares and Investor Class shares. All classes have equal rights and voting privileges, except for matters affecting a single class.
2. Investments in Fidelity Central Funds.
The Fund invests in Fidelity Central Funds, which are open-end investment companies generally available only to other investment companies and accounts managed by the investment adviser and its affiliates. The Fund's Schedule of Investments lists each of the Fidelity Central Funds held as of period end, if any, as an investment of the Fund, but does not include the underlying holdings of each Fidelity Central Fund. As an Investing Fund, the Fund indirectly bears its proportionate share of the expenses of the underlying Fidelity Central Funds.
The Money Market Central Funds seek preservation of capital and current income and are managed by Fidelity Investments Money Management, Inc. (FIMM), an affiliate of the investment adviser. Annualized expenses of the Money Market Central Funds as of their most recent shareholder report date are less than .005%.
A complete unaudited list of holdings for each Fidelity Central Fund is available upon request or at the Securities and Exchange Commission (the SEC) website at www.sec.gov. In addition, the financial statements of the Fidelity Central Funds, which are not covered by the Fund's Report of Independent Registered Public Accounting Firm, are available on the SEC website or upon request.
3. Significant Accounting Policies.
The Fund is an investment company and applies the accounting and reporting guidance of the Financial Accounting Standards Board (FASB) Accounting Standards Codification Topic 946 Financial Services – Investments Companies. The financial statements have been prepared in conformity with accounting principles generally accepted in the United States of America (GAAP), which require management to make certain estimates and assumptions at the date of the financial statements. Actual results could differ from those estimates. Subsequent events, if any, through the date that the financial statements were issued have been evaluated in the preparation of the financial statements. The following summarizes the significant accounting policies of the Fund:
Investment Valuation. Investments are valued as of 4:00 p.m. Eastern time on the last calendar day of the period. The Board of Trustees (the Board) has delegated the day to day responsibility for the valuation of the Fund's investments to the Fair Value Committee (the Committee) established by the Fund's investment adviser. In accordance with valuation policies and procedures approved by the Board, the Fund attempts to obtain prices from one or more third party pricing vendors or brokers to value its investments. When current market prices, quotations or currency exchange rates are not readily available or reliable, investments will be fair valued in good faith by the Committee, in accordance with procedures adopted by the Board. Factors used in determining fair value vary by investment type and may include market or investment specific events. The frequency with which these procedures are used cannot be predicted and they may be utilized to a significant extent. The Committee oversees the Fund's valuation policies and procedures and reports to the Board on the Committee's activities and fair value determinations. The Board monitors the appropriateness of the procedures used in valuing the Fund's investments and ratifies the fair value determinations of the Committee.
The Fund categorizes the inputs to valuation techniques used to value its investments into a disclosure hierarchy consisting of three levels as shown below:
- Level 1 – quoted prices in active markets for identical investments
- Level 2 – other significant observable inputs (including quoted prices for similar investments, interest rates, prepayment speeds, etc.)
- Level 3 – unobservable inputs (including the Fund's own assumptions based on the best information available)
Valuation techniques used to value the Fund's investments by major category are as follows:
Equity securities, including restricted securities, for which market quotations are readily available, are valued at the last reported sale price or official closing price as reported by a third party pricing vendor on the primary market or exchange on which they are traded and are categorized as Level 1 in the hierarchy. In the event there were no sales during the day or closing prices are not available, securities are valued at the last quoted bid price or may be valued using the last available price and are generally categorized as Level 2 in the hierarchy. For foreign equity securities, when market or security specific events arise, comparisons to the valuation of American Depositary Receipts (ADRs), futures contracts, Exchange-Traded Funds (ETFs) and certain indexes as well as quoted prices for similar securities may be used and would be categorized as Level 2 in the hierarchy. Utilizing these techniques may result in transfers between Level 1 and Level 2. For equity securities, including restricted securities, where observable inputs are limited, assumptions about market activity and risk are used and these securities may be categorized as Level 3 in the hierarchy.
Investments in open-end mutual funds, including the Fidelity Central Funds, are valued at their closing net asset value (NAV) each business day and are categorized as Level 1 in the hierarchy.
Changes in valuation techniques may result in transfers in or out of an assigned level within the disclosure hierarchy. The aggregate value of investments by input level as of December 31, 2017, including information on transfers between Levels 1 and 2, is included at the end of the Fund's Schedule of Investments.
Foreign Currency. The Fund may use foreign currency contracts to facilitate transactions in foreign-denominated securities. Gains and losses from these transactions may arise from changes in the value of the foreign currency or if the counterparties do not perform under the contracts' terms.
Foreign-denominated assets, including investment securities, and liabilities are translated into U.S. dollars at the exchange rates at period end. Purchases and sales of investment securities, income and dividends received and expenses denominated in foreign currencies are translated into U.S. dollars at the exchange rate in effect on the transaction date.
The effects of exchange rate fluctuations on investments are included with the net realized and unrealized gain (loss) on investment securities. Other foreign currency transactions resulting in realized and unrealized gain (loss) are disclosed separately.
Investment Transactions and Income. For financial reporting purposes, the Fund's investment holdings and NAV include trades executed through the end of the last business day of the period. The NAV per share for processing shareholder transactions is calculated as of the close of business of the New York Stock Exchange (NYSE), normally 4:00 p.m. Eastern time and includes trades executed through the end of the prior business day. Gains and losses on securities sold are determined on the basis of identified cost and includes proceeds received from litigation. Dividend income is recorded on the ex-dividend date, except for certain dividends from foreign securities where the ex-dividend date may have passed, which are recorded as soon as the Fund is informed of the ex-dividend date. Non-cash dividends included in dividend income, if any, are recorded at the fair market value of the securities received. Income and capital gain distributions from Fidelity Central Funds, if any, are recorded on the ex-dividend date. Investment income is recorded net of foreign taxes withheld where recovery of such taxes is uncertain.
Class Allocations and Expenses. Investment income, realized and unrealized capital gains and losses, common expenses of the Fund, and certain fund-level expense reductions, if any, are allocated daily on a pro-rata basis to each class based on the relative net assets of each class to the total net assets of the Fund. Each class differs with respect to transfer agent and distribution and service plan fees incurred. Certain expense reductions may also differ by class. For the reporting period, the allocated portion of income and expenses to each class as a percent of its average net assets may vary due to the timing of recording these transactions in relation to fluctuating net assets of the classes. Expenses directly attributable to a fund are charged to that fund. Expenses attributable to more than one fund are allocated among the respective funds on the basis of relative net assets or other appropriate methods. Expense estimates are accrued in the period to which they relate and adjustments are made when actual amounts are known.
Deferred Trustee Compensation. Under a Deferred Compensation Plan (the Plan), independent Trustees may elect to defer receipt of a portion of their annual compensation. Deferred amounts are invested in a cross-section of Fidelity funds, are marked-to-market and remain in the Fund until distributed in accordance with the Plan. The investment of deferred amounts and the offsetting payable to the Trustees are included in the accompanying Statement of Assets and Liabilities.
Income Tax Information and Distributions to Shareholders. Each year, the Fund intends to qualify as a regulated investment company under Subchapter M of the Internal Revenue Code, including distributing substantially all of its taxable income and realized gains. As a result, no provision for U.S. Federal income taxes is required. As of December 31, 2017, the Fund did not have any unrecognized tax benefits in the financial statements; nor is the Fund aware of any tax positions for which it is reasonably possible that the total amounts of unrecognized tax benefits will significantly change in the next twelve months. The Fund files a U.S. federal tax return, in addition to state and local tax returns as required. The Fund's federal income tax returns are subject to examination by the Internal Revenue Service (IRS) for a period of three fiscal years after they are filed. State and local tax returns may be subject to examination for an additional fiscal year depending on the jurisdiction. Foreign taxes are provided for based on the Fund's understanding of the tax rules and rates that exist in the foreign markets in which it invests.
Distributions are declared and recorded on the ex-dividend date. Income dividends and capital gain distributions are declared separately for each class. Income and capital gain distributions are determined in accordance with income tax regulations, which may differ from GAAP.
Capital accounts within the financial statements are adjusted for permanent book-tax differences. These adjustments have no impact on net assets or the results of operations. Capital accounts are not adjusted for temporary book-tax differences which will reverse in a subsequent period.
Book-tax differences are primarily due to foreign currency transactions, passive foreign investment companies (PFIC), deferred trustees compensation, expiring capital loss carryforwards, capital loss carryforwards and losses deferred due to wash sales and excise tax regulations.
As of period end, the cost and unrealized appreciation (depreciation) in securities, and derivatives if applicable, for federal income tax purposes were as follows:
| Gross unrealized appreciation | $393,087,781 |
| Gross unrealized depreciation | (17,157,792) |
| Net unrealized appreciation (depreciation) | $375,929,989 |
| Tax Cost | $1,397,623,107 |
The tax-based components of distributable earnings as of period end were as follows:
| Undistributed ordinary income | $317,812 |
| Net unrealized appreciation (depreciation) on securities and other investments | $375,950,456 |
The tax character of distributions paid was as follows:
| | December 31, 2017 | December 31, 2016 |
| Ordinary Income | $23,856,519 | $ 22,942,598 |
Delayed Delivery Transactions and When-Issued Securities. During the period, the Fund transacted in securities on a delayed delivery or when-issued basis. Payment and delivery may take place after the customary settlement period for that security. The price of the underlying securities and the date when the securities will be delivered and paid for are fixed at the time the transaction is negotiated. The securities purchased on a delayed delivery or when-issued basis are identified as such in the Fund's Schedule of Investments. With respect to purchase commitments, the Fund identifies securities as segregated in its records with a value at least equal to the amount of the commitment. Losses may arise due to changes in the value of the underlying securities or if the counterparty does not perform under the contract's terms, or if the issuer does not issue the securities due to political, economic, or other factors.
Restricted Securities. The Fund may invest in securities that are subject to legal or contractual restrictions on resale. These securities generally may be resold in transactions exempt from registration or to the public if the securities are registered. Disposal of these securities may involve time-consuming negotiations and expense, and prompt sale at an acceptable price may be difficult. Information regarding restricted securities is included at the end of the Fund's Schedule of Investments.
4. Purchases and Sales of Investments.
Purchases and sales of securities, other than short-term securities, aggregated $562,978,135 and $636,665,833, respectively.
5. Fees and Other Transactions with Affiliates.
Management Fee. Fidelity Management & Research Company (the investment adviser) and its affiliates provide the Fund with investment management related services for which the Fund pays a monthly management fee. The management fee is the sum of an individual fund fee rate that is based on an annual rate of .42% of the Fund's average net assets and an annualized group fee rate that averaged .24% during the period. The group fee rate is based upon the average net assets of all the mutual funds advised by the investment adviser, including any mutual funds previously advised by the investment adviser that are currently advised by Fidelity SelectCo, LLC, an affiliate of the investment adviser. The group fee rate decreases as assets under management increase and increases as assets under management decrease. For the reporting period, the total annual management fee rate was .67% of the Fund's average net assets.
Distribution and Service Plan Fees. In accordance with Rule 12b-1 of the 1940 Act, the Fund has adopted separate 12b-1 Plans for each Service Class of shares. Each Service Class pays Fidelity Distributors Corporation (FDC), an affiliate of the investment adviser, a service fee. For the period, the service fee is based on an annual rate of .10% of Service Class' average net assets and .25% of Service Class 2's average net assets.
For the period, total fees, all of which were re-allowed to insurance companies for the distribution of shares and providing shareholder support services, were as follows:
| Service Class | $131,612 |
| Service Class 2 | 848,436 |
| | $980,048 |
Transfer Agent Fees. Fidelity Investments Institutional Operations Company, Inc. (FIIOC), an affiliate of the investment adviser, is the Fund's transfer, dividend disbursing, and shareholder servicing agent. FIIOC receives an asset-based fee with respect to each class. Each class pays a fee for transfer agent services, typesetting and printing and mailing of shareholder reports, excluding mailing of proxy statements, equal to an annual rate of class-level average net assets. The annual rate for Investor Class is .15% and the annual rate for all other classes is .07%. For the period, transfer agent fees for each class were as follows:
| Initial Class | $522,051 |
| Service Class | 86,757 |
| Service Class 2 | 223,713 |
| Investor Class | 558,262 |
| | $1,390,783 |
Accounting and Security Lending Fees. Fidelity Service Company, Inc. (FSC), an affiliate of the investment adviser, maintains the Fund's accounting records. The accounting fee is based on the level of average net assets for each month. Under a separate contract, FSC administers the security lending program. The security lending fee is based on the number and duration of lending transactions.
Brokerage Commissions. The Fund placed a portion of its portfolio transactions with brokerage firms which are affiliates of the investment adviser. Brokerage commissions are included in net realized gain (loss) and change in net unrealized appreciation (depreciation) in the Statement of Operations. The commissions paid to these affiliated firms were $1,210 for the period.
Interfund Trades. The Fund may purchase from or sell securities to other Fidelity Funds under procedures adopted by the Board. The procedures have been designed to ensure these interfund trades are executed in accordance with Rule 17a-7 of the 1940 Act. Interfund trades are included within the respective purchases and sales amounts shown in the Purchases and Sales of Investments note.
6. Committed Line of Credit.
The Fund participates with other funds managed by the investment adviser or an affiliate in a $4.25 billion credit facility (the "line of credit") to be utilized for temporary or emergency purposes to fund shareholder redemptions or for other short-term liquidity purposes. The Fund has agreed to pay commitment fees on its pro-rata portion of the line of credit, which amounted to $4,971 and is reflected in Miscellaneous expenses on the Statement of Operations. During the period, the Fund did not borrow on this line of credit.
7. Security Lending.
The Fund lends portfolio securities through a lending agent from time to time in order to earn additional income. For equity securities, a lending agent is used and may loan securities to certain qualified borrowers, including Fidelity Capital Markets (FCM), a broker-dealer affiliated with the Fund. On the settlement date of the loan, the Fund receives collateral (in the form of U.S. Treasury obligations, letters of credit and/or cash) against the loaned securities and maintains collateral in an amount not less than 100% of the market value of the loaned securities during the period of the loan. The market value of the loaned securities is determined at the close of business of the Fund and any additional required collateral is delivered to the Fund on the next business day. The Fund or borrower may terminate the loan at any time, and if the borrower defaults on its obligation to return the securities loaned because of insolvency or other reasons, the Fund may apply collateral received from the borrower against the obligation. The Fund may experience delays and costs in recovering the securities loaned. Any cash collateral received is invested in the Fidelity Securities Lending Cash Central Fund. The value of loaned securities and cash collateral at period end are disclosed on the Fund's Statement of Assets and Liabilities. Security lending income represents the income earned on investing cash collateral, less rebates paid to borrowers and any lending agent fees associated with the loan, plus any premium payments received for lending certain types of securities. Security lending income is presented in the Statement of Operations as a component of income from Fidelity Central Funds. Total security lending income during the period amounted to $646,599. During the period, there were no securities loaned to FCM.
8. Expense Reductions.
Commissions paid to certain brokers with whom the investment adviser, or its affiliates, places trades on behalf of the Fund include an amount in addition to trade execution, which may be rebated back to the Fund to offset certain expenses. This amount totaled $330,453 for the period.
In addition, through arrangements with the Fund's custodian, credits realized as a result of certain uninvested cash balances were used to reduce the Fund's expenses. During the period, these credits reduced the Fund's custody expenses by $2,079.
In addition, during the period the investment adviser reimbursed and/or waived a portion of fund-level operating expenses in the amount of $12,747.
9. Distributions to Shareholders.
Distributions to shareholders of each class were as follows:
| | Year ended
December 31, 2017 | Year ended
December 31, 2016 |
| From net investment income | | |
| Initial Class | $10,956,970 | $10,486,163 |
| Service Class | 1,740,479 | 1,661,827 |
| Service Class 2 | 4,063,486 | 3,888,245 |
| Investor Class | 5,558,232 | 4,370,338 |
| Total | $22,319,167 | $20,406,573 |
| From net realized gain | | |
| Initial Class | $715,232 | $1,242,804 |
| Service Class | 122,569 | 210,191 |
| Service Class 2 | 316,225 | 540,973 |
| Investor Class | 383,326 | 542,057 |
| Total | $1,537,352 | $2,536,025 |
10. Share Transactions.
Transactions for each class of shares were as follows:
| | Shares | Shares | Dollars | Dollars |
| | Year ended December 31, 2017 | Year ended December 31, 2016 | Year ended December 31, 2017 | Year ended December 31, 2016 |
| Initial Class | | | | |
| Shares sold | 3,939,081 | 6,040,612 | $81,647,867 | $108,562,164 |
| Reinvestment of distributions | 522,338 | 663,028 | 11,672,202 | 11,728,967 |
| Shares redeemed | (7,942,813) | (6,994,294) | (167,477,813) | (127,879,172) |
| Net increase (decrease) | (3,481,394) | (290,654) | $(74,157,744) | $(7,588,041) |
| Service Class | | | | |
| Shares sold | 458,423 | 342,589 | $9,659,492 | $6,193,425 |
| Reinvestment of distributions | 83,470 | 106,244 | 1,863,048 | 1,872,018 |
| Shares redeemed | (1,026,405) | (1,073,911) | (21,192,961) | (19,457,006) |
| Net increase (decrease) | (484,512) | (625,078) | $(9,670,421) | $(11,391,563) |
| Service Class 2 | | | | |
| Shares sold | 1,454,959 | 1,512,220 | $29,464,030 | $27,045,816 |
| Reinvestment of distributions | 197,195 | 252,665 | 4,379,711 | 4,429,218 |
| Shares redeemed | (2,832,702) | (2,913,101) | (57,908,938) | (52,590,171) |
| Net increase (decrease) | (1,180,548) | (1,148,216) | $(24,065,197) | $(21,115,137) |
| Investor Class | | | | |
| Shares sold | 4,199,962 | 3,026,923 | $87,910,955 | $54,310,749 |
| Reinvestment of distributions | 265,961 | 278,638 | 5,941,558 | 4,912,395 |
| Shares redeemed | (2,035,744) | (2,768,663) | (42,114,471) | (50,391,417) |
| Net increase (decrease) | 2,430,179 | 536,898 | $51,738,042 | $8,831,727 |
11. Other.
The Fund's organizational documents provide former and current trustees and officers with a limited indemnification against liabilities arising in connection with the performance of their duties to the Fund. In the normal course of business, the Fund may also enter into contracts that provide general indemnifications. The Fund's maximum exposure under these arrangements is unknown as this would be dependent on future claims that may be made against the Fund. The risk of material loss from such claims is considered remote.
At the end of the period, the investment adviser or its affiliates were the owners of record of 23% of the total outstanding shares of the Fund and one otherwise unaffiliated shareholder was the owner of record of 16% of the total outstanding shares of the Fund. Mutual funds managed by the investment adviser or its affiliates were the owners of record, in the aggregate, of approximately 24% of the total outstanding shares of the Fund.
Report of Independent Registered Public Accounting Firm
To the Board of Trustees of Variable Insurance Products Fund and Shareholders of VIP Overseas Portfolio:
Opinion on the Financial Statements
We have audited the accompanying statement of assets and liabilities, including the schedule of investments, of VIP Overseas Portfolio (one of the funds constituting Variable Insurance Products Fund, referred to hereafter as the “Fund”) as of December 31, 2017, the related statement of operations for the year ended December 31, 2017, the statement of changes in net assets for each of the two years in the period ended December 31, 2017, including the related notes, and the financial highlights for each of the five years in the period ended December 31, 2017 (collectively referred to as the “financial statements”). In our opinion, the financial statements present fairly, in all material respects, the financial position of the Fund as of December 31, 2017, the results of its operations for the year then ended, the changes in its net assets for each of the two years in the period ended December 31, 2017 and the financial highlights for each of the five years in the period ended December 31, 2017 in conformity with accounting principles generally accepted in the United States of America.
Basis for Opinion
These financial statements are the responsibility of the Fund’s management. Our responsibility is to express an opinion on the Fund’s financial statements based on our audits. We are a public accounting firm registered with the Public Company Accounting Oversight Board (United States) (“PCAOB”) and are required to be independent with respect to the Fund in accordance with the U.S. federal securities laws and the applicable rules and regulations of the Securities and Exchange Commission and the PCAOB.
We conducted our audits of these financial statements in accordance with the standards of the PCAOB. Those standards require that we plan and perform the audit to obtain reasonable assurance about whether the financial statements are free of material misstatement, whether due to error or fraud.
Our audits included performing procedures to assess the risks of material misstatement of the financial statements, whether due to error or fraud, and performing procedures that respond to those risks. Such procedures included examining, on a test basis, evidence regarding the amounts and disclosures in the financial statements. Our audits also included evaluating the accounting principles used and significant estimates made by management, as well as evaluating the overall presentation of the financial statements. Our procedures included confirmation of securities owned as of December 31, 2017 by correspondence with the custodian and brokers; when replies were not received from brokers, we performed other auditing procedures. We believe that our audits provide a reasonable basis for our opinion.
PricewaterhouseCoopers LLP
Boston, Massachusetts
February 14, 2018
We have served as the auditor of one or more investment companies in the Fidelity group of funds since 1932.
Trustees and Officers
The Trustees, Members of the Advisory Board (if any), and officers of the trust and fund, as applicable, are listed below. The Board of Trustees governs the fund and is responsible for protecting the interests of shareholders. The Trustees are experienced executives who meet periodically throughout the year to oversee the fund's activities, review contractual arrangements with companies that provide services to the fund, oversee management of the risks associated with such activities and contractual arrangements, and review the fund's performance. Except for Mr. Chiel, each of the Trustees oversees 190 funds. Mr. Chiel oversees 145 funds.
The Trustees hold office without limit in time except that (a) any Trustee may resign; (b) any Trustee may be removed by written instrument, signed by at least two-thirds of the number of Trustees prior to such removal; (c) any Trustee who requests to be retired or who has become incapacitated by illness or injury may be retired by written instrument signed by a majority of the other Trustees; and (d) any Trustee may be removed at any special meeting of shareholders by a two-thirds vote of the outstanding voting securities of the trust. Each Trustee who is not an interested person (as defined in the 1940 Act) of the trust and the fund is referred to herein as an Independent Trustee. Each Independent Trustee shall retire not later than the last day of the calendar year in which his or her 75th birthday occurs. The Independent Trustees may waive this mandatory retirement age policy with respect to individual Trustees. Officers and Advisory Board Members hold office without limit in time, except that any officer or Advisory Board Member may resign or may be removed by a vote of a majority of the Trustees at any regular meeting or any special meeting of the Trustees. Except as indicated, each individual has held the office shown or other offices in the same company for the past five years.
The fund’s Statement of Additional Information (SAI) includes more information about the Trustees. To request a free copy, call Fidelity at 1-877-208-0098.
Experience, Skills, Attributes, and Qualifications of the Trustees. The Governance and Nominating Committee has adopted a statement of policy that describes the experience, qualifications, attributes, and skills that are necessary and desirable for potential Independent Trustee candidates (Statement of Policy). The Board believes that each Trustee satisfied at the time he or she was initially elected or appointed a Trustee, and continues to satisfy, the standards contemplated by the Statement of Policy. The Governance and Nominating Committee also engages professional search firms to help identify potential Independent Trustee candidates who have the experience, qualifications, attributes, and skills consistent with the Statement of Policy. From time to time, additional criteria based on the composition and skills of the current Independent Trustees, as well as experience or skills that may be appropriate in light of future changes to board composition, business conditions, and regulatory or other developments, have also been considered by the professional search firms and the Governance and Nominating Committee. In addition, the Board takes into account the Trustees' commitment and participation in Board and committee meetings, as well as their leadership of standing and ad hoc committees throughout their tenure.
In determining that a particular Trustee was and continues to be qualified to serve as a Trustee, the Board has considered a variety of criteria, none of which, in isolation, was controlling. The Board believes that, collectively, the Trustees have balanced and diverse experience, qualifications, attributes, and skills, which allow the Board to operate effectively in governing the fund and protecting the interests of shareholders. Information about the specific experience, skills, attributes, and qualifications of each Trustee, which in each case led to the Board's conclusion that the Trustee should serve (or continue to serve) as a trustee of the fund, is provided below.
Board Structure and Oversight Function. James C. Curvey is an interested person and currently serves as Chairman. The Trustees have determined that an interested Chairman is appropriate and benefits shareholders because an interested Chairman has a personal and professional stake in the quality and continuity of services provided to the fund. Independent Trustees exercise their informed business judgment to appoint an individual of their choosing to serve as Chairman, regardless of whether the Trustee happens to be independent or a member of management. The Independent Trustees have determined that they can act independently and effectively without having an Independent Trustee serve as Chairman and that a key structural component for assuring that they are in a position to do so is for the Independent Trustees to constitute a substantial majority for the Board. The Independent Trustees also regularly meet in executive session. Ned C. Lautenbach serves as Chairman of the Independent Trustees and as such (i) acts as a liaison between the Independent Trustees and management with respect to matters important to the Independent Trustees and (ii) with management prepares agendas for Board meetings.
Fidelity® funds are overseen by different Boards of Trustees. The fund's Board oversees Fidelity's high income and certain equity funds, and other Boards oversee Fidelity's investment-grade bond, money market, asset allocation, and sector funds. The asset allocation funds may invest in Fidelity® funds overseen by the fund's Board. The use of separate Boards, each with its own committee structure, allows the Trustees of each group of Fidelity® funds to focus on the unique issues of the funds they oversee, including common research, investment, and operational issues. On occasion, the separate Boards establish joint committees to address issues of overlapping consequences for the Fidelity® funds overseen by each Board.
The Trustees operate using a system of committees to facilitate the timely and efficient consideration of all matters of importance to the Trustees, the fund, and fund shareholders and to facilitate compliance with legal and regulatory requirements and oversight of the fund's activities and associated risks. The Board, acting through its committees, has charged FMR and its affiliates with (i) identifying events or circumstances the occurrence of which could have demonstrably adverse effects on the fund's business and/or reputation; (ii) implementing processes and controls to lessen the possibility that such events or circumstances occur or to mitigate the effects of such events or circumstances if they do occur; and (iii) creating and maintaining a system designed to evaluate continuously business and market conditions in order to facilitate the identification and implementation processes described in (i) and (ii) above. Because the day-to-day operations and activities of the fund are carried out by or through FMR, its affiliates, and other service providers, the fund's exposure to risks is mitigated but not eliminated by the processes overseen by the Trustees. While each of the Board's committees has responsibility for overseeing different aspects of the fund's activities, oversight is exercised primarily through the Operations, Audit, and Compliance Committees. In addition, the Independent Trustees have worked with FMR to enhance the Board's oversight of investment and financial risks, legal and regulatory risks, technology risks, and operational risks, including the development of additional risk reporting to the Board. For example, a working group comprised of Independent Trustees and FMR has worked and continues to work to review the Fidelity® funds' valuation-related activities, reporting and risk management. Appropriate personnel, including but not limited to the fund's Chief Compliance Officer (CCO), FMR's internal auditor, the independent accountants, the fund's Treasurer and portfolio management personnel, make periodic reports to the Board's committees, as appropriate, including an annual review of Fidelity's risk management program for the Fidelity® funds. The responsibilities of each standing committee, including their oversight responsibilities, are described further under "Standing Committees of the Trustees."
Interested Trustees*:
Correspondence intended for a Trustee who is an interested person may be sent to Fidelity Investments, 245 Summer Street, Boston, Massachusetts 02210.
Name, Year of Birth; Principal Occupations and Other Relevant Experience+
Jonathan Chiel (1957)
Year of Election or Appointment: 2016
Trustee
Mr. Chiel also serves as Trustee of other Fidelity® funds. Mr. Chiel is Executive Vice President and General Counsel for FMR LLC (diversified financial services company, 2012-present). Previously, Mr. Chiel served as general counsel (2004-2012) and senior vice president and deputy general counsel (2000-2004) for John Hancock Financial Services; a partner with Choate, Hall & Stewart (1996-2000) (law firm); and an Assistant United States Attorney for the United States Attorney’s Office of the District of Massachusetts (1986-95), including Chief of the Criminal Division (1993-1995). Mr. Chiel is a director on the boards of the Boston Bar Foundation and the Maimonides School.
James C. Curvey (1935)
Year of Election or Appointment: 2007
Trustee
Chairman of the Board of Trustees
Mr. Curvey also serves as Trustee of other Fidelity® funds. Mr. Curvey is a Director of Fidelity Research & Analysis Co. (investment adviser firm, 2009-present), and Vice Chairman (2007-present) and Director of FMR LLC (diversified financial services company). In addition, Mr. Curvey serves as an Overseer for the Boston Symphony Orchestra and a member of the board of Artis-Naples, Naples, Florida, and as a Trustee for Brewster Academy, Wolfeboro, New Hampshire. Previously, Mr. Curvey served as a Director of Fidelity Investments Money Management, Inc. (investment adviser firm, 2009-2014) and a Director of FMR and FMR Co., Inc. (investment adviser firms, 2007-2014).
Charles S. Morrison (1960)
Year of Election or Appointment: 2014
Trustee
Mr. Morrison also serves as Trustee of other funds. He serves as President of Fidelity SelectCo, LLC (investment adviser firm, 2017-present) and Fidelity Management & Research Company (FMR) (investment adviser firm, 2016-present), a Director of Fidelity Investments Money Management, Inc. (FIMM) (investment adviser firm, 2014-present), Director of Fidelity SelectCo, LLC (investment adviser firm, 2014-present), President, Asset Management (2014-present), and is an employee of Fidelity Investments. Previously, Mr. Morrison served as Vice President of Fidelity's Fixed Income and Asset Allocation Funds (2012-2014), President, Fixed Income (2011-2014), Vice President of Fidelity's Money Market Funds (2005-2009), President, Money Market Group Leader of FMR (investment adviser firm, 2009), and Senior Vice President, Money Market Group of FMR (2004-2009). Mr. Morrison also served as Vice President of Fidelity's Bond Funds (2002-2005), certain Balanced Funds (2002-2005), and certain Asset Allocation Funds (2002-2007), and as Senior Vice President (2002-2005) of Fidelity's Bond Division.
* Determined to be an “Interested Trustee” by virtue of, among other things, his or her affiliation with the trust or various entities under common control with FMR.
+ The information includes the Trustee's principal occupation during the last five years and other information relating to the experience, attributes, and skills relevant to the Trustee's qualifications to serve as a Trustee, which led to the conclusion that the Trustee should serve as a Trustee for the fund.
Independent Trustees:
Correspondence intended for an Independent Trustee may be sent to Fidelity Investments, P.O. Box 55235, Boston, Massachusetts 02205-5235.
Name, Year of Birth; Principal Occupations and Other Relevant Experience+
Dennis J. Dirks (1948)
Year of Election or Appointment: 2005
Trustee
Mr. Dirks also serves as Trustee of other Fidelity® funds. Prior to his retirement in May 2003, Mr. Dirks was Chief Operating Officer and a member of the Board of The Depository Trust & Clearing Corporation (DTCC). He also served as President, Chief Operating Officer, and Board member of The Depository Trust Company (DTC) and President and Board member of the National Securities Clearing Corporation (NSCC). In addition, Mr. Dirks served as Chief Executive Officer and Board member of the Government Securities Clearing Corporation, Chief Executive Officer and Board member of the Mortgage-Backed Securities Clearing Corporation, as a Trustee and a member of the Finance Committee of Manhattan College (2005-2008), as a Trustee and a member of the Finance Committee of AHRC of Nassau County (2006-2008), as a member of the Independent Directors Council (IDC) Governing Council (2010-2015), and as a member of the Board of Directors for The Brookville Center for Children’s Services, Inc. (2009-2017). Mr. Dirks is a member of the Finance Committee (2016-present) and Board of Directors (2017-present) of the Asolo Repertory Theatre.
Alan J. Lacy (1953)
Year of Election or Appointment: 2008
Trustee
Mr. Lacy also serves as Trustee of other Fidelity® funds. Mr. Lacy serves as a Director of Bristol-Myers Squibb Company (global pharmaceuticals, 2008-present). He is a Trustee of the California Chapter of The Nature Conservancy (2015-present) and a Director of the Center for Advanced Study in the Behavioral Sciences at Stanford University (2015-present). In addition, Mr. Lacy served as Senior Adviser (2007-2014) of Oak Hill Capital Partners, L.P. (private equity) and also served as Chief Executive Officer (2005) and Vice Chairman (2005-2006) of Sears Holdings Corporation (retail) and Chief Executive Officer and Chairman of the Board of Sears, Roebuck and Co. (retail, 2000-2005). Previously, Mr. Lacy served as Chairman (2014-2017) and a member (2010-2017) of the Board of Directors of Dave & Buster’s Entertainment, Inc. (restaurant and entertainment complexes), as Chairman (2008-2011) and a member (2006-2015) of the Board of Trustees of the National Parks Conservation Association, and as a member of the Board of Directors for The Hillman Companies, Inc. (hardware wholesalers, 2010-2014), Earth Fare, Inc. (retail grocery, 2010-2014), and The Western Union Company (global money transfer, 2006-2011).
Ned C. Lautenbach (1944)
Year of Election or Appointment: 2000
Trustee
Chairman of the Independent Trustees
Mr. Lautenbach also serves as Trustee of other Fidelity® funds. Mr. Lautenbach currently serves as Vice Chair of the Board of Governors, State University System of Florida (2013-present) and is a member of the Council on Foreign Relations (1994-present). He is also a member and has most recently served as Chairman of the Board of Directors of Artis-Naples (2012-present). Previously, Mr. Lautenbach served as a member and then Lead Director of the Board of Directors of Eaton Corporation (diversified industrial, 1997-2016). He was also a Partner and Advisory Partner at Clayton, Dubilier & Rice, LLC (private equity investment, 1998-2010), as well as a Director of Sony Corporation (2006-2007). In addition, Mr. Lautenbach also had a 30-year career with IBM (technology company) during which time he served as Senior Vice President and a member of the Corporate Executive Committee (1968-1998).
Joseph Mauriello (1944)
Year of Election or Appointment: 2008
Trustee
Mr. Mauriello also serves as Trustee of other Fidelity® funds. Prior to his retirement in January 2006, Mr. Mauriello served in numerous senior management positions including Deputy Chairman and Chief Operating Officer (2004-2005), and Vice Chairman of Financial Services (2002-2004) of KPMG LLP US (professional services, 1965-2005). Mr. Mauriello currently serves as a member of the Board of Directors of XL Group plc. (global insurance and re-insurance, 2006-present) and the Independent Directors Council (IDC) Governing Council (2015-present). Previously, Mr. Mauriello served as a Director of the Hamilton Funds of the Bank of New York (2006-2007) and of Arcadia Resources Inc. (health care services and products, 2007-2012).
Cornelia M. Small (1944)
Year of Election or Appointment: 2005
Trustee
Ms. Small also serves as Trustee of other Fidelity® funds. Ms. Small is a member of the Board of Directors (2009-present) and Chair of the Investment Committee (2010-present) of the Teagle Foundation. Ms. Small also serves on the Investment Committee of the Berkshire Taconic Community Foundation (2008-present). Previously, Ms. Small served as Chairperson (2002-2008) and a member of the Investment Committee and Chairperson (2008-2012) and a member of the Board of Trustees of Smith College. In addition, Ms. Small served as Chief Investment Officer, Director of Global Equity Investments, and a member of the Board of Directors of Scudder, Stevens & Clark and Scudder Kemper Investments.
William S. Stavropoulos (1939)
Year of Election or Appointment: 2001
Trustee
Vice Chairman of the Independent Trustees
Mr. Stavropoulos also serves as Trustee of other Fidelity® funds. Mr. Stavropoulos serves as President and Founder of the Michigan Baseball Foundation, the Great Lakes Loons (2007-present). Mr. Stavropoulos is Chairman Emeritus of the Board of Directors of The Dow Chemical Company, where he previously served in numerous senior management positions, including President, CEO (1995-2000; 2002-2004), Chairman of the Executive Committee (2000-2006), and as a member of the Board of Directors (1990-2006). Currently, Mr. Stavropoulos is Chairman of the Board of Directors of Univar Inc. (global distributor of commodity and specialty chemicals), a Director of Teradata Corporation (data warehousing and technology solutions), and a member of the Advisory Board for Metalmark Capital LLC (private equity investment, 2005-present). Mr. Stavropoulos is an operating advisor to Clayton, Dubilier & Rice, LLC (private equity investment). In addition, Mr. Stavropoulos is a member of the University of Notre Dame Advisory Council for the College of Science, a Trustee of the Rollin L. Gerstacker Foundation, and a Director of Artis-Naples in Naples, Florida. Previously, Mr. Stavropoulos served as a Director of Chemical Financial Corporation (bank holding company, 1993-2012) and Tyco International, Ltd. (multinational manufacturing and services, 2007-2012).
David M. Thomas (1949)
Year of Election or Appointment: 2008
Trustee
Mr. Thomas also serves as Trustee of other Fidelity® funds. Mr. Thomas serves as Non-Executive Chairman of the Board of Directors of Fortune Brands Home and Security (home and security products, 2011-present), as a member of the Board of Directors (2004-present) and Presiding Director (2013-present) of Interpublic Group of Companies, Inc. (marketing communication), and as a member of the Board of Trustees of the University of Florida (2013-present). Previously, Mr. Thomas served as Executive Chairman (2005-2006) and Chairman and Chief Executive Officer (2000-2005) of IMS Health, Inc. (pharmaceutical and healthcare information solutions), and a Director of Fortune Brands, Inc. (consumer products, 2000-2011).
+ The information includes the Trustee's principal occupation during the last five years and other information relating to the experience, attributes, and skills relevant to the Trustee's qualifications to serve as a Trustee, which led to the conclusion that the Trustee should serve as a Trustee for the fund.
Advisory Board Members and Officers:
Correspondence intended for an officer or Peter S. Lynch may be sent to Fidelity Investments, 245 Summer Street, Boston, Massachusetts 02210. Officers appear below in alphabetical order.
Name, Year of Birth; Principal Occupation
Peter S. Lynch (1944)
Year of Election or Appointment: 2003
Member of the Advisory Board
Mr. Lynch also serves as Member of the Advisory Board of other Fidelity® funds. Mr. Lynch is Vice Chairman and a Director of FMR (investment adviser firm) and FMR Co., Inc. (investment adviser firm). In addition, Mr. Lynch serves as a Trustee of Boston College and as the Chairman of the Inner-City Scholarship Fund. Previously, Mr. Lynch served on the Special Olympics International Board of Directors (1997-2006).
Elizabeth Paige Baumann (1968)
Year of Election or Appointment: 2017
Anti-Money Laundering (AML) Officer
Ms. Baumann also serves as AML Officer of other funds. She is Chief AML Officer (2012-present) and Senior Vice President (2014-present) of FMR LLC (diversified financial services company) and is an employee of Fidelity Investments. Previously, Ms. Baumann served as AML Officer of the funds (2012-2016), and Vice President (2007-2014) and Deputy Anti-Money Laundering Officer (2007-2012) of FMR LLC.
Marc R. Bryant (1966)
Year of Election or Appointment: 2015
Secretary and Chief Legal Officer (CLO)
Mr. Bryant also serves as Secretary and CLO of other funds. Mr. Bryant serves as CLO, Secretary, and Senior Vice President of Fidelity Management & Research Company (investment adviser firm, 2015-present) and FMR Co., Inc. (investment adviser firm, 2015-present); Secretary of Fidelity SelectCo, LLC (investment adviser firm, 2015-present) and Fidelity Investments Money Management, Inc. (investment adviser firm, 2015-present); and CLO of Fidelity Management & Research (Hong Kong) Limited and FMR Investment Management (UK) Limited (investment adviser firms, 2015-present) and Fidelity Management & Research (Japan) Limited (investment adviser firm, 2016-present). He is Senior Vice President and Deputy General Counsel of FMR LLC (diversified financial services company). Previously, Mr. Bryant served as Secretary and CLO of Fidelity Rutland Square Trust II (2010-2014) and Assistant Secretary of Fidelity's Fixed Income and Asset Allocation Funds (2013-2015). Prior to joining Fidelity Investments, Mr. Bryant served as a Senior Vice President and the Head of Global Retail Legal for AllianceBernstein L.P. (2006-2010), and as the General Counsel for ProFund Advisors LLC (2001-2006).
William C. Coffey (1969)
Year of Election or Appointment: 2009
Assistant Secretary
Mr. Coffey also serves as Assistant Secretary of other funds. He is Senior Vice President and Deputy General Counsel of FMR LLC (diversified financial services company, 2010-present), and is an employee of Fidelity Investments. Previously, Mr. Coffey served as Vice President and Associate General Counsel of FMR LLC (2005-2009).
Jonathan Davis (1968)
Year of Election or Appointment: 2010
Assistant Treasurer
Mr. Davis also serves as Assistant Treasurer of other funds. Mr. Davis serves as Assistant Treasurer of FMR Capital, Inc. (2017-present) and is an employee of Fidelity Investments. Previously, Mr. Davis served as Vice President and Associate General Counsel of FMR LLC (diversified financial services company, 2003-2010).
Adrien E. Deberghes (1967)
Year of Election or Appointment: 2016
Assistant Treasurer
Mr. Deberghes also serves as an officer of other funds. He serves as Assistant Treasurer of FMR Capital, Inc. (2017-present), Executive Vice President of Fidelity Investments Money Management, Inc. (FIMM) (investment adviser firm, 2016-present), and is an employee of Fidelity Investments (2008-present). Prior to joining Fidelity Investments, Mr. Deberghes was Senior Vice President of Mutual Fund Administration at State Street Corporation (2007-2008), Senior Director of Mutual Fund Administration at Investors Bank & Trust (2005-2007), and Director of Finance for Dunkin' Brands (2000-2005). Previously, Mr. Deberghes served in other fund officer roles.
Joseph DeSantis (1959)
Year of Election or Appointment: 2017
Vice President
Mr. DeSantis also serves as Vice President of other funds. Mr. DeSantis serves as a Director of Fidelity Management & Research (Japan) Limited (investment adviser firm, 2016-present), Chief Investment Officer, Equities (2010-present) and is an employee of Fidelity Investments.
Stephanie J. Dorsey (1969)
Year of Election or Appointment: 2010
Assistant Treasurer
Ms. Dorsey also serves as an officer of other funds. Ms. Dorsey serves as Assistant Treasurer of FMR Capital, Inc. (2017-present), is an employee of Fidelity Investments (2008-present), and has served in other fund officer roles. Prior to joining Fidelity Investments, Ms. Dorsey served as Treasurer (2004-2008) of the JPMorgan Mutual Funds and Vice President (2004-2008) of JPMorgan Chase Bank.
Howard J. Galligan III (1966)
Year of Election or Appointment: 2014
Chief Financial Officer
Mr. Galligan also serves as Chief Financial Officer of other funds. Mr. Galligan serves as President of Fidelity Pricing and Cash Management Services (FPCMS) (2014-present) and as a Director of Strategic Advisers, Inc. (investment adviser firm, 2008-present). Previously, Mr. Galligan served as Chief Administrative Officer of Asset Management (2011-2014) and Chief Operating Officer and Senior Vice President of Investment Support for Strategic Advisers, Inc. (2003-2011).
Brian B. Hogan (1964)
Year of Election or Appointment: 2009
Vice President
Mr. Hogan also serves as Trustee or Vice President of other funds. Mr. Hogan serves as a Director of FMR Investment Management (UK) Limited (investment adviser firm, 2015-present) and Fidelity SelectCo, LLC (investment adviser firm, 2014-present) and President of the Equity Division of FMR (investment adviser firm, 2009-present). Previously, Mr. Hogan served as Senior Vice President, Equity Research of FMR (2006-2009) and as a portfolio manager. Mr. Brian B. Hogan is not related to Mr. Colm A. Hogan.
Colm A. Hogan (1973)
Year of Election or Appointment: 2016
Deputy Treasurer
Mr. Hogan also serves as an officer of other funds. Mr. Hogan serves as Assistant Treasurer of FMR Capital, Inc. (2017-present) and is an employee of Fidelity Investments (2005-present). Mr. Colm A. Hogan is not related to Mr. Brian B. Hogan.
Chris Maher (1972)
Year of Election or Appointment: 2013
Assistant Treasurer
Mr. Maher serves as Assistant Treasurer of other funds. Mr. Maher is Vice President of Valuation Oversight, serves as Assistant Treasurer of FMR Capital, Inc. (2017-present), and is an employee of Fidelity Investments. Previously, Mr. Maher served as Vice President of Asset Management Compliance (2013), Vice President of the Program Management Group of FMR (investment adviser firm, 2010-2013), and Vice President of Valuation Oversight (2008-2010).
Rieco E. Mello (1969)
Year of Election or Appointment: 2017
Assistant Treasurer
Mr. Mello also serves as Assistant Treasurer of other funds. Mr. Mello serves as Assistant Treasurer of FMR Capital, Inc. (2017-present) and is an employee of Fidelity Investments (1995-present).
Kenneth B. Robins (1969)
Year of Election or Appointment: 2016
Chief Compliance Officer
Mr. Robins also serves as an officer of other funds. Mr. Robins serves as Compliance Officer of Fidelity Management & Research Company and FMR Co., Inc. (investment adviser firms, 2016-present) and is an employee of Fidelity Investments (2004-present). Previously, Mr. Robins served as Executive Vice President of Fidelity Investments Money Management, Inc. (investment adviser firm, 2013-2016) and served in other fund officer roles.
Stacie M. Smith (1974)
Year of Election or Appointment: 2016
President and Treasurer
Ms. Smith also serves as an officer of other funds. Ms. Smith serves as Assistant Treasurer of FMR Capital, Inc. (2017-present), is an employee of Fidelity Investments (2009-present), and has served in other fund officer roles. Prior to joining Fidelity Investments, Ms. Smith served as Senior Audit Manager of Ernst & Young LLP (accounting firm, 1996-2009). Previously, Ms. Smith served as Deputy Treasurer of certain Fidelity® funds (2013-2016).
Marc L. Spector (1972)
Year of Election or Appointment: 2016
Assistant Treasurer
Mr. Spector also serves as an officer of other funds. Mr. Spector serves as Assistant Treasurer of FMR Capital, Inc. (2017-present) and is an employee of Fidelity Investments (2016-present). Prior to joining Fidelity Investments, Mr. Spector served as Director at the Siegfried Group (accounting firm, 2013-2016), and prior to Siegfried Group as audit senior manager at Deloitte & Touche (accounting firm, 2005-2013).
Renee Stagnone (1975)
Year of Election or Appointment: 2016
Assistant Treasurer
Ms. Stagnone also serves as an officer of other funds. Ms. Stagnone serves as Assistant Treasurer of FMR Capital, Inc. (2017-present) and is an employee of Fidelity Investments (1997-present). Previously, Ms. Stagnone served as Deputy Treasurer of certain Fidelity® funds (2013-2016).
Shareholder Expense Example
As a shareholder of the Fund, you incur two types of costs: (1) transaction costs and (2) ongoing costs, including management fees, distribution and/or service (12b-1) fees and other Fund expenses. This Example is intended to help you understand your ongoing costs (in dollars) of investing in the Fund and to compare these costs with the ongoing costs of investing in other mutual funds.
The Example is based on an investment of $1,000 invested at the beginning of the period and held for the entire period (July 1, 2017 to December 31, 2017).
Actual Expenses
The first line of the accompanying table for each class of the Fund provides information about actual account values and actual expenses. You may use the information in this line, together with the amount you invested, to estimate the expenses that you paid over the period. Simply divide your account value by $1,000.00 (for example, an $8,600 account value divided by $1,000.00 = 8.6), then multiply the result by the number in the first line for a class of the Fund under the heading entitled "Expenses Paid During Period" to estimate the expenses you paid on your account during this period. The estimate of expenses does not include any fees or other expenses of any variable annuity or variable life insurance product. If they were, the estimate of expenses you paid during the period would be higher, and your ending account value would be lower. In addition, the Fund, as a shareholder in the underlying Fidelity Central Funds, will indirectly bear its pro-rata share of the fees and expenses incurred by the underlying Fidelity Central Funds. These fees and expenses are not included in the Fund's annualized expense ratio used to calculate the expense estimate in the table below.
Hypothetical Example for Comparison Purposes
The second line of the accompanying table for each class of the Fund provides information about hypothetical account values and hypothetical expenses based on a Class' actual expense ratio and an assumed rate of return of 5% per year before expenses, which is not the Class' actual return. The hypothetical account values and expenses may not be used to estimate the actual ending account balance or expenses you paid for the period. You may use this information to compare the ongoing costs of investing in the Fund and other funds. To do so, compare this 5% hypothetical example with the 5% hypothetical examples that appear in the shareholder reports of the other funds. The estimate of expenses does not include any fees or other expenses of any variable annuity or variable life insurance product. If they were, the estimate of expenses you paid during the period would be higher, and your ending account value would be lower. In addition, the Fund, as a shareholder in the underlying Fidelity Central Funds, will indirectly bear its pro-rata share of the fees and expenses incurred by the underlying Fidelity Central Funds. These fees and expenses are not included in the Fund's annualized expense ratio used to calculate the expense estimate in the table below.
Please note that the expenses shown in the table are meant to highlight your ongoing costs only and do not reflect any transaction costs. Therefore, the second line of the table is useful in comparing ongoing costs only, and will not help you determine the relative total costs of owning different funds.
| | Annualized Expense Ratio-A | Beginning
Account Value
July 1, 2017 | Ending
Account Value
December 31, 2017 | Expenses Paid
During Period-B
July 1, 2017
to December 31, 2017 |
| Initial Class | .80% | | | |
| Actual | | $1,000.00 | $1,095.30 | $4.23 |
| Hypothetical-C | | $1,000.00 | $1,021.17 | $4.08 |
| Service Class | .90% | | | |
| Actual | | $1,000.00 | $1,094.40 | $4.75 |
| Hypothetical-C | | $1,000.00 | $1,020.67 | $4.58 |
| Service Class 2 | 1.05% | | | |
| Actual | | $1,000.00 | $1,094.10 | $5.54 |
| Hypothetical-C | | $1,000.00 | $1,019.91 | $5.35 |
| Investor Class | .88% | | | |
| Actual | | $1,000.00 | $1,094.60 | $4.65 |
| Hypothetical-C | | $1,000.00 | $1,020.77 | $4.48 |
A Annualized expense ratio reflects expenses net of applicable fee waivers.
B Expenses are equal to each Class' annualized expense ratio, multiplied by the average account value over the period, multiplied by 184/365 (to reflect the one-half year period).
C 5% return per year before expenses
Distributions (Unaudited)
Initial Class designates 1% and 2%; Service Class designates 0% and 2%; Service Class 2 designates 0% and 2%; and Investor Class designates 0% and 2%; of the dividends distributed in February and December, respectively during the fiscal year as qualifying for the dividends–received deduction for corporate shareholders.
The amounts per share which represent income derived from sources within, and taxes paid to, foreign countries or possessions of the United States are as follows:
| | Pay Date | Income | Taxes |
| Insert Fund Name | | | |
| Initial Class | 12/01/17 | $0.3516 | $0.0296 |
| Service Class | 12/01/17 | $0.3336 | $0.0296 |
| Service Class 2 | 12/01/17 | $0.3066 | $0.0296 |
| Investor Class | 12/01/17 | $0.3396 | $0.0296 |
|
Board Approval of Investment Advisory Contracts and Management Fees
VIP Overseas Portfolio
Each year, the Board of Trustees, including the Independent Trustees (together, the Board), votes on the renewal of the management contract with Fidelity Management & Research Company (FMR) and the sub-advisory agreements (together, the Advisory Contracts) for the fund. FMR and the sub-advisers are referred to herein as the Investment Advisers. The Board, assisted by the advice of fund counsel and Independent Trustees' counsel, requests and considers a broad range of information relevant to the renewal of the Advisory Contracts throughout the year.
The Board meets regularly and, at each of its meetings, covers an extensive agenda of topics and materials and considers factors that are relevant to its annual consideration of the renewal of the fund's Advisory Contracts, including the services and support provided to the fund and its shareholders. The Board has established various standing committees (Committees), each composed of and chaired by Independent Trustees with varying backgrounds, to which the Board has assigned specific subject matter responsibilities in order to enhance effective decision-making by the Board. The Board, acting directly and through its Committees, requests and receives information concerning the annual consideration of the renewal of the fund's Advisory Contracts. The Board also meets as needed to review matters specifically related to the Board's annual consideration of the renewal of the Advisory Contracts. Members of the Board may also meet with trustees of other Fidelity funds through ad hoc joint committees to discuss certain matters relevant to all of the Fidelity funds.
At its July 2017 meeting, the Board unanimously determined to renew the fund's Advisory Contracts. In reaching its determination, the Board considered all factors it believed relevant, including (i) the nature, extent, and quality of the services to be provided to the fund and its shareholders (including the investment performance of the fund); (ii) the competitiveness of the fund's management fee and total expense ratio relative to peer funds; (iii) the total costs of the services to be provided by and the profits to be realized by Fidelity from its relationships with the fund; and (iv) the extent to which, if any, economies of scale exist and would be realized as the fund grows, and whether any economies of scale are appropriately shared with fund shareholders.
In considering whether to renew the Advisory Contracts for the fund, the Board reached a determination, with the assistance of fund counsel and Independent Trustees' counsel and through the exercise of its business judgment, that the renewal of the Advisory Contracts was in the best interests of the fund and its shareholders and that the compensation payable under the Advisory Contracts was fair and reasonable. The Board's decision to renew the Advisory Contracts was not based on any single factor, but rather was based on a comprehensive consideration of all the information provided to the Board at its meetings throughout the year. The Board, in reaching its determination to renew the Advisory Contracts, was aware that shareholders of the fund have a broad range of investment choices available to them, including a wide choice among funds offered by Fidelity's competitors, and that the fund's shareholders, who have the opportunity to review and weigh the disclosure provided by the fund in its prospectus and other public disclosures, have chosen to invest in this fund, which is part of the Fidelity family of funds.
Amendment to Group Fee Rate. The Board also approved an amendment to the management contract for the fund to add an additional breakpoint to the group fee schedule, effective October 1, 2017. The Board noted that the additional breakpoint would result in lower management fee rates as Fidelity's assets under management increase.
Nature, Extent, and Quality of Services Provided. The Board considered Fidelity's staffing as it relates to the fund, including the backgrounds of investment personnel of Fidelity, and also considered the fund's investment objective, strategies, and related investment philosophy. The Independent Trustees also had discussions with senior management of Fidelity's investment operations and investment groups. The Board considered the structure of the investment personnel compensation program and whether this structure provides appropriate incentives to act in the best interests of the fund. Additionally, the Board considered the portfolio managers' investments, if any, in the funds that they manage.
Resources Dedicated to Investment Management and Support Services. The Board and the Fund Oversight and Research Committees reviewed the general qualifications and capabilities of Fidelity's investment staff, including its size, education, experience, and resources, as well as Fidelity's approach to recruiting, training, managing, and compensating investment personnel. The Board noted that Fidelity has continued to increase the resources devoted to non-U.S. offices, including expansion of Fidelity's global investment organization. The Board also noted that Fidelity's analysts have extensive resources, tools and capabilities that allow them to conduct sophisticated quantitative and fundamental analysis, as well as credit analysis of issuers, counterparties and guarantors. Further, the Board considered that Fidelity's investment professionals have sufficient access to global information and data so as to provide competitive investment results over time, and that those professionals also have access to sophisticated tools that permit them to assess portfolio construction and risk and performance attribution characteristics continuously, as well as to transmit new information and research conclusions rapidly around the world. Additionally, in its deliberations, the Board considered Fidelity's trading, risk management, compliance, and technology and operations capabilities and resources, which are integral parts of the investment management process.
Shareholder and Administrative Services. The Board considered (i) the nature, extent, quality, and cost of advisory, administrative, and shareholder services performed by the Investment Advisers and their affiliates under the Advisory Contracts and under separate agreements covering transfer agency, pricing and bookkeeping, and securities lending services for the fund; (ii) the nature and extent of the supervision of third party service providers, principally custodians, subcustodians, and pricing vendors; and (iii) the resources devoted to, and the record of compliance with, the fund's compliance policies and procedures. The Board also reviewed the allocation of fund brokerage, including allocations to brokers affiliated with the Investment Advisers, the use of brokerage commissions to pay fund expenses, and the use of "soft" commission dollars to pay for research services.
The Board noted that the growth of fund assets over time across the complex allows Fidelity to reinvest in the development of services designed to enhance the value or convenience of the Fidelity funds as investment vehicles. These services include 24-hour access to account information and market information through telephone representatives and over the Internet, investor education materials and asset allocation tools, and the expanded availability of Fidelity Investor Centers.
In 2014, the Board formed an ad hoc Committee on Transfer Agency Fees to review the variety of transfer agency fee structures throughout the industry and Fidelity's competitive positioning with respect to industry participants.
Investment in a Large Fund Family. The Board considered the benefits to shareholders of investing in a Fidelity fund, including the benefits of investing in a fund that is part of a large family of funds offering a variety of investment disciplines and providing a large variety of mutual fund investor services. The Board noted that Fidelity had taken, or had made recommendations that resulted in the Fidelity funds taking, a number of actions over the previous year that benefited particular funds, including: (i) continuing to dedicate additional resources to Fidelity's investment research process, and to the support of the senior management team that oversees asset management; (ii) continuing efforts to enhance Fidelity's global research capabilities; (iii) launching new funds and making other enhancements to meet client needs; (iv) launching new share classes of existing funds; (v) eliminating purchase minimums and broadening eligibility requirements for certain lower-priced share classes; (vi) reducing management fees and total expenses for certain growth equity funds and index funds; (vii) lowering expense caps for certain existing funds and classes to reduce expenses borne by shareholders; (viii) eliminating short-term redemption fees for certain funds; (ix) introducing a new pricing structure for certain funds of funds that is expected to reduce overall expenses paid by shareholders; (x) rationalizing product lines and gaining increased efficiencies through proposals for fund mergers and share class consolidations; (xi) continuing to develop, acquire and implement systems and technology to improve services to the funds and shareholders, strengthen information security, and increase efficiency; and (xii) implementing enhancements to further strengthen Fidelity's product line to increase investors' probability of success in achieving their investment goals, including retirement income goals.
Investment Performance. The Board considered whether the fund has operated in accordance with its investment objective, as well as its record of compliance with its investment restrictions and its performance history.
The Board took into account discussions with representatives of the Investment Advisers about fund investment performance that occur at Board meetings throughout the year. In this regard the Board noted that as part of regularly scheduled fund reviews and other reports to the Board on fund performance, the Board considers annualized return information for the fund for different time periods, measured against a securities market index ("benchmark index") and a peer group of funds with similar objectives ("peer group"), if any. In its evaluation of fund investment performance, the Board gave particular attention to information indicating changes in performance of certain Fidelity funds for specific time periods and discussed with the Investment Advisers the reasons for any overperformance or underperformance.
In addition to reviewing absolute and relative fund performance, the Independent Trustees periodically consider the appropriateness of fund performance metrics in evaluating the results achieved. In general, the Independent Trustees believe that fund performance should be evaluated based on net performance (after fees and expenses) of both the highest performing and lowest performing fund share classes, where applicable, compared to appropriate benchmark indices, over appropriate time periods that may include full market cycles, and compared to peer groups, as applicable, over the same periods, taking into account relevant factors including the following: general market conditions; issuer-specific information; and fund cash flows and other factors.
The Independent Trustees recognize that shareholders evaluate performance on a net basis over their own holding periods, for which one-, three-, and five-year periods are often used as a proxy. For this reason, the performance information reviewed by the Board also included net cumulative calendar year total return information for the fund and an appropriate benchmark index and peer group for the most recentone-, three-, and five-year periods, as shown below. Returns are shown compared to the 25th percentile (top of box, 75% beaten) and 75th percentile (bottom of box, 25% beaten) of the peer universe. Returns of the benchmark index are "net MA,"
i.e., adjusted for tax withholding rates applicable to U.S.-based funds organized as Massachusetts business trusts.
VIP Overseas Portfolio
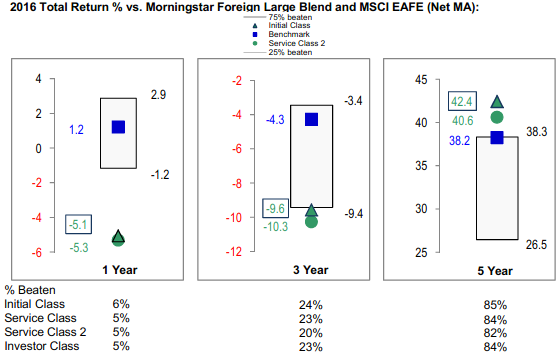
The Board has discussed the fund's underperformance (based on the December 31, 2016 data presented herein) with FMR, including the fund's investment strategy, the portfolio management team, and broader trends in the market that may have impacted the fund's performance, and has engaged with FMR to consider what steps might be taken to remediate the fund's underperformance. The Board noted that the fund's performance has improved since the period shown. The Board noted that there was a portfolio management change for the fund in December 2016.
Based on its review, the Board concluded that the nature, extent, and quality of services provided to the fund under the Advisory Contracts should continue to benefit the shareholders of the fund.
Competitiveness of Management Fee and Total Expense Ratio. The Board considered the fund's management fee and total expense ratio compared to "mapped groups" of competitive funds and classes created for the purpose of facilitating the Trustees' competitive analysis of management fees and total expenses. Fidelity creates "mapped groups" by combining similar Lipper investment objective categories that have comparable investment mandates. Combining Lipper investment objective categories aids the Board's management fee and total expense ratio comparisons by broadening the competitive group used for comparison.
Management Fee. The Board considered two proprietary management fee comparisons for the 12-month periods shown in basis points (BP) in the chart below. The group of Lipper funds used by the Board for management fee comparisons is referred to below as the "Total Mapped Group." The Total Mapped Group comparison focuses on a fund's standing in terms of gross management fees before expense reimbursements or caps relative to the total universe of funds with comparable investment mandates, regardless of whether their management fee structures also are comparable. Funds with comparable investment mandates offer exposure to similar types of securities. Funds with comparable management fee structures have similar management fee contractual arrangements (
e.g., flat rate charged for advisory services, all-inclusive fee rate,
etc.). "TMG %" represents the percentage of funds in the Total Mapped Group that had management fees that were lower than the fund's. For example, a hypothetical TMG % of 20% would mean that 80% of the funds in the Total Mapped Group had higher, and 20% had lower, management fees than the fund. The fund's actual TMG %s and the number of funds in the Total Mapped Group are in the chart below. The "Asset-Size Peer Group" (ASPG) comparison focuses on a fund's standing relative to a subset of non-Fidelity funds within the Total Mapped Group that are similar in size and management fee structure. For example, if a fund is in the first quartile of the ASPG, the fund's management fee ranks in the least expensive or lowest 25% of funds in the ASPG. The ASPG represents at least 15% of the funds in the Total Mapped Group with comparable asset size and management fee structures, subject to a minimum of 50 funds (or all funds in the Total Mapped Group if fewer than 50). Additional information, such as the ASPG quartile in which the fund's management fee rate ranked, is also included in the chart and considered by the Board.
VIP Overseas Portfolio
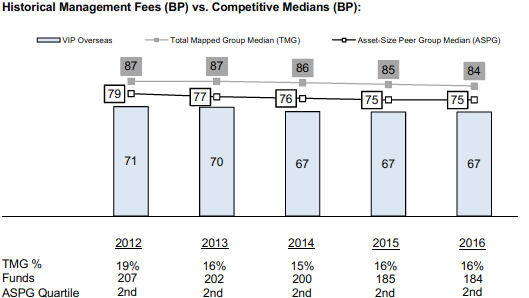
The Board noted that the fund's management fee rate ranked below the median of its Total Mapped Group and below the median of its ASPG for 2016.
Furthermore, the Board considered that it had approved a reduction (effective August 1, 2014) in the individual fund fee rate component of the management fee rate for the fund from 0.450% to 0.424%. The Board considered that the chart reflects the fund's lower management fee rate for 2014, as if the lower fee rate were in effect for the entire year.
The Board noted that, in 2014, the Board and the boards of other Fidelity funds formed the ad hoc Committee on Group Fee to conduct an in-depth review of the "group fee" component of the management fee of funds with such management fee structures. The Committee's focus included the mechanics of the group fee, the competitive landscape of group fee structures, Fidelity funds with no group fee component and investment products not included in group fee assets. The Board also considered that, for funds subject to the group fee, FMR agreed to voluntarily waive fees over a specified period of time in amounts designed to account for assets converted from certain funds to certain collective investment trusts.
The Board also noted that, in 2013, the ad hoc Committee on Management Fees was formed to conduct an in-depth review of the management fee rates of Fidelity's active equity mutual funds. The Committee focused on the following areas: (i) standard fee structures; (ii) research consumption and trading evolution; (iii) management fee competitiveness/profitability by category; and (iv) factors that drive institutional pricing.
Based on its review, the Board concluded that the fund's management fee is fair and reasonable in light of the services that the fund receives and the other factors considered.
Total Expense Ratio. In its review of each class's total expense ratio, the Board considered the fund's management fee rate as well as other fund or class expenses, as applicable, such as transfer agent fees, pricing and bookkeeping fees, fund-paid 12b-1 fees, and custodial, legal, and audit fees. The Board also noted that Fidelity may agree to waive fees and expenses from time to time, and the extent to which, if any, it has done so for the fund. As part of its review, the Board also considered the current and historical total expense ratios of each class of the fund compared to competitive fund median expenses. Each class of the fund is compared to those funds and classes in the Total Mapped Group (used by the Board for management fee comparisons) that have a similar sales load structure.
The Board noted that the total expense ratio of each of Initial Class, Investor Class, and Service Class ranked below the competitive median for 2016 and the total expense ratio of Service Class 2 ranked equal to the competitive median for 2016.
Fees Charged to Other Fidelity Clients. The Board also considered Fidelity fee structures and other information with respect to clients of Fidelity, such as other funds advised or subadvised by Fidelity, pension plan clients, and other institutional clients with similar mandates. The Board noted that an ad hoc joint committee created by it and the boards of other Fidelity funds periodically (most recently in 2013) reviews and compares Fidelity's institutional investment advisory business with its business of providing services to the Fidelity funds, including the differences in services provided, fees charged, and costs incurred, as well as competition in their respective marketplaces.
Based on its review of total expense ratios and fees charged to other Fidelity clients, the Board concluded that the total expense ratio of each class of the fund was reasonable in light of the services that the fund and its shareholders receive and the other factors considered.
Costs of the Services and Profitability. The Board considered the revenues earned and the expenses incurred by Fidelity in conducting the business of developing, marketing, distributing, managing, administering and servicing the fund and servicing the fund's shareholders. The Board also considered the level of Fidelity's profits in respect of all the Fidelity funds.
On an annual basis, Fidelity presents to the Board information about the profitability of its relationships with the fund. Fidelity calculates profitability information for each fund, as well as aggregate profitability information for groups of Fidelity funds and all Fidelity funds, using a series of detailed revenue and cost allocation methodologies which originate with the books and records of Fidelity on which Fidelity's audited financial statements are based. The Audit Committee of the Board reviews any significant changes from the prior year's methodologies.
PricewaterhouseCoopers LLP (PwC), independent registered public accounting firm and auditor to Fidelity and certain Fidelity funds, has been engaged annually by the Board as part of the Board's assessment of Fidelity's profitability analysis. PwC's engagement includes the review and assessment of the methodologies used by Fidelity in determining the revenues and expenses attributable to Fidelity's mutual fund business, and completion of agreed-upon procedures in respect of the mathematical accuracy of the fund profitability information and its conformity to established allocation methodologies. After considering PwC's reports issued under the engagement and information provided by Fidelity, the Board concluded that while other allocation methods may also be reasonable, Fidelity's profitability methodologies are reasonable in all material respects.
The Board also reviewed Fidelity's non-fund businesses and potential fall-out benefits related to the mutual fund business as well as cases where Fidelity's affiliates may benefit from or be related to the fund's business.
The Board considered the costs of the services provided by and the profits realized by Fidelity in connection with the operation of the fund and was satisfied that the profitability was not excessive.
Economies of Scale. The Board considered whether there have been economies of scale in respect of the management of the Fidelity funds, whether the Fidelity funds (including the fund) have appropriately benefited from any such economies of scale, and whether there is potential for realization of any further economies of scale. The Board considered the extent to which the fund will benefit from economies of scale as assets grow through increased services to the fund, through waivers or reimbursements, or through fee or expense ratio reductions. The Board also noted that a committee (the Economies of Scale Committee) created by it and the boards of other Fidelity funds periodically (most recently in 2013) analyzes whether Fidelity attains economies of scale in respect of the management and servicing of the Fidelity funds, whether the Fidelity funds have appropriately benefited from such economies of scale, and whether there is potential for realization of any further economies of scale.
The Board recognized that the fund's management contract incorporates a "group fee" structure, which provides for lower group fee rates as total group assets increase, and for higher group fee rates as total group assets decrease (with "group assets" defined to include fund assets under FMR's management plus the assets of sector funds previously under FMR's management). FMR calculates the group fee rates based on a tiered asset "breakpoint" schedule that varies based on asset class. The Board considered that the group fee is designed to deliver the benefits of economies of scale to fund shareholders when total Fidelity fund assets increase, even if assets of any particular fund are unchanged or have declined, because some portion of Fidelity's costs are attributable to services provided to all Fidelity funds, and all funds benefit if those costs can be allocated among more assets. The Board concluded that, given the group fee structure, fund shareholders will benefit from lower management fees as group assets increase at the fund complex level, regardless of whether Fidelity achieves any such economies of scale.
The Board concluded, taking into account the analysis of the Economies of Scale Committee, that economies of scale, if any, are being appropriately shared between fund shareholders and Fidelity.
Additional Information Requested by the Board. In order to develop fully the factual basis for consideration of the Fidelity funds' advisory contracts, the Board requested and received additional information on certain topics, including: (i) fund performance trends, in particular the underperformance of certain funds, and Fidelity's long-term strategies for certain funds; (ii) Fidelity's fund profitability methodology, profitability trends for certain funds, and the impact of certain factors on fund profitability results, including the impact of market trends on actively managed funds; (iii) the use of performance fees and the calculation of performance adjustments, including the impact of underperformance and fund outflows on performance adjustments; (iv) metrics for evaluating index fund performance; (v) Fidelity's group fee structure, including the group fee breakpoint schedules; (vi) the terms of Fidelity's contractual and voluntary expense cap arrangements with the funds; (vii) the methodology with respect to evaluating competitive fund data and peer group classifications and fee comparisons; (viii) the expense structures for different funds and classes; (ix) Fidelity's arrangements with affiliated sub-advisers on behalf of the funds; (x) information regarding other accounts managed by Fidelity, including institutional accounts and collective investment trusts; (xi) recent changes to the fee structure for certain funds of funds; and (xii) the impact of the Department of Labor's new fiduciary rule on the funds' comparative expense information.
Based on its evaluation of all of the conclusions noted above, and after considering all factors it believed relevant, the Board concluded that the advisory fee structures are fair and reasonable, and that the fund's Advisory Contracts should be renewed.
VIPOVRS-ANN-0218
1.540205.120
Item 2.
Code of Ethics
As of the end of the period, December 31, 2017, Variable Insurance Products Fund (the trust) has adopted a code of ethics, as defined in Item 2 of Form N-CSR,that applies to its President and Treasurer and its Chief Financial Officer. A copy of the code of ethics is filed as an exhibit to this Form N-CSR.
Item 3.
Audit Committee Financial Expert
The Board of Trustees of the trust has determined that Joseph Mauriello is an audit committee financial expert, as defined in Item 3 of Form N-CSR. Mr. Mauriello is independent for purposes of Item 3 of Form N-CSR.
Item 4.
Principal Accountant Fees and Services
Fees and Services
The following table presents fees billed by Deloitte & Touche LLP, the member firms of Deloitte Touche Tohmatsu, and their respective affiliates (collectively, “Deloitte Entities”) in each of the last two fiscal years for services rendered to VIP Value Portfolio (the “Fund”):
Services Billed by Deloitte Entities
December 31, 2017 FeesA
| | | | |
| Audit Fees | Audit-Related Fees | Tax Fees | All Other Fees |
VIP Value Portfolio | $45,000 | $100 | $8,200 | $1,300 |
December 31, 2016 FeesA,B
| | | | |
| Audit Fees | Audit-Related Fees | Tax Fees | All Other Fees |
VIP Value Portfolio | $60,000 | $100 | $8,300 | $1,400 |
A Amounts may reflect rounding.
B Certain amounts have been reclassified to align with current period presentation.
The following table presents fees billed by PricewaterhouseCoopers LLP (“PwC”) in each of the last two fiscal years for services rendered to VIP Equity-Income Portfolio, VIP Growth Portfolio, VIP High Income Portfolio and VIP Overseas Portfolio (the “Funds”):
Services Billed by PwC
December 31, 2017 FeesA
| | | | |
| Audit Fees | Audit-Related Fees | Tax Fees | All Other Fees |
VIP Equity-Income Portfolio | $67,000 | $6,000 | $7,000 | $2,900 |
VIP Growth Portfolio | $61,000 | $5,500 | $3,700 | $2,600 |
VIP High Income Portfolio | $89,000 | $8,000 | $3,500 | $3,800 |
VIP Overseas Portfolio | $64,000 | $6,000 | $5,700 | $2,900 |
December 31, 2016 FeesA,B
| | | | |
| Audit Fees | Audit-Related Fees | Tax Fees | All Other Fees |
VIP Equity-Income Portfolio | $72,000 | $6,800 | $6,900 | $3,200 |
VIP Growth Portfolio | $63,000 | $6,300 | $3,700 | $3,000 |
VIP High Income Portfolio | $89,000 | $9,200 | $5,100 | $4,300 |
VIP Overseas Portfolio | $64,000 | $6,900 | $5,700 | $3,200 |
A Amounts may reflect rounding.
B Certain amounts have been reclassified to align with current period presentation.
The following table presents fees billed by PwC and Deloitte Entities that were required to be approved by the Audit Committee for services that relate directly to the operations and financial reporting of the Funds and that are rendered on behalf of Fidelity Management & Research Company (“FMR”) and entities controlling, controlled by, or under common control with FMR (not including any sub-adviser whose role is primarily portfolio management and is subcontracted with or overseen by another investment adviser) that provide ongoing services to the Funds (“Fund Service Providers”):
Services Billed by Deloitte Entities
| | |
| December 31, 2017A | December 31, 2016A |
Audit-Related Fees | $- | $35,000 |
Tax Fees | $25,000 | $- |
All Other Fees | $- | $- |
A Amounts may reflect rounding.
Services Billed by PwC
| | |
| December 31, 2017A | December 31, 2016A |
Audit-Related Fees | $8,470,000 | $6,240,000 |
Tax Fees | $160,000 | $10,000 |
All Other Fees | $- | $- |
A Amounts may reflect rounding.
“Audit-Related Fees” represent fees billed for assurance and related services that are reasonably related to the performance of the fund audit or the review of the fund's financial statements and that are not reported under Audit Fees.
“Tax Fees” represent fees billed for tax compliance, tax advice or tax planning that relate directly to the operations and financial reporting of the fund.
“All Other Fees” represent fees billed for services provided to the fund or Fund Service Provider, a significant portion of which are assurance related, that relate directly to the operations and financial reporting of the fund, excluding those services that are reported under Audit Fees, Audit-Related Fees or Tax Fees.
Assurance services must be performed by an independent public accountant.
* * *
The aggregate non-audit fees billed by PwC and Deloitte Entities for services rendered to the Funds, FMR (not including any sub-adviser whose role is primarily portfolio management and is subcontracted with or overseen by another investment adviser), and any Fund Service Provider for each of the last two fiscal years of the Funds are as follows:
| | |
Billed By | December 31, 2017A | December 31, 2016A,B |
Deloitte Entities | $315,000 | $275,000 |
PwC | $10,775,000 | $7,700,000 |
A Amounts may reflect rounding.
B Certain amounts have been reclassified to align with current period presentation.
The trust's Audit Committee has considered non-audit services that were not pre-approved that were provided by PwC and Deloitte Entities to Fund Service Providers to be compatible with maintaining the independence of PwC and Deloitte Entities in their audits of the Funds, taking into account representations from PwC and Deloitte Entities, in accordance with Public Company Accounting Oversight Board rules, regarding their independence from the Funds and their related entities and FMR’s review of the
appropriateness and permissibility under applicable law of such non-audit services prior to their provision to the Fund Service Providers.
Audit Committee Pre-Approval Policies and Procedures
The trust’s Audit Committee must pre-approve all audit and non-audit services provided by a fund’s independent registered public accounting firm relating to the operations or financial reporting of the fund. Prior to the commencement of any audit or non-audit services to a fund, the Audit Committee reviews the services to determine whether they are appropriate and permissible under applicable law.
The Audit Committee has adopted policies and procedures to, among other purposes, provide a framework for the Committee’s consideration of non-audit services by the audit firms that audit the Fidelity funds. The policies and procedures require that any non-audit service provided by a fund audit firm to a Fidelity fund and any non-audit service provided by a fund auditor to a Fund Service Provider that relates directly to the operations and financial reporting of a Fidelity fund (“Covered Service”) are subject to approval by the Audit Committee before such service is provided.
All Covered Services must be approved in advance of provision of the service either: (i) by formal resolution of the Audit Committee, or (ii) by oral or written approval of the service by the Chair of the Audit Committee (or if the Chair is unavailable, such other member of the Audit Committee as may be designated by the Chair to act in the Chair’s absence). The approval contemplated by (ii) above is permitted where the Treasurer determines that action on such an engagement is necessary before the next meeting of the Audit Committee.
Non-audit services provided by a fund audit firm to a Fund Service Provider that do not relate directly to the operations and financial reporting of a Fidelity fund are reported to the Audit Committee on a periodic basis.
Non-Audit Services Approved Pursuant to Rule 2-01(c)(7)(i)(C) and (ii) of Regulation S-X (“De Minimis Exception”)
There were no non-audit services approved or required to be approved by the Audit Committee pursuant to the De Minimis Exception during the Funds’ last two fiscal years relating to services provided to (i) the Funds or (ii) any Fund Service Provider that relate directly to the operations and financial reporting of the Funds.
Item 5.
Audit Committee of Listed Registrants
Not applicable.
Item 6.
Investments
(a)
Not applicable.
(b)
Not applicable
Item 7.
Disclosure of Proxy Voting Policies and Procedures for Closed-End Management Investment Companies
Not applicable.
Item 8.
Portfolio Managers of Closed-End Management Investment Companies
Not applicable.
Item 9.
Purchase of Equity Securities by Closed-End Management Investment Company and Affiliated Purchasers
Not applicable.
Item 10.
Submission of Matters to a Vote of Security Holders
There were no material changes to the procedures by which shareholders may recommend nominees to the trust’s Board of Trustees.
Item 11.
Controls and Procedures
(a)(i) The President and Treasurer and the Chief Financial Officer have concluded that the trust’s disclosure controls and procedures (as defined in Rule 30a-3(c) under the Investment Company Act) provide reasonable assurances that material information relating to the trust is made known to them by the appropriate persons, based on their evaluation of these controls and procedures as of a date within 90 days of the filing date of this report.
(a)(ii) There was no change in the trust’s internal control over financial reporting (as defined in Rule 30a-3(d) under the Investment Company Act) that occurred during the second fiscal quarter of the period covered by this report that has materially affected, or is reasonably likely to materially affect, the trust’s internal control over financial reporting.
Item 12.
Exhibits
| | |
(a) | (1) | Code of Ethics pursuant to Item 2 of Form N-CSR is filed and attached hereto as EX-99.CODE ETH. |
(a) | (2) | Certification pursuant to Rule 30a-2(a) under the Investment Company Act of 1940 (17 CFR 270.30a-2(a)) is filed and attached hereto as Exhibit 99.CERT. |
(a) | (3) | Not applicable. |
(b) | | Certification pursuant to Rule 30a-2(b) under the Investment Company Act of 1940 (17 CFR 270.30a-2(b)) is furnished and attached hereto as Exhibit 99.906CERT. |
SIGNATURES
Pursuant to the requirements of the Securities Exchange Act of 1934 and the Investment Company Act of 1940, the registrant has duly caused this report to be signed on its behalf by the undersigned, thereunto duly authorized.
Variable Insurance Products Fund
| |
By: | /s/Stacie M. Smith |
| Stacie M. Smith |
| President and Treasurer |
| |
Date: | February 22, 2018 |
Pursuant to the requirements of the Securities Exchange Act of 1934 and the Investment Company Act of 1940, this report has been signed below by the following persons on behalf of the registrant and in the capacities and on the dates indicated.
| |
By: | /s/ Stacie M. Smith |
| Stacie M. Smith |
| President and Treasurer |
| |
Date: | February 22, 2018 |
| |
By: | /s/Howard J. Galligan III |
| Howard J. Galligan III |
| Chief Financial Officer |
| |
Date: | February 22, 2018 |