UNITED STATES
SECURITIES AND EXCHANGE COMMISSION
Washington, D.C. 20549
FORM N-CSR
CERTIFIED SHAREHOLDER REPORT OF REGISTERED
MANAGEMENT INVESTMENT COMPANIES
Investment Company Act file number 811-3329
Variable Insurance Products Fund
(Exact name of registrant as specified in charter)
82 Devonshire St., Boston, Massachusetts 02109
(Address of principal executive offices) (Zip code)
Eric D. Roiter, Secretary
82 Devonshire St.
Boston, Massachusetts 02109
(Name and address of agent for service)
Registrant's telephone number, including area code: 617-563-7000
Date of fiscal year end: | December 31 |
| |
Date of reporting period: | December 31, 2006 |
Item 1. Reports to Stockholders
Fidelity® Variable Insurance Products:
Equity-Income Portfolio
Annual Report
December 31, 2006
(2_fidelity_logos) (Registered_Trademark)
Contents
Performance | <Click Here> | How the fund has done over time. |
Management's Discussion | <Click Here> | The manager's review of fund performance, strategy and outlook. |
Shareholder Expense Example | <Click Here> | An example of shareholder expenses. |
Investment Changes | <Click Here> | A summary of major shifts in the fund's investments over the past six months. |
Investments | <Click Here> | A complete list of the fund's investments with their market values. |
Financial Statements | <Click Here> | Statements of assets and liabilities, operations, and changes in net assets, as well as financial highlights. |
Notes | <Click Here> | Notes to the financial statements. |
Report of Independent Registered Public Accounting Firm | <Click Here> | |
Trustees and Officers | <Click Here> | |
Distributions | <Click Here> | |
Proxy Voting Results | <Click Here> | |
Board Approval of Investment Advisory Contracts and Management Fees | <Click Here> | |
To view a fund's proxy voting guidelines and proxy voting record for the 12-month period ended June 30, visit www.fidelity.com/proxyvotingresults or visit the Securities and Exchange Commission's (SEC) web site at www.sec.gov. You may also call 1-877-208-0098 to request a free copy of the proxy voting guidelines.
Fidelity Variable Insurance Products are separate account options which are purchased through a variable insurance contract.
Standard & Poor's, S&P and S&P 500 are registered service marks of The McGraw-Hill Companies, Inc. and have been licensed for use by Fidelity Distributors Corporation.
Other third party marks appearing herein are the property of their respective owners.
All other marks appearing herein are registered or unregistered trademarks or service marks of FMR Corp. or an affiliated company.
This report and the financial statements contained herein are submitted for the general information of the shareholders of the fund. This report is not authorized for distribution to prospective investors in the fund unless preceded or accompanied by an effective prospectus.
A fund files its complete schedule of portfolio holdings with the SEC for the first and third quarters of each fiscal year on Form N-Q. Forms N-Q are available on the SEC's web site at http://www.sec.gov. A fund's Forms N-Q may be reviewed and copied at the SEC's Public Reference Room in Washington, DC. Information regarding the operation of the SEC's Public Reference Room may be obtained by calling 1-800-SEC-0330. For a complete list of a fund's portfolio holdings, view the most recent quarterly holdings report, semiannual report, or annual report on Fidelity's web site at http://www.advisor.fidelity.com.
NOT FDIC INSURED · MAY LOSE VALUE · NO BANK GUARANTEE
Neither the fund nor Fidelity Distributors Corporation is a bank.
VIP Equity-Income Portfolio
VIP Equity-Income Portfolio
Performance: The Bottom Line
Average annual total return reflects the change in the value of an investment, assuming reinvestment of a class' dividend income and capital gains (the profits earned upon the sale of securities that have grown in value) and assuming a constant rate of performance each year. During periods of reimbursement by Fidelity, a fund's total return will be greater than it would be had the reimbursement not occurred. Performance numbers are net of all underlying fund operating expenses, but do not include any insurance charges imposed by your insurance company's separate account. If performance information included the effect of these additional charges, the total returns would have been lower. How a fund did yesterday is no guarantee of how it will do tomorrow.
Average Annual Total Returns
Periods ended December 31, 2006 | Past 1
year | Past 5
years | Past 10
years |
VIP Equity-Income - Initial Class | 20.19% | 8.96% | 9.18% |
VIP Equity-Income - Service Class A | 20.08% | 8.86% | 9.08% |
VIP Equity-Income - Service Class 2 B | 19.93% | 8.69% | 8.96% |
VIP Equity-Income - Investor Class C | 20.04% | 8.93% | 9.16% |
A The initial offering of Service Class shares took place on November 3, 1997. Performance for Service Class shares reflects an asset-based distribution fee (12b-1 fee), and returns prior to November 3, 1997 are those of Initial Class and do not include the effects of Service Class' 12b-1 fee. Had Service Class' 12b-1 fee been reflected, returns prior to November 3, 1997 would have been lower.
B The initial offering of Service Class 2 shares took place on January 12, 2000. Performance for Service Class 2 shares reflects an asset-based distribution fee (12b-1 fee). Returns from November 3, 1997 to January 12, 2000 are those of Service Class which reflect a different 12b-1 fee. Service Class 2 returns prior to November 3, 1997 are those of Initial Class, and do not include the effects of a 12b-1 fee. Had Service Class 2 shares' 12b-1 fee been reflected, returns prior to January 12, 2000 would have been lower.
C The initial offering of Investor Class shares took place on July 21, 2005. Returns prior to July 21, 2005 are those of Initial Class. If Investor Class's transfer agent fee had been reflected, returns prior to July 21, 2005 would have been lower.
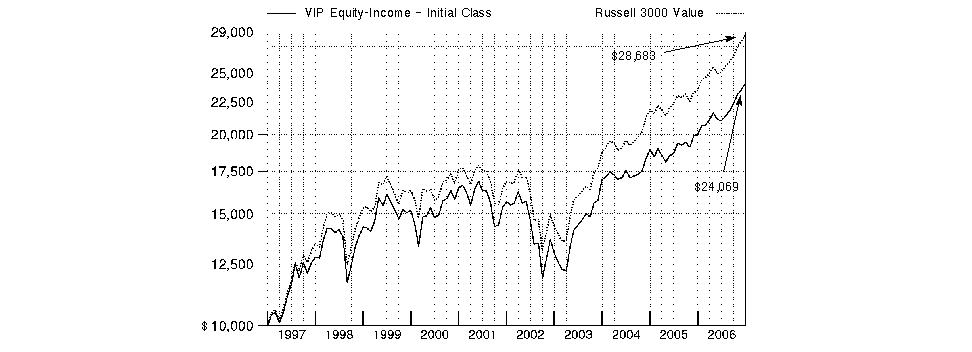
$10,000 Over 10 Years
Let's say hypothetically that $10,000 was invested in VIP Equity-Income Portfolio - Initial Class on December 31, 1996. The chart shows how the value of your investment would have changed, and also shows how the Russell 3000® Value Index performed over the same period.
Annual Report
VIP Equity-Income Portfolio
Management's Discussion of Fund Performance
Comments from Stephen Petersen, Portfolio Manager of VIP Equity-Income Portfolio
U.S. stock markets registered their fourth consecutive year of positive returns in 2006. Among the highlights were the performances of the Dow Jones Industrial AverageSM - a gauge of 30 mega-cap, blue-chip stocks - and the small-cap-oriented Russell 2000® Index, both of which reached new highs. The efforts of the Federal Reserve Board to contain inflation levels also dominated the investment headlines. In all, the Fed hiked short-term interest rates four times, but held rates steady after its June 29 increase, finally pausing after 17 rate hikes over a two-year period. A slowing residential housing market and moderating oil prices - the latter of which hit a record closing high of $77 per barrel in July before falling sharply - also held economic growth in check. For the year overall, the Standard & Poor's 500SM Index was up 15.79%, the Dow advanced 19.05%, the Russell 2000 Index gained 18.37% and the NASDAQ Composite® Index rose 10.39%.
For the 12 months ending December 31, 2006, the fund underperformed the Russell 3000® Value Index, which returned 22.34%. (For specific portfolio performance results, please refer to the performance section of this report.) The fund's large-cap orientation relative to the index helped performance, but not enough to offset weak stock picks in industrials, materials, technology and consumer staples. However, the fund trailed the Russell index only modestly, as its focus on high-quality companies and good picks in banks, consumer discretionary and the exceptionally strong telecommunication services sector helped results. Detractors from performance included semiconductor giant Intel, which lost market share to Advanced Micro Devices in the server-based microprocessor market. Wal-Mart's disappointing operating results and sluggish sales growth caused its stock performance to lag. Contributors included telecommunications company BellSouth, which benefited from the announcement that it would be acquired by AT&T. Strong growth in defense spending helped aerospace/defense company Lockheed Martin produce better-than-expected revenues and earnings results.
The views expressed above reflect those of the portfolio manager(s) only through the end of the period as stated on the cover of this report and do not necessarily represent the views of Fidelity or any other person in the Fidelity organization. Any such views are subject to change at any time based upon market or other conditions and Fidelity disclaims any responsibility to update such views. These views may not be relied on as investment advice and, because investment decisions for a Fidelity fund are based on numerous factors, may not be relied on as an indication of trading intent on behalf of any Fidelity fund.
VIP Equity-Income Portfolio
VIP Equity-Income Portfolio
Shareholder Expense Example
As a shareholder of the Fund, you incur two types of costs: (1) transaction costs, including redemption fees, and (2) ongoing costs, including management fees, distribution and/or service (12b-1) fees and other Fund expenses. This Example is intended to help you understand your ongoing costs (in dollars) of investing in the Fund and to compare these costs with the ongoing costs of investing in other mutual funds.
The Example is based on an investment of $1,000 invested at the beginning of the period and held for the entire period (July 1, 2006 to December 31, 2006).
Actual Expenses
The first line of the accompanying table for each class of the Fund provides information about actual account values and actual expenses. You may use the information in this line, together with the amount you invested, to estimate the expenses that you paid over the period. Simply divide your account value by $1,000.00 (for example, an $8,600 account value divided by $1,000.00 = 8.6), then multiply the result by the number in the first line for a class of the Fund under the heading entitled "Expenses Paid During Period" to estimate the expenses you paid on your account during this period. The estimate of expenses does not include any fees or other expenses of any variable annuity or variable life insurance product. If they were, the estimate of expenses you paid during the period would be higher, and your ending account value would be lower.
Hypothetical Example for Comparison Purposes
The second line of the accompanying table for each class of the Fund provides information about hypothetical account values and hypothetical expenses based on a Class' actual expense ratio and an assumed rate of return of 5% per year before expenses, which is not the Class' actual return. The hypothetical account values and expenses may not be used to estimate the actual ending account balance or expenses you paid for the period. You may use this information to compare the ongoing costs of investing in the Fund and other funds. To do so, compare this 5% hypothetical example with the 5% hypothetical examples that appear in the shareholder reports of the other funds. The estimate of expenses does not include any fees or other expenses of any variable annuity or variable life insurance product. If they were, the estimate of expenses you paid during the period would be higher, and your ending account value would be lower.
Please note that the expenses shown in the table are meant to highlight your ongoing costs only and do not reflect any transaction costs. Therefore, the second line of the table is useful in comparing ongoing costs only, and will not help you determine the relative total costs of owning different funds. In addition, if these transactional costs were included, your costs would have been higher.
| Beginning
Account Value
July 1, 2006 | Ending
Account Value
December 31, 2006 | Expenses Paid
During Period *
July 1, 2006 to
December 31, 2006 |
Initial Class | | | |
Actual | $ 1,000.00 | $ 1,143.40 | $ 3.13 |
Hypothetical A | $ 1,000.00 | $ 1,022.28 | $ 2.96 |
Service Class | | | |
Actual | $ 1,000.00 | $ 1,142.80 | $ 3.67 |
Hypothetical A | $ 1,000.00 | $ 1,021.78 | $ 3.47 |
Service Class 2 | | | |
Actual | $ 1,000.00 | $ 1,142.10 | $ 4.48 |
Hypothetical A | $ 1,000.00 | $ 1,021.02 | $ 4.23 |
Service Class 2R | | | |
Actual | $ 1,000.00 | $ 1,141.90 | $ 4.48 |
Hypothetical A | $ 1,000.00 | $ 1,021.02 | $ 4.23 |
Investor Class | | | |
Actual | $ 1,000.00 | $ 1,142.70 | $ 3.78 |
Hypothetical A | $ 1,000.00 | $ 1,021.68 | $ 3.57 |
A 5% return per year before expenses
* Expenses are equal to each Class' annualized expense ratio (shown in the table below); multiplied by the average account value over the period, multiplied by 184/365 (to reflect the one-half year period).
| Annualized
Expense Ratio |
Initial Class | .58% |
Service Class | .68% |
Service Class 2 | .83% |
Service Class 2R | .83% |
Investor Class | .70% |
Annual Report
VIP Equity-Income Portfolio
Investment Changes
Top Ten Stocks as of December 31, 2006 |
| % of fund's
net assets | % of fund's net assets
6 months ago |
Exxon Mobil Corp. | 5.4 | 4.1 |
Bank of America Corp. | 3.2 | 3.3 |
American International Group, Inc. | 2.7 | 2.5 |
Citigroup, Inc. | 2.6 | 2.6 |
JPMorgan Chase & Co. | 2.3 | 2.3 |
AT&T, Inc. | 2.2 | 1.9 |
Pfizer, Inc. | 1.8 | 1.3 |
BellSouth Corp. | 1.7 | 1.5 |
Wachovia Corp. | 1.5 | 1.5 |
General Electric Co. | 1.4 | 1.4 |
| 24.8 | |
Top Five Market Sectors as of December 31, 2006 |
| % of fund's
net assets | % of fund's net assets
6 months ago |
Financials | 28.8 | 27.8 |
Energy | 12.9 | 13.1 |
Consumer Discretionary | 12.0 | 12.1 |
Industrials | 9.7 | 11.3 |
Information Technology | 9.1 | 8.2 |
Asset Allocation (% of fund's net assets) |
As of December 31, 2006 * | As of June 30, 2006 * * |
 | Stocks 98.7% | | | Stocks 99.1% | |
 | Bonds 0.9% | | | Bonds 0.6% | |
 | Short-Term Investments
and Net Other Assets 0.4% | | | Short-Term Investments
and Net Other Assets 0.3% | |
* Foreign investments | 9.6% | | * * Foreign investments | 10.9% | |

VIP Equity-Income Portfolio
VIP Equity-Income Portfolio
Investments December 31, 2006
Showing Percentage of Net Assets
Common Stocks - 98.2% |
| Shares | | Value (Note 1) |
CONSUMER DISCRETIONARY - 11.4% |
Auto Components - 0.3% |
American Axle & Manufacturing Holdings, Inc. | 457,477 | | $ 8,687,488 |
Gentex Corp. | 595,400 | | 9,264,424 |
The Goodyear Tire & Rubber Co. (a)(d) | 758,100 | | 15,912,519 |
| | 33,864,431 |
Automobiles - 1.1% |
Hyundai Motor Co. | 205,150 | | 14,867,863 |
Monaco Coach Corp. | 318,231 | | 4,506,151 |
Peugeot Citroen SA | 288,500 | | 19,120,061 |
Renault SA | 163,901 | | 19,690,771 |
Toyota Motor Corp. sponsored ADR | 430,700 | | 57,847,317 |
Winnebago Industries, Inc. | 349,700 | | 11,508,627 |
| | 127,540,790 |
Diversified Consumer Services - 0.1% |
Service Corp. International | 1,723,300 | | 17,663,825 |
Hotels, Restaurants & Leisure - 0.4% |
Gaylord Entertainment Co. (a) | 373,365 | | 19,015,479 |
McDonald's Corp. | 373,000 | | 16,535,090 |
Wyndham Worldwide Corp. (a) | 341,002 | | 10,918,884 |
| | 46,469,453 |
Household Durables - 1.6% |
Beazer Homes USA, Inc. | 165,300 | | 7,770,753 |
Black & Decker Corp. | 41,100 | | 3,286,767 |
KB Home | 226,400 | | 11,609,792 |
Lennar Corp. Class A | 163,900 | | 8,598,194 |
Newell Rubbermaid, Inc. | 2,220,800 | | 64,292,160 |
Sony Corp. sponsored ADR | 453,200 | | 19,410,556 |
The Stanley Works | 327,730 | | 16,481,542 |
Whirlpool Corp. | 722,534 | | 59,984,773 |
| | 191,434,537 |
Internet & Catalog Retail - 0.2% |
Liberty Media Holding Corp. - Interactive Series A (a) | 899,869 | | 19,410,174 |
Leisure Equipment & Products - 0.3% |
Eastman Kodak Co. (d) | 1,464,000 | | 37,771,200 |
Media - 4.8% |
CBS Corp. Class B | 709,543 | | 22,123,551 |
Clear Channel Communications, Inc. | 2,782,300 | | 98,882,942 |
Comcast Corp. Class A | 1,982,691 | | 83,927,310 |
Gannett Co., Inc. | 327,700 | | 19,812,742 |
Idearc, Inc. (a) | 186,370 | | 5,339,501 |
McGraw-Hill Companies, Inc. | 41,500 | | 2,822,830 |
News Corp. Class A | 774,316 | | 16,632,308 |
NTL, Inc. | 812,888 | | 20,517,281 |
R.H. Donnelley Corp. | 148,800 | | 9,334,224 |
The McClatchy Co. Class A | 575,865 | | 24,934,955 |
The New York Times Co. Class A (d) | 1,133,025 | | 27,600,489 |
The Reader's Digest Association, Inc. (non-vtg.) | 1,481,965 | | 24,748,816 |
|
| Shares | | Value (Note 1) |
The Walt Disney Co. | 899,500 | | $ 30,825,865 |
Time Warner, Inc. | 5,602,750 | | 122,027,895 |
Viacom, Inc. Class B (non-vtg.) (a) | 1,638,343 | | 67,221,213 |
| | 576,751,922 |
Multiline Retail - 1.0% |
Dollar Tree Stores, Inc. (a) | 903,251 | | 27,187,861 |
Family Dollar Stores, Inc. | 1,072,100 | | 31,444,693 |
Federated Department Stores, Inc. | 1,100,800 | | 41,973,504 |
Sears Holdings Corp. (a) | 82,400 | | 13,837,432 |
Tuesday Morning Corp. | 343,584 | | 5,342,731 |
| | 119,786,221 |
Specialty Retail - 1.4% |
AnnTaylor Stores Corp. (a) | 288,391 | | 9,470,760 |
Chico's FAS, Inc. (a)(d) | 909,300 | | 18,813,417 |
Gap, Inc. | 188,300 | | 3,671,850 |
Home Depot, Inc. | 2,138,500 | | 85,882,160 |
OfficeMax, Inc. | 146,000 | | 7,248,900 |
RadioShack Corp. (d) | 2,096,700 | | 35,182,626 |
Tiffany & Co., Inc. | 351,700 | | 13,800,708 |
| | 174,070,421 |
Textiles, Apparel & Luxury Goods - 0.2% |
Liz Claiborne, Inc. | 553,040 | | 24,035,118 |
TOTAL CONSUMER DISCRETIONARY | | 1,368,798,092 |
CONSUMER STAPLES - 5.8% |
Beverages - 0.7% |
Anheuser-Busch Companies, Inc. (d) | 1,126,100 | | 55,404,120 |
SABMiller PLC | 1,130,100 | | 26,006,949 |
| | 81,411,069 |
Food & Staples Retailing - 1.5% |
CVS Corp. | 1,150,100 | | 35,549,591 |
Rite Aid Corp. | 2,365,468 | | 12,868,146 |
Wal-Mart Stores, Inc. | 2,849,600 | | 131,594,528 |
| | 180,012,265 |
Food Products - 0.5% |
Hershey Co. | 328,600 | | 16,364,280 |
Kraft Foods, Inc. Class A (d) | 643,600 | | 22,976,520 |
Tyson Foods, Inc. Class A | 1,214,500 | | 19,978,525 |
| | 59,319,325 |
Household Products - 1.2% |
Colgate-Palmolive Co. | 1,471,700 | | 96,013,708 |
Kimberly-Clark Corp. | 310,400 | | 21,091,680 |
Procter & Gamble Co. | 501,442 | | 32,227,677 |
| | 149,333,065 |
Personal Products - 0.7% |
Avon Products, Inc. | 2,575,570 | | 85,096,833 |
Common Stocks - continued |
| Shares | | Value (Note 1) |
CONSUMER STAPLES - continued |
Tobacco - 1.2% |
Altria Group, Inc. | 1,655,100 | | $ 142,040,682 |
TOTAL CONSUMER STAPLES | | 697,213,239 |
ENERGY - 12.9% |
Energy Equipment & Services - 2.6% |
Baker Hughes, Inc. | 1,364,100 | | 101,843,706 |
Halliburton Co. | 1,307,895 | | 40,610,140 |
Noble Corp. | 639,300 | | 48,682,695 |
Schlumberger Ltd. (NY Shares) | 1,901,757 | | 120,114,972 |
| | 311,251,513 |
Oil, Gas & Consumable Fuels - 10.3% |
Apache Corp. | 581,880 | | 38,700,839 |
BP PLC sponsored ADR | 616,742 | | 41,383,388 |
Chevron Corp. | 2,322,542 | | 170,776,513 |
ConocoPhillips | 1,348,900 | | 97,053,355 |
EOG Resources, Inc. | 524,900 | | 32,780,005 |
Exxon Mobil Corp. | 8,392,636 | | 643,127,696 |
Hess Corp. | 719,900 | | 35,685,443 |
Lukoil Oil Co. sponsored ADR | 266,100 | | 23,552,511 |
Occidental Petroleum Corp. | 831,200 | | 40,587,496 |
Total SA sponsored ADR | 1,031,733 | | 74,202,237 |
Valero Energy Corp. | 451,700 | | 23,108,972 |
Williams Companies, Inc. | 558,100 | | 14,577,572 |
| | 1,235,536,027 |
TOTAL ENERGY | | 1,546,787,540 |
FINANCIALS - 28.7% |
Capital Markets - 4.2% |
Ameriprise Financial, Inc. | 479,702 | | 26,143,759 |
Bank of New York Co., Inc. | 2,489,400 | | 98,007,678 |
KKR Private Equity Investors, LP | 652,400 | | 14,352,800 |
KKR Private Equity Investors, LP Restricted Depositary Units (e) | 708,100 | | 15,578,200 |
Mellon Financial Corp. | 1,271,600 | | 53,597,940 |
Merrill Lynch & Co., Inc. | 1,192,400 | | 111,012,440 |
Morgan Stanley | 1,750,400 | | 142,535,072 |
Nomura Holdings, Inc. | 935,000 | | 17,631,877 |
State Street Corp. | 462,153 | | 31,167,598 |
| | 510,027,364 |
Commercial Banks - 4.8% |
Barclays PLC Sponsored ADR (d) | 657,400 | | 38,221,236 |
HSBC Holdings PLC sponsored ADR (d) | 246,400 | | 22,582,560 |
KeyCorp | 728,500 | | 27,704,855 |
Lloyds TSB Group PLC | 2,118,800 | | 24,011,300 |
Marshall & Ilsley Corp. | 492,800 | | 23,708,608 |
|
| Shares | | Value (Note 1) |
PNC Financial Services Group, Inc. | 616,314 | | $ 45,631,889 |
Royal Bank of Scotland Group PLC | 592,888 | | 23,142,732 |
U.S. Bancorp, Delaware | 1,479,938 | | 53,558,956 |
Wachovia Corp. | 3,101,257 | | 176,616,586 |
Wells Fargo & Co. | 3,854,200 | | 137,055,352 |
| | 572,234,074 |
Consumer Finance - 0.5% |
American Express Co. | 634,796 | | 38,513,073 |
Capital One Financial Corp. | 226,400 | | 17,392,048 |
| | 55,905,121 |
Diversified Financial Services - 8.3% |
Bank of America Corp. | 7,175,177 | | 383,082,700 |
Citigroup, Inc. | 5,613,119 | | 312,650,728 |
FirstRand Ltd. | 7,037,125 | | 22,298,626 |
JPMorgan Chase & Co. (d) | 5,696,412 | | 275,136,700 |
| | 993,168,754 |
Insurance - 8.1% |
ACE Ltd. | 2,142,596 | | 129,777,040 |
AFLAC, Inc. | 143,600 | | 6,605,600 |
Allianz AG sponsored ADR | 1,071,900 | | 21,888,198 |
Allstate Corp. | 1,050,200 | | 68,378,522 |
American International Group, Inc. | 4,588,550 | | 328,815,493 |
Genworth Financial, Inc. Class A (non-vtg.) | 116,202 | | 3,975,270 |
Hartford Financial Services Group, Inc. | 890,900 | | 83,129,879 |
Marsh & McLennan Companies, Inc. | 881,907 | | 27,039,269 |
MetLife, Inc. unit | 835,300 | | 25,543,474 |
Montpelier Re Holdings Ltd. | 1,344,500 | | 25,021,145 |
PartnerRe Ltd. | 486,620 | | 34,564,619 |
Swiss Reinsurance Co. (Reg.) | 321,551 | | 27,328,999 |
The St. Paul Travelers Companies, Inc. | 2,274,726 | | 122,130,039 |
Willis Group Holdings Ltd. | 937,000 | | 37,208,270 |
XL Capital Ltd. Class A | 415,820 | | 29,947,356 |
| | 971,353,173 |
Real Estate Investment Trusts - 0.6% |
Developers Diversified Realty Corp. | 376,800 | | 23,719,560 |
Equity Office Properties Trust | 557,200 | | 26,840,324 |
Equity Residential (SBI) | 381,400 | | 19,356,050 |
| | 69,915,934 |
Thrifts & Mortgage Finance - 2.2% |
Countrywide Financial Corp. | 412,110 | | 17,494,070 |
Fannie Mae | 2,617,310 | | 155,442,041 |
Freddie Mac (d) | 1,148,000 | | 77,949,200 |
Sovereign Bancorp, Inc. | 516,251 | | 13,107,600 |
| | 263,992,911 |
TOTAL FINANCIALS | | 3,436,597,331 |
Common Stocks - continued |
| Shares | | Value (Note 1) |
HEALTH CARE - 7.0% |
Health Care Equipment & Supplies - 0.9% |
Baxter International, Inc. | 1,982,832 | | $ 91,983,576 |
Boston Scientific Corp. (a) | 842,357 | | 14,471,693 |
| | 106,455,269 |
Health Care Providers & Services - 0.3% |
Omnicare, Inc. | 266,100 | | 10,279,443 |
UnitedHealth Group, Inc. | 383,947 | | 20,629,472 |
| | 30,908,915 |
Pharmaceuticals - 5.8% |
Bristol-Myers Squibb Co. | 2,213,300 | | 58,254,056 |
Johnson & Johnson | 1,829,300 | | 120,770,386 |
Merck & Co., Inc. | 2,109,200 | | 91,961,120 |
Novartis AG sponsored ADR | 361,700 | | 20,776,048 |
Pfizer, Inc. | 8,398,200 | | 217,513,380 |
Schering-Plough Corp. | 3,284,630 | | 77,648,653 |
Wyeth | 2,169,100 | | 110,450,572 |
| | 697,374,215 |
TOTAL HEALTH CARE | | 834,738,399 |
INDUSTRIALS - 9.5% |
Aerospace & Defense - 2.1% |
General Dynamics Corp. | 297,700 | | 22,133,995 |
Honeywell International, Inc. | 2,504,425 | | 113,300,187 |
Lockheed Martin Corp. | 506,300 | | 46,615,041 |
The Boeing Co. | 177,300 | | 15,751,332 |
United Technologies Corp. | 844,540 | | 52,800,641 |
| | 250,601,196 |
Air Freight & Logistics - 0.1% |
United Parcel Service, Inc. Class B | 217,800 | | 16,330,644 |
Building Products - 0.3% |
Masco Corp. | 1,145,000 | | 34,201,150 |
Commercial Services & Supplies - 0.3% |
Waste Management, Inc. | 930,600 | | 34,218,162 |
Electrical Equipment - 0.4% |
Emerson Electric Co. | 997,400 | | 43,975,366 |
Industrial Conglomerates - 3.1% |
3M Co. | 654,700 | | 51,020,771 |
General Electric Co. | 4,634,090 | | 172,434,489 |
Siemens AG sponsored ADR | 20,500 | | 2,020,275 |
Textron, Inc. | 263,300 | | 24,689,641 |
Tyco International Ltd. | 4,253,346 | | 129,301,718 |
| | 379,466,894 |
Machinery - 2.3% |
Briggs & Stratton Corp. (d) | 958,688 | | 25,836,642 |
Caterpillar, Inc. | 485,500 | | 29,775,715 |
Deere & Co. | 156,100 | | 14,840,427 |
Dover Corp. | 1,141,900 | | 55,975,938 |
Eaton Corp. | 165,700 | | 12,450,698 |
|
| Shares | | Value (Note 1) |
Illinois Tool Works, Inc. | 337,300 | | $ 15,579,887 |
Ingersoll-Rand Co. Ltd. Class A | 883,888 | | 34,586,537 |
Navistar International Corp. (a) | 649,295 | | 21,705,932 |
SPX Corp. | 1,080,489 | | 66,082,707 |
| | 276,834,483 |
Road & Rail - 0.9% |
Burlington Northern Santa Fe Corp. | 930,400 | | 68,672,824 |
Hertz Global Holdings, Inc. | 307,900 | | 5,354,381 |
Laidlaw International, Inc. | 268,000 | | 8,155,240 |
Union Pacific Corp. | 287,100 | | 26,418,942 |
| | 108,601,387 |
TOTAL INDUSTRIALS | | 1,144,229,282 |
INFORMATION TECHNOLOGY - 9.1% |
Communications Equipment - 1.1% |
Alcatel-Lucent SA sponsored ADR | 1,280,488 | | 18,208,539 |
Cisco Systems, Inc. (a) | 2,508,000 | | 68,543,640 |
Lucent Technologies, Inc. warrants 12/10/07 (a) | 8,328 | | 2,582 |
Motorola, Inc. | 1,673,712 | | 34,411,519 |
Nortel Networks Corp. (a) | 308,740 | | 8,282,493 |
| | 129,448,773 |
Computers & Peripherals - 2.6% |
EMC Corp. (a)(d) | 3,040,100 | | 40,129,320 |
Hewlett-Packard Co. | 2,804,111 | | 115,501,332 |
Imation Corp. | 328,300 | | 15,242,969 |
International Business Machines Corp. | 1,280,500 | | 124,400,575 |
Sun Microsystems, Inc. (a) | 3,725,375 | | 20,191,533 |
| | 315,465,729 |
Electronic Equipment & Instruments - 1.0% |
Agilent Technologies, Inc. (a) | 912,800 | | 31,811,080 |
Arrow Electronics, Inc. (a) | 775,900 | | 24,479,645 |
Avnet, Inc. (a) | 1,566,330 | | 39,988,405 |
Solectron Corp. (a) | 5,630,400 | | 18,129,888 |
Tektronix, Inc. | 143,608 | | 4,189,045 |
| | 118,598,063 |
Internet Software & Services - 0.0% |
Google, Inc. Class A (sub. vtg.) (a) | 8,200 | | 3,775,936 |
IT Services - 0.3% |
MoneyGram International, Inc. | 912,900 | | 28,628,544 |
The Western Union Co. | 390,300 | | 8,750,526 |
| | 37,379,070 |
Office Electronics - 0.5% |
Xerox Corp. (a) | 3,896,635 | | 66,047,964 |
Semiconductors & Semiconductor Equipment - 2.4% |
Analog Devices, Inc. | 1,406,800 | | 46,241,516 |
Applied Materials, Inc. | 2,485,400 | | 45,855,630 |
Intel Corp. | 4,522,000 | | 91,570,500 |
Micron Technology, Inc. (a) | 1,589,200 | | 22,185,232 |
National Semiconductor Corp. | 1,558,747 | | 35,383,557 |
Common Stocks - continued |
| Shares | | Value (Note 1) |
INFORMATION TECHNOLOGY - continued |
Semiconductors & Semiconductor Equipment - continued |
Samsung Electronics Co. Ltd. | 28,040 | | $ 18,482,283 |
Spansion, Inc. Class A | 410,900 | | 6,105,974 |
Teradyne, Inc. (a) | 809,300 | | 12,107,128 |
Verigy Ltd. | 296,059 | | 5,255,047 |
| | 283,186,867 |
Software - 1.2% |
Autodesk, Inc. (a) | 144,000 | | 5,826,240 |
Microsoft Corp. | 3,073,500 | | 91,774,710 |
Oracle Corp. (a) | 731,200 | | 12,532,768 |
Symantec Corp. (a) | 1,496,133 | | 31,194,373 |
| | 141,328,091 |
TOTAL INFORMATION TECHNOLOGY | | 1,095,230,493 |
MATERIALS - 3.8% |
Chemicals - 2.0% |
Air Products & Chemicals, Inc. | 621,300 | | 43,664,964 |
Arkema (a) | 12,180 | | 625,996 |
Arkema sponsored ADR (a) | 234,455 | | 11,992,363 |
Ashland, Inc. | 172,200 | | 11,912,796 |
Bayer AG sponsored ADR | 270,700 | | 14,444,552 |
Celanese Corp. Class A | 672,400 | | 17,401,712 |
Chemtura Corp. | 2,044,164 | | 19,685,301 |
Dow Chemical Co. | 694,300 | | 27,730,342 |
E.I. du Pont de Nemours & Co. | 836,800 | | 40,760,528 |
Georgia Gulf Corp. | 759,800 | | 14,671,738 |
Lyondell Chemical Co. | 470,766 | | 12,037,474 |
PolyOne Corp. (a) | 1,126,200 | | 8,446,500 |
Rohm & Haas Co. | 166,256 | | 8,499,007 |
Tronox, Inc. Class B | 179,376 | | 2,832,347 |
| | 234,705,620 |
Containers & Packaging - 0.2% |
Smurfit-Stone Container Corp. (a) | 2,730,472 | | 28,833,784 |
Metals & Mining - 1.0% |
Alcan, Inc. | 601,700 | | 29,300,623 |
Alcoa, Inc. | 2,359,016 | | 70,794,070 |
Phelps Dodge Corp. | 188,000 | | 22,507,360 |
| | 122,602,053 |
Paper & Forest Products - 0.6% |
International Paper Co. | 1,105,400 | | 37,694,140 |
Weyerhaeuser Co. | 519,600 | | 36,709,740 |
| | 74,403,880 |
TOTAL MATERIALS | | 460,545,337 |
TELECOMMUNICATION SERVICES - 6.6% |
Diversified Telecommunication Services - 5.7% |
AT&T, Inc. (d) | 7,251,893 | | 259,255,175 |
|
| Shares | | Value (Note 1) |
BellSouth Corp. | 4,402,699 | | $ 207,411,150 |
Qwest Communications International, Inc. (a) | 5,870,900 | | 49,139,433 |
Telkom SA Ltd. sponsored ADR (d) | 329,475 | | 26,713,833 |
Verizon Communications, Inc. | 3,727,402 | | 138,808,450 |
| | 681,328,041 |
Wireless Telecommunication Services - 0.9% |
MTN Group Ltd. | 515,700 | | 6,278,791 |
Sprint Nextel Corp. | 3,408,000 | | 64,377,120 |
Vodafone Group PLC sponsored ADR | 1,248,187 | | 34,674,635 |
| | 105,330,546 |
TOTAL TELECOMMUNICATION SERVICES | | 786,658,587 |
UTILITIES - 3.4% |
Electric Utilities - 0.8% |
Entergy Corp. | 658,100 | | 60,755,792 |
Exelon Corp. | 494,000 | | 30,573,660 |
| | 91,329,452 |
Independent Power Producers & Energy Traders - 0.7% |
AES Corp. (a) | 1,644,400 | | 36,242,576 |
TXU Corp. | 788,840 | | 42,763,016 |
| | 79,005,592 |
Multi-Utilities - 1.9% |
Dominion Resources, Inc. | 968,900 | | 81,232,576 |
Duke Energy Corp. | 921,000 | | 30,586,410 |
Public Service Enterprise Group, Inc. | 933,800 | | 61,985,644 |
Wisconsin Energy Corp. | 1,286,100 | | 61,038,306 |
| | 234,842,936 |
TOTAL UTILITIES | | 405,177,980 |
TOTAL COMMON STOCKS (Cost $8,186,731,717) | 11,775,976,280 |
Convertible Preferred Stocks - 0.5% |
| | | |
CONSUMER DISCRETIONARY - 0.3% |
Automobiles - 0.2% |
Ford Motor Co. Capital Trust II 6.50% | 402,500 | | 13,837,950 |
General Motors Corp.: | | | |
Series B, 5.25% | 359,600 | | 7,634,308 |
Series C, 6.25% | 253,100 | | 5,785,866 |
| | 27,258,124 |
Hotels, Restaurants & Leisure - 0.1% |
Six Flags, Inc. 7.25% PIERS | 384,900 | | 8,564,025 |
TOTAL CONSUMER DISCRETIONARY | | 35,822,149 |
FINANCIALS - 0.1% |
Insurance - 0.1% |
Conseco, Inc. Series B, 5.50% | 143,400 | | 3,559,188 |
Convertible Preferred Stocks - continued |
| Shares | | Value (Note 1) |
FINANCIALS - continued |
Insurance - continued |
Travelers Property Casualty Corp. 4.50% | 208,200 | | $ 5,579,760 |
XL Capital Ltd. 6.50% | 475,300 | | 11,174,303 |
| | 20,313,251 |
HEALTH CARE - 0.1% |
Pharmaceuticals - 0.1% |
Schering-Plough Corp. 6.00% | 176,300 | | 10,045,574 |
MATERIALS - 0.0% |
Chemicals - 0.0% |
Celanese Corp. 4.25% | 67,100 | | 2,432,375 |
TOTAL CONVERTIBLE PREFERRED STOCKS (Cost $76,185,301) | 68,613,349 |
Corporate Bonds - 0.9% |
| Principal Amount | | |
Convertible Bonds - 0.8% |
CONSUMER DISCRETIONARY - 0.3% |
Automobiles - 0.1% |
Ford Motor Co. 4.25% 12/15/36 | | $ 9,770,000 | | 10,456,831 |
Hotels, Restaurants & Leisure - 0.0% |
Six Flags, Inc. 4.5% 5/15/15 | | 3,640,000 | | 3,794,700 |
Media - 0.2% |
Liberty Media Corp.3.5% 1/15/31 (e) | | 11,400,000 | | 11,510,580 |
News America, Inc. liquid yield option note 0% 2/28/21 (e) | | 22,670,000 | | 13,460,313 |
| | 24,970,893 |
TOTAL CONSUMER DISCRETIONARY | | 39,222,424 |
INDUSTRIALS - 0.2% |
Airlines - 0.1% |
UAL Corp. 4.5% 6/30/21 (e) | | 8,680,000 | | 12,500,068 |
Industrial Conglomerates - 0.1% |
Tyco International Group SA yankee 3.125% 1/15/23 | | 5,220,000 | | 7,412,922 |
TOTAL INDUSTRIALS | | 19,912,990 |
TELECOMMUNICATION SERVICES - 0.3% |
Diversified Telecommunication Services - 0.3% |
Level 3 Communications, Inc.: | | | | |
3.5% 6/15/12 | | 6,220,000 | | 7,692,772 |
|
| Principal Amount | | Value
(Note 1) |
5.25% 12/15/11 (e) | | $ 11,850,000 | | $ 18,528,186 |
5.25% 12/15/11 | | 3,930,000 | | 6,144,791 |
| | 32,365,749 |
TOTAL CONVERTIBLE BONDS | | 91,501,163 |
Nonconvertible Bonds - 0.1% |
MATERIALS - 0.1% |
Chemicals - 0.1% |
Hercules, Inc. 6.5% 6/30/29 unit | | 15,700,000 | | 13,639,145 |
TOTAL CORPORATE BONDS (Cost $92,953,803) | 105,140,308 |
Money Market Funds - 3.2% |
| Shares | | |
Fidelity Cash Central Fund, 5.37% (b) | 47,106,209 | | 47,106,209 |
Fidelity Securities Lending Cash Central Fund, 5.38% (b)(c) | 337,798,594 | | 337,798,594 |
TOTAL MONEY MARKET FUNDS (Cost $384,904,803) | 384,904,803 |
TOTAL INVESTMENT
PORTFOLIO - 102.8% (Cost $8,740,775,624) | | 12,334,634,740 |
NET OTHER ASSETS - (2.8)% | | (340,944,513) |
NET ASSETS - 100% | $ 11,993,690,227 |
Legend |
(a) Non-income producing |
(b) Affiliated fund that is available only to investment companies and other accounts managed by Fidelity Investments. The rate quoted is the annualized seven-day yield of the fund at period end. A complete unaudited listing of the fund's holdings as of its most recent quarter end is available upon request. |
(c) Investment made with cash collateral received from securities on loan. |
(d) Security or a portion of the security is on loan at period end. |
(e) Security exempt from registration under Rule 144A of the Securities Act of 1933. These securities may be resold in transactions exempt from registration, normally to qualified institutional buyers. At the end of the period, the value of these securities amounted to $71,577,347 or 0.6% of net assets. |
Affiliated Central Funds |
Information regarding fiscal year to date income earned by the Fund from investments in Fidelity Central Funds is as follows: |
Fund | Income earned |
Fidelity Cash Central Fund | $ 1,755,983 |
Fidelity Securities Lending Cash Central Fund | 1,591,296 |
Total | $ 3,347,279 |
See accompanying notes which are an integral part of the financial statements.
VIP Equity-Income Portfolio
VIP Equity-Income Portfolio
Financial Statements
Statement of Assets and Liabilities
| December 31, 2006 |
| | |
Assets | | |
Investment in securities, at value (including securities loaned of $331,211,680) - See accompanying schedule: Unaffiliated issuers (cost $8,355,870,821) | $ 11,949,729,937 | |
Fidelity Central Funds (cost $384,904,803) | 384,904,803 | |
Total Investments (cost $8,740,775,624) | | $ 12,334,634,740 |
Receivable for investments sold | | 985,125 |
Receivable for fund shares sold | | 854,292 |
Dividends receivable | | 14,969,169 |
Interest receivable | | 1,146,970 |
Prepaid expenses | | 53,533 |
Other receivables | | 558,501 |
Total assets | | 12,353,202,330 |
| | |
Liabilities | | |
Payable for investments purchased | $ 5,984,867 | |
Payable for fund shares redeemed | 7,928,275 | |
Accrued management fee | 4,616,752 | |
Distribution fees payable | 584,627 | |
Other affiliated payables | 1,077,657 | |
Other payables and accrued expenses | 1,521,331 | |
Collateral on securities loaned, at value | 337,798,594 | |
Total liabilities | | 359,512,103 |
| | |
Net Assets | | $ 11,993,690,227 |
Net Assets consist of: | | |
Paid in capital | | $ 8,382,644,063 |
Undistributed net investment income | | 6,057,687 |
Accumulated undistributed net realized gain (loss) on investments and foreign currency transactions | | 11,129,272 |
Net unrealized appreciation (depreciation) on investments and assets and liabilities in foreign currencies | | 3,593,859,205 |
Net Assets | | $ 11,993,690,227 |
Statement of Assets and Liabilities - continued
| December 31, 2006 |
| | |
Initial Class:
Net Asset Value, offering price and redemption price per share ($8,315,158,819 ÷ 317,373,077 shares) | | $ 26.20 |
| | |
Service Class:
Net Asset Value, offering price and redemption price per share ($1,118,333,037 ÷ 42,831,440 shares) | | $ 26.11 |
| | |
Service Class 2:
Net Asset Value, offering price and redemption price per share ($2,373,058,996 ÷ 91,743,429 shares) | | $ 25.87 |
| | |
Service Class 2R:
Net Asset Value, offering price and redemption price per share ($17,089,178 ÷ 664,071 shares) | | $ 25.73 |
| | |
Investor Class:
Net Asset Value, offering price and redemption price per share ($170,050,197 ÷ 6,502,985 shares) | | $ 26.15 |
See accompanying notes which are an integral part of the financial statements.
Annual Report
VIP Equity-Income Portfolio
Financial Statements - continued
Statement of Operations
| Year ended December 31, 2006 |
| | |
Investment Income | | |
Dividends | | $ 249,862,922 |
Interest | | 3,646,574 |
Income from Fidelity Central Funds (including $1,591,296 from security lending) | | 3,347,279 |
Total income | | 256,856,775 |
| | |
Expenses | | |
Management fee | $ 51,498,631 | |
Transfer agent fees | 7,533,695 | |
Distribution fees | 6,043,143 | |
Accounting and security lending fees | 1,448,191 | |
Custodian fees and expenses | 253,854 | |
Independent trustees' compensation | 40,857 | |
Appreciation in deferred trustee compensation account | 12,469 | |
Audit | 116,162 | |
Legal | 204,028 | |
Interest | 70,229 | |
Miscellaneous | 1,821,006 | |
Total expenses before reductions | 69,042,265 | |
Expense reductions | (447,375) | 68,594,890 |
Net investment income (loss) | | 188,261,885 |
Realized and Unrealized Gain (Loss) Net realized gain (loss) on: | | |
Investment securities: | | |
Unaffiliated issuers | 828,364,854 | |
Foreign currency transactions | (53,108) | |
Total net realized gain (loss) | | 828,311,746 |
Change in net unrealized appreciation (depreciation) on: Investment securities | 1,034,327,955 | |
Assets and liabilities in foreign currencies | 3,201 | |
Total change in net unrealized appreciation (depreciation) | | 1,034,331,156 |
Net gain (loss) | | 1,862,642,902 |
Net increase (decrease) in net assets resulting from operations | | $ 2,050,904,787 |
Statement of Changes in Net Assets
| Year ended
December 31,
2006 | Year ended
December 31,
2005 |
Increase (Decrease) in Net Assets | | |
Operations | | |
Net investment income (loss) | $ 188,261,885 | $ 180,286,741 |
Net realized gain (loss) | 828,311,746 | 551,406,495 |
Change in net unrealized appreciation (depreciation) | 1,034,331,156 | (133,326,683) |
Net increase (decrease) in net assets resulting from operations | 2,050,904,787 | 598,366,553 |
Distributions to shareholders from net investment income | (361,533,412) | (175,959,121) |
Distributions to shareholders from net realized gain | (1,350,709,216) | (394,382,958) |
Total distributions | (1,712,242,628) | (570,342,079) |
Share transactions - net increase (decrease) | 928,687,527 | (588,913,583) |
Redemption fees | 4,203 | 2,560 |
Total increase (decrease) in net assets | 1,267,353,889 | (560,886,549) |
| | |
Net Assets | | |
Beginning of period | 10,726,336,338 | 11,287,222,887 |
End of period (including undistributed net investment income of $6,057,687 and undistributed net investment income of $180,172,674, respectively) | $ 11,993,690,227 | $ 10,726,336,338 |
See accompanying notes which are an integral part of the financial statements.
VIP Equity-Income Portfolio
Financial Highlights - Initial Class
Years ended December 31, | 2006 | 2005 | 2004 | 2003 | 2002 |
Selected Per-Share Data | | | | | |
Net asset value, beginning of period | $ 25.49 | $ 25.37 | $ 23.18 | $ 18.16 | $ 22.75 |
Income from Investment Operations | | | | | |
Net investment income (loss) C | .45 | .42 | .40 | .36 | .34 |
Net realized and unrealized gain (loss) | 4.37 | 1.00 | 2.24 | 5.01 | (4.08) |
Total from investment operations | 4.82 | 1.42 | 2.64 | 5.37 | (3.74) |
Distributions from net investment income | (.89) | (.41) | (.36) | (.35) | (.36) |
Distributions from net realized gain | (3.22) | (.89) | (.09) | - | (.49) |
Total distributions | (4.11) | (1.30) | (.45) | (.35) | (.85) |
Redemption fees added to paid in capital C, G | - | - | - | - | - |
Net asset value, end of period | $ 26.20 | $ 25.49 | $ 25.37 | $ 23.18 | $ 18.16 |
Total Return A, B | 20.19% | 5.87% | 11.53% | 30.33% | (16.95)% |
Ratios to Average Net Assets D, F | | | | | |
Expenses before reductions | .57% | .56% | .58% | .57% | .57% |
Expenses net of fee waivers, if any | .57% | .56% | .58% | .57% | .57% |
Expenses net of all reductions | .56% | .55% | .57% | .56% | .56% |
Net investment income (loss) | 1.76% | 1.71% | 1.71% | 1.83% | 1.70% |
Supplemental Data | | | | | |
Net assets, end of period (000 omitted) | $ 8,315,159 | $ 7,875,801 | $ 8,689,829 | $ 8,402,963 | $ 6,895,940 |
Portfolio turnover rate E | 22% | 19% | 22% | 26% | 25% |
A Total returns do not reflect charges attributable to your insurance company's separate account. Inclusion of these charges would reduce the total returns shown.
B Total returns would have been lower had certain expenses not been reduced during the periods shown.
C Calculated based on average shares outstanding during the period.
D Fees and expenses of the underlying Fidelity Central Funds are not included in the Fund's expense ratio. The Fund indirectly bears its proportionate share of the expenses of any underlying Fidelity Central Funds.
E Amount does not include the portfolio activity of any underlying Fidelity Central Funds.
F Expense ratios reflect operating expenses of the class. Expenses before reductions do not reflect amounts reimbursed by the investment adviser or reductions from brokerage service arrangements or other expense offset arrangements and do not represent the amount paid by the class during periods when reimbursements or reductions occur. Expenses net of fee waivers reflect expenses after reimbursement by the investment adviser but prior to reductions from brokerage service arrangements or other expense offset arrangements. Expenses net of all reductions represent the net expenses paid by the class.
G Amount represents less than $.01 per share.
Financial Highlights - Service Class
Years ended December 31, | 2006 | 2005 | 2004 | 2003 | 2002 |
Selected Per-Share Data | | | | | |
Net asset value, beginning of period | $ 25.39 | $ 25.28 | $ 23.11 | $ 18.10 | $ 22.67 |
Income from Investment Operations | | | | | |
Net investment income (loss) C | .43 | .39 | .38 | .34 | .32 |
Net realized and unrealized gain (loss) | 4.35 | 1.00 | 2.22 | 5.00 | (4.06) |
Total from investment operations | 4.78 | 1.39 | 2.60 | 5.34 | (3.74) |
Distributions from net investment income | (.84) | (.39) | (.34) | (.33) | (.34) |
Distributions from net realized gain | (3.22) | (.89) | (.09) | - | (.49) |
Total distributions | (4.06) | (1.28) | (.43) | (.33) | (.83) |
Redemption fees added to paid in capital C, G | - | - | - | - | - |
Net asset value, end of period | $ 26.11 | $ 25.39 | $ 25.28 | $ 23.11 | $ 18.10 |
Total Return A, B | 20.08% | 5.76% | 11.38% | 30.22% | (17.00)% |
Ratios to Average Net Assets D, F | | | | | |
Expenses before reductions | .67% | .66% | .68% | .67% | .67% |
Expenses net of fee waivers, if any | .67% | .66% | .68% | .67% | .67% |
Expenses net of all reductions | .66% | .65% | .67% | .66% | .66% |
Net investment income (loss) | 1.66% | 1.61% | 1.61% | 1.73% | 1.60% |
Supplemental Data | | | | | |
Net assets, end of period (000 omitted) | $ 1,118,333 | $ 1,079,838 | $ 1,170,778 | $ 1,071,483 | $ 771,516 |
Portfolio turnover rate E | 22% | 19% | 22% | 26% | 25% |
A Total returns do not reflect charges attributable to your insurance company's separate account. Inclusion of these charges would reduce the total returns shown.
B Total returns would have been lower had certain expenses not been reduced during the periods shown.
C Calculated based on average shares outstanding during the period.
D Fees and expenses of the underlying Fidelity Central Funds are not included in the Fund's expense ratio. The Fund indirectly bears its proportionate share of the expenses of any underlying Fidelity Central Funds.
E Amount does not include the portfolio activity of any underlying Fidelity Central Funds.
F Expense ratios reflect operating expenses of the class. Expenses before reductions do not reflect amounts reimbursed by the investment adviser or reductions from brokerage service arrangements or other expense offset arrangements and do not represent the amount paid by the class during periods when reimbursements or reductions occur. Expenses net of fee waivers reflect expenses after reimbursement by the investment adviser but prior to reductions from brokerage service arrangements or other expense offset arrangements. Expenses net of all reductions represent the net expenses paid by the class.
G Amount represents less than $.01 per share.
See accompanying notes which are an integral part of the financial statements.
Annual Report
Financial Highlights - Service Class 2
Years ended December 31, | 2006 | 2005 | 2004 | 2003 | 2002 |
Selected Per-Share Data | | | | | |
Net asset value, beginning of period | $ 25.17 | $ 25.09 | $ 22.96 | $ 18.00 | $ 22.59 |
Income from Investment Operations | | | | | |
Net investment income (loss) C | .38 | .35 | .34 | .31 | .28 |
Net realized and unrealized gain (loss) | 4.32 | .98 | 2.21 | 4.97 | (4.04) |
Total from investment operations | 4.70 | 1.33 | 2.55 | 5.28 | (3.76) |
Distributions from net investment income | (.78) | (.36) | (.33) | (.32) | (.34) |
Distributions from net realized gain | (3.22) | (.89) | (.09) | - | (.49) |
Total distributions | (4.00) | (1.25) | (.42) | (.32) | (.83) |
Redemption fees added to paid in capital C, G | - | - | - | - | - |
Net asset value, end of period | $ 25.87 | $ 25.17 | $ 25.09 | $ 22.96 | $ 18.00 |
Total Return A, B | 19.93% | 5.57% | 11.23% | 30.03% | (17.15)% |
Ratios to Average Net Assets D, F | | | | | |
Expenses before reductions | .82% | .81% | .83% | .82% | .83% |
Expenses net of fee waivers, if any | .82% | .81% | .83% | .82% | .83% |
Expenses net of all reductions | .82% | .80% | .82% | .81% | .82% |
Net investment income (loss) | 1.51% | 1.46% | 1.46% | 1.58% | 1.44% |
Supplemental Data | | | | | |
Net assets, end of period (000 omitted) | $ 2,373,059 | $ 1,723,546 | $ 1,420,999 | $ 916,679 | $ 403,632 |
Portfolio turnover rate E | 22% | 19% | 22% | 26% | 25% |
A Total returns do not reflect charges attributable to your insurance company's separate account. Inclusion of these charges would reduce the total returns shown.
B Total returns would have been lower had certain expenses not been reduced during the periods shown.
C Calculated based on average shares outstanding during the period.
D Fees and expenses of the underlying Fidelity Central Funds are not included in the Fund's expense ratio. The Fund indirectly bears its proportionate share of the expenses of any underlying Fidelity Central Funds.
E Amount does not include the portfolio activity of any underlying Fidelity Central Funds.
F Expense ratios reflect operating expenses of the class. Expenses before reductions do not reflect amounts reimbursed by the investment adviser or reductions from brokerage service arrangements or other expense offset arrangements and do not represent the amount paid by the class during periods when reimbursements or reductions occur. Expenses net of fee waivers reflect expenses after reimbursement by the investment adviser but prior to reductions from brokerage service arrangements or other expense offset arrangements. Expenses net of all reductions represent the net expenses paid by the class.
G Amount represents less than $.01 per share.
Financial Highlights - Service Class 2R
Years ended December 31, | 2006 | 2005 | 2004 | 2003 | 2002 H |
Selected Per-Share Data | | | | | |
Net asset value, beginning of period | $ 25.08 | $ 25.01 | $ 22.91 | $ 17.99 | $ 21.82 |
Income from Investment Operations | | | | | |
Net investment income (loss) E | .38 | .35 | .34 | .31 | .18 |
Net realized and unrealized gain (loss) | 4.29 | .99 | 2.20 | 4.96 | (4.01) |
Total from investment operations | 4.67 | 1.34 | 2.54 | 5.27 | (3.83) |
Distributions from net investment income | (.80) | (.38) | (.35) | (.35) | - |
Distributions from net realized gain | (3.22) | (.89) | (.09) | - | - |
Total distributions | (4.02) | (1.27) | (.44) | (.35) | - |
Redemption fees added to paid in capital E, J | - | - | - | - | - |
Net asset value, end of period | $ 25.73 | $ 25.08 | $ 25.01 | $ 22.91 | $ 17.99 |
Total Return B, C, D | 19.89% | 5.61% | 11.22% | 30.05% | (17.55)% |
Ratios to Average Net Assets F, I | | | | | |
Expenses before reductions | .82% | .81% | .83% | .82% | .85% A |
Expenses net of fee waivers, if any | .82% | .81% | .83% | .82% | .85% A |
Expenses net of all reductions | .81% | .80% | .82% | .81% | .84% A |
Net investment income (loss) | 1.51% | 1.46% | 1.46% | 1.57% | 1.45% A |
Supplemental Data | | | | | |
Net assets, end of period (000 omitted) | $ 17,089 | $ 9,651 | $ 5,617 | $ 1,891 | $ 471 |
Portfolio turnover rate G | 22% | 19% | 22% | 26% | 25% |
A Annualized
B Total returns for periods of less than one year are not annualized.
C Total returns do not reflect charges attributable to your insurance company's separate account. Inclusion of these charges would reduce the total returns shown.
D Total returns would have been lower had certain expenses not been reduced during the periods shown.
E Calculated based on average shares outstanding during the period.
F Fees and expenses of the underlying Fidelity Central Funds are not included in the Fund's expense ratio. The Fund indirectly bears its proportionate share of the expenses of any underlying Fidelity Central Funds.
G Amount does not include the portfolio activity of any underlying Fidelity Central Funds.
H For the period April 24, 2002 (commencement of sale of shares) to December 31, 2002.
I Expense ratios reflect operating expenses of the class. Expenses before reductions do not reflect amounts reimbursed by the investment adviser or reductions from brokerage service arrangements or other expense offset arrangements and do not represent the amount paid by the class during periods when reimbursements or reductions occur. Expense ratios before reductions for start-up periods may not be representative of longer-term operating periods. Expenses net of fee waivers reflect expenses after reimbursement by the investment adviser but prior to reductions from brokerage service arrangements or other expense offset arrangements. Expenses net of all reductions represent the net expenses paid by the class.
J Amount represents less than $.01 per share.
See accompanying notes which are an integral part of the financial statements.
VIP Equity-Income Portfolio
Financial Highlights - Investor Class
Years ended December 31, | 2006 | 2005 H |
Selected Per-Share Data | | |
Net asset value, beginning of period | $ 25.48 | $ 24.46 |
Income from Investment Operations | | |
Net investment income (loss) E | .42 | .17 |
Net realized and unrealized gain (loss) | 4.36 | .85 |
Total from investment operations | 4.78 | 1.02 |
Distributions from net investment income | (.89) | - |
Distributions from net realized gain | (3.22) | - |
Total distributions | (4.11) | - |
Redemption fees added to paid in capital E, J | - | - |
Net asset value, end of period | $ 26.15 | $ 25.48 |
Total Return B, C, D | 20.04% | 4.17% |
Ratios to Average Net Assets F, I | | |
Expenses before reductions | .69% | .74% A |
Expenses net of fee waivers, if any | .69% | .74% A |
Expenses net of all reductions | .69% | .73% A |
Net investment income (loss) | 1.63% | 1.54% A |
Supplemental Data | | |
Net assets, end of period (000 omitted) | $ 170,050 | $ 37,500 |
Portfolio turnover rate G | 22% | 19% |
A Annualized
B Total returns for periods of less than one year are not annualized.
C Total returns do not reflect charges attributable to your insurance company's separate account. Inclusion of these charges would reduce the total returns shown.
D Total returns would have been lower had certain expenses not been reduced during the periods shown.
E Calculated based on average shares outstanding during the period.
F Fees and expenses of the underlying Fidelity Central Funds are not included in the Fund's expense ratio. The Fund indirectly bears its proportionate share of the expenses of any underlying Fidelity Central Funds.
G Amount does not include the portfolio activity of any underlying Fidelity Central Funds.
H For the period July 21, 2005 (commencement of sale of shares) to December 31, 2005.
I Expense ratios reflect operating expenses of the class. Expenses before reductions do not reflect amounts reimbursed by the investment adviser or reductions from brokerage service arrangements or other expense offset arrangements and do not represent the amount paid by the class during periods when reimbursements or reductions occur. Expense ratios before reductions for start-up periods may not be representative of longer-term operating periods. Expenses net of fee waivers reflect expenses after reimbursement by the investment adviser but prior to reductions from brokerage service arrangements or other expense offset arrangements. Expenses net of all reductions represent the net expenses paid by the class.
J Amount represents less than $.01 per share.
See accompanying notes which are an integral part of the financial statements.
Annual Report
Notes to Financial Statements
For the period ended December 31, 2006
1. Significant Accounting Policies.
VIP Equity-Income Portfolio (the Fund) is a fund of Variable Insurance Products Fund (the trust) and is authorized to issue an unlimited number of shares. The trust is registered under the Investment Company Act of 1940, as amended (the 1940 Act), as an open-end management investment company organized as a Massachusetts business trust. Shares of the Fund may only be purchased by insurance companies for the purpose of funding variable annuity or variable life insurance contracts. The Fund offers the following classes of shares: Initial Class shares, Service Class shares, Service Class 2 shares, Service Class 2R shares, and Investor Class shares. All classes have equal rights and voting privileges, except for matters affecting a single class. Investment income, realized and unrealized capital gains and losses, the common expenses of the Fund, and certain fund-level expense reductions, if any, are allocated on a pro rata basis to each class based on the relative net assets of each class to the total net assets of the Fund. Each class differs with respect to transfer agent and distribution and service plan fees incurred. Certain expense reductions also differ by class.
The Fund may invest in Fidelity Central Funds which are open-end investment companies available to investment companies and other accounts managed by Fidelity Management & Research Company (FMR) and its affiliates. The financial statements have been prepared in conformity with accounting principles generally accepted in the United States of America, which require management to make certain estimates and assumptions at the date of the financial statements. The following summarizes the significant accounting policies of the Fund, which are also consistently followed by the Fidelity Central Funds:
Security Valuation. Investments are valued and net asset value (NAV) per share is calculated (NAV calculation) as of the close of business of the New York Stock Exchange (NYSE), normally 4:00 p.m. Eastern time. Wherever possible, the Fund uses independent pricing services approved by the Board of Trustees to value its investments.
Equity securities, including restricted securities, for which market quotations are readily available, are valued at the last reported sale price or official closing price as reported by an independent pricing service on the primary market or exchange on which they are traded. In the event there were no sales during the day or closing prices are not available, securities are valued at the last quoted bid price. Debt securities, including restricted securities, for which quotations are readily available, are valued by independent pricing services or by dealers who make markets in such securities. Pricing services consider yield or price of bonds of comparable quality, coupon, maturity and type as well as dealer supplied prices. Investments in open-end mutual funds, including the Fidelity Central Funds, are valued at their closing net asset value each business day. Short-term securities with remaining maturities of sixty days or less for which quotations are not readily available are valued at amortized cost, which approximates value.
When current market prices or quotations are not readily available or do not accurately reflect fair value, valuations may be determined in accordance with procedures adopted by the Board of Trustees. For example, when developments occur between the close of a market and the close of the NYSE that may materially affect the value of some or all of the securities, or when trading in a security is halted, those securities may be fair valued. Factors used in the determination of fair value may include monitoring news to identify significant market or security specific events such as changes in the value of U.S. securities markets, reviewing developments in foreign markets and evaluating the performance of ADRs, futures contracts and exchange-traded funds. Because the Fund's utilization of fair value pricing depends on market activity, the frequency with which fair value pricing is used can not be predicted and may be utilized to a significant extent. The value of securities used for NAV calculation under fair value pricing may differ from published prices for the same securities.
Foreign Currency. The Fund uses foreign currency contracts to facilitate transactions in foreign-denominated securities. Losses from these transactions may arise from changes in the value of the foreign currency or if the counterparties do not perform under the contracts' terms.
Foreign-denominated assets, including investment securities, and liabilities are translated into U.S. dollars at the exchange rate at period end. Purchases and sales of investment securities, income and dividends received and expenses denominated in foreign currencies are translated into U.S. dollars at the exchange rate in effect on the transaction date.
The effects of exchange rate fluctuations on investments are included with the net realized and unrealized gain (loss) on investment securities. Other foreign currency transactions resulting in realized and unrealized gain (loss) are disclosed separately.
Investment Transactions and Income. Security transactions, including the Fund's investment activity in the Fidelity Central Funds, are accounted for as of trade date. Gains and losses on securities sold are determined on the basis of identified cost and may include proceeds received from litigation. Dividend income is recorded on the ex-dividend date, except for certain dividends from foreign securities where the ex-dividend date may have passed, which are recorded as soon as the Fund is informed of the ex-dividend date. Non-cash dividends included in dividend income, if any, are recorded at the fair market value of the securities received. Distributions received on securities that represent a return of capital or capital gain are recorded as a reduction of cost of investments and/or as a realized gain. The Fund estimates the components of distributions received that may be considered return of capital distributions or capital gain distributions. Interest income and income distributions from the Fidelity Central Funds are accrued as earned, with any income distributions receivable as of period end included in Interest Receivable on the Statement of Assets and Liabilities. Interest income includes coupon interest and amortization of premium and accretion of discount on debt securities. Investment income is recorded net of foreign taxes withheld where recovery of such taxes is uncertain.
VIP Equity-Income Portfolio
1. Significant Accounting Policies - continued
Expenses. Most expenses of the trust can be directly attributed to a fund. Expenses which cannot be directly attributed are apportioned among each Fund in the trust. Expense estimates are accrued in the period to which they relate and adjustments are made when actual amounts are known.
Deferred Trustee Compensation. Under a Deferred Compensation Plan (the Plan), Independent Trustees must defer receipt of a portion of, and may elect to defer receipt of an additional portion of, their annual compensation. Deferred amounts are invested in a cross-section of Fidelity funds, are marked-to-market and remain in the Fund until distributed in accordance with the Plan. The investment of deferred amounts and the offsetting payable to the Trustees are included in the accompanying Statement of Assets and Liabilities.
Income Tax Information and Distributions to Shareholders. Each year, the Fund intends to qualify as a regulated investment company by distributing all of its taxable income and realized gains under Subchapter M of the Internal Revenue Code. As a result, no provision for income taxes is required in the accompanying financial statements. Foreign taxes are provided for based on the Fund's understanding of the tax rules and rates that exist in the foreign markets in which it invests.
Distributions are recorded on the ex-dividend date. Income dividends and capital gain distributions are declared separately for each class. Income and capital gain distributions are determined in accordance with income tax regulations, which may differ from generally accepted accounting principles. In addition, the Fund will claim a portion of the payment made to redeeming shareholders as a distribution for income tax purposes.
Capital accounts within the financial statements are adjusted for permanent book-tax differences. These adjustments have no impact on net assets or the results of operations. Temporary book-tax differences will reverse in a subsequent period.
Book-tax differences are primarily due to foreign currency transactions, passive foreign investment companies (PFIC), market discount, partnerships, deferred trustees compensation and losses deferred due to wash sales.
The tax-basis components of distributable earnings and the federal tax cost as of period end were as follows:
Unrealized appreciation | $ 3,880,252,554 |
Unrealized depreciation | (295,422,391) |
Net unrealized appreciation (depreciation) | 3,584,830,163 |
Undistributed ordinary income | 8,572,542 |
Undistributed long-term capital gain | 13,681,943 |
| |
Cost for federal income tax purposes | $ 8,749,804,577 |
The tax character of distributions paid was as follows:
| December 31, 2006 | December 31, 2005 |
Ordinary Income | $ 503,567,088 | $ 222,487,447 |
Long-term Capital Gains | 1,208,675,540 | 347,854,632 |
Total | $ 1,712,242,628 | $ 570,342,079 |
Trading (Redemption) Fees. Service Class 2R shares held less than 60 days are subject to a redemption fee equal to 1% of the proceeds of the redeemed shares. All redemption fees, including any estimated redemption fees paid by FMR, are retained by the Fund and accounted for as an addition to paid in capital.
New Accounting Pronouncements. In July 2006, Financial Accounting Standards Board Interpretation No. 48, Accounting for Uncertainty in Income Taxes - an interpretation of FASB Statement 109 (FIN 48), was issued and is effective on the last business day of the semiannual reporting period for fiscal years beginning after December 15, 2006. FIN 48 sets forth a threshold for financial statement recognition, measurement and disclosure of a tax position taken or expected to be taken on a tax return. Management is currently evaluating the impact, if any, the adoption of FIN 48 will have on the Fund's net assets, results of operations and financial statement disclosures.
In addition, in September 2006, Statement of Financial Accounting Standards No. 157, Fair Value Measurements (SFAS 157), was issued and is effective for fiscal years beginning after November 15, 2007. SFAS 157 defines fair value, establishes a framework for measuring fair value and expands disclosures about fair value measurements. Management is currently evaluating the impact the adoption of SFAS 157 will have on the Fund's financial statement disclosures.
Annual Report
Notes to Financial Statements - continued
2. Operating Policies.
Repurchase Agreements. FMR has received an Exemptive Order from the Securities and Exchange Commission (the SEC) which permits the Fund and other affiliated entities of FMR to transfer uninvested cash balances into joint trading accounts which are then invested in repurchase agreements. The Fund may also invest directly with institutions in repurchase agreements. Repurchase agreements are collateralized by government or non-government securities. Upon settlement date, collateral is held in segregated accounts with custodian banks and may be obtained in the event of a default of the counterparty. The Fund monitors, on a daily basis, the value of the collateral to ensure it is at least equal to the principal amount of the repurchase agreement (including accrued interest). In the event of a default by the counterparty, realization of the collateral proceeds could be delayed, during which time the value of the collateral may decline.
Restricted Securities. The Fund may invest in securities that are subject to legal or contractual restrictions on resale. These securities generally may be resold in transactions exempt from registration or to the public if the securities are registered. Disposal of these securities may involve time-consuming negotiations and expense, and prompt sale at an acceptable price may be difficult. Information regarding restricted securities is included at the end of the Fund's Schedule of Investments.
3. Purchases and Sales of Investments.
Purchases and sales of securities, other than short-term securities, aggregated $2,437,840,437 and $3,025,706,165, respectively.
4. Fees and Other Transactions with Affiliates.
Management Fee. FMR and its affiliates provide the Fund with investment management related services for which the Fund pays a monthly management fee. The management fee is the sum of an individual fund fee rate that is based on an annual rate of .20% of the Fund's average net assets and a group fee rate that averaged .27% during the period. The group fee rate is based upon the average net assets of all the mutual funds advised by FMR. The group fee rate decreases as assets under management increase and increases as assets under management decrease. For the period, the total annual management fee rate was .47% of the Fund's average net assets.
Distribution and Service Plan. In accordance with Rule 12b-1 of the 1940 Act, the Fund has adopted separate 12b-1 Plans for each Service Class of shares. Each Service Class pays Fidelity Distributors Corporation (FDC), an affiliate of FMR, a service fee. For the period, the service fee is based on an annual rate of .10% of Service Class' average net assets and .25% of Service Class 2's and Service Class 2R's average net assets.
For the period, each class paid FDC the following amounts, all of which were re-allowed to insurance companies for the distribution of shares and providing shareholder support services:
Service Class | $ 1,079,776 |
Service Class 2 | 4,934,301 |
Service Class 2R | 29,066 |
| $ 6,043,143 |
Transfer Agent Fees. Fidelity Investments Institutional Operations Company, Inc. (FIIOC), an affiliate of FMR, is the fund's transfer, dividend disbursing, and shareholder servicing agent. FIIOC receives an asset-based fee with respect to each class. Each class with the exception of Investor Class pays a transfer agent fee, excluding out of pocket expenses, equal to an annual rate of .07% of their month end net assets. Investor Class pays a monthly asset-based transfer agent fee of .18% of its month end net assets. The total transfer agent fees paid by each class to FIIOC, including out of pocket expenses, were as follows:
Initial Class | $ 5,281,345 |
Service Class | 718,009 |
Service Class 2 | 1,344,318 |
Service Class 2R | 7,837 |
Investor Class | 182,186 |
| $ 7,533,695 |
Accounting and Security Lending Fees. Fidelity Service Company, Inc. (FSC), an affiliate of FMR, maintains the Fund's accounting records. The accounting fee is based on the level of average net assets for the month. Under a separate contract, FSC administers the security lending program. The security lending fee is based on the number and duration of lending transactions.
VIP Equity-Income Portfolio
4. Fees and Other Transactions with Affiliates - continued
Investments in Fidelity Central Funds. The Fund may invest in Fidelity Central Funds. The Fund's Schedule of Investments lists each of the Fidelity Central Funds as an investment of the Fund but does not include the underlying holdings of each Fidelity Central Fund. As an Investing Fund, the Fund indirectly bears its proportionate share of the expenses of the underlying Fidelity Central Funds. A complete unaudited list of holdings for each Fidelity Central Fund is available upon request. In addition, the financial statements of the Fidelity Central Funds, which are not covered by the Fund's Report of Independent Registered Public Accounting Firm, are available on the EDGAR Database on the SEC's web site, www.sec.gov, or upon request.
The Money Market Central Funds seek preservation of capital and current income and are managed by Fidelity Investments Money Management, Inc. (FIMM), an affiliate of FMR.
Brokerage Commissions. The Fund placed a portion of its portfolio transactions with brokerage firms which are affiliates of the investment adviser. The commissions paid to these affiliated firms were $9,656 for the period.
Interfund Lending Program. Pursuant to an Exemptive Order issued by the SEC, the Fund, along with other registered investment companies having management contracts with FMR, may participate in an interfund lending program. This program provides an alternative credit facility allowing the funds to borrow from, or lend money to, other participating affiliated funds. At period end, there were no interfund loans outstanding. The Fund's activity in this program during the period for which loans were outstanding was as follows:
Borrower or Lender | Average Daily
Loan Balance | Weighted Average Interest Rate | Interest
Expense |
Borrower | $ 9,969,083 | 4.87% | $ 64,697 |
5. Committed Line of Credit.
The Fund participates with other funds managed by FMR in a $4.2 billion credit facility (the "line of credit") to be utilized for temporary or emergency purposes to fund shareholder redemptions or for other short-term liquidity purposes. The Fund has agreed to pay commitment fees on its pro rata portion of the line of credit, which amounted to $30,011 and is reflected in Miscellaneous Expense on the Statement of Operations. During the period, there were no borrowings on this line of credit.
6. Security Lending.
The Fund lends portfolio securities from time to time in order to earn additional income. On the settlement date of the loan, the Fund receives collateral (in the form of U.S. Treasury obligations, letters of credit and/or cash) against the loaned securities and maintains collateral in an amount not less than 100% of the market value of the loaned securities during the period of the loan. The market value of the loaned securities is determined at the close of business of the Fund and any additional required collateral is delivered to the Fund on the next business day. If the borrower defaults on its obligation to return the securities loaned because of insolvency or other reasons, a fund could experience delays and costs in recovering the securities loaned or in gaining access to the collateral. Any cash collateral received is invested in the Fidelity Securities Lending Cash Central Fund. The value of loaned securities and cash collateral at period end are disclosed on the Fund's Statement of Assets and Liabilities. Security lending income represents the income earned on investing cash collateral, less fees and expenses associated with the loan, plus any premium payments that may be received on the loan of certain types of securities. Security lending income is presented in the Statement of Operations as a component of income from Fidelity Central Funds.
7. Bank Borrowings.
The Fund is permitted to have bank borrowings for temporary or emergency purposes to fund shareholder redemptions. The Fund has established borrowing arrangements with certain banks. The interest rate on the borrowings is the bank's base rate, as revised from time to time. The average daily loan balance during the period for which loans were outstanding amounted to $6,306,333. The weighted average interest rate was 5.27%. At period end, there were no bank borrowings outstanding.
8. Expense Reductions.
Many of the brokers with whom FMR places trades on behalf of the Fund provided services to the Fund in addition to trade execution. These services included payments of certain expenses on behalf of the Fund totaling $263,222 for the period. In addition, through arrangements with the fund's custodian, credits realized as a result of uninvested cash balances were used to reduce the Fund's expenses. During the period, these credits reduced the Fund's custody expenses by $16,021.
Annual Report
Notes to Financial Statements - continued
9. Other.
The Fund's organizational documents provide former and current trustees and officers with a limited indemnification against liabilities arising in connection with the performance of their duties to the Fund. In the normal course of business, the Fund may also enter into contracts that provide general indemnifications. The Fund's maximum exposure under these arrangements is unknown as this would be dependent on future claims that may be made against the Fund. The risk of material loss from such claims is considered remote.
At the end of the period, FMR or its affiliates were the owners of record of 12% of the total outstanding shares of the Fund and one otherwise unaffiliated shareholder was the owner of record of 22% of the total outstanding shares of the Fund.
The United States Securities and Exchange Commission ("SEC") is conducting an investigation of FMR (covering the years 2002 to 2004) arising from gifts, gratuities and business entertainment provided by certain brokers to certain individuals who were employed on FMR's domestic equity trading desk during that period. FMR is in discussions with the SEC staff regarding the possible resolution of the matter, but as of period-end no final resolution has been reached.
In December 2006, the Independent Trustees completed their own investigation of the matter with the assistance of independent counsel. The Independent Trustees and FMR agree that, despite the absence of proof that the Fidelity mutual funds experienced diminished execution quality as a result of the improper receipt of gifts and business entertainment, the conduct at issue was serious and is worthy of redress. Accordingly, the Independent Trustees have requested and FMR has agreed to pay $42 million to Fidelity mutual funds, plus interest to be determined at the time that payment is made. A method of allocating this payment among the funds has not yet been determined. The total payment to the Fund is not anticipated to have a material impact on the Fund's net assets. In addition, FMR reimbursed related legal expenses which are recorded in the accompanying Statement of Operations as an expense reduction.
10. Distributions to Shareholders.
Distributions to shareholders of each class were as follows:
| Years ended December 31, |
| 2006 | 2005 |
From net investment income | | |
Initial Class | $ 264,166,176 | $ 137,602,640 |
Service Class | 33,884,044 | 17,563,270 |
Service Class 2 | 59,720,009 | 20,698,826 |
Service Class 2R | 384,977 | 94,385 |
Investor Class | 3,378,206 | - |
Total | $ 361,533,412 | $ 175,959,121 |
From net realized gain | | |
Initial Class | $ 955,191,565 | $ 302,386,049 |
Service Class | 129,915,591 | 40,600,805 |
Service Class 2 | 250,476,248 | 51,172,097 |
Service Class 2R | 1,596,604 | 224,007 |
Investor Class | 13,529,208 | - |
Total | $ 1,350,709,216 | $ 394,382,958 |
VIP Equity-Income Portfolio
11. Share Transactions.
Transactions for each class of shares were as follows:
| Shares | Dollars |
Years ended December 31, | 2006 | 2005 A | 2006 | 2005 A |
Initial Class | | | | |
Shares sold | 11,142,631 | 9,995,592 | $ 291,841,012 | $ 243,588,116 |
Reinvestment of distributions | 48,349,563 | 18,234,094 | 1,219,357,741 | 439,988,689 |
Shares redeemed | (51,111,950) | (61,778,854) | (1,316,326,890) | (1,504,207,375) |
Net increase (decrease) | 8,380,244 | (33,549,168) | $ 194,871,863 | $ (820,630,570) |
Service Class | | | | |
Shares sold | 1,973,377 | 1,664,065 | $ 51,112,539 | $ 40,334,290 |
Reinvestment of distributions | 6,517,581 | 2,417,459 | 163,799,635 | 58,164,074 |
Shares redeemed | (8,189,522) | (7,864,758) | (210,464,004) | (190,937,287) |
Net increase (decrease) | 301,436 | (3,783,234) | $ 4,448,170 | $ (92,438,923) |
Service Class 2 | | | | |
Shares sold | 18,633,564 | 15,407,445 | $ 478,385,754 | $ 370,175,387 |
Reinvestment of distributions | 12,399,920 | 3,009,670 | 310,196,257 | 71,870,922 |
Shares redeemed | (7,758,659) | (6,593,873) | (196,924,442) | (158,371,244) |
Net increase (decrease) | 23,274,825 | 11,823,242 | $ 591,657,569 | $ 283,675,065 |
Service Class 2R | | | | |
Shares sold | 328,046 | 229,939 | $ 8,477,584 | $ 5,501,232 |
Reinvestment of distributions | 79,377 | 13,378 | 1,981,581 | 318,391 |
Shares redeemed | (128,136) | (83,085) | (3,244,089) | (1,983,529) |
Net increase (decrease) | 279,287 | 160,232 | $ 7,215,076 | $ 3,836,094 |
Investor Class | | | | |
Shares sold | 4,614,643 | 1,480,945 | $ 119,868,954 | $ 36,874,007 |
Reinvestment of distributions | 660,041 | - | 16,907,414 | - |
Shares redeemed | (243,553) | (9,091) | (6,281,519) | (229,256) |
Net increase (decrease) | 5,031,131 | 1,471,854 | $ 130,494,849 | $ 36,644,751 |
A Share transactions for Investor Class are for the period July 21, 2005 (commencement of sale of shares) to December 31, 2005.
Annual Report
Report of Independent Registered Public Accounting Firm
To the Trustees of Variable Insurance Products Fund and the Shareholders of VIP Equity-Income Portfolio:
In our opinion, the accompanying statement of assets and liabilities, including the schedule of investments, and the related statements of operations and of changes in net assets and the financial highlights present fairly, in all material respects, the financial position of VIP Equity-Income Portfolio (a fund of Variable Insurance Products Fund) at December 31, 2006, the results of its operations for the year then ended, the changes in its net assets for each of the two years in the period then ended and the financial highlights for each of the periods indicated, in conformity with accounting principles generally accepted in the United States of America. These financial statements and financial highlights (hereafter referred to as "financial statements") are the responsibility of the VIP Equity-Income Portfolio's management; our responsibility is to express an opinion on these financial statements based on our audits. We conducted our audits of these financial statements in accordance with the standards of the Public Company Accounting Oversight Board (United States). Those standards require that we plan and perform the audit to obtain reasonable assurance about whether the financial statements are free of material misstatement. An audit includes examining, on a test basis, evidence supporting the amounts and disclosures in the financial statements, assessing the accounting principles used and significant estimates made by management, and evaluating the overall financial statement presentation. We believe that our audits, which included confirmation of securities at December 31, 2006 by correspondence with the custodian and brokers, provide a reasonable basis for our opinion.
/s/ PricewaterhouseCoopers LLP
PricewaterhouseCoopers LLP
Boston, Massachusetts
February 12, 2007
VIP Equity-Income Portfolio
Trustees and Officers
The Trustees, Member of the Advisory Board, and executive officers of the trust and fund, as applicable, are listed below. The Board of Trustees governs the fund and is responsible for protecting the interests of shareholders. The Trustees are experienced executives who meet periodically throughout the year to oversee the fund's activities, review contractual arrangements with companies that provide services to the fund, and review the fund's performance. Each of the Trustees oversees 348 funds advised by FMR or an affiliate.
The Trustees hold office without limit in time except that (a) any Trustee may resign; (b) any Trustee may be removed by written instrument, signed by at least two-thirds of the number of Trustees prior to such removal; (c) any Trustee who requests to be retired or who has become incapacitated by illness or injury may be retired by written instrument signed by a majority of the other Trustees; and (d) any Trustee may be removed at any special meeting of shareholders by a two-thirds vote of the outstanding voting securities of the trust. Each Trustee who is not an interested person (as defined in the 1940 Act) (Independent Trustee), shall retire not later than the last day of the calendar year in which his or her 72nd birthday occurs. The Independent Trustees may waive this mandatory retirement age policy with respect to individual Trustees. The executive officers and Advisory Board Member hold office without limit in time, except that any officer and Advisory Board Member may resign or may be removed by a vote of a majority of the Trustees at any regular meeting or any special meeting of the Trustees. Except as indicated, each individual has held the office shown or other offices in the same company for the past five years.
The fund's Statement of Additional Information (SAI) includes more information about the Trustees. To request a free copy, call Fidelity at 1-877-208-0098.
Interested Trustees *:
Correspondence intended for each Trustee who is an interested person may be sent to Fidelity Investments, 82 Devonshire Street, Boston, Massachusetts 02109.
Name, Age; Principal Occupation |
Edward C. Johnson 3d (76) |
| Year of Election or Appointment: 1981 Mr. Johnson is Chairman of the Board of Trustees. Mr. Johnson serves as President (2006-present), Chief Executive Officer, Chairman, and a Director of FMR Corp.; Chairman and a Director of FMR; Chairman and a Director of Fidelity Research & Analysis Company (FRAC); Chairman and a Director of Fidelity Investments Money Management, Inc.; and Chairman (2001-present) and a Director of FMR Co., Inc. In addition, Mr. Johnson serves as Chairman and Director of Fidelity International Limited (FIL). |
Robert L. Reynolds (54) |
| Year of Election or Appointment: 2003 Mr. Reynolds is President and a Director of FMR (2005-present), Fidelity Investments Money Management, Inc. (2005-present), and FMR Co., Inc. (2005-present). Mr. Reynolds also serves as Vice Chairman (2006-present), a Director (2003-present), and Chief Operating Officer of FMR Corp. and a Director of Strategic Advisers, Inc. (2005-present). He also serves on the Board at Fidelity Investments Canada, Ltd. |
* Trustees have been determined to be "Interested Trustees" by virtue of, among other things, their affiliation with the trust or various entities under common control with FMR.
Independent Trustees:
Correspondence intended for each Independent Trustee (that is, the Trustees other than the Interested Trustees) may be sent to Fidelity Investments, P.O. Box 55235, Boston, Massachusetts 02205-5235.
Name, Age; Principal Occupation |
Dennis J. Dirks (58) |
| Year of Election or Appointment: 2005 Prior to his retirement in May 2003, Mr. Dirks was Chief Operating Officer and a member of the Board of The Depository Trust & Clearing Corporation (DTCC) (1999-2003). He also served as President, Chief Operating Officer, and Board member of The Depository Trust Company (DTC) (1999-2003) and President and Board member of the National Securities Clearing Corporation (NSCC) (1999-2003). In addition, Mr. Dirks served as Chief Executive Officer and Board member of the Government Securities Clearing Corporation (2001-2003) and Chief Executive Officer and Board member of the Mortgage-Backed Securities Clearing Corporation (2001-2003). Mr. Dirks also serves as a Trustee and a member of the Finance Committee of Manhattan College (2005-present) and a Trustee and a member of the Finance Committee of AHRC of Nassau County (2006-present). |
Albert R. Gamper, Jr. (64) |
| Year of Election or Appointment: 2006 Prior to his retirement in December 2004, Mr. Gamper served as Chairman of the Board of CIT Group Inc. (commercial finance). During his tenure with CIT Group Inc. Mr. Gamper served in numerous senior management positions, including Chairman (1987-1989; 1999-2001; 2002-2004), Chief Executive Officer (1987-2004), and President (1989-2002). He currently serves as a member of the Board of Directors of Public Service Enterprise Group (utilities, 2001-present), Chairman of the Board of Governors, Rutgers University (2004-present), and Chairman of the Board of Saint Barnabas Health Care System. |
George H. Heilmeier (70) |
| Year of Election or Appointment: 2004 Dr. Heilmeier is Chairman Emeritus of Telcordia Technologies (communication software and systems), where prior to his retirement, he served as company Chairman and Chief Executive Officer. He currently serves on the Boards of Directors of The Mitre Corporation (systems engineering and information technology support for the government), and HRL Laboratories (private research and development, 2004-present). He is Chairman of the General Motors Science & Technology Advisory Board and a Life Fellow of the Institute of Electrical and Electronics Engineers (IEEE). Dr. Heilmeier is a member of the Defense Science Board and the National Security Agency Advisory Board. He is also a member of the National Academy of Engineering, the American Academy of Arts and Sciences, and the Board of Overseers of the School of Engineering and Applied Science of the University of Pennsylvania. Previously, Dr. Heilmeier served as a Director of TRW Inc. (automotive, space, defense, and information technology, 1992-2002), Compaq (1994-2002), Automatic Data Processing, Inc. (ADP) (technology-based business outsourcing, 1995-2002), INET Technologies Inc. (telecommunications network surveillance, 2001-2004), and Teletech Holdings (customer management services). He is the recipient of the 2005 Kyoto Prize in Advanced Technology for his invention of the liquid crystal display, and a member of the Consumer Electronics Hall of Fame. |
James H. Keyes (66) |
| Year of Election or Appointment: 2007 Prior to his retirement in 2003, Mr. Keyes was Chairman, President, and Chief Executive Officer of Johnson Controls, Inc. (automotive supplier, 1993-2003). He currently serves as a member of the boards of LSI Logic Corporation (semiconductor technologies), Navistar International Corporation (manufacture and sale of trucks, buses, and diesel engines, 2002-present), and Pitney Bowes, Inc. (integrated mail, messaging, and document management solutions). |
Marie L. Knowles (60) |
| Year of Election or Appointment: 2001 Prior to Ms. Knowles' retirement in June 2000, she served as Executive Vice President and Chief Financial Officer of Atlantic Richfield Company (ARCO) (diversified energy, 1996-2000). From 1993 to 1996, she was a Senior Vice President of ARCO and President of ARCO Transportation Company. She served as a Director of ARCO from 1996 to 1998. She currently serves as a Director of Phelps Dodge Corporation (copper mining and manufacturing) and McKesson Corporation (healthcare service, 2002-present). Ms. Knowles is a Trustee of the Brookings Institution and the Catalina Island Conservancy and also serves as a member of the Advisory Board for the School of Engineering of the University of Southern California. |
Ned C. Lautenbach (62) |
| Year of Election or Appointment: 2000 Mr. Lautenbach is Chairman of the Independent Trustees (2006-present). Mr. Lautenbach has been a partner of Clayton, Dubilier & Rice, Inc. (private equity investment firm) since September 1998. Previously, Mr. Lautenbach was with the International Business Machines Corporation (IBM) from 1968 until his retirement in 1998. Mr. Lautenbach serves as a Director of Sony Corporation (2006-present) and Eaton Corporation (diversified industrial) as well as the Philharmonic Center for the Arts in Naples, Florida. He also is a member of the Board of Trustees of Fairfield University (2005-present), as well as a member of the Council on Foreign Relations. |
Cornelia M. Small (62) |
| Year of Election or Appointment: 2005 Ms. Small is a member (2000-present) and Chairperson (2002-present) of the Investment Committee, and a member (2002-present) of the Board of Trustees of Smith College. Previously, she served as Chief Investment Officer (1999-2000), Director of Global Equity Investments (1996-1999), and a member of the Board of Directors of Scudder, Stevens & Clark (1990-1997) and Scudder Kemper Investments (1997-1999). In addition, Ms. Small served as Co-Chair (2000-2003) of the Annual Fund for the Fletcher School of Law and Diplomacy. |
William S. Stavropoulos (67) |
| Year of Election or Appointment: 2001 Mr. Stavropoulos is Chairman Emeritus of the Board of Directors of The Dow Chemical Company. Since joining The Dow Chemical Company in 1967, Mr. Stavropoulos served in numerous senior management positions, including President (1993-2000; 2002-2003), CEO (1995-2000; 2002-2004), and Chairman of the Executive Committee (2000-2004). Currently, he is a Director of NCR Corporation (data warehousing and technology solutions), BellSouth Corporation (telecommunications), Chemical Financial Corporation, Maersk Inc. (industrial conglomerate, 2002-present), and Metalmark Capital (private equity investment firm, 2005-present). He also serves as a member of the Board of Trustees of the American Enterprise Institute for Public Policy Research. In addition, Mr. Stavropoulos is a member of The Business Council, J.P. Morgan International Council and the University of Notre Dame Advisory Council for the College of Science. |
Kenneth L. Wolfe (67) |
| Year of Election or Appointment: 2005 Prior to his retirement in 2001, Mr. Wolfe was Chairman and Chief Executive Officer of Hershey Foods Corporation (1993-2001). He currently serves as a member of the boards of Adelphia Communications Corporation (2003-present), Bausch & Lomb, Inc., and Revlon Inc. (2004-present). |
Advisory Board Member and Executive Officers:
Correspondence intended for each executive officer and Mr. Lynch may be sent to Fidelity Investments, 82 Devonshire Street, Boston, Massachusetts 02109.
Name, Age; Principal Occupation |
Peter S. Lynch (62) |
| Year of Election or Appointment: 2003 Member of the Advisory Board of Variable Insurance Products Fund. Mr. Lynch is Vice Chairman and a Director of FMR, and Vice Chairman (2001-present) and a Director of FMR Co., Inc. Previously, Mr. Lynch served as a Trustee of the Fidelity funds (1990-2003). In addition, he serves as a Trustee of Boston College and as the Chairman of the Inner-City Scholarship Fund. |
Kimberley H. Monasterio (43) |
| Year of Election or Appointment: 2007 President and Treasurer of VIP Equity-Income. Ms. Monasterio also serves as President and Treasurer of other Fidelity funds (2007-present) and is an employee of FMR (2004-present). Previously, Ms. Monasterio served as Deputy Treasurer of the Fidelity funds (2004-2006). Before joining Fidelity Investments, Ms. Monasterio served as Treasurer (2000-2004) and Chief Financial Officer (2002-2004) of the Franklin Templeton Funds and Senior Vice President of Franklin Templeton Services, LLC (2000-2004). |
Dwight D. Churchill (53) |
| Year of Election or Appointment: 2005 Vice President of VIP Equity-Income. Mr. Churchill also serves as Vice President of certain Equity Funds (2005-present). Mr. Churchill is Executive Vice President of FMR (2005-present) and FMR Co., Inc. (2005-present). Previously, Mr. Churchill served as Senior Vice President of Fidelity Investments Money Management, Inc. (2005-2006), Head of Fidelity's Fixed-Income Division (2000-2005), Vice President of Fidelity's Money Market Funds (2000-2005), Vice President of Fidelity's Bond Funds, and Senior Vice President of FMR. |
Bruce T. Herring (41) |
| Year of Election or Appointment: 2006 Vice President of VIP Equity-Income. Mr. Herring also serves as Vice President of certain Equity Funds (2006-present). Mr. Herring is Senior Vice President of FMR (2006-present) and Vice President of FMR Co., Inc. (2001-present). Previously, Mr. Herring served as a portfolio manager for Fidelity U.S. Equity Funds (2001-2005). |
Stephen R. Petersen (50) |
| Year of Election or Appointment: 1997 Vice President of VIP Equity-Income. Mr. Petersen also serves as Vice President of other funds advised by FMR. Prior to assuming his current responsibilities, Mr. Petersen worked as a research analyst and portfolio manager. Mr. Petersen also serves as Senior Vice President of FMR (1999) and FMR Co., Inc. (2001). |
Eric D. Roiter (58) |
| Year of Election or Appointment: 1998 Secretary of VIP Equity-Income. He also serves as Secretary of other Fidelity funds; Vice President, General Counsel, and Secretary of FMR Co., Inc. (2001-present) and FMR; Assistant Secretary of Fidelity Management & Research (U.K.) Inc. (2001-present), Fidelity Research & Analysis Company (2001-present), and Fidelity Investments Money Management, Inc. (2001-present). Mr. Roiter is an Adjunct Member, Faculty of Law, at Boston College Law School (2003-present). Previously, Mr. Roiter served as Vice President and Secretary of Fidelity Distributors Corporation (FDC) (1998-2005). |
Stuart Fross (47) |
| Year of Election or Appointment: 2003 Assistant Secretary of VIP Equity-Income. Mr. Fross also serves as Assistant Secretary of other Fidelity funds (2003-present), Vice President and Secretary of FDC (2005-present), and is an employee of FMR. |
R. Stephen Ganis (40) |
| Year of Election or Appointment: 2006 Anti-Money Laundering (AML) officer of VIP Equity-Income. Mr. Ganis also serves as AML officer of other Fidelity funds (2006-present) and FMR Corp. (2003-present). Before joining Fidelity Investments, Mr. Ganis practiced law at Goodwin Procter, LLP (2000-2002). |
Joseph B. Hollis (58) |
| Year of Election or Appointment: 2006 Chief Financial Officer of VIP Equity-Income. Mr. Hollis also serves as Chief Financial Officer of other Fidelity funds. Mr. Hollis is President of Fidelity Pricing and Cash Management Services (FPCMS) (2005-present). Mr. Hollis also serves as President and Director of Fidelity Service Company, Inc. (2006-present). Previously, Mr. Hollis served as Senior Vice President of Cash Management Services (1999-2002) and Investment Management Operations (2002-2005). |
Kenneth A. Rathgeber (59) |
| Year of Election or Appointment: 2004 Chief Compliance Officer of VIP Equity-Income. Mr. Rathgeber also serves as Chief Compliance Officer of other Fidelity funds (2004-present) and Executive Vice President of Risk Oversight for Fidelity Investments (2002-present). He is Chief Compliance Officer of FMR (2005-present), FMR Co., Inc. (2005-present), Fidelity Management & Research (U.K.) Inc. (2005-present), Fidelity Research & Analysis Company (2005-present), Fidelity Investments Money Management, Inc. (2005-present), and Strategic Advisers, Inc. (2005-present). Previously, Mr. Rathgeber served as Executive Vice President and Chief Operating Officer for Fidelity Investments Institutional Services Company, Inc. (1998-2002). |
Bryan A. Mehrmann (45) |
| Year of Election or Appointment: 2005 Deputy Treasurer of VIP Equity-Income. Mr. Mehrmann also serves as Deputy Treasurer of other Fidelity funds (2005-present) and is an employee of FMR. Previously, Mr. Mehrmann served as Vice President of Fidelity Investments Institutional Services Group (FIIS)/Fidelity Investments Institutional Operations Corporation, Inc. (FIIOC) Client Services (1998-2004). |
Kenneth B. Robins (37) |
| Year of Election or Appointment: 2005 Deputy Treasurer of VIP Equity-Income. Mr. Robins also serves as Deputy Treasurer of other Fidelity funds (2005-present) and is an employee of FMR (2004-present). Before joining Fidelity Investments, Mr. Robins worked at KPMG LLP, where he was a partner in KPMG's department of professional practice (2002-2004) and a Senior Manager (1999-2000). In addition, Mr. Robins served as Assistant Chief Accountant, United States Securities and Exchange Commission (2000-2002). |
Robert G. Byrnes (40) |
| Year of Election or Appointment: 2005 Assistant Treasurer of VIP Equity-Income. Mr. Byrnes also serves as Assistant Treasurer of other Fidelity funds (2005-present) and is an employee of FMR (2005-present). Previously, Mr. Byrnes served as Vice President of FPCMS (2003-2005). Before joining Fidelity Investments, Mr. Byrnes worked at Deutsche Asset Management where he served as Vice President of the Investment Operations Group (2000-2003). |
John H. Costello (60) |
| Year of Election or Appointment: 1986 Assistant Treasurer of VIP Equity-Income. Mr. Costello also serves as Assistant Treasurer of other Fidelity funds and is an employee of FMR. |
Peter L. Lydecker (52) |
| Year of Election or Appointment: 2004 Assistant Treasurer of VIP Equity-Income. Mr. Lydecker also serves as Assistant Treasurer of other Fidelity funds (2004) and is an employee of FMR. |
Mark Osterheld (51) |
| Year of Election or Appointment: 2002 Assistant Treasurer of VIP Equity-Income. Mr. Osterheld also serves as Assistant Treasurer of other Fidelity funds (2002) and is an employee of FMR. |
Gary W. Ryan (48) |
| Year of Election or Appointment: 2005 Assistant Treasurer of VIP Equity-Income. Mr. Ryan also serves as Assistant Treasurer of other Fidelity funds (2005-present) and is an employee of FMR (2005-present). Previously, Mr. Ryan served as Vice President of Fund Reporting in FPCMS (1999-2005). |
Salvatore Schiavone (41) |
| Year of Election or Appointment: 2005 Assistant Treasurer of VIP Equity-Income. Mr. Schiavone also serves as Assistant Treasurer of other Fidelity funds (2005-present) and is an employee of FMR (2005-present). Before joining Fidelity Investments, Mr. Schiavone worked at Deutsche Asset Management, where he most recently served as Assistant Treasurer (2003-2005) of the Scudder Funds and Vice President and Head of Fund Reporting (1996-2003). |
Annual Report
Distributions
The Board of Trustees of VIP Equity-Income Portfolio voted to pay to shareholders of record at the opening of business on record date, the following distributions per share derived from capital gains realized from sales of portfolio securities, and dividends derived from net investment income:
| Pay Date | Record Date | Dividends | Capital Gains |
Initial Class | 02/09/07 | 02/09/07 | $.01 | $.04 |
Service Class | 02/09/07 | 02/09/07 | $.01 | $.04 |
Service Class 2 | 02/09/07 | 02/09/07 | $.01 | $.04 |
Investor Class | 02/09/07 | 02/09/07 | $.01 | $.04 |
The fund hereby designates as a capital gain dividend with respect to the taxable year ended December 31, 2006 $760,494,950, or, if subsequently determined to be different, the net capital gain of such year.
Initial Class designates 76% and 86%; Service Class designates 79% and 90%; Service Class 2 designates 83% and 95%; and Investor Class designates 75% and 88% of the dividends distributed in February and December 2006 respectively, during the fiscal year as qualifying for the dividends-received deduction for corporate shareholders.
The fund will notify shareholders in January 2007 of amounts for use in preparing 2006 income tax returns.
VIP Equity-Income Portfolio
Proxy Voting Results
A special meeting of the fund's shareholders was held on November 15, 2006. The results of votes taken among shareholders on the proposal before them are reported below. Each vote reported represents one dollar of net asset value held on the record date for the meeting.
PROPOSAL 1 |
To elect a Board of Trustees. A |
| # of
Votes | % of
Votes |
Dennis J. Dirks |
Affirmative | 17,902,425,874.20 | 95.888 |
Withheld | 767,753,174.62 | 4.112 |
TOTAL | 18,670,179,048.82 | 100.000 |
Albert R. Gamper, Jr. |
Affirmative | 17,903,848,885.90 | 95.895 |
Withheld | 766,330,162.92 | 4.105 |
TOTAL | 18,670,179,048.82 | 100.000 |
Robert M. Gates |
Affirmative | 17,872,803,847.04 | 95.729 |
Withheld | 797,375,201.78 | 4.271 |
TOTAL | 18,670,179,048.82 | 100.000 |
George H. Heilmeier |
Affirmative | 17.870,083,099.32 | 95.715 |
Withheld | 800,095,949.50 | 4.285 |
TOTAL | 18,670,179,048.82 | 100.000 |
Edward C. Johnson 3d |
Affirmative | 17,855,450,949.13 | 95.636 |
Withheld | 814,728,099.69 | 4.364 |
TOTAL | 18,670,179,048.82 | 100.000 |
Stephen P. Jonas |
Affirmative | 17,891,792,907.31 | 95.831 |
Withheld | 778,386,141.51 | 4.169 |
TOTAL | 18,670,179,048.82 | 100.000 |
James H. KeyesB |
Affirmative | 17,882,873,107.76 | 95.783 |
Withheld | 787,305,941.06 | 4.217 |
TOTAL | 18,670,179,048.82 | 100.000 |
Marie L. Knowles |
Affirmative | 17,891,908,567.08 | 95.831 |
Withheld | 778,270,481.74 | 4.169 |
TOTAL | 18,670,179,048.82 | 100.000 |
Ned C. Lautenbach |
Affirmative | 17,899,551,251.03 | 95.872 |
Withheld | 770,627,797.79 | 4.128 |
TOTAL | 18,670,179,048.82 | 100.000 |
| # of
Votes | % of
Votes |
William O. McCoy |
Affirmative | 17,860,461,325.05 | 95.663 |
Withheld | 809,717,723.77 | 4.337 |
TOTAL | 18,670,179,048.82 | 100.000 |
Robert L. Reynolds |
Affirmative | 17,894,978,918.13 | 95.848 |
Withheld | 775,200,130.69 | 4.152 |
TOTAL | 18,670,179,048.82 | 100.000 |
Cornelia M. Small |
Affirmative | 17,897,519,970.69 | 95.862 |
Withheld | 772,659,078.13 | 4.138 |
TOTAL | 18,670,179,048.82 | 100.000 |
William S. Stavropoulos |
Affirmative | 17,871,058,112.55 | 95.720 |
Withheld | 799,120,936.27 | 4.280 |
TOTAL | 18,670,179,048.82 | 100.000 |
Kenneth L. Wolfe |
Affirmative | 17,886,340,376.33 | 95.802 |
Withheld | 783,838,672.49 | 4.198 |
TOTAL | 18,670,179,048.82 | 100.000 |
A Denotes trust-wide proposal and voting results. B Effective on or about January 1, 2007. |
Annual Report
Board Approval of Investment Advisory Contracts and Management Fees
VIP Equity-Income Portfolio
Each year, typically in July, the Board of Trustees, including the Independent Trustees (together, the Board), votes on the renewal of the management contract and sub-advisory agreements (together, the Advisory Contracts) for the fund. The Board, assisted by the advice of fund counsel and Independent Trustees' counsel, requests and considers a broad range of information throughout the year.
The Board meets regularly each month except August and takes into account throughout the year matters bearing on Advisory Contracts. The Board, acting directly and through its separate committees, considers at each of its meetings factors that are relevant to the annual renewal of the fund's Advisory Contracts, including the services and support provided to the fund and its shareholders. At the time of the renewal, the Board had 12 standing committees, each composed of Independent Trustees with varying backgrounds, to which the Board has assigned specific subject matter responsibilities in order to enhance effective decision-making by the Board. Each committee has adopted a written charter outlining the structure and purposes of the committee. One such committee, the Equity Contract Committee, meets periodically as needed throughout the year to consider matters specifically related to the annual renewal of Advisory Contracts. The committee requests and receives information on, and makes recommendations to the Independent Trustees concerning, the approval and annual review of the Advisory Contracts.
At its July 2006 meeting, the Board of Trustees, including the Independent Trustees, unanimously determined to renew the Advisory Contracts for the fund. In reaching its determination, the Board considered all factors it believed relevant, including (i) the nature, extent, and quality of the services to be provided to the fund and its shareholders (including the investment performance of the fund); (ii) the competitiveness of the management fee and total expenses of the fund; (iii) the total costs of the services to be provided by and the profits to be realized by the investment adviser and its affiliates from the relationship with the fund; (iv) the extent to which economies of scale would be realized as the fund grows; and (v) whether fee levels reflect these economies of scale, if any, for the benefit of fund shareholders.
In determining whether to renew the Advisory Contracts for the fund, the Board ultimately reached a determination, with the assistance of fund counsel and Independent Trustees' counsel, that the renewal of the Advisory Contracts and the compensation to be received by Fidelity under the management contract is consistent with Fidelity's fiduciary duty under applicable law. In addition to evaluating the specific factors noted above, the Board, in reaching its determination, is aware that shareholders in the fund have a broad range of investment choices available to them, including a wide choice among mutual funds offered by competitors to Fidelity, and that the fund's shareholders, with the opportunity to review and weigh the disclosure provided by the fund in its prospectus and other public disclosures, have chosen to invest in this fund, managed by Fidelity.
Nature, Extent, and Quality of Services Provided. The Board considered staffing within the investment adviser, FMR, and the sub-advisers (together, the Investment Advisers), including the background of the fund's portfolio manager and the fund's investment objective and discipline. The Independent Trustees also had discussions with senior management of Fidelity's investment operations and investment groups. The Board considered the structure of the portfolio manager compensation program and whether this structure provides appropriate incentives.
Resources Dedicated to Investment Management and Support Services. The Board reviewed the size, education, and experience of the Investment Advisers' investment staff, their use of technology, and the Investment Advisers' approach to recruiting, training, and retaining portfolio managers and other research, advisory, and management personnel. The Board considered Fidelity's extensive global research capabilities that enable the Investment Advisers to aggregate data from various sources in an effort to produce positive investment results. The Board noted that Fidelity's analysts have access to a variety of technological tools that enable them to perform both fundamental and quantitative analysis and to specialize in various disciplines. The Board also considered that Fidelity's portfolio managers and analysts have access to daily portfolio attribution that allows for monitoring of a fund's portfolio, as well as an electronic communication system that provides immediate real-time access to research concerning issuers and credit enhancers.
Shareholder and Administrative Services. The Board considered (i) the nature, extent, quality, and cost of administrative, distribution, and shareholder services performed by the Investment Advisers and their affiliates under the Advisory Contracts and under separate agreements covering transfer agency, pricing and bookkeeping, and securities lending services for the fund; (ii) the nature and extent of the Investment Advisers' supervision of third party service providers, principally custodians and subcustodians; and (iii) the resources devoted to, and the record of compliance with, the fund's compliance policies and procedures. The Board reviewed the allocation of fund brokerage, including allocations to brokers affiliated with the Investment Advisers, the use of brokerage commissions to pay fund expenses, and the use of "soft" commission dollars to pay for research services. The Board also considered that Fidelity voluntarily pays for market data out of its own resources.
The Board noted that the growth of fund assets across the complex allows Fidelity to reinvest in the development of services designed to enhance the value or convenience of the Fidelity funds as investment vehicles. These services include 24-hour access to account information and market information through phone representatives and over the Internet, and investor education materials and asset allocation tools.
Investment in a Large Fund Family. The Board considered the benefits to shareholders of investing in a Fidelity fund, including the benefits of investing in a fund that is part of a large family of funds offering a variety of investment disciplines and providing for a large variety of mutual fund investor services. The Board noted that, since the last Advisory Contract renewals in July 2005, Fidelity has taken a number of actions that benefited particular funds, including (i) dedicating additional resources to investment research and to restructure the investment research teams; (ii) voluntarily entering into contractual arrangements with certain brokers pursuant to which Fidelity pays for research products and services separately out of its own resources, rather than bundling with fund commissions; (iii) launching the Fidelity Advantage Class of its five Spartan stock index funds and three Spartan bond index funds, which is a lower-fee class available to shareholders with higher account balances; (iv) contractually agreeing to impose expense limitations on Fidelity U.S. Bond Index Fund and reducing the fund's initial investment minimum; and (v) offering shareholders of each of the Fidelity Institutional Money Market Funds the privilege of exchanging shares of the fund for shares of other Fidelity funds.
VIP Equity-Income Portfolio
Investment Performance and Compliance. The Board considered whether the fund has operated within its investment objective, as well as its record of compliance with its investment restrictions. It also reviewed the fund's absolute investment performance for each class (except Investor Class), as well as the fund's relative investment performance for each class (except Investor Class) measured against (i) a broad-based securities market index, and (ii) a peer group of mutual funds deemed appropriate by the Board over multiple periods. The following charts considered by the Board show, over the one-, three-, and five-year periods ended December 31, 2005, the cumulative total returns of Service Class 2 and Initial Class of the fund, the cumulative total returns of a broad-based securities market index ("benchmark"), and a range of cumulative total returns of a peer group of mutual funds identified by Lipper Inc. as having an investment objective similar to that of the fund. The returns of Service Class 2 and Initial Class represent the performance of classes with the highest and lowest 12b-1 fees, respectively (not necessarily with the highest and lowest total expenses). (Investor Class of the fund, which has no 12b-1 fee, had less than one year of performance as of December 31, 2005.) The box within each chart shows the 25th percentile return (bottom of box) and the 75th percentile return (top of box) of the Lipper peer group. Returns shown above the box are in the first quartile and returns shown below the box are in the fourth quartile. The percentage beaten numbers noted below each chart correspond to the percentile box and represent the percentage of funds in the Lipper peer group whose performance was equal to or lower than that of the class indicated.
VIP Equity-Income Portfolio

The Board reviewed the fund's relative investment performance against its Lipper peer group and stated that the performance of Initial Class of the fund was in the second quartile for all the periods shown. The Board also stated that the relative investment performance of the fund was lower than its benchmark for all the periods shown. The Board considered that the variations in performance among the fund's classes reflect the variations in class expenses, which result in lower performance for higher expense classes.
The Board considered that FMR has taken steps to refocus and strengthen equity research, equity portfolio management, and compliance. The Board noted with favor FMR's reorganization of its senior management team in 2005 and FMR's dedication of additional resources to investment research, and participated in the process that led to those changes.
Based on its review, and giving particular weight to the nature and quality of the resources dedicated by the Investment Advisers to maintain and improve relative performance, the Board concluded that the nature, extent, and quality of the services provided to the fund will benefit the fund's shareholders, particularly in light of the Board's view that the fund's shareholders benefit from investing in a fund that is part of a large family of funds offering a variety of investment disciplines and services.
Competitiveness of Management Fee and Total Fund Expenses. The Board considered the fund's management fee and total expenses compared to "mapped groups" of competitive funds and classes. Fidelity creates "mapped groups" by combining similar Lipper investment objective categories that have comparable management fee characteristics. Combining Lipper investment objective categories aids the Board's management fee and total expense comparisons by broadening the competitive group used for comparison and by reducing the number of universes to which various Fidelity funds are compared.
Annual Report
Board Approval of Investment Advisory Contracts and Management Fees - continued
The Board considered two proprietary management fee comparisons for the 12-month periods shown in the chart below. The group of Lipper funds used by the Board for management fee comparisons is referred to below as the "Total Mapped Group" and, for the reasons explained above, is broader than the Lipper peer group used by the Board for performance comparisons. The Total Mapped Group comparison focuses on a fund's standing relative to the total universe of comparable funds available to investors, in terms of gross management fees before expense reimbursements or caps. "TMG %" represents the percentage of funds in the Total Mapped Group that had management fees that were lower than the fund's. For example, a TMG % of 10% means that 90% of the funds in the Total Mapped Group had higher management fees than the fund. The "Asset-Size Peer Group" (ASPG) comparison focuses on a fund's standing relative to non-Fidelity funds similar in size to the fund within the Total Mapped Group. The ASPG represents at least 15% of the funds in the Total Mapped Group with comparable asset size and management fee characteristics, subject to a minimum of 50 funds (or all funds in the Total Mapped Group if fewer than 50). Additional information, such as the ASPG quartile in which the fund's management fee ranked, is also included in the chart and considered by the Board.
VIP Equity-Income Portfolio
The Board noted that the fund's management fee ranked below the median of its Total Mapped Group and below the median of its ASPG for 2005.
Based on its review, the Board concluded that the fund's management fee was fair and reasonable in light of the services that the fund receives and the other factors considered.
In its review of each class's total expenses, the Board considered the fund's management fee as well as other fund or class expenses, as applicable, such as transfer agent fees, pricing and bookkeeping fees, fund-paid 12b-1 fees, and custodial, legal, and audit fees. The Board also noted the effects of any waivers and reimbursements on fees and expenses. As part of its review, the Board also considered current and historical total expenses of each class of the fund compared to competitive fund median expenses. Each class of the fund is compared to those funds and classes in the Total Mapped Group (used by the Board for management fee comparisons) that have a similar sales load structure.
The Board noted that the total expenses of each class ranked below its competitive median for 2005.
In its review of total expenses, the Board also considered Fidelity fee structures and other information on clients that FMR and its affiliates service in other competitive markets, such as other mutual funds advised or subadvised by FMR or its affiliates, pension plan clients, and other institutional clients.
Based on its review, the Board concluded that the total expenses of each class of the fund were reasonable in light of the services that the fund and its shareholders receive and the other factors considered.
Costs of the Services and Profitability. The Board considered the revenues earned and the expenses incurred by Fidelity in conducting the business of developing, marketing, distributing, managing, administering and servicing the fund and its shareholders. The Board also considered the level of Fidelity's profits in respect of all the Fidelity funds.
VIP Equity-Income Portfolio
On an annual basis, FMR presents to the Board Fidelity's profitability for the fund. Fidelity calculates the profitability for each fund, as well as aggregate profitability for groups of Fidelity funds and all Fidelity funds, using a series of detailed revenue and cost allocation methodologies which originate with the audited books and records of Fidelity. The Audit Committee of the Board reviews any significant changes from the prior year's methodologies.
PricewaterhouseCoopers LLP (PwC), independent registered accounting firm and auditor to Fidelity and certain Fidelity funds, has been engaged annually by the Board as part of the Board's assessment of the results of Fidelity's profitability analysis. PwC's engagement includes the review and assessment of Fidelity's methodologies used in determining the revenues and expenses attributable to Fidelity's mutual fund business, and completion of agreed-upon procedures surrounding the mathematical accuracy of fund profitability and its conformity to allocation methodologies. After considering PwC's reports issued under the engagement and information provided by Fidelity, the Board believes that while other allocation methods may also be reasonable, Fidelity's profitability methodologies are reasonable in all material respects.
The Board has also reviewed Fidelity's non-fund businesses and any fall-out benefits related to the mutual fund business as well as cases where Fidelity's affiliates may benefit from or be related to the fund's business.
The Board considered the costs of the services provided by and the profits realized by Fidelity in connection with the operation of the fund and determined that the amount of profit is a fair entrepreneurial profit for the management of the fund.
Economies of Scale. The Board considered whether there have been economies of scale in respect of the management of the Fidelity funds, whether the Fidelity funds (including the fund) have appropriately benefited from any such economies of scale, and whether there is potential for realization of any further economies of scale. The Board considered the extent to which the fund will benefit from economies of scale through increased services to the fund, through waivers or reimbursements, or through fee or expense reductions.
The Board recognized that the fund's management contract incorporates a "group fee" structure, which provides for lower fee rates as total fund assets under FMR's management increase, and for higher fee rates as total fund assets under FMR's management decrease. The Board considered that the group fee is designed to deliver the benefits of economies of scale to fund shareholders when total fund assets increase, even if assets of any particular fund are unchanged or have declined, because some portion of Fidelity's costs are attributable to services provided to all Fidelity funds, and all funds benefit if those costs can be allocated among more assets. The Board concluded that, given the group fee structure, fund shareholders will achieve a certain level of economies of scale as assets under FMR's management increase at the fund complex level, regardless of whether Fidelity achieves any such economies of scale.
The Board further concluded that any potential economies of scale are being shared between fund shareholders and Fidelity in an appropriate manner.
Additional Information Requested by the Board. In order to develop fully the factual basis for consideration of the Advisory Contracts, the Board requested additional information on several topics, including (i) Fidelity's fund profitability methodology and profitability trends within certain funds; (ii) portfolio manager compensation; (iii) the extent to which any economies of scale exist and are shared between the funds and Fidelity; (iv) the total expenses of certain funds and classes relative to competitors, including the extent to which the expenses of certain funds have been or could be capped; (v) fund performance trends; and (vi) Fidelity's fee structures, including use of performance fees.
Based on its evaluation of all of the conclusions noted above, and after considering all material factors, the Board ultimately concluded that the advisory fee structures are fair and reasonable, and that the fund's Advisory Contracts should be renewed.
Annual Report
Investment Adviser
Fidelity Management & Research Company
Boston, MA
Investment Sub-Advisers
FMR Co., Inc.
Fidelity Management & Research (U.K.) Inc.
Fidelity Research & Analysis Company
(formerly Fidelity Management &
Research (Far East) Inc.)
Fidelity Investments Japan Limited
Fidelity International Investment Advisors
Fidelity International Investment Advisors (U.K.) Limited
General Distributor
Fidelity Distributors Corporation
Boston, MA
Transfer and Service Agents
Fidelity Investments Institutional Operations Company, Inc.
Boston, MA
Fidelity Service Company, Inc.
Boston, MA
Custodian
The Northern Trust Company
Chicago, IL
VIPEI-ANN-0207
1.540027.109
Fidelity® Variable Insurance Products:
Equity-Income Portfolio - Service Class 2R
Annual Report
December 31, 2006
(2_fidelity_logos) (Registered_Trademark)
Contents
Performance | <Click Here> | How the fund has done over time. |
Management's Discussion | <Click Here> | The manager's review of fund performance, strategy and outlook. |
Shareholder Expense Example | <Click Here> | An example of shareholder expenses. |
Investment Changes | <Click Here> | A summary of major shifts in the fund's investments over the past six months. |
Investments | <Click Here> | A complete list of the fund's investments with their
market values. |
Financial Statements | <Click Here> | Statements of assets and liabilities, operations, and
changes in net assets, as well as financial highlights. |
Notes | <Click Here> | Notes to the financial statements. |
Report of Independent Registered Public Accounting Firm | <Click Here> | |
Trustees and Officers | <Click Here> | |
Distributions | <Click Here> | |
Proxy Voting Results | <Click Here> | |
Board Approval of Investment Advisory Contracts and Management Fees | <Click Here> | |
To view a fund's proxy voting guidelines and proxy voting record for the 12-month period ended June 30, visit www.fidelity.com/proxyvotingresults or visit the Securities and Exchange Commission's (SEC) web site at www.sec.gov. You may also call 1-877-208-0098 to request a free copy of the proxy voting guidelines.
Fidelity Variable Insurance Products are separate account options which are purchased through a variable insurance contract.
Standard & Poor's, S&P and S&P 500 are registered service marks of The McGraw-Hill Companies, Inc. and have been licensed for use by Fidelity Distributors Corporation.
Other third party marks appearing herein are the property of their respective owners.
All other marks appearing herein are registered or unregistered trademarks or service marks of FMR Corp. or an affiliated company.
This report and the financial statements contained herein are submitted for the general information of the shareholders of the fund. This report is not authorized for distribution to prospective investors in the fund unless preceded or accompanied by an effective prospectus.
A fund files its complete schedule of portfolio holdings with the SEC for the first and third quarters of each fiscal year on Form N-Q. Forms N-Q are available on the SEC's web site at http://www.sec.gov. A fund's Forms N-Q may be reviewed and copied at the SEC's Public Reference Room in Washington, DC. Information regarding the operation of the SEC's Public Reference Room may be obtained by calling 1-800-SEC-0330. For a complete list of a fund's portfolio holdings, view the most recent quarterly holdings report, semiannual report, or annual report on Fidelity's web site at http://www.advisor.fidelity.com.
NOT FDIC INSURED · MAY LOSE VALUE · NO BANK GUARANTEE
Neither the fund nor Fidelity Distributors Corporation is a bank.
VIP Equity-Income Portfolio
VIP Equity-Income Portfolio - Service Class 2R
Performance: The Bottom Line
Average annual total return reflects the change in the value of an investment, assuming reinvestment of a class' dividend income and capital gains (the profits earned upon the sale of securities that have grown in value) and assuming a constant rate of performance each year. During periods of reimbursement by Fidelity, a fund's total return will be greater than it would be had the reimbursement not occurred. Performance numbers are net of all underlying fund operating expenses, but do not include any insurance charges imposed by your insurance company's separate account. If performance information included the effect of these additional charges, the total returns would have been lower. How a fund did yesterday is no guarantee of how it will do tomorrow.
Average Annual Total Returns
Periods ended December 31, 2006 | Past 1
year | Past 5
years | Past 10
years |
VIP Equity Income - Service Class 2R A | 19.89% | 8.68% | 8.96% |
A The initial offering of Service Class 2R shares took place on April 24, 2002. Performance for Service Class 2R shares reflects an asset-based distribution fee (12b-1 fee). Returns from January 12, 2000 to April 24, 2002 are those of Service Class 2. Service Class 2R returns from November 3, 1997 to January 12, 2000 are those of Service Class which reflects a different 12b-1 fee. Service Class 2R returns prior to November 3, 1997 are those of Initial Class, and do not include the effects of a 12b-1 fee. Had Service Class 2R shares' 12b-1 fee been reflected, returns prior to January 12, 2000 would have been lower.
$10,000 Over 10 Years
Let's say hypothetically that $10,000 was invested in VIP Equity-Income Portfolio - Service Class 2R on December 31, 1996. The chart shows how the value of your investment would have changed, and also shows how the Russell 3000® Value Index performed over the same period.

Annual Report
VIP Equity-Income Portfolio
Management's Discussion of Fund Performance
Comments from Stephen Petersen, Portfolio Manager of VIP Equity-Income Portfolio
U.S. stock markets registered their fourth consecutive year of positive returns in 2006. Among the highlights were the performances of the Dow Jones Industrial AverageSM - a gauge of 30 mega-cap, blue-chip stocks - and the small-cap-oriented Russell 2000® Index, both of which reached new highs. The efforts of the Federal Reserve Board to contain inflation levels also dominated the investment headlines. In all, the Fed hiked short-term interest rates four times, but held rates steady after its June 29 increase, finally pausing after 17 rate hikes over a two-year period. A slowing residential housing market and moderating oil prices - the latter of which hit a record closing high of $77 per barrel in July before falling sharply - also held economic growth in check. For the year overall, the Standard & Poor's 500SM Index was up 15.79%, the Dow advanced 19.05%, the Russell 2000 Index gained 18.37% and the NASDAQ Composite® Index rose 10.39%.
For the 12 months ending December 31, 2006, the fund underperformed the Russell 3000® Value Index, which returned 22.34%. (For specific portfolio performance results, please refer to the performance section of this report.) The fund's large-cap orientation relative to the index helped performance, but not enough to offset weak stock picks in industrials, materials, technology and consumer staples. However, the fund trailed the Russell index only modestly, as its focus on high-quality companies and good picks in banks, consumer discretionary and the exceptionally strong telecommunication services sector helped results. Detractors from performance included semiconductor giant Intel, which lost market share to Advanced Micro Devices in the server-based microprocessor market. Wal-Mart's disappointing operating results and sluggish sales growth caused its stock performance to lag. Contributors included telecommunications company BellSouth, which benefited from the announcement that it would be acquired by AT&T. Strong growth in defense spending helped aerospace/defense company Lockheed Martin produce better-than-expected revenues and earnings results.
The views expressed above reflect those of the portfolio manager(s) only through the end of the period as stated on the cover of this report and do not necessarily represent the views of Fidelity or any other person in the Fidelity organization. Any such views are subject to change at any time based upon market or other conditions and Fidelity disclaims any responsibility to update such views. These views may not be relied on as investment advice and, because investment decisions for a Fidelity fund are based on numerous factors, may not be relied on as an indication of trading intent on behalf of any Fidelity fund.
VIP Equity-Income Portfolio
VIP Equity-Income Portfolio
Shareholder Expense Example
As a shareholder of the Fund, you incur two types of costs: (1) transaction costs, including redemption fees, and (2) ongoing costs, including management fees, distribution and/or service (12b-1) fees and other Fund expenses. This Example is intended to help you understand your ongoing costs (in dollars) of investing in the Fund and to compare these costs with the ongoing costs of investing in other mutual funds.
The Example is based on an investment of $1,000 invested at the beginning of the period and held for the entire period (July 1, 2006 to December 31, 2006).
Actual Expenses
The first line of the accompanying table for each class of the Fund provides information about actual account values and actual expenses. You may use the information in this line, together with the amount you invested, to estimate the expenses that you paid over the period. Simply divide your account value by $1,000.00 (for example, an $8,600 account value divided by $1,000.00 = 8.6), then multiply the result by the number in the first line for a class of the Fund under the heading entitled "Expenses Paid During Period" to estimate the expenses you paid on your account during this period. The estimate of expenses does not include any fees or other expenses of any variable annuity or variable life insurance product. If they were, the estimate of expenses you paid during the period would be higher, and your ending account value would be lower.
Hypothetical Example for Comparison Purposes
The second line of the accompanying table for each class of the Fund provides information about hypothetical account values and hypothetical expenses based on a Class' actual expense ratio and an assumed rate of return of 5% per year before expenses, which is not the Class' actual return. The hypothetical account values and expenses may not be used to estimate the actual ending account balance or expenses you paid for the period. You may use this information to compare the ongoing costs of investing in the Fund and other funds. To do so, compare this 5% hypothetical example with the 5% hypothetical examples that appear in the shareholder reports of the other funds. The estimate of expenses does not include any fees or other expenses of any variable annuity or variable life insurance product. If they were, the estimate of expenses you paid during the period would be higher, and your ending account value would be lower.
Please note that the expenses shown in the table are meant to highlight your ongoing costs only and do not reflect any transaction costs. Therefore, the second line of the table is useful in comparing ongoing costs only, and will not help you determine the relative total costs of owning different funds. In addition, if these transactional costs were included, your costs would have been higher.
| Beginning
Account Value
July 1, 2006 | Ending
Account Value
December 31, 2006 | Expenses Paid
During Period *
July 1, 2006 to
December 31, 2006 |
Initial Class | | | |
Actual | $ 1,000.00 | $ 1,143.40 | $ 3.13 |
Hypothetical A | $ 1,000.00 | $ 1,022.28 | $ 2.96 |
Service Class | | | |
Actual | $ 1,000.00 | $ 1,142.80 | $ 3.67 |
Hypothetical A | $ 1,000.00 | $ 1,021.78 | $ 3.47 |
Service Class 2 | | | |
Actual | $ 1,000.00 | $ 1,142.10 | $ 4.48 |
Hypothetical A | $ 1,000.00 | $ 1,021.02 | $ 4.23 |
Service Class 2R | | | |
Actual | $ 1,000.00 | $ 1,141.90 | $ 4.48 |
Hypothetical A | $ 1,000.00 | $ 1,021.02 | $ 4.23 |
Investor Class | | | |
Actual | $ 1,000.00 | $ 1,142.70 | $ 3.78 |
Hypothetical A | $ 1,000.00 | $ 1,021.68 | $ 3.57 |
A 5% return per year before expenses
* Expenses are equal to each Class' annualized expense ratio (shown in the table below); multiplied by the average account value over the period, multiplied by 184/365 (to reflect the one-half year period).
| Annualized
Expense Ratio |
Initial Class | .58% |
Service Class | .68% |
Service Class 2 | .83% |
Service Class 2R | .83% |
Investor Class | .70% |
Annual Report
VIP Equity-Income Portfolio
Investment Changes
Top Ten Stocks as of December 31, 2006 |
| % of fund's
net assets | % of fund's net assets
6 months ago |
Exxon Mobil Corp. | 5.4 | 4.1 |
Bank of America Corp. | 3.2 | 3.3 |
American International Group, Inc. | 2.7 | 2.5 |
Citigroup, Inc. | 2.6 | 2.6 |
JPMorgan Chase & Co. | 2.3 | 2.3 |
AT&T, Inc. | 2.2 | 1.9 |
Pfizer, Inc. | 1.8 | 1.3 |
BellSouth Corp. | 1.7 | 1.5 |
Wachovia Corp. | 1.5 | 1.5 |
General Electric Co. | 1.4 | 1.4 |
| 24.8 | |
Top Five Market Sectors as of December 31, 2006 |
| % of fund's
net assets | % of fund's net assets
6 months ago |
Financials | 28.8 | 27.8 |
Energy | 12.9 | 13.1 |
Consumer Discretionary | 12.0 | 12.1 |
Industrials | 9.7 | 11.3 |
Information Technology | 9.1 | 8.2 |
Asset Allocation (% of fund's net assets) |
As of December 31, 2006 * | As of June 30, 2006 * * |
| Stocks 98.7% | | | Stocks 99.1% | |
| Bonds 0.9% | | | Bonds 0.6% | |
| Short-Term Investments
and Net Other Assets 0.4% | | | Short-Term Investments
and Net Other Assets 0.3% | |
* Foreign investments | 9.6% | | * * Foreign investments | 10.9% | |

VIP Equity-Income Portfolio
VIP Equity-Income Portfolio
Investments December 31, 2006
Showing Percentage of Net Assets
Common Stocks - 98.2% |
| Shares | | Value (Note 1) |
CONSUMER DISCRETIONARY - 11.4% |
Auto Components - 0.3% |
American Axle & Manufacturing Holdings, Inc. | 457,477 | | $ 8,687,488 |
Gentex Corp. | 595,400 | | 9,264,424 |
The Goodyear Tire & Rubber Co. (a)(d) | 758,100 | | 15,912,519 |
| | 33,864,431 |
Automobiles - 1.1% |
Hyundai Motor Co. | 205,150 | | 14,867,863 |
Monaco Coach Corp. | 318,231 | | 4,506,151 |
Peugeot Citroen SA | 288,500 | | 19,120,061 |
Renault SA | 163,901 | | 19,690,771 |
Toyota Motor Corp. sponsored ADR | 430,700 | | 57,847,317 |
Winnebago Industries, Inc. | 349,700 | | 11,508,627 |
| | 127,540,790 |
Diversified Consumer Services - 0.1% |
Service Corp. International | 1,723,300 | | 17,663,825 |
Hotels, Restaurants & Leisure - 0.4% |
Gaylord Entertainment Co. (a) | 373,365 | | 19,015,479 |
McDonald's Corp. | 373,000 | | 16,535,090 |
Wyndham Worldwide Corp. (a) | 341,002 | | 10,918,884 |
| | 46,469,453 |
Household Durables - 1.6% |
Beazer Homes USA, Inc. | 165,300 | | 7,770,753 |
Black & Decker Corp. | 41,100 | | 3,286,767 |
KB Home | 226,400 | | 11,609,792 |
Lennar Corp. Class A | 163,900 | | 8,598,194 |
Newell Rubbermaid, Inc. | 2,220,800 | | 64,292,160 |
Sony Corp. sponsored ADR | 453,200 | | 19,410,556 |
The Stanley Works | 327,730 | | 16,481,542 |
Whirlpool Corp. | 722,534 | | 59,984,773 |
| | 191,434,537 |
Internet & Catalog Retail - 0.2% |
Liberty Media Holding Corp. - Interactive Series A (a) | 899,869 | | 19,410,174 |
Leisure Equipment & Products - 0.3% |
Eastman Kodak Co. (d) | 1,464,000 | | 37,771,200 |
Media - 4.8% |
CBS Corp. Class B | 709,543 | | 22,123,551 |
Clear Channel Communications, Inc. | 2,782,300 | | 98,882,942 |
Comcast Corp. Class A | 1,982,691 | | 83,927,310 |
Gannett Co., Inc. | 327,700 | | 19,812,742 |
Idearc, Inc. (a) | 186,370 | | 5,339,501 |
McGraw-Hill Companies, Inc. | 41,500 | | 2,822,830 |
News Corp. Class A | 774,316 | | 16,632,308 |
NTL, Inc. | 812,888 | | 20,517,281 |
R.H. Donnelley Corp. | 148,800 | | 9,334,224 |
The McClatchy Co. Class A | 575,865 | | 24,934,955 |
The New York Times Co. Class A (d) | 1,133,025 | | 27,600,489 |
The Reader's Digest Association, Inc. (non-vtg.) | 1,481,965 | | 24,748,816 |
|
| Shares | | Value (Note 1) |
The Walt Disney Co. | 899,500 | | $ 30,825,865 |
Time Warner, Inc. | 5,602,750 | | 122,027,895 |
Viacom, Inc. Class B (non-vtg.) (a) | 1,638,343 | | 67,221,213 |
| | 576,751,922 |
Multiline Retail - 1.0% |
Dollar Tree Stores, Inc. (a) | 903,251 | | 27,187,861 |
Family Dollar Stores, Inc. | 1,072,100 | | 31,444,693 |
Federated Department Stores, Inc. | 1,100,800 | | 41,973,504 |
Sears Holdings Corp. (a) | 82,400 | | 13,837,432 |
Tuesday Morning Corp. | 343,584 | | 5,342,731 |
| | 119,786,221 |
Specialty Retail - 1.4% |
AnnTaylor Stores Corp. (a) | 288,391 | | 9,470,760 |
Chico's FAS, Inc. (a)(d) | 909,300 | | 18,813,417 |
Gap, Inc. | 188,300 | | 3,671,850 |
Home Depot, Inc. | 2,138,500 | | 85,882,160 |
OfficeMax, Inc. | 146,000 | | 7,248,900 |
RadioShack Corp. (d) | 2,096,700 | | 35,182,626 |
Tiffany & Co., Inc. | 351,700 | | 13,800,708 |
| | 174,070,421 |
Textiles, Apparel & Luxury Goods - 0.2% |
Liz Claiborne, Inc. | 553,040 | | 24,035,118 |
TOTAL CONSUMER DISCRETIONARY | | 1,368,798,092 |
CONSUMER STAPLES - 5.8% |
Beverages - 0.7% |
Anheuser-Busch Companies, Inc. (d) | 1,126,100 | | 55,404,120 |
SABMiller PLC | 1,130,100 | | 26,006,949 |
| | 81,411,069 |
Food & Staples Retailing - 1.5% |
CVS Corp. | 1,150,100 | | 35,549,591 |
Rite Aid Corp. | 2,365,468 | | 12,868,146 |
Wal-Mart Stores, Inc. | 2,849,600 | | 131,594,528 |
| | 180,012,265 |
Food Products - 0.5% |
Hershey Co. | 328,600 | | 16,364,280 |
Kraft Foods, Inc. Class A (d) | 643,600 | | 22,976,520 |
Tyson Foods, Inc. Class A | 1,214,500 | | 19,978,525 |
| | 59,319,325 |
Household Products - 1.2% |
Colgate-Palmolive Co. | 1,471,700 | | 96,013,708 |
Kimberly-Clark Corp. | 310,400 | | 21,091,680 |
Procter & Gamble Co. | 501,442 | | 32,227,677 |
| | 149,333,065 |
Personal Products - 0.7% |
Avon Products, Inc. | 2,575,570 | | 85,096,833 |
Common Stocks - continued |
| Shares | | Value (Note 1) |
CONSUMER STAPLES - continued |
Tobacco - 1.2% |
Altria Group, Inc. | 1,655,100 | | $ 142,040,682 |
TOTAL CONSUMER STAPLES | | 697,213,239 |
ENERGY - 12.9% |
Energy Equipment & Services - 2.6% |
Baker Hughes, Inc. | 1,364,100 | | 101,843,706 |
Halliburton Co. | 1,307,895 | | 40,610,140 |
Noble Corp. | 639,300 | | 48,682,695 |
Schlumberger Ltd. (NY Shares) | 1,901,757 | | 120,114,972 |
| | 311,251,513 |
Oil, Gas & Consumable Fuels - 10.3% |
Apache Corp. | 581,880 | | 38,700,839 |
BP PLC sponsored ADR | 616,742 | | 41,383,388 |
Chevron Corp. | 2,322,542 | | 170,776,513 |
ConocoPhillips | 1,348,900 | | 97,053,355 |
EOG Resources, Inc. | 524,900 | | 32,780,005 |
Exxon Mobil Corp. | 8,392,636 | | 643,127,696 |
Hess Corp. | 719,900 | | 35,685,443 |
Lukoil Oil Co. sponsored ADR | 266,100 | | 23,552,511 |
Occidental Petroleum Corp. | 831,200 | | 40,587,496 |
Total SA sponsored ADR | 1,031,733 | | 74,202,237 |
Valero Energy Corp. | 451,700 | | 23,108,972 |
Williams Companies, Inc. | 558,100 | | 14,577,572 |
| | 1,235,536,027 |
TOTAL ENERGY | | 1,546,787,540 |
FINANCIALS - 28.7% |
Capital Markets - 4.2% |
Ameriprise Financial, Inc. | 479,702 | | 26,143,759 |
Bank of New York Co., Inc. | 2,489,400 | | 98,007,678 |
KKR Private Equity Investors, LP | 652,400 | | 14,352,800 |
KKR Private Equity Investors, LP Restricted Depositary Units (e) | 708,100 | | 15,578,200 |
Mellon Financial Corp. | 1,271,600 | | 53,597,940 |
Merrill Lynch & Co., Inc. | 1,192,400 | | 111,012,440 |
Morgan Stanley | 1,750,400 | | 142,535,072 |
Nomura Holdings, Inc. | 935,000 | | 17,631,877 |
State Street Corp. | 462,153 | | 31,167,598 |
| | 510,027,364 |
Commercial Banks - 4.8% |
Barclays PLC Sponsored ADR (d) | 657,400 | | 38,221,236 |
HSBC Holdings PLC sponsored ADR (d) | 246,400 | | 22,582,560 |
KeyCorp | 728,500 | | 27,704,855 |
Lloyds TSB Group PLC | 2,118,800 | | 24,011,300 |
Marshall & Ilsley Corp. | 492,800 | | 23,708,608 |
|
| Shares | | Value (Note 1) |
PNC Financial Services Group, Inc. | 616,314 | | $ 45,631,889 |
Royal Bank of Scotland Group PLC | 592,888 | | 23,142,732 |
U.S. Bancorp, Delaware | 1,479,938 | | 53,558,956 |
Wachovia Corp. | 3,101,257 | | 176,616,586 |
Wells Fargo & Co. | 3,854,200 | | 137,055,352 |
| | 572,234,074 |
Consumer Finance - 0.5% |
American Express Co. | 634,796 | | 38,513,073 |
Capital One Financial Corp. | 226,400 | | 17,392,048 |
| | 55,905,121 |
Diversified Financial Services - 8.3% |
Bank of America Corp. | 7,175,177 | | 383,082,700 |
Citigroup, Inc. | 5,613,119 | | 312,650,728 |
FirstRand Ltd. | 7,037,125 | | 22,298,626 |
JPMorgan Chase & Co. (d) | 5,696,412 | | 275,136,700 |
| | 993,168,754 |
Insurance - 8.1% |
ACE Ltd. | 2,142,596 | | 129,777,040 |
AFLAC, Inc. | 143,600 | | 6,605,600 |
Allianz AG sponsored ADR | 1,071,900 | | 21,888,198 |
Allstate Corp. | 1,050,200 | | 68,378,522 |
American International Group, Inc. | 4,588,550 | | 328,815,493 |
Genworth Financial, Inc. Class A (non-vtg.) | 116,202 | | 3,975,270 |
Hartford Financial Services Group, Inc. | 890,900 | | 83,129,879 |
Marsh & McLennan Companies, Inc. | 881,907 | | 27,039,269 |
MetLife, Inc. unit | 835,300 | | 25,543,474 |
Montpelier Re Holdings Ltd. | 1,344,500 | | 25,021,145 |
PartnerRe Ltd. | 486,620 | | 34,564,619 |
Swiss Reinsurance Co. (Reg.) | 321,551 | | 27,328,999 |
The St. Paul Travelers Companies, Inc. | 2,274,726 | | 122,130,039 |
Willis Group Holdings Ltd. | 937,000 | | 37,208,270 |
XL Capital Ltd. Class A | 415,820 | | 29,947,356 |
| | 971,353,173 |
Real Estate Investment Trusts - 0.6% |
Developers Diversified Realty Corp. | 376,800 | | 23,719,560 |
Equity Office Properties Trust | 557,200 | | 26,840,324 |
Equity Residential (SBI) | 381,400 | | 19,356,050 |
| | 69,915,934 |
Thrifts & Mortgage Finance - 2.2% |
Countrywide Financial Corp. | 412,110 | | 17,494,070 |
Fannie Mae | 2,617,310 | | 155,442,041 |
Freddie Mac (d) | 1,148,000 | | 77,949,200 |
Sovereign Bancorp, Inc. | 516,251 | | 13,107,600 |
| | 263,992,911 |
TOTAL FINANCIALS | | 3,436,597,331 |
Common Stocks - continued |
| Shares | | Value (Note 1) |
HEALTH CARE - 7.0% |
Health Care Equipment & Supplies - 0.9% |
Baxter International, Inc. | 1,982,832 | | $ 91,983,576 |
Boston Scientific Corp. (a) | 842,357 | | 14,471,693 |
| | 106,455,269 |
Health Care Providers & Services - 0.3% |
Omnicare, Inc. | 266,100 | | 10,279,443 |
UnitedHealth Group, Inc. | 383,947 | | 20,629,472 |
| | 30,908,915 |
Pharmaceuticals - 5.8% |
Bristol-Myers Squibb Co. | 2,213,300 | | 58,254,056 |
Johnson & Johnson | 1,829,300 | | 120,770,386 |
Merck & Co., Inc. | 2,109,200 | | 91,961,120 |
Novartis AG sponsored ADR | 361,700 | | 20,776,048 |
Pfizer, Inc. | 8,398,200 | | 217,513,380 |
Schering-Plough Corp. | 3,284,630 | | 77,648,653 |
Wyeth | 2,169,100 | | 110,450,572 |
| | 697,374,215 |
TOTAL HEALTH CARE | | 834,738,399 |
INDUSTRIALS - 9.5% |
Aerospace & Defense - 2.1% |
General Dynamics Corp. | 297,700 | | 22,133,995 |
Honeywell International, Inc. | 2,504,425 | | 113,300,187 |
Lockheed Martin Corp. | 506,300 | | 46,615,041 |
The Boeing Co. | 177,300 | | 15,751,332 |
United Technologies Corp. | 844,540 | | 52,800,641 |
| | 250,601,196 |
Air Freight & Logistics - 0.1% |
United Parcel Service, Inc. Class B | 217,800 | | 16,330,644 |
Building Products - 0.3% |
Masco Corp. | 1,145,000 | | 34,201,150 |
Commercial Services & Supplies - 0.3% |
Waste Management, Inc. | 930,600 | | 34,218,162 |
Electrical Equipment - 0.4% |
Emerson Electric Co. | 997,400 | | 43,975,366 |
Industrial Conglomerates - 3.1% |
3M Co. | 654,700 | | 51,020,771 |
General Electric Co. | 4,634,090 | | 172,434,489 |
Siemens AG sponsored ADR | 20,500 | | 2,020,275 |
Textron, Inc. | 263,300 | | 24,689,641 |
Tyco International Ltd. | 4,253,346 | | 129,301,718 |
| | 379,466,894 |
Machinery - 2.3% |
Briggs & Stratton Corp. (d) | 958,688 | | 25,836,642 |
Caterpillar, Inc. | 485,500 | | 29,775,715 |
Deere & Co. | 156,100 | | 14,840,427 |
Dover Corp. | 1,141,900 | | 55,975,938 |
Eaton Corp. | 165,700 | | 12,450,698 |
|
| Shares | | Value (Note 1) |
Illinois Tool Works, Inc. | 337,300 | | $ 15,579,887 |
Ingersoll-Rand Co. Ltd. Class A | 883,888 | | 34,586,537 |
Navistar International Corp. (a) | 649,295 | | 21,705,932 |
SPX Corp. | 1,080,489 | | 66,082,707 |
| | 276,834,483 |
Road & Rail - 0.9% |
Burlington Northern Santa Fe Corp. | 930,400 | | 68,672,824 |
Hertz Global Holdings, Inc. | 307,900 | | 5,354,381 |
Laidlaw International, Inc. | 268,000 | | 8,155,240 |
Union Pacific Corp. | 287,100 | | 26,418,942 |
| | 108,601,387 |
TOTAL INDUSTRIALS | | 1,144,229,282 |
INFORMATION TECHNOLOGY - 9.1% |
Communications Equipment - 1.1% |
Alcatel-Lucent SA sponsored ADR | 1,280,488 | | 18,208,539 |
Cisco Systems, Inc. (a) | 2,508,000 | | 68,543,640 |
Lucent Technologies, Inc. warrants 12/10/07 (a) | 8,328 | | 2,582 |
Motorola, Inc. | 1,673,712 | | 34,411,519 |
Nortel Networks Corp. (a) | 308,740 | | 8,282,493 |
| | 129,448,773 |
Computers & Peripherals - 2.6% |
EMC Corp. (a)(d) | 3,040,100 | | 40,129,320 |
Hewlett-Packard Co. | 2,804,111 | | 115,501,332 |
Imation Corp. | 328,300 | | 15,242,969 |
International Business Machines Corp. | 1,280,500 | | 124,400,575 |
Sun Microsystems, Inc. (a) | 3,725,375 | | 20,191,533 |
| | 315,465,729 |
Electronic Equipment & Instruments - 1.0% |
Agilent Technologies, Inc. (a) | 912,800 | | 31,811,080 |
Arrow Electronics, Inc. (a) | 775,900 | | 24,479,645 |
Avnet, Inc. (a) | 1,566,330 | | 39,988,405 |
Solectron Corp. (a) | 5,630,400 | | 18,129,888 |
Tektronix, Inc. | 143,608 | | 4,189,045 |
| | 118,598,063 |
Internet Software & Services - 0.0% |
Google, Inc. Class A (sub. vtg.) (a) | 8,200 | | 3,775,936 |
IT Services - 0.3% |
MoneyGram International, Inc. | 912,900 | | 28,628,544 |
The Western Union Co. | 390,300 | | 8,750,526 |
| | 37,379,070 |
Office Electronics - 0.5% |
Xerox Corp. (a) | 3,896,635 | | 66,047,964 |
Semiconductors & Semiconductor Equipment - 2.4% |
Analog Devices, Inc. | 1,406,800 | | 46,241,516 |
Applied Materials, Inc. | 2,485,400 | | 45,855,630 |
Intel Corp. | 4,522,000 | | 91,570,500 |
Micron Technology, Inc. (a) | 1,589,200 | | 22,185,232 |
National Semiconductor Corp. | 1,558,747 | | 35,383,557 |
Common Stocks - continued |
| Shares | | Value (Note 1) |
INFORMATION TECHNOLOGY - continued |
Semiconductors & Semiconductor Equipment - continued |
Samsung Electronics Co. Ltd. | 28,040 | | $ 18,482,283 |
Spansion, Inc. Class A | 410,900 | | 6,105,974 |
Teradyne, Inc. (a) | 809,300 | | 12,107,128 |
Verigy Ltd. | 296,059 | | 5,255,047 |
| | 283,186,867 |
Software - 1.2% |
Autodesk, Inc. (a) | 144,000 | | 5,826,240 |
Microsoft Corp. | 3,073,500 | | 91,774,710 |
Oracle Corp. (a) | 731,200 | | 12,532,768 |
Symantec Corp. (a) | 1,496,133 | | 31,194,373 |
| | 141,328,091 |
TOTAL INFORMATION TECHNOLOGY | | 1,095,230,493 |
MATERIALS - 3.8% |
Chemicals - 2.0% |
Air Products & Chemicals, Inc. | 621,300 | | 43,664,964 |
Arkema (a) | 12,180 | | 625,996 |
Arkema sponsored ADR (a) | 234,455 | | 11,992,363 |
Ashland, Inc. | 172,200 | | 11,912,796 |
Bayer AG sponsored ADR | 270,700 | | 14,444,552 |
Celanese Corp. Class A | 672,400 | | 17,401,712 |
Chemtura Corp. | 2,044,164 | | 19,685,301 |
Dow Chemical Co. | 694,300 | | 27,730,342 |
E.I. du Pont de Nemours & Co. | 836,800 | | 40,760,528 |
Georgia Gulf Corp. | 759,800 | | 14,671,738 |
Lyondell Chemical Co. | 470,766 | | 12,037,474 |
PolyOne Corp. (a) | 1,126,200 | | 8,446,500 |
Rohm & Haas Co. | 166,256 | | 8,499,007 |
Tronox, Inc. Class B | 179,376 | | 2,832,347 |
| | 234,705,620 |
Containers & Packaging - 0.2% |
Smurfit-Stone Container Corp. (a) | 2,730,472 | | 28,833,784 |
Metals & Mining - 1.0% |
Alcan, Inc. | 601,700 | | 29,300,623 |
Alcoa, Inc. | 2,359,016 | | 70,794,070 |
Phelps Dodge Corp. | 188,000 | | 22,507,360 |
| | 122,602,053 |
Paper & Forest Products - 0.6% |
International Paper Co. | 1,105,400 | | 37,694,140 |
Weyerhaeuser Co. | 519,600 | | 36,709,740 |
| | 74,403,880 |
TOTAL MATERIALS | | 460,545,337 |
TELECOMMUNICATION SERVICES - 6.6% |
Diversified Telecommunication Services - 5.7% |
AT&T, Inc. (d) | 7,251,893 | | 259,255,175 |
|
| Shares | | Value (Note 1) |
BellSouth Corp. | 4,402,699 | | $ 207,411,150 |
Qwest Communications International, Inc. (a) | 5,870,900 | | 49,139,433 |
Telkom SA Ltd. sponsored ADR (d) | 329,475 | | 26,713,833 |
Verizon Communications, Inc. | 3,727,402 | | 138,808,450 |
| | 681,328,041 |
Wireless Telecommunication Services - 0.9% |
MTN Group Ltd. | 515,700 | | 6,278,791 |
Sprint Nextel Corp. | 3,408,000 | | 64,377,120 |
Vodafone Group PLC sponsored ADR | 1,248,187 | | 34,674,635 |
| | 105,330,546 |
TOTAL TELECOMMUNICATION SERVICES | | 786,658,587 |
UTILITIES - 3.4% |
Electric Utilities - 0.8% |
Entergy Corp. | 658,100 | | 60,755,792 |
Exelon Corp. | 494,000 | | 30,573,660 |
| | 91,329,452 |
Independent Power Producers & Energy Traders - 0.7% |
AES Corp. (a) | 1,644,400 | | 36,242,576 |
TXU Corp. | 788,840 | | 42,763,016 |
| | 79,005,592 |
Multi-Utilities - 1.9% |
Dominion Resources, Inc. | 968,900 | | 81,232,576 |
Duke Energy Corp. | 921,000 | | 30,586,410 |
Public Service Enterprise Group, Inc. | 933,800 | | 61,985,644 |
Wisconsin Energy Corp. | 1,286,100 | | 61,038,306 |
| | 234,842,936 |
TOTAL UTILITIES | | 405,177,980 |
TOTAL COMMON STOCKS (Cost $8,186,731,717) | 11,775,976,280 |
Convertible Preferred Stocks - 0.5% |
| | | |
CONSUMER DISCRETIONARY - 0.3% |
Automobiles - 0.2% |
Ford Motor Co. Capital Trust II 6.50% | 402,500 | | 13,837,950 |
General Motors Corp.: | | | |
Series B, 5.25% | 359,600 | | 7,634,308 |
Series C, 6.25% | 253,100 | | 5,785,866 |
| | 27,258,124 |
Hotels, Restaurants & Leisure - 0.1% |
Six Flags, Inc. 7.25% PIERS | 384,900 | | 8,564,025 |
TOTAL CONSUMER DISCRETIONARY | | 35,822,149 |
FINANCIALS - 0.1% |
Insurance - 0.1% |
Conseco, Inc. Series B, 5.50% | 143,400 | | 3,559,188 |
Convertible Preferred Stocks - continued |
| Shares | | Value (Note 1) |
FINANCIALS - continued |
Insurance - continued |
Travelers Property Casualty Corp. 4.50% | 208,200 | | $ 5,579,760 |
XL Capital Ltd. 6.50% | 475,300 | | 11,174,303 |
| | 20,313,251 |
HEALTH CARE - 0.1% |
Pharmaceuticals - 0.1% |
Schering-Plough Corp. 6.00% | 176,300 | | 10,045,574 |
MATERIALS - 0.0% |
Chemicals - 0.0% |
Celanese Corp. 4.25% | 67,100 | | 2,432,375 |
TOTAL CONVERTIBLE PREFERRED STOCKS (Cost $76,185,301) | 68,613,349 |
Corporate Bonds - 0.9% |
| Principal Amount | | |
Convertible Bonds - 0.8% |
CONSUMER DISCRETIONARY - 0.3% |
Automobiles - 0.1% |
Ford Motor Co. 4.25% 12/15/36 | | $ 9,770,000 | | 10,456,831 |
Hotels, Restaurants & Leisure - 0.0% |
Six Flags, Inc. 4.5% 5/15/15 | | 3,640,000 | | 3,794,700 |
Media - 0.2% |
Liberty Media Corp.3.5% 1/15/31 (e) | | 11,400,000 | | 11,510,580 |
News America, Inc. liquid yield option note 0% 2/28/21 (e) | | 22,670,000 | | 13,460,313 |
| | 24,970,893 |
TOTAL CONSUMER DISCRETIONARY | | 39,222,424 |
INDUSTRIALS - 0.2% |
Airlines - 0.1% |
UAL Corp. 4.5% 6/30/21 (e) | | 8,680,000 | | 12,500,068 |
Industrial Conglomerates - 0.1% |
Tyco International Group SA yankee 3.125% 1/15/23 | | 5,220,000 | | 7,412,922 |
TOTAL INDUSTRIALS | | 19,912,990 |
TELECOMMUNICATION SERVICES - 0.3% |
Diversified Telecommunication Services - 0.3% |
Level 3 Communications, Inc.: | | | | |
3.5% 6/15/12 | | 6,220,000 | | 7,692,772 |
|
| Principal Amount | | Value
(Note 1) |
5.25% 12/15/11 (e) | | $ 11,850,000 | | $ 18,528,186 |
5.25% 12/15/11 | | 3,930,000 | | 6,144,791 |
| | 32,365,749 |
TOTAL CONVERTIBLE BONDS | | 91,501,163 |
Nonconvertible Bonds - 0.1% |
MATERIALS - 0.1% |
Chemicals - 0.1% |
Hercules, Inc. 6.5% 6/30/29 unit | | 15,700,000 | | 13,639,145 |
TOTAL CORPORATE BONDS (Cost $92,953,803) | 105,140,308 |
Money Market Funds - 3.2% |
| Shares | | |
Fidelity Cash Central Fund, 5.37% (b) | 47,106,209 | | 47,106,209 |
Fidelity Securities Lending Cash Central Fund, 5.38% (b)(c) | 337,798,594 | | 337,798,594 |
TOTAL MONEY MARKET FUNDS (Cost $384,904,803) | 384,904,803 |
TOTAL INVESTMENT
PORTFOLIO - 102.8% (Cost $8,740,775,624) | | 12,334,634,740 |
NET OTHER ASSETS - (2.8)% | | (340,944,513) |
NET ASSETS - 100% | $ 11,993,690,227 |
Legend |
(a) Non-income producing |
(b) Affiliated fund that is available only to investment companies and other accounts managed by Fidelity Investments. The rate quoted is the annualized seven-day yield of the fund at period end. A complete unaudited listing of the fund's holdings as of its most recent quarter end is available upon request. |
(c) Investment made with cash collateral received from securities on loan. |
(d) Security or a portion of the security is on loan at period end. |
(e) Security exempt from registration under Rule 144A of the Securities Act of 1933. These securities may be resold in transactions exempt from registration, normally to qualified institutional buyers. At the end of the period, the value of these securities amounted to $71,577,347 or 0.6% of net assets. |
Affiliated Central Funds |
Information regarding fiscal year to date income earned by the Fund from investments in Fidelity Central Funds is as follows: |
Fund | Income earned |
Fidelity Cash Central Fund | $ 1,755,983 |
Fidelity Securities Lending Cash Central Fund | 1,591,296 |
Total | $ 3,347,279 |
See accompanying notes which are an integral part of the financial statements.
VIP Equity-Income Portfolio
VIP Equity-Income Portfolio
Financial Statements
Statement of Assets and Liabilities
| December 31, 2006 |
| | |
Assets | | |
Investment in securities, at value (including securities loaned of $331,211,680) - See accompanying schedule: Unaffiliated issuers (cost $8,355,870,821) | $ 11,949,729,937 | |
Fidelity Central Funds (cost $384,904,803) | 384,904,803 | |
Total Investments (cost $8,740,775,624) | | $ 12,334,634,740 |
Receivable for investments sold | | 985,125 |
Receivable for fund shares sold | | 854,292 |
Dividends receivable | | 14,969,169 |
Interest receivable | | 1,146,970 |
Prepaid expenses | | 53,533 |
Other receivables | | 558,501 |
Total assets | | 12,353,202,330 |
| | |
Liabilities | | |
Payable for investments purchased | $ 5,984,867 | |
Payable for fund shares redeemed | 7,928,275 | |
Accrued management fee | 4,616,752 | |
Distribution fees payable | 584,627 | |
Other affiliated payables | 1,077,657 | |
Other payables and accrued expenses | 1,521,331 | |
Collateral on securities loaned, at value | 337,798,594 | |
Total liabilities | | 359,512,103 |
| | |
Net Assets | | $ 11,993,690,227 |
Net Assets consist of: | | |
Paid in capital | | $ 8,382,644,063 |
Undistributed net investment income | | 6,057,687 |
Accumulated undistributed net realized gain (loss) on investments and foreign currency transactions | | 11,129,272 |
Net unrealized appreciation (depreciation) on investments and assets and liabilities in foreign currencies | | 3,593,859,205 |
Net Assets | | $ 11,993,690,227 |
Statement of Assets and Liabilities - continued
| December 31, 2006 |
| | |
Initial Class:
Net Asset Value, offering price and redemption price per share ($8,315,158,819 ÷ 317,373,077 shares) | | $ 26.20 |
| | |
Service Class:
Net Asset Value, offering price and redemption price per share ($1,118,333,037 ÷ 42,831,440 shares) | | $ 26.11 |
| | |
Service Class 2:
Net Asset Value, offering price and redemption price per share ($2,373,058,996 ÷ 91,743,429 shares) | | $ 25.87 |
| | |
Service Class 2R:
Net Asset Value, offering price and redemption price per share ($17,089,178 ÷ 664,071 shares) | | $ 25.73 |
| | |
Investor Class:
Net Asset Value, offering price and redemption price per share ($170,050,197 ÷ 6,502,985 shares) | | $ 26.15 |
See accompanying notes which are an integral part of the financial statements.
Annual Report
VIP Equity-Income Portfolio
Financial Statements - continued
Statement of Operations
| Year ended December 31, 2006 |
| | |
Investment Income | | |
Dividends | | $ 249,862,922 |
Interest | | 3,646,574 |
Income from Fidelity Central Funds (including $1,591,296 from security lending) | | 3,347,279 |
Total income | | 256,856,775 |
| | |
Expenses | | |
Management fee | $ 51,498,631 | |
Transfer agent fees | 7,533,695 | |
Distribution fees | 6,043,143 | |
Accounting and security lending fees | 1,448,191 | |
Custodian fees and expenses | 253,854 | |
Independent trustees' compensation | 40,857 | |
Appreciation in deferred trustee compensation account | 12,469 | |
Audit | 116,162 | |
Legal | 204,028 | |
Interest | 70,229 | |
Miscellaneous | 1,821,006 | |
Total expenses before reductions | 69,042,265 | |
Expense reductions | (447,375) | 68,594,890 |
Net investment income (loss) | | 188,261,885 |
Realized and Unrealized Gain (Loss) Net realized gain (loss) on: | | |
Investment securities: | | |
Unaffiliated issuers | 828,364,854 | |
Foreign currency transactions | (53,108) | |
Total net realized gain (loss) | | 828,311,746 |
Change in net unrealized appreciation (depreciation) on: Investment securities | 1,034,327,955 | |
Assets and liabilities in foreign currencies | 3,201 | |
Total change in net unrealized appreciation (depreciation) | | 1,034,331,156 |
Net gain (loss) | | 1,862,642,902 |
Net increase (decrease) in net assets resulting from operations | | $ 2,050,904,787 |
Statement of Changes in Net Assets
| Year ended
December 31,
2006 | Year ended
December 31,
2005 |
Increase (Decrease) in Net Assets | | |
Operations | | |
Net investment income (loss) | $ 188,261,885 | $ 180,286,741 |
Net realized gain (loss) | 828,311,746 | 551,406,495 |
Change in net unrealized appreciation (depreciation) | 1,034,331,156 | (133,326,683) |
Net increase (decrease) in net assets resulting from operations | 2,050,904,787 | 598,366,553 |
Distributions to shareholders from net investment income | (361,533,412) | (175,959,121) |
Distributions to shareholders from net realized gain | (1,350,709,216) | (394,382,958) |
Total distributions | (1,712,242,628) | (570,342,079) |
Share transactions - net increase (decrease) | 928,687,527 | (588,913,583) |
Redemption fees | 4,203 | 2,560 |
Total increase (decrease) in net assets | 1,267,353,889 | (560,886,549) |
| | |
Net Assets | | |
Beginning of period | 10,726,336,338 | 11,287,222,887 |
End of period (including undistributed net investment income of $6,057,687 and undistributed net investment income of $180,172,674, respectively) | $ 11,993,690,227 | $ 10,726,336,338 |
See accompanying notes which are an integral part of the financial statements.
VIP Equity-Income Portfolio
Financial Highlights - Initial Class
Years ended December 31, | 2006 | 2005 | 2004 | 2003 | 2002 |
Selected Per-Share Data | | | | | |
Net asset value, beginning of period | $ 25.49 | $ 25.37 | $ 23.18 | $ 18.16 | $ 22.75 |
Income from Investment Operations | | | | | |
Net investment income (loss) C | .45 | .42 | .40 | .36 | .34 |
Net realized and unrealized gain (loss) | 4.37 | 1.00 | 2.24 | 5.01 | (4.08) |
Total from investment operations | 4.82 | 1.42 | 2.64 | 5.37 | (3.74) |
Distributions from net investment income | (.89) | (.41) | (.36) | (.35) | (.36) |
Distributions from net realized gain | (3.22) | (.89) | (.09) | - | (.49) |
Total distributions | (4.11) | (1.30) | (.45) | (.35) | (.85) |
Redemption fees added to paid in capital C, G | - | - | - | - | - |
Net asset value, end of period | $ 26.20 | $ 25.49 | $ 25.37 | $ 23.18 | $ 18.16 |
Total Return A, B | 20.19% | 5.87% | 11.53% | 30.33% | (16.95)% |
Ratios to Average Net Assets D, F | | | | | |
Expenses before reductions | .57% | .56% | .58% | .57% | .57% |
Expenses net of fee waivers, if any | .57% | .56% | .58% | .57% | .57% |
Expenses net of all reductions | .56% | .55% | .57% | .56% | .56% |
Net investment income (loss) | 1.76% | 1.71% | 1.71% | 1.83% | 1.70% |
Supplemental Data | | | | | |
Net assets, end of period (000 omitted) | $ 8,315,159 | $ 7,875,801 | $ 8,689,829 | $ 8,402,963 | $ 6,895,940 |
Portfolio turnover rate E | 22% | 19% | 22% | 26% | 25% |
A Total returns do not reflect charges attributable to your insurance company's separate account. Inclusion of these charges would reduce the total returns shown.
B Total returns would have been lower had certain expenses not been reduced during the periods shown.
C Calculated based on average shares outstanding during the period.
D Fees and expenses of the underlying Fidelity Central Funds are not included in the Fund's expense ratio. The Fund indirectly bears its proportionate share of the expenses of any underlying Fidelity Central Funds.
E Amount does not include the portfolio activity of any underlying Fidelity Central Funds.
F Expense ratios reflect operating expenses of the class. Expenses before reductions do not reflect amounts reimbursed by the investment adviser or reductions from brokerage service arrangements or other expense offset arrangements and do not represent the amount paid by the class during periods when reimbursements or reductions occur. Expenses net of fee waivers reflect expenses after reimbursement by the investment adviser but prior to reductions from brokerage service arrangements or other expense offset arrangements. Expenses net of all reductions represent the net expenses paid by the class.
G Amount represents less than $.01 per share.
Financial Highlights - Service Class
Years ended December 31, | 2006 | 2005 | 2004 | 2003 | 2002 |
Selected Per-Share Data | | | | | |
Net asset value, beginning of period | $ 25.39 | $ 25.28 | $ 23.11 | $ 18.10 | $ 22.67 |
Income from Investment Operations | | | | | |
Net investment income (loss) C | .43 | .39 | .38 | .34 | .32 |
Net realized and unrealized gain (loss) | 4.35 | 1.00 | 2.22 | 5.00 | (4.06) |
Total from investment operations | 4.78 | 1.39 | 2.60 | 5.34 | (3.74) |
Distributions from net investment income | (.84) | (.39) | (.34) | (.33) | (.34) |
Distributions from net realized gain | (3.22) | (.89) | (.09) | - | (.49) |
Total distributions | (4.06) | (1.28) | (.43) | (.33) | (.83) |
Redemption fees added to paid in capital C, G | - | - | - | - | - |
Net asset value, end of period | $ 26.11 | $ 25.39 | $ 25.28 | $ 23.11 | $ 18.10 |
Total Return A, B | 20.08% | 5.76% | 11.38% | 30.22% | (17.00)% |
Ratios to Average Net Assets D, F | | | | | |
Expenses before reductions | .67% | .66% | .68% | .67% | .67% |
Expenses net of fee waivers, if any | .67% | .66% | .68% | .67% | .67% |
Expenses net of all reductions | .66% | .65% | .67% | .66% | .66% |
Net investment income (loss) | 1.66% | 1.61% | 1.61% | 1.73% | 1.60% |
Supplemental Data | | | | | |
Net assets, end of period (000 omitted) | $ 1,118,333 | $ 1,079,838 | $ 1,170,778 | $ 1,071,483 | $ 771,516 |
Portfolio turnover rate E | 22% | 19% | 22% | 26% | 25% |
A Total returns do not reflect charges attributable to your insurance company's separate account. Inclusion of these charges would reduce the total returns shown.
B Total returns would have been lower had certain expenses not been reduced during the periods shown.
C Calculated based on average shares outstanding during the period.
D Fees and expenses of the underlying Fidelity Central Funds are not included in the Fund's expense ratio. The Fund indirectly bears its proportionate share of the expenses of any underlying Fidelity Central Funds.
E Amount does not include the portfolio activity of any underlying Fidelity Central Funds.
F Expense ratios reflect operating expenses of the class. Expenses before reductions do not reflect amounts reimbursed by the investment adviser or reductions from brokerage service arrangements or other expense offset arrangements and do not represent the amount paid by the class during periods when reimbursements or reductions occur. Expenses net of fee waivers reflect expenses after reimbursement by the investment adviser but prior to reductions from brokerage service arrangements or other expense offset arrangements. Expenses net of all reductions represent the net expenses paid by the class.
G Amount represents less than $.01 per share.
See accompanying notes which are an integral part of the financial statements.
Annual Report
Financial Highlights - Service Class 2
Years ended December 31, | 2006 | 2005 | 2004 | 2003 | 2002 |
Selected Per-Share Data | | | | | |
Net asset value, beginning of period | $ 25.17 | $ 25.09 | $ 22.96 | $ 18.00 | $ 22.59 |
Income from Investment Operations | | | | | |
Net investment income (loss) C | .38 | .35 | .34 | .31 | .28 |
Net realized and unrealized gain (loss) | 4.32 | .98 | 2.21 | 4.97 | (4.04) |
Total from investment operations | 4.70 | 1.33 | 2.55 | 5.28 | (3.76) |
Distributions from net investment income | (.78) | (.36) | (.33) | (.32) | (.34) |
Distributions from net realized gain | (3.22) | (.89) | (.09) | - | (.49) |
Total distributions | (4.00) | (1.25) | (.42) | (.32) | (.83) |
Redemption fees added to paid in capital C, G | - | - | - | - | - |
Net asset value, end of period | $ 25.87 | $ 25.17 | $ 25.09 | $ 22.96 | $ 18.00 |
Total Return A, B | 19.93% | 5.57% | 11.23% | 30.03% | (17.15)% |
Ratios to Average Net Assets D, F | | | | | |
Expenses before reductions | .82% | .81% | .83% | .82% | .83% |
Expenses net of fee waivers, if any | .82% | .81% | .83% | .82% | .83% |
Expenses net of all reductions | .82% | .80% | .82% | .81% | .82% |
Net investment income (loss) | 1.51% | 1.46% | 1.46% | 1.58% | 1.44% |
Supplemental Data | | | | | |
Net assets, end of period (000 omitted) | $ 2,373,059 | $ 1,723,546 | $ 1,420,999 | $ 916,679 | $ 403,632 |
Portfolio turnover rate E | 22% | 19% | 22% | 26% | 25% |
A Total returns do not reflect charges attributable to your insurance company's separate account. Inclusion of these charges would reduce the total returns shown.
B Total returns would have been lower had certain expenses not been reduced during the periods shown.
C Calculated based on average shares outstanding during the period.
D Fees and expenses of the underlying Fidelity Central Funds are not included in the Fund's expense ratio. The Fund indirectly bears its proportionate share of the expenses of any underlying Fidelity Central Funds.
E Amount does not include the portfolio activity of any underlying Fidelity Central Funds.
F Expense ratios reflect operating expenses of the class. Expenses before reductions do not reflect amounts reimbursed by the investment adviser or reductions from brokerage service arrangements or other expense offset arrangements and do not represent the amount paid by the class during periods when reimbursements or reductions occur. Expenses net of fee waivers reflect expenses after reimbursement by the investment adviser but prior to reductions from brokerage service arrangements or other expense offset arrangements. Expenses net of all reductions represent the net expenses paid by the class.
G Amount represents less than $.01 per share.
Financial Highlights - Service Class 2R
Years ended December 31, | 2006 | 2005 | 2004 | 2003 | 2002 H |
Selected Per-Share Data | | | | | |
Net asset value, beginning of period | $ 25.08 | $ 25.01 | $ 22.91 | $ 17.99 | $ 21.82 |
Income from Investment Operations | | | | | |
Net investment income (loss) E | .38 | .35 | .34 | .31 | .18 |
Net realized and unrealized gain (loss) | 4.29 | .99 | 2.20 | 4.96 | (4.01) |
Total from investment operations | 4.67 | 1.34 | 2.54 | 5.27 | (3.83) |
Distributions from net investment income | (.80) | (.38) | (.35) | (.35) | - |
Distributions from net realized gain | (3.22) | (.89) | (.09) | - | - |
Total distributions | (4.02) | (1.27) | (.44) | (.35) | - |
Redemption fees added to paid in capital E, J | - | - | - | - | - |
Net asset value, end of period | $ 25.73 | $ 25.08 | $ 25.01 | $ 22.91 | $ 17.99 |
Total Return B, C, D | 19.89% | 5.61% | 11.22% | 30.05% | (17.55)% |
Ratios to Average Net Assets F, I | | | | | |
Expenses before reductions | .82% | .81% | .83% | .82% | .85% A |
Expenses net of fee waivers, if any | .82% | .81% | .83% | .82% | .85% A |
Expenses net of all reductions | .81% | .80% | .82% | .81% | .84% A |
Net investment income (loss) | 1.51% | 1.46% | 1.46% | 1.57% | 1.45% A |
Supplemental Data | | | | | |
Net assets, end of period (000 omitted) | $ 17,089 | $ 9,651 | $ 5,617 | $ 1,891 | $ 471 |
Portfolio turnover rate G | 22% | 19% | 22% | 26% | 25% |
A Annualized
B Total returns for periods of less than one year are not annualized.
C Total returns do not reflect charges attributable to your insurance company's separate account. Inclusion of these charges would reduce the total returns shown.
D Total returns would have been lower had certain expenses not been reduced during the periods shown.
E Calculated based on average shares outstanding during the period.
F Fees and expenses of the underlying Fidelity Central Funds are not included in the Fund's expense ratio. The Fund indirectly bears its proportionate share of the expenses of any underlying Fidelity Central Funds.
G Amount does not include the portfolio activity of any underlying Fidelity Central Funds.
H For the period April 24, 2002 (commencement of sale of shares) to December 31, 2002.
I Expense ratios reflect operating expenses of the class. Expenses before reductions do not reflect amounts reimbursed by the investment adviser or reductions from brokerage service arrangements or other expense offset arrangements and do not represent the amount paid by the class during periods when reimbursements or reductions occur. Expense ratios before reductions for start-up periods may not be representative of longer-term operating periods. Expenses net of fee waivers reflect expenses after reimbursement by the investment adviser but prior to reductions from brokerage service arrangements or other expense offset arrangements. Expenses net of all reductions represent the net expenses paid by the class.
J Amount represents less than $.01 per share.
See accompanying notes which are an integral part of the financial statements.
VIP Equity-Income Portfolio
Financial Highlights - Investor Class
Years ended December 31, | 2006 | 2005 H |
Selected Per-Share Data | | |
Net asset value, beginning of period | $ 25.48 | $ 24.46 |
Income from Investment Operations | | |
Net investment income (loss) E | .42 | .17 |
Net realized and unrealized gain (loss) | 4.36 | .85 |
Total from investment operations | 4.78 | 1.02 |
Distributions from net investment income | (.89) | - |
Distributions from net realized gain | (3.22) | - |
Total distributions | (4.11) | - |
Redemption fees added to paid in capital E, J | - | - |
Net asset value, end of period | $ 26.15 | $ 25.48 |
Total Return B, C, D | 20.04% | 4.17% |
Ratios to Average Net Assets F, I | | |
Expenses before reductions | .69% | .74% A |
Expenses net of fee waivers, if any | .69% | .74% A |
Expenses net of all reductions | .69% | .73% A |
Net investment income (loss) | 1.63% | 1.54% A |
Supplemental Data | | |
Net assets, end of period (000 omitted) | $ 170,050 | $ 37,500 |
Portfolio turnover rate G | 22% | 19% |
A Annualized
B Total returns for periods of less than one year are not annualized.
C Total returns do not reflect charges attributable to your insurance company's separate account. Inclusion of these charges would reduce the total returns shown.
D Total returns would have been lower had certain expenses not been reduced during the periods shown.
E Calculated based on average shares outstanding during the period.
F Fees and expenses of the underlying Fidelity Central Funds are not included in the Fund's expense ratio. The Fund indirectly bears its proportionate share of the expenses of any underlying Fidelity Central Funds.
G Amount does not include the portfolio activity of any underlying Fidelity Central Funds.
H For the period July 21, 2005 (commencement of sale of shares) to December 31, 2005.
I Expense ratios reflect operating expenses of the class. Expenses before reductions do not reflect amounts reimbursed by the investment adviser or reductions from brokerage service arrangements or other expense offset arrangements and do not represent the amount paid by the class during periods when reimbursements or reductions occur. Expense ratios before reductions for start-up periods may not be representative of longer-term operating periods. Expenses net of fee waivers reflect expenses after reimbursement by the investment adviser but prior to reductions from brokerage service arrangements or other expense offset arrangements. Expenses net of all reductions represent the net expenses paid by the class.
J Amount represents less than $.01 per share.
See accompanying notes which are an integral part of the financial statements.
Annual Report
Notes to Financial Statements
For the period ended December 31, 2006
1. Significant Accounting Policies.
VIP Equity-Income Portfolio (the Fund) is a fund of Variable Insurance Products Fund (the trust) and is authorized to issue an unlimited number of shares. The trust is registered under the Investment Company Act of 1940, as amended (the 1940 Act), as an open-end management investment company organized as a Massachusetts business trust. Shares of the Fund may only be purchased by insurance companies for the purpose of funding variable annuity or variable life insurance contracts. The Fund offers the following classes of shares: Initial Class shares, Service Class shares, Service Class 2 shares, Service Class 2R shares, and Investor Class shares. All classes have equal rights and voting privileges, except for matters affecting a single class. Investment income, realized and unrealized capital gains and losses, the common expenses of the Fund, and certain fund-level expense reductions, if any, are allocated on a pro rata basis to each class based on the relative net assets of each class to the total net assets of the Fund. Each class differs with respect to transfer agent and distribution and service plan fees incurred. Certain expense reductions also differ by class.
The Fund may invest in Fidelity Central Funds which are open-end investment companies available to investment companies and other accounts managed by Fidelity Management & Research Company (FMR) and its affiliates. The financial statements have been prepared in conformity with accounting principles generally accepted in the United States of America, which require management to make certain estimates and assumptions at the date of the financial statements. The following summarizes the significant accounting policies of the Fund, which are also consistently followed by the Fidelity Central Funds:
Security Valuation. Investments are valued and net asset value (NAV) per share is calculated (NAV calculation) as of the close of business of the New York Stock Exchange (NYSE), normally 4:00 p.m. Eastern time. Wherever possible, the Fund uses independent pricing services approved by the Board of Trustees to value its investments.
Equity securities, including restricted securities, for which market quotations are readily available, are valued at the last reported sale price or official closing price as reported by an independent pricing service on the primary market or exchange on which they are traded. In the event there were no sales during the day or closing prices are not available, securities are valued at the last quoted bid price. Debt securities, including restricted securities, for which quotations are readily available, are valued by independent pricing services or by dealers who make markets in such securities. Pricing services consider yield or price of bonds of comparable quality, coupon, maturity and type as well as dealer supplied prices. Investments in open-end mutual funds, including the Fidelity Central Funds, are valued at their closing net asset value each business day. Short-term securities with remaining maturities of sixty days or less for which quotations are not readily available are valued at amortized cost, which approximates value.
When current market prices or quotations are not readily available or do not accurately reflect fair value, valuations may be determined in accordance with procedures adopted by the Board of Trustees. For example, when developments occur between the close of a market and the close of the NYSE that may materially affect the value of some or all of the securities, or when trading in a security is halted, those securities may be fair valued. Factors used in the determination of fair value may include monitoring news to identify significant market or security specific events such as changes in the value of U.S. securities markets, reviewing developments in foreign markets and evaluating the performance of ADRs, futures contracts and exchange-traded funds. Because the Fund's utilization of fair value pricing depends on market activity, the frequency with which fair value pricing is used can not be predicted and may be utilized to a significant extent. The value of securities used for NAV calculation under fair value pricing may differ from published prices for the same securities.
Foreign Currency. The Fund uses foreign currency contracts to facilitate transactions in foreign-denominated securities. Losses from these transactions may arise from changes in the value of the foreign currency or if the counterparties do not perform under the contracts' terms.
Foreign-denominated assets, including investment securities, and liabilities are translated into U.S. dollars at the exchange rate at period end. Purchases and sales of investment securities, income and dividends received and expenses denominated in foreign currencies are translated into U.S. dollars at the exchange rate in effect on the transaction date.
The effects of exchange rate fluctuations on investments are included with the net realized and unrealized gain (loss) on investment securities. Other foreign currency transactions resulting in realized and unrealized gain (loss) are disclosed separately.
Investment Transactions and Income. Security transactions, including the Fund's investment activity in the Fidelity Central Funds, are accounted for as of trade date. Gains and losses on securities sold are determined on the basis of identified cost and may include proceeds received from litigation. Dividend income is recorded on the ex-dividend date, except for certain dividends from foreign securities where the ex-dividend date may have passed, which are recorded as soon as the Fund is informed of the ex-dividend date. Non-cash dividends included in dividend income, if any, are recorded at the fair market value of the securities received. Distributions received on securities that represent a return of capital or capital gain are recorded as a reduction of cost of investments and/or as a realized gain. The Fund estimates the components of distributions received that may be considered return of capital distributions or capital gain distributions. Interest income and income distributions from the Fidelity Central Funds are accrued as earned, with any income distributions receivable as of period end included in Interest Receivable on the Statement of Assets and Liabilities. Interest income includes coupon interest and amortization of premium and accretion of discount on debt securities. Investment income is recorded net of foreign taxes withheld where recovery of such taxes is uncertain.
VIP Equity-Income Portfolio
1. Significant Accounting Policies - continued
Expenses. Most expenses of the trust can be directly attributed to a fund. Expenses which cannot be directly attributed are apportioned among each Fund in the trust. Expense estimates are accrued in the period to which they relate and adjustments are made when actual amounts are known.
Deferred Trustee Compensation. Under a Deferred Compensation Plan (the Plan), Independent Trustees must defer receipt of a portion of, and may elect to defer receipt of an additional portion of, their annual compensation. Deferred amounts are invested in a cross-section of Fidelity funds, are marked-to-market and remain in the Fund until distributed in accordance with the Plan. The investment of deferred amounts and the offsetting payable to the Trustees are included in the accompanying Statement of Assets and Liabilities.
Income Tax Information and Distributions to Shareholders. Each year, the Fund intends to qualify as a regulated investment company by distributing all of its taxable income and realized gains under Subchapter M of the Internal Revenue Code. As a result, no provision for income taxes is required in the accompanying financial statements. Foreign taxes are provided for based on the Fund's understanding of the tax rules and rates that exist in the foreign markets in which it invests.
Distributions are recorded on the ex-dividend date. Income dividends and capital gain distributions are declared separately for each class. Income and capital gain distributions are determined in accordance with income tax regulations, which may differ from generally accepted accounting principles. In addition, the Fund will claim a portion of the payment made to redeeming shareholders as a distribution for income tax purposes.
Capital accounts within the financial statements are adjusted for permanent book-tax differences. These adjustments have no impact on net assets or the results of operations. Temporary book-tax differences will reverse in a subsequent period.
Book-tax differences are primarily due to foreign currency transactions, passive foreign investment companies (PFIC), market discount, partnerships, deferred trustees compensation and losses deferred due to wash sales.
The tax-basis components of distributable earnings and the federal tax cost as of period end were as follows:
Unrealized appreciation | $ 3,880,252,554 |
Unrealized depreciation | (295,422,391) |
Net unrealized appreciation (depreciation) | 3,584,830,163 |
Undistributed ordinary income | 8,572,542 |
Undistributed long-term capital gain | 13,681,943 |
| |
Cost for federal income tax purposes | $ 8,749,804,577 |
The tax character of distributions paid was as follows:
| December 31, 2006 | December 31, 2005 |
Ordinary Income | $ 503,567,088 | $ 222,487,447 |
Long-term Capital Gains | 1,208,675,540 | 347,854,632 |
Total | $ 1,712,242,628 | $ 570,342,079 |
Trading (Redemption) Fees. Service Class 2R shares held less than 60 days are subject to a redemption fee equal to 1% of the proceeds of the redeemed shares. All redemption fees, including any estimated redemption fees paid by FMR, are retained by the Fund and accounted for as an addition to paid in capital.
New Accounting Pronouncements. In July 2006, Financial Accounting Standards Board Interpretation No. 48, Accounting for Uncertainty in Income Taxes - an interpretation of FASB Statement 109 (FIN 48), was issued and is effective on the last business day of the semiannual reporting period for fiscal years beginning after December 15, 2006. FIN 48 sets forth a threshold for financial statement recognition, measurement and disclosure of a tax position taken or expected to be taken on a tax return. Management is currently evaluating the impact, if any, the adoption of FIN 48 will have on the Fund's net assets, results of operations and financial statement disclosures.
In addition, in September 2006, Statement of Financial Accounting Standards No. 157, Fair Value Measurements (SFAS 157), was issued and is effective for fiscal years beginning after November 15, 2007. SFAS 157 defines fair value, establishes a framework for measuring fair value and expands disclosures about fair value measurements. Management is currently evaluating the impact the adoption of SFAS 157 will have on the Fund's financial statement disclosures.
Annual Report
Notes to Financial Statements - continued
2. Operating Policies.
Repurchase Agreements. FMR has received an Exemptive Order from the Securities and Exchange Commission (the SEC) which permits the Fund and other affiliated entities of FMR to transfer uninvested cash balances into joint trading accounts which are then invested in repurchase agreements. The Fund may also invest directly with institutions in repurchase agreements. Repurchase agreements are collateralized by government or non-government securities. Upon settlement date, collateral is held in segregated accounts with custodian banks and may be obtained in the event of a default of the counterparty. The Fund monitors, on a daily basis, the value of the collateral to ensure it is at least equal to the principal amount of the repurchase agreement (including accrued interest). In the event of a default by the counterparty, realization of the collateral proceeds could be delayed, during which time the value of the collateral may decline.
Restricted Securities. The Fund may invest in securities that are subject to legal or contractual restrictions on resale. These securities generally may be resold in transactions exempt from registration or to the public if the securities are registered. Disposal of these securities may involve time-consuming negotiations and expense, and prompt sale at an acceptable price may be difficult. Information regarding restricted securities is included at the end of the Fund's Schedule of Investments.
3. Purchases and Sales of Investments.
Purchases and sales of securities, other than short-term securities, aggregated $2,437,840,437 and $3,025,706,165, respectively.
4. Fees and Other Transactions with Affiliates.
Management Fee. FMR and its affiliates provide the Fund with investment management related services for which the Fund pays a monthly management fee. The management fee is the sum of an individual fund fee rate that is based on an annual rate of .20% of the Fund's average net assets and a group fee rate that averaged .27% during the period. The group fee rate is based upon the average net assets of all the mutual funds advised by FMR. The group fee rate decreases as assets under management increase and increases as assets under management decrease. For the period, the total annual management fee rate was .47% of the Fund's average net assets.
Distribution and Service Plan. In accordance with Rule 12b-1 of the 1940 Act, the Fund has adopted separate 12b-1 Plans for each Service Class of shares. Each Service Class pays Fidelity Distributors Corporation (FDC), an affiliate of FMR, a service fee. For the period, the service fee is based on an annual rate of .10% of Service Class' average net assets and .25% of Service Class 2's and Service Class 2R's average net assets.
For the period, each class paid FDC the following amounts, all of which were re-allowed to insurance companies for the distribution of shares and providing shareholder support services:
Service Class | $ 1,079,776 |
Service Class 2 | 4,934,301 |
Service Class 2R | 29,066 |
| $ 6,043,143 |
Transfer Agent Fees. Fidelity Investments Institutional Operations Company, Inc. (FIIOC), an affiliate of FMR, is the fund's transfer, dividend disbursing, and shareholder servicing agent. FIIOC receives an asset-based fee with respect to each class. Each class with the exception of Investor Class pays a transfer agent fee, excluding out of pocket expenses, equal to an annual rate of .07% of their month end net assets. Investor Class pays a monthly asset-based transfer agent fee of .18% of its month end net assets. The total transfer agent fees paid by each class to FIIOC, including out of pocket expenses, were as follows:
Initial Class | $ 5,281,345 |
Service Class | 718,009 |
Service Class 2 | 1,344,318 |
Service Class 2R | 7,837 |
Investor Class | 182,186 |
| $ 7,533,695 |
Accounting and Security Lending Fees. Fidelity Service Company, Inc. (FSC), an affiliate of FMR, maintains the Fund's accounting records. The accounting fee is based on the level of average net assets for the month. Under a separate contract, FSC administers the security lending program. The security lending fee is based on the number and duration of lending transactions.
VIP Equity-Income Portfolio
4. Fees and Other Transactions with Affiliates - continued
Investments in Fidelity Central Funds. The Fund may invest in Fidelity Central Funds. The Fund's Schedule of Investments lists each of the Fidelity Central Funds as an investment of the Fund but does not include the underlying holdings of each Fidelity Central Fund. As an Investing Fund, the Fund indirectly bears its proportionate share of the expenses of the underlying Fidelity Central Funds. A complete unaudited list of holdings for each Fidelity Central Fund is available upon request. In addition, the financial statements of the Fidelity Central Funds, which are not covered by the Fund's Report of Independent Registered Public Accounting Firm, are available on the EDGAR Database on the SEC's web site, www.sec.gov, or upon request.
The Money Market Central Funds seek preservation of capital and current income and are managed by Fidelity Investments Money Management, Inc. (FIMM), an affiliate of FMR.
Brokerage Commissions. The Fund placed a portion of its portfolio transactions with brokerage firms which are affiliates of the investment adviser. The commissions paid to these affiliated firms were $9,656 for the period.
Interfund Lending Program. Pursuant to an Exemptive Order issued by the SEC, the Fund, along with other registered investment companies having management contracts with FMR, may participate in an interfund lending program. This program provides an alternative credit facility allowing the funds to borrow from, or lend money to, other participating affiliated funds. At period end, there were no interfund loans outstanding. The Fund's activity in this program during the period for which loans were outstanding was as follows:
Borrower or Lender | Average Daily
Loan Balance | Weighted Average Interest Rate | Interest
Expense |
Borrower | $ 9,969,083 | 4.87% | $ 64,697 |
5. Committed Line of Credit.
The Fund participates with other funds managed by FMR in a $4.2 billion credit facility (the "line of credit") to be utilized for temporary or emergency purposes to fund shareholder redemptions or for other short-term liquidity purposes. The Fund has agreed to pay commitment fees on its pro rata portion of the line of credit, which amounted to $30,011 and is reflected in Miscellaneous Expense on the Statement of Operations. During the period, there were no borrowings on this line of credit.
6. Security Lending.
The Fund lends portfolio securities from time to time in order to earn additional income. On the settlement date of the loan, the Fund receives collateral (in the form of U.S. Treasury obligations, letters of credit and/or cash) against the loaned securities and maintains collateral in an amount not less than 100% of the market value of the loaned securities during the period of the loan. The market value of the loaned securities is determined at the close of business of the Fund and any additional required collateral is delivered to the Fund on the next business day. If the borrower defaults on its obligation to return the securities loaned because of insolvency or other reasons, a fund could experience delays and costs in recovering the securities loaned or in gaining access to the collateral. Any cash collateral received is invested in the Fidelity Securities Lending Cash Central Fund. The value of loaned securities and cash collateral at period end are disclosed on the Fund's Statement of Assets and Liabilities. Security lending income represents the income earned on investing cash collateral, less fees and expenses associated with the loan, plus any premium payments that may be received on the loan of certain types of securities. Security lending income is presented in the Statement of Operations as a component of income from Fidelity Central Funds.
7. Bank Borrowings.
The Fund is permitted to have bank borrowings for temporary or emergency purposes to fund shareholder redemptions. The Fund has established borrowing arrangements with certain banks. The interest rate on the borrowings is the bank's base rate, as revised from time to time. The average daily loan balance during the period for which loans were outstanding amounted to $6,306,333. The weighted average interest rate was 5.27%. At period end, there were no bank borrowings outstanding.
8. Expense Reductions.
Many of the brokers with whom FMR places trades on behalf of the Fund provided services to the Fund in addition to trade execution. These services included payments of certain expenses on behalf of the Fund totaling $263,222 for the period. In addition, through arrangements with the fund's custodian, credits realized as a result of uninvested cash balances were used to reduce the Fund's expenses. During the period, these credits reduced the Fund's custody expenses by $16,021.
Annual Report
Notes to Financial Statements - continued
9. Other.
The Fund's organizational documents provide former and current trustees and officers with a limited indemnification against liabilities arising in connection with the performance of their duties to the Fund. In the normal course of business, the Fund may also enter into contracts that provide general indemnifications. The Fund's maximum exposure under these arrangements is unknown as this would be dependent on future claims that may be made against the Fund. The risk of material loss from such claims is considered remote.
At the end of the period, FMR or its affiliates were the owners of record of 12% of the total outstanding shares of the Fund and one otherwise unaffiliated shareholder was the owner of record of 22% of the total outstanding shares of the Fund.
The United States Securities and Exchange Commission ("SEC") is conducting an investigation of FMR (covering the years 2002 to 2004) arising from gifts, gratuities and business entertainment provided by certain brokers to certain individuals who were employed on FMR's domestic equity trading desk during that period. FMR is in discussions with the SEC staff regarding the possible resolution of the matter, but as of period-end no final resolution has been reached.
In December 2006, the Independent Trustees completed their own investigation of the matter with the assistance of independent counsel. The Independent Trustees and FMR agree that, despite the absence of proof that the Fidelity mutual funds experienced diminished execution quality as a result of the improper receipt of gifts and business entertainment, the conduct at issue was serious and is worthy of redress. Accordingly, the Independent Trustees have requested and FMR has agreed to pay $42 million to Fidelity mutual funds, plus interest to be determined at the time that payment is made. A method of allocating this payment among the funds has not yet been determined. The total payment to the Fund is not anticipated to have a material impact on the Fund's net assets. In addition, FMR reimbursed related legal expenses which are recorded in the accompanying Statement of Operations as an expense reduction.
10. Distributions to Shareholders.
Distributions to shareholders of each class were as follows:
| Years ended December 31, |
| 2006 | 2005 |
From net investment income | | |
Initial Class | $ 264,166,176 | $ 137,602,640 |
Service Class | 33,884,044 | 17,563,270 |
Service Class 2 | 59,720,009 | 20,698,826 |
Service Class 2R | 384,977 | 94,385 |
Investor Class | 3,378,206 | - |
Total | $ 361,533,412 | $ 175,959,121 |
From net realized gain | | |
Initial Class | $ 955,191,565 | $ 302,386,049 |
Service Class | 129,915,591 | 40,600,805 |
Service Class 2 | 250,476,248 | 51,172,097 |
Service Class 2R | 1,596,604 | 224,007 |
Investor Class | 13,529,208 | - |
Total | $ 1,350,709,216 | $ 394,382,958 |
VIP Equity-Income Portfolio
11. Share Transactions.
Transactions for each class of shares were as follows:
| Shares | Dollars |
Years ended December 31, | 2006 | 2005 A | 2006 | 2005 A |
Initial Class | | | | |
Shares sold | 11,142,631 | 9,995,592 | $ 291,841,012 | $ 243,588,116 |
Reinvestment of distributions | 48,349,563 | 18,234,094 | 1,219,357,741 | 439,988,689 |
Shares redeemed | (51,111,950) | (61,778,854) | (1,316,326,890) | (1,504,207,375) |
Net increase (decrease) | 8,380,244 | (33,549,168) | $ 194,871,863 | $ (820,630,570) |
Service Class | | | | |
Shares sold | 1,973,377 | 1,664,065 | $ 51,112,539 | $ 40,334,290 |
Reinvestment of distributions | 6,517,581 | 2,417,459 | 163,799,635 | 58,164,074 |
Shares redeemed | (8,189,522) | (7,864,758) | (210,464,004) | (190,937,287) |
Net increase (decrease) | 301,436 | (3,783,234) | $ 4,448,170 | $ (92,438,923) |
Service Class 2 | | | | |
Shares sold | 18,633,564 | 15,407,445 | $ 478,385,754 | $ 370,175,387 |
Reinvestment of distributions | 12,399,920 | 3,009,670 | 310,196,257 | 71,870,922 |
Shares redeemed | (7,758,659) | (6,593,873) | (196,924,442) | (158,371,244) |
Net increase (decrease) | 23,274,825 | 11,823,242 | $ 591,657,569 | $ 283,675,065 |
Service Class 2R | | | | |
Shares sold | 328,046 | 229,939 | $ 8,477,584 | $ 5,501,232 |
Reinvestment of distributions | 79,377 | 13,378 | 1,981,581 | 318,391 |
Shares redeemed | (128,136) | (83,085) | (3,244,089) | (1,983,529) |
Net increase (decrease) | 279,287 | 160,232 | $ 7,215,076 | $ 3,836,094 |
Investor Class | | | | |
Shares sold | 4,614,643 | 1,480,945 | $ 119,868,954 | $ 36,874,007 |
Reinvestment of distributions | 660,041 | - | 16,907,414 | - |
Shares redeemed | (243,553) | (9,091) | (6,281,519) | (229,256) |
Net increase (decrease) | 5,031,131 | 1,471,854 | $ 130,494,849 | $ 36,644,751 |
A Share transactions for Investor Class are for the period July 21, 2005 (commencement of sale of shares) to December 31, 2005.
Annual Report
Report of Independent Registered Public Accounting Firm
To the Trustees of Variable Insurance Products Fund and the Shareholders of VIP Equity-Income Portfolio:
In our opinion, the accompanying statement of assets and liabilities, including the schedule of investments, and the related statements of operations and of changes in net assets and the financial highlights present fairly, in all material respects, the financial position of VIP Equity-Income Portfolio (a fund of Variable Insurance Products Fund) at December 31, 2006, the results of its operations for the year then ended, the changes in its net assets for each of the two years in the period then ended and the financial highlights for each of the periods indicated, in conformity with accounting principles generally accepted in the United States of America. These financial statements and financial highlights (hereafter referred to as "financial statements") are the responsibility of the VIP Equity-Income Portfolio's management; our responsibility is to express an opinion on these financial statements based on our audits. We conducted our audits of these financial statements in accordance with the standards of the Public Company Accounting Oversight Board (United States). Those standards require that we plan and perform the audit to obtain reasonable assurance about whether the financial statements are free of material misstatement. An audit includes examining, on a test basis, evidence supporting the amounts and disclosures in the financial statements, assessing the accounting principles used and significant estimates made by management, and evaluating the overall financial statement presentation. We believe that our audits, which included confirmation of securities at December 31, 2006 by correspondence with the custodian and brokers, provide a reasonable basis for our opinion.
/s/ PricewaterhouseCoopers LLP
PricewaterhouseCoopers LLP
Boston, Massachusetts
February 12, 2007
VIP Equity-Income Portfolio
Trustees and Officers
The Trustees, Member of the Advisory Board, and executive officers of the trust and fund, as applicable, are listed below. The Board of Trustees governs the fund and is responsible for protecting the interests of shareholders. The Trustees are experienced executives who meet periodically throughout the year to oversee the fund's activities, review contractual arrangements with companies that provide services to the fund, and review the fund's performance. Each of the Trustees oversees 348 funds advised by FMR or an affiliate.
The Trustees hold office without limit in time except that (a) any Trustee may resign; (b) any Trustee may be removed by written instrument, signed by at least two-thirds of the number of Trustees prior to such removal; (c) any Trustee who requests to be retired or who has become incapacitated by illness or injury may be retired by written instrument signed by a majority of the other Trustees; and (d) any Trustee may be removed at any special meeting of shareholders by a two-thirds vote of the outstanding voting securities of the trust. Each Trustee who is not an interested person (as defined in the 1940 Act) (Independent Trustee), shall retire not later than the last day of the calendar year in which his or her 72nd birthday occurs. The Independent Trustees may waive this mandatory retirement age policy with respect to individual Trustees. The executive officers and Advisory Board Member hold office without limit in time, except that any officer and Advisory Board Member may resign or may be removed by a vote of a majority of the Trustees at any regular meeting or any special meeting of the Trustees. Except as indicated, each individual has held the office shown or other offices in the same company for the past five years.
The fund's Statement of Additional Information (SAI) includes more information about the Trustees. To request a free copy, call Fidelity at 1-877-208-0098.
Interested Trustees *:
Correspondence intended for each Trustee who is an interested person may be sent to Fidelity Investments, 82 Devonshire Street, Boston, Massachusetts 02109.
Name, Age; Principal Occupation |
Edward C. Johnson 3d (76) |
| Year of Election or Appointment: 1981 Mr. Johnson is Chairman of the Board of Trustees. Mr. Johnson serves as President (2006-present), Chief Executive Officer, Chairman, and a Director of FMR Corp.; Chairman and a Director of FMR; Chairman and a Director of Fidelity Research & Analysis Company (FRAC); Chairman and a Director of Fidelity Investments Money Management, Inc.; and Chairman (2001-present) and a Director of FMR Co., Inc. In addition, Mr. Johnson serves as Chairman and Director of Fidelity International Limited (FIL). |
Robert L. Reynolds (54) |
| Year of Election or Appointment: 2003 Mr. Reynolds is President and a Director of FMR (2005-present), Fidelity Investments Money Management, Inc. (2005-present), and FMR Co., Inc. (2005-present). Mr. Reynolds also serves as Vice Chairman (2006-present), a Director (2003-present), and Chief Operating Officer of FMR Corp. and a Director of Strategic Advisers, Inc. (2005-present). He also serves on the Board at Fidelity Investments Canada, Ltd. |
* Trustees have been determined to be "Interested Trustees" by virtue of, among other things, their affiliation with the trust or various entities under common control with FMR.
Independent Trustees:
Correspondence intended for each Independent Trustee (that is, the Trustees other than the Interested Trustees) may be sent to Fidelity Investments, P.O. Box 55235, Boston, Massachusetts 02205-5235.
Name, Age; Principal Occupation |
Dennis J. Dirks (58) |
| Year of Election or Appointment: 2005 Prior to his retirement in May 2003, Mr. Dirks was Chief Operating Officer and a member of the Board of The Depository Trust & Clearing Corporation (DTCC) (1999-2003). He also served as President, Chief Operating Officer, and Board member of The Depository Trust Company (DTC) (1999-2003) and President and Board member of the National Securities Clearing Corporation (NSCC) (1999-2003). In addition, Mr. Dirks served as Chief Executive Officer and Board member of the Government Securities Clearing Corporation (2001-2003) and Chief Executive Officer and Board member of the Mortgage-Backed Securities Clearing Corporation (2001-2003). Mr. Dirks also serves as a Trustee and a member of the Finance Committee of Manhattan College (2005-present) and a Trustee and a member of the Finance Committee of AHRC of Nassau County (2006-present). |
Albert R. Gamper, Jr. (64) |
| Year of Election or Appointment: 2006 Prior to his retirement in December 2004, Mr. Gamper served as Chairman of the Board of CIT Group Inc. (commercial finance). During his tenure with CIT Group Inc. Mr. Gamper served in numerous senior management positions, including Chairman (1987-1989; 1999-2001; 2002-2004), Chief Executive Officer (1987-2004), and President (1989-2002). He currently serves as a member of the Board of Directors of Public Service Enterprise Group (utilities, 2001-present), Chairman of the Board of Governors, Rutgers University (2004-present), and Chairman of the Board of Saint Barnabas Health Care System. |
George H. Heilmeier (70) |
| Year of Election or Appointment: 2004 Dr. Heilmeier is Chairman Emeritus of Telcordia Technologies (communication software and systems), where prior to his retirement, he served as company Chairman and Chief Executive Officer. He currently serves on the Boards of Directors of The Mitre Corporation (systems engineering and information technology support for the government), and HRL Laboratories (private research and development, 2004-present). He is Chairman of the General Motors Science & Technology Advisory Board and a Life Fellow of the Institute of Electrical and Electronics Engineers (IEEE). Dr. Heilmeier is a member of the Defense Science Board and the National Security Agency Advisory Board. He is also a member of the National Academy of Engineering, the American Academy of Arts and Sciences, and the Board of Overseers of the School of Engineering and Applied Science of the University of Pennsylvania. Previously, Dr. Heilmeier served as a Director of TRW Inc. (automotive, space, defense, and information technology, 1992-2002), Compaq (1994-2002), Automatic Data Processing, Inc. (ADP) (technology-based business outsourcing, 1995-2002), INET Technologies Inc. (telecommunications network surveillance, 2001-2004), and Teletech Holdings (customer management services). He is the recipient of the 2005 Kyoto Prize in Advanced Technology for his invention of the liquid crystal display, and a member of the Consumer Electronics Hall of Fame. |
James H. Keyes (66) |
| Year of Election or Appointment: 2007 Prior to his retirement in 2003, Mr. Keyes was Chairman, President, and Chief Executive Officer of Johnson Controls, Inc. (automotive supplier, 1993-2003). He currently serves as a member of the boards of LSI Logic Corporation (semiconductor technologies), Navistar International Corporation (manufacture and sale of trucks, buses, and diesel engines, 2002-present), and Pitney Bowes, Inc. (integrated mail, messaging, and document management solutions). |
Marie L. Knowles (60) |
| Year of Election or Appointment: 2001 Prior to Ms. Knowles' retirement in June 2000, she served as Executive Vice President and Chief Financial Officer of Atlantic Richfield Company (ARCO) (diversified energy, 1996-2000). From 1993 to 1996, she was a Senior Vice President of ARCO and President of ARCO Transportation Company. She served as a Director of ARCO from 1996 to 1998. She currently serves as a Director of Phelps Dodge Corporation (copper mining and manufacturing) and McKesson Corporation (healthcare service, 2002-present). Ms. Knowles is a Trustee of the Brookings Institution and the Catalina Island Conservancy and also serves as a member of the Advisory Board for the School of Engineering of the University of Southern California. |
Ned C. Lautenbach (62) |
| Year of Election or Appointment: 2000 Mr. Lautenbach is Chairman of the Independent Trustees (2006-present). Mr. Lautenbach has been a partner of Clayton, Dubilier & Rice, Inc. (private equity investment firm) since September 1998. Previously, Mr. Lautenbach was with the International Business Machines Corporation (IBM) from 1968 until his retirement in 1998. Mr. Lautenbach serves as a Director of Sony Corporation (2006-present) and Eaton Corporation (diversified industrial) as well as the Philharmonic Center for the Arts in Naples, Florida. He also is a member of the Board of Trustees of Fairfield University (2005-present), as well as a member of the Council on Foreign Relations. |
Cornelia M. Small (62) |
| Year of Election or Appointment: 2005 Ms. Small is a member (2000-present) and Chairperson (2002-present) of the Investment Committee, and a member (2002-present) of the Board of Trustees of Smith College. Previously, she served as Chief Investment Officer (1999-2000), Director of Global Equity Investments (1996-1999), and a member of the Board of Directors of Scudder, Stevens & Clark (1990-1997) and Scudder Kemper Investments (1997-1999). In addition, Ms. Small served as Co-Chair (2000-2003) of the Annual Fund for the Fletcher School of Law and Diplomacy. |
William S. Stavropoulos (67) |
| Year of Election or Appointment: 2001 Mr. Stavropoulos is Chairman Emeritus of the Board of Directors of The Dow Chemical Company. Since joining The Dow Chemical Company in 1967, Mr. Stavropoulos served in numerous senior management positions, including President (1993-2000; 2002-2003), CEO (1995-2000; 2002-2004), and Chairman of the Executive Committee (2000-2004). Currently, he is a Director of NCR Corporation (data warehousing and technology solutions), BellSouth Corporation (telecommunications), Chemical Financial Corporation, Maersk Inc. (industrial conglomerate, 2002-present), and Metalmark Capital (private equity investment firm, 2005-present). He also serves as a member of the Board of Trustees of the American Enterprise Institute for Public Policy Research. In addition, Mr. Stavropoulos is a member of The Business Council, J.P. Morgan International Council and the University of Notre Dame Advisory Council for the College of Science. |
Kenneth L. Wolfe (67) |
| Year of Election or Appointment: 2005 Prior to his retirement in 2001, Mr. Wolfe was Chairman and Chief Executive Officer of Hershey Foods Corporation (1993-2001). He currently serves as a member of the boards of Adelphia Communications Corporation (2003-present), Bausch & Lomb, Inc., and Revlon Inc. (2004-present). |
Advisory Board Member and Executive Officers:
Correspondence intended for each executive officer and Mr. Lynch may be sent to Fidelity Investments, 82 Devonshire Street, Boston, Massachusetts 02109.
Name, Age; Principal Occupation |
Peter S. Lynch (62) |
| Year of Election or Appointment: 2003 Member of the Advisory Board of Variable Insurance Products Fund. Mr. Lynch is Vice Chairman and a Director of FMR, and Vice Chairman (2001-present) and a Director of FMR Co., Inc. Previously, Mr. Lynch served as a Trustee of the Fidelity funds (1990-2003). In addition, he serves as a Trustee of Boston College and as the Chairman of the Inner-City Scholarship Fund. |
Kimberley H. Monasterio (43) |
| Year of Election or Appointment: 2007 President and Treasurer of VIP Equity-Income. Ms. Monasterio also serves as President and Treasurer of other Fidelity funds (2007-present) and is an employee of FMR (2004-present). Previously, Ms. Monasterio served as Deputy Treasurer of the Fidelity funds (2004-2006). Before joining Fidelity Investments, Ms. Monasterio served as Treasurer (2000-2004) and Chief Financial Officer (2002-2004) of the Franklin Templeton Funds and Senior Vice President of Franklin Templeton Services, LLC (2000-2004). |
Dwight D. Churchill (53) |
| Year of Election or Appointment: 2005 Vice President of VIP Equity-Income. Mr. Churchill also serves as Vice President of certain Equity Funds (2005-present). Mr. Churchill is Executive Vice President of FMR (2005-present) and FMR Co., Inc. (2005-present). Previously, Mr. Churchill served as Senior Vice President of Fidelity Investments Money Management, Inc. (2005-2006), Head of Fidelity's Fixed-Income Division (2000-2005), Vice President of Fidelity's Money Market Funds (2000-2005), Vice President of Fidelity's Bond Funds, and Senior Vice President of FMR. |
Bruce T. Herring (41) |
| Year of Election or Appointment: 2006 Vice President of VIP Equity-Income. Mr. Herring also serves as Vice President of certain Equity Funds (2006-present). Mr. Herring is Senior Vice President of FMR (2006-present) and Vice President of FMR Co., Inc. (2001-present). Previously, Mr. Herring served as a portfolio manager for Fidelity U.S. Equity Funds (2001-2005). |
Stephen R. Petersen (50) |
| Year of Election or Appointment: 1997 Vice President of VIP Equity-Income. Mr. Petersen also serves as Vice President of other funds advised by FMR. Prior to assuming his current responsibilities, Mr. Petersen worked as a research analyst and portfolio manager. Mr. Petersen also serves as Senior Vice President of FMR (1999) and FMR Co., Inc. (2001). |
Eric D. Roiter (58) |
| Year of Election or Appointment: 1998 Secretary of VIP Equity-Income. He also serves as Secretary of other Fidelity funds; Vice President, General Counsel, and Secretary of FMR Co., Inc. (2001-present) and FMR; Assistant Secretary of Fidelity Management & Research (U.K.) Inc. (2001-present), Fidelity Research & Analysis Company (2001-present), and Fidelity Investments Money Management, Inc. (2001-present). Mr. Roiter is an Adjunct Member, Faculty of Law, at Boston College Law School (2003-present). Previously, Mr. Roiter served as Vice President and Secretary of Fidelity Distributors Corporation (FDC) (1998-2005). |
Stuart Fross (47) |
| Year of Election or Appointment: 2003 Assistant Secretary of VIP Equity-Income. Mr. Fross also serves as Assistant Secretary of other Fidelity funds (2003-present), Vice President and Secretary of FDC (2005-present), and is an employee of FMR. |
R. Stephen Ganis (40) |
| Year of Election or Appointment: 2006 Anti-Money Laundering (AML) officer of VIP Equity-Income. Mr. Ganis also serves as AML officer of other Fidelity funds (2006-present) and FMR Corp. (2003-present). Before joining Fidelity Investments, Mr. Ganis practiced law at Goodwin Procter, LLP (2000-2002). |
Joseph B. Hollis (58) |
| Year of Election or Appointment: 2006 Chief Financial Officer of VIP Equity-Income. Mr. Hollis also serves as Chief Financial Officer of other Fidelity funds. Mr. Hollis is President of Fidelity Pricing and Cash Management Services (FPCMS) (2005-present). Mr. Hollis also serves as President and Director of Fidelity Service Company, Inc. (2006-present). Previously, Mr. Hollis served as Senior Vice President of Cash Management Services (1999-2002) and Investment Management Operations (2002-2005). |
Kenneth A. Rathgeber (59) |
| Year of Election or Appointment: 2004 Chief Compliance Officer of VIP Equity-Income. Mr. Rathgeber also serves as Chief Compliance Officer of other Fidelity funds (2004-present) and Executive Vice President of Risk Oversight for Fidelity Investments (2002-present). He is Chief Compliance Officer of FMR (2005-present), FMR Co., Inc. (2005-present), Fidelity Management & Research (U.K.) Inc. (2005-present), Fidelity Research & Analysis Company (2005-present), Fidelity Investments Money Management, Inc. (2005-present), and Strategic Advisers, Inc. (2005-present). Previously, Mr. Rathgeber served as Executive Vice President and Chief Operating Officer for Fidelity Investments Institutional Services Company, Inc. (1998-2002). |
Bryan A. Mehrmann (45) |
| Year of Election or Appointment: 2005 Deputy Treasurer of VIP Equity-Income. Mr. Mehrmann also serves as Deputy Treasurer of other Fidelity funds (2005-present) and is an employee of FMR. Previously, Mr. Mehrmann served as Vice President of Fidelity Investments Institutional Services Group (FIIS)/Fidelity Investments Institutional Operations Corporation, Inc. (FIIOC) Client Services (1998-2004). |
Kenneth B. Robins (37) |
| Year of Election or Appointment: 2005 Deputy Treasurer of VIP Equity-Income. Mr. Robins also serves as Deputy Treasurer of other Fidelity funds (2005-present) and is an employee of FMR (2004-present). Before joining Fidelity Investments, Mr. Robins worked at KPMG LLP, where he was a partner in KPMG's department of professional practice (2002-2004) and a Senior Manager (1999-2000). In addition, Mr. Robins served as Assistant Chief Accountant, United States Securities and Exchange Commission (2000-2002). |
Robert G. Byrnes (40) |
| Year of Election or Appointment: 2005 Assistant Treasurer of VIP Equity-Income. Mr. Byrnes also serves as Assistant Treasurer of other Fidelity funds (2005-present) and is an employee of FMR (2005-present). Previously, Mr. Byrnes served as Vice President of FPCMS (2003-2005). Before joining Fidelity Investments, Mr. Byrnes worked at Deutsche Asset Management where he served as Vice President of the Investment Operations Group (2000-2003). |
John H. Costello (60) |
| Year of Election or Appointment: 1986 Assistant Treasurer of VIP Equity-Income. Mr. Costello also serves as Assistant Treasurer of other Fidelity funds and is an employee of FMR. |
Peter L. Lydecker (52) |
| Year of Election or Appointment: 2004 Assistant Treasurer of VIP Equity-Income. Mr. Lydecker also serves as Assistant Treasurer of other Fidelity funds (2004) and is an employee of FMR. |
Mark Osterheld (51) |
| Year of Election or Appointment: 2002 Assistant Treasurer of VIP Equity-Income. Mr. Osterheld also serves as Assistant Treasurer of other Fidelity funds (2002) and is an employee of FMR. |
Gary W. Ryan (48) |
| Year of Election or Appointment: 2005 Assistant Treasurer of VIP Equity-Income. Mr. Ryan also serves as Assistant Treasurer of other Fidelity funds (2005-present) and is an employee of FMR (2005-present). Previously, Mr. Ryan served as Vice President of Fund Reporting in FPCMS (1999-2005). |
Salvatore Schiavone (41) |
| Year of Election or Appointment: 2005 Assistant Treasurer of VIP Equity-Income. Mr. Schiavone also serves as Assistant Treasurer of other Fidelity funds (2005-present) and is an employee of FMR (2005-present). Before joining Fidelity Investments, Mr. Schiavone worked at Deutsche Asset Management, where he most recently served as Assistant Treasurer (2003-2005) of the Scudder Funds and Vice President and Head of Fund Reporting (1996-2003). |
Annual Report
Distributions
The Board of Trustees of VIP Equity-Income Portfolio voted to pay to shareholders of record at the opening of business on record date, the following distributions per share derived from capital gains realized from sales of portfolio securities, and dividends derived from net investment income:
| Pay Date | Record Date | Dividends | Capital Gains |
Service Class 2R | 02/09/07 | 02/09/07 | $.01 | $.04 |
The fund hereby designates as a capital gain dividend with respect to the taxable year ended December 31, 2006, $760,494,950, or, if subsequently determined to be different, the net capital gain of such year.
Service Class 2R designates 81% and 94% of the dividends distributed in February and December 2006 respectively, during the fiscal year as qualifying for the dividends-received deduction for corporate shareholders.
The fund will notify shareholders in January 2007 of amounts for use in preparing 2006 income tax returns.
VIP Equity-Income Portfolio
Proxy Voting Results
A special meeting of the fund's shareholders was held on November 15, 2006. The results of votes taken among shareholders on the proposal before them are reported below. Each vote reported represents one dollar of net asset value held on the record date for the meeting.
PROPOSAL 1 |
To elect a Board of Trustees. A |
| # of
Votes | % of
Votes |
Dennis J. Dirks |
Affirmative | 17,902,425,874.20 | 95.888 |
Withheld | 767,753,174.62 | 4.112 |
TOTAL | 18,670,179,048.82 | 100.000 |
Albert R. Gamper, Jr. |
Affirmative | 17,903,848,885.90 | 95.895 |
Withheld | 766,330,162.92 | 4.105 |
TOTAL | 18,670,179,048.82 | 100.000 |
Robert M. Gates |
Affirmative | 17,872,803,847.04 | 95.729 |
Withheld | 797,375,201.78 | 4.271 |
TOTAL | 18,670,179,048.82 | 100.000 |
George H. Heilmeier |
Affirmative | 17.870,083,099.32 | 95.715 |
Withheld | 800,095,949.50 | 4.285 |
TOTAL | 18,670,179,048.82 | 100.000 |
Edward C. Johnson 3d |
Affirmative | 17,855,450,949.13 | 95.636 |
Withheld | 814,728,099.69 | 4.364 |
TOTAL | 18,670,179,048.82 | 100.000 |
Stephen P. Jonas |
Affirmative | 17,891,792,907.31 | 95.831 |
Withheld | 778,386,141.51 | 4.169 |
TOTAL | 18,670,179,048.82 | 100.000 |
James H. KeyesB |
Affirmative | 17,882,873,107.76 | 95.783 |
Withheld | 787,305,941.06 | 4.217 |
TOTAL | 18,670,179,048.82 | 100.000 |
Marie L. Knowles |
Affirmative | 17,891,908,567.08 | 95.831 |
Withheld | 778,270,481.74 | 4.169 |
TOTAL | 18,670,179,048.82 | 100.000 |
Ned C. Lautenbach |
Affirmative | 17,899,551,251.03 | 95.872 |
Withheld | 770,627,797.79 | 4.128 |
TOTAL | 18,670,179,048.82 | 100.000 |
| # of
Votes | % of
Votes |
William O. McCoy |
Affirmative | 17,860,461,325.05 | 95.663 |
Withheld | 809,717,723.77 | 4.337 |
TOTAL | 18,670,179,048.82 | 100.000 |
Robert L. Reynolds |
Affirmative | 17,894,978,918.13 | 95.848 |
Withheld | 775,200,130.69 | 4.152 |
TOTAL | 18,670,179,048.82 | 100.000 |
Cornelia M. Small |
Affirmative | 17,897,519,970.69 | 95.862 |
Withheld | 772,659,078.13 | 4.138 |
TOTAL | 18,670,179,048.82 | 100.000 |
William S. Stavropoulos |
Affirmative | 17,871,058,112.55 | 95.720 |
Withheld | 799,120,936.27 | 4.280 |
TOTAL | 18,670,179,048.82 | 100.000 |
Kenneth L. Wolfe |
Affirmative | 17,886,340,376.33 | 95.802 |
Withheld | 783,838,672.49 | 4.198 |
TOTAL | 18,670,179,048.82 | 100.000 |
A Denotes trust-wide proposal and voting results. B Effective on or about January 1, 2007. |
Annual Report
Board Approval of Investment Advisory Contracts and Management Fees
VIP Equity-Income Portfolio
Each year, typically in July, the Board of Trustees, including the Independent Trustees (together, the Board), votes on the renewal of the management contract and sub-advisory agreements (together, the Advisory Contracts) for the fund. The Board, assisted by the advice of fund counsel and Independent Trustees' counsel, requests and considers a broad range of information throughout the year.
The Board meets regularly each month except August and takes into account throughout the year matters bearing on Advisory Contracts. The Board, acting directly and through its separate committees, considers at each of its meetings factors that are relevant to the annual renewal of the fund's Advisory Contracts, including the services and support provided to the fund and its shareholders. At the time of the renewal, the Board had 12 standing committees, each composed of Independent Trustees with varying backgrounds, to which the Board has assigned specific subject matter responsibilities in order to enhance effective decision-making by the Board. Each committee has adopted a written charter outlining the structure and purposes of the committee. One such committee, the Equity Contract Committee, meets periodically as needed throughout the year to consider matters specifically related to the annual renewal of Advisory Contracts. The committee requests and receives information on, and makes recommendations to the Independent Trustees concerning, the approval and annual review of the Advisory Contracts.
At its July 2006 meeting, the Board of Trustees, including the Independent Trustees, unanimously determined to renew the Advisory Contracts for the fund. In reaching its determination, the Board considered all factors it believed relevant, including (i) the nature, extent, and quality of the services to be provided to the fund and its shareholders (including the investment performance of the fund); (ii) the competitiveness of the management fee and total expenses of the fund; (iii) the total costs of the services to be provided by and the profits to be realized by the investment adviser and its affiliates from the relationship with the fund; (iv) the extent to which economies of scale would be realized as the fund grows; and (v) whether fee levels reflect these economies of scale, if any, for the benefit of fund shareholders.
In determining whether to renew the Advisory Contracts for the fund, the Board ultimately reached a determination, with the assistance of fund counsel and Independent Trustees' counsel, that the renewal of the Advisory Contracts and the compensation to be received by Fidelity under the management contract is consistent with Fidelity's fiduciary duty under applicable law. In addition to evaluating the specific factors noted above, the Board, in reaching its determination, is aware that shareholders in the fund have a broad range of investment choices available to them, including a wide choice among mutual funds offered by competitors to Fidelity, and that the fund's shareholders, with the opportunity to review and weigh the disclosure provided by the fund in its prospectus and other public disclosures, have chosen to invest in this fund, managed by Fidelity.
Nature, Extent, and Quality of Services Provided. The Board considered staffing within the investment adviser, FMR, and the sub-advisers (together, the Investment Advisers), including the background of the fund's portfolio manager and the fund's investment objective and discipline. The Independent Trustees also had discussions with senior management of Fidelity's investment operations and investment groups. The Board considered the structure of the portfolio manager compensation program and whether this structure provides appropriate incentives.
Resources Dedicated to Investment Management and Support Services. The Board reviewed the size, education, and experience of the Investment Advisers' investment staff, their use of technology, and the Investment Advisers' approach to recruiting, training, and retaining portfolio managers and other research, advisory, and management personnel. The Board considered Fidelity's extensive global research capabilities that enable the Investment Advisers to aggregate data from various sources in an effort to produce positive investment results. The Board noted that Fidelity's analysts have access to a variety of technological tools that enable them to perform both fundamental and quantitative analysis and to specialize in various disciplines. The Board also considered that Fidelity's portfolio managers and analysts have access to daily portfolio attribution that allows for monitoring of a fund's portfolio, as well as an electronic communication system that provides immediate real-time access to research concerning issuers and credit enhancers.
Shareholder and Administrative Services. The Board considered (i) the nature, extent, quality, and cost of administrative, distribution, and shareholder services performed by the Investment Advisers and their affiliates under the Advisory Contracts and under separate agreements covering transfer agency, pricing and bookkeeping, and securities lending services for the fund; (ii) the nature and extent of the Investment Advisers' supervision of third party service providers, principally custodians and subcustodians; and (iii) the resources devoted to, and the record of compliance with, the fund's compliance policies and procedures. The Board reviewed the allocation of fund brokerage, including allocations to brokers affiliated with the Investment Advisers, the use of brokerage commissions to pay fund expenses, and the use of "soft" commission dollars to pay for research services. The Board also considered that Fidelity voluntarily pays for market data out of its own resources.
The Board noted that the growth of fund assets across the complex allows Fidelity to reinvest in the development of services designed to enhance the value or convenience of the Fidelity funds as investment vehicles. These services include 24-hour access to account information and market information through phone representatives and over the Internet, and investor education materials and asset allocation tools.
Investment in a Large Fund Family. The Board considered the benefits to shareholders of investing in a Fidelity fund, including the benefits of investing in a fund that is part of a large family of funds offering a variety of investment disciplines and providing for a large variety of mutual fund investor services. The Board noted that, since the last Advisory Contract renewals in July 2005, Fidelity has taken a number of actions that benefited particular funds, including (i) dedicating additional resources to investment research and to restructure the investment research teams; (ii) voluntarily entering into contractual arrangements with certain brokers pursuant to which Fidelity pays for research products and services separately out of its own resources, rather than bundling with fund commissions; (iii) launching the Fidelity Advantage Class of its five Spartan stock index funds and three Spartan bond index funds, which is a lower-fee class available to shareholders with higher account balances; (iv) contractually agreeing to impose expense limitations on Fidelity U.S. Bond Index Fund and reducing the fund's initial investment minimum; and (v) offering shareholders of each of the Fidelity Institutional Money Market Funds the privilege of exchanging shares of the fund for shares of other Fidelity funds.
VIP Equity-Income Portfolio
Investment Performance and Compliance. The Board considered whether the fund has operated within its investment objective, as well as its record of compliance with its investment restrictions. It also reviewed the fund's absolute investment performance for each class (except Investor Class), as well as the fund's relative investment performance for each class (except Investor Class) measured against (i) a broad-based securities market index, and (ii) a peer group of mutual funds deemed appropriate by the Board over multiple periods. The following charts considered by the Board show, over the one-, three-, and five-year periods ended December 31, 2005, the cumulative total returns of Service Class 2 and Initial Class of the fund, the cumulative total returns of a broad-based securities market index ("benchmark"), and a range of cumulative total returns of a peer group of mutual funds identified by Lipper Inc. as having an investment objective similar to that of the fund. The returns of Service Class 2 and Initial Class represent the performance of classes with the highest and lowest 12b-1 fees, respectively (not necessarily with the highest and lowest total expenses). (Investor Class of the fund, which has no 12b-1 fee, had less than one year of performance as of December 31, 2005.) The box within each chart shows the 25th percentile return (bottom of box) and the 75th percentile return (top of box) of the Lipper peer group. Returns shown above the box are in the first quartile and returns shown below the box are in the fourth quartile. The percentage beaten numbers noted below each chart correspond to the percentile box and represent the percentage of funds in the Lipper peer group whose performance was equal to or lower than that of the class indicated.
VIP Equity-Income Portfolio

The Board reviewed the fund's relative investment performance against its Lipper peer group and stated that the performance of Initial Class of the fund was in the second quartile for all the periods shown. The Board also stated that the relative investment performance of the fund was lower than its benchmark for all the periods shown. The Board considered that the variations in performance among the fund's classes reflect the variations in class expenses, which result in lower performance for higher expense classes.
The Board considered that FMR has taken steps to refocus and strengthen equity research, equity portfolio management, and compliance. The Board noted with favor FMR's reorganization of its senior management team in 2005 and FMR's dedication of additional resources to investment research, and participated in the process that led to those changes.
Based on its review, and giving particular weight to the nature and quality of the resources dedicated by the Investment Advisers to maintain and improve relative performance, the Board concluded that the nature, extent, and quality of the services provided to the fund will benefit the fund's shareholders, particularly in light of the Board's view that the fund's shareholders benefit from investing in a fund that is part of a large family of funds offering a variety of investment disciplines and services.
Competitiveness of Management Fee and Total Fund Expenses. The Board considered the fund's management fee and total expenses compared to "mapped groups" of competitive funds and classes. Fidelity creates "mapped groups" by combining similar Lipper investment objective categories that have comparable management fee characteristics. Combining Lipper investment objective categories aids the Board's management fee and total expense comparisons by broadening the competitive group used for comparison and by reducing the number of universes to which various Fidelity funds are compared.
Annual Report
Board Approval of Investment Advisory Contracts and Management Fees - continued
The Board considered two proprietary management fee comparisons for the 12-month periods shown in the chart below. The group of Lipper funds used by the Board for management fee comparisons is referred to below as the "Total Mapped Group" and, for the reasons explained above, is broader than the Lipper peer group used by the Board for performance comparisons. The Total Mapped Group comparison focuses on a fund's standing relative to the total universe of comparable funds available to investors, in terms of gross management fees before expense reimbursements or caps. "TMG %" represents the percentage of funds in the Total Mapped Group that had management fees that were lower than the fund's. For example, a TMG % of 10% means that 90% of the funds in the Total Mapped Group had higher management fees than the fund. The "Asset-Size Peer Group" (ASPG) comparison focuses on a fund's standing relative to non-Fidelity funds similar in size to the fund within the Total Mapped Group. The ASPG represents at least 15% of the funds in the Total Mapped Group with comparable asset size and management fee characteristics, subject to a minimum of 50 funds (or all funds in the Total Mapped Group if fewer than 50). Additional information, such as the ASPG quartile in which the fund's management fee ranked, is also included in the chart and considered by the Board.
VIP Equity-Income Portfolio

The Board noted that the fund's management fee ranked below the median of its Total Mapped Group and below the median of its ASPG for 2005.
Based on its review, the Board concluded that the fund's management fee was fair and reasonable in light of the services that the fund receives and the other factors considered.
In its review of each class's total expenses, the Board considered the fund's management fee as well as other fund or class expenses, as applicable, such as transfer agent fees, pricing and bookkeeping fees, fund-paid 12b-1 fees, and custodial, legal, and audit fees. The Board also noted the effects of any waivers and reimbursements on fees and expenses. As part of its review, the Board also considered current and historical total expenses of each class of the fund compared to competitive fund median expenses. Each class of the fund is compared to those funds and classes in the Total Mapped Group (used by the Board for management fee comparisons) that have a similar sales load structure.
The Board noted that the total expenses of each class ranked below its competitive median for 2005.
In its review of total expenses, the Board also considered Fidelity fee structures and other information on clients that FMR and its affiliates service in other competitive markets, such as other mutual funds advised or subadvised by FMR or its affiliates, pension plan clients, and other institutional clients.
Based on its review, the Board concluded that the total expenses of each class of the fund were reasonable in light of the services that the fund and its shareholders receive and the other factors considered.
Costs of the Services and Profitability. The Board considered the revenues earned and the expenses incurred by Fidelity in conducting the business of developing, marketing, distributing, managing, administering and servicing the fund and its shareholders. The Board also considered the level of Fidelity's profits in respect of all the Fidelity funds.
VIP Equity-Income Portfolio
On an annual basis, FMR presents to the Board Fidelity's profitability for the fund. Fidelity calculates the profitability for each fund, as well as aggregate profitability for groups of Fidelity funds and all Fidelity funds, using a series of detailed revenue and cost allocation methodologies which originate with the audited books and records of Fidelity. The Audit Committee of the Board reviews any significant changes from the prior year's methodologies.
PricewaterhouseCoopers LLP (PwC), independent registered accounting firm and auditor to Fidelity and certain Fidelity funds, has been engaged annually by the Board as part of the Board's assessment of the results of Fidelity's profitability analysis. PwC's engagement includes the review and assessment of Fidelity's methodologies used in determining the revenues and expenses attributable to Fidelity's mutual fund business, and completion of agreed-upon procedures surrounding the mathematical accuracy of fund profitability and its conformity to allocation methodologies. After considering PwC's reports issued under the engagement and information provided by Fidelity, the Board believes that while other allocation methods may also be reasonable, Fidelity's profitability methodologies are reasonable in all material respects.
The Board has also reviewed Fidelity's non-fund businesses and any fall-out benefits related to the mutual fund business as well as cases where Fidelity's affiliates may benefit from or be related to the fund's business.
The Board considered the costs of the services provided by and the profits realized by Fidelity in connection with the operation of the fund and determined that the amount of profit is a fair entrepreneurial profit for the management of the fund.
Economies of Scale. The Board considered whether there have been economies of scale in respect of the management of the Fidelity funds, whether the Fidelity funds (including the fund) have appropriately benefited from any such economies of scale, and whether there is potential for realization of any further economies of scale. The Board considered the extent to which the fund will benefit from economies of scale through increased services to the fund, through waivers or reimbursements, or through fee or expense reductions.
The Board recognized that the fund's management contract incorporates a "group fee" structure, which provides for lower fee rates as total fund assets under FMR's management increase, and for higher fee rates as total fund assets under FMR's management decrease. The Board considered that the group fee is designed to deliver the benefits of economies of scale to fund shareholders when total fund assets increase, even if assets of any particular fund are unchanged or have declined, because some portion of Fidelity's costs are attributable to services provided to all Fidelity funds, and all funds benefit if those costs can be allocated among more assets. The Board concluded that, given the group fee structure, fund shareholders will achieve a certain level of economies of scale as assets under FMR's management increase at the fund complex level, regardless of whether Fidelity achieves any such economies of scale.
The Board further concluded that any potential economies of scale are being shared between fund shareholders and Fidelity in an appropriate manner.
Additional Information Requested by the Board. In order to develop fully the factual basis for consideration of the Advisory Contracts, the Board requested additional information on several topics, including (i) Fidelity's fund profitability methodology and profitability trends within certain funds; (ii) portfolio manager compensation; (iii) the extent to which any economies of scale exist and are shared between the funds and Fidelity; (iv) the total expenses of certain funds and classes relative to competitors, including the extent to which the expenses of certain funds have been or could be capped; (v) fund performance trends; and (vi) Fidelity's fee structures, including use of performance fees.
Based on its evaluation of all of the conclusions noted above, and after considering all material factors, the Board ultimately concluded that the advisory fee structures are fair and reasonable, and that the fund's Advisory Contracts should be renewed.
Annual Report
Investment Adviser
Fidelity Management & Research Company
Boston, MA
Investment Sub-Adviser
FMR Co., Inc.
Fidelity Management & Research (U.K.) Inc.
Fidelity Research & Analysis Company
(formerly Fidelity Management &
Research (Far East) Inc.)
Fidelity Investments Japan Limited
Fidelity International Investment Advisors
Fidelity International Investment Advisors (U.K.) Limited
General Distributor
Fidelity Distributors Corporation
Boston, MA
Transfer and Service Agents
Fidelity Investments Institutional Operations Company, Inc.
Boston, MA
Fidelity Service Company, Inc.
Boston, MA
Custodian
The Northern Trust Company
Chicago, IL
VIPEI2R-ANN-0207
1.782454.104
Fidelity® Variable Insurance Products:
Growth Portfolio
Annual Report
December 31, 2006
(2_fidelity_logos) (Registered_Trademark)
Contents
Performance | <Click Here> | How the fund has done over time. |
Management's Discussion | <Click Here> | The manager's review of fund performance, strategy and outlook. |
Shareholder Expense Example | <Click Here> | An example of shareholder expenses. |
Investment Changes | <Click Here> | A summary of major shifts in the fund's investments over the past six months. |
Investments | <Click Here> | A complete list of the fund's investments with their
market values. |
Financial Statements | <Click Here> | Statements of assets and liabilities, operations, and
changes in net assets, as well as financial highlights. |
Notes | <Click Here> | Notes to the financial statements. |
Report of Independent Registered Public Accounting Firm | <Click Here> | |
Trustees and Officers | <Click Here> | |
Distributions | <Click Here> | |
Proxy Voting Results | <Click Here> | |
Board Approval of Investment Advisory Contracts and Management Fees | <Click Here> | |
To view a fund's proxy voting guidelines and proxy voting record for the 12-month period ended June 30, visit www.fidelity.com/proxyvotingresults or visit the Securities and Exchange Commission's (SEC) web site at www.sec.gov. You may also call 1-877-208-0098 to request a free copy of the proxy voting guidelines.
Fidelity Variable Insurance Products are separate account options which are purchased through a variable insurance contract.
Standard & Poor's, S&P and S&P 500 are registered service marks of The McGraw-Hill Companies, Inc. and have been licensed for use by Fidelity Distributors Corporation.
Other third party marks appearing herein are the property of their respective owners.
All other marks appearing herein are registered or unregistered trademarks or service marks of FMR Corp. or an affiliated company.
This report and the financial statements contained herein are submitted for the general information of the shareholders of the fund. This report is not authorized for distribution to prospective investors in the fund unless preceded or accompanied by an effective prospectus.
A fund files its complete schedule of portfolio holdings with the SEC for the first and third quarters of each fiscal year on Form N-Q. Forms N-Q are available on the SEC's web site at http://www.sec.gov. A fund's Forms N-Q may be reviewed and copied at the SEC's Public Reference Room in Washington, DC. Information regarding the operation of the SEC's Public Reference Room may be obtained by calling 1-800-SEC-0330. For a complete list of a fund's portfolio holdings, view the most recent quarterly holdings report, semiannual report, or annual report on Fidelity's web site at http://www.advisor.fidelity.com.
NOT FDIC INSURED · MAY LOSE VALUE · NO BANK GUARANTEE
Neither the fund nor Fidelity Distributors Corporation is a bank.
VIP Growth Portfolio
VIP Growth Portfolio
Performance: The Bottom Line
Average annual total return reflects the change in the value of an investment, assuming reinvestment of the class' dividend income and capital gains (the profits earned upon the sale of securities that have grown in value) and assuming a constant rate of performance each year. During periods of reimbursement by Fidelity, a fund's total return will be greater than it would be had the reimbursement not occurred. Performance numbers are net of all underlying fund operating expenses, but do not include any insurance charges imposed by your insurance company's separate account. If performance information included the effect of these additional charges, the total returns would have been lower. How a fund did yesterday is no guarantee of how it will do tomorrow.
Average Annual Total Returns
Periods ended December 31, 2006 | Past 1
year | Past 5
years | Past 10
years |
VIP Growth - Initial Class | 6.85% | 1.65% | 6.53% |
VIP Growth - Service Class A | 6.73% | 1.54% | 6.43% |
VIP Growth - Service Class 2 B | 6.57% | 1.39% | 6.32% |
VIP Growth - Investor Class C | 6.72% | 1.60% | 6.51% |
A The initial offering of Service Class shares took place on November 3, 1997. Performance for Service Class shares reflects an asset-based service fee (12b-1 fee), and returns prior to November 3, 1997 are those of Initial Class and do not include the effects of Service Class 12b-1 fee. Had Service Class shares 12b-1 fee been reflected, returns prior to November 3, 1997 would have been lower.
B The initial offering of Service Class 2 shares took place on January 12, 2000. Performance for Service Class 2 shares reflects an asset-based service fee (12b-1 fee). Returns from November 3, 1997 through January 12, 2000 are those of Service Class which reflect a different 12b-1 fee. Service Class 2 returns prior to November 3, 1997 are those of Initial Class, and do not include the effects of a 12b-1 fee. Had Service Class 2's 12b-1 fee been reflected, returns prior to January 12, 2000 would have been lower.
C The initial offering of Investor Class shares took place on July 21, 2005. Returns prior to July 21, 2005 are those of Initial Class. If Investor Class's transfer agent fee had been reflected, returns prior to July 21, 2005 would have been lower.
$10,000 Over 10 Years
Let's say hypothetically that $10,000 was invested in VIP Growth Portfolio - Initial Class on December 31, 1996. The chart shows how the value of your investment would have changed, and also shows how the Russell 3000® Growth Index performed over the same period.
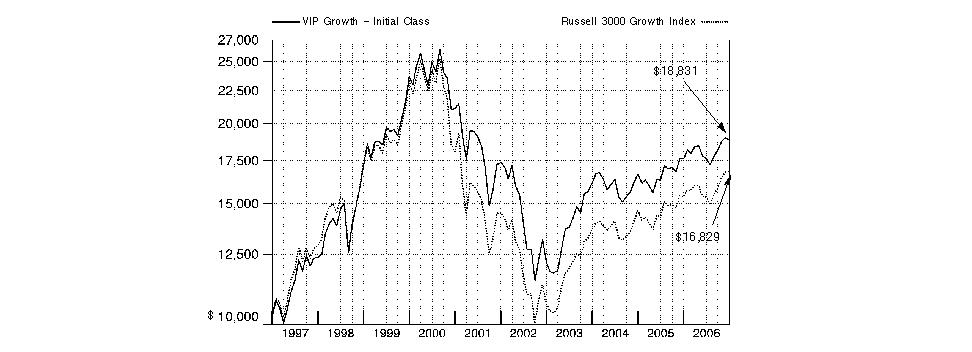
Annual Report
VIP Growth Portfolio
Management's Discussion of Fund Performance
Comments from Jennifer Uhrig, who managed VIP Growth Portfolio for most of the period covered by this report
U.S. stock markets registered their fourth consecutive year of positive returns in 2006. Among the highlights were the performances of the Dow Jones Industrial AverageSM - a gauge of 30 mega-cap, blue-chip stocks - and the small-cap-oriented Russell 2000® Index, both of which reached new highs. The efforts of the Federal Reserve Board to contain inflation levels also dominated the investment headlines. In all, the Fed hiked short-term interest rates four times, but held rates steady after its June 29 increase, finally pausing after 17 rate hikes over a two-year period. A slowing residential housing market and moderating oil prices - the latter of which hit a record closing high of $77 per barrel in July before falling sharply - also held economic growth in check. For the year overall, the Standard & Poor's 500SM Index was up 15.79%, the Dow advanced 19.05%, the Russell 2000 Index gained 18.37% and the NASDAQ Composite® Index rose 10.39%.
For the year ending December 31, 2006, the fund trailed the Russell 3000® Growth Index, which returned 9.46%. (For specific portfolio performance results, please refer to the performance section of this report.) The fund underperformed the index in part because of its conservative positioning during the market's rebound in the latter part of the period and also because of inopportune stock selection in the information technology and health care sectors. Among the holdings that detracted the most were underweighted positions in network equipment maker Cisco Systems, software giant Microsoft and database software maker Oracle, along with weak results from wireless equipment maker QUALCOMM and online auctioneer eBay, the latter of which was sold off by period end. Where the fund did well versus the index - in energy and in segments of the consumer sectors, for example - those gains were mostly a product of favorable stock picking. Top contributors included energy services firm Schlumberger, Taiwanese contract manufacturer Hon Hai Precision Industry and global positioning systems (GPS) leader Garmin. Hon Hai was no longer held at period end.
Note to shareholders: Jason Weiner became Portfolio Manager of the fund on November 9, 2006.
The views expressed above reflect those of the portfolio manager(s) only through the end of the period as stated on the cover of this report and do not necessarily represent the views of Fidelity or any other person in the Fidelity organization. Any such views are subject to change at any time based upon market or other conditions and Fidelity disclaims any responsibility to update such views. These views may not be relied on as investment advice and, because investment decisions for a Fidelity fund are based on numerous factors, may not be relied on as an indication of trading intent on behalf of any Fidelity fund.
VIP Growth Portfolio
VIP Growth Portfolio
Shareholder Expense Example
As a shareholder of the Fund, you incur two types of costs: (1) transaction costs, including redemption fees, and (2) ongoing costs, including management fees, distribution and/or service (12b-1) fees and other Fund expenses. This Example is intended to help you understand your ongoing costs (in dollars) of investing in the Fund and to compare these costs with the ongoing costs of investing in other mutual funds.
The Example is based on an investment of $1,000 invested at the beginning of the period and held for the entire period (July 1, 2006 to December 31, 2006).
Actual Expenses
The first line of the accompanying table for each class of the Fund provides information about actual account values and actual expenses. You may use the information in this line, together with the amount you invested, to estimate the expenses that you paid over the period. Simply divide your account value by $1,000.00 (for example, an $8,600 account value divided by $1,000.00 = 8.6), then multiply the result by the number in the first line for a class of the Fund under the heading entitled "Expenses Paid During Period" to estimate the expenses you paid on your account during this period. The estimate of expenses does not include any fees or other expenses of any variable annuity or variable life insurance product. If they were, the estimate of expenses you paid during the period would be higher, and your ending account value would be lower.
Hypothetical Example for Comparison Purposes
The second line of the accompanying table for each class of the Fund provides information about hypothetical account values and hypothetical expenses based on a Class' actual expense ratio and an assumed rate of return of 5% per year before expenses, which is not the Class' actual return. The hypothetical account values and expenses may not be used to estimate the actual ending account balance or expenses you paid for the period. You may use this information to compare the ongoing costs of investing in the Fund and other funds. To do so, compare this 5% hypothetical example with the 5% hypothetical examples that appear in the shareholder reports of the other funds. The estimate of expenses does not include any fees or other expenses of any variable annuity or variable life insurance product. If they were, the estimate of expenses you paid during the period would be higher, and your ending account value would be lower.
Please note that the expenses shown in the table are meant to highlight your ongoing costs only and do not reflect any transaction costs. Therefore, the second line of the table is useful in comparing ongoing costs only, and will not help you determine the relative total costs of owning different funds. In addition, if these transactional costs were included, your costs would have been higher.
| Beginning
Account Value
July 1, 2006 | Ending
Account Value
December 31, 2006 | Expenses Paid
During Period *
July 1, 2006
to December 31, 2006 |
Initial Class | | | |
Actual | $ 1,000.00 | $ 1,068.50 | $ 3.70 |
Hypothetical A | $ 1,000.00 | $ 1,021.63 | $ 3.62 |
Service Class | | | |
Actual | $ 1,000.00 | $ 1,067.90 | $ 4.22 |
Hypothetical A | $ 1,000.00 | $ 1,021.12 | $ 4.13 |
Service Class 2 | | |
Actual | $ 1,000.00 | $ 1,066.90 | $ 5.00 |
Hypothetical A | $ 1,000.00 | $ 1,020.37 | $ 4.89 |
Service Class 2R | | |
Actual | $ 1,000.00 | $ 1,067.20 | $ 4.95 |
Hypothetical A | $ 1,000.00 | $ 1,020.42 | $ 4.84 |
Investor Class | | |
Actual | $ 1,000.00 | $ 1,068.10 | $ 4.27 |
Hypothetical A | $ 1,000.00 | $ 1,021.07 | $ 4.18 |
A 5% return per year before expenses
* Expenses are equal to each Class' annualized expense ratio (shown in the table below); multiplied by the average account value over the period, multiplied by 184/365 (to reflect the one-half year period).
| Annualized
Expense Ratio |
Initial Class | .71% |
Service Class | .81% |
Service Class 2 | .96% |
Service Class 2R | .95% |
Investor Class | .82% |
Annual Report
VIP Growth Portfolio
Investment Changes
Top Ten Stocks as of December 31, 2006 |
| % of fund's
net assets | % of fund's net assets
6 months ago |
Microsoft Corp. | 3.9 | 2.2 |
Cisco Systems, Inc. | 3.2 | 0.9 |
Biogen Idec, Inc. | 2.8 | 0.0 |
Intel Corp. | 2.7 | 0.0 |
Google, Inc. Class A (sub. vtg.) | 2.6 | 2.2 |
General Electric Co. | 2.6 | 4.4 |
Johnson & Johnson | 1.9 | 3.2 |
Research In Motion Ltd. | 1.8 | 0.0 |
ABB Ltd. sponsored ADR | 1.7 | 0.0 |
Commerce Bancorp, Inc., New Jersey | 1.6 | 0.0 |
| 24.8 | |
Top Five Market Sectors as of December 31, 2006 |
| % of fund's
net assets | % of fund's net assets
6 months ago |
Information Technology | 31.6 | 23.8 |
Health Care | 20.8 | 18.0 |
Consumer Discretionary | 11.1 | 9.7 |
Industrials | 11.1 | 11.9 |
Financials | 10.2 | 10.1 |
Asset Allocation (% of fund's net assets) |
As of December 31, 2006* | As of June 30, 2006** |
| Stocks 99.9% | | | Stocks 99.8% | |
| Short-Term Investments
and Net Other Assets 0.1% | | | Short-Term Investments
and Net Other Assets 0.2% | |
* Foreign investments | 13.2% | | ** Foreign investments | 13.0% | |

VIP Growth Portfolio
VIP Growth Portfolio
Investments December 31, 2006
Showing Percentage of Net Assets
Common Stocks - 99.9% |
| Shares | | Value (Note 1) |
CONSUMER DISCRETIONARY - 11.1% |
Automobiles - 0.6% |
Toyota Motor Corp. sponsored ADR | 297,400 | | $ 39,943,794 |
Diversified Consumer Services - 1.1% |
Sotheby's Class A (ltd. vtg.) (d) | 1,115,450 | | 34,601,259 |
Weight Watchers International, Inc. | 873,800 | | 45,900,714 |
| | 80,501,973 |
Hotels, Restaurants & Leisure - 1.8% |
Bob Evans Farms, Inc. | 255,063 | | 8,728,256 |
Carrols Restaurant Group, Inc. | 52,800 | | 748,704 |
International Game Technology | 278,600 | | 12,871,320 |
McCormick & Schmick's Seafood Restaurants (a) | 487,327 | | 11,715,341 |
McDonald's Corp. | 884,100 | | 39,192,153 |
Melco PBL Entertainment (Macau) Ltd. Sponsored ADR | 44,300 | | 941,818 |
Starbucks Corp. (a) | 1,165,554 | | 41,283,923 |
Yum! Brands, Inc. | 235,023 | | 13,819,352 |
| | 129,300,867 |
Household Durables - 1.7% |
Garmin Ltd. (d) | 1,316,900 | | 73,298,654 |
Sony Corp. sponsored ADR | 1,170,969 | | 50,152,602 |
| | 123,451,256 |
Media - 1.6% |
Lamar Advertising Co. Class A (a) | 583,340 | | 38,144,603 |
McGraw-Hill Companies, Inc. | 467,094 | | 31,771,734 |
Omnicom Group, Inc. | 401,400 | | 41,962,356 |
| | 111,878,693 |
Multiline Retail - 1.1% |
Kohl's Corp. (a) | 519,600 | | 35,556,228 |
Saks, Inc. | 1,208,000 | | 21,526,560 |
Target Corp. | 380,300 | | 21,696,115 |
| | 78,778,903 |
Specialty Retail - 1.6% |
Guess?, Inc. (a) | 506,400 | | 32,120,952 |
J. Crew Group, Inc. | 412,100 | | 15,886,455 |
RadioShack Corp. (d) | 1,361,800 | | 22,851,004 |
Staples, Inc. | 1,391,187 | | 37,144,693 |
Zumiez, Inc. (a) | 366,364 | | 10,822,393 |
| | 118,825,497 |
Textiles, Apparel & Luxury Goods - 1.6% |
Crocs, Inc. (d) | 540,294 | | 23,340,701 |
Polo Ralph Lauren Corp. Class A | 1,056,832 | | 82,073,573 |
Under Armour, Inc. Class A (sub. vtg.) (a) | 230,100 | | 11,608,545 |
| | 117,022,819 |
TOTAL CONSUMER DISCRETIONARY | | 799,703,802 |
|
| Shares | | Value (Note 1) |
CONSUMER STAPLES - 7.1% |
Beverages - 1.7% |
PepsiCo, Inc. | 1,422,629 | | $ 88,985,444 |
The Coca-Cola Co. | 632,700 | | 30,527,775 |
| | 119,513,219 |
Food & Staples Retailing - 2.3% |
CVS Corp. | 3,456,285 | | 106,833,769 |
Sysco Corp. | 417,900 | | 15,362,004 |
Walgreen Co. | 951,500 | | 43,664,335 |
| | 165,860,108 |
Food Products - 0.6% |
Tyson Foods, Inc. Class A | 2,762,900 | | 45,449,705 |
Household Products - 1.3% |
Colgate-Palmolive Co. | 841,000 | | 54,866,840 |
Procter & Gamble Co. | 581,400 | | 37,366,578 |
| | 92,233,418 |
Personal Products - 0.6% |
Avon Products, Inc. | 1,100,779 | | 36,369,738 |
Bare Escentuals, Inc. | 232,247 | | 7,215,914 |
| | 43,585,652 |
Tobacco - 0.6% |
Altria Group, Inc. | 520,300 | | 44,652,146 |
TOTAL CONSUMER STAPLES | | 511,294,248 |
ENERGY - 5.8% |
Energy Equipment & Services - 1.4% |
Baker Hughes, Inc. | 309,670 | | 23,119,962 |
Halliburton Co. | 1,330,400 | | 41,308,920 |
Noble Corp. | 193,500 | | 14,735,025 |
Schlumberger Ltd. (NY Shares) | 343,000 | | 21,663,880 |
| | 100,827,787 |
Oil, Gas & Consumable Fuels - 4.4% |
Canadian Oil Sands Trust unit | 1,365,900 | | 38,200,685 |
Chesapeake Energy Corp. | 2,285,008 | | 66,379,482 |
Denbury Resources, Inc. (a) | 315,900 | | 8,778,861 |
EOG Resources, Inc. | 582,900 | | 36,402,105 |
Exxon Mobil Corp. | 503,800 | | 38,606,194 |
Noble Energy, Inc. | 94,200 | | 4,622,394 |
OAO Gazprom sponsored ADR | 827,100 | | 38,377,440 |
Petroplus Holdings AG | 210,060 | | 12,752,320 |
Quicksilver Resources, Inc. (a) | 195,300 | | 7,146,027 |
Ultra Petroleum Corp. (a) | 1,015,817 | | 48,505,262 |
XTO Energy, Inc. | 402,100 | | 18,918,805 |
| | 318,689,575 |
TOTAL ENERGY | | 419,517,362 |
FINANCIALS - 10.2% |
Capital Markets - 3.6% |
Charles Schwab Corp. | 3,725,972 | | 72,060,298 |
Common Stocks - continued |
| Shares | | Value (Note 1) |
FINANCIALS - continued |
Capital Markets - continued |
Goldman Sachs Group, Inc. | 73,700 | | $ 14,692,095 |
Investors Financial Services Corp. | 349,725 | | 14,922,766 |
Merrill Lynch & Co., Inc. | 330,700 | | 30,788,170 |
Northern Trust Corp. | 626,979 | | 38,051,356 |
State Street Corp. | 807,600 | | 54,464,544 |
UBS AG (NY Shares) | 600,108 | | 36,204,516 |
| | 261,183,745 |
Commercial Banks - 2.4% |
Canadian Western Bank, Edmonton | 265,000 | | 11,995,455 |
Commerce Bancorp, Inc., New Jersey (d) | 3,209,100 | | 113,184,957 |
East West Bancorp, Inc. | 225,100 | | 7,973,042 |
Wells Fargo & Co. | 1,032,000 | | 36,697,920 |
| | 169,851,374 |
Consumer Finance - 1.4% |
American Express Co. (d) | 1,694,200 | | 102,787,114 |
Insurance - 2.8% |
ACE Ltd. | 327,700 | | 19,848,789 |
AFLAC, Inc. | 978,620 | | 45,016,520 |
American International Group, Inc. | 1,400,666 | | 100,371,726 |
Willis Group Holdings Ltd. | 796,700 | | 31,636,957 |
| | 196,873,992 |
TOTAL FINANCIALS | | 730,696,225 |
HEALTH CARE - 20.8% |
Biotechnology - 9.2% |
Acorda Therapeutics, Inc. | 723,483 | | 11,459,971 |
Altus Pharmaceuticals, Inc. | 409,100 | | 7,711,535 |
Amgen, Inc. (a) | 1,305,010 | | 89,145,233 |
Amylin Pharmaceuticals, Inc. (a)(d) | 1,007,225 | | 36,330,606 |
Biogen Idec, Inc. (a) | 4,131,140 | | 203,210,777 |
Cephalon, Inc. (a)(d) | 484,900 | | 34,141,809 |
CSL Ltd. | 486,605 | | 25,110,316 |
Genentech, Inc. (a) | 1,073,300 | | 87,076,829 |
Gilead Sciences, Inc. (a) | 1,341,292 | | 87,090,090 |
OSI Pharmaceuticals, Inc. (a) | 968,710 | | 33,885,476 |
PDL BioPharma, Inc. (a) | 1,219,435 | | 24,559,421 |
Telik, Inc. (a)(d) | 946,993 | | 4,195,179 |
Theravance, Inc. (a) | 485,549 | | 14,998,609 |
| | 658,915,851 |
Health Care Equipment & Supplies - 4.2% |
ArthroCare Corp. (a) | 144,815 | | 5,781,015 |
Becton, Dickinson & Co. | 899,400 | | 63,092,910 |
C.R. Bard, Inc. | 608,700 | | 50,503,839 |
Cochlear Ltd. | 172,439 | | 7,895,154 |
DENTSPLY International, Inc. | 947,714 | | 28,289,263 |
Hologic, Inc. (a) | 686,391 | | 32,452,566 |
Kyphon, Inc. (a) | 167,949 | | 6,785,140 |
Mentor Corp. | 794,540 | | 38,829,170 |
|
| Shares | | Value (Note 1) |
Mindray Medical International Ltd. sponsored ADR | 184,500 | | $ 4,413,240 |
ResMed, Inc. (a) | 709,800 | | 34,936,356 |
Sirona Dental Systems, Inc. | 836,002 | | 32,194,437 |
| | 305,173,090 |
Health Care Providers & Services - 1.7% |
Brookdale Senior Living, Inc. | 334,300 | | 16,046,400 |
Cardinal Health, Inc. | 561,600 | | 36,183,888 |
Henry Schein, Inc. (a) | 1,001,800 | | 49,068,164 |
Medco Health Solutions, Inc. (a) | 445,300 | | 23,796,832 |
| | 125,095,284 |
Life Sciences Tools & Services - 1.5% |
Covance, Inc. (a) | 1,112,000 | | 65,507,920 |
Pharmaceutical Product Development, Inc. | 1,356,921 | | 43,719,995 |
| | 109,227,915 |
Pharmaceuticals - 4.2% |
Allergan, Inc. | 333,300 | | 39,909,342 |
Johnson & Johnson | 2,017,720 | | 133,209,874 |
Merck & Co., Inc. | 1,878,500 | | 81,902,600 |
Wyeth | 870,800 | | 44,341,136 |
| | 299,362,952 |
TOTAL HEALTH CARE | | 1,497,775,092 |
INDUSTRIALS - 11.1% |
Aerospace & Defense - 1.3% |
The Boeing Co. | 1,008,941 | | 89,634,318 |
Air Freight & Logistics - 0.3% |
United Parcel Service, Inc. Class B | 237,440 | | 17,803,251 |
Airlines - 1.3% |
AirTran Holdings, Inc. (a) | 1,240,800 | | 14,566,992 |
Allegiant Travel Co. | 13,800 | | 387,228 |
Ryanair Holdings PLC sponsored ADR (a) | 27,000 | | 2,200,500 |
UAL Corp. (a) | 346,546 | | 15,248,024 |
US Airways Group, Inc. (a) | 1,149,000 | | 61,873,650 |
| | 94,276,394 |
Commercial Services & Supplies - 1.5% |
Cintas Corp. | 850,851 | | 33,787,293 |
Equifax, Inc. | 1,085,104 | | 44,055,222 |
Tele Atlas NV (a) | 1,439,575 | | 30,161,362 |
| | 108,003,877 |
Construction & Engineering - 0.2% |
Jacobs Engineering Group, Inc. (a) | 196,600 | | 16,030,764 |
Electrical Equipment - 2.2% |
ABB Ltd. sponsored ADR | 6,683,500 | | 120,169,330 |
General Cable Corp. | 915,600 | | 40,020,876 |
| | 160,190,206 |
Industrial Conglomerates - 3.9% |
General Electric Co. | 4,917,020 | | 182,962,314 |
McDermott International, Inc. (a) | 714,800 | | 36,354,728 |
Common Stocks - continued |
| Shares | | Value (Note 1) |
INDUSTRIALS - continued |
Industrial Conglomerates - continued |
Textron, Inc. | 393,900 | | $ 36,936,003 |
Tyco International Ltd. | 752,113 | | 22,864,235 |
| | 279,117,280 |
Machinery - 0.4% |
Deere & Co. | 250,300 | | 23,796,021 |
Valmont Industries, Inc. | 131,770 | | 7,311,917 |
| | 31,107,938 |
TOTAL INDUSTRIALS | | 796,164,028 |
INFORMATION TECHNOLOGY - 31.6% |
Communications Equipment - 8.8% |
Cisco Systems, Inc. (a) | 8,372,700 | | 228,825,891 |
Corning, Inc. (a) | 3,630,300 | | 67,922,913 |
Harris Corp. | 818,400 | | 37,531,824 |
Juniper Networks, Inc. (a) | 2,411,600 | | 45,675,704 |
Nice Systems Ltd. sponsored ADR | 1,221,267 | | 37,590,598 |
QUALCOMM, Inc. | 1,291,703 | | 48,813,456 |
Research In Motion Ltd. (a) | 1,018,100 | | 130,092,818 |
TomTom Group BV (a)(d) | 763,835 | | 32,995,338 |
| | 629,448,542 |
Computers & Peripherals - 3.0% |
Apple Computer, Inc. (a) | 865,534 | | 73,431,905 |
EMC Corp. (a) | 5,781,958 | | 76,321,846 |
Network Appliance, Inc. (a) | 1,682,215 | | 66,077,405 |
| | 215,831,156 |
Electronic Equipment & Instruments - 0.7% |
Amphenol Corp. Class A | 783,382 | | 48,632,355 |
Dolby Laboratories, Inc. Class A (a) | 126,700 | | 3,930,234 |
IPG Photonics Corp. | 11,600 | | 278,400 |
| | 52,840,989 |
Internet Software & Services - 3.1% |
Google, Inc. Class A (sub. vtg.) (a) | 402,100 | | 185,159,008 |
LoopNet, Inc. | 164,296 | | 2,461,154 |
VeriSign, Inc. (a) | 1,494,900 | | 35,952,345 |
| | 223,572,507 |
IT Services - 4.0% |
Cognizant Technology Solutions Corp. Class A (a) | 616,600 | | 47,576,856 |
ExlService Holdings, Inc. | 444,874 | | 9,360,149 |
First Data Corp. | 1,439,800 | | 36,743,696 |
Infosys Technologies Ltd. sponsored ADR | 524,400 | | 28,611,264 |
MoneyGram International, Inc. | 233,700 | | 7,328,832 |
Paychex, Inc. | 829,514 | | 32,798,984 |
Satyam Computer Services Ltd. sponsored ADR | 1,609,700 | | 38,648,897 |
|
| Shares | | Value (Note 1) |
The Western Union Co. | 3,711,900 | | $ 83,220,798 |
WNS Holdings Ltd. ADR | 117,800 | | 3,663,580 |
| | 287,953,056 |
Semiconductors & Semiconductor Equipment - 4.6% |
Broadcom Corp. Class A (a) | 2,474,000 | | 79,934,940 |
FormFactor, Inc. (a) | 53,900 | | 2,007,775 |
Integrated Device Technology, Inc. (a) | 1,548,800 | | 23,975,424 |
Intel Corp. | 9,651,400 | | 195,440,850 |
National Semiconductor Corp. | 747,000 | | 16,956,900 |
SiRF Technology Holdings, Inc. (a) | 554,900 | | 14,161,048 |
| | 332,476,937 |
Software - 7.4% |
Activision, Inc. (a) | 1,469,546 | | 25,334,973 |
Electronic Arts, Inc. (a) | 1,231,187 | | 62,002,577 |
Guidance Software, Inc. | 205,700 | | 3,202,749 |
Microsoft Corp. | 9,319,770 | | 278,288,330 |
NSD Co. Ltd. | 237,200 | | 7,531,424 |
Opsware, Inc. (a) | 654,406 | | 5,771,861 |
Oracle Corp. (a) | 5,361,000 | | 91,887,540 |
Red Hat, Inc. (a) | 938,142 | | 21,577,266 |
Take-Two Interactive Software, Inc. (a)(d) | 2,030,657 | | 36,064,468 |
| | 531,661,188 |
TOTAL INFORMATION TECHNOLOGY | | 2,273,784,375 |
MATERIALS - 1.0% |
Chemicals - 1.0% |
Monsanto Co. | 1,234,300 | | 64,837,779 |
Praxair, Inc. | 176,400 | | 10,465,812 |
| | 75,303,591 |
TELECOMMUNICATION SERVICES - 1.2% |
Diversified Telecommunication Services - 1.2% |
AT&T, Inc. | 895,800 | | 32,024,850 |
BellSouth Corp. | 782,200 | | 36,849,442 |
Level 3 Communications, Inc. (a) | 2,961,800 | | 16,586,080 |
| | 85,460,372 |
TOTAL COMMON STOCKS (Cost $6,234,426,050) | 7,189,699,095 |
Preferred Stocks - 0.0% |
| | | |
Convertible Preferred Stocks - 0.0% |
INFORMATION TECHNOLOGY - 0.0% |
Communications Equipment - 0.0% |
Chorum Technologies, Inc. Series E (a)(e) | 88,646 | | 1 |
Nonconvertible Preferred Stocks - 0.0% |
HEALTH CARE - 0.0% |
Life Sciences Tools & Services - 0.0% |
GeneProt, Inc. Series A (a)(e) | 826,000 | | 8 |
Preferred Stocks - continued |
| Shares | | Value (Note 1) |
Nonconvertible Preferred Stocks - continued |
INDUSTRIALS - 0.0% |
Aerospace & Defense - 0.0% |
Rolls-Royce Group PLC Series B | 149,262,496 | | $ 296,723 |
TOTAL NONCONVERTIBLE PREFERRED STOCKS | | 296,731 |
TOTAL PREFERRED STOCKS (Cost $6,086,260) | 296,732 |
Money Market Funds - 1.5% |
| | | |
Fidelity Securities Lending Cash Central Fund, 5.38% (b)(c)
(Cost $107,754,496) | 107,754,496 | | 107,754,496 |
TOTAL INVESTMENT PORTFOLIO - 101.4% (Cost $6,348,266,806) | 7,297,750,323 |
NET OTHER ASSETS - (1.4)% | | (100,060,289) |
NET ASSETS - 100% | 7,197,690,034 |
Legend |
(a) Non-income producing |
(b) Affiliated fund that is available only to investment companies and other accounts managed by Fidelity Investments. The rate quoted is the annualized seven-day yield of the fund at period end. A complete unaudited listing of the fund's holdings as of its most recent quarter end is available upon request. |
(c) Investment made with cash collateral received from securities on loan. |
(d) Security or a portion of the security is on loan at period end. |
(e) Restricted securities - Investment in securities not registered under the Securities Act of 1933 (excluding 144A issues). At the end of the period, the value of restricted securities (excluding 144A issues) amounted to $9 or 0.0% of net assets. |
Additional information on each holding is as follows: |
Security | Acquisition Date | Acquisition Cost |
Chorum Technologies, Inc. Series E | 9/19/00 | $ 1,329,855 |
GeneProt, Inc. Series A | 7/7/00 | $ 4,472,693 |
Affiliated Central Funds |
Information regarding fiscal year to date income earned by the Fund from investments in Fidelity Central Funds is as follows: |
Fund | Income earned |
Fidelity Cash Central Fund | $ 2,410,445 |
Fidelity Securities Lending Cash Central Fund | 1,521,192 |
Total | $ 3,931,637 |
Other Affiliated Issuers |
An affiliated company is a company in which the fund has ownership of at least 5% of the voting securities. Fiscal year to date transactions with companies which are or were affiliates are as follows: |
Affiliate | Value, beginning
of period | Purchases | Sales
Proceeds | Dividend
Income | Value,
end of period |
Cross Country Healthcare, Inc. | $ - | $ 37,470,928 | $ 45,984,832 | $ - | $ - |
Fred's, Inc. Class A | 36,494,326 | 7,755,216 | 36,192,725 | 125,157 | - |
Total | $ 36,494,326 | $ 45,226,144 | $ 82,177,557 | $ 125,157 | $ - |
Other Information |
Distribution of investments by country of issue, as a percentage of total net assets, is as follows: |
United States of America | 86.8% |
Canada | 3.2% |
Switzerland | 2.4% |
Cayman Islands | 1.5% |
Japan | 1.4% |
Others (individually less than 1%) | 4.7% |
| 100.0% |
Income Tax Information |
At December 31, 2006, the fund had a capital loss carryforward of approximately $1,792,773,530 of which $1,748,065,676 and $44,707,854 will expire on December 31, 2010 and 2011, respectively. |
See accompanying notes which are an integral part of the financial statements.
VIP Growth Portfolio
VIP Growth Portfolio
Financial Statements
Statement of Assets and Liabilities
| December 31, 2006 |
| | |
Assets | | |
Investment in securities, at value
(including securities loaned of $104,278,033) -
See accompanying schedule: Unaffiliated issuers
(cost $6,240,512,310) | $ 7,189,995,827 | |
Fidelity Central Funds
(cost $107,754,496) | 107,754,496 | |
Total Investments
(cost $6,348,226,806) | | $ 7,297,750,323 |
Foreign currency held at value
(cost $5,890,303) | | 5,904,011 |
Receivable for investments sold | | 38,193,821 |
Receivable for fund shares sold | | 427,319 |
Dividends receivable | | 5,821,882 |
Interest receivable | | 371,687 |
Prepaid expenses | | 35,881 |
Other receivables | | 718,970 |
Total assets | | 7,349,223,894 |
| | |
Liabilities | | |
Payable to custodian bank | $ 55,124 | |
Payable for investments purchased | 12,189,958 | |
Payable for fund shares redeemed | 9,105,244 | |
Accrued management fee | 3,437,187 | |
Distribution fees payable | 207,285 | |
Notes payable to affiliates | 16,316,000 | |
Other affiliated payables | 756,611 | |
Other payables and accrued expenses | 1,711,955 | |
Collateral on securities loaned, at value | 107,754,496 | |
Total liabilities | | 151,533,860 |
| | |
Net Assets | | $ 7,197,690,034 |
Net Assets consist of: | | |
Paid in capital | | $ 7,800,293,380 |
Undistributed net investment income | | 43,290,513 |
Accumulated undistributed net realized gain (loss) on investments and foreign currency transactions | | (1,595,352,713) |
Net unrealized appreciation
(depreciation) on investments and assets and liabilities in foreign currencies | | 949,458,854 |
Net Assets | | $ 7,197,690,034 |
Statement of Assets and Liabilities - continued
| December 31, 2006 |
| | |
Initial Class:
Net Asset Value, offering price and redemption price per share ($5,610,628,842 ÷ 156,427,269 shares) | | $ 35.87 |
| | |
Service Class:
Net Asset Value, offering price and redemption price per share ($877,279,103 ÷ 24,557,583 shares) | | $ 35.72 |
| | |
Service Class 2:
Net Asset Value, offering price and redemption price per share ($627,753,799 ÷ 17,721,628 shares) | | $ 35.42 |
| | |
Service Class 2R:
Net Asset Value, offering price and redemption price per share ($5,062,921 ÷ 143,512 shares) | | $ 35.28 |
| | |
Investor Class:
Net Asset Value, offering price and redemption price per share ($76,965,369 ÷ 2,151,270 shares) | | $ 35.78 |
See accompanying notes which are an integral part of the financial statements.
Annual Report
VIP Growth Portfolio
Financial Statements - continued
Statement of Operations
| Year ended December 31, 2006 |
| | |
Investment Income | | |
Dividends (including $125,157 earned from other affiliated issuers) | | $ 95,580,738 |
Interest | | 116,961 |
Income from Fidelity Central Funds (including $1,521,192 from security lending) | | 3,931,637 |
Total income | | 99,629,336 |
| | |
Expenses | | |
Management fee | $ 43,960,841 | |
Transfer agent fees | 5,244,539 | |
Distribution fees | 2,701,405 | |
Accounting and security lending fees | 1,283,070 | |
Custodian fees and expenses | 279,301 | |
Independent trustees' compensation | 29,546 | |
Appreciation in deferred trustee compensation account | 5,357 | |
Audit | 99,219 | |
Legal | 170,446 | |
Interest | 111,005 | |
Miscellaneous | 1,902,600 | |
Total expenses before reductions | 55,787,329 | |
Expense reductions | (983,924) | 54,803,405 |
Net investment income (loss) | | 44,825,931 |
Realized and Unrealized Gain (Loss) Net realized gain (loss) on: | | |
Investment securities: | | |
Unaffiliated issuers | 1,212,167,627 | |
Other affiliated issuers | (1,537,271) | |
Foreign currency transactions | (160,720) | |
Total net realized gain (loss) | | 1,210,469,636 |
Change in net unrealized appreciation (depreciation) on: Investment securities | (728,384,373) | |
Assets and liabilities in foreign currencies | (17,953) | |
Total change in net unrealized appreciation (depreciation) | | (728,402,326) |
Net gain (loss) | | 482,067,310 |
Net increase (decrease) in net assets resulting from operations | | $ 526,893,241 |
Statement of Changes in Net Assets
| Year ended
December 31,
2006 | Year ended
December 31,
2005 |
Increase (Decrease) in Net Assets | | |
Operations | | |
Net investment income (loss) | $ 44,825,931 | $ 29,190,123 |
Net realized gain (loss) | 1,210,469,636 | 875,877,180 |
Change in net unrealized appreciation (depreciation) | (728,402,326) | (448,273,685) |
Net increase (decrease) in net assets resulting from operations | 526,893,241 | 456,793,618 |
Distributions to shareholders from net investment income | (29,989,011) | (43,821,998) |
Share transactions - net increase (decrease) | (2,000,205,631) | (1,648,924,682) |
Redemption fees | 1,882 | 117 |
Total increase (decrease) in net assets | (1,503,299,519) | (1,235,952,945) |
| | |
Net Assets | | |
Beginning of period | 8,700,989,553 | 9,936,942,498 |
End of period (including undistributed net investment income of $43,290,513 and undistributed net investment income of $27,754,269, respectively) | $ 7,197,690,034 | $ 8,700,989,553 |
See accompanying notes which are an integral part of the financial statements.
VIP Growth Portfolio
Financial Highlights - Initial Class
Years ended December 31, | 2006 | 2005 | 2004 | 2003 | 2002 |
Selected Per-Share Data | | | | | |
Net asset value, beginning of period | $ 33.70 | $ 32.01 | $ 31.04 | $ 23.44 | $ 33.61 |
Income from Investment Operations | | | | | |
Net investment income (loss) C | .21 | .11 | .15 F,I | .07 | .07 |
Net realized and unrealized gain (loss) | 2.09 | 1.74 | .90 | 7.60 | (10.17) |
Total from investment operations | 2.30 | 1.85 | 1.05 | 7.67 | (10.10) |
Distributions from net investment income | (.13) | (.16) | (.08) | (.07) | (.07) |
Redemption fees added to paid in capital C,H | - | - | - | - | - |
Net asset value, end of period | $ 35.87 | $ 33.70 | $ 32.01 | $ 31.04 | $ 23.44 |
Total Return A,B | 6.85% | 5.80% | 3.38% | 32.85% | (30.10)% |
Ratios to Average Net Assets D,G | | | | | |
Expenses before reductions | .68% | .67% | .68% | .67% | .67% |
Expenses net of fee waivers, if any | .68% | .67% | .68% | .67% | .67% |
Expenses net of all reductions | .67% | .63% | .65% | .64% | .61% |
Net investment income (loss) | .61% | .36% | .47% I | .28% | .25% |
Supplemental Data | | | | | |
Net assets, end of period (000 omitted) | $ 5,610,629 | $ 6,726,655 | $ 7,796,888 | $ 8,594,509 | $ 7,016,147 |
Portfolio turnover rate E | 114% | 79% | 72% | 61% | 90% |
A Total returns do not reflect charges attributable to your insurance company's separate account. Inclusion of these charges would reduce the total returns shown.
B Total returns would have been lower had certain expenses not been reduced during the periods shown.
C Calculated based on average shares outstanding during the period.
D Fees and expenses of the underlying Fidelity Central Funds are not included in the Fund's expense ratio. The Fund indirectly bears its proportionate share of the expenses of any underlying Fidelity Central Funds.
E Amount does not include the portfolio activity of any underlying Fidelity Central Funds.
F Investment income per share reflects a special dividend which amounted to $.08 per share.
G Expense ratios reflect operating expenses of the class. Expenses before reductions do not reflect amounts reimbursed by the investment adviser or reductions from brokerage service arrangements or other expense offset arrangements and do not represent the amount paid by the class during periods when reimbursements or reductions occur. Expenses net of fee waivers reflect expenses after reimbursement by the investment adviser but prior to reductions from brokerage service arrangements or other expense offset arrangements. Expenses net of all reductions represent the net expenses paid by the class.
H Amount represents less than $.01 per share.
I As a result in the change in the estimate of the return of capital components of dividend income realized in the year ended December 31, 2003, net investment income per share and the ratio of net investment income to average net assets for the year ended December 31, 2004 have been reduced by $.01 per share and .02%, respectively. The change in estimate has no impact on total net assets or total return of the class.
Financial Highlights - Service Class
Years ended December 31, | 2006 | 2005 | 2004 | 2003 | 2002 |
Selected Per-Share Data | | | | | |
Net asset value, beginning of period | $ 33.56 | $ 31.88 | $ 30.92 | $ 23.34 | $ 33.48 |
Income from Investment Operations | | | | | |
Net investment income (loss) C | .18 | .08 | .11 F,I | .05 | .04 |
Net realized and unrealized gain (loss) | 2.07 | 1.72 | .90 | 7.58 | (10.14) |
Total from investment operations | 2.25 | 1.80 | 1.01 | 7.63 | (10.10) |
Distributions from net investment income | (.09) | (.12) | (.05) | (.05) | (.04) |
Redemption fees added to paid in capital C,H | - | - | - | - | - |
Net asset value, end of period | $ 35.72 | $ 33.56 | $ 31.88 | $ 30.92 | $ 23.34 |
Total Return A,B | 6.73% | 5.67% | 3.26% | 32.78% | (30.20)% |
Ratios to Average Net Assets D,G | | | | | |
Expenses before reductions | .78% | .77% | .78% | .77% | .77% |
Expenses net of fee waivers, if any | .78% | .77% | .78% | .77% | .77% |
Expenses net of all reductions | .77% | .73% | .75% | .74% | .71% |
Net investment income (loss) | .51% | .26% | .37% I | .18% | .15% |
Supplemental Data | | | | | |
Net assets, end of period (000 omitted) | $ 877,279 | $ 1,086,172 | $ 1,326,262 | $ 1,401,298 | $ 1,058,738 |
Portfolio turnover rate E | 114% | 79% | 72% | 61% | 90% |
A Total returns do not reflect charges attributable to your insurance company's separate account. Inclusion of these charges would reduce the total returns shown.
B Total returns would have been lower had certain expenses not been reduced during the periods shown.
C Calculated based on average shares outstanding during the period.
D Fees and expenses of the underlying Fidelity Central Funds are not included in the Fund's expense ratio. The Fund indirectly bears its proportionate share of the expenses of any underlying Fidelity Central Funds.
E Amount does not include the portfolio activity of any underlying Fidelity Central Funds.
F Investment income per share reflects a special dividend which amounted to $.08 per share.
G Expense ratios reflect operating expenses of the class. Expenses before reductions do not reflect amounts reimbursed by the investment adviser or reductions from brokerage service arrangements or other expense offset arrangements and do not represent the amount paid by the class during periods when reimbursements or reductions occur. Expenses net of fee waivers reflect expenses after reimbursement by the investment adviser but prior to reductions from brokerage service arrangements or other expense offset arrangements. Expenses net of all reductions represent the net expenses paid by the class.
H Amount represents less than $.01 per share.
I As a result in the change in the estimate of the return of capital components of dividend income realized in the year ended December 31, 2003, net investment income per share and the ratio of net investment income to average net assets for the year ended December 31, 2004 have been reduced by $.01 per share and .02%, respectively. The change in estimate has no impact on total net assets or total return of the class.
See accompanying notes which are an integral part of the financial statements.
Annual Report
Financial Highlights - Service Class 2
Years ended December 31, | 2006 | 2005 | 2004 | 2003 | 2002 |
Selected Per-Share Data | | | | | |
Net asset value, beginning of period | $ 33.29 | $ 31.64 | $ 30.72 | $ 23.21 | $ 33.34 |
Income from Investment Operations | | | | | |
Net investment income (loss) C | .12 | .03 | .07 F,I | .01 | - H |
Net realized and unrealized gain (loss) | 2.07 | 1.71 | .89 | 7.53 | (10.09) |
Total from investment operations | 2.19 | 1.74 | .96 | 7.54 | (10.09) |
Distributions from net investment income | (.06) | (.09) | (.04) | (.03) | (.04) |
Redemption fees added to paid in capital C,H | - | - | - | - | - |
Net asset value, end of period | $ 35.42 | $ 33.29 | $ 31.64 | $ 30.72 | $ 23.21 |
Total Return A,B | 6.57% | 5.50% | 3.12% | 32.54% | (30.30)% |
Ratios to Average Net Assets D,G | | | | | |
Expenses before reductions | .94% | .92% | .93% | .92% | .93% |
Expenses net of fee waivers, if any | .94% | .92% | .93% | .92% | .93% |
Expenses net of all reductions | .92% | .88% | .90% | .89% | .87% |
Net investment income (loss) | .36% | .11% | .22% I | .02% | (.01)% |
Supplemental Data | | | | | |
Net assets, end of period (000 omitted) | $ 627,754 | $ 858,587 | $ 811,126 | $ 609,798 | $ 238,543 |
Portfolio turnover rate E | 114% | 79% | 72% | 61% | 90% |
A Total returns do not reflect charges attributable to your insurance company's separate account. Inclusion of these charges would reduce the total returns shown.
B Total returns would have been lower had certain expenses not been reduced during the periods shown.
C Calculated based on average shares outstanding during the period.
D Fees and expenses of the underlying Fidelity Central Funds are not included in the Fund's expense ratio. The Fund indirectly bears its proportionate share of the expenses of any underlying Fidelity Central Funds.
E Amount does not include the portfolio activity of any underlying Fidelity Central Funds.
F Investment income per share reflects a special dividend which amounted to $.08 per share.
G Expense ratios reflect operating expenses of the class. Expenses before reductions do not reflect amounts reimbursed by the investment adviser or reductions from brokerage service arrangements or other expense offset arrangements and do not represent the amount paid by the class during periods when reimbursements or reductions occur. Expenses net of fee waivers reflect expenses after reimbursement by the investment adviser but prior to reductions from brokerage service arrangements or other expense offset arrangements. Expenses net of all reductions represent the net expenses paid by the class.
H Amount represents less than $.01 per share.
I As a result in the change in the estimate of the return of capital components of dividend income realized in the year ended December 31, 2003, net investment income per share and the ratio of net investment income to average net assets for the year ended December 31, 2004 have been reduced by $.01 per share and .02%, respectively. The change in estimate has no impact on total net assets or total return of the class.
Financial Highlights - Service Class 2R
Years ended December 31, | 2006 | 2005 | 2004 | 2003 | 2002 L |
Selected Per-Share Data | | | | | |
Net asset value, beginning of period | $ 33.18 | $ 31.54 | $ 30.65 | $ 23.20 | $ 31.05 |
Income from Investment Operations | | | | | |
Net investment income (loss) C | .12 | .04 | .07 F,I | .01 | (.01) |
Net realized and unrealized gain (loss) | 2.06 | 1.70 | .88 | 7.51 | (7.84) |
Total from investment operations | 2.18 | 1.74 | .95 | 7.52 | (7.85) |
Distributions from net investment income | (.08) | (.10) | (.06) | (.07) | - |
Redemption fees added to paid in capital C,H | - | - | - | - | - |
Net asset value, end of period | $ 35.28 | $ 33.18 | $ 31.54 | $ 30.65 | $ 23.20 |
Total Return A,B, K | 6.58% | 5.52% | 3.10% | 32.54% | (25.28)% |
Ratios to Average Net Assets D,G | | | | | |
Expenses before reductions | .93% | .92% | .93% | .92% | .96% J |
Expenses net of fee waivers, if any | .93% | .92% | .93% | .92% | .96% J |
Expenses net of all reductions | .92% | .88% | .90% | .90% | .90% J |
Net investment income (loss) | .36% | .12% | .22% I | .02% | (.03)% J |
Supplemental Data | | | | | |
Net assets, end of period (000 omitted) | $ 5,063 | $ 5,409 | $ 2,667 | $ 1,369 | $ 210 |
Portfolio turnover rate E | 114% | 79% | 72% | 61% | 90% |
A Total returns do not reflect charges attributable to your insurance company's separate account. Inclusion of these charges would reduce the total returns shown.
B Total returns would have been lower had certain expenses not been reduced during the periods shown.
C Calculated based on average shares outstanding during the period.
D Fees and expenses of the underlying Fidelity Central Funds are not included in the Fund's expense ratio. The Fund indirectly bears its proportionate share of the expenses of any underlying Fidelity Central Funds.
E Amount does not include the portfolio activity of any underlying Fidelity Central Funds.
F Investment income per share reflects a special dividend which amounted to $.08 per share.
G Expense ratios reflect operating expenses of the class. Expenses before reductions do not reflect amounts reimbursed by the investment adviser or reductions from brokerage service arrangements or other expense offset arrangements and do not represent the amount paid by the class during periods when reimbursements or reductions occur. Expense ratios before reductions for start-up periods may not be representative of longer-term operating periods. Expenses net of fee waivers reflect expenses after reimbursement by the investment adviser but prior to reductions from brokerage service arrangements or other expense offset arrangements. Expenses net of all reductions represent the net expenses paid by the class.
H Amount represents less than $.01 per share.
I As a result in the change in the estimate of the return of capital components of dividend income realized in the year ended December 31, 2003, net investment income per share and the ratio of net investment income to average net assets for the year ended December 31, 2004 have been reduced by $.01 per share and .02%, respectively. The change in estimate has no impact on total net assets or total return of the class.
J Annualized
K Total returns for periods of less than one year are not annualized.
L For the period April 24, 2002 (commencement of sale of shares) to December 31, 2002.
See accompanying notes which are an integral part of the financial statements.
VIP Growth Portfolio
Financial Highlights - Investor Class
Years ended December 31, | 2006 | 2005 H |
Selected Per-Share Data | | |
Net asset value, beginning of period | $ 33.67 | $ 32.60 |
Income from Investment Operations | | |
Net investment income (loss) E | .17 | .03 |
Net realized and unrealized gain (loss) | 2.08 | 1.04 |
Total from investment operations | 2.25 | 1.07 |
Distributions from net investment income | (.14) | - |
Redemption fees added to paid in capital E,J | - | - |
Net asset value, end of period | $ 35.78 | $ 33.67 |
Total Return B,C,D | 6.72% | 3.28% |
Ratios to Average Net Assets F,I | | |
Expenses before reductions | .81% | .83% A |
Expenses net of fee waivers, if any | .81% | .83% A |
Expenses net of all reductions | .80% | .79% A |
Net investment income (loss) | .49% | .23% A |
Supplemental Data | | |
Net assets, end of period (000 omitted) | $ 76,965 | $ 24,166 |
Portfolio turnover rate G | 114% | 79% |
A Annualized
B Total returns for periods of less than one year are not annualized.
C Total returns do not reflect charges attributable to your insurance company's separate account. Inclusion of these charges would reduce the total returns shown.
D Total returns would have been lower had certain expenses not been reduced during the periods shown.
E Calculated based on average shares outstanding during the period.
F Fees and expenses of the underlying Fidelity Central Funds are not included in the Fund's expense ratio. The Fund indirectly bears its proportionate share of the expenses of any underlying Fidelity Central Funds.
G Amount does not include the portfolio activity of any underlying Fidelity Central Funds.
H For the period July 21, 2005 (commencement of sale of shares) to December 31, 2005.
I Expense ratios reflect operating expenses of the class. Expenses before reductions do not reflect amounts reimbursed by the investment adviser or reductions from brokerage service arrangements or other expense offset arrangements and do not represent the amount paid by the class during periods when reimbursements or reductions occur. Expense ratios before reductions for start-up periods may not be representative of longer-term operating periods. Expenses net of fee waivers reflect expenses after reimbursement by the investment adviser but prior to reductions from brokerage service arrangements or other expense offset arrangements. Expenses net of all reductions represent the net expenses paid by the class.
J Amount represents less than $.01 per share.
See accompanying notes which are an integral part of the financial statements.
Annual Report
Notes to Financial Statements
For the period ended December 31, 2006
1. Significant Accounting Policies.
VIP Growth Portfolio (the Fund) is a fund of Variable Insurance Products Fund (the trust) and is authorized to issue an unlimited number of shares. The trust is registered under the Investment Company Act of 1940, as amended (the 1940 Act), as an open-end management investment company organized as a Massachusetts business trust. Shares of the Fund may only be purchased by insurance companies for the purpose of funding variable annuity or variable life insurance contracts. The Fund offers the following classes of shares: Initial Class shares, Service Class shares, Service Class 2 shares, Service Class R shares, and Investor Class shares. All classes have equal rights and voting privileges, except for matters affecting a single class. Investment income, realized and unrealized capital gains and losses, the common expenses of the Fund, and certain fund-level expense reductions, if any, are allocated on a pro rata basis to each class based on the relative net assets of each class to the total net assets of the Fund. Each class differs with respect to transfer agent and distribution and service plan fees incurred. Certain expense reductions also differ by class.
The Fund may invest in Fidelity Central Funds which are open-end investment companies available to investment companies and other accounts managed by Fidelity Management & Research Company (FMR) and its affiliates. The financial statements have been prepared in conformity with accounting principles generally accepted in the United States of America, which require management to make certain estimates and assumptions at the date of the financial statements. The following summarizes the significant accounting policies of the Fund, which are also consistently followed by the Fidelity Central Funds:
Security Valuation. Investments are valued and net asset value (NAV) per share is calculated (NAV calculation) as of the close of business of the New York Stock Exchange (NYSE), normally 4:00 p.m. Eastern time. Wherever possible, the Fund uses independent pricing services approved by the Board of Trustees to value its investments.
Equity securities, including restricted securities, for which market quotations are readily available, are valued at the last reported sale price or official closing price as reported by an independent pricing service on the primary market or exchange on which they are traded. In the event there were no sales during the day or closing prices are not available, securities are valued at the last quoted bid price. Debt securities, including restricted securities, for which quotations are readily available, are valued by independent pricing services or by dealers who make markets in such securities. Pricing services consider yield or price of bonds of comparable quality, coupon, maturity and type as well as dealer supplied prices. Investments in open-end mutual funds, including the Fidelity Central Funds, are valued at their closing net asset value each business day. Short-term securities with remaining maturities of sixty days or less for which quotations are not readily available are valued at amortized cost, which approximates value.
When current market prices or quotations are not readily available or do not accurately reflect fair value, valuations may be determined in accordance with procedures adopted by the Board of Trustees. For example, when developments occur between the close of a market and the close of the NYSE that may materially affect the value of some or all of the securities, or when trading in a security is halted, those securities may be fair valued. Factors used in the determination of fair value may include monitoring news to identify significant market or security specific events such as changes in the value of U.S. securities markets, reviewing developments in foreign markets and evaluating the performance of ADRs, futures contracts and exchange-traded funds. Because the Fund's utilization of fair value pricing depends on market activity, the frequency with which fair value pricing is used can not be predicted and may be utilized to a significant extent. The value of securities used for NAV calculation under fair value pricing may differ from published prices for the same securities.
Foreign Currency. The Fund uses foreign currency contracts to facilitate transactions in foreign-denominated securities. Losses from these transactions may arise from changes in the value of the foreign currency or if the counterparties do not perform under the contracts' terms.
Foreign-denominated assets, including investment securities, and liabilities are translated into U.S. dollars at the exchange rate at period end. Purchases and sales of investment securities, income and dividends received and expenses denominated in foreign currencies are translated into U.S. dollars at the exchange rate in effect on the transaction date.
The effects of exchange rate fluctuations on investments are included with the net realized and unrealized gain (loss) on investment securities. Other foreign currency transactions resulting in realized and unrealized gain (loss) are disclosed separately.
Investment Transactions and Income. Security transactions, including the Fund's investment activity in the Fidelity Central Funds, are accounted for as of trade date. Gains and losses on securities sold are determined on the basis of identified cost and may include proceeds received from litigation. Dividend income is recorded on the ex-dividend date, except for certain dividends from foreign securities where the ex-dividend date may have passed, which are recorded as soon as the Fund is informed of the ex-dividend date. Non-cash dividends included in dividend income, if any, are recorded at the fair market value of the securities received. Distributions received on securities that represent a return of capital or capital gain are recorded as a reduction of cost of investments and/or as a realized gain. The Fund estimates the components of distributions received that may be considered return of capital distributions or capital gain distributions. Interest income and income distributions from the Fidelity Central Funds are accrued as earned, with any income distributions receivable as of period end included in Interest Receivable on the Statement of Assets and Liabilities. Interest income includes coupon interest and amortization of premium and accretion of discount on debt securities. Investment income is recorded net of foreign taxes withheld where recovery of such taxes is uncertain.
VIP Growth Portfolio
1. Significant Accounting Policies - continued
Expenses. Most expenses of the trust can be directly attributed to a fund. Expenses which cannot be directly attributed are apportioned among each Fund in the trust. Expense estimates are accrued in the period to which they relate and adjustments are made when actual amounts are known.
Deferred Trustee Compensation. Under a Deferred Compensation Plan (the Plan), Independent Trustees must defer receipt of a portion of, and may elect to defer receipt of an additional portion of, their annual compensation. Deferred amounts are invested in a cross-section of Fidelity funds, are marked-to-market and remain in the Fund until distributed in accordance with the Plan. The investment of deferred amounts and the offsetting payable to the Trustees are included in the accompanying Statement of Assets and Liabilities.
Income Tax Information and Distributions to Shareholders. Each year, the Fund intends to qualify as a regulated investment company by distributing all of its taxable income and realized gains under Subchapter M of the Internal Revenue Code. As a result, no provision for income taxes is required in the accompanying financial statements. Foreign taxes are provided for based on the Fund's understanding of the tax rules and rates that exist in the foreign markets in which it invests.
Distributions are recorded on the ex-dividend date. Income dividends and capital gain distributions are declared separately for each class. Income and capital gain distributions are determined in accordance with income tax regulations, which may differ from generally accepted accounting principles.
Capital accounts within the financial statements are adjusted for permanent book-tax differences. These adjustments have no impact on net assets or the results of operations. Temporary book-tax differences will reverse in a subsequent period.
Book-tax differences are primarily due to foreign currency transactions, redemptions in kind, partnerships, deferred trustees compensation and losses deferred due to wash sales.
The tax-basis components of distributable earnings and the federal tax cost as of period end were as follows:
Unrealized appreciation | $ 1,114,618,421 | |
Unrealized depreciation | (168,491,285) | |
Net unrealized appreciation (depreciation) | 946,127,136 | |
Undistributed ordinary income | 43,330,042 | |
Capital loss carryforward | (1,792,773,530) | |
| | |
Cost for federal income tax purposes | $ 6,351,623,187 | |
The tax character of distributions paid was as follows:
| December 31, 2006 | December 31, 2005 |
Ordinary Income | $ 29,989,011 | $ 43,821,998 |
Trading (Redemption) Fees. Service Class 2R shares held less than 60 days are subject to a redemption fee equal to 1% of the proceeds of the redeemed shares. All redemption fees, including any estimated redemption fees paid by FMR, are retained by the Fund and accounted for as an addition to paid in capital.
New Accounting Pronouncements. In July 2006, Financial Accounting Standards Board Interpretation No. 48, Accounting for Uncertainty in Income Taxes - an interpretation of FASB Statement 109 (FIN 48), was issued and is effective on the last business day of the semiannual reporting period for fiscal years beginning after December 15, 2006. FIN 48 sets forth a threshold for financial statement recognition, measurement and disclosure of a tax position taken or expected to be taken on a tax return. Management is currently evaluating the impact, if any, the adoption of FIN 48 will have on the Fund's net assets, results of operations and financial statement disclosures.
In addition, in September 2006, Statement of Financial Accounting Standards No. 157, Fair Value Measurements (SFAS 157), was issued and is effective for fiscal years beginning after November 15, 2007. SFAS 157 defines fair value, establishes a framework for measuring fair value and expands disclosures about fair value measurements. Management is currently evaluating the impact the adoption of SFAS 157 will have on the Fund's financial statement disclosures.
2. Operating Policies.
Repurchase Agreements. FMR has received an Exemptive Order from the Securities and Exchange Commission (the SEC) which permits the Fund and other affiliated entities of FMR to transfer uninvested cash balances into joint trading accounts which are then invested in repurchase agreements. The Fund may also invest directly with institutions in repurchase agreements. Repurchase agreements are collateralized by government or non-government securities. Upon settlement date, collateral is held in segregated accounts with custodian banks and may be obtained in the event of a
Annual Report
Notes to Financial Statements - continued
2. Operating Policies - continued
Repurchase Agreements - continued
default of the counterparty. The Fund monitors, on a daily basis, the value of the collateral to ensure it is at least equal to the principal amount of the repurchase agreement (including accrued interest). In the event of a default by the counterparty, realization of the collateral proceeds could be delayed, during which time the value of the collateral may decline.
Restricted Securities. The Fund may invest in securities that are subject to legal or contractual restrictions on resale. These securities generally may be resold in transactions exempt from registration or to the public if the securities are registered. Disposal of these securities may involve time-consuming negotiations and expense, and prompt sale at an acceptable price may be difficult. Information regarding restricted securities is included at the end of the Fund's Schedule of Investments.
3. Purchases and Sales of Investments.
Purchases and sales of securities, other than short-term securities, and in-kind transactions aggregated $8,789,613,878 and $10,219,762,722, respectively. Securities delivered on an in-kind basis aggregated $522,515,707. Realized gain (loss) of $200,959,374 on securities delivered on an in-kind basis is included in the accompanying Statement of Operations as realized gain or loss on investment securities and is not taxable to the fund.
4. Fees and Other Transactions with Affiliates.
Management Fee. FMR and its affiliates provide the Fund with investment management related services for which the Fund pays a monthly management fee. The management fee is the sum of an individual fund fee rate that is based on an annual rate of .30% of the Fund's average net assets and a group fee rate that averaged .27% during the period. The group fee rate is based upon the average net assets of all the mutual funds advised by FMR. The group fee rate decreases as assets under management increase and increases as assets under management decrease. For the period, the total annual management fee rate was .57% of the Fund's average net assets.
Distribution and Service Plan. In accordance with Rule 12b-1 of the 1940 Act, the Fund has adopted separate 12b-1 Plans for each Service Class of shares. Each Service Class pays Fidelity Distributors Corporation (FDC), an affiliate of FMR, a service fee. For the period, the service fee is based on an annual rate of .10% of Service Class' average net assets and .25% of Service Class 2's and Service Class 2R's average net assets.
For the period, each class paid FDC the following amounts, all of which were re-allowed to insurance companies for the distribution of shares and providing shareholder support services:
Service Class | $ 958,576 | |
Service Class 2 | 1,728,584 | |
Service Class 2 R | 14,245 | |
| $ 2,701,405 | |
Transfer Agent Fees. Fidelity Investments Institutional Operations Company, Inc. (FIIOC), an affiliate of FMR, is the fund's transfer, dividend disbursing, and shareholder servicing agent. FIIOC receives an asset-based fee with respect to each class. Each class with the exception of Investor Class pays a transfer agent fee, excluding out of pocket expenses, equal to an annual rate of .07% of their month end net assets. Investor Class pays a monthly asset-based transfer agent fee of .18% of its month end net assets. The total transfer agent fees paid by each class to FIIOC, including out of pocket expenses, were as follows:
Initial Class | $ 4,028,550 | |
Service Class | 638,566 | |
Service Class 2 | 472,805 | |
Service Class 2R | 3,806 | |
Investor Class | 100,812 | |
| $ 5,244,539 | |
Accounting and Security Lending Fees. Fidelity Service Company, Inc. (FSC), an affiliate of FMR, maintains the Fund's accounting records. The accounting fee is based on the level of average net assets for the month. Under a separate contract, FSC administers the security lending program. The security lending fee is based on the number and duration of lending transactions.
Investments in Fidelity Central Funds. The Fund may invest in Fidelity Central Funds. The Fund's Schedule of Investments lists each of the Fidelity Central Funds as an investment of the Fund but does not include the underlying holdings of each Fidelity Central Fund. As an Investing Fund, the Fund indirectly bears its proportionate share of the expenses of the underlying Fidelity Central Funds. A complete unaudited list of holdings for each Fidelity Central Fund is available upon request. In addition, the financial statements of the Fidelity Central Funds, which are not covered by the Fund's Report of Independent Registered Public Accounting Firm, are available on the EDGAR Database on the SEC's web site, www.sec.gov, or upon request.
VIP Growth Portfolio
4. Fees and Other Transactions with Affiliates - continued
Investments in Fidelity Central Funds - continued
The Money Market Central Funds seek preservation of capital and current income and are managed by Fidelity Investments Money Management, Inc. (FIMM), an affiliate of FMR.
Brokerage Commissions. The Fund placed a portion of its portfolio transactions with brokerage firms which are affiliates of the investment adviser. The commissions paid to these affiliated firms were $57,327 for the period.
Interfund Lending Program. Pursuant to an Exemptive Order issued by the SEC, the Fund, along with other registered investment companies having management contracts with FMR, may participate in an interfund lending program. This program provides an alternative credit facility allowing the funds to borrow from, or lend money to, other participating affiliated funds. The Fund's activity in this program during the period for which loans were outstanding was as follows:
Borrower or Lender | Average Daily
Loan Balance | Weighted Average Interest Rate | Interest
Expense |
Borrower | $ 32,825,826 | 5.29% | $ 111,005 |
5. Committed Line of Credit.
The Fund participates with other funds managed by FMR in a $4.2 billion credit facility (the "line of credit") to be utilized for temporary or emergency purposes to fund shareholder redemptions or for other short-term liquidity purposes. The Fund has agreed to pay commitment fees on its pro rata portion of the line of credit, which amounted to $22,679 and is reflected in Miscellaneous Expense on the Statement of Operations. During the period, there were no borrowings on this line of credit.
6. Security Lending.
The Fund lends portfolio securities from time to time in order to earn additional income. On the settlement date of the loan, the Fund receives collateral (in the form of U.S. Treasury obligations, letters of credit and/or cash) against the loaned securities and maintains collateral in an amount not less than 100% of the market value of the loaned securities during the period of the loan. The market value of the loaned securities is determined at the close of business of the Fund and any additional required collateral is delivered to the Fund on the next business day. If the borrower defaults on its obligation to return the securities loaned because of insolvency or other reasons, a fund could experience delays and costs in recovering the securities loaned or in gaining access to the collateral. Any cash collateral received is invested in the Fidelity Securities Lending Cash Central Fund. The value of loaned securities and cash collateral at period end are disclosed on the Fund's Statement of Assets and Liabilities. Security lending income represents the income earned on investing cash collateral, less fees and expenses associated with the loan, plus any premium payments that may be received on the loan of certain types of securities. Security lending income is presented in the Statement of Operations as a component of income from Fidelity Central Funds.
7. Expense Reductions.
Many of the brokers with whom FMR places trades on behalf of the Fund provided services to the Fund in addition to trade execution. These services included payments of certain expenses on behalf of the Fund totaling $845,352 for the period. In addition, through arrangements with the fund's custodian, credits realized as a result of uninvested cash balances were used to reduce the Fund's expenses. During the period, these credits reduced the Fund's custody expenses by $15,348.
8. Other.
The Fund's organizational documents provide former and current trustees and officers with a limited indemnification against liabilities arising in connection with the performance of their duties to the Fund. In the normal course of business, the Fund may also enter into contracts that provide general indemnifications. The Fund's maximum exposure under these arrangements is unknown as this would be dependent on future claims that may be made against the Fund. The risk of material loss from such claims is considered remote.
At the end of the period, FMR or its affiliates were the owners of record of 12% of the total outstanding shares of the fund and two otherwise unaffiliated shareholders were the owners of record of 35% of the total outstanding shares of the fund.
The United States Securities and Exchange Commission ("SEC") is conducting an investigation of FMR (covering the years 2002 to 2004) arising from gifts, gratuities and business entertainment provided by certain brokers to certain individuals who were employed on FMR's domestic equity trading desk during that period. FMR is in discussions with the SEC staff regarding the possible resolution of the matter, but as of period-end no final resolution has been reached.
Annual Report
Notes to Financial Statements - continued
8. Other - continued
In December 2006, the Independent Trustees completed their own investigation of the matter with the assistance of independent counsel. The Independent Trustees and FMR agree that, despite the absence of proof that the Fidelity mutual funds experienced diminished execution quality as a result of the improper receipt of gifts and business entertainment, the conduct at issue was serious and is worthy of redress. Accordingly, the Independent Trustees have requested and FMR has agreed to pay $42 million to Fidelity mutual funds, plus interest to be determined at the time that payment is made. A method of allocating this payment among the funds has not yet been determined. The total payment to the Fund is not anticipated to have a material impact on the Fund's net assets. In addition, FMR reimbursed related legal expenses which are recorded in the accompanying Statement of Operations as an expense reduction.
9. Distributions to Shareholders.
Distributions to shareholders of each class were as follows:
| Years ended December 31, |
| 2006 | 2005A |
From net investment income | | |
Initial Class | $ 25,469,432 | $ 36,754,599 |
Service Class | 2,969,186 | 4,880,141 |
Service Class 2 | 1,415,183 | 2,179,216 |
Service Class 2R | 11,992 | 8,042 |
Investor Class | 123,218 | - |
Total | $ 29,989,011 | $ 43,821,998 |
A Distributions for Investor Class are for the period July 21, 2005 (commencement of sale of shares) to December 31, 2005.
10. Share Transactions.
Transactions for each class of shares were as follows:
| Shares
Years ended December 31, | Dollars
Years ended December 31, |
| 2006 | 2005A | 2006 | 2005A |
Initial Class | | | | |
Shares sold | 3,610,816 | 5,020,349 | $ 124,622,618 | $ 159,510,141 |
Reinvestment of distributions | 750,646 | 1,168,668 | 25,469,432 | 36,754,598 |
Shares redeemed | (47,564,114) | (50,113,556) | (1,648,287,637) | (1,589,683,859) |
Net increase (decrease) | (43,202,652) | (43,924,539) | $ (1,498,195,587) | $ (1,393,419,120) |
Service Class | | | | |
Shares sold | 904,973 | 1,583,330 | $ 31,365,157 | $ 49,875,519 |
Reinvestment of distributions | 87,794 | 155,666 | 2,969,186 | 4,880,142 |
Shares redeemed | (8,801,822) | (10,974,628) | (303,894,497) | (341,802,898) |
Net increase (decrease) | (7,809,055) | (9,235,632) | $ (269,560,154) | $ (287,047,237) |
Service Class 2 | | | | |
Shares sold | 3,844,723 | 4,801,863 | $ 131,119,141 | $ 150,862,050 |
Reinvestment of distributions | 42,144 | 69,981 | 1,415,183 | 2,179,216 |
Shares redeemed | (11,956,728) | (4,718,596) | (413,608,979) | (147,633,784) |
Net increase (decrease) | (8,069,861) | 153,248 | $ (281,074,655) | $ 5,407,482 |
Service Class 2R | | | | |
Shares sold | 109,377 | 97,483 | $ 3,727,115 | $ 3,094,057 |
Reinvestment of distributions | 358 | 259 | 11,992 | 8,042 |
Shares redeemed | (129,250) | (19,254) | (4,434,759) | (605,298) |
Net increase (decrease) | (19,515) | 78,488 | $ (695,652) | $ 2,496,801 |
Investor Class | | | | |
Shares sold | 1,635,275 | 720,556 | $ 56,255,612 | $ 23,727,387 |
Reinvestment of distributions | 3,637 | - | 123,218 | - |
Shares redeemed | (205,451) | (2,747) | (7,058,413) | (89,995) |
Net increase (decrease) | 1,433,461 | 717,809 | $ 49,320,417 | $ 23,637,392 |
A Share transactions for Investor Class are for the period July 21, 2005 (commencement of sale of shares) to December 31, 2005.
VIP Growth Portfolio
Report of Independent Registered Public Accounting Firm
To the Trustees of Variable Insurance Products Fund and the Shareholders of VIP Growth Portfolio:
In our opinion, the accompanying statement of assets and liabilities, including the schedule of investments, and the related statements of operations and of changes in net assets and the financial highlights present fairly, in all material respects, the financial position of VIP Growth Portfolio (a fund of Variable Insurance Products Fund) at December 31, 2006, the results of its operations for the year then ended, the changes in its net assets for each of the two years in the period then ended and the financial highlights for each of the periods indicated, in conformity with accounting principles generally accepted in the United States of America. These financial statements and financial highlights (hereafter referred to as "financial statements") are the responsibility of the VIP Growth Portfolio's management; our responsibility is to express an opinion on these financial statements based on our audits. We conducted our audits of these financial statements in accordance with the standards of the Public Company Accounting Oversight Board (United States). Those standards require that we plan and perform the audit to obtain reasonable assurance about whether the financial statements are free of material misstatement. An audit includes examining, on a test basis, evidence supporting the amounts and disclosures in the financial statements, assessing the accounting principles used and significant estimates made by management, and evaluating the overall financial statement presentation. We believe that our audits, which included confirmation of securities at December 31, 2006 by correspondence with the custodian and brokers, provide a reasonable basis for our opinion.
/s/ PricewaterhouseCoopers LLP
PricewaterhouseCoopers LLP
Boston, Massachusetts
February 12, 2007
Annual Report
Trustees and Officers
The Trustees, Member of the Advisory Board, and executive officers of the trust and fund, as applicable, are listed below. The Board of Trustees governs the fund and is responsible for protecting the interests of shareholders. The Trustees are experienced executives who meet periodically throughout the year to oversee the fund's activities, review contractual arrangements with companies that provide services to the fund, and review the fund's performance. Each of the Trustees oversees 348 funds advised by FMR or an affiliate.
The Trustees hold office without limit in time except that (a) any Trustee may resign; (b) any Trustee may be removed by written instrument, signed by at least two-thirds of the number of Trustees prior to such removal; (c) any Trustee who requests to be retired or who has become incapacitated by illness or injury may be retired by written instrument signed by a majority of the other Trustees; and (d) any Trustee may be removed at any special meeting of shareholders by a two-thirds vote of the outstanding voting securities of the trust. Each Trustee who is not an interested person (as defined in the 1940 Act) (Independent Trustee), shall retire not later than the last day of the calendar year in which his or her 72nd birthday occurs. The Independent Trustees may waive this mandatory retirement age policy with respect to individual Trustees. The executive officers and Advisory Board Member hold office without limit in time, except that any officer and Advisory Board Member may resign or may be removed by a vote of a majority of the Trustees at any regular meeting or any special meeting of the Trustees. Except as indicated, each individual has held the office shown or other offices in the same company for the past five years.
The fund's Statement of Additional Information (SAI) includes more information about the Trustees. To request a free copy, call Fidelity at 1-877-208-0098.
Interested Trustees*:
Correspondence intended for each Trustee who is an interested person may be sent to Fidelity Investments, 82 Devonshire Street, Boston, Massachusetts 02109.
Name, Age; Principal Occupation |
Edward C. Johnson 3d (76) |
| Year of Election or Appointment: 1981 Mr. Johnson is Chairman of the Board of Trustees. Mr. Johnson serves as President (2006-present), Chief Executive Officer, Chairman, and a Director of FMR Corp.; Chairman and a Director of FMR; Chairman and a Director of Fidelity Research & Analysis Company (FRAC); Chairman and a Director of Fidelity Investments Money Management, Inc.; and Chairman (2001-present) and a Director of FMR Co., Inc. In addition, Mr. Johnson serves as Chairman and Director of Fidelity International Limited (FIL). |
Robert L. Reynolds (54) |
| Year of Election or Appointment: 2003 Mr. Reynolds is President and a Director of FMR (2005-present), Fidelity Investments Money Management, Inc. (2005-present), and FMR Co., Inc. (2005-present). Mr. Reynolds also serves as Vice Chairman (2006-present), a Director (2003-present), and Chief Operating Officer of FMR Corp. and a Director of Strategic Advisers, Inc. (2005-present). He also serves on the Board at Fidelity Investments Canada, Ltd. |
* Trustees have been determined to be "Interested Trustees" by virtue of, among other things, their affiliation with the trust or various entities under common control with FMR.
Independent Trustees:
Correspondence intended for each Independent Trustee (that is, the Trustees other than the Interested Trustees) may be sent to Fidelity Investments, P.O. Box 55235, Boston, Massachusetts 02205-5235.
Name, Age; Principal Occupation |
Dennis J. Dirks (58) |
| Year of Election or Appointment: 2005 Prior to his retirement in May 2003, Mr. Dirks was Chief Operating Officer and a member of the Board of The Depository Trust & Clearing Corporation (DTCC) (1999-2003). He also served as President, Chief Operating Officer, and Board member of The Depository Trust Company (DTC) (1999-2003) and President and Board member of the National Securities Clearing Corporation (NSCC) (1999-2003). In addition, Mr. Dirks served as Chief Executive Officer and Board member of the Government Securities Clearing Corporation (2001-2003) and Chief Executive Officer and Board member of the Mortgage-Backed Securities Clearing Corporation (2001-2003). Mr. Dirks also serves as a Trustee and a member of the Finance Committee of Manhattan College (2005-present) and a Trustee and a member of the Finance Committee of AHRC of Nassau County (2006-present). |
Albert R. Gamper, Jr. (64) |
| Year of Election or Appointment: 2006 Prior to his retirement in December 2004, Mr. Gamper served as Chairman of the Board of CIT Group Inc. (commercial finance). During his tenure with CIT Group Inc. Mr. Gamper served in numerous senior management positions, including Chairman (1987-1989; 1999-2001; 2002-2004), Chief Executive Officer (1987-2004), and President (1989-2002). He currently serves as a member of the Board of Directors of Public Service Enterprise Group (utilities, 2001-present), Chairman of the Board of Governors, Rutgers University (2004-present), and Chairman of the Board of Saint Barnabas Health Care System. |
George H. Heilmeier (70) |
| Year of Election or Appointment: 2004 Dr. Heilmeier is Chairman Emeritus of Telcordia Technologies (communication software and systems), where prior to his retirement, he served as company Chairman and Chief Executive Officer. He currently serves on the Boards of Directors of The Mitre Corporation (systems engineering and information technology support for the government), and HRL Laboratories (private research and development, 2004-present). He is Chairman of the General Motors Science & Technology Advisory Board and a Life Fellow of the Institute of Electrical and Electronics Engineers (IEEE). Dr. Heilmeier is a member of the Defense Science Board and the National Security Agency Advisory Board. He is also a member of the National Academy of Engineering, the American Academy of Arts and Sciences, and the Board of Overseers of the School of Engineering and Applied Science of the University of Pennsylvania. Previously, Dr. Heilmeier served as a Director of TRW Inc. (automotive, space, defense, and information technology, 1992-2002), Compaq (1994-2002), Automatic Data Processing, Inc. (ADP) (technology-based business outsourcing, 1995-2002), INET Technologies Inc. (telecommunications network surveillance, 2001-2004), and Teletech Holdings (customer management services). He is the recipient of the 2005 Kyoto Prize in Advanced Technology for his invention of the liquid crystal display, and a member of the Consumer Electronics Hall of Fame. |
James H. Keyes (66) |
| Year of Election or Appointment: 2007 Prior to his retirement in 2003, Mr. Keyes was Chairman, President, and Chief Executive Officer of Johnson Controls, Inc. (automotive supplier, 1993-2003). He currently serves as a member of the boards of LSI Logic Corporation (semiconductor technologies), Navistar International Corporation (manufacture and sale of trucks, buses, and diesel engines, 2002-present), and Pitney Bowes, Inc. (integrated mail, messaging, and document management solutions). |
Marie L. Knowles (60) |
| Year of Election or Appointment: 2001 Prior to Ms. Knowles' retirement in June 2000, she served as Executive Vice President and Chief Financial Officer of Atlantic Richfield Company (ARCO) (diversified energy, 1996-2000). From 1993 to 1996, she was a Senior Vice President of ARCO and President of ARCO Transportation Company. She served as a Director of ARCO from 1996 to 1998. She currently serves as a Director of Phelps Dodge Corporation (copper mining and manufacturing) and McKesson Corporation (healthcare service, 2002-present). Ms. Knowles is a Trustee of the Brookings Institution and the Catalina Island Conservancy and also serves as a member of the Advisory Board for the School of Engineering of the University of Southern California. |
Ned C. Lautenbach (62) |
| Year of Election or Appointment: 2000 Mr. Lautenbach is Chairman of the Independent Trustees (2006-present). Mr. Lautenbach has been a partner of Clayton, Dubilier & Rice, Inc. (private equity investment firm) since September 1998. Previously, Mr. Lautenbach was with the International Business Machines Corporation (IBM) from 1968 until his retirement in 1998. Mr. Lautenbach serves as a Director of Sony Corporation (2006-present) and Eaton Corporation (diversified industrial) as well as the Philharmonic Center for the Arts in Naples, Florida. He also is a member of the Board of Trustees of Fairfield University (2005-present), as well as a member of the Council on Foreign Relations. |
Cornelia M. Small (62) |
| Year of Election or Appointment: 2005 Ms. Small is a member (2000-present) and Chairperson (2002-present) of the Investment Committee, and a member (2002- present) of the Board of Trustees of Smith College. Previously, she served as Chief Investment Officer (1999-2000), Director of Global Equity Investments (1996-1999), and a member of the Board of Directors of Scudder, Stevens & Clark (1990-1997) and Scudder Kemper Investments (1997-1999). In addition, Ms. Small served as Co-Chair (2000-2003) of the Annual Fund for the Fletcher School of Law and Diplomacy. |
William S. Stavropoulos (67) |
| Year of Election or Appointment: 2001 Mr. Stavropoulos is Chairman Emeritus of the Board of Directors of The Dow Chemical Company. Since joining The Dow Chemical Company in 1967, Mr. Stavropoulos served in numerous senior management positions, including President (1993-2000; 2002-2003), CEO (1995-2000; 2002-2004), and Chairman of the Executive Committee (2000-2004). Currently, he is a Director of NCR Corporation (data warehousing and technology solutions), BellSouth Corporation (telecommunications), Chemical Financial Corporation, Maersk Inc. (industrial conglomerate, 2002-present), and Metalmark Capital (private equity investment firm, 2005-present). He also serves as a member of the Board of Trustees of the American Enterprise Institute for Public Policy Research. In addition, Mr. Stavropoulos is a member of The Business Council, J.P. Morgan International Council and the University of Notre Dame Advisory Council for the College of Science. |
Kenneth L. Wolfe (67) |
| Year of Election or Appointment: 2005 Prior to his retirement in 2001, Mr. Wolfe was Chairman and Chief Executive Officer of Hershey Foods Corporation (1993-2001). He currently serves as a member of the boards of Adelphia Communications Corporation (2003-present), Bausch & Lomb, Inc., and Revlon Inc. (2004-present). |
Advisory Board Member and Executive Officers:
Correspondence intended for each executive officer and Mr. Lynch may be sent to Fidelity Investments, 82 Devonshire Street, Boston, Massachusetts 02109.
Name, Age; Principal Occupation |
Peter S. Lynch (62) |
| Year of Election or Appointment: 2003 Member of the Advisory Board of Variable Insurance Products Fund. Mr. Lynch is Vice Chairman and a Director of FMR, and Vice Chairman (2001-present) and a Director of FMR Co., Inc. Previously, Mr. Lynch served as a Trustee of the Fidelity funds (1990-2003). In addition, he serves as a Trustee of Boston College and as the Chairman of the Inner-City Scholarship Fund. |
Kimberley H. Monasterio (43) |
| Year of Election or Appointment: 2007 President and Treasurer of VIP Growth. Ms. Monasterio also serves as President and Treasurer of other Fidelity funds (2007- present) and is an employee of FMR (2004-present). Previously, Ms. Monasterio served as Deputy Treasurer of the Fidelity funds (2004-2006). Before joining Fidelity Investments, Ms. Monasterio served as Treasurer (2000-2004) and Chief Financial Officer (2002-2004) of the Franklin Templeton Funds and Senior Vice President of Franklin Templeton Services, LLC (2000-2004). |
Dwight D. Churchill (53) |
| Year of Election or Appointment: 2005 Vice President of VIP Growth. Mr. Churchill also serves as Vice President of certain Equity Funds (2005-present). Mr. Churchill is Executive Vice President of FMR (2005-present) and FMR Co., Inc. (2005-present). Previously, Mr. Churchill served as Senior Vice President of Fidelity Investments Money Management, Inc. (2005-2006), Head of Fidelity's Fixed-Income Division (2000-2005), Vice President of Fidelity's Money Market Funds (2000-2005), Vice President of Fidelity's Bond Funds, and Senior Vice President of FMR. |
Bruce T. Herring (41) |
| Year of Election or Appointment: 2006 Vice President of VIP Growth. Mr. Herring also serves as Vice President of certain Equity Funds (2006-present). Mr. Herring is Senior Vice President of FMR (2006-present) and Vice President of FMR Co., Inc. (2001-present). Previously, Mr. Herring served as a portfolio manager for Fidelity U.S. Equity Funds (2001-2005). |
Jason Weiner (37) |
| Year of Election or Appointment: 2006 Vice President of VIP Growth. Mr. Weiner also serves as Vice President of other funds advised by FMR. Prior to assuming his current responsibilities, Mr. Weiner worked as a research analyst and portfolio manager. Mr. Weiner also serves as Vice President of FMR (1999) and FMR Co., Inc. (2001). |
Eric D. Roiter (58) |
| Year of Election or Appointment: 1998 Secretary of VIP Growth. He also serves as Secretary of other Fidelity funds; Vice President, General Counsel, and Secretary of FMR Co., Inc. (2001-present) and FMR; Assistant Secretary of Fidelity Management & Research (U.K.) Inc. (2001-present), Fidelity Research & Analysis Company (2001-present), and Fidelity Investments Money Management, Inc. (2001-present). Mr. Roiter is an Adjunct Member, Faculty of Law, at Boston College Law School (2003-present). Previously, Mr. Roiter served as Vice President and Secretary of Fidelity Distributors Corporation (FDC) (1998-2005). |
Stuart Fross (47) |
| Year of Election or Appointment: 2003 Assistant Secretary of VIP Growth. Mr. Fross also serves as Assistant Secretary of other Fidelity funds (2003-present), Vice President and Secretary of FDC (2005-present), and is an employee of FMR. |
R. Stephen Ganis (40) |
| Year of Election or Appointment: 2006 Anti-Money Laundering (AML) officer of VIP Growth. Mr. Ganis also serves as AML officer of other Fidelity funds (2006-present) and FMR Corp. (2003-present). Before joining Fidelity Investments, Mr. Ganis practiced law at Goodwin Procter, LLP (2000-2002). |
Joseph B. Hollis (58) |
| Year of Election or Appointment: 2006 Chief Financial Officer of VIP Growth. Mr. Hollis also serves as Chief Financial Officer of other Fidelity funds. Mr. Hollis is President of Fidelity Pricing and Cash Management Services (FPCMS) (2005-present). Mr. Hollis also serves as President and Director of Fidelity Service Company, Inc. (2006-present). Previously, Mr. Hollis served as Senior Vice President of Cash Management Services (1999-2002) and Investment Management Operations (2002-2005). |
Kenneth A. Rathgeber (59) |
| Year of Election or Appointment: 2004 Chief Compliance Officer of VIP Growth. Mr. Rathgeber also serves as Chief Compliance Officer of other Fidelity funds (2004-present) and Executive Vice President of Risk Oversight for Fidelity Investments (2002-present). He is Chief Compliance Officer of FMR (2005-present), FMR Co., Inc. (2005-present), Fidelity Management & Research (U.K.) Inc. (2005-present), Fidelity Research & Analysis Company (2005-present), Fidelity Investments Money Management, Inc. (2005-present), and Strategic Advisers, Inc. (2005-present). Previously, Mr. Rathgeber served as Executive Vice President and Chief Operating Officer for Fidelity Investments Institutional Services Company, Inc. (1998-2002). |
Bryan A. Mehrmann (45) |
| Year of Election or Appointment: 2005 Deputy Treasurer of VIP Growth. Mr. Mehrmann also serves as Deputy Treasurer of other Fidelity funds (2005-present) and is an employee of FMR. Previously, Mr. Mehrmann served as Vice President of Fidelity Investments Institutional Services Group (FIIS)/Fidelity Investments Institutional Operations Corporation, Inc. (FIIOC) Client Services (1998-2004). |
Kenneth B. Robins (37) |
| Year of Election or Appointment: 2005 Deputy Treasurer of VIP Growth. Mr. Robins also serves as Deputy Treasurer of other Fidelity funds (2005-present) and is an employee of FMR (2004-present). Before joining Fidelity Investments, Mr. Robins worked at KPMG LLP, where he was a partner in KPMG's department of professional practice (2002-2004) and a Senior Manager (1999-2000). In addition, Mr. Robins served as Assistant Chief Accountant, United States Securities and Exchange Commission (2000-2002). |
Robert G. Byrnes (40) |
| Year of Election or Appointment: 2005 Assistant Treasurer of VIP Growth. Mr. Byrnes also serves as Assistant Treasurer of other Fidelity funds (2005-present) and is an employee of FMR (2005-present). Previously, Mr. Byrnes served as Vice President of FPCMS (2003-2005). Before joining Fidelity Investments, Mr. Byrnes worked at Deutsche Asset Management where he served as Vice President of the Investment Operations Group (2000-2003). |
John H. Costello (60) |
| Year of Election or Appointment: 1986 Assistant Treasurer of VIP Growth. Mr. Costello also serves as Assistant Treasurer of other Fidelity funds and is an employee of FMR. |
Peter L. Lydecker (52) |
| Year of Election or Appointment: 2004 Assistant Treasurer of VIP Growth. Mr. Lydecker also serves as Assistant Treasurer of other Fidelity funds (2004) and is an employee of FMR. |
Mark Osterheld (51) |
| Year of Election or Appointment: 2002 Assistant Treasurer of VIP Growth. Mr. Osterheld also serves as Assistant Treasurer of other Fidelity funds (2002) and is an employee of FMR. |
Gary W. Ryan (48) |
| Year of Election or Appointment: 2005 Assistant Treasurer of VIP Growth. Mr. Ryan also serves as Assistant Treasurer of other Fidelity funds (2005-present) and is an employee of FMR (2005-present). Previously, Mr. Ryan served as Vice President of Fund Reporting in FPCMS (1999-2005). |
Salvatore Schiavone (41) |
| Year of Election or Appointment: 2005 Assistant Treasurer of VIP Growth. Mr. Schiavone also serves as Assistant Treasurer of other Fidelity funds (2005-present) and is an employee of FMR (2005-present). Before joining Fidelity Investments, Mr. Schiavone worked at Deutsche Asset Management, where he most recently served as Assistant Treasurer (2003-2005) of the Scudder Funds and Vice President and Head of Fund Reporting (1996-2003). |
VIP Growth Portfolio
Distributions
Initial Class, Service Class, Service Class 2, Service Class 2R and Investor Class designates 100% of the dividend distributed during the fiscal year as qualifying for the dividends-received deduction for corporate shareholders.
The fund will notify shareholders in January 2007 of amounts for use in preparing 2006 income tax returns.
Annual Report
Proxy Voting Results
A special meeting of the fund's shareholders was held on November 15, 2006. The results of votes taken among shareholders on the proposal before them are reported below. Each vote reported represents one dollar of net asset value held on the record date for the meeting.
PROPOSAL 1 |
To elect a Board of Trustees. A |
| # of
Votes | % of
Votes |
Dennis J. Dirks |
Affirmative | 17,902,425,874.20 | 95.888 |
Withheld | 767,753,174.62 | 4.112 |
TOTAL | 18,670,179,048.82 | 100.000 |
Albert R. Gamper, Jr. |
Affirmative | 17,903,848,885.90 | 95.895 |
Withheld | 766,330,162.92 | 4.105 |
TOTAL | 18,670,179,048.82 | 100.000 |
Robert M. Gates |
Affirmative | 17,872,803,847.04 | 95.729 |
Withheld | 797,375,201.78 | 4.271 |
TOTAL | 18,670,179,048.82 | 100.000 |
George H. Heilmeier |
Affirmative | 17.870,083,099.32 | 95.715 |
Withheld | 800,095,949.50 | 4.285 |
TOTAL | 18,670,179,048.82 | 100.000 |
Edward C. Johnson 3d |
Affirmative | 17,855,450,949.13 | 95.636 |
Withheld | 814,728,099.69 | 4.364 |
TOTAL | 18,670,179,048.82 | 100.000 |
Stephen P. Jonas |
Affirmative | 17,891,792,907.31 | 95.831 |
Withheld | 778,386,141.51 | 4.169 |
TOTAL | 18,670,179,048.82 | 100.000 |
James H. KeyesB |
Affirmative | 17,882,873,107.76 | 95.783 |
Withheld | 787,305,941.06 | 4.217 |
TOTAL | 18,670,179,048.82 | 100.000 |
Marie L. Knowles |
Affirmative | 17,891,908,567.08 | 95.831 |
Withheld | 778,270,481.74 | 4.169 |
TOTAL | 18,670,179,048.82 | 100.000 |
Ned C. Lautenbach |
Affirmative | 17,899,551,251.03 | 95.872 |
Withheld | 770,627,797.79 | 4.128 |
TOTAL | 18,670,179,048.82 | 100.000 |
| # of
Votes | % of
Votes |
William O. McCoy |
Affirmative | 17,860,461,325.05 | 95.663 |
Withheld | 809,717,723.77 | 4.337 |
TOTAL | 18,670,179,048.82 | 100.000 |
Robert L. Reynolds |
Affirmative | 17,894,978,918.13 | 95.848 |
Withheld | 775,200,130.69 | 4.152 |
TOTAL | 18,670,179,048.82 | 100.000 |
Cornelia M. Small |
Affirmative | 17,897,519,970.69 | 95.862 |
Withheld | 772,659,078.13 | 4.138 |
TOTAL | 18,670,179,048.82 | 100.000 |
William S. Stavropoulos |
Affirmative | 17,871,058,112.55 | 95.720 |
Withheld | 799,120,936.27 | 4.280 |
TOTAL | 18,670,179,048.82 | 100.000 |
Kenneth L. Wolfe |
Affirmative | 17,886,340,376.33 | 95.802 |
Withheld | 783,838,672.49 | 4.198 |
TOTAL | 18,670,179,048.82 | 100.000 |
A Denotes trust-wide proposal and voting results. B Effective on or about January 1, 2007. |
VIP Growth Portfolio
Board Approval of Investment Advisory Contracts and Management Fees
VIP Growth Portfolio
Each year, typically in July, the Board of Trustees, including the Independent Trustees (together, the Board), votes on the renewal of the management contract and sub-advisory agreements (together, the Advisory Contracts) for the fund. The Board, assisted by the advice of fund counsel and Independent Trustees' counsel, requests and considers a broad range of information throughout the year.
The Board meets regularly each month except August and takes into account throughout the year matters bearing on Advisory Contracts. The Board, acting directly and through its separate committees, considers at each of its meetings factors that are relevant to the annual renewal of the fund's Advisory Contracts, including the services and support provided to the fund and its shareholders. At the time of the renewal, the Board had 12 standing committees, each composed of Independent Trustees with varying backgrounds, to which the Board has assigned specific subject matter responsibilities in order to enhance effective decision-making by the Board. Each committee has adopted a written charter outlining the structure and purposes of the committee. One such committee, the Equity Contract Committee, meets periodically as needed throughout the year to consider matters specifically related to the annual renewal of Advisory Contracts. The committee requests and receives information on, and makes recommendations to the Independent Trustees concerning, the approval and annual review of the Advisory Contracts.
At its July 2006 meeting, the Board of Trustees, including the Independent Trustees, unanimously determined to renew the Advisory Contracts for the fund. In reaching its determination, the Board considered all factors it believed relevant, including (i) the nature, extent, and quality of the services to be provided to the fund and its shareholders (including the investment performance of the fund); (ii) the competitiveness of the management fee and total expenses of the fund; (iii) the total costs of the services to be provided by and the profits to be realized by the investment adviser and its affiliates from the relationship with the fund; (iv) the extent to which economies of scale would be realized as the fund grows; and (v) whether fee levels reflect these economies of scale, if any, for the benefit of fund shareholders.
In determining whether to renew the Advisory Contracts for the fund, the Board ultimately reached a determination, with the assistance of fund counsel and Independent Trustees' counsel, that the renewal of the Advisory Contracts and the compensation to be received by Fidelity under the management contract is consistent with Fidelity's fiduciary duty under applicable law. In addition to evaluating the specific factors noted above, the Board, in reaching its determination, is aware that shareholders in the fund have a broad range of investment choices available to them, including a wide choice among mutual funds offered by competitors to Fidelity, and that the fund's shareholders, with the opportunity to review and weigh the disclosure provided by the fund in its prospectus and other public disclosures, have chosen to invest in this fund, managed by Fidelity.
Nature, Extent, and Quality of Services Provided. The Board considered staffing within the investment adviser, FMR, and the sub-advisers (together, the Investment Advisers), including the background of the fund's portfolio manager and the fund's investment objective and discipline. The Independent Trustees also had discussions with senior management of Fidelity's investment operations and investment groups. The Board considered the structure of the portfolio manager compensation program and whether this structure provides appropriate incentives.
Resources Dedicated to Investment Management and Support Services. The Board reviewed the size, education, and experience of the Investment Advisers' investment staff, their use of technology, and the Investment Advisers' approach to recruiting, training, and retaining portfolio managers and other research, advisory, and management personnel. The Board considered Fidelity's extensive global research capabilities that enable the Investment Advisers to aggregate data from various sources in an effort to produce positive investment results. The Board noted that Fidelity's analysts have access to a variety of technological tools that enable them to perform both fundamental and quantitative analysis and to specialize in various disciplines. The Board also considered that Fidelity's portfolio managers and analysts have access to daily portfolio attribution that allows for monitoring of a fund's portfolio, as well as an electronic communication system that provides immediate real-time access to research concerning issuers and credit enhancers.
Shareholder and Administrative Services. The Board considered (i) the nature, extent, quality, and cost of administrative, distribution, and shareholder services performed by the Investment Advisers and their affiliates under the Advisory Contracts and under separate agreements covering transfer agency, pricing and bookkeeping, and securities lending services for the fund; (ii) the nature and extent of the Investment Advisers' supervision of third party service providers, principally custodians and subcustodians; and (iii) the resources devoted to, and the record of compliance with, the fund's compliance policies and procedures. The Board reviewed the allocation of fund brokerage, including allocations to brokers affiliated with the Investment Advisers, the use of brokerage commissions to pay fund expenses, and the use of "soft" commission dollars to pay for research services. The Board also considered that Fidelity voluntarily pays for market data out of its own resources.
The Board noted that the growth of fund assets across the complex allows Fidelity to reinvest in the development of services designed to enhance the value or convenience of the Fidelity funds as investment vehicles. These services include 24-hour access to account information and market information through phone representatives and over the Internet, and investor education materials and asset allocation tools.
Investment in a Large Fund Family. The Board considered the benefits to shareholders of investing in a Fidelity fund, including the benefits of investing in a fund that is part of a large family of funds offering a variety of investment disciplines and providing for a large variety of mutual fund investor services. The Board noted that, since the last Advisory Contract renewals in July 2005, Fidelity has taken a number of actions that benefited particular funds, including (i) dedicating additional resources to investment research and to restructure the investment research teams; (ii) voluntarily entering into contractual arrangements with certain brokers pursuant to which Fidelity pays for research products and services separately out of its own resources, rather than bundling with fund commissions; (iii) launching the Fidelity Advantage Class of its five Spartan stock index funds and three Spartan bond index funds, which is a lower-fee class available to shareholders with higher account balances; (iv) contractually agreeing to impose expense limitations on Fidelity U.S. Bond Index Fund and reducing the fund's initial investment minimum; and (v) offering shareholders of each of the Fidelity Institutional Money Market Funds the privilege of exchanging shares of the fund for shares of other Fidelity funds.
Annual Report
Board Approval of Investment Advisory Contracts and Management Fees - continued
Investment Performance and Compliance. The Board considered whether the fund has operated within its investment objective, as well as its record of compliance with its investment restrictions. It also reviewed the fund's absolute investment performance for each class (except Investor Class), as well as the fund's relative investment performance for each class (except Investor Class) measured against (i) a broad-based securities market index, and (ii) a peer group of mutual funds deemed appropriate by the Board over multiple periods. The following charts considered by the Board show, over the one-, three-, and five-year periods ended December 31, 2005, the cumulative total returns of Service Class 2 and Initial Class of the fund, the cumulative total returns of a broad-based securities market index ("benchmark"), and a range of cumulative total returns of a peer group of mutual funds identified by Lipper Inc. as having an investment objective similar to that of the fund. The returns of Service Class 2 and Initial Class represent the performance of classes with the highest and lowest 12b-1 fees, respectively (not necessarily with the highest and lowest total expenses). (Investor Class of the fund, which has no 12b-1 fee, had less than one year of performance as of December 31, 2005.) The box within each chart shows the 25th percentile return (bottom of box) and the 75th percentile return (top of box) of the Lipper peer group. Returns shown above the box are in the first quartile and returns shown below the box are in the fourth quartile. The percentage beaten numbers noted below each chart correspond to the percentile box and represent the percentage of funds in the Lipper peer group whose performance was equal to or lower than that of the class indicated.
VIP Growth Portfolio

The Board reviewed the fund's relative investment performance against its Lipper peer group and stated that the performance of Initial Class of the fund was in the third quartile for all the periods shown. The Board also stated that the relative investment performance of the fund was lower than its benchmark for the three- and five-year periods, although the one-year cumulative total return of Initial Class of the fund was higher than its benchmark. The Board considered that the variations in performance among the fund's classes reflect the variations in class expenses, which result in lower performance for higher expense classes. The Board discussed with FMR actions to be taken by FMR to improve the fund's disappointing performance. The Board also reviewed the fund's relative investment performance against a customized peer group based on a combination of categories defined by Morningstar. The Board will continue to closely monitor the performance of the fund in the coming year.
The Board considered that FMR has taken steps to refocus and strengthen equity research, equity portfolio management, and compliance. The Board noted with favor FMR's reorganization of its senior management team in 2005 and FMR's dedication of additional resources to investment research, and participated in the process that led to those changes.
Based on its review, and giving particular weight to the nature and quality of the resources dedicated by the Investment Advisers to maintain and improve relative performance, the Board concluded that the nature, extent, and quality of the services provided to the fund will benefit the fund's shareholders, particularly in light of the Board's view that the fund's shareholders benefit from investing in a fund that is part of a large family of funds offering a variety of investment disciplines and services.
VIP Growth Portfolio
Competitiveness of Management Fee and Total Fund Expenses. The Board considered the fund's management fee and total expenses compared to "mapped groups" of competitive funds and classes. Fidelity creates "mapped groups" by combining similar Lipper investment objective categories that have comparable management fee characteristics. Combining Lipper investment objective categories aids the Board's management fee and total expense comparisons by broadening the competitive group used for comparison and by reducing the number of universes to which various Fidelity funds are compared.
The Board considered two proprietary management fee comparisons for the 12-month periods shown in the chart below. The group of Lipper funds used by the Board for management fee comparisons is referred to below as the "Total Mapped Group" and, for the reasons explained above, is broader than the Lipper peer group used by the Board for performance comparisons. The Total Mapped Group comparison focuses on a fund's standing relative to the total universe of comparable funds available to investors, in terms of gross management fees before expense reimbursements or caps. "TMG %" represents the percentage of funds in the Total Mapped Group that had management fees that were lower than the fund's. For example, a TMG % of 6% means that 94% of the funds in the Total Mapped Group had higher management fees than the fund. The "Asset-Size Peer Group" (ASPG) comparison focuses on a fund's standing relative to non-Fidelity funds similar in size to the fund within the Total Mapped Group. The ASPG represents at least 15% of the funds in the Total Mapped Group with comparable asset size and management fee characteristics, subject to a minimum of 50 funds (or all funds in the Total Mapped Group if fewer than 50). Additional information, such as the ASPG quartile in which the fund's management fee ranked, is also included in the chart and considered by the Board.
VIP Growth Portfolio

The Board noted that the fund's management fee ranked below the median of its Total Mapped Group and below the median of its ASPG for 2005.
Based on its review, the Board concluded that the fund's management fee was fair and reasonable in light of the services that the fund receives and the other factors considered.
In its review of each class's total expenses, the Board considered the fund's management fee as well as other fund or class expenses, as applicable, such as transfer agent fees, pricing and bookkeeping fees, fund-paid 12b-1 fees, and custodial, legal, and audit fees. The Board also noted the effects of any waivers and reimbursements on fees and expenses. As part of its review, the Board also considered current and historical total expenses of each class of the fund compared to competitive fund median expenses. Each class of the fund is compared to those funds and classes in the Total Mapped Group (used by the Board for management fee comparisons) that have a similar sales load structure.
The Board noted that the total expenses of each class ranked below its competitive median for 2005.
In its review of total expenses, the Board also considered Fidelity fee structures and other information on clients that FMR and its affiliates service in other competitive markets, such as other mutual funds advised or subadvised by FMR or its affiliates, pension plan clients, and other institutional clients.
Based on its review, the Board concluded that the total expenses of each class of the fund were reasonable in light of the services that the fund and its shareholders receive and the other factors considered.
Annual Report
Board Approval of Investment Advisory Contracts and Management Fees - continued
Costs of the Services and Profitability. The Board considered the revenues earned and the expenses incurred by Fidelity in conducting the business of developing, marketing, distributing, managing, administering and servicing the fund and its shareholders. The Board also considered the level of Fidelity's profits in respect of all the Fidelity funds.
On an annual basis, FMR presents to the Board Fidelity's profitability for the fund. Fidelity calculates the profitability for each fund, as well as aggregate profitability for groups of Fidelity funds and all Fidelity funds, using a series of detailed revenue and cost allocation methodologies which originate with the audited books and records of Fidelity. The Audit Committee of the Board reviews any significant changes from the prior year's methodologies.
PricewaterhouseCoopers LLP (PwC), independent registered accounting firm and auditor to Fidelity and certain Fidelity funds, has been engaged annually by the Board as part of the Board's assessment of the results of Fidelity's profitability analysis. PwC's engagement includes the review and assessment of Fidelity's methodologies used in determining the revenues and expenses attributable to Fidelity's mutual fund business, and completion of agreed-upon procedures surrounding the mathematical accuracy of fund profitability and its conformity to allocation methodologies. After considering PwC's reports issued under the engagement and information provided by Fidelity, the Board believes that while other allocation methods may also be reasonable, Fidelity's profitability methodologies are reasonable in all material respects.
The Board has also reviewed Fidelity's non-fund businesses and any fall-out benefits related to the mutual fund business as well as cases where Fidelity's affiliates may benefit from or be related to the fund's business.
The Board considered the costs of the services provided by and the profits realized by Fidelity in connection with the operation of the fund and determined that the amount of profit is a fair entrepreneurial profit for the management of the fund.
Economies of Scale. The Board considered whether there have been economies of scale in respect of the management of the Fidelity funds, whether the Fidelity funds (including the fund) have appropriately benefited from any such economies of scale, and whether there is potential for realization of any further economies of scale. The Board considered the extent to which the fund will benefit from economies of scale through increased services to the fund, through waivers or reimbursements, or through fee or expense reductions.
The Board recognized that the fund's management contract incorporates a "group fee" structure, which provides for lower fee rates as total fund assets under FMR's management increase, and for higher fee rates as total fund assets under FMR's management decrease. The Board considered that the group fee is designed to deliver the benefits of economies of scale to fund shareholders when total fund assets increase, even if assets of any particular fund are unchanged or have declined, because some portion of Fidelity's costs are attributable to services provided to all Fidelity funds, and all funds benefit if those costs can be allocated among more assets. The Board concluded that, given the group fee structure, fund shareholders will achieve a certain level of economies of scale as assets under FMR's management increase at the fund complex level, regardless of whether Fidelity achieves any such economies of scale.
The Board further concluded that any potential economies of scale are being shared between fund shareholders and Fidelity in an appropriate manner.
Additional Information Requested by the Board. In order to develop fully the factual basis for consideration of the Advisory Contracts, the Board requested additional information on several topics, including (i) Fidelity's fund profitability methodology and profitability trends within certain funds; (ii) portfolio manager compensation; (iii) the extent to which any economies of scale exist and are shared between the funds and Fidelity; (iv) the total expenses of certain funds and classes relative to competitors, including the extent to which the expenses of certain funds have been or could be capped; (v) fund performance trends; and (vi) Fidelity's fee structures, including use of performance fees.
Based on its evaluation of all of the conclusions noted above, and after considering all material factors, the Board ultimately concluded that the advisory fee structures are fair and reasonable, and that the fund's Advisory Contracts should be renewed.
VIP Growth Portfolio
Annual Report
VIP Growth Portfolio
Annual Report
Investment Adviser
Fidelity Management & Research Company
Boston, MA
Investment Sub-Adviser
FMR Co., Inc.
Fidelity Management & Research (U.K.) Inc.
Fidelity Research & Analysis Company
(formerly Fidelity Management & Research (Far East) Inc.)
Fidelity International Investment Advisors
Fidelity International Investment Advisors (U.K.) Limited
Fidelity Investments Japan Limited
General Distributor
Fidelity Distributors Corporation
Boston, MA
Transfer and Service Agents
Fidelity Investments Institutional Operations Company, Inc.
Boston, MA
Fidelity Service Company, Inc.
Boston, MA
Custodian
Mellon Bank, N.A.
Pittsburgh, PA
VIPGRWT-ANN-0207
1.540077.109
Fidelity® Variable Insurance Products:
Growth Portfolio - Service Class 2R
Annual Report
December 31, 2006
(2_fidelity_logos) (Registered_Trademark)
Contents
Performance | <Click Here> | How the fund has done over time. |
Management's Discussion | <Click Here> | The managers' review of fund performance, strategy and outlook. |
Shareholder Expense Example | <Click Here> | An example of shareholder expenses. |
Investment Changes | <Click Here> | A summary of major shifts in the fund's investments over the past six months. |
Investments | <Click Here> | A complete list of the fund's investments with their
market values. |
Financial Statements | <Click Here> | Statements of assets and liabilities, operations, and
changes in net assets, as well as financial highlights. |
Notes | <Click Here> | Notes to the financial statements. |
Report of Independent Registered Public Accounting Firm | <Click Here> | |
Trustees and Officers | <Click Here> | |
Distributions | <Click Here> | |
Proxy Voting Results | <Click Here> | |
Board Approval of Investment Advisory Contracts and Management Fees | <Click Here> | |
To view a fund's proxy voting guidelines and proxy voting record for the 12-month period ended June 30, visit www.fidelity.com/proxyvotingresults or visit the Securities and Exchange Commission's (SEC) web site at www.sec.gov. You may also call 1-877-208-0098 to request a free copy of the proxy voting guidelines.
Fidelity Variable Insurance Products are separate account options which are purchased through a variable insurance contract.
Standard & Poor's, S&P and S&P 500 are registered service marks of The McGraw-Hill Companies, Inc. and have been licensed for use by Fidelity Distributors Corporation.
Other third party marks appearing herein are the property of their respective owners.
All other marks appearing herein are registered or unregistered trademarks or service marks of FMR Corp. or an affiliated company.
This report and the financial statements contained herein are submitted for the general information of the shareholders of the fund. This report is not authorized for distribution to prospective investors in the fund unless preceded or accompanied by an effective prospectus.
A fund files its complete schedule of portfolio holdings with the SEC for the first and third quarters of each fiscal year on Form N-Q. Forms N-Q are available on the SEC's web site at http://www.sec.gov. A fund's Forms N-Q may be reviewed and copied at the SEC's Public Reference Room in Washington, DC. Information regarding the operation of the SEC's Public Reference Room may be obtained by calling 1-800-SEC-0330. For a complete list of a fund's portfolio holdings, view the most recent quarterly holdings report, semiannual report, or annual report on Fidelity's web site at http://www.advisor.fidelity.com.
NOT FDIC INSURED · MAY LOSE VALUE · NO BANK GUARANTEE
Neither the fund nor Fidelity Distributors Corporation is a bank.
VIP Growth Portfolio
VIP Growth Portfolio
Performance: The Bottom Line
Average annual total return reflects the change in the value of an investment, assuming reinvestment of a class' dividend income and capital gains (the profits earned upon the sale of securities that have grown in value) and assuming a constant rate of performance each year. During periods of reimbursement by Fidelity, a fund's total return will be greater than it would be had the reimbursement not occurred. Performance numbers are net of all underlying fund operating expenses, but do not include any insurance charges imposed by your insurance company's separate account. If performance information included the effect of these additional charges, the total returns would be lower. How a fund did yesterday is no guarantee of how it will do tomorrow.
Average Annual Total Returns
Periods ended December 31, 2006 | Past 1
year | Past 5
years | Past 10
years |
VIP Growth - Service Class 2R A | 6.58% | 1.38% | 6.31% |
A The initial offering of Service Class 2R shares took place on April 24, 2002. Performance for Service Class 2R shares reflects an asset-based service fee (12b-1 fee). Returns from January 12, 2000 to April 24, 2002 are those of Service Class 2. Returns from November 3, 1997 to January 12, 2000 are those of Service Class, which reflect a different 12b-1 fee. Service Class 2R returns prior to November 3, 1997 are those of Initial Class and do not include the effects of a 12b-1 fee. Had Service Class 2R's 12b-1 fee been reflected, returns prior to January 12, 2000 would have been lower.
$10,000 Over 10 Years
Let's say hypothetically that $10,000 was invested in VIP Growth Portfolio - Service Class 2R on December 31, 1996. The chart shows how the value of your investment would have changed, and also shows how the Russell 3000® Growth Index performed over the same period.
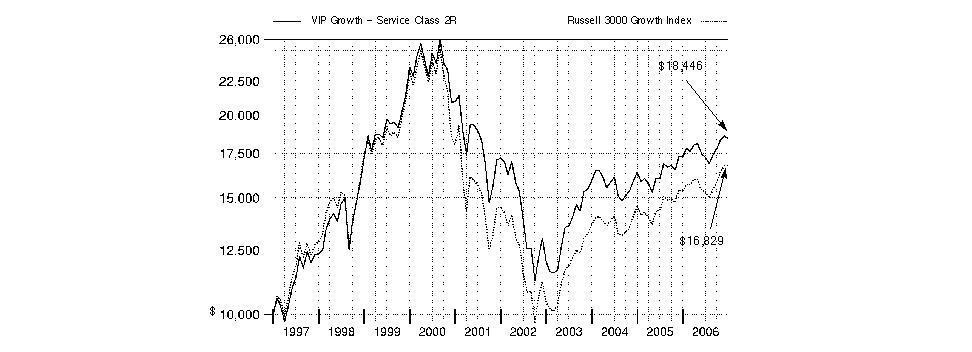
Annual Report
VIP Growth Portfolio
Management's Discussion of Fund Performance
Comments from Jennifer Uhrig, who managed VIP Growth Portfolio for most of the period covered by this report
U.S. stock markets registered their fourth consecutive year of positive returns in 2006. Among the highlights were the performances of the Dow Jones Industrial AverageSM - a gauge of 30 mega-cap, blue-chip stocks - and the small-cap-oriented Russell 2000® Index, both of which reached new highs. The efforts of the Federal Reserve Board to contain inflation levels also dominated the investment headlines. In all, the Fed hiked short-term interest rates four times, but held rates steady after its June 29 increase, finally pausing after 17 rate hikes over a two-year period. A slowing residential housing market and moderating oil prices - the latter of which hit a record closing high of $77 per barrel in July before falling sharply - also held economic growth in check. For the year overall, the Standard & Poor's 500SM Index was up 15.79%, the Dow advanced 19.05%, the Russell 2000 Index gained 18.37% and the NASDAQ Composite® Index rose 10.39%.
For the year ending December 31, 2006, the fund trailed the Russell 3000® Growth Index, which returned 9.46%. (For specific portfolio performance results, please refer to the performance section of this report.) The fund underperformed the index in part because of its conservative positioning during the market's rebound in the latter part of the period and also because of inopportune stock selection in the information technology and health care sectors. Among the holdings that detracted the most were underweighted positions in network equipment maker Cisco Systems, software giant Microsoft and database software maker Oracle, along with weak results from wireless equipment maker QUALCOMM and online auctioneer eBay, the latter of which was sold off by period end. Where the fund did well versus the index - in energy and in segments of the consumer sectors, for example - those gains were mostly a product of favorable stock picking. Top contributors included energy services firm Schlumberger, Taiwanese contract manufacturer Hon Hai Precision Industry and global positioning systems (GPS) leader Garmin. Hon Hai was no longer held at period end.
Note to shareholders: Jason Weiner became Portfolio Manager of the fund on November 9, 2006.
The views expressed above reflect those of the portfolio manager(s) only through the end of the period as stated on the cover of this report and do not necessarily represent the views of Fidelity or any other person in the Fidelity organization. Any such views are subject to change at any time based upon market or other conditions and Fidelity disclaims any responsibility to update such views. These views may not be relied on as investment advice and, because investment decisions for a Fidelity fund are based on numerous factors, may not be relied on as an indication of trading intent on behalf of any Fidelity fund.
VIP Growth Portfolio
VIP Growth Portfolio
Shareholder Expense Example
As a shareholder of the Fund, you incur two types of costs: (1) transaction costs, including redemption fees, and (2) ongoing costs, including management fees, distribution and/or service (12b-1) fees and other Fund expenses. This Example is intended to help you understand your ongoing costs (in dollars) of investing in the Fund and to compare these costs with the ongoing costs of investing in other mutual funds.
The Example is based on an investment of $1,000 invested at the beginning of the period and held for the entire period (July 1, 2006 to December 31, 2006).
Actual Expenses
The first line of the accompanying table for each class of the Fund provides information about actual account values and actual expenses. You may use the information in this line, together with the amount you invested, to estimate the expenses that you paid over the period. Simply divide your account value by $1,000.00 (for example, an $8,600 account value divided by $1,000.00 = 8.6), then multiply the result by the number in the first line for a class of the Fund under the heading entitled "Expenses Paid During Period" to estimate the expenses you paid on your account during this period. The estimate of expenses does not include any fees or other expenses of any variable annuity or variable life insurance product. If they were, the estimate of expenses you paid during the period would be higher, and your ending account value would be lower.
Hypothetical Example for Comparison Purposes
The second line of the accompanying table for each class of the Fund provides information about hypothetical account values and hypothetical expenses based on a Class' actual expense ratio and an assumed rate of return of 5% per year before expenses, which is not the Class' actual return. The hypothetical account values and expenses may not be used to estimate the actual ending account balance or expenses you paid for the period. You may use this information to compare the ongoing costs of investing in the Fund and other funds. To do so, compare this 5% hypothetical example with the 5% hypothetical examples that appear in the shareholder reports of the other funds. The estimate of expenses does not include any fees or other expenses of any variable annuity or variable life insurance product. If they were, the estimate of expenses you paid during the period would be higher, and your ending account value would be lower.
Please note that the expenses shown in the table are meant to highlight your ongoing costs only and do not reflect any transaction costs. Therefore, the second line of the table is useful in comparing ongoing costs only, and will not help you determine the relative total costs of owning different funds. In addition, if these transactional costs were included, your costs would have been higher.
| Beginning
Account Value
July 1, 2006 | Ending
Account Value
December 31, 2006 | Expenses Paid
During Period *
July 1, 2006
to December 31, 2006 |
Initial Class | | | |
Actual | $ 1,000.00 | $ 1,068.50 | $ 3.70 |
Hypothetical A | $ 1,000.00 | $ 1,021.63 | $ 3.62 |
Service Class | | | |
Actual | $ 1,000.00 | $ 1,067.90 | $ 4.22 |
Hypothetical A | $ 1,000.00 | $ 1,021.12 | $ 4.13 |
Service Class 2 | | |
Actual | $ 1,000.00 | $ 1,066.90 | $ 5.00 |
Hypothetical A | $ 1,000.00 | $ 1,020.37 | $ 4.89 |
Service Class 2R | | |
Actual | $ 1,000.00 | $ 1,067.20 | $ 4.95 |
Hypothetical A | $ 1,000.00 | $ 1,020.42 | $ 4.84 |
Investor Class | | |
Actual | $ 1,000.00 | $ 1,068.10 | $ 4.27 |
Hypothetical A | $ 1,000.00 | $ 1,021.07 | $ 4.18 |
A 5% return per year before expenses
* Expenses are equal to each Class' annualized expense ratio (shown in the table below); multiplied by the average account value over the period, multiplied by 184/365 (to reflect the one-half year period).
| Annualized
Expense Ratio |
Initial Class | .71% |
Service Class | .81% |
Service Class 2 | .96% |
Service Class 2R | .95% |
Investor Class | .82% |
Annual Report
VIP Growth Portfolio
Investment Changes
Top Ten Stocks as of December 31, 2006 |
| % of fund's
net assets | % of fund's net assets
6 months ago |
Microsoft Corp. | 3.9 | 2.2 |
Cisco Systems, Inc. | 3.2 | 0.9 |
Biogen Idec, Inc. | 2.8 | 0.0 |
Intel Corp. | 2.7 | 0.0 |
Google, Inc. Class A (sub. vtg.) | 2.6 | 2.2 |
General Electric Co. | 2.6 | 4.4 |
Johnson & Johnson | 1.9 | 3.2 |
Research In Motion Ltd. | 1.8 | 0.0 |
ABB Ltd. sponsored ADR | 1.7 | 0.0 |
Commerce Bancorp, Inc., New Jersey | 1.6 | 0.0 |
| 24.8 | |
Top Five Market Sectors as of December 31, 2006 |
| % of fund's
net assets | % of fund's net assets
6 months ago |
Information Technology | 31.6 | 23.8 |
Health Care | 20.8 | 18.0 |
Consumer Discretionary | 11.1 | 9.7 |
Industrials | 11.1 | 11.9 |
Financials | 10.2 | 10.1 |
Asset Allocation (% of fund's net assets) |
As of December 31, 2006* | As of June 30, 2006** |
| Stocks 99.9% | | | Stocks 99.8% | |
| Short-Term Investments
and Net Other Assets 0.1% | | | Short-Term Investments
and Net Other Assets 0.2% | |
* Foreign investments | 13.2% | | ** Foreign investments | 13.0% | |

VIP Growth Portfolio
VIP Growth Portfolio
Investments December 31, 2006
Showing Percentage of Net Assets
Common Stocks - 99.9% |
| Shares | | Value (Note 1) |
CONSUMER DISCRETIONARY - 11.1% |
Automobiles - 0.6% |
Toyota Motor Corp. sponsored ADR | 297,400 | | $ 39,943,794 |
Diversified Consumer Services - 1.1% |
Sotheby's Class A (ltd. vtg.) (d) | 1,115,450 | | 34,601,259 |
Weight Watchers International, Inc. | 873,800 | | 45,900,714 |
| | 80,501,973 |
Hotels, Restaurants & Leisure - 1.8% |
Bob Evans Farms, Inc. | 255,063 | | 8,728,256 |
Carrols Restaurant Group, Inc. | 52,800 | | 748,704 |
International Game Technology | 278,600 | | 12,871,320 |
McCormick & Schmick's Seafood Restaurants (a) | 487,327 | | 11,715,341 |
McDonald's Corp. | 884,100 | | 39,192,153 |
Melco PBL Entertainment (Macau) Ltd. Sponsored ADR | 44,300 | | 941,818 |
Starbucks Corp. (a) | 1,165,554 | | 41,283,923 |
Yum! Brands, Inc. | 235,023 | | 13,819,352 |
| | 129,300,867 |
Household Durables - 1.7% |
Garmin Ltd. (d) | 1,316,900 | | 73,298,654 |
Sony Corp. sponsored ADR | 1,170,969 | | 50,152,602 |
| | 123,451,256 |
Media - 1.6% |
Lamar Advertising Co. Class A (a) | 583,340 | | 38,144,603 |
McGraw-Hill Companies, Inc. | 467,094 | | 31,771,734 |
Omnicom Group, Inc. | 401,400 | | 41,962,356 |
| | 111,878,693 |
Multiline Retail - 1.1% |
Kohl's Corp. (a) | 519,600 | | 35,556,228 |
Saks, Inc. | 1,208,000 | | 21,526,560 |
Target Corp. | 380,300 | | 21,696,115 |
| | 78,778,903 |
Specialty Retail - 1.6% |
Guess?, Inc. (a) | 506,400 | | 32,120,952 |
J. Crew Group, Inc. | 412,100 | | 15,886,455 |
RadioShack Corp. (d) | 1,361,800 | | 22,851,004 |
Staples, Inc. | 1,391,187 | | 37,144,693 |
Zumiez, Inc. (a) | 366,364 | | 10,822,393 |
| | 118,825,497 |
Textiles, Apparel & Luxury Goods - 1.6% |
Crocs, Inc. (d) | 540,294 | | 23,340,701 |
Polo Ralph Lauren Corp. Class A | 1,056,832 | | 82,073,573 |
Under Armour, Inc. Class A (sub. vtg.) (a) | 230,100 | | 11,608,545 |
| | 117,022,819 |
TOTAL CONSUMER DISCRETIONARY | | 799,703,802 |
|
| Shares | | Value (Note 1) |
CONSUMER STAPLES - 7.1% |
Beverages - 1.7% |
PepsiCo, Inc. | 1,422,629 | | $ 88,985,444 |
The Coca-Cola Co. | 632,700 | | 30,527,775 |
| | 119,513,219 |
Food & Staples Retailing - 2.3% |
CVS Corp. | 3,456,285 | | 106,833,769 |
Sysco Corp. | 417,900 | | 15,362,004 |
Walgreen Co. | 951,500 | | 43,664,335 |
| | 165,860,108 |
Food Products - 0.6% |
Tyson Foods, Inc. Class A | 2,762,900 | | 45,449,705 |
Household Products - 1.3% |
Colgate-Palmolive Co. | 841,000 | | 54,866,840 |
Procter & Gamble Co. | 581,400 | | 37,366,578 |
| | 92,233,418 |
Personal Products - 0.6% |
Avon Products, Inc. | 1,100,779 | | 36,369,738 |
Bare Escentuals, Inc. | 232,247 | | 7,215,914 |
| | 43,585,652 |
Tobacco - 0.6% |
Altria Group, Inc. | 520,300 | | 44,652,146 |
TOTAL CONSUMER STAPLES | | 511,294,248 |
ENERGY - 5.8% |
Energy Equipment & Services - 1.4% |
Baker Hughes, Inc. | 309,670 | | 23,119,962 |
Halliburton Co. | 1,330,400 | | 41,308,920 |
Noble Corp. | 193,500 | | 14,735,025 |
Schlumberger Ltd. (NY Shares) | 343,000 | | 21,663,880 |
| | 100,827,787 |
Oil, Gas & Consumable Fuels - 4.4% |
Canadian Oil Sands Trust unit | 1,365,900 | | 38,200,685 |
Chesapeake Energy Corp. | 2,285,008 | | 66,379,482 |
Denbury Resources, Inc. (a) | 315,900 | | 8,778,861 |
EOG Resources, Inc. | 582,900 | | 36,402,105 |
Exxon Mobil Corp. | 503,800 | | 38,606,194 |
Noble Energy, Inc. | 94,200 | | 4,622,394 |
OAO Gazprom sponsored ADR | 827,100 | | 38,377,440 |
Petroplus Holdings AG | 210,060 | | 12,752,320 |
Quicksilver Resources, Inc. (a) | 195,300 | | 7,146,027 |
Ultra Petroleum Corp. (a) | 1,015,817 | | 48,505,262 |
XTO Energy, Inc. | 402,100 | | 18,918,805 |
| | 318,689,575 |
TOTAL ENERGY | | 419,517,362 |
FINANCIALS - 10.2% |
Capital Markets - 3.6% |
Charles Schwab Corp. | 3,725,972 | | 72,060,298 |
Common Stocks - continued |
| Shares | | Value (Note 1) |
FINANCIALS - continued |
Capital Markets - continued |
Goldman Sachs Group, Inc. | 73,700 | | $ 14,692,095 |
Investors Financial Services Corp. | 349,725 | | 14,922,766 |
Merrill Lynch & Co., Inc. | 330,700 | | 30,788,170 |
Northern Trust Corp. | 626,979 | | 38,051,356 |
State Street Corp. | 807,600 | | 54,464,544 |
UBS AG (NY Shares) | 600,108 | | 36,204,516 |
| | 261,183,745 |
Commercial Banks - 2.4% |
Canadian Western Bank, Edmonton | 265,000 | | 11,995,455 |
Commerce Bancorp, Inc., New Jersey (d) | 3,209,100 | | 113,184,957 |
East West Bancorp, Inc. | 225,100 | | 7,973,042 |
Wells Fargo & Co. | 1,032,000 | | 36,697,920 |
| | 169,851,374 |
Consumer Finance - 1.4% |
American Express Co. (d) | 1,694,200 | | 102,787,114 |
Insurance - 2.8% |
ACE Ltd. | 327,700 | | 19,848,789 |
AFLAC, Inc. | 978,620 | | 45,016,520 |
American International Group, Inc. | 1,400,666 | | 100,371,726 |
Willis Group Holdings Ltd. | 796,700 | | 31,636,957 |
| | 196,873,992 |
TOTAL FINANCIALS | | 730,696,225 |
HEALTH CARE - 20.8% |
Biotechnology - 9.2% |
Acorda Therapeutics, Inc. | 723,483 | | 11,459,971 |
Altus Pharmaceuticals, Inc. | 409,100 | | 7,711,535 |
Amgen, Inc. (a) | 1,305,010 | | 89,145,233 |
Amylin Pharmaceuticals, Inc. (a)(d) | 1,007,225 | | 36,330,606 |
Biogen Idec, Inc. (a) | 4,131,140 | | 203,210,777 |
Cephalon, Inc. (a)(d) | 484,900 | | 34,141,809 |
CSL Ltd. | 486,605 | | 25,110,316 |
Genentech, Inc. (a) | 1,073,300 | | 87,076,829 |
Gilead Sciences, Inc. (a) | 1,341,292 | | 87,090,090 |
OSI Pharmaceuticals, Inc. (a) | 968,710 | | 33,885,476 |
PDL BioPharma, Inc. (a) | 1,219,435 | | 24,559,421 |
Telik, Inc. (a)(d) | 946,993 | | 4,195,179 |
Theravance, Inc. (a) | 485,549 | | 14,998,609 |
| | 658,915,851 |
Health Care Equipment & Supplies - 4.2% |
ArthroCare Corp. (a) | 144,815 | | 5,781,015 |
Becton, Dickinson & Co. | 899,400 | | 63,092,910 |
C.R. Bard, Inc. | 608,700 | | 50,503,839 |
Cochlear Ltd. | 172,439 | | 7,895,154 |
DENTSPLY International, Inc. | 947,714 | | 28,289,263 |
Hologic, Inc. (a) | 686,391 | | 32,452,566 |
Kyphon, Inc. (a) | 167,949 | | 6,785,140 |
Mentor Corp. | 794,540 | | 38,829,170 |
|
| Shares | | Value (Note 1) |
Mindray Medical International Ltd. sponsored ADR | 184,500 | | $ 4,413,240 |
ResMed, Inc. (a) | 709,800 | | 34,936,356 |
Sirona Dental Systems, Inc. | 836,002 | | 32,194,437 |
| | 305,173,090 |
Health Care Providers & Services - 1.7% |
Brookdale Senior Living, Inc. | 334,300 | | 16,046,400 |
Cardinal Health, Inc. | 561,600 | | 36,183,888 |
Henry Schein, Inc. (a) | 1,001,800 | | 49,068,164 |
Medco Health Solutions, Inc. (a) | 445,300 | | 23,796,832 |
| | 125,095,284 |
Life Sciences Tools & Services - 1.5% |
Covance, Inc. (a) | 1,112,000 | | 65,507,920 |
Pharmaceutical Product Development, Inc. | 1,356,921 | | 43,719,995 |
| | 109,227,915 |
Pharmaceuticals - 4.2% |
Allergan, Inc. | 333,300 | | 39,909,342 |
Johnson & Johnson | 2,017,720 | | 133,209,874 |
Merck & Co., Inc. | 1,878,500 | | 81,902,600 |
Wyeth | 870,800 | | 44,341,136 |
| | 299,362,952 |
TOTAL HEALTH CARE | | 1,497,775,092 |
INDUSTRIALS - 11.1% |
Aerospace & Defense - 1.3% |
The Boeing Co. | 1,008,941 | | 89,634,318 |
Air Freight & Logistics - 0.3% |
United Parcel Service, Inc. Class B | 237,440 | | 17,803,251 |
Airlines - 1.3% |
AirTran Holdings, Inc. (a) | 1,240,800 | | 14,566,992 |
Allegiant Travel Co. | 13,800 | | 387,228 |
Ryanair Holdings PLC sponsored ADR (a) | 27,000 | | 2,200,500 |
UAL Corp. (a) | 346,546 | | 15,248,024 |
US Airways Group, Inc. (a) | 1,149,000 | | 61,873,650 |
| | 94,276,394 |
Commercial Services & Supplies - 1.5% |
Cintas Corp. | 850,851 | | 33,787,293 |
Equifax, Inc. | 1,085,104 | | 44,055,222 |
Tele Atlas NV (a) | 1,439,575 | | 30,161,362 |
| | 108,003,877 |
Construction & Engineering - 0.2% |
Jacobs Engineering Group, Inc. (a) | 196,600 | | 16,030,764 |
Electrical Equipment - 2.2% |
ABB Ltd. sponsored ADR | 6,683,500 | | 120,169,330 |
General Cable Corp. | 915,600 | | 40,020,876 |
| | 160,190,206 |
Industrial Conglomerates - 3.9% |
General Electric Co. | 4,917,020 | | 182,962,314 |
McDermott International, Inc. (a) | 714,800 | | 36,354,728 |
Common Stocks - continued |
| Shares | | Value (Note 1) |
INDUSTRIALS - continued |
Industrial Conglomerates - continued |
Textron, Inc. | 393,900 | | $ 36,936,003 |
Tyco International Ltd. | 752,113 | | 22,864,235 |
| | 279,117,280 |
Machinery - 0.4% |
Deere & Co. | 250,300 | | 23,796,021 |
Valmont Industries, Inc. | 131,770 | | 7,311,917 |
| | 31,107,938 |
TOTAL INDUSTRIALS | | 796,164,028 |
INFORMATION TECHNOLOGY - 31.6% |
Communications Equipment - 8.8% |
Cisco Systems, Inc. (a) | 8,372,700 | | 228,825,891 |
Corning, Inc. (a) | 3,630,300 | | 67,922,913 |
Harris Corp. | 818,400 | | 37,531,824 |
Juniper Networks, Inc. (a) | 2,411,600 | | 45,675,704 |
Nice Systems Ltd. sponsored ADR | 1,221,267 | | 37,590,598 |
QUALCOMM, Inc. | 1,291,703 | | 48,813,456 |
Research In Motion Ltd. (a) | 1,018,100 | | 130,092,818 |
TomTom Group BV (a)(d) | 763,835 | | 32,995,338 |
| | 629,448,542 |
Computers & Peripherals - 3.0% |
Apple Computer, Inc. (a) | 865,534 | | 73,431,905 |
EMC Corp. (a) | 5,781,958 | | 76,321,846 |
Network Appliance, Inc. (a) | 1,682,215 | | 66,077,405 |
| | 215,831,156 |
Electronic Equipment & Instruments - 0.7% |
Amphenol Corp. Class A | 783,382 | | 48,632,355 |
Dolby Laboratories, Inc. Class A (a) | 126,700 | | 3,930,234 |
IPG Photonics Corp. | 11,600 | | 278,400 |
| | 52,840,989 |
Internet Software & Services - 3.1% |
Google, Inc. Class A (sub. vtg.) (a) | 402,100 | | 185,159,008 |
LoopNet, Inc. | 164,296 | | 2,461,154 |
VeriSign, Inc. (a) | 1,494,900 | | 35,952,345 |
| | 223,572,507 |
IT Services - 4.0% |
Cognizant Technology Solutions Corp. Class A (a) | 616,600 | | 47,576,856 |
ExlService Holdings, Inc. | 444,874 | | 9,360,149 |
First Data Corp. | 1,439,800 | | 36,743,696 |
Infosys Technologies Ltd. sponsored ADR | 524,400 | | 28,611,264 |
MoneyGram International, Inc. | 233,700 | | 7,328,832 |
Paychex, Inc. | 829,514 | | 32,798,984 |
Satyam Computer Services Ltd. sponsored ADR | 1,609,700 | | 38,648,897 |
|
| Shares | | Value (Note 1) |
The Western Union Co. | 3,711,900 | | $ 83,220,798 |
WNS Holdings Ltd. ADR | 117,800 | | 3,663,580 |
| | 287,953,056 |
Semiconductors & Semiconductor Equipment - 4.6% |
Broadcom Corp. Class A (a) | 2,474,000 | | 79,934,940 |
FormFactor, Inc. (a) | 53,900 | | 2,007,775 |
Integrated Device Technology, Inc. (a) | 1,548,800 | | 23,975,424 |
Intel Corp. | 9,651,400 | | 195,440,850 |
National Semiconductor Corp. | 747,000 | | 16,956,900 |
SiRF Technology Holdings, Inc. (a) | 554,900 | | 14,161,048 |
| | 332,476,937 |
Software - 7.4% |
Activision, Inc. (a) | 1,469,546 | | 25,334,973 |
Electronic Arts, Inc. (a) | 1,231,187 | | 62,002,577 |
Guidance Software, Inc. | 205,700 | | 3,202,749 |
Microsoft Corp. | 9,319,770 | | 278,288,330 |
NSD Co. Ltd. | 237,200 | | 7,531,424 |
Opsware, Inc. (a) | 654,406 | | 5,771,861 |
Oracle Corp. (a) | 5,361,000 | | 91,887,540 |
Red Hat, Inc. (a) | 938,142 | | 21,577,266 |
Take-Two Interactive Software, Inc. (a)(d) | 2,030,657 | | 36,064,468 |
| | 531,661,188 |
TOTAL INFORMATION TECHNOLOGY | | 2,273,784,375 |
MATERIALS - 1.0% |
Chemicals - 1.0% |
Monsanto Co. | 1,234,300 | | 64,837,779 |
Praxair, Inc. | 176,400 | | 10,465,812 |
| | 75,303,591 |
TELECOMMUNICATION SERVICES - 1.2% |
Diversified Telecommunication Services - 1.2% |
AT&T, Inc. | 895,800 | | 32,024,850 |
BellSouth Corp. | 782,200 | | 36,849,442 |
Level 3 Communications, Inc. (a) | 2,961,800 | | 16,586,080 |
| | 85,460,372 |
TOTAL COMMON STOCKS (Cost $6,234,426,050) | 7,189,699,095 |
Preferred Stocks - 0.0% |
| | | |
Convertible Preferred Stocks - 0.0% |
INFORMATION TECHNOLOGY - 0.0% |
Communications Equipment - 0.0% |
Chorum Technologies, Inc. Series E (a)(e) | 88,646 | | 1 |
Nonconvertible Preferred Stocks - 0.0% |
HEALTH CARE - 0.0% |
Life Sciences Tools & Services - 0.0% |
GeneProt, Inc. Series A (a)(e) | 826,000 | | 8 |
Preferred Stocks - continued |
| Shares | | Value (Note 1) |
Nonconvertible Preferred Stocks - continued |
INDUSTRIALS - 0.0% |
Aerospace & Defense - 0.0% |
Rolls-Royce Group PLC Series B | 149,262,496 | | $ 296,723 |
TOTAL NONCONVERTIBLE PREFERRED STOCKS | | 296,731 |
TOTAL PREFERRED STOCKS (Cost $6,086,260) | 296,732 |
Money Market Funds - 1.5% |
| | | |
Fidelity Securities Lending Cash Central Fund, 5.38% (b)(c)
(Cost $107,754,496) | 107,754,496 | | 107,754,496 |
TOTAL INVESTMENT PORTFOLIO - 101.4% (Cost $6,348,266,806) | 7,297,750,323 |
NET OTHER ASSETS - (1.4)% | | (100,060,289) |
NET ASSETS - 100% | 7,197,690,034 |
Legend |
(a) Non-income producing |
(b) Affiliated fund that is available only to investment companies and other accounts managed by Fidelity Investments. The rate quoted is the annualized seven-day yield of the fund at period end. A complete unaudited listing of the fund's holdings as of its most recent quarter end is available upon request. |
(c) Investment made with cash collateral received from securities on loan. |
(d) Security or a portion of the security is on loan at period end. |
(e) Restricted securities - Investment in securities not registered under the Securities Act of 1933 (excluding 144A issues). At the end of the period, the value of restricted securities (excluding 144A issues) amounted to $9 or 0.0% of net assets. |
Additional information on each holding is as follows: |
Security | Acquisition Date | Acquisition Cost |
Chorum Technologies, Inc. Series E | 9/19/00 | $ 1,329,855 |
GeneProt, Inc. Series A | 7/7/00 | $ 4,472,693 |
Affiliated Central Funds |
Information regarding fiscal year to date income earned by the Fund from investments in Fidelity Central Funds is as follows: |
Fund | Income earned |
Fidelity Cash Central Fund | $ 2,410,445 |
Fidelity Securities Lending Cash Central Fund | 1,521,192 |
Total | $ 3,931,637 |
Other Affiliated Issuers |
An affiliated company is a company in which the fund has ownership of at least 5% of the voting securities. Fiscal year to date transactions with companies which are or were affiliates are as follows: |
Affiliate | Value, beginning
of period | Purchases | Sales
Proceeds | Dividend
Income | Value,
end of period |
Cross Country Healthcare, Inc. | $ - | $ 37,470,928 | $ 45,984,832 | $ - | $ - |
Fred's, Inc. Class A | 36,494,326 | 7,755,216 | 36,192,725 | 125,157 | - |
Total | $ 36,494,326 | $ 45,226,144 | $ 82,177,557 | $ 125,157 | $ - |
Other Information |
Distribution of investments by country of issue, as a percentage of total net assets, is as follows: |
United States of America | 86.8% |
Canada | 3.2% |
Switzerland | 2.4% |
Cayman Islands | 1.5% |
Japan | 1.4% |
Others (individually less than 1%) | 4.7% |
| 100.0% |
Income Tax Information |
At December 31, 2006, the fund had a capital loss carryforward of approximately $1,792,773,530 of which $1,748,065,676 and $44,707,854 will expire on December 31, 2010 and 2011, respectively. |
See accompanying notes which are an integral part of the financial statements.
VIP Growth Portfolio
VIP Growth Portfolio
Financial Statements
Statement of Assets and Liabilities
| December 31, 2006 |
| | |
Assets | | |
Investment in securities, at value
(including securities loaned of $104,278,033) -
See accompanying schedule: Unaffiliated issuers
(cost $6,240,512,310) | $ 7,189,995,827 | |
Fidelity Central Funds
(cost $107,754,496) | 107,754,496 | |
Total Investments
(cost $6,348,226,806) | | $ 7,297,750,323 |
Foreign currency held at value
(cost $5,890,303) | | 5,904,011 |
Receivable for investments sold | | 38,193,821 |
Receivable for fund shares sold | | 427,319 |
Dividends receivable | | 5,821,882 |
Interest receivable | | 371,687 |
Prepaid expenses | | 35,881 |
Other receivables | | 718,970 |
Total assets | | 7,349,223,894 |
| | |
Liabilities | | |
Payable to custodian bank | $ 55,124 | |
Payable for investments purchased | 12,189,958 | |
Payable for fund shares redeemed | 9,105,244 | |
Accrued management fee | 3,437,187 | |
Distribution fees payable | 207,285 | |
Notes payable to affiliates | 16,316,000 | |
Other affiliated payables | 756,611 | |
Other payables and accrued expenses | 1,711,955 | |
Collateral on securities loaned, at value | 107,754,496 | |
Total liabilities | | 151,533,860 |
| | |
Net Assets | | $ 7,197,690,034 |
Net Assets consist of: | | |
Paid in capital | | $ 7,800,293,380 |
Undistributed net investment income | | 43,290,513 |
Accumulated undistributed net realized gain (loss) on investments and foreign currency transactions | | (1,595,352,713) |
Net unrealized appreciation
(depreciation) on investments and assets and liabilities in foreign currencies | | 949,458,854 |
Net Assets | | $ 7,197,690,034 |
Statement of Assets and Liabilities - continued
| December 31, 2006 |
| | |
Initial Class:
Net Asset Value, offering price and redemption price per share ($5,610,628,842 ÷ 156,427,269 shares) | | $ 35.87 |
| | |
Service Class:
Net Asset Value, offering price and redemption price per share ($877,279,103 ÷ 24,557,583 shares) | | $ 35.72 |
| | |
Service Class 2:
Net Asset Value, offering price and redemption price per share ($627,753,799 ÷ 17,721,628 shares) | | $ 35.42 |
| | |
Service Class 2R:
Net Asset Value, offering price and redemption price per share ($5,062,921 ÷ 143,512 shares) | | $ 35.28 |
| | |
Investor Class:
Net Asset Value, offering price and redemption price per share ($76,965,369 ÷ 2,151,270 shares) | | $ 35.78 |
See accompanying notes which are an integral part of the financial statements.
Annual Report
VIP Growth Portfolio
Financial Statements - continued
Statement of Operations
| Year ended December 31, 2006 |
| | |
Investment Income | | |
Dividends (including $125,157 earned from other affiliated issuers) | | $ 95,580,738 |
Interest | | 116,961 |
Income from Fidelity Central Funds (including $1,521,192 from security lending) | | 3,931,637 |
Total income | | 99,629,336 |
| | |
Expenses | | |
Management fee | $ 43,960,841 | |
Transfer agent fees | 5,244,539 | |
Distribution fees | 2,701,405 | |
Accounting and security lending fees | 1,283,070 | |
Custodian fees and expenses | 279,301 | |
Independent trustees' compensation | 29,546 | |
Appreciation in deferred trustee compensation account | 5,357 | |
Audit | 99,219 | |
Legal | 170,446 | |
Interest | 111,005 | |
Miscellaneous | 1,902,600 | |
Total expenses before reductions | 55,787,329 | |
Expense reductions | (983,924) | 54,803,405 |
Net investment income (loss) | | 44,825,931 |
Realized and Unrealized Gain (Loss) Net realized gain (loss) on: | | |
Investment securities: | | |
Unaffiliated issuers | 1,212,167,627 | |
Other affiliated issuers | (1,537,271) | |
Foreign currency transactions | (160,720) | |
Total net realized gain (loss) | | 1,210,469,636 |
Change in net unrealized appreciation (depreciation) on: Investment securities | (728,384,373) | |
Assets and liabilities in foreign currencies | (17,953) | |
Total change in net unrealized appreciation (depreciation) | | (728,402,326) |
Net gain (loss) | | 482,067,310 |
Net increase (decrease) in net assets resulting from operations | | $ 526,893,241 |
Statement of Changes in Net Assets
| Year ended
December 31,
2006 | Year ended
December 31,
2005 |
Increase (Decrease) in Net Assets | | |
Operations | | |
Net investment income (loss) | $ 44,825,931 | $ 29,190,123 |
Net realized gain (loss) | 1,210,469,636 | 875,877,180 |
Change in net unrealized appreciation (depreciation) | (728,402,326) | (448,273,685) |
Net increase (decrease) in net assets resulting from operations | 526,893,241 | 456,793,618 |
Distributions to shareholders from net investment income | (29,989,011) | (43,821,998) |
Share transactions - net increase (decrease) | (2,000,205,631) | (1,648,924,682) |
Redemption fees | 1,882 | 117 |
Total increase (decrease) in net assets | (1,503,299,519) | (1,235,952,945) |
| | |
Net Assets | | |
Beginning of period | 8,700,989,553 | 9,936,942,498 |
End of period (including undistributed net investment income of $43,290,513 and undistributed net investment income of $27,754,269, respectively) | $ 7,197,690,034 | $ 8,700,989,553 |
See accompanying notes which are an integral part of the financial statements.
VIP Growth Portfolio
Financial Highlights - Initial Class
Years ended December 31, | 2006 | 2005 | 2004 | 2003 | 2002 |
Selected Per-Share Data | | | | | |
Net asset value, beginning of period | $ 33.70 | $ 32.01 | $ 31.04 | $ 23.44 | $ 33.61 |
Income from Investment Operations | | | | | |
Net investment income (loss) C | .21 | .11 | .15 F,I | .07 | .07 |
Net realized and unrealized gain (loss) | 2.09 | 1.74 | .90 | 7.60 | (10.17) |
Total from investment operations | 2.30 | 1.85 | 1.05 | 7.67 | (10.10) |
Distributions from net investment income | (.13) | (.16) | (.08) | (.07) | (.07) |
Redemption fees added to paid in capital C,H | - | - | - | - | - |
Net asset value, end of period | $ 35.87 | $ 33.70 | $ 32.01 | $ 31.04 | $ 23.44 |
Total Return A,B | 6.85% | 5.80% | 3.38% | 32.85% | (30.10)% |
Ratios to Average Net Assets D,G | | | | | |
Expenses before reductions | .68% | .67% | .68% | .67% | .67% |
Expenses net of fee waivers, if any | .68% | .67% | .68% | .67% | .67% |
Expenses net of all reductions | .67% | .63% | .65% | .64% | .61% |
Net investment income (loss) | .61% | .36% | .47% I | .28% | .25% |
Supplemental Data | | | | | |
Net assets, end of period (000 omitted) | $ 5,610,629 | $ 6,726,655 | $ 7,796,888 | $ 8,594,509 | $ 7,016,147 |
Portfolio turnover rate E | 114% | 79% | 72% | 61% | 90% |
A Total returns do not reflect charges attributable to your insurance company's separate account. Inclusion of these charges would reduce the total returns shown.
B Total returns would have been lower had certain expenses not been reduced during the periods shown.
C Calculated based on average shares outstanding during the period.
D Fees and expenses of the underlying Fidelity Central Funds are not included in the Fund's expense ratio. The Fund indirectly bears its proportionate share of the expenses of any underlying Fidelity Central Funds.
E Amount does not include the portfolio activity of any underlying Fidelity Central Funds.
F Investment income per share reflects a special dividend which amounted to $.08 per share.
G Expense ratios reflect operating expenses of the class. Expenses before reductions do not reflect amounts reimbursed by the investment adviser or reductions from brokerage service arrangements or other expense offset arrangements and do not represent the amount paid by the class during periods when reimbursements or reductions occur. Expenses net of fee waivers reflect expenses after reimbursement by the investment adviser but prior to reductions from brokerage service arrangements or other expense offset arrangements. Expenses net of all reductions represent the net expenses paid by the class.
H Amount represents less than $.01 per share.
I As a result in the change in the estimate of the return of capital components of dividend income realized in the year ended December 31, 2003, net investment income per share and the ratio of net investment income to average net assets for the year ended December 31, 2004 have been reduced by $.01 per share and .02%, respectively. The change in estimate has no impact on total net assets or total return of the class.
Financial Highlights - Service Class
Years ended December 31, | 2006 | 2005 | 2004 | 2003 | 2002 |
Selected Per-Share Data | | | | | |
Net asset value, beginning of period | $ 33.56 | $ 31.88 | $ 30.92 | $ 23.34 | $ 33.48 |
Income from Investment Operations | | | | | |
Net investment income (loss) C | .18 | .08 | .11 F,I | .05 | .04 |
Net realized and unrealized gain (loss) | 2.07 | 1.72 | .90 | 7.58 | (10.14) |
Total from investment operations | 2.25 | 1.80 | 1.01 | 7.63 | (10.10) |
Distributions from net investment income | (.09) | (.12) | (.05) | (.05) | (.04) |
Redemption fees added to paid in capital C,H | - | - | - | - | - |
Net asset value, end of period | $ 35.72 | $ 33.56 | $ 31.88 | $ 30.92 | $ 23.34 |
Total Return A,B | 6.73% | 5.67% | 3.26% | 32.78% | (30.20)% |
Ratios to Average Net Assets D,G | | | | | |
Expenses before reductions | .78% | .77% | .78% | .77% | .77% |
Expenses net of fee waivers, if any | .78% | .77% | .78% | .77% | .77% |
Expenses net of all reductions | .77% | .73% | .75% | .74% | .71% |
Net investment income (loss) | .51% | .26% | .37% I | .18% | .15% |
Supplemental Data | | | | | |
Net assets, end of period (000 omitted) | $ 877,279 | $ 1,086,172 | $ 1,326,262 | $ 1,401,298 | $ 1,058,738 |
Portfolio turnover rate E | 114% | 79% | 72% | 61% | 90% |
A Total returns do not reflect charges attributable to your insurance company's separate account. Inclusion of these charges would reduce the total returns shown.
B Total returns would have been lower had certain expenses not been reduced during the periods shown.
C Calculated based on average shares outstanding during the period.
D Fees and expenses of the underlying Fidelity Central Funds are not included in the Fund's expense ratio. The Fund indirectly bears its proportionate share of the expenses of any underlying Fidelity Central Funds.
E Amount does not include the portfolio activity of any underlying Fidelity Central Funds.
F Investment income per share reflects a special dividend which amounted to $.08 per share.
G Expense ratios reflect operating expenses of the class. Expenses before reductions do not reflect amounts reimbursed by the investment adviser or reductions from brokerage service arrangements or other expense offset arrangements and do not represent the amount paid by the class during periods when reimbursements or reductions occur. Expenses net of fee waivers reflect expenses after reimbursement by the investment adviser but prior to reductions from brokerage service arrangements or other expense offset arrangements. Expenses net of all reductions represent the net expenses paid by the class.
H Amount represents less than $.01 per share.
I As a result in the change in the estimate of the return of capital components of dividend income realized in the year ended December 31, 2003, net investment income per share and the ratio of net investment income to average net assets for the year ended December 31, 2004 have been reduced by $.01 per share and .02%, respectively. The change in estimate has no impact on total net assets or total return of the class.
See accompanying notes which are an integral part of the financial statements.
Annual Report
Financial Highlights - Service Class 2
Years ended December 31, | 2006 | 2005 | 2004 | 2003 | 2002 |
Selected Per-Share Data | | | | | |
Net asset value, beginning of period | $ 33.29 | $ 31.64 | $ 30.72 | $ 23.21 | $ 33.34 |
Income from Investment Operations | | | | | |
Net investment income (loss) C | .12 | .03 | .07 F,I | .01 | - H |
Net realized and unrealized gain (loss) | 2.07 | 1.71 | .89 | 7.53 | (10.09) |
Total from investment operations | 2.19 | 1.74 | .96 | 7.54 | (10.09) |
Distributions from net investment income | (.06) | (.09) | (.04) | (.03) | (.04) |
Redemption fees added to paid in capital C,H | - | - | - | - | - |
Net asset value, end of period | $ 35.42 | $ 33.29 | $ 31.64 | $ 30.72 | $ 23.21 |
Total Return A,B | 6.57% | 5.50% | 3.12% | 32.54% | (30.30)% |
Ratios to Average Net Assets D,G | | | | | |
Expenses before reductions | .94% | .92% | .93% | .92% | .93% |
Expenses net of fee waivers, if any | .94% | .92% | .93% | .92% | .93% |
Expenses net of all reductions | .92% | .88% | .90% | .89% | .87% |
Net investment income (loss) | .36% | .11% | .22% I | .02% | (.01)% |
Supplemental Data | | | | | |
Net assets, end of period (000 omitted) | $ 627,754 | $ 858,587 | $ 811,126 | $ 609,798 | $ 238,543 |
Portfolio turnover rate E | 114% | 79% | 72% | 61% | 90% |
A Total returns do not reflect charges attributable to your insurance company's separate account. Inclusion of these charges would reduce the total returns shown.
B Total returns would have been lower had certain expenses not been reduced during the periods shown.
C Calculated based on average shares outstanding during the period.
D Fees and expenses of the underlying Fidelity Central Funds are not included in the Fund's expense ratio. The Fund indirectly bears its proportionate share of the expenses of any underlying Fidelity Central Funds.
E Amount does not include the portfolio activity of any underlying Fidelity Central Funds.
F Investment income per share reflects a special dividend which amounted to $.08 per share.
G Expense ratios reflect operating expenses of the class. Expenses before reductions do not reflect amounts reimbursed by the investment adviser or reductions from brokerage service arrangements or other expense offset arrangements and do not represent the amount paid by the class during periods when reimbursements or reductions occur. Expenses net of fee waivers reflect expenses after reimbursement by the investment adviser but prior to reductions from brokerage service arrangements or other expense offset arrangements. Expenses net of all reductions represent the net expenses paid by the class.
H Amount represents less than $.01 per share.
I As a result in the change in the estimate of the return of capital components of dividend income realized in the year ended December 31, 2003, net investment income per share and the ratio of net investment income to average net assets for the year ended December 31, 2004 have been reduced by $.01 per share and .02%, respectively. The change in estimate has no impact on total net assets or total return of the class.
Financial Highlights - Service Class 2R
Years ended December 31, | 2006 | 2005 | 2004 | 2003 | 2002 L |
Selected Per-Share Data | | | | | |
Net asset value, beginning of period | $ 33.18 | $ 31.54 | $ 30.65 | $ 23.20 | $ 31.05 |
Income from Investment Operations | | | | | |
Net investment income (loss) C | .12 | .04 | .07 F,I | .01 | (.01) |
Net realized and unrealized gain (loss) | 2.06 | 1.70 | .88 | 7.51 | (7.84) |
Total from investment operations | 2.18 | 1.74 | .95 | 7.52 | (7.85) |
Distributions from net investment income | (.08) | (.10) | (.06) | (.07) | - |
Redemption fees added to paid in capital C,H | - | - | - | - | - |
Net asset value, end of period | $ 35.28 | $ 33.18 | $ 31.54 | $ 30.65 | $ 23.20 |
Total Return A,B, K | 6.58% | 5.52% | 3.10% | 32.54% | (25.28)% |
Ratios to Average Net Assets D,G | | | | | |
Expenses before reductions | .93% | .92% | .93% | .92% | .96% J |
Expenses net of fee waivers, if any | .93% | .92% | .93% | .92% | .96% J |
Expenses net of all reductions | .92% | .88% | .90% | .90% | .90% J |
Net investment income (loss) | .36% | .12% | .22% I | .02% | (.03)% J |
Supplemental Data | | | | | |
Net assets, end of period (000 omitted) | $ 5,063 | $ 5,409 | $ 2,667 | $ 1,369 | $ 210 |
Portfolio turnover rate E | 114% | 79% | 72% | 61% | 90% |
A Total returns do not reflect charges attributable to your insurance company's separate account. Inclusion of these charges would reduce the total returns shown.
B Total returns would have been lower had certain expenses not been reduced during the periods shown.
C Calculated based on average shares outstanding during the period.
D Fees and expenses of the underlying Fidelity Central Funds are not included in the Fund's expense ratio. The Fund indirectly bears its proportionate share of the expenses of any underlying Fidelity Central Funds.
E Amount does not include the portfolio activity of any underlying Fidelity Central Funds.
F Investment income per share reflects a special dividend which amounted to $.08 per share.
G Expense ratios reflect operating expenses of the class. Expenses before reductions do not reflect amounts reimbursed by the investment adviser or reductions from brokerage service arrangements or other expense offset arrangements and do not represent the amount paid by the class during periods when reimbursements or reductions occur. Expense ratios before reductions for start-up periods may not be representative of longer-term operating periods. Expenses net of fee waivers reflect expenses after reimbursement by the investment adviser but prior to reductions from brokerage service arrangements or other expense offset arrangements. Expenses net of all reductions represent the net expenses paid by the class.
H Amount represents less than $.01 per share.
I As a result in the change in the estimate of the return of capital components of dividend income realized in the year ended December 31, 2003, net investment income per share and the ratio of net investment income to average net assets for the year ended December 31, 2004 have been reduced by $.01 per share and .02%, respectively. The change in estimate has no impact on total net assets or total return of the class.
J Annualized
K Total returns for periods of less than one year are not annualized.
L For the period April 24, 2002 (commencement of sale of shares) to December 31, 2002.
See accompanying notes which are an integral part of the financial statements.
VIP Growth Portfolio
Financial Highlights - Investor Class
Years ended December 31, | 2006 | 2005 H |
Selected Per-Share Data | | |
Net asset value, beginning of period | $ 33.67 | $ 32.60 |
Income from Investment Operations | | |
Net investment income (loss) E | .17 | .03 |
Net realized and unrealized gain (loss) | 2.08 | 1.04 |
Total from investment operations | 2.25 | 1.07 |
Distributions from net investment income | (.14) | - |
Redemption fees added to paid in capital E,J | - | - |
Net asset value, end of period | $ 35.78 | $ 33.67 |
Total Return B,C,D | 6.72% | 3.28% |
Ratios to Average Net Assets F,I | | |
Expenses before reductions | .81% | .83% A |
Expenses net of fee waivers, if any | .81% | .83% A |
Expenses net of all reductions | .80% | .79% A |
Net investment income (loss) | .49% | .23% A |
Supplemental Data | | |
Net assets, end of period (000 omitted) | $ 76,965 | $ 24,166 |
Portfolio turnover rate G | 114% | 79% |
A Annualized
B Total returns for periods of less than one year are not annualized.
C Total returns do not reflect charges attributable to your insurance company's separate account. Inclusion of these charges would reduce the total returns shown.
D Total returns would have been lower had certain expenses not been reduced during the periods shown.
E Calculated based on average shares outstanding during the period.
F Fees and expenses of the underlying Fidelity Central Funds are not included in the Fund's expense ratio. The Fund indirectly bears its proportionate share of the expenses of any underlying Fidelity Central Funds.
G Amount does not include the portfolio activity of any underlying Fidelity Central Funds.
H For the period July 21, 2005 (commencement of sale of shares) to December 31, 2005.
I Expense ratios reflect operating expenses of the class. Expenses before reductions do not reflect amounts reimbursed by the investment adviser or reductions from brokerage service arrangements or other expense offset arrangements and do not represent the amount paid by the class during periods when reimbursements or reductions occur. Expense ratios before reductions for start-up periods may not be representative of longer-term operating periods. Expenses net of fee waivers reflect expenses after reimbursement by the investment adviser but prior to reductions from brokerage service arrangements or other expense offset arrangements. Expenses net of all reductions represent the net expenses paid by the class.
J Amount represents less than $.01 per share.
See accompanying notes which are an integral part of the financial statements.
Annual Report
Notes to Financial Statements
For the period ended December 31, 2006
1. Significant Accounting Policies.
VIP Growth Portfolio (the Fund) is a fund of Variable Insurance Products Fund (the trust) and is authorized to issue an unlimited number of shares. The trust is registered under the Investment Company Act of 1940, as amended (the 1940 Act), as an open-end management investment company organized as a Massachusetts business trust. Shares of the Fund may only be purchased by insurance companies for the purpose of funding variable annuity or variable life insurance contracts. The Fund offers the following classes of shares: Initial Class shares, Service Class shares, Service Class 2 shares, Service Class R shares, and Investor Class shares. All classes have equal rights and voting privileges, except for matters affecting a single class. Investment income, realized and unrealized capital gains and losses, the common expenses of the Fund, and certain fund-level expense reductions, if any, are allocated on a pro rata basis to each class based on the relative net assets of each class to the total net assets of the Fund. Each class differs with respect to transfer agent and distribution and service plan fees incurred. Certain expense reductions also differ by class.
The Fund may invest in Fidelity Central Funds which are open-end investment companies available to investment companies and other accounts managed by Fidelity Management & Research Company (FMR) and its affiliates. The financial statements have been prepared in conformity with accounting principles generally accepted in the United States of America, which require management to make certain estimates and assumptions at the date of the financial statements. The following summarizes the significant accounting policies of the Fund, which are also consistently followed by the Fidelity Central Funds:
Security Valuation. Investments are valued and net asset value (NAV) per share is calculated (NAV calculation) as of the close of business of the New York Stock Exchange (NYSE), normally 4:00 p.m. Eastern time. Wherever possible, the Fund uses independent pricing services approved by the Board of Trustees to value its investments.
Equity securities, including restricted securities, for which market quotations are readily available, are valued at the last reported sale price or official closing price as reported by an independent pricing service on the primary market or exchange on which they are traded. In the event there were no sales during the day or closing prices are not available, securities are valued at the last quoted bid price. Debt securities, including restricted securities, for which quotations are readily available, are valued by independent pricing services or by dealers who make markets in such securities. Pricing services consider yield or price of bonds of comparable quality, coupon, maturity and type as well as dealer supplied prices. Investments in open-end mutual funds, including the Fidelity Central Funds, are valued at their closing net asset value each business day. Short-term securities with remaining maturities of sixty days or less for which quotations are not readily available are valued at amortized cost, which approximates value.
When current market prices or quotations are not readily available or do not accurately reflect fair value, valuations may be determined in accordance with procedures adopted by the Board of Trustees. For example, when developments occur between the close of a market and the close of the NYSE that may materially affect the value of some or all of the securities, or when trading in a security is halted, those securities may be fair valued. Factors used in the determination of fair value may include monitoring news to identify significant market or security specific events such as changes in the value of U.S. securities markets, reviewing developments in foreign markets and evaluating the performance of ADRs, futures contracts and exchange-traded funds. Because the Fund's utilization of fair value pricing depends on market activity, the frequency with which fair value pricing is used can not be predicted and may be utilized to a significant extent. The value of securities used for NAV calculation under fair value pricing may differ from published prices for the same securities.
Foreign Currency. The Fund uses foreign currency contracts to facilitate transactions in foreign-denominated securities. Losses from these transactions may arise from changes in the value of the foreign currency or if the counterparties do not perform under the contracts' terms.
Foreign-denominated assets, including investment securities, and liabilities are translated into U.S. dollars at the exchange rate at period end. Purchases and sales of investment securities, income and dividends received and expenses denominated in foreign currencies are translated into U.S. dollars at the exchange rate in effect on the transaction date.
The effects of exchange rate fluctuations on investments are included with the net realized and unrealized gain (loss) on investment securities. Other foreign currency transactions resulting in realized and unrealized gain (loss) are disclosed separately.
Investment Transactions and Income. Security transactions, including the Fund's investment activity in the Fidelity Central Funds, are accounted for as of trade date. Gains and losses on securities sold are determined on the basis of identified cost and may include proceeds received from litigation. Dividend income is recorded on the ex-dividend date, except for certain dividends from foreign securities where the ex-dividend date may have passed, which are recorded as soon as the Fund is informed of the ex-dividend date. Non-cash dividends included in dividend income, if any, are recorded at the fair market value of the securities received. Distributions received on securities that represent a return of capital or capital gain are recorded as a reduction of cost of investments and/or as a realized gain. The Fund estimates the components of distributions received that may be considered return of capital distributions or capital gain distributions. Interest income and income distributions from the Fidelity Central Funds are accrued as earned, with any income distributions receivable as of period end included in Interest Receivable on the Statement of Assets and Liabilities. Interest income includes coupon interest and amortization of premium and accretion of discount on debt securities. Investment income is recorded net of foreign taxes withheld where recovery of such taxes is uncertain.
VIP Growth Portfolio
1. Significant Accounting Policies - continued
Expenses. Most expenses of the trust can be directly attributed to a fund. Expenses which cannot be directly attributed are apportioned among each Fund in the trust. Expense estimates are accrued in the period to which they relate and adjustments are made when actual amounts are known.
Deferred Trustee Compensation. Under a Deferred Compensation Plan (the Plan), Independent Trustees must defer receipt of a portion of, and may elect to defer receipt of an additional portion of, their annual compensation. Deferred amounts are invested in a cross-section of Fidelity funds, are marked-to-market and remain in the Fund until distributed in accordance with the Plan. The investment of deferred amounts and the offsetting payable to the Trustees are included in the accompanying Statement of Assets and Liabilities.
Income Tax Information and Distributions to Shareholders. Each year, the Fund intends to qualify as a regulated investment company by distributing all of its taxable income and realized gains under Subchapter M of the Internal Revenue Code. As a result, no provision for income taxes is required in the accompanying financial statements. Foreign taxes are provided for based on the Fund's understanding of the tax rules and rates that exist in the foreign markets in which it invests.
Distributions are recorded on the ex-dividend date. Income dividends and capital gain distributions are declared separately for each class. Income and capital gain distributions are determined in accordance with income tax regulations, which may differ from generally accepted accounting principles.
Capital accounts within the financial statements are adjusted for permanent book-tax differences. These adjustments have no impact on net assets or the results of operations. Temporary book-tax differences will reverse in a subsequent period.
Book-tax differences are primarily due to foreign currency transactions, redemptions in kind, partnerships, deferred trustees compensation and losses deferred due to wash sales.
The tax-basis components of distributable earnings and the federal tax cost as of period end were as follows:
Unrealized appreciation | $ 1,114,618,421 | |
Unrealized depreciation | (168,491,285) | |
Net unrealized appreciation (depreciation) | 946,127,136 | |
Undistributed ordinary income | 43,330,042 | |
Capital loss carryforward | (1,792,773,530) | |
| | |
Cost for federal income tax purposes | $ 6,351,623,187 | |
The tax character of distributions paid was as follows:
| December 31, 2006 | December 31, 2005 |
Ordinary Income | $ 29,989,011 | $ 43,821,998 |
Trading (Redemption) Fees. Service Class 2R shares held less than 60 days are subject to a redemption fee equal to 1% of the proceeds of the redeemed shares. All redemption fees, including any estimated redemption fees paid by FMR, are retained by the Fund and accounted for as an addition to paid in capital.
New Accounting Pronouncements. In July 2006, Financial Accounting Standards Board Interpretation No. 48, Accounting for Uncertainty in Income Taxes - an interpretation of FASB Statement 109 (FIN 48), was issued and is effective on the last business day of the semiannual reporting period for fiscal years beginning after December 15, 2006. FIN 48 sets forth a threshold for financial statement recognition, measurement and disclosure of a tax position taken or expected to be taken on a tax return. Management is currently evaluating the impact, if any, the adoption of FIN 48 will have on the Fund's net assets, results of operations and financial statement disclosures.
In addition, in September 2006, Statement of Financial Accounting Standards No. 157, Fair Value Measurements (SFAS 157), was issued and is effective for fiscal years beginning after November 15, 2007. SFAS 157 defines fair value, establishes a framework for measuring fair value and expands disclosures about fair value measurements. Management is currently evaluating the impact the adoption of SFAS 157 will have on the Fund's financial statement disclosures.
2. Operating Policies.
Repurchase Agreements. FMR has received an Exemptive Order from the Securities and Exchange Commission (the SEC) which permits the Fund and other affiliated entities of FMR to transfer uninvested cash balances into joint trading accounts which are then invested in repurchase agreements. The Fund may also invest directly with institutions in repurchase agreements. Repurchase agreements are collateralized by government or non-government securities. Upon settlement date, collateral is held in segregated accounts with custodian banks and may be obtained in the event of a
Annual Report
Notes to Financial Statements - continued
2. Operating Policies - continued
Repurchase Agreements - continued
default of the counterparty. The Fund monitors, on a daily basis, the value of the collateral to ensure it is at least equal to the principal amount of the repurchase agreement (including accrued interest). In the event of a default by the counterparty, realization of the collateral proceeds could be delayed, during which time the value of the collateral may decline.
Restricted Securities. The Fund may invest in securities that are subject to legal or contractual restrictions on resale. These securities generally may be resold in transactions exempt from registration or to the public if the securities are registered. Disposal of these securities may involve time-consuming negotiations and expense, and prompt sale at an acceptable price may be difficult. Information regarding restricted securities is included at the end of the Fund's Schedule of Investments.
3. Purchases and Sales of Investments.
Purchases and sales of securities, other than short-term securities, and in-kind transactions aggregated $8,789,613,878 and $10,219,762,722, respectively. Securities delivered on an in-kind basis aggregated $522,515,707. Realized gain (loss) of $200,959,374 on securities delivered on an in-kind basis is included in the accompanying Statement of Operations as realized gain or loss on investment securities and is not taxable to the fund.
4. Fees and Other Transactions with Affiliates.
Management Fee. FMR and its affiliates provide the Fund with investment management related services for which the Fund pays a monthly management fee. The management fee is the sum of an individual fund fee rate that is based on an annual rate of .30% of the Fund's average net assets and a group fee rate that averaged .27% during the period. The group fee rate is based upon the average net assets of all the mutual funds advised by FMR. The group fee rate decreases as assets under management increase and increases as assets under management decrease. For the period, the total annual management fee rate was .57% of the Fund's average net assets.
Distribution and Service Plan. In accordance with Rule 12b-1 of the 1940 Act, the Fund has adopted separate 12b-1 Plans for each Service Class of shares. Each Service Class pays Fidelity Distributors Corporation (FDC), an affiliate of FMR, a service fee. For the period, the service fee is based on an annual rate of .10% of Service Class' average net assets and .25% of Service Class 2's and Service Class 2R's average net assets.
For the period, each class paid FDC the following amounts, all of which were re-allowed to insurance companies for the distribution of shares and providing shareholder support services:
Service Class | $ 958,576 | |
Service Class 2 | 1,728,584 | |
Service Class 2 R | 14,245 | |
| $ 2,701,405 | |
Transfer Agent Fees. Fidelity Investments Institutional Operations Company, Inc. (FIIOC), an affiliate of FMR, is the fund's transfer, dividend disbursing, and shareholder servicing agent. FIIOC receives an asset-based fee with respect to each class. Each class with the exception of Investor Class pays a transfer agent fee, excluding out of pocket expenses, equal to an annual rate of .07% of their month end net assets. Investor Class pays a monthly asset-based transfer agent fee of .18% of its month end net assets. The total transfer agent fees paid by each class to FIIOC, including out of pocket expenses, were as follows:
Initial Class | $ 4,028,550 | |
Service Class | 638,566 | |
Service Class 2 | 472,805 | |
Service Class 2R | 3,806 | |
Investor Class | 100,812 | |
| $ 5,244,539 | |
Accounting and Security Lending Fees. Fidelity Service Company, Inc. (FSC), an affiliate of FMR, maintains the Fund's accounting records. The accounting fee is based on the level of average net assets for the month. Under a separate contract, FSC administers the security lending program. The security lending fee is based on the number and duration of lending transactions.
Investments in Fidelity Central Funds. The Fund may invest in Fidelity Central Funds. The Fund's Schedule of Investments lists each of the Fidelity Central Funds as an investment of the Fund but does not include the underlying holdings of each Fidelity Central Fund. As an Investing Fund, the Fund indirectly bears its proportionate share of the expenses of the underlying Fidelity Central Funds. A complete unaudited list of holdings for each Fidelity Central Fund is available upon request. In addition, the financial statements of the Fidelity Central Funds, which are not covered by the Fund's Report of Independent Registered Public Accounting Firm, are available on the EDGAR Database on the SEC's web site, www.sec.gov, or upon request.
VIP Growth Portfolio
4. Fees and Other Transactions with Affiliates - continued
Investments in Fidelity Central Funds - continued
The Money Market Central Funds seek preservation of capital and current income and are managed by Fidelity Investments Money Management, Inc. (FIMM), an affiliate of FMR.
Brokerage Commissions. The Fund placed a portion of its portfolio transactions with brokerage firms which are affiliates of the investment adviser. The commissions paid to these affiliated firms were $57,327 for the period.
Interfund Lending Program. Pursuant to an Exemptive Order issued by the SEC, the Fund, along with other registered investment companies having management contracts with FMR, may participate in an interfund lending program. This program provides an alternative credit facility allowing the funds to borrow from, or lend money to, other participating affiliated funds. The Fund's activity in this program during the period for which loans were outstanding was as follows:
Borrower or Lender | Average Daily
Loan Balance | Weighted Average Interest Rate | Interest
Expense |
Borrower | $ 32,825,826 | 5.29% | $ 111,005 |
5. Committed Line of Credit.
The Fund participates with other funds managed by FMR in a $4.2 billion credit facility (the "line of credit") to be utilized for temporary or emergency purposes to fund shareholder redemptions or for other short-term liquidity purposes. The Fund has agreed to pay commitment fees on its pro rata portion of the line of credit, which amounted to $22,679 and is reflected in Miscellaneous Expense on the Statement of Operations. During the period, there were no borrowings on this line of credit.
6. Security Lending.
The Fund lends portfolio securities from time to time in order to earn additional income. On the settlement date of the loan, the Fund receives collateral (in the form of U.S. Treasury obligations, letters of credit and/or cash) against the loaned securities and maintains collateral in an amount not less than 100% of the market value of the loaned securities during the period of the loan. The market value of the loaned securities is determined at the close of business of the Fund and any additional required collateral is delivered to the Fund on the next business day. If the borrower defaults on its obligation to return the securities loaned because of insolvency or other reasons, a fund could experience delays and costs in recovering the securities loaned or in gaining access to the collateral. Any cash collateral received is invested in the Fidelity Securities Lending Cash Central Fund. The value of loaned securities and cash collateral at period end are disclosed on the Fund's Statement of Assets and Liabilities. Security lending income represents the income earned on investing cash collateral, less fees and expenses associated with the loan, plus any premium payments that may be received on the loan of certain types of securities. Security lending income is presented in the Statement of Operations as a component of income from Fidelity Central Funds.
7. Expense Reductions.
Many of the brokers with whom FMR places trades on behalf of the Fund provided services to the Fund in addition to trade execution. These services included payments of certain expenses on behalf of the Fund totaling $845,352 for the period. In addition, through arrangements with the fund's custodian, credits realized as a result of uninvested cash balances were used to reduce the Fund's expenses. During the period, these credits reduced the Fund's custody expenses by $15,348.
8. Other.
The Fund's organizational documents provide former and current trustees and officers with a limited indemnification against liabilities arising in connection with the performance of their duties to the Fund. In the normal course of business, the Fund may also enter into contracts that provide general indemnifications. The Fund's maximum exposure under these arrangements is unknown as this would be dependent on future claims that may be made against the Fund. The risk of material loss from such claims is considered remote.
At the end of the period, FMR or its affiliates were the owners of record of 12% of the total outstanding shares of the fund and two otherwise unaffiliated shareholders were the owners of record of 35% of the total outstanding shares of the fund.
The United States Securities and Exchange Commission ("SEC") is conducting an investigation of FMR (covering the years 2002 to 2004) arising from gifts, gratuities and business entertainment provided by certain brokers to certain individuals who were employed on FMR's domestic equity trading desk during that period. FMR is in discussions with the SEC staff regarding the possible resolution of the matter, but as of period-end no final resolution has been reached.
Annual Report
Notes to Financial Statements - continued
8. Other - continued
In December 2006, the Independent Trustees completed their own investigation of the matter with the assistance of independent counsel. The Independent Trustees and FMR agree that, despite the absence of proof that the Fidelity mutual funds experienced diminished execution quality as a result of the improper receipt of gifts and business entertainment, the conduct at issue was serious and is worthy of redress. Accordingly, the Independent Trustees have requested and FMR has agreed to pay $42 million to Fidelity mutual funds, plus interest to be determined at the time that payment is made. A method of allocating this payment among the funds has not yet been determined. The total payment to the Fund is not anticipated to have a material impact on the Fund's net assets. In addition, FMR reimbursed related legal expenses which are recorded in the accompanying Statement of Operations as an expense reduction.
9. Distributions to Shareholders.
Distributions to shareholders of each class were as follows:
| Years ended December 31, |
| 2006 | 2005A |
From net investment income | | |
Initial Class | $ 25,469,432 | $ 36,754,599 |
Service Class | 2,969,186 | 4,880,141 |
Service Class 2 | 1,415,183 | 2,179,216 |
Service Class 2R | 11,992 | 8,042 |
Investor Class | 123,218 | - |
Total | $ 29,989,011 | $ 43,821,998 |
A Distributions for Investor Class are for the period July 21, 2005 (commencement of sale of shares) to December 31, 2005.
10. Share Transactions.
Transactions for each class of shares were as follows:
| Shares
Years ended December 31, | Dollars
Years ended December 31, |
| 2006 | 2005A | 2006 | 2005A |
Initial Class | | | | |
Shares sold | 3,610,816 | 5,020,349 | $ 124,622,618 | $ 159,510,141 |
Reinvestment of distributions | 750,646 | 1,168,668 | 25,469,432 | 36,754,598 |
Shares redeemed | (47,564,114) | (50,113,556) | (1,648,287,637) | (1,589,683,859) |
Net increase (decrease) | (43,202,652) | (43,924,539) | $ (1,498,195,587) | $ (1,393,419,120) |
Service Class | | | | |
Shares sold | 904,973 | 1,583,330 | $ 31,365,157 | $ 49,875,519 |
Reinvestment of distributions | 87,794 | 155,666 | 2,969,186 | 4,880,142 |
Shares redeemed | (8,801,822) | (10,974,628) | (303,894,497) | (341,802,898) |
Net increase (decrease) | (7,809,055) | (9,235,632) | $ (269,560,154) | $ (287,047,237) |
Service Class 2 | | | | |
Shares sold | 3,844,723 | 4,801,863 | $ 131,119,141 | $ 150,862,050 |
Reinvestment of distributions | 42,144 | 69,981 | 1,415,183 | 2,179,216 |
Shares redeemed | (11,956,728) | (4,718,596) | (413,608,979) | (147,633,784) |
Net increase (decrease) | (8,069,861) | 153,248 | $ (281,074,655) | $ 5,407,482 |
Service Class 2R | | | | |
Shares sold | 109,377 | 97,483 | $ 3,727,115 | $ 3,094,057 |
Reinvestment of distributions | 358 | 259 | 11,992 | 8,042 |
Shares redeemed | (129,250) | (19,254) | (4,434,759) | (605,298) |
Net increase (decrease) | (19,515) | 78,488 | $ (695,652) | $ 2,496,801 |
Investor Class | | | | |
Shares sold | 1,635,275 | 720,556 | $ 56,255,612 | $ 23,727,387 |
Reinvestment of distributions | 3,637 | - | 123,218 | - |
Shares redeemed | (205,451) | (2,747) | (7,058,413) | (89,995) |
Net increase (decrease) | 1,433,461 | 717,809 | $ 49,320,417 | $ 23,637,392 |
A Share transactions for Investor Class are for the period July 21, 2005 (commencement of sale of shares) to December 31, 2005.
VIP Growth Portfolio
Report of Independent Registered Public Accounting Firm
To the Trustees of Variable Insurance Products Fund and the Shareholders of VIP Growth Portfolio:
In our opinion, the accompanying statement of assets and liabilities, including the schedule of investments, and the related statements of operations and of changes in net assets and the financial highlights present fairly, in all material respects, the financial position of VIP Growth Portfolio (a fund of Variable Insurance Products Fund) at December 31, 2006, the results of its operations for the year then ended, the changes in its net assets for each of the two years in the period then ended and the financial highlights for each of the periods indicated, in conformity with accounting principles generally accepted in the United States of America. These financial statements and financial highlights (hereafter referred to as "financial statements") are the responsibility of the VIP Growth Portfolio's management; our responsibility is to express an opinion on these financial statements based on our audits. We conducted our audits of these financial statements in accordance with the standards of the Public Company Accounting Oversight Board (United States). Those standards require that we plan and perform the audit to obtain reasonable assurance about whether the financial statements are free of material misstatement. An audit includes examining, on a test basis, evidence supporting the amounts and disclosures in the financial statements, assessing the accounting principles used and significant estimates made by management, and evaluating the overall financial statement presentation. We believe that our audits, which included confirmation of securities at December 31, 2006 by correspondence with the custodian and brokers, provide a reasonable basis for our opinion.
/s/ PricewaterhouseCoopers LLP
PricewaterhouseCoopers LLP
Boston, Massachusetts
February 12, 2007
Annual Report
Trustees and Officers
The Trustees, Member of the Advisory Board, and executive officers of the trust and fund, as applicable, are listed below. The Board of Trustees governs the fund and is responsible for protecting the interests of shareholders. The Trustees are experienced executives who meet periodically throughout the year to oversee the fund's activities, review contractual arrangements with companies that provide services to the fund, and review the fund's performance. Each of the Trustees oversees 348 funds advised by FMR or an affiliate.
The Trustees hold office without limit in time except that (a) any Trustee may resign; (b) any Trustee may be removed by written instrument, signed by at least two-thirds of the number of Trustees prior to such removal; (c) any Trustee who requests to be retired or who has become incapacitated by illness or injury may be retired by written instrument signed by a majority of the other Trustees; and (d) any Trustee may be removed at any special meeting of shareholders by a two-thirds vote of the outstanding voting securities of the trust. Each Trustee who is not an interested person (as defined in the 1940 Act) (Independent Trustee), shall retire not later than the last day of the calendar year in which his or her 72nd birthday occurs. The Independent Trustees may waive this mandatory retirement age policy with respect to individual Trustees. The executive officers and Advisory Board Member hold office without limit in time, except that any officer and Advisory Board Member may resign or may be removed by a vote of a majority of the Trustees at any regular meeting or any special meeting of the Trustees. Except as indicated, each individual has held the office shown or other offices in the same company for the past five years.
The fund's Statement of Additional Information (SAI) includes more information about the Trustees. To request a free copy, call Fidelity at 1-877-208-0098.
Interested Trustees*:
Correspondence intended for each Trustee who is an interested person may be sent to Fidelity Investments, 82 Devonshire Street, Boston, Massachusetts 02109.
Name, Age; Principal Occupation |
Edward C. Johnson 3d (76) |
| Year of Election or Appointment: 1981 Mr. Johnson is Chairman of the Board of Trustees. Mr. Johnson serves as President (2006-present), Chief Executive Officer, Chairman, and a Director of FMR Corp.; Chairman and a Director of FMR; Chairman and a Director of Fidelity Research & Analysis Company (FRAC); Chairman and a Director of Fidelity Investments Money Management, Inc.; and Chairman (2001-present) and a Director of FMR Co., Inc. In addition, Mr. Johnson serves as Chairman and Director of Fidelity International Limited (FIL). |
Robert L. Reynolds (54) |
| Year of Election or Appointment: 2003 Mr. Reynolds is President and a Director of FMR (2005-present), Fidelity Investments Money Management, Inc. (2005-present), and FMR Co., Inc. (2005-present). Mr. Reynolds also serves as Vice Chairman (2006-present), a Director (2003-present), and Chief Operating Officer of FMR Corp. and a Director of Strategic Advisers, Inc. (2005-present). He also serves on the Board at Fidelity Investments Canada, Ltd. |
* Trustees have been determined to be "Interested Trustees" by virtue of, among other things, their affiliation with the trust or various entities under common control with FMR.
Independent Trustees:
Correspondence intended for each Independent Trustee (that is, the Trustees other than the Interested Trustees) may be sent to Fidelity Investments, P.O. Box 55235, Boston, Massachusetts 02205-5235.
Name, Age; Principal Occupation |
Dennis J. Dirks (58) |
| Year of Election or Appointment: 2005 Prior to his retirement in May 2003, Mr. Dirks was Chief Operating Officer and a member of the Board of The Depository Trust & Clearing Corporation (DTCC) (1999-2003). He also served as President, Chief Operating Officer, and Board member of The Depository Trust Company (DTC) (1999-2003) and President and Board member of the National Securities Clearing Corporation (NSCC) (1999-2003). In addition, Mr. Dirks served as Chief Executive Officer and Board member of the Government Securities Clearing Corporation (2001-2003) and Chief Executive Officer and Board member of the Mortgage-Backed Securities Clearing Corporation (2001-2003). Mr. Dirks also serves as a Trustee and a member of the Finance Committee of Manhattan College (2005-present) and a Trustee and a member of the Finance Committee of AHRC of Nassau County (2006-present). |
Albert R. Gamper, Jr. (64) |
| Year of Election or Appointment: 2006 Prior to his retirement in December 2004, Mr. Gamper served as Chairman of the Board of CIT Group Inc. (commercial finance). During his tenure with CIT Group Inc. Mr. Gamper served in numerous senior management positions, including Chairman (1987-1989; 1999-2001; 2002-2004), Chief Executive Officer (1987-2004), and President (1989-2002). He currently serves as a member of the Board of Directors of Public Service Enterprise Group (utilities, 2001-present), Chairman of the Board of Governors, Rutgers University (2004-present), and Chairman of the Board of Saint Barnabas Health Care System. |
George H. Heilmeier (70) |
| Year of Election or Appointment: 2004 Dr. Heilmeier is Chairman Emeritus of Telcordia Technologies (communication software and systems), where prior to his retirement, he served as company Chairman and Chief Executive Officer. He currently serves on the Boards of Directors of The Mitre Corporation (systems engineering and information technology support for the government), and HRL Laboratories (private research and development, 2004-present). He is Chairman of the General Motors Science & Technology Advisory Board and a Life Fellow of the Institute of Electrical and Electronics Engineers (IEEE). Dr. Heilmeier is a member of the Defense Science Board and the National Security Agency Advisory Board. He is also a member of the National Academy of Engineering, the American Academy of Arts and Sciences, and the Board of Overseers of the School of Engineering and Applied Science of the University of Pennsylvania. Previously, Dr. Heilmeier served as a Director of TRW Inc. (automotive, space, defense, and information technology, 1992-2002), Compaq (1994-2002), Automatic Data Processing, Inc. (ADP) (technology-based business outsourcing, 1995-2002), INET Technologies Inc. (telecommunications network surveillance, 2001-2004), and Teletech Holdings (customer management services). He is the recipient of the 2005 Kyoto Prize in Advanced Technology for his invention of the liquid crystal display, and a member of the Consumer Electronics Hall of Fame. |
James H. Keyes (66) |
| Year of Election or Appointment: 2007 Prior to his retirement in 2003, Mr. Keyes was Chairman, President, and Chief Executive Officer of Johnson Controls, Inc. (automotive supplier, 1993-2003). He currently serves as a member of the boards of LSI Logic Corporation (semiconductor technologies), Navistar International Corporation (manufacture and sale of trucks, buses, and diesel engines, 2002-present), and Pitney Bowes, Inc. (integrated mail, messaging, and document management solutions). |
Marie L. Knowles (60) |
| Year of Election or Appointment: 2001 Prior to Ms. Knowles' retirement in June 2000, she served as Executive Vice President and Chief Financial Officer of Atlantic Richfield Company (ARCO) (diversified energy, 1996-2000). From 1993 to 1996, she was a Senior Vice President of ARCO and President of ARCO Transportation Company. She served as a Director of ARCO from 1996 to 1998. She currently serves as a Director of Phelps Dodge Corporation (copper mining and manufacturing) and McKesson Corporation (healthcare service, 2002-present). Ms. Knowles is a Trustee of the Brookings Institution and the Catalina Island Conservancy and also serves as a member of the Advisory Board for the School of Engineering of the University of Southern California. |
Ned C. Lautenbach (62) |
| Year of Election or Appointment: 2000 Mr. Lautenbach is Chairman of the Independent Trustees (2006-present). Mr. Lautenbach has been a partner of Clayton, Dubilier & Rice, Inc. (private equity investment firm) since September 1998. Previously, Mr. Lautenbach was with the International Business Machines Corporation (IBM) from 1968 until his retirement in 1998. Mr. Lautenbach serves as a Director of Sony Corporation (2006-present) and Eaton Corporation (diversified industrial) as well as the Philharmonic Center for the Arts in Naples, Florida. He also is a member of the Board of Trustees of Fairfield University (2005-present), as well as a member of the Council on Foreign Relations. |
Cornelia M. Small (62) |
| Year of Election or Appointment: 2005 Ms. Small is a member (2000-present) and Chairperson (2002-present) of the Investment Committee, and a member (2002- present) of the Board of Trustees of Smith College. Previously, she served as Chief Investment Officer (1999-2000), Director of Global Equity Investments (1996-1999), and a member of the Board of Directors of Scudder, Stevens & Clark (1990-1997) and Scudder Kemper Investments (1997-1999). In addition, Ms. Small served as Co-Chair (2000-2003) of the Annual Fund for the Fletcher School of Law and Diplomacy. |
William S. Stavropoulos (67) |
| Year of Election or Appointment: 2001 Mr. Stavropoulos is Chairman Emeritus of the Board of Directors of The Dow Chemical Company. Since joining The Dow Chemical Company in 1967, Mr. Stavropoulos served in numerous senior management positions, including President (1993-2000; 2002-2003), CEO (1995-2000; 2002-2004), and Chairman of the Executive Committee (2000-2004). Currently, he is a Director of NCR Corporation (data warehousing and technology solutions), BellSouth Corporation (telecommunications), Chemical Financial Corporation, Maersk Inc. (industrial conglomerate, 2002-present), and Metalmark Capital (private equity investment firm, 2005-present). He also serves as a member of the Board of Trustees of the American Enterprise Institute for Public Policy Research. In addition, Mr. Stavropoulos is a member of The Business Council, J.P. Morgan International Council and the University of Notre Dame Advisory Council for the College of Science. |
Kenneth L. Wolfe (67) |
| Year of Election or Appointment: 2005 Prior to his retirement in 2001, Mr. Wolfe was Chairman and Chief Executive Officer of Hershey Foods Corporation (1993-2001). He currently serves as a member of the boards of Adelphia Communications Corporation (2003-present), Bausch & Lomb, Inc., and Revlon Inc. (2004-present). |
Advisory Board Member and Executive Officers:
Correspondence intended for each executive officer and Mr. Lynch may be sent to Fidelity Investments, 82 Devonshire Street, Boston, Massachusetts 02109.
Name, Age; Principal Occupation |
Peter S. Lynch (62) |
| Year of Election or Appointment: 2003 Member of the Advisory Board of Variable Insurance Products Fund. Mr. Lynch is Vice Chairman and a Director of FMR, and Vice Chairman (2001-present) and a Director of FMR Co., Inc. Previously, Mr. Lynch served as a Trustee of the Fidelity funds (1990-2003). In addition, he serves as a Trustee of Boston College and as the Chairman of the Inner-City Scholarship Fund. |
Kimberley H. Monasterio (43) |
| Year of Election or Appointment: 2007 President and Treasurer of VIP Growth. Ms. Monasterio also serves as President and Treasurer of other Fidelity funds (2007- present) and is an employee of FMR (2004-present). Previously, Ms. Monasterio served as Deputy Treasurer of the Fidelity funds (2004-2006). Before joining Fidelity Investments, Ms. Monasterio served as Treasurer (2000-2004) and Chief Financial Officer (2002-2004) of the Franklin Templeton Funds and Senior Vice President of Franklin Templeton Services, LLC (2000-2004). |
Dwight D. Churchill (53) |
| Year of Election or Appointment: 2005 Vice President of VIP Growth. Mr. Churchill also serves as Vice President of certain Equity Funds (2005-present). Mr. Churchill is Executive Vice President of FMR (2005-present) and FMR Co., Inc. (2005-present). Previously, Mr. Churchill served as Senior Vice President of Fidelity Investments Money Management, Inc. (2005-2006), Head of Fidelity's Fixed-Income Division (2000-2005), Vice President of Fidelity's Money Market Funds (2000-2005), Vice President of Fidelity's Bond Funds, and Senior Vice President of FMR. |
Bruce T. Herring (41) |
| Year of Election or Appointment: 2006 Vice President of VIP Growth. Mr. Herring also serves as Vice President of certain Equity Funds (2006-present). Mr. Herring is Senior Vice President of FMR (2006-present) and Vice President of FMR Co., Inc. (2001-present). Previously, Mr. Herring served as a portfolio manager for Fidelity U.S. Equity Funds (2001-2005). |
Jason Weiner (37) |
| Year of Election or Appointment: 2006 Vice President of VIP Growth. Mr. Weiner also serves as Vice President of other funds advised by FMR. Prior to assuming his current responsibilities, Mr. Weiner worked as a research analyst and portfolio manager. Mr. Weiner also serves as Vice President of FMR (1999) and FMR Co., Inc. (2001). |
Eric D. Roiter (58) |
| Year of Election or Appointment: 1998 Secretary of VIP Growth. He also serves as Secretary of other Fidelity funds; Vice President, General Counsel, and Secretary of FMR Co., Inc. (2001-present) and FMR; Assistant Secretary of Fidelity Management & Research (U.K.) Inc. (2001-present), Fidelity Research & Analysis Company (2001-present), and Fidelity Investments Money Management, Inc. (2001-present). Mr. Roiter is an Adjunct Member, Faculty of Law, at Boston College Law School (2003-present). Previously, Mr. Roiter served as Vice President and Secretary of Fidelity Distributors Corporation (FDC) (1998-2005). |
Stuart Fross (47) |
| Year of Election or Appointment: 2003 Assistant Secretary of VIP Growth. Mr. Fross also serves as Assistant Secretary of other Fidelity funds (2003-present), Vice President and Secretary of FDC (2005-present), and is an employee of FMR. |
R. Stephen Ganis (40) |
| Year of Election or Appointment: 2006 Anti-Money Laundering (AML) officer of VIP Growth. Mr. Ganis also serves as AML officer of other Fidelity funds (2006-present) and FMR Corp. (2003-present). Before joining Fidelity Investments, Mr. Ganis practiced law at Goodwin Procter, LLP (2000-2002). |
Joseph B. Hollis (58) |
| Year of Election or Appointment: 2006 Chief Financial Officer of VIP Growth. Mr. Hollis also serves as Chief Financial Officer of other Fidelity funds. Mr. Hollis is President of Fidelity Pricing and Cash Management Services (FPCMS) (2005-present). Mr. Hollis also serves as President and Director of Fidelity Service Company, Inc. (2006-present). Previously, Mr. Hollis served as Senior Vice President of Cash Management Services (1999-2002) and Investment Management Operations (2002-2005). |
Kenneth A. Rathgeber (59) |
| Year of Election or Appointment: 2004 Chief Compliance Officer of VIP Growth. Mr. Rathgeber also serves as Chief Compliance Officer of other Fidelity funds (2004-present) and Executive Vice President of Risk Oversight for Fidelity Investments (2002-present). He is Chief Compliance Officer of FMR (2005-present), FMR Co., Inc. (2005-present), Fidelity Management & Research (U.K.) Inc. (2005-present), Fidelity Research & Analysis Company (2005-present), Fidelity Investments Money Management, Inc. (2005-present), and Strategic Advisers, Inc. (2005-present). Previously, Mr. Rathgeber served as Executive Vice President and Chief Operating Officer for Fidelity Investments Institutional Services Company, Inc. (1998-2002). |
Bryan A. Mehrmann (45) |
| Year of Election or Appointment: 2005 Deputy Treasurer of VIP Growth. Mr. Mehrmann also serves as Deputy Treasurer of other Fidelity funds (2005-present) and is an employee of FMR. Previously, Mr. Mehrmann served as Vice President of Fidelity Investments Institutional Services Group (FIIS)/Fidelity Investments Institutional Operations Corporation, Inc. (FIIOC) Client Services (1998-2004). |
Kenneth B. Robins (37) |
| Year of Election or Appointment: 2005 Deputy Treasurer of VIP Growth. Mr. Robins also serves as Deputy Treasurer of other Fidelity funds (2005-present) and is an employee of FMR (2004-present). Before joining Fidelity Investments, Mr. Robins worked at KPMG LLP, where he was a partner in KPMG's department of professional practice (2002-2004) and a Senior Manager (1999-2000). In addition, Mr. Robins served as Assistant Chief Accountant, United States Securities and Exchange Commission (2000-2002). |
Robert G. Byrnes (40) |
| Year of Election or Appointment: 2005 Assistant Treasurer of VIP Growth. Mr. Byrnes also serves as Assistant Treasurer of other Fidelity funds (2005-present) and is an employee of FMR (2005-present). Previously, Mr. Byrnes served as Vice President of FPCMS (2003-2005). Before joining Fidelity Investments, Mr. Byrnes worked at Deutsche Asset Management where he served as Vice President of the Investment Operations Group (2000-2003). |
John H. Costello (60) |
| Year of Election or Appointment: 1986 Assistant Treasurer of VIP Growth. Mr. Costello also serves as Assistant Treasurer of other Fidelity funds and is an employee of FMR. |
Peter L. Lydecker (52) |
| Year of Election or Appointment: 2004 Assistant Treasurer of VIP Growth. Mr. Lydecker also serves as Assistant Treasurer of other Fidelity funds (2004) and is an employee of FMR. |
Mark Osterheld (51) |
| Year of Election or Appointment: 2002 Assistant Treasurer of VIP Growth. Mr. Osterheld also serves as Assistant Treasurer of other Fidelity funds (2002) and is an employee of FMR. |
Gary W. Ryan (48) |
| Year of Election or Appointment: 2005 Assistant Treasurer of VIP Growth. Mr. Ryan also serves as Assistant Treasurer of other Fidelity funds (2005-present) and is an employee of FMR (2005-present). Previously, Mr. Ryan served as Vice President of Fund Reporting in FPCMS (1999-2005). |
Salvatore Schiavone (41) |
| Year of Election or Appointment: 2005 Assistant Treasurer of VIP Growth. Mr. Schiavone also serves as Assistant Treasurer of other Fidelity funds (2005-present) and is an employee of FMR (2005-present). Before joining Fidelity Investments, Mr. Schiavone worked at Deutsche Asset Management, where he most recently served as Assistant Treasurer (2003-2005) of the Scudder Funds and Vice President and Head of Fund Reporting (1996-2003). |
VIP Growth Portfolio
Distributions
Service Class 2R designates 100% of the dividend distributed during the fiscal year as qualifying for the dividends-received deduction for corporate shareholders.
The fund will notify shareholders in January 2007 of amounts for use in preparing 2006 income tax returns.
Annual Report
Proxy Voting Results
A special meeting of the fund's shareholders was held on November 15, 2006. The results of votes taken among shareholders on the proposal before them are reported below. Each vote reported represents one dollar of net asset value held on the record date for the meeting.
PROPOSAL 1 |
To elect a Board of Trustees. A |
| # of
Votes | % of
Votes |
Dennis J. Dirks |
Affirmative | 17,902,425,874.20 | 95.888 |
Withheld | 767,753,174.62 | 4.112 |
TOTAL | 18,670,179,048.82 | 100.000 |
Albert R. Gamper, Jr. |
Affirmative | 17,903,848,885.90 | 95.895 |
Withheld | 766,330,162.92 | 4.105 |
TOTAL | 18,670,179,048.82 | 100.000 |
Robert M. Gates |
Affirmative | 17,872,803,847.04 | 95.729 |
Withheld | 797,375,201.78 | 4.271 |
TOTAL | 18,670,179,048.82 | 100.000 |
George H. Heilmeier |
Affirmative | 17.870,083,099.32 | 95.715 |
Withheld | 800,095,949.50 | 4.285 |
TOTAL | 18,670,179,048.82 | 100.000 |
Edward C. Johnson 3d |
Affirmative | 17,855,450,949.13 | 95.636 |
Withheld | 814,728,099.69 | 4.364 |
TOTAL | 18,670,179,048.82 | 100.000 |
Stephen P. Jonas |
Affirmative | 17,891,792,907.31 | 95.831 |
Withheld | 778,386,141.51 | 4.169 |
TOTAL | 18,670,179,048.82 | 100.000 |
James H. KeyesB |
Affirmative | 17,882,873,107.76 | 95.783 |
Withheld | 787,305,941.06 | 4.217 |
TOTAL | 18,670,179,048.82 | 100.000 |
Marie L. Knowles |
Affirmative | 17,891,908,567.08 | 95.831 |
Withheld | 778,270,481.74 | 4.169 |
TOTAL | 18,670,179,048.82 | 100.000 |
Ned C. Lautenbach |
Affirmative | 17,899,551,251.03 | 95.872 |
Withheld | 770,627,797.79 | 4.128 |
TOTAL | 18,670,179,048.82 | 100.000 |
| # of
Votes | % of
Votes |
William O. McCoy |
Affirmative | 17,860,461,325.05 | 95.663 |
Withheld | 809,717,723.77 | 4.337 |
TOTAL | 18,670,179,048.82 | 100.000 |
Robert L. Reynolds |
Affirmative | 17,894,978,918.13 | 95.848 |
Withheld | 775,200,130.69 | 4.152 |
TOTAL | 18,670,179,048.82 | 100.000 |
Cornelia M. Small |
Affirmative | 17,897,519,970.69 | 95.862 |
Withheld | 772,659,078.13 | 4.138 |
TOTAL | 18,670,179,048.82 | 100.000 |
William S. Stavropoulos |
Affirmative | 17,871,058,112.55 | 95.720 |
Withheld | 799,120,936.27 | 4.280 |
TOTAL | 18,670,179,048.82 | 100.000 |
Kenneth L. Wolfe |
Affirmative | 17,886,340,376.33 | 95.802 |
Withheld | 783,838,672.49 | 4.198 |
TOTAL | 18,670,179,048.82 | 100.000 |
A Denotes trust-wide proposal and voting results. B Effective on or about January 1, 2007. |
VIP Growth Portfolio
Board Approval of Investment Advisory Contracts and Management Fees
VIP Growth Portfolio
Each year, typically in July, the Board of Trustees, including the Independent Trustees (together, the Board), votes on the renewal of the management contract and sub-advisory agreements (together, the Advisory Contracts) for the fund. The Board, assisted by the advice of fund counsel and Independent Trustees' counsel, requests and considers a broad range of information throughout the year.
The Board meets regularly each month except August and takes into account throughout the year matters bearing on Advisory Contracts. The Board, acting directly and through its separate committees, considers at each of its meetings factors that are relevant to the annual renewal of the fund's Advisory Contracts, including the services and support provided to the fund and its shareholders. At the time of the renewal, the Board had 12 standing committees, each composed of Independent Trustees with varying backgrounds, to which the Board has assigned specific subject matter responsibilities in order to enhance effective decision-making by the Board. Each committee has adopted a written charter outlining the structure and purposes of the committee. One such committee, the Equity Contract Committee, meets periodically as needed throughout the year to consider matters specifically related to the annual renewal of Advisory Contracts. The committee requests and receives information on, and makes recommendations to the Independent Trustees concerning, the approval and annual review of the Advisory Contracts.
At its July 2006 meeting, the Board of Trustees, including the Independent Trustees, unanimously determined to renew the Advisory Contracts for the fund. In reaching its determination, the Board considered all factors it believed relevant, including (i) the nature, extent, and quality of the services to be provided to the fund and its shareholders (including the investment performance of the fund); (ii) the competitiveness of the management fee and total expenses of the fund; (iii) the total costs of the services to be provided by and the profits to be realized by the investment adviser and its affiliates from the relationship with the fund; (iv) the extent to which economies of scale would be realized as the fund grows; and (v) whether fee levels reflect these economies of scale, if any, for the benefit of fund shareholders.
In determining whether to renew the Advisory Contracts for the fund, the Board ultimately reached a determination, with the assistance of fund counsel and Independent Trustees' counsel, that the renewal of the Advisory Contracts and the compensation to be received by Fidelity under the management contract is consistent with Fidelity's fiduciary duty under applicable law. In addition to evaluating the specific factors noted above, the Board, in reaching its determination, is aware that shareholders in the fund have a broad range of investment choices available to them, including a wide choice among mutual funds offered by competitors to Fidelity, and that the fund's shareholders, with the opportunity to review and weigh the disclosure provided by the fund in its prospectus and other public disclosures, have chosen to invest in this fund, managed by Fidelity.
Nature, Extent, and Quality of Services Provided. The Board considered staffing within the investment adviser, FMR, and the sub-advisers (together, the Investment Advisers), including the background of the fund's portfolio manager and the fund's investment objective and discipline. The Independent Trustees also had discussions with senior management of Fidelity's investment operations and investment groups. The Board considered the structure of the portfolio manager compensation program and whether this structure provides appropriate incentives.
Resources Dedicated to Investment Management and Support Services. The Board reviewed the size, education, and experience of the Investment Advisers' investment staff, their use of technology, and the Investment Advisers' approach to recruiting, training, and retaining portfolio managers and other research, advisory, and management personnel. The Board considered Fidelity's extensive global research capabilities that enable the Investment Advisers to aggregate data from various sources in an effort to produce positive investment results. The Board noted that Fidelity's analysts have access to a variety of technological tools that enable them to perform both fundamental and quantitative analysis and to specialize in various disciplines. The Board also considered that Fidelity's portfolio managers and analysts have access to daily portfolio attribution that allows for monitoring of a fund's portfolio, as well as an electronic communication system that provides immediate real-time access to research concerning issuers and credit enhancers.
Shareholder and Administrative Services. The Board considered (i) the nature, extent, quality, and cost of administrative, distribution, and shareholder services performed by the Investment Advisers and their affiliates under the Advisory Contracts and under separate agreements covering transfer agency, pricing and bookkeeping, and securities lending services for the fund; (ii) the nature and extent of the Investment Advisers' supervision of third party service providers, principally custodians and subcustodians; and (iii) the resources devoted to, and the record of compliance with, the fund's compliance policies and procedures. The Board reviewed the allocation of fund brokerage, including allocations to brokers affiliated with the Investment Advisers, the use of brokerage commissions to pay fund expenses, and the use of "soft" commission dollars to pay for research services. The Board also considered that Fidelity voluntarily pays for market data out of its own resources.
The Board noted that the growth of fund assets across the complex allows Fidelity to reinvest in the development of services designed to enhance the value or convenience of the Fidelity funds as investment vehicles. These services include 24-hour access to account information and market information through phone representatives and over the Internet, and investor education materials and asset allocation tools.
Investment in a Large Fund Family. The Board considered the benefits to shareholders of investing in a Fidelity fund, including the benefits of investing in a fund that is part of a large family of funds offering a variety of investment disciplines and providing for a large variety of mutual fund investor services. The Board noted that, since the last Advisory Contract renewals in July 2005, Fidelity has taken a number of actions that benefited particular funds, including (i) dedicating additional resources to investment research and to restructure the investment research teams; (ii) voluntarily entering into contractual arrangements with certain brokers pursuant to which Fidelity pays for research products and services separately out of its own resources, rather than bundling with fund commissions; (iii) launching the Fidelity Advantage Class of its five Spartan stock index funds and three Spartan bond index funds, which is a lower-fee class available to shareholders with higher account balances; (iv) contractually agreeing to impose expense limitations on Fidelity U.S. Bond Index Fund and reducing the fund's initial investment minimum; and (v) offering shareholders of each of the Fidelity Institutional Money Market Funds the privilege of exchanging shares of the fund for shares of other Fidelity funds.
Annual Report
Board Approval of Investment Advisory Contracts and Management Fees - continued
Investment Performance and Compliance. The Board considered whether the fund has operated within its investment objective, as well as its record of compliance with its investment restrictions. It also reviewed the fund's absolute investment performance for each class (except Investor Class), as well as the fund's relative investment performance for each class (except Investor Class) measured against (i) a broad-based securities market index, and (ii) a peer group of mutual funds deemed appropriate by the Board over multiple periods. The following charts considered by the Board show, over the one-, three-, and five-year periods ended December 31, 2005, the cumulative total returns of Service Class 2 and Initial Class of the fund, the cumulative total returns of a broad-based securities market index ("benchmark"), and a range of cumulative total returns of a peer group of mutual funds identified by Lipper Inc. as having an investment objective similar to that of the fund. The returns of Service Class 2 and Initial Class represent the performance of classes with the highest and lowest 12b-1 fees, respectively (not necessarily with the highest and lowest total expenses). (Investor Class of the fund, which has no 12b-1 fee, had less than one year of performance as of December 31, 2005.) The box within each chart shows the 25th percentile return (bottom of box) and the 75th percentile return (top of box) of the Lipper peer group. Returns shown above the box are in the first quartile and returns shown below the box are in the fourth quartile. The percentage beaten numbers noted below each chart correspond to the percentile box and represent the percentage of funds in the Lipper peer group whose performance was equal to or lower than that of the class indicated.
VIP Growth Portfolio
The Board reviewed the fund's relative investment performance against its Lipper peer group and stated that the performance of Initial Class of the fund was in the third quartile for all the periods shown. The Board also stated that the relative investment performance of the fund was lower than its benchmark for the three- and five-year periods, although the one-year cumulative total return of Initial Class of the fund was higher than its benchmark. The Board considered that the variations in performance among the fund's classes reflect the variations in class expenses, which result in lower performance for higher expense classes. The Board discussed with FMR actions to be taken by FMR to improve the fund's disappointing performance. The Board also reviewed the fund's relative investment performance against a customized peer group based on a combination of categories defined by Morningstar. The Board will continue to closely monitor the performance of the fund in the coming year.
The Board considered that FMR has taken steps to refocus and strengthen equity research, equity portfolio management, and compliance. The Board noted with favor FMR's reorganization of its senior management team in 2005 and FMR's dedication of additional resources to investment research, and participated in the process that led to those changes.
Based on its review, and giving particular weight to the nature and quality of the resources dedicated by the Investment Advisers to maintain and improve relative performance, the Board concluded that the nature, extent, and quality of the services provided to the fund will benefit the fund's shareholders, particularly in light of the Board's view that the fund's shareholders benefit from investing in a fund that is part of a large family of funds offering a variety of investment disciplines and services.
VIP Growth Portfolio
Competitiveness of Management Fee and Total Fund Expenses. The Board considered the fund's management fee and total expenses compared to "mapped groups" of competitive funds and classes. Fidelity creates "mapped groups" by combining similar Lipper investment objective categories that have comparable management fee characteristics. Combining Lipper investment objective categories aids the Board's management fee and total expense comparisons by broadening the competitive group used for comparison and by reducing the number of universes to which various Fidelity funds are compared.
The Board considered two proprietary management fee comparisons for the 12-month periods shown in the chart below. The group of Lipper funds used by the Board for management fee comparisons is referred to below as the "Total Mapped Group" and, for the reasons explained above, is broader than the Lipper peer group used by the Board for performance comparisons. The Total Mapped Group comparison focuses on a fund's standing relative to the total universe of comparable funds available to investors, in terms of gross management fees before expense reimbursements or caps. "TMG %" represents the percentage of funds in the Total Mapped Group that had management fees that were lower than the fund's. For example, a TMG % of 6% means that 94% of the funds in the Total Mapped Group had higher management fees than the fund. The "Asset-Size Peer Group" (ASPG) comparison focuses on a fund's standing relative to non-Fidelity funds similar in size to the fund within the Total Mapped Group. The ASPG represents at least 15% of the funds in the Total Mapped Group with comparable asset size and management fee characteristics, subject to a minimum of 50 funds (or all funds in the Total Mapped Group if fewer than 50). Additional information, such as the ASPG quartile in which the fund's management fee ranked, is also included in the chart and considered by the Board.
VIP Growth Portfolio
The Board noted that the fund's management fee ranked below the median of its Total Mapped Group and below the median of its ASPG for 2005.
Based on its review, the Board concluded that the fund's management fee was fair and reasonable in light of the services that the fund receives and the other factors considered.
In its review of each class's total expenses, the Board considered the fund's management fee as well as other fund or class expenses, as applicable, such as transfer agent fees, pricing and bookkeeping fees, fund-paid 12b-1 fees, and custodial, legal, and audit fees. The Board also noted the effects of any waivers and reimbursements on fees and expenses. As part of its review, the Board also considered current and historical total expenses of each class of the fund compared to competitive fund median expenses. Each class of the fund is compared to those funds and classes in the Total Mapped Group (used by the Board for management fee comparisons) that have a similar sales load structure.
The Board noted that the total expenses of each class ranked below its competitive median for 2005.
In its review of total expenses, the Board also considered Fidelity fee structures and other information on clients that FMR and its affiliates service in other competitive markets, such as other mutual funds advised or subadvised by FMR or its affiliates, pension plan clients, and other institutional clients.
Based on its review, the Board concluded that the total expenses of each class of the fund were reasonable in light of the services that the fund and its shareholders receive and the other factors considered.
Annual Report
Board Approval of Investment Advisory Contracts and Management Fees - continued
Costs of the Services and Profitability. The Board considered the revenues earned and the expenses incurred by Fidelity in conducting the business of developing, marketing, distributing, managing, administering and servicing the fund and its shareholders. The Board also considered the level of Fidelity's profits in respect of all the Fidelity funds.
On an annual basis, FMR presents to the Board Fidelity's profitability for the fund. Fidelity calculates the profitability for each fund, as well as aggregate profitability for groups of Fidelity funds and all Fidelity funds, using a series of detailed revenue and cost allocation methodologies which originate with the audited books and records of Fidelity. The Audit Committee of the Board reviews any significant changes from the prior year's methodologies.
PricewaterhouseCoopers LLP (PwC), independent registered accounting firm and auditor to Fidelity and certain Fidelity funds, has been engaged annually by the Board as part of the Board's assessment of the results of Fidelity's profitability analysis. PwC's engagement includes the review and assessment of Fidelity's methodologies used in determining the revenues and expenses attributable to Fidelity's mutual fund business, and completion of agreed-upon procedures surrounding the mathematical accuracy of fund profitability and its conformity to allocation methodologies. After considering PwC's reports issued under the engagement and information provided by Fidelity, the Board believes that while other allocation methods may also be reasonable, Fidelity's profitability methodologies are reasonable in all material respects.
The Board has also reviewed Fidelity's non-fund businesses and any fall-out benefits related to the mutual fund business as well as cases where Fidelity's affiliates may benefit from or be related to the fund's business.
The Board considered the costs of the services provided by and the profits realized by Fidelity in connection with the operation of the fund and determined that the amount of profit is a fair entrepreneurial profit for the management of the fund.
Economies of Scale. The Board considered whether there have been economies of scale in respect of the management of the Fidelity funds, whether the Fidelity funds (including the fund) have appropriately benefited from any such economies of scale, and whether there is potential for realization of any further economies of scale. The Board considered the extent to which the fund will benefit from economies of scale through increased services to the fund, through waivers or reimbursements, or through fee or expense reductions.
The Board recognized that the fund's management contract incorporates a "group fee" structure, which provides for lower fee rates as total fund assets under FMR's management increase, and for higher fee rates as total fund assets under FMR's management decrease. The Board considered that the group fee is designed to deliver the benefits of economies of scale to fund shareholders when total fund assets increase, even if assets of any particular fund are unchanged or have declined, because some portion of Fidelity's costs are attributable to services provided to all Fidelity funds, and all funds benefit if those costs can be allocated among more assets. The Board concluded that, given the group fee structure, fund shareholders will achieve a certain level of economies of scale as assets under FMR's management increase at the fund complex level, regardless of whether Fidelity achieves any such economies of scale.
The Board further concluded that any potential economies of scale are being shared between fund shareholders and Fidelity in an appropriate manner.
Additional Information Requested by the Board. In order to develop fully the factual basis for consideration of the Advisory Contracts, the Board requested additional information on several topics, including (i) Fidelity's fund profitability methodology and profitability trends within certain funds; (ii) portfolio manager compensation; (iii) the extent to which any economies of scale exist and are shared between the funds and Fidelity; (iv) the total expenses of certain funds and classes relative to competitors, including the extent to which the expenses of certain funds have been or could be capped; (v) fund performance trends; and (vi) Fidelity's fee structures, including use of performance fees.
Based on its evaluation of all of the conclusions noted above, and after considering all material factors, the Board ultimately concluded that the advisory fee structures are fair and reasonable, and that the fund's Advisory Contracts should be renewed.
VIP Growth Portfolio
Annual Report
VIP Growth Portfolio
Annual Report
Investment Adviser
Fidelity Management & Research Company
Boston, MA
Investment Sub-Adviser
FMR Co., Inc.
Fidelity Management & Research (U.K.) Inc.
Fidelity Research & Analysis Company
(formerly Fidelity Management & Research (Far East) Inc.)
Fidelity International Investment Advisors
Fidelity International Investment Advisors (U.K.) Limited
Fidelity Investments Japan Limited
General Distributor
Fidelity Distributors Corporation
Boston, MA
Transfer and Service Agents
Fidelity Investments Institutional Operations Company, Inc.
Boston, MA
Fidelity Service Company, Inc.
Boston, MA
Custodian
Mellon Bank, N.A.
Pittsburgh, PA
VIPGRWTR-ANN-0207
1.811845.102
Fidelity® Variable Insurance Products:
High Income Portfolio
Annual Report
December 31, 2006
(2_fidelity_logos) (Registered_Trademark)
Contents
Performance | <Click Here> | How the fund has done over time. |
Management's Discussion | <Click Here> | The manager's review of fund performance, strategy and outlook. |
Shareholder Expense Example | <Click Here> | An example of shareholder expenses. |
Investment Changes | <Click Here> | A summary of major shifts in the fund's investments over the past six months. |
Investments | <Click Here> | A complete list of the fund's investments with their
market values. |
Financial Statements | <Click Here> | Statements of assets and liabilities, operations, and
changes in net assets, as well as financial highlights. |
Notes | <Click Here> | Notes to the financial statements. |
Report of Independent Registered Public Accounting Firm | <Click Here> | |
Trustees and Officers | <Click Here> | |
Proxy Voting Results | <Click Here> | |
To view a fund's proxy voting guidelines and proxy voting record for the 12-month period ended June 30, visit www.fidelity.com/proxyvotingresults or visit the Securities and Exchange Commission's (SEC) web site at www.sec.gov. You may also call 1-877-208-0098 to request a free copy of the proxy voting guidelines.
Fidelity Variable Insurance Products are separate account options which are purchased through a variable insurance contract.
Standard & Poor's, S&P and S&P 500 are registered service marks of The McGraw-Hill Companies, Inc. and have been licensed for use by Fidelity Distributors Corporation.
Other third party marks appearing herein are the property of their respective owners.
All other marks appearing herein are registered or unregistered trademarks or service marks of FMR Corp. or an affiliated company.
This report and the financial statements contained herein are submitted for the general information of the shareholders of the fund. This report is not authorized for distribution to prospective investors in the fund unless preceded or accompanied by an effective prospectus.
A fund files its complete schedule of portfolio holdings with the SEC for the first and third quarters of each fiscal year on Form N-Q. Forms N-Q are available on the SEC's web site at http://www.sec.gov. A fund's Forms N-Q may be reviewed and copied at the SEC's Public Reference Room in Washington, DC. Information regarding the operation of the SEC's Public Reference Room may be obtained by calling 1-800-SEC-0330. For a complete list of a fund's portfolio holdings, view the most recent quarterly holdings report, semiannual report, or annual report on Fidelity's web site at http://www.advisor.fidelity.com.
NOT FDIC INSURED · MAY LOSE VALUE · NO BANK GUARANTEE
Neither the fund nor Fidelity Distributors Corporation is a bank.
VIP High Income Portfolio
VIP High Income Portfolio
Performance: The Bottom Line
Average annual total return reflects the change in the value of an investment, assuming reinvestment of a class' dividend income and capital gains (the profits earned upon the sale of securities that have grown in value) and assuming a constant rate of performance each year. During periods of reimbursement by Fidelity, a fund's total return will be greater than it would be had the reimbursement not occurred. Performance numbers are net of all underlying fund operating expenses, but do not include any insurance charges imposed by your insurance company's separate account. If performance information included the effect of these additional charges, the total returns would be lower. How a fund did yesterday is no guarantee of how it will do tomorrow.
Average Annual Total Returns
Periods ended December 31, 2006 | Past 1
year | Past 5
years | Past 10
years |
VIP High Income - Initial Class | 11.24% | 10.51% | 3.22% |
VIP High Income - Service Class A | 11.18% | 10.42% | 3.12% |
VIP High Income - Service Class 2 B | 11.02% | 10.22% | 3.00% |
VIP High Income - Investor Class C | 11.24% | 10.48% | 3.21% |
A The initial offering of Service Class shares took place on November 3, 1997. Performance for Service Class shares reflects an asset based distribution fee (12b-1 fee), and returns prior to November 3, 1997 are those of Initial Class and do not include the effects of Service Class' 12b-1 fee. Had Service Class' 12b-1 fee been reflected, returns prior to November 3, 1997 would have been lower.
B The initial offering of Service Class 2 shares took place on January 12, 2000. Performance for Service Class 2 shares reflects an asset based distribution fee (12b-1 fee). Returns from November 3, 1997 to January 12, 2000 are those of Service Class which reflect a different 12b-1 fee. Service Class 2 returns prior to November 3, 1997 are those of Initial Class and do not include the effects of a 12b-1 fee. Had Service Class 2's 12b-1 fee been reflected, returns prior to January 12, 2000 would have been lower.
C The initial offering of Investor Class shares took place on July 21, 2005. Returns prior to July 21, 2005 are those of Initial Class. If Investor Class's transfer agent fee had been reflected, returns prior to July 21, 2005 would have been lower.
$10,000 Over 10 Years
Let's say hypothetically that $10,000 was invested in VIP High Income Portfolio - Initial Class on December 31, 1996. The chart shows how the value of your investment would have changed, and also shows how the Merrill Lynch ® U.S. High Yield Master II Constrained Index and the Merrill Lynch U.S. High Yield Master II Index performed over the same period.
Beginning on January 1, 2006, the Merrill Lynch US High Yield Master II Constrained Index replaced the Merrill Lynch US High Yield Master II Index as the fund's primary index for all time periods because the Merrill Lynch U.S. High Yield Master II Constrained Index conforms more closely to the fund's investment strategy.

Annual Report
VIP High Income Portfolio
Management's Discussion of Fund Performance
Comments from Matthew Conti, Portfolio Manager of VIP High Income Portfolio
For the 12-month period ending December 31, 2006, the U.S. high-yield bond market posted its fourth consecutive year of positive returns. The Merrill Lynch® U.S. High Yield Master II Constrained Index rose 10.76% in that time, the fourth year in a row that the asset class topped the investment-grade bond market, which gained 4.33% as measured by the Lehman Brothers® Aggregate Bond Index. High yield was paced by a historically low default rate, solid corporate earnings, stable long-term interest rates, improved balance sheets and a strong equity market. One notable trend in 2006 was a significant increase in mergers, acquisitions and leveraged buyout activity, which resulted in a record-high issuance of high-yield debt. Fortunately, demand easily offset the supply. For the most part, high-yield companies enjoyed easy access to capital from the bank loan market, and the attractive yields of junk bonds drew heavy interest from private equity investors, hedge funds, international investors and institutions looking to meet fixed pension and retirement obligations.
For the 12 months that ended December 31, 2006, the fund outperformed the Merrill Lynch Constrained index - which became the fund's primary benchmark on January 1, 2006 - but underperformed the 11.77% return of its previous benchmark, the Merrill Lynch U.S. High Yield Master II Index. Positive security selection in heath care and telecommunications helped performance relative to the Constrained index, while overweighting gaming and underweighting automotive detracted. Top contributors to performance included underweighting hospital company HCA and not owning index component Dura Automotive, as well as holdings in satellite telecommunications provider Intelsat, video game retailer GameStop, General Motors Acceptance Corporation - the financing arm of General Motors (GM) - and building materials firm MAAX, not held at period end. Underweighting GM - no longer in the fund - and cable TV company Charter Communications detracted, as did bricks-and-mortar gaming companies Station Casinos and MGM Mirage. An out-of-benchmark position in building materials provider Masonite also lagged.
Note to shareholders: Effective January 1, 2006, the fund changed its benchmark to the Merrill Lynch U.S. High Yield Master II Constrained Index because this index conforms more closely to the fund's investment strategy. The Constrained index includes all of the bonds in the former benchmark, the Merrill Lynch U.S. High Yield Master II Index, but imposes a 2% limit on any individual issuer. In Fidelity's view, the Constrained index represents a better measure of the high-yield market, as this index is more diversified than the unconstrained version and is less likely to be disrupted by rapid market changes.
The views expressed above reflect those of the portfolio manager(s) only through the end of the period as stated on the cover of this report and do not necessarily represent the views of Fidelity or any other person in the Fidelity organization. Any such views are subject to change at any time based upon market or other conditions and Fidelity disclaims any responsibility to update such views. These views may not be relied on as investment advice and, because investment decisions for a Fidelity fund are based on numerous factors, may not be relied on as an indication of trading intent on behalf of any Fidelity fund.
VIP High Income Portfolio
VIP High Income Portfolio
Shareholder Expense Example
As a shareholder of the Fund, you incur two types of costs: (1) transaction costs, including redemption fees, and (2) ongoing costs, including management fees, distribution and/or service (12b-1) fees and other Fund expenses. This Example is intended to help you understand your ongoing costs (in dollars) of investing in the Fund and to compare these costs with the ongoing costs of investing in other mutual funds.
The Example is based on an investment of $1,000 invested at the beginning of the period and held for the entire period (July 1, 2006 to December 31, 2006).
Actual Expenses
The first line of the accompanying table for each class of the Fund provides information about actual account values and actual expenses. You may use the information in this line, together with the amount you invested, to estimate the expenses that you paid over the period. Simply divide your account value by $1,000.00 (for example, an $8,600 account value divided by $1,000.00 = 8.6), then multiply the result by the number in the first line for a class of the Fund under the heading entitled "Expenses Paid During Period" to estimate the expenses you paid on your account during this period. The estimate of expenses does not include any fees or other expenses of any variable annuity or variable life insurance product. If they were, the estimate of expenses you paid during the period would be higher, and your ending account value would be lower.
Hypothetical Example for Comparison Purposes
The second line of the accompanying table for each class of the Fund provides information about hypothetical account values and hypothetical expenses based on a Class' actual expense ratio and an assumed rate of return of 5% per year before expenses, which is not the Class' actual return. The hypothetical account values and expenses may not be used to estimate the actual ending account balance or expenses you paid for the period. You may use this information to compare the ongoing costs of investing in the Fund and other funds. To do so, compare this 5% hypothetical example with the 5% hypothetical examples that appear in the shareholder reports of the other funds. The estimate of expenses does not include any fees or other expenses of any variable annuity or variable life insurance product. If they were, the estimate of expenses you paid during the period would be higher, and your ending account value would be lower.
Please note that the expenses shown in the table are meant to highlight your ongoing costs only and do not reflect any transaction costs. Therefore, the second line of the table is useful in comparing ongoing costs only, and will not help you determine the relative total costs of owning different funds. In addition, if these transactional costs were included, your costs would have been higher.
| Beginning
Account Value
July 1, 2006 | Ending
Account Value
December 31, 2006 | Expenses Paid
During Period *
July 1, 2006 to
December 31, 2006 |
Initial Class | | | |
Actual | $ 1,000.00 | $ 1,080.00 | $ 3.83 |
Hypothetical A | $ 1,000.00 | $ 1,021.53 | $ 3.72 |
Service Class | | | |
Actual | $ 1,000.00 | $ 1,079.20 | $ 4.35 |
Hypothetical A | $ 1,000.00 | $ 1,021.02 | $ 4.23 |
Service Class 2 | | | |
Actual | $ 1,000.00 | $ 1,079.20 | $ 5.14 |
Hypothetical A | $ 1,000.00 | $ 1,020.27 | $ 4.99 |
Initial Class R | | | |
Actual | $ 1,000.00 | $ 1,080.30 | $ 3.83 |
Hypothetical A | $ 1,000.00 | $ 1,021.53 | $ 3.72 |
Service Class R | | | |
Actual | $ 1,000.00 | $ 1,079.40 | $ 4.30 |
Hypothetical A | $ 1,000.00 | $ 1,021.07 | $ 4.18 |
Service Class 2R | | | |
Actual | $ 1,000.00 | $ 1,078.80 | $ 5.13 |
Hypothetical A | $ 1,000.00 | $ 1,020.27 | $ 4.99 |
Investor Class | | | |
Actual | $ 1,000.00 | $ 1,079.90 | $ 4.19 |
Hypothetical A | $ 1,000.00 | $ 1,021.17 | $ 4.08 |
A 5% return per year before expenses
* Expenses are equal to each Class' annualized expense ratio (shown in the table below); multiplied by the average account value over the period, multiplied by 184/365 (to reflect the one-half year period).
Annual Report
VIP High Income Portfolio
Shareholder Expense Example - continued
| Annualized
Expense Ratio |
Initial Class | .73% |
Service Class | .83% |
Service Class 2 | .98% |
Initial Class R | .73% |
Service Class R | .82% |
Service Class 2R | .98% |
Investor Class | .80% |
VIP High Income Portfolio
VIP High Income Portfolio
Investment Changes
Top Five Holdings as of December 31, 2006 |
(by issuer, excluding cash equivalents) | % of fund's
net assets | % of fund's net assets
6 months ago |
Intelsat Ltd. | 2.4 | 2.4 |
Ford Motor Credit Co. | 2.4 | 1.6 |
MGM Mirage, Inc. | 1.9 | 1.5 |
General Motors Acceptance Corp. | 1.9 | 2.2 |
Ship Finance International Ltd. | 1.8 | 1.9 |
| 10.4 | |
Top Five Market Sectors as of December 31, 2006 |
| % of fund's
net assets | % of fund's net assets
6 months ago |
Technology | 8.7 | 9.0 |
Energy | 8.3 | 9.5 |
Telecommunications | 8.3 | 8.5 |
Automotive | 6.6 | 4.5 |
Gaming | 6.3 | 7.5 |
Quality Diversification (% of fund's net assets) |
As of December 31, 2006 | As of June 30, 2006 |
| AAA, AA, A 0.4% | | | AAA, AA, A 0.5% | |
 | BBB 0.7% | | | BBB 0.0% | |
 | BB 33.9% | | | BB 37.4% | |
| B 45.1% | | | B 48.0% | |
 | CCC, CC, C 11.7% | | | CCC, CC, C 8.9% | |
 | Not Rated 3.1% | | | Not Rated 1.4% | |
 | Equities 0.1% | | | Equities 0.1% | |
| Short-Term
Investments and
Net Other Assets 5.0% | | | Short-Term
Investments and
Net Other Assets 3.7% | |

We have used ratings from Moody's® Investors Services, Inc. Where Moody's ratings are not available, we have used S&P® ratings. Percentages are adjusted for the effect of futures contracts, if applicable. |
Asset Allocation (% of fund's net assets) |
As of December 31, 2006 * | As of June 30, 2006 * * |
| Nonconvertible
Bonds 87.0% | | | Nonconvertible
Bonds 87.8% | |
 | Convertible Bonds, Preferred Stocks 0.0% | | | Convertible Bonds, Preferred Stocks 0.2% | |
 | Common Stocks 0.1% | | | Common Stocks 0.1% | |
 | Floating Rate Loans 7.9% | | | Floating Rate Loans 7.8% | |
| Other Investments 0.0% | | | Other Investments 0.4% | |
| Short-Term
Investments and
Net Other Assets 5.0% | | | Short-Term
Investments and
Net Other Assets 3.7% | |
* Foreign investments | 16.1% | | * * Foreign investments | 18.8% | |

Annual Report
VIP High Income Portfolio
Investments December 31, 2006
Showing Percentage of Net Assets
Nonconvertible Bonds - 87.0% |
| Principal Amount | | Value
(Note 1) |
Aerospace - 1.4% |
Bombardier, Inc.: | | | | |
6.75% 5/1/12 (d) | | $ 10,000 | | $ 9,800 |
7.45% 5/1/34 (d) | | 1,795,000 | | 1,642,425 |
8% 11/15/14 (d) | | 2,085,000 | | 2,131,913 |
L-3 Communications Corp.: | | | | |
5.875% 1/15/15 | | 1,120,000 | | 1,080,800 |
6.375% 10/15/15 | | 4,875,000 | | 4,814,063 |
7.625% 6/15/12 | | 5,245,000 | | 5,428,575 |
Primus International, Inc. 11.5% 4/15/09 (d) | | 4,505,000 | | 4,820,350 |
| | 19,927,926 |
Air Transportation - 1.6% |
American Airlines, Inc. pass thru trust certificates: | | | | |
6.817% 5/23/11 | | 7,425,000 | | 7,536,375 |
7.377% 5/23/19 | | 764,033 | | 746,842 |
8.608% 10/1/12 | | 535,000 | | 567,100 |
AMR Corp. 9% 8/1/12 | | 1,980,000 | | 2,116,224 |
Continental Airlines, Inc.: | | | | |
7.875% 7/2/18 | | 1,142,436 | | 1,162,429 |
9.558% 9/1/19 | | 1,684,767 | | 1,823,760 |
Continental Airlines, Inc. pass thru trust certificates: | | | | |
7.566% 9/15/21 | | 653,189 | | 656,455 |
7.73% 9/15/12 | | 340,150 | | 341,000 |
9.798% 4/1/21 | | 3,216,267 | | 3,537,894 |
Navios Maritime Holdings, Inc. 9.5% 12/15/14 (d) | | 4,220,000 | | 4,230,550 |
| | 22,718,629 |
Automotive - 4.9% |
Ford Motor Co. 7.45% 7/16/31 | | 4,165,000 | | 3,269,525 |
Ford Motor Credit Co.: | | | | |
7% 10/1/13 | | 8,790,000 | | 8,394,450 |
7.25% 10/25/11 | | 5,520,000 | | 5,405,581 |
8% 12/15/16 | | 2,890,000 | | 2,861,100 |
8.11% 1/13/12 (e) | | 5,590,000 | | 5,534,100 |
9.8238% 4/15/12 (e) | | 3,230,000 | | 3,443,988 |
10.61% 6/15/11 (d)(e) | | 6,664,000 | | 7,197,120 |
General Motors Acceptance Corp.: | | | | |
5.625% 5/15/09 | | 1,190,000 | | 1,180,605 |
6.75% 12/1/14 | | 6,145,000 | | 6,329,350 |
6.875% 9/15/11 | | 4,690,000 | | 4,807,250 |
8% 11/1/31 | | 11,575,000 | | 13,253,375 |
GMAC LLC 6% 12/15/11 | | 2,740,000 | | 2,719,450 |
Visteon Corp. 7% 3/10/14 | | 3,795,000 | | 3,311,138 |
| | 67,707,032 |
Banks and Thrifts - 0.4% |
Western Financial Bank 9.625% 5/15/12 | | 5,125,000 | | 5,596,423 |
|
| Principal Amount | | Value
(Note 1) |
Broadcasting - 0.3% |
Nexstar Broadcasting, Inc. 7% 1/15/14 | | $ 2,440,000 | | $ 2,293,600 |
Nexstar Finance Holdings LLC/Nexstar Finance Holdings, Inc. 0% 4/1/13 (c) | | 1,850,000 | | 1,655,750 |
| | 3,949,350 |
Building Materials - 0.7% |
Anixter International, Inc. 5.95% 3/1/15 | | 3,270,000 | | 3,024,750 |
Masonite Corp. 11% 4/6/15 (d) | | 7,930,000 | | 7,355,075 |
| | 10,379,825 |
Cable TV - 3.1% |
Cablevision Systems Corp. 9.87% 4/1/09 (e) | | 3,835,000 | | 4,021,956 |
Charter Communications Holdings I LLC: | | | | |
0% 1/15/15 (c) | | 2,335,000 | | 2,113,175 |
9.92% 4/1/14 | | 5,420,000 | | 4,661,200 |
10% 5/15/14 | | 3,685,000 | | 3,205,950 |
11.125% 1/15/14 | | 2,025,000 | | 1,776,938 |
Charter Communications Holdings I LLC/Charter Communications Holdings I Capital Corp. 11% 10/1/15 | | 1,085,000 | | 1,106,700 |
Charter Communications Holdings II LLC/Charter Communications Holdings II Capital Corp. 10.25% 9/15/10 | | 2,400,000 | | 2,502,000 |
EchoStar Communications Corp.: | | | | |
5.75% 10/1/08 | | 5,475,000 | | 5,447,625 |
7% 10/1/13 | | 5,940,000 | | 5,925,150 |
7.125% 2/1/16 | | 2,785,000 | | 2,781,658 |
Kabel Deutschland GmbH 10.625% 7/1/14 | | 4,350,000 | | 4,833,938 |
NTL Cable PLC: | | | | |
8.75% 4/15/14 | | 2,175,000 | | 2,272,875 |
9.125% 8/15/16 | | 1,805,000 | | 1,899,763 |
| | 42,548,928 |
Capital Goods - 1.6% |
Amsted Industries, Inc. 10.25% 10/15/11 (d) | | 4,930,000 | | 5,262,775 |
Case New Holland, Inc. 7.125% 3/1/14 | | 6,795,000 | | 6,930,900 |
Leucadia National Corp. 7% 8/15/13 | | 3,520,000 | | 3,572,800 |
Park-Ohio Industries, Inc. 8.375% 11/15/14 | | 2,425,000 | | 2,243,125 |
Sensus Metering Systems, Inc. 8.625% 12/15/13 | | 4,325,000 | | 4,325,000 |
| | 22,334,600 |
Chemicals - 4.0% |
Chemtura Corp. 6.875% 6/1/16 | | 2,640,000 | | 2,626,800 |
Nonconvertible Bonds - continued |
| Principal Amount | | Value
(Note 1) |
Chemicals - continued |
Crystal US Holding 3 LLC/Crystal US Sub 3 Corp.: | | | | |
Series A, 0% 10/1/14 (c) | | $ 3,240,000 | | $ 2,737,800 |
Series B, 0% 10/1/14 (c) | | 1,965,000 | | 1,660,425 |
Equistar Chemicals LP 7.55% 2/15/26 | | 2,525,000 | | 2,398,750 |
Equistar Chemicals LP/Equistar Funding Corp.: | | | | |
8.75% 2/15/09 | | 1,995,000 | | 2,084,775 |
10.125% 9/1/08 | | 2,600,000 | | 2,762,500 |
Lyondell Chemical Co.: | | | | |
8% 9/15/14 | | 3,110,000 | | 3,214,963 |
8.25% 9/15/16 | | 3,110,000 | | 3,253,838 |
Millennium America, Inc.: | | | | |
7.625% 11/15/26 | | 1,040,000 | | 925,600 |
9.25% 6/15/08 | | 3,585,000 | | 3,710,475 |
Momentive Performance Materials, Inc. 9.75% 12/1/14 (d) | | 8,720,000 | | 8,730,900 |
Nalco Co. 7.75% 11/15/11 | | 3,005,000 | | 3,083,881 |
Nell AF Sarl 8.375% 8/15/15 (d) | | 2,690,000 | | 2,763,975 |
NOVA Chemicals Corp.: | | | | |
7.4% 4/1/09 | | 4,250,000 | | 4,319,063 |
8.5019% 11/15/13 (e) | | 2,425,000 | | 2,449,250 |
Phibro Animal Health Corp.: | | | | |
10% 8/1/13 (d) | | 2,440,000 | | 2,531,500 |
13% 8/1/14 (d) | | 1,420,000 | | 1,437,750 |
Tronox Worldwide LLC/Tronox Worldwide Finance Corp. 9.5% 12/1/12 | | 4,065,000 | | 4,268,250 |
| | 54,960,495 |
Consumer Products - 0.3% |
Jostens Holding Corp. 0% 12/1/13 (c) | | 3,050,000 | | 2,653,500 |
Jostens IH Corp. 7.625% 10/1/12 | | 1,970,000 | | 1,989,700 |
| | 4,643,200 |
Containers - 1.0% |
Berry Plastics Holding Corp. 8.875% 9/15/14 (d) | | 4,680,000 | | 4,785,300 |
BWAY Corp. 10% 10/15/10 | | 7,005,000 | | 7,320,225 |
Owens-Brockway Glass Container, Inc. 8.25% 5/15/13 | | 1,195,000 | | 1,236,825 |
| | 13,342,350 |
Diversified Financial Services - 0.5% |
E*TRADE Financial Corp.: | | | | |
7.375% 9/15/13 | | 1,490,000 | | 1,534,700 |
7.875% 12/1/15 | | 2,895,000 | | 3,075,938 |
8% 6/15/11 | | 2,440,000 | | 2,549,800 |
| | 7,160,438 |
Diversified Media - 1.7% |
Affinion Group, Inc. 11.5% 10/15/15 | | 3,385,000 | | 3,579,638 |
|
| Principal Amount | | Value
(Note 1) |
LBI Media Holdings, Inc. 0% 10/15/13 (c) | | $ 6,440,000 | | $ 5,538,400 |
LBI Media, Inc. 10.125% 7/15/12 | | 2,245,000 | | 2,379,700 |
Nielsen Finance LLC/Co.: | | | | |
0% 8/1/16 (c)(d) | | 2,660,000 | | 1,835,400 |
10% 8/1/14 (d) | | 4,145,000 | | 4,476,600 |
Quebecor Media, Inc. 7.75% 3/15/16 | | 5,920,000 | | 5,979,200 |
| | 23,788,938 |
Electric Utilities - 3.8% |
AES Corp.: | | | | |
8.875% 2/15/11 | | 3,581,000 | | 3,840,623 |
9.375% 9/15/10 | | 4,088,000 | | 4,425,260 |
9.5% 6/1/09 | | 904,000 | | 967,280 |
AES Gener SA 7.5% 3/25/14 | | 4,965,000 | | 5,250,488 |
Aquila, Inc. 14.875% 7/1/12 | | 2,555,000 | | 3,321,500 |
Dynegy Holdings, Inc. 8.375% 5/1/16 | | 3,130,000 | | 3,294,325 |
Mirant Americas Generation LLC 8.5% 10/1/21 | | 4,075,000 | | 4,115,750 |
MSW Energy Holdings II LLC/MSW Finance Co. II, Inc. 7.375% 9/1/10 | | 7,490,000 | | 7,639,800 |
MSW Energy Holdings LLC/MSW Energy Finance Co., Inc. 8.5% 9/1/10 | | 2,505,000 | | 2,580,150 |
NGC Corp. 7.125% 5/15/18 | | 1,805,000 | | 1,759,875 |
Tenaska Alabama Partners LP 7% 6/30/21 (d) | | 3,222,625 | | 3,171,973 |
TXU Corp. 6.5% 11/15/24 | | 4,645,000 | | 4,460,733 |
Utilicorp Canada Finance Corp. 7.75% 6/15/11 | | 7,595,000 | | 8,050,700 |
Utilicorp United, Inc. 9.95% 2/1/11 (e) | | 55,000 | | 60,363 |
| | 52,938,820 |
Energy - 7.6% |
Atlas Pipeline Partners LP 8.125% 12/15/15 | | 4,080,000 | | 4,212,600 |
Chaparral Energy, Inc. 8.5% 12/1/15 | | 4,800,000 | | 4,764,000 |
Chesapeake Energy Corp.: | | | | |
6.5% 8/15/17 | | 7,185,000 | | 6,996,394 |
6.625% 1/15/16 | | 2,045,000 | | 2,039,888 |
7.5% 6/15/14 | | 2,095,000 | | 2,178,800 |
7.75% 1/15/15 | | 4,390,000 | | 4,554,625 |
Complete Production Services, Inc. 8% 12/15/16 (d) | | 4,070,000 | | 4,161,575 |
El Paso Performance-Linked Trust 7.75% 7/15/11 (d) | | 4,345,000 | | 4,540,525 |
Hanover Compressor Co.: | | | | |
8.625% 12/15/10 | | 2,560,000 | | 2,662,400 |
9% 6/1/14 | | 1,785,000 | | 1,918,875 |
Hanover Equipment Trust 8.75% 9/1/11 | | 775,000 | | 808,906 |
Nonconvertible Bonds - continued |
| Principal Amount | | Value
(Note 1) |
Energy - continued |
Hilcorp Energy I LP/Hilcorp Finance Co.: | | | | |
7.75% 11/1/15 (d) | | $ 3,440,000 | | $ 3,388,400 |
9% 6/1/16 (d) | | 3,910,000 | | 4,125,050 |
OPTI Canada, Inc. 8.25% 12/15/14 (d) | | 3,460,000 | | 3,533,698 |
Pan American Energy LLC 7.75% 2/9/12 (d) | | 3,630,000 | | 3,747,975 |
Parker Drilling Co.: | | | | |
9.625% 10/1/13 | | 2,960,000 | | 3,241,200 |
10.1194% 9/1/10 (e) | | 4,878,000 | | 4,981,658 |
Petrohawk Energy Corp. 9.125% 7/15/13 | | 7,095,000 | | 7,414,275 |
Pogo Producing Co. 6.875% 10/1/17 | | 1,030,000 | | 988,800 |
Range Resources Corp.: | | | | |
6.375% 3/15/15 (Reg. S) | | 885,000 | | 854,025 |
7.375% 7/15/13 | | 10,075,000 | | 10,276,500 |
7.5% 5/15/16 | | 3,910,000 | | 3,997,975 |
SESI LLC 6.875% 6/1/14 | | 2,530,000 | | 2,530,000 |
Stone Energy Corp. 6.75% 12/15/14 | | 2,465,000 | | 2,341,750 |
Targa Resources, Inc./Targa Resources Finance Corp. 8.5% 11/1/13 (d) | | 2,535,000 | | 2,554,013 |
Williams Companies, Inc. 6.375% 10/1/10 (d) | | 4,765,000 | | 4,776,913 |
Williams Partners LP/Williams Partners Finance Corp.: | | | | |
7.25% 2/1/17 (d) | | 2,760,000 | | 2,815,200 |
7.5% 6/15/11 (d) | | 4,330,000 | | 4,524,850 |
| | 104,930,870 |
Entertainment/Film - 0.3% |
AMC Entertainment, Inc. 8% 3/1/14 | | 4,370,000 | | 4,348,150 |
Environmental - 0.9% |
Allied Waste North America, Inc.: | | | | |
5.75% 2/15/11 | | 3,645,000 | | 3,526,538 |
7.125% 5/15/16 | | 3,180,000 | | 3,148,200 |
8.5% 12/1/08 | | 3,965,000 | | 4,173,163 |
Browning-Ferris Industries, Inc.: | | | | |
6.375% 1/15/08 | | 855,000 | | 855,000 |
7.4% 9/15/35 | | 585,000 | | 546,975 |
| | 12,249,876 |
Food and Drug Retail - 1.0% |
Albertsons, Inc.: | | | | |
7.45% 8/1/29 | | 2,280,000 | | 2,227,558 |
7.75% 6/15/26 | | 2,565,000 | | 2,561,153 |
8% 5/1/31 | | 1,685,000 | | 1,709,195 |
|
| Principal Amount | | Value
(Note 1) |
GNC Parent Corp. 12.14% 12/1/11 pay-in-kind (d)(e) | | $ 4,470,000 | | $ 4,470,000 |
SUPERVALU, Inc. 7.5% 11/15/14 | | 2,990,000 | | 3,109,600 |
| | 14,077,506 |
Food/Beverage/Tobacco - 1.2% |
National Beef Packing Co. LLC/National Beef Finance Corp. 10.5% 8/1/11 | | 3,690,000 | | 3,865,275 |
Pierre Foods, Inc. 9.875% 7/15/12 | | 2,600,000 | | 2,678,000 |
Reynolds American, Inc.: | | | | |
7.25% 6/1/13 | | 3,200,000 | | 3,352,000 |
7.3% 7/15/15 | | 2,680,000 | | 2,780,500 |
Swift & Co.: | | | | |
10.125% 10/1/09 | | 3,215,000 | | 3,279,300 |
12.5% 1/1/10 | | 760,000 | | 775,200 |
| | 16,730,275 |
Gaming - 5.5% |
Chukchansi Economic Development Authority: | | | | |
8% 11/15/13 (d) | | 3,210,000 | | 3,318,338 |
8.8769% 11/15/12 (d)(e) | | 1,010,000 | | 1,046,613 |
Mandalay Resort Group 9.375% 2/15/10 | | 4,655,000 | | 4,969,213 |
MGM Mirage, Inc.: | | | | |
6% 10/1/09 | | 4,775,000 | | 4,769,031 |
6.625% 7/15/15 | | 785,000 | | 756,544 |
6.75% 9/1/12 | | 9,015,000 | | 8,834,700 |
6.75% 4/1/13 | | 4,390,000 | | 4,291,225 |
6.875% 4/1/16 | | 2,995,000 | | 2,867,713 |
7.625% 1/15/17 | | 4,420,000 | | 4,442,100 |
Mohegan Tribal Gaming Authority: | | | | |
6.375% 7/15/09 | | 4,740,000 | | 4,740,000 |
7.125% 8/15/14 | | 2,010,000 | | 2,037,638 |
8% 4/1/12 | | 970,000 | | 1,010,013 |
MTR Gaming Group, Inc.: | | | | |
9% 6/1/12 | | 960,000 | | 986,400 |
9.75% 4/1/10 | | 1,650,000 | | 1,736,625 |
Scientific Games Corp. 6.25% 12/15/12 | | 3,275,000 | | 3,184,938 |
Seneca Gaming Corp.: | | | | |
Series B, 7.25% 5/1/12 | | 4,600,000 | | 4,680,500 |
7.25% 5/1/12 | | 6,020,000 | | 6,125,350 |
Station Casinos, Inc.: | | | | |
6.625% 3/15/18 | | 60,000 | | 51,675 |
6.875% 3/1/16 | | 5,720,000 | | 5,119,400 |
Virgin River Casino Corp./RBG LLC/B&BB, Inc.: | | | | |
0% 1/15/13 (c) | | 2,100,000 | | 1,485,750 |
9% 1/15/12 | | 3,610,000 | | 3,736,350 |
Wheeling Island Gaming, Inc. 10.125% 12/15/09 | | 5,900,000 | | 6,010,625 |
| | 76,200,741 |
Nonconvertible Bonds - continued |
| Principal Amount | | Value
(Note 1) |
Healthcare - 5.5% |
AmeriPath, Inc. 10.5% 4/1/13 | | $ 2,380,000 | | $ 2,576,350 |
CDRV Investors, Inc. 0% 1/1/15 (c) | | 9,250,000 | | 7,168,750 |
Concentra Operating Corp.: | | | | |
9.125% 6/1/12 | | 4,095,000 | | 4,299,750 |
9.5% 8/15/10 | | 2,145,000 | | 2,252,250 |
HCA, Inc.: | | | | |
9.125% 11/15/14 (d) | | 2,740,000 | | 2,924,950 |
9.25% 11/15/16 (d) | | 2,740,000 | | 2,928,375 |
9.625% 11/15/16 pay-in-kind (d) | | 2,190,000 | | 2,354,250 |
HealthSouth Corp.: | | | | |
10.75% 6/15/16 (d) | | 4,250,000 | | 4,579,375 |
11.3544% 6/15/14 (d)(e) | | 3,250,000 | | 3,461,250 |
IASIS Healthcare LLC/IASIS Capital Corp. 8.75% 6/15/14 | | 3,815,000 | | 3,857,919 |
Multiplan, Inc. 10.375% 4/15/16 (d) | | 2,485,000 | | 2,485,000 |
National Mentor Holdings, Inc. 11.25% 7/1/14 (d) | | 2,675,000 | | 2,855,563 |
Omega Healthcare Investors, Inc.: | | | | |
7% 4/1/14 | | 9,970,000 | | 10,044,775 |
7% 1/15/16 | | 2,480,000 | | 2,486,200 |
Rural/Metro Corp. 9.875% 3/15/15 | | 1,670,000 | | 1,734,713 |
Senior Housing Properties Trust 8.625% 1/15/12 | | 4,460,000 | | 4,839,100 |
Service Corp. International 6.75% 4/1/16 | | 490,000 | | 490,000 |
Team Finance LLC/Health Finance Corp. 11.25% 12/1/13 | | 4,310,000 | | 4,460,850 |
Ventas Realty LP: | | | | |
6.5% 6/1/16 | | 5,250,000 | | 5,322,188 |
6.625% 10/15/14 | | 2,320,000 | | 2,360,600 |
6.75% 4/1/17 | | 2,310,000 | | 2,367,750 |
| | 75,849,958 |
Homebuilding/Real Estate - 2.5% |
American Real Estate Partners/American Real Estate Finance Corp.: | | | | |
7.125% 2/15/13 | | 3,370,000 | | 3,370,000 |
8.125% 6/1/12 | | 11,585,000 | | 11,932,550 |
K. Hovnanian Enterprises, Inc.: | | | | |
6% 1/15/10 | | 490,000 | | 465,500 |
6.25% 1/15/15 | | 920,000 | | 871,700 |
8.875% 4/1/12 | | 1,570,000 | | 1,601,400 |
KB Home 7.75% 2/1/10 | | 6,910,000 | | 7,013,650 |
Technical Olympic USA, Inc.: | | | | |
7.5% 3/15/11 | | 880,000 | | 728,200 |
7.5% 1/15/15 | | 5,860,000 | | 4,570,800 |
10.375% 7/1/12 | | 885,000 | | 805,350 |
|
| Principal Amount | | Value
(Note 1) |
WCI Communities, Inc.: | | | | |
6.625% 3/15/15 | | $ 2,535,000 | | $ 2,180,100 |
7.875% 10/1/13 | | 830,000 | | 742,850 |
| | 34,282,100 |
Hotels - 0.7% |
Grupo Posadas SA de CV 8.75% 10/4/11 (d) | | 3,875,000 | | 4,049,375 |
Host Marriott LP 7.125% 11/1/13 | | 5,390,000 | | 5,511,275 |
| | 9,560,650 |
Insurance - 0.2% |
UnumProvident Corp. 7.375% 6/15/32 | | 580,000 | | 618,963 |
UnumProvident Finance Co. PLC 6.85% 11/15/15 (d) | | 1,500,000 | | 1,582,635 |
| | 2,201,598 |
Leisure - 1.9% |
Royal Caribbean Cruises Ltd.: | | | | |
7% 6/15/13 | | 4,720,000 | | 4,804,200 |
yankee 7.5% 10/15/27 | | 1,980,000 | | 1,925,550 |
Six Flags, Inc. 9.75% 4/15/13 | | 450,000 | | 421,875 |
Town Sports International Holdings, Inc. 0% 2/1/14 (c) | | 1,052,000 | | 915,240 |
Town Sports International, Inc. 9.625% 4/15/11 | | 5,344,000 | | 5,637,920 |
Universal City Development Partners Ltd./UCDP Finance, Inc. 11.75% 4/1/10 | | 5,125,000 | | 5,490,156 |
Universal City Florida Holding Co. I/II: | | | | |
8.375% 5/1/10 | | 575,000 | | 587,938 |
10.1213% 5/1/10 (e) | | 5,780,000 | | 5,967,850 |
| | 25,750,729 |
Metals/Mining - 4.3% |
Arch Western Finance LLC 6.75% 7/1/13 | | 6,050,000 | | 5,989,500 |
Compass Minerals International, Inc.: | | | | |
0% 12/15/12 (c) | | 4,520,000 | | 4,463,500 |
0% 6/1/13 (c) | | 8,615,000 | | 8,205,788 |
Drummond Co., Inc. 7.375% 2/15/16 (d) | | 7,370,000 | | 7,075,200 |
FMG Finance Pty Ltd.: | | | | |
9.3694% 9/1/11 (d)(e) | | 3,090,000 | | 3,082,275 |
10% 9/1/13 (d) | | 2,010,000 | | 2,070,300 |
10.625% 9/1/16 (d) | | 595,000 | | 636,650 |
Massey Energy Co. 6.875% 12/15/13 | | 5,415,000 | | 5,090,100 |
Peabody Energy Corp.: | | | | |
7.375% 11/1/16 | | 2,675,000 | | 2,848,875 |
7.875% 11/1/26 | | 1,945,000 | | 2,090,875 |
PNA Group, Inc. 10.75% 9/1/16 (d) | | 4,345,000 | | 4,497,075 |
Nonconvertible Bonds - continued |
| Principal Amount | | Value
(Note 1) |
Metals/Mining - continued |
RathGibson, Inc. 11.25% 2/15/14 | | $ 4,820,000 | | $ 5,157,400 |
Vedanta Resources PLC 6.625% 2/22/10 (d) | | 8,875,000 | | 8,764,063 |
| | 59,971,601 |
Paper - 1.5% |
Catalyst Paper Corp. 8.625% 6/15/11 | | 1,710,000 | | 1,727,100 |
Georgia-Pacific Corp.: | | | | |
7% 1/15/15 (d) | | 8,720,000 | | 8,752,264 |
8% 1/15/24 | | 1,470,000 | | 1,492,050 |
8.875% 5/15/31 | | 2,725,000 | | 2,861,250 |
Jefferson Smurfit Corp. U.S. 7.5% 6/1/13 | | 1,580,000 | | 1,497,050 |
Stone Container Corp. 9.75% 2/1/11 | | 1,878,000 | | 1,936,688 |
Stone Container Finance Co. 7.375% 7/15/14 | | 3,080,000 | | 2,864,400 |
| | 21,130,802 |
Publishing/Printing - 0.9% |
Dex Media West LLC/Dex Media West Finance Co. 8.5% 8/15/10 | | 2,175,000 | | 2,256,563 |
The Reader's Digest Association, Inc. 6.5% 3/1/11 | | 10,605,000 | | 10,883,381 |
| | 13,139,944 |
Railroad - 0.7% |
Kansas City Southern Railway Co. 7.5% 6/15/09 | | 9,860,000 | | 9,958,600 |
Restaurants - 1.3% |
Carrols Corp. 9% 1/15/13 | | 5,255,000 | | 5,360,100 |
Friendly Ice Cream Corp. 8.375% 6/15/12 | | 6,665,000 | | 6,265,100 |
Landry's Seafood Restaurants, Inc. 7.5% 12/15/14 | | 6,915,000 | | 6,759,413 |
| | 18,384,613 |
Services - 3.6% |
Ashtead Capital, Inc. 9% 8/15/16 (d) | | 3,090,000 | | 3,298,575 |
Avis Budget Car Rental LLC/Avis Budget Finance, Inc.: | | | | |
7.625% 5/15/14 (d) | | 3,105,000 | | 3,011,850 |
7.75% 5/15/16 (d) | | 2,320,000 | | 2,250,400 |
7.8738% 5/15/14 (d)(e) | | 550,000 | | 532,125 |
Education Management LLC/Education Management Finance Corp. 10.25% 6/1/16 (d) | | 2,435,000 | | 2,575,013 |
FTI Consulting, Inc.: | | | | |
7.625% 6/15/13 | | 4,965,000 | | 5,089,125 |
7.75% 10/1/16 (d) | | 2,665,000 | | 2,758,275 |
Iron Mountain, Inc.: | | | | |
8.25% 7/1/11 | | 5,110,000 | | 5,135,550 |
8.625% 4/1/13 | | 5,270,000 | | 5,428,100 |
|
| Principal Amount | | Value
(Note 1) |
Penhall International Corp. 12% 8/1/14 (d) | | $ 2,650,000 | | $ 2,875,250 |
Rental Service Co. 9.5% 12/1/14 (d) | | 2,830,000 | | 2,914,900 |
Rural/Metro Corp. 0% 3/15/16 (c) | | 3,185,000 | | 2,468,375 |
Service Corp. International: | | | | |
7% 6/15/17 | | 75,000 | | 75,938 |
7.375% 10/1/14 | | 2,530,000 | | 2,631,200 |
7.625% 10/1/18 | | 1,855,000 | | 1,961,663 |
United Rentals North America, Inc. 7% 2/15/14 | | 7,300,000 | | 7,099,250 |
| | 50,105,589 |
Shipping - 3.4% |
OMI Corp. 7.625% 12/1/13 | | 9,595,000 | | 9,834,875 |
Overseas Shipholding Group, Inc.: | | | | |
7.5% 2/15/24 | | 550,000 | | 558,250 |
8.25% 3/15/13 | | 1,295,000 | | 1,362,988 |
Ship Finance International Ltd. 8.5% 12/15/13 | | 25,180,000 | | 25,117,023 |
Teekay Shipping Corp. 8.875% 7/15/11 | | 10,093,000 | | 10,887,824 |
| | 47,760,960 |
Super Retail - 1.8% |
GSC Holdings Corp./Gamestop, Inc. 8% 10/1/12 | | 7,595,000 | | 7,936,775 |
Michaels Stores, Inc.: | | | | |
10% 11/1/14 (d) | | 4,470,000 | | 4,615,275 |
11.375% 11/1/16 (d) | | 4,490,000 | | 4,641,538 |
NBC Acquisition Corp. 0% 3/15/13 (c) | | 1,665,000 | | 1,332,000 |
Nebraska Book Co., Inc. 8.625% 3/15/12 | | 3,050,000 | | 2,928,000 |
Sonic Automotive, Inc. 8.625% 8/15/13 | | 3,690,000 | | 3,800,700 |
| | 25,254,288 |
Technology - 8.2% |
Activant Solutions, Inc. 9.5% 5/1/16 (d) | | 1,330,000 | | 1,230,250 |
Amkor Technology, Inc. 9.25% 6/1/16 | | 4,195,000 | | 4,100,613 |
Avago Technologies Finance Ltd.: | | | | |
10.125% 12/1/13 (d) | | 3,400,000 | | 3,578,500 |
10.8694% 6/1/13 (d)(e) | | 3,380,000 | | 3,515,200 |
Celestica, Inc.: | | | | |
7.625% 7/1/13 | | 2,090,000 | | 2,037,750 |
7.875% 7/1/11 | | 7,750,000 | | 7,691,875 |
Freescale Semiconductor, Inc.: | | | | |
8.875% 12/15/14 (d) | | 4,145,000 | | 4,140,026 |
9.125% 12/15/14 pay-in-kind (d) | | 2,910,000 | | 2,891,958 |
9.25% 12/15/14 (d)(e) | | 2,910,000 | | 2,884,683 |
10.125% 12/15/16 (d) | | 3,920,000 | | 3,925,096 |
IKON Office Solutions, Inc. 7.75% 9/15/15 | | 5,615,000 | | 5,860,656 |
Nonconvertible Bonds - continued |
| Principal Amount | | Value
(Note 1) |
Technology - continued |
Lucent Technologies, Inc.: | | | | |
6.45% 3/15/29 | | $ 8,660,000 | | $ 8,010,500 |
6.5% 1/15/28 | | 3,465,000 | | 3,205,125 |
MagnaChip Semiconductor SA/MagnaChip Semiconductor Finance Co.: | | | | |
8% 12/15/14 | | 945,000 | | 628,425 |
8.61% 12/15/11 (e) | | 1,890,000 | | 1,625,400 |
Nortel Networks Corp.: | | | | |
9.6238% 7/15/11 (d)(e) | | 3,340,000 | | 3,519,525 |
10.125% 7/15/13 (d) | | 3,825,000 | | 4,140,563 |
Northern Telecom Capital Corp. 7.875% 6/15/26 | | 475,000 | | 425,125 |
Northern Telecom Ltd. yankee 6.875% 9/1/23 | | 840,000 | | 714,000 |
NXP BV: | | | | |
7.875% 10/15/14 (d) | | 3,580,000 | | 3,696,350 |
8.118% 10/15/13 (d)(e) | | 2,970,000 | | 3,010,838 |
9.5% 10/15/15 (d) | | 6,065,000 | | 6,231,788 |
Sanmina-SCI Corp.: | | | | |
6.75% 3/1/13 | | 3,485,000 | | 3,232,338 |
8.125% 3/1/16 | | 4,130,000 | | 3,964,800 |
Seagate Technology HDD Holdings 6.8% 10/1/16 | | 2,350,000 | | 2,350,000 |
STATS ChipPAC Ltd. 7.5% 7/19/10 | | 5,185,000 | | 5,249,813 |
SunGard Data Systems, Inc.: | | | | |
9.125% 8/15/13 | | 3,865,000 | | 4,058,250 |
10.25% 8/15/15 | | 1,945,000 | | 2,073,856 |
UGS Capital Corp. II 10.3481% 6/1/11 pay-in-kind (d)(e) | | 6,055,901 | | 6,116,460 |
Xerox Capital Trust I 8% 2/1/27 | | 4,400,000 | | 4,510,000 |
Xerox Corp.: | | | | |
6.4% 3/15/16 | | 1,145,000 | | 1,165,621 |
6.75% 2/1/17 | | 2,305,000 | | 2,402,963 |
7.625% 6/15/13 | | 2,340,000 | | 2,457,000 |
| | 114,645,347 |
Telecommunications - 7.9% |
Centennial Communications Corp. 10% 1/1/13 | | 1,000,000 | | 1,062,500 |
Centennial Communications Corp./Centennial Cellular Operating Co. LLC/Centennial Puerto Rico Operations Corp. 8.125% 2/1/14 | | 1,585,000 | | 1,616,700 |
Digicel Ltd. 9.25% 9/1/12 (d) | | 5,335,000 | | 5,681,775 |
Intelsat Ltd.: | | | | |
6.5% 11/1/13 | | 11,870,000 | | 10,089,500 |
7.625% 4/15/12 | | 10,795,000 | | 9,985,375 |
9.25% 6/15/16 (d) | | 5,790,000 | | 6,180,825 |
11.25% 6/15/16 (d) | | 4,170,000 | | 4,597,425 |
11.3544% 6/15/13 (d)(e) | | 2,700,000 | | 2,835,000 |
|
| Principal Amount | | Value
(Note 1) |
Intelsat Subsidiary Holding Co. Ltd. 10.4844% 1/15/12 (e) | | $ 3,115,000 | | $ 3,142,256 |
Level 3 Financing, Inc.: | | | | |
9.25% 11/1/14 (d) | | 12,005,000 | | 12,215,088 |
12.25% 3/15/13 | | 5,435,000 | | 6,162,203 |
MetroPCS Wireless, Inc. 9.25% 11/1/14 (d) | | 5,200,000 | | 5,395,000 |
Millicom International Cellular SA 10% 12/1/13 | | 1,490,000 | | 1,624,100 |
Mobile Telesystems Finance SA 8% 1/28/12 (d) | | 3,158,000 | | 3,315,900 |
PanAmSat Corp.: | | | | |
9% 8/15/14 | | 5,374,000 | | 5,709,875 |
9% 6/15/16 (d) | | 3,820,000 | | 4,044,425 |
Qwest Corp.: | | | | |
7.5% 10/1/14 | | 3,840,000 | | 4,089,600 |
8.61% 6/15/13 (e) | | 7,630,000 | | 8,265,579 |
Rogers Communications, Inc. 9.625% 5/1/11 | | 1,020,000 | | 1,162,800 |
U.S. West Communications: | | | | |
6.875% 9/15/33 | | 2,535,000 | | 2,433,600 |
7.5% 6/15/23 | | 4,335,000 | | 4,400,025 |
Windstream Corp.: | | | | |
8.125% 8/1/13 (d) | | 2,350,000 | | 2,546,930 |
8.625% 8/1/16 (d) | | 2,565,000 | | 2,815,088 |
| | 109,371,569 |
Textiles & Apparel - 0.8% |
Hanesbrands, Inc. 8.735% 12/15/14 (d)(e) | | 1,440,000 | | 1,463,400 |
Levi Strauss & Co.: | | | | |
8.875% 4/1/16 | | 7,165,000 | | 7,451,600 |
10.1216% 4/1/12 (e) | | 1,890,000 | | 1,939,613 |
| | 10,854,613 |
TOTAL NONCONVERTIBLE BONDS (Cost $1,176,824,198) | 1,208,757,333 |
Commercial Mortgage Securities - 0.0% |
|
LB Multi-family Mortgage Trust Series 1991-4 Class A1, 7.25% 4/25/21 (d)(e)
(Cost $143,248) | | 185,924 | | 167,332 |
Common Stocks - 0.1% |
| | Shares | | |
Textiles & Apparel - 0.1% |
Arena Brands Holding Corp. Class B (a)(g)
(Cost $1,974,627) | | 48,889 | | 722,091 |
Floating Rate Loans - 7.9% |
| Principal Amount | | Value
(Note 1) |
Automotive - 1.7% |
Ford Motor Co. term loan 8.36% 12/15/13 (e) | | $ 14,770,000 | | $ 14,788,463 |
Lear Corp. term loan 7.8656% 4/25/12 (e) | | 2,652,020 | | 2,655,335 |
Oshkosh Truck Co. Tranche B, term loan 7.35% 12/6/13 (e) | | 5,910,000 | | 5,913,694 |
| | 23,357,492 |
Cable TV - 1.1% |
Charter Communications Operating LLC Tranche B, term loan 8.005% 4/28/13 (e) | | 5,498,000 | | 5,525,490 |
CSC Holdings, Inc. Tranche B, term loan 7.1228% 3/29/13 (e) | | 4,925,250 | | 4,922,172 |
Insight Midwest Holdings LLC Tranche B, term loan 7.61% 4/6/14 (e) | | 4,830,000 | | 4,857,169 |
| | 15,304,831 |
Diversified Financial Services - 0.4% |
LPL Holdings, Inc. Tranche C, term loan 8.1137% 6/29/14 (e) | | 5,200,000 | | 5,226,000 |
Electric Utilities - 0.8% |
Covanta Energy Corp.: | | | | |
Tranche 1: | | | | |
Credit-Linked Deposit 7.6% 6/24/12 (e) | | 3,999,608 | | 4,034,604 |
term loan 7.6149% 6/24/12 (e) | | 2,858,960 | | 2,883,976 |
Tranche 2, term loan 10.85% 6/24/13 (e) | | 4,631,250 | | 4,718,086 |
| | 11,636,666 |
Energy - 0.7% |
Sandridge Energy, Inc. term loan 10.1904% 11/21/07 (e) | | 4,760,000 | | 4,795,700 |
Targa Resources, Inc./Targa Resources Finance Corp.: | | | | |
Credit-Linked Deposit 7.4888% 10/31/12 (e) | | 605,806 | | 607,321 |
term loan: | | | | |
7.6% 10/31/07 (e) | | 2,230,000 | | 2,230,000 |
7.6237% 10/31/12 (e) | | 2,492,641 | | 2,498,873 |
| | 10,131,894 |
Food/Beverage/Tobacco - 0.1% |
Pierre Foods, Inc. Tranche B, term loan 7.61% 6/30/10 (e) | | 840,000 | | 843,150 |
Gaming - 0.8% |
Kerzner International Ltd.: | | | | |
term loan 8.3531% 9/1/13 (e) | | 3,181,250 | | 3,129,555 |
Class DD, term loan 8.3531% 9/1/13 (e)(f) | | 1,908,750 | | 1,877,733 |
|
| Principal Amount | | Value
(Note 1) |
Venetian Macau Ltd. Tranche B, term loan: | | | | |
5/26/12 (f) | | $ 2,103,333 | | $ 2,103,333 |
8.12% 5/26/13 (e) | | 4,206,667 | | 4,248,733 |
| | 11,359,354 |
Paper - 0.7% |
Georgia-Pacific Corp. Tranche B1, term loan 7.3561% 12/23/12 (e) | | 9,484,200 | | 9,543,476 |
Services - 0.5% |
NES Rentals Holdings, Inc. Tranche 2, term loan 12.125% 7/21/13 (e) | | 4,570,000 | | 4,604,275 |
RSC Equipment Rental Tranche 2LN, term loan 8.8466% 11/30/13 (e) | | 2,860,000 | | 2,892,175 |
| | 7,496,450 |
Super Retail - 0.2% |
Michaels Stores, Inc. Tranche B, term loan 8.375% 10/31/13 (e) | | 3,330,000 | | 3,285,080 |
Technology - 0.5% |
Fidelity National Information Solutions, Inc.: | | | | |
Tranche A, term loan 6.6% 3/9/11 (e) | | 5,107,424 | | 5,094,655 |
Tranche B, term loan 7.1% 3/9/13 (e) | | 1,926,510 | | 1,925,306 |
| | 7,019,961 |
Telecommunications - 0.4% |
Qwest Corp. Tranche B, term loan 6.95% 6/30/10 (e) | | 1,880,000 | | 1,915,250 |
Wind Telecomunicazioni Spa term loan 12.54% 12/21/11 (e) | | 2,910,000 | | 2,950,013 |
| | 4,865,263 |
TOTAL FLOATING RATE LOANS (Cost $109,628,444) | 110,069,617 |
Money Market Funds - 3.6% |
| | Shares | | |
Fidelity Cash Central Fund, 5.37% (b)
(Cost $49,383,175) | | 49,383,175 | | 49,383,175 |
TOTAL INVESTMENT PORTFOLIO - 98.6% (Cost $1,337,953,692) | | | 1,369,099,548 |
NET OTHER ASSETS - 1.4% | | | 19,912,773 |
NET ASSETS - 100% | | $ 1,389,012,321 |
Legend |
(a) Non-income producing |
(b) Affiliated fund that is available only to investment companies and other accounts managed by Fidelity Investments. The rate quoted is the annualized seven-day yield of the fund at period end. A complete unaudited listing of the fund's holdings as of its most recent quarter end is available upon request. |
(c) Security initially issued in zero coupon form which converts to coupon form at a specified rate and date. The rate shown is the rate at period end. |
(d) Security exempt from registration under Rule 144A of the Securities Act of 1933. These securities may be resold in transactions exempt from registration, normally to qualified institutional buyers. At the end of the period, the value of these securities amounted to $301,097,782 or 21.7% of net assets. |
(e) The coupon rate shown on floating or adjustable rate securities represents the rate at period end. |
(f) Position or a portion of the position represents an unfunded loan commitment. At period end, the total principal amount and market value of unfunded commitments totaled $3,375,833 and $3,355,155, respectively. The coupon rate will be determined at time of settlement. |
(g) Restricted securities - Investment in securities not registered under the Securities Act of 1933 (excluding 144A issues). At the end of the period, the value of restricted securities (excluding 144A issues) amounted to $722,091 or 0.1% of net assets. |
Additional information on each holding is as follows: |
Security | Acquisition Date | Acquisition Cost |
Arena Brands Holding Corp. Class B | 6/18/97 | $ 1,974,627 |
Affiliated Central Funds |
Information regarding fiscal year to date income earned by the Fund from investments in Fidelity Central Funds is as follows: |
Fund | Income earned |
Fidelity Cash Central Fund | $ 2,434,175 |
Other Information |
Distribution of investments by country of issue, as a percentage of total net assets, is as follows: |
United States of America | 83.9% |
Bermuda | 4.8% |
Canada | 3.8% |
Marshall Islands | 1.8% |
United Kingdom | 1.0% |
Others (individually less than 1%) | 4.7% |
| 100.0% |
Income Tax Information |
At December 31, 2006, the fund had a capital loss carryforward of approximately $1,110,768,989 of which $249,734,104, $772,554,243 and $88,480,642 will expire on December 31, 2008, 2009 and 2010, respectively. |
See accompanying notes which are an integral part of the financial statements.
Annual Report
VIP High Income Portfolio
Financial Statements
Statement of Assets and Liabilities
| December 31, 2006 |
Assets | | |
Investment in securities, at value - See accompanying schedule: Unaffiliated issuers (cost $1,288,570,517) | $ 1,319,716,373 | |
Fidelity Central Funds (cost $49,383,175) | 49,383,175 | |
Total Investments (cost $1,337,953,692) | | $ 1,369,099,548 |
Cash | | 5,247,145 |
Receivable for investments sold | | 5,448,511 |
Receivable for fund shares sold | | 32,641 |
Interest receivable | | 22,731,150 |
Prepaid expenses | | 6,377 |
Other receivables | | 4,668 |
Total assets | | 1,402,570,040 |
| | |
Liabilities | | |
Payable for investments purchased | $ 12,304,130 | |
Payable for fund shares redeemed | 53,566 | |
Accrued management fee | 664,431 | |
Distribution fees payable | 46,178 | |
Other affiliated payables | 124,613 | |
Other payables and accrued expenses | 364,801 | |
Total liabilities | | 13,557,719 |
| | |
Net Assets | | $ 1,389,012,321 |
Net Assets consist of: | | |
Paid in capital | | $ 2,464,817,919 |
Undistributed net investment income | | 3,860,284 |
Accumulated undistributed net realized gain (loss) on investments | | (1,110,811,738) |
Net unrealized appreciation (depreciation) on investments | | 31,145,856 |
Net Assets | | $ 1,389,012,321 |
Statement of Assets and Liabilities - continued
| December 31, 2006 |
| | |
Initial Class:
Net Asset Value, offering price and redemption price per share ($922,565,040 ÷ 145,321,849 shares) | | $ 6.35 |
| | |
Service Class:
Net Asset Value, offering price and redemption price per share ($277,545,665 ÷ 43,923,717 shares) | | $ 6.32 |
| | |
Service Class 2:
Net Asset Value, offering price and redemption price per share ($110,503,133 ÷ 17,685,742 shares) | | $ 6.25 |
| | |
Initial Class R:
Net Asset Value, offering price and redemption price per share ($92,594 ÷ 14,604 shares) | | $ 6.34 |
| | |
Service Class R:
Net Asset Value, offering price and redemption price per share ($92,353 ÷ 14,621 shares) | | $ 6.32 |
| | |
Service Class 2R:
Net Asset Value, offering price and redemption price per share ($91,967 ÷ 14,716 shares) | | $ 6.25 |
| | |
Investor Class:
Net Asset Value, offering price and redemption price per share ($78,121,569 ÷ 12,328,364 shares) | | $ 6.34 |
See accompanying notes which are an integral part of the financial statements.
VIP High Income Portfolio
Statement of Operations
| Year ended December 31, 2006 |
| | |
Investment Income | | |
Interest | | 109,941,287 |
Income from Fidelity Central Funds | | 2,434,175 |
Total income | | 112,375,462 |
| | |
Expenses | | |
Management fee | $ 7,904,598 | |
Transfer agent fees | 992,388 | |
Distribution fees | 526,826 | |
Accounting fees and expenses | 502,943 | |
Custodian fees and expenses | 35,696 | |
Independent trustees' compensation | 5,256 | |
Audit | 81,447 | |
Legal | 16,552 | |
Interest | 6,880 | |
Miscellaneous | 367,306 | |
Total expenses before reductions | 10,439,892 | |
Expense reductions | (17,479) | 10,422,413 |
Net investment income | | 101,953,049 |
Realized and Unrealized Gain (Loss) Net realized gain (loss) on: | | |
Investment securities: | | |
Unaffiliated issuers | | 19,571,030 |
Change in net unrealized appreciation (depreciation) on investment securities | | 25,541,215 |
Net gain (loss) | | 45,112,245 |
Net increase (decrease) in net assets resulting from operations | | $ 147,065,294 |
Statement of Changes in Net Assets
| Year ended
December 31, 2006 | Year ended
December 31, 2005 |
Increase (Decrease) in Net Assets | | |
Operations | | |
Net investment income | $ 101,953,049 | $ 110,572,722 |
Net realized gain (loss) | 19,571,030 | 14,492,871 |
Change in net unrealized appreciation (depreciation) | 25,541,215 | (85,881,349) |
Net increase (decrease) in net assets resulting from operations | 147,065,294 | 39,184,244 |
Distributions to shareholders from net investment income | (103,253,559) | (242,303,630) |
Share transactions - net increase (decrease) | (158,550,860) | (136,476,901) |
Total increase (decrease) in net assets | (114,739,125) | (339,596,287) |
| | |
Net Assets | | |
Beginning of period | 1,503,751,446 | 1,843,347,733 |
End of period (including undistributed net investment income of $3,860,284 and undistributed net investment income of $5,394,674, respectively) | $ 1,389,012,321 | $ 1,503,751,446 |
See accompanying notes which are an integral part of the financial statements.
Annual Report
Financial Highlights - Initial Class
Years ended December 31, | 2006 | 2005 | 2004 | 2003 | 2002 |
Selected Per-Share Data | | | | | |
Net asset value, beginning of period | $ 6.17 | $ 7.00 | $ 6.95 | $ 5.93 | $ 6.41 |
Income from Investment Operations | | | | | |
Net investment income C | .476 | .457 | .494 | .520 | .496 G |
Net realized and unrealized gain (loss) | .216 | (.281) | .126 | .980 | (.306) G |
Total from investment operations | .692 | .176 | .620 | 1.500 | .190 |
Distributions from net investment income | (.512) | (1.006) | (.570) | (.480) | (.670) |
Net asset value, end of period | $ 6.35 | $ 6.17 | $ 7.00 | $ 6.95 | $ 5.93 |
Total Return A, B | 11.24% | 2.70% | 9.59% | 27.26% | 3.44% |
Ratios to Average Net Assets D, F | | | | | |
Expenses before reductions | .71% | .70% | .71% | .69% | .70% |
Expenses net of fee waivers, if any | .71% | .70% | .71% | .69% | .70% |
Expenses net of all reductions | .71% | .70% | .71% | .69% | .70% |
Net investment income | 7.40% | 6.98% | 7.43% | 8.25% | 8.65% G |
Supplemental Data | | | | | |
Net assets, end of period (000 omitted) | $ 922,565 | $ 1,080,002 | $ 1,371,736 | $ 1,593,714 | $ 1,145,562 |
Portfolio turnover rate E | 65% | 95% | 128% | 130% | 96% |
A Total returns do not reflect charges attributable to your insurance company's separate account. Inclusion of these charges would reduce the total returns shown.
B Total returns would have been lower had certain expenses not been reduced during the periods shown.
C Calculated based on average shares outstanding during the period.
D Fees and expenses of the underlying Fidelity Central Funds are not included in the Fund's expense ratio. The Fund indirectly bears its proportionate share of the expenses of any underlying Fidelity Central Funds.
E Amount does not include the portfolio activity of any underlying Fidelity Central Funds.
F Expense ratios reflect operating expenses of the class. Expenses before reductions do not reflect amounts reimbursed by the investment adviser or reductions from brokerage service arrangements or other expense offset arrangements and do not represent the amount paid by the class during periods when reimbursements or reductions occur. Expenses net of fee waivers reflect expenses after reimbursement by the investment adviser but prior to reductions from brokerage service arrangements or other expense offset arrangements. Expenses net of all reductions represent the net expenses paid by the class.
G As a result of a revision to reflect accretion of market discount using the interest method, certain amounts for the year ended December 31, 2002, have been reclassified from what was previously reported. The impact of this change was a decrease to net investment income (loss) of $.017 per share with a corresponding increase to net realized and unrealized gain (loss) per share. The ratio of net investment income (loss) to average net assets decreased from 8.95% to 8.65%. The reclassification has no impact on the net assets of the Fund.
Financial Highlights - Service Class
Years ended December 31, | 2006 | 2005 | 2004 | 2003 | 2002 |
Selected Per-Share Data | | | | | |
Net asset value, beginning of period | $ 6.14 | $ 6.97 | $ 6.92 | $ 5.91 | $ 6.38 |
Income from Investment Operations | | | | | |
Net investment income C | .467 | .448 | .486 | .513 | .488 G |
Net realized and unrealized gain (loss) | .218 | (.283) | .124 | .967 | (.288) G |
Total from investment operations | .685 | .165 | .610 | 1.480 | .200 |
Distributions from net investment income | (.505) | (.995) | (.560) | (.470) | (.670) |
Net asset value, end of period | $ 6.32 | $ 6.14 | $ 6.97 | $ 6.92 | $ 5.91 |
Total Return A, B | 11.18% | 2.52% | 9.47% | 26.97% | 3.62% |
Ratios to Average Net Assets D, F | | | | | |
Expenses before reductions | .81% | .80% | .81% | .79% | .80% |
Expenses net of fee waivers, if any | .81% | .80% | .81% | .79% | .80% |
Expenses net of all reductions | .81% | .80% | .81% | .79% | .80% |
Net investment income | 7.30% | 6.88% | 7.33% | 8.15% | 8.55% G |
Supplemental Data | | | | | |
Net assets, end of period (000 omitted) | $ 277,546 | $ 319,380 | $ 377,122 | $ 417,928 | $ 260,489 |
Portfolio turnover rate E | 65% | 95% | 128% | 130% | 96% |
A Total returns do not reflect charges attributable to your insurance company's separate account. Inclusion of these charges would reduce the total returns shown.
B Total returns would have been lower had certain expenses not been reduced during the periods shown.
C Calculated based on average shares outstanding during the period.
D Fees and expenses of the underlying Fidelity Central Funds are not included in the Fund's expense ratio. The Fund indirectly bears its proportionate share of the expenses of any underlying Fidelity Central Funds.
E Amount does not include the portfolio activity of any underlying Fidelity Central Funds.
F Expense ratios reflect operating expenses of the class. Expenses before reductions do not reflect amounts reimbursed by the investment adviser or reductions from brokerage service arrangements or other expense offset arrangements and do not represent the amount paid by the class during periods when reimbursements or reductions occur. Expenses net of fee waivers reflect expenses after reimbursement by the investment adviser but prior to reductions from brokerage service arrangements or other expense offset arrangements. Expenses net of all reductions represent the net expenses paid by the class.
G As a result of a revision to reflect accretion of market discount using the interest method, certain amounts for the year ended December 31, 2002, have been reclassified from what was previously reported. The impact of this change was a decrease to net investment income (loss) of $.017 per share with a corresponding increase to net realized and unrealized gain (loss) per share. The ratio of net investment income (loss) to average net assets decreased from 8.85% to 8.55%. The reclassification has no impact on the net assets of the Fund.
See accompanying notes which are an integral part of the financial statements.
VIP High Income Portfolio
Financial Highlights - Service Class 2
Years ended December 31, | 2006 | 2005 | 2004 | 2003 | 2002 |
Selected Per-Share Data | | | | | |
Net asset value, beginning of period | $ 6.08 | $ 6.91 | $ 6.87 | $ 5.87 | $ 6.36 |
Income from Investment Operations | | | | | |
Net investment income C | .453 | .433 | .470 | .501 | .472 G |
Net realized and unrealized gain (loss) | .216 | (.284) | .130 | .959 | (.292) G |
Total from investment operations | .669 | .149 | .600 | 1.460 | .180 |
Distributions from net investment income | (.499) | (.979) | (.560) | (.460) | (.670) |
Net asset value, end of period | $ 6.25 | $ 6.08 | $ 6.91 | $ 6.87 | $ 5.87 |
Total Return A, B | 11.02% | 2.31% | 9.38% | 26.75% | 3.30% |
Ratios to Average Net Assets D, F | | | | | |
Expenses before reductions | .97% | .95% | .97% | .95% | .97% |
Expenses net of fee waivers, if any | .97% | .95% | .97% | .95% | .97% |
Expenses net of all reductions | .97% | .95% | .97% | .95% | .97% |
Net investment income | 7.14% | 6.72% | 7.17% | 7.99% | 8.38% G |
Supplemental Data | | | | | |
Net assets, end of period (000 omitted) | $ 110,503 | $ 86,757 | $ 94,246 | $ 76,383 | $ 32,499 |
Portfolio turnover rate E | 65% | 95% | 128% | 130% | 96% |
A Total returns do not reflect charges attributable to your insurance company's separate account. Inclusion of these charges would reduce the total returns shown.
B Total returns would have been lower had certain expenses not been reduced during the periods shown.
C Calculated based on average shares outstanding during the period.
D Fees and expenses of the underlying Fidelity Central Funds are not included in the Fund's expense ratio. The Fund indirectly bears its proportionate share of the expenses of any underlying Fidelity Central Funds.
E Amount does not include the portfolio activity of any underlying Fidelity Central Funds.
F Expense ratios reflect operating expenses of the class. Expenses before reductions do not reflect amounts reimbursed by the investment adviser or reductions from brokerage service arrangements or other expense offset arrangements and do not represent the amount paid by the class during periods when reimbursements or reductions occur. Expenses net of fee waivers reflect expenses after reimbursement by the investment adviser but prior to reductions from brokerage service arrangements or other expense offset arrangements. Expenses net of all reductions represent the net expenses paid by the class.
G As a result of a revision to reflect accretion of market discount using the interest method, certain amounts for the year ended December 31, 2002, have been reclassified from what was previously reported. The impact of this change was a decrease to net investment income (loss) of $.017 per share with a corresponding increase to net realized and unrealized gain (loss) per share. The ratio of net investment income (loss) to average net assets decreased from 8.68% to 8.38%. The reclassification has no impact on the net assets of the Fund.
Financial Highlights - Initial Class R
Years ended December 31, | 2006 | 2005 | 2004 H |
Selected Per-Share Data | | | |
Net asset value, beginning of period | $ 6.16 | $ 7.00 | $ 6.47 |
Income from Investment Operations | | | |
Net investment income E | .475 | .455 | .338 |
Net realized and unrealized gain (loss) | .218 | (.288) | .192 |
Total from investment operations | .693 | .167 | .530 |
Distributions from net investment income | (.513) | (1.007) | - |
Net asset value, end of period | $ 6.34 | $ 6.16 | $ 7.00 |
Total Return B, C, D | 11.27% | 2.55% | 8.19% |
Ratios to Average Net Assets F, I | | | |
Expenses before reductions | .71% | .70% | .71% A |
Expenses net of fee waivers, if any | .71% | .70% | .71% A |
Expenses net of all reductions | .71% | .70% | .71% A |
Net investment income | 7.39% | 6.98% | 7.16% A |
Supplemental Data | | | |
Net assets, end of period (000 omitted) | $ 93 | $ 83 | $ 81 |
Portfolio turnover rate G | 65% | 95% | 128% |
A Annualized
B Total returns for periods of less than one year are not annualized.
C Total returns do not reflect charges attributable to your insurance company's separate account. Inclusion of these charges would reduce the total returns shown.
D Total returns would have been lower had certain expenses not been reduced during the periods shown.
E Calculated based on average shares outstanding during the period.
F Fees and expenses of the underlying Fidelity Central Funds are not included in the Fund's expense ratio. The Fund indirectly bears its proportionate share of the expenses of any underlying Fidelity Central Funds.
G Amount does not include the portfolio activity of any underlying Fidelity Central Funds.
H For the period April 14, 2004 (commencement of sale of shares) to December 31, 2004.
I Expense ratios reflect operating expenses of the class. Expenses before reductions do not reflect amounts reimbursed by the investment adviser or reductions from brokerage service arrangements or other expense offset arrangements and do not represent the amount paid by the class during periods when reimbursements or reductions occur. Expense ratios before reductions for start-up periods may not be representative of longer-term operating periods. Expenses net of fee waivers reflect expenses after reimbursement by the investment adviser but prior to reductions from brokerage service arrangements or other expense offset arrangements. Expenses net of all reductions represent the net expenses paid by the class.
See accompanying notes which are an integral part of the financial statements.
Annual Report
Financial Highlights - Service Class R
Years ended December 31, | 2006 | 2005 | 2004 H |
Selected Per-Share Data | | | |
Net asset value, beginning of period | $ 6.14 | $ 6.97 | $ 6.45 |
Income from Investment Operations | | | |
Net investment income E | .467 | .447 | .332 |
Net realized and unrealized gain (loss) | .219 | (.282) | .188 |
Total from investment operations | .686 | .165 | .520 |
Distributions from net investment income | (.506) | (.995) | - |
Net asset value, end of period | $ 6.32 | $ 6.14 | $ 6.97 |
Total Return B, C, D | 11.19% | 2.53% | 8.06% |
Ratios to Average Net Assets F, I | | | |
Expenses before reductions | .81% | .80% | .81% A |
Expenses net of fee waivers, if any | .81% | .80% | .81% A |
Expenses net of all reductions | .81% | .80% | .81% A |
Net investment income | 7.30% | 6.88% | 7.05% A |
Supplemental Data | | | |
Net assets, end of period (000 omitted) | $ 92 | $ 83 | $ 81 |
Portfolio turnover rate G | 65% | 95% | 128% |
A Annualized
B Total returns for periods of less than one year are not annualized.
C Total returns do not reflect charges attributable to your insurance company's separate account. Inclusion of these charges would reduce the total returns shown.
D Total returns would have been lower had certain expenses not been reduced during the periods shown.
E Calculated based on average shares outstanding during the period.
F Fees and expenses of the underlying Fidelity Central Funds are not included in the Fund's expense ratio. The Fund indirectly bears its proportionate share of the expenses of any underlying Fidelity Central Funds.
G Amount does not include the portfolio activity of any underlying Fidelity Central Funds.
H For the period April 14, 2004 (commencement of sale of shares) to December 31, 2004.
I Expense ratios reflect operating expenses of the class. Expenses before reductions do not reflect amounts reimbursed by the investment adviser or reductions from brokerage service arrangements or other expense offset arrangements and do not represent the amount paid by the class during periods when reimbursements or reductions occur. Expense ratios before reductions for start-up periods may not be representative of longer-term operating periods. Expenses net of fee waivers reflect expenses after reimbursement by the investment adviser but prior to reductions from brokerage service arrangements or other expense offset arrangements. Expenses net of all reductions represent the net expenses paid by the class.
Financial Highlights - Service Class 2R
Years ended December 31, | 2006 | 2005 | 2004 H |
Selected Per-Share Data | | | |
Net asset value, beginning of period | $ 6.08 | $ 6.91 | $ 6.40 |
Income from Investment Operations | | | |
Net investment income E | .453 | .433 | .322 |
Net realized and unrealized gain (loss) | .214 | (.282) | .188 |
Total from investment operations | .667 | .151 | .510 |
Distributions from net investment income | (.497) | (.981) | - |
Net asset value, end of period | $ 6.25 | $ 6.08 | $ 6.91 |
Total Return B, C, D | 10.99% | 2.33% | 7.97% |
Ratios to Average Net Assets F, I | | | |
Expenses before reductions | .96% | .94% | .96% A |
Expenses net of fee waivers, if any | .96% | .94% | .96% A |
Expenses net of all reductions | .96% | .94% | .96% A |
Net investment income | 7.14% | 6.73% | 6.90% A |
Supplemental Data | | | |
Net assets, end of period (000 omitted) | $ 92 | $ 83 | $ 81 |
Portfolio turnover rate G | 65% | 95% | 128% |
A Annualized
B Total returns for periods of less than one year are not annualized.
C Total returns do not reflect charges attributable to your insurance company's separate account. Inclusion of these charges would reduce the total returns shown.
D Total returns would have been lower had certain expenses not been reduced during the periods shown.
E Calculated based on average shares outstanding during the period.
F Fees and expenses of the underlying Fidelity Central Funds are not included in the Fund's expense ratio. The Fund indirectly bears its proportionate share of the expenses of any underlying Fidelity Central Funds.
G Amount does not include the portfolio activity of any underlying Fidelity Central Funds.
H For the period April 14, 2004 (commencement of sale of shares) to December 31, 2004.
I Expense ratios reflect operating expenses of the class. Expenses before reductions do not reflect amounts reimbursed by the investment adviser or reductions from brokerage service arrangements or other expense offset arrangements and do not represent the amount paid by the class during periods when reimbursements or reductions occur. Expense ratios before reductions for start-up periods may not be representative of longer-term operating periods. Expenses net of fee waivers reflect expenses after reimbursement by the investment adviser but prior to reductions from brokerage service arrangements or other expense offset arrangements. Expenses net of all reductions represent the net expenses paid by the class.
See accompanying notes which are an integral part of the financial statements.
VIP High Income Portfolio
Financial Highlights - Investor Class
Years ended December 31, | 2006 | 2005 H |
Selected Per-Share Data | | |
Net asset value, beginning of period | $ 6.16 | $ 6.54 |
Income from Investment Operations | | |
Net investment income E | .471 | .193 |
Net realized and unrealized gain (loss) | .220 | (.089) |
Total from investment operations | .691 | .104 |
Distributions from net investment income | (.511) | (.484) |
Net asset value, end of period | $ 6.34 | $ 6.16 |
Total Return B, C, D | 11.24% | 1.60% |
Ratios to Average Net Assets F, I | | |
Expenses before reductions | .80% | .82% A |
Expenses net of fee waivers, if any | .80% | .82% A |
Expenses net of all reductions | .79% | .82% A |
Net investment income | 7.31% | 6.86% A |
Supplemental Data | | |
Net assets, end of period (000 omitted) | $ 78,122 | $ 17,363 |
Portfolio turnover rate G | 65% | 95% |
A Annualized
B Total returns for periods of less than one year are not annualized.
C Total returns do not reflect charges attributable to your insurance company's separate account. Inclusion of these charges would reduce the total returns shown.
D Total returns would have been lower had certain expenses not been reduced during the periods shown.
E Calculated based on average shares outstanding during the period.
F Fees and expenses of the underlying Fidelity Central Funds are not included in the Fund's expense ratio. The Fund indirectly bears its proportionate share of the expenses of any underlying Fidelity Central Funds.
G Amount does not include the portfolio activity of any underlying Fidelity Central Funds.
H For the period July 21, 2005 (commencement of sale of shares) to December 31, 2005.
I Expense ratios reflect operating expenses of the class. Expenses before reductions do not reflect amounts reimbursed by the investment adviser or reductions from brokerage service arrangements or other expense offset arrangements and do not represent the amount paid by the class during periods when reimbursements or reductions occur. Expense ratios before reductions for start-up periods may not be representative of longer-term operating periods. Expenses net of fee waivers reflect expenses after reimbursement by the investment adviser but prior to reductions from brokerage service arrangements or other expense offset arrangements. Expenses net of all reductions represent the net expenses paid by the class.
See accompanying notes which are an integral part of the financial statements.
Annual Report
Notes to Financial Statements
For the period ended December 31, 2006
1. Significant Accounting Policies.
VIP High Income Portfolio (the Fund) is a fund of Variable Insurance Products Fund (the trust) and is authorized to issue an unlimited number of shares. The trust is registered under the Investment Company Act of 1940, as amended (the 1940 Act), as an open-end management investment company organized as a Massachusetts business trust. Shares of the Fund may only be purchased by insurance companies for the purpose of funding variable annuity or variable life insurance contracts. The Fund offers the following classes of shares: Initial Class shares, Service Class shares, Service Class 2 shares, Initial Class R shares, Service Class R shares, Service Class 2R shares, and Investor Class shares. All classes have equal rights and voting privileges, except for matters affecting a single class. Investment income, realized and unrealized capital gains and losses, the common expenses of the Fund, and certain fund-level expense reductions, if any, are allocated on a pro rata basis to each class based on the relative net assets of each class to the total net assets of the Fund. Each class differs with respect to transfer agent and distribution and service plan fees incurred. Certain expense reductions also differ by class.
The Fund may invest in Fidelity Central Funds which are open-end investment companies available to investment companies and other accounts managed by Fidelity Management & Research (FMR) and its affiliates. The financial statements have been prepared in conformity with accounting principles generally accepted in the United States of America, which require management to make certain estimates and assumptions at the date of the financial statements. The following summarizes the significant accounting policies of the Fund, which are also consistently followed by the Fidelity Central Funds:
Security Valuation. Investments are valued and net asset value per share is calculated (NAV calculation) as of the close of business of the New York Stock Exchange, normally 4:00 p.m. Eastern time. Wherever possible, the Fund uses independent pricing services approved by the Board of Trustees to value its investments.
Debt securities, including restricted securities, for which quotations are readily available, are valued by independent pricing services or by dealers who make markets in such securities. Pricing services consider yield or price of bonds of comparable quality, coupon, maturity and type as well as dealer supplied prices. Equity securities, including restricted securities, for which market quotations are readily available, are valued at the last reported sale price or official closing price as reported by an independent pricing service on the primary market or exchange on which they are traded. In the event there were no sales during the day or closing prices are not available, securities are valued at the last quoted bid price.
When current market prices or quotations are not readily available or do not accurately reflect fair value, valuations may be determined in accordance with procedures adopted by the Board of Trustees. The frequency of when fair value pricing is used is unpredictable. The value of securities used for NAV calculation under fair value pricing may differ from published prices for the same securities. Investments in open-end mutual funds, including the Fidelity Central Funds, are valued at their closing net asset value each business day. Short-term securities with remaining maturities of sixty days or less for which quotations are not readily available are valued at amortized cost, which approximates value.
Investment Transactions and Income. Security transactions, including the Fund's investment activity in the Fidelity Central Funds, are accounted for as of trade date. Gains and losses on securities sold are determined on the basis of identified cost and may include proceeds received from litigation. Distributions received on securities that represent a return of capital or capital gain are recorded as a reduction of cost of investments and/or as a realized gain. The Fund estimates the components of distributions received that may be considered return of capital distributions or capital gain distributions. Interest income is accrued as earned, with any income distributions receivable as of period end included in Interest Receivable on the Statement of Assets and Liabilities. Interest income includes coupon interest and amortization of premium and accretion of discount on debt securities.
Expenses. Most expenses of the trust can be directly attributed to a fund. Expenses which cannot be directly attributed are apportioned among each Fund in the trust. Expense estimates are accrued in the period to which they relate and adjustments are made when actual amounts are known.
Income Tax Information and Distributions to Shareholders. Each year, the Fund intends to qualify as a regulated investment company by distributing all of its taxable income and realized gains under Subchapter M of the Internal Revenue Code. As a result, no provision for income taxes is required in the accompanying financial statements.
Distributions are recorded on the ex-dividend date. Income dividends and capital gain distributions are declared separately for each class. Income and capital gain distributions are determined in accordance with income tax regulations, which may differ from generally accepted accounting principles.
Capital accounts within the financial statements are adjusted for permanent book-tax differences. These adjustments have no impact on net assets or the results of operations. Temporary book-tax differences will reverse in a subsequent period.
Book-tax differences are primarily due to market discount, capital loss carryforwards and losses deferred due to wash sales.
VIP High Income Portfolio
1. Significant Accounting Policies - continued
Income Tax Information and Distributions to Shareholders - continued
The tax-basis components of distributable earnings and the federal tax cost as of period end were as follows:
Unrealized appreciation | $ 43,304,661 |
Unrealized depreciation | (8,664,345) |
Net unrealized appreciation (depreciation) | 34,640,316 |
Undistributed ordinary income | 324,505 |
Capital loss carryforward | (1,110,768,989) |
| |
Cost for federal income tax purposes | $ 1,334,459,232 |
The tax character of distributions paid was as follows:
| December 31, 2006 | December 31, 2005 |
Ordinary Income | $ 103,253,559 | $ 242,303,630 |
Trading (Redemption) Fees. Initial Class R shares, Service Class R shares, and Service Class 2R shares held less than 60 days are subject to a redemption fee equal to 1% of the proceeds of the redeemed shares. All redemption fees, including any estimated redemption fees paid by FMR, are retained by the Fund and accounted for as an addition to paid in capital.
New Accounting Pronouncements. In July 2006, Financial Accounting Standards Board Interpretation No. 48, Accounting for Uncertainty in Income Taxes - an interpretation of FASB Statement 109 (FIN 48), was issued and is effective on the last business day of the semiannual reporting period for fiscal years beginning after December 15, 2006. FIN 48 sets forth a threshold for financial statement recognition, measurement and disclosure of a tax position taken or expected to be taken on a tax return. Management is currently evaluating the impact, if any, the adoption of FIN 48 will have on the Fund's net assets, results of operations and financial statement disclosures.
In addition, in September 2006, Statement of Financial Accounting Standards No. 157, Fair Value Measurements (SFAS 157), was issued and is effective for fiscal years beginning after November 15, 2007. SFAS 157 defines fair value, establishes a framework for measuring fair value and expands disclosures about fair value measurements. Management is currently evaluating the impact the adoption of SFAS 157 will have on the Fund's financial statement disclosures.
2. Operating Policies.
Repurchase Agreements. FMR has received an Exemptive Order from the Securities and Exchange Commission (the SEC) which permits the Fund and other affiliated entities of FMR to transfer uninvested cash balances into joint trading accounts which are then invested in repurchase agreements. The Fund may also invest directly with institutions in repurchase agreements. Repurchase agreements are collateralized by government or non-government securities. Upon settlement date, collateral is held in segregated accounts with custodian banks and may be obtained in the event of a default of the counterparty. The Fund monitors, on a daily basis, the value of the collateral to ensure it is at least equal to the principal amount of the repurchase agreement (including accrued interest). In the event of a default by the counterparty, realization of the collateral proceeds could be delayed, during which time the value of the collateral may decline.
Restricted Securities. The Fund may invest in securities that are subject to legal or contractual restrictions on resale. These securities generally may be resold in transactions exempt from registration or to the public if the securities are registered. Disposal of these securities may involve time-consuming negotiations and expense, and prompt sale at an acceptable price may be difficult. Information regarding restricted securities is included at the end of the Fund's Schedule of Investments.
Loans and Other Direct Debt Instruments. The Fund may invest in loans and loan participations, trade claims or other receivables. These investments may include standby financing commitments, including revolving credit facilities, that obligate the Fund to supply additional cash to the borrower on demand. Loan participations involve a risk of insolvency of the lending bank or other financial intermediary. The Fund may be contractually obligated to receive approval from the agent bank and/or borrower prior to the sale of these investments.
3. Purchases and Sales of Investments.
Purchases and sales of securities, other than short-term securities, aggregated $865,731,965 and $1,016,668,370, respectively.
Annual Report
Notes to Financial Statements - continued
4. Fees and Other Transactions with Affiliates.
Management Fee. FMR and its affiliates provide the Fund with investment management related services for which the Fund pays a monthly management fee. The management fee is the sum of an individual fund fee rate that is based on an annual rate of .45% of the Fund's average net assets and a group fee rate that averaged .12% during the period. The group fee rate is based upon the average net assets of all the mutual funds advised by FMR. The group fee rate decreases as assets under management increase and increases as assets under management decrease. For the period, the total annual management fee rate was .57% of the Fund's average net assets.
Distribution and Service Plan. In accordance with Rule 12b-1 of the 1940 Act, the Fund has adopted separate 12b-1 Plans for each Service Class of shares. Each Service Class pays Fidelity Distributors Corporation (FDC), an affiliate of FMR, a service fee. For the period, the service fee is based on an annual rate of .10% of Service Class' and Service Class R's average net assets and .25% of Service Class 2's and Service Class 2R's average net assets.
For the period, each class paid FDC the following amounts, all of which were re-allowed to insurance companies for the distribution of shares and providing shareholder support services:
Service Class | $ 287,507 |
Service Class 2 | 239,015 |
Service Class R | 86 |
Service Class 2R | 218 |
| $ 526,826 |
Transfer Agent Fees. Fidelity Investments Institutional Operations Company, Inc. (FIIOC), an affiliate of FMR, is the fund's transfer, dividend disbursing, and shareholder servicing agent. FIIOC receives an asset-based fee with respect to each class. Each class with the exception of Investor Class pays a transfer agent fee, excluding out of pocket expenses, equal to an annual rate of .07% of their month end net assets. Investor Class pays a monthly asset-based transfer agent fee of .14% of its month end net assets. The total transfer agent fees paid by each class to FIIOC, including out of pocket expenses, were as follows:
Initial Class | $ 659,851 |
Service Class | 192,109 |
Service Class 2 | 69,704 |
Initial Class R | 61 |
Service Class R | 61 |
Service Class 2R | 60 |
Investor Class | 70,542 |
| $ 992,388 |
Accounting Fees. Fidelity Service Company, Inc. (FSC), an affiliate of FMR, maintains the Fund's accounting records. The fee is based on the level of average net assets for the month.
Investments in Fidelity Central Funds. The Fund may invest in Fidelity Central Funds. The Fund's Schedule of Investments lists each of the Fidelity Central Funds as an investment of the Fund but does not include the underlying holdings of each Fidelity Central Fund. As an Investing Fund, the Fund indirectly bears its proportionate share of the expenses of the underlying Fidelity Central Funds. A complete unaudited list of holdings for each Fidelity Central Fund is available upon request. In addition, the financial statements of the Fidelity Central Funds, which are not covered by the Fund's Report of Independent Registered Public Accounting Firm, are available on the EDGAR Database on the SEC's web site, www.sec.gov, or upon request.
The Money Market Central Funds seek preservation of capital and current income and are managed by Fidelity Investments Money Management, Inc. (FIMM), an affiliate of FMR.
Interfund Lending Program. Pursuant to an Exemptive Order issued by the SEC, the Fund, along with other registered investment companies having management contracts with FMR, may participate in an interfund lending program. This program provides an alternative credit facility allowing the funds to borrow from, or lend money to, other participating affiliated funds. At period end, there were no interfund loans outstanding. The Fund's activity in this program during the period for which loans were outstanding was as follows:
Borrower or Lender | Average Daily
Loan Balance | Weighted Average Interest Rate | Interest
Expense |
Borrower | $ 50,002,000 | 4.95% | $ 6,880 |
VIP High Income Portfolio
5. Committed Line of Credit.
The Fund participates with other funds managed by FMR in a $4.2 billion credit facility (the "line of credit") to be utilized for temporary or emergency purposes to fund shareholder redemptions or for other short-term liquidity purposes. The Fund has agreed to pay commitment fees on its pro rata portion of the line of credit, which amounted to $3,930 and is reflected in Miscellaneous Expense on the Statement of Operations. During the period, there were no borrowings on this line of credit.
6. Expense Reductions.
Through arrangements with the fund's custodian, credits realized as a result of uninvested cash balances were used to reduce the Fund's expenses. During the period, these credits reduced the Fund's custody expenses by $13,761.
7. Other.
The Fund's organizational documents provide former and current trustees and officers with a limited indemnification against liabilities arising in connection with the performance of their duties to the Fund. In the normal course of business, the Fund may also enter into contracts that provide general indemnifications. The Fund's maximum exposure under these arrangements is unknown as this would be dependent on future claims that may be made against the Fund. The risk of material loss from such claims is considered remote.
At the end of the period, FMR or its affiliates were the owners of record of 21% of the total outstanding shares of the Fund and two otherwise unaffiliated shareholders were the owners of record of 48% of the total outstanding shares of the Fund.
The United States Securities and Exchange Commission ("SEC") is conducting an investigation of FMR (covering the years 2002 to 2004) arising from gifts, gratuities and business entertainment provided by certain brokers to certain individuals who were employed on FMR's domestic equity trading desk during that period. FMR is in discussions with the SEC staff regarding the possible resolution of the matter, but as of period-end no final resolution has been reached.
In December 2006, the Independent Trustees completed their own investigation of the matter with the assistance of independent counsel. The Independent Trustees and FMR agree that, despite the absence of proof that the Fidelity mutual funds experienced diminished execution quality as a result of the improper receipt of gifts and business entertainment, the conduct at issue was serious and is worthy of redress. Accordingly, the Independent Trustees have requested and FMR has agreed to pay $42 million to Fidelity mutual funds, plus interest to be determined at the time that payment is made. A method of allocating this payment among the funds has not yet been determined. The total payment to the Fund is not anticipated to have a material impact on the Fund's net assets. In addition, FMR reimbursed related legal expenses which are recorded in the accompanying Statement of Operations as an expense reduction.
8. Distributions to Shareholders.
Distributions to shareholders of each class were as follows:
Years ended December 31, | 2006 | 2005 A |
From net investment income | | |
Initial Class | $ 68,637,194 | $ 178,515,690 |
Service Class | 20,731,877 | 49,309,732 |
Service Class 2 | 8,160,312 | 13,285,899 |
Initial Class R | 6,935 | 12,124 |
Service Class R | 6,854 | 12,013 |
Service Class 2R | 6,779 | 11,933 |
Investor Class | 5,703,608 | 1,156,239 |
Total | $ 103,253,559 | $ 242,303,630 |
A Distributions for Investor Class are for the period July 21, 2005 (commencement of sale of shares) to December 31, 2005.
Annual Report
Notes to Financial Statements - continued
9. Share Transactions.
Transactions for each class of shares were as follows:
| Shares | Dollars |
Years ended December 31, | 2006 | 2005 A | 2006 | 2005 A |
Initial Class | | | | |
Shares sold | 20,391,924 | 37,931,608 | $ 130,862,386 | $ 248,546,554 |
Reinvestment of distributions | 10,827,982 | 28,128,457 | 68,637,194 | 178,515,690 |
Shares redeemed | (60,996,323) | (86,845,685) | (389,548,495) | (567,756,363) |
Net increase (decrease) | (29,776,417) | (20,785,620) | $ (190,048,915) | $ (140,694,119) |
Service Class | | | | |
Shares sold | 15,758,056 | 29,061,863 | $ 100,943,180 | $ 188,149,058 |
Reinvestment of distributions | 3,286,143 | 7,805,887 | 20,731,877 | 49,309,732 |
Shares redeemed | (27,123,963) | (38,948,041) | (172,895,592) | (254,601,512) |
Net increase (decrease) | (8,079,764) | (2,080,291) | $ (51,220,535) | $ (17,142,722) |
Service Class 2 | | | | |
Shares sold | 8,956,747 | 16,971,594 | $ 56,663,410 | $ 108,910,856 |
Reinvestment of distributions | 1,307,892 | 2,124,657 | 8,160,311 | 13,285,899 |
Shares redeemed | (6,845,198) | (18,474,037) | (43,209,500) | (119,201,649) |
Net increase (decrease) | 3,419,441 | 622,214 | $ 21,614,221 | $ 2,995,106 |
Initial Class R | | | | |
Reinvestment of distributions | 1,095 | 1,917 | $ 6,935 | $ 12,124 |
Net increase (decrease) | 1,095 | 1,917 | $ 6,935 | $ 12,124 |
Service Class R | | | | |
Reinvestment of distributions | 1,087 | 1,906 | $ 6,854 | $ 12,013 |
Net increase (decrease) | 1,087 | 1,906 | $ 6,854 | $ 12,013 |
Service Class 2R | | | | |
Reinvestment of distributions | 1,087 | 1,910 | $ 6,779 | $ 11,933 |
Net increase (decrease) | 1,087 | 1,910 | $ 6,779 | $ 11,933 |
Investor Class | | | | |
Shares sold | 10,403,901 | 2,735,811 | $ 66,865,919 | $ 17,864,904 |
Reinvestment of distributions | 901,089 | 188,006 | 5,703,608 | 1,156,238 |
Shares redeemed | (1,794,789) | (105,654) | (11,485,726) | (692,378) |
Net increase (decrease) | 9,510,201 | 2,818,163 | $ 61,083,801 | $ 18,328,764 |
A Share transactions for Investor Class are for the period July 21, 2005 (commencement of sale of shares) to December 31, 2005.
VIP High Income Portfolio
Report of Independent Registered Public Accounting Firm
To the Trustees of Variable Insurance Products Fund and the Shareholders of VIP High Income Portfolio:
In our opinion, the accompanying statement of assets and liabilities, including the schedule of investments, and the related statements of operations and of changes in net assets and the financial highlights present fairly, in all material respects, the financial position of VIP High Income Portfolio (a fund of Variable Insurance Products Fund) at December 31, 2006, the results of its operations for the year then ended, the changes in its net assets for each of the two years in the period then ended and the financial highlights for each of the periods indicated, in conformity with accounting principles generally accepted in the United States of America. These financial statements and financial highlights (hereafter referred to as "financial statements") are the responsibility of the VIP High Income Portfolio's management; our responsibility is to express an opinion on these financial statements based on our audits. We conducted our audits of these financial statements in accordance with the standards of the Public Company Accounting Oversight Board (United States). Those standards require that we plan and perform the audit to obtain reasonable assurance about whether the financial statements are free of material misstatement. An audit includes examining, on a test basis, evidence supporting the amounts and disclosures in the financial statements, assessing the accounting principles used and significant estimates made by management, and evaluating the overall financial statement presentation. We believe that our audits, which included confirmation of securities at December 31, 2006 by correspondence with the custodian and brokers, provide a reasonable basis for our opinion.
/s/ PricewaterhouseCoopers LLP
PricewaterhouseCoopers LLP
Boston, Massachusetts
February 13, 2007
Annual Report
Trustees and Officers
The Trustees, Member of the Advisory Board, and executive officers of the trust and fund, as applicable, are listed below. The Board of Trustees governs the fund and is responsible for protecting the interests of shareholders. The Trustees are experienced executives who meet periodically throughout the year to oversee the fund's activities, review contractual arrangements with companies that provide services to the fund, and review the fund's performance. Each of the Trustees oversees 348 funds advised by FMR or an affiliate.
The Trustees hold office without limit in time except that (a) any Trustee may resign; (b) any Trustee may be removed by written instrument, signed by at least two-thirds of the number of Trustees prior to such removal; (c) any Trustee who requests to be retired or who has become incapacitated by illness or injury may be retired by written instrument signed by a majority of the other Trustees; and (d) any Trustee may be removed at any special meeting of shareholders by a two-thirds vote of the outstanding voting securities of the trust. Each Trustee who is not an interested person (as defined in the 1940 Act) (Independent Trustee), shall retire not later than the last day of the calendar year in which his or her 72nd birthday occurs. The Independent Trustees may waive this mandatory retirement age policy with respect to individual Trustees. The executive officers and Advisory Board Member hold office without limit in time, except that any officer and Advisory Board Member may resign or may be removed by a vote of a majority of the Trustees at any regular meeting or any special meeting of the Trustees. Except as indicated, each individual has held the office shown or other offices in the same company for the past five years.
The fund's Statement of Additional Information (SAI) includes more information about the Trustees. To request a free copy, call Fidelity at 1-877-208-0098.
Interested Trustees*:
Correspondence intended for each Trustee who is an interested person may be sent to Fidelity Investments, 82 Devonshire Street, Boston, Massachusetts 02109.
Name, Age; Principal Occupation |
Edward C. Johnson 3d (76) |
| Year of Election or Appointment: 1981 Mr. Johnson is Chairman of the Board of Trustees. Mr. Johnson serves as President (2006-present), Chief Executive Officer, Chairman, and a Director of FMR Corp.; Chairman and a Director of FMR; Chairman and a Director of Fidelity Research & Analysis Company (FRAC); Chairman and a Director of Fidelity Investments Money Management, Inc.; and Chairman (2001- present) and a Director of FMR Co., Inc. In addition, Mr. Johnson serves as Chairman and Director of Fidelity International Limited (FIL). |
Robert L. Reynolds (54) |
| Year of Election or Appointment: 2003 Mr. Reynolds is President and a Director of FMR (2005-present), Fidelity Investments Money Management, Inc. (2005-present), and FMR Co., Inc. (2005-present). Mr. Reynolds also serves as Vice Chairman (2006-present), a Director (2003-present), and Chief Operating Officer of FMR Corp. and a Director of Strategic Advisers, Inc. (2005-present). He also serves on the Board at Fidelity Investments Canada, Ltd. |
* Trustees have been determined to be "Interested Trustees" by virtue of, among other things, their affiliation with the trust or various entities under common control with FMR.
Independent Trustees:
Correspondence intended for each Independent Trustee (that is, the Trustees other than the Interested Trustees) may be sent to Fidelity Investments, P.O. Box 55235, Boston, Massachusetts 02205-5235.
Name, Age; Principal Occupation |
Dennis J. Dirks (58) |
| Year of Election or Appointment: 2005 Prior to his retirement in May 2003, Mr. Dirks was Chief Operating Officer and a member of the Board of The Depository Trust & Clearing Corporation (DTCC) (1999-2003). He also served as President, Chief Operating Officer, and Board member of The Depository Trust Company (DTC) (1999-2003) and President and Board member of the National Securities Clearing Corporation (NSCC) (1999-2003). In addition, Mr. Dirks served as Chief Executive Officer and Board member of the Government Securities Clearing Corporation (2001-2003) and Chief Executive Officer and Board member of the Mortgage-Backed Securities Clearing Corporation (2001-2003). Mr. Dirks also serves as a Trustee and a member of the Finance Committee of Manhattan College (2005-present) and a Trustee and a member of the Finance Committee of AHRC of Nassau County (2006-present). |
Albert R. Gamper, Jr. (64) |
| Year of Election or Appointment: 2006 Prior to his retirement in December 2004, Mr. Gamper served as Chairman of the Board of CIT Group Inc. (commercial finance). During his tenure with CIT Group Inc. Mr. Gamper served in numerous senior management positions, including Chairman (1987-1989; 1999-2001; 2002-2004), Chief Executive Officer (1987-2004), and President (1989-2002). He currently serves as a member of the Board of Directors of Public Service Enterprise Group (utilities, 2001-present), Chairman of the Board of Governors, Rutgers University (2004-present), and Chairman of the Board of Saint Barnabas Health Care System. |
George H. Heilmeier (70) |
| Year of Election or Appointment: 2004 Dr. Heilmeier is Chairman Emeritus of Telcordia Technologies (communication software and systems), where prior to his retirement, he served as company Chairman and Chief Executive Officer. He currently serves on the Boards of Directors of The Mitre Corporation (systems engineering and information technology support for the government), and HRL Laboratories (private research and development, 2004-present). He is Chairman of the General Motors Science & Technology Advisory Board and a Life Fellow of the Institute of Electrical and Electronics Engineers (IEEE). Dr. Heilmeier is a member of the Defense Science Board and the National Security Agency Advisory Board. He is also a member of the National Academy of Engineering, the American Academy of Arts and Sciences, and the Board of Overseers of the School of Engineering and Applied Science of the University of Pennsylvania. Previously, Dr. Heilmeier served as a Director of TRW Inc. (automotive, space, defense, and information technology, 1992-2002), Compaq (1994-2002), Automatic Data Processing, Inc. (ADP) (technology-based business outsourcing, 1995-2002), INET Technologies Inc. (telecommunications network surveillance, 2001-2004), and Teletech Holdings (customer management services). He is the recipient of the 2005 Kyoto Prize in Advanced Technology for his invention of the liquid crystal display, and a member of the Consumer Electronics Hall of Fame. |
James H. Keyes (66) |
| Year of Election or Appointment: 2007 Prior to his retirement in 2003, Mr. Keyes was Chairman, President, and Chief Executive Officer of Johnson Controls, Inc. (automotive supplier, 1993-2003). He currently serves as a member of the boards of LSI Logic Corporation (semiconductor technologies), Navistar International Corporation (manufacture and sale of trucks, buses, and diesel engines, 2002-present), and Pitney Bowes, Inc. (integrated mail, messaging, and document management solutions). |
Marie L. Knowles (60) |
| Year of Election or Appointment: 2001 Prior to Ms. Knowles' retirement in June 2000, she served as Executive Vice President and Chief Financial Officer of Atlantic Richfield Company (ARCO) (diversified energy, 1996-2000). From 1993 to 1996, she was a Senior Vice President of ARCO and President of ARCO Transportation Company. She served as a Director of ARCO from 1996 to 1998. She currently serves as a Director of Phelps Dodge Corporation (copper mining and manufacturing) and McKesson Corporation (healthcare service, 2002-present). Ms. Knowles is a Trustee of the Brookings Institution and the Catalina Island Conservancy and also serves as a member of the Advisory Board for the School of Engineering of the University of Southern California. |
Ned C. Lautenbach (62) |
| Year of Election or Appointment: 2000 Mr. Lautenbach is Chairman of the Independent Trustees (2006-present). Mr. Lautenbach has been a partner of Clayton, Dubilier & Rice, Inc. (private equity investment firm) since September 1998. Previously, Mr. Lautenbach was with the International Business Machines Corporation (IBM) from 1968 until his retirement in 1998. Mr. Lautenbach serves as a Director of Sony Corporation (2006-present) and Eaton Corporation (diversified industrial) as well as the Philharmonic Center for the Arts in Naples, Florida. He also is a member of the Board of Trustees of Fairfield University (2005-present), as well as a member of the Council on Foreign Relations. |
Cornelia M. Small (62) |
| Year of Election or Appointment: 2005 Ms. Small is a member (2000-present) and Chairperson (2002-present) of the Investment Committee, and a member (2002- present) of the Board of Trustees of Smith College. Previously, she served as Chief Investment Officer (1999-2000), Director of Global Equity Investments (1996-1999), and a member of the Board of Directors of Scudder, Stevens & Clark (1990-1997) and Scudder Kemper Investments (1997-1999). In addition, Ms. Small served as Co-Chair (2000-2003) of the Annual Fund for the Fletcher School of Law and Diplomacy. |
William S. Stavropoulos (67) |
| Year of Election or Appointment: 2001 Mr. Stavropoulos is Chairman Emeritus of the Board of Directors of The Dow Chemical Company. Since joining The Dow Chemical Company in 1967, Mr. Stavropoulos served in numerous senior management positions, including President (1993-2000; 2002-2003), CEO (1995-2000; 2002-2004), and Chairman of the Executive Committee (2000-2004). Currently, he is a Director of NCR Corporation (data warehousing and technology solutions), BellSouth Corporation (telecommunications), Chemical Financial Corporation, Maersk Inc. (industrial conglomerate, 2002-present), and Metalmark Capital (private equity investment firm, 2005-present). He also serves as a member of the Board of Trustees of the American Enterprise Institute for Public Policy Research. In addition, Mr. Stavropoulos is a member of The Business Council, J.P. Morgan International Council and the University of Notre Dame Advisory Council for the College of Science. |
Kenneth L. Wolfe (67) |
| Year of Election or Appointment: 2005 Prior to his retirement in 2001, Mr. Wolfe was Chairman and Chief Executive Officer of Hershey Foods Corporation (1993-2001). He currently serves as a member of the boards of Adelphia Communications Corporation (2003-present), Bausch & Lomb, Inc., and Revlon Inc. (2004-present). |
Advisory Board Member and Executive Officers:
Correspondence intended for each executive officer and Mr. Lynch may be sent to Fidelity Investments, 82 Devonshire Street, Boston, Massachusetts 02109.
Name, Age; Principal Occupation |
Peter S. Lynch (62) |
| Year of Election or Appointment: 2003 Member of the Advisory Board of Variable Insurance Products Fund. Mr. Lynch is Vice Chairman and a Director of FMR, and Vice Chairman (2001-present) and a Director of FMR Co., Inc. Previously, Mr. Lynch served as a Trustee of the Fidelity funds (1990-2003). In addition, he serves as a Trustee of Boston College and as the Chairman of the Inner-City Scholarship Fund. |
Kimberley H. Monasterio (43) |
| Year of Election or Appointment: 2007 President and Treasurer of VIP High Income. Ms. Monasterio also serves as President and Treasurer of other Fidelity funds (2007-present) and is an employee of FMR (2004-present). Previously, Ms. Monasterio served as Deputy Treasurer of the Fidelity funds (2004-2006). Before joining Fidelity Investments, Ms. Monasterio served as Treasurer (2000-2004) and Chief Financial Officer (2002-2004) of the Franklin Templeton Funds and Senior Vice President of Franklin Templeton Services, LLC (2000-2004). |
Walter C. Donovan (44) |
| Year of Election or Appointment: 2005 Vice President of VIP High Income. Mr. Donovan also serves as Vice President of Fidelity's High Income Funds (2005-present). Mr. Donovan also serves as Executive Vice President of FMR (2005-present) and FMR Co., Inc. (2005-present). Previously, Mr. Donovan served as Vice President of Fidelity's Fixed-Income Funds (2005-2006), certain Asset Allocation Funds (2005-2006), certain Balanced Funds (2005-2006), and as Vice President and Director of Fidelity's International Equity Trading group (1998-2005). |
Robert A. Lawrence (46) |
| Year of Election or Appointment: 2006 Vice President of VIP High Income. Mr. Lawrence also serves as Vice President of the High Income Funds. Mr. Lawrence is Senior Vice President of FMR (2006-present) and FMR Co., Inc. (2006-present). Previously, Mr. Lawrence served as President of Fidelity Strategic Investments (2002-2005). |
Matthew J. Conti (39) |
| Year of Election or Appointment: 2003 Vice President of VIP High Income. Mr. Conti also serves as Vice President of other funds advised by FMR. Prior to assuming his current responsibilities, Mr. Conti worked as a research analyst and manager. Mr. Conti also serves as Vice President of FMR (2003) and FMR Co., Inc. (2003). |
Eric D. Roiter (58) |
| Year of Election or Appointment: 1998 Secretary of VIP High Income. He also serves as Secretary of other Fidelity funds; Vice President, General Counsel, and Secretary of FMR Co., Inc. (2001-present) and FMR; Assistant Secretary of Fidelity Management & Research (U.K.) Inc. (2001-present), Fidelity Research & Analysis Company (2001-present), and Fidelity Investments Money Management, Inc. (2001-present). Mr. Roiter is an Adjunct Member, Faculty of Law, at Boston College Law School (2003-present). Previously, Mr. Roiter served as Vice President and Secretary of Fidelity Distributors Corporation (FDC) (1998-2005). |
Stuart Fross (47) |
| Year of Election or Appointment: 2003 Assistant Secretary of VIP High Income. Mr. Fross also serves as Assistant Secretary of other Fidelity funds (2003-present), Vice President and Secretary of FDC (2005-present), and is an employee of FMR. |
R. Stephen Ganis (40) |
| Year of Election or Appointment: 2006 Anti-Money Laundering (AML) officer of VIP High Income. Mr. Ganis also serves as AML officer of other Fidelity funds (2006- present) and FMR Corp. (2003-present). Before joining Fidelity Investments, Mr. Ganis practiced law at Goodwin Procter, LLP (2000-2002). |
Joseph B. Hollis (58) |
| Year of Election or Appointment: 2006 Chief Financial Officer of VIP High Income. Mr. Hollis also serves as Chief Financial Officer of other Fidelity funds. Mr. Hollis is President of Fidelity Pricing and Cash Management Services (FPCMS) (2005-present). Mr. Hollis also serves as President and Director of Fidelity Service Company, Inc. (2006-present). Previously, Mr. Hollis served as Senior Vice President of Cash Management Services (1999-2002) and Investment Management Operations (2002-2005). |
Kenneth A. Rathgeber (59) |
| Year of Election or Appointment: 2004 Chief Compliance Officer of VIP High Income. Mr. Rathgeber also serves as Chief Compliance Officer of other Fidelity funds (2004-present) and Executive Vice President of Risk Oversight for Fidelity Investments (2002-present). He is Chief Compliance Officer of FMR (2005-present), FMR Co., Inc. (2005-present), Fidelity Management & Research (U.K.) Inc. (2005-present), Fidelity Research & Analysis Company (2005-present), Fidelity Investments Money Management, Inc. (2005-present), and Strategic Advisers, Inc. (2005-present). Previously, Mr. Rathgeber served as Executive Vice President and Chief Operating Officer for Fidelity Investments Institutional Services Company, Inc. (1998-2002). |
Bryan A. Mehrmann (45) |
| Year of Election or Appointment: 2005 Deputy Treasurer of VIP High Income. Mr. Mehrmann also serves as Deputy Treasurer of other Fidelity funds (2005-present) and is an employee of FMR. Previously, Mr. Mehrmann served as Vice President of Fidelity Investments Institutional Services Group (FIIS)/Fidelity Investments Institutional Operations Corporation, Inc. (FIIOC) Client Services (1998-2004). |
Kenneth B. Robins (37) |
| Year of Election or Appointment: 2005 Deputy Treasurer of VIP High Income. Mr. Robins also serves as Deputy Treasurer of other Fidelity funds (2005-present) and is an employee of FMR (2004-present). Before joining Fidelity Investments, Mr. Robins worked at KPMG LLP, where he was a partner in KPMG's department of professional practice (2002-2004) and a Senior Manager (1999-2000). In addition, Mr. Robins served as Assistant Chief Accountant, United States Securities and Exchange Commission (2000-2002). |
Robert G. Byrnes (40) |
| Year of Election or Appointment: 2005 Assistant Treasurer of VIP High Income. Mr. Byrnes also serves as Assistant Treasurer of other Fidelity funds (2005-present) and is an employee of FMR (2005-present). Previously, Mr. Byrnes served as Vice President of FPCMS (2003-2005). Before joining Fidelity Investments, Mr. Byrnes worked at Deutsche Asset Management where he served as Vice President of the Investment Operations Group (2000-2003). |
John H. Costello (60) |
| Year of Election or Appointment: 1986 Assistant Treasurer of VIP High Income. Mr. Costello also serves as Assistant Treasurer of other Fidelity funds and is an employee of FMR. |
Peter L. Lydecker (52) |
| Year of Election or Appointment: 2004 Assistant Treasurer of VIP High Income. Mr. Lydecker also serves as Assistant Treasurer of other Fidelity funds (2004) and is an employee of FMR. |
Mark Osterheld (51) |
| Year of Election or Appointment: 2002 Assistant Treasurer of VIP High Income. Mr. Osterheld also serves as Assistant Treasurer of other Fidelity funds (2002) and is an employee of FMR. |
Gary W. Ryan (48) |
| Year of Election or Appointment: 2005 Assistant Treasurer of VIP High Income. Mr. Ryan also serves as Assistant Treasurer of other Fidelity funds (2005-present) and is an employee of FMR (2005-present). Previously, Mr. Ryan served as Vice President of Fund Reporting in FPCMS (1999-2005). |
Salvatore Schiavone (41) |
| Year of Election or Appointment: 2005 Assistant Treasurer of VIP High Income. Mr. Schiavone also serves as Assistant Treasurer of other Fidelity funds (2005-present) and is an employee of FMR (2005-present). Before joining Fidelity Investments, Mr. Schiavone worked at Deutsche Asset Management, where he most recently served as Assistant Treasurer (2003-2005) of the Scudder Funds and Vice President and Head of Fund Reporting (1996-2003). |
VIP High Income Portfolio
Proxy Voting Results
A special meeting of the fund's shareholders was held on November 15, 2006. The results of votes taken among shareholders on the proposal before them are reported below. Each vote reported represents one dollar of net asset value held on the record date for the meeting.
PROPOSAL 1 |
To elect a Board of Trustees. A |
| # of
Votes | % of
Votes |
Dennis J. Dirks |
Affirmative | 17,902,425,874.20 | 95.888 |
Withheld | 767,753,174.62 | 4.112 |
TOTAL | 18,670,179,048.82 | 100.000 |
Albert R. Gamper, Jr. |
Affirmative | 17,903,848,885.90 | 95.895 |
Withheld | 766,330,162.92 | 4.105 |
TOTAL | 18,670,179,048.82 | 100.000 |
Robert M. Gates |
Affirmative | 17,872,803,847.04 | 95.729 |
Withheld | 797,375,201.78 | 4.271 |
TOTAL | 18,670,179,048.82 | 100.000 |
George H. Heilmeier |
Affirmative | 17,870,083,099.32 | 95.715 |
Withheld | 800,095,949.50 | 4.285 |
TOTAL | 18,670,179,048.82 | 100.000 |
Edward C. Johnson 3d |
Affirmative | 17,855,450,949.13 | 95.636 |
Withheld | 814,728,099.69 | 4.364 |
TOTAL | 18,670,179,048.82 | 100.000 |
Stephen P. Jonas |
Affirmative | 17,891,792,907.31 | 95.831 |
Withheld | 778,386,141.51 | 4.169 |
TOTAL | 18,670,179,048.82 | 100.000 |
James H. KeyesB |
Affirmative | 17,882,873,107.76 | 95.783 |
Withheld | 787,305,941.06 | 4.217 |
TOTAL | 18,670,179,048.82 | 100.000 |
Marie L. Knowles |
Affirmative | 17,891,908,567.08 | 95.831 |
Withheld | 778,270,481.74 | 4.169 |
TOTAL | 18,670,179,048.82 | 100.000 |
Ned C. Lautenbach |
Affirmative | 17,899,551,251.03 | 95.872 |
Withheld | 770,627,797.79 | 4.128 |
TOTAL | 18,670,179,048.82 | 100.000 |
| # of
Votes | % of
Votes |
William O. McCoy |
Affirmative | 17,860,461,325.05 | 95.663 |
Withheld | 809,717,723.77 | 4.337 |
TOTAL | 18,670,179,048.82 | 100.000 |
Robert L. Reynolds |
Affirmative | 17,894,978,918.13 | 95.848 |
Withheld | 775,200,130.69 | 4.152 |
TOTAL | 18,670,179,048.82 | 100.000 |
Cornelia M. Small |
Affirmative | 17,897,519,970.69 | 95.862 |
Withheld | 772,659,078.13 | 4.138 |
TOTAL | 18,670,179,048.82 | 100.000 |
William S. Stavropoulos |
Affirmative | 17,871,058,112.55 | 95.720 |
Withheld | 799,120,936.27 | 4.280 |
TOTAL | 18,670,179,048.82 | 100.000 |
Kenneth L. Wolfe |
Affirmative | 17,886,340,376.33 | 95.802 |
Withheld | 783,838,672.49 | 4.198 |
TOTAL | 18,670,179,048.82 | 100.000 |
A Denotes trust-wide proposal and voting results. B Effective on or about January 1, 2007. |
Annual Report
VIP High Income Portfolio
Annual Report
Investment Adviser
Fidelity Management & Research Company
Boston, MA
Investment Sub-Advisers
FMR Co., Inc.
Fidelity Research & Analysis Company (formerly Fidelity
Management & Research (Far East) Inc.)
Fidelity Investments Japan Limited
Fidelity International Investment Advisors
Fidelity International Investment Advisors (U.K.) Limited
General Distributor
Fidelity Distributors Corporation
Boston, MA
Transfer and Service Agents
Fidelity Investments Institutional Operations Company, Inc.
Boston, MA
Fidelity Service Company, Inc.
Boston, MA
Custodian
The Bank of New York
New York, NY
VIPHI-ANN-0207
1.540029.109
Fidelity® Variable Insurance Products:
High Income Portfolio - Class R
Annual Report
December 31, 2006
(2_fidelity_logos) (Registered_Trademark)
Contents
Performance | <Click Here> | How the fund has done over time. |
Management's Discussion | <Click Here> | The manager's review of fund performance, strategy and outlook. |
Shareholder Expense Example | <Click Here> | An example of shareholder expenses. |
Investment Changes | <Click Here> | A summary of major shifts in the fund's investments over the past six months. |
Investments | <Click Here> | A complete list of the fund's investments with their
market values. |
Financial Statements | <Click Here> | Statements of assets and liabilities, operations, and
changes in net assets, as well as financial highlights. |
Notes | <Click Here> | Notes to the financial statements. |
Report of Independent Registered Public Accounting Firm | <Click Here> | |
Trustees and Officers | <Click Here> | |
Proxy Voting Results | <Click Here> | |
To view a fund's proxy voting guidelines and proxy voting record for the 12-month period ended June 30, visit www.fidelity.com/proxyvotingresults or visit the Securities and Exchange Commission's (SEC) web site at www.sec.gov. You may also call 1-877-208-0098 to request a free copy of the proxy voting guidelines.
Fidelity Variable Insurance Products are separate account options which are purchased through a variable insurance contract.
Standard & Poor's, S&P and S&P 500 are registered service marks of The McGraw-Hill Companies, Inc. and have been licensed for use by Fidelity Distributors Corporation.
Other third party marks appearing herein are the property of their respective owners.
All other marks appearing herein are registered or unregistered trademarks or service marks of FMR Corp. or an affiliated company.
This report and the financial statements contained herein are submitted for the general information of the shareholders of the fund. This report is not authorized for distribution to prospective investors in the fund unless preceded or accompanied by an effective prospectus.
A fund files its complete schedule of portfolio holdings with the SEC for the first and third quarters of each fiscal year on Form N-Q. Forms N-Q are available on the SEC's web site at http://www.sec.gov. A fund's Forms N-Q may be reviewed and copied at the SEC's Public Reference Room in Washington, DC. Information regarding the operation of the SEC's Public Reference Room may be obtained by calling 1-800-SEC-0330. For a complete list of a fund's portfolio holdings, view the most recent quarterly holdings report, semiannual report, or annual report on Fidelity's web site at http://www.advisor.fidelity.com.
NOT FDIC INSURED · MAY LOSE VALUE · NO BANK GUARANTEE
Neither the fund nor Fidelity Distributors Corporation is a bank.
VIP High Income Portfolio
VIP High Income Portfolio
Performance: The Bottom Line
Average annual total return reflects the change in the value of an investment, assuming reinvestment of a class' dividend income and capital gains (the profits earned upon the sale of securities that have grown in value) and assuming a constant rate of performance each year. During periods of reimbursement by Fidelity, a fund's total return will be greater than it would be had the reimbursement not occurred. Performance numbers are net of all underlying fund operating expenses, but do not include any insurance charges imposed by your insurance company's separate account. If performance information included the effect of these additional charges, the total returns would have been lower. How a fund did yesterday is no guarantee of how it will do tomorrow.
Average Annual Total Returns
Periods ended December 31, 2006 | Past 1
year | Past 5
years | Past 10
years |
VIP High Income - Initial Class R A | 11.27% | 10.48% | 3.21% |
VIP High Income - Service Class R B | 11.19% | 10.43% | 3.12% |
VIP High Income - Service Class 2R C | 10.99% | 10.22% | 3.00% |
A The initial offering of Initial Class R shares took place on April 14, 2004. Returns prior to April 14, 2004 are those of Initial Class.
B The initial offering of Service Class R shares took place on April 14, 2004. Performance for Service Class R shares reflects an asset-based service fee (12b-1 fee). Returns from November 3, 1997 to April 14, 2004 are those of Service Class. Returns prior to November 3, 1997 are those of Initial Class and do not include the effects of a 12b-1 fee. Had Service Class R's 12b-1 fee been reflected, returns prior to November 3, 1997 would have been lower.
C The initial offering of Service Class 2R shares took place on April 14, 2004. Performance for Service Class 2R shares reflects an asset-based service fee (12b-1 fee). Returns from January 12, 2000 to April 14, 2004 are those of Service Class 2. Returns from November 3, 1997 to January 12, 2000 are those of Service Class which reflect a different 12b-1 fee. Service Class 2R returns prior to November 3, 1997 are those of Initial Class and do not include the effects of a 12b-1 fee. Had Service Class 2R's 12b-1 fee been reflected, returns prior to January 12, 2000 would have been lower.
$10,000 Over 10 Years
Let's say hypothetically that $10,000 was invested in VIP High Income Portfolio - Initial Class R on December 31, 1996. The chart shows how the value of your investment would have changed, and also shows how the Merrill Lynch® US High Yield Master II Constrained Index and the Merrill Lynch US High Yield Master II Index performed over the same period.
Beginning on January 1, 2006, the Merrill Lynch US High Yield Master II Constrained Index replaced the Merrill Lynch US High Yield Master II Index as the fund's primary index for all time periods because the Merrill Lynch U.S. High Yield Master II Constrained Index conforms more closely to the fund's investment strategy.
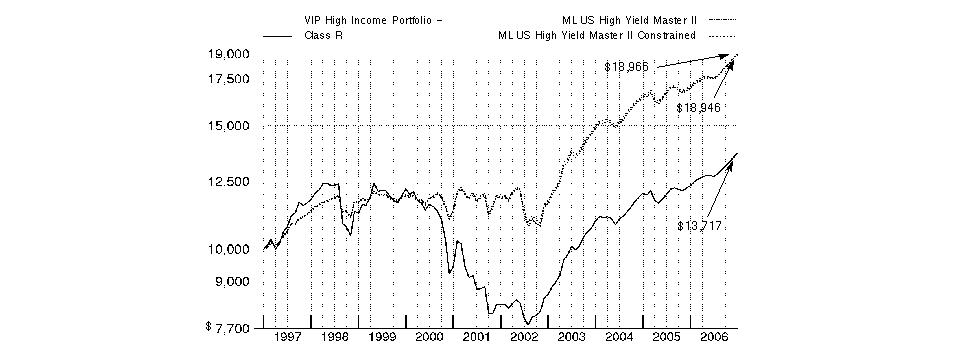
Annual Report
VIP High Income Portfolio
Management's Discussion of Fund Performance
Comments from Matthew Conti, Portfolio Manager of VIP High Income Portfolio
For the 12-month period ending December 31, 2006, the U.S. high-yield bond market posted its fourth consecutive year of positive returns. The Merrill Lynch® U.S. High Yield Master II Constrained Index rose 10.76% in that time, the fourth year in a row that the asset class topped the investment-grade bond market, which gained 4.33% as measured by the Lehman Brothers® Aggregate Bond Index. High yield was paced by a historically low default rate, solid corporate earnings, stable long-term interest rates, improved balance sheets and a strong equity market. One notable trend in 2006 was a significant increase in mergers, acquisitions and leveraged buyout activity, which resulted in a record-high issuance of high-yield debt. Fortunately, demand easily offset the supply. For the most part, high-yield companies enjoyed easy access to capital from the bank loan market, and the attractive yields of junk bonds drew heavy interest from private equity investors, hedge funds, international investors and institutions looking to meet fixed pension and retirement obligations.
For the 12 months that ended December 31, 2006, the fund outperformed the Merrill Lynch Constrained index - which became the fund's primary benchmark on January 1, 2006 - but underperformed the 11.77% return of its previous benchmark, the Merrill Lynch U.S. High Yield Master II Index. Positive security selection in heath care and telecommunications helped performance relative to the Constrained index, while overweighting gaming and underweighting automotive detracted. Top contributors to performance included underweighting hospital company HCA and not owning index component Dura Automotive, as well as holdings in satellite telecommunications provider Intelsat, video game retailer GameStop, General Motors Acceptance Corporation - the financing arm of General Motors (GM) - and building materials firm MAAX, not held at period end. Underweighting GM - no longer in the fund - and cable TV company Charter Communications detracted, as did bricks-and-mortar gaming companies Station Casinos and MGM Mirage. An out-of-benchmark position in building materials provider Masonite also lagged.
Note to shareholders: Effective January 1, 2006, the fund changed its benchmark to the Merrill Lynch U.S. High Yield Master II Constrained Index because this index conforms more closely to the fund's investment strategy. The Constrained index includes all of the bonds in the former benchmark, the Merrill Lynch U.S. High Yield Master II Index, but imposes a 2% limit on any individual issuer. In Fidelity's view, the Constrained index represents a better measure of the high-yield market, as this index is more diversified than the unconstrained version and is less likely to be disrupted by rapid market changes.
The views expressed above reflect those of the portfolio manager(s) only through the end of the period as stated on the cover of this report and do not necessarily represent the views of Fidelity or any other person in the Fidelity organization. Any such views are subject to change at any time based upon market or other conditions and Fidelity disclaims any responsibility to update such views. These views may not be relied on as investment advice and, because investment decisions for a Fidelity fund are based on numerous factors, may not be relied on as an indication of trading intent on behalf of any Fidelity fund.
VIP High Income Portfolio
VIP High Income Portfolio
Shareholder Expense Example
As a shareholder of the Fund, you incur two types of costs: (1) transaction costs, including redemption fees, and (2) ongoing costs, including management fees, distribution and/or service (12b-1) fees and other Fund expenses. This Example is intended to help you understand your ongoing costs (in dollars) of investing in the Fund and to compare these costs with the ongoing costs of investing in other mutual funds.
The Example is based on an investment of $1,000 invested at the beginning of the period and held for the entire period (July 1, 2006 to December 31, 2006).
Actual Expenses
The first line of the accompanying table for each class of the Fund provides information about actual account values and actual expenses. You may use the information in this line, together with the amount you invested, to estimate the expenses that you paid over the period. Simply divide your account value by $1,000.00 (for example, an $8,600 account value divided by $1,000.00 = 8.6), then multiply the result by the number in the first line for a class of the Fund under the heading entitled "Expenses Paid During Period" to estimate the expenses you paid on your account during this period. The estimate of expenses does not include any fees or other expenses of any variable annuity or variable life insurance product. If they were, the estimate of expenses you paid during the period would be higher, and your ending account value would be lower.
Hypothetical Example for Comparison Purposes
The second line of the accompanying table for each class of the Fund provides information about hypothetical account values and hypothetical expenses based on a Class' actual expense ratio and an assumed rate of return of 5% per year before expenses, which is not the Class' actual return. The hypothetical account values and expenses may not be used to estimate the actual ending account balance or expenses you paid for the period. You may use this information to compare the ongoing costs of investing in the Fund and other funds. To do so, compare this 5% hypothetical example with the 5% hypothetical examples that appear in the shareholder reports of the other funds. The estimate of expenses does not include any fees or other expenses of any variable annuity or variable life insurance product. If they were, the estimate of expenses you paid during the period would be higher, and your ending account value would be lower.
Please note that the expenses shown in the table are meant to highlight your ongoing costs only and do not reflect any transaction costs. Therefore, the second line of the table is useful in comparing ongoing costs only, and will not help you determine the relative total costs of owning different funds. In addition, if these transactional costs were included, your costs would have been higher.
| Beginning
Account Value
July 1, 2006 | Ending
Account Value
December 31, 2006 | Expenses Paid
During Period *
July 1, 2006 to
December 31, 2006 |
Initial Class | | | |
Actual | $ 1,000.00 | $ 1,080.00 | $ 3.83 |
Hypothetical A | $ 1,000.00 | $ 1,021.53 | $ 3.72 |
Service Class | | | |
Actual | $ 1,000.00 | $ 1,079.20 | $ 4.35 |
Hypothetical A | $ 1,000.00 | $ 1,021.02 | $ 4.23 |
Service Class 2 | | | |
Actual | $ 1,000.00 | $ 1,079.20 | $ 5.14 |
Hypothetical A | $ 1,000.00 | $ 1,020.27 | $ 4.99 |
Initial Class R | | | |
Actual | $ 1,000.00 | $ 1,080.30 | $ 3.83 |
Hypothetical A | $ 1,000.00 | $ 1,021.53 | $ 3.72 |
Service Class R | | | |
Actual | $ 1,000.00 | $ 1,079.40 | $ 4.30 |
Hypothetical A | $ 1,000.00 | $ 1,021.07 | $ 4.18 |
Service Class 2R | | | |
Actual | $ 1,000.00 | $ 1,078.80 | $ 5.13 |
Hypothetical A | $ 1,000.00 | $ 1,020.27 | $ 4.99 |
Investor Class | | | |
Actual | $ 1,000.00 | $ 1,079.90 | $ 4.19 |
Hypothetical A | $ 1,000.00 | $ 1,021.17 | $ 4.08 |
A 5% return per year before expenses
* Expenses are equal to each Class' annualized expense ratio (shown in the table below); multiplied by the average account value over the period, multiplied by 184/365 (to reflect the one-half year period).
Annual Report
VIP High Income Portfolio
Shareholder Expense Example - continued
| Annualized
Expense Ratio |
Initial Class | .73% |
Service Class | .83% |
Service Class 2 | .98% |
Initial Class R | .73% |
Service Class R | .82% |
Service Class 2R | .98% |
Investor Class | .80% |
VIP High Income Portfolio
VIP High Income Portfolio
Investment Changes
Top Five Holdings as of December 31, 2006 |
(by issuer, excluding cash equivalents) | % of fund's
net assets | % of fund's net assets
6 months ago |
Intelsat Ltd. | 2.4 | 2.4 |
Ford Motor Credit Co. | 2.4 | 1.6 |
MGM Mirage, Inc. | 1.9 | 1.5 |
General Motors Acceptance Corp. | 1.9 | 2.2 |
Ship Finance International Ltd. | 1.8 | 1.9 |
| 10.4 | |
Top Five Market Sectors as of December 31, 2006 |
| % of fund's
net assets | % of fund's net assets
6 months ago |
Technology | 8.7 | 9.0 |
Energy | 8.3 | 9.5 |
Telecommunications | 8.3 | 8.5 |
Automotive | 6.6 | 4.5 |
Gaming | 6.3 | 7.5 |
Quality Diversification (% of fund's net assets) |
As of December 31, 2006 | As of June 30, 2006 |
| AAA, AA, A 0.4% | | | AAA, AA, A 0.5% | |
| BBB 0.7% | | | BBB 0.0% | |
| BB 33.9% | | | BB 37.4% | |
| B 45.1% | | | B 48.0% | |
| CCC, CC, C 11.7% | | | CCC, CC, C 8.9% | |
| Not Rated 3.1% | | | Not Rated 1.4% | |
| Equities 0.1% | | | Equities 0.1% | |
| Short-Term
Investments and
Net Other Assets 5.0% | | | Short-Term
Investments and
Net Other Assets 3.7% | |

We have used ratings from Moody's® Investors Services, Inc. Where Moody's ratings are not available, we have used S&P® ratings. Percentages are adjusted for the effect of futures contracts, if applicable. |
Asset Allocation (% of fund's net assets) |
As of December 31, 2006 * | As of June 30, 2006 * * |
| Nonconvertible
Bonds 87.0% | | | Nonconvertible
Bonds 87.8% | |
| Convertible Bonds, Preferred Stocks 0.0% | | | Convertible Bonds, Preferred Stocks 0.2% | |
| Common Stocks 0.1% | | | Common Stocks 0.1% | |
| Floating Rate Loans 7.9% | | | Floating Rate Loans 7.8% | |
| Other Investments 0.0% | | | Other Investments 0.4% | |
| Short-Term
Investments and
Net Other Assets 5.0% | | | Short-Term
Investments and
Net Other Assets 3.7% | |
* Foreign investments | 16.1% | | * * Foreign investments | 18.8% | |

Annual Report
VIP High Income Portfolio
Investments December 31, 2006
Showing Percentage of Net Assets
Nonconvertible Bonds - 87.0% |
| Principal Amount | | Value
(Note 1) |
Aerospace - 1.4% |
Bombardier, Inc.: | | | | |
6.75% 5/1/12 (d) | | $ 10,000 | | $ 9,800 |
7.45% 5/1/34 (d) | | 1,795,000 | | 1,642,425 |
8% 11/15/14 (d) | | 2,085,000 | | 2,131,913 |
L-3 Communications Corp.: | | | | |
5.875% 1/15/15 | | 1,120,000 | | 1,080,800 |
6.375% 10/15/15 | | 4,875,000 | | 4,814,063 |
7.625% 6/15/12 | | 5,245,000 | | 5,428,575 |
Primus International, Inc. 11.5% 4/15/09 (d) | | 4,505,000 | | 4,820,350 |
| | 19,927,926 |
Air Transportation - 1.6% |
American Airlines, Inc. pass thru trust certificates: | | | | |
6.817% 5/23/11 | | 7,425,000 | | 7,536,375 |
7.377% 5/23/19 | | 764,033 | | 746,842 |
8.608% 10/1/12 | | 535,000 | | 567,100 |
AMR Corp. 9% 8/1/12 | | 1,980,000 | | 2,116,224 |
Continental Airlines, Inc.: | | | | |
7.875% 7/2/18 | | 1,142,436 | | 1,162,429 |
9.558% 9/1/19 | | 1,684,767 | | 1,823,760 |
Continental Airlines, Inc. pass thru trust certificates: | | | | |
7.566% 9/15/21 | | 653,189 | | 656,455 |
7.73% 9/15/12 | | 340,150 | | 341,000 |
9.798% 4/1/21 | | 3,216,267 | | 3,537,894 |
Navios Maritime Holdings, Inc. 9.5% 12/15/14 (d) | | 4,220,000 | | 4,230,550 |
| | 22,718,629 |
Automotive - 4.9% |
Ford Motor Co. 7.45% 7/16/31 | | 4,165,000 | | 3,269,525 |
Ford Motor Credit Co.: | | | | |
7% 10/1/13 | | 8,790,000 | | 8,394,450 |
7.25% 10/25/11 | | 5,520,000 | | 5,405,581 |
8% 12/15/16 | | 2,890,000 | | 2,861,100 |
8.11% 1/13/12 (e) | | 5,590,000 | | 5,534,100 |
9.8238% 4/15/12 (e) | | 3,230,000 | | 3,443,988 |
10.61% 6/15/11 (d)(e) | | 6,664,000 | | 7,197,120 |
General Motors Acceptance Corp.: | | | | |
5.625% 5/15/09 | | 1,190,000 | | 1,180,605 |
6.75% 12/1/14 | | 6,145,000 | | 6,329,350 |
6.875% 9/15/11 | | 4,690,000 | | 4,807,250 |
8% 11/1/31 | | 11,575,000 | | 13,253,375 |
GMAC LLC 6% 12/15/11 | | 2,740,000 | | 2,719,450 |
Visteon Corp. 7% 3/10/14 | | 3,795,000 | | 3,311,138 |
| | 67,707,032 |
Banks and Thrifts - 0.4% |
Western Financial Bank 9.625% 5/15/12 | | 5,125,000 | | 5,596,423 |
|
| Principal Amount | | Value
(Note 1) |
Broadcasting - 0.3% |
Nexstar Broadcasting, Inc. 7% 1/15/14 | | $ 2,440,000 | | $ 2,293,600 |
Nexstar Finance Holdings LLC/Nexstar Finance Holdings, Inc. 0% 4/1/13 (c) | | 1,850,000 | | 1,655,750 |
| | 3,949,350 |
Building Materials - 0.7% |
Anixter International, Inc. 5.95% 3/1/15 | | 3,270,000 | | 3,024,750 |
Masonite Corp. 11% 4/6/15 (d) | | 7,930,000 | | 7,355,075 |
| | 10,379,825 |
Cable TV - 3.1% |
Cablevision Systems Corp. 9.87% 4/1/09 (e) | | 3,835,000 | | 4,021,956 |
Charter Communications Holdings I LLC: | | | | |
0% 1/15/15 (c) | | 2,335,000 | | 2,113,175 |
9.92% 4/1/14 | | 5,420,000 | | 4,661,200 |
10% 5/15/14 | | 3,685,000 | | 3,205,950 |
11.125% 1/15/14 | | 2,025,000 | | 1,776,938 |
Charter Communications Holdings I LLC/Charter Communications Holdings I Capital Corp. 11% 10/1/15 | | 1,085,000 | | 1,106,700 |
Charter Communications Holdings II LLC/Charter Communications Holdings II Capital Corp. 10.25% 9/15/10 | | 2,400,000 | | 2,502,000 |
EchoStar Communications Corp.: | | | | |
5.75% 10/1/08 | | 5,475,000 | | 5,447,625 |
7% 10/1/13 | | 5,940,000 | | 5,925,150 |
7.125% 2/1/16 | | 2,785,000 | | 2,781,658 |
Kabel Deutschland GmbH 10.625% 7/1/14 | | 4,350,000 | | 4,833,938 |
NTL Cable PLC: | | | | |
8.75% 4/15/14 | | 2,175,000 | | 2,272,875 |
9.125% 8/15/16 | | 1,805,000 | | 1,899,763 |
| | 42,548,928 |
Capital Goods - 1.6% |
Amsted Industries, Inc. 10.25% 10/15/11 (d) | | 4,930,000 | | 5,262,775 |
Case New Holland, Inc. 7.125% 3/1/14 | | 6,795,000 | | 6,930,900 |
Leucadia National Corp. 7% 8/15/13 | | 3,520,000 | | 3,572,800 |
Park-Ohio Industries, Inc. 8.375% 11/15/14 | | 2,425,000 | | 2,243,125 |
Sensus Metering Systems, Inc. 8.625% 12/15/13 | | 4,325,000 | | 4,325,000 |
| | 22,334,600 |
Chemicals - 4.0% |
Chemtura Corp. 6.875% 6/1/16 | | 2,640,000 | | 2,626,800 |
Nonconvertible Bonds - continued |
| Principal Amount | | Value
(Note 1) |
Chemicals - continued |
Crystal US Holding 3 LLC/Crystal US Sub 3 Corp.: | | | | |
Series A, 0% 10/1/14 (c) | | $ 3,240,000 | | $ 2,737,800 |
Series B, 0% 10/1/14 (c) | | 1,965,000 | | 1,660,425 |
Equistar Chemicals LP 7.55% 2/15/26 | | 2,525,000 | | 2,398,750 |
Equistar Chemicals LP/Equistar Funding Corp.: | | | | |
8.75% 2/15/09 | | 1,995,000 | | 2,084,775 |
10.125% 9/1/08 | | 2,600,000 | | 2,762,500 |
Lyondell Chemical Co.: | | | | |
8% 9/15/14 | | 3,110,000 | | 3,214,963 |
8.25% 9/15/16 | | 3,110,000 | | 3,253,838 |
Millennium America, Inc.: | | | | |
7.625% 11/15/26 | | 1,040,000 | | 925,600 |
9.25% 6/15/08 | | 3,585,000 | | 3,710,475 |
Momentive Performance Materials, Inc. 9.75% 12/1/14 (d) | | 8,720,000 | | 8,730,900 |
Nalco Co. 7.75% 11/15/11 | | 3,005,000 | | 3,083,881 |
Nell AF Sarl 8.375% 8/15/15 (d) | | 2,690,000 | | 2,763,975 |
NOVA Chemicals Corp.: | | | | |
7.4% 4/1/09 | | 4,250,000 | | 4,319,063 |
8.5019% 11/15/13 (e) | | 2,425,000 | | 2,449,250 |
Phibro Animal Health Corp.: | | | | |
10% 8/1/13 (d) | | 2,440,000 | | 2,531,500 |
13% 8/1/14 (d) | | 1,420,000 | | 1,437,750 |
Tronox Worldwide LLC/Tronox Worldwide Finance Corp. 9.5% 12/1/12 | | 4,065,000 | | 4,268,250 |
| | 54,960,495 |
Consumer Products - 0.3% |
Jostens Holding Corp. 0% 12/1/13 (c) | | 3,050,000 | | 2,653,500 |
Jostens IH Corp. 7.625% 10/1/12 | | 1,970,000 | | 1,989,700 |
| | 4,643,200 |
Containers - 1.0% |
Berry Plastics Holding Corp. 8.875% 9/15/14 (d) | | 4,680,000 | | 4,785,300 |
BWAY Corp. 10% 10/15/10 | | 7,005,000 | | 7,320,225 |
Owens-Brockway Glass Container, Inc. 8.25% 5/15/13 | | 1,195,000 | | 1,236,825 |
| | 13,342,350 |
Diversified Financial Services - 0.5% |
E*TRADE Financial Corp.: | | | | |
7.375% 9/15/13 | | 1,490,000 | | 1,534,700 |
7.875% 12/1/15 | | 2,895,000 | | 3,075,938 |
8% 6/15/11 | | 2,440,000 | | 2,549,800 |
| | 7,160,438 |
Diversified Media - 1.7% |
Affinion Group, Inc. 11.5% 10/15/15 | | 3,385,000 | | 3,579,638 |
|
| Principal Amount | | Value
(Note 1) |
LBI Media Holdings, Inc. 0% 10/15/13 (c) | | $ 6,440,000 | | $ 5,538,400 |
LBI Media, Inc. 10.125% 7/15/12 | | 2,245,000 | | 2,379,700 |
Nielsen Finance LLC/Co.: | | | | |
0% 8/1/16 (c)(d) | | 2,660,000 | | 1,835,400 |
10% 8/1/14 (d) | | 4,145,000 | | 4,476,600 |
Quebecor Media, Inc. 7.75% 3/15/16 | | 5,920,000 | | 5,979,200 |
| | 23,788,938 |
Electric Utilities - 3.8% |
AES Corp.: | | | | |
8.875% 2/15/11 | | 3,581,000 | | 3,840,623 |
9.375% 9/15/10 | | 4,088,000 | | 4,425,260 |
9.5% 6/1/09 | | 904,000 | | 967,280 |
AES Gener SA 7.5% 3/25/14 | | 4,965,000 | | 5,250,488 |
Aquila, Inc. 14.875% 7/1/12 | | 2,555,000 | | 3,321,500 |
Dynegy Holdings, Inc. 8.375% 5/1/16 | | 3,130,000 | | 3,294,325 |
Mirant Americas Generation LLC 8.5% 10/1/21 | | 4,075,000 | | 4,115,750 |
MSW Energy Holdings II LLC/MSW Finance Co. II, Inc. 7.375% 9/1/10 | | 7,490,000 | | 7,639,800 |
MSW Energy Holdings LLC/MSW Energy Finance Co., Inc. 8.5% 9/1/10 | | 2,505,000 | | 2,580,150 |
NGC Corp. 7.125% 5/15/18 | | 1,805,000 | | 1,759,875 |
Tenaska Alabama Partners LP 7% 6/30/21 (d) | | 3,222,625 | | 3,171,973 |
TXU Corp. 6.5% 11/15/24 | | 4,645,000 | | 4,460,733 |
Utilicorp Canada Finance Corp. 7.75% 6/15/11 | | 7,595,000 | | 8,050,700 |
Utilicorp United, Inc. 9.95% 2/1/11 (e) | | 55,000 | | 60,363 |
| | 52,938,820 |
Energy - 7.6% |
Atlas Pipeline Partners LP 8.125% 12/15/15 | | 4,080,000 | | 4,212,600 |
Chaparral Energy, Inc. 8.5% 12/1/15 | | 4,800,000 | | 4,764,000 |
Chesapeake Energy Corp.: | | | | |
6.5% 8/15/17 | | 7,185,000 | | 6,996,394 |
6.625% 1/15/16 | | 2,045,000 | | 2,039,888 |
7.5% 6/15/14 | | 2,095,000 | | 2,178,800 |
7.75% 1/15/15 | | 4,390,000 | | 4,554,625 |
Complete Production Services, Inc. 8% 12/15/16 (d) | | 4,070,000 | | 4,161,575 |
El Paso Performance-Linked Trust 7.75% 7/15/11 (d) | | 4,345,000 | | 4,540,525 |
Hanover Compressor Co.: | | | | |
8.625% 12/15/10 | | 2,560,000 | | 2,662,400 |
9% 6/1/14 | | 1,785,000 | | 1,918,875 |
Hanover Equipment Trust 8.75% 9/1/11 | | 775,000 | | 808,906 |
Nonconvertible Bonds - continued |
| Principal Amount | | Value
(Note 1) |
Energy - continued |
Hilcorp Energy I LP/Hilcorp Finance Co.: | | | | |
7.75% 11/1/15 (d) | | $ 3,440,000 | | $ 3,388,400 |
9% 6/1/16 (d) | | 3,910,000 | | 4,125,050 |
OPTI Canada, Inc. 8.25% 12/15/14 (d) | | 3,460,000 | | 3,533,698 |
Pan American Energy LLC 7.75% 2/9/12 (d) | | 3,630,000 | | 3,747,975 |
Parker Drilling Co.: | | | | |
9.625% 10/1/13 | | 2,960,000 | | 3,241,200 |
10.1194% 9/1/10 (e) | | 4,878,000 | | 4,981,658 |
Petrohawk Energy Corp. 9.125% 7/15/13 | | 7,095,000 | | 7,414,275 |
Pogo Producing Co. 6.875% 10/1/17 | | 1,030,000 | | 988,800 |
Range Resources Corp.: | | | | |
6.375% 3/15/15 (Reg. S) | | 885,000 | | 854,025 |
7.375% 7/15/13 | | 10,075,000 | | 10,276,500 |
7.5% 5/15/16 | | 3,910,000 | | 3,997,975 |
SESI LLC 6.875% 6/1/14 | | 2,530,000 | | 2,530,000 |
Stone Energy Corp. 6.75% 12/15/14 | | 2,465,000 | | 2,341,750 |
Targa Resources, Inc./Targa Resources Finance Corp. 8.5% 11/1/13 (d) | | 2,535,000 | | 2,554,013 |
Williams Companies, Inc. 6.375% 10/1/10 (d) | | 4,765,000 | | 4,776,913 |
Williams Partners LP/Williams Partners Finance Corp.: | | | | |
7.25% 2/1/17 (d) | | 2,760,000 | | 2,815,200 |
7.5% 6/15/11 (d) | | 4,330,000 | | 4,524,850 |
| | 104,930,870 |
Entertainment/Film - 0.3% |
AMC Entertainment, Inc. 8% 3/1/14 | | 4,370,000 | | 4,348,150 |
Environmental - 0.9% |
Allied Waste North America, Inc.: | | | | |
5.75% 2/15/11 | | 3,645,000 | | 3,526,538 |
7.125% 5/15/16 | | 3,180,000 | | 3,148,200 |
8.5% 12/1/08 | | 3,965,000 | | 4,173,163 |
Browning-Ferris Industries, Inc.: | | | | |
6.375% 1/15/08 | | 855,000 | | 855,000 |
7.4% 9/15/35 | | 585,000 | | 546,975 |
| | 12,249,876 |
Food and Drug Retail - 1.0% |
Albertsons, Inc.: | | | | |
7.45% 8/1/29 | | 2,280,000 | | 2,227,558 |
7.75% 6/15/26 | | 2,565,000 | | 2,561,153 |
8% 5/1/31 | | 1,685,000 | | 1,709,195 |
|
| Principal Amount | | Value
(Note 1) |
GNC Parent Corp. 12.14% 12/1/11 pay-in-kind (d)(e) | | $ 4,470,000 | | $ 4,470,000 |
SUPERVALU, Inc. 7.5% 11/15/14 | | 2,990,000 | | 3,109,600 |
| | 14,077,506 |
Food/Beverage/Tobacco - 1.2% |
National Beef Packing Co. LLC/National Beef Finance Corp. 10.5% 8/1/11 | | 3,690,000 | | 3,865,275 |
Pierre Foods, Inc. 9.875% 7/15/12 | | 2,600,000 | | 2,678,000 |
Reynolds American, Inc.: | | | | |
7.25% 6/1/13 | | 3,200,000 | | 3,352,000 |
7.3% 7/15/15 | | 2,680,000 | | 2,780,500 |
Swift & Co.: | | | | |
10.125% 10/1/09 | | 3,215,000 | | 3,279,300 |
12.5% 1/1/10 | | 760,000 | | 775,200 |
| | 16,730,275 |
Gaming - 5.5% |
Chukchansi Economic Development Authority: | | | | |
8% 11/15/13 (d) | | 3,210,000 | | 3,318,338 |
8.8769% 11/15/12 (d)(e) | | 1,010,000 | | 1,046,613 |
Mandalay Resort Group 9.375% 2/15/10 | | 4,655,000 | | 4,969,213 |
MGM Mirage, Inc.: | | | | |
6% 10/1/09 | | 4,775,000 | | 4,769,031 |
6.625% 7/15/15 | | 785,000 | | 756,544 |
6.75% 9/1/12 | | 9,015,000 | | 8,834,700 |
6.75% 4/1/13 | | 4,390,000 | | 4,291,225 |
6.875% 4/1/16 | | 2,995,000 | | 2,867,713 |
7.625% 1/15/17 | | 4,420,000 | | 4,442,100 |
Mohegan Tribal Gaming Authority: | | | | |
6.375% 7/15/09 | | 4,740,000 | | 4,740,000 |
7.125% 8/15/14 | | 2,010,000 | | 2,037,638 |
8% 4/1/12 | | 970,000 | | 1,010,013 |
MTR Gaming Group, Inc.: | | | | |
9% 6/1/12 | | 960,000 | | 986,400 |
9.75% 4/1/10 | | 1,650,000 | | 1,736,625 |
Scientific Games Corp. 6.25% 12/15/12 | | 3,275,000 | | 3,184,938 |
Seneca Gaming Corp.: | | | | |
Series B, 7.25% 5/1/12 | | 4,600,000 | | 4,680,500 |
7.25% 5/1/12 | | 6,020,000 | | 6,125,350 |
Station Casinos, Inc.: | | | | |
6.625% 3/15/18 | | 60,000 | | 51,675 |
6.875% 3/1/16 | | 5,720,000 | | 5,119,400 |
Virgin River Casino Corp./RBG LLC/B&BB, Inc.: | | | | |
0% 1/15/13 (c) | | 2,100,000 | | 1,485,750 |
9% 1/15/12 | | 3,610,000 | | 3,736,350 |
Wheeling Island Gaming, Inc. 10.125% 12/15/09 | | 5,900,000 | | 6,010,625 |
| | 76,200,741 |
Nonconvertible Bonds - continued |
| Principal Amount | | Value
(Note 1) |
Healthcare - 5.5% |
AmeriPath, Inc. 10.5% 4/1/13 | | $ 2,380,000 | | $ 2,576,350 |
CDRV Investors, Inc. 0% 1/1/15 (c) | | 9,250,000 | | 7,168,750 |
Concentra Operating Corp.: | | | | |
9.125% 6/1/12 | | 4,095,000 | | 4,299,750 |
9.5% 8/15/10 | | 2,145,000 | | 2,252,250 |
HCA, Inc.: | | | | |
9.125% 11/15/14 (d) | | 2,740,000 | | 2,924,950 |
9.25% 11/15/16 (d) | | 2,740,000 | | 2,928,375 |
9.625% 11/15/16 pay-in-kind (d) | | 2,190,000 | | 2,354,250 |
HealthSouth Corp.: | | | | |
10.75% 6/15/16 (d) | | 4,250,000 | | 4,579,375 |
11.3544% 6/15/14 (d)(e) | | 3,250,000 | | 3,461,250 |
IASIS Healthcare LLC/IASIS Capital Corp. 8.75% 6/15/14 | | 3,815,000 | | 3,857,919 |
Multiplan, Inc. 10.375% 4/15/16 (d) | | 2,485,000 | | 2,485,000 |
National Mentor Holdings, Inc. 11.25% 7/1/14 (d) | | 2,675,000 | | 2,855,563 |
Omega Healthcare Investors, Inc.: | | | | |
7% 4/1/14 | | 9,970,000 | | 10,044,775 |
7% 1/15/16 | | 2,480,000 | | 2,486,200 |
Rural/Metro Corp. 9.875% 3/15/15 | | 1,670,000 | | 1,734,713 |
Senior Housing Properties Trust 8.625% 1/15/12 | | 4,460,000 | | 4,839,100 |
Service Corp. International 6.75% 4/1/16 | | 490,000 | | 490,000 |
Team Finance LLC/Health Finance Corp. 11.25% 12/1/13 | | 4,310,000 | | 4,460,850 |
Ventas Realty LP: | | | | |
6.5% 6/1/16 | | 5,250,000 | | 5,322,188 |
6.625% 10/15/14 | | 2,320,000 | | 2,360,600 |
6.75% 4/1/17 | | 2,310,000 | | 2,367,750 |
| | 75,849,958 |
Homebuilding/Real Estate - 2.5% |
American Real Estate Partners/American Real Estate Finance Corp.: | | | | |
7.125% 2/15/13 | | 3,370,000 | | 3,370,000 |
8.125% 6/1/12 | | 11,585,000 | | 11,932,550 |
K. Hovnanian Enterprises, Inc.: | | | | |
6% 1/15/10 | | 490,000 | | 465,500 |
6.25% 1/15/15 | | 920,000 | | 871,700 |
8.875% 4/1/12 | | 1,570,000 | | 1,601,400 |
KB Home 7.75% 2/1/10 | | 6,910,000 | | 7,013,650 |
Technical Olympic USA, Inc.: | | | | |
7.5% 3/15/11 | | 880,000 | | 728,200 |
7.5% 1/15/15 | | 5,860,000 | | 4,570,800 |
10.375% 7/1/12 | | 885,000 | | 805,350 |
|
| Principal Amount | | Value
(Note 1) |
WCI Communities, Inc.: | | | | |
6.625% 3/15/15 | | $ 2,535,000 | | $ 2,180,100 |
7.875% 10/1/13 | | 830,000 | | 742,850 |
| | 34,282,100 |
Hotels - 0.7% |
Grupo Posadas SA de CV 8.75% 10/4/11 (d) | | 3,875,000 | | 4,049,375 |
Host Marriott LP 7.125% 11/1/13 | | 5,390,000 | | 5,511,275 |
| | 9,560,650 |
Insurance - 0.2% |
UnumProvident Corp. 7.375% 6/15/32 | | 580,000 | | 618,963 |
UnumProvident Finance Co. PLC 6.85% 11/15/15 (d) | | 1,500,000 | | 1,582,635 |
| | 2,201,598 |
Leisure - 1.9% |
Royal Caribbean Cruises Ltd.: | | | | |
7% 6/15/13 | | 4,720,000 | | 4,804,200 |
yankee 7.5% 10/15/27 | | 1,980,000 | | 1,925,550 |
Six Flags, Inc. 9.75% 4/15/13 | | 450,000 | | 421,875 |
Town Sports International Holdings, Inc. 0% 2/1/14 (c) | | 1,052,000 | | 915,240 |
Town Sports International, Inc. 9.625% 4/15/11 | | 5,344,000 | | 5,637,920 |
Universal City Development Partners Ltd./UCDP Finance, Inc. 11.75% 4/1/10 | | 5,125,000 | | 5,490,156 |
Universal City Florida Holding Co. I/II: | | | | |
8.375% 5/1/10 | | 575,000 | | 587,938 |
10.1213% 5/1/10 (e) | | 5,780,000 | | 5,967,850 |
| | 25,750,729 |
Metals/Mining - 4.3% |
Arch Western Finance LLC 6.75% 7/1/13 | | 6,050,000 | | 5,989,500 |
Compass Minerals International, Inc.: | | | | |
0% 12/15/12 (c) | | 4,520,000 | | 4,463,500 |
0% 6/1/13 (c) | | 8,615,000 | | 8,205,788 |
Drummond Co., Inc. 7.375% 2/15/16 (d) | | 7,370,000 | | 7,075,200 |
FMG Finance Pty Ltd.: | | | | |
9.3694% 9/1/11 (d)(e) | | 3,090,000 | | 3,082,275 |
10% 9/1/13 (d) | | 2,010,000 | | 2,070,300 |
10.625% 9/1/16 (d) | | 595,000 | | 636,650 |
Massey Energy Co. 6.875% 12/15/13 | | 5,415,000 | | 5,090,100 |
Peabody Energy Corp.: | | | | |
7.375% 11/1/16 | | 2,675,000 | | 2,848,875 |
7.875% 11/1/26 | | 1,945,000 | | 2,090,875 |
PNA Group, Inc. 10.75% 9/1/16 (d) | | 4,345,000 | | 4,497,075 |
Nonconvertible Bonds - continued |
| Principal Amount | | Value
(Note 1) |
Metals/Mining - continued |
RathGibson, Inc. 11.25% 2/15/14 | | $ 4,820,000 | | $ 5,157,400 |
Vedanta Resources PLC 6.625% 2/22/10 (d) | | 8,875,000 | | 8,764,063 |
| | 59,971,601 |
Paper - 1.5% |
Catalyst Paper Corp. 8.625% 6/15/11 | | 1,710,000 | | 1,727,100 |
Georgia-Pacific Corp.: | | | | |
7% 1/15/15 (d) | | 8,720,000 | | 8,752,264 |
8% 1/15/24 | | 1,470,000 | | 1,492,050 |
8.875% 5/15/31 | | 2,725,000 | | 2,861,250 |
Jefferson Smurfit Corp. U.S. 7.5% 6/1/13 | | 1,580,000 | | 1,497,050 |
Stone Container Corp. 9.75% 2/1/11 | | 1,878,000 | | 1,936,688 |
Stone Container Finance Co. 7.375% 7/15/14 | | 3,080,000 | | 2,864,400 |
| | 21,130,802 |
Publishing/Printing - 0.9% |
Dex Media West LLC/Dex Media West Finance Co. 8.5% 8/15/10 | | 2,175,000 | | 2,256,563 |
The Reader's Digest Association, Inc. 6.5% 3/1/11 | | 10,605,000 | | 10,883,381 |
| | 13,139,944 |
Railroad - 0.7% |
Kansas City Southern Railway Co. 7.5% 6/15/09 | | 9,860,000 | | 9,958,600 |
Restaurants - 1.3% |
Carrols Corp. 9% 1/15/13 | | 5,255,000 | | 5,360,100 |
Friendly Ice Cream Corp. 8.375% 6/15/12 | | 6,665,000 | | 6,265,100 |
Landry's Seafood Restaurants, Inc. 7.5% 12/15/14 | | 6,915,000 | | 6,759,413 |
| | 18,384,613 |
Services - 3.6% |
Ashtead Capital, Inc. 9% 8/15/16 (d) | | 3,090,000 | | 3,298,575 |
Avis Budget Car Rental LLC/Avis Budget Finance, Inc.: | | | | |
7.625% 5/15/14 (d) | | 3,105,000 | | 3,011,850 |
7.75% 5/15/16 (d) | | 2,320,000 | | 2,250,400 |
7.8738% 5/15/14 (d)(e) | | 550,000 | | 532,125 |
Education Management LLC/Education Management Finance Corp. 10.25% 6/1/16 (d) | | 2,435,000 | | 2,575,013 |
FTI Consulting, Inc.: | | | | |
7.625% 6/15/13 | | 4,965,000 | | 5,089,125 |
7.75% 10/1/16 (d) | | 2,665,000 | | 2,758,275 |
Iron Mountain, Inc.: | | | | |
8.25% 7/1/11 | | 5,110,000 | | 5,135,550 |
8.625% 4/1/13 | | 5,270,000 | | 5,428,100 |
|
| Principal Amount | | Value
(Note 1) |
Penhall International Corp. 12% 8/1/14 (d) | | $ 2,650,000 | | $ 2,875,250 |
Rental Service Co. 9.5% 12/1/14 (d) | | 2,830,000 | | 2,914,900 |
Rural/Metro Corp. 0% 3/15/16 (c) | | 3,185,000 | | 2,468,375 |
Service Corp. International: | | | | |
7% 6/15/17 | | 75,000 | | 75,938 |
7.375% 10/1/14 | | 2,530,000 | | 2,631,200 |
7.625% 10/1/18 | | 1,855,000 | | 1,961,663 |
United Rentals North America, Inc. 7% 2/15/14 | | 7,300,000 | | 7,099,250 |
| | 50,105,589 |
Shipping - 3.4% |
OMI Corp. 7.625% 12/1/13 | | 9,595,000 | | 9,834,875 |
Overseas Shipholding Group, Inc.: | | | | |
7.5% 2/15/24 | | 550,000 | | 558,250 |
8.25% 3/15/13 | | 1,295,000 | | 1,362,988 |
Ship Finance International Ltd. 8.5% 12/15/13 | | 25,180,000 | | 25,117,023 |
Teekay Shipping Corp. 8.875% 7/15/11 | | 10,093,000 | | 10,887,824 |
| | 47,760,960 |
Super Retail - 1.8% |
GSC Holdings Corp./Gamestop, Inc. 8% 10/1/12 | | 7,595,000 | | 7,936,775 |
Michaels Stores, Inc.: | | | | |
10% 11/1/14 (d) | | 4,470,000 | | 4,615,275 |
11.375% 11/1/16 (d) | | 4,490,000 | | 4,641,538 |
NBC Acquisition Corp. 0% 3/15/13 (c) | | 1,665,000 | | 1,332,000 |
Nebraska Book Co., Inc. 8.625% 3/15/12 | | 3,050,000 | | 2,928,000 |
Sonic Automotive, Inc. 8.625% 8/15/13 | | 3,690,000 | | 3,800,700 |
| | 25,254,288 |
Technology - 8.2% |
Activant Solutions, Inc. 9.5% 5/1/16 (d) | | 1,330,000 | | 1,230,250 |
Amkor Technology, Inc. 9.25% 6/1/16 | | 4,195,000 | | 4,100,613 |
Avago Technologies Finance Ltd.: | | | | |
10.125% 12/1/13 (d) | | 3,400,000 | | 3,578,500 |
10.8694% 6/1/13 (d)(e) | | 3,380,000 | | 3,515,200 |
Celestica, Inc.: | | | | |
7.625% 7/1/13 | | 2,090,000 | | 2,037,750 |
7.875% 7/1/11 | | 7,750,000 | | 7,691,875 |
Freescale Semiconductor, Inc.: | | | | |
8.875% 12/15/14 (d) | | 4,145,000 | | 4,140,026 |
9.125% 12/15/14 pay-in-kind (d) | | 2,910,000 | | 2,891,958 |
9.25% 12/15/14 (d)(e) | | 2,910,000 | | 2,884,683 |
10.125% 12/15/16 (d) | | 3,920,000 | | 3,925,096 |
IKON Office Solutions, Inc. 7.75% 9/15/15 | | 5,615,000 | | 5,860,656 |
Nonconvertible Bonds - continued |
| Principal Amount | | Value
(Note 1) |
Technology - continued |
Lucent Technologies, Inc.: | | | | |
6.45% 3/15/29 | | $ 8,660,000 | | $ 8,010,500 |
6.5% 1/15/28 | | 3,465,000 | | 3,205,125 |
MagnaChip Semiconductor SA/MagnaChip Semiconductor Finance Co.: | | | | |
8% 12/15/14 | | 945,000 | | 628,425 |
8.61% 12/15/11 (e) | | 1,890,000 | | 1,625,400 |
Nortel Networks Corp.: | | | | |
9.6238% 7/15/11 (d)(e) | | 3,340,000 | | 3,519,525 |
10.125% 7/15/13 (d) | | 3,825,000 | | 4,140,563 |
Northern Telecom Capital Corp. 7.875% 6/15/26 | | 475,000 | | 425,125 |
Northern Telecom Ltd. yankee 6.875% 9/1/23 | | 840,000 | | 714,000 |
NXP BV: | | | | |
7.875% 10/15/14 (d) | | 3,580,000 | | 3,696,350 |
8.118% 10/15/13 (d)(e) | | 2,970,000 | | 3,010,838 |
9.5% 10/15/15 (d) | | 6,065,000 | | 6,231,788 |
Sanmina-SCI Corp.: | | | | |
6.75% 3/1/13 | | 3,485,000 | | 3,232,338 |
8.125% 3/1/16 | | 4,130,000 | | 3,964,800 |
Seagate Technology HDD Holdings 6.8% 10/1/16 | | 2,350,000 | | 2,350,000 |
STATS ChipPAC Ltd. 7.5% 7/19/10 | | 5,185,000 | | 5,249,813 |
SunGard Data Systems, Inc.: | | | | |
9.125% 8/15/13 | | 3,865,000 | | 4,058,250 |
10.25% 8/15/15 | | 1,945,000 | | 2,073,856 |
UGS Capital Corp. II 10.3481% 6/1/11 pay-in-kind (d)(e) | | 6,055,901 | | 6,116,460 |
Xerox Capital Trust I 8% 2/1/27 | | 4,400,000 | | 4,510,000 |
Xerox Corp.: | | | | |
6.4% 3/15/16 | | 1,145,000 | | 1,165,621 |
6.75% 2/1/17 | | 2,305,000 | | 2,402,963 |
7.625% 6/15/13 | | 2,340,000 | | 2,457,000 |
| | 114,645,347 |
Telecommunications - 7.9% |
Centennial Communications Corp. 10% 1/1/13 | | 1,000,000 | | 1,062,500 |
Centennial Communications Corp./Centennial Cellular Operating Co. LLC/Centennial Puerto Rico Operations Corp. 8.125% 2/1/14 | | 1,585,000 | | 1,616,700 |
Digicel Ltd. 9.25% 9/1/12 (d) | | 5,335,000 | | 5,681,775 |
Intelsat Ltd.: | | | | |
6.5% 11/1/13 | | 11,870,000 | | 10,089,500 |
7.625% 4/15/12 | | 10,795,000 | | 9,985,375 |
9.25% 6/15/16 (d) | | 5,790,000 | | 6,180,825 |
11.25% 6/15/16 (d) | | 4,170,000 | | 4,597,425 |
11.3544% 6/15/13 (d)(e) | | 2,700,000 | | 2,835,000 |
|
| Principal Amount | | Value
(Note 1) |
Intelsat Subsidiary Holding Co. Ltd. 10.4844% 1/15/12 (e) | | $ 3,115,000 | | $ 3,142,256 |
Level 3 Financing, Inc.: | | | | |
9.25% 11/1/14 (d) | | 12,005,000 | | 12,215,088 |
12.25% 3/15/13 | | 5,435,000 | | 6,162,203 |
MetroPCS Wireless, Inc. 9.25% 11/1/14 (d) | | 5,200,000 | | 5,395,000 |
Millicom International Cellular SA 10% 12/1/13 | | 1,490,000 | | 1,624,100 |
Mobile Telesystems Finance SA 8% 1/28/12 (d) | | 3,158,000 | | 3,315,900 |
PanAmSat Corp.: | | | | |
9% 8/15/14 | | 5,374,000 | | 5,709,875 |
9% 6/15/16 (d) | | 3,820,000 | | 4,044,425 |
Qwest Corp.: | | | | |
7.5% 10/1/14 | | 3,840,000 | | 4,089,600 |
8.61% 6/15/13 (e) | | 7,630,000 | | 8,265,579 |
Rogers Communications, Inc. 9.625% 5/1/11 | | 1,020,000 | | 1,162,800 |
U.S. West Communications: | | | | |
6.875% 9/15/33 | | 2,535,000 | | 2,433,600 |
7.5% 6/15/23 | | 4,335,000 | | 4,400,025 |
Windstream Corp.: | | | | |
8.125% 8/1/13 (d) | | 2,350,000 | | 2,546,930 |
8.625% 8/1/16 (d) | | 2,565,000 | | 2,815,088 |
| | 109,371,569 |
Textiles & Apparel - 0.8% |
Hanesbrands, Inc. 8.735% 12/15/14 (d)(e) | | 1,440,000 | | 1,463,400 |
Levi Strauss & Co.: | | | | |
8.875% 4/1/16 | | 7,165,000 | | 7,451,600 |
10.1216% 4/1/12 (e) | | 1,890,000 | | 1,939,613 |
| | 10,854,613 |
TOTAL NONCONVERTIBLE BONDS (Cost $1,176,824,198) | 1,208,757,333 |
Commercial Mortgage Securities - 0.0% |
|
LB Multi-family Mortgage Trust Series 1991-4 Class A1, 7.25% 4/25/21 (d)(e)
(Cost $143,248) | | 185,924 | | 167,332 |
Common Stocks - 0.1% |
| | Shares | | |
Textiles & Apparel - 0.1% |
Arena Brands Holding Corp. Class B (a)(g)
(Cost $1,974,627) | | 48,889 | | 722,091 |
Floating Rate Loans - 7.9% |
| Principal Amount | | Value
(Note 1) |
Automotive - 1.7% |
Ford Motor Co. term loan 8.36% 12/15/13 (e) | | $ 14,770,000 | | $ 14,788,463 |
Lear Corp. term loan 7.8656% 4/25/12 (e) | | 2,652,020 | | 2,655,335 |
Oshkosh Truck Co. Tranche B, term loan 7.35% 12/6/13 (e) | | 5,910,000 | | 5,913,694 |
| | 23,357,492 |
Cable TV - 1.1% |
Charter Communications Operating LLC Tranche B, term loan 8.005% 4/28/13 (e) | | 5,498,000 | | 5,525,490 |
CSC Holdings, Inc. Tranche B, term loan 7.1228% 3/29/13 (e) | | 4,925,250 | | 4,922,172 |
Insight Midwest Holdings LLC Tranche B, term loan 7.61% 4/6/14 (e) | | 4,830,000 | | 4,857,169 |
| | 15,304,831 |
Diversified Financial Services - 0.4% |
LPL Holdings, Inc. Tranche C, term loan 8.1137% 6/29/14 (e) | | 5,200,000 | | 5,226,000 |
Electric Utilities - 0.8% |
Covanta Energy Corp.: | | | | |
Tranche 1: | | | | |
Credit-Linked Deposit 7.6% 6/24/12 (e) | | 3,999,608 | | 4,034,604 |
term loan 7.6149% 6/24/12 (e) | | 2,858,960 | | 2,883,976 |
Tranche 2, term loan 10.85% 6/24/13 (e) | | 4,631,250 | | 4,718,086 |
| | 11,636,666 |
Energy - 0.7% |
Sandridge Energy, Inc. term loan 10.1904% 11/21/07 (e) | | 4,760,000 | | 4,795,700 |
Targa Resources, Inc./Targa Resources Finance Corp.: | | | | |
Credit-Linked Deposit 7.4888% 10/31/12 (e) | | 605,806 | | 607,321 |
term loan: | | | | |
7.6% 10/31/07 (e) | | 2,230,000 | | 2,230,000 |
7.6237% 10/31/12 (e) | | 2,492,641 | | 2,498,873 |
| | 10,131,894 |
Food/Beverage/Tobacco - 0.1% |
Pierre Foods, Inc. Tranche B, term loan 7.61% 6/30/10 (e) | | 840,000 | | 843,150 |
Gaming - 0.8% |
Kerzner International Ltd.: | | | | |
term loan 8.3531% 9/1/13 (e) | | 3,181,250 | | 3,129,555 |
Class DD, term loan 8.3531% 9/1/13 (e)(f) | | 1,908,750 | | 1,877,733 |
|
| Principal Amount | | Value
(Note 1) |
Venetian Macau Ltd. Tranche B, term loan: | | | | |
5/26/12 (f) | | $ 2,103,333 | | $ 2,103,333 |
8.12% 5/26/13 (e) | | 4,206,667 | | 4,248,733 |
| | 11,359,354 |
Paper - 0.7% |
Georgia-Pacific Corp. Tranche B1, term loan 7.3561% 12/23/12 (e) | | 9,484,200 | | 9,543,476 |
Services - 0.5% |
NES Rentals Holdings, Inc. Tranche 2, term loan 12.125% 7/21/13 (e) | | 4,570,000 | | 4,604,275 |
RSC Equipment Rental Tranche 2LN, term loan 8.8466% 11/30/13 (e) | | 2,860,000 | | 2,892,175 |
| | 7,496,450 |
Super Retail - 0.2% |
Michaels Stores, Inc. Tranche B, term loan 8.375% 10/31/13 (e) | | 3,330,000 | | 3,285,080 |
Technology - 0.5% |
Fidelity National Information Solutions, Inc.: | | | | |
Tranche A, term loan 6.6% 3/9/11 (e) | | 5,107,424 | | 5,094,655 |
Tranche B, term loan 7.1% 3/9/13 (e) | | 1,926,510 | | 1,925,306 |
| | 7,019,961 |
Telecommunications - 0.4% |
Qwest Corp. Tranche B, term loan 6.95% 6/30/10 (e) | | 1,880,000 | | 1,915,250 |
Wind Telecomunicazioni Spa term loan 12.54% 12/21/11 (e) | | 2,910,000 | | 2,950,013 |
| | 4,865,263 |
TOTAL FLOATING RATE LOANS (Cost $109,628,444) | 110,069,617 |
Money Market Funds - 3.6% |
| | Shares | | |
Fidelity Cash Central Fund, 5.37% (b)
(Cost $49,383,175) | | 49,383,175 | | 49,383,175 |
TOTAL INVESTMENT PORTFOLIO - 98.6% (Cost $1,337,953,692) | | | 1,369,099,548 |
NET OTHER ASSETS - 1.4% | | | 19,912,773 |
NET ASSETS - 100% | | $ 1,389,012,321 |
Legend |
(a) Non-income producing |
(b) Affiliated fund that is available only to investment companies and other accounts managed by Fidelity Investments. The rate quoted is the annualized seven-day yield of the fund at period end. A complete unaudited listing of the fund's holdings as of its most recent quarter end is available upon request. |
(c) Security initially issued in zero coupon form which converts to coupon form at a specified rate and date. The rate shown is the rate at period end. |
(d) Security exempt from registration under Rule 144A of the Securities Act of 1933. These securities may be resold in transactions exempt from registration, normally to qualified institutional buyers. At the end of the period, the value of these securities amounted to $301,097,782 or 21.7% of net assets. |
(e) The coupon rate shown on floating or adjustable rate securities represents the rate at period end. |
(f) Position or a portion of the position represents an unfunded loan commitment. At period end, the total principal amount and market value of unfunded commitments totaled $3,375,833 and $3,355,155, respectively. The coupon rate will be determined at time of settlement. |
(g) Restricted securities - Investment in securities not registered under the Securities Act of 1933 (excluding 144A issues). At the end of the period, the value of restricted securities (excluding 144A issues) amounted to $722,091 or 0.1% of net assets. |
Additional information on each holding is as follows: |
Security | Acquisition Date | Acquisition Cost |
Arena Brands Holding Corp. Class B | 6/18/97 | $ 1,974,627 |
Affiliated Central Funds |
Information regarding fiscal year to date income earned by the Fund from investments in Fidelity Central Funds is as follows: |
Fund | Income earned |
Fidelity Cash Central Fund | $ 2,434,175 |
Other Information |
Distribution of investments by country of issue, as a percentage of total net assets, is as follows: |
United States of America | 83.9% |
Bermuda | 4.8% |
Canada | 3.8% |
Marshall Islands | 1.8% |
United Kingdom | 1.0% |
Others (individually less than 1%) | 4.7% |
| 100.0% |
Income Tax Information |
At December 31, 2006, the fund had a capital loss carryforward of approximately $1,110,768,989 of which $249,734,104, $772,554,243 and $88,480,642 will expire on December 31, 2008, 2009 and 2010, respectively. |
See accompanying notes which are an integral part of the financial statements.
Annual Report
VIP High Income Portfolio
Financial Statements
Statement of Assets and Liabilities
| December 31, 2006 |
Assets | | |
Investment in securities, at value - See accompanying schedule: Unaffiliated issuers (cost $1,288,570,517) | $ 1,319,716,373 | |
Fidelity Central Funds (cost $49,383,175) | 49,383,175 | |
Total Investments (cost $1,337,953,692) | | $ 1,369,099,548 |
Cash | | 5,247,145 |
Receivable for investments sold | | 5,448,511 |
Receivable for fund shares sold | | 32,641 |
Interest receivable | | 22,731,150 |
Prepaid expenses | | 6,377 |
Other receivables | | 4,668 |
Total assets | | 1,402,570,040 |
| | |
Liabilities | | |
Payable for investments purchased | $ 12,304,130 | |
Payable for fund shares redeemed | 53,566 | |
Accrued management fee | 664,431 | |
Distribution fees payable | 46,178 | |
Other affiliated payables | 124,613 | |
Other payables and accrued expenses | 364,801 | |
Total liabilities | | 13,557,719 |
| | |
Net Assets | | $ 1,389,012,321 |
Net Assets consist of: | | |
Paid in capital | | $ 2,464,817,919 |
Undistributed net investment income | | 3,860,284 |
Accumulated undistributed net realized gain (loss) on investments | | (1,110,811,738) |
Net unrealized appreciation (depreciation) on investments | | 31,145,856 |
Net Assets | | $ 1,389,012,321 |
Statement of Assets and Liabilities - continued
| December 31, 2006 |
| | |
Initial Class:
Net Asset Value, offering price and redemption price per share ($922,565,040 ÷ 145,321,849 shares) | | $ 6.35 |
| | |
Service Class:
Net Asset Value, offering price and redemption price per share ($277,545,665 ÷ 43,923,717 shares) | | $ 6.32 |
| | |
Service Class 2:
Net Asset Value, offering price and redemption price per share ($110,503,133 ÷ 17,685,742 shares) | | $ 6.25 |
| | |
Initial Class R:
Net Asset Value, offering price and redemption price per share ($92,594 ÷ 14,604 shares) | | $ 6.34 |
| | |
Service Class R:
Net Asset Value, offering price and redemption price per share ($92,353 ÷ 14,621 shares) | | $ 6.32 |
| | |
Service Class 2R:
Net Asset Value, offering price and redemption price per share ($91,967 ÷ 14,716 shares) | | $ 6.25 |
| | |
Investor Class:
Net Asset Value, offering price and redemption price per share ($78,121,569 ÷ 12,328,364 shares) | | $ 6.34 |
See accompanying notes which are an integral part of the financial statements.
VIP High Income Portfolio
Statement of Operations
| Year ended December 31, 2006 |
| | |
Investment Income | | |
Interest | | 109,941,287 |
Income from Fidelity Central Funds | | 2,434,175 |
Total income | | 112,375,462 |
| | |
Expenses | | |
Management fee | $ 7,904,598 | |
Transfer agent fees | 992,388 | |
Distribution fees | 526,826 | |
Accounting fees and expenses | 502,943 | |
Custodian fees and expenses | 35,696 | |
Independent trustees' compensation | 5,256 | |
Audit | 81,447 | |
Legal | 16,552 | |
Interest | 6,880 | |
Miscellaneous | 367,306 | |
Total expenses before reductions | 10,439,892 | |
Expense reductions | (17,479) | 10,422,413 |
Net investment income | | 101,953,049 |
Realized and Unrealized Gain (Loss) Net realized gain (loss) on: | | |
Investment securities: | | |
Unaffiliated issuers | | 19,571,030 |
Change in net unrealized appreciation (depreciation) on investment securities | | 25,541,215 |
Net gain (loss) | | 45,112,245 |
Net increase (decrease) in net assets resulting from operations | | $ 147,065,294 |
Statement of Changes in Net Assets
| Year ended
December 31, 2006 | Year ended
December 31, 2005 |
Increase (Decrease) in Net Assets | | |
Operations | | |
Net investment income | $ 101,953,049 | $ 110,572,722 |
Net realized gain (loss) | 19,571,030 | 14,492,871 |
Change in net unrealized appreciation (depreciation) | 25,541,215 | (85,881,349) |
Net increase (decrease) in net assets resulting from operations | 147,065,294 | 39,184,244 |
Distributions to shareholders from net investment income | (103,253,559) | (242,303,630) |
Share transactions - net increase (decrease) | (158,550,860) | (136,476,901) |
Total increase (decrease) in net assets | (114,739,125) | (339,596,287) |
| | |
Net Assets | | |
Beginning of period | 1,503,751,446 | 1,843,347,733 |
End of period (including undistributed net investment income of $3,860,284 and undistributed net investment income of $5,394,674, respectively) | $ 1,389,012,321 | $ 1,503,751,446 |
See accompanying notes which are an integral part of the financial statements.
Annual Report
Financial Highlights - Initial Class
Years ended December 31, | 2006 | 2005 | 2004 | 2003 | 2002 |
Selected Per-Share Data | | | | | |
Net asset value, beginning of period | $ 6.17 | $ 7.00 | $ 6.95 | $ 5.93 | $ 6.41 |
Income from Investment Operations | | | | | |
Net investment income C | .476 | .457 | .494 | .520 | .496 G |
Net realized and unrealized gain (loss) | .216 | (.281) | .126 | .980 | (.306) G |
Total from investment operations | .692 | .176 | .620 | 1.500 | .190 |
Distributions from net investment income | (.512) | (1.006) | (.570) | (.480) | (.670) |
Net asset value, end of period | $ 6.35 | $ 6.17 | $ 7.00 | $ 6.95 | $ 5.93 |
Total Return A, B | 11.24% | 2.70% | 9.59% | 27.26% | 3.44% |
Ratios to Average Net Assets D, F | | | | | |
Expenses before reductions | .71% | .70% | .71% | .69% | .70% |
Expenses net of fee waivers, if any | .71% | .70% | .71% | .69% | .70% |
Expenses net of all reductions | .71% | .70% | .71% | .69% | .70% |
Net investment income | 7.40% | 6.98% | 7.43% | 8.25% | 8.65% G |
Supplemental Data | | | | | |
Net assets, end of period (000 omitted) | $ 922,565 | $ 1,080,002 | $ 1,371,736 | $ 1,593,714 | $ 1,145,562 |
Portfolio turnover rate E | 65% | 95% | 128% | 130% | 96% |
A Total returns do not reflect charges attributable to your insurance company's separate account. Inclusion of these charges would reduce the total returns shown.
B Total returns would have been lower had certain expenses not been reduced during the periods shown.
C Calculated based on average shares outstanding during the period.
D Fees and expenses of the underlying Fidelity Central Funds are not included in the Fund's expense ratio. The Fund indirectly bears its proportionate share of the expenses of any underlying Fidelity Central Funds.
E Amount does not include the portfolio activity of any underlying Fidelity Central Funds.
F Expense ratios reflect operating expenses of the class. Expenses before reductions do not reflect amounts reimbursed by the investment adviser or reductions from brokerage service arrangements or other expense offset arrangements and do not represent the amount paid by the class during periods when reimbursements or reductions occur. Expenses net of fee waivers reflect expenses after reimbursement by the investment adviser but prior to reductions from brokerage service arrangements or other expense offset arrangements. Expenses net of all reductions represent the net expenses paid by the class.
G As a result of a revision to reflect accretion of market discount using the interest method, certain amounts for the year ended December 31, 2002, have been reclassified from what was previously reported. The impact of this change was a decrease to net investment income (loss) of $.017 per share with a corresponding increase to net realized and unrealized gain (loss) per share. The ratio of net investment income (loss) to average net assets decreased from 8.95% to 8.65%. The reclassification has no impact on the net assets of the Fund.
Financial Highlights - Service Class
Years ended December 31, | 2006 | 2005 | 2004 | 2003 | 2002 |
Selected Per-Share Data | | | | | |
Net asset value, beginning of period | $ 6.14 | $ 6.97 | $ 6.92 | $ 5.91 | $ 6.38 |
Income from Investment Operations | | | | | |
Net investment income C | .467 | .448 | .486 | .513 | .488 G |
Net realized and unrealized gain (loss) | .218 | (.283) | .124 | .967 | (.288) G |
Total from investment operations | .685 | .165 | .610 | 1.480 | .200 |
Distributions from net investment income | (.505) | (.995) | (.560) | (.470) | (.670) |
Net asset value, end of period | $ 6.32 | $ 6.14 | $ 6.97 | $ 6.92 | $ 5.91 |
Total Return A, B | 11.18% | 2.52% | 9.47% | 26.97% | 3.62% |
Ratios to Average Net Assets D, F | | | | | |
Expenses before reductions | .81% | .80% | .81% | .79% | .80% |
Expenses net of fee waivers, if any | .81% | .80% | .81% | .79% | .80% |
Expenses net of all reductions | .81% | .80% | .81% | .79% | .80% |
Net investment income | 7.30% | 6.88% | 7.33% | 8.15% | 8.55% G |
Supplemental Data | | | | | |
Net assets, end of period (000 omitted) | $ 277,546 | $ 319,380 | $ 377,122 | $ 417,928 | $ 260,489 |
Portfolio turnover rate E | 65% | 95% | 128% | 130% | 96% |
A Total returns do not reflect charges attributable to your insurance company's separate account. Inclusion of these charges would reduce the total returns shown.
B Total returns would have been lower had certain expenses not been reduced during the periods shown.
C Calculated based on average shares outstanding during the period.
D Fees and expenses of the underlying Fidelity Central Funds are not included in the Fund's expense ratio. The Fund indirectly bears its proportionate share of the expenses of any underlying Fidelity Central Funds.
E Amount does not include the portfolio activity of any underlying Fidelity Central Funds.
F Expense ratios reflect operating expenses of the class. Expenses before reductions do not reflect amounts reimbursed by the investment adviser or reductions from brokerage service arrangements or other expense offset arrangements and do not represent the amount paid by the class during periods when reimbursements or reductions occur. Expenses net of fee waivers reflect expenses after reimbursement by the investment adviser but prior to reductions from brokerage service arrangements or other expense offset arrangements. Expenses net of all reductions represent the net expenses paid by the class.
G As a result of a revision to reflect accretion of market discount using the interest method, certain amounts for the year ended December 31, 2002, have been reclassified from what was previously reported. The impact of this change was a decrease to net investment income (loss) of $.017 per share with a corresponding increase to net realized and unrealized gain (loss) per share. The ratio of net investment income (loss) to average net assets decreased from 8.85% to 8.55%. The reclassification has no impact on the net assets of the Fund.
See accompanying notes which are an integral part of the financial statements.
VIP High Income Portfolio
Financial Highlights - Service Class 2
Years ended December 31, | 2006 | 2005 | 2004 | 2003 | 2002 |
Selected Per-Share Data | | | | | |
Net asset value, beginning of period | $ 6.08 | $ 6.91 | $ 6.87 | $ 5.87 | $ 6.36 |
Income from Investment Operations | | | | | |
Net investment income C | .453 | .433 | .470 | .501 | .472 G |
Net realized and unrealized gain (loss) | .216 | (.284) | .130 | .959 | (.292) G |
Total from investment operations | .669 | .149 | .600 | 1.460 | .180 |
Distributions from net investment income | (.499) | (.979) | (.560) | (.460) | (.670) |
Net asset value, end of period | $ 6.25 | $ 6.08 | $ 6.91 | $ 6.87 | $ 5.87 |
Total Return A, B | 11.02% | 2.31% | 9.38% | 26.75% | 3.30% |
Ratios to Average Net Assets D, F | | | | | |
Expenses before reductions | .97% | .95% | .97% | .95% | .97% |
Expenses net of fee waivers, if any | .97% | .95% | .97% | .95% | .97% |
Expenses net of all reductions | .97% | .95% | .97% | .95% | .97% |
Net investment income | 7.14% | 6.72% | 7.17% | 7.99% | 8.38% G |
Supplemental Data | | | | | |
Net assets, end of period (000 omitted) | $ 110,503 | $ 86,757 | $ 94,246 | $ 76,383 | $ 32,499 |
Portfolio turnover rate E | 65% | 95% | 128% | 130% | 96% |
A Total returns do not reflect charges attributable to your insurance company's separate account. Inclusion of these charges would reduce the total returns shown.
B Total returns would have been lower had certain expenses not been reduced during the periods shown.
C Calculated based on average shares outstanding during the period.
D Fees and expenses of the underlying Fidelity Central Funds are not included in the Fund's expense ratio. The Fund indirectly bears its proportionate share of the expenses of any underlying Fidelity Central Funds.
E Amount does not include the portfolio activity of any underlying Fidelity Central Funds.
F Expense ratios reflect operating expenses of the class. Expenses before reductions do not reflect amounts reimbursed by the investment adviser or reductions from brokerage service arrangements or other expense offset arrangements and do not represent the amount paid by the class during periods when reimbursements or reductions occur. Expenses net of fee waivers reflect expenses after reimbursement by the investment adviser but prior to reductions from brokerage service arrangements or other expense offset arrangements. Expenses net of all reductions represent the net expenses paid by the class.
G As a result of a revision to reflect accretion of market discount using the interest method, certain amounts for the year ended December 31, 2002, have been reclassified from what was previously reported. The impact of this change was a decrease to net investment income (loss) of $.017 per share with a corresponding increase to net realized and unrealized gain (loss) per share. The ratio of net investment income (loss) to average net assets decreased from 8.68% to 8.38%. The reclassification has no impact on the net assets of the Fund.
Financial Highlights - Initial Class R
Years ended December 31, | 2006 | 2005 | 2004 H |
Selected Per-Share Data | | | |
Net asset value, beginning of period | $ 6.16 | $ 7.00 | $ 6.47 |
Income from Investment Operations | | | |
Net investment income E | .475 | .455 | .338 |
Net realized and unrealized gain (loss) | .218 | (.288) | .192 |
Total from investment operations | .693 | .167 | .530 |
Distributions from net investment income | (.513) | (1.007) | - |
Net asset value, end of period | $ 6.34 | $ 6.16 | $ 7.00 |
Total Return B, C, D | 11.27% | 2.55% | 8.19% |
Ratios to Average Net Assets F, I | | | |
Expenses before reductions | .71% | .70% | .71% A |
Expenses net of fee waivers, if any | .71% | .70% | .71% A |
Expenses net of all reductions | .71% | .70% | .71% A |
Net investment income | 7.39% | 6.98% | 7.16% A |
Supplemental Data | | | |
Net assets, end of period (000 omitted) | $ 93 | $ 83 | $ 81 |
Portfolio turnover rate G | 65% | 95% | 128% |
A Annualized
B Total returns for periods of less than one year are not annualized.
C Total returns do not reflect charges attributable to your insurance company's separate account. Inclusion of these charges would reduce the total returns shown.
D Total returns would have been lower had certain expenses not been reduced during the periods shown.
E Calculated based on average shares outstanding during the period.
F Fees and expenses of the underlying Fidelity Central Funds are not included in the Fund's expense ratio. The Fund indirectly bears its proportionate share of the expenses of any underlying Fidelity Central Funds.
G Amount does not include the portfolio activity of any underlying Fidelity Central Funds.
H For the period April 14, 2004 (commencement of sale of shares) to December 31, 2004.
I Expense ratios reflect operating expenses of the class. Expenses before reductions do not reflect amounts reimbursed by the investment adviser or reductions from brokerage service arrangements or other expense offset arrangements and do not represent the amount paid by the class during periods when reimbursements or reductions occur. Expense ratios before reductions for start-up periods may not be representative of longer-term operating periods. Expenses net of fee waivers reflect expenses after reimbursement by the investment adviser but prior to reductions from brokerage service arrangements or other expense offset arrangements. Expenses net of all reductions represent the net expenses paid by the class.
See accompanying notes which are an integral part of the financial statements.
Annual Report
Financial Highlights - Service Class R
Years ended December 31, | 2006 | 2005 | 2004 H |
Selected Per-Share Data | | | |
Net asset value, beginning of period | $ 6.14 | $ 6.97 | $ 6.45 |
Income from Investment Operations | | | |
Net investment income E | .467 | .447 | .332 |
Net realized and unrealized gain (loss) | .219 | (.282) | .188 |
Total from investment operations | .686 | .165 | .520 |
Distributions from net investment income | (.506) | (.995) | - |
Net asset value, end of period | $ 6.32 | $ 6.14 | $ 6.97 |
Total Return B, C, D | 11.19% | 2.53% | 8.06% |
Ratios to Average Net Assets F, I | | | |
Expenses before reductions | .81% | .80% | .81% A |
Expenses net of fee waivers, if any | .81% | .80% | .81% A |
Expenses net of all reductions | .81% | .80% | .81% A |
Net investment income | 7.30% | 6.88% | 7.05% A |
Supplemental Data | | | |
Net assets, end of period (000 omitted) | $ 92 | $ 83 | $ 81 |
Portfolio turnover rate G | 65% | 95% | 128% |
A Annualized
B Total returns for periods of less than one year are not annualized.
C Total returns do not reflect charges attributable to your insurance company's separate account. Inclusion of these charges would reduce the total returns shown.
D Total returns would have been lower had certain expenses not been reduced during the periods shown.
E Calculated based on average shares outstanding during the period.
F Fees and expenses of the underlying Fidelity Central Funds are not included in the Fund's expense ratio. The Fund indirectly bears its proportionate share of the expenses of any underlying Fidelity Central Funds.
G Amount does not include the portfolio activity of any underlying Fidelity Central Funds.
H For the period April 14, 2004 (commencement of sale of shares) to December 31, 2004.
I Expense ratios reflect operating expenses of the class. Expenses before reductions do not reflect amounts reimbursed by the investment adviser or reductions from brokerage service arrangements or other expense offset arrangements and do not represent the amount paid by the class during periods when reimbursements or reductions occur. Expense ratios before reductions for start-up periods may not be representative of longer-term operating periods. Expenses net of fee waivers reflect expenses after reimbursement by the investment adviser but prior to reductions from brokerage service arrangements or other expense offset arrangements. Expenses net of all reductions represent the net expenses paid by the class.
Financial Highlights - Service Class 2R
Years ended December 31, | 2006 | 2005 | 2004 H |
Selected Per-Share Data | | | |
Net asset value, beginning of period | $ 6.08 | $ 6.91 | $ 6.40 |
Income from Investment Operations | | | |
Net investment income E | .453 | .433 | .322 |
Net realized and unrealized gain (loss) | .214 | (.282) | .188 |
Total from investment operations | .667 | .151 | .510 |
Distributions from net investment income | (.497) | (.981) | - |
Net asset value, end of period | $ 6.25 | $ 6.08 | $ 6.91 |
Total Return B, C, D | 10.99% | 2.33% | 7.97% |
Ratios to Average Net Assets F, I | | | |
Expenses before reductions | .96% | .94% | .96% A |
Expenses net of fee waivers, if any | .96% | .94% | .96% A |
Expenses net of all reductions | .96% | .94% | .96% A |
Net investment income | 7.14% | 6.73% | 6.90% A |
Supplemental Data | | | |
Net assets, end of period (000 omitted) | $ 92 | $ 83 | $ 81 |
Portfolio turnover rate G | 65% | 95% | 128% |
A Annualized
B Total returns for periods of less than one year are not annualized.
C Total returns do not reflect charges attributable to your insurance company's separate account. Inclusion of these charges would reduce the total returns shown.
D Total returns would have been lower had certain expenses not been reduced during the periods shown.
E Calculated based on average shares outstanding during the period.
F Fees and expenses of the underlying Fidelity Central Funds are not included in the Fund's expense ratio. The Fund indirectly bears its proportionate share of the expenses of any underlying Fidelity Central Funds.
G Amount does not include the portfolio activity of any underlying Fidelity Central Funds.
H For the period April 14, 2004 (commencement of sale of shares) to December 31, 2004.
I Expense ratios reflect operating expenses of the class. Expenses before reductions do not reflect amounts reimbursed by the investment adviser or reductions from brokerage service arrangements or other expense offset arrangements and do not represent the amount paid by the class during periods when reimbursements or reductions occur. Expense ratios before reductions for start-up periods may not be representative of longer-term operating periods. Expenses net of fee waivers reflect expenses after reimbursement by the investment adviser but prior to reductions from brokerage service arrangements or other expense offset arrangements. Expenses net of all reductions represent the net expenses paid by the class.
See accompanying notes which are an integral part of the financial statements.
VIP High Income Portfolio
Financial Highlights - Investor Class
Years ended December 31, | 2006 | 2005 H |
Selected Per-Share Data | | |
Net asset value, beginning of period | $ 6.16 | $ 6.54 |
Income from Investment Operations | | |
Net investment income E | .471 | .193 |
Net realized and unrealized gain (loss) | .220 | (.089) |
Total from investment operations | .691 | .104 |
Distributions from net investment income | (.511) | (.484) |
Net asset value, end of period | $ 6.34 | $ 6.16 |
Total Return B, C, D | 11.24% | 1.60% |
Ratios to Average Net Assets F, I | | |
Expenses before reductions | .80% | .82% A |
Expenses net of fee waivers, if any | .80% | .82% A |
Expenses net of all reductions | .79% | .82% A |
Net investment income | 7.31% | 6.86% A |
Supplemental Data | | |
Net assets, end of period (000 omitted) | $ 78,122 | $ 17,363 |
Portfolio turnover rate G | 65% | 95% |
A Annualized
B Total returns for periods of less than one year are not annualized.
C Total returns do not reflect charges attributable to your insurance company's separate account. Inclusion of these charges would reduce the total returns shown.
D Total returns would have been lower had certain expenses not been reduced during the periods shown.
E Calculated based on average shares outstanding during the period.
F Fees and expenses of the underlying Fidelity Central Funds are not included in the Fund's expense ratio. The Fund indirectly bears its proportionate share of the expenses of any underlying Fidelity Central Funds.
G Amount does not include the portfolio activity of any underlying Fidelity Central Funds.
H For the period July 21, 2005 (commencement of sale of shares) to December 31, 2005.
I Expense ratios reflect operating expenses of the class. Expenses before reductions do not reflect amounts reimbursed by the investment adviser or reductions from brokerage service arrangements or other expense offset arrangements and do not represent the amount paid by the class during periods when reimbursements or reductions occur. Expense ratios before reductions for start-up periods may not be representative of longer-term operating periods. Expenses net of fee waivers reflect expenses after reimbursement by the investment adviser but prior to reductions from brokerage service arrangements or other expense offset arrangements. Expenses net of all reductions represent the net expenses paid by the class.
See accompanying notes which are an integral part of the financial statements.
Annual Report
Notes to Financial Statements
For the period ended December 31, 2006
1. Significant Accounting Policies.
VIP High Income Portfolio (the Fund) is a fund of Variable Insurance Products Fund (the trust) and is authorized to issue an unlimited number of shares. The trust is registered under the Investment Company Act of 1940, as amended (the 1940 Act), as an open-end management investment company organized as a Massachusetts business trust. Shares of the Fund may only be purchased by insurance companies for the purpose of funding variable annuity or variable life insurance contracts. The Fund offers the following classes of shares: Initial Class shares, Service Class shares, Service Class 2 shares, Initial Class R shares, Service Class R shares, Service Class 2R shares, and Investor Class shares. All classes have equal rights and voting privileges, except for matters affecting a single class. Investment income, realized and unrealized capital gains and losses, the common expenses of the Fund, and certain fund-level expense reductions, if any, are allocated on a pro rata basis to each class based on the relative net assets of each class to the total net assets of the Fund. Each class differs with respect to transfer agent and distribution and service plan fees incurred. Certain expense reductions also differ by class.
The Fund may invest in Fidelity Central Funds which are open-end investment companies available to investment companies and other accounts managed by Fidelity Management & Research (FMR) and its affiliates. The financial statements have been prepared in conformity with accounting principles generally accepted in the United States of America, which require management to make certain estimates and assumptions at the date of the financial statements. The following summarizes the significant accounting policies of the Fund, which are also consistently followed by the Fidelity Central Funds:
Security Valuation. Investments are valued and net asset value per share is calculated (NAV calculation) as of the close of business of the New York Stock Exchange, normally 4:00 p.m. Eastern time. Wherever possible, the Fund uses independent pricing services approved by the Board of Trustees to value its investments.
Debt securities, including restricted securities, for which quotations are readily available, are valued by independent pricing services or by dealers who make markets in such securities. Pricing services consider yield or price of bonds of comparable quality, coupon, maturity and type as well as dealer supplied prices. Equity securities, including restricted securities, for which market quotations are readily available, are valued at the last reported sale price or official closing price as reported by an independent pricing service on the primary market or exchange on which they are traded. In the event there were no sales during the day or closing prices are not available, securities are valued at the last quoted bid price.
When current market prices or quotations are not readily available or do not accurately reflect fair value, valuations may be determined in accordance with procedures adopted by the Board of Trustees. The frequency of when fair value pricing is used is unpredictable. The value of securities used for NAV calculation under fair value pricing may differ from published prices for the same securities. Investments in open-end mutual funds, including the Fidelity Central Funds, are valued at their closing net asset value each business day. Short-term securities with remaining maturities of sixty days or less for which quotations are not readily available are valued at amortized cost, which approximates value.
Investment Transactions and Income. Security transactions, including the Fund's investment activity in the Fidelity Central Funds, are accounted for as of trade date. Gains and losses on securities sold are determined on the basis of identified cost and may include proceeds received from litigation. Distributions received on securities that represent a return of capital or capital gain are recorded as a reduction of cost of investments and/or as a realized gain. The Fund estimates the components of distributions received that may be considered return of capital distributions or capital gain distributions. Interest income is accrued as earned, with any income distributions receivable as of period end included in Interest Receivable on the Statement of Assets and Liabilities. Interest income includes coupon interest and amortization of premium and accretion of discount on debt securities.
Expenses. Most expenses of the trust can be directly attributed to a fund. Expenses which cannot be directly attributed are apportioned among each Fund in the trust. Expense estimates are accrued in the period to which they relate and adjustments are made when actual amounts are known.
Income Tax Information and Distributions to Shareholders. Each year, the Fund intends to qualify as a regulated investment company by distributing all of its taxable income and realized gains under Subchapter M of the Internal Revenue Code. As a result, no provision for income taxes is required in the accompanying financial statements.
Distributions are recorded on the ex-dividend date. Income dividends and capital gain distributions are declared separately for each class. Income and capital gain distributions are determined in accordance with income tax regulations, which may differ from generally accepted accounting principles.
Capital accounts within the financial statements are adjusted for permanent book-tax differences. These adjustments have no impact on net assets or the results of operations. Temporary book-tax differences will reverse in a subsequent period.
Book-tax differences are primarily due to market discount, capital loss carryforwards and losses deferred due to wash sales.
VIP High Income Portfolio
1. Significant Accounting Policies - continued
Income Tax Information and Distributions to Shareholders - continued
The tax-basis components of distributable earnings and the federal tax cost as of period end were as follows:
Unrealized appreciation | $ 43,304,661 |
Unrealized depreciation | (8,664,345) |
Net unrealized appreciation (depreciation) | 34,640,316 |
Undistributed ordinary income | 324,505 |
Capital loss carryforward | (1,110,768,989) |
| |
Cost for federal income tax purposes | $ 1,334,459,232 |
The tax character of distributions paid was as follows:
| December 31, 2006 | December 31, 2005 |
Ordinary Income | $ 103,253,559 | $ 242,303,630 |
Trading (Redemption) Fees. Initial Class R shares, Service Class R shares, and Service Class 2R shares held less than 60 days are subject to a redemption fee equal to 1% of the proceeds of the redeemed shares. All redemption fees, including any estimated redemption fees paid by FMR, are retained by the Fund and accounted for as an addition to paid in capital.
New Accounting Pronouncements. In July 2006, Financial Accounting Standards Board Interpretation No. 48, Accounting for Uncertainty in Income Taxes - an interpretation of FASB Statement 109 (FIN 48), was issued and is effective on the last business day of the semiannual reporting period for fiscal years beginning after December 15, 2006. FIN 48 sets forth a threshold for financial statement recognition, measurement and disclosure of a tax position taken or expected to be taken on a tax return. Management is currently evaluating the impact, if any, the adoption of FIN 48 will have on the Fund's net assets, results of operations and financial statement disclosures.
In addition, in September 2006, Statement of Financial Accounting Standards No. 157, Fair Value Measurements (SFAS 157), was issued and is effective for fiscal years beginning after November 15, 2007. SFAS 157 defines fair value, establishes a framework for measuring fair value and expands disclosures about fair value measurements. Management is currently evaluating the impact the adoption of SFAS 157 will have on the Fund's financial statement disclosures.
2. Operating Policies.
Repurchase Agreements. FMR has received an Exemptive Order from the Securities and Exchange Commission (the SEC) which permits the Fund and other affiliated entities of FMR to transfer uninvested cash balances into joint trading accounts which are then invested in repurchase agreements. The Fund may also invest directly with institutions in repurchase agreements. Repurchase agreements are collateralized by government or non-government securities. Upon settlement date, collateral is held in segregated accounts with custodian banks and may be obtained in the event of a default of the counterparty. The Fund monitors, on a daily basis, the value of the collateral to ensure it is at least equal to the principal amount of the repurchase agreement (including accrued interest). In the event of a default by the counterparty, realization of the collateral proceeds could be delayed, during which time the value of the collateral may decline.
Restricted Securities. The Fund may invest in securities that are subject to legal or contractual restrictions on resale. These securities generally may be resold in transactions exempt from registration or to the public if the securities are registered. Disposal of these securities may involve time-consuming negotiations and expense, and prompt sale at an acceptable price may be difficult. Information regarding restricted securities is included at the end of the Fund's Schedule of Investments.
Loans and Other Direct Debt Instruments. The Fund may invest in loans and loan participations, trade claims or other receivables. These investments may include standby financing commitments, including revolving credit facilities, that obligate the Fund to supply additional cash to the borrower on demand. Loan participations involve a risk of insolvency of the lending bank or other financial intermediary. The Fund may be contractually obligated to receive approval from the agent bank and/or borrower prior to the sale of these investments.
3. Purchases and Sales of Investments.
Purchases and sales of securities, other than short-term securities, aggregated $865,731,965 and $1,016,668,370, respectively.
Annual Report
Notes to Financial Statements - continued
4. Fees and Other Transactions with Affiliates.
Management Fee. FMR and its affiliates provide the Fund with investment management related services for which the Fund pays a monthly management fee. The management fee is the sum of an individual fund fee rate that is based on an annual rate of .45% of the Fund's average net assets and a group fee rate that averaged .12% during the period. The group fee rate is based upon the average net assets of all the mutual funds advised by FMR. The group fee rate decreases as assets under management increase and increases as assets under management decrease. For the period, the total annual management fee rate was .57% of the Fund's average net assets.
Distribution and Service Plan. In accordance with Rule 12b-1 of the 1940 Act, the Fund has adopted separate 12b-1 Plans for each Service Class of shares. Each Service Class pays Fidelity Distributors Corporation (FDC), an affiliate of FMR, a service fee. For the period, the service fee is based on an annual rate of .10% of Service Class' and Service Class R's average net assets and .25% of Service Class 2's and Service Class 2R's average net assets.
For the period, each class paid FDC the following amounts, all of which were re-allowed to insurance companies for the distribution of shares and providing shareholder support services:
Service Class | $ 287,507 |
Service Class 2 | 239,015 |
Service Class R | 86 |
Service Class 2R | 218 |
| $ 526,826 |
Transfer Agent Fees. Fidelity Investments Institutional Operations Company, Inc. (FIIOC), an affiliate of FMR, is the fund's transfer, dividend disbursing, and shareholder servicing agent. FIIOC receives an asset-based fee with respect to each class. Each class with the exception of Investor Class pays a transfer agent fee, excluding out of pocket expenses, equal to an annual rate of .07% of their month end net assets. Investor Class pays a monthly asset-based transfer agent fee of .14% of its month end net assets. The total transfer agent fees paid by each class to FIIOC, including out of pocket expenses, were as follows:
Initial Class | $ 659,851 |
Service Class | 192,109 |
Service Class 2 | 69,704 |
Initial Class R | 61 |
Service Class R | 61 |
Service Class 2R | 60 |
Investor Class | 70,542 |
| $ 992,388 |
Accounting Fees. Fidelity Service Company, Inc. (FSC), an affiliate of FMR, maintains the Fund's accounting records. The fee is based on the level of average net assets for the month.
Investments in Fidelity Central Funds. The Fund may invest in Fidelity Central Funds. The Fund's Schedule of Investments lists each of the Fidelity Central Funds as an investment of the Fund but does not include the underlying holdings of each Fidelity Central Fund. As an Investing Fund, the Fund indirectly bears its proportionate share of the expenses of the underlying Fidelity Central Funds. A complete unaudited list of holdings for each Fidelity Central Fund is available upon request. In addition, the financial statements of the Fidelity Central Funds, which are not covered by the Fund's Report of Independent Registered Public Accounting Firm, are available on the EDGAR Database on the SEC's web site, www.sec.gov, or upon request.
The Money Market Central Funds seek preservation of capital and current income and are managed by Fidelity Investments Money Management, Inc. (FIMM), an affiliate of FMR.
Interfund Lending Program. Pursuant to an Exemptive Order issued by the SEC, the Fund, along with other registered investment companies having management contracts with FMR, may participate in an interfund lending program. This program provides an alternative credit facility allowing the funds to borrow from, or lend money to, other participating affiliated funds. At period end, there were no interfund loans outstanding. The Fund's activity in this program during the period for which loans were outstanding was as follows:
Borrower or Lender | Average Daily
Loan Balance | Weighted Average Interest Rate | Interest
Expense |
Borrower | $ 50,002,000 | 4.95% | $ 6,880 |
VIP High Income Portfolio
5. Committed Line of Credit.
The Fund participates with other funds managed by FMR in a $4.2 billion credit facility (the "line of credit") to be utilized for temporary or emergency purposes to fund shareholder redemptions or for other short-term liquidity purposes. The Fund has agreed to pay commitment fees on its pro rata portion of the line of credit, which amounted to $3,930 and is reflected in Miscellaneous Expense on the Statement of Operations. During the period, there were no borrowings on this line of credit.
6. Expense Reductions.
Through arrangements with the fund's custodian, credits realized as a result of uninvested cash balances were used to reduce the Fund's expenses. During the period, these credits reduced the Fund's custody expenses by $13,761.
7. Other.
The Fund's organizational documents provide former and current trustees and officers with a limited indemnification against liabilities arising in connection with the performance of their duties to the Fund. In the normal course of business, the Fund may also enter into contracts that provide general indemnifications. The Fund's maximum exposure under these arrangements is unknown as this would be dependent on future claims that may be made against the Fund. The risk of material loss from such claims is considered remote.
At the end of the period, FMR or its affiliates were the owners of record of 21% of the total outstanding shares of the Fund and two otherwise unaffiliated shareholders were the owners of record of 48% of the total outstanding shares of the Fund.
The United States Securities and Exchange Commission ("SEC") is conducting an investigation of FMR (covering the years 2002 to 2004) arising from gifts, gratuities and business entertainment provided by certain brokers to certain individuals who were employed on FMR's domestic equity trading desk during that period. FMR is in discussions with the SEC staff regarding the possible resolution of the matter, but as of period-end no final resolution has been reached.
In December 2006, the Independent Trustees completed their own investigation of the matter with the assistance of independent counsel. The Independent Trustees and FMR agree that, despite the absence of proof that the Fidelity mutual funds experienced diminished execution quality as a result of the improper receipt of gifts and business entertainment, the conduct at issue was serious and is worthy of redress. Accordingly, the Independent Trustees have requested and FMR has agreed to pay $42 million to Fidelity mutual funds, plus interest to be determined at the time that payment is made. A method of allocating this payment among the funds has not yet been determined. The total payment to the Fund is not anticipated to have a material impact on the Fund's net assets. In addition, FMR reimbursed related legal expenses which are recorded in the accompanying Statement of Operations as an expense reduction.
8. Distributions to Shareholders.
Distributions to shareholders of each class were as follows:
Years ended December 31, | 2006 | 2005 A |
From net investment income | | |
Initial Class | $ 68,637,194 | $ 178,515,690 |
Service Class | 20,731,877 | 49,309,732 |
Service Class 2 | 8,160,312 | 13,285,899 |
Initial Class R | 6,935 | 12,124 |
Service Class R | 6,854 | 12,013 |
Service Class 2R | 6,779 | 11,933 |
Investor Class | 5,703,608 | 1,156,239 |
Total | $ 103,253,559 | $ 242,303,630 |
A Distributions for Investor Class are for the period July 21, 2005 (commencement of sale of shares) to December 31, 2005.
Annual Report
Notes to Financial Statements - continued
9. Share Transactions.
Transactions for each class of shares were as follows:
| Shares | Dollars |
Years ended December 31, | 2006 | 2005 A | 2006 | 2005 A |
Initial Class | | | | |
Shares sold | 20,391,924 | 37,931,608 | $ 130,862,386 | $ 248,546,554 |
Reinvestment of distributions | 10,827,982 | 28,128,457 | 68,637,194 | 178,515,690 |
Shares redeemed | (60,996,323) | (86,845,685) | (389,548,495) | (567,756,363) |
Net increase (decrease) | (29,776,417) | (20,785,620) | $ (190,048,915) | $ (140,694,119) |
Service Class | | | | |
Shares sold | 15,758,056 | 29,061,863 | $ 100,943,180 | $ 188,149,058 |
Reinvestment of distributions | 3,286,143 | 7,805,887 | 20,731,877 | 49,309,732 |
Shares redeemed | (27,123,963) | (38,948,041) | (172,895,592) | (254,601,512) |
Net increase (decrease) | (8,079,764) | (2,080,291) | $ (51,220,535) | $ (17,142,722) |
Service Class 2 | | | | |
Shares sold | 8,956,747 | 16,971,594 | $ 56,663,410 | $ 108,910,856 |
Reinvestment of distributions | 1,307,892 | 2,124,657 | 8,160,311 | 13,285,899 |
Shares redeemed | (6,845,198) | (18,474,037) | (43,209,500) | (119,201,649) |
Net increase (decrease) | 3,419,441 | 622,214 | $ 21,614,221 | $ 2,995,106 |
Initial Class R | | | | |
Reinvestment of distributions | 1,095 | 1,917 | $ 6,935 | $ 12,124 |
Net increase (decrease) | 1,095 | 1,917 | $ 6,935 | $ 12,124 |
Service Class R | | | | |
Reinvestment of distributions | 1,087 | 1,906 | $ 6,854 | $ 12,013 |
Net increase (decrease) | 1,087 | 1,906 | $ 6,854 | $ 12,013 |
Service Class 2R | | | | |
Reinvestment of distributions | 1,087 | 1,910 | $ 6,779 | $ 11,933 |
Net increase (decrease) | 1,087 | 1,910 | $ 6,779 | $ 11,933 |
Investor Class | | | | |
Shares sold | 10,403,901 | 2,735,811 | $ 66,865,919 | $ 17,864,904 |
Reinvestment of distributions | 901,089 | 188,006 | 5,703,608 | 1,156,238 |
Shares redeemed | (1,794,789) | (105,654) | (11,485,726) | (692,378) |
Net increase (decrease) | 9,510,201 | 2,818,163 | $ 61,083,801 | $ 18,328,764 |
A Share transactions for Investor Class are for the period July 21, 2005 (commencement of sale of shares) to December 31, 2005.
VIP High Income Portfolio
Report of Independent Registered Public Accounting Firm
To the Trustees of Variable Insurance Products Fund and the Shareholders of VIP High Income Portfolio:
In our opinion, the accompanying statement of assets and liabilities, including the schedule of investments, and the related statements of operations and of changes in net assets and the financial highlights present fairly, in all material respects, the financial position of VIP High Income Portfolio (a fund of Variable Insurance Products Fund) at December 31, 2006, the results of its operations for the year then ended, the changes in its net assets for each of the two years in the period then ended and the financial highlights for each of the periods indicated, in conformity with accounting principles generally accepted in the United States of America. These financial statements and financial highlights (hereafter referred to as "financial statements") are the responsibility of the VIP High Income Portfolio's management; our responsibility is to express an opinion on these financial statements based on our audits. We conducted our audits of these financial statements in accordance with the standards of the Public Company Accounting Oversight Board (United States). Those standards require that we plan and perform the audit to obtain reasonable assurance about whether the financial statements are free of material misstatement. An audit includes examining, on a test basis, evidence supporting the amounts and disclosures in the financial statements, assessing the accounting principles used and significant estimates made by management, and evaluating the overall financial statement presentation. We believe that our audits, which included confirmation of securities at December 31, 2006 by correspondence with the custodian and brokers, provide a reasonable basis for our opinion.
/s/ PricewaterhouseCoopers LLP
PricewaterhouseCoopers LLP
Boston, Massachusetts
February 13, 2007
Annual Report
Trustees and Officers
The Trustees, Member of the Advisory Board, and executive officers of the trust and fund, as applicable, are listed below. The Board of Trustees governs the fund and is responsible for protecting the interests of shareholders. The Trustees are experienced executives who meet periodically throughout the year to oversee the fund's activities, review contractual arrangements with companies that provide services to the fund, and review the fund's performance. Each of the Trustees oversees 348 funds advised by FMR or an affiliate.
The Trustees hold office without limit in time except that (a) any Trustee may resign; (b) any Trustee may be removed by written instrument, signed by at least two-thirds of the number of Trustees prior to such removal; (c) any Trustee who requests to be retired or who has become incapacitated by illness or injury may be retired by written instrument signed by a majority of the other Trustees; and (d) any Trustee may be removed at any special meeting of shareholders by a two-thirds vote of the outstanding voting securities of the trust. Each Trustee who is not an interested person (as defined in the 1940 Act) (Independent Trustee), shall retire not later than the last day of the calendar year in which his or her 72nd birthday occurs. The Independent Trustees may waive this mandatory retirement age policy with respect to individual Trustees. The executive officers and Advisory Board Member hold office without limit in time, except that any officer and Advisory Board Member may resign or may be removed by a vote of a majority of the Trustees at any regular meeting or any special meeting of the Trustees. Except as indicated, each individual has held the office shown or other offices in the same company for the past five years.
The fund's Statement of Additional Information (SAI) includes more information about the Trustees. To request a free copy, call Fidelity at 1-877-208-0098.
Interested Trustees*:
Correspondence intended for each Trustee who is an interested person may be sent to Fidelity Investments, 82 Devonshire Street, Boston, Massachusetts 02109.
Name, Age; Principal Occupation |
Edward C. Johnson 3d (76) |
| Year of Election or Appointment: 1981 Mr. Johnson is Chairman of the Board of Trustees. Mr. Johnson serves as President (2006-present), Chief Executive Officer, Chairman, and a Director of FMR Corp.; Chairman and a Director of FMR; Chairman and a Director of Fidelity Research & Analysis Company (FRAC); Chairman and a Director of Fidelity Investments Money Management, Inc.; and Chairman (2001- present) and a Director of FMR Co., Inc. In addition, Mr. Johnson serves as Chairman and Director of Fidelity International Limited (FIL). |
Robert L. Reynolds (54) |
| Year of Election or Appointment: 2003 Mr. Reynolds is President and a Director of FMR (2005-present), Fidelity Investments Money Management, Inc. (2005-present), and FMR Co., Inc. (2005-present). Mr. Reynolds also serves as Vice Chairman (2006-present), a Director (2003-present), and Chief Operating Officer of FMR Corp. and a Director of Strategic Advisers, Inc. (2005-present). He also serves on the Board at Fidelity Investments Canada, Ltd. |
* Trustees have been determined to be "Interested Trustees" by virtue of, among other things, their affiliation with the trust or various entities under common control with FMR.
Independent Trustees:
Correspondence intended for each Independent Trustee (that is, the Trustees other than the Interested Trustees) may be sent to Fidelity Investments, P.O. Box 55235, Boston, Massachusetts 02205-5235.
Name, Age; Principal Occupation |
Dennis J. Dirks (58) |
| Year of Election or Appointment: 2005 Prior to his retirement in May 2003, Mr. Dirks was Chief Operating Officer and a member of the Board of The Depository Trust & Clearing Corporation (DTCC) (1999-2003). He also served as President, Chief Operating Officer, and Board member of The Depository Trust Company (DTC) (1999-2003) and President and Board member of the National Securities Clearing Corporation (NSCC) (1999-2003). In addition, Mr. Dirks served as Chief Executive Officer and Board member of the Government Securities Clearing Corporation (2001-2003) and Chief Executive Officer and Board member of the Mortgage-Backed Securities Clearing Corporation (2001-2003). Mr. Dirks also serves as a Trustee and a member of the Finance Committee of Manhattan College (2005-present) and a Trustee and a member of the Finance Committee of AHRC of Nassau County (2006-present). |
Albert R. Gamper, Jr. (64) |
| Year of Election or Appointment: 2006 Prior to his retirement in December 2004, Mr. Gamper served as Chairman of the Board of CIT Group Inc. (commercial finance). During his tenure with CIT Group Inc. Mr. Gamper served in numerous senior management positions, including Chairman (1987-1989; 1999-2001; 2002-2004), Chief Executive Officer (1987-2004), and President (1989-2002). He currently serves as a member of the Board of Directors of Public Service Enterprise Group (utilities, 2001-present), Chairman of the Board of Governors, Rutgers University (2004-present), and Chairman of the Board of Saint Barnabas Health Care System. |
George H. Heilmeier (70) |
| Year of Election or Appointment: 2004 Dr. Heilmeier is Chairman Emeritus of Telcordia Technologies (communication software and systems), where prior to his retirement, he served as company Chairman and Chief Executive Officer. He currently serves on the Boards of Directors of The Mitre Corporation (systems engineering and information technology support for the government), and HRL Laboratories (private research and development, 2004-present). He is Chairman of the General Motors Science & Technology Advisory Board and a Life Fellow of the Institute of Electrical and Electronics Engineers (IEEE). Dr. Heilmeier is a member of the Defense Science Board and the National Security Agency Advisory Board. He is also a member of the National Academy of Engineering, the American Academy of Arts and Sciences, and the Board of Overseers of the School of Engineering and Applied Science of the University of Pennsylvania. Previously, Dr. Heilmeier served as a Director of TRW Inc. (automotive, space, defense, and information technology, 1992-2002), Compaq (1994-2002), Automatic Data Processing, Inc. (ADP) (technology-based business outsourcing, 1995-2002), INET Technologies Inc. (telecommunications network surveillance, 2001-2004), and Teletech Holdings (customer management services). He is the recipient of the 2005 Kyoto Prize in Advanced Technology for his invention of the liquid crystal display, and a member of the Consumer Electronics Hall of Fame. |
James H. Keyes (66) |
| Year of Election or Appointment: 2007 Prior to his retirement in 2003, Mr. Keyes was Chairman, President, and Chief Executive Officer of Johnson Controls, Inc. (automotive supplier, 1993-2003). He currently serves as a member of the boards of LSI Logic Corporation (semiconductor technologies), Navistar International Corporation (manufacture and sale of trucks, buses, and diesel engines, 2002-present), and Pitney Bowes, Inc. (integrated mail, messaging, and document management solutions). |
Marie L. Knowles (60) |
| Year of Election or Appointment: 2001 Prior to Ms. Knowles' retirement in June 2000, she served as Executive Vice President and Chief Financial Officer of Atlantic Richfield Company (ARCO) (diversified energy, 1996-2000). From 1993 to 1996, she was a Senior Vice President of ARCO and President of ARCO Transportation Company. She served as a Director of ARCO from 1996 to 1998. She currently serves as a Director of Phelps Dodge Corporation (copper mining and manufacturing) and McKesson Corporation (healthcare service, 2002-present). Ms. Knowles is a Trustee of the Brookings Institution and the Catalina Island Conservancy and also serves as a member of the Advisory Board for the School of Engineering of the University of Southern California. |
Ned C. Lautenbach (62) |
| Year of Election or Appointment: 2000 Mr. Lautenbach is Chairman of the Independent Trustees (2006-present). Mr. Lautenbach has been a partner of Clayton, Dubilier & Rice, Inc. (private equity investment firm) since September 1998. Previously, Mr. Lautenbach was with the International Business Machines Corporation (IBM) from 1968 until his retirement in 1998. Mr. Lautenbach serves as a Director of Sony Corporation (2006-present) and Eaton Corporation (diversified industrial) as well as the Philharmonic Center for the Arts in Naples, Florida. He also is a member of the Board of Trustees of Fairfield University (2005-present), as well as a member of the Council on Foreign Relations. |
Cornelia M. Small (62) |
| Year of Election or Appointment: 2005 Ms. Small is a member (2000-present) and Chairperson (2002-present) of the Investment Committee, and a member (2002- present) of the Board of Trustees of Smith College. Previously, she served as Chief Investment Officer (1999-2000), Director of Global Equity Investments (1996-1999), and a member of the Board of Directors of Scudder, Stevens & Clark (1990-1997) and Scudder Kemper Investments (1997-1999). In addition, Ms. Small served as Co-Chair (2000-2003) of the Annual Fund for the Fletcher School of Law and Diplomacy. |
William S. Stavropoulos (67) |
| Year of Election or Appointment: 2001 Mr. Stavropoulos is Chairman Emeritus of the Board of Directors of The Dow Chemical Company. Since joining The Dow Chemical Company in 1967, Mr. Stavropoulos served in numerous senior management positions, including President (1993-2000; 2002-2003), CEO (1995-2000; 2002-2004), and Chairman of the Executive Committee (2000-2004). Currently, he is a Director of NCR Corporation (data warehousing and technology solutions), BellSouth Corporation (telecommunications), Chemical Financial Corporation, Maersk Inc. (industrial conglomerate, 2002-present), and Metalmark Capital (private equity investment firm, 2005-present). He also serves as a member of the Board of Trustees of the American Enterprise Institute for Public Policy Research. In addition, Mr. Stavropoulos is a member of The Business Council, J.P. Morgan International Council and the University of Notre Dame Advisory Council for the College of Science. |
Kenneth L. Wolfe (67) |
| Year of Election or Appointment: 2005 Prior to his retirement in 2001, Mr. Wolfe was Chairman and Chief Executive Officer of Hershey Foods Corporation (1993-2001). He currently serves as a member of the boards of Adelphia Communications Corporation (2003-present), Bausch & Lomb, Inc., and Revlon Inc. (2004-present). |
Advisory Board Member and Executive Officers:
Correspondence intended for each executive officer and Mr. Lynch may be sent to Fidelity Investments, 82 Devonshire Street, Boston, Massachusetts 02109.
Name, Age; Principal Occupation |
Peter S. Lynch (62) |
| Year of Election or Appointment: 2003 Member of the Advisory Board of Variable Insurance Products Fund. Mr. Lynch is Vice Chairman and a Director of FMR, and Vice Chairman (2001-present) and a Director of FMR Co., Inc. Previously, Mr. Lynch served as a Trustee of the Fidelity funds (1990-2003). In addition, he serves as a Trustee of Boston College and as the Chairman of the Inner-City Scholarship Fund. |
Kimberley H. Monasterio (43) |
| Year of Election or Appointment: 2007 President and Treasurer of VIP High Income. Ms. Monasterio also serves as President and Treasurer of other Fidelity funds (2007-present) and is an employee of FMR (2004-present). Previously, Ms. Monasterio served as Deputy Treasurer of the Fidelity funds (2004-2006). Before joining Fidelity Investments, Ms. Monasterio served as Treasurer (2000-2004) and Chief Financial Officer (2002-2004) of the Franklin Templeton Funds and Senior Vice President of Franklin Templeton Services, LLC (2000-2004). |
Walter C. Donovan (44) |
| Year of Election or Appointment: 2005 Vice President of VIP High Income. Mr. Donovan also serves as Vice President of Fidelity's High Income Funds (2005-present). Mr. Donovan also serves as Executive Vice President of FMR (2005-present) and FMR Co., Inc. (2005-present). Previously, Mr. Donovan served as Vice President of Fidelity's Fixed-Income Funds (2005-2006), certain Asset Allocation Funds (2005-2006), certain Balanced Funds (2005-2006), and as Vice President and Director of Fidelity's International Equity Trading group (1998-2005). |
Robert A. Lawrence (46) |
| Year of Election or Appointment: 2006 Vice President of VIP High Income. Mr. Lawrence also serves as Vice President of the High Income Funds. Mr. Lawrence is Senior Vice President of FMR (2006-present) and FMR Co., Inc. (2006-present). Previously, Mr. Lawrence served as President of Fidelity Strategic Investments (2002-2005). |
Matthew J. Conti (39) |
| Year of Election or Appointment: 2003 Vice President of VIP High Income. Mr. Conti also serves as Vice President of other funds advised by FMR. Prior to assuming his current responsibilities, Mr. Conti worked as a research analyst and manager. Mr. Conti also serves as Vice President of FMR (2003) and FMR Co., Inc. (2003). |
Eric D. Roiter (58) |
| Year of Election or Appointment: 1998 Secretary of VIP High Income. He also serves as Secretary of other Fidelity funds; Vice President, General Counsel, and Secretary of FMR Co., Inc. (2001-present) and FMR; Assistant Secretary of Fidelity Management & Research (U.K.) Inc. (2001-present), Fidelity Research & Analysis Company (2001-present), and Fidelity Investments Money Management, Inc. (2001-present). Mr. Roiter is an Adjunct Member, Faculty of Law, at Boston College Law School (2003-present). Previously, Mr. Roiter served as Vice President and Secretary of Fidelity Distributors Corporation (FDC) (1998-2005). |
Stuart Fross (47) |
| Year of Election or Appointment: 2003 Assistant Secretary of VIP High Income. Mr. Fross also serves as Assistant Secretary of other Fidelity funds (2003-present), Vice President and Secretary of FDC (2005-present), and is an employee of FMR. |
R. Stephen Ganis (40) |
| Year of Election or Appointment: 2006 Anti-Money Laundering (AML) officer of VIP High Income. Mr. Ganis also serves as AML officer of other Fidelity funds (2006- present) and FMR Corp. (2003-present). Before joining Fidelity Investments, Mr. Ganis practiced law at Goodwin Procter, LLP (2000-2002). |
Joseph B. Hollis (58) |
| Year of Election or Appointment: 2006 Chief Financial Officer of VIP High Income. Mr. Hollis also serves as Chief Financial Officer of other Fidelity funds. Mr. Hollis is President of Fidelity Pricing and Cash Management Services (FPCMS) (2005-present). Mr. Hollis also serves as President and Director of Fidelity Service Company, Inc. (2006-present). Previously, Mr. Hollis served as Senior Vice President of Cash Management Services (1999-2002) and Investment Management Operations (2002-2005). |
Kenneth A. Rathgeber (59) |
| Year of Election or Appointment: 2004 Chief Compliance Officer of VIP High Income. Mr. Rathgeber also serves as Chief Compliance Officer of other Fidelity funds (2004-present) and Executive Vice President of Risk Oversight for Fidelity Investments (2002-present). He is Chief Compliance Officer of FMR (2005-present), FMR Co., Inc. (2005-present), Fidelity Management & Research (U.K.) Inc. (2005-present), Fidelity Research & Analysis Company (2005-present), Fidelity Investments Money Management, Inc. (2005-present), and Strategic Advisers, Inc. (2005-present). Previously, Mr. Rathgeber served as Executive Vice President and Chief Operating Officer for Fidelity Investments Institutional Services Company, Inc. (1998-2002). |
Bryan A. Mehrmann (45) |
| Year of Election or Appointment: 2005 Deputy Treasurer of VIP High Income. Mr. Mehrmann also serves as Deputy Treasurer of other Fidelity funds (2005-present) and is an employee of FMR. Previously, Mr. Mehrmann served as Vice President of Fidelity Investments Institutional Services Group (FIIS)/Fidelity Investments Institutional Operations Corporation, Inc. (FIIOC) Client Services (1998-2004). |
Kenneth B. Robins (37) |
| Year of Election or Appointment: 2005 Deputy Treasurer of VIP High Income. Mr. Robins also serves as Deputy Treasurer of other Fidelity funds (2005-present) and is an employee of FMR (2004-present). Before joining Fidelity Investments, Mr. Robins worked at KPMG LLP, where he was a partner in KPMG's department of professional practice (2002-2004) and a Senior Manager (1999-2000). In addition, Mr. Robins served as Assistant Chief Accountant, United States Securities and Exchange Commission (2000-2002). |
Robert G. Byrnes (40) |
| Year of Election or Appointment: 2005 Assistant Treasurer of VIP High Income. Mr. Byrnes also serves as Assistant Treasurer of other Fidelity funds (2005-present) and is an employee of FMR (2005-present). Previously, Mr. Byrnes served as Vice President of FPCMS (2003-2005). Before joining Fidelity Investments, Mr. Byrnes worked at Deutsche Asset Management where he served as Vice President of the Investment Operations Group (2000-2003). |
John H. Costello (60) |
| Year of Election or Appointment: 1986 Assistant Treasurer of VIP High Income. Mr. Costello also serves as Assistant Treasurer of other Fidelity funds and is an employee of FMR. |
Peter L. Lydecker (52) |
| Year of Election or Appointment: 2004 Assistant Treasurer of VIP High Income. Mr. Lydecker also serves as Assistant Treasurer of other Fidelity funds (2004) and is an employee of FMR. |
Mark Osterheld (51) |
| Year of Election or Appointment: 2002 Assistant Treasurer of VIP High Income. Mr. Osterheld also serves as Assistant Treasurer of other Fidelity funds (2002) and is an employee of FMR. |
Gary W. Ryan (48) |
| Year of Election or Appointment: 2005 Assistant Treasurer of VIP High Income. Mr. Ryan also serves as Assistant Treasurer of other Fidelity funds (2005-present) and is an employee of FMR (2005-present). Previously, Mr. Ryan served as Vice President of Fund Reporting in FPCMS (1999-2005). |
Salvatore Schiavone (41) |
| Year of Election or Appointment: 2005 Assistant Treasurer of VIP High Income. Mr. Schiavone also serves as Assistant Treasurer of other Fidelity funds (2005-present) and is an employee of FMR (2005-present). Before joining Fidelity Investments, Mr. Schiavone worked at Deutsche Asset Management, where he most recently served as Assistant Treasurer (2003-2005) of the Scudder Funds and Vice President and Head of Fund Reporting (1996-2003). |
VIP High Income Portfolio
Proxy Voting Results
A special meeting of the fund's shareholders was held on November 15, 2006. The results of votes taken among shareholders on the proposal before them are reported below. Each vote reported represents one dollar of net asset value held on the record date for the meeting.
PROPOSAL 1 |
To elect a Board of Trustees. A |
| # of
Votes | % of
Votes |
Dennis J. Dirks |
Affirmative | 17,902,425,874.20 | 95.888 |
Withheld | 767,753,174.62 | 4.112 |
TOTAL | 18,670,179,048.82 | 100.000 |
Albert R. Gamper, Jr. |
Affirmative | 17,903,848,885.90 | 95.895 |
Withheld | 766,330,162.92 | 4.105 |
TOTAL | 18,670,179,048.82 | 100.000 |
Robert M. Gates |
Affirmative | 17,872,803,847.04 | 95.729 |
Withheld | 797,375,201.78 | 4.271 |
TOTAL | 18,670,179,048.82 | 100.000 |
George H. Heilmeier |
Affirmative | 17,870,083,099.32 | 95.715 |
Withheld | 800,095,949.50 | 4.285 |
TOTAL | 18,670,179,048.82 | 100.000 |
Edward C. Johnson 3d |
Affirmative | 17,855,450,949.13 | 95.636 |
Withheld | 814,728,099.69 | 4.364 |
TOTAL | 18,670,179,048.82 | 100.000 |
Stephen P. Jonas |
Affirmative | 17,891,792,907.31 | 95.831 |
Withheld | 778,386,141.51 | 4.169 |
TOTAL | 18,670,179,048.82 | 100.000 |
James H. KeyesB |
Affirmative | 17,882,873,107.76 | 95.783 |
Withheld | 787,305,941.06 | 4.217 |
TOTAL | 18,670,179,048.82 | 100.000 |
Marie L. Knowles |
Affirmative | 17,891,908,567.08 | 95.831 |
Withheld | 778,270,481.74 | 4.169 |
TOTAL | 18,670,179,048.82 | 100.000 |
Ned C. Lautenbach |
Affirmative | 17,899,551,251.03 | 95.872 |
Withheld | 770,627,797.79 | 4.128 |
TOTAL | 18,670,179,048.82 | 100.000 |
| # of
Votes | % of
Votes |
William O. McCoy |
Affirmative | 17,860,461,325.05 | 95.663 |
Withheld | 809,717,723.77 | 4.337 |
TOTAL | 18,670,179,048.82 | 100.000 |
Robert L. Reynolds |
Affirmative | 17,894,978,918.13 | 95.848 |
Withheld | 775,200,130.69 | 4.152 |
TOTAL | 18,670,179,048.82 | 100.000 |
Cornelia M. Small |
Affirmative | 17,897,519,970.69 | 95.862 |
Withheld | 772,659,078.13 | 4.138 |
TOTAL | 18,670,179,048.82 | 100.000 |
William S. Stavropoulos |
Affirmative | 17,871,058,112.55 | 95.720 |
Withheld | 799,120,936.27 | 4.280 |
TOTAL | 18,670,179,048.82 | 100.000 |
Kenneth L. Wolfe |
Affirmative | 17,886,340,376.33 | 95.802 |
Withheld | 783,838,672.49 | 4.198 |
TOTAL | 18,670,179,048.82 | 100.000 |
A Denotes trust-wide proposal and voting results. B Effective on or about January 1, 2007. |
Annual Report
VIP High Income Portfolio
Annual Report
Investment Adviser
Fidelity Management & Research Company
Boston, MA
Investment Sub-Advisers
FMR Co., Inc.
Fidelity Research & Analysis Company (formerly Fidelity
Management & Research (Far East) Inc.)
Fidelity Investments Japan Limited
Fidelity International Investment Advisors
Fidelity International Investment Advisors (U.K.) Limited
General Distributor
Fidelity Distributors Corporation
Boston, MA
Transfer and Service Agents
Fidelity Investments Institutional Operations Company, Inc.
Boston, MA
Fidelity Service Company, Inc.
Boston, MA
Custodian
The Bank of New York
New York, NY
VIPHIR-ANN-0207
1.811842.102
Fidelity® Variable Insurance Products:
Money Market Portfolio
Annual Report
December 31, 2006
(2_fidelity_logos) (Registered_Trademark)
Contents
Performance | <Click Here> | How the fund has done over time. |
Shareholder Expense Example | <Click Here> | An example of shareholder expenses. |
Investment Changes | <Click Here> | A summary of major shifts in the fund's investments over the past six months and one year. |
Investments | <Click Here> | A complete list of the fund's investments. |
Financial Statements | <Click Here> | Statements of assets and liabilities, operations, and
changes in net assets, as well as financial highlights. |
Notes | <Click Here> | Notes to the financial statements. |
Report of Independent Registered Public Accounting Firm | <Click Here> | |
Trustees and Officers | <Click Here> | |
Proxy Voting Results | <Click Here> | |
To view a fund's proxy voting guidelines and proxy voting record for the 12-month period ended June 30, visit www.fidelity.com/proxyvotingresults or visit the Securities and Exchange Commission's (SEC) web site at www.sec.gov. You may also call 1-877-208-0098 to request a free copy of the proxy voting guidelines.
Fidelity Variable Insurance Products are separate account options which are purchased through a variable insurance contract.
Standard & Poor's, S&P and S&P 500 are registered service marks of The McGraw-Hill Companies, Inc. and have been licensed for use by Fidelity Distributors Corporation.
Other third party marks appearing herein are the property of their respective owners.
All other marks appearing herein are registered or unregistered trademarks or service marks of FMR Corp. or an affiliated company.
This report and the financial statements contained herein are submitted for the general information of the shareholders of the fund. This report is not authorized for distribution to prospective investors in the fund unless preceded or accompanied by an effective prospectus.
A fund files its complete schedule of portfolio holdings with the SEC for the first and third quarters of each fiscal year on Form N-Q. Forms N-Q are available on the SEC's web site at http://www.sec.gov. A fund's Forms N-Q may be reviewed and copied at the SEC's Public Reference Room in Washington, DC. Information regarding the operation of the SEC's Public Reference Room may be obtained by calling 1-800-SEC-0330. For a complete list of a fund's portfolio holdings, view the most recent quarterly holdings report, semiannual report, or annual report on Fidelity's web site at http://www.advisor.fidelity.com.
NOT FDIC INSURED · MAY LOSE VALUE · NO BANK GUARANTEE
Neither the fund nor Fidelity Distributors Corporation is a bank.
VIP Money Market Portfolio
VIP Money Market Portfolio
Performance: The Bottom Line
Average annual total return reflects the change in the value of an investment, assuming reinvestment of the class' dividend income and capital gains (the profits earned upon the sale of securities that have grown in value) and assuming a constant rate of performance each year. During periods of reimbursement by Fidelity, a fund's total return will be greater than it would be had the reimbursement not occurred. Performance numbers are net of all underlying fund operating expenses, but do not include any insurance charges imposed by your insurance company's separate account. If performance information included the effect of these additional charges, the total returns would have been lower. How a fund did yesterday is no guarantee of how it will do tomorrow.
Average Annual Total Returns
Periods ended December 31, 2006 | Past 1
year | Past 5
years | Past 10
years |
VIP Money Market - Initial Class | 4.87% | 2.35% | 3.83% |
VIP Money Market - Service Class A | 4.76% | 2.25% | 3.76% |
VIP Money Market - Service Class 2 B | 4.61% | 2.10% | 3.65% |
VIP Money Market - Investor Class C | 4.81% | 2.33% | 3.82% |
A The initial offering of Service Class shares took place on July 7, 2000. Performance for Service Class shares reflects an asset-based service fee (12b-1 fee), and returns prior to July 7, 2000 are those of Initial Class and do not include the effects of Service Class' 12b-1 fee. Had Service Class' 12b-1 fee been reflected, returns prior to July 7, 2000 would have been lower.
B The initial offering of Service Class 2 shares took place on January 12, 2000. Performance for Service Class 2 shares reflects an asset-based service fee (12b-1 fee), and returns prior to January 12, 2000 are those of Initial Class and do not include the effects of Service Class 2's 12b-1 fee. Had Service Class 2's 12b-1 fee been reflected, returns prior to January 12, 2000 would have been lower.
C The initial offering of Investor Class shares took place on July 21, 2005. Returns prior to July 21, 2005 are those of Initial Class. If Investor Class's transfer agent fee had been reflected, returns prior to July 21, 2005 would have been lower.
Annual Report
VIP Money Market Portfolio
Shareholder Expense Example
As a shareholder of the Fund, you incur two types of costs: (1) transaction costs, and (2) ongoing costs, including management fees, distribution and/or service (12b-1) fees and other Fund expenses. This Example is intended to help you understand your ongoing costs (in dollars) of investing in the Fund and to compare these costs with the ongoing costs of investing in other mutual funds.
The Example is based on an investment of $1,000 invested at the beginning of the period and held for the entire period (July 1, 2006 to December 31, 2006).
Actual Expenses
The first line of the accompanying table for each class of the Fund provides information about actual account values and actual expenses. You may use the information in this line, together with the amount you invested, to estimate the expenses that you paid over the period. Simply divide your account value by $1,000.00 (for example, an $8,600 account value divided by $1,000.00 = 8.6), then multiply the result by the number in the first line for a class of the Fund under the heading entitled "Expenses Paid During Period" to estimate the expenses you paid on your account during this period. The estimate of expenses does not include any fees or other expenses of any variable annuity or variable life insurance product. If they were, the estimate of expenses you paid during the period would be higher, and your ending account value would be lower.
Hypothetical Example for Comparison Purposes
The second line of the accompanying table for each class of the Fund provides information about hypothetical account values and hypothetical expenses based on a Class' actual expense ratio and an assumed rate of return of 5% per year before expenses, which is not the Class' actual return. The hypothetical account values and expenses may not be used to estimate the actual ending account balance or expenses you paid for the period. You may use this information to compare the ongoing costs of investing in the Fund and other funds. To do so, compare this 5% hypothetical example with the 5% hypothetical examples that appear in the shareholder reports of the other funds. The estimate of expenses does not include any fees or other expenses of any variable annuity or variable life insurance product. If they were, the estimate of expenses you paid during the period would be higher, and your ending account value would be lower.
Please note that the expenses shown in the table are meant to highlight your ongoing costs only and do not reflect any transaction costs. Therefore, the second line of the table is useful in comparing ongoing costs only, and will not help you determine the relative total costs of owning different funds.
| Beginning
Account Value
July 1, 2006 | Ending
Account Value
December 31, 2006 | Expenses Paid
During Period *
July 1, 2006
to December 31, 2006 |
Initial Class | | | |
Actual | $ 1,000.00 | $ 1,025.50 | $ 1.68 |
HypotheticalA | $ 1,000.00 | $ 1,023.54 | $ 1.68 |
Service Class | | | |
Actual | $ 1,000.00 | $ 1,025.00 | $ 2.25 |
HypotheticalA | $ 1,000.00 | $ 1,022.99 | $ 2.24 |
Service Class 2 | | | |
Actual | $ 1,000.00 | $ 1,024.30 | $ 2.96 |
HypotheticalA | $ 1,000.00 | $ 1,022.28 | $ 2.96 |
Investor Class | | | |
Actual | $ 1,000.00 | $ 1,025.30 | $ 1.99 |
HypotheticalA | $ 1,000.00 | $ 1,023.24 | $ 1.99 |
A 5% return per year before expenses
* Expenses are equal to each Class' annualized expense ratio (shown in the table below); multiplied by the average account value over the period, multiplied by 184/365 (to reflect the one-half year period).
| Annualized
Expense Ratio |
Initial Class | .33% |
Service Class | .44% |
Service Class 2 | .58% |
Investor Class | .39% |
VIP Money Market Portfolio
VIP Money Market Portfolio
Investment Changes
Maturity Diversification |
Days | % of fund's investments 12/31/06 | % of fund's investments 6/30/06 | % of fund's
investments
12/31/05 |
0 - 30 | 52.1 | 56.8 | 66.2 |
31 - 90 | 33.8 | 29.2 | 30.2 |
91 - 180 | 8.0 | 8.8 | 3.1 |
181 - 397 | 6.1 | 5.2 | 0.5 |
Weighted Average Maturity |
| 12/31/06 | 6/30/06 | 12/31/05 |
VIP Money Market Portfolio | 56 Days | 48 Days | 31 Days |
All Taxable Money Market Funds Average* | 41 Days | 38 Days | 36 Days |
Asset Allocation (% of fund's net assets) |
As of December 31, 2006 | As of June 30, 2006 |
| Corporate Bonds 1.0% | | | Corporate Bonds 1.4% | |
 | Commercial Paper 21.9% | | | Commercial Paper 23.7% | |
 | Bank CDs, BAs, TDs,
and Notes 62.0% | | | Bank CDs, BAs, TDs,
and Notes 53.4% | |
 | Government Securities 0.5% | | | Government Securities 0.3% | |
| Repurchase
Agreements 14.8% | | | Repurchase
Agreements 22.6% | |
 | Other Investments 0.7% | | | Other Investments 0.1% | |
 | Net Other Assets ** (0.9)% | | | Net Other Assets ** (1.5)% | |

** Net Other Assets are not included in the pie chart.
* Source: iMoneyNet, Inc.
Annual Report
VIP Money Market Portfolio
Investments December 31, 2006
Showing Percentage of Net Assets
Corporate Bonds - 1.0% |
| Due Date | Yield (a) | Principal Amount | Value (Note 1) |
Bell Trace Obligated Group |
| 1/29/07 | 5.41% (c) | $ 14,405,000 | $ 14,405,000 |
Virginia Electric & Power Co. |
| 2/1/07 | 5.53 | 10,065,000 | 10,062,544 |
TOTAL CORPORATE BONDS | 24,467,544 |
Certificates of Deposit - 20.9% |
|
London Branch, Eurodollar, Foreign Banks - 7.1% |
Calyon |
| 1/24/07 to 2/12/07 | 5.00 to 5.22 | 15,000,000 | 15,000,000 |
Credit Agricole SA |
| 2/12/07 to 4/18/07 | 5.32 to 5.36 | 45,000,000 | 45,000,000 |
Credit Industriel et Commercial |
| 1/29/07 to 5/8/07 | 5.22 to 5.40 | 47,000,000 | 47,000,000 |
Deutsche Bank AG |
| 1/30/07 | 4.86 | 15,000,000 | 15,000,000 |
Dresdner Bank AG |
| 3/5/07 | 5.40 | 6,000,000 | 6,000,000 |
HBOS Treasury Services PLC |
| 5/23/07 | 5.36 | 5,000,000 | 5,000,000 |
Landesbank Hessen-Thuringen |
| 4/17/07 | 5.36 | 5,000,000 | 5,000,000 |
Societe Generale |
| 4/17/07 to 1/3/08 | 5.30 to 5.35 | 29,000,000 | 29,000,000 |
| | | 167,000,000 |
New York Branch, Yankee Dollar, Foreign Banks - 13.8% |
BNP Paribas SA |
| 4/17/07 to 10/2/07 | 5.30 to 5.45 | 30,000,000 | 30,000,000 |
Canadian Imperial Bank of Commerce |
| 1/16/07 | 5.43 (c) | 20,000,000 | 20,000,000 |
Credit Suisse First Boston |
| 1/22/07 | 5.35 (c) | 20,000,000 | 20,000,000 |
Credit Suisse Group |
| 6/4/07 | 5.40 to 5.43 | 22,000,000 | 22,000,000 |
DEPFA BANK PLC |
| 1/25/07 | 5.33 | 5,000,000 | 5,000,000 |
Deutsche Bank AG |
| 2/5/07 to 1/11/08 | 4.90 to 5.42 | 55,000,000 | 55,000,000 |
HBOS Treasury Services PLC |
| 4/17/07 to 5/23/07 | 5.35 to 5.36 | 10,000,000 | 10,000,000 |
Landesbank Baden-Wuert |
| 4/13/07 | 5.35 | 9,000,000 | 9,000,124 |
|
| Due Date | Yield (a) | Principal Amount | Value (Note 1) |
Mizuho Corporate Bank Ltd. |
| 1/25/07 to 2/14/07 | 5.34 to 5.56% | $ 42,000,000 | $ 42,000,000 |
Natexis Banques Populaires NY CD |
| 12/12/07 to 12/18/07 | 5.40 | 28,000,000 | 28,000,000 |
Norinchukin Bank |
| 2/20/07 to 3/1/07 | 5.35 | 80,000,000 | 80,000,000 |
Sumitomo Mitsui Banking Corp. |
| 1/26/07 to 4/18/07 | 5.32 to 5.38 | 5,000,000 | 5,000,000 |
| | | 326,000,124 |
| TOTAL CERTIFICATES OF DEPOSIT | 493,000,124 |
Commercial Paper - 21.9% |
|
Aegis Finance LLC |
| 2/8/07 | 5.34 | 2,000,000 | 1,988,885 |
American Wtr. Cap. Corp. |
| 2/6/07 to 3/5/07 | 5.43 to 5.46 (b) | 6,008,000 | 5,968,417 |
Amsterdam Funding Corp. |
| 1/25/07 to 2/5/07 | 5.33 | 10,000,000 | 9,952,191 |
Apache Corp. |
| 1/16/07 | 5.39 to 5.40 (b) | 6,000,000 | 5,986,592 |
Aquifer Funding LLC |
| 1/4/07 | 5.34 | 19,000,000 | 18,991,577 |
AT&T, Inc. |
| 1/25/07 to 2/6/07 | 5.34 to 5.35 | 7,000,000 | 6,966,507 |
Bavaria TRR Corp. |
| 1/11/07 to 1/25/07 | 5.37 to 5.40 | 10,000,000 | 9,972,536 |
BellSouth Corp. |
| 3/1/07 | 5.35 | 1,000,000 | 991,314 |
Beta Finance, Inc. |
| 4/23/07 | 5.37 (b) | 20,500,000 | 20,166,442 |
Bradford & Bingley PLC |
| 2/5/07 | 5.34 | 2,000,000 | 1,989,763 |
Caisse Nat des Caisses d' Epargne |
| 2/7/07 | 5.34 (b) | 5,000,000 | 4,973,098 |
Capital One Multi-Asset Execution Trust |
| 3/14/07 | 5.35 | 1,000,000 | 989,440 |
Charta LLC |
| 2/16/07 | 5.39 | 2,000,000 | 1,986,353 |
Citigroup Funding, Inc. |
| 1/19/07 to 3/26/07 | 5.34 to 5.35 | 10,000,000 | 9,925,125 |
ConocoPhillips Qatar Funding Ltd. |
| 4/13/07 | 5.43 (b) | 1,000,000 | 985,012 |
Commercial Paper - continued |
| Due Date | Yield (a) | Principal Amount | Value (Note 1) |
Countrywide Financial Corp. |
| 3/15/07 | 5.37% | $ 2,000,000 | $ 1,978,506 |
Cullinan Finance Corp. |
| 1/23/07 | 5.56 (b) | 5,000,000 | 4,983,469 |
CVS Corp. |
| 1/8/07 to 1/18/07 | 5.40 | 4,000,000 | 3,992,269 |
DaimlerChrysler NA Holding Corp. |
| 1/2/07 to 3/20/07 | 5.42 to 5.46 | 16,000,000 | 15,905,491 |
Davis Square Funding V Corp. |
| 2/22/07 to 3/16/07 | 5.34 to 5.36 | 10,000,000 | 9,902,670 |
DEPFA BANK PLC |
| 3/20/07 | 5.35 | 5,000,000 | 4,943,342 |
Devon Energy Corp. |
| 1/26/07 to 2/26/07 | 5.37 to 5.40 | 5,500,000 | 5,466,134 |
Dominion Resources, Inc. |
| 1/12/07 to 1/26/07 | 5.37 to 5.39 | 8,000,000 | 7,978,656 |
DZ Bank AG |
| 2/2/07 | 5.33 | 20,000,000 | 19,906,489 |
Emerald (MBNA Credit Card Master Note Trust) |
| 1/26/07 to 3/13/07 | 5.32 to 5.35 | 10,000,000 | 9,915,942 |
FCAR Owner Trust |
| 1/16/07 to 3/15/07 | 5.32 to 5.57 | 28,000,000 | 27,853,314 |
Fortune Brands, Inc. |
| 1/16/07 to 2/23/07 | 5.36 to 5.41 | 8,000,000 | 7,957,628 |
France Telecom SA |
| 1/16/07 to 3/14/07 | 5.39 to 5.40 (b) | 4,500,000 | 4,468,468 |
Giro Funding US Corp. |
| 1/30/07 to 1/31/07 | 5.34 | 16,000,000 | 15,931,981 |
Grampian Funding LLC |
| 1/26/07 to 4/10/07 | 5.32 to 5.35 | 40,000,000 | 39,613,952 |
Grenadier Funding Corp. |
| 2/13/07 | 5.34 | 1,000,000 | 993,705 |
Harrier Finance Funding LLC |
| 6/27/07 | 5.35 (b) | 10,000,000 | 9,744,530 |
HSBC Finance Corp. |
| 3/23/07 | 5.35 | 5,000,000 | 4,940,600 |
Hypo Real Estate Bank International AG |
| 3/12/07 | 5.38 | 2,000,000 | 1,979,350 |
John Deere Capital Corp. |
| 1/22/07 to 3/16/07 | 5.37 to 5.42 | 6,000,000 | 5,955,516 |
Kellogg Co. |
| 3/9/07 to 3/22/07 | 5.38 to 5.40 | 4,000,000 | 3,957,303 |
Kestrel Funding (US) LLC |
| 1/17/07 to 2/2/07 | 5.33 to 5.34 (b) | 16,000,000 | 15,927,596 |
Monument Gardens Funding |
| 3/19/07 | 5.35 | 10,000,000 | 9,887,067 |
Motown Notes Program |
| 1/31/07 to 3/23/07 | 5.35 to 5.38 | 8,307,000 | 8,230,144 |
Nelnet Student Funding Ext CP LLC |
| 2/5/07 | 5.33 | 5,000,000 | 4,974,333 |
|
| Due Date | Yield (a) | Principal Amount | Value (Note 1) |
Nissan Motor Acceptance Corp. |
| 1/16/07 to 2/16/07 | 5.38 to 5.40% | $ 5,000,000 | $ 4,981,499 |
Pacific Gas & Electric Co. |
| 1/18/07 | 5.39 (b) | 2,000,000 | 1,994,938 |
Paradigm Funding LLC |
| 1/22/07 to 3/26/07 | 5.33 to 5.39 | 22,000,000 | 21,876,667 |
Park Granada LLC |
| 3/20/07 | 5.37 | 5,000,000 | 4,942,583 |
Park Sienna LLC |
| 1/11/07 to 3/29/07 | 5.33 to 5.36 | 20,000,000 | 19,815,571 |
Rockies Express Pipeline LLC |
| 2/7/07 to 3/20/07 | 5.43 to 5.47 (b) | 3,000,000 | 2,971,078 |
SABMiller PLC |
| 2/5/07 to 2/20/07 | 5.38 to 5.40 | 4,000,000 | 3,976,409 |
Societe Generale NA |
| 1/8/07 | 5.33 | 3,305,000 | 3,301,626 |
Strand Capital LLC |
| 1/23/07 to 2/20/07 | 5.34 to 5.38 | 6,000,000 | 5,971,511 |
Stratford Receivables Co. LLC |
| 1/8/07 to 2/14/07 | 5.33 to 5.40 | 37,000,000 | 36,887,182 |
Textron Financial Corp. |
| 1/16/07 to 2/9/07 | 5.35 to 5.39 | 10,000,000 | 9,966,087 |
Thames Asset Global Securities No. 1, Inc. |
| 1/22/07 | 5.38 | 1,000,000 | 996,879 |
The Walt Disney Co. |
| 1/25/07 to 2/7/07 | 5.34 to 5.37 | 4,000,000 | 3,982,415 |
Time Warner, Inc. |
| 1/16/07 | 5.49 (b) | 8,500,000 | 8,480,900 |
UniCredito Italiano Bank (Ireland) PLC |
| 3/13/07 to 4/16/07 | 5.35 to 5.36 | 16,000,000 | 15,786,443 |
Verizon Communications, Inc. |
| 2/8/07 to 2/16/07 | 5.37 to 5.38 (b) | 13,000,000 | 12,917,169 |
Weatherford International Ltd. |
| 1/8/07 to 1/12/07 | 5.39 to 5.40 (b) | 3,799,000 | 3,793,954 |
WellPoint, Inc. |
| 2/12/07 to 3/16/07 | 5.38 to 5.40 | 2,000,000 | 1,982,826 |
Xcel Energy, Inc. |
| 4/13/07 | 5.56 | 2,000,000 | 1,969,343 |
TOTAL COMMERCIAL PAPER | 515,816,787 |
Federal Agencies - 0.5% |
|
Federal Home Loan Bank - 0.5% |
| 8/15/07 to 8/21/07 | 5.48 | 12,000,000 | 11,999,408 |
TOTAL FEDERAL AGENCIES | 11,999,408 |
Master Notes - 3.0% |
| Due Date | Yield (a) | Principal Amount | Value (Note 1) |
Asset Funding Co. III LLC |
| 1/5/07 | 5.41 to 5.42% (c)(e) | $ 26,000,000 | $ 26,000,000 |
Goldman Sachs Group, Inc. |
| 1/9/07 to 2/26/07 | 5.40 to 5.42 (c)(e) | 42,000,000 | 42,000,000 |
Lehman Brothers Holdings, Inc. |
| 4/30/07 | 5.46 (c)(e) | 3,000,000 | 3,000,000 |
TOTAL MASTER NOTES | 71,000,000 |
Medium-Term Notes - 33.5% |
|
AIG Matched Funding Corp. |
| 2/15/07 | 5.36 to 5.37 (c) | 23,000,000 | 23,000,000 |
| 2/15/07 to 11/15/07 | 5.34
to 5.37 (b) | 28,000,000 | 28,000,000 |
Allstate Life Global Funding II |
| 1/29/07 | 5.36 (b)(c) | 1,000,000 | 1,000,000 |
American Express Credit Corp. |
| 1/5/07 | 5.45 (c) | 10,000,000 | 10,000,516 |
Australia & New Zealand Banking Group Ltd. |
| 1/23/07 | 5.35 (b)(c) | 5,000,000 | 5,000,000 |
Banco Santander Totta SA |
| 1/16/07 | 5.35 (b)(c) | 15,000,000 | 15,000,000 |
Bank of New York Co., Inc. |
| 1/29/07 | 5.41 (b)(c) | 15,000,000 | 15,000,000 |
Banque Federative du Credit Mutuel (BFCM) |
| 1/16/07 | 5.35 (b)(c) | 12,000,000 | 12,000,000 |
Bayerische Landesbank Girozentrale |
| 1/17/07 to 2/20/07 | 5.38 to 5.42 (c) | 25,000,000 | 25,000,000 |
BellSouth Corp. |
| 4/26/07 | 5.34 (b) | 15,000,000 | 14,945,528 |
BMW U.S. Capital LLC |
| 1/16/07 | 5.35 (c) | 2,000,000 | 2,000,000 |
| 1/5/07 | 5.33 (b)(c) | 2,000,000 | 2,000,000 |
BNP Paribas SA |
| 1/2/07 | 5.30 (c) | 10,000,000 | 9,998,235 |
Caja Madrid SA |
| 1/19/07 | 5.37 (c) | 7,000,000 | 7,000,000 |
Calyon New York Branch |
| 1/2/07 | 5.29 (c) | 8,000,000 | 7,998,432 |
CIT Group, Inc. |
| 2/20/07 | 5.60 (c) | 15,000,000 | 15,013,920 |
Commonwealth Bank of Australia |
| 1/24/07 | 5.35 (c) | 21,430,000 | 21,432,711 |
ConocoPhillips |
| 1/11/07 | 5.37 (c) | 3,000,000 | 3,000,000 |
Countrywide Bank, Alexandria Virginia |
| 1/3/07 to 1/16/07 | 5.36 (c) | 25,000,000 | 24,999,673 |
Countrywide Financial Corp. |
| 1/11/07 | 5.53 (c) | 500,000 | 500,169 |
|
| Due Date | Yield (a) | Principal Amount | Value (Note 1) |
Credit Agricole SA |
| 1/23/07 | 5.34% (c) | $ 16,000,000 | $ 16,000,000 |
Cullinan Finance Corp. |
| 2/26/07 to 6/25/07 | 5.33 to
5.38 (b)(c) | 23,000,000 | 22,997,367 |
Cullinan Finance Ltd./Corp. Mtn 144A |
| 10/15/07 | 5.33 (b) | 6,000,000 | 6,000,000 |
DnB Nor ASA |
| 1/25/07 | 5.34 (b)(c) | 27,000,000 | 26,999,944 |
Harrier Finance Funding LLC |
| 3/20/07 | 5.35 (b)(c) | 1,000,000 | 1,000,002 |
HBOS Treasury Services PLC |
| 1/9/07 | 5.32 (b)(c) | 10,600,000 | 10,599,264 |
| 3/26/07 | 5.44 (c) | 20,000,000 | 20,000,000 |
HSBC Finance Corp. |
| 1/8/07 to 1/24/07 | 5.34 to 5.38 (c) | 26,000,000 | 26,000,000 |
HSBC USA, Inc. |
| 1/16/07 | 5.35 (c) | 5,000,000 | 5,000,000 |
HSH Nordbank |
| 1/22/07 | 5.36 (b)(c) | 12,000,000 | 12,000,000 |
HSH Nordbank AG |
| 1/23/07 | 5.38 (b)(c) | 6,000,000 | 6,000,000 |
Huntington National Bank, Columbus |
| 2/1/07 | 5.45 (c) | 2,000,000 | 2,000,206 |
ING USA Annuity & Life Insurance Co. |
| 3/23/07 | 5.46 (c)(e) | 3,000,000 | 3,000,000 |
Intesa Bank Ireland PLC |
| 1/25/07 | 5.35 (b)(c) | 20,000,000 | 20,000,000 |
K2 (USA) LLC |
| 3/12/07 | 5.31 (b)(c) | 6,000,000 | 5,999,591 |
Kestrel Funding PLC US LLC 144A |
| 1/26/07 | 5.34 (b)(c) | 1,000,000 | 1,000,000 |
Key Bank NA |
| 3/19/07 | 5.38 (c) | 1,000,000 | 1,000,081 |
Merrill Lynch & Co., Inc. |
| 1/4/07 to 1/16/07 | 5.36 to 5.60 (c) | 28,000,000 | 28,023,047 |
Metropolitan Life Insurance Co. |
| 1/8/07 | 5.36 (b)(c) | 3,884,000 | 3,884,000 |
Morgan Stanley |
| 1/2/07 to 1/29/07 | 5.37 to 5.44 (c) | 48,000,000 | 48,000,181 |
Natexis Banques Populaires NY CD |
| 1/2/07 | 5.31 (c) | 21,000,000 | 20,997,955 |
National Rural Utils. Coop. Finance Corp. |
| 1/4/07 | 5.33 (c) | 1,000,000 | 1,000,000 |
Nordea Bank AB |
| 1/2/07 | 5.29 (c) | 13,000,000 | 12,997,466 |
Pacific Life Global Funding |
| 1/4/07 | 5.40 (b)(c) | 3,000,000 | 3,001,129 |
RACERS |
| 1/22/07 | 5.37 (b)(c) | 15,000,000 | 15,000,000 |
Medium-Term Notes - continued |
| Due Date | Yield (a) | Principal Amount | Value (Note 1) |
Royal Bank of Scotland PLC |
| 1/22/07 | 5.34% (b)(c) | $ 10,000,000 | $ 10,000,000 |
Security Life of Denver Insurance Co. |
| 2/28/07 | 5.45 (c)(e) | 2,000,000 | 2,000,000 |
Sigma Finance, Inc. |
| 1/16/07 to 3/12/07 | 5.31 to
5.35 (b)(c) | 17,000,000 | 16,999,186 |
Skandinaviska Enskilda Banken |
| 1/8/07 | 5.30 (c) | 14,000,000 | 13,997,665 |
Skandinaviska Enskilda Banken AB |
| 3/8/07 | 5.34 (c) | 14,000,000 | 14,000,000 |
Societe Generale |
| 1/2/07 | 5.34 (b)(c) | 9,000,000 | 9,000,479 |
| 1/31/07 | 5.30 (c) | 20,000,000 | 19,997,181 |
UniCredito Italiano Bank (Ireland) PLC |
| 1/16/07 | 5.36 (b)(c) | 30,500,000 | 30,499,971 |
| 1/30/07 | 5.32 (c) | 10,000,000 | 9,998,765 |
Unicredito Italiano Spa, New York |
| 2/20/07 to 3/13/07 | 5.35 to 5.37 (c) | 34,000,000 | 33,998,579 |
Verizon Communications, Inc. |
| 1/8/07 | 5.50 (c) | 1,000,000 | 999,980 |
Vodafone Group PLC |
| 3/29/07 | 5.42 (c) | 2,500,000 | 2,499,809 |
Washington Mutual Bank |
| 2/16/07 to 2/28/07 | 5.35 to 5.42 (c) | 30,500,000 | 30,501,768 |
Washington Mutual Bank FA |
| 1/24/07 | 5.33 (c) | 1,500,000 | 1,499,930 |
| 1/31/07 | 5.36 (b)(c) | 20,000,000 | 20,000,000 |
WestLB AG |
| 1/10/07 to 3/30/07 | 5.39 (b)(c) | 13,000,000 | 13,000,000 |
TOTAL MEDIUM-TERM NOTES | 790,382,730 |
Short-Term Notes - 3.3% |
|
Jackson National Life Insurance Co. |
| 1/1/07 | 5.42 (c)(e) | 7,000,000 | 7,000,000 |
Metropolitan Life Insurance Co. |
| 1/2/07 to 2/1/07 | 5.49 to 5.51 (c)(e) | 15,000,000 | 15,000,000 |
| 1/29/07 | 5.45 (b)(c) | 5,000,000 | 5,000,000 |
Monumental Life Insurance Co. |
| 1/2/07 | 5.49 to 5.52 (c)(e) | 10,000,000 | 10,000,000 |
New York Life Insurance Co. |
| 3/30/07 | 5.44 (c)(e) | 30,000,000 | 30,000,000 |
Transamerica Occidental Life Insurance Co. |
| 2/1/07 | 5.54 (c)(e) | 10,000,000 | 10,000,000 |
TOTAL SHORT-TERM NOTES | 77,000,000 |
Asset-Backed Securities - 0.7% |
| Due Date | Yield (a) | Principal Amount | Value (Note 1) |
Master Funding Trust I |
| 1/25/07 - 4/25/07 | 5.38% (c) | $ 14,768,000 | $ 14,767,954 |
Wind Trust |
| 2/25/07 | 5.32 (b)(c) | 1,000,000 | 1,000,000 |
TOTAL ASSET-BACKED SECURITIES | 15,767,954 |
Municipal Securities - 1.3% |
|
Catholic Health Initiatives 5.35 to 5.36%
1/11/07 to 2/13/07 | 11,100,000 | | 11,100,000 |
Michigan Gen. Oblig. Bonds 5.41% Tender 10/4/07 | 4,100,000 | | 4,100,000 |
Texas Gen. Oblig. Series E, 5.37%
1/5/07, VRDN (c) | 13,560,000 | | 13,560,000 |
TOTAL MUNICIPAL SECURITIES | 28,760,000 |
Repurchase Agreements - 14.8% |
| Maturity Amount | | |
In a joint trading account at 5.33% dated 12/29/06 due 1/2/07 (Collateralized by U.S. Government Obligations) # | $ 446,264 | | 446,000 |
With: | | | |
Banc of America Securities LLC at 5.36%, dated 12/29/06 due 1/2/07 (Collateralized by Commercial Paper Obligations valued at $46,920,000, 0%, 1/5/07 - 4/26/07) | 46,027,396 | | 46,000,000 |
Barclays Capital, Inc. at 5.42%, dated 12/29/06 due 1/2/07 (Collateralized by Equity Securities valued at $111,301,098) | 106,063,836 | | 106,000,000 |
Citigroup Global Markets, Inc. at 5.37%, dated 12/29/06 due 1/2/07 (Collateralized by Corporate Obligations valued at $73,440,001, 0% - 20%, 8/15/07 - 12/25/39) | 72,042,980 | | 72,000,000 |
Deutsche Bank Securities, Inc. at: | | | |
5.34%, dated 11/28/06 due 1/29/07 (Collateralized by Corporate Obligations valued at $10,500,000, 0.25%, 4/11/13) | 10,091,967 | | 10,000,000 |
5.35%, dated: | | | |
12/1/06 due 1/12/07 (Collateralized by Mortgage Loan Obligations valued at $10,500,000, 5.42%, 12/15/20) | 10,062,417 | | 10,000,000 |
12/11/06 due 1/11/07 (Collateralized by Corporate Obligations valued at $15,300,001, 10.25%, 9/15/10) | 15,069,104 | | 15,000,000 |
Repurchase Agreements - continued |
| Maturity Amount | | Value (Note 1) |
With: - continued | | | |
Deutsche Bank Securities, Inc. at: | | | |
5.38%, dated 10/19/06 due 1/19/07 (Collateralized by Corporate Obligations valued at $10,200,000, 8%, 11/15/14) | $ 10,137,489 | | $ 10,000,000 |
Goldman Sachs & Co. at 5.41%, dated 11/21/06 due 2/21/07 (Collateralized by Corporate Obligations valued at $32,550,001, 7.38%, 10/28/09 - 2/1/11) (c)(d) | 31,428,592 | | 31,000,000 |
J.P. Morgan Securities, Inc. at 5.41%, dated 12/29/11 due 3/18/13 (Collateralized by Corporate Obligations valued at $20,068,284, 7.11% - 8.38%, 3/18/13) (c)(d) | 19,142,764 | | 19,000,000 |
Merrill Lynch, Pierce, Fenner & Smith at 5.42%, dated 10/17/06 due 1/17/07 (Collateralized by Corporate Obligations valued at $15,783,415, 0% - 9.63%, 7/15/07 - 11/7/46) (c)(d) | 15,205,753 | | 15,000,000 |
Morgan Stanley & Co. at 5.36%, dated 12/13/06 due 2/1/07 (Collateralized by Mortgage Loan Obligations valued at $15,994,587, 0.54% - 5.77%, 7/14/07 - 5/1/40) | 15,111,667 | | 15,000,000 |
TOTAL REPURCHASE AGREEMENTS | 349,446,000 |
TOTAL INVESTMENT PORTFOLIO - 100.9%
(Cost $2,377,640,547) | 2,377,640,547 |
NET OTHER ASSETS - (0.9)% | (21,037,308) |
NET ASSETS - 100% | $ 2,356,603,239 |
Security Type Abbreviation |
VRDN - VARIABLE RATE DEMAND NOTE |
Legend |
(a) Yield represents either the annualized yield at the date of purchase, or the stated coupon rate, or, for floating rate securities, the rate at period end. |
(b) Security exempt from registration under Rule 144A of the Securities Act of 1933. These securities may be resold in transactions exempt from registration, normally to qualified institutional buyers. At the end of the period, the value of these securities amounted to $436,288,124 or 18.5% of net assets. |
(c) Coupon rates for floating and adjustable rate securities reflect the rates in effect at period end. Due dates for these security types are the next interest rate reset date or, when applicable, the final maturity date. |
(d) The maturity amount is based on the rate at period end. |
(e) Restricted securities - Investment in securities not registered under the Securities Act of 1933 (excluding 144A issues). At the end of the period, the value of restricted securities (excluding 144A issues) amounted to $148,000,000 or 6.3% of net assets. |
Additional information on each holding is as follows: |
Security | Acquisition Date | Cost |
Asset Funding Co. III LLC:
5.41%, 1/5/07 | 11/7/06 | $ 13,000,000 |
5.42%, 1/5/07 | 8/29/06 | $ 13,000,000 |
Goldman Sachs Group, Inc.:
5.4%, 1/9/07 | 1/9/06 | $ 6,000,000 |
5.42%, 2/26/07 | 8/26/04 | $ 36,000,000 |
ING USA Annuity & Life Insurance Co. 5.46%, 3/23/07 | 6/23/05 | $ 3,000,000 |
Jackson National Life Insurance Co. 5.42%, 1/1/07 | 3/31/03 | $ 7,000,000 |
Lehman Brothers Holdings, Inc. 5.46%, 4/30/07 | 12/11/06 | $ 3,000,000 |
Metropolitan Life Insurance Co.: 5.49%, 1/2/07 | 3/26/02 | $ 10,000,000 |
5.51%, 2/1/07 | 2/24/03 | $ 5,000,000 |
Monumental Life Insurance Co.: 5.49%, 1/2/07 | 9/17/98 | $ 5,000,000 |
5.52%, 1/2/07 | 3/12/99 | $ 5,000,000 |
New York Life Insurance Co.
5.44%, 3/30/07 | 2/28/02 - 12/19/02 | $ 30,000,000 |
Security Life of Denver Insurance Co. 5.45%, 2/28/07 | 8/26/05 | $ 2,000,000 |
Transamerica Occidental Life Insurance Co.
5.54%, 2/1/07 | 4/28/00 | $ 10,000,000 |
# Additional Information on each counterparty to the repurchase agreement is as follows: |
Repurchase Agreement / Counterparty | Value |
$446,000 due 1/02/07 at 5.33% |
ABN AMRO Bank N.V., New York Branch | $ 75,765 |
BNP Paribas Securities Corp. | 48,235 |
Banc of America Securities LLC | 75,765 |
Barclays Capital, Inc. | 75,765 |
Bear Stearns & Co., Inc. | 113,647 |
Greenwich Capital Markets, Inc. | 18,941 |
HSBC Securities (USA), Inc. | 37,882 |
| $ 446,000 |
Income Tax Information |
At December 31, 2006, the fund had a capital loss carryforward of approximately $342,158 of which $61,748, $174,987 and $105,423 will expire on December 31, 2011, 2012 and 2013, respectively. |
See accompanying notes which are an integral part of the financial statements.
Annual Report
VIP Money Market Portfolio
Financial Statements
Statement of Assets and Liabilities
| December 31, 2006 |
| | |
Assets | | |
Investment in securities, at value
(including repurchase agreements of $349,446,000) -
See accompanying schedule: Unaffiliated issuers
(cost $2,377,640,547) | | $ 2,377,640,547 |
Cash | | 162,198 |
Receivable for fund shares sold | | 1,742,384 |
Interest receivable | | 12,990,520 |
Prepaid expenses | | 10,778 |
Other receivables | | 271 |
Total assets | | 2,392,546,698 |
| | |
Liabilities | | |
Payable for investments purchased | $ 34,000,000 | |
Payable for fund shares redeemed | 464,799 | |
Distributions payable | 648,827 | |
Accrued management fee | 459,561 | |
Distribution fees payable | 20,188 | |
Other affiliated payables | 171,747 | |
Other payables and accrued expenses | 178,337 | |
Total liabilities | | 35,943,459 |
| | |
Net Assets | | $ 2,356,603,239 |
Net Assets consist of: | | |
Paid in capital | | $ 2,356,898,384 |
Undistributed net investment income | | 47,013 |
Accumulated undistributed net realized gain (loss) on investments | | (342,158) |
Net Assets | | $ 2,356,603,239 |
Statement of Assets and Liabilities - continued
| December 31, 2006 |
| | |
Initial Class:
Net Asset Value, offering price and redemption price per share ($1,634,441,388 ÷ 1,634,751,606 shares) | | $ 1.00 |
| | |
Service Class:
Net Asset Value, offering price and redemption price per share ($56,501,591 ÷ 56,503,579 shares) | | $ 1.00 |
| | |
Service Class 2:
Net Asset Value, offering price and redemption price per share ($85,646,793 ÷ 85,648,438 shares) | | $ 1.00 |
| | |
Investor Class:
Net Asset Value, offering price and redemption price per share ($580,013,467 ÷ 579,969,475 shares) | | $ 1.00 |
See accompanying notes which are an integral part of the financial statements.
VIP Money Market Portfolio
Statement of Operations
| Year ended December 31, 2006 |
| | |
Investment Income | | |
Interest (including $99,861 from affiliated interfund lending) | | $ 101,612,331 |
| | |
Expenses | | |
Management fee | $ 4,582,492 | |
Transfer agent fees | 1,541,014 | |
Distribution fees | 199,831 | |
Accounting fees and expenses | 203,292 | |
Custodian fees and expenses | 50,830 | |
Independent trustees' compensation | 7,079 | |
Audit | 46,837 | |
Legal | 8,148 | |
Interest | 10,332 | |
Miscellaneous | 195,357 | |
Total expenses before reductions | 6,845,212 | |
Expense reductions | (4,191) | 6,841,021 |
Net investment income | | 94,771,310 |
Realized and Unrealized Gain (Loss) Net realized gain (loss) on: | | |
Investment securities: | | |
Unaffiliated issuers | | 46,850 |
Net increase in net assets resulting from operations | | $ 94,818,160 |
Statement of Changes in Net Assets
| Year ended
December 31,
2006 | Year ended
December 31,
2005 |
Increase (Decrease) in Net Assets | | |
Operations | | |
Net investment income | $ 94,771,310 | $ 45,355,398 |
Net realized gain (loss) | 46,850 | (105,423) |
Net increase in net assets resulting from operations | 94,818,160 | 45,249,975 |
Distributions to shareholders from net investment income | (94,777,417) | (45,352,183) |
Share transactions - net increase (decrease) | 810,408,342 | 119,003,253 |
Total increase (decrease) in net assets | 810,449,085 | 118,901,045 |
| | |
Net Assets | | |
Beginning of period | 1,546,154,154 | 1,427,253,109 |
End of period (including undistributed net investment income of $47,013 and
distributions in excess of net investment income of $25,356, respectively) | $ 2,356,603,239 | $ 1,546,154,154 |
See accompanying notes which are an integral part of the financial statements.
Annual Report
Financial Highlights - Initial Class
Years ended December 31, | 2006 | 2005 | 2004 | 2003 | 2002 |
Selected Per-Share Data | | | | | |
Net asset value, beginning of period | $ 1.00 | $ 1.00 | $ 1.00 | $ 1.00 | $ 1.00 |
Income from Investment Operations | | | | | |
Net investment income | .048 | .030 | .012 | .010 | .017 |
Distributions from net investment income | (.048) | (.030) | (.012) | (.010) | (.017) |
Net asset value, end of period | $ 1.00 | $ 1.00 | $ 1.00 | $ 1.00 | $ 1.00 |
Total Return A,B | 4.87% | 3.03% | 1.21% | 1.00% | 1.69% |
Ratios to Average Net AssetsC | | | | | |
Expenses before reductions | .33% | .29% | .29% | .29% | .29% |
Expenses net of fee waivers, if any | .33% | .29% | .29% | .29% | .29% |
Expenses net of all reductions | .33% | .29% | .29% | .29% | .29% |
Net investment income | 4.84% | 3.00% | 1.18% | 1.00% | 1.68% |
Supplemental Data | | | | | |
Net assets, end of period (000 omitted) | $ 1,634,441 | $ 1,347,642 | $ 1,392,449 | $ 1,817,440 | $ 2,705,069 |
A Total returns do not reflect charges attributable to your insurance company's separate account. Inclusion of these charges would reduce the total returns shown.
B Total returns would have been lower had certain expenses not been reduced during the periods shown.
C Expense ratios reflect operating expenses of the class. Expenses before reductions do not reflect amounts reimbursed by the investment adviser or expense offset arrangements and do not represent the amount paid by the class during periods when reimbursements or reductions occur. Expenses net of fee waivers reflect expenses after reimbursement by the investment adviser but prior to reductions from expense offset arrangements. Expenses net of all reductions represent the net expenses paid by the class.
Financial Highlights - Service Class
Years ended December 31, | 2006 | 2005 | 2004 | 2003 | 2002 |
Selected Per-Share Data | | | | | |
Net asset value, beginning of period | $ 1.00 | $ 1.00 | $ 1.00 | $ 1.00 | $ 1.00 |
Income from Investment Operations | | | | | |
Net investment income | .047 | .029 | .011 | .009 | .016 |
Distributions from net investment income | (.047) | (.029) | (.011) | (.009) | (.016) |
Net asset value, end of period | $ 1.00 | $ 1.00 | $ 1.00 | $ 1.00 | $ 1.00 |
Total Return A,B | 4.76% | 2.92% | 1.10% | .90% | 1.61% |
Ratios to Average Net Assets C | | | | | |
Expenses before reductions | .43% | .40% | .40% | .38% | .39% |
Expenses net of fee waivers, if any | .43% | .40% | .40% | .38% | .39% |
Expenses net of all reductions | .43% | .40% | .40% | .38% | .39% |
Net investment income | 4.73% | 2.88% | 1.08% | .91% | 1.58% |
Supplemental Data | | | | | |
Net assets, end of period (000 omitted) | $ 56,502 | $ 20,987 | $ 13,905 | $ 19,606 | $ 8,017 |
A Total returns do not reflect charges attributable to your insurance company's separate account. Inclusion of these charges would reduce the total returns shown.
B Total returns would have been lower had certain expenses not been reduced during the periods shown.
C Expense ratios reflect operating expenses of the class. Expenses before reductions do not reflect amounts reimbursed by the investment adviser or expense offset arrangements and do not represent the amount paid by the class during periods when reimbursements or reductions occur. Expenses net of fee waivers reflect expenses after reimbursement by the investment adviser but prior to reductions from expense offset arrangements. Expenses net of all reductions represent the net expenses paid by the class.
See accompanying notes which are an integral part of the financial statements.
VIP Money Market Portfolio
Financial Highlights - Service Class 2
Years ended December 31, | 2006 | 2005 | 2004 | 2003 | 2002 |
Selected Per-Share Data | | | | | |
Net asset value, beginning of period | $ 1.00 | $ 1.00 | $ 1.00 | $ 1.00 | $ 1.00 |
Income from Investment Operations | | | | | |
Net investment income | .045 | .027 | .009 | .007 | .014 |
Distributions from net investment income | (.045) | (.027) | (.009) | (.007) | (.014) |
Net asset value, end of period | $ 1.00 | $ 1.00 | $ 1.00 | $ 1.00 | $ 1.00 |
Total Return A,B | 4.61% | 2.77% | .95% | .75% | 1.45% |
Ratios to Average Net Assets C | | | | | |
Expenses before reductions | .58% | .54% | .55% | .54% | .54% |
Expenses net of fee waivers, if any | .58% | .54% | .55% | .54% | .54% |
Expenses net of all reductions | .58% | .54% | .55% | .54% | .54% |
Net investment income | 4.59% | 2.90% | .93% | .75% | 1.43% |
Supplemental Data | | | | | |
Net assets, end of period (000 omitted) | $ 85,647 | $ 51,301 | $ 20,899 | $ 3,068 | $ 47,604 |
A Total returns do not reflect charges attributable to your insurance company's separate account. Inclusion of these charges would reduce the total returns shown.
B Total returns would have been lower had certain expenses not been reduced during the periods shown.
C Expense ratios reflect operating expenses of the class. Expenses before reductions do not reflect amounts reimbursed by the investment adviser or expense offset arrangements and do not represent the amount paid by the class during periods when reimbursements or reductions occur. Expenses net of fee waivers reflect expenses after reimbursement by the investment adviser but prior to reductions from expense offset arrangements. Expenses net of all reductions represent the net expenses paid by the class.
Financial Highlights - Investor Class
Years ended December 31, | 2006 | 2005 E |
Selected Per-Share Data | | |
Net asset value, beginning of period | $ 1.00 | $ 1.00 |
Income from Investment Operations | | |
Net investment income | .047 | .016 |
Distributions from net investment income | (.047) | (.016) |
Net asset value, end of period | $ 1.00 | $ 1.00 |
Total Return B,C,D | 4.81% | 1.58% |
Ratios to Average Net Assets F | | |
Expenses before reductions | .39% | .36% A |
Expenses net of fee waivers, if any | .39% | .36% A |
Expenses net of all reductions | .39% | .36% A |
Net investment income | 4.78% | 3.72% A |
Supplemental Data | | |
Net assets, end of period (000 omitted) | $ 580,013 | $ 126,224 |
A Annualized
B Total returns for periods of less than one year are not annualized.
C Total returns do not reflect charges attributable to your insurance company's separate account. Inclusion of these charges would reduce the total returns shown.
D Total returns would have been lower had certain expenses not been reduced during the periods shown.
E For the period July 21, 2005 (commencement of sale of shares) to December 31, 2005.
F Expense ratios reflect operating expenses of the class. Expenses before reductions do not reflect amounts reimbursed by the investment adviser or expense offset arrangements and do not represent the amount paid by the class during periods when reimbursements or reductions occur. Expense ratios before reductions for start-up periods may not be representative of longer-term operating periods. Expenses net of fee waivers reflect expenses after reimbursement by the investment adviser but prior to reductions from expense offset arrangements. Expenses net of all reductions represent the net expenses paid by the class.
See accompanying notes which are an integral part of the financial statements.
Annual Report
Notes to Financial Statements
For the period ended December 31, 2006
1. Significant Accounting Policies.
VIP Money Market Portfolio (the Fund) is a fund of Variable Insurance Products Fund (the trust) (referred to in this report as VIP Money Market Portfolio) and is authorized to issue an unlimited number of shares. The trust is registered under the Investment Company Act of 1940, as amended (the 1940 Act), as an open-end management investment company organized as a Massachusetts business trust. Shares of the Fund may only be purchased by insurance companies for the purpose of funding variable annuity or variable life insurance contracts. The Fund offers the following classes of shares: Initial Class shares, Service Class shares, Service Class 2 shares, and Investor Class shares. All classes have equal rights and voting privileges, except for matters affecting a single class. Investment income, realized and unrealized capital gains and losses, the common expenses of the Fund, and certain fund-level expense reductions, if any, are allocated on a pro rata basis to each class based on the relative net assets of each class to the total net assets of the Fund. Each class differs with respect to transfer agent and distribution and service plan fees incurred. Certain expense reductions also differ by class.
The financial statements have been prepared in conformity with accounting principles generally accepted in the United States of America, which require management to make certain estimates and assumptions at the date of the financial statements. The following summarizes the significant accounting policies of the Fund:
Security Valuation. Net asset value per share is calculated as of the close of business of the New York Stock Exchange, normally 4:00 p.m. Eastern time. As permitted by compliance with certain conditions under Rule 2a-7 of the 1940 Act, securities are valued at amortized cost, which approximates value.
Investment Transactions and Income. Security transactions are accounted for as of trade date. Gains and losses on securities sold are determined on the basis of identified cost. Interest income is accrued as earned. Interest income includes coupon interest and amortization of premium and accretion of discount on debt securities.
Expenses. Most expenses of the trust can be directly attributed to a fund. Expenses which cannot be directly attributed are apportioned among each Fund in the trust. Expense estimates are accrued in the period to which they relate and adjustments are made when actual amounts are known.
Income Tax Information and Distributions to Shareholders. Each year, the Fund intends to qualify as a regulated investment company by distributing all of its taxable income and realized gains under Subchapter M of the Internal Revenue Code. As a result, no provision for income taxes is required in the accompanying financial statements.
Dividends are declared daily and paid monthly from net investment income. Distributions from realized gains, if any, are recorded on the ex-dividend date. Income dividends and capital gain distributions are declared separately for each class. Income and capital gain distributions are determined in accordance with income tax regulations, which may differ from generally accepted accounting principles.
Capital accounts within the financial statements are adjusted for permanent book-tax differences. These adjustments have no impact on net assets or the results of operations. Temporary book-tax differences will reverse in a subsequent period.
Book-tax differences are primarily due to deferred trustees compensation and capital loss carryforwards.
The tax-basis components of distributable earnings and the federal tax cost as of period end were as follows:
Unrealized appreciation | $ - | |
Unrealized depreciation | - | |
Net unrealized appreciation (depreciation) | - | |
Undistributed ordinary income | 48,835 | |
Capital loss carryforward | (342,158) | |
| | |
Cost for federal income tax purposes | $ 2,377,640,547 | |
The tax character of distributions paid was as follows:
| December 31, 2006 | December 31,2005 |
Ordinary Income | $ 94,777,417 | $ 45,352,183 |
New Accounting Pronouncements. In July 2006, Financial Accounting Standards Board Interpretation No. 48, Accounting for Uncertainty in Income Taxes - an interpretation of FASB Statement 109 (FIN 48), was issued and is effective on the last business day of the semiannual reporting period for fiscal years beginning after December 15, 2006. FIN 48 sets forth a threshold for financial statement recognition, measurement and disclosure of a tax position taken or expected to be taken on a tax return. Management is currently evaluating the impact, if any, the adoption of FIN 48 will have on the Fund's net assets, results of operations and financial statement disclosures.
VIP Money Market Portfolio
1. Significant Accounting Policies - continued
New Accounting Pronouncements - continued
In addition, in September 2006, Statement of Financial Accounting Standards No. 157, Fair Value Measurements (SFAS 157), was issued and is effective for fiscal years beginning after November 15, 2007. SFAS 157 defines fair value, establishes a framework for measuring fair value and expands disclosures about fair value measurements. Management is currently evaluating the impact the adoption of SFAS 157 will have on the Fund's financial statement disclosures.
2. Operating Policies.
Repurchase Agreements. Fidelity Management & Research Company (FMR) has received an Exemptive Order from the Securities and Exchange Commission (the SEC) which permits the Fund and other affiliated entities of FMR to transfer uninvested cash balances into joint trading accounts which are then invested in repurchase agreements. The Fund may also invest directly with institutions in repurchase agreements. Repurchase agreements are collateralized by government or non-government securities. Upon settlement date, collateral is held in segregated accounts with custodian banks and may be obtained in the event of a default of the counterparty. The Fund monitors, on a daily basis, the value of the collateral to ensure it is at least equal to the principal amount of the repurchase agreement (including accrued interest). In the event of a default by the counterparty, realization of the collateral proceeds could be delayed, during which time the value of the collateral may decline.
Reverse Repurchase Agreements. To enhance its yield, the Fund may enter into reverse repurchase agreements whereby the Fund transfers securities to a counterparty who then agrees to transfer them back to the Fund at a future date and agreed upon price, reflecting a rate of interest below market rate. The Fund receives cash proceeds, which are invested in other securities, and agrees to repay the proceeds plus accrued interest in return for the same securities transferred. The Fund continues to receive interest payments on the transferred securities during the term of the reverse repurchase agreement. During the period that a reverse repurchase agreement is outstanding, the Fund identifies cash and liquid securities as segregated in its custodian records with a value at least equal to its obligation under the agreement. If the counterparty defaults on its obligation, because of insolvency or other reasons, the Fund could experience delays and costs in recovering the security or in gaining access to the collateral. The average daily balance during the period for which reverse repurchase agreements were outstanding amounted to $4,830,667. The weighted average interest rate was 4.28%. At period end, there were no reverse repurchase agreements outstanding.
Restricted Securities. The Fund may invest in securities that are subject to legal or contractual restrictions on resale. These securities generally may be resold in transactions exempt from registration or to the public if the securities are registered. Disposal of these securities may involve time-consuming negotiations and expense, and prompt sale at an acceptable price may be difficult. Information regarding restricted securities is included at the end of the Fund's Schedule of Investments.
3. Fees and Other Transactions with Affiliates.
Management Fee. FMR and its affiliates provide the Fund with investment management related services for which the Fund pays a monthly management fee. The management fee is calculated on the basis of a group fee rate plus a total income-based component. The group fee rate averaged ..12% during the period. The group fee rate is based upon the average net assets of all the mutual funds advised by FMR. The group fee rate decreases as assets under management increase and increases as assets under management decrease. The total income-based component is calculated according to a graduated schedule providing for different rates based on the Fund's gross annualized yield. The rate increases as the Fund's gross yield increases.
During the period the income-based portion of this fee was $2,218,147 or an annual rate of .11% of the Fund's average net assets. For the period, the Fund's total annual management fee rate was .23% of the Fund's average net assets.
Distribution and Service Plan. In accordance with Rule 12b-1 of the 1940 Act, the Fund has adopted separate 12b-1 Plans for each Service Class of shares. Each Service Class pays Fidelity Distributors Corporation (FDC), an affiliate of FMR, a service fee. For the period, the service fee is based on an annual rate of .10% of Service Class' average net assets and .25% of Service Class 2's average net assets.
For the period, each class paid FDC the following amounts, all of which were re-allowed to insurance companies for the distribution of shares and providing shareholder support services:
Service Class | $ 25,344 | |
Service Class 2 | 174,487 | |
| $ 199,831 | |
Annual Report
Notes to Financial Statements - continued
3. Fees and Other Transactions with Affiliates - continued
Transfer Agent Fees. Fidelity Investments Institutional Operations Company, Inc. (FIIOC), an affiliate of FMR, is the fund's transfer, dividend disbursing, and shareholder servicing agent. FIIOC receives an asset-based fee with respect to each class. Each class with the exception of Investor Class pays a transfer agent fee, excluding out of pocket expenses, equal to an annual rate of .07% of their month end net assets. Investor Class pays a monthly asset-based transfer agent fee of .12% of its month end net assets. The total transfer agent fees paid by each class to FIIOC, including out of pocket expenses, were as follows:
Initial Class | $ 1,044,859 | |
Service Class | 19,215 | |
Service Class 2 | 48,129 | |
Investor Class | 428,811 | |
| $ 1,541,014 | |
Accounting Fees. Fidelity Service Company, Inc. (FSC), an affiliate of FMR, maintains the Fund's accounting records. The fee is based on the level of average net assets for the month.
Interfund Lending Program. Pursuant to an Exemptive Order issued by the SEC, the Fund, along with other registered investment companies having management contracts with FMR, may participate in an interfund lending program. This program provides an alternative credit facility allowing the funds to borrow from, or lend money to, other participating affiliated funds. At period end, there were no interfund loans outstanding. The Fund's activity in this program during the period for which loans were outstanding was as follows:
Borrower or Lender | Average Daily Loan Balance | Weighted Average Interest Rate |
Lender | $ 14,417,878 | 5.09% |
4. Expense Reductions.
Through arrangements with the fund's custodian, credits realized as a result of uninvested cash balances were used to reduce the Fund's expenses. During the period, these credits reduced the Fund's custody expenses by $4,191.
5. Other.
The Fund's organizational documents provide former and current trustees and officers with a limited indemnification against liabilities arising in connection with the performance of their duties to the Fund. In the normal course of business, the Fund may also enter into contracts that provide general indemnifications. The Fund's maximum exposure under these arrangements is unknown as this would be dependent on future claims that may be made against the Fund. The risk of material loss from such claims is considered remote.
At the end of the period, FMR or its affiliates were the owners of record of 62% of the total outstanding shares of the Fund and one otherwise unaffiliated shareholder was the owner of record of 11% of the total outstanding shares of the Fund.
6. Distributions to Shareholders.
Distributions to shareholders of each class were as follows:
| Years ended December 31, |
| 2006 | 2005 A |
From net investment income | | |
Initial Class | $ 73,972,014 | $ 42,861,410 |
Service Class | 1,192,586 | 503,413 |
Service Class 2 | 3,206,476 | 1,060,557 |
Investor Class | 16,406,341 | 926,803 |
Total | $ 94,777,417 | $ 45,352,183 |
A Distributions for Investor Class are for the period July 21, 2005 (commencement of sale of shares) to December 31, 2005.
VIP Money Market Portfolio
7. Share Transactions.
Transactions for each class of shares at a $1.00 per share were as follows:
| Years ended December 31, |
| 2006 | 2005 A |
Initial Class
Shares sold | 805,545,671 | 578,771,972 |
Reinvestment of distributions | 73,673,472 | 42,689,819 |
Shares redeemed | (592,412,576) | (666,171,512) |
Net increase (decrease) | 286,806,567 | (44,709,721) |
Service Class
Shares sold | 99,908,819 | 38,588,771 |
Reinvestment of distributions | 1,179,497 | 501,078 |
Shares redeemed | (65,574,755) | (32,005,992) |
Net increase (decrease) | 35,513,561 | 7,083,857 |
Service Class 2
Shares sold | 87,110,784 | 53,115,392 |
Reinvestment of distributions | 3,189,428 | 1,055,054 |
Shares redeemed | (55,956,973) | (23,765,829) |
Net increase (decrease) | 34,343,239 | 30,404,617 |
Investor Class
Shares sold | 560,339,731 | 158,042,483 |
Reinvestment of distributions | 16,261,969 | 912,610 |
Shares redeemed | (122,856,725) | (32,730,593) |
Net increase (decrease) | 453,744,975 | 126,224,500 |
A Share transactions for Investor Class are for the period July 21, 2005 (commencement of sale of shares) to December 31, 2005.
Annual Report
Report of Independent Registered Public Accounting Firm
To the Trustees of Variable Insurance Products Fund and the Shareholders of VIP Money Market Portfolio:
In our opinion, the accompanying statement of assets and liabilities, including the schedule of investments, and the related statements of operations and of changes in net assets and the financial highlights present fairly, in all material respects, the financial position of VIP Money Market Portfolio (a fund of Variable Insurance Products Fund) at December 31, 2006, the results of its operations for the year then ended, the changes in its net assets for each of the two years in the period then ended and the financial highlights for each of the periods indicated, in conformity with accounting principles generally accepted in the United States of America. These financial statements and financial highlights (hereafter referred to as "financial statements") are the responsibility of the VIP Money Market Portfolio's management; our responsibility is to express an opinion on these financial statements based on our audits. We conducted our audits of these financial statements in accordance with the standards of the Public Company Accounting Oversight Board (United States). Those standards require that we plan and perform the audit to obtain reasonable assurance about whether the financial statements are free of material misstatement. An audit includes examining, on a test basis, evidence supporting the amounts and disclosures in the financial statements, assessing the accounting principles used and significant estimates made by management, and evaluating the overall financial statement presentation. We believe that our audits, which included confirmation of securities at December 31, 2006 by correspondence with the custodian and brokers, provide a reasonable basis for our opinion.
/s/ PricewaterhouseCoopers LLP
PricewaterhouseCoopers LLP
Boston, Massachusetts
February 13, 2007
VIP Money Market Portfolio
Trustees and Officers
The Trustees, Member of the Advisory Board, and executive officers of the trust and fund, as applicable, are listed below. The Board of Trustees governs the fund and is responsible for protecting the interests of shareholders. The Trustees are experienced executives who meet periodically throughout the year to oversee the fund's activities, review contractual arrangements with companies that provide services to the fund, and review the fund's performance. Each of the Trustees oversees 348 funds advised by FMR or an affiliate.
The Trustees hold office without limit in time except that (a) any Trustee may resign; (b) any Trustee may be removed by written instrument, signed by at least two-thirds of the number of Trustees prior to such removal; (c) any Trustee who requests to be retired or who has become incapacitated by illness or injury may be retired by written instrument signed by a majority of the other Trustees; and (d) any Trustee may be removed at any special meeting of shareholders by a two-thirds vote of the outstanding voting securities of the trust. Each Trustee who is not an interested person (as defined in the 1940 Act) (Independent Trustee), shall retire not later than the last day of the calendar year in which his or her 72nd birthday occurs. The Independent Trustees may waive this mandatory retirement age policy with respect to individual Trustees. The executive officers and Advisory Board Member hold office without limit in time, except that any officer and Advisory Board Member may resign or may be removed by a vote of a majority of the Trustees at any regular meeting or any special meeting of the Trustees. Except as indicated, each individual has held the office shown or other offices in the same company for the past five years.
The fund's Statement of Additional Information (SAI) includes more information about the Trustees. To request a free copy, call Fidelity at 1-877-208-0098.
Interested Trustees*:
Correspondence intended for each Trustee who is an interested person may be sent to Fidelity Investments, 82 Devonshire Street, Boston, Massachusetts 02109.
Name, Age; Principal Occupation |
Edward C. Johnson 3d (76) |
| Year of Election or Appointment: 1981 Mr. Johnson is Chairman of the Board of Trustees. Mr. Johnson serves as President (2006-present), Chief Executive Officer, Chairman, and a Director of FMR Corp.; Chairman and a Director of FMR; Chairman and a Director of Fidelity Research & Analysis Company (FRAC); Chairman and a Director of Fidelity Investments Money Management, Inc.; and Chairman (2001-present) and a Director of FMR Co., Inc. In addition, Mr. Johnson serves as Chairman and Director of Fidelity International Limited (FIL). |
Robert L. Reynolds (54) |
| Year of Election or Appointment: 2003 Mr. Reynolds is President and a Director of FMR (2005-present), Fidelity Investments Money Management, Inc. (2005-present), and FMR Co., Inc. (2005-present). Mr. Reynolds also serves as Vice Chairman (2006-present), a Director (2003-present), and Chief Operating Officer of FMR Corp. and a Director of Strategic Advisers, Inc. (2005-present). He also serves on the Board at Fidelity Investments Canada, Ltd. |
* Trustees have been determined to be "Interested Trustees" by virtue of, among other things, their affiliation with the trust or various entities under common control with FMR.
Independent Trustees:
Correspondence intended for each Independent Trustee (that is, the Trustees other than the Interested Trustees) may be sent to Fidelity Investments, P.O. Box 55235, Boston, Massachusetts 02205-5235.
Name, Age; Principal Occupation |
Dennis J. Dirks (58) |
| Year of Election or Appointment: 2005 Prior to his retirement in May 2003, Mr. Dirks was Chief Operating Officer and a member of the Board of The Depository Trust & Clearing Corporation (DTCC) (1999-2003). He also served as President, Chief Operating Officer, and Board member of The Depository Trust Company (DTC) (1999-2003) and President and Board member of the National Securities Clearing Corporation (NSCC) (1999-2003). In addition, Mr. Dirks served as Chief Executive Officer and Board member of the Government Securities Clearing Corporation (2001-2003) and Chief Executive Officer and Board member of the Mortgage-Backed Securities Clearing Corporation (2001-2003). Mr. Dirks also serves as a Trustee and a member of the Finance Committee of Manhattan College (2005-present) and a Trustee and a member of the Finance Committee of AHRC of Nassau County (2006-present). |
Albert R. Gamper, Jr. (64) |
| Year of Election or Appointment: 2006 Prior to his retirement in December 2004, Mr. Gamper served as Chairman of the Board of CIT Group Inc. (commercial finance). During his tenure with CIT Group Inc. Mr. Gamper served in numerous senior management positions, including Chairman (1987-1989; 1999-2001; 2002-2004), Chief Executive Officer (1987-2004), and President (1989-2002). He currently serves as a member of the Board of Directors of Public Service Enterprise Group (utilities, 2001-present), Chairman of the Board of Governors, Rutgers University (2004-present), and Chairman of the Board of Saint Barnabas Health Care System. |
George H. Heilmeier (70) |
| Year of Election or Appointment: 2004 Dr. Heilmeier is Chairman Emeritus of Telcordia Technologies (communication software and systems), where prior to his retirement, he served as company Chairman and Chief Executive Officer. He currently serves on the Boards of Directors of The Mitre Corporation (systems engineering and information technology support for the government), and HRL Laboratories (private research and development, 2004-present). He is Chairman of the General Motors Science & Technology Advisory Board and a Life Fellow of the Institute of Electrical and Electronics Engineers (IEEE). Dr. Heilmeier is a member of the Defense Science Board and the National Security Agency Advisory Board. He is also a member of the National Academy of Engineering, the American Academy of Arts and Sciences, and the Board of Overseers of the School of Engineering and Applied Science of the University of Pennsylvania. Previously, Dr. Heilmeier served as a Director of TRW Inc. (automotive, space, defense, and information technology, 1992-2002), Compaq (1994-2002), Automatic Data Processing, Inc. (ADP) (technology-based business outsourcing, 1995-2002), INET Technologies Inc. (telecommunications network surveillance, 2001-2004), and Teletech Holdings (customer management services). He is the recipient of the 2005 Kyoto Prize in Advanced Technology for his invention of the liquid crystal display, and a member of the Consumer Electronics Hall of Fame. |
James H. Keyes (66) |
| Year of Election or Appointment: 2007 Prior to his retirement in 2003, Mr. Keyes was Chairman, President, and Chief Executive Officer of Johnson Controls, Inc. (automotive supplier, 1993-2003). He currently serves as a member of the boards of LSI Logic Corporation (semiconductor technologies), Navistar International Corporation (manufacture and sale of trucks, buses, and diesel engines, 2002-present), and Pitney Bowes, Inc. (integrated mail, messaging, and document management solutions). |
Marie L. Knowles (60) |
| Year of Election or Appointment: 2001 Prior to Ms. Knowles' retirement in June 2000, she served as Executive Vice President and Chief Financial Officer of Atlantic Richfield Company (ARCO) (diversified energy, 1996-2000). From 1993 to 1996, she was a Senior Vice President of ARCO and President of ARCO Transportation Company. She served as a Director of ARCO from 1996 to 1998. She currently serves as a Director of Phelps Dodge Corporation (copper mining and manufacturing) and McKesson Corporation (healthcare service, 2002-present). Ms. Knowles is a Trustee of the Brookings Institution and the Catalina Island Conservancy and also serves as a member of the Advisory Board for the School of Engineering of the University of Southern California. |
Ned C. Lautenbach (62) |
| Year of Election or Appointment: 2000 Mr. Lautenbach is Chairman of the Independent Trustees (2006-present). Mr. Lautenbach has been a partner of Clayton, Dubilier & Rice, Inc. (private equity investment firm) since September 1998. Previously, Mr. Lautenbach was with the International Business Machines Corporation (IBM) from 1968 until his retirement in 1998. Mr. Lautenbach serves as a Director of Sony Corporation (2006-present) and Eaton Corporation (diversified industrial) as well as the Philharmonic Center for the Arts in Naples, Florida. He also is a member of the Board of Trustees of Fairfield University (2005-present), as well as a member of the Council on Foreign Relations. |
Cornelia M. Small (62) |
| Year of Election or Appointment: 2005 Ms. Small is a member (2000-present) and Chairperson (2002-present) of the Investment Committee, and a member (2002- present) of the Board of Trustees of Smith College. Previously, she served as Chief Investment Officer (1999-2000), Director of Global Equity Investments (1996-1999), and a member of the Board of Directors of Scudder, Stevens & Clark (1990-1997) and Scudder Kemper Investments (1997-1999). In addition, Ms. Small served as Co-Chair (2000-2003) of the Annual Fund for the Fletcher School of Law and Diplomacy. |
William S. Stavropoulos (67) |
| Year of Election or Appointment: 2001 Mr. Stavropoulos is Chairman Emeritus of the Board of Directors of The Dow Chemical Company. Since joining The Dow Chemical Company in 1967, Mr. Stavropoulos served in numerous senior management positions, including President (1993-2000; 2002-2003), CEO (1995-2000; 2002-2004), and Chairman of the Executive Committee (2000-2004). Currently, he is a Director of NCR Corporation (data warehousing and technology solutions), BellSouth Corporation (telecommunications), Chemical Financial Corporation, Maersk Inc. (industrial conglomerate, 2002-present), and Metalmark Capital (private equity investment firm, 2005-present). He also serves as a member of the Board of Trustees of the American Enterprise Institute for Public Policy Research. In addition, Mr. Stavropoulos is a member of The Business Council, J.P. Morgan International Council and the University of Notre Dame Advisory Council for the College of Science. |
Kenneth L. Wolfe (67) |
| Year of Election or Appointment: 2005 Prior to his retirement in 2001, Mr. Wolfe was Chairman and Chief Executive Officer of Hershey Foods Corporation (1993-2001). He currently serves as a member of the boards of Adelphia Communications Corporation (2003-present), Bausch & Lomb, Inc., and Revlon Inc. (2004-present). |
Advisory Board Member and Executive Officers:
Correspondence intended for each executive officer and Mr. Lynch may be sent to Fidelity Investments, 82 Devonshire Street, Boston, Massachusetts 02109.
Name, Age; Principal Occupation |
Peter S. Lynch (62) |
| Year of Election or Appointment: 2003 Member of the Advisory Board of Variable Insurance Products Fund. Mr. Lynch is Vice Chairman and a Director of FMR, and Vice Chairman (2001-present) and a Director of FMR Co., Inc. Previously, Mr. Lynch served as a Trustee of the Fidelity funds (1990-2003). In addition, he serves as a Trustee of Boston College and as the Chairman of the Inner-City Scholarship Fund. |
Kimberley H. Monasterio (43) |
| Year of Election or Appointment: 2007 President and Treasurer of VIP Money Market. Ms. Monasterio also serves as President and Treasurer of other Fidelity funds (2007-present) and is an employee of FMR (2004-present). Previously, Ms. Monasterio served as Deputy Treasurer of the Fidelity funds (2004-2006). Before joining Fidelity Investments, Ms. Monasterio served as Treasurer (2000-2004) and Chief Financial Officer (2002-2004) of the Franklin Templeton Funds and Senior Vice President of Franklin Templeton Services, LLC (2000-2004). |
Boyce I. Greer (50) |
| Year of Election or Appointment: 2005 Vice President of VIP Money Market. Mr. Greer also serves as Vice President of certain Equity Funds (2005-present), certain Asset Allocation Funds (2005-present), Fixed-Income Funds (2006-present), and Money Market Funds (2006-present). Mr. Greer is also a Trustee of other investment companies advised by FMR (2003-present). He is an Executive Vice President of FMR (2005-present) and FMR Co., Inc. (2005-present), and Senior Vice President of Fidelity Investments Money Management, Inc. (2006-present). Previously, Mr. Greer served as a Director and Managing Director of Strategic Advisers, Inc. (2002-2005), and Executive Vice President (2000-2002) and Money Market Group Leader (1997-2002) of the Fidelity Investments Fixed Income Division. He also served as Vice President of Fidelity's Money Market Funds (1997-2002), Senior Vice President of FMR (1997-2002), and Vice President of FIMM (1998-2002). |
Charles S. Morrison (46) |
| Year of Election or Appointment: 2005 Vice President of VIP Money Market. Mr. Morrison also serves as Vice President of Fidelity's Money Market Funds (2005-present) and certain Asset Allocation Funds (2002-present). Previously, he served as Vice President of Fidelity's Bond Funds (2002-2005) and certain Balanced Funds (2002-2005). He served as Vice President (2002-2005) and Bond Group Leader (2002-2005) of Fidelity Investments Fixed Income Division. Mr. Morrison is also Vice President of FIMM (2002-present) and FMR (2002-present). Mr. Morrison joined Fidelity Investments in 1987 as a Corporate Bond Analyst in the Fixed Income Research Division. |
David L. Murphy (58) |
| Year of Election or Appointment: 2002 Vice President of VIP Money Market. Mr. Murphy also serves as Vice President of Fidelity's Money Market Funds (2002-present), certain Asset Allocation Funds (2003-present), Fixed-Income Funds (2005-present), and Balanced Funds (2005-present). He serves as Senior Vice President (2000-present) and Head (2004-present) of the Fidelity Investments Fixed Income Division. Mr. Murphy is also a Senior Vice President of Fidelity Investments Money Management, Inc. (2003-present) and an Executive Vice President of FMR (2005-present). Previously, Mr. Murphy served as Money Market Group Leader (2002-2004), Bond Group Leader (2000-2002), and Vice President of Fidelity's Taxable Bond Funds (2000-2002) and Fidelity's Municipal Bond Funds (2001-2002). |
James K. Miller (43) |
| Year of Election or Appointment: 2003 Vice President of VIP Money Market. Mr. Miller also serves as Vice President of other funds advised by FMR. Prior to assuming his current responsibilities, Mr. Miller worked as an analyst, bond trader and portfolio manager. |
Eric D. Roiter (58) |
| Year of Election or Appointment: 1998 Secretary of VIP Money Market. He also serves as Secretary of other Fidelity funds; Vice President, General Counsel, and Secretary of FMR Co., Inc. (2001-present) and FMR; Assistant Secretary of Fidelity Management & Research (U.K.) Inc. (2001-present), Fidelity Research & Analysis Company (2001-present), and Fidelity Investments Money Management, Inc. (2001-present). Mr. Roiter is an Adjunct Member, Faculty of Law, at Boston College Law School (2003-present). Previously, Mr. Roiter served as Vice President and Secretary of Fidelity Distributors Corporation (FDC) (1998-2005). |
Stuart Fross (47) |
| Year of Election or Appointment: 2003 Assistant Secretary of VIP Money Market. Mr. Fross also serves as Assistant Secretary of other Fidelity funds (2003-present), Vice President and Secretary of FDC (2005-present), and is an employee of FMR. |
R. Stephen Ganis (40) |
| Year of Election or Appointment: 2006 Anti-Money Laundering (AML) officer of VIP Money Market. Mr. Ganis also serves as AML officer of other Fidelity funds (2006-present) and FMR Corp. (2003-present). Before joining Fidelity Investments, Mr. Ganis practiced law at Goodwin Procter, LLP (2000-2002). |
Joseph B. Hollis (58) |
| Year of Election or Appointment: 2006 Chief Financial Officer of VIP Money Market. Mr. Hollis also serves as Chief Financial Officer of other Fidelity funds. Mr. Hollis is President of Fidelity Pricing and Cash Management Services (FPCMS) (2005-present). Mr. Hollis also serves as President and Director of Fidelity Service Company, Inc. (2006-present). Previously, Mr. Hollis served as Senior Vice President of Cash Management Services (1999-2002) and Investment Management Operations (2002-2005). |
Kenneth A. Rathgeber (59) |
| Year of Election or Appointment: 2004 Chief Compliance Officer of VIP Money Market. Mr. Rathgeber also serves as Chief Compliance Officer of other Fidelity funds (2004-present) and Executive Vice President of Risk Oversight for Fidelity Investments (2002-present). He is Chief Compliance Officer of FMR (2005-present), FMR Co., Inc. (2005-present), Fidelity Management & Research (U.K.) Inc. (2005-present), Fidelity Research & Analysis Company (2005-present), Fidelity Investments Money Management, Inc. (2005-present), and Strategic Advisers, Inc. (2005-present). Previously, Mr. Rathgeber served as Executive Vice President and Chief Operating Officer for Fidelity Investments Institutional Services Company, Inc. (1998-2002). |
Bryan A. Mehrmann (45) |
| Year of Election or Appointment: 2005 Deputy Treasurer of VIP Money Market. Mr. Mehrmann also serves as Deputy Treasurer of other Fidelity funds (2005-present) and is an employee of FMR. Previously, Mr. Mehrmann served as Vice President of Fidelity Investments Institutional Services Group (FIIS)/Fidelity Investments Institutional Operations Corporation, Inc. (FIIOC) Client Services (1998-2004). |
Kenneth B. Robins (37) |
| Year of Election or Appointment: 2005 Deputy Treasurer of VIP Money Market. Mr. Robins also serves as Deputy Treasurer of other Fidelity funds (2005-present) and is an employee of FMR (2004-present). Before joining Fidelity Investments, Mr. Robins worked at KPMG LLP, where he was a partner in KPMG's department of professional practice (2002-2004) and a Senior Manager (1999-2000). In addition, Mr. Robins served as Assistant Chief Accountant, United States Securities and Exchange Commission (2000-2002). |
Robert G. Byrnes (40) |
| Year of Election or Appointment: 2005 Assistant Treasurer of VIP Money Market. Mr. Byrnes also serves as Assistant Treasurer of other Fidelity funds (2005-present) and is an employee of FMR (2005-present). Previously, Mr. Byrnes served as Vice President of FPCMS (2003-2005). Before joining Fidelity Investments, Mr. Byrnes worked at Deutsche Asset Management where he served as Vice President of the Investment Operations Group (2000-2003). |
John H. Costello (60) |
| Year of Election or Appointment: 1986 Assistant Treasurer of VIP Money Market. Mr. Costello also serves as Assistant Treasurer of other Fidelity funds and is an employee of FMR. |
Peter L. Lydecker (52) |
| Year of Election or Appointment: 2004 Assistant Treasurer of VIP Money Market. Mr. Lydecker also serves as Assistant Treasurer of other Fidelity funds (2004) and is an employee of FMR. |
Mark Osterheld (51) |
| Year of Election or Appointment: 2002 Assistant Treasurer of VIP Money Market. Mr. Osterheld also serves as Assistant Treasurer of other Fidelity funds (2002) and is an employee of FMR. |
Gary W. Ryan (48) |
| Year of Election or Appointment: 2005 Assistant Treasurer of VIP Money Market. Mr. Ryan also serves as Assistant Treasurer of other Fidelity funds (2005-present) and is an employee of FMR (2005-present). Previously, Mr. Ryan served as Vice President of Fund Reporting in FPCMS (1999-2005). |
Salvatore Schiavone (41) |
| Year of Election or Appointment: 2005 Assistant Treasurer of VIP Money Market. Mr. Schiavone also serves as Assistant Treasurer of other Fidelity funds (2005-present) and is an employee of FMR (2005-present). Before joining Fidelity Investments, Mr. Schiavone worked at Deutsche Asset Management, where he most recently served as Assistant Treasurer (2003-2005) of the Scudder Funds and Vice President and Head of Fund Reporting (1996-2003). |
Annual Report
Proxy Voting Results
A special meeting of the fund's shareholders was held on November 15, 2006. The results of votes taken among shareholders on the proposal before them are reported below. Each vote reported represents one dollar of net asset value held on the record date for the meeting.
PROPOSAL 1 |
To elect a Board of Trustees. A |
| # of
Votes | % of
Votes |
Dennis J. Dirks |
Affirmative | 17,902,425,874.20 | 95.888 |
Withheld | 767,753,174.62 | 4.112 |
TOTAL | 18,670,179,048.82 | 100.000 |
Albert R. Gamper, Jr. |
Affirmative | 17,903,848,885.90 | 95.895 |
Withheld | 766,330,162.92 | 4.105 |
TOTAL | 18,670,179,048.82 | 100.000 |
Robert M. Gates |
Affirmative | 17,872,803,847.04 | 95.729 |
Withheld | 797,375,201.78 | 4.271 |
TOTAL | 18,670,179,048.82 | 100.000 |
George H. Heilmeier |
Affirmative | 17.870,083,099.32 | 95.715 |
Withheld | 800,095,949.50 | 4.285 |
TOTAL | 18,670,179,048.82 | 100.000 |
Edward C. Johnson 3d |
Affirmative | 17,855,450,949.13 | 95.636 |
Withheld | 814,728,099.69 | 4.364 |
TOTAL | 18,670,179,048.82 | 100.000 |
Stephen P. Jonas |
Affirmative | 17,891,792,907.31 | 95.831 |
Withheld | 778,386,141.51 | 4.169 |
TOTAL | 18,670,179,048.82 | 100.000 |
James H. KeyesB |
Affirmative | 17,882,873,107.76 | 95.783 |
Withheld | 787,305,941.06 | 4.217 |
TOTAL | 18,670,179,048.82 | 100.000 |
Marie L. Knowles |
Affirmative | 17,891,908,567.08 | 95.831 |
Withheld | 778,270,481.74 | 4.169 |
TOTAL | 18,670,179,048.82 | 100.000 |
Ned C. Lautenbach |
Affirmative | 17,899,551,251.03 | 95.872 |
Withheld | 770,627,797.79 | 4.128 |
TOTAL | 18,670,179,048.82 | 100.000 |
| # of
Votes | % of
Votes |
William O. McCoy |
Affirmative | 17,860,461,325.05 | 95.663 |
Withheld | 809,717,723.77 | 4.337 |
TOTAL | 18,670,179,048.82 | 100.000 |
Robert L. Reynolds |
Affirmative | 17,894,978,918.13 | 95.848 |
Withheld | 775,200,130.69 | 4.152 |
TOTAL | 18,670,179,048.82 | 100.000 |
Cornelia M. Small |
Affirmative | 17,897,519,970.69 | 95.862 |
Withheld | 772,659,078.13 | 4.138 |
TOTAL | 18,670,179,048.82 | 100.000 |
William S. Stavropoulos |
Affirmative | 17,871,058,112.55 | 95.720 |
Withheld | 799,120,936.27 | 4.280 |
TOTAL | 18,670,179,048.82 | 100.000 |
Kenneth L. Wolfe |
Affirmative | 17,886,340,376.33 | 95.802 |
Withheld | 783,838,672.49 | 4.198 |
TOTAL | 18,670,179,048.82 | 100.000 |
A Denotes trust-wide proposal and voting results. B Effective on or about January 1, 2007. |
VIP Money Market Portfolio
Annual Report
Investment Adviser
Fidelity Management & Research Company
Boston, MA
Investment Sub-Adviser
Fidelity Investments Money Management, Inc.
Fidelity International Investment Advisors
Fidelity International Investment Advisors (U.K.) Limited
Fidelity Research & Analysis Company
(formerly Fidelity Management &
Research (Far East) Inc.)
General Distributor
Fidelity Distributors Corporation
Boston, MA
Transfer and Shareholder Servicing Agents
Fidelity Investments Institutional Operations Co., Inc.
Boston, MA
Fidelity Service Company, Inc.
Boston, MA
Custodian
The Bank of New York
New York, NY
VIPMM-ANN-0207
1.701157.109
Fidelity® Variable Insurance Products:
Overseas Portfolio
Annual Report
December 31, 2006
(2_fidelity_logos) (Registered_Trademark)
Contents
Performance | <Click Here> | How the fund has done over time. |
Management's Discussion | <Click Here> | The manager's review of fund performance, strategy and outlook. |
Shareholder Expense Example | <Click Here> | An example of shareholder expenses. |
Investment Changes | <Click Here> | A summary of major shifts in the fund's investments over the past six months. |
Investments | <Click Here> | A complete list of the fund's investments with their
market values. |
Financial Statements | <Click Here> | Statements of assets and liabilities, operations, and
changes in net assets, as well as financial highlights. |
Notes | <Click Here> | Notes to the financial statements. |
Report of Independent Registered Public Accounting Firm | <Click Here> | |
Trustees and Officers | <Click Here> | |
Distributions | <Click Here> | |
Proxy Voting Results | <Click Here> | |
Board Approval of Investment Advisory Contracts and Management Fees | <Click Here> | |
| | |
To view a fund's proxy voting guidelines and proxy voting record for the 12-month period ended June 30, visit www.fidelity.com/proxyvotingresults or visit the Securities and Exchange Commission's (SEC) web site at www.sec.gov. You may also call 1-877-208-0098 to request a free copy of the proxy voting guidelines.
Fidelity Variable Insurance Products are separate account options which are purchased through a variable insurance contract.
Standard & Poor's, S&P and S&P 500 are registered service marks of The McGraw-Hill Companies, Inc. and have been licensed for use by Fidelity Distributors Corporation.
Other third party marks appearing herein are the property of their respective owners.
All other marks appearing herein are registered or unregistered trademarks or service marks of FMR Corp. or an affiliated company.
This report and the financial statements contained herein are submitted for the general information of the shareholders of the fund. This report is not authorized for distribution to prospective investors in the fund unless preceded or accompanied by an effective prospectus.
A fund files its complete schedule of portfolio holdings with the SEC for the first and third quarters of each fiscal year on Form N-Q. Forms N-Q are available on the SEC's web site at http://www.sec.gov. A fund's Forms N-Q may be reviewed and copied at the SEC's Public Reference Room in Washington, DC. Information regarding the operation of the SEC's Public Reference Room may be obtained by calling 1-800-SEC-0330. For a complete list of a fund's portfolio holdings, view the most recent quarterly holdings report, semiannual report, or annual report on Fidelity's web site at http://www.advisor.fidelity.com.
NOT FDIC INSURED · MAY LOSE VALUE · NO BANK GUARANTEE
Neither the fund nor Fidelity Distributors Corporation is a bank.
VIP Overseas Portfolio
VIP Overseas Portfolio
Performance: The Bottom Line
Average annual total return reflects the change in the value of an investment, assuming reinvestment of the class' dividend income and capital gains (the profits earned upon the sale of securities that have grown in value) and assuming a constant rate of performance each year. During periods of reimbursement by Fidelity, a fund's total return will be greater than it would be had the reimbursement not occurred. Performance numbers are net of all underlying fund operating expenses, but do not include any insurance charges imposed by your insurance company's separate account. If performance information included the effect of these additional charges, the total returns would have been lower. How a fund did yesterday is no guarantee of how it will do tomorrow.
Average Annual Total Returns
Periods ended December 31, 2006 | Past 1
year | Past 5
years | Past 10
years |
VIP Overseas - Initial Class | 18.09% | 12.78% | 7.64% |
VIP Overseas - Service Class A | 17.95% | 12.68% | 7.55% |
VIP Overseas - Service Class 2 B | 17.83% | 12.52% | 7.46% |
A The initial offering of Service Class shares took place on November 3, 1997. Performance for Service Class shares reflects an asset-based distribution fee (12b-1 fee), and returns prior to November 3, 1997 are those of Initial Class and do not include the effects of Service Class' 12b-1 fee. Had Service Class shares' 12b-1 fee been reflected, returns prior to November 3, 1997 would have been lower.
B The initial offering of Service Class 2 shares took place on January 12, 2000. Performance for Service Class 2 shares reflects an asset-based distribution fee (12b-1 fee). Returns from November 3, 1997 to January 12, 2000 are those of Service Class which reflect a different 12b-1 fee. Service Class 2 returns prior to November 3, 1997 are those of Initial Class, and do not include the effects of a 12b-1 fee. Had Service Class 2 shares' 12b-1 fee been reflected, returns prior to January 12, 2000 would have been lower.
$10,000 Over 10 Years
Let's say hypothetically that $10,000 was invested in VIP Overseas Portfolio - Initial Class on December 31, 1996. The chart shows how the value of your investment would have changed, and also shows how the MSCI® EAFE® Index performed over the same period.
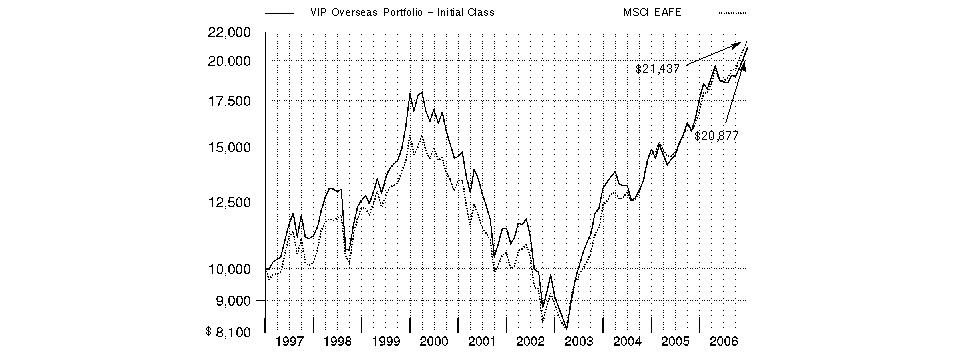
Annual Report
VIP Overseas Portfolio
Management's Discussion of Fund Performance
Comments from Graeme Rockett, Portfolio Manager of VIP Overseas Portfolio
International equity markets as a whole outpaced their U.S. counterparts for the 12 months ending December 31, 2006 - partly as a result of favorable currency movements that boosted returns for U.S. investors in foreign stocks. The Morgan Stanley Capital InternationalSM Europe, Australasia, Far East (MSCI® EAFE®) Index - a gauge of developed stock markets outside the United States and Canada - gained 26.53% during that time. This marked the fifth year in a row that the MSCI EAFE outperformed the Standard & Poor's 500SM Index, a popular barometer of the U.S. equity market, which returned 15.79% in 2006. The European component of the MSCI EAFE, representing two-thirds of the index on average during the period, was up roughly 34%, riding the tail winds of strong profit growth and booming merger-and-acquisition activity. Japan, on the other hand, accounting for roughly one-fourth of the index, was up only modestly, struggling with a weak yen and slowing consumer spending.
For the 12 months ending December 31, 2006, VIP Overseas Portfolio underperformed the MSCI EAFE index. (For specific portfolio performance results, please refer to the performance section of this report.) An overweighting in small- and mid-cap stocks detracted from fund performance during a period when large-cap stocks delivered stronger returns. Stock selection in Europe and Japan accounted for most of the fund's underperformance versus the index. On a sector basis, our weakest results were in financials, consumer discretionary and technology. Given a rising market, holding a modest cash position also detracted. Returns were hurt by investments in Japanese brokerage stocks - including Nikko Cordial, JAFCO and SBI E*Trade - which declined during a period of mediocre performance by the Japanese equity market. Yahoo Japan declined as well, as weak advertising spending by Japanese firms hurt its earnings. Credit Saison, a Japanese consumer finance company, lost ground when government regulators decided to institute an interest rate cap for consumer loans. All of the stocks mentioned above were sold by period end. Stock picking in the capital goods segment contributed to the fund's returns - in particular Alstom, a French manufacturer of power generation equipment. Nintendo, the Japanese video game manufacturer, also helped performance, as sales of its new Wii game console exceeded analysts' expectations. On an absolute basis, favorable currency movements gave performance a sizable boost.
The views expressed above reflect those of the portfolio manager(s) only through the end of the period as stated on the cover of this report and do not necessarily represent the views of Fidelity or any other person in the Fidelity organization. Any such views are subject to change at any time based upon market or other conditions and Fidelity disclaims any responsibility to update such views. These views may not be relied on as investment advice and, because investment decisions for a Fidelity fund are based on numerous factors, may not be relied on as an indication of trading intent on behalf of any Fidelity fund.
VIP Overseas Portfolio
VIP Overseas Portfolio
Shareholder Expense Example
As a shareholder of the Fund, you incur two types of costs: (1) transaction costs, including redemption fees, and (2) ongoing costs, including management fees, distribution and/or service (12b-1) fees and other Fund expenses. This Example is intended to help you understand your ongoing costs (in dollars) of investing in the Fund and to compare these costs with the ongoing costs of investing in other mutual funds.
The Example is based on an investment of $1,000 invested at the beginning of the period and held for the entire period (July 1, 2006 to December 31, 2006).
Actual Expenses
The first line of the accompanying table for each class of the Fund provides information about actual account values and actual expenses. You may use the information in this line, together with the amount you invested, to estimate the expenses that you paid over the period. Simply divide your account value by $1,000.00 (for example, an $8,600 account value divided by $1,000.00 = 8.6), then multiply the result by the number in the first line for a class of the Fund under the heading entitled "Expenses Paid During Period" to estimate the expenses you paid on your account during this period. The estimate of expenses does not include any fees or other expenses of any variable annuity or variable life insurance product. If they were, the estimate of expenses you paid during the period would be higher, and your ending account value would be lower.
Hypothetical Example for Comparison Purposes
The second line of the accompanying table for each class of the Fund provides information about hypothetical account values and hypothetical expenses based on a Class' actual expense ratio and an assumed rate of return of 5% per year before expenses, which is not the Class' actual return. The hypothetical account values and expenses may not be used to estimate the actual ending account balance or expenses you paid for the period. You may use this information to compare the ongoing costs of investing in the Fund and other funds. To do so, compare this 5% hypothetical example with the 5% hypothetical examples that appear in the shareholder reports of the other funds. The estimate of expenses does not include any fees or other expenses of any variable annuity or variable life insurance product. If they were, the estimate of expenses you paid during the period would be higher, and your ending account value would be lower.
Please note that the expenses shown in the table are meant to highlight your ongoing costs only and do not reflect any transaction costs. Therefore, the second line of the table is useful in comparing ongoing costs only, and will not help you determine the relative total costs of owning different funds. In addition, if these transactional costs were included, your costs would have been higher.
| Beginning
Account Value
July 1, 2006 | Ending
Account Value
December 31, 2006 | Expenses Paid
During Period*
July 1, 2006 to
December 31, 2006 |
Initial Class | | | |
Actual | $ 1,000.00 | $ 1,119.60 | $ 4.81 |
HypotheticalA | $ 1,000.00 | $ 1,020.67 | $ 4.58 |
Service Class | | | |
Actual | $ 1,000.00 | $ 1,119.10 | $ 5.34 |
HypotheticalA | $ 1,000.00 | $ 1,020.16 | $ 5.09 |
Service Class 2 | | | |
Actual | $ 1,000.00 | $ 1,118.70 | $ 6.14 |
HypotheticalA | $ 1,000.00 | $ 1,019.41 | $ 5.85 |
Initial Class R | | | |
Actual | $ 1,000.00 | $ 1,119.90 | $ 4.81 |
HypotheticalA | $ 1,000.00 | $ 1,020.67 | $ 4.58 |
Service Class R | | | |
Actual | $ 1,000.00 | $ 1,119.30 | $ 5.29 |
HypotheticalA | $ 1,000.00 | $ 1,020.21 | $ 5.04 |
Service Class 2R | | | |
Actual | $ 1,000.00 | $ 1,118.40 | $ 6.09 |
HypotheticalA | $ 1,000.00 | $ 1,019.46 | $ 5.80 |
Investor Class R | | | |
Actual | $ 1,000.00 | $ 1,119.40 | $ 5.45 |
HypotheticalA | $ 1,000.00 | $ 1,020.06 | $ 5.19 |
A 5% return per year before expenses
* Expenses are equal to each Class' annualized expense ratio (shown in the table below); multiplied by the average account value over the period, multiplied by 184/365 (to reflect the one-half year period).
Annual Report
VIP Overseas Portfolio
Shareholder Expense Example - continued
| Annualized
Expense Ratio |
Initial Class | .90% |
Service Class | 1.00% |
Service Class 2 | 1.15% |
Initial Class R | .90% |
Service Class R | .99% |
Service Class 2R | 1.14% |
Investor Class R | 1.02% |
VIP Overseas Portfolio
VIP Overseas Portfolio
Investment Changes
Geographic Diversification (% of fund's net assets) |
As of December 31, 2006 |
 | United Kingdom | 21.1% | |
 | Japan | 16.4% | |
 | France | 12.2% | |
 | Germany | 10.1% | |
 | Switzerland | 8.6% | |
 | Australia | 4.8% | |
 | United States of America | 4.0% | |
 | Italy | 3.6% | |
 | Spain | 3.3% | |
 | Other | 15.9% | |

Percentages are adjusted for the effect of futures contracts, if applicable. |
|
As of June 30, 2006 |
| United Kingdom | 23.2% | |
| Japan | 19.8% | |
| France | 12.3% | |
| Germany | 9.9% | |
| Switzerland | 7.5% | |
| United States of America | 7.2% | |
| Italy | 3.5% | |
| Australia | 2.4% | |
| Netherlands | 2.4% | |
| Other | 11.8% | |

Percentages are adjusted for the effect of futures contracts, if applicable. |
Asset Allocation |
| % of fund's
net assets | % of fund's net assets
6 months ago |
Stocks | 96.7 | 94.1 |
Short-Term Investments and Net Other Assets | 3.3 | 5.9 |
Top Ten Stocks as of December 31, 2006 |
| % of fund's
net assets | % of fund's net assets
6 months ago |
BP PLC (United Kingdom, Oil, Gas & Consumable Fuels) | 2.3 | 2.7 |
Toyota Motor Corp. (Japan, Automobiles) | 2.0 | 1.5 |
Nintendo Co. Ltd. (Japan, Software) | 1.4 | 0.7 |
Roche Holding AG (participation certificate) (Switzerland, Pharmaceuticals) | 1.4 | 1.5 |
E.ON AG (Germany, Electric Utilities) | 1.4 | 1.2 |
ABB Ltd. (Reg.) (Switzerland, Electrical Equipment) | 1.4 | 0.6 |
Vodafone Group PLC (United Kingdom, Wireless Telecommunication Services) | 1.3 | 0.9 |
UBS AG (Reg.) (Switzerland, Capital Markets) | 1.3 | 1.3 |
Alstom SA (France, Electrical Equipment) | 1.2 | 0.7 |
National Australia Bank Ltd. (Australia, Commercial Banks) | 1.2 | 0.7 |
| 14.9 | |
Market Sectors as of December 31, 2006 |
| % of fund's
net assets | % of fund's net assets
6 months ago |
Financials | 28.7 | 26.8 |
Consumer Discretionary | 14.8 | 13.0 |
Industrials | 9.5 | 8.4 |
Energy | 8.2 | 9.5 |
Consumer Staples | 8.1 | 6.5 |
Information Technology | 8.0 | 10.4 |
Health Care | 6.0 | 8.4 |
Utilities | 4.7 | 2.4 |
Telecommunication Services | 4.6 | 3.2 |
Materials | 4.1 | 5.5 |
Annual Report
VIP Overseas Portfolio
Investments December 31, 2006
Showing Percentage of Net Assets
Common Stocks - 96.4% |
| Shares | | Value (Note 1) |
Australia - 4.8% |
Aristocrat Leisure Ltd. | 1,028,000 | | $ 12,902,901 |
Australian Wealth Management Ltd. | 2,397,900 | | 4,770,114 |
Babcock & Brown Japan Property Trust | 2,867,800 | | 4,731,428 |
BHP Billiton Ltd. | 740,600 | | 14,719,425 |
Computershare Ltd. | 1,733,600 | | 12,179,684 |
CSL Ltd. | 386,200 | | 19,929,109 |
Energy Resources of Australia Ltd. | 234,200 | | 3,845,452 |
Macquarie Bank Ltd. | 170,700 | | 10,635,863 |
National Australia Bank Ltd. | 1,241,300 | | 39,535,405 |
Rio Tinto Ltd. | 79,200 | | 4,645,272 |
Seek Ltd. | 779,600 | | 3,618,647 |
Silex Systems Ltd. (a) | 1,297,800 | | 5,583,434 |
Westfield Group Stapled Security unit | 841,600 | | 13,944,896 |
WorleyParsons Ltd. | 212,866 | | 3,575,815 |
TOTAL AUSTRALIA | | 154,617,445 |
Austria - 0.5% |
Oesterreichische Elektrizitaetswirtschafts AG (Verbund) | 120,100 | | 6,408,834 |
OMV AG | 165,800 | | 9,410,045 |
TOTAL AUSTRIA | | 15,818,879 |
Belgium - 0.6% |
InBev SA | 205,800 | | 13,568,556 |
KBC Groupe SA | 55,900 | | 6,855,944 |
TOTAL BELGIUM | | 20,424,500 |
Bermuda - 0.2% |
Aquarius Platinum Ltd. (United Kingdom) | 174,000 | | 3,779,336 |
Dufry South America Ltd. unit (a) | 151,000 | | 1,978,938 |
TOTAL BERMUDA | | 5,758,274 |
Brazil - 0.2% |
Vivo Participacoes SA (PN) sponsored ADR | 1,938,000 | | 7,945,800 |
Canada - 0.7% |
Cameco Corp. (d) | 440,900 | | 17,847,753 |
Talisman Energy, Inc. | 208,400 | | 3,538,868 |
TOTAL CANADA | | 21,386,621 |
Cayman Islands - 0.0% |
Melco PBL Entertainment (Macau) Ltd. sponsored ADR | 39,000 | | 829,140 |
China - 0.2% |
China Coal Energy Co. Ltd. (H Shares) | 531,000 | | 344,748 |
China Merchants Bank Co. Ltd. (H Shares) (a) | 217,500 | | 460,820 |
Global Bio-Chem Technology Group Co. Ltd. | 19,550,000 | | 6,585,115 |
TOTAL CHINA | | 7,390,683 |
Czech Republic - 0.5% |
Ceske Energeticke Zavody AS | 362,900 | | 16,722,700 |
|
| Shares | | Value (Note 1) |
Denmark - 0.8% |
Novozymes AS Series B | 133,400 | | $ 11,477,808 |
Vestas Wind Systems AS (a) | 381,600 | | 16,129,415 |
TOTAL DENMARK | | 27,607,223 |
Finland - 1.1% |
Fortum Oyj | 216,800 | | 6,170,889 |
Neste Oil Oyj | 182,900 | | 5,560,929 |
Nokia Corp. sponsored ADR | 824,000 | | 16,743,680 |
UPM-Kymmene Corp. sponsored ADR | 248,800 | | 6,284,688 |
TOTAL FINLAND | | 34,760,186 |
France - 12.2% |
Air France KLM (Reg.) | 190,700 | | 8,028,695 |
Alstom SA (a) | 292,700 | | 39,685,595 |
AXA SA | 247,415 | | 9,978,247 |
BNP Paribas SA | 214,002 | | 23,350,728 |
Cap Gemini SA | 327,600 | | 20,565,257 |
Carrefour SA | 150,000 | | 9,097,498 |
CNP Assurances | 110,400 | | 12,330,457 |
Dassault Systemes SA | 83,200 | | 4,415,594 |
Electricite de France | 183,000 | | 13,336,132 |
Financiere Marc de Lacharriere SA (Fimalac) | 108,700 | | 10,432,867 |
France Telecom SA | 106,661 | | 2,954,510 |
Groupe Danone | 116,800 | | 17,702,087 |
L'Air Liquide SA | 74,290 | | 17,644,171 |
L'Oreal SA | 182,795 | | 18,316,640 |
Michelin SA (Compagnie Generale des Etablissements) Series B | 89,300 | | 8,547,305 |
Neopost SA | 74,700 | | 9,383,592 |
Peugeot Citroen SA | 80,600 | | 5,341,688 |
Pinault Printemps-Redoute SA | 77,100 | | 11,522,336 |
Publicis Groupe SA | 192,100 | | 8,102,853 |
Remy Cointreau SA | 109,300 | | 7,070,595 |
Sanofi-Aventis sponsored ADR | 364,600 | | 16,833,582 |
Societe Generale Series A | 82,310 | | 13,974,404 |
Suez SA (France) | 211,300 | | 10,943,533 |
Total SA Series B | 317,000 | | 22,798,640 |
Veolia Environnement | 454,000 | | 35,003,255 |
Vinci SA | 172,900 | | 22,095,818 |
Vivendi Universal SA | 447,100 | | 17,477,641 |
TOTAL FRANCE | | 396,933,720 |
Germany - 9.8% |
Aareal Bank AG (a) | 169,511 | | 7,893,018 |
Allianz AG (Reg.) | 144,400 | | 29,486,480 |
BASF AG | 34,500 | | 3,353,745 |
Bayer AG | 122,600 | | 6,541,936 |
Beiersdorf AG | 312,300 | | 20,252,100 |
Deutsche Postbank AG | 95,700 | | 8,082,171 |
Deutsche Telekom AG sponsored ADR | 148,200 | | 2,697,240 |
Deutz AG (a) | 967,563 | | 12,837,636 |
E.ON AG | 325,844 | | 44,174,671 |
Common Stocks - continued |
| Shares | | Value (Note 1) |
Germany - continued |
ESCADA AG (a) | 373,821 | | $ 14,756,203 |
Fresenius Medical Care AG | 68,400 | | 9,117,761 |
GFK AG | 111,269 | | 4,821,171 |
Hugo Boss AG | 180,200 | | 9,753,902 |
KarstadtQuelle AG (a)(d) | 420,300 | | 12,185,166 |
Lanxess AG (a) | 244,300 | | 13,700,856 |
Merck KGaA | 32,900 | | 3,411,352 |
Metro AG | 196,100 | | 12,507,035 |
MPC Muenchmeyer Petersen Capital AG | 50,800 | | 4,480,690 |
Muenchener Rueckversicherungs-Gesellschaft AG (Reg.) | 61,000 | | 10,503,010 |
Puma AG | 33,800 | | 13,193,611 |
Q-Cells AG | 89,000 | | 4,003,150 |
RWE AG | 61,800 | | 6,812,628 |
SAP AG sponsored ADR | 93,000 | | 4,938,300 |
SGL Carbon AG (a) | 592,200 | | 14,627,898 |
Siemens AG sponsored ADR | 313,500 | | 30,895,425 |
Wincor Nixdorf AG | 94,200 | | 14,657,404 |
TOTAL GERMANY | | 319,684,559 |
Greece - 0.8% |
Alpha Bank AE | 503,900 | | 15,234,197 |
Bank of Piraeus | 369,075 | | 11,898,714 |
TOTAL GREECE | | 27,132,911 |
Hong Kong - 0.4% |
China Unicom Ltd. | 5,250,000 | | 7,817,250 |
Dynasty Fine Wines Group Ltd. | 10,966,000 | | 3,975,691 |
TOTAL HONG KONG | | 11,792,941 |
India - 0.4% |
Infosys Technologies Ltd. | 124,666 | | 6,335,175 |
Satyam Computer Services Ltd. | 477,960 | | 5,237,354 |
TOTAL INDIA | | 11,572,529 |
Ireland - 1.6% |
Allied Irish Banks PLC | 700,300 | | 21,282,117 |
Irish Life & Permanent PLC | 735,300 | | 20,288,530 |
Ryanair Holdings PLC sponsored ADR (a) | 119,400 | | 9,731,100 |
TOTAL IRELAND | | 51,301,747 |
Israel - 0.7% |
ECI Telecom Ltd. (a) | 1,550,200 | | 13,424,732 |
Mizrahi Tefahot Bank Ltd. | 749,100 | | 5,631,997 |
Vizrt Ltd. (a) | 273,100 | | 3,911,931 |
TOTAL ISRAEL | | 22,968,660 |
Italy - 3.6% |
Azimut Holdings Spa | 518,100 | | 6,941,872 |
Banca Intesa Spa | 2,436,700 | | 18,819,048 |
Banche Popolari Unite SCpA | 438,500 | | 12,052,858 |
ENI Spa | 809,686 | | 27,237,837 |
FASTWEB Spa | 111,700 | | 6,388,242 |
|
| Shares | | Value (Note 1) |
Lottomatica Spa | 155,800 | | $ 6,475,032 |
Pirelli & C. Real Estate Spa | 78,000 | | 5,353,701 |
Unicredito Italiano Spa | 3,963,500 | | 34,744,548 |
TOTAL ITALY | | 118,013,138 |
Japan - 16.4% |
Aeon Fantasy Co. Ltd. | 84,200 | | 2,821,991 |
Canon, Inc. (d) | 490,600 | | 27,763,054 |
Capcom Co. Ltd. | 175,500 | | 3,162,096 |
Daiwa Securities Group, Inc. (a) | 2,176,000 | | 24,401,176 |
Fast Retailing Co. Ltd. | 64,700 | | 6,173,809 |
Fujitsu Ltd. | 1,852,000 | | 14,529,761 |
Honda Motor Co. Ltd. | 97,400 | | 3,851,196 |
Hoya Corp. | 220,400 | | 8,590,139 |
Japan Tobacco, Inc. | 1,892 | | 9,138,177 |
KOEI Co. Ltd. (d) | 131,700 | | 2,229,110 |
Leopalace21 Corp. | 114,100 | | 3,641,999 |
Matsushita Electric Industrial Co. Ltd. sponsored ADR | 281,000 | | 5,645,290 |
Millea Holdings, Inc. | 284,500 | | 10,036,959 |
Mitsubishi Estate Co. Ltd. | 1,130,000 | | 29,234,775 |
Mitsubishi UFJ Financial Group, Inc. | 1,673 | | 20,828,850 |
Mitsui Fudosan Co. Ltd. | 427,000 | | 10,419,446 |
Mizuho Financial Group, Inc. | 4,709 | | 33,621,588 |
Nafco Co. Ltd. | 161,200 | | 4,184,024 |
Nidec Corp. | 152,100 | | 11,754,053 |
Nintendo Co. Ltd. | 173,700 | | 45,084,670 |
NSK Ltd. | 1,903,000 | | 18,750,265 |
Organo Corp. | 291,000 | | 3,001,663 |
ORIX Corp. | 80,790 | | 23,378,543 |
Point, Inc. (d) | 97,600 | | 6,411,021 |
Sankei Building Co. Ltd. | 22,100 | | 194,547 |
Sompo Japan Insurance, Inc. | 517,000 | | 6,318,648 |
Sony Corp. sponsored ADR | 170,500 | | 7,302,515 |
St. Marc Holdings Co. Ltd. | 48,000 | | 3,406,972 |
Stanley Electric Co. Ltd. | 351,500 | | 7,041,810 |
Sumco Corp. | 123,000 | | 10,393,784 |
Sumitomo Forestry Co. Ltd. | 581,000 | | 6,295,590 |
Sumitomo Mitsui Financial Group, Inc. | 2,728 | | 27,955,985 |
Sumitomo Trust & Banking Co. Ltd. | 1,565,600 | | 16,412,170 |
T&D Holdings, Inc. | 340,450 | | 22,506,018 |
Tokuyama Corp. | 464,000 | | 7,062,310 |
Toyota Motor Corp. | 950,700 | | 63,844,259 |
USS Co. Ltd. | 189,400 | | 12,329,693 |
Xebio Co. Ltd. | 158,200 | | 4,969,912 |
Yamada Denki Co. Ltd. | 43,200 | | 3,665,015 |
Yamaha Motor Co. Ltd. (a) | 161,600 | | 5,076,724 |
TOTAL JAPAN | | 533,429,607 |
Kazakhstan - 0.0% |
JSC Halyk Bank of Kazakhstan GDR (a)(e) | 54,900 | | 1,207,800 |
Luxembourg - 0.3% |
SES Global SA FDR unit | 562,747 | | 9,806,789 |
Common Stocks - continued |
| Shares | | Value (Note 1) |
Netherlands - 2.9% |
ABN-AMRO Holding NV sponsored ADR | 220,800 | | $ 7,076,640 |
Heineken NV (Bearer) | 202,900 | | 9,651,305 |
IHC Caland NV | 497,500 | | 17,109,627 |
ING Groep NV (Certificaten Van Aandelen) | 223,724 | | 9,881,889 |
Koninklijke KPN NV sponsored ADR (d) | 943,000 | | 13,447,180 |
Koninklijke Numico NV | 219,500 | | 11,808,694 |
Koninklijke Philips Electronics NV (NY Shares) | 578,800 | | 21,751,304 |
Mittal Steel Co. NV | 108,100 | | 4,563,982 |
TOTAL NETHERLANDS | | 95,290,621 |
Norway - 1.9% |
Acta Holding ASA | 1,234,000 | | 6,531,247 |
Aker Kvaerner ASA | 156,200 | | 19,490,710 |
DnB Nor ASA | 687,800 | | 9,762,757 |
Schibsted ASA (B Shares) | 253,100 | | 9,052,406 |
Statoil ASA | 264,000 | | 6,997,009 |
Telenor ASA sponsored ADR | 195,900 | | 11,054,637 |
TOTAL NORWAY | | 62,888,766 |
Singapore - 0.1% |
Singapore Exchange Ltd. | 1,237,000 | | 4,598,963 |
South Africa - 0.6% |
African Bank Investments Ltd. | 1,214,900 | | 4,959,483 |
Impala Platinum Holdings Ltd. | 157,400 | | 4,133,828 |
JSE Ltd. | 708,100 | | 5,306,202 |
Sasol Ltd. sponsored ADR | 119,800 | | 4,420,620 |
TOTAL SOUTH AFRICA | | 18,820,133 |
Spain - 3.3% |
Altadis SA (Spain) | 251,900 | | 13,185,940 |
Banco Bilbao Vizcaya Argentaria SA | 1,352,700 | | 32,545,962 |
Banco Pastor SA | 374,800 | | 7,298,462 |
Banco Santander Central Hispano SA | 1,340,800 | | 25,019,328 |
Gestevision Telecinco SA | 4,177 | | 119,002 |
Telefonica SA | 1,440,380 | | 30,608,075 |
TOTAL SPAIN | | 108,776,769 |
Sweden - 0.8% |
Modern Times Group AB (MTG) (B Shares) | 152,900 | | 10,050,835 |
Telefonaktiebolaget LM Ericsson (B Shares) sponsored ADR | 374,600 | | 15,070,158 |
TOTAL SWEDEN | | 25,120,993 |
Switzerland - 8.6% |
ABB Ltd.: | | | |
(Reg.) | 2,148,790 | | 38,517,627 |
sponsored ADR | 311,100 | | 5,593,578 |
BKW FMB Energie AG | 31,373 | | 3,688,216 |
Compagnie Financiere Richemont unit | 291,416 | | 16,974,065 |
|
| Shares | | Value (Note 1) |
Credit Suisse Group (Reg.) | 131,405 | | $ 9,178,639 |
EFG International (a) | 177,230 | | 6,680,929 |
Nestle SA (Reg.) | 78,443 | | 27,864,817 |
Nobel Biocare Holding AG (Switzerland) | 53,188 | | 15,719,248 |
Novartis AG (Reg.) | 359,171 | | 20,630,782 |
Roche Holding AG (participation certificate) | 246,794 | | 44,238,475 |
Schindler Holding AG (Reg.) | 123,000 | | 7,668,895 |
Societe Generale de Surveillance Holding SA (SGS) (Reg.) | 18,325 | | 20,415,398 |
Sulzer AG (Reg.) | 11,905 | | 13,546,278 |
Swisscom AG (Reg.) | 21,277 | | 8,051,205 |
UBS AG (Reg.) | 689,702 | | 41,609,722 |
TOTAL SWITZERLAND | | 280,377,874 |
Taiwan - 0.2% |
Shin Kong Financial Holding Co. Ltd. | 4,909,000 | | 5,287,890 |
Thailand - 0.4% |
Bangkok Bank Ltd. PCL (For. Reg.) | 3,603,500 | | 11,689,774 |
United Kingdom - 21.1% |
Aegis Group PLC | 2,734,700 | | 7,498,465 |
Amvescap PLC | 781,300 | | 9,120,082 |
Anglo American PLC (United Kingdom) | 348,800 | | 17,028,416 |
AstraZeneca PLC (United Kingdom) | 331,100 | | 17,730,405 |
BAE Systems PLC | 2,041,300 | | 17,021,434 |
Barclays PLC | 818,100 | | 11,891,083 |
Benfield Group PLC | 1,671,800 | | 11,705,636 |
BG Group PLC | 1,615,700 | | 21,929,495 |
BHP Billiton PLC | 745,995 | | 13,653,685 |
BlueBay Asset Management | 432,000 | | 3,316,687 |
BP PLC | 6,558,406 | | 73,344,833 |
British Land Co. PLC | 519,700 | | 17,446,094 |
BT Group PLC | 273,600 | | 1,638,590 |
BT Group PLC sponsored ADR | 83,700 | | 5,012,793 |
Burberry Group PLC | 675,700 | | 8,542,497 |
Cable & Wireless PLC | 2,972,200 | | 9,182,947 |
Diageo PLC | 1,191,200 | | 23,618,518 |
Gallaher Group PLC sponsored ADR | 12,300 | | 1,106,385 |
GlaxoSmithKline PLC | 1,271,900 | | 33,552,722 |
Gyrus Group PLC (a) | 1,162,500 | | 8,555,130 |
HSBC Holdings PLC (United Kingdom) (Reg.) | 1,071,526 | | 19,641,072 |
Imperial Tobacco Group PLC sponsored ADR | 11,400 | | 900,942 |
Informa PLC | 919,700 | | 10,753,632 |
International Power PLC | 1,396,400 | | 10,440,554 |
Jardine Lloyd Thompson Group PLC | 1,843,173 | | 15,179,825 |
Lloyds TSB Group PLC | 524,000 | | 5,938,230 |
Man Group plc | 2,780,500 | | 28,467,649 |
Marks & Spencer Group PLC | 1,215,500 | | 17,069,028 |
Mothercare PLC | 825,300 | | 6,283,721 |
Prudential PLC | 1,702,600 | | 23,325,717 |
Reed Elsevier PLC | 2,702,800 | | 29,757,829 |
Reuters Group PLC | 4,110,900 | | 35,848,873 |
Common Stocks - continued |
| Shares | | Value (Note 1) |
United Kingdom - continued |
Reuters Group PLC sponsored ADR | 34,900 | | $ 1,822,827 |
Rio Tinto PLC (Reg.) | 152,706 | | 8,112,124 |
Royal Bank of Scotland Group PLC | 531,500 | | 20,746,519 |
Royal Dutch Shell PLC: | | | |
Class A sponsored ADR | 317,800 | | 22,497,062 |
Class B | 153,800 | | 5,471,435 |
Taylor Nelson Sofres PLC | 3,528,900 | | 13,892,169 |
Tesco PLC | 4,761,600 | | 37,722,989 |
The Weir Group PLC | 1,017,400 | | 10,640,638 |
Vodafone Group PLC | 15,149,662 | | 42,085,762 |
Xstrata PLC | 140,400 | | 7,012,001 |
TOTAL UNITED KINGDOM | | 686,506,495 |
United States of America - 0.7% |
Estee Lauder Companies, Inc. Class A (d) | 415,900 | | 16,977,038 |
Merck & Co., Inc. | 110,600 | | 4,822,160 |
TOTAL UNITED STATES OF AMERICA | | 21,799,198 |
TOTAL COMMON STOCKS (Cost $2,453,526,305) | 3,138,263,328 |
Nonconvertible Preferred Stocks - 0.3% |
| | | |
Germany - 0.3% |
Porsche AG (non-vtg.)
(Cost $7,685,783) | 6,855 | | 8,724,715 |
Money Market Funds - 5.3% |
| Shares | | Value (Note 1) |
Fidelity Cash Central Fund, 5.37% (b) | 106,327,661 | | $ 106,327,661 |
Fidelity Securities Lending Cash Central Fund, 5.38% (b)(c) | 68,259,519 | | 68,259,519 |
TOTAL MONEY MARKET FUNDS (Cost $174,587,180) | 174,587,180 |
TOTAL INVESTMENT PORTFOLIO - 102.0% (Cost $2,635,799,268) | | 3,321,575,223 |
NET OTHER ASSETS - (2.0)% | | (65,819,655) |
NET ASSETS - 100% | $ 3,255,755,568 |
Legend |
(a) Non-income producing |
(b) Affiliated fund that is available only to investment companies and other accounts managed by Fidelity Investments. The rate quoted is the annualized seven-day yield of the fund at period end. A complete unaudited listing of the fund's holdings as of its most recent quarter end is available upon request. |
(c) Investment made with cash collateral received from securities on loan. |
(d) Security or a portion of the security is on loan at period end. |
(e) Security exempt from registration under Rule 144A of the Securities Act of 1933. These securities may be resold in transactions exempt from registration, normally to qualified institutional buyers. At the end of the period, the value of these securities amounted to $1,207,800 or 0.0% of net assets. |
Affiliated Central Funds |
Information regarding fiscal year to date income earned by the Fund from investments in Fidelity Central Funds is as follows: |
Fund | Income earned |
Fidelity Cash Central Fund | $ 6,363,823 |
Fidelity Securities Lending Cash Central Fund | 2,850,920 |
Total | $ 9,214,743 |
See accompanying notes which are an integral part of the financial statements.
Annual Report
VIP Overseas Portfolio
Financial Statements
Statement of Assets and Liabilities
| December 31, 2006 |
| | |
Assets | | |
Investment in securities, at value (including securities loaned of $65,332,646) - See accompanying schedule: Unaffiliated issuers (cost $2,461,212,088) | $ 3,146,988,043 | |
Fidelity Central Funds (cost $174,587,180) | 174,587,180 | |
Total Investments (cost $2,635,799,268) | | $ 3,321,575,223 |
Foreign currency held at value (cost $473,818) | | 473,822 |
Receivable for investments sold | | 11,907,042 |
Receivable for fund shares sold | | 95,653 |
Dividends receivable | | 2,243,845 |
Interest receivable | | 382,136 |
Prepaid expenses | | 14,634 |
Other receivables | | 448,604 |
Total assets | | 3,337,140,959 |
| | |
Liabilities | | |
Payable for investments purchased | $ 8,909,168 | |
Payable for fund shares redeemed | 602,452 | |
Accrued management fee | 1,910,637 | |
Distribution fees payable | 199,112 | |
Other affiliated payables | 373,310 | |
Other payables and accrued expenses | 1,131,193 | |
Collateral on securities loaned, at value | 68,259,519 | |
Total liabilities | | 81,385,391 |
| | |
Net Assets | | $ 3,255,755,568 |
Net Assets consist of: | | |
Paid in capital | | $ 2,309,866,589 |
Undistributed net investment income | | 50,264,705 |
Accumulated undistributed net realized gain (loss) on investments and foreign currency transactions | | 210,238,563 |
Net unrealized appreciation (depreciation) on investments and assets and liabilities in foreign currencies | | 685,385,711 |
Net Assets | | $ 3,255,755,568 |
Statement of Assets and Liabilities - continued
| December 31, 2006 |
| | |
Initial Class:
Net Asset Value, offering price and redemption price per share ($1,624,901,402 ÷ 67,805,282 shares) | | $ 23.96 |
| | |
Service Class:
Net Asset Value, offering price and redemption price per share ($362,059,669 ÷ 15,175,359 shares) | | $ 23.86 |
| | |
Service Class 2:
Net Asset Value, offering price and redemption price per share ($703,421,056 ÷ 29,622,780 shares) | | $ 23.75 |
| | |
Initial Class R:
Net Asset Value, offering price and redemption price per share ($240,692,745 ÷ 10,060,860 shares) | | $ 23.92 |
| | |
| | |
Service Class R:
Net Asset Value, offering price and redemption price per share ($133,933,774 ÷ 5,620,715 shares) | | $ 23.83 |
| | |
Service Class 2R:
Net Asset Value, offering price and redemption price per share ($68,728,514 ÷ 2,911,382 shares) | | $ 23.61 |
| | |
Investor Class R:
Net Asset Value, offering price and redemption price per share ($122,018,408 ÷ 5,103,196 shares) | | $ 23.91 |
See accompanying notes which are an integral part of the financial statements.
VIP Overseas Portfolio
Statement of Operations
| Year ended December 31, 2006 |
| | |
Investment Income | | |
Dividends | | $ 73,555,182 |
Interest | | 75,697 |
Income from Fidelity Central Funds (including $2,850,920 from security lending) | | 9,214,743 |
| | 82,845,622 |
Less foreign taxes withheld | | (5,548,559) |
Total income | | 77,297,063 |
| | |
Expenses | | |
Management fee | $ 21,497,437 | |
Transfer agent fees | 2,153,778 | |
Distribution fees | 2,132,831 | |
Accounting and security lending fees | 1,400,014 | |
Custodian fees and expenses | 792,092 | |
Independent trustees' compensation | 11,016 | |
Appreciation in deferred trustee compensation account | 4,547 | |
Audit | 81,435 | |
Legal | 63,928 | |
Miscellaneous | 673,246 | |
Total expenses before reductions | 28,810,324 | |
Expense reductions | (2,257,767) | 26,552,557 |
Net investment income (loss) | | 50,744,506 |
Realized and Unrealized Gain (Loss) Net realized gain (loss) on: | | |
Investment securities: | | |
Unaffiliated issuers (net of foreign taxes of $633,524) | 381,144,858 | |
Foreign currency transactions | 75,904 | |
Total net realized gain (loss) | | 381,220,762 |
Change in net unrealized appreciation (depreciation) on: Investment securities (net of increase in deferred foreign taxes of $138,498) | 68,354,343 | |
Assets and liabilities in foreign currencies | 71,637 | |
Total change in net unrealized appreciation (depreciation) | | 68,425,980 |
Net gain (loss) | | 449,646,742 |
Net increase (decrease) in net assets resulting from operations | | $ 500,391,248 |
Statement of Changes in Net Assets
| Year ended
December 31, 2006 | Year ended
December 31, 2005 |
Increase (Decrease) in Net Assets | | |
Operations | | |
Net investment income (loss) | $ 50,744,506 | $ 24,787,096 |
Net realized gain (loss) | 381,220,762 | 344,848,271 |
Change in net unrealized appreciation (depreciation) | 68,425,980 | 65,476,773 |
Net increase (decrease) in net assets resulting
from operations | 500,391,248 | 435,112,140 |
Distributions to shareholders from net investment income | (24,249,132) | (14,837,058) |
Distributions to shareholders from net realized gain | (17,825,284) | (12,260,637) |
Total distributions | (42,074,416) | (27,097,695) |
Share transactions - net increase (decrease) | 37,019,715 | (27,675,205) |
Redemption fees | 70,975 | 31,974 |
Total increase (decrease) in net assets | 495,407,522 | 380,371,214 |
| | |
Net Assets | | |
Beginning of period | 2,760,348,046 | 2,379,976,832 |
End of period (including undistributed net investment income of $50,264,705 and undistributed net investment income of $24,125,361, respectively) | $ 3,255,755,568 | $ 2,760,348,046 |
See accompanying notes which are an integral part of the financial statements.
Annual Report
Financial Highlights - Initial Class
Years ended December 31, | 2006 | 2005 | 2004 | 2003 | 2002 |
Selected Per-Share Data | | | | | |
Net asset value, beginning of period | $ 20.60 | $ 17.51 | $ 15.59 | $ 10.98 | $ 13.88 |
Income from Investment Operations | | | | | |
Net investment income (loss) C | .38 | .20 | .13 | .11 | .10 |
Net realized and unrealized gain (loss) | 3.30 | 3.10 | 1.97 | 4.60 | (2.90) |
Total from investment operations | 3.68 | 3.30 | 2.10 | 4.71 | (2.80) |
Distributions from net investment income | (.19) | (.12) | (.18) | (.10) | (.10) |
Distributions from net realized gain | (.13) | (.09) | - | - | - |
Total distributions | (.32) | (.21) | (.18) | (.10) | (.10) |
Redemption fees added to paid in capital C,G | - | - | - | - | - |
Net asset value, end of period | $ 23.96 | $ 20.60 | $ 17.51 | $ 15.59 | $ 10.98 |
Total Return A,B | 18.09% | 19.06% | 13.57% | 43.37% | (20.28)% |
Ratios to Average Net Assets D,F | | | | | |
Expenses before reductions | .88% | .89% | .91% | .90% | .90% |
Expenses net of fee waivers, if any | .88% | .89% | .91% | .90% | .90% |
Expenses net of all reductions | .81% | .82% | .87% | .86% | .86% |
Net investment income (loss) | 1.76% | 1.11% | .80% | .87% | .79% |
Supplemental Data | | | | | |
Net assets, end of period (000 omitted) | $ 1,624,901 | $ 1,549,179 | $ 1,491,485 | $ 1,436,137 | $ 1,031,489 |
Portfolio turnover rate E | 123% | 92% | 84% | 99% | 77% |
A Total returns do not reflect charges attributable to your insurance company's separate account. Inclusion of these charges would reduce the total returns shown.
B Total returns would have been lower had certain expenses not been reduced during the periods shown.
C Calculated based on average shares outstanding during the period.
D Fees and expenses of the underlying Fidelity Central Funds are not included in the Fund's expense ratio. The Fund indirectly bears its proportionate share of the expenses of any underlying Fidelity Central Funds.
E Amount does not include the portfolio activity of any underlying Fidelity Central Funds.
F Expense ratios reflect operating expenses of the class. Expenses before reductions do not reflect amounts reimbursed by the investment adviser or reductions from brokerage service arrangements or other expense offset arrangements and do not represent the amount paid by the class during periods when reimbursements or reductions occur. Expenses net of fee waivers reflect expenses after reimbursement by the investment adviser but prior to reductions from brokerage service arrangements or other expense offset arrangements. Expenses net of all reductions represent the net expenses paid by the class.
G Amount represents less than $.01 per share.
Financial Highlights - Service Class
Years ended December 31, | 2006 | 2005 | 2004 | 2003 | 2002 |
Selected Per-Share Data | | | | | |
Net asset value, beginning of period | $ 20.52 | $ 17.44 | $ 15.53 | $ 10.94 | $ 13.83 |
Income from Investment Operations | | | | | |
Net investment income (loss) C | .36 | .18 | .11 | .09 | .09 |
Net realized and unrealized gain (loss) | 3.28 | 3.09 | 1.97 | 4.59 | (2.89) |
Total from investment operations | 3.64 | 3.27 | 2.08 | 4.68 | (2.80) |
Distributions from net investment income | (.17) | (.10) | (.17) | (.09) | (.09) |
Distributions from net realized gain | (.13) | (.09) | - | - | - |
Total distributions | (.30) | (.19) | (.17) | (.09) | (.09) |
Redemption fees added to paid in capital C,G | - | - | - | - | - |
Net asset value, end of period | $ 23.86 | $ 20.52 | $ 17.44 | $ 15.53 | $ 10.94 |
Total Return A,B | 17.95% | 18.97% | 13.49% | 43.20% | (20.34)% |
Ratios to Average Net Assets D,F | | | | | |
Expenses before reductions | .98% | .99% | 1.01% | 1.00% | 1.00% |
Expenses net of fee waivers, if any | .98% | .99% | 1.01% | 1.00% | 1.00% |
Expenses net of all reductions | .91% | .92% | .97% | .96% | .96% |
Net investment income (loss) | 1.66% | 1.02% | .69% | .77% | .69% |
Supplemental Data | | | | | |
Net assets, end of period (000 omitted) | $ 362,060 | $ 329,759 | $ 322,649 | $ 246,632 | $ 177,322 |
Portfolio turnover rate E | 123% | 92% | 84% | 99% | 77% |
A Total returns do not reflect charges attributable to your insurance company's separate account. Inclusion of these charges would reduce the total returns shown.
B Total returns would have been lower had certain expenses not been reduced during the periods shown.
C Calculated based on average shares outstanding during the period.
D Fees and expenses of the underlying Fidelity Central Funds are not included in the Fund's expense ratio. The Fund indirectly bears its proportionate share of the expenses of any underlying Fidelity Central Funds.
E Amount does not include the portfolio activity of any underlying Fidelity Central Funds.
F Expense ratios reflect operating expenses of the class. Expenses before reductions do not reflect amounts reimbursed by the investment adviser or reductions from brokerage service arrangements or other expense offset arrangements and do not represent the amount paid by the class during periods when reimbursements or reductions occur. Expenses net of fee waivers reflect expenses after reimbursement by the investment adviser but prior to reductions from brokerage service arrangements or other expense offset arrangements. Expenses net of all reductions represent the net expenses paid by the class.
G Amount represents less than $.01 per share.
See accompanying notes which are an integral part of the financial statements.
VIP Overseas Portfolio
Financial Highlights - Service Class 2
Years ended December 31, | 2006 | 2005 | 2004 | 2003 | 2002 |
Selected Per-Share Data | | | | | |
Net asset value, beginning of period | $ 20.43 | $ 17.39 | $ 15.50 | $ 10.90 | $ 13.81 |
Income from Investment Operations | | | | | |
Net investment income (loss) C | .33 | .14 | .08 | .08 | .07 |
Net realized and unrealized gain (loss) | 3.27 | 3.08 | 1.97 | 4.58 | (2.88) |
Total from investment operations | 3.60 | 3.22 | 2.05 | 4.66 | (2.81) |
Distributions from net investment income | (.15) | (.09) | (.16) | (.06) | (.10) |
Distributions from net realized gain | (.13) | (.09) | - | - | - |
Total distributions | (.28) | (.18) | (.16) | (.06) | (.10) |
Redemption fees added to paid in capital C,G | - | - | - | - | - |
Net asset value, end of period | $ 23.75 | $ 20.43 | $ 17.39 | $ 15.50 | $ 10.90 |
Total Return A,B | 17.83% | 18.72% | 13.31% | 43.04% | (20.46)% |
Ratios to Average Net Assets D,F | | | | | |
Expenses before reductions | 1.13% | 1.14% | 1.16% | 1.16% | 1.16% |
Expenses net of fee waivers, if any | 1.13% | 1.14% | 1.16% | 1.16% | 1.16% |
Expenses net of all reductions | 1.06% | 1.07% | 1.12% | 1.12% | 1.12% |
Net investment income (loss) | 1.51% | .79% | .54% | .61% | .53% |
Supplemental Data | | | | | |
Net assets, end of period (000 omitted) | $ 703,421 | $ 502,801 | $ 319,708 | $ 140,822 | $ 47,824 |
Portfolio turnover rate E | 123% | 92% | 84% | 99% | 77% |
A Total returns do not reflect charges attributable to your insurance company's separate account. Inclusion of these charges would reduce the total returns shown.
B Total returns would have been lower had certain expenses not been reduced during the periods shown.
C Calculated based on average shares outstanding during the period.
D Fees and expenses of the underlying Fidelity Central Funds are not included in the Fund's expense ratio. The Fund indirectly bears its proportionate share of the expenses of any underlying Fidelity Central Funds.
E Amount does not include the portfolio activity of any underlying Fidelity Central Funds.
F Expense ratios reflect operating expenses of the class. Expenses before reductions do not reflect amounts reimbursed by the investment adviser or reductions from brokerage service arrangements or other expense offset arrangements and do not represent the amount paid by the class during periods when reimbursements or reductions occur. Expenses net of fee waivers reflect expenses after reimbursement by the investment adviser but prior to reductions from brokerage service arrangements or other expense offset arrangements. Expenses net of all reductions represent the net expenses paid by the class.
G Amount represents less than $.01 per share.
Financial Highlights - Initial Class R
Years ended December 31, | 2006 | 2005 | 2004 | 2003 | 2002 H |
Selected Per-Share Data | | | | | |
Net asset value, beginning of period | $ 20.57 | $ 17.49 | $ 15.57 | $ 10.98 | $ 14.05 |
Income from Investment Operations | | | | | |
Net investment income (loss) E | .38 | .19 | .12 | .11 | .06 |
Net realized and unrealized gain (loss) | 3.29 | 3.10 | 1.98 | 4.59 | (3.13) |
Total from investment operations | 3.67 | 3.29 | 2.10 | 4.70 | (3.07) |
Distributions from net investment income | (.19) | (.12) | (.18) | (.11) | - |
Distributions from net realized gain | (.13) | (.09) | - | - | - |
Total distributions | (.32) | (.21) | (.18) | (.11) | - |
Redemption fees added to paid in capital E,J | - | - | - | - | - |
Net asset value, end of period | $ 23.92 | $ 20.57 | $ 17.49 | $ 15.57 | $ 10.98 |
Total Return B,C,D | 18.08% | 19.05% | 13.59% | 43.32% | (21.85)% |
Ratios to Average Net Assets F,I | | | | | |
Expenses before reductions | .88% | .89% | .91% | .90% | .91% A |
Expenses net of fee waivers, if any | .88% | .89% | .91% | .90% | .91% A |
Expenses net of all reductions | .81% | .82% | .87% | .86% | .87% A |
Net investment income (loss) | 1.76% | 1.08% | .79% | .87% | .79% A |
Supplemental Data | | | | | |
Net assets, end of period (000 omitted) | $ 240,693 | $ 184,245 | $ 132,064 | $ 39,466 | $ 15,649 |
Portfolio turnover rate G | 123% | 92% | 84% | 99% | 77% |
A Annualized
B Total returns for periods of less than one year are not annualized.
C Total returns do not reflect charges attributable to your insurance company's separate account. Inclusion of these charges would reduce the total returns shown.
D Total returns would have been lower had certain expenses not been reduced during the periods shown.
E Calculated based on average shares outstanding during the period.
F Fees and expenses of the underlying Fidelity Central Funds are not included in the Fund's expense ratio. The Fund indirectly bears its proportionate share of the expenses of any underlying Fidelity Central Funds.
G Amount does not include the portfolio activity of any underlying Fidelity Central Funds.
H For the period April 24, 2002 (commencement of sale of shares) to December 31, 2002.
I Expense ratios reflect operating expenses of the class. Expenses before reductions do not reflect amounts reimbursed by the investment adviser or reductions from brokerage service arrangements or other expense offset arrangements and do not represent the amount paid by the class during periods when reimbursements or reductions occur. Expense ratios before reductions for start-up periods may not be representative of longer-term operating periods. Expenses net of fee waivers reflect expenses after reimbursement by the investment adviser but prior to reductions from brokerage service arrangements or other expense offset arrangements. Expenses net of all reductions represent the net expenses paid by the class.
J Amount represents less than $.01 per share.
See accompanying notes which are an integral part of the financial statements.
Annual Report
Financial Highlights - Service Class R
Years ended December 31, | 2006 | 2005 | 2004 | 2003 | 2002 H |
Selected Per-Share Data | | | | | |
Net asset value, beginning of period | $ 20.50 | $ 17.43 | $ 15.52 | $ 10.94 | $ 14.01 |
Income from Investment Operations | | | | | |
Net investment income (loss) E | .36 | .17 | .11 | .10 | .05 |
Net realized and unrealized gain (loss) | 3.27 | 3.09 | 1.97 | 4.58 | (3.12) |
Total from investment operations | 3.63 | 3.26 | 2.08 | 4.68 | (3.07) |
Distributions from net investment income | (.17) | (.10) | (.17) | (.10) | - |
Distributions from net realized gain | (.13) | (.09) | - | - | - |
Total distributions | (.30) | (.19) | (.17) | (.10) | - |
Redemption fees added to paid in capital E,J | - | - | - | - | - |
Net asset value, end of period | $ 23.83 | $ 20.50 | $ 17.43 | $ 15.52 | $ 10.94 |
Total Return B,C,D | 17.95% | 18.92% | 13.50% | 43.25% | (21.91)% |
Ratios to Average Net Assets F,I | | | | | |
Expenses before reductions | .98% | .99% | 1.01% | 1.00% | 1.01% A |
Expenses net of fee waivers, if any | .98% | .99% | 1.01% | 1.00% | 1.01% A |
Expenses net of all reductions | .91% | .92% | .96% | .96% | .97% A |
Net investment income (loss) | 1.66% | .96% | .70% | .77% | .69% A |
Supplemental Data | | | | | |
Net assets, end of period (000 omitted) | $ 133,934 | $ 115,449 | $ 86,509 | $ 56,141 | $ 17,997 |
Portfolio turnover rate G | 123% | 92% | 84% | 99% | 77% |
A Annualized
B Total returns for periods of less than one year are not annualized.
C Total returns do not reflect charges attributable to your insurance company's separate account. Inclusion of these charges would reduce the total returns shown.
D Total returns would have been lower had certain expenses not been reduced during the periods shown.
E Calculated based on average shares outstanding during the period.
F Fees and expenses of the underlying Fidelity Central Funds are not included in the Fund's expense ratio. The Fund indirectly bears its proportionate share of the expenses of any underlying Fidelity Central Funds.
G Amount does not include the portfolio activity of any underlying Fidelity Central Funds.
H For the period April 24, 2002 (commencement of sale of shares) to December 31, 2002.
I Expense ratios reflect operating expenses of the class. Expenses before reductions do not reflect amounts reimbursed by the investment adviser or reductions from brokerage service arrangements or other expense offset arrangements and do not represent the amount paid by the class during periods when reimbursements or reductions occur. Expense ratios before reductions for start-up periods may not be representative of longer-term operating periods. Expenses net of fee waivers reflect expenses after reimbursement by the investment adviser but prior to reductions from brokerage service arrangements or other expense offset arrangements. Expenses net of all reductions represent the net expenses paid by the class.
J Amount represents less than $.01 per share.
Financial Highlights - Service Class 2R
Years ended December 31, | 2006 | 2005 | 2004 | 2003 | 2002 H |
Selected Per-Share Data | | | | | |
Net asset value, beginning of period | $ 20.32 | $ 17.30 | $ 15.42 | $ 10.90 | $ 13.96 |
Income from Investment Operations | | | | | |
Net investment income (loss) E | .32 | .14 | .08 | .08 | .04 |
Net realized and unrealized gain (loss) | 3.26 | 3.07 | 1.96 | 4.55 | (3.10) |
Total from investment operations | 3.58 | 3.21 | 2.04 | 4.63 | (3.06) |
Distributions from net investment income | (.16) | (.10) | (.16) | (.11) | - |
Distributions from net realized gain | (.13) | (.09) | - | - | - |
Total distributions | (.29) | (.19) | (.16) | (.11) | - |
Redemption fees added to paid in capital E,J | - | - | - | - | - |
Net asset value, end of period | $ 23.61 | $ 20.32 | $ 17.30 | $ 15.42 | $ 10.90 |
Total Return B,C,D | 17.81% | 18.74% | 13.32% | 43.00% | (21.92)% |
Ratios to Average Net Assets F,I | | | | | |
Expenses before reductions | 1.13% | 1.14% | 1.16% | 1.15% | 1.17% A |
Expenses net of fee waivers, if any | 1.13% | 1.14% | 1.16% | 1.15% | 1.17% A |
Expenses net of all reductions | 1.06% | 1.07% | 1.11% | 1.11% | 1.14% A |
Net investment income (loss) | 1.51% | .77% | .55% | .62% | .52% A |
Supplemental Data | | | | | |
Net assets, end of period (000 omitted) | $ 68,729 | $ 49,373 | $ 27,562 | $ 7,072 | $ 1,616 |
Portfolio turnover rate G | 123% | 92% | 84% | 99% | 77% |
A Annualized
B Total returns for periods of less than one year are not annualized.
C Total returns do not reflect charges attributable to your insurance company's separate account. Inclusion of these charges would reduce the total returns shown.
D Total returns would have been lower had certain expenses not been reduced during the periods shown.
E Calculated based on average shares outstanding during the period.
F Fees and expenses of the underlying Fidelity Central Funds are not included in the Fund's expense ratio. The Fund indirectly bears its proportionate share of the expenses of any underlying Fidelity Central Funds.
G Amount does not include the portfolio activity of any underlying Fidelity Central Funds.
H For the period April 24, 2002 (commencement of sale of shares) to December 31, 2002.
I Expense ratios reflect operating expenses of the class. Expenses before reductions do not reflect amounts reimbursed by the investment adviser or reductions from brokerage service arrangements or other expense offset arrangements and do not represent the amount paid by the class during periods when reimbursements or reductions occur. Expense ratios before reductions for start-up periods may not be representative of longer-term operating periods. Expenses net of fee waivers reflect expenses after reimbursement by the investment adviser but prior to reductions from brokerage service arrangements or other expense offset arrangements. Expenses net of all reductions represent the net expenses paid by the class.
J Amount represents less than $.01 per share.
See accompanying notes which are an integral part of the financial statements.
VIP Overseas Portfolio
Financial Highlights - Investor Class R
Years ended December 31, | 2006 | 2005 H |
Selected Per-Share Data | | |
Net asset value, beginning of period | $ 20.59 | $ 17.69 |
Income from Investment Operations | | |
Net investment income (loss) E | .36 | .02 |
Net realized and unrealized gain (loss) | 3.29 | 2.88 |
Total from investment operations | 3.65 | 2.90 |
Distributions from net investment income | (.20) | - |
Distributions from net realized gain | (.13) | - |
Total distributions | (.33) | - |
Redemption fees added to paid in capital E,J | - | - |
Net asset value, end of period | $ 23.91 | $ 20.59 |
Total Return B,C,D | 17.94% | 16.39% |
Ratios to Average Net Assets F,I | | |
Expenses before reductions | 1.01% | 1.07% A |
Expenses net of fee waivers, if any | 1.01% | 1.07% A |
Expenses net of all reductions | .93% | 1.00% A |
Net investment income (loss) | 1.64% | .23% A |
Supplemental Data | | |
Net assets, end of period (000 omitted) | $ 122,018 | $ 29,544 |
Portfolio turnover rate G | 123% | 92% |
A Annualized
B Total returns for periods of less than one year are not annualized.
C Total returns do not reflect charges attributable to your insurance company's separate account. Inclusion of these charges would reduce the total returns shown.
D Total returns would have been lower had certain expenses not been reduced during the periods shown.
E Calculated based on average shares outstanding during the period.
F Fees and expenses of the underlying Fidelity Central Funds are not included in the Fund's expense ratio. The Fund indirectly bears its proportionate share of the expenses of any underlying Fidelity Central Funds.
G Amount does not include the portfolio activity of any underlying Fidelity Central Funds.
H For the period July 21, 2005 (commencement of sale of shares) to December 31, 2005.
I Expense ratios reflect operating expenses of the class. Expenses before reductions do not reflect amounts reimbursed by the investment adviser or reductions from brokerage service arrangements or other expense offset arrangements and do not represent the amount paid by the class during periods when reimbursements or reductions occur. Expense ratios before reductions for start-up periods may not be representative of longer-term operating periods. Expenses net of fee waivers reflect expenses after reimbursement by the investment adviser but prior to reductions from brokerage service arrangements or other expense offset arrangements. Expenses net of all reductions represent the net expenses paid by the class.
J Amount represents less than $.01 per share.
See accompanying notes which are an integral part of the financial statements.
Annual Report
Notes to Financial Statements
For the period ended December 31, 2006
1. Significant Accounting Policies.
VIP Overseas Portfolio (the Fund) is a fund of Variable Insurance Products (the trust) and is authorized to issue an unlimited number of shares. The trust is registered under the Investment Company Act of 1940, as amended (the 1940 Act), as an open-end management investment company organized as a Massachusetts business trust. Shares of the Fund may only be purchased by insurance companies for the purpose of funding variable annuity or variable life insurance contracts. The Fund offers the following classes of shares: Initial Class shares, Service Class shares, Service Class 2 shares, Initial Class R shares, Service Class R shares, Service Class 2R shares, and Investor Class R shares. All classes have equal rights and voting privileges, except for matters affecting a single class. Investment income, realized and unrealized capital gains and losses, the common expenses of the Fund, and certain fund-level expense reductions, if any, are allocated on a pro rata basis to each class based on the relative net assets of each class to the total net assets of the Fund. Each class differs with respect to transfer agent and distribution and service plan fees incurred. Certain expense reductions also differ by class.
The Fund's investments in emerging markets can be subject to social, economic, regulatory, and political uncertainties and can be extremely volatile. The Fund may invest in Fidelity Central Funds which are open-end investment companies available to investment companies and other accounts managed by Fidelity Management & Research Company (FMR) and its affiliates. The financial statements have been prepared in conformity with accounting principles generally accepted in the United States of America, which require management to make certain estimates and assumptions at the date of the financial statements. The following summarizes the significant accounting policies of the Fund, which are also consistently followed by the Fidelity Central Funds:
Security Valuation. Investments are valued and net asset value (NAV) per share is calculated (NAV calculation) as of the close of business of the New York Stock Exchange (NYSE), normally 4:00 p.m. Eastern time. Wherever possible, the Fund uses independent pricing services approved by the Board of Trustees to value its investments.
Equity securities, including restricted securities, for which market quotations are readily available, are valued at the last reported sale price or official closing price as reported by an independent pricing service on the primary market or exchange on which they are traded. In the event there were no sales during the day or closing prices are not available, securities are valued at the last quoted bid price. Debt securities, including restricted securities, for which quotations are readily available, are valued by independent pricing services or by dealers who make markets in such securities. Pricing services consider yield or price of bonds of comparable quality, coupon, maturity and type as well as dealer supplied prices. Investments in open-end mutual funds, including the Fidelity Central Funds, are valued at their closing net asset value each business day. Short-term securities with remaining maturities of sixty days or less for which quotations are not readily available are valued at amortized cost, which approximates value.
When current market prices or quotations are not readily available or do not accurately reflect fair value, valuations may be determined in accordance with procedures adopted by the Board of Trustees. For example, when developments occur between the close of a market and the close of the NYSE that may materially affect the value of some or all of the securities, or when trading in a security is halted, those securities may be fair valued. Factors used in the determination of fair value may include monitoring news to identify significant market or security specific events such as changes in the value of U.S. securities markets, reviewing developments in foreign markets and evaluating the performance of ADRs, futures contracts and exchange-traded funds. Because the Fund's utilization of fair value pricing depends on market activity, the frequency with which fair value pricing is used can not be predicted and may be utilized to a significant extent. The value of securities used for NAV calculation under fair value pricing may differ from published prices for the same securities.
Foreign Currency. The Fund uses foreign currency contracts to facilitate transactions in foreign-denominated securities. Losses from these transactions may arise from changes in the value of the foreign currency or if the counterparties do not perform under the contracts' terms.
Foreign-denominated assets, including investment securities, and liabilities are translated into U.S. dollars at the exchange rate at period end. Purchases and sales of investment securities, income and dividends received and expenses denominated in foreign currencies are translated into U.S. dollars at the exchange rate in effect on the transaction date.
The effects of exchange rate fluctuations on investments are included with the net realized and unrealized gain (loss) on investment securities. Other foreign currency transactions resulting in realized and unrealized gain (loss) are disclosed separately.
Investment Transactions and Income. Security transactions, including the Fund's investment activity in the Fidelity Central Funds, are accounted for as of trade date. Gains and losses on securities sold are determined on the basis of identified cost and may include proceeds received from litigation. Dividend income is recorded on the ex-dividend date, except for certain dividends from foreign securities where the ex-dividend date may have passed, which are recorded as soon as the Fund is informed of the ex-dividend date. Non-cash dividends included in dividend income, if any, are recorded at the fair market value of the securities received. Distributions received on securities that represent a return of capital or capital gain are recorded as a reduction of cost of investments and/or as a realized gain. The Fund estimates the components of distributions received that may be considered return of capital distributions or capital gain distributions. Interest income and income distributions from the Fidelity Central Funds are accrued as earned,
VIP Overseas Portfolio
1. Significant Accounting Policies - continued
Investment Transactions and Income - continued
with any income distributions receivable as of period end included in Interest Receivable on the Statement of Assets and Liabilities. Interest income includes coupon interest and amortization of premium and accretion of discount on debt securities. Investment income is recorded net of foreign taxes withheld where recovery of such taxes is uncertain.
Expenses. Most expenses of the trust can be directly attributed to a fund. Expenses which cannot be directly attributed are apportioned among each Fund in the trust. Expense estimates are accrued in the period to which they relate and adjustments are made when actual amounts are known.
Deferred Trustee Compensation. Under a Deferred Compensation Plan (the Plan), Independent Trustees must defer receipt of a portion of, and may elect to defer receipt of an additional portion of, their annual compensation. Deferred amounts are invested in a cross-section of Fidelity funds, are marked-to-market and remain in the Fund until distributed in accordance with the Plan. The investment of deferred amounts and the offsetting payable to the Trustees are included in the accompanying Statement of Assets and Liabilities.
Income Tax Information and Distributions to Shareholders. Each year, the Fund intends to qualify as a regulated investment company by distributing all of its taxable income and realized gains under Subchapter M of the Internal Revenue Code. As a result, no provision for income taxes is required in the accompanying financial statements. Foreign taxes are provided for based on the Fund's understanding of the tax rules and rates that exist in the foreign markets in which it invests.
Distributions are recorded on the ex-dividend date. Income dividends and capital gain distributions are declared separately for each class. Income and capital gain distributions are determined in accordance with income tax regulations, which may differ from generally accepted accounting principles.
Capital accounts within the financial statements are adjusted for permanent book-tax differences. These adjustments have no impact on net assets or the results of operations. Temporary book-tax differences will reverse in a subsequent period.
Book-tax differences are primarily due to certain foreign taxes, foreign currency transactions, passive foreign investment companies (PFIC), deferred trustee expenses, capital loss carryforwards and losses deferred due to wash sales.
The tax-basis components of distributable earnings and the federal tax cost as of period end were as follows:
Unrealized appreciation | $ 706,737,702 |
Unrealized depreciation | (35,151,851) |
Net unrealized appreciation (depreciation) | 671,585,851 |
Undistributed ordinary income | 49,691,784 |
Undistributed long-term capital gain | 224,671,947 |
| |
Cost for federal income tax purposes | $ 2,649,989,372 |
The tax character of distributions paid was as follows:
| December 31, 2006 | December 31, 2005 |
Ordinary Income | $ 42,074,416 | $ 27,097,695 |
Trading (Redemption) Fees. Initial Class R shares, Service Class R shares, Service Class 2R shares, and Investor Class R shares held less than 60 days are subject to a redemption fee equal to 1% of the proceeds of the redeemed shares. All redemption fees, including any estimated redemption fees paid by FMR, are retained by the Fund and accounted for as an addition to paid in capital.
New Accounting Pronouncements. In July 2006, Financial Accounting Standards Board Interpretation No. 48, Accounting for Uncertainty in Income Taxes - an interpretation of FASB Statement 109 (FIN 48), was issued and is effective on the last business day of the semiannual reporting period for fiscal years beginning after December 15, 2006. FIN 48 sets forth a threshold for financial statement recognition, measurement and disclosure of a tax position taken or expected to be taken on a tax return. Management is currently evaluating the impact, if any, the adoption of FIN 48 will have on the Fund's net assets, results of operations and financial statement disclosures.
In addition, in September 2006, Statement of Financial Accounting Standards No. 157, Fair Value Measurements (SFAS 157), was issued and is effective for fiscal years beginning after November 15, 2007. SFAS 157 defines fair value, establishes a framework for measuring fair value and expands disclosures about fair value measurements. Management is currently evaluating the impact the adoption of SFAS 157 will have on the Fund's financial statement disclosures.
Annual Report
Notes to Financial Statements - continued
2. Operating Policies.
Repurchase Agreements. FMR has received an Exemptive Order from the Securities and Exchange Commission (the SEC) which permits the Fund and other affiliated entities of FMR to transfer uninvested cash balances into joint trading accounts which are then invested in repurchase agreements. The Fund may also invest directly with institutions in repurchase agreements. Repurchase agreements are collateralized by government or non-government securities. Upon settlement date, collateral is held in segregated accounts with custodian banks and may be obtained in the event of a default of the counterparty. The Fund monitors, on a daily basis, the value of the collateral to ensure it is at least equal to the principal amount of the repurchase agreement (including accrued interest). In the event of a default by the counterparty, realization of the collateral proceeds could be delayed, during which time the value of the collateral may decline.
Restricted Securities. The Fund may invest in securities that are subject to legal or contractual restrictions on resale. These securities generally may be resold in transactions exempt from registration or to the public if the securities are registered. Disposal of these securities may involve time-consuming negotiations and expense, and prompt sale at an acceptable price may be difficult. Information regarding restricted securities is included at the end of the Fund's Schedule of Investments.
3. Purchases and Sales of Investments.
Purchases and sales of securities, other than short-term securities, aggregated $3,647,565,647 and $3,565,361,526, respectively.
4. Fees and Other Transactions with Affiliates.
Management Fee. FMR and its affiliates provide the Fund with investment management related services for which the Fund pays a monthly management fee. The management fee is the sum of an individual fund fee rate that is based on an annual rate of .45% of the Fund's average net assets and a group fee rate that averaged .27% during the period. The group fee rate is based upon the average net assets of all the mutual funds advised by FMR. The group fee rate decreases as assets under management increase and increases as assets under management decrease. For the period, the total annual management fee rate was .72% of the Fund's average net assets.
Distribution and Service Plan. In accordance with Rule 12b-1 of the 1940 Act, the Fund has adopted separate 12b-1 Plans for each Service Class of shares. Each Service Class pays Fidelity Distributors Corporation (FDC), an affiliate of FMR, a service fee. For the period, the service fee is based on an annual rate of .10% of Service Class' and Service Class R's average net assets and .25% of Service Class 2's and Service Class 2R's average net assets.
For the period, each class paid FDC the following amounts, all of which were re-allowed to insurance companies for the distribution of shares and providing shareholder support services:
Service Class | $ 342,279 |
Service Class 2 | 1,510,257 |
Service Class R | 129,525 |
Service Class 2R | 150,770 |
| $ 2,132,831 |
Transfer Agent Fees. Fidelity Investments Institutional Operations Company, Inc. (FIIOC), an affiliate of FMR, is the fund's transfer, dividend disbursing, and shareholder servicing agent. FIIOC receives an asset-based fee with respect to each class. Each class with the exception of Investor Class R pays a transfer agent fee, excluding out of pocket expenses, equal to an annual rate of .07% of their month end net assets. Investor Class R pays a monthly asset-based transfer agent fee of .18% of its month end net assets. The total transfer agent fees paid by each class to FIIOC, including out of pocket expenses, were as follows:
Initial Class | $ 1,069,408 |
Service Class | 232,658 |
Service Class 2 | 414,570 |
Initial Class R | 153,209 |
Service Class R | 86,391 |
Service Class 2R | 40,534 |
Investor Class R | 157,008 |
| $ 2,153,778 |
Accounting and Security Lending Fees. Fidelity Service Company, Inc. (FSC), an affiliate of FMR, maintains the Fund's accounting records. The accounting fee is based on the level of average net assets for the month. Under a separate contract, FSC administers the security lending program. The security lending fee is based on the number and duration of lending transactions.
VIP Overseas Portfolio
4. Fees and Other Transactions with Affiliates - continued
Investments in Fidelity Central Funds. The Fund may invest in Fidelity Central Funds. The Fund's Schedule of Investments lists each of the Fidelity Central Funds as an investment of the Fund but does not include the underlying holdings of each Fidelity Central Fund. As an Investing Fund, the Fund indirectly bears its proportionate share of the expenses of the underlying Fidelity Central Funds. A complete unaudited list of holdings for each Fidelity Central Fund is available upon request. In addition, the financial statements of the Fidelity Central Funds, which are not covered by the Fund's Report of Independent Registered Public Accounting Firm, are available on the EDGAR Database on the SEC's web site, www.sec.gov, or upon request.
The Money Market Central Funds seek preservation of capital and current income and are managed by Fidelity Investments Money Management, Inc. (FIMM), an affiliate of FMR.
Brokerage Commissions. The Fund placed a portion of its portfolio transactions with brokerage firms which are affiliates of the investment adviser. The commissions paid to these affiliated firms were $736 for the period.
5. Committed Line of Credit.
The Fund participates with other funds managed by FMR in a $4.2 billion credit facility (the "line of credit") to be utilized for temporary or emergency purposes to fund shareholder redemptions or for other short-term liquidity purposes. The Fund has agreed to pay commitment fees on its pro rata portion of the line of credit, which amounted to $7,913 and is reflected in Miscellaneous Expense on the Statement of Operations. During the period, there were no borrowings on this line of credit.
6. Security Lending.
The Fund lends portfolio securities from time to time in order to earn additional income. On the settlement date of the loan, the Fund receives collateral (in the form of U.S. Treasury obligations, letters of credit and/or cash) against the loaned securities and maintains collateral in an amount not less than 100% of the market value of the loaned securities during the period of the loan. The market value of the loaned securities is determined at the close of business of the Fund and any additional required collateral is delivered to the Fund on the next business day. If the borrower defaults on its obligation to return the securities loaned because of insolvency or other reasons, a fund could experience delays and costs in recovering the securities loaned or in gaining access to the collateral. Any cash collateral received is invested in the Fidelity Securities Lending Cash Central Fund. The value of loaned securities and cash collateral at period end are disclosed on the Fund's Statement of Assets and Liabilities. Security lending income represents the income earned on investing cash collateral, less fees and expenses associated with the loan, plus any premium payments that may be received on the loan of certain types of securities. Security lending income is presented in the Statement of Operations as a component of income from Fidelity Central Funds.
7. Expense Reductions.
Many of the brokers with whom FMR places trades on behalf of the Fund provided services to the Fund in addition to trade execution. These services included payments of certain expenses on behalf of the Fund totaling $2,205,967 for the period. In addition, through arrangements with the fund's custodian, credits realized as a result of uninvested cash balances were used to reduce the Fund's expenses. During the period, these credits reduced the Fund's custody expense by $7,301.
8. Other.
The Fund's organizational documents provide former and current trustees and officers with a limited indemnification against liabilities arising in connection with the performance of their duties to the Fund. In the normal course of business, the Fund may also enter into contracts that provide general indemnifications. The Fund's maximum exposure under these arrangements is unknown as this would be dependent on future claims that may be made against the Fund. The risk of material loss from such claims is considered remote.
At the end of the period, FMR or its affiliates were the owner of record of 14% of the total outstanding shares of the Fund and two otherwise unaffiliated shareholders were the owners of record of 38% of the total outstanding shares of the Fund.
The United States Securities and Exchange Commission ("SEC") is conducting an investigation of FMR (covering the years 2002 to 2004) arising from gifts, gratuities and business entertainment provided by certain brokers to certain individuals who were employed on FMR's domestic equity trading desk during that period. FMR is in discussions with the SEC staff regarding the possible resolution of the matter, but as of period-end no final resolution has been reached.
In December 2006, the Independent Trustees completed their own investigation of the matter with the assistance of independent counsel. The Independent Trustees and FMR agree that, despite the absence of proof that the Fidelity mutual funds experienced diminished execution quality as a result of the improper receipt of gifts and business entertainment, the conduct at issue was serious and is worthy of redress. Accordingly, the Independent Trustees have requested and FMR has agreed to pay $42 million to Fidelity mutual funds, plus interest to be determined at the time that payment is
Annual Report
Notes to Financial Statements - continued
8. Other - continued
made. A method of allocating this payment among the funds has not yet been determined. The total payment to the Fund is not anticipated to have a material impact on the Fund's net assets. In addition, FMR reimbursed related legal expenses which are recorded in the accompanying Statement of Operations as an expense reduction.
9. Distributions to Shareholders.
Distributions to shareholders of each class were as follows:
Years ended December 31, | 2006 | 2005 |
From net investment income | | |
Initial Class | $ 14,091,669 | $ 9,625,631 |
Service Class | 2,672,527 | 1,847,002 |
Service Class 2 | 3,822,324 | 1,745,414 |
Initial Class R | 1,834,008 | 965,865 |
Service Class R | 1,035,719 | 492,968 |
Service Class 2R | 404,891 | 160,178 |
Investor Class R | 387,994 | - |
Total | $ 24,249,132 | $ 14,837,058 |
From net realized gain | | |
Initial Class | $ 9,796,346 | $ 7,533,103 |
Service Class | 2,080,411 | 1,662,302 |
Service Class 2 | 3,312,681 | 1,745,414 |
Initial Class R | 1,261,487 | 724,399 |
Service Class R | 778,286 | 443,671 |
Service Class 2R | 337,410 | 151,748 |
Investor Class R | 258,663 | - |
Total | $ 17,825,284 | $ 12,260,637 |
VIP Overseas Portfolio
10. Share Transactions.
Transactions for each class of shares were as follows:
| Shares | Dollars |
Years ended December 31, | 2006 | 2005A | 2006 | 2005A |
Initial Class | | | | |
Shares sold | 8,304,320 | 7,401,949 | $ 179,677,212 | $ 132,174,303 |
Reinvestment of distributions | 1,151,230 | 1,002,262 | 23,888,014 | 17,158,734 |
Shares redeemed | (16,836,811) | (18,372,431) | (368,119,935) | (325,484,696) |
Net increase (decrease) | (7,381,261) | (9,968,220) | $ (164,554,709) | $ (176,151,659) |
Service Class | | | | |
Shares sold | 1,974,850 | 2,681,647 | $ 42,447,696 | $ 47,720,466 |
Reinvestment of distributions | 229,833 | 205,704 | 4,752,938 | 3,509,304 |
Shares redeemed | (3,102,957) | (5,311,978) | (67,340,790) | (91,468,586) |
Net increase (decrease) | (898,274) | (2,424,627) | $ (20,140,156) | $ (40,238,816) |
Service Class 2 | | | | |
Shares sold | 7,511,166 | 7,706,445 | $ 162,864,891 | $ 135,627,664 |
Reinvestment of distributions | 346,191 | 205,102 | 7,135,005 | 3,490,828 |
Shares redeemed | (2,840,731) | (1,690,309) | (60,833,342) | (30,166,445) |
Net increase (decrease) | 5,016,626 | 6,221,238 | $ 109,166,554 | $ 108,952,047 |
Initial Class R | | | | |
Shares sold | 2,772,603 | 2,614,989 | $ 60,021,525 | $ 46,966,500 |
Reinvestment of distributions | 149,396 | 98,846 | 3,095,495 | 1,690,264 |
Shares redeemed | (1,817,333) | (1,307,426) | (39,551,862) | (22,938,002) |
Net increase (decrease) | 1,104,666 | 1,406,409 | $ 23,565,158 | $ 25,718,762 |
Service Class R | | | | |
Shares sold | 1,190,213 | 1,192,156 | $ 25,640,889 | $ 21,053,947 |
Reinvestment of distributions | 87,845 | 54,935 | 1,814,005 | 936,639 |
Shares redeemed | (1,290,192) | (578,793) | (28,107,366) | (10,225,074) |
Net increase (decrease) | (12,134) | 668,298 | $ (652,472) | $ 11,765,512 |
Service Class 2R | | | | |
Shares sold | 904,989 | 998,545 | $ 19,265,401 | $ 17,565,601 |
Reinvestment of distributions | 36,227 | 18,435 | 742,301 | 311,926 |
Shares redeemed | (459,435) | (180,588) | (9,806,715) | (3,145,256) |
Net increase (decrease) | 481,781 | 836,392 | $ 10,200,987 | $ 14,732,271 |
Investor Class R | | | | |
Shares sold | 3,992,909 | 1,438,624 | $ 86,366,168 | $ 27,620,203 |
Reinvestment of distributions | 31,194 | - | 646,657 | - |
Shares redeemed | (355,662) | (3,869) | (7,578,472) | (73,525) |
Net increase (decrease) | 3,668,441 | 1,434,755 | $ 79,434,353 | $ 27,546,678 |
A Share transactions for Investor Class R are for the period July 21, 2005 (commencement of sale of shares) to December 31, 2005.
Annual Report
Report of Independent Registered Public Accounting Firm
To the Trustees of Variable Insurance Products Fund and the Shareholders of VIP Overseas Portfolio:
In our opinion, the accompanying statement of assets and liabilities, including the schedule of investments, and the related statements of operations and of changes in net assets and the financial highlights present fairly, in all material respects, the financial position of VIP Overseas Portfolio (a fund of Variable Insurance Products Fund) at December 31, 2006, the results of its operations for the year then ended, the changes in its net assets for each of the two years in the period then ended and the financial highlights for each of the periods indicated, in conformity with accounting principles generally accepted in the United States of America. These financial statements and financial highlights (hereafter referred to as "financial statements") are the responsibility of the VIP Overseas Portfolio's management; our responsibility is to express an opinion on these financial statements based on our audits. We conducted our audits of these financial statements in accordance with the standards of the Public Company Accounting Oversight Board (United States). Those standards require that we plan and perform the audit to obtain reasonable assurance about whether the financial statements are free of material misstatement. An audit includes examining, on a test basis, evidence supporting the amounts and disclosures in the financial statements, assessing the accounting principles used and significant estimates made by management, and evaluating the overall financial statement presentation. We believe that our audits, which included confirmation of securities at December 31, 2006 by correspondence with the custodian and brokers, provide a reasonable basis for our opinion.
/s/ PricewaterhouseCoopers LLP
PricewaterhouseCoopers LLP
Boston, Massachusetts
February 13, 2007
VIP Overseas Portfolio
Trustees and Officers
The Trustees, Member of the Advisory Board, and executive officers of the trust and fund, as applicable, are listed below. The Board of Trustees governs the fund and is responsible for protecting the interests of shareholders. The Trustees are experienced executives who meet periodically throughout the year to oversee the fund's activities, review contractual arrangements with companies that provide services to the fund, and review the fund's performance. Each of the Trustees oversees 348 funds advised by FMR or an affiliate.
The Trustees hold office without limit in time except that (a) any Trustee may resign; (b) any Trustee may be removed by written instrument, signed by at least two-thirds of the number of Trustees prior to such removal; (c) any Trustee who requests to be retired or who has become incapacitated by illness or injury may be retired by written instrument signed by a majority of the other Trustees; and (d) any Trustee may be removed at any special meeting of shareholders by a two-thirds vote of the outstanding voting securities of the trust. Each Trustee who is not an interested person (as defined in the 1940 Act) (Independent Trustee), shall retire not later than the last day of the calendar year in which his or her 72nd birthday occurs. The Independent Trustees may waive this mandatory retirement age policy with respect to individual Trustees. The executive officers and Advisory Board Member hold office without limit in time, except that any officer and Advisory Board Member may resign or may be removed by a vote of a majority of the Trustees at any regular meeting or any special meeting of the Trustees. Except as indicated, each individual has held the office shown or other offices in the same company for the past five years.
The fund's Statement of Additional Information (SAI) includes more information about the Trustees. To request a free copy, call Fidelity at 1-877-208-0098.
Interested Trustees*:
Correspondence intended for each Trustee who is an interested person may be sent to Fidelity Investments, 82 Devonshire Street, Boston, Massachusetts 02109.
Name, Age; Principal Occupation |
Edward C. Johnson 3d (76) |
| Year of Election or Appointment: 1981 Mr. Johnson is Chairman of the Board of Trustees. Mr. Johnson serves as President (2006-present), Chief Executive Officer, Chairman, and a Director of FMR Corp.; Chairman and a Director of FMR; Chairman and a Director of Fidelity Research & Analysis Company (FRAC); Chairman and a Director of Fidelity Investments Money Management, Inc.; and Chairman (2001-present) and a Director of FMR Co., Inc. In addition, Mr. Johnson serves as Chairman and Director of Fidelity International Limited (FIL). |
Robert L. Reynolds (54) |
| Year of Election or Appointment: 2003 Mr. Reynolds is President and a Director of FMR (2005-present), Fidelity Investments Money Management, Inc. (2005-present), and FMR Co., Inc. (2005-present). Mr. Reynolds also serves as Vice Chairman (2006-present), a Director (2003-present), and Chief Operating Officer of FMR Corp. and a Director of Strategic Advisers, Inc. (2005-present). He also serves on the Board at Fidelity Investments Canada, Ltd. |
* Trustees have been determined to be "Interested Trustees" by virtue of, among other things, their affiliation with the trust or various entities under common control with FMR.
Independent Trustees:
Correspondence intended for each Independent Trustee (that is, the Trustees other than the Interested Trustees) may be sent to Fidelity Investments, P.O. Box 55235, Boston, Massachusetts 02205-5235.
Name, Age; Principal Occupation |
Dennis J. Dirks (58) |
| Year of Election or Appointment: 2005 Prior to his retirement in May 2003, Mr. Dirks was Chief Operating Officer and a member of the Board of The Depository Trust & Clearing Corporation (DTCC) (1999-2003). He also served as President, Chief Operating Officer, and Board member of The Depository Trust Company (DTC) (1999-2003) and President and Board member of the National Securities Clearing Corporation (NSCC) (1999-2003). In addition, Mr. Dirks served as Chief Executive Officer and Board member of the Government Securities Clearing Corporation (2001-2003) and Chief Executive Officer and Board member of the Mortgage-Backed Securities Clearing Corporation (2001-2003). Mr. Dirks also serves as a Trustee and a member of the Finance Committee of Manhattan College (2005-present) and a Trustee and a member of the Finance Committee of AHRC of Nassau County (2006-present). |
Albert R. Gamper, Jr. (64) |
| Year of Election or Appointment: 2006 Prior to his retirement in December 2004, Mr. Gamper served as Chairman of the Board of CIT Group Inc. (commercial finance). During his tenure with CIT Group Inc. Mr. Gamper served in numerous senior management positions, including Chairman (1987-1989; 1999-2001; 2002-2004), Chief Executive Officer (1987-2004), and President (1989-2002). He currently serves as a member of the Board of Directors of Public Service Enterprise Group (utilities, 2001-present), Chairman of the Board of Governors, Rutgers University (2004-present), and Chairman of the Board of Saint Barnabas Health Care System. |
George H. Heilmeier (70) |
| Year of Election or Appointment: 2004 Dr. Heilmeier is Chairman Emeritus of Telcordia Technologies (communication software and systems), where prior to his retirement, he served as company Chairman and Chief Executive Officer. He currently serves on the Boards of Directors of The Mitre Corporation (systems engineering and information technology support for the government), and HRL Laboratories (private research and development, 2004-present). He is Chairman of the General Motors Science & Technology Advisory Board and a Life Fellow of the Institute of Electrical and Electronics Engineers (IEEE). Dr. Heilmeier is a member of the Defense Science Board and the National Security Agency Advisory Board. He is also a member of the National Academy of Engineering, the American Academy of Arts and Sciences, and the Board of Overseers of the School of Engineering and Applied Science of the University of Pennsylvania. Previously, Dr. Heilmeier served as a Director of TRW Inc. (automotive, space, defense, and information technology, 1992-2002), Compaq (1994-2002), Automatic Data Processing, Inc. (ADP) (technology-based business outsourcing, 1995-2002), INET Technologies Inc. (telecommunications network surveillance, 2001-2004), and Teletech Holdings (customer management services). He is the recipient of the 2005 Kyoto Prize in Advanced Technology for his invention of the liquid crystal display, and a member of the Consumer Electronics Hall of Fame. |
James H. Keyes (66) |
| Year of Election or Appointment: 2007 Prior to his retirement in 2003, Mr. Keyes was Chairman, President, and Chief Executive Officer of Johnson Controls, Inc. (automotive supplier, 1993-2003). He currently serves as a member of the boards of LSI Logic Corporation (semiconductor technologies), Navistar International Corporation (manufacture and sale of trucks, buses, and diesel engines, 2002-present), and Pitney Bowes, Inc. (integrated mail, messaging, and document management solutions). |
Marie L. Knowles (60) |
| Year of Election or Appointment: 2001 Prior to Ms. Knowles' retirement in June 2000, she served as Executive Vice President and Chief Financial Officer of Atlantic Richfield Company (ARCO) (diversified energy, 1996-2000). From 1993 to 1996, she was a Senior Vice President of ARCO and President of ARCO Transportation Company. She served as a Director of ARCO from 1996 to 1998. She currently serves as a Director of Phelps Dodge Corporation (copper mining and manufacturing) and McKesson Corporation (healthcare service, 2002-present). Ms. Knowles is a Trustee of the Brookings Institution and the Catalina Island Conservancy and also serves as a member of the Advisory Board for the School of Engineering of the University of Southern California. |
Ned C. Lautenbach (62) |
| Year of Election or Appointment: 2000 Mr. Lautenbach is Chairman of the Independent Trustees (2006-present). Mr. Lautenbach has been a partner of Clayton, Dubilier & Rice, Inc. (private equity investment firm) since September 1998. Previously, Mr. Lautenbach was with the International Business Machines Corporation (IBM) from 1968 until his retirement in 1998. Mr. Lautenbach serves as a Director of Sony Corporation (2006-present) and Eaton Corporation (diversified industrial) as well as the Philharmonic Center for the Arts in Naples, Florida. He also is a member of the Board of Trustees of Fairfield University (2005-present), as well as a member of the Council on Foreign Relations. |
Cornelia M. Small (62) |
| Year of Election or Appointment: 2005 Ms. Small is a member (2000-present) and Chairperson (2002-present) of the Investment Committee, and a member (2002-present) of the Board of Trustees of Smith College. Previously, she served as Chief Investment Officer (1999-2000), Director of Global Equity Investments (1996-1999), and a member of the Board of Directors of Scudder, Stevens & Clark (1990-1997) and Scudder Kemper Investments (1997-1999). In addition, Ms. Small served as Co-Chair (2000-2003) of the Annual Fund for the Fletcher School of Law and Diplomacy. |
William S. Stavropoulos (67) |
| Year of Election or Appointment: 2001 Mr. Stavropoulos is Chairman Emeritus of the Board of Directors of The Dow Chemical Company. Since joining The Dow Chemical Company in 1967, Mr. Stavropoulos served in numerous senior management positions, including President (1993-2000; 2002-2003), CEO (1995-2000; 2002-2004), and Chairman of the Executive Committee (2000-2004). Currently, he is a Director of NCR Corporation (data warehousing and technology solutions), BellSouth Corporation (telecommunications), Chemical Financial Corporation, Maersk Inc. (industrial conglomerate, 2002-present), and Metalmark Capital (private equity investment firm, 2005-present). He also serves as a member of the Board of Trustees of the American Enterprise Institute for Public Policy Research. In addition, Mr. Stavropoulos is a member of The Business Council, J.P. Morgan International Council and the University of Notre Dame Advisory Council for the College of Science. |
Kenneth L. Wolfe (67) |
| Year of Election or Appointment: 2005 Prior to his retirement in 2001, Mr. Wolfe was Chairman and Chief Executive Officer of Hershey Foods Corporation (1993-2001). He currently serves as a member of the boards of Adelphia Communications Corporation (2003-present), Bausch & Lomb, Inc., and Revlon Inc. (2004-present). |
Advisory Board Member and Executive Officers:
Correspondence intended for each executive officer and Mr. Lynch may be sent to Fidelity Investments, 82 Devonshire Street, Boston, Massachusetts 02109.
Name, Age; Principal Occupation |
Peter S. Lynch (62) |
| Year of Election or Appointment: 2003 Member of the Advisory Board of Variable Insurance Products Fund. Mr. Lynch is Vice Chairman and a Director of FMR, and Vice Chairman (2001-present) and a Director of FMR Co., Inc. Previously, Mr. Lynch served as a Trustee of the Fidelity funds (1990-2003). In addition, he serves as a Trustee of Boston College and as the Chairman of the Inner-City Scholarship Fund. |
Kimberley H. Monasterio (43) |
| Year of Election or Appointment: 2007 President and Treasurer of VIP Overseas. Ms. Monasterio also serves as President and Treasurer of other Fidelity funds (2007-present) and is an employee of FMR (2004-present). Previously, Ms. Monasterio served as Deputy Treasurer of the Fidelity funds (2004-2006). Before joining Fidelity Investments, Ms. Monasterio served as Treasurer (2000-2004) and Chief Financial Officer (2002-2004) of the Franklin Templeton Funds and Senior Vice President of Franklin Templeton Services, LLC (2000-2004). |
Dwight D. Churchill (53) |
| Year of Election or Appointment: 2005 Vice President of VIP Overseas. Mr. Churchill also serves as Vice President of certain Equity Funds (2005-present). Mr. Churchill is Executive Vice President of FMR (2005-present) and FMR Co., Inc. (2005-present). Previously, Mr. Churchill served as Senior Vice President of Fidelity Investments Money Management, Inc. (2005-2006), Head of Fidelity's Fixed-Income Division (2000-2005), Vice President of Fidelity's Money Market Funds (2000-2005), Vice President of Fidelity's Bond Funds, and Senior Vice President of FMR. |
Eric M. Wetlaufer (44) |
| Year of Election or Appointment: 2006 Vice President of VIP Overseas. Mr. Wetlaufer also serves as Vice President of certain International Equity Funds (2006-present). Mr. Wetlaufer is Senior Vice President of FMR (2006-present) and FMR Co., Inc. (2006-present), and President and Director of Fidelity Management & Research (U.K.) Inc. (2006-present) and Fidelity Research & Analysis Company (2006-present). Before joining Fidelity Investments in 2005, Mr. Wetlaufer was a partner in Oxhead Capital Management (2004-2005). Previously, Mr. Wetlaufer served as a Chief Investment Officer of Putnam Investments (1997-2003). |
Graeme Rockett (40) |
| Year of Election or Appointment: 2006 Vice President of VIP Overseas. Mr. Rockett also serves as Vice President of other funds advised by FMR. Prior to assuming his current responsibilities, Mr. Rockett worked as a research analyst and portfolio manager. Mr. Rockett also serves as Vice President of FMR and FMR Co., Inc. (2006). |
Eric D. Roiter (58) |
| Year of Election or Appointment: 1998 Secretary of VIP Overseas. He also serves as Secretary of other Fidelity funds; Vice President, General Counsel, and Secretary of FMR Co., Inc. (2001-present) and FMR; Assistant Secretary of Fidelity Management & Research (U.K.) Inc. (2001-present), Fidelity Research & Analysis Company (2001-present), and Fidelity Investments Money Management, Inc. (2001-present). Mr. Roiter is an Adjunct Member, Faculty of Law, at Boston College Law School (2003-present). Previously, Mr. Roiter served as Vice President and Secretary of Fidelity Distributors Corporation (FDC) (1998-2005). |
Stuart Fross (47) |
| Year of Election or Appointment: 2003 Assistant Secretary of VIP Overseas. Mr. Fross also serves as Assistant Secretary of other Fidelity funds (2003-present), Vice President and Secretary of FDC (2005-present), and is an employee of FMR. |
R. Stephen Ganis (40) |
| Year of Election or Appointment: 2006 Anti-Money Laundering (AML) officer of VIP Overseas. Mr. Ganis also serves as AML officer of other Fidelity funds (2006-present) and FMR Corp. (2003-present). Before joining Fidelity Investments, Mr. Ganis practiced law at Goodwin Procter, LLP (2000-2002). |
Joseph B. Hollis (58) |
| Year of Election or Appointment: 2006 Chief Financial Officer of VIP Overseas. Mr. Hollis also serves as Chief Financial Officer of other Fidelity funds. Mr. Hollis is President of Fidelity Pricing and Cash Management Services (FPCMS) (2005-present). Mr. Hollis also serves as President and Director of Fidelity Service Company, Inc. (2006-present). Previously, Mr. Hollis served as Senior Vice President of Cash Management Services (1999-2002) and Investment Management Operations (2002-2005). |
Kenneth A. Rathgeber (59) |
| Year of Election or Appointment: 2004 Chief Compliance Officer of VIP Overseas. Mr. Rathgeber also serves as Chief Compliance Officer of other Fidelity funds (2004-present) and Executive Vice President of Risk Oversight for Fidelity Investments (2002-present). He is Chief Compliance Officer of FMR (2005-present), FMR Co., Inc. (2005-present), Fidelity Management & Research (U.K.) Inc. (2005-present), Fidelity Research & Analysis Company (2005-present), Fidelity Investments Money Management, Inc. (2005-present), and Strategic Advisers, Inc. (2005-present). Previously, Mr. Rathgeber served as Executive Vice President and Chief Operating Officer for Fidelity Investments Institutional Services Company, Inc. (1998-2002). |
Bryan A. Mehrmann (45) |
| Year of Election or Appointment: 2005 Deputy Treasurer of VIP Overseas. Mr. Mehrmann also serves as Deputy Treasurer of other Fidelity funds (2005-present) and is an employee of FMR. Previously, Mr. Mehrmann served as Vice President of Fidelity Investments Institutional Services Group (FIIS)/Fidelity Investments Institutional Operations Corporation, Inc. (FIIOC) Client Services (1998-2004). |
Kenneth B. Robins (37) |
| Year of Election or Appointment: 2005 Deputy Treasurer of VIP Overseas. Mr. Robins also serves as Deputy Treasurer of other Fidelity funds (2005-present) and is an employee of FMR (2004-present). Before joining Fidelity Investments, Mr. Robins worked at KPMG LLP, where he was a partner in KPMG's department of professional practice (2002-2004) and a Senior Manager (1999-2000). In addition, Mr. Robins served as Assistant Chief Accountant, United States Securities and Exchange Commission (2000-2002). |
Robert G. Byrnes (40) |
| Year of Election or Appointment: 2005 Assistant Treasurer of VIP Overseas. Mr. Byrnes also serves as Assistant Treasurer of other Fidelity funds (2005-present) and is an employee of FMR (2005-present). Previously, Mr. Byrnes served as Vice President of FPCMS (2003-2005). Before joining Fidelity Investments, Mr. Byrnes worked at Deutsche Asset Management where he served as Vice President of the Investment Operations Group (2000-2003). |
John H. Costello (60) |
| Year of Election or Appointment: 1987 Assistant Treasurer of VIP Overseas. Mr. Costello also serves as Assistant Treasurer of other Fidelity funds and is an employee of FMR. |
Peter L. Lydecker (52) |
| Year of Election or Appointment: 2004 Assistant Treasurer of VIP Overseas. Mr. Lydecker also serves as Assistant Treasurer of other Fidelity funds (2004) and is an employee of FMR. |
Mark Osterheld (51) |
| Year of Election or Appointment: 2002 Assistant Treasurer of VIP Overseas. Mr. Osterheld also serves as Assistant Treasurer of other Fidelity funds (2002) and is an employee of FMR. |
Gary W. Ryan (48) |
| Year of Election or Appointment: 2005 Assistant Treasurer of VIP Overseas. Mr. Ryan also serves as Assistant Treasurer of other Fidelity funds (2005-present) and is an employee of FMR (2005-present). Previously, Mr. Ryan served as Vice President of Fund Reporting in FPCMS (1999-2005). |
Salvatore Schiavone (41) |
| Year of Election or Appointment: 2005 Assistant Treasurer of VIP Overseas. Mr. Schiavone also serves as Assistant Treasurer of other Fidelity funds (2005-present) and is an employee of FMR (2005-present). Before joining Fidelity Investments, Mr. Schiavone worked at Deutsche Asset Management, where he most recently served as Assistant Treasurer (2003-2005) of the Scudder Funds and Vice President and Head of Fund Reporting (1996-2003). |
Annual Report
Distributions
The Board of Trustees of VIP Overseas Portfolio voted to pay to shareholders of record at the opening of business on record date, the following distributions per share derived from capital gains realized from sales of portfolio securities, and dividends derived from net investment income:
| Pay Date | Record Date | Dividends | Capital Gains |
Initial Class | 02/09/2007 | 02/09/2007 | $0.380 | $1.660 |
Service Class | 02/09/2007 | 02/09/2007 | $0.358 | $1.660 |
Service Class 2 | 02/09/2007 | 02/09/2007 | $0.331 | $1.660 |
The fund hereby designates as a capital gain dividend with respect to the taxable year ended December 31, 2006, $224,671,947, or, if subsequently determined to be different, the net capital gain of such year.
The amounts per share which represent income derived from sources within, and taxes paid to, foreign countries or possessions of the United States are as follows:
| Pay Date | Income | Taxes |
Initial Class | 02/10/2006 | $.330 | $.022 |
Service Class | 02/10/2006 | $.311 | $.022 |
Service Class 2 | 02/10/2006 | $.294 | $.022 |
The fund will notify shareholders in January 2007 of amounts for use in preparing 2006 income tax returns.
VIP Overseas Portfolio
Proxy Voting Results
A special meeting of the fund's shareholders was held on November 15, 2006. The results of votes taken among shareholders on the proposal before them are reported below. Each vote reported represents one dollar of net asset value held on the record date for the meeting.
PROPOSAL 1 |
To elect a Board of Trustees. A |
| # of
Votes | % of
Votes |
Dennis J. Dirks |
Affirmative | 17,902,425,874.20 | 95.888 |
Withheld | 767,753,174.62 | 4.112 |
TOTAL | 18,670,179,048.82 | 100.000 |
Albert R. Gamper, Jr. |
Affirmative | 17,903,848,885.90 | 95.895 |
Withheld | 766,330,162.92 | 4.105 |
TOTAL | 18,670,179,048.82 | 100.000 |
Robert M. Gates |
Affirmative | 17,872,803,847.04 | 95.729 |
Withheld | 797,375,201.78 | 4.271 |
TOTAL | 18,670,179,048.82 | 100.000 |
George H. Heilmeier |
Affirmative | 17.870,083,099.32 | 95.715 |
Withheld | 800,095,949.50 | 4.285 |
TOTAL | 18,670,179,048.82 | 100.000 |
Edward C. Johnson 3d |
Affirmative | 17,855,450,949.13 | 95.636 |
Withheld | 814,728,099.69 | 4.364 |
TOTAL | 18,670,179,048.82 | 100.000 |
Stephen P. Jonas |
Affirmative | 17,891,792,907.31 | 95.831 |
Withheld | 778,386,141.51 | 4.169 |
TOTAL | 18,670,179,048.82 | 100.000 |
James H. KeyesB |
Affirmative | 17,882,873,107.76 | 95.783 |
Withheld | 787,305,941.06 | 4.217 |
TOTAL | 18,670,179,048.82 | 100.000 |
Marie L. Knowles |
Affirmative | 17,891,908,567.08 | 95.831 |
Withheld | 778,270,481.74 | 4.169 |
TOTAL | 18,670,179,048.82 | 100.000 |
Ned C. Lautenbach |
Affirmative | 17,899,551,251.03 | 95.872 |
Withheld | 770,627,797.79 | 4.128 |
TOTAL | 18,670,179,048.82 | 100.000 |
| # of
Votes | % of
Votes |
William O. McCoy |
Affirmative | 17,860,461,325.05 | 95.663 |
Withheld | 809,717,723.77 | 4.337 |
TOTAL | 18,670,179,048.82 | 100.000 |
Robert L. Reynolds |
Affirmative | 17,894,978,918.13 | 95.848 |
Withheld | 775,200,130.69 | 4.152 |
TOTAL | 18,670,179,048.82 | 100.000 |
Cornelia M. Small |
Affirmative | 17,897,519,970.69 | 95.862 |
Withheld | 772,659,078.13 | 4.138 |
TOTAL | 18,670,179,048.82 | 100.000 |
William S. Stavropoulos |
Affirmative | 17,871,058,112.55 | 95.720 |
Withheld | 799,120,936.27 | 4.280 |
TOTAL | 18,670,179,048.82 | 100.000 |
Kenneth L. Wolfe |
Affirmative | 17,886,340,376.33 | 95.802 |
Withheld | 783,838,672.49 | 4.198 |
TOTAL | 18,670,179,048.82 | 100.000 |
A Denotes trust-wide proposal and voting results. B Effective on or about January 1, 2007. |
Annual Report
Board Approval of Investment Advisory Contracts and Management Fees
VIP Overseas Portfolio
Each year, typically in July, the Board of Trustees, including the Independent Trustees (together, the Board), votes on the renewal of the management contract and sub-advisory agreements (together, the Advisory Contracts) for the fund. The Board, assisted by the advice of fund counsel and Independent Trustees' counsel, requests and considers a broad range of information throughout the year.
The Board meets regularly each month except August and takes into account throughout the year matters bearing on Advisory Contracts. The Board, acting directly and through its separate committees, considers at each of its meetings factors that are relevant to the annual renewal of the fund's Advisory Contracts, including the services and support provided to the fund and its shareholders. At the time of the renewal, the Board had 12 standing committees, each composed of Independent Trustees with varying backgrounds, to which the Board has assigned specific subject matter responsibilities in order to enhance effective decision-making by the Board. Each committee has adopted a written charter outlining the structure and purposes of the committee. One such committee, the Equity Contract Committee, meets periodically as needed throughout the year to consider matters specifically related to the annual renewal of Advisory Contracts. The committee requests and receives information on, and makes recommendations to the Independent Trustees concerning, the approval and annual review of the Advisory Contracts.
At its July 2006 meeting, the Board of Trustees, including the Independent Trustees, unanimously determined to renew the Advisory Contracts for the fund. In reaching its determination, the Board considered all factors it believed relevant, including (i) the nature, extent, and quality of the services to be provided to the fund and its shareholders (including the investment performance of the fund); (ii) the competitiveness of the management fee and total expenses of the fund; (iii) the total costs of the services to be provided by and the profits to be realized by the investment adviser and its affiliates from the relationship with the fund; (iv) the extent to which economies of scale would be realized as the fund grows; and (v) whether fee levels reflect these economies of scale, if any, for the benefit of fund shareholders.
In determining whether to renew the Advisory Contracts for the fund, the Board ultimately reached a determination, with the assistance of fund counsel and Independent Trustees' counsel, that the renewal of the Advisory Contracts and the compensation to be received by Fidelity under the management contract is consistent with Fidelity's fiduciary duty under applicable law. In addition to evaluating the specific factors noted above, the Board, in reaching its determination, is aware that shareholders in the fund have a broad range of investment choices available to them, including a wide choice among mutual funds offered by competitors to Fidelity, and that the fund's shareholders, with the opportunity to review and weigh the disclosure provided by the fund in its prospectus and other public disclosures, have chosen to invest in this fund, managed by Fidelity.
Nature, Extent, and Quality of Services Provided. The Board considered staffing within the investment adviser, FMR, and the sub-advisers (together, the Investment Advisers), including the background of the fund's portfolio manager and the fund's investment objective and discipline. The Independent Trustees also had discussions with senior management of Fidelity's investment operations and investment groups. The Board considered the structure of the portfolio manager compensation program and whether this structure provides appropriate incentives.
Resources Dedicated to Investment Management and Support Services. The Board reviewed the size, education, and experience of the Investment Advisers' investment staff, their use of technology, and the Investment Advisers' approach to recruiting, training, and retaining portfolio managers and other research, advisory, and management personnel. The Board considered Fidelity's extensive global research capabilities that enable the Investment Advisers to aggregate data from various sources in an effort to produce positive investment results. The Board noted that Fidelity's analysts have access to a variety of technological tools that enable them to perform both fundamental and quantitative analysis and to specialize in various disciplines. The Board also considered that Fidelity's portfolio managers and analysts have access to daily portfolio attribution that allows for monitoring of a fund's portfolio, as well as an electronic communication system that provides immediate real-time access to research concerning issuers and credit enhancers.
Shareholder and Administrative Services. The Board considered (i) the nature, extent, quality, and cost of administrative, distribution, and shareholder services performed by the Investment Advisers and their affiliates under the Advisory Contracts and under separate agreements covering transfer agency, pricing and bookkeeping, and securities lending services for the fund; (ii) the nature and extent of the Investment Advisers' supervision of third party service providers, principally custodians and subcustodians; and (iii) the resources devoted to, and the record of compliance with, the fund's compliance policies and procedures. The Board reviewed the allocation of fund brokerage, including allocations to brokers affiliated with the Investment Advisers, the use of brokerage commissions to pay fund expenses, and the use of "soft" commission dollars to pay for research services. The Board also considered that Fidelity voluntarily pays for market data out of its own resources.
The Board noted that the growth of fund assets across the complex allows Fidelity to reinvest in the development of services designed to enhance the value or convenience of the Fidelity funds as investment vehicles. These services include 24-hour access to account information and market information through phone representatives and over the Internet, and investor education materials and asset allocation tools.
Investment in a Large Fund Family. The Board considered the benefits to shareholders of investing in a Fidelity fund, including the benefits of investing in a fund that is part of a large family of funds offering a variety of investment disciplines and providing for a large variety of mutual fund investor services. The Board noted that, since the last Advisory Contract renewals in July 2005, Fidelity has taken a number of actions that benefited particular funds, including (i) dedicating additional resources to investment research and to restructure the investment research teams; (ii) voluntarily entering into contractual arrangements with certain brokers pursuant to which Fidelity pays for research products and services separately out of its own resources, rather than bundling with fund commissions; (iii) launching the Fidelity Advantage Class of its five Spartan stock index funds and three Spartan bond index funds, which is a lower-fee class available to shareholders with higher account balances; (iv) contractually agreeing to impose expense limitations on Fidelity U.S. Bond Index Fund and reducing the fund's initial investment minimum; and (v) offering shareholders of each of the Fidelity Institutional Money Market Funds the privilege of exchanging shares of the fund for shares of other Fidelity funds.
VIP Overseas Portfolio
Investment Performance and Compliance. The Board considered whether the fund has operated within its investment objective, as well as its record of compliance with its investment restrictions. It also reviewed the fund's absolute investment performance for each class (except Investor Class R), as well as the fund's relative investment performance for each class (except Investor Class R) measured against (i) a broad-based securities market index, and (ii) a peer group of mutual funds deemed appropriate by the Board over multiple periods. The following charts considered by the Board show, over the one-, three-, and five-year periods ended December 31, 2005, the cumulative total returns of Service Class 2 and Initial Class of the fund, the cumulative total returns of a broad-based securities market index ("benchmark"), and a range of cumulative total returns of a peer group of mutual funds identified by Lipper Inc. as having an investment objective similar to that of the fund. The returns of Service Class 2 and Initial Class represent the performance of classes with the highest and lowest 12b-1 fees, respectively (not necessarily with the highest and lowest total expenses). (Investor Class R, which has no 12b-1 fee, had less than one year of performance as of December 31, 2005.) The box within each chart shows the 25th percentile return (bottom of box) and the 75th percentile return (top of box) of the Lipper peer group. Returns shown above the box are in the first quartile and returns shown below the box are in the fourth quartile. The percentage beaten numbers noted below each chart correspond to the percentile box and represent the percentage of funds in the Lipper peer group whose performance was equal to or lower than that of the class indicated.
VIP Overseas Portfolio

The Board reviewed the fund's relative investment performance against its Lipper peer group and stated that the performance of Initial Class of the fund was in the first quartile for the one- and three-year periods and the second quartile for the five-year period. The Board also stated that the relative investment performance of Initial Class of the fund compared favorably to its benchmark for the one- and three-year periods, although the fund's five-year cumulative total return was lower than its benchmark. The Board considered that the variations in performance among the fund's classes reflect the variations in class expenses, which result in lower performance for higher expense classes. The Board also reviewed the fund's relative investment performance against a peer group defined by Morningstar.
The Board considered that FMR has taken steps to refocus and strengthen equity research, equity portfolio management, and compliance. The Board noted with favor FMR's reorganization of its senior management team in 2005 and FMR's dedication of additional resources to investment research, and participated in the process that led to those changes.
Based on its review, and giving particular weight to the nature and quality of the resources dedicated by the Investment Advisers to maintain and improve relative performance, the Board concluded that the nature, extent, and quality of the services provided to the fund will benefit the fund's shareholders, particularly in light of the Board's view that the fund's shareholders benefit from investing in a fund that is part of a large family of funds offering a variety of investment disciplines and services.
Competitiveness of Management Fee and Total Fund Expenses. The Board considered the fund's management fee and total expenses compared to "mapped groups" of competitive funds and classes. Fidelity creates "mapped groups" by combining similar Lipper investment objective categories that have comparable management fee characteristics. Combining Lipper investment objective categories aids the Board's management fee and total expense comparisons by broadening the competitive group used for comparison and by reducing the number of universes to which various Fidelity funds are compared.
Annual Report
Board Approval of Investment Advisory Contracts and Management Fees - continued
The Board considered two proprietary management fee comparisons for the 12-month periods shown in the chart below. The group of Lipper funds used by the Board for management fee comparisons is referred to below as the "Total Mapped Group" and, for the reasons explained above, is broader than the Lipper peer group used by the Board for performance comparisons. The Total Mapped Group comparison focuses on a fund's standing relative to the total universe of comparable funds available to investors, in terms of gross management fees before expense reimbursements or caps. "TMG %" represents the percentage of funds in the Total Mapped Group that had management fees that were lower than the fund's. For example, a TMG % of 12% means that 88% of the funds in the Total Mapped Group had higher management fees than the fund. The "Asset-Size Peer Group" (ASPG) comparison focuses on a fund's standing relative to non-Fidelity funds similar in size to the fund within the Total Mapped Group. The ASPG represents at least 15% of the funds in the Total Mapped Group with comparable asset size and management fee characteristics, subject to a minimum of 50 funds (or all funds in the Total Mapped Group if fewer than 50). Additional information, such as the ASPG quartile in which the fund's management fee ranked, is also included in the chart and considered by the Board.
VIP Overseas Portfolio

The Board noted that the fund's management fee ranked below the median of its Total Mapped Group and below the median of its ASPG for 2005.
Based on its review, the Board concluded that the fund's management fee was fair and reasonable in light of the services that the fund receives and the other factors considered.
In its review of each class's total expenses, the Board considered the fund's management fee as well as other fund or class expenses, as applicable, such as transfer agent fees, pricing and bookkeeping fees, fund-paid 12b-1 fees, and custodial, legal, and audit fees. The Board also noted the effects of any waivers and reimbursements on fees and expenses. As part of its review, the Board also considered current and historical total expenses of each class of the fund compared to competitive fund median expenses. Each class of the fund is compared to those funds and classes in the Total Mapped Group (used by the Board for management fee comparisons) that have a similar sales load structure.
The Board noted that the total expenses of each class ranked below its competitive median for 2005.
In its review of total expenses, the Board also considered Fidelity fee structures and other information on clients that FMR and its affiliates service in other competitive markets, such as other mutual funds advised or subadvised by FMR or its affiliates, pension plan clients, and other institutional clients.
Based on its review, the Board concluded that the total expenses of each class of the fund were reasonable in light of the services that the fund and its shareholders receive and the other factors considered.
Costs of the Services and Profitability. The Board considered the revenues earned and the expenses incurred by Fidelity in conducting the business of developing, marketing, distributing, managing, administering and servicing the fund and its shareholders. The Board also considered the level of Fidelity's profits in respect of all the Fidelity funds.
VIP Overseas Portfolio
On an annual basis, FMR presents to the Board Fidelity's profitability for the fund. Fidelity calculates the profitability for each fund, as well as aggregate profitability for groups of Fidelity funds and all Fidelity funds, using a series of detailed revenue and cost allocation methodologies which originate with the audited books and records of Fidelity. The Audit Committee of the Board reviews any significant changes from the prior year's methodologies.
PricewaterhouseCoopers LLP (PwC), independent registered accounting firm and auditor to Fidelity and certain Fidelity funds, has been engaged annually by the Board as part of the Board's assessment of the results of Fidelity's profitability analysis. PwC's engagement includes the review and assessment of Fidelity's methodologies used in determining the revenues and expenses attributable to Fidelity's mutual fund business, and completion of agreed-upon procedures surrounding the mathematical accuracy of fund profitability and its conformity to allocation methodologies. After considering PwC's reports issued under the engagement and information provided by Fidelity, the Board believes that while other allocation methods may also be reasonable, Fidelity's profitability methodologies are reasonable in all material respects.
The Board has also reviewed Fidelity's non-fund businesses and any fall-out benefits related to the mutual fund business as well as cases where Fidelity's affiliates may benefit from or be related to the fund's business.
The Board considered the costs of the services provided by and the profits realized by Fidelity in connection with the operation of the fund and determined that the amount of profit is a fair entrepreneurial profit for the management of the fund.
Economies of Scale. The Board considered whether there have been economies of scale in respect of the management of the Fidelity funds, whether the Fidelity funds (including the fund) have appropriately benefited from any such economies of scale, and whether there is potential for realization of any further economies of scale. The Board considered the extent to which the fund will benefit from economies of scale through increased services to the fund, through waivers or reimbursements, or through fee or expense reductions.
The Board recognized that the fund's management contract incorporates a "group fee" structure, which provides for lower fee rates as total fund assets under FMR's management increase, and for higher fee rates as total fund assets under FMR's management decrease. The Board considered that the group fee is designed to deliver the benefits of economies of scale to fund shareholders when total fund assets increase, even if assets of any particular fund are unchanged or have declined, because some portion of Fidelity's costs are attributable to services provided to all Fidelity funds, and all funds benefit if those costs can be allocated among more assets. The Board concluded that, given the group fee structure, fund shareholders will achieve a certain level of economies of scale as assets under FMR's management increase at the fund complex level, regardless of whether Fidelity achieves any such economies of scale.
The Board further concluded that any potential economies of scale are being shared between fund shareholders and Fidelity in an appropriate manner.
Additional Information Requested by the Board. In order to develop fully the factual basis for consideration of the Advisory Contracts, the Board requested additional information on several topics, including (i) Fidelity's fund profitability methodology and profitability trends within certain funds; (ii) portfolio manager compensation; (iii) the extent to which any economies of scale exist and are shared between the funds and Fidelity; (iv) the total expenses of certain funds and classes relative to competitors, including the extent to which the expenses of certain funds have been or could be capped; (v) fund performance trends; and (vi) Fidelity's fee structures, including use of performance fees.
Based on its evaluation of all of the conclusions noted above, and after considering all material factors, the Board ultimately concluded that the advisory fee structures are fair and reasonable, and that the fund's Advisory Contracts should be renewed.
Annual Report
Investment Adviser
Fidelity Management & Research Company
Boston, MA
Investment Sub-Advisers
FMR Co., Inc.
Fidelity Management & Research (U.K.) Inc.
Fidelity Research & Analysis Company (formerly Fidelity
Management & Research (Far East) Inc.)
Fidelity International Investment Advisors
Fidelity International Investment Advisors (U.K.) Limited
Fidelity Investments Japan Limited
General Distributor
Fidelity Distributors Corporation
Boston, MA
Transfer and Service Agents
Fidelity Investments Institutional Operations Company, Inc.
Boston, MA
Fidelity Service Company, Inc.
Boston, MA
Custodian
JPMorgan Chase Bank
New York, NY
VIPOVRS-ANN-0207
1.540205.109
Fidelity® Variable Insurance Products:
Overseas Portfolio - Class R
Annual Report
December 31, 2006
(2_fidelity_logos) (Registered_Trademark)
Contents
Performance | <Click Here> | How the fund has done over time. |
Management's Discussion | <Click Here> | The manager's review of fund performance, strategy and outlook. |
Shareholder Expense Example | <Click Here> | An example of shareholder expenses. |
Investment Changes | <Click Here> | A summary of major shifts in the fund's investments over the past six months. |
Investments | <Click Here> | A complete list of the fund's investments with their
market values. |
Financial Statements | <Click Here> | Statements of assets and liabilities, operations, and
changes in net assets, as well as financial highlights. |
Notes | <Click Here> | Notes to the financial statements. |
Report of Independent Registered Public Accounting Firm | <Click Here> | |
Trustees and Officers | <Click Here> | |
Distributions | <Click Here> | |
Proxy Voting Results | <Click Here> | |
Board Approval of Investment Advisory Contracts and Management Fees | <Click Here> | |
To view a fund's proxy voting guidelines and proxy voting record for the 12-month period ended June 30, visit www.fidelity.com/proxyvotingresults or visit the Securities and Exchange Commission's (SEC) web site at www.sec.gov. You may also call 1-877-208-0098 to request a free copy of the proxy voting guidelines.
Fidelity Variable Insurance Products are separate account options which are purchased through a variable insurance contract.
Standard & Poor's, S&P and S&P 500 are registered service marks of The McGraw-Hill Companies, Inc. and have been licensed for use by Fidelity Distributors Corporation.
Other third party marks appearing herein are the property of their respective owners.
All other marks appearing herein are registered or unregistered trademarks or service marks of FMR Corp. or an affiliated company.
This report and the financial statements contained herein are submitted for the general information of the shareholders of the fund. This report is not authorized for distribution to prospective investors in the fund unless preceded or accompanied by an effective prospectus.
A fund files its complete schedule of portfolio holdings with the SEC for the first and third quarters of each fiscal year on Form N-Q. Forms N-Q are available on the SEC's web site at http://www.sec.gov. A fund's Forms N-Q may be reviewed and copied at the SEC's Public Reference Room in Washington, DC. Information regarding the operation of the SEC's Public Reference Room may be obtained by calling 1-800-SEC-0330. For a complete list of a fund's portfolio holdings, view the most recent quarterly holdings report, semiannual report, or annual report on Fidelity's web site at http://www.advisor.fidelity.com.
NOT FDIC INSURED · MAY LOSE VALUE · NO BANK GUARANTEE
Neither the fund nor Fidelity Distributors Corporation is a bank.
VIP Overseas Portfolio
VIP Overseas Portfolio - Class R
Performance: The Bottom Line
Average annual total return reflects the change in the value of an investment, assuming reinvestment of the class' dividend income and capital gains (the profits earned upon the sale of securities that have grown in value) and assuming a constant rate of performance each year. During periods of reimbursement by Fidelity, a fund's total return will be greater than it would be had the reimbursement not occurred. Performance numbers are net of all underlying fund operating expenses, but do not include any insurance charges imposed by your insurance company's separate account. If performance information included the effect of these additional charges, the total returns would be lower. How a fund did yesterday is no guarantee of how it will do tomorrow.
Average Annual Total Returns
Periods ended December 31, 2006 | Past 1
year | Past 5
years | Past 10
years |
VIP Overseas - Initial Class R A | 18.08% | 12.78% | 7.64% |
VIP Overseas - Service Class R B | 17.95% | 12.68% | 7.55% |
VIP Overseas - Service Class 2R C | 17.81% | 12.51% | 7.46% |
VIP Overseas - Investor Class R D | 17.94% | 12.75% | 7.62% |
A The initial offering of Initial Class R shares took place on April 24, 2002. Returns prior to April 24, 2002 are those of Initial Class.
B The initial offering of Service Class R shares took place on April 24, 2002. Performance for Service Class R shares reflects an asset-based service fee (12b-1 fee). Returns from November 3, 1997 to April 24, 2002 are those of Service Class. Returns prior to November 3, 1997 are those of Initial Class and do not include the effects of a 12b-1 fee. Had Service Class R's 12b-1 fee been reflected, returns prior to November 3, 1997 would have been lower.
C The initial offering of Service Class 2R shares took place on April 24, 2002. Performance for Service Class 2R shares reflects an asset-based service fee (12b-1 fee). Returns from January 12, 2000 to April 24, 2002 are those of Service Class 2. Returns from November 3, 1997 to January 12, 2000 are those of Service Class which reflect a different 12b-1 fee. Service Class 2R returns prior to November 3, 1997 are those of Initial Class and do not include the effects of a 12b-1 fee. Had Service Class 2R's 12b-1 fee been reflected, returns prior to January 12, 2000 would have been lower.
D The initial offering of Investor Class R shares took place on July 21, 2005. Returns prior to July 21, 2005 are those of Initial Class. If Investor Class R's transfer agent fee had been reflected, returns prior to July 21, 2005 would have been lower.
$10,000 Over 10 Years
Let's say hypothetically that $10,000 was invested in VIP Overseas Portfolio - Initial Class R on December 31, 1996. The chart shows how the value of your investment would have changed, and also shows how the MSCI® EAFE® Index performed over the same period.
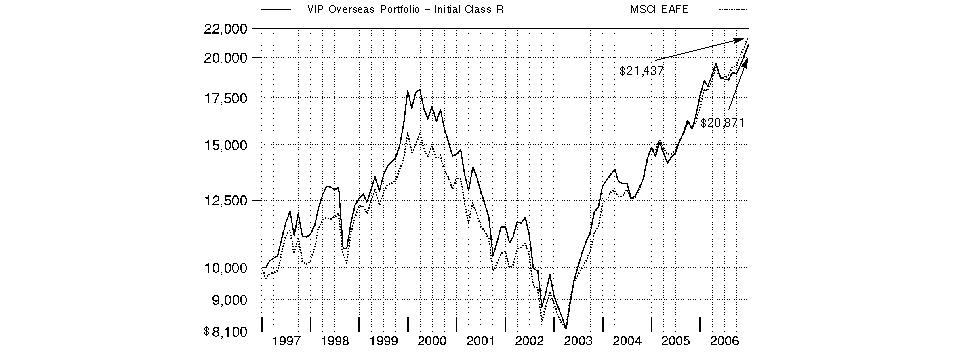
Annual Report
VIP Overseas Portfolio
Management's Discussion of Fund Performance
Comments from Graeme Rockett, Portfolio Manager of VIP Overseas Portfolio
International equity markets as a whole outpaced their U.S. counterparts for the 12 months ending December 31, 2006 - partly as a result of favorable currency movements that boosted returns for U.S. investors in foreign stocks. The Morgan Stanley Capital InternationalSM Europe, Australasia, Far East (MSCI® EAFE®) Index - a gauge of developed stock markets outside the United States and Canada - gained 26.53% during that time. This marked the fifth year in a row that the MSCI EAFE outperformed the Standard & Poor's 500SM Index, a popular barometer of the U.S. equity market, which returned 15.79% in 2006. The European component of the MSCI EAFE, representing two-thirds of the index on average during the period, was up roughly 34%, riding the tail winds of strong profit growth and booming merger-and-acquisition activity. Japan, on the other hand, accounting for roughly one-fourth of the index, was up only modestly, struggling with a weak yen and slowing consumer spending.
For the 12 months ending December 31, 2006, VIP Overseas Portfolio underperformed the MSCI EAFE index. (For specific portfolio performance results, please refer to the performance section of this report.) An overweighting in small- and mid-cap stocks detracted from fund performance during a period when large-cap stocks delivered stronger returns. Stock selection in Europe and Japan accounted for most of the fund's underperformance versus the index. On a sector basis, our weakest results were in financials, consumer discretionary and technology. Given a rising market, holding a modest cash position also detracted. Returns were hurt by investments in Japanese brokerage stocks - including Nikko Cordial, JAFCO and SBI E*Trade - which declined during a period of mediocre performance by the Japanese equity market. Yahoo Japan declined as well, as weak advertising spending by Japanese firms hurt its earnings. Credit Saison, a Japanese consumer finance company, lost ground when government regulators decided to institute an interest rate cap for consumer loans. All of the stocks mentioned above were sold by period end. Stock picking in the capital goods segment contributed to the fund's returns - in particular Alstom, a French manufacturer of power generation equipment. Nintendo, the Japanese video game manufacturer, also helped performance, as sales of its new Wii game console exceeded analysts' expectations. On an absolute basis, favorable currency movements gave performance a sizable boost.
The views expressed above reflect those of the portfolio manager(s) only through the end of the period as stated on the cover of this report and do not necessarily represent the views of Fidelity or any other person in the Fidelity organization. Any such views are subject to change at any time based upon market or other conditions and Fidelity disclaims any responsibility to update such views. These views may not be relied on as investment advice and, because investment decisions for a Fidelity fund are based on numerous factors, may not be relied on as an indication of trading intent on behalf of any Fidelity fund.
VIP Overseas Portfolio
VIP Overseas Portfolio
Shareholder Expense Example
As a shareholder of the Fund, you incur two types of costs: (1) transaction costs, including redemption fees, and (2) ongoing costs, including management fees, distribution and/or service (12b-1) fees and other Fund expenses. This Example is intended to help you understand your ongoing costs (in dollars) of investing in the Fund and to compare these costs with the ongoing costs of investing in other mutual funds.
The Example is based on an investment of $1,000 invested at the beginning of the period and held for the entire period (July 1, 2006 to December 31, 2006).
Actual Expenses
The first line of the accompanying table for each class of the Fund provides information about actual account values and actual expenses. You may use the information in this line, together with the amount you invested, to estimate the expenses that you paid over the period. Simply divide your account value by $1,000.00 (for example, an $8,600 account value divided by $1,000.00 = 8.6), then multiply the result by the number in the first line for a class of the Fund under the heading entitled "Expenses Paid During Period" to estimate the expenses you paid on your account during this period. The estimate of expenses does not include any fees or other expenses of any variable annuity or variable life insurance product. If they were, the estimate of expenses you paid during the period would be higher, and your ending account value would be lower.
Hypothetical Example for Comparison Purposes
The second line of the accompanying table for each class of the Fund provides information about hypothetical account values and hypothetical expenses based on a Class' actual expense ratio and an assumed rate of return of 5% per year before expenses, which is not the Class' actual return. The hypothetical account values and expenses may not be used to estimate the actual ending account balance or expenses you paid for the period. You may use this information to compare the ongoing costs of investing in the Fund and other funds. To do so, compare this 5% hypothetical example with the 5% hypothetical examples that appear in the shareholder reports of the other funds. The estimate of expenses does not include any fees or other expenses of any variable annuity or variable life insurance product. If they were, the estimate of expenses you paid during the period would be higher, and your ending account value would be lower.
Please note that the expenses shown in the table are meant to highlight your ongoing costs only and do not reflect any transaction costs. Therefore, the second line of the table is useful in comparing ongoing costs only, and will not help you determine the relative total costs of owning different funds. In addition, if these transactional costs were included, your costs would have been higher.
| Beginning
Account Value
July 1, 2006 | Ending
Account Value
December 31, 2006 | Expenses Paid
During Period*
July 1, 2006 to
December 31, 2006 |
Initial Class | | | |
Actual | $ 1,000.00 | $ 1,119.60 | $ 4.81 |
HypotheticalA | $ 1,000.00 | $ 1,020.67 | $ 4.58 |
Service Class | | | |
Actual | $ 1,000.00 | $ 1,119.10 | $ 5.34 |
HypotheticalA | $ 1,000.00 | $ 1,020.16 | $ 5.09 |
Service Class 2 | | | |
Actual | $ 1,000.00 | $ 1,118.70 | $ 6.14 |
HypotheticalA | $ 1,000.00 | $ 1,019.41 | $ 5.85 |
Initial Class R | | | |
Actual | $ 1,000.00 | $ 1,119.90 | $ 4.81 |
HypotheticalA | $ 1,000.00 | $ 1,020.67 | $ 4.58 |
Service Class R | | | |
Actual | $ 1,000.00 | $ 1,119.30 | $ 5.29 |
HypotheticalA | $ 1,000.00 | $ 1,020.21 | $ 5.04 |
Service Class 2R | | | |
Actual | $ 1,000.00 | $ 1,118.40 | $ 6.09 |
HypotheticalA | $ 1,000.00 | $ 1,019.46 | $ 5.80 |
Investor Class R | | | |
Actual | $ 1,000.00 | $ 1,119.40 | $ 5.45 |
HypotheticalA | $ 1,000.00 | $ 1,020.06 | $ 5.19 |
A 5% return per year before expenses
* Expenses are equal to each Class' annualized expense ratio (shown in the table below); multiplied by the average account value over the period, multiplied by 184/365 (to reflect the one-half year period).
Annual Report
VIP Overseas Portfolio
Shareholder Expense Example - continued
| Annualized
Expense Ratio |
Initial Class | .90% |
Service Class | 1.00% |
Service Class 2 | 1.15% |
Initial Class R | .90% |
Service Class R | .99% |
Service Class 2R | 1.14% |
Investor Class R | 1.02% |
VIP Overseas Portfolio
VIP Overseas Portfolio
Investment Changes
Geographic Diversification (% of fund's net assets) |
As of December 31, 2006 |
| United Kingdom | 21.1% | |
| Japan | 16.4% | |
| France | 12.2% | |
| Germany | 10.1% | |
| Switzerland | 8.6% | |
| Australia | 4.8% | |
| United States of America | 4.0% | |
| Italy | 3.6% | |
| Spain | 3.3% | |
| Other | 15.9% | |

Percentages are adjusted for the effect of futures contracts, if applicable. |
|
As of June 30, 2006 |
| United Kingdom | 23.2% | |
| Japan | 19.8% | |
| France | 12.3% | |
| Germany | 9.9% | |
| Switzerland | 7.5% | |
| United States of America | 7.2% | |
| Italy | 3.5% | |
| Australia | 2.4% | |
| Netherlands | 2.4% | |
| Other | 11.8% | |

Percentages are adjusted for the effect of futures contracts, if applicable. |
Asset Allocation |
| % of fund's
net assets | % of fund's net assets
6 months ago |
Stocks | 96.7 | 94.1 |
Short-Term Investments and Net Other Assets | 3.3 | 5.9 |
Top Ten Stocks as of December 31, 2006 |
| % of fund's
net assets | % of fund's net assets
6 months ago |
BP PLC (United Kingdom, Oil, Gas & Consumable Fuels) | 2.3 | 2.7 |
Toyota Motor Corp. (Japan, Automobiles) | 2.0 | 1.5 |
Nintendo Co. Ltd. (Japan, Software) | 1.4 | 0.7 |
Roche Holding AG (participation certificate) (Switzerland, Pharmaceuticals) | 1.4 | 1.5 |
E.ON AG (Germany, Electric Utilities) | 1.4 | 1.2 |
ABB Ltd. (Reg.) (Switzerland, Electrical Equipment) | 1.4 | 0.6 |
Vodafone Group PLC (United Kingdom, Wireless Telecommunication Services) | 1.3 | 0.9 |
UBS AG (Reg.) (Switzerland, Capital Markets) | 1.3 | 1.3 |
Alstom SA (France, Electrical Equipment) | 1.2 | 0.7 |
National Australia Bank Ltd. (Australia, Commercial Banks) | 1.2 | 0.7 |
| 14.9 | |
Market Sectors as of December 31, 2006 |
| % of fund's
net assets | % of fund's net assets
6 months ago |
Financials | 28.7 | 26.8 |
Consumer Discretionary | 14.8 | 13.0 |
Industrials | 9.5 | 8.4 |
Energy | 8.2 | 9.5 |
Consumer Staples | 8.1 | 6.5 |
Information Technology | 8.0 | 10.4 |
Health Care | 6.0 | 8.4 |
Utilities | 4.7 | 2.4 |
Telecommunication Services | 4.6 | 3.2 |
Materials | 4.1 | 5.5 |
Annual Report
VIP Overseas Portfolio
Investments December 31, 2006
Showing Percentage of Net Assets
Common Stocks - 96.4% |
| Shares | | Value (Note 1) |
Australia - 4.8% |
Aristocrat Leisure Ltd. | 1,028,000 | | $ 12,902,901 |
Australian Wealth Management Ltd. | 2,397,900 | | 4,770,114 |
Babcock & Brown Japan Property Trust | 2,867,800 | | 4,731,428 |
BHP Billiton Ltd. | 740,600 | | 14,719,425 |
Computershare Ltd. | 1,733,600 | | 12,179,684 |
CSL Ltd. | 386,200 | | 19,929,109 |
Energy Resources of Australia Ltd. | 234,200 | | 3,845,452 |
Macquarie Bank Ltd. | 170,700 | | 10,635,863 |
National Australia Bank Ltd. | 1,241,300 | | 39,535,405 |
Rio Tinto Ltd. | 79,200 | | 4,645,272 |
Seek Ltd. | 779,600 | | 3,618,647 |
Silex Systems Ltd. (a) | 1,297,800 | | 5,583,434 |
Westfield Group Stapled Security unit | 841,600 | | 13,944,896 |
WorleyParsons Ltd. | 212,866 | | 3,575,815 |
TOTAL AUSTRALIA | | 154,617,445 |
Austria - 0.5% |
Oesterreichische Elektrizitaetswirtschafts AG (Verbund) | 120,100 | | 6,408,834 |
OMV AG | 165,800 | | 9,410,045 |
TOTAL AUSTRIA | | 15,818,879 |
Belgium - 0.6% |
InBev SA | 205,800 | | 13,568,556 |
KBC Groupe SA | 55,900 | | 6,855,944 |
TOTAL BELGIUM | | 20,424,500 |
Bermuda - 0.2% |
Aquarius Platinum Ltd. (United Kingdom) | 174,000 | | 3,779,336 |
Dufry South America Ltd. unit (a) | 151,000 | | 1,978,938 |
TOTAL BERMUDA | | 5,758,274 |
Brazil - 0.2% |
Vivo Participacoes SA (PN) sponsored ADR | 1,938,000 | | 7,945,800 |
Canada - 0.7% |
Cameco Corp. (d) | 440,900 | | 17,847,753 |
Talisman Energy, Inc. | 208,400 | | 3,538,868 |
TOTAL CANADA | | 21,386,621 |
Cayman Islands - 0.0% |
Melco PBL Entertainment (Macau) Ltd. sponsored ADR | 39,000 | | 829,140 |
China - 0.2% |
China Coal Energy Co. Ltd. (H Shares) | 531,000 | | 344,748 |
China Merchants Bank Co. Ltd. (H Shares) (a) | 217,500 | | 460,820 |
Global Bio-Chem Technology Group Co. Ltd. | 19,550,000 | | 6,585,115 |
TOTAL CHINA | | 7,390,683 |
Czech Republic - 0.5% |
Ceske Energeticke Zavody AS | 362,900 | | 16,722,700 |
|
| Shares | | Value (Note 1) |
Denmark - 0.8% |
Novozymes AS Series B | 133,400 | | $ 11,477,808 |
Vestas Wind Systems AS (a) | 381,600 | | 16,129,415 |
TOTAL DENMARK | | 27,607,223 |
Finland - 1.1% |
Fortum Oyj | 216,800 | | 6,170,889 |
Neste Oil Oyj | 182,900 | | 5,560,929 |
Nokia Corp. sponsored ADR | 824,000 | | 16,743,680 |
UPM-Kymmene Corp. sponsored ADR | 248,800 | | 6,284,688 |
TOTAL FINLAND | | 34,760,186 |
France - 12.2% |
Air France KLM (Reg.) | 190,700 | | 8,028,695 |
Alstom SA (a) | 292,700 | | 39,685,595 |
AXA SA | 247,415 | | 9,978,247 |
BNP Paribas SA | 214,002 | | 23,350,728 |
Cap Gemini SA | 327,600 | | 20,565,257 |
Carrefour SA | 150,000 | | 9,097,498 |
CNP Assurances | 110,400 | | 12,330,457 |
Dassault Systemes SA | 83,200 | | 4,415,594 |
Electricite de France | 183,000 | | 13,336,132 |
Financiere Marc de Lacharriere SA (Fimalac) | 108,700 | | 10,432,867 |
France Telecom SA | 106,661 | | 2,954,510 |
Groupe Danone | 116,800 | | 17,702,087 |
L'Air Liquide SA | 74,290 | | 17,644,171 |
L'Oreal SA | 182,795 | | 18,316,640 |
Michelin SA (Compagnie Generale des Etablissements) Series B | 89,300 | | 8,547,305 |
Neopost SA | 74,700 | | 9,383,592 |
Peugeot Citroen SA | 80,600 | | 5,341,688 |
Pinault Printemps-Redoute SA | 77,100 | | 11,522,336 |
Publicis Groupe SA | 192,100 | | 8,102,853 |
Remy Cointreau SA | 109,300 | | 7,070,595 |
Sanofi-Aventis sponsored ADR | 364,600 | | 16,833,582 |
Societe Generale Series A | 82,310 | | 13,974,404 |
Suez SA (France) | 211,300 | | 10,943,533 |
Total SA Series B | 317,000 | | 22,798,640 |
Veolia Environnement | 454,000 | | 35,003,255 |
Vinci SA | 172,900 | | 22,095,818 |
Vivendi Universal SA | 447,100 | | 17,477,641 |
TOTAL FRANCE | | 396,933,720 |
Germany - 9.8% |
Aareal Bank AG (a) | 169,511 | | 7,893,018 |
Allianz AG (Reg.) | 144,400 | | 29,486,480 |
BASF AG | 34,500 | | 3,353,745 |
Bayer AG | 122,600 | | 6,541,936 |
Beiersdorf AG | 312,300 | | 20,252,100 |
Deutsche Postbank AG | 95,700 | | 8,082,171 |
Deutsche Telekom AG sponsored ADR | 148,200 | | 2,697,240 |
Deutz AG (a) | 967,563 | | 12,837,636 |
E.ON AG | 325,844 | | 44,174,671 |
Common Stocks - continued |
| Shares | | Value (Note 1) |
Germany - continued |
ESCADA AG (a) | 373,821 | | $ 14,756,203 |
Fresenius Medical Care AG | 68,400 | | 9,117,761 |
GFK AG | 111,269 | | 4,821,171 |
Hugo Boss AG | 180,200 | | 9,753,902 |
KarstadtQuelle AG (a)(d) | 420,300 | | 12,185,166 |
Lanxess AG (a) | 244,300 | | 13,700,856 |
Merck KGaA | 32,900 | | 3,411,352 |
Metro AG | 196,100 | | 12,507,035 |
MPC Muenchmeyer Petersen Capital AG | 50,800 | | 4,480,690 |
Muenchener Rueckversicherungs-Gesellschaft AG (Reg.) | 61,000 | | 10,503,010 |
Puma AG | 33,800 | | 13,193,611 |
Q-Cells AG | 89,000 | | 4,003,150 |
RWE AG | 61,800 | | 6,812,628 |
SAP AG sponsored ADR | 93,000 | | 4,938,300 |
SGL Carbon AG (a) | 592,200 | | 14,627,898 |
Siemens AG sponsored ADR | 313,500 | | 30,895,425 |
Wincor Nixdorf AG | 94,200 | | 14,657,404 |
TOTAL GERMANY | | 319,684,559 |
Greece - 0.8% |
Alpha Bank AE | 503,900 | | 15,234,197 |
Bank of Piraeus | 369,075 | | 11,898,714 |
TOTAL GREECE | | 27,132,911 |
Hong Kong - 0.4% |
China Unicom Ltd. | 5,250,000 | | 7,817,250 |
Dynasty Fine Wines Group Ltd. | 10,966,000 | | 3,975,691 |
TOTAL HONG KONG | | 11,792,941 |
India - 0.4% |
Infosys Technologies Ltd. | 124,666 | | 6,335,175 |
Satyam Computer Services Ltd. | 477,960 | | 5,237,354 |
TOTAL INDIA | | 11,572,529 |
Ireland - 1.6% |
Allied Irish Banks PLC | 700,300 | | 21,282,117 |
Irish Life & Permanent PLC | 735,300 | | 20,288,530 |
Ryanair Holdings PLC sponsored ADR (a) | 119,400 | | 9,731,100 |
TOTAL IRELAND | | 51,301,747 |
Israel - 0.7% |
ECI Telecom Ltd. (a) | 1,550,200 | | 13,424,732 |
Mizrahi Tefahot Bank Ltd. | 749,100 | | 5,631,997 |
Vizrt Ltd. (a) | 273,100 | | 3,911,931 |
TOTAL ISRAEL | | 22,968,660 |
Italy - 3.6% |
Azimut Holdings Spa | 518,100 | | 6,941,872 |
Banca Intesa Spa | 2,436,700 | | 18,819,048 |
Banche Popolari Unite SCpA | 438,500 | | 12,052,858 |
ENI Spa | 809,686 | | 27,237,837 |
FASTWEB Spa | 111,700 | | 6,388,242 |
|
| Shares | | Value (Note 1) |
Lottomatica Spa | 155,800 | | $ 6,475,032 |
Pirelli & C. Real Estate Spa | 78,000 | | 5,353,701 |
Unicredito Italiano Spa | 3,963,500 | | 34,744,548 |
TOTAL ITALY | | 118,013,138 |
Japan - 16.4% |
Aeon Fantasy Co. Ltd. | 84,200 | | 2,821,991 |
Canon, Inc. (d) | 490,600 | | 27,763,054 |
Capcom Co. Ltd. | 175,500 | | 3,162,096 |
Daiwa Securities Group, Inc. (a) | 2,176,000 | | 24,401,176 |
Fast Retailing Co. Ltd. | 64,700 | | 6,173,809 |
Fujitsu Ltd. | 1,852,000 | | 14,529,761 |
Honda Motor Co. Ltd. | 97,400 | | 3,851,196 |
Hoya Corp. | 220,400 | | 8,590,139 |
Japan Tobacco, Inc. | 1,892 | | 9,138,177 |
KOEI Co. Ltd. (d) | 131,700 | | 2,229,110 |
Leopalace21 Corp. | 114,100 | | 3,641,999 |
Matsushita Electric Industrial Co. Ltd. sponsored ADR | 281,000 | | 5,645,290 |
Millea Holdings, Inc. | 284,500 | | 10,036,959 |
Mitsubishi Estate Co. Ltd. | 1,130,000 | | 29,234,775 |
Mitsubishi UFJ Financial Group, Inc. | 1,673 | | 20,828,850 |
Mitsui Fudosan Co. Ltd. | 427,000 | | 10,419,446 |
Mizuho Financial Group, Inc. | 4,709 | | 33,621,588 |
Nafco Co. Ltd. | 161,200 | | 4,184,024 |
Nidec Corp. | 152,100 | | 11,754,053 |
Nintendo Co. Ltd. | 173,700 | | 45,084,670 |
NSK Ltd. | 1,903,000 | | 18,750,265 |
Organo Corp. | 291,000 | | 3,001,663 |
ORIX Corp. | 80,790 | | 23,378,543 |
Point, Inc. (d) | 97,600 | | 6,411,021 |
Sankei Building Co. Ltd. | 22,100 | | 194,547 |
Sompo Japan Insurance, Inc. | 517,000 | | 6,318,648 |
Sony Corp. sponsored ADR | 170,500 | | 7,302,515 |
St. Marc Holdings Co. Ltd. | 48,000 | | 3,406,972 |
Stanley Electric Co. Ltd. | 351,500 | | 7,041,810 |
Sumco Corp. | 123,000 | | 10,393,784 |
Sumitomo Forestry Co. Ltd. | 581,000 | | 6,295,590 |
Sumitomo Mitsui Financial Group, Inc. | 2,728 | | 27,955,985 |
Sumitomo Trust & Banking Co. Ltd. | 1,565,600 | | 16,412,170 |
T&D Holdings, Inc. | 340,450 | | 22,506,018 |
Tokuyama Corp. | 464,000 | | 7,062,310 |
Toyota Motor Corp. | 950,700 | | 63,844,259 |
USS Co. Ltd. | 189,400 | | 12,329,693 |
Xebio Co. Ltd. | 158,200 | | 4,969,912 |
Yamada Denki Co. Ltd. | 43,200 | | 3,665,015 |
Yamaha Motor Co. Ltd. (a) | 161,600 | | 5,076,724 |
TOTAL JAPAN | | 533,429,607 |
Kazakhstan - 0.0% |
JSC Halyk Bank of Kazakhstan GDR (a)(e) | 54,900 | | 1,207,800 |
Luxembourg - 0.3% |
SES Global SA FDR unit | 562,747 | | 9,806,789 |
Common Stocks - continued |
| Shares | | Value (Note 1) |
Netherlands - 2.9% |
ABN-AMRO Holding NV sponsored ADR | 220,800 | | $ 7,076,640 |
Heineken NV (Bearer) | 202,900 | | 9,651,305 |
IHC Caland NV | 497,500 | | 17,109,627 |
ING Groep NV (Certificaten Van Aandelen) | 223,724 | | 9,881,889 |
Koninklijke KPN NV sponsored ADR (d) | 943,000 | | 13,447,180 |
Koninklijke Numico NV | 219,500 | | 11,808,694 |
Koninklijke Philips Electronics NV (NY Shares) | 578,800 | | 21,751,304 |
Mittal Steel Co. NV | 108,100 | | 4,563,982 |
TOTAL NETHERLANDS | | 95,290,621 |
Norway - 1.9% |
Acta Holding ASA | 1,234,000 | | 6,531,247 |
Aker Kvaerner ASA | 156,200 | | 19,490,710 |
DnB Nor ASA | 687,800 | | 9,762,757 |
Schibsted ASA (B Shares) | 253,100 | | 9,052,406 |
Statoil ASA | 264,000 | | 6,997,009 |
Telenor ASA sponsored ADR | 195,900 | | 11,054,637 |
TOTAL NORWAY | | 62,888,766 |
Singapore - 0.1% |
Singapore Exchange Ltd. | 1,237,000 | | 4,598,963 |
South Africa - 0.6% |
African Bank Investments Ltd. | 1,214,900 | | 4,959,483 |
Impala Platinum Holdings Ltd. | 157,400 | | 4,133,828 |
JSE Ltd. | 708,100 | | 5,306,202 |
Sasol Ltd. sponsored ADR | 119,800 | | 4,420,620 |
TOTAL SOUTH AFRICA | | 18,820,133 |
Spain - 3.3% |
Altadis SA (Spain) | 251,900 | | 13,185,940 |
Banco Bilbao Vizcaya Argentaria SA | 1,352,700 | | 32,545,962 |
Banco Pastor SA | 374,800 | | 7,298,462 |
Banco Santander Central Hispano SA | 1,340,800 | | 25,019,328 |
Gestevision Telecinco SA | 4,177 | | 119,002 |
Telefonica SA | 1,440,380 | | 30,608,075 |
TOTAL SPAIN | | 108,776,769 |
Sweden - 0.8% |
Modern Times Group AB (MTG) (B Shares) | 152,900 | | 10,050,835 |
Telefonaktiebolaget LM Ericsson (B Shares) sponsored ADR | 374,600 | | 15,070,158 |
TOTAL SWEDEN | | 25,120,993 |
Switzerland - 8.6% |
ABB Ltd.: | | | |
(Reg.) | 2,148,790 | | 38,517,627 |
sponsored ADR | 311,100 | | 5,593,578 |
BKW FMB Energie AG | 31,373 | | 3,688,216 |
Compagnie Financiere Richemont unit | 291,416 | | 16,974,065 |
|
| Shares | | Value (Note 1) |
Credit Suisse Group (Reg.) | 131,405 | | $ 9,178,639 |
EFG International (a) | 177,230 | | 6,680,929 |
Nestle SA (Reg.) | 78,443 | | 27,864,817 |
Nobel Biocare Holding AG (Switzerland) | 53,188 | | 15,719,248 |
Novartis AG (Reg.) | 359,171 | | 20,630,782 |
Roche Holding AG (participation certificate) | 246,794 | | 44,238,475 |
Schindler Holding AG (Reg.) | 123,000 | | 7,668,895 |
Societe Generale de Surveillance Holding SA (SGS) (Reg.) | 18,325 | | 20,415,398 |
Sulzer AG (Reg.) | 11,905 | | 13,546,278 |
Swisscom AG (Reg.) | 21,277 | | 8,051,205 |
UBS AG (Reg.) | 689,702 | | 41,609,722 |
TOTAL SWITZERLAND | | 280,377,874 |
Taiwan - 0.2% |
Shin Kong Financial Holding Co. Ltd. | 4,909,000 | | 5,287,890 |
Thailand - 0.4% |
Bangkok Bank Ltd. PCL (For. Reg.) | 3,603,500 | | 11,689,774 |
United Kingdom - 21.1% |
Aegis Group PLC | 2,734,700 | | 7,498,465 |
Amvescap PLC | 781,300 | | 9,120,082 |
Anglo American PLC (United Kingdom) | 348,800 | | 17,028,416 |
AstraZeneca PLC (United Kingdom) | 331,100 | | 17,730,405 |
BAE Systems PLC | 2,041,300 | | 17,021,434 |
Barclays PLC | 818,100 | | 11,891,083 |
Benfield Group PLC | 1,671,800 | | 11,705,636 |
BG Group PLC | 1,615,700 | | 21,929,495 |
BHP Billiton PLC | 745,995 | | 13,653,685 |
BlueBay Asset Management | 432,000 | | 3,316,687 |
BP PLC | 6,558,406 | | 73,344,833 |
British Land Co. PLC | 519,700 | | 17,446,094 |
BT Group PLC | 273,600 | | 1,638,590 |
BT Group PLC sponsored ADR | 83,700 | | 5,012,793 |
Burberry Group PLC | 675,700 | | 8,542,497 |
Cable & Wireless PLC | 2,972,200 | | 9,182,947 |
Diageo PLC | 1,191,200 | | 23,618,518 |
Gallaher Group PLC sponsored ADR | 12,300 | | 1,106,385 |
GlaxoSmithKline PLC | 1,271,900 | | 33,552,722 |
Gyrus Group PLC (a) | 1,162,500 | | 8,555,130 |
HSBC Holdings PLC (United Kingdom) (Reg.) | 1,071,526 | | 19,641,072 |
Imperial Tobacco Group PLC sponsored ADR | 11,400 | | 900,942 |
Informa PLC | 919,700 | | 10,753,632 |
International Power PLC | 1,396,400 | | 10,440,554 |
Jardine Lloyd Thompson Group PLC | 1,843,173 | | 15,179,825 |
Lloyds TSB Group PLC | 524,000 | | 5,938,230 |
Man Group plc | 2,780,500 | | 28,467,649 |
Marks & Spencer Group PLC | 1,215,500 | | 17,069,028 |
Mothercare PLC | 825,300 | | 6,283,721 |
Prudential PLC | 1,702,600 | | 23,325,717 |
Reed Elsevier PLC | 2,702,800 | | 29,757,829 |
Reuters Group PLC | 4,110,900 | | 35,848,873 |
Common Stocks - continued |
| Shares | | Value (Note 1) |
United Kingdom - continued |
Reuters Group PLC sponsored ADR | 34,900 | | $ 1,822,827 |
Rio Tinto PLC (Reg.) | 152,706 | | 8,112,124 |
Royal Bank of Scotland Group PLC | 531,500 | | 20,746,519 |
Royal Dutch Shell PLC: | | | |
Class A sponsored ADR | 317,800 | | 22,497,062 |
Class B | 153,800 | | 5,471,435 |
Taylor Nelson Sofres PLC | 3,528,900 | | 13,892,169 |
Tesco PLC | 4,761,600 | | 37,722,989 |
The Weir Group PLC | 1,017,400 | | 10,640,638 |
Vodafone Group PLC | 15,149,662 | | 42,085,762 |
Xstrata PLC | 140,400 | | 7,012,001 |
TOTAL UNITED KINGDOM | | 686,506,495 |
United States of America - 0.7% |
Estee Lauder Companies, Inc. Class A (d) | 415,900 | | 16,977,038 |
Merck & Co., Inc. | 110,600 | | 4,822,160 |
TOTAL UNITED STATES OF AMERICA | | 21,799,198 |
TOTAL COMMON STOCKS (Cost $2,453,526,305) | 3,138,263,328 |
Nonconvertible Preferred Stocks - 0.3% |
| | | |
Germany - 0.3% |
Porsche AG (non-vtg.)
(Cost $7,685,783) | 6,855 | | 8,724,715 |
Money Market Funds - 5.3% |
| Shares | | Value (Note 1) |
Fidelity Cash Central Fund, 5.37% (b) | 106,327,661 | | $ 106,327,661 |
Fidelity Securities Lending Cash Central Fund, 5.38% (b)(c) | 68,259,519 | | 68,259,519 |
TOTAL MONEY MARKET FUNDS (Cost $174,587,180) | 174,587,180 |
TOTAL INVESTMENT PORTFOLIO - 102.0% (Cost $2,635,799,268) | | 3,321,575,223 |
NET OTHER ASSETS - (2.0)% | | (65,819,655) |
NET ASSETS - 100% | $ 3,255,755,568 |
Legend |
(a) Non-income producing |
(b) Affiliated fund that is available only to investment companies and other accounts managed by Fidelity Investments. The rate quoted is the annualized seven-day yield of the fund at period end. A complete unaudited listing of the fund's holdings as of its most recent quarter end is available upon request. |
(c) Investment made with cash collateral received from securities on loan. |
(d) Security or a portion of the security is on loan at period end. |
(e) Security exempt from registration under Rule 144A of the Securities Act of 1933. These securities may be resold in transactions exempt from registration, normally to qualified institutional buyers. At the end of the period, the value of these securities amounted to $1,207,800 or 0.0% of net assets. |
Affiliated Central Funds |
Information regarding fiscal year to date income earned by the Fund from investments in Fidelity Central Funds is as follows: |
Fund | Income earned |
Fidelity Cash Central Fund | $ 6,363,823 |
Fidelity Securities Lending Cash Central Fund | 2,850,920 |
Total | $ 9,214,743 |
See accompanying notes which are an integral part of the financial statements.
Annual Report
VIP Overseas Portfolio
Financial Statements
Statement of Assets and Liabilities
| December 31, 2006 |
| | |
Assets | | |
Investment in securities, at value (including securities loaned of $65,332,646) - See accompanying schedule: Unaffiliated issuers (cost $2,461,212,088) | $ 3,146,988,043 | |
Fidelity Central Funds (cost $174,587,180) | 174,587,180 | |
Total Investments (cost $2,635,799,268) | | $ 3,321,575,223 |
Foreign currency held at value (cost $473,818) | | 473,822 |
Receivable for investments sold | | 11,907,042 |
Receivable for fund shares sold | | 95,653 |
Dividends receivable | | 2,243,845 |
Interest receivable | | 382,136 |
Prepaid expenses | | 14,634 |
Other receivables | | 448,604 |
Total assets | | 3,337,140,959 |
| | |
Liabilities | | |
Payable for investments purchased | $ 8,909,168 | |
Payable for fund shares redeemed | 602,452 | |
Accrued management fee | 1,910,637 | |
Distribution fees payable | 199,112 | |
Other affiliated payables | 373,310 | |
Other payables and accrued expenses | 1,131,193 | |
Collateral on securities loaned, at value | 68,259,519 | |
Total liabilities | | 81,385,391 |
| | |
Net Assets | | $ 3,255,755,568 |
Net Assets consist of: | | |
Paid in capital | | $ 2,309,866,589 |
Undistributed net investment income | | 50,264,705 |
Accumulated undistributed net realized gain (loss) on investments and foreign currency transactions | | 210,238,563 |
Net unrealized appreciation (depreciation) on investments and assets and liabilities in foreign currencies | | 685,385,711 |
Net Assets | | $ 3,255,755,568 |
Statement of Assets and Liabilities - continued
| December 31, 2006 |
| | |
Initial Class:
Net Asset Value, offering price and redemption price per share ($1,624,901,402 ÷ 67,805,282 shares) | | $ 23.96 |
| | |
Service Class:
Net Asset Value, offering price and redemption price per share ($362,059,669 ÷ 15,175,359 shares) | | $ 23.86 |
| | |
Service Class 2:
Net Asset Value, offering price and redemption price per share ($703,421,056 ÷ 29,622,780 shares) | | $ 23.75 |
| | |
Initial Class R:
Net Asset Value, offering price and redemption price per share ($240,692,745 ÷ 10,060,860 shares) | | $ 23.92 |
| | |
| | |
Service Class R:
Net Asset Value, offering price and redemption price per share ($133,933,774 ÷ 5,620,715 shares) | | $ 23.83 |
| | |
Service Class 2R:
Net Asset Value, offering price and redemption price per share ($68,728,514 ÷ 2,911,382 shares) | | $ 23.61 |
| | |
Investor Class R:
Net Asset Value, offering price and redemption price per share ($122,018,408 ÷ 5,103,196 shares) | | $ 23.91 |
See accompanying notes which are an integral part of the financial statements.
VIP Overseas Portfolio
Statement of Operations
| Year ended December 31, 2006 |
| | |
Investment Income | | |
Dividends | | $ 73,555,182 |
Interest | | 75,697 |
Income from Fidelity Central Funds (including $2,850,920 from security lending) | | 9,214,743 |
| | 82,845,622 |
Less foreign taxes withheld | | (5,548,559) |
Total income | | 77,297,063 |
| | |
Expenses | | |
Management fee | $ 21,497,437 | |
Transfer agent fees | 2,153,778 | |
Distribution fees | 2,132,831 | |
Accounting and security lending fees | 1,400,014 | |
Custodian fees and expenses | 792,092 | |
Independent trustees' compensation | 11,016 | |
Appreciation in deferred trustee compensation account | 4,547 | |
Audit | 81,435 | |
Legal | 63,928 | |
Miscellaneous | 673,246 | |
Total expenses before reductions | 28,810,324 | |
Expense reductions | (2,257,767) | 26,552,557 |
Net investment income (loss) | | 50,744,506 |
Realized and Unrealized Gain (Loss) Net realized gain (loss) on: | | |
Investment securities: | | |
Unaffiliated issuers (net of foreign taxes of $633,524) | 381,144,858 | |
Foreign currency transactions | 75,904 | |
Total net realized gain (loss) | | 381,220,762 |
Change in net unrealized appreciation (depreciation) on: Investment securities (net of increase in deferred foreign taxes of $138,498) | 68,354,343 | |
Assets and liabilities in foreign currencies | 71,637 | |
Total change in net unrealized appreciation (depreciation) | | 68,425,980 |
Net gain (loss) | | 449,646,742 |
Net increase (decrease) in net assets resulting from operations | | $ 500,391,248 |
Statement of Changes in Net Assets
| Year ended
December 31, 2006 | Year ended
December 31, 2005 |
Increase (Decrease) in Net Assets | | |
Operations | | |
Net investment income (loss) | $ 50,744,506 | $ 24,787,096 |
Net realized gain (loss) | 381,220,762 | 344,848,271 |
Change in net unrealized appreciation (depreciation) | 68,425,980 | 65,476,773 |
Net increase (decrease) in net assets resulting
from operations | 500,391,248 | 435,112,140 |
Distributions to shareholders from net investment income | (24,249,132) | (14,837,058) |
Distributions to shareholders from net realized gain | (17,825,284) | (12,260,637) |
Total distributions | (42,074,416) | (27,097,695) |
Share transactions - net increase (decrease) | 37,019,715 | (27,675,205) |
Redemption fees | 70,975 | 31,974 |
Total increase (decrease) in net assets | 495,407,522 | 380,371,214 |
| | |
Net Assets | | |
Beginning of period | 2,760,348,046 | 2,379,976,832 |
End of period (including undistributed net investment income of $50,264,705 and undistributed net investment income of $24,125,361, respectively) | $ 3,255,755,568 | $ 2,760,348,046 |
See accompanying notes which are an integral part of the financial statements.
Annual Report
Financial Highlights - Initial Class
Years ended December 31, | 2006 | 2005 | 2004 | 2003 | 2002 |
Selected Per-Share Data | | | | | |
Net asset value, beginning of period | $ 20.60 | $ 17.51 | $ 15.59 | $ 10.98 | $ 13.88 |
Income from Investment Operations | | | | | |
Net investment income (loss) C | .38 | .20 | .13 | .11 | .10 |
Net realized and unrealized gain (loss) | 3.30 | 3.10 | 1.97 | 4.60 | (2.90) |
Total from investment operations | 3.68 | 3.30 | 2.10 | 4.71 | (2.80) |
Distributions from net investment income | (.19) | (.12) | (.18) | (.10) | (.10) |
Distributions from net realized gain | (.13) | (.09) | - | - | - |
Total distributions | (.32) | (.21) | (.18) | (.10) | (.10) |
Redemption fees added to paid in capital C,G | - | - | - | - | - |
Net asset value, end of period | $ 23.96 | $ 20.60 | $ 17.51 | $ 15.59 | $ 10.98 |
Total Return A,B | 18.09% | 19.06% | 13.57% | 43.37% | (20.28)% |
Ratios to Average Net Assets D,F | | | | | |
Expenses before reductions | .88% | .89% | .91% | .90% | .90% |
Expenses net of fee waivers, if any | .88% | .89% | .91% | .90% | .90% |
Expenses net of all reductions | .81% | .82% | .87% | .86% | .86% |
Net investment income (loss) | 1.76% | 1.11% | .80% | .87% | .79% |
Supplemental Data | | | | | |
Net assets, end of period (000 omitted) | $ 1,624,901 | $ 1,549,179 | $ 1,491,485 | $ 1,436,137 | $ 1,031,489 |
Portfolio turnover rate E | 123% | 92% | 84% | 99% | 77% |
A Total returns do not reflect charges attributable to your insurance company's separate account. Inclusion of these charges would reduce the total returns shown.
B Total returns would have been lower had certain expenses not been reduced during the periods shown.
C Calculated based on average shares outstanding during the period.
D Fees and expenses of the underlying Fidelity Central Funds are not included in the Fund's expense ratio. The Fund indirectly bears its proportionate share of the expenses of any underlying Fidelity Central Funds.
E Amount does not include the portfolio activity of any underlying Fidelity Central Funds.
F Expense ratios reflect operating expenses of the class. Expenses before reductions do not reflect amounts reimbursed by the investment adviser or reductions from brokerage service arrangements or other expense offset arrangements and do not represent the amount paid by the class during periods when reimbursements or reductions occur. Expenses net of fee waivers reflect expenses after reimbursement by the investment adviser but prior to reductions from brokerage service arrangements or other expense offset arrangements. Expenses net of all reductions represent the net expenses paid by the class.
G Amount represents less than $.01 per share.
Financial Highlights - Service Class
Years ended December 31, | 2006 | 2005 | 2004 | 2003 | 2002 |
Selected Per-Share Data | | | | | |
Net asset value, beginning of period | $ 20.52 | $ 17.44 | $ 15.53 | $ 10.94 | $ 13.83 |
Income from Investment Operations | | | | | |
Net investment income (loss) C | .36 | .18 | .11 | .09 | .09 |
Net realized and unrealized gain (loss) | 3.28 | 3.09 | 1.97 | 4.59 | (2.89) |
Total from investment operations | 3.64 | 3.27 | 2.08 | 4.68 | (2.80) |
Distributions from net investment income | (.17) | (.10) | (.17) | (.09) | (.09) |
Distributions from net realized gain | (.13) | (.09) | - | - | - |
Total distributions | (.30) | (.19) | (.17) | (.09) | (.09) |
Redemption fees added to paid in capital C,G | - | - | - | - | - |
Net asset value, end of period | $ 23.86 | $ 20.52 | $ 17.44 | $ 15.53 | $ 10.94 |
Total Return A,B | 17.95% | 18.97% | 13.49% | 43.20% | (20.34)% |
Ratios to Average Net Assets D,F | | | | | |
Expenses before reductions | .98% | .99% | 1.01% | 1.00% | 1.00% |
Expenses net of fee waivers, if any | .98% | .99% | 1.01% | 1.00% | 1.00% |
Expenses net of all reductions | .91% | .92% | .97% | .96% | .96% |
Net investment income (loss) | 1.66% | 1.02% | .69% | .77% | .69% |
Supplemental Data | | | | | |
Net assets, end of period (000 omitted) | $ 362,060 | $ 329,759 | $ 322,649 | $ 246,632 | $ 177,322 |
Portfolio turnover rate E | 123% | 92% | 84% | 99% | 77% |
A Total returns do not reflect charges attributable to your insurance company's separate account. Inclusion of these charges would reduce the total returns shown.
B Total returns would have been lower had certain expenses not been reduced during the periods shown.
C Calculated based on average shares outstanding during the period.
D Fees and expenses of the underlying Fidelity Central Funds are not included in the Fund's expense ratio. The Fund indirectly bears its proportionate share of the expenses of any underlying Fidelity Central Funds.
E Amount does not include the portfolio activity of any underlying Fidelity Central Funds.
F Expense ratios reflect operating expenses of the class. Expenses before reductions do not reflect amounts reimbursed by the investment adviser or reductions from brokerage service arrangements or other expense offset arrangements and do not represent the amount paid by the class during periods when reimbursements or reductions occur. Expenses net of fee waivers reflect expenses after reimbursement by the investment adviser but prior to reductions from brokerage service arrangements or other expense offset arrangements. Expenses net of all reductions represent the net expenses paid by the class.
G Amount represents less than $.01 per share.
See accompanying notes which are an integral part of the financial statements.
VIP Overseas Portfolio
Financial Highlights - Service Class 2
Years ended December 31, | 2006 | 2005 | 2004 | 2003 | 2002 |
Selected Per-Share Data | | | | | |
Net asset value, beginning of period | $ 20.43 | $ 17.39 | $ 15.50 | $ 10.90 | $ 13.81 |
Income from Investment Operations | | | | | |
Net investment income (loss) C | .33 | .14 | .08 | .08 | .07 |
Net realized and unrealized gain (loss) | 3.27 | 3.08 | 1.97 | 4.58 | (2.88) |
Total from investment operations | 3.60 | 3.22 | 2.05 | 4.66 | (2.81) |
Distributions from net investment income | (.15) | (.09) | (.16) | (.06) | (.10) |
Distributions from net realized gain | (.13) | (.09) | - | - | - |
Total distributions | (.28) | (.18) | (.16) | (.06) | (.10) |
Redemption fees added to paid in capital C,G | - | - | - | - | - |
Net asset value, end of period | $ 23.75 | $ 20.43 | $ 17.39 | $ 15.50 | $ 10.90 |
Total Return A,B | 17.83% | 18.72% | 13.31% | 43.04% | (20.46)% |
Ratios to Average Net Assets D,F | | | | | |
Expenses before reductions | 1.13% | 1.14% | 1.16% | 1.16% | 1.16% |
Expenses net of fee waivers, if any | 1.13% | 1.14% | 1.16% | 1.16% | 1.16% |
Expenses net of all reductions | 1.06% | 1.07% | 1.12% | 1.12% | 1.12% |
Net investment income (loss) | 1.51% | .79% | .54% | .61% | .53% |
Supplemental Data | | | | | |
Net assets, end of period (000 omitted) | $ 703,421 | $ 502,801 | $ 319,708 | $ 140,822 | $ 47,824 |
Portfolio turnover rate E | 123% | 92% | 84% | 99% | 77% |
A Total returns do not reflect charges attributable to your insurance company's separate account. Inclusion of these charges would reduce the total returns shown.
B Total returns would have been lower had certain expenses not been reduced during the periods shown.
C Calculated based on average shares outstanding during the period.
D Fees and expenses of the underlying Fidelity Central Funds are not included in the Fund's expense ratio. The Fund indirectly bears its proportionate share of the expenses of any underlying Fidelity Central Funds.
E Amount does not include the portfolio activity of any underlying Fidelity Central Funds.
F Expense ratios reflect operating expenses of the class. Expenses before reductions do not reflect amounts reimbursed by the investment adviser or reductions from brokerage service arrangements or other expense offset arrangements and do not represent the amount paid by the class during periods when reimbursements or reductions occur. Expenses net of fee waivers reflect expenses after reimbursement by the investment adviser but prior to reductions from brokerage service arrangements or other expense offset arrangements. Expenses net of all reductions represent the net expenses paid by the class.
G Amount represents less than $.01 per share.
Financial Highlights - Initial Class R
Years ended December 31, | 2006 | 2005 | 2004 | 2003 | 2002 H |
Selected Per-Share Data | | | | | |
Net asset value, beginning of period | $ 20.57 | $ 17.49 | $ 15.57 | $ 10.98 | $ 14.05 |
Income from Investment Operations | | | | | |
Net investment income (loss) E | .38 | .19 | .12 | .11 | .06 |
Net realized and unrealized gain (loss) | 3.29 | 3.10 | 1.98 | 4.59 | (3.13) |
Total from investment operations | 3.67 | 3.29 | 2.10 | 4.70 | (3.07) |
Distributions from net investment income | (.19) | (.12) | (.18) | (.11) | - |
Distributions from net realized gain | (.13) | (.09) | - | - | - |
Total distributions | (.32) | (.21) | (.18) | (.11) | - |
Redemption fees added to paid in capital E,J | - | - | - | - | - |
Net asset value, end of period | $ 23.92 | $ 20.57 | $ 17.49 | $ 15.57 | $ 10.98 |
Total Return B,C,D | 18.08% | 19.05% | 13.59% | 43.32% | (21.85)% |
Ratios to Average Net Assets F,I | | | | | |
Expenses before reductions | .88% | .89% | .91% | .90% | .91% A |
Expenses net of fee waivers, if any | .88% | .89% | .91% | .90% | .91% A |
Expenses net of all reductions | .81% | .82% | .87% | .86% | .87% A |
Net investment income (loss) | 1.76% | 1.08% | .79% | .87% | .79% A |
Supplemental Data | | | | | |
Net assets, end of period (000 omitted) | $ 240,693 | $ 184,245 | $ 132,064 | $ 39,466 | $ 15,649 |
Portfolio turnover rate G | 123% | 92% | 84% | 99% | 77% |
A Annualized
B Total returns for periods of less than one year are not annualized.
C Total returns do not reflect charges attributable to your insurance company's separate account. Inclusion of these charges would reduce the total returns shown.
D Total returns would have been lower had certain expenses not been reduced during the periods shown.
E Calculated based on average shares outstanding during the period.
F Fees and expenses of the underlying Fidelity Central Funds are not included in the Fund's expense ratio. The Fund indirectly bears its proportionate share of the expenses of any underlying Fidelity Central Funds.
G Amount does not include the portfolio activity of any underlying Fidelity Central Funds.
H For the period April 24, 2002 (commencement of sale of shares) to December 31, 2002.
I Expense ratios reflect operating expenses of the class. Expenses before reductions do not reflect amounts reimbursed by the investment adviser or reductions from brokerage service arrangements or other expense offset arrangements and do not represent the amount paid by the class during periods when reimbursements or reductions occur. Expense ratios before reductions for start-up periods may not be representative of longer-term operating periods. Expenses net of fee waivers reflect expenses after reimbursement by the investment adviser but prior to reductions from brokerage service arrangements or other expense offset arrangements. Expenses net of all reductions represent the net expenses paid by the class.
J Amount represents less than $.01 per share.
See accompanying notes which are an integral part of the financial statements.
Annual Report
Financial Highlights - Service Class R
Years ended December 31, | 2006 | 2005 | 2004 | 2003 | 2002 H |
Selected Per-Share Data | | | | | |
Net asset value, beginning of period | $ 20.50 | $ 17.43 | $ 15.52 | $ 10.94 | $ 14.01 |
Income from Investment Operations | | | | | |
Net investment income (loss) E | .36 | .17 | .11 | .10 | .05 |
Net realized and unrealized gain (loss) | 3.27 | 3.09 | 1.97 | 4.58 | (3.12) |
Total from investment operations | 3.63 | 3.26 | 2.08 | 4.68 | (3.07) |
Distributions from net investment income | (.17) | (.10) | (.17) | (.10) | - |
Distributions from net realized gain | (.13) | (.09) | - | - | - |
Total distributions | (.30) | (.19) | (.17) | (.10) | - |
Redemption fees added to paid in capital E,J | - | - | - | - | - |
Net asset value, end of period | $ 23.83 | $ 20.50 | $ 17.43 | $ 15.52 | $ 10.94 |
Total Return B,C,D | 17.95% | 18.92% | 13.50% | 43.25% | (21.91)% |
Ratios to Average Net Assets F,I | | | | | |
Expenses before reductions | .98% | .99% | 1.01% | 1.00% | 1.01% A |
Expenses net of fee waivers, if any | .98% | .99% | 1.01% | 1.00% | 1.01% A |
Expenses net of all reductions | .91% | .92% | .96% | .96% | .97% A |
Net investment income (loss) | 1.66% | .96% | .70% | .77% | .69% A |
Supplemental Data | | | | | |
Net assets, end of period (000 omitted) | $ 133,934 | $ 115,449 | $ 86,509 | $ 56,141 | $ 17,997 |
Portfolio turnover rate G | 123% | 92% | 84% | 99% | 77% |
A Annualized
B Total returns for periods of less than one year are not annualized.
C Total returns do not reflect charges attributable to your insurance company's separate account. Inclusion of these charges would reduce the total returns shown.
D Total returns would have been lower had certain expenses not been reduced during the periods shown.
E Calculated based on average shares outstanding during the period.
F Fees and expenses of the underlying Fidelity Central Funds are not included in the Fund's expense ratio. The Fund indirectly bears its proportionate share of the expenses of any underlying Fidelity Central Funds.
G Amount does not include the portfolio activity of any underlying Fidelity Central Funds.
H For the period April 24, 2002 (commencement of sale of shares) to December 31, 2002.
I Expense ratios reflect operating expenses of the class. Expenses before reductions do not reflect amounts reimbursed by the investment adviser or reductions from brokerage service arrangements or other expense offset arrangements and do not represent the amount paid by the class during periods when reimbursements or reductions occur. Expense ratios before reductions for start-up periods may not be representative of longer-term operating periods. Expenses net of fee waivers reflect expenses after reimbursement by the investment adviser but prior to reductions from brokerage service arrangements or other expense offset arrangements. Expenses net of all reductions represent the net expenses paid by the class.
J Amount represents less than $.01 per share.
Financial Highlights - Service Class 2R
Years ended December 31, | 2006 | 2005 | 2004 | 2003 | 2002 H |
Selected Per-Share Data | | | | | |
Net asset value, beginning of period | $ 20.32 | $ 17.30 | $ 15.42 | $ 10.90 | $ 13.96 |
Income from Investment Operations | | | | | |
Net investment income (loss) E | .32 | .14 | .08 | .08 | .04 |
Net realized and unrealized gain (loss) | 3.26 | 3.07 | 1.96 | 4.55 | (3.10) |
Total from investment operations | 3.58 | 3.21 | 2.04 | 4.63 | (3.06) |
Distributions from net investment income | (.16) | (.10) | (.16) | (.11) | - |
Distributions from net realized gain | (.13) | (.09) | - | - | - |
Total distributions | (.29) | (.19) | (.16) | (.11) | - |
Redemption fees added to paid in capital E,J | - | - | - | - | - |
Net asset value, end of period | $ 23.61 | $ 20.32 | $ 17.30 | $ 15.42 | $ 10.90 |
Total Return B,C,D | 17.81% | 18.74% | 13.32% | 43.00% | (21.92)% |
Ratios to Average Net Assets F,I | | | | | |
Expenses before reductions | 1.13% | 1.14% | 1.16% | 1.15% | 1.17% A |
Expenses net of fee waivers, if any | 1.13% | 1.14% | 1.16% | 1.15% | 1.17% A |
Expenses net of all reductions | 1.06% | 1.07% | 1.11% | 1.11% | 1.14% A |
Net investment income (loss) | 1.51% | .77% | .55% | .62% | .52% A |
Supplemental Data | | | | | |
Net assets, end of period (000 omitted) | $ 68,729 | $ 49,373 | $ 27,562 | $ 7,072 | $ 1,616 |
Portfolio turnover rate G | 123% | 92% | 84% | 99% | 77% |
A Annualized
B Total returns for periods of less than one year are not annualized.
C Total returns do not reflect charges attributable to your insurance company's separate account. Inclusion of these charges would reduce the total returns shown.
D Total returns would have been lower had certain expenses not been reduced during the periods shown.
E Calculated based on average shares outstanding during the period.
F Fees and expenses of the underlying Fidelity Central Funds are not included in the Fund's expense ratio. The Fund indirectly bears its proportionate share of the expenses of any underlying Fidelity Central Funds.
G Amount does not include the portfolio activity of any underlying Fidelity Central Funds.
H For the period April 24, 2002 (commencement of sale of shares) to December 31, 2002.
I Expense ratios reflect operating expenses of the class. Expenses before reductions do not reflect amounts reimbursed by the investment adviser or reductions from brokerage service arrangements or other expense offset arrangements and do not represent the amount paid by the class during periods when reimbursements or reductions occur. Expense ratios before reductions for start-up periods may not be representative of longer-term operating periods. Expenses net of fee waivers reflect expenses after reimbursement by the investment adviser but prior to reductions from brokerage service arrangements or other expense offset arrangements. Expenses net of all reductions represent the net expenses paid by the class.
J Amount represents less than $.01 per share.
See accompanying notes which are an integral part of the financial statements.
VIP Overseas Portfolio
Financial Highlights - Investor Class R
Years ended December 31, | 2006 | 2005 H |
Selected Per-Share Data | | |
Net asset value, beginning of period | $ 20.59 | $ 17.69 |
Income from Investment Operations | | |
Net investment income (loss) E | .36 | .02 |
Net realized and unrealized gain (loss) | 3.29 | 2.88 |
Total from investment operations | 3.65 | 2.90 |
Distributions from net investment income | (.20) | - |
Distributions from net realized gain | (.13) | - |
Total distributions | (.33) | - |
Redemption fees added to paid in capital E,J | - | - |
Net asset value, end of period | $ 23.91 | $ 20.59 |
Total Return B,C,D | 17.94% | 16.39% |
Ratios to Average Net Assets F,I | | |
Expenses before reductions | 1.01% | 1.07% A |
Expenses net of fee waivers, if any | 1.01% | 1.07% A |
Expenses net of all reductions | .93% | 1.00% A |
Net investment income (loss) | 1.64% | .23% A |
Supplemental Data | | |
Net assets, end of period (000 omitted) | $ 122,018 | $ 29,544 |
Portfolio turnover rate G | 123% | 92% |
A Annualized
B Total returns for periods of less than one year are not annualized.
C Total returns do not reflect charges attributable to your insurance company's separate account. Inclusion of these charges would reduce the total returns shown.
D Total returns would have been lower had certain expenses not been reduced during the periods shown.
E Calculated based on average shares outstanding during the period.
F Fees and expenses of the underlying Fidelity Central Funds are not included in the Fund's expense ratio. The Fund indirectly bears its proportionate share of the expenses of any underlying Fidelity Central Funds.
G Amount does not include the portfolio activity of any underlying Fidelity Central Funds.
H For the period July 21, 2005 (commencement of sale of shares) to December 31, 2005.
I Expense ratios reflect operating expenses of the class. Expenses before reductions do not reflect amounts reimbursed by the investment adviser or reductions from brokerage service arrangements or other expense offset arrangements and do not represent the amount paid by the class during periods when reimbursements or reductions occur. Expense ratios before reductions for start-up periods may not be representative of longer-term operating periods. Expenses net of fee waivers reflect expenses after reimbursement by the investment adviser but prior to reductions from brokerage service arrangements or other expense offset arrangements. Expenses net of all reductions represent the net expenses paid by the class.
J Amount represents less than $.01 per share.
See accompanying notes which are an integral part of the financial statements.
Annual Report
Notes to Financial Statements
For the period ended December 31, 2006
1. Significant Accounting Policies.
VIP Overseas Portfolio (the Fund) is a fund of Variable Insurance Products (the trust) and is authorized to issue an unlimited number of shares. The trust is registered under the Investment Company Act of 1940, as amended (the 1940 Act), as an open-end management investment company organized as a Massachusetts business trust. Shares of the Fund may only be purchased by insurance companies for the purpose of funding variable annuity or variable life insurance contracts. The Fund offers the following classes of shares: Initial Class shares, Service Class shares, Service Class 2 shares, Initial Class R shares, Service Class R shares, Service Class 2R shares, and Investor Class R shares. All classes have equal rights and voting privileges, except for matters affecting a single class. Investment income, realized and unrealized capital gains and losses, the common expenses of the Fund, and certain fund-level expense reductions, if any, are allocated on a pro rata basis to each class based on the relative net assets of each class to the total net assets of the Fund. Each class differs with respect to transfer agent and distribution and service plan fees incurred. Certain expense reductions also differ by class.
The Fund's investments in emerging markets can be subject to social, economic, regulatory, and political uncertainties and can be extremely volatile. The Fund may invest in Fidelity Central Funds which are open-end investment companies available to investment companies and other accounts managed by Fidelity Management & Research Company (FMR) and its affiliates. The financial statements have been prepared in conformity with accounting principles generally accepted in the United States of America, which require management to make certain estimates and assumptions at the date of the financial statements. The following summarizes the significant accounting policies of the Fund, which are also consistently followed by the Fidelity Central Funds:
Security Valuation. Investments are valued and net asset value (NAV) per share is calculated (NAV calculation) as of the close of business of the New York Stock Exchange (NYSE), normally 4:00 p.m. Eastern time. Wherever possible, the Fund uses independent pricing services approved by the Board of Trustees to value its investments.
Equity securities, including restricted securities, for which market quotations are readily available, are valued at the last reported sale price or official closing price as reported by an independent pricing service on the primary market or exchange on which they are traded. In the event there were no sales during the day or closing prices are not available, securities are valued at the last quoted bid price. Debt securities, including restricted securities, for which quotations are readily available, are valued by independent pricing services or by dealers who make markets in such securities. Pricing services consider yield or price of bonds of comparable quality, coupon, maturity and type as well as dealer supplied prices. Investments in open-end mutual funds, including the Fidelity Central Funds, are valued at their closing net asset value each business day. Short-term securities with remaining maturities of sixty days or less for which quotations are not readily available are valued at amortized cost, which approximates value.
When current market prices or quotations are not readily available or do not accurately reflect fair value, valuations may be determined in accordance with procedures adopted by the Board of Trustees. For example, when developments occur between the close of a market and the close of the NYSE that may materially affect the value of some or all of the securities, or when trading in a security is halted, those securities may be fair valued. Factors used in the determination of fair value may include monitoring news to identify significant market or security specific events such as changes in the value of U.S. securities markets, reviewing developments in foreign markets and evaluating the performance of ADRs, futures contracts and exchange-traded funds. Because the Fund's utilization of fair value pricing depends on market activity, the frequency with which fair value pricing is used can not be predicted and may be utilized to a significant extent. The value of securities used for NAV calculation under fair value pricing may differ from published prices for the same securities.
Foreign Currency. The Fund uses foreign currency contracts to facilitate transactions in foreign-denominated securities. Losses from these transactions may arise from changes in the value of the foreign currency or if the counterparties do not perform under the contracts' terms.
Foreign-denominated assets, including investment securities, and liabilities are translated into U.S. dollars at the exchange rate at period end. Purchases and sales of investment securities, income and dividends received and expenses denominated in foreign currencies are translated into U.S. dollars at the exchange rate in effect on the transaction date.
The effects of exchange rate fluctuations on investments are included with the net realized and unrealized gain (loss) on investment securities. Other foreign currency transactions resulting in realized and unrealized gain (loss) are disclosed separately.
Investment Transactions and Income. Security transactions, including the Fund's investment activity in the Fidelity Central Funds, are accounted for as of trade date. Gains and losses on securities sold are determined on the basis of identified cost and may include proceeds received from litigation. Dividend income is recorded on the ex-dividend date, except for certain dividends from foreign securities where the ex-dividend date may have passed, which are recorded as soon as the Fund is informed of the ex-dividend date. Non-cash dividends included in dividend income, if any, are recorded at the fair market value of the securities received. Distributions received on securities that represent a return of capital or capital gain are recorded as a reduction of cost of investments and/or as a realized gain. The Fund estimates the components of distributions received that may be considered return of capital distributions or capital gain distributions. Interest income and income distributions from the Fidelity Central Funds are accrued as earned,
VIP Overseas Portfolio
1. Significant Accounting Policies - continued
Investment Transactions and Income - continued
with any income distributions receivable as of period end included in Interest Receivable on the Statement of Assets and Liabilities. Interest income includes coupon interest and amortization of premium and accretion of discount on debt securities. Investment income is recorded net of foreign taxes withheld where recovery of such taxes is uncertain.
Expenses. Most expenses of the trust can be directly attributed to a fund. Expenses which cannot be directly attributed are apportioned among each Fund in the trust. Expense estimates are accrued in the period to which they relate and adjustments are made when actual amounts are known.
Deferred Trustee Compensation. Under a Deferred Compensation Plan (the Plan), Independent Trustees must defer receipt of a portion of, and may elect to defer receipt of an additional portion of, their annual compensation. Deferred amounts are invested in a cross-section of Fidelity funds, are marked-to-market and remain in the Fund until distributed in accordance with the Plan. The investment of deferred amounts and the offsetting payable to the Trustees are included in the accompanying Statement of Assets and Liabilities.
Income Tax Information and Distributions to Shareholders. Each year, the Fund intends to qualify as a regulated investment company by distributing all of its taxable income and realized gains under Subchapter M of the Internal Revenue Code. As a result, no provision for income taxes is required in the accompanying financial statements. Foreign taxes are provided for based on the Fund's understanding of the tax rules and rates that exist in the foreign markets in which it invests.
Distributions are recorded on the ex-dividend date. Income dividends and capital gain distributions are declared separately for each class. Income and capital gain distributions are determined in accordance with income tax regulations, which may differ from generally accepted accounting principles.
Capital accounts within the financial statements are adjusted for permanent book-tax differences. These adjustments have no impact on net assets or the results of operations. Temporary book-tax differences will reverse in a subsequent period.
Book-tax differences are primarily due to certain foreign taxes, foreign currency transactions, passive foreign investment companies (PFIC), deferred trustee expenses, capital loss carryforwards and losses deferred due to wash sales.
The tax-basis components of distributable earnings and the federal tax cost as of period end were as follows:
Unrealized appreciation | $ 706,737,702 |
Unrealized depreciation | (35,151,851) |
Net unrealized appreciation (depreciation) | 671,585,851 |
Undistributed ordinary income | 49,691,784 |
Undistributed long-term capital gain | 224,671,947 |
| |
Cost for federal income tax purposes | $ 2,649,989,372 |
The tax character of distributions paid was as follows:
| December 31, 2006 | December 31, 2005 |
Ordinary Income | $ 42,074,416 | $ 27,097,695 |
Trading (Redemption) Fees. Initial Class R shares, Service Class R shares, Service Class 2R shares, and Investor Class R shares held less than 60 days are subject to a redemption fee equal to 1% of the proceeds of the redeemed shares. All redemption fees, including any estimated redemption fees paid by FMR, are retained by the Fund and accounted for as an addition to paid in capital.
New Accounting Pronouncements. In July 2006, Financial Accounting Standards Board Interpretation No. 48, Accounting for Uncertainty in Income Taxes - an interpretation of FASB Statement 109 (FIN 48), was issued and is effective on the last business day of the semiannual reporting period for fiscal years beginning after December 15, 2006. FIN 48 sets forth a threshold for financial statement recognition, measurement and disclosure of a tax position taken or expected to be taken on a tax return. Management is currently evaluating the impact, if any, the adoption of FIN 48 will have on the Fund's net assets, results of operations and financial statement disclosures.
In addition, in September 2006, Statement of Financial Accounting Standards No. 157, Fair Value Measurements (SFAS 157), was issued and is effective for fiscal years beginning after November 15, 2007. SFAS 157 defines fair value, establishes a framework for measuring fair value and expands disclosures about fair value measurements. Management is currently evaluating the impact the adoption of SFAS 157 will have on the Fund's financial statement disclosures.
Annual Report
Notes to Financial Statements - continued
2. Operating Policies.
Repurchase Agreements. FMR has received an Exemptive Order from the Securities and Exchange Commission (the SEC) which permits the Fund and other affiliated entities of FMR to transfer uninvested cash balances into joint trading accounts which are then invested in repurchase agreements. The Fund may also invest directly with institutions in repurchase agreements. Repurchase agreements are collateralized by government or non-government securities. Upon settlement date, collateral is held in segregated accounts with custodian banks and may be obtained in the event of a default of the counterparty. The Fund monitors, on a daily basis, the value of the collateral to ensure it is at least equal to the principal amount of the repurchase agreement (including accrued interest). In the event of a default by the counterparty, realization of the collateral proceeds could be delayed, during which time the value of the collateral may decline.
Restricted Securities. The Fund may invest in securities that are subject to legal or contractual restrictions on resale. These securities generally may be resold in transactions exempt from registration or to the public if the securities are registered. Disposal of these securities may involve time-consuming negotiations and expense, and prompt sale at an acceptable price may be difficult. Information regarding restricted securities is included at the end of the Fund's Schedule of Investments.
3. Purchases and Sales of Investments.
Purchases and sales of securities, other than short-term securities, aggregated $3,647,565,647 and $3,565,361,526, respectively.
4. Fees and Other Transactions with Affiliates.
Management Fee. FMR and its affiliates provide the Fund with investment management related services for which the Fund pays a monthly management fee. The management fee is the sum of an individual fund fee rate that is based on an annual rate of .45% of the Fund's average net assets and a group fee rate that averaged .27% during the period. The group fee rate is based upon the average net assets of all the mutual funds advised by FMR. The group fee rate decreases as assets under management increase and increases as assets under management decrease. For the period, the total annual management fee rate was .72% of the Fund's average net assets.
Distribution and Service Plan. In accordance with Rule 12b-1 of the 1940 Act, the Fund has adopted separate 12b-1 Plans for each Service Class of shares. Each Service Class pays Fidelity Distributors Corporation (FDC), an affiliate of FMR, a service fee. For the period, the service fee is based on an annual rate of .10% of Service Class' and Service Class R's average net assets and .25% of Service Class 2's and Service Class 2R's average net assets.
For the period, each class paid FDC the following amounts, all of which were re-allowed to insurance companies for the distribution of shares and providing shareholder support services:
Service Class | $ 342,279 |
Service Class 2 | 1,510,257 |
Service Class R | 129,525 |
Service Class 2R | 150,770 |
| $ 2,132,831 |
Transfer Agent Fees. Fidelity Investments Institutional Operations Company, Inc. (FIIOC), an affiliate of FMR, is the fund's transfer, dividend disbursing, and shareholder servicing agent. FIIOC receives an asset-based fee with respect to each class. Each class with the exception of Investor Class R pays a transfer agent fee, excluding out of pocket expenses, equal to an annual rate of .07% of their month end net assets. Investor Class R pays a monthly asset-based transfer agent fee of .18% of its month end net assets. The total transfer agent fees paid by each class to FIIOC, including out of pocket expenses, were as follows:
Initial Class | $ 1,069,408 |
Service Class | 232,658 |
Service Class 2 | 414,570 |
Initial Class R | 153,209 |
Service Class R | 86,391 |
Service Class 2R | 40,534 |
Investor Class R | 157,008 |
| $ 2,153,778 |
Accounting and Security Lending Fees. Fidelity Service Company, Inc. (FSC), an affiliate of FMR, maintains the Fund's accounting records. The accounting fee is based on the level of average net assets for the month. Under a separate contract, FSC administers the security lending program. The security lending fee is based on the number and duration of lending transactions.
VIP Overseas Portfolio
4. Fees and Other Transactions with Affiliates - continued
Investments in Fidelity Central Funds. The Fund may invest in Fidelity Central Funds. The Fund's Schedule of Investments lists each of the Fidelity Central Funds as an investment of the Fund but does not include the underlying holdings of each Fidelity Central Fund. As an Investing Fund, the Fund indirectly bears its proportionate share of the expenses of the underlying Fidelity Central Funds. A complete unaudited list of holdings for each Fidelity Central Fund is available upon request. In addition, the financial statements of the Fidelity Central Funds, which are not covered by the Fund's Report of Independent Registered Public Accounting Firm, are available on the EDGAR Database on the SEC's web site, www.sec.gov, or upon request.
The Money Market Central Funds seek preservation of capital and current income and are managed by Fidelity Investments Money Management, Inc. (FIMM), an affiliate of FMR.
Brokerage Commissions. The Fund placed a portion of its portfolio transactions with brokerage firms which are affiliates of the investment adviser. The commissions paid to these affiliated firms were $736 for the period.
5. Committed Line of Credit.
The Fund participates with other funds managed by FMR in a $4.2 billion credit facility (the "line of credit") to be utilized for temporary or emergency purposes to fund shareholder redemptions or for other short-term liquidity purposes. The Fund has agreed to pay commitment fees on its pro rata portion of the line of credit, which amounted to $7,913 and is reflected in Miscellaneous Expense on the Statement of Operations. During the period, there were no borrowings on this line of credit.
6. Security Lending.
The Fund lends portfolio securities from time to time in order to earn additional income. On the settlement date of the loan, the Fund receives collateral (in the form of U.S. Treasury obligations, letters of credit and/or cash) against the loaned securities and maintains collateral in an amount not less than 100% of the market value of the loaned securities during the period of the loan. The market value of the loaned securities is determined at the close of business of the Fund and any additional required collateral is delivered to the Fund on the next business day. If the borrower defaults on its obligation to return the securities loaned because of insolvency or other reasons, a fund could experience delays and costs in recovering the securities loaned or in gaining access to the collateral. Any cash collateral received is invested in the Fidelity Securities Lending Cash Central Fund. The value of loaned securities and cash collateral at period end are disclosed on the Fund's Statement of Assets and Liabilities. Security lending income represents the income earned on investing cash collateral, less fees and expenses associated with the loan, plus any premium payments that may be received on the loan of certain types of securities. Security lending income is presented in the Statement of Operations as a component of income from Fidelity Central Funds.
7. Expense Reductions.
Many of the brokers with whom FMR places trades on behalf of the Fund provided services to the Fund in addition to trade execution. These services included payments of certain expenses on behalf of the Fund totaling $2,205,967 for the period. In addition, through arrangements with the fund's custodian, credits realized as a result of uninvested cash balances were used to reduce the Fund's expenses. During the period, these credits reduced the Fund's custody expense by $7,301.
8. Other.
The Fund's organizational documents provide former and current trustees and officers with a limited indemnification against liabilities arising in connection with the performance of their duties to the Fund. In the normal course of business, the Fund may also enter into contracts that provide general indemnifications. The Fund's maximum exposure under these arrangements is unknown as this would be dependent on future claims that may be made against the Fund. The risk of material loss from such claims is considered remote.
At the end of the period, FMR or its affiliates were the owner of record of 14% of the total outstanding shares of the Fund and two otherwise unaffiliated shareholders were the owners of record of 38% of the total outstanding shares of the Fund.
The United States Securities and Exchange Commission ("SEC") is conducting an investigation of FMR (covering the years 2002 to 2004) arising from gifts, gratuities and business entertainment provided by certain brokers to certain individuals who were employed on FMR's domestic equity trading desk during that period. FMR is in discussions with the SEC staff regarding the possible resolution of the matter, but as of period-end no final resolution has been reached.
In December 2006, the Independent Trustees completed their own investigation of the matter with the assistance of independent counsel. The Independent Trustees and FMR agree that, despite the absence of proof that the Fidelity mutual funds experienced diminished execution quality as a result of the improper receipt of gifts and business entertainment, the conduct at issue was serious and is worthy of redress. Accordingly, the Independent Trustees have requested and FMR has agreed to pay $42 million to Fidelity mutual funds, plus interest to be determined at the time that payment is
Annual Report
Notes to Financial Statements - continued
8. Other - continued
made. A method of allocating this payment among the funds has not yet been determined. The total payment to the Fund is not anticipated to have a material impact on the Fund's net assets. In addition, FMR reimbursed related legal expenses which are recorded in the accompanying Statement of Operations as an expense reduction.
9. Distributions to Shareholders.
Distributions to shareholders of each class were as follows:
Years ended December 31, | 2006 | 2005 |
From net investment income | | |
Initial Class | $ 14,091,669 | $ 9,625,631 |
Service Class | 2,672,527 | 1,847,002 |
Service Class 2 | 3,822,324 | 1,745,414 |
Initial Class R | 1,834,008 | 965,865 |
Service Class R | 1,035,719 | 492,968 |
Service Class 2R | 404,891 | 160,178 |
Investor Class R | 387,994 | - |
Total | $ 24,249,132 | $ 14,837,058 |
From net realized gain | | |
Initial Class | $ 9,796,346 | $ 7,533,103 |
Service Class | 2,080,411 | 1,662,302 |
Service Class 2 | 3,312,681 | 1,745,414 |
Initial Class R | 1,261,487 | 724,399 |
Service Class R | 778,286 | 443,671 |
Service Class 2R | 337,410 | 151,748 |
Investor Class R | 258,663 | - |
Total | $ 17,825,284 | $ 12,260,637 |
VIP Overseas Portfolio
10. Share Transactions.
Transactions for each class of shares were as follows:
| Shares | Dollars |
Years ended December 31, | 2006 | 2005A | 2006 | 2005A |
Initial Class | | | | |
Shares sold | 8,304,320 | 7,401,949 | $ 179,677,212 | $ 132,174,303 |
Reinvestment of distributions | 1,151,230 | 1,002,262 | 23,888,014 | 17,158,734 |
Shares redeemed | (16,836,811) | (18,372,431) | (368,119,935) | (325,484,696) |
Net increase (decrease) | (7,381,261) | (9,968,220) | $ (164,554,709) | $ (176,151,659) |
Service Class | | | | |
Shares sold | 1,974,850 | 2,681,647 | $ 42,447,696 | $ 47,720,466 |
Reinvestment of distributions | 229,833 | 205,704 | 4,752,938 | 3,509,304 |
Shares redeemed | (3,102,957) | (5,311,978) | (67,340,790) | (91,468,586) |
Net increase (decrease) | (898,274) | (2,424,627) | $ (20,140,156) | $ (40,238,816) |
Service Class 2 | | | | |
Shares sold | 7,511,166 | 7,706,445 | $ 162,864,891 | $ 135,627,664 |
Reinvestment of distributions | 346,191 | 205,102 | 7,135,005 | 3,490,828 |
Shares redeemed | (2,840,731) | (1,690,309) | (60,833,342) | (30,166,445) |
Net increase (decrease) | 5,016,626 | 6,221,238 | $ 109,166,554 | $ 108,952,047 |
Initial Class R | | | | |
Shares sold | 2,772,603 | 2,614,989 | $ 60,021,525 | $ 46,966,500 |
Reinvestment of distributions | 149,396 | 98,846 | 3,095,495 | 1,690,264 |
Shares redeemed | (1,817,333) | (1,307,426) | (39,551,862) | (22,938,002) |
Net increase (decrease) | 1,104,666 | 1,406,409 | $ 23,565,158 | $ 25,718,762 |
Service Class R | | | | |
Shares sold | 1,190,213 | 1,192,156 | $ 25,640,889 | $ 21,053,947 |
Reinvestment of distributions | 87,845 | 54,935 | 1,814,005 | 936,639 |
Shares redeemed | (1,290,192) | (578,793) | (28,107,366) | (10,225,074) |
Net increase (decrease) | (12,134) | 668,298 | $ (652,472) | $ 11,765,512 |
Service Class 2R | | | | |
Shares sold | 904,989 | 998,545 | $ 19,265,401 | $ 17,565,601 |
Reinvestment of distributions | 36,227 | 18,435 | 742,301 | 311,926 |
Shares redeemed | (459,435) | (180,588) | (9,806,715) | (3,145,256) |
Net increase (decrease) | 481,781 | 836,392 | $ 10,200,987 | $ 14,732,271 |
Investor Class R | | | | |
Shares sold | 3,992,909 | 1,438,624 | $ 86,366,168 | $ 27,620,203 |
Reinvestment of distributions | 31,194 | - | 646,657 | - |
Shares redeemed | (355,662) | (3,869) | (7,578,472) | (73,525) |
Net increase (decrease) | 3,668,441 | 1,434,755 | $ 79,434,353 | $ 27,546,678 |
A Share transactions for Investor Class R are for the period July 21, 2005 (commencement of sale of shares) to December 31, 2005.
Annual Report
Report of Independent Registered Public Accounting Firm
To the Trustees of Variable Insurance Products Fund and the Shareholders of VIP Overseas Portfolio:
In our opinion, the accompanying statement of assets and liabilities, including the schedule of investments, and the related statements of operations and of changes in net assets and the financial highlights present fairly, in all material respects, the financial position of VIP Overseas Portfolio (a fund of Variable Insurance Products Fund) at December 31, 2006, the results of its operations for the year then ended, the changes in its net assets for each of the two years in the period then ended and the financial highlights for each of the periods indicated, in conformity with accounting principles generally accepted in the United States of America. These financial statements and financial highlights (hereafter referred to as "financial statements") are the responsibility of the VIP Overseas Portfolio's management; our responsibility is to express an opinion on these financial statements based on our audits. We conducted our audits of these financial statements in accordance with the standards of the Public Company Accounting Oversight Board (United States). Those standards require that we plan and perform the audit to obtain reasonable assurance about whether the financial statements are free of material misstatement. An audit includes examining, on a test basis, evidence supporting the amounts and disclosures in the financial statements, assessing the accounting principles used and significant estimates made by management, and evaluating the overall financial statement presentation. We believe that our audits, which included confirmation of securities at December 31, 2006 by correspondence with the custodian and brokers, provide a reasonable basis for our opinion.
/s/ PricewaterhouseCoopers LLP
PricewaterhouseCoopers LLP
Boston, Massachusetts
February 13, 2007
VIP Overseas Portfolio
Trustees and Officers
The Trustees, Member of the Advisory Board, and executive officers of the trust and fund, as applicable, are listed below. The Board of Trustees governs the fund and is responsible for protecting the interests of shareholders. The Trustees are experienced executives who meet periodically throughout the year to oversee the fund's activities, review contractual arrangements with companies that provide services to the fund, and review the fund's performance. Each of the Trustees oversees 348 funds advised by FMR or an affiliate.
The Trustees hold office without limit in time except that (a) any Trustee may resign; (b) any Trustee may be removed by written instrument, signed by at least two-thirds of the number of Trustees prior to such removal; (c) any Trustee who requests to be retired or who has become incapacitated by illness or injury may be retired by written instrument signed by a majority of the other Trustees; and (d) any Trustee may be removed at any special meeting of shareholders by a two-thirds vote of the outstanding voting securities of the trust. Each Trustee who is not an interested person (as defined in the 1940 Act) (Independent Trustee), shall retire not later than the last day of the calendar year in which his or her 72nd birthday occurs. The Independent Trustees may waive this mandatory retirement age policy with respect to individual Trustees. The executive officers and Advisory Board Member hold office without limit in time, except that any officer and Advisory Board Member may resign or may be removed by a vote of a majority of the Trustees at any regular meeting or any special meeting of the Trustees. Except as indicated, each individual has held the office shown or other offices in the same company for the past five years.
The fund's Statement of Additional Information (SAI) includes more information about the Trustees. To request a free copy, call Fidelity at 1-877-208-0098.
Interested Trustees*:
Correspondence intended for each Trustee who is an interested person may be sent to Fidelity Investments, 82 Devonshire Street, Boston, Massachusetts 02109.
Name, Age; Principal Occupation |
Edward C. Johnson 3d (76) |
| Year of Election or Appointment: 1981 Mr. Johnson is Chairman of the Board of Trustees. Mr. Johnson serves as President (2006-present), Chief Executive Officer, Chairman, and a Director of FMR Corp.; Chairman and a Director of FMR; Chairman and a Director of Fidelity Research & Analysis Company (FRAC); Chairman and a Director of Fidelity Investments Money Management, Inc.; and Chairman (2001-present) and a Director of FMR Co., Inc. In addition, Mr. Johnson serves as Chairman and Director of Fidelity International Limited (FIL). |
Robert L. Reynolds (54) |
| Year of Election or Appointment: 2003 Mr. Reynolds is President and a Director of FMR (2005-present), Fidelity Investments Money Management, Inc. (2005-present), and FMR Co., Inc. (2005-present). Mr. Reynolds also serves as Vice Chairman (2006-present), a Director (2003-present), and Chief Operating Officer of FMR Corp. and a Director of Strategic Advisers, Inc. (2005-present). He also serves on the Board at Fidelity Investments Canada, Ltd. |
* Trustees have been determined to be "Interested Trustees" by virtue of, among other things, their affiliation with the trust or various entities under common control with FMR.
Independent Trustees:
Correspondence intended for each Independent Trustee (that is, the Trustees other than the Interested Trustees) may be sent to Fidelity Investments, P.O. Box 55235, Boston, Massachusetts 02205-5235.
Name, Age; Principal Occupation |
Dennis J. Dirks (58) |
| Year of Election or Appointment: 2005 Prior to his retirement in May 2003, Mr. Dirks was Chief Operating Officer and a member of the Board of The Depository Trust & Clearing Corporation (DTCC) (1999-2003). He also served as President, Chief Operating Officer, and Board member of The Depository Trust Company (DTC) (1999-2003) and President and Board member of the National Securities Clearing Corporation (NSCC) (1999-2003). In addition, Mr. Dirks served as Chief Executive Officer and Board member of the Government Securities Clearing Corporation (2001-2003) and Chief Executive Officer and Board member of the Mortgage-Backed Securities Clearing Corporation (2001-2003). Mr. Dirks also serves as a Trustee and a member of the Finance Committee of Manhattan College (2005-present) and a Trustee and a member of the Finance Committee of AHRC of Nassau County (2006-present). |
Albert R. Gamper, Jr. (64) |
| Year of Election or Appointment: 2006 Prior to his retirement in December 2004, Mr. Gamper served as Chairman of the Board of CIT Group Inc. (commercial finance). During his tenure with CIT Group Inc. Mr. Gamper served in numerous senior management positions, including Chairman (1987-1989; 1999-2001; 2002-2004), Chief Executive Officer (1987-2004), and President (1989-2002). He currently serves as a member of the Board of Directors of Public Service Enterprise Group (utilities, 2001-present), Chairman of the Board of Governors, Rutgers University (2004-present), and Chairman of the Board of Saint Barnabas Health Care System. |
George H. Heilmeier (70) |
| Year of Election or Appointment: 2004 Dr. Heilmeier is Chairman Emeritus of Telcordia Technologies (communication software and systems), where prior to his retirement, he served as company Chairman and Chief Executive Officer. He currently serves on the Boards of Directors of The Mitre Corporation (systems engineering and information technology support for the government), and HRL Laboratories (private research and development, 2004-present). He is Chairman of the General Motors Science & Technology Advisory Board and a Life Fellow of the Institute of Electrical and Electronics Engineers (IEEE). Dr. Heilmeier is a member of the Defense Science Board and the National Security Agency Advisory Board. He is also a member of the National Academy of Engineering, the American Academy of Arts and Sciences, and the Board of Overseers of the School of Engineering and Applied Science of the University of Pennsylvania. Previously, Dr. Heilmeier served as a Director of TRW Inc. (automotive, space, defense, and information technology, 1992-2002), Compaq (1994-2002), Automatic Data Processing, Inc. (ADP) (technology-based business outsourcing, 1995-2002), INET Technologies Inc. (telecommunications network surveillance, 2001-2004), and Teletech Holdings (customer management services). He is the recipient of the 2005 Kyoto Prize in Advanced Technology for his invention of the liquid crystal display, and a member of the Consumer Electronics Hall of Fame. |
James H. Keyes (66) |
| Year of Election or Appointment: 2007 Prior to his retirement in 2003, Mr. Keyes was Chairman, President, and Chief Executive Officer of Johnson Controls, Inc. (automotive supplier, 1993-2003). He currently serves as a member of the boards of LSI Logic Corporation (semiconductor technologies), Navistar International Corporation (manufacture and sale of trucks, buses, and diesel engines, 2002-present), and Pitney Bowes, Inc. (integrated mail, messaging, and document management solutions). |
Marie L. Knowles (60) |
| Year of Election or Appointment: 2001 Prior to Ms. Knowles' retirement in June 2000, she served as Executive Vice President and Chief Financial Officer of Atlantic Richfield Company (ARCO) (diversified energy, 1996-2000). From 1993 to 1996, she was a Senior Vice President of ARCO and President of ARCO Transportation Company. She served as a Director of ARCO from 1996 to 1998. She currently serves as a Director of Phelps Dodge Corporation (copper mining and manufacturing) and McKesson Corporation (healthcare service, 2002-present). Ms. Knowles is a Trustee of the Brookings Institution and the Catalina Island Conservancy and also serves as a member of the Advisory Board for the School of Engineering of the University of Southern California. |
Ned C. Lautenbach (62) |
| Year of Election or Appointment: 2000 Mr. Lautenbach is Chairman of the Independent Trustees (2006-present). Mr. Lautenbach has been a partner of Clayton, Dubilier & Rice, Inc. (private equity investment firm) since September 1998. Previously, Mr. Lautenbach was with the International Business Machines Corporation (IBM) from 1968 until his retirement in 1998. Mr. Lautenbach serves as a Director of Sony Corporation (2006-present) and Eaton Corporation (diversified industrial) as well as the Philharmonic Center for the Arts in Naples, Florida. He also is a member of the Board of Trustees of Fairfield University (2005-present), as well as a member of the Council on Foreign Relations. |
Cornelia M. Small (62) |
| Year of Election or Appointment: 2005 Ms. Small is a member (2000-present) and Chairperson (2002-present) of the Investment Committee, and a member (2002-present) of the Board of Trustees of Smith College. Previously, she served as Chief Investment Officer (1999-2000), Director of Global Equity Investments (1996-1999), and a member of the Board of Directors of Scudder, Stevens & Clark (1990-1997) and Scudder Kemper Investments (1997-1999). In addition, Ms. Small served as Co-Chair (2000-2003) of the Annual Fund for the Fletcher School of Law and Diplomacy. |
William S. Stavropoulos (67) |
| Year of Election or Appointment: 2001 Mr. Stavropoulos is Chairman Emeritus of the Board of Directors of The Dow Chemical Company. Since joining The Dow Chemical Company in 1967, Mr. Stavropoulos served in numerous senior management positions, including President (1993-2000; 2002-2003), CEO (1995-2000; 2002-2004), and Chairman of the Executive Committee (2000-2004). Currently, he is a Director of NCR Corporation (data warehousing and technology solutions), BellSouth Corporation (telecommunications), Chemical Financial Corporation, Maersk Inc. (industrial conglomerate, 2002-present), and Metalmark Capital (private equity investment firm, 2005-present). He also serves as a member of the Board of Trustees of the American Enterprise Institute for Public Policy Research. In addition, Mr. Stavropoulos is a member of The Business Council, J.P. Morgan International Council and the University of Notre Dame Advisory Council for the College of Science. |
Kenneth L. Wolfe (67) |
| Year of Election or Appointment: 2005 Prior to his retirement in 2001, Mr. Wolfe was Chairman and Chief Executive Officer of Hershey Foods Corporation (1993-2001). He currently serves as a member of the boards of Adelphia Communications Corporation (2003-present), Bausch & Lomb, Inc., and Revlon Inc. (2004-present). |
Advisory Board Member and Executive Officers:
Correspondence intended for each executive officer and Mr. Lynch may be sent to Fidelity Investments, 82 Devonshire Street, Boston, Massachusetts 02109.
Name, Age; Principal Occupation |
Peter S. Lynch (62) |
| Year of Election or Appointment: 2003 Member of the Advisory Board of Variable Insurance Products Fund. Mr. Lynch is Vice Chairman and a Director of FMR, and Vice Chairman (2001-present) and a Director of FMR Co., Inc. Previously, Mr. Lynch served as a Trustee of the Fidelity funds (1990-2003). In addition, he serves as a Trustee of Boston College and as the Chairman of the Inner-City Scholarship Fund. |
Kimberley H. Monasterio (43) |
| Year of Election or Appointment: 2007 President and Treasurer of VIP Overseas. Ms. Monasterio also serves as President and Treasurer of other Fidelity funds (2007-present) and is an employee of FMR (2004-present). Previously, Ms. Monasterio served as Deputy Treasurer of the Fidelity funds (2004-2006). Before joining Fidelity Investments, Ms. Monasterio served as Treasurer (2000-2004) and Chief Financial Officer (2002-2004) of the Franklin Templeton Funds and Senior Vice President of Franklin Templeton Services, LLC (2000-2004). |
Dwight D. Churchill (53) |
| Year of Election or Appointment: 2005 Vice President of VIP Overseas. Mr. Churchill also serves as Vice President of certain Equity Funds (2005-present). Mr. Churchill is Executive Vice President of FMR (2005-present) and FMR Co., Inc. (2005-present). Previously, Mr. Churchill served as Senior Vice President of Fidelity Investments Money Management, Inc. (2005-2006), Head of Fidelity's Fixed-Income Division (2000-2005), Vice President of Fidelity's Money Market Funds (2000-2005), Vice President of Fidelity's Bond Funds, and Senior Vice President of FMR. |
Eric M. Wetlaufer (44) |
| Year of Election or Appointment: 2006 Vice President of VIP Overseas. Mr. Wetlaufer also serves as Vice President of certain International Equity Funds (2006-present). Mr. Wetlaufer is Senior Vice President of FMR (2006-present) and FMR Co., Inc. (2006-present), and President and Director of Fidelity Management & Research (U.K.) Inc. (2006-present) and Fidelity Research & Analysis Company (2006-present). Before joining Fidelity Investments in 2005, Mr. Wetlaufer was a partner in Oxhead Capital Management (2004-2005). Previously, Mr. Wetlaufer served as a Chief Investment Officer of Putnam Investments (1997-2003). |
Graeme Rockett (40) |
| Year of Election or Appointment: 2006 Vice President of VIP Overseas. Mr. Rockett also serves as Vice President of other funds advised by FMR. Prior to assuming his current responsibilities, Mr. Rockett worked as a research analyst and portfolio manager. Mr. Rockett also serves as Vice President of FMR and FMR Co., Inc. (2006). |
Eric D. Roiter (58) |
| Year of Election or Appointment: 1998 Secretary of VIP Overseas. He also serves as Secretary of other Fidelity funds; Vice President, General Counsel, and Secretary of FMR Co., Inc. (2001-present) and FMR; Assistant Secretary of Fidelity Management & Research (U.K.) Inc. (2001-present), Fidelity Research & Analysis Company (2001-present), and Fidelity Investments Money Management, Inc. (2001-present). Mr. Roiter is an Adjunct Member, Faculty of Law, at Boston College Law School (2003-present). Previously, Mr. Roiter served as Vice President and Secretary of Fidelity Distributors Corporation (FDC) (1998-2005). |
Stuart Fross (47) |
| Year of Election or Appointment: 2003 Assistant Secretary of VIP Overseas. Mr. Fross also serves as Assistant Secretary of other Fidelity funds (2003-present), Vice President and Secretary of FDC (2005-present), and is an employee of FMR. |
R. Stephen Ganis (40) |
| Year of Election or Appointment: 2006 Anti-Money Laundering (AML) officer of VIP Overseas. Mr. Ganis also serves as AML officer of other Fidelity funds (2006-present) and FMR Corp. (2003-present). Before joining Fidelity Investments, Mr. Ganis practiced law at Goodwin Procter, LLP (2000-2002). |
Joseph B. Hollis (58) |
| Year of Election or Appointment: 2006 Chief Financial Officer of VIP Overseas. Mr. Hollis also serves as Chief Financial Officer of other Fidelity funds. Mr. Hollis is President of Fidelity Pricing and Cash Management Services (FPCMS) (2005-present). Mr. Hollis also serves as President and Director of Fidelity Service Company, Inc. (2006-present). Previously, Mr. Hollis served as Senior Vice President of Cash Management Services (1999-2002) and Investment Management Operations (2002-2005). |
Kenneth A. Rathgeber (59) |
| Year of Election or Appointment: 2004 Chief Compliance Officer of VIP Overseas. Mr. Rathgeber also serves as Chief Compliance Officer of other Fidelity funds (2004-present) and Executive Vice President of Risk Oversight for Fidelity Investments (2002-present). He is Chief Compliance Officer of FMR (2005-present), FMR Co., Inc. (2005-present), Fidelity Management & Research (U.K.) Inc. (2005-present), Fidelity Research & Analysis Company (2005-present), Fidelity Investments Money Management, Inc. (2005-present), and Strategic Advisers, Inc. (2005-present). Previously, Mr. Rathgeber served as Executive Vice President and Chief Operating Officer for Fidelity Investments Institutional Services Company, Inc. (1998-2002). |
Bryan A. Mehrmann (45) |
| Year of Election or Appointment: 2005 Deputy Treasurer of VIP Overseas. Mr. Mehrmann also serves as Deputy Treasurer of other Fidelity funds (2005-present) and is an employee of FMR. Previously, Mr. Mehrmann served as Vice President of Fidelity Investments Institutional Services Group (FIIS)/Fidelity Investments Institutional Operations Corporation, Inc. (FIIOC) Client Services (1998-2004). |
Kenneth B. Robins (37) |
| Year of Election or Appointment: 2005 Deputy Treasurer of VIP Overseas. Mr. Robins also serves as Deputy Treasurer of other Fidelity funds (2005-present) and is an employee of FMR (2004-present). Before joining Fidelity Investments, Mr. Robins worked at KPMG LLP, where he was a partner in KPMG's department of professional practice (2002-2004) and a Senior Manager (1999-2000). In addition, Mr. Robins served as Assistant Chief Accountant, United States Securities and Exchange Commission (2000-2002). |
Robert G. Byrnes (40) |
| Year of Election or Appointment: 2005 Assistant Treasurer of VIP Overseas. Mr. Byrnes also serves as Assistant Treasurer of other Fidelity funds (2005-present) and is an employee of FMR (2005-present). Previously, Mr. Byrnes served as Vice President of FPCMS (2003-2005). Before joining Fidelity Investments, Mr. Byrnes worked at Deutsche Asset Management where he served as Vice President of the Investment Operations Group (2000-2003). |
John H. Costello (60) |
| Year of Election or Appointment: 1987 Assistant Treasurer of VIP Overseas. Mr. Costello also serves as Assistant Treasurer of other Fidelity funds and is an employee of FMR. |
Peter L. Lydecker (52) |
| Year of Election or Appointment: 2004 Assistant Treasurer of VIP Overseas. Mr. Lydecker also serves as Assistant Treasurer of other Fidelity funds (2004) and is an employee of FMR. |
Mark Osterheld (51) |
| Year of Election or Appointment: 2002 Assistant Treasurer of VIP Overseas. Mr. Osterheld also serves as Assistant Treasurer of other Fidelity funds (2002) and is an employee of FMR. |
Gary W. Ryan (48) |
| Year of Election or Appointment: 2005 Assistant Treasurer of VIP Overseas. Mr. Ryan also serves as Assistant Treasurer of other Fidelity funds (2005-present) and is an employee of FMR (2005-present). Previously, Mr. Ryan served as Vice President of Fund Reporting in FPCMS (1999-2005). |
Salvatore Schiavone (41) |
| Year of Election or Appointment: 2005 Assistant Treasurer of VIP Overseas. Mr. Schiavone also serves as Assistant Treasurer of other Fidelity funds (2005-present) and is an employee of FMR (2005-present). Before joining Fidelity Investments, Mr. Schiavone worked at Deutsche Asset Management, where he most recently served as Assistant Treasurer (2003-2005) of the Scudder Funds and Vice President and Head of Fund Reporting (1996-2003). |
Annual Report
Distributions
The Board of Trustees of VIP Overseas Portfolio voted to pay to shareholders of record at the opening of business on record date, the following distributions per share derived from capital gains realized from sales of portfolio securities, and dividends derived from net investment income:
| Pay Date | Record Date | Dividends | Capital Gains |
Initial Class R | 02/09/07 | 02/09/07 | $0.381 | $1.660 |
Service Class R | 02/09/07 | 02/09/07 | $0.357 | $1.660 |
Service Class 2R | 02/09/07 | 02/09/07 | $0.331 | $1.660 |
Investor Class R | 02/09/07 | 02/09/07 | $0.367 | $1.660 |
The fund hereby designates as a capital gain dividend with respect to the taxable year ended December 31, 2006, $224,671,947, or, if subsequently determined to be different, the net capital gain of such year.
The amounts per share which represent income derived from sources within, and taxes paid to, foreign countries or possessions of the United States are as follows:
| Pay Date | Income | Taxes |
Initial Class R | 02/10/2006 | $.332 | $.022 |
Service Class R | 02/10/2006 | $.317 | $.022 |
Service Class 2R | 02/10/2006 | $.300 | $.022 |
Investor Class R | 02/10/2006 | $.338 | $.022 |
The fund will notify shareholders in January 2007 of amounts for use in preparing 2006 income tax returns.
VIP Overseas Portfolio
Proxy Voting Results
A special meeting of the fund's shareholders was held on November 15, 2006. The results of votes taken among shareholders on the proposal before them are reported below. Each vote reported represents one dollar of net asset value held on the record date for the meeting.
PROPOSAL 1 |
To elect a Board of Trustees. A |
| # of
Votes | % of
Votes |
Dennis J. Dirks |
Affirmative | 17,902,425,874.20 | 95.888 |
Withheld | 767,753,174.62 | 4.112 |
TOTAL | 18,670,179,048.82 | 100.000 |
Albert R. Gamper, Jr. |
Affirmative | 17,903,848,885.90 | 95.895 |
Withheld | 766,330,162.92 | 4.105 |
TOTAL | 18,670,179,048.82 | 100.000 |
Robert M. Gates |
Affirmative | 17,872,803,847.04 | 95.729 |
Withheld | 797,375,201.78 | 4.271 |
TOTAL | 18,670,179,048.82 | 100.000 |
George H. Heilmeier |
Affirmative | 17.870,083,099.32 | 95.715 |
Withheld | 800,095,949.50 | 4.285 |
TOTAL | 18,670,179,048.82 | 100.000 |
Edward C. Johnson 3d |
Affirmative | 17,855,450,949.13 | 95.636 |
Withheld | 814,728,099.69 | 4.364 |
TOTAL | 18,670,179,048.82 | 100.000 |
Stephen P. Jonas |
Affirmative | 17,891,792,907.31 | 95.831 |
Withheld | 778,386,141.51 | 4.169 |
TOTAL | 18,670,179,048.82 | 100.000 |
James H. KeyesB |
Affirmative | 17,882,873,107.76 | 95.783 |
Withheld | 787,305,941.06 | 4.217 |
TOTAL | 18,670,179,048.82 | 100.000 |
Marie L. Knowles |
Affirmative | 17,891,908,567.08 | 95.831 |
Withheld | 778,270,481.74 | 4.169 |
TOTAL | 18,670,179,048.82 | 100.000 |
Ned C. Lautenbach |
Affirmative | 17,899,551,251.03 | 95.872 |
Withheld | 770,627,797.79 | 4.128 |
TOTAL | 18,670,179,048.82 | 100.000 |
| # of
Votes | % of
Votes |
William O. McCoy |
Affirmative | 17,860,461,325.05 | 95.663 |
Withheld | 809,717,723.77 | 4.337 |
TOTAL | 18,670,179,048.82 | 100.000 |
Robert L. Reynolds |
Affirmative | 17,894,978,918.13 | 95.848 |
Withheld | 775,200,130.69 | 4.152 |
TOTAL | 18,670,179,048.82 | 100.000 |
Cornelia M. Small |
Affirmative | 17,897,519,970.69 | 95.862 |
Withheld | 772,659,078.13 | 4.138 |
TOTAL | 18,670,179,048.82 | 100.000 |
William S. Stavropoulos |
Affirmative | 17,871,058,112.55 | 95.720 |
Withheld | 799,120,936.27 | 4.280 |
TOTAL | 18,670,179,048.82 | 100.000 |
Kenneth L. Wolfe |
Affirmative | 17,886,340,376.33 | 95.802 |
Withheld | 783,838,672.49 | 4.198 |
TOTAL | 18,670,179,048.82 | 100.000 |
A Denotes trust-wide proposal and voting results. B Effective on or about January 1, 2007. |
Annual Report
Board Approval of Investment Advisory Contracts and Management Fees
VIP Overseas Portfolio
Each year, typically in July, the Board of Trustees, including the Independent Trustees (together, the Board), votes on the renewal of the management contract and sub-advisory agreements (together, the Advisory Contracts) for the fund. The Board, assisted by the advice of fund counsel and Independent Trustees' counsel, requests and considers a broad range of information throughout the year.
The Board meets regularly each month except August and takes into account throughout the year matters bearing on Advisory Contracts. The Board, acting directly and through its separate committees, considers at each of its meetings factors that are relevant to the annual renewal of the fund's Advisory Contracts, including the services and support provided to the fund and its shareholders. At the time of the renewal, the Board had 12 standing committees, each composed of Independent Trustees with varying backgrounds, to which the Board has assigned specific subject matter responsibilities in order to enhance effective decision-making by the Board. Each committee has adopted a written charter outlining the structure and purposes of the committee. One such committee, the Equity Contract Committee, meets periodically as needed throughout the year to consider matters specifically related to the annual renewal of Advisory Contracts. The committee requests and receives information on, and makes recommendations to the Independent Trustees concerning, the approval and annual review of the Advisory Contracts.
At its July 2006 meeting, the Board of Trustees, including the Independent Trustees, unanimously determined to renew the Advisory Contracts for the fund. In reaching its determination, the Board considered all factors it believed relevant, including (i) the nature, extent, and quality of the services to be provided to the fund and its shareholders (including the investment performance of the fund); (ii) the competitiveness of the management fee and total expenses of the fund; (iii) the total costs of the services to be provided by and the profits to be realized by the investment adviser and its affiliates from the relationship with the fund; (iv) the extent to which economies of scale would be realized as the fund grows; and (v) whether fee levels reflect these economies of scale, if any, for the benefit of fund shareholders.
In determining whether to renew the Advisory Contracts for the fund, the Board ultimately reached a determination, with the assistance of fund counsel and Independent Trustees' counsel, that the renewal of the Advisory Contracts and the compensation to be received by Fidelity under the management contract is consistent with Fidelity's fiduciary duty under applicable law. In addition to evaluating the specific factors noted above, the Board, in reaching its determination, is aware that shareholders in the fund have a broad range of investment choices available to them, including a wide choice among mutual funds offered by competitors to Fidelity, and that the fund's shareholders, with the opportunity to review and weigh the disclosure provided by the fund in its prospectus and other public disclosures, have chosen to invest in this fund, managed by Fidelity.
Nature, Extent, and Quality of Services Provided. The Board considered staffing within the investment adviser, FMR, and the sub-advisers (together, the Investment Advisers), including the background of the fund's portfolio manager and the fund's investment objective and discipline. The Independent Trustees also had discussions with senior management of Fidelity's investment operations and investment groups. The Board considered the structure of the portfolio manager compensation program and whether this structure provides appropriate incentives.
Resources Dedicated to Investment Management and Support Services. The Board reviewed the size, education, and experience of the Investment Advisers' investment staff, their use of technology, and the Investment Advisers' approach to recruiting, training, and retaining portfolio managers and other research, advisory, and management personnel. The Board considered Fidelity's extensive global research capabilities that enable the Investment Advisers to aggregate data from various sources in an effort to produce positive investment results. The Board noted that Fidelity's analysts have access to a variety of technological tools that enable them to perform both fundamental and quantitative analysis and to specialize in various disciplines. The Board also considered that Fidelity's portfolio managers and analysts have access to daily portfolio attribution that allows for monitoring of a fund's portfolio, as well as an electronic communication system that provides immediate real-time access to research concerning issuers and credit enhancers.
Shareholder and Administrative Services. The Board considered (i) the nature, extent, quality, and cost of administrative, distribution, and shareholder services performed by the Investment Advisers and their affiliates under the Advisory Contracts and under separate agreements covering transfer agency, pricing and bookkeeping, and securities lending services for the fund; (ii) the nature and extent of the Investment Advisers' supervision of third party service providers, principally custodians and subcustodians; and (iii) the resources devoted to, and the record of compliance with, the fund's compliance policies and procedures. The Board reviewed the allocation of fund brokerage, including allocations to brokers affiliated with the Investment Advisers, the use of brokerage commissions to pay fund expenses, and the use of "soft" commission dollars to pay for research services. The Board also considered that Fidelity voluntarily pays for market data out of its own resources.
The Board noted that the growth of fund assets across the complex allows Fidelity to reinvest in the development of services designed to enhance the value or convenience of the Fidelity funds as investment vehicles. These services include 24-hour access to account information and market information through phone representatives and over the Internet, and investor education materials and asset allocation tools.
Investment in a Large Fund Family. The Board considered the benefits to shareholders of investing in a Fidelity fund, including the benefits of investing in a fund that is part of a large family of funds offering a variety of investment disciplines and providing for a large variety of mutual fund investor services. The Board noted that, since the last Advisory Contract renewals in July 2005, Fidelity has taken a number of actions that benefited particular funds, including (i) dedicating additional resources to investment research and to restructure the investment research teams; (ii) voluntarily entering into contractual arrangements with certain brokers pursuant to which Fidelity pays for research products and services separately out of its own resources, rather than bundling with fund commissions; (iii) launching the Fidelity Advantage Class of its five Spartan stock index funds and three Spartan bond index funds, which is a lower-fee class available to shareholders with higher account balances; (iv) contractually agreeing to impose expense limitations on Fidelity U.S. Bond Index Fund and reducing the fund's initial investment minimum; and (v) offering shareholders of each of the Fidelity Institutional Money Market Funds the privilege of exchanging shares of the fund for shares of other Fidelity funds.
VIP Overseas Portfolio
Investment Performance and Compliance. The Board considered whether the fund has operated within its investment objective, as well as its record of compliance with its investment restrictions. It also reviewed the fund's absolute investment performance for each class (except Investor Class R), as well as the fund's relative investment performance for each class (except Investor Class R) measured against (i) a broad-based securities market index, and (ii) a peer group of mutual funds deemed appropriate by the Board over multiple periods. The following charts considered by the Board show, over the one-, three-, and five-year periods ended December 31, 2005, the cumulative total returns of Service Class 2 and Initial Class of the fund, the cumulative total returns of a broad-based securities market index ("benchmark"), and a range of cumulative total returns of a peer group of mutual funds identified by Lipper Inc. as having an investment objective similar to that of the fund. The returns of Service Class 2 and Initial Class represent the performance of classes with the highest and lowest 12b-1 fees, respectively (not necessarily with the highest and lowest total expenses). (Investor Class R, which has no 12b-1 fee, had less than one year of performance as of December 31, 2005.) The box within each chart shows the 25th percentile return (bottom of box) and the 75th percentile return (top of box) of the Lipper peer group. Returns shown above the box are in the first quartile and returns shown below the box are in the fourth quartile. The percentage beaten numbers noted below each chart correspond to the percentile box and represent the percentage of funds in the Lipper peer group whose performance was equal to or lower than that of the class indicated.
VIP Overseas Portfolio
The Board reviewed the fund's relative investment performance against its Lipper peer group and stated that the performance of Initial Class of the fund was in the first quartile for the one- and three-year periods and the second quartile for the five-year period. The Board also stated that the relative investment performance of Initial Class of the fund compared favorably to its benchmark for the one- and three-year periods, although the fund's five-year cumulative total return was lower than its benchmark. The Board considered that the variations in performance among the fund's classes reflect the variations in class expenses, which result in lower performance for higher expense classes. The Board also reviewed the fund's relative investment performance against a peer group defined by Morningstar.
The Board considered that FMR has taken steps to refocus and strengthen equity research, equity portfolio management, and compliance. The Board noted with favor FMR's reorganization of its senior management team in 2005 and FMR's dedication of additional resources to investment research, and participated in the process that led to those changes.
Based on its review, and giving particular weight to the nature and quality of the resources dedicated by the Investment Advisers to maintain and improve relative performance, the Board concluded that the nature, extent, and quality of the services provided to the fund will benefit the fund's shareholders, particularly in light of the Board's view that the fund's shareholders benefit from investing in a fund that is part of a large family of funds offering a variety of investment disciplines and services.
Competitiveness of Management Fee and Total Fund Expenses. The Board considered the fund's management fee and total expenses compared to "mapped groups" of competitive funds and classes. Fidelity creates "mapped groups" by combining similar Lipper investment objective categories that have comparable management fee characteristics. Combining Lipper investment objective categories aids the Board's management fee and total expense comparisons by broadening the competitive group used for comparison and by reducing the number of universes to which various Fidelity funds are compared.
Annual Report
Board Approval of Investment Advisory Contracts and Management Fees - continued
The Board considered two proprietary management fee comparisons for the 12-month periods shown in the chart below. The group of Lipper funds used by the Board for management fee comparisons is referred to below as the "Total Mapped Group" and, for the reasons explained above, is broader than the Lipper peer group used by the Board for performance comparisons. The Total Mapped Group comparison focuses on a fund's standing relative to the total universe of comparable funds available to investors, in terms of gross management fees before expense reimbursements or caps. "TMG %" represents the percentage of funds in the Total Mapped Group that had management fees that were lower than the fund's. For example, a TMG % of 12% means that 88% of the funds in the Total Mapped Group had higher management fees than the fund. The "Asset-Size Peer Group" (ASPG) comparison focuses on a fund's standing relative to non-Fidelity funds similar in size to the fund within the Total Mapped Group. The ASPG represents at least 15% of the funds in the Total Mapped Group with comparable asset size and management fee characteristics, subject to a minimum of 50 funds (or all funds in the Total Mapped Group if fewer than 50). Additional information, such as the ASPG quartile in which the fund's management fee ranked, is also included in the chart and considered by the Board.
VIP Overseas Portfolio
The Board noted that the fund's management fee ranked below the median of its Total Mapped Group and below the median of its ASPG for 2005.
Based on its review, the Board concluded that the fund's management fee was fair and reasonable in light of the services that the fund receives and the other factors considered.
In its review of each class's total expenses, the Board considered the fund's management fee as well as other fund or class expenses, as applicable, such as transfer agent fees, pricing and bookkeeping fees, fund-paid 12b-1 fees, and custodial, legal, and audit fees. The Board also noted the effects of any waivers and reimbursements on fees and expenses. As part of its review, the Board also considered current and historical total expenses of each class of the fund compared to competitive fund median expenses. Each class of the fund is compared to those funds and classes in the Total Mapped Group (used by the Board for management fee comparisons) that have a similar sales load structure.
The Board noted that the total expenses of each class ranked below its competitive median for 2005.
In its review of total expenses, the Board also considered Fidelity fee structures and other information on clients that FMR and its affiliates service in other competitive markets, such as other mutual funds advised or subadvised by FMR or its affiliates, pension plan clients, and other institutional clients.
Based on its review, the Board concluded that the total expenses of each class of the fund were reasonable in light of the services that the fund and its shareholders receive and the other factors considered.
Costs of the Services and Profitability. The Board considered the revenues earned and the expenses incurred by Fidelity in conducting the business of developing, marketing, distributing, managing, administering and servicing the fund and its shareholders. The Board also considered the level of Fidelity's profits in respect of all the Fidelity funds.
VIP Overseas Portfolio
On an annual basis, FMR presents to the Board Fidelity's profitability for the fund. Fidelity calculates the profitability for each fund, as well as aggregate profitability for groups of Fidelity funds and all Fidelity funds, using a series of detailed revenue and cost allocation methodologies which originate with the audited books and records of Fidelity. The Audit Committee of the Board reviews any significant changes from the prior year's methodologies.
PricewaterhouseCoopers LLP (PwC), independent registered accounting firm and auditor to Fidelity and certain Fidelity funds, has been engaged annually by the Board as part of the Board's assessment of the results of Fidelity's profitability analysis. PwC's engagement includes the review and assessment of Fidelity's methodologies used in determining the revenues and expenses attributable to Fidelity's mutual fund business, and completion of agreed-upon procedures surrounding the mathematical accuracy of fund profitability and its conformity to allocation methodologies. After considering PwC's reports issued under the engagement and information provided by Fidelity, the Board believes that while other allocation methods may also be reasonable, Fidelity's profitability methodologies are reasonable in all material respects.
The Board has also reviewed Fidelity's non-fund businesses and any fall-out benefits related to the mutual fund business as well as cases where Fidelity's affiliates may benefit from or be related to the fund's business.
The Board considered the costs of the services provided by and the profits realized by Fidelity in connection with the operation of the fund and determined that the amount of profit is a fair entrepreneurial profit for the management of the fund.
Economies of Scale. The Board considered whether there have been economies of scale in respect of the management of the Fidelity funds, whether the Fidelity funds (including the fund) have appropriately benefited from any such economies of scale, and whether there is potential for realization of any further economies of scale. The Board considered the extent to which the fund will benefit from economies of scale through increased services to the fund, through waivers or reimbursements, or through fee or expense reductions.
The Board recognized that the fund's management contract incorporates a "group fee" structure, which provides for lower fee rates as total fund assets under FMR's management increase, and for higher fee rates as total fund assets under FMR's management decrease. The Board considered that the group fee is designed to deliver the benefits of economies of scale to fund shareholders when total fund assets increase, even if assets of any particular fund are unchanged or have declined, because some portion of Fidelity's costs are attributable to services provided to all Fidelity funds, and all funds benefit if those costs can be allocated among more assets. The Board concluded that, given the group fee structure, fund shareholders will achieve a certain level of economies of scale as assets under FMR's management increase at the fund complex level, regardless of whether Fidelity achieves any such economies of scale.
The Board further concluded that any potential economies of scale are being shared between fund shareholders and Fidelity in an appropriate manner.
Additional Information Requested by the Board. In order to develop fully the factual basis for consideration of the Advisory Contracts, the Board requested additional information on several topics, including (i) Fidelity's fund profitability methodology and profitability trends within certain funds; (ii) portfolio manager compensation; (iii) the extent to which any economies of scale exist and are shared between the funds and Fidelity; (iv) the total expenses of certain funds and classes relative to competitors, including the extent to which the expenses of certain funds have been or could be capped; (v) fund performance trends; and (vi) Fidelity's fee structures, including use of performance fees.
Based on its evaluation of all of the conclusions noted above, and after considering all material factors, the Board ultimately concluded that the advisory fee structures are fair and reasonable, and that the fund's Advisory Contracts should be renewed.
Annual Report
Investment Adviser
Fidelity Management & Research Company
Boston, MA
Investment Sub-Advisers
FMR Co., Inc.
Fidelity Management & Research (U.K.) Inc.
Fidelity Research & Analysis Company (formerly Fidelity
Management & Research (Far East) Inc.)
Fidelity International Investment Advisors
Fidelity International Investment Advisors (U.K.) Limited
Fidelity Investments Japan Limited
General Distributor
Fidelity Distributors Corporation
Boston, MA
Transfer and Service Agents
Fidelity Investments Institutional Operations Company, Inc.
Boston, MA
Fidelity Service Company, Inc.
Boston, MA
Custodian
JPMorgan Chase Bank
New York, NY
VIPOVRSR-ANN-0207
1.781996.104
Fidelity® Variable Insurance Products:
Value Portfolio
Annual Report
December 31, 2006
(2_fidelity_logos) (Registered_Trademark)
Contents
Performance | <Click Here> | How the fund has done over time. |
Management's Discussion | <Click Here> | The manager's review of fund performance, strategy and outlook. |
Shareholder Expense Example | <Click Here> | An example of shareholder expenses. |
Investment Changes | <Click Here> | A summary of major shifts in the fund's investments over the past six months. |
Investments | <Click Here> | A complete list of the fund's investments with their
market values. |
Financial Statements | <Click Here> | Statements of assets and liabilities, operations, and
changes in net assets, as well as financial highlights. |
Notes | <Click Here> | Notes to the financial statements. |
Report of Independent Registered Public Accounting Firm | <Click Here> | |
Trustees and Officers | <Click Here> | |
Distributions | <Click Here> | |
Proxy Voting Results | <Click Here> | |
Board Approval of Investment Advisory Contracts and Management Fees | <Click Here> | |
To view a fund's proxy voting guidelines and proxy voting record for the 12-month period ended June 30, visit www.fidelity.com/proxyvotingresults or visit the Securities and Exchange Commission's (SEC) web site at www.sec.gov. You may also call 1-877-208-0098 to request a free copy of the proxy voting guidelines.
Fidelity Variable Insurance Products are separate account options which are purchased through a variable insurance contract.
Standard & Poor's, S&P and S&P 500 are registered service marks of The McGraw-Hill Companies, Inc. and have been licensed for use by Fidelity Distributors Corporation.
Other third party marks appearing herein are the property of their respective owners.
All other marks appearing herein are registered or unregistered trademarks or service marks of FMR Corp. or an affiliated company.
This report and the financial statements contained herein are submitted for the general information of the shareholders of the fund. This report is not authorized for distribution to prospective investors in the fund unless preceded or accompanied by an effective prospectus.
A fund files its complete schedule of portfolio holdings with the SEC for the first and third quarters of each fiscal year on Form N-Q. Forms N-Q are available on the SEC's web site at http://www.sec.gov. A fund's Forms N-Q may be reviewed and copied at the SEC's Public Reference Room in Washington, DC. Information regarding the operation of the SEC's Public Reference Room may be obtained by calling 1-800-SEC-0330. For a complete list of a fund's portfolio holdings, view the most recent quarterly holdings report, semiannual report, or annual report on Fidelity's web site at http://www.advisor.fidelity.com.
NOT FDIC INSURED · MAY LOSE VALUE · NO BANK GUARANTEE
Neither the fund nor Fidelity Distributors Corporation is a bank.
VIP Value Portfolio
VIP Value Portfolio
Performance: The Bottom Line
Average annual total return reflects the change in the value of an investment, assuming reinvestment of the class' dividend income and capital gains (the profits earned upon the sale of securities that have grown in value) and assuming a constant rate of performance each year. During periods of reimbursement by Fidelity, a fund's total return will be greater than it would be had the reimbursement not occurred. Performance numbers are net of all underlying fund operating expenses, but do not include any insurance charges imposed by your insurance company's separate account. If performance information included the effect of these additional charges, the total returns would have been lower. How a fund did yesterday is no guarantee of how it will do tomorrow.
Average Annual Total Returns
Periods ended December 31, 2006 | Past 1
year | Past 5
years | Life of fundA |
VIP Value - Initial Class | 14.75% | 8.91% | 7.19% |
VIP Value - Service ClassB | 14.56% | 8.80% | 7.07% |
VIP Value - Service Class 2 C | 14.32% | 8.61% | 6.91% |
VIP Value - Investor Class D | 14.49% | 8.85% | 7.14% |
A From May 9, 2001.
B Performance for Service Class shares reflects an asset-based service fee (12b-1 fee).
C Performance for Service Class 2 shares reflects an asset-based service fee (12b-1 fee).
D The initial offering of Investor Class shares took place on July 21, 2005. Returns prior to July 21, 2005 are those of Initial Class. If Investor Class's transfer agent fee had been reflected, returns prior to July 21, 2005 would have been lower.
$10,000 Over Life of Fund
Let's say hypothetically that $10,000 was invested in VIP Value Portfolio - Initial Class on May 9, 2001, when the fund started. The chart shows how the value of your investment would have changed, and also shows how the Russell 3000® Value Index performed over the same period.
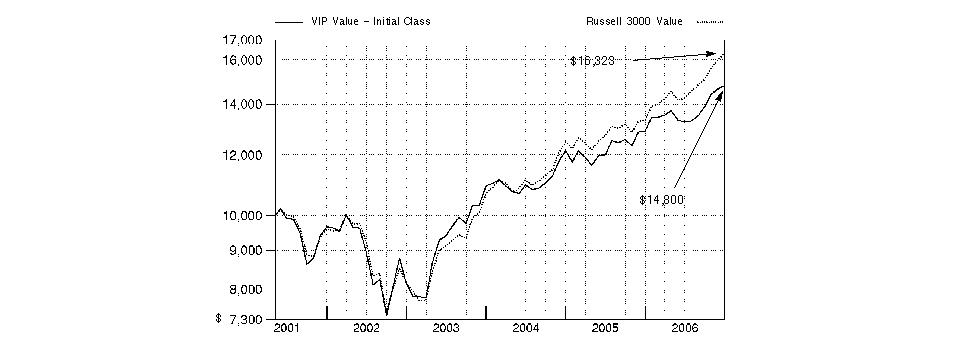
Annual Report
VIP Value Portfolio
Management's Discussion of Fund Performance
Comments from Stephen DuFour, who managed VIP Value Portfolio for most of the period covered by this report
U.S. stock markets registered their fourth consecutive year of positive returns in 2006. Among the highlights were the performances of the Dow Jones Industrial AverageSM - a gauge of 30 mega-cap, blue-chip stocks - and the small-cap-oriented Russell 2000® Index, both of which reached new highs. The efforts of the Federal Reserve Board to contain inflation levels also dominated the investment headlines. In all, the Fed hiked short-term interest rates four times, but held rates steady after its June 29 increase, finally pausing after 17 rate hikes over a two-year period. A slowing residential housing market and moderating oil prices - the latter of which hit a record closing high of $77 per barrel in July before falling sharply - also held economic growth in check. For the year overall, the Standard & Poor's 500SM Index was up 15.79%, the Dow advanced 19.05%, the Russell 2000 Index gained 18.37% and the NASDAQ Composite® Index rose 10.39%.
For the fiscal year ending December 31, 2006, the fund underperformed the Russell 3000® Value Index, which returned 22.34%. (For specific portfolio performance results, please refer to the performance section of this report.) Most of the fund's relative underperformance came from owning stocks whose returns, while generally strong, were not as good as those of some of the index's largest names. The fund's weakest results were in financials, consumer discretionary and consumer staples, while an underweighting in energy also hurt. The biggest detractors were Wal-Mart Stores and global insurance giant American International Group, as well as Canada's Talisman Energy, which suffered due to weak natural gas prices. A few good picks in the telecommunication services and materials sectors, as well as overweighting the semiconductors/semiconductor equipment group during the first half of the period, boosted the fund's return. The top contributors included such names as FormFactor, a maker of semiconductor wafers used to test integrated circuits, and coal producer Peabody Energy, which contributed due to the fund's timely trading of its stock. None of these stocks just mentioned was in the portfolio at period end.
Note to shareholders: Richard Fentin became Portfolio Manager of the fund on November 9, 2006.
The views expressed above reflect those of the portfolio manager(s) only through the end of the period as stated on the cover of this report and do not necessarily represent the views of Fidelity or any other person in the Fidelity organization. Any such views are subject to change at any time based upon market or other conditions and Fidelity disclaims any responsibility to update such views. These views may not be relied on as investment advice and, because investment decisions for a Fidelity fund are based on numerous factors, may not be relied on as an indication of trading intent on behalf of any Fidelity fund.
VIP Value Portfolio
VIP Value Portfolio
Shareholder Expense Example
As a shareholder of the Fund, you incur two types of costs: (1) transaction costs, and (2) ongoing costs, including management fees, distribution and/or service (12b-1) fees and other Fund expenses. This Example is intended to help you understand your ongoing costs (in dollars) of investing in the Fund and to compare these costs with the ongoing costs of investing in other mutual funds.
The Example is based on an investment of $1,000 invested at the beginning of the period and held for the entire period (July 1, 2006 to December 31, 2006).
Actual Expenses
The first line of the accompanying table for each class of the Fund provides information about actual account values and actual expenses. You may use the information in this line, together with the amount you invested, to estimate the expenses that you paid over the period. Simply divide your account value by $1,000.00 (for example, an $8,600 account value divided by $1,000.00 = 8.6), then multiply the result by the number in the first line for a class of the Fund under the heading entitled "Expenses Paid During Period" to estimate the expenses you paid on your account during this period. The estimate of expenses does not include any fees or other expenses of any variable annuity or variable life insurance product. If they were, the estimate of expenses you paid during the period would be higher, and your ending account value would be lower.
Hypothetical Example for Comparison Purposes
The second line of the accompanying table for each class of the Fund provides information about hypothetical account values and hypothetical expenses based on a Class' actual expense ratio and an assumed rate of return of 5% per year before expenses, which is not the Class' actual return. The hypothetical account values and expenses may not be used to estimate the actual ending account balance or expenses you paid for the period. You may use this information to compare the ongoing costs of investing in the Fund and other funds. To do so, compare this 5% hypothetical example with the 5% hypothetical examples that appear in the shareholder reports of the other funds. The estimate of expenses does not include any fees or other expenses of any variable annuity or variable life insurance product. If they were, the estimate of expenses you paid during the period would be higher, and your ending account value would be lower.
Please note that the expenses shown in the table are meant to highlight your ongoing costs only and do not reflect any transaction costs. Therefore, the second line of the table is useful in comparing ongoing costs only, and will not help you determine the relative total costs of owning different funds.
| Beginning
Account Value
July 1, 2006 | Ending
Account Value
December 31, 2006 | Expenses Paid
During Period *
July 1, 2006
to December 31, 2006 |
Initial Class | | | |
Actual | $ 1,000.00 | $ 1,114.90 | $ 4.53 |
HypotheticalA | $ 1,000.00 | $ 1,020.92 | $ 4.33 |
Service Class | | | |
Actual | $ 1,000.00 | $ 1,114.60 | $ 5.06 |
HypotheticalA | $ 1,000.00 | $ 1,020.42 | $ 4.84 |
Service Class 2 | | | |
Actual | $ 1,000.00 | $ 1,113.00 | $ 5.86 |
HypotheticalA | $ 1,000.00 | $ 1,019.66 | $ 5.60 |
Investor Class | | | |
Actual | $ 1,000.00 | $ 1,114.00 | $ 5.22 |
Hypothetical A | $ 1,000.00 | $ 1,020.27 | $ 4.99 |
A 5% return per year before expenses
* Expenses are equal to each Class' annualized expense ratio (shown in the table below); multiplied by the average account value over the period, multiplied by 184/365 (to reflect the one-half year period).
| Annualized
Expense Ratio |
Initial Class | .85% |
Service Class | .95% |
Service Class 2 | 1.10% |
Investor Class | .98% |
Annual Report
VIP Value Portfolio
Investment Changes
Top Ten Stocks as of December 31, 2006 |
| % of fund's
net assets | % of fund's net assets
6 months ago |
Baxter International, Inc. | 1.9 | 0.0 |
Xerox Corp. | 1.5 | 0.0 |
Tyco International Ltd. | 1.3 | 0.0 |
Symbol Technologies, Inc. | 1.1 | 0.0 |
Ceridian Corp. | 1.1 | 0.0 |
Avon Products, Inc. | 1.1 | 0.0 |
The Brink's Co. | 1.1 | 0.0 |
Safeway, Inc. | 1.0 | 0.0 |
Flextronics International Ltd. | 1.0 | 0.0 |
Agilent Technologies, Inc. | 1.0 | 0.0 |
| 12.1 | |
Top Five Market Sectors as of December 31, 2006 |
| % of fund's
net assets | % of fund's net assets
6 months ago |
Information Technology | 19.5 | 6.1 |
Consumer Discretionary | 19.4 | 9.7 |
Financials | 15.1 | 30.8 |
Health Care | 10.5 | 7.9 |
Energy | 7.5 | 10.1 |
Asset Allocation (% of fund's net assets) |
As of December 31, 2006 * | As of June 30, 2006 ** |
| Stocks 97.6% | | | Stocks 95.5% | |
| Bonds 0.1% | | | Bonds 0.2% | |
| Short-Term
Investments and
Net Other Assets 2.3% | | | Short-Term
Investments and
Net Other Assets 4.3% | |
* Foreign investments | 10.3% | | **Foreign investments | 1.0% | |

VIP Value Portfolio
VIP Value Portfolio
Investments December 31, 2006
Showing Percentage of Net Assets
Common Stocks - 97.4% |
| Shares | | Value (Note 1) |
CONSUMER DISCRETIONARY - 19.3% |
Auto Components - 0.2% |
Gentex Corp. | 11,100 | | $ 172,716 |
Automobiles - 1.1% |
Monaco Coach Corp. | 3,200 | | 45,312 |
Nissan Motor Co. Ltd. | 13,400 | | 161,295 |
Renault SA | 3,800 | | 456,525 |
Winnebago Industries, Inc. | 7,575 | | 249,293 |
| | 912,425 |
Diversified Consumer Services - 0.1% |
Apollo Group, Inc. Class A (a) | 400 | | 15,588 |
Service Corp. International | 8,400 | | 86,100 |
| | 101,688 |
Hotels, Restaurants & Leisure - 3.9% |
Applebee's International, Inc. | 3,300 | | 81,411 |
Aristocrat Leisure Ltd. | 9,700 | | 121,749 |
Boyd Gaming Corp. | 200 | | 9,062 |
Brinker International, Inc. | 15,900 | | 479,544 |
Carnival Corp. unit | 13,700 | | 671,985 |
Domino's Pizza, Inc. | 5,700 | | 159,600 |
Gaylord Entertainment Co. (a) | 4,000 | | 203,720 |
OSI Restaurant Partners, Inc. | 9,900 | | 388,080 |
Rare Hospitality International, Inc. (a) | 5,300 | | 174,529 |
Royal Caribbean Cruises Ltd. | 15,300 | | 633,114 |
WMS Industries, Inc. (a) | 6,800 | | 237,048 |
| | 3,159,842 |
Household Durables - 3.2% |
Ethan Allen Interiors, Inc. | 5,643 | | 203,769 |
Jarden Corp. (a) | 7,300 | | 253,967 |
La-Z-Boy, Inc. | 7,500 | | 89,025 |
Leggett & Platt, Inc. | 21,200 | | 506,680 |
Newell Rubbermaid, Inc. | 10,200 | | 295,290 |
Sealy Corp., Inc. | 13,700 | | 202,075 |
Sony Corp. sponsored ADR | 1,700 | | 72,811 |
The Stanley Works | 14,500 | | 729,205 |
Whirlpool Corp. | 3,300 | | 273,966 |
| | 2,626,788 |
Leisure Equipment & Products - 1.3% |
Brunswick Corp. | 11,800 | | 376,420 |
Eastman Kodak Co. | 22,000 | | 567,600 |
Polaris Industries, Inc. | 1,700 | | 79,611 |
| | 1,023,631 |
Media - 4.2% |
Clear Channel Communications, Inc. | 12,700 | | 451,358 |
E.W. Scripps Co. Class A | 5,600 | | 279,664 |
Gannett Co., Inc. | 9,800 | | 592,508 |
Getty Images, Inc. (a) | 3,700 | | 158,434 |
Live Nation, Inc. (a) | 6,300 | | 141,120 |
Omnicom Group, Inc. | 3,200 | | 334,528 |
R.H. Donnelley Corp. | 7,800 | | 489,294 |
The New York Times Co. Class A | 11,500 | | 280,140 |
|
| Shares | | Value (Note 1) |
The Reader's Digest Association, Inc. (non-vtg.) | 9,210 | | $ 153,807 |
Tribune Co. | 9,000 | | 277,020 |
Viacom, Inc. Class B (non-vtg.) (a) | 5,500 | | 225,665 |
| | 3,383,538 |
Multiline Retail - 1.0% |
Big Lots, Inc. (a) | 4,792 | | 109,833 |
Family Dollar Stores, Inc. | 18,100 | | 530,873 |
Sears Holdings Corp. (a) | 500 | | 83,965 |
Tuesday Morning Corp. | 4,602 | | 71,561 |
| | 796,232 |
Specialty Retail - 3.4% |
AnnTaylor Stores Corp. (a) | 700 | | 22,988 |
AutoNation, Inc. (a) | 3,800 | | 81,016 |
AutoZone, Inc. (a) | 1,100 | | 127,116 |
Best Buy Co., Inc. | 2,000 | | 98,380 |
Gap, Inc. | 28,800 | | 561,600 |
Hot Topic, Inc. (a) | 7,600 | | 101,384 |
OfficeMax, Inc. | 13,100 | | 650,415 |
PETsMART, Inc. | 11,800 | | 340,548 |
Select Comfort Corp. (a) | 4,132 | | 71,855 |
Tiffany & Co., Inc. | 12,100 | | 474,804 |
Williams-Sonoma, Inc. | 7,400 | | 232,656 |
| | 2,762,762 |
Textiles, Apparel & Luxury Goods - 0.9% |
Brown Shoe Co., Inc. | 700 | | 33,418 |
Liz Claiborne, Inc. | 16,700 | | 725,782 |
| | 759,200 |
TOTAL CONSUMER DISCRETIONARY | | 15,698,822 |
CONSUMER STAPLES - 5.8% |
Beverages - 0.6% |
Cott Corp. (a) | 15,300 | | 219,003 |
SABMiller PLC | 10,400 | | 239,335 |
| | 458,338 |
Food & Staples Retailing - 1.9% |
Kroger Co. | 10,700 | | 246,849 |
Rite Aid Corp. | 19,200 | | 104,448 |
Safeway, Inc. | 24,000 | | 829,440 |
Sysco Corp. | 10,900 | | 400,684 |
| | 1,581,421 |
Food Products - 0.9% |
Bunge Ltd. | 1,800 | | 130,518 |
Chiquita Brands International, Inc. | 5,100 | | 81,447 |
Corn Products International, Inc. | 6,300 | | 217,602 |
PAN Fish ASA (a) | 5,000 | | 4,571 |
Tyson Foods, Inc. Class A | 20,300 | | 333,935 |
| | 768,073 |
Household Products - 0.6% |
Colgate-Palmolive Co. | 7,500 | | 489,300 |
Common Stocks - continued |
| Shares | | Value (Note 1) |
CONSUMER STAPLES - continued |
Personal Products - 1.2% |
Avon Products, Inc. | 27,600 | | $ 911,904 |
Playtex Products, Inc. (a) | 2,000 | | 28,780 |
| | 940,684 |
Tobacco - 0.6% |
Altria Group, Inc. | 5,470 | | 469,435 |
TOTAL CONSUMER STAPLES | | 4,707,251 |
ENERGY - 7.5% |
Energy Equipment & Services - 5.1% |
Baker Hughes, Inc. | 4,300 | | 321,038 |
Cameron International Corp. (a) | 8,200 | | 435,010 |
ENSCO International, Inc. | 4,700 | | 235,282 |
FMC Technologies, Inc. (a) | 8,300 | | 511,529 |
GlobalSantaFe Corp. | 4,300 | | 252,754 |
Halliburton Co. | 11,500 | | 357,075 |
Hornbeck Offshore Services, Inc. (a) | 663 | | 23,669 |
National Oilwell Varco, Inc. (a) | 11,100 | | 679,098 |
Pride International, Inc. (a) | 3,600 | | 108,036 |
Smith International, Inc. | 14,000 | | 574,980 |
Superior Energy Services, Inc. (a) | 900 | | 29,412 |
Transocean, Inc. (a) | 3,800 | | 307,382 |
Weatherford International Ltd. (a) | 6,700 | | 279,993 |
| | 4,115,258 |
Oil, Gas & Consumable Fuels - 2.4% |
Arch Coal, Inc. | 10,300 | | 309,309 |
Cabot Oil & Gas Corp. | 5,100 | | 309,315 |
EOG Resources, Inc. | 3,500 | | 218,575 |
EXCO Resources, Inc. | 5,500 | | 93,005 |
Foundation Coal Holdings, Inc. | 9,900 | | 314,424 |
Noble Energy, Inc. | 2,900 | | 142,303 |
Petroplus Holdings AG | 1,030 | | 62,529 |
Teekay Offshore Partners LP (a) | 400 | | 10,544 |
Ultra Petroleum Corp. (a) | 2,800 | | 133,700 |
Valero Energy Corp. | 7,000 | | 358,120 |
| | 1,951,824 |
TOTAL ENERGY | | 6,067,082 |
FINANCIALS - 15.0% |
Capital Markets - 1.1% |
Ameriprise Financial, Inc. | 1,000 | | 54,500 |
Janus Capital Group, Inc. | 3,500 | | 75,565 |
Merrill Lynch & Co., Inc. | 4,900 | | 456,190 |
State Street Corp. | 2,710 | | 182,762 |
TD Ameritrade Holding Corp. | 9,200 | | 148,856 |
| | 917,873 |
Commercial Banks - 1.2% |
Appalachian Bancshares, Inc. (a) | 100 | | 1,925 |
Boston Private Financial Holdings, Inc. | 3,700 | | 104,377 |
|
| Shares | | Value (Note 1) |
JSC Halyk Bank of Kazakhstan GDR (a)(c) | 700 | | $ 15,400 |
Popular, Inc. | 2,700 | | 48,465 |
UnionBanCal Corp. | 2,800 | | 171,500 |
Wachovia Corp. | 8,800 | | 501,160 |
Zions Bancorp | 2,200 | | 181,368 |
| | 1,024,195 |
Consumer Finance - 0.5% |
Capital One Financial Corp. | 5,100 | | 391,782 |
Diversified Financial Services - 0.6% |
Bank of America Corp. | 4,120 | | 219,967 |
JPMorgan Chase & Co. | 5,000 | | 241,500 |
| | 461,467 |
Insurance - 4.2% |
AFLAC, Inc. | 9,200 | | 423,200 |
AMBAC Financial Group, Inc. | 5,600 | | 498,792 |
Genworth Financial, Inc. Class A (non-vtg.) | 3,700 | | 126,577 |
Marsh & McLennan Companies, Inc. | 18,700 | | 573,342 |
MBIA, Inc. | 8,300 | | 606,398 |
MetLife, Inc. | 3,000 | | 177,030 |
Montpelier Re Holdings Ltd. | 2,000 | | 37,220 |
Prudential Financial, Inc. | 3,200 | | 274,752 |
The St. Paul Travelers Companies, Inc. | 7,800 | | 418,782 |
Willis Group Holdings Ltd. | 7,200 | | 285,912 |
| | 3,422,005 |
Real Estate Investment Trusts - 5.2% |
Alexandria Real Estate Equities, Inc. | 2,000 | | 200,800 |
American Financial Realty Trust (SBI) | 8,900 | | 101,816 |
Annaly Capital Management, Inc. | 4,600 | | 63,986 |
Developers Diversified Realty Corp. | 4,300 | | 270,685 |
Duke Realty LP | 10,200 | | 417,180 |
Education Realty Trust, Inc. | 4,800 | | 70,896 |
Equity Office Properties Trust | 11,100 | | 534,687 |
Equity Residential (SBI) | 5,700 | | 289,275 |
General Growth Properties, Inc. | 11,923 | | 622,738 |
GMH Communities Trust | 4,500 | | 45,675 |
Health Care Property Investors, Inc. | 9,800 | | 360,836 |
Kimco Realty Corp. | 6,300 | | 283,185 |
Public Storage, Inc. | 3,600 | | 351,000 |
Vornado Realty Trust | 4,900 | | 595,350 |
| | 4,208,109 |
Thrifts & Mortgage Finance - 2.2% |
Countrywide Financial Corp. | 8,700 | | 369,315 |
Fannie Mae | 12,500 | | 742,375 |
Freddie Mac | 7,100 | | 482,090 |
Hudson City Bancorp, Inc. | 16,700 | | 231,796 |
| | 1,825,576 |
TOTAL FINANCIALS | | 12,251,007 |
Common Stocks - continued |
| Shares | | Value (Note 1) |
HEALTH CARE - 10.5% |
Biotechnology - 0.5% |
Cephalon, Inc. (a) | 4,700 | | $ 330,927 |
MedImmune, Inc. (a) | 3,400 | | 110,058 |
| | 440,985 |
Health Care Equipment & Supplies - 2.8% |
Baxter International, Inc. | 33,400 | | 1,549,425 |
Becton, Dickinson & Co. | 4,400 | | 308,660 |
CONMED Corp. (a) | 5,800 | | 134,096 |
Dade Behring Holdings, Inc. | 2,800 | | 111,468 |
Wright Medical Group, Inc. (a) | 6,900 | | 160,632 |
| | 2,264,281 |
Health Care Providers & Services - 5.2% |
AmerisourceBergen Corp. | 1,100 | | 49,456 |
Brookdale Senior Living, Inc. | 4,200 | | 201,600 |
Chemed Corp. | 2,400 | | 88,752 |
Community Health Systems, Inc. (a) | 14,800 | | 540,496 |
DaVita, Inc. (a) | 3,200 | | 182,016 |
Health Net, Inc. (a) | 7,720 | | 375,655 |
Laboratory Corp. of America Holdings (a) | 2,400 | | 176,328 |
McKesson Corp. | 10,700 | | 542,490 |
Medco Health Solutions, Inc. (a) | 6,300 | | 336,672 |
Omnicare, Inc. | 3,500 | | 135,205 |
Quest Diagnostics, Inc. | 8,400 | | 445,200 |
Triad Hospitals, Inc. (a) | 5,000 | | 209,150 |
United Surgical Partners International, Inc. (a) | 10,500 | | 297,675 |
UnitedHealth Group, Inc. | 1,200 | | 64,476 |
Universal Health Services, Inc. Class B | 10,600 | | 587,558 |
| | 4,232,729 |
Life Sciences Tools & Services - 0.9% |
Charles River Laboratories International, Inc. (a) | 7,000 | | 302,750 |
Thermo Fisher Scientific, Inc. (a) | 3,700 | | 167,573 |
Varian, Inc. (a) | 2,000 | | 89,580 |
Waters Corp. (a) | 4,000 | | 195,880 |
| | 755,783 |
Pharmaceuticals - 1.1% |
Schering-Plough Corp. | 23,700 | | 560,268 |
Teva Pharmaceutical Industries Ltd. sponsored ADR | 9,900 | | 307,692 |
| | 867,960 |
TOTAL HEALTH CARE | | 8,561,738 |
INDUSTRIALS - 7.3% |
Aerospace & Defense - 0.3% |
Honeywell International, Inc. | 4,900 | | 221,676 |
Airlines - 0.7% |
Ryanair Holdings PLC sponsored ADR (a) | 3,700 | | 301,550 |
|
| Shares | | Value (Note 1) |
Southwest Airlines Co. | 6,200 | | $ 94,984 |
TAM SA (PN) sponsored ADR (ltd. vtg.) | 4,800 | | 144,048 |
| | 540,582 |
Building Products - 1.1% |
American Standard Companies, Inc. | 3,800 | | 174,230 |
Masco Corp. | 23,500 | | 701,945 |
| | 876,175 |
Commercial Services & Supplies - 1.5% |
Allied Waste Industries, Inc. | 10,300 | | 126,587 |
Clean Harbors, Inc. (a) | 1,700 | | 82,297 |
Navigant Consulting, Inc. (a) | 4,700 | | 92,872 |
Pike Electric Corp. (a) | 4,100 | | 66,953 |
The Brink's Co. | 13,700 | | 875,704 |
| | 1,244,413 |
Construction & Engineering - 0.6% |
Fluor Corp. | 5,600 | | 457,240 |
Industrial Conglomerates - 1.3% |
Tyco International Ltd. | 35,000 | | 1,064,000 |
Machinery - 0.9% |
Albany International Corp. Class A | 2,500 | | 82,275 |
Deere & Co. | 5,300 | | 503,871 |
SPX Corp. | 900 | | 55,044 |
Wabash National Corp. | 6,200 | | 93,620 |
| | 734,810 |
Road & Rail - 0.7% |
Canadian National Railway Co. | 4,200 | | 180,355 |
Con-way, Inc. | 6,800 | | 299,472 |
CSX Corp. | 1,000 | | 34,430 |
Laidlaw International, Inc. | 3,000 | | 91,290 |
| | 605,547 |
Transportation Infrastructure - 0.2% |
Macquarie Infrastructure Co. Trust | 4,900 | | 173,852 |
TOTAL INDUSTRIALS | | 5,918,295 |
INFORMATION TECHNOLOGY - 19.5% |
Communications Equipment - 1.0% |
Alcatel-Lucent SA sponsored ADR | 19,821 | | 281,855 |
Motorola, Inc. | 15,800 | | 324,848 |
Nortel Networks Corp. (a) | 7,910 | | 212,200 |
Powerwave Technologies, Inc. (a) | 4,100 | | 26,445 |
| | 845,348 |
Computers & Peripherals - 2.8% |
Diebold, Inc. | 4,700 | | 219,020 |
EMC Corp. (a) | 11,200 | | 147,840 |
Imation Corp. | 3,800 | | 176,434 |
Intermec, Inc. (a) | 11,129 | | 270,101 |
Komag, Inc. (a) | 200 | | 7,576 |
NCR Corp. (a) | 11,300 | | 483,188 |
Seagate Technology | 29,900 | | 792,350 |
Common Stocks - continued |
| Shares | | Value (Note 1) |
INFORMATION TECHNOLOGY - continued |
Computers & Peripherals - continued |
Sun Microsystems, Inc. (a) | 17,900 | | $ 97,018 |
Western Digital Corp. (a) | 6,200 | | 126,852 |
| | 2,320,379 |
Electronic Equipment & Instruments - 5.6% |
Agilent Technologies, Inc. (a) | 23,300 | | 812,005 |
Arrow Electronics, Inc. (a) | 13,800 | | 435,390 |
Avnet, Inc. (a) | 21,079 | | 538,147 |
CDW Corp. | 4,500 | | 316,440 |
Celestica, Inc. (sub. vtg.) (a) | 36,100 | | 281,122 |
Flextronics International Ltd. (a) | 72,000 | | 826,560 |
Ingram Micro, Inc. Class A (a) | 11,100 | | 226,551 |
Jabil Circuit, Inc. | 3,300 | | 81,015 |
Solectron Corp. (a) | 38,800 | | 124,936 |
Symbol Technologies, Inc. | 62,600 | | 935,244 |
| | 4,577,410 |
Internet Software & Services - 0.9% |
Open Text Corp. (a) | 2,200 | | 45,132 |
ValueClick, Inc. (a) | 6,000 | | 141,780 |
Yahoo!, Inc. (a) | 19,800 | | 505,692 |
| | 692,604 |
IT Services - 2.0% |
Ceridian Corp. (a) | 33,000 | | 923,340 |
Hewitt Associates, Inc. Class A (a) | 17,100 | | 440,325 |
Satyam Computer Services Ltd. sponsored ADR | 10,200 | | 244,902 |
Unisys Corp. (a) | 3,600 | | 28,224 |
| | 1,636,791 |
Office Electronics - 1.5% |
Xerox Corp. (a) | 71,200 | | 1,206,840 |
Semiconductors & Semiconductor Equipment - 4.5% |
AMIS Holdings, Inc. (a) | 10,700 | | 113,099 |
Amkor Technology, Inc. (a) | 5,500 | | 51,370 |
Applied Materials, Inc. | 23,800 | | 439,110 |
ASML Holding NV (NY Shares) (a) | 21,100 | | 519,693 |
Atmel Corp. (a) | 11,100 | | 67,155 |
DSP Group, Inc. (a) | 2,200 | | 47,740 |
Fairchild Semiconductor International, Inc. (a) | 36,400 | | 611,884 |
Integrated Device Technology, Inc. (a) | 16,200 | | 250,776 |
Intersil Corp. Class A | 16,100 | | 385,112 |
Maxim Integrated Products, Inc. | 7,400 | | 226,588 |
MKS Instruments, Inc. (a) | 7,800 | | 176,124 |
National Semiconductor Corp. | 25,900 | | 587,930 |
Spansion, Inc. Class A | 10,500 | | 156,030 |
| | 3,632,611 |
Software - 1.2% |
Fair, Isaac & Co., Inc. | 5,500 | | 223,575 |
Hyperion Solutions Corp. (a) | 6,400 | | 230,016 |
Parametric Technology Corp. (a) | 4,200 | | 75,684 |
|
| Shares | | Value (Note 1) |
Quest Software, Inc. (a) | 3,700 | | $ 54,205 |
Symantec Corp. (a) | 19,600 | | 408,660 |
| | 992,140 |
TOTAL INFORMATION TECHNOLOGY | | 15,904,123 |
MATERIALS - 3.6% |
Chemicals - 1.6% |
Arkema sponsored ADR (a) | 900 | | 46,035 |
Ashland, Inc. | 3,100 | | 214,458 |
Chemtura Corp. | 40,300 | | 388,089 |
Cytec Industries, Inc. | 8,100 | | 457,731 |
Georgia Gulf Corp. | 1,900 | | 36,689 |
H.B. Fuller Co. | 3,700 | | 95,534 |
Lubrizol Corp. | 1,333 | | 66,823 |
OMNOVA Solutions, Inc. (a) | 3,400 | | 15,572 |
| | 1,320,931 |
Containers & Packaging - 0.9% |
Owens-Illinois, Inc. | 41,300 | | 761,985 |
Metals & Mining - 1.1% |
Alcan, Inc. | 6,500 | | 316,527 |
Alcoa, Inc. | 11,000 | | 330,110 |
Compass Minerals International, Inc. | 1,400 | | 44,184 |
Newmont Mining Corp. | 3,100 | | 139,965 |
Oregon Steel Mills, Inc. (a) | 700 | | 43,687 |
| | 874,473 |
TOTAL MATERIALS | | 2,957,389 |
TELECOMMUNICATION SERVICES - 3.3% |
Diversified Telecommunication Services - 2.1% |
AT&T, Inc. | 12,500 | | 446,875 |
BellSouth Corp. | 10,200 | | 480,522 |
Citizens Communications Co. | 15,000 | | 215,550 |
NTELOS Holding Corp. | 6,400 | | 114,432 |
Telenor ASA sponsored ADR | 2,300 | | 129,789 |
Verizon Communications, Inc. | 9,600 | | 357,504 |
| | 1,744,672 |
Wireless Telecommunication Services - 1.2% |
ALLTEL Corp. | 6,200 | | 374,976 |
Dobson Communications Corp. Class A | 20,900 | | 182,039 |
MTN Group Ltd. | 5,400 | | 65,747 |
Sprint Nextel Corp. | 14,500 | | 273,905 |
Vivo Participacoes SA (PN) sponsored ADR | 9,700 | | 39,770 |
| | 936,437 |
TOTAL TELECOMMUNICATION SERVICES | | 2,681,109 |
UTILITIES - 5.6% |
Electric Utilities - 2.6% |
Allegheny Energy, Inc. (a) | 9,000 | | 413,190 |
Edison International | 9,400 | | 427,512 |
Common Stocks - continued |
| Shares | | Value (Note 1) |
UTILITIES - continued |
Electric Utilities - continued |
Entergy Corp. | 6,500 | | $ 600,080 |
FPL Group, Inc. | 5,800 | | 315,636 |
PPL Corp. | 9,200 | | 329,728 |
| | 2,086,146 |
Gas Utilities - 0.4% |
Energen Corp. | 1,400 | | 65,716 |
Equitable Resources, Inc. | 7,086 | | 295,841 |
| | 361,557 |
Independent Power Producers & Energy Traders - 1.9% |
AES Corp. (a) | 11,800 | | 260,072 |
Constellation Energy Group, Inc. | 6,200 | | 426,994 |
NRG Energy, Inc. | 6,300 | | 352,863 |
TXU Corp. | 9,600 | | 520,416 |
| | 1,560,345 |
Multi-Utilities - 0.7% |
CMS Energy Corp. (a) | 9,700 | | 161,990 |
Public Service Enterprise Group, Inc. | 6,200 | | 411,556 |
| | 573,546 |
TOTAL UTILITIES | | 4,581,594 |
TOTAL COMMON STOCKS (Cost $76,335,529) | 79,328,410 |
Preferred Stocks - 0.2% |
| | | |
Convertible Preferred Stocks - 0.1% |
MATERIALS - 0.1% |
Containers & Packaging - 0.1% |
Owens-Illinois, Inc. 4.75% | 3,100 | | 114,700 |
Nonconvertible Preferred Stocks - 0.1% |
FINANCIALS - 0.1% |
Thrifts & Mortgage Finance - 0.1% |
Fannie Mae 7.00% | 1,000 | | 52,500 |
TOTAL PREFERRED STOCKS (Cost $167,146) | 167,200 |
Convertible Bonds - 0.1% |
| Principal Amount | | Value (Note 1) |
CONSUMER DISCRETIONARY - 0.1% |
Automobiles - 0.1% |
Ford Motor Co. 4.25% 12/15/36 | $ 60,000 | | $ 64,218 |
TOTAL CONVERTIBLE BONDS (Cost $60,000) | 64,218 |
Money Market Funds - 2.6% |
| Shares | | |
Fidelity Cash Central Fund, 5.37% (b)
(Cost $2,141,063) | 2,141,063 | | 2,141,063 |
TOTAL INVESTMENT PORTFOLIO - 100.3% (Cost $78,703,738) | | 81,700,891 |
NET OTHER ASSETS - (0.3)% | | (224,911) |
NET ASSETS - 100% | $ 81,475,980 |
Legend |
(a) Non-income producing |
(b) Affiliated fund that is available only to investment companies and other accounts managed by Fidelity Investments. The rate quoted is the annualized seven-day yield of the fund at period end. A complete unaudited listing of the fund's holdings as of its most recent quarter end is available upon request. |
(c) Security exempt from registration under Rule 144A of the Securities Act of 1933. These securities may be resold in transactions exempt from registration, normally to qualified institutional buyers. At the end of the period, the value of these securities amounted to $15,400 or 0.0% of net assets. |
Affiliated Central Funds |
Information regarding fiscal year to date income earned by the Fund from investments in Fidelity Central Funds is as follows: |
Fund | Income earned |
Fidelity Cash Central Fund | $ 105,329 |
Fidelity Securities Lending Cash Central Fund | 190 |
Total | $ 105,519 |
Other Information |
Distribution of investments by country of issue, as a percentage of total net assets, is as follows: |
United States of America | 89.7% |
Canada | 1.7% |
Cayman Islands | 1.3% |
Singapore | 1.0% |
Others (individually less than 1%) | 6.3% |
| 100.0% |
See accompanying notes which are an integral part of the financial statements.
VIP Value Portfolio
VIP Value Portfolio
Financial Statements
Statement of Assets and Liabilities
| December 31, 2006 |
| | |
Assets | | |
Investment in securities, at value - See accompanying schedule: Unaffiliated issuers
(cost $76,562,675) | $ 79,559,828 | |
Fidelity Central Funds
(cost $2,141,063) | 2,141,063 | |
Total Investments
(cost $78,703,738) | | $ 81,700,891 |
Receivable for investments sold | | 208,307 |
Dividends receivable | | 92,947 |
Interest receivable | | 9,323 |
Prepaid expenses | | 282 |
Receivable from investment adviser for expense reductions | | 1,905 |
Other receivables | | 1,291 |
Total assets | | 82,014,946 |
| | |
Liabilities | | |
Payable for investments purchased | $ 435,344 | |
Payable for fund shares redeemed | 1 | |
Accrued management fee | 37,815 | |
Distribution fees payable | 1,689 | |
Other affiliated payables | 10,823 | |
Other payables and accrued expenses | 53,294 | |
Total liabilities | | 538,966 |
| | |
Net Assets | | $ 81,475,980 |
Net Assets consist of: | | |
Paid in capital | | $ 72,640,981 |
Distributions in excess of net investment income | | (823) |
Accumulated undistributed net realized gain (loss) on investments and foreign currency transactions | | 5,838,678 |
Net unrealized appreciation
(depreciation) on investments and assets and liabilities in foreign currencies | | 2,997,144 |
Net Assets | | $ 81,475,980 |
Statement of Assets and Liabilities - continued
| December 31, 2006 |
| | |
Initial Class:
Net Asset Value, offering price and redemption price
per share ($35,416,128 ÷ 2,480,698 shares) | $ 14.28 |
| | |
Service Class:
Net Asset Value, offering price and redemption price
per share ($1,017,118 ÷ 71,443 shares) | $ 14.24 |
| | |
Service Class 2:
Net Asset Value, offering price and redemption price
per share ($7,803,446 ÷ 551,684 shares) | $ 14.14 |
| | |
Investor Class:
Net Asset Value, offering price and redemption price
per share ($37,239,288 ÷ 2,610,731 shares) | $ 14.26 |
See accompanying notes which are an integral part of the financial statements.
Annual Report
VIP Value Portfolio
Financial Statements - continued
Statement of Operations
| Year ended December 31, 2006 |
Investment Income | | |
Dividends | | $ 1,050,828 |
Interest | | 2,708 |
Income from Fidelity Central Funds | | 105,519 |
Total income | | 1,159,055 |
| | |
Expenses | | |
Management fee | $ 327,306 | |
Transfer agent fees | 82,292 | |
Distribution fees | 16,369 | |
Accounting and security lending fees | 23,896 | |
Custodian fees and expenses | 36,448 | |
Independent trustees' compensation | 199 | |
Audit | 46,804 | |
Legal | 2,399 | |
Miscellaneous | 19,101 | |
Total expenses before reductions | 554,814 | |
Expense reductions | (14,464) | 540,350 |
Net investment income (loss) | | 618,705 |
Realized and Unrealized Gain (Loss) Net realized gain (loss) on: | | |
Investment securities: | | |
Unaffiliated issuers | 6,460,490 | |
Foreign currency transactions | 3,200 | |
Total net realized gain (loss) | | 6,463,690 |
Change in net unrealized appreciation (depreciation) on:
Investment securities | 1,104,525 | |
Assets and liabilities in foreign currencies | (10) | |
Total change in net unrealized appreciation (depreciation) | | 1,104,515 |
Net gain (loss) | | 7,568,205 |
Net increase (decrease) in net assets resulting from operations | | $ 8,186,910 |
Statement of Changes in Net Assets
| Year ended
December 31, 2006 | Year ended
December 31, 2005 |
Increase (Decrease) in Net Assets | | |
Operations | | |
Net investment income (loss) | $ 618,705 | $ 157,283 |
Net realized gain (loss) | 6,463,690 | (51,162) |
Change in net unrealized appreciation (depreciation) | 1,104,515 | 1,165,733 |
Net increase (decrease) in net assets resulting from operations | 8,186,910 | 1,271,854 |
Distributions to shareholders from net investment income | (679,326) | (164,984) |
Distributions to shareholders from net realized gain | (399,094) | - |
Total distributions | (1,078,420) | (164,984) |
Share transactions - net increase (decrease) | 38,361,583 | 29,516,298 |
Total increase (decrease) in net assets | 45,470,073 | 30,623,168 |
| | |
Net Assets | | |
Beginning of period | 36,005,907 | 5,382,739 |
End of period (including distributions in excess of net investment income of $823 and distributions in excess of net investment income of $823, respectively) | $ 81,475,980 | $ 36,005,907 |
See accompanying notes which are an integral part of the financial statements.
VIP Value Portfolio
Financial Highlights - Initial Class
Years ended December 31, | 2006 | 2005 | 2004 | 2003 | 2002 |
Selected Per-Share Data | | | | | |
Net asset value, beginning of period | $ 12.63 | $ 11.97 | $ 10.86 | $ 8.12 | $ 9.64 |
Income from Investment Operations | | | | | |
Net investment income (loss) C | .16 | .15 | .14 F | .05 | .03 |
Net realized and unrealized gain (loss) | 1.70 | .58 | 1.08 | 2.72 | (1.54) |
Total from investment operations | 1.86 | .73 | 1.22 | 2.77 | (1.51) |
Distributions from net investment income | (.13) | (.07) | (.11) | (.03) | (.01) |
Distributions from net realized gain | (.08) | - | - | - | - |
Total distributions | (.21) | (.07) | (.11) | (.03) | (.01) |
Net asset value, end of period | $ 14.28 | $ 12.63 | $ 11.97 | $ 10.86 | $ 8.12 |
Total Return A,B | 14.75% | 6.09% | 11.24% | 34.16% | (15.66)% |
Ratios to Average Net Assets D,G | | | | | |
Expenses before reductions | .88% | 1.19% | 2.65% | 4.32% | 3.60% |
Expenses net of fee waivers, if any | .85% | .85% | 1.00% | 1.28% | 1.50% |
Expenses net of all reductions | .84% | .78% | .95% | 1.22% | 1.45% |
Net investment income (loss) | 1.16% | 1.21% | 1.26% | .57% | .31% |
Supplemental Data | | | | | |
Net assets, end of period (000 omitted) | $ 35,416 | $ 18,478 | $ 583 | $ 413 | $ 261 |
Portfolio turnover rate E | 263% | 181% | 155% | 164% | 192% |
A Total returns do not reflect charges attributable to your insurance company's separate account. Inclusion of these charges would reduce the total returns shown.
B Total returns would have been lower had certain expenses not been reduced during the periods shown.
C Calculated based on average shares outstanding during the period.
D Fees and expenses of the underlying Fidelity Central Funds are not included in the Fund's expense ratio. The Fund indirectly bears its proportionate share of the expenses of any underlying Fidelity Central Funds.
E Amount does not include the portfolio activity of any underlying Fidelity Central Funds.
F Investment income per share reflects a special dividend which amounted to $.03 per share.
G Expense ratios reflect operating expenses of the class. Expenses before reductions do not reflect amounts reimbursed by the investment adviser or reductions from brokerage service arrangements or other expense offset arrangements and do not represent the amount paid by the class during periods when reimbursements or reductions occur. Expenses net of fee waivers reflect expenses after reimbursement by the investment adviser but prior to reductions from brokerage service arrangements or other expense offset arrangements. Expenses net of all reductions represent the net expenses paid by the class.
Financial Highlights - Service Class
Years ended December 31, | 2006 | 2005 | 2004 | 2003 | 2002 |
Selected Per-Share Data | | | | | |
Net asset value, beginning of period | $ 12.60 | $ 11.93 | $ 10.84 | $ 8.12 | $ 9.64 |
Income from Investment Operations | | | | | |
Net investment income (loss) C | .14 | .13 | .13 F | .05 | .02 |
Net realized and unrealized gain (loss) | 1.69 | .60 | 1.07 | 2.70 | (1.53) |
Total from investment operations | 1.83 | .73 | 1.20 | 2.75 | (1.51) |
Distributions from net investment income | (.11) | (.06) | (.11) | (.03) | (.01) |
Distributions from net realized gain | (.08) | - | - | - | - |
Total distributions | (.19) | (.06) | (.11) | (.03) | (.01) |
Net asset value, end of period | $ 14.24 | $ 12.60 | $ 11.93 | $ 10.84 | $ 8.12 |
Total Return A,B | 14.56% | 6.08% | 11.07% | 33.91% | (15.66)% |
Ratios to Average Net Assets D,G | | | | | |
Expenses before reductions | .96% | 1.60% | 2.75% | 4.35% | 3.64% |
Expenses net of fee waivers, if any | .95% | .97% | 1.10% | 1.35% | 1.60% |
Expenses net of all reductions | .94% | .90% | 1.04% | 1.29% | 1.55% |
Net investment income (loss) | 1.06% | 1.09% | 1.17% | .50% | .21% |
Supplemental Data | | | | | |
Net assets, end of period (000 omitted) | $ 1,017 | $ 1,232 | $ 1,225 | $ 972 | $ 803 |
Portfolio turnover rate E | 263% | 181% | 155% | 164% | 192% |
A Total returns do not reflect charges attributable to your insurance company's separate account. Inclusion of these charges would reduce the total returns shown.
B Total returns would have been lower had certain expenses not been reduced during the periods shown.
C Calculated based on average shares outstanding during the period.
D Fees and expenses of the underlying Fidelity Central Funds are not included in the Fund's expense ratio. The Fund indirectly bears its proportionate share of the expenses of any underlying Fidelity Central Funds.
E Amount does not include the portfolio activity of any underlying Fidelity Central Funds.
F Investment income per share reflects a special dividend which amounted to $.03 per share.
G Expense ratios reflect operating expenses of the class. Expenses before reductions do not reflect amounts reimbursed by the investment adviser or reductions from brokerage service arrangements or other expense offset arrangements and do not represent the amount paid by the class during periods when reimbursements or reductions occur. Expenses net of fee waivers reflect expenses after reimbursement by the investment adviser but prior to reductions from brokerage service arrangements or other expense offset arrangements. Expenses net of all reductions represent the net expenses paid by the class.
See accompanying notes which are an integral part of the financial statements.
Annual Report
Financial Highlights - Service Class 2
Years ended December 31, | 2006 | 2005 | 2004 | 2003 | 2002 |
Selected Per-Share Data | | | | | |
Net asset value, beginning of period | $ 12.53 | $ 11.87 | $ 10.80 | $ 8.10 | $ 9.64 |
Income from Investment Operations | | | | | |
Net investment income (loss) C | .12 | .11 | .11 F | .03 | .01 |
Net realized and unrealized gain (loss) | 1.67 | .59 | 1.07 | 2.70 | (1.54) |
Total from investment operations | 1.79 | .70 | 1.18 | 2.73 | (1.53) |
Distributions from net investment income | (.10) | (.04) | (.11) | (.03) | (.01) |
Distributions from net realized gain | (.08) | - | - | - | - |
Total distributions | (.18) | (.04) | (.11) | (.03) | (.01) |
Net asset value, end of period | $ 14.14 | $ 12.53 | $ 11.87 | $ 10.80 | $ 8.10 |
Total Return A,B | 14.32% | 5.92% | 10.93% | 33.75% | (15.87)% |
Ratios to Average Net Assets D,G | | | | | |
Expenses before reductions | 1.15% | 1.76% | 2.93% | 4.50% | 3.78% |
Expenses net of fee waivers, if any | 1.10% | 1.11% | 1.25% | 1.51% | 1.75% |
Expenses net of all reductions | 1.09% | 1.05% | 1.20% | 1.45% | 1.70% |
Net investment income (loss) | .91% | .94% | 1.01% | .34% | .06% |
Supplemental Data | | | | | |
Net assets, end of period (000 omitted) | $ 7,803 | $ 5,262 | $ 3,575 | $ 2,865 | $ 1,698 |
Portfolio turnover rate E | 263% | 181% | 155% | 164% | 192% |
A Total returns do not reflect charges attributable to your insurance company's separate account. Inclusion of these charges would reduce the total returns shown.
B Total returns would have been lower had certain expenses not been reduced during the periods shown.
C Calculated based on average shares outstanding during the period.
D Fees and expenses of the underlying Fidelity Central Funds are not included in the Fund's expense ratio. The Fund indirectly bears its proportionate share of the expenses of any underlying Fidelity Central Funds.
E Amount does not include the portfolio activity of any underlying Fidelity Central Funds.
F Investment income per share reflects a special dividend which amounted to $.03 per share.
G Expense ratios reflect operating expenses of the class. Expenses before reductions do not reflect amounts reimbursed by the investment adviser or reductions from brokerage service arrangements or other expense offset arrangements and do not represent the amount paid by the class during periods when reimbursements or reductions occur. Expenses net of fee waivers reflect expenses after reimbursement by the investment adviser but prior to reductions from brokerage service arrangements or other expense offset arrangements. Expenses net of all reductions represent the net expenses paid by the class.
Financial Highlights - Investor Class
Years ended December 31, | 2006 | 2005 H |
Selected Per-Share Data | | |
Net asset value, beginning of period | $ 12.63 | $ 12.23 |
Income from Investment Operations | | |
Net investment income (loss) E | .14 | .06 |
Net realized and unrealized gain (loss) | 1.69 | .40 |
Total from investment operations | 1.83 | .46 |
Distributions from net investment income | (.12) | (.06) |
Distributions from net realized gain | (.08) | - |
Total distributions | (.20) | (.06) |
Net asset value, end of period | $ 14.26 | $ 12.63 |
Total Return B,C,D | 14.49% | 3.77% |
Ratios to Average Net Assets F,I | | |
Expenses before reductions | .99% | 1.27% A |
Expenses net of fee waivers, if any | .99% | 1.00% A |
Expenses net of all reductions | .98% | .93% A |
Net investment income (loss) | 1.01% | 1.06% A |
Supplemental Data | | |
Net assets, end of period (000 omitted) | $ 37,239 | $ 11,034 |
Portfolio turnover rate G | 263% | 181% |
A Annualized
B Total returns for periods of less than one year are not annualized.
C Total returns do not reflect charges attributable to your insurance company's separate account. Inclusion of these charges would reduce the total returns shown.
D Total returns would have been lower had certain expenses not been reduced during the periods shown.
E Calculated based on average shares outstanding during the period.
F Fees and expenses of the underlying Fidelity Central Funds are not included in the Fund's expense ratio. The Fund indirectly bears its proportionate share of the expenses of any underlying Fidelity Central Funds.
G Amount does not include the portfolio activity of any underlying Fidelity Central Funds.
H For the period July 21, 2005 (commencement of sale of shares) to December 31, 2005.
I Expense ratios reflect operating expenses of the class. Expenses before reductions do not reflect amounts reimbursed by the investment adviser or reductions from brokerage service arrangements or other expense offset arrangements and do not represent the amount paid by the class during periods when reimbursements or reductions occur. Expense ratios before reductions for start-up periods may not be representative of longer-term operating periods. Expenses net of fee waivers reflect expenses after reimbursement by the investment adviser but prior to reductions from brokerage service arrangements or other expense offset arrangements. Expenses net of all reductions represent the net expenses paid by the class.
See accompanying notes which are an integral part of the financial statements.
VIP Value Portfolio
Notes to Financial Statements
For the period ended December 31, 2006
1. Significant Accounting Policies.
VIP Value Portfolio (the Fund) is a fund of Variable Insurance Products (the trust) and is authorized to issue an unlimited number of shares. The trust is registered under the Investment Company Act of 1940, as amended (the 1940 Act), as an open-end management investment company organized as a Massachusetts business trust. Shares of the Fund may only be purchased by insurance companies for the purpose of funding variable annuity or variable life insurance contracts. The Fund offers the following classes of shares: Initial Class shares, Service Class shares, and Service Class 2 shares, and Investor Class shares. All classes have equal rights and voting privileges, except for matters affecting a single class. Investment income, realized and unrealized capital gains and losses, the common expenses of the Fund, and certain fund-level expense reductions, if any, are allocated on a pro rata basis to each class based on the relative net assets of each class to the total net assets of the Fund. Each class differs with respect to transfer agent and distribution and service plan fees incurred. Certain expense reductions also differ by class.
The Fund may invest in Fidelity Central Funds which are open-end investment companies available to investment companies and other accounts managed by Fidelity Management & Research Company (FMR) and its affiliates. The financial statements have been prepared in conformity with accounting principles generally accepted in the United States of America, which require management to make certain estimates and assumptions at the date of the financial statements. The following summarizes the significant accounting policies of the Fund, which are also consistently followed by the Fidelity Central Funds:
Security Valuation. Investments are valued and net asset value (NAV) per share is calculated (NAV calculation) as of the close of business of the New York Stock Exchange (NYSE), normally 4:00 p.m. Eastern time. Wherever possible, the Fund uses independent pricing services approved by the Board of Trustees to value its investments.
Equity securities, including restricted securities, for which market quotations are readily available, are valued at the last reported sale price or official closing price as reported by an independent pricing service on the primary market or exchange on which they are traded. In the event there were no sales during the day or closing prices are not available, securities are valued at the last quoted bid price. Investments in open-end mutual funds, including the Fidelity Central Funds, are valued at their closing net asset value each business day. Short-term securities with remaining maturities of sixty days or less for which quotations are not readily available are valued at amortized cost, which approximates value.
When current market prices or quotations are not readily available or do not accurately reflect fair value, valuations may be determined in accordance with procedures adopted by the Board of Trustees. For example, when developments occur between the close of a market and the close of the NYSE that may materially affect the value of some or all of the securities, or when trading in a security is halted, those securities may be fair valued. Factors used in the determination of fair value may include monitoring news to identify significant market or security specific events such as changes in the value of U.S. securities markets, reviewing developments in foreign markets and evaluating the performance of ADRs, futures contracts and exchange-traded funds. Because the Fund's utilization of fair value pricing depends on market activity, the frequency with which fair value pricing is used can not be predicted and may be utilized to a significant extent. The value of securities used for NAV calculation under fair value pricing may differ from published prices for the same securities.
Foreign Currency. The Fund uses foreign currency contracts to facilitate transactions in foreign-denominated securities. Losses from these transactions may arise from changes in the value of the foreign currency or if the counterparties do not perform under the contracts' terms.
Foreign-denominated assets, including investment securities, and liabilities are translated into U.S. dollars at the exchange rate at period end. Purchases and sales of investment securities, income and dividends received and expenses denominated in foreign currencies are translated into U.S. dollars at the exchange rate in effect on the transaction date.
The effects of exchange rate fluctuations on investments are included with the net realized and unrealized gain (loss) on investment securities. Other foreign currency transactions resulting in realized and unrealized gain (loss) are disclosed separately.
Investment Transactions and Income. Security transactions, including the Fund's investment activity in the Fidelity Central Funds, are accounted for as of trade date. Gains and losses on securities sold are determined on the basis of identified cost and may include proceeds received from litigation. Dividend income is recorded on the ex-dividend date, except for certain dividends from foreign securities where the ex-dividend date may have passed, which are recorded as soon as the Fund is informed of the ex-dividend date. Non-cash dividends included in dividend income, if any, are recorded at the fair market value of the securities received. Distributions received on securities that represent a return of capital or capital gain are recorded as a reduction of cost of investments and/or as a realized gain. The Fund estimates the components of distributions received that may be considered return of capital distributions or capital gain distributions. Interest income and income distributions from the Fidelity Central Funds are accrued as earned, with any income distributions receivable as of period end included in Interest Receivable on the Statement of Assets and Liabilities. Interest income includes coupon interest and amortization of premium and accretion of discount on debt securities. Investment income is recorded net of foreign taxes withheld where recovery of such taxes is uncertain.
Annual Report
Notes to Financial Statements - continued
1. Significant Accounting Policies - continued
Expenses. Most expenses of the trust can be directly attributed to a fund. Expenses which cannot be directly attributed are apportioned among each Fund in the trust. Expense estimates are accrued in the period to which they relate and adjustments are made when actual amounts are known.
Income Tax Information and Distributions to Shareholders. Each year, the Fund intends to qualify as a regulated investment company by distributing all of its taxable income and realized gains under Subchapter M of the Internal Revenue Code. As a result, no provision for income taxes is required in the accompanying financial statements. Foreign taxes are provided for based on the Fund's understanding of the tax rules and rates that exist in the foreign markets in which it invests.
Distributions are recorded on the ex-dividend date. Income dividends and capital gain distributions are declared separately for each class. Income and capital gain distributions are determined in accordance with income tax regulations, which may differ from generally accepted accounting principles.
Capital accounts within the financial statements are adjusted for permanent book-tax differences. These adjustments have no impact on net assets or the results of operations. Temporary book-tax differences will reverse in a subsequent period.
Book-tax differences are primarily due to foreign currency transactions, passive foreign investment companies (PFIC), partnerships, and losses deferred due to wash sales.
The tax-basis components of distributable earnings and the federal tax cost as of period end were as follows:
Unrealized appreciation | $ 3,892,207 | |
Unrealized depreciation | (983,189) | |
Net unrealized appreciation (depreciation) | 2,909,018 | |
Undistributed ordinary income | 4,414,941 | |
Undistributed long-term capital gain | 1,511,040 | |
| | |
Cost for federal income tax purposes | $ 78,791,873 | |
The tax character of distributions paid was as follows:
| December 31, 2006 | December 31, 2005 |
Ordinary Income | $ 679,326 | $ 164,984 |
Long-term Capital Gains | 399,094 | - |
Total | $ 1,078,420 | $ 164,984 |
New Accounting Pronouncements. In July 2006, Financial Accounting Standards Board Interpretation No. 48, Accounting for Uncertainty in Income Taxes - an interpretation of FASB Statement 109 (FIN 48), was issued and is effective on the last business day of the semiannual reporting period for fiscal years beginning after December 15, 2006. FIN 48 sets forth a threshold for financial statement recognition, measurement and disclosure of a tax position taken or expected to be taken on a tax return. Management is currently evaluating the impact, if any, the adoption of FIN 48 will have on the Fund's net assets, results of operations and financial statement disclosures.
In addition, in September 2006, Statement of Financial Accounting Standards No. 157, Fair Value Measurements (SFAS 157), was issued and is effective for fiscal years beginning after November 15, 2007. SFAS 157 defines fair value, establishes a framework for measuring fair value and expands disclosures about fair value measurements. Management is currently evaluating the impact the adoption of SFAS 157 will have on the Fund's financial statement disclosures.
2. Operating Policies.
Repurchase Agreements. FMR has received an Exemptive Order from the Securities and Exchange Commission (the SEC) which permits the Fund and other affiliated entities of FMR to transfer uninvested cash balances into joint trading accounts which are then invested in repurchase agreements. The Fund may also invest directly with institutions in repurchase agreements. Repurchase agreements are collateralized by government or non-government securities. Upon settlement date, collateral is held in segregated accounts with custodian banks and may be obtained in the event of a default of the counterparty. The Fund monitors, on a daily basis, the value of the collateral to ensure it is at least equal to the principal amount of the repurchase agreement (including accrued interest). In the event of a default by the counterparty, realization of the collateral proceeds could be delayed, during which time the value of the collateral may decline.
Restricted Securities. The Fund may invest in securities that are subject to legal or contractual restrictions on resale. These securities generally may be resold in transactions exempt from registration or to the public if the securities are registered. Disposal of these securities may involve time-consuming negotiations and expense, and prompt sale at an acceptable price may be difficult. Information regarding restricted securities is included at the end of the Fund's Schedule of Investments.
VIP Value Portfolio
3. Purchases and Sales of Investments.
Purchases and sales of securities, other than short-term securities, aggregated $185,003,568 and $148,466,082, respectively.
4. Fees and Other Transactions with Affiliates.
Management Fee. FMR and its affiliates provide the Fund with investment management related services for which the Fund pays a monthly management fee. The management fee is the sum of an individual fund fee rate that is based on an annual rate of .30% of the Fund's average net assets and a group fee rate that averaged .27% during the period. The group fee rate is based upon the average net assets of all the mutual funds advised by FMR. The group fee rate decreases as assets under management increase and increases as assets under management decrease. For the period, the total annual management fee rate was .56% of the Fund's average net assets.
Distribution and Service Plan. In accordance with Rule 12b-1 of the 1940 Act, the Fund has adopted separate 12b-1 Plans for each Service Class of shares. Each Service Class pays Fidelity Distributors Corporation (FDC), an affiliate of FMR, a service fee. For the period, the service fee is based on an annual rate of .10% of Service Class' average net assets and .25% of Service Class 2's average net assets.
For the period, each class paid FDC the following amounts, all of which were re-allowed to insurance companies for the distribution of shares and providing shareholder support services:
Service Class | $ 1,137 | |
Service Class 2 | 15,232 | |
| $ 16,369 | |
Transfer Agent Fees. Fidelity Investments Institutional Operations Company, Inc. (FIIOC), an affiliate of FMR, is the fund's transfer, dividend disbursing, and shareholder servicing agent. FIIOC receives an asset-based fee with respect to each class. Each class with the exception of Investor Class pays a transfer agent fee, excluding out of pocket expenses, equal to an annual rate of .07% of their month end net assets. Investor Class pays a monthly asset-based transfer agent fee of .18% of its month end net assets. The total transfer agent fees paid by each class to FIIOC, including out of pocket expenses, were as follows:
Initial Class | $ 23,323 | |
Service Class | 783 | |
Service Class 2 | 6,951 | |
Investor Class | 51,235 | |
| $ 82,292 | |
Accounting and Security Lending Fees. Fidelity Service Company, Inc. (FSC), an affiliate of FMR, maintains the Fund's accounting records. The accounting fee is based on the level of average net assets for the month. Under a separate contract, FSC administers the security lending program. The security lending fee is based on the number and duration of lending transactions.
Investments in Fidelity Central Funds. The Fund may invest in Fidelity Central Funds. The Fund's Schedule of Investments lists each of the Fidelity Central Funds as an investment of the Fund but does not include the underlying holdings of each Fidelity Central Fund. As an Investing Fund, the Fund indirectly bears its proportionate share of the expenses of the underlying Fidelity Central Funds. A complete unaudited list of holdings for each Fidelity Central Fund is available upon request. In addition, the financial statements of the Fidelity Central Funds, which are not covered by the Fund's Report of Independent Registered Public Accounting Firm, are available on the EDGAR Database on the SEC's web site, www.sec.gov, or upon request.
The Money Market Central Funds seek preservation of capital and current income and are managed by Fidelity Investments Money Management, Inc. (FIMM), an affiliate of FMR.
Brokerage Commissions. The Fund placed a portion of its portfolio transactions with brokerage firms which are affiliates of the investment adviser. The commissions paid to these affiliated firms were $1,802 for the period.
5. Security Lending.
The Fund lends portfolio securities from time to time in order to earn additional income. On the settlement date of the loan, the Fund receives collateral (in the form of U.S. Treasury obligations, letters of credit and/or cash) against the loaned securities and maintains collateral in an amount not less than 100% of the market value of the loaned securities during the period of the loan. The market value of the loaned securities is determined at the close of business of the Fund and any additional required collateral is delivered to the Fund on the next business day. If the borrower defaults on its obligation to return the securities loaned because of insolvency or other reasons, a fund could experience delays and costs in recovering the securities loaned or in gaining access to the collateral. Any cash collateral received is invested in the Fidelity Securities Lending Cash Central Fund. At period end, there were no security loans outstanding. Security lending income represents the income earned on investing cash collateral, less fees and expenses associated with the loan, plus any premium payments that may be received on the loan of certain types of securities. Security lending income is presented in the Statement of Operations as a component of income from Fidelity Central Funds. Net income from lending portfolio securities during the period amounted to $190.
Annual Report
Notes to Financial Statements - continued
6. Committed Line of Credit.
The Fund participates with other funds managed by FMR in a $4.2 billion credit facility (the "line of credit") to be utilized for temporary or emergency purposes to fund shareholder redemptions or for other short-term liquidity purposes. The Fund has agreed to pay commitment fees on its pro rata portion of the line of credit, which amounted to $125 and is reflected in Miscellaneous Expense on the Statement of Operations. During the period, there were no borrowings on this line of credit.
7. Expense Reductions.
FMR voluntarily agreed to reimburse each class to the extent annual operating expenses exceeded certain levels of average net assets as noted in the table below. Some expenses, for example interest expense, including commitment fees, are excluded from this reimbursement.
The following classes were in reimbursement during the period:
| Expense
Limitations | Reimbursement
from adviser |
| | |
Initial Class | .85% | $ 7,281 |
Service Class | .95% | 109 |
Service Class 2 | 1.10% | 3,093 |
| | $ 10,483 |
Many of the brokers with whom FMR places trades on behalf of the Fund provided services to the Fund in addition to trade execution. These services included payments of certain expenses on behalf of the Fund totaling $3,223 for the period.
8. Other.
The Fund's organizational documents provide former and current trustees and officers with a limited indemnification against liabilities arising in connection with the performance of their duties to the Fund. In the normal course of business, the Fund may also enter into contracts that provide general indemnifications. The Fund's maximum exposure under these arrangements is unknown as this would be dependent on future claims that may be made against the Fund. The risk of material loss from such claims is considered remote.
At the end of the period, the VIP Freedom Funds were the owners of record, in the aggregate, of approximately 24% of the total outstanding shares of the Fund. FMR or its affiliates were the owners of record of 90% of the total outstanding shares of the Fund.
The United States Securities and Exchange Commission ("SEC") is conducting an investigation of FMR (covering the years 2002 to 2004) arising from gifts, gratuities and business entertainment provided by certain brokers to certain individuals who were employed on FMR's domestic equity trading desk during that period. FMR is in discussions with the SEC staff regarding the possible resolution of the matter, but as of period-end no final resolution has been reached.
In December 2006, the Independent Trustees completed their own investigation of the matter with the assistance of independent counsel. The Independent Trustees and FMR agree that, despite the absence of proof that the Fidelity mutual funds experienced diminished execution quality as a result of the improper receipt of gifts and business entertainment, the conduct at issue was serious and is worthy of redress. Accordingly, the Independent Trustees have requested and FMR has agreed to pay $42 million to Fidelity mutual funds, plus interest to be determined at the time that payment is made. A method of allocating this payment among the funds has not yet been determined. The total payment to the Fund is not anticipated to have a material impact on the Fund's net assets. In addition, FMR reimbursed related legal expenses which are recorded in the accompanying Statement of Operations as an expense reduction.
VIP Value Portfolio
9. Distributions to Shareholders.
Distributions to shareholders of each class were as follows:
| Years ended December 31, |
| 2006 | 2005 A |
From net investment income | | |
Initial Class | $ 318,535 | $ 89,975 |
Service Class | 7,837 | 5,479 |
Service Class 2 | 54,899 | 17,885 |
Investor Class | 298,055 | 51,645 |
Total | $ 679,326 | $ 164,984 |
From net realized gain | | |
Initial Class | $ 178,524 | $ - |
Service Class | 6,106 | - |
Service Class 2 | 40,164 | - |
Investor Class | 174,300 | - |
Total | $ 399,094 | $ - |
A Distributions for Investor Class are for the period July 21, 2005 (commencement of sale of shares) to December 31, 2005.
10. Share Transactions.
Transactions for each class of shares were as follows:
| Shares | Dollars |
| Years ended December 31, | Years ended December 31, |
| 2006 | 2005 A | 2006 | 2005 A |
Initial Class | | | | |
Shares sold | 1,717,374 | 1,616,990 | $ 23,109,773 | $ 19,824,294 |
Reinvestment of distributions | 35,172 | 7,031 | 497,059 | 89,975 |
Shares redeemed | (734,411) | (210,164) | (9,841,607) | (2,622,897) |
Net increase (decrease) | 1,018,135 | 1,413,857 | $ 13,765,225 | $ 17,291,372 |
Service Class | | | | |
Shares sold | 4,080 | 16,046 | $ 54,164 | $ 191,885 |
Reinvestment of distributions | 996 | 432 | 13,943 | 5,479 |
Shares redeemed | (31,433) | (21,359) | (416,806) | (258,061) |
Net increase (decrease) | (26,357) | (4,881) | $ (348,699) | $ (60,697) |
Service Class 2 | | | | |
Shares sold | 287,117 | 290,671 | $ 3,801,302 | $ 3,489,876 |
Reinvestment of distributions | 6,799 | 1,418 | 95,063 | 17,885 |
Shares redeemed | (162,347) | (173,072) | (2,133,061) | (2,100,168) |
Net increase (decrease) | 131,569 | 119,017 | $ 1,763,304 | $ 1,407,593 |
Investor Class | | | | |
Shares sold | 2,184,810 | 876,622 | $ 29,121,152 | $ 10,912,909 |
Reinvestment of distributions | 33,389 | 4,035 | 472,355 | 51,645 |
Shares redeemed | (481,144) | (6,981) | (6,411,754) | (86,524) |
Net increase (decrease) | 1,737,055 | 873,676 | $ 23,181,753 | $ 10,878,030 |
A Share transactions for Investor Class are for the period July 21, 2005 (commencement of sale of shares) to December 31, 2005.
Annual Report
Report of Independent Registered Public Accounting Firm
To the Trustees of Variable Insurance Products Fund and Shareholders of VIP Value Portfolio:
We have audited the accompanying statement of assets and liabilities of VIP Value Portfolio (the Fund), a fund of Variable Insurance Products Fund, including the schedule of investments as of December 31, 2006, and the related statement of operations for the year then ended, the statement of changes in net assets for each of the two years in the period then ended, and the financial highlights for each of the five years in the period then ended. These financial statements and financial highlights are the responsibility of the Fund's management. Our responsibility is to express an opinion on these financial statements and financial highlights based on our audits.
We conducted our audits in accordance with standards of the Public Company Accounting Oversight Board (United States). Those standards require that we plan and perform the audit to obtain reasonable assurance about whether the financial statements and financial highlights are free of material misstatement. The Fund is not required to have, nor were we engaged to perform, an audit of its internal control over financial reporting. Our audits included consideration of internal control over financial reporting as a basis for designing audit procedures that are appropriate in the circumstances, but not for the purpose of expressing an opinion on the effectiveness of the Fund's internal control over financial reporting. Accordingly, we express no such opinion. An audit also includes examining, on a test basis, evidence supporting the amounts and disclosures in the financial statements, assessing the accounting principles used and significant estimates made by management, as well as evaluating the overall financial statement presentation. Our procedures included confirmation of securities owned as of December 31, 2006, by correspondence with the custodians and brokers; where replies were not received from brokers, we performed other auditing procedures. We believe that our audits provide a reasonable basis for our opinion.
In our opinion, the financial statements and financial highlights referred to above present fairly, in all material respects, the financial position of VIP Value Portfolio as of December 31, 2006, the results of its operations for the year then ended, the changes in its net assets for each of the two years in the period then ended, and its financial highlights for each of the five years in the period then ended, in conformity with accounting principles generally accepted in the United States of America.
/s/ Deloitte & Touche LLP
DELOITTE & TOUCHE LLP
Boston, Massachusetts
February 16, 2007
VIP Value Portfolio
Trustees and Officers
The Trustees, Member of the Advisory Board, and executive officers of the trust and fund, as applicable, are listed below. The Board of Trustees governs the fund and is responsible for protecting the interests of shareholders. The Trustees are experienced executives who meet periodically throughout the year to oversee the fund's activities, review contractual arrangements with companies that provide services to the fund, and review the fund's performance. Each of the Trustees oversees 348 funds advised by FMR or an affiliate.
The Trustees hold office without limit in time except that (a) any Trustee may resign; (b) any Trustee may be removed by written instrument, signed by at least two-thirds of the number of Trustees prior to such removal; (c) any Trustee who requests to be retired or who has become incapacitated by illness or injury may be retired by written instrument signed by a majority of the other Trustees; and (d) any Trustee may be removed at any special meeting of shareholders by a two-thirds vote of the outstanding voting securities of the trust. Each Trustee who is not an interested person (as defined in the 1940 Act) (Independent Trustee), shall retire not later than the last day of the calendar year in which his or her 72nd birthday occurs. The Independent Trustees may waive this mandatory retirement age policy with respect to individual Trustees. The executive officers and Advisory Board Member hold office without limit in time, except that any officer and Advisory Board Member may resign or may be removed by a vote of a majority of the Trustees at any regular meeting or any special meeting of the Trustees. Except as indicated, each individual has held the office shown or other offices in the same company for the past five years.
The fund's Statement of Additional Information (SAI) includes more information about the Trustees. To request a free copy, call Fidelity at 1-877-208-0098.
Interested Trustees*:
Correspondence intended for each Trustee who is an interested person may be sent to Fidelity Investments, 82 Devonshire Street, Boston, Massachusetts 02109.
Name, Age; Principal Occupation |
Edward C. Johnson 3d (76) |
| Year of Election or Appointment: 1981 Mr. Johnson is Chairman of the Board of Trustees. Mr. Johnson serves as President (2006-present), Chief Executive Officer, Chairman, and a Director of FMR Corp.; Chairman and a Director of FMR; Chairman and a Director of Fidelity Research & Analysis Company (FRAC); Chairman and a Director of Fidelity Investments Money Management, Inc.; and Chairman (2001-present) and a Director of FMR Co., Inc. In addition, Mr. Johnson serves as Chairman and Director of Fidelity International Limited (FIL). |
Robert L. Reynolds (54) |
| Year of Election or Appointment: 2003 Mr. Reynolds is President and a Director of FMR (2005-present), Fidelity Investments Money Management, Inc. (2005-present), and FMR Co., Inc. (2005-present). Mr. Reynolds also serves as Vice Chairman (2006-present), a Director (2003-present), and Chief Operating Officer of FMR Corp. and a Director of Strategic Advisers, Inc. (2005-present). He also serves on the Board at Fidelity Investments Canada, Ltd. |
* Trustees have been determined to be "Interested Trustees" by virtue of, among other things, their affiliation with the trust or various entities under common control with FMR.
Independent Trustees:
Correspondence intended for each Independent Trustee (that is, the Trustees other than the Interested Trustees) may be sent to Fidelity Investments, P.O. Box 55235, Boston, Massachusetts 02205-5235.
Name, Age; Principal Occupation |
Dennis J. Dirks (58) |
| Year of Election or Appointment: 2005 Prior to his retirement in May 2003, Mr. Dirks was Chief Operating Officer and a member of the Board of The Depository Trust & Clearing Corporation (DTCC) (1999-2003). He also served as President, Chief Operating Officer, and Board member of The Depository Trust Company (DTC) (1999-2003) and President and Board member of the National Securities Clearing Corporation (NSCC) (1999-2003). In addition, Mr. Dirks served as Chief Executive Officer and Board member of the Government Securities Clearing Corporation (2001-2003) and Chief Executive Officer and Board member of the Mortgage-Backed Securities Clearing Corporation (2001-2003). Mr. Dirks also serves as a Trustee and a member of the Finance Committee of Manhattan College (2005-present) and a Trustee and a member of the Finance Committee of AHRC of Nassau County (2006-present). |
Albert R. Gamper, Jr. (64) |
| Year of Election or Appointment: 2006 Prior to his retirement in December 2004, Mr. Gamper served as Chairman of the Board of CIT Group Inc. (commercial finance). During his tenure with CIT Group Inc. Mr. Gamper served in numerous senior management positions, including Chairman (1987-1989; 1999-2001; 2002-2004), Chief Executive Officer (1987-2004), and President (1989-2002). He currently serves as a member of the Board of Directors of Public Service Enterprise Group (utilities, 2001-present), Chairman of the Board of Governors, Rutgers University (2004-present), and Chairman of the Board of Saint Barnabas Health Care System. |
George H. Heilmeier (70) |
| Year of Election or Appointment: 2004 Dr. Heilmeier is Chairman Emeritus of Telcordia Technologies (communication software and systems), where prior to his retirement, he served as company Chairman and Chief Executive Officer. He currently serves on the Boards of Directors of The Mitre Corporation (systems engineering and information technology support for the government), and HRL Laboratories (private research and development, 2004-present). He is Chairman of the General Motors Science & Technology Advisory Board and a Life Fellow of the Institute of Electrical and Electronics Engineers (IEEE). Dr. Heilmeier is a member of the Defense Science Board and the National Security Agency Advisory Board. He is also a member of the National Academy of Engineering, the American Academy of Arts and Sciences, and the Board of Overseers of the School of Engineering and Applied Science of the University of Pennsylvania. Previously, Dr. Heilmeier served as a Director of TRW Inc. (automotive, space, defense, and information technology, 1992-2002), Compaq (1994-2002), Automatic Data Processing, Inc. (ADP) (technology-based business outsourcing, 1995-2002), INET Technologies Inc. (telecommunications network surveillance, 2001-2004), and Teletech Holdings (customer management services). He is the recipient of the 2005 Kyoto Prize in Advanced Technology for his invention of the liquid crystal display, and a member of the Consumer Electronics Hall of Fame. |
James H. Keyes (66) |
| Year of Election or Appointment: 2007 Prior to his retirement in 2003, Mr. Keyes was Chairman, President, and Chief Executive Officer of Johnson Controls, Inc. (automotive supplier, 1993-2003). He currently serves as a member of the boards of LSI Logic Corporation (semiconductor technologies), Navistar International Corporation (manufacture and sale of trucks, buses, and diesel engines, 2002-present), and Pitney Bowes, Inc. (integrated mail, messaging, and document management solutions). |
Marie L. Knowles (60) |
| Year of Election or Appointment: 2001 Prior to Ms. Knowles' retirement in June 2000, she served as Executive Vice President and Chief Financial Officer of Atlantic Richfield Company (ARCO) (diversified energy, 1996-2000). From 1993 to 1996, she was a Senior Vice President of ARCO and President of ARCO Transportation Company. She served as a Director of ARCO from 1996 to 1998. She currently serves as a Director of Phelps Dodge Corporation (copper mining and manufacturing) and McKesson Corporation (healthcare service, 2002-present). Ms. Knowles is a Trustee of the Brookings Institution and the Catalina Island Conservancy and also serves as a member of the Advisory Board for the School of Engineering of the University of Southern California. |
Ned C. Lautenbach (62) |
| Year of Election or Appointment: 2000 Mr. Lautenbach is Chairman of the Independent Trustees (2006-present). Mr. Lautenbach has been a partner of Clayton, Dubilier & Rice, Inc. (private equity investment firm) since September 1998. Previously, Mr. Lautenbach was with the International Business Machines Corporation (IBM) from 1968 until his retirement in 1998. Mr. Lautenbach serves as a Director of Sony Corporation (2006-present) and Eaton Corporation (diversified industrial) as well as the Philharmonic Center for the Arts in Naples, Florida. He also is a member of the Board of Trustees of Fairfield University (2005-present), as well as a member of the Council on Foreign Relations. |
Cornelia M. Small (62) |
| Year of Election or Appointment: 2005 Ms. Small is a member (2000-present) and Chairperson (2002-present) of the Investment Committee, and a member (2002- present) of the Board of Trustees of Smith College. Previously, she served as Chief Investment Officer (1999-2000), Director of Global Equity Investments (1996-1999), and a member of the Board of Directors of Scudder, Stevens & Clark (1990-1997) and Scudder Kemper Investments (1997-1999). In addition, Ms. Small served as Co-Chair (2000-2003) of the Annual Fund for the Fletcher School of Law and Diplomacy. |
William S. Stavropoulos (67) |
| Year of Election or Appointment: 2001 Mr. Stavropoulos is Chairman Emeritus of the Board of Directors of The Dow Chemical Company. Since joining The Dow Chemical Company in 1967, Mr. Stavropoulos served in numerous senior management positions, including President (1993-2000; 2002-2003), CEO (1995-2000; 2002-2004), and Chairman of the Executive Committee (2000-2004). Currently, he is a Director of NCR Corporation (data warehousing and technology solutions), BellSouth Corporation (telecommunications), Chemical Financial Corporation, Maersk Inc. (industrial conglomerate, 2002-present), and Metalmark Capital (private equity investment firm, 2005-present). He also serves as a member of the Board of Trustees of the American Enterprise Institute for Public Policy Research. In addition, Mr. Stavropoulos is a member of The Business Council, J.P. Morgan International Council and the University of Notre Dame Advisory Council for the College of Science. |
Kenneth L. Wolfe (67) |
| Year of Election or Appointment: 2005 Prior to his retirement in 2001, Mr. Wolfe was Chairman and Chief Executive Officer of Hershey Foods Corporation (1993-2001). He currently serves as a member of the boards of Adelphia Communications Corporation (2003-present), Bausch & Lomb, Inc., and Revlon Inc. (2004-present). |
Advisory Board Member and Executive Officers:
Correspondence intended for each executive officer and Mr. Lynch may be sent to Fidelity Investments, 82 Devonshire Street, Boston, Massachusetts 02109.
Name, Age; Principal Occupation |
Peter S. Lynch (62) |
| Year of Election or Appointment: 2003 Member of the Advisory Board of Variable Insurance Products Fund. Mr. Lynch is Vice Chairman and a Director of FMR, and Vice Chairman (2001-present) and a Director of FMR Co., Inc. Previously, Mr. Lynch served as a Trustee of the Fidelity funds (1990-2003). In addition, he serves as a Trustee of Boston College and as the Chairman of the Inner-City Scholarship Fund. |
Kimberley H. Monasterio (43) |
| Year of Election or Appointment: 2007 President and Treasurer of VIP Value. Ms. Monasterio also serves as President and Treasurer of other Fidelity funds (2007-present) and is an employee of FMR (2004-present). Previously, Ms. Monasterio served as Deputy Treasurer of the Fidelity funds (2004-2006). Before joining Fidelity Investments, Ms. Monasterio served as Treasurer (2000-2004) and Chief Financial Officer (2002-2004) of the Franklin Templeton Funds and Senior Vice President of Franklin Templeton Services, LLC (2000-2004). |
Dwight D. Churchill (53) |
| Year of Election or Appointment: 2005 Vice President of VIP Value. Mr. Churchill also serves as Vice President of certain Equity Funds (2005-present). Mr. Churchill is Executive Vice President of FMR (2005-present) and FMR Co., Inc. (2005-present). Previously, Mr. Churchill served as Senior Vice President of Fidelity Investments Money Management, Inc. (2005-2006), Head of Fidelity's Fixed-Income Division (2000-2005), Vice President of Fidelity's Money Market Funds (2000-2005), Vice President of Fidelity's Bond Funds, and Senior Vice President of FMR. |
Bruce T. Herring (41) |
| Year of Election or Appointment: 2006 Vice President of VIP Value. Mr. Herring also serves as Vice President of certain Equity Funds (2006-present). Mr. Herring is Senior Vice President of FMR (2006-present) and Vice President of FMR Co., Inc. (2001-present). Previously, Mr. Herring served as a portfolio manager for Fidelity U.S. Equity Funds (2001-2005). |
Eric M. Wetlaufer (44) |
| Year of Election or Appointment: 2006 Vice President of VIP Value. Mr. Wetlaufer also serves as Vice President of certain International Equity Funds (2006-present). Mr. Wetlaufer is Senior Vice President of FMR (2006-present) and FMR Co., Inc. (2006-present), and President and Director of Fidelity Management & Research (U.K.) Inc. (2006-present) and Fidelity Research & Analysis Company (2006-present). Before joining Fidelity Investments in 2005, Mr. Wetlaufer was a partner in Oxhead Capital Management (2004-2005). Previously, Mr. Wetlaufer served as a Chief Investment Officer of Putnam Investments (1997-2003). |
Richard B. Fentin (51) |
| Year of Election or Appointment: 2006
Vice President of VIP Value. Mr. Fentin also serves as Vice President of other funds advised by FMR. Prior to assuming his current responsibilities, Mr. Fentin worked as a research analyst, portfolio assistant and manager. Mr. Fentin also serves as Senior Vice President of FMR (1993) and FMR Co., Inc. (2001). |
Eric D. Roiter (58) |
| Year of Election or Appointment: 2001 Secretary of VIP Value. He also serves as Secretary of other Fidelity funds; Vice President, General Counsel, and Secretary of FMR Co., Inc. (2001-present) and FMR; Assistant Secretary of Fidelity Management & Research (U.K.) Inc. (2001-present), Fidelity Research & Analysis Company (2001-present), and Fidelity Investments Money Management, Inc. (2001-present). Mr. Roiter is an Adjunct Member, Faculty of Law, at Boston College Law School (2003-present). Previously, Mr. Roiter served as Vice President and Secretary of Fidelity Distributors Corporation (FDC) (1998-2005). |
Stuart Fross (47) |
| Year of Election or Appointment: 2003 Assistant Secretary of VIP Value. Mr. Fross also serves as Assistant Secretary of other Fidelity funds (2003-present), Vice President and Secretary of FDC (2005-present), and is an employee of FMR. |
R. Stephen Ganis (40) |
| Year of Election or Appointment: 2006 Anti-Money Laundering (AML) officer of VIP Value. Mr. Ganis also serves as AML officer of other Fidelity funds (2006-present) and FMR Corp. (2003-present). Before joining Fidelity Investments, Mr. Ganis practiced law at Goodwin Procter, LLP (2000-2002). |
Joseph B. Hollis (58) |
| Year of Election or Appointment: 2006 Chief Financial Officer of VIP Value. Mr. Hollis also serves as Chief Financial Officer of other Fidelity funds. Mr. Hollis is President of Fidelity Pricing and Cash Management Services (FPCMS) (2005-present). Mr. Hollis also serves as President and Director of Fidelity Service Company, Inc. (2006-present). Previously, Mr. Hollis served as Senior Vice President of Cash Management Services (1999-2002) and Investment Management Operations (2002-2005). |
Kenneth A. Rathgeber (59) |
| Year of Election or Appointment: 2004 Chief Compliance Officer of VIP Value. Mr. Rathgeber also serves as Chief Compliance Officer of other Fidelity funds (2004- present) and Executive Vice President of Risk Oversight for Fidelity Investments (2002-present). He is Chief Compliance Officer of FMR (2005-present), FMR Co., Inc. (2005-present), Fidelity Management & Research (U.K.) Inc. (2005-present), Fidelity Research & Analysis Company (2005-present), Fidelity Investments Money Management, Inc. (2005-present), and Strategic Advisers, Inc. (2005-present). Previously, Mr. Rathgeber served as Executive Vice President and Chief Operating Officer for Fidelity Investments Institutional Services Company, Inc. (1998-2002). |
Bryan A. Mehrmann (45) |
| Year of Election or Appointment: 2005 Deputy Treasurer of VIP Value. Mr. Mehrmann also serves as Deputy Treasurer of other Fidelity funds (2005-present) and is an employee of FMR. Previously, Mr. Mehrmann served as Vice President of Fidelity Investments Institutional Services Group (FIIS)/Fidelity Investments Institutional Operations Corporation, Inc. (FIIOC) Client Services (1998-2004). |
Kenneth B. Robins (37) |
| Year of Election or Appointment: 2005 Deputy Treasurer of VIP Value. Mr. Robins also serves as Deputy Treasurer of other Fidelity funds (2005-present) and is an employee of FMR (2004-present). Before joining Fidelity Investments, Mr. Robins worked at KPMG LLP, where he was a partner in KPMG's department of professional practice (2002-2004) and a Senior Manager (1999-2000). In addition, Mr. Robins served as Assistant Chief Accountant, United States Securities and Exchange Commission (2000-2002). |
Robert G. Byrnes (40) |
| Year of Election or Appointment: 2005 Assistant Treasurer of VIP Value. Mr. Byrnes also serves as Assistant Treasurer of other Fidelity funds (2005-present) and is an employee of FMR (2005-present). Previously, Mr. Byrnes served as Vice President of FPCMS (2003-2005). Before joining Fidelity Investments, Mr. Byrnes worked at Deutsche Asset Management where he served as Vice President of the Investment Operations Group (2000-2003). |
John H. Costello (60) |
| Year of Election or Appointment: 2001 Assistant Treasurer of VIP Value. Mr. Costello also serves as Assistant Treasurer of other Fidelity funds and is an employee of FMR. |
Peter L. Lydecker (52) |
| Year of Election or Appointment: 2004 Assistant Treasurer of VIP Value. Mr. Lydecker also serves as Assistant Treasurer of other Fidelity funds (2004) and is an employee of FMR. |
Mark Osterheld (51) |
| Year of Election or Appointment: 2002 Assistant Treasurer of VIP Value. Mr. Osterheld also serves as Assistant Treasurer of other Fidelity funds (2002) and is an employee of FMR. |
Gary W. Ryan (48) |
| Year of Election or Appointment: 2005 Assistant Treasurer of VIP Value. Mr. Ryan also serves as Assistant Treasurer of other Fidelity funds (2005-present) and is an employee of FMR (2005-present). Previously, Mr. Ryan served as Vice President of Fund Reporting in FPCMS (1999-2005). |
Salvatore Schiavone (41) |
| Year of Election or Appointment: 2005 Assistant Treasurer of VIP Value. Mr. Schiavone also serves as Assistant Treasurer of other Fidelity funds (2005-present) and is an employee of FMR (2005-present). Before joining Fidelity Investments, Mr. Schiavone worked at Deutsche Asset Management, where he most recently served as Assistant Treasurer (2003-2005) of the Scudder Funds and Vice President and Head of Fund Reporting (1996-2003). |
Annual Report
Distributions
The Board of Trustees of VIP Value Portfolio voted to pay to shareholders of record at the opening of business on record date, the following distributions per share derived from capital gains realized from sales of portfolio securities:
| Pay Date | Record Date | Capital Gains |
Initial Class | 02/09/07 | 02/09/07 | $0.985 |
Service Class | 02/09/07 | 02/09/07 | $0.985 |
Service Class 2 | 02/09/07 | 02/09/07 | $0.985 |
Investor Class | 02/09/07 | 02/09/07 | $0.985 |
The fund hereby designates as a capital gain dividend with respect to the taxable year ended December 31, 2006, $1,859,506, or, if subsequently determined to be different, the net capital gain of such year.
Initial Class, Service Class, Service Class 2, and Investor Class designate 100% of the dividends distributed during the fiscal year as qualifying for the dividends-received deduction for corporate shareholders.
The fund will notify shareholders in January 2007 of amounts for use in preparing 2006 income tax returns.
VIP Value Portfolio
Proxy Voting Results
A special meeting of the fund's shareholders was held on November 15, 2006. The results of votes taken among shareholders on the proposal before them are reported below. Each vote reported represents one dollar of net asset value held on the record date for the meeting.
PROPOSAL 1 |
To elect a Board of Trustees. A |
| # of
Votes | % of
Votes |
Dennis J. Dirks |
Affirmative | 17,902,425,874.20 | 95.888 |
Withheld | 767,753,174.62 | 4.112 |
TOTAL | 18,670,179,048.82 | 100.000 |
Albert R. Gamper, Jr. |
Affirmative | 17,903,848,885.90 | 95.895 |
Withheld | 766,330,162.92 | 4.105 |
TOTAL | 18,670,179,048.82 | 100.000 |
Robert M. Gates |
Affirmative | 17,872,803,847.04 | 95.729 |
Withheld | 797,375,201.78 | 4.271 |
TOTAL | 18,670,179,048.82 | 100.000 |
George H. Heilmeier |
Affirmative | 17.870,083,099.32 | 95.715 |
Withheld | 800,095,949.50 | 4.285 |
TOTAL | 18,670,179,048.82 | 100.000 |
Edward C. Johnson 3d |
Affirmative | 17,855,450,949.13 | 95.636 |
Withheld | 814,728,099.69 | 4.364 |
TOTAL | 18,670,179,048.82 | 100.000 |
Stephen P. Jonas |
Affirmative | 17,891,792,907.31 | 95.831 |
Withheld | 778,386,141.51 | 4.169 |
TOTAL | 18,670,179,048.82 | 100.000 |
James H. KeyesB |
Affirmative | 17,882,873,107.76 | 95.783 |
Withheld | 787,305,941.06 | 4.217 |
TOTAL | 18,670,179,048.82 | 100.000 |
Marie L. Knowles |
Affirmative | 17,891,908,567.08 | 95.831 |
Withheld | 778,270,481.74 | 4.169 |
TOTAL | 18,670,179,048.82 | 100.000 |
Ned C. Lautenbach |
Affirmative | 17,899,551,251.03 | 95.872 |
Withheld | 770,627,797.79 | 4.128 |
TOTAL | 18,670,179,048.82 | 100.000 |
| # of
Votes | % of
Votes |
William O. McCoy |
Affirmative | 17,860,461,325.05 | 95.663 |
Withheld | 809,717,723.77 | 4.337 |
TOTAL | 18,670,179,048.82 | 100.000 |
Robert L. Reynolds |
Affirmative | 17,894,978,918.13 | 95.848 |
Withheld | 775,200,130.69 | 4.152 |
TOTAL | 18,670,179,048.82 | 100.000 |
Cornelia M. Small |
Affirmative | 17,897,519,970.69 | 95.862 |
Withheld | 772,659,078.13 | 4.138 |
TOTAL | 18,670,179,048.82 | 100.000 |
William S. Stavropoulos |
Affirmative | 17,871,058,112.55 | 95.720 |
Withheld | 799,120,936.27 | 4.280 |
TOTAL | 18,670,179,048.82 | 100.000 |
Kenneth L. Wolfe |
Affirmative | 17,886,340,376.33 | 95.802 |
Withheld | 783,838,672.49 | 4.198 |
TOTAL | 18,670,179,048.82 | 100.000 |
A Denotes trust-wide proposal and voting results. B Effective on or about January 1, 2007. |
Annual Report
Board Approval of Investment Advisory Contracts and Management Fees
VIP Value Portfolio
Each year, typically in July, the Board of Trustees, including the Independent Trustees (together, the Board), votes on the renewal of the management contract and sub-advisory agreements (together, the Advisory Contracts) for the fund. The Board, assisted by the advice of fund counsel and Independent Trustees' counsel, requests and considers a broad range of information throughout the year.
The Board meets regularly each month except August and takes into account throughout the year matters bearing on Advisory Contracts. The Board, acting directly and through its separate committees, considers at each of its meetings factors that are relevant to the annual renewal of the fund's Advisory Contracts, including the services and support provided to the fund and its shareholders. At the time of the renewal, the Board had 12 standing committees, each composed of Independent Trustees with varying backgrounds, to which the Board has assigned specific subject matter responsibilities in order to enhance effective decision-making by the Board. Each committee has adopted a written charter outlining the structure and purposes of the committee. One such committee, the Equity Contract Committee, meets periodically as needed throughout the year to consider matters specifically related to the annual renewal of Advisory Contracts. The committee requests and receives information on, and makes recommendations to the Independent Trustees concerning, the approval and annual review of the Advisory Contracts.
At its July 2006 meeting, the Board of Trustees, including the Independent Trustees, unanimously determined to renew the Advisory Contracts for the fund. In reaching its determination, the Board considered all factors it believed relevant, including (i) the nature, extent, and quality of the services to be provided to the fund and its shareholders (including the investment performance of the fund); (ii) the competitiveness of the management fee and total expenses of the fund; (iii) the total costs of the services to be provided by and the profits to be realized by the investment adviser and its affiliates from the relationship with the fund; (iv) the extent to which economies of scale would be realized as the fund grows; and (v) whether fee levels reflect these economies of scale, if any, for the benefit of fund shareholders.
In determining whether to renew the Advisory Contracts for the fund, the Board ultimately reached a determination, with the assistance of fund counsel and Independent Trustees' counsel, that the renewal of the Advisory Contracts and the compensation to be received by Fidelity under the management contract is consistent with Fidelity's fiduciary duty under applicable law. In addition to evaluating the specific factors noted above, the Board, in reaching its determination, is aware that shareholders in the fund have a broad range of investment choices available to them, including a wide choice among mutual funds offered by competitors to Fidelity, and that the fund's shareholders, with the opportunity to review and weigh the disclosure provided by the fund in its prospectus and other public disclosures, have chosen to invest in this fund, managed by Fidelity.
Nature, Extent, and Quality of Services Provided. The Board considered staffing within the investment adviser, FMR, and the sub-advisers (together, the Investment Advisers), including the background of the fund's portfolio manager and the fund's investment objective and discipline. The Independent Trustees also had discussions with senior management of Fidelity's investment operations and investment groups. The Board considered the structure of the portfolio manager compensation program and whether this structure provides appropriate incentives.
Resources Dedicated to Investment Management and Support Services. The Board reviewed the size, education, and experience of the Investment Advisers' investment staff, their use of technology, and the Investment Advisers' approach to recruiting, training, and retaining portfolio managers and other research, advisory, and management personnel. The Board considered Fidelity's extensive global research capabilities that enable the Investment Advisers to aggregate data from various sources in an effort to produce positive investment results. The Board noted that Fidelity's analysts have access to a variety of technological tools that enable them to perform both fundamental and quantitative analysis and to specialize in various disciplines. The Board also considered that Fidelity's portfolio managers and analysts have access to daily portfolio attribution that allows for monitoring of a fund's portfolio, as well as an electronic communication system that provides immediate real-time access to research concerning issuers and credit enhancers.
Shareholder and Administrative Services. The Board considered (i) the nature, extent, quality, and cost of administrative, distribution, and shareholder services performed by the Investment Advisers and their affiliates under the Advisory Contracts and under separate agreements covering transfer agency, pricing and bookkeeping, and securities lending services for the fund; (ii) the nature and extent of the Investment Advisers' supervision of third party service providers, principally custodians and subcustodians; and (iii) the resources devoted to, and the record of compliance with, the fund's compliance policies and procedures. The Board reviewed the allocation of fund brokerage, including allocations to brokers affiliated with the Investment Advisers, the use of brokerage commissions to pay fund expenses, and the use of "soft" commission dollars to pay for research services. The Board also considered that Fidelity voluntarily pays for market data out of its own resources.
The Board noted that the growth of fund assets across the complex allows Fidelity to reinvest in the development of services designed to enhance the value or convenience of the Fidelity funds as investment vehicles. These services include 24-hour access to account information and market information through phone representatives and over the Internet, and investor education materials and asset allocation tools.
Investment in a Large Fund Family. The Board considered the benefits to shareholders of investing in a Fidelity fund, including the benefits of investing in a fund that is part of a large family of funds offering a variety of investment disciplines and providing for a large variety of mutual fund investor services. The Board noted that, since the last Advisory Contract renewals in July 2005, Fidelity has taken a number of actions that benefited particular funds, including (i) dedicating additional resources to investment research and to restructure the investment research teams; (ii) voluntarily entering into contractual arrangements with certain brokers pursuant to which Fidelity pays for research products and services separately out of its own resources, rather than bundling with fund commissions; (iii) launching the Fidelity Advantage Class of its five Spartan stock index funds and three Spartan bond index funds, which is a lower-fee class available to shareholders with higher account balances; (iv) contractually agreeing to impose expense limitations on Fidelity U.S. Bond Index Fund and reducing the fund's initial investment minimum; and (v) offering shareholders of each of the Fidelity Institutional Money Market Funds the privilege of exchanging shares of the fund for shares of other Fidelity funds.
VIP Value Portfolio
Investment Performance and Compliance. The Board considered whether the fund has operated within its investment objective, as well as its record of compliance with its investment restrictions. It also reviewed the fund's absolute investment performance for each class (except Investor Class), as well as the fund's relative investment performance for each class (except Investor Class) measured against (i) a broad-based securities market index, and (ii) a peer group of mutual funds over multiple periods. Because the fund had been in existence less than five calendar years, the following charts considered by the Board show, over the one- and three-year periods ended December 31, 2005, the cumulative total returns of Service Class 2 and Initial Class of the fund, the cumulative total returns of a broad-based securities market index ("benchmark"), and a range of cumulative total returns of a peer group of mutual funds identified by Lipper Inc. as having an investment objective similar to that of the fund. The returns of Service Class 2 and Initial Class represent the performance of classes with the highest and lowest 12b-1 fees, respectively (not necessarily with the highest and lowest total expenses). (Investor Class of the fund, which has no 12b-1 fee, had less than one year of performance as of December 31, 2005.) The box within each chart shows the 25th percentile return (bottom of box) and the 75th percentile return (top of box) of the Lipper peer group. Returns shown above the box are in the first quartile and returns shown below the box are in the fourth quartile. The percentage beaten numbers noted below each chart correspond to the percentile box and represent the percentage of funds in the Lipper peer group whose performance was equal to or lower than that of the class indicated.
VIP Value Portfolio
The Board reviewed the fund's relative investment performance against its Lipper peer group and stated that the performance of Initial Class of the fund was in the third quartile for the one-year period and the second quartile for the three-year period. The Board noted that FMR does not consider that Lipper peer group to be a meaningful comparison for the fund, however, because the peer group includes funds with different investment mandates (some broader, some narrower) than the fund. For example, the peer group includes funds that are not limited to a particular investment style, funds that focus on growth-oriented stocks, and funds that (like the fund) focus their investments on value-oriented securities. The Board also stated that the relative investment performance of the fund was lower than its benchmark for all the periods shown. The Board considered that the variations in performance among the fund's classes reflect the variations in class expenses, which result in lower performance for higher expense classes. The Board also reviewed the fund's relative investment performance against a peer group defined by Morningstar.
The Board considered that FMR has taken steps to refocus and strengthen equity research, equity portfolio management, and compliance. The Board noted with favor FMR's reorganization of its senior management team in 2005 and FMR's dedication of additional resources to investment research, and participated in the process that led to those changes.
Based on its review, and giving particular weight to the nature and quality of the resources dedicated by the Investment Advisers to maintain and improve relative performance, the Board concluded that the nature, extent, and quality of the services provided to the fund will benefit the fund's shareholders, particularly in light of the Board's view that the fund's shareholders benefit from investing in a fund that is part of a large family of funds offering a variety of investment disciplines and services.
Annual Portfolio
Board Approval of Investment Advisory Contracts and Management Fees - continued
Competitiveness of Management Fee and Total Fund Expenses. The Board considered the fund's management fee and total expenses compared to "mapped groups" of competitive funds and classes. Fidelity creates "mapped groups" by combining similar Lipper investment objective categories that have comparable management fee characteristics. Combining Lipper investment objective categories aids the Board's management fee and total expense comparisons by broadening the competitive group used for comparison and by reducing the number of universes to which various Fidelity funds are compared.
The Board considered two proprietary management fee comparisons for the 12-month (or shorter) periods shown in the chart below. The group of Lipper funds used by the Board for management fee comparisons is referred to below as the "Total Mapped Group" and, for the reasons explained above, is broader than the Lipper peer group used by the Board for performance comparisons. The Total Mapped Group comparison focuses on a fund's standing relative to the total universe of comparable funds available to investors, in terms of gross management fees before expense reimbursements or caps. "TMG %" represents the percentage of funds in the Total Mapped Group that had management fees that were lower than the fund's. For example, a TMG % of 6% means that 94% of the funds in the Total Mapped Group had higher management fees than the fund. The "Asset-Size Peer Group" (ASPG) comparison focuses on a fund's standing relative to non-Fidelity funds similar in size to the fund within the Total Mapped Group. The ASPG represents at least 15% of the funds in the Total Mapped Group with comparable asset size and management fee characteristics, subject to a minimum of 50 funds (or all funds in the Total Mapped Group if fewer than 50). Additional information, such as the ASPG quartile in which the fund's management fee ranked, is also included in the chart and considered by the Board.
VIP Value Portfolio
The Board noted that the fund's management fee ranked below the median of its Total Mapped Group and below the median of its ASPG for 2005.
Based on its review, the Board concluded that the fund's management fee was fair and reasonable in light of the services that the fund receives and the other factors considered.
In its review of each class's total expenses, the Board considered the fund's management fee as well as other fund or class expenses, as applicable, such as transfer agent fees, pricing and bookkeeping fees, fund-paid 12b-1 fees, and custodial, legal, and audit fees. The Board also noted the effects of any waivers and reimbursements on fees and expenses. As part of its review, the Board also considered current and historical total expenses of each class of the fund compared to competitive fund median expenses. Each class of the fund is compared to those funds and classes in the Total Mapped Group (used by the Board for management fee comparisons) that have a similar sales load structure.
The Board noted that the total expenses of each of Initial Class and Service Class ranked below its competitive median for 2005, and the total expenses of each of Investor Class and Service Class 2 ranked above its competitive median for 2005. The Board noted that the fund offers multiple classes, each of which has a different 12b-1 fee structure, and that the multiple structures are intended to offer a range of pricing options for the intermediary market. The Board also noted that the total expenses of the classes vary primarily by the level of their 12b-1 fees, although differences in transfer agent fees may also cause expenses to vary from class to class. The Board considered that Investor Class was above median primarily due to its higher transfer agent fee.
In its review of total expenses, the Board also considered Fidelity fee structures and other information on clients that FMR and its affiliates service in other competitive markets, such as other mutual funds advised or subadvised by FMR or its affiliates, pension plan clients, and other institutional clients.
VIP Value Portfolio
Based on its review, the Board concluded that the total expenses of each class of the fund were reasonable, although in some cases above the median of the universe presented for comparison, in light of the services that the fund and its shareholders receive and the other factors considered.
Costs of the Services and Profitability. The Board considered the revenues earned and the expenses incurred by Fidelity in conducting the business of developing, marketing, distributing, managing, administering and servicing the fund and its shareholders. The Board also considered the level of Fidelity's profits in respect of all the Fidelity funds.
On an annual basis, FMR presents to the Board Fidelity's profitability for the fund. Fidelity calculates the profitability for each fund, as well as aggregate profitability for groups of Fidelity funds and all Fidelity funds, using a series of detailed revenue and cost allocation methodologies which originate with the audited books and records of Fidelity. The Audit Committee of the Board reviews any significant changes from the prior year's methodologies.
PricewaterhouseCoopers LLP (PwC), independent registered accounting firm and auditor to Fidelity and certain Fidelity funds, has been engaged annually by the Board as part of the Board's assessment of the results of Fidelity's profitability analysis. PwC's engagement includes the review and assessment of Fidelity's methodologies used in determining the revenues and expenses attributable to Fidelity's mutual fund business, and completion of agreed-upon procedures surrounding the mathematical accuracy of fund profitability and its conformity to allocation methodologies. After considering PwC's reports issued under the engagement and information provided by Fidelity, the Board believes that while other allocation methods may also be reasonable, Fidelity's profitability methodologies are reasonable in all material respects.
The Board has also reviewed Fidelity's non-fund businesses and any fall-out benefits related to the mutual fund business as well as cases where Fidelity's affiliates may benefit from or be related to the fund's business.
The Board considered the costs of the services provided by and the profits realized by Fidelity in connection with the operation of the fund and determined that the amount of profit is a fair entrepreneurial profit for the management of the fund.
Economies of Scale. The Board considered whether there have been economies of scale in respect of the management of the Fidelity funds, whether the Fidelity funds (including the fund) have appropriately benefited from any such economies of scale, and whether there is potential for realization of any further economies of scale. The Board considered the extent to which the fund will benefit from economies of scale through increased services to the fund, through waivers or reimbursements, or through fee or expense reductions.
The Board recognized that the fund's management contract incorporates a "group fee" structure, which provides for lower fee rates as total fund assets under FMR's management increase, and for higher fee rates as total fund assets under FMR's management decrease. The Board considered that the group fee is designed to deliver the benefits of economies of scale to fund shareholders when total fund assets increase, even if assets of any particular fund are unchanged or have declined, because some portion of Fidelity's costs are attributable to services provided to all Fidelity funds, and all funds benefit if those costs can be allocated among more assets. The Board concluded that, given the group fee structure, fund shareholders will achieve a certain level of economies of scale as assets under FMR's management increase at the fund complex level, regardless of whether Fidelity achieves any such economies of scale.
The Board further concluded that any potential economies of scale are being shared between fund shareholders and Fidelity in an appropriate manner.
Additional Information Requested by the Board. In order to develop fully the factual basis for consideration of the Advisory Contracts, the Board requested additional information on several topics, including (i) Fidelity's fund profitability methodology and profitability trends within certain funds; (ii) portfolio manager compensation; (iii) the extent to which any economies of scale exist and are shared between the funds and Fidelity; (iv) the total expenses of certain funds and classes relative to competitors, including the extent to which the expenses of certain funds have been or could be capped; (v) fund performance trends; and (vi) Fidelity's fee structures, including use of performance fees.
Based on its evaluation of all of the conclusions noted above, and after considering all material factors, the Board ultimately concluded that the advisory fee structures are fair and reasonable, and that the fund's Advisory Contracts should be renewed.
Annual Report
VIP Value Portfolio
Annual Report
Investment Adviser
Fidelity Management & Research Company
Boston, MA
Investment Sub-Advisers
FMR Co., Inc.
Fidelity Management & Research (U.K.) Inc.
Fidelity Research & Analysis Company
(formerly Fidelity Management & Research (Far East) Inc.)
Fidelity Investments Japan Limited
Fidelity International Investment Advisors
Fidelity International Investment Advisors (U.K.) Limited
General Distributor
Fidelity Distributors Corporation
Boston, MA
Transfer and Service Agents
Fidelity Investments Institutional Operations Company, Inc.
Boston, MA
Fidelity Service Company, Inc.
Boston, MA
Custodian
State Street Bank and Trust Company
Quincy, MA
VIPVAL-ANN-0207
1.768949.105
Item 2. Code of Ethics
As of the end of the period, December 31, 2006, Variable Insurance Products Fund (the trust) has adopted a code of ethics, as defined in Item 2 of Form N-CSR, that applies to its President and Treasurer and its Chief Financial Officer. A copy of the code of ethics is filed as an exhibit to this Form N-CSR.
Item 3. Audit Committee Financial Expert
The Board of Trustees of the trust has determined that Marie L. Knowles is an audit committee financial expert, as defined in Item 3 of Form N-CSR. Ms. Knowles is independent for purposes of Item 3 of Form N-CSR.
Item 4. Principal Accountant Fees and Services
(a) Audit Fees.
For the fiscal years ended December 31, 2006 and December 31, 2005, the aggregate Audit Fees billed by PricewaterhouseCoopers LLP (PwC) for professional services rendered for the audits of the financial statements, or services that are normally provided in connection with statutory and regulatory filings or engagements for those fiscal years, for Equity-Income Portfolio, Growth Portfolio, High Income Portfolio, Money Market Portfolio and Overseas Portfolio (the funds) and for all funds in the Fidelity Group of Funds are shown in the table below.
Fund | 2006A | 2005A |
Equity-Income Portfolio | $88,000 | $87,000 |
Growth Portfolio | $74,000 | $77,000 |
High Income Portfolio | $73,000 | $67,000 |
Money Market Portfolio | $38,000 | $35,000 |
Overseas Portfolio | $61,000 | $55,000 |
All funds in the Fidelity Group of Funds audited by PwC | $13,900,000 | $12,300,000 |
A | Aggregate amounts may reflect rounding. |
For the fiscal years ended December 31, 2006 and December 31, 2005, the aggregate Audit Fees billed by Deloitte & Touche LLP, the member firms of Deloitte Touche Tohmatsu, and their respective affiliates (collectively, "Deloitte Entities") for professional services rendered for the audits of the financial statements, or services that are normally provided in connection with statutory and regulatory filings or engagements for those fiscal years, for Value Portfolio (the fund) and for all funds in the Fidelity Group of Funds are shown in the table below.
Fund | 2006A | 2005A |
Value Portfolio | $34,000 | $33,000 |
All funds in the Fidelity Group of Funds audited by Deloitte Entities | $6,700,000 | $5,700,000 |
A | Aggregate amounts may reflect rounding. |
(b) Audit-Related Fees.
In each of the fiscal years ended December 31, 2006 and December 31, 2005, the aggregate Audit-Related Fees billed by PwC for services rendered for assurance and related services to each fund that are reasonably related to the performance of the audit or review of the fund's financial statements, but not reported as Audit Fees, are shown in the table below.
Fund | 2006A | 2005A |
Equity-Income Portfolio | $0 | $0 |
Growth Portfolio | $0 | $0 |
High Income Portfolio | $0 | $0 |
Money Market Portfolio | $0 | $0 |
Overseas Portfolio | $0 | $0 |
A | Aggregate amounts may reflect rounding. |
In each of the fiscal years ended December 31, 2006 and December 31, 2005, the aggregate Audit-Related Fees billed by Deloitte Entities for services rendered for assurance and related services to the fund that are reasonably related to the performance of the audit or review of the fund's financial statements, but not reported as Audit Fees, are shown in the table below.
Fund | 2006A | 2005A |
Value Portfolio | $0 | $0 |
A | Aggregate amounts may reflect rounding. |
In each of the fiscal years ended December 31, 2006 and December 31, 2005, the aggregate Audit-Related Fees that were billed by PwC and Deloitte Entities that were required to be approved by the Audit Committee for services rendered on behalf of Fidelity Management & Research Company (FMR) and entities controlling, controlled by, or under common control with FMR (not including any sub-adviser whose role is primarily portfolio management and is subcontracted with or overseen by another investment adviser) that provide ongoing services to the funds ("Fund Service Providers") for assurance and related services that relate directly to the operations and financial reporting of each fund that are reasonably related to the performance of the audit or review of the fund's financial statements, but not reported as Audit Fees, are shown in the table below.
Billed By | 2006A | 2005A |
PwC | $0 | $0 |
Deloitte Entities | $0 | $0 |
A | Aggregate amounts may reflect rounding. |
Fees included in the audit-related category comprise assurance and related services (e.g., due diligence services) that are traditionally performed by the independent registered public accounting firm. These audit-related services include due diligence related to mergers and acquisitions, accounting consultations and audits in connection with acquisitions, internal control reviews, attest services that are not required by statute or regulation and consultation concerning financial accounting and reporting standards.
(c) Tax Fees.
In each of the fiscal years ended December 31, 2006 and December 31, 2005, the aggregate Tax Fees billed by PwC for professional services rendered for tax compliance, tax advice, and tax planning for each fund is shown in the table below.
Fund | 2006A | 2005A |
Equity-Income Portfolio | $3,600 | $3,400 |
Growth Portfolio | $2,700 | $2,500 |
High Income Portfolio | $2,700 | $2,500 |
Money Market Portfolio | $1,800 | $1,700 |
Overseas Portfolio | $4,600 | $4,200 |
A | Aggregate amounts may reflect rounding. |
In each of the fiscal years ended December 31, 2006 and December 31, 2005, the aggregate Tax Fees billed by Deloitte Entities for professional services rendered for tax compliance, tax advice, and tax planning for the fund is shown in the table below.
Fund | 2006A | 2005A |
Value Portfolio | $4,500 | $4,300 |
A | Aggregate amounts may reflect rounding. |
In each of the fiscal years ended December 31, 2006 and December 31, 2005, the aggregate Tax Fees billed by PwC and Deloitte Entities that were required to be approved by the Audit Committee for professional services rendered on behalf of the Fund Service Providers for tax compliance, tax advice, and tax planning that relate directly to the operations and financial reporting of each fund is shown in the table below.
Billed By | 2006A | 2005A |
PwC | $0 | $0 |
Deloitte Entities | $0 | $0 |
A | Aggregate amounts may reflect rounding. |
Fees included in the Tax Fees category comprise all services performed by professional staff in the independent registered public accounting firm's tax division except those services related to the audit. Typically, this category would include fees for tax compliance, tax planning, and tax advice. Tax compliance, tax advice, and tax planning services include preparation of original and amended tax returns, claims for refund and tax payment-planning services, assistance with tax audits and appeals, tax advice related to mergers and acquisitions and requests for rulings or technical advice from taxing authorities.
(d) All Other Fees.
In each of the fiscal years ended December 31, 2006 and December 31, 2005, the aggregate Other Fees billed by PwC for all other non-audit services rendered to the funds is shown in the table below.
Fund | 2006A | 2005A |
Equity-Income Portfolio | $9,000 | $10,900 |
Growth Portfolio | $7,200 | $9,400 |
High Income Portfolio | $2,200 | $2,800 |
Money Market Portfolio | $2,100 | $2,300 |
Overseas Portfolio | $3,300 | $3,400 |
A | Aggregate amounts may reflect rounding. |
In each of the fiscal years ended December 31, 2006 and December 31, 2005, the aggregate Other Fees billed by Deloitte Entities for all other non-audit services rendered to the fund is shown in the table below.
Fund | 2006A | 2005A |
Value Portfolio | $ 0 | $0 |
A | Aggregate amounts may reflect rounding. |
In each of the fiscal years ended December 31, 2006 and December 31, 2005, the aggregate Other Fees billed by PwC and Deloitte Entities that were required to be approved by the Audit Committee for all other non-audit services rendered on behalf of the Fund Service Providers that relate directly to the operations and financial reporting of each fund is shown in the table below.
Billed By | 2006A | 2005A |
PwC | $125,000 | $190,000 |
Deloitte Entities | $180,000 | $160,000 |
A | Aggregate amounts may reflect rounding. |
Fees included in the All Other Fees category include services related to internal control reviews, strategy and other consulting, financial information systems design and implementation, consulting on other information systems, and other tax services unrelated to the fund.
(e) (1) | Audit Committee Pre-Approval Policies and Procedures: |
The trust's Audit Committee must pre-approve all audit and non-audit services provided by the independent registered public accounting firm relating to the operations or financial reporting of the funds. Prior to the commencement of any audit or non-audit services to a fund, the Audit Committee reviews the services to determine whether they are appropriate and permissible under applicable law.
The trust's Audit Committee has adopted policies and procedures to, among other purposes, provide a framework for the Committee's consideration of non-audit services by the audit firms that audit the Fidelity funds. The policies and procedures require that any non-audit service provided by a fund audit firm to a Fidelity Fund and any non-audit service provided by a fund auditor to a Fund Service Provider that relates directly to the operations and financial reporting of a Fidelity fund (Covered Service) are subject to approval by the Audit Committee before such service is provided. Non-audit services provided by a fund audit firm for a Fund Service Provider that do not relate directly to the operations and financial reporting of a Fidelity fund (Non-Covered Service) but that are expected to exceed $50,000 are also subject to pre-approval by the Audit Committee.
All Covered Services, as well as Non-Covered Services that are expected to exceed $50,000, must be approved in advance of provision of the service either: (i) by formal resolution of the Audit Committee, or (ii) by oral or written approval of the service by the Chair of the Audit Committee (or if the Chair is unavailable, such other member of the Audit Committee as may be designated by the Chair to act in the Chair's absence). The approval contemplated by (ii) above is permitted where the Treasurer determines that action on such an engagement is necessary before the next meeting of the Audit Committee. Neither pre-approval nor advance notice of Non-Covered Service engagements for which fees are not expected to exceed $50,000 is required; such engagements are to be reported to the Audit Committee monthly.
(e) (2) | Services approved pursuant to paragraph (c)(7)(i)(C) of Rule 2-01 of Regulation S-X: |
Audit-Related Fees:
There were no amounts that were approved by the Audit Committee pursuant to the de minimis exception for the fiscal years ended December 31, 2006 and December 31, 2005 on behalf of each fund.
There were no amounts that were required to be approved by the Audit Committee pursuant to the de minimis exception for the fiscal years ended December 31, 2006 and December 31, 2005 on behalf of the Fund Service Providers that relate directly to the operations and financial reporting of each fund.
Tax Fees:
There were no amounts that were approved by the Audit Committee pursuant to the de minimis exception for the fiscal years ended December 31, 2006 and December 31, 2005 on behalf of each fund.
There were no amounts that were required to be approved by the Audit Committee pursuant to the de minimis exception for the fiscal years ended December 31, 2006 and December 31, 2005 on behalf of the Fund Service Providers that relate directly to the operations and financial reporting of each fund.
All Other Fees:
There were no amounts that were approved by the Audit Committee pursuant to the de minimis exception for the fiscal years ended December 31, 2006 and December 31, 2005 on behalf of each fund.
There were no amounts that were required to be approved by the Audit Committee pursuant to the de minimis exception for the fiscal years ended December 31, 2006 and December 31, 2005 on behalf of the Fund Service Providers that relate directly to the operations and financial reporting of each fund.
(f) Not applicable.
(g) For the fiscal years ended December 31, 2006 and December 31, 2005, the aggregate fees billed by PwC of $1,355,000A and $1,340,000A,B for non-audit services rendered on behalf of the funds, FMR (not including any sub-adviser whose role is primarily portfolio management and is subcontracted with or overseen by another investment adviser) and Fund Service Providers relating to Covered Services and Non-Covered Services are shown in the table below.
| 2006A | 2005A |
Covered Services | $165,000 | $250,000 |
Non-Covered Services | $1,190,000 | $1,090,000B |
A | Aggregate amounts may reflect rounding. |
B | Reflects current period presentation. |
For the fiscal years ended December 31, 2006 and December 31, 2005, the aggregate fees billed by Deloitte Entities of $720,000A and $400,000A,B for non-audit services rendered on behalf of the fund, FMR (not including any sub-adviser whose role is primarily portfolio management and is subcontracted with or overseen by another investment adviser) and Fund Service Providers relating to Covered Services and Non-Covered Services are shown in the table below.
| 2006A | 2005A |
Covered Services | $185,000 | $150,000 |
Non-Covered Services | $535,000 | $250,000 B |
A | Aggregate amounts may reflect rounding. |
B | Reflects current period presentation. |
(h) The trust's Audit Committee has considered Non-Covered Services that were not pre-approved that were provided by PwC and Deloitte Entities to Fund Service Providers to be compatible with maintaining the independence of PwC and Deloitte Entities in their audit of the funds, taking into account representations from PwC and Deloitte Entities, in accordance with Independence Standards Board Standard No.1, regarding their independence from the funds and their related entities.
Item 5. Audit Committee of Listed Registrants
Not applicable.
Item 6. Schedule of Investments
Not applicable.
Item 7. Disclosure of Proxy Voting Policies and Procedures for Closed-End Management Investment Companies
Not applicable.
Item 8. Portfolio Managers of Closed-End Management Investment Companies
Not applicable.
Item 9. Purchase of Equity Securities by Closed-End Management Investment Company and Affiliated Purchasers
Not applicable.
Item 10. Submission of Matters to a Vote of Security Holders
There were no material changes to the procedures by which shareholders may recommend nominees to the trust's Board of Trustees.
Item 11. Controls and Procedures
(a)(i) The President and Treasurer and the Chief Financial Officer have concluded that the trust's disclosure controls and procedures (as defined in Rule 30a-3(c) under the Investment Company Act) provide reasonable assurances that material information relating to the trust is made known to them by the appropriate persons, based on their evaluation of these controls and procedures as of a date within 90 days of the filing date of this report.
(a)(ii) There was no change in the trust's internal control over financial reporting (as defined in Rule 30a-3(d) under the Investment Company Act) that occurred during the second fiscal quarter of the period covered by this report that has materially affected, or is reasonably likely to materially affect, the trust's internal control over financial reporting.
Item 12. Exhibits
(a) | (1) | Code of Ethics pursuant to Item 2 of Form N-CSR is filed and attached hereto as EX-99.CODE ETH. |
(a) | (2) | Certification pursuant to Rule 30a-2(a) under the Investment Company Act of 1940 (17 CFR 270.30a-2(a)) is filed and attached hereto as Exhibit 99.CERT. |
(a) | (3) | Not applicable. |
(b) | | Certification pursuant to Rule 30a-2(b) under the Investment Company Act of 1940 (17 CFR 270.30a-2(b)) is furnished and attached hereto as Exhibit 99.906CERT. |
SIGNATURES
Pursuant to the requirements of the Securities Exchange Act of 1934 and the Investment Company Act of 1940, the registrant has duly caused this report to be signed on its behalf by the undersigned, thereunto duly authorized.
Variable Insurance Products Fund
By: | /s/Kimberley Monasterio |
| Kimberley Monasterio |
| President and Treasurer |
| |
Date: | February 16, 2007 |
Pursuant to the requirements of the Securities Exchange Act of 1934 and the Investment Company Act of 1940, this report has been signed below by the following persons on behalf of the registrant and in the capacities and on the dates indicated.
By: | /s/Kimberley Monasterio |
| Kimberley Monasterio |
| President and Treasurer |
| |
Date: | February 16, 2007 |
By: | /s/Joseph B. Hollis |
| Joseph B. Hollis |
| Chief Financial Officer |
| |
Date: | February 16, 2007 |