UNITED STATES
SECURITIES AND EXCHANGE COMMISSION
Washington, D.C. 20549
FORM N-CSR
CERTIFIED SHAREHOLDER REPORT OF REGISTERED
MANAGEMENT INVESTMENT COMPANIES
Investment Company Act file number 811-3329
Variable Insurance Products Fund
(Exact name of registrant as specified in charter)
82 Devonshire St., Boston, Massachusetts 02109
(Address of principal executive offices) (Zip code)
Eric D. Roiter, Secretary
82 Devonshire St.
Boston, Massachusetts 02109
(Name and address of agent for service)
Registrant's telephone number, including area code: 617-563-7000
Date of fiscal year end: | December 31 |
| |
Date of reporting period: | December 31, 2004 |
Item 1. Reports to Stockholders
Fidelity® Variable Insurance Products
Asset Manager SM Portfolio |
Contrafund® Portfolio |
Equity-Income Portfolio |
Growth Portfolio |
High Income Portfolio |
Index 500 Portfolio |
Overseas Portfolio |
Annual Report
December 31, 2004
(2_fidelity_logos) (Registered_Trademark)
Contents
Shareholder Expense Example | 4 | An example of shareholder expenses |
Asset Manager Portfolio | 8 9 10 11 24 | Performance Management's Discussion Investment Summary Investments Financial Statements |
Contrafund Portfolio | 25 29 30 31 40 | Performance Management's Discussion Investment Summary Investments Financial Statements |
Equity-Income Portfolio | 44 45 46 47 53 | Performance Management's Discussion Investment Summary Investments Financial Statements |
Growth Portfolio | 57 58 59 60 65 | Performance Management's Discussion Investment Summary Investments Financial Statements |
High Income Portfolio | 69 70 71 72 80 | Performance Management's Discussion Investment Summary Investments Financial Statements |
Index 500 Portfolio | 85 86 87 88 96 | Performance Management's Discussion Investment Summary Investments Financial Statements |
Overseas Portfolio | 100 101 102 103 106 | Performance Management's Discussion Investment Summary Investments Financial Statements |
Notes to Financial Statements | 111 | Notes to the Financial Statements |
Report of Independent Registered Public Accounting Firm | 119 | |
Central Investment Portfolio Top Fifty Holdings | 124 | Top Fifty holdings of each Fidelity Central Investment Portfolio held by certain funds. |
Trustees and Officers | 126 | |
Distributions | 132 | |
Proxy Voting Results | 134 | |
To view a fund's proxy voting guidelines and proxy voting record for the 12-month period ended June 30, visit www.fidelity.com/proxyvotingresults or visit the Securities and Exchange Commission's (SEC) web site at www.sec.gov. You may also call 1-800-544-5429 to request a free copy of the proxy voting guidelines.
Fidelity Variable Insurance Products are separate account options which are purchased through a variable insurance contract.
Standard & Poor's, S&P and S&P 500 are registered service marks of The McGraw-Hill Companies, Inc. and have been licensed for use by Fidelity Distributors Corporation.
Other third party marks appearing herein are the property of their respective owners.
All other marks appearing herein are registered or unregistered trademarks or service marks of FMR Corp. or an affiliated company.
(Recycle graphic) This report is printed on recycled paper using soy-based inks.
This report and the financial statements contained herein are submitted for the general information of the shareholders of the funds. This report is not authorized for distribution to prospective investors in the funds unless preceded or accompanied by an effective prospectus.
A fund files its complete schedule of portfolio holdings with the SEC for the first and third quarters of each fiscal year on Form N-Q. Forms N-Q are available on the SEC's web site at http://www.sec.gov. A fund's Forms N-Q may be reviewed and copied at the SEC's Public Reference Room in Washington, DC. Information regarding the operation of the SEC's Public Reference Room may be obtained by calling 1-800-SEC-0330. For a complete list of a fund's portfolio holdings, view the most recent quarterly holdings report, semiannual report, or annual report on Fidelity's web site at http://www.advisor.fidelity.com.
NOT FDIC INSURED · MAY LOSE VALUE · NO BANK GUARANTEE
Neither the funds nor Fidelity Distributors Corporation is a bank.
Annual Report
Shareholder Expense Example
As a shareholder of a Fund, you incur two types of costs: (1) transaction costs, including redemption fees, and (2) ongoing costs, including management fees, distribution and/or service (12b-1) fees and other Fund expenses. This Example is intended to help you understand your ongoing costs (in dollars) of investing in the Funds and to compare these costs with the ongoing costs of investing in other mutual funds.
The Example is based on an investment of $1,000 invested at the beginning of the period and held for the entire period (July 1, 2004 to December 31, 2004).
Actual Expenses
The first line of the table below for each class of each fund provides information about actual account values and actual expenses. You may use the information in this line, together with the amount you invested, to estimate the expenses that you paid over the period. Simply divide your account value by $1,000.00 (for example, an $8,600 account value divided by $1,000.00 = 8.6), then multiply the result by the number in the first line for a class of the fund under the heading entitled "Expenses Paid During Period" to estimate the expenses you paid on your account during this period. An annual index fund fee of $10 that is charged once a year may apply for certain accounts with a value of less than $10,000. This fee is not included in the table below. If it was, the estimate of expenses you paid during the period would be higher, and your ending account value lower, by this amount. The estimate of expenses does not include any fees or other expenses of any variable annuity of variable life insurance product. If they were, the estimate of expenses you paid during the period would be higher, and your ending account value would be lower.
Hypothetical Example for Comparison Purposes
The second line of the table below for each class of each fund provides information about hypothetical account values and hypothetical expenses based on a Class' actual expense ratio and an assumed rate of return of 5% per year before expenses, which is not the Class' actual return. The hypothetical account values and expenses may not be used to estimate the actual ending account balance or expenses you paid for the period. You may use this information to compare the ongoing costs of investing in the Fund and other funds. To do so, compare this 5% hypothetical example with the 5% hypothetical examples that appear in the shareholder reports of the other funds. An annual index fund fee of $10 that is charged once a year may apply for certain accounts with a value of less than $10,000. This fee is not included in the table below. If it was, the estimate of expenses you paid during the period would be higher, and your ending account value lower, by this amount. The estimate of expenses does not include any fees or other expenses of any variable annuity of variable life insurance product. If they were, the estimate of expenses you paid during the period would be higher, and your ending account value would be lower.
Please note that the expenses shown in the table are meant to highlight your ongoing costs only and do not reflect any transaction costs. Therefore, the second line of the table is useful in comparing ongoing costs only, and will not help you determine the relative total costs of owning different funds. In addition, if these transactional costs were included, your costs would have been higher.
| Beginning
Account Value
July 1, 2004 | Ending
Account Value
December 31, 2004 | Expenses Paid
During Period*
July 1, 2004
to December 31, 2004 |
Asset Manager | | | |
Initial Class | | | |
Actual | $ 1,000.00 | $ 1,041.40 | $ 3.44 |
Hypothetical A | $ 1,000.00 | $ 1,021.77 | $ 3.40 |
Service Class | | | |
Actual | $ 1,000.00 | $ 1,040.90 | $ 4.00 |
Hypothetical A | $ 1,000.00 | $ 1,021.22 | $ 3.96 |
Service Class 2 | | | |
Actual | $ 1,000.00 | $ 1,039.80 | $ 4.82 |
Hypothetical A | $ 1,000.00 | $ 1,020.41 | $ 4.77 |
Contrafund | | | |
Initial Class | | | |
Actual | $ 1,000.00 | $ 1,086.10 | $ 3.62 |
Hypothetical A | $ 1,000.00 | $ 1,021.67 | $ 3.51 |
Service Class | | | |
Actual | $ 1,000.00 | $ 1,085.50 | $ 4.14 |
Hypothetical A | $ 1,000.00 | $ 1,021.17 | $ 4.01 |
Service Class 2 | | | |
Actual | $ 1,000.00 | $ 1,084.80 | $ 4.93 |
Hypothetical A | $ 1,000.00 | $ 1,020.41 | $ 4.77 |
Service Class 2R | | | |
Actual | $ 1,000.00 | $ 1,084.60 | $ 4.93 |
Hypothetical A | $ 1,000.00 | $ 1,020.41 | $ 4.77 |
| Beginning
Account Value
July 1, 2004 | Ending
Account Value
December 31, 2004 | Expenses Paid
During Period*
July 1, 2004
to December 31, 2004 |
Equity-Income | | | |
Initial Class | | | |
Actual | $ 1,000.00 | $ 1,077.30 | $ 3.08 |
Hypothetical A | $ 1,000.00 | $ 1,022.17 | $ 3.00 |
Service Class | | | |
Actual | $ 1,000.00 | $ 1,077.10 | $ 3.60 |
Hypothetical A | $ 1,000.00 | $ 1,021.67 | $ 3.51 |
Service Class 2 | | | |
Actual | $ 1,000.00 | $ 1,076.40 | $ 4.38 |
Hypothetical A | $ 1,000.00 | $ 1,020.91 | $ 4.27 |
Service Class 2R | | | |
Actual | $ 1,000.00 | $ 1,075.70 | $ 4.38 |
Hypothetical A | $ 1,000.00 | $ 1,020.91 | $ 4.27 |
Growth | | | |
Initial Class | | | |
Actual | $ 1,000.00 | $ 1,018.80 | $ 3.55 |
Hypothetical A | $ 1,000.00 | $ 1,021.62 | $ 3.56 |
Service Class | | | |
Actual | $ 1,000.00 | $ 1,018.20 | $ 4.06 |
Hypothetical A | $ 1,000.00 | $ 1,021.11 | $ 4.06 |
Service Class 2 | | | |
Actual | $ 1,000.00 | $ 1,017.40 | $ 4.82 |
Hypothetical A | $ 1,000.00 | $ 1,020.36 | $ 4.82 |
Service Class 2R | | | |
Actual | $ 1,000.00 | $ 1,017.40 | $ 4.82 |
Hypothetical A | $ 1,000.00 | $ 1,020.36 | $ 4.82 |
High Income | | | |
Initial Class | | | |
Actual | $ 1,000.00 | $ 1,088.60 | $ 3.78 |
Hypothetical A | $ 1,000.00 | $ 1,021.52 | $ 3.66 |
Service Class | | | |
Actual | $ 1,000.00 | $ 1,089.10 | $ 4.31 |
Hypothetical A | $ 1,000.00 | $ 1,021.01 | $ 4.17 |
Service Class 2 | | | |
Actual | $ 1,000.00 | $ 1,088.20 | $ 5.14 |
Hypothetical A | $ 1,000.00 | $ 1,020.21 | $ 4.98 |
Initial Class R | | | |
Actual | $ 1,000.00 | $ 1,090.30 | $ 3.73 |
Hypothetical A | $ 1,000.00 | $ 1,021.57 | $ 3.61 |
Service Class R | | | |
Actual | $ 1,000.00 | $ 1,089.10 | $ 4.25 |
Hypothetical A | $ 1,000.00 | $ 1,021.06 | $ 4.12 |
Service Class 2R | | | |
Actual | $ 1,000.00 | $ 1,088.20 | $ 5.04 |
Hypothetical A | $ 1,000.00 | $ 1,020.31 | $ 4.88 |
Index 500 | | | |
Initial Class | | | |
Actual | $ 1,000.00 | $ 1,070.60 | $ 1.46** |
Hypothetical A | $ 1,000.00 | $ 1,023.73 | $ 1.42** |
Service Class | | | |
Actual | $ 1,000.00 | $ 1,070.20 | $ 1.98** |
Hypothetical A | $ 1,000.00 | $ 1,023.23 | $ 1.93** |
Service Class 2 | | | |
Actual | $ 1,000.00 | $ 1,069.30 | $ 2.76** |
Hypothetical A | $ 1,000.00 | $ 1,022.47 | $ 2.69** |
| Beginning
Account Value
July 1, 2004 | Ending
Account Value
December 31, 2004 | Expenses Paid
During Period*
July 1, 2004
to December 31, 2004 |
Overseas | | | |
Initial Class | | | |
Actual | $ 1,000.00 | $ 1,124.60 | $ 4.97 |
Hypothetical A | $ 1,000.00 | $ 1,020.46 | $ 4.72 |
Service Class | | | |
Actual | $ 1,000.00 | $ 1,123.70 | $ 5.50 |
Hypothetical A | $ 1,000.00 | $ 1,019.96 | $ 5.23 |
Service Class 2 | | | |
Actual | $ 1,000.00 | $ 1,123.40 | $ 6.30 |
Hypothetical A | $ 1,000.00 | $ 1,019.20 | $ 5.99 |
Initial Class R | | | |
Actual | $ 1,000.00 | $ 1,124.80 | $ 4.97 |
Hypothetical A | $ 1,000.00 | $ 1,020.46 | $ 4.72 |
Service Class R | | | |
Actual | $ 1,000.00 | $ 1,124.50 | $ 5.50 |
Hypothetical A | $ 1,000.00 | $ 1,019.96 | $ 5.23 |
Service Class 2R | | | |
Actual | $ 1,000.00 | $ 1,123.40 | $ 6.30 |
Hypothetical A | $ 1,000.00 | $ 1,019.20 | $ 5.99 |
A 5% return per year before expenses
* Expenses are equal to each Class' annualized expense ratio (shown in the table below); multiplied by the average account value over the period, multiplied by 184/366 (to reflect the one-half year period).
| Annualized
Expense Ratio |
Asset Manager | |
Initial Class | .67% |
Service Class | .78% |
Service Class 2 | .94% |
Contrafund | |
Initial Class | .69% |
Service Class | .79% |
Service Class 2 | .94% |
Service Class 2R | .94% |
Equity-Income | |
Initial Class | .59% |
Service Class | .69% |
Service Class 2 | .84% |
Service Class 2R | .84% |
Growth | |
Initial Class | .70% |
Service Class | .80% |
Service Class 2 | .95% |
Service Class 2R | .95% |
High Income | |
Initial Class | .72% |
Service Class | .82% |
Service Class 2 | .98% |
Initial Class R | .71% |
Service Class R | .81% |
Service Class 2R | .96% |
Index 500 | |
Initial Class | .28%** |
Service Class | .38%** |
Service Class 2 | .53%** |
| Annualized
Expense Ratio |
Overseas | |
Initial Class | .93% |
Service Class | 1.03% |
Service Class 2 | 1.18% |
Initial Class R | .93% |
Service Class R | 1.03% |
Service Class 2R | 1.18% |
**Under the terms of the VIP Index 500 Portfolio's amended management contract and the VIP Index 500 Portfolio 10 Basis Point Expense Contract effective March 1, 2005, Fidelity Management & Research Company has contractually agreed to pay all operating expenses of the fund and each current class of the fund with certain exceptions. If these contractual arrangements had been in effect during the period, the annualized expense ratio and the expenses paid in the actual and hypothetical examples above would have been as follows:
| Annualized
Expense Ratio | Expenses
Paid |
Initial Class | .10% | |
Actual | | $ .52 |
HypotheticalA | | $ .51 |
Service Class | .20% | |
Actual | | $ 1.04 |
HypotheticalA | | $ 1.02 |
Service Class 2 | .35% | |
Actual | | $ 1.82 |
HypotheticalA | | $ 1.78 |
A 5% return per year before expenses
Annual Report
Fidelity Variable Insurance Products: Asset Manager Portfolio
Performance: The Bottom Line
Average annual total return reflects the change in the value of an investment, assuming reinvestment of a class' dividend income and capital gains (the profits earned upon the sale of securities that have grown in value) and assuming a constant rate of performance each year. During periods of reimbursement by Fidelity, a fund's total return will be greater than it would be had the reimbursement not occurred. Performance numbers are net of all underlying fund operating expenses, but do not include any insurance charges imposed by your insurance company's separate account. If performance information included the effect of these additional charges, the total returns would have been lower. How a fund did yesterday is no guarantee of how it will do tomorrow.
Average Annual Total Returns
Periods ended December 31, 2004 | Past 1
year | Past 5
years | Past 10
years |
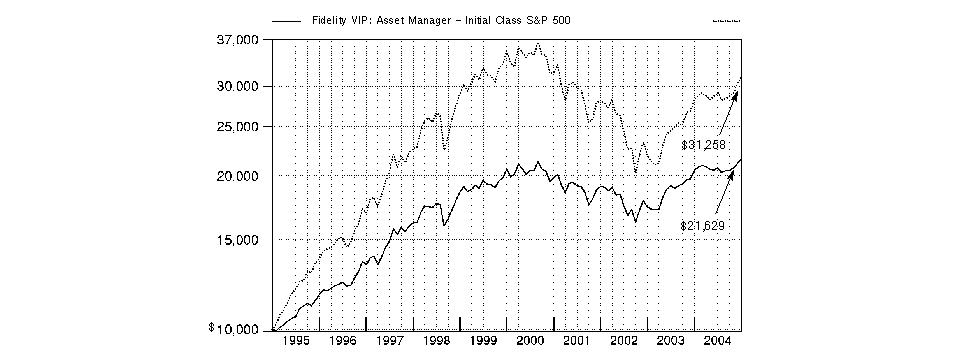
Fidelity VIP: Asset Manager Portfolio - Initial Class | 5.47% | 0.91% | 8.02% |
Fidelity VIP: Asset Manager Portfolio - Service Class A | 5.36% | 0.79% | 7.91% |
Fidelity VIP: Asset Manager Portfolio - Service Class 2 B | 5.18% | 0.62% | 7.82% |
A The initial offering of Service Class shares took place on November 3, 1997. Performance for Service Class shares reflects an asset based distribution fee (12b-1 fee) and returns prior to November 3, 1997 are those for Initial Class and do not include the effects of Service Class' 12b-1 fee. Had Service Class shares' 12b-1 fee been reflected, returns prior to November 3, 1997 would have been lower.
B The initial offering of Service Class 2 shares took place on January 12, 2000. Performance for Service Class 2 shares reflect an asset based distribution fee (12b-1 fee). Returns from November 3, 1997 to January 12, 2000 are those of Service Class which reflect a different 12b-1 fee. Service Class 2 returns prior to November 3, 1997 are those of Initial Class and do not include the effect of a 12b-1 fee. Had Service Class 2's 12b-1 fee been reflected, returns prior to January 12, 2000 would have been lower.
$10,000 Over 10 Years
Let's say hypothetically that $10,000 was invested in Fidelity ® Variable Insurance Products: Asset Manager SM Portfolio - Initial Class on December 31, 1994. The chart shows how the value of your investment would have changed, and also shows how the S&P 500 Index performed over the same period.
Annual Report
Fidelity Variable Insurance Products: Asset Manager Portfolio
Management's Discussion of Fund Performance
Comments from Richard Habermann and Ford O'Neil, Co-Managers of Fidelity® Variable Insurance Products: Asset Manager Portfolio
Equity and fixed-income benchmarks finished the year ending December 31, 2004, with positive returns. In the equity markets, small-cap stocks outperformed large-caps for the sixth consecutive year, as the Russell 2000® Index was up 18.33% compared to 10.88% for the larger-cap Standard & Poor's 500SM Index. Meanwhile, value stocks topped growth stocks: The Russell 3000® Value Index advanced 16.94%, compared to 6.93% for the Russell 3000 Growth Index. Elsewhere the tech-heavy NASDAQ Composite® Index returned 9.15%, thanks primarily to a 14.87% jump in the fourth quarter, and the Dow Jones Industrial AverageSM gained 5.37%. Despite five increases in short-term interest rates, the Lehman Brothers® Aggregate Bond Index rose 4.34% in 2004. While that's roughly half of the benchmark's historical average annual return, it's better than many analysts' expectations at the beginning of the period, given concerns about the potentially high levels of economic growth and subsequent inflation at the start of the year. However, economic expansion was more moderate than anticipated, and the Fed reassured investors that rate tightening would be undertaken at a measured pace.
During the past year, the fund trailed both the Fidelity Asset Manager Composite Index and the LipperSM Variable Annuity Flexible Portfolio Funds Average, which returned 7.33% and 8.25%, respectively. Disappointing stock selection was simply too much to overcome even in the face of favorable asset allocation and solid results within the fixed-income subportfolio. In an environment that favored riskier assets, the fund was rewarded relative to the index for overweighting stocks and high-yield bonds, both of which outperformed investment-grade debt. Unfortunately, our average peer tends to be even heavier in equities. The fund's domestic equity investments trailed the S&P 500® by more than four percentage points, largely due to one major holding in media - radio broadcaster Clear Channel Communications - that stumbled badly. Unfavorable stock selection in financials and health care also hurt, led by insurance giant American International Group and large-cap pharmaceutical company Pfizer, respectively. Conversely, underweighting weak technology stocks helped, as did overweighting retailers Home Depot and pharmacy chain CVS, and energy holdings such as Diamond Offshore Drilling. In fixed income, our high-yield and investment-grade holdings easily beat the Lehman Brothers Aggregate Bond Index. The strategic cash portion of the fund topped its benchmark as well, though overweighting it curbed the fund's gains in a rising bond market.
The views expressed in this statement reflect those of the portfolio managers only through the end of the period of the report as stated on the cover and do not necessarily represent the views of Fidelity or any other person in the Fidelity organization. Any such views are subject to change at any time based upon market or other conditions and Fidelity disclaims any responsibility to update such views. These views may not be relied on as investment advice and, because investment decisions for a Fidelity fund are based on numerous factors, may not be relied on as an indication of trading intent on behalf of any Fidelity fund.
Annual Report
Fidelity Variable Insurance Products: Asset Manager Portfolio
Investment Summary
Top Five Stocks as of December 31, 2004 |
| % of fund's
net assets |
Home Depot, Inc. | 2.6 |
American International Group, Inc. | 2.6 |
Cardinal Health, Inc. | 2.5 |
Microsoft Corp. | 2.4 |
Fannie Mae | 2.1 |
| 12.2 |
Top Five Bond Issuers as of December 31, 2004 |
(with maturities greater than one year) | % of fund's
net assets |
Fannie Mae | 8.4 |
U.S. Treasury Obligations | 5.5 |
Freddie Mac | 1.1 |
Government National Mortgage Association | 0.5 |
Thirteen Affiliates of General Growth Properties, Inc. | 0.5 |
| 16.0 |
Asset Allocation as of December 31, 2004 |
% of fund's net assets * |
 | Stock Class and
Equity Futures | 55.4% | |
 | Bond Class | 28.5% | |
 | Short-Term Class | 16.1% | |
* Foreign
investments 7.6% | |

Asset allocations in the pie chart reflect the categorization of assets as defined in the fund's prospectus in effect of the time period indicated above. Financial Statement categorizations conform to accounting standards and will differ from the pie chart. Percentages are adjusted for the effect of futures contracts and swap contracts, if applicable.
The information in the above tables is based on the combined investments of the fund and its pro-rata share of investments of Fidelity's fixed-income central funds.
Annual Report
Fidelity Variable Insurance Products: Asset Manager Portfolio
Investments December 31, 2004
Showing Percentage of Net Assets
Common Stocks - 51.0% |
| Shares | | Value (Note 1) |
CONSUMER DISCRETIONARY - 6.1% |
Auto Components - 0.1% |
Aisin Seiki Co. Ltd. | 22,900 | | $ 580,157 |
Bridgestone Corp. | 29,000 | | 577,565 |
Michelin SA (Compagnie Generale des Etablissements) Series B | 13,700 | | 877,014 |
NOK Corp. | 10,200 | | 319,652 |
Sanden Corp. | 34,000 | | 210,446 |
Stanley Electric Co. Ltd. | 22,900 | | 392,584 |
Sumitomo Rubber Industries Ltd. | 38,000 | | 355,775 |
| | 3,313,193 |
Automobiles - 0.2% |
Honda Motor Co. Ltd. | 12,400 | | 646,288 |
Hyundai Motor Co. | 11,430 | | 612,795 |
Kia Motors Corp. | 24,170 | | 254,495 |
Renault SA | 7,600 | | 634,567 |
Toyota Motor Corp. | 49,300 | | 2,018,096 |
| | 4,166,241 |
Hotels, Restaurants & Leisure - 0.3% |
H.I.S. Co. Ltd. | 25,200 | | 490,567 |
McDonald's Corp. | 173,200 | | 5,552,792 |
William Hill PLC | 105,100 | | 1,137,544 |
| | 7,180,903 |
Household Durables - 0.1% |
Casio Computer Co. Ltd. | 17,000 | | 262,394 |
HTL International Holdings Ltd. | 355,000 | | 289,290 |
Koninklijke Philips Electronics NV (NY Shares) | 15,800 | | 418,700 |
LG Electronics, Inc. | 3,380 | | 209,291 |
Matsushita Electric Industrial Co. Ltd. | 16,000 | | 256,800 |
Merry Electronics Co. Ltd. | 109,322 | | 261,355 |
Sumitomo Forestry Co. Ltd. | 36,000 | | 361,652 |
Techtronic Industries Co. Ltd. | 371,500 | | 810,123 |
| | 2,869,605 |
Leisure Equipment & Products - 0.0% |
Aruze Corp. | 2,000 | | 50,962 |
Fuji Photo Film Co. Ltd. | 15,800 | | 584,284 |
Mars Engineering Corp. | 6,200 | | 209,431 |
Sega Sammy Holdings, Inc. (a) | 6,000 | | 329,786 |
| | 1,174,463 |
Media - 2.4% |
Clear Channel Communications, Inc. | 1,567,168 | | 52,484,456 |
Dow Jones & Co., Inc. | 18,300 | | 787,998 |
ITV PLC | 348,171 | | 703,236 |
Kadokawa Shoten Publishing Co. Ltd. | 3,400 | | 141,072 |
Macquarie Communications Infrastructure Group | 74,400 | | 321,322 |
Maiden Group PLC | 31,600 | | 137,961 |
Modern Times Group AB (MTG) (B Shares) (a) | 10,850 | | 295,502 |
News Corp.: | | | |
Class A | 486,800 | | 9,083,688 |
|
| Shares | | Value (Note 1) |
Class B unit | 57 | | $ 1,094 |
NRJ Group | 6,920 | | 151,605 |
PT Multimedia SGPS SA | 11,100 | | 278,417 |
Television Broadcasts Ltd. | 44,000 | | 204,354 |
Time Warner, Inc. (a) | 207,700 | | 4,037,688 |
| | 68,628,393 |
Multiline Retail - 0.0% |
Don Quijote Co. Ltd. | 4,300 | | 219,555 |
Next PLC | 11,800 | | 373,639 |
Ryohin Keikaku Co. Ltd. | 8,000 | | 402,226 |
| | 995,420 |
Specialty Retail - 2.8% |
Bookoff Corp. | 8,000 | | 155,736 |
Esprit Holdings Ltd. | 125,000 | | 755,841 |
Fast Retailing Co. Ltd. | 2,300 | | 175,144 |
Hikari Tsushin, Inc. | 7,700 | | 590,862 |
Home Depot, Inc. | 1,689,500 | | 72,209,230 |
JB Hi-Fi Ltd. | 27,221 | | 82,635 |
Nishimatsuya Chain Co. Ltd. | 5,000 | | 189,398 |
Pertama Holdings Ltd. | 568,000 | | 97,445 |
Ross Stores, Inc. | 28,000 | | 808,360 |
Staples, Inc. | 29,600 | | 997,816 |
TJX Companies, Inc. | 101,300 | | 2,545,669 |
USS Co. Ltd. | 6,290 | | 528,107 |
Wyevale Garden Centres PLC | 35,200 | | 292,832 |
| | 79,429,075 |
Textiles, Apparel & Luxury Goods - 0.2% |
Adidas-Salomon AG | 3,100 | | 499,380 |
Billabong International Ltd. | 37,700 | | 337,735 |
Bulgari Spa | 136,100 | | 1,678,254 |
Compagnie Financiere Richemont unit | 26,937 | | 894,787 |
Li Ning Co. Ltd. | 272,000 | | 136,476 |
Ted Baker PLC | 90,600 | | 839,772 |
| | 4,386,404 |
TOTAL CONSUMER DISCRETIONARY | | 172,143,697 |
CONSUMER STAPLES - 3.8% |
Beverages - 0.3% |
Asahi Breweries Ltd. | 14,200 | | 175,923 |
C&C Group PLC | 112,300 | | 450,928 |
Fosters Group Ltd. | 85,500 | | 387,323 |
PepsiCo, Inc. | 119,300 | | 6,227,460 |
Pernod-Ricard | 4,900 | | 749,128 |
| | 7,990,762 |
Food & Staples Retailing - 2.1% |
CVS Corp. | 678,000 | | 30,557,460 |
Safeway, Inc. (a) | 572,100 | | 11,293,254 |
Wal-Mart Stores, Inc. | 335,000 | | 17,694,700 |
Wumart Stores, Inc. (H Shares) (a) | 26,000 | | 41,812 |
| | 59,587,226 |
Common Stocks - continued |
| Shares | | Value (Note 1) |
CONSUMER STAPLES - continued |
Food Products - 0.0% |
People's Food Holdings Ltd. | 276,000 | | $ 253,661 |
Pulmuone Co. Ltd. | 4,200 | | 210,974 |
| | 464,635 |
Household Products - 0.2% |
Colgate-Palmolive Co. | 58,800 | | 3,008,208 |
Kimberly-Clark Corp. | 6,400 | | 421,184 |
Procter & Gamble Co. | 39,100 | | 2,153,628 |
| | 5,583,020 |
Personal Products - 0.5% |
Alberto-Culver Co. | 287,650 | | 13,971,161 |
Estee Lauder Companies, Inc. Class A | 23,400 | | 1,071,018 |
Hengan International Group Co. Ltd. | 58,000 | | 38,056 |
| | 15,080,235 |
Tobacco - 0.7% |
Altria Group, Inc. | 314,900 | | 19,240,390 |
TOTAL CONSUMER STAPLES | | 107,946,268 |
ENERGY - 2.4% |
Energy Equipment & Services - 1.5% |
Diamond Offshore Drilling, Inc. (d) | 304,800 | | 12,207,240 |
ENSCO International, Inc. | 214,900 | | 6,820,926 |
GlobalSantaFe Corp. | 308,600 | | 10,217,746 |
Nabors Industries Ltd. (a) | 31,000 | | 1,589,990 |
Transocean, Inc. (a) | 289,200 | | 12,259,188 |
| | 43,095,090 |
Oil & Gas - 0.9% |
BP PLC sponsored ADR | 54,900 | | 3,206,160 |
ChevronTexaco Corp. | 37,700 | | 1,979,627 |
China Petroleum & Chemical Corp. (H Shares) | 572,000 | | 234,463 |
ConocoPhillips | 116,100 | | 10,080,963 |
Cosmo Oil Co. Ltd. | 33,000 | | 97,618 |
ENI Spa | 64,000 | | 1,610,752 |
Exxon Mobil Corp. | 39,900 | | 2,045,274 |
GS Holdings Corp. (a) | 3,510 | | 75,951 |
Nippon Mining Holdings, Inc. | 51,500 | | 242,341 |
Royal Dutch Petroleum Co. (Hague Registry) | 31,900 | | 1,830,422 |
Shell Transport & Trading Co. PLC ADR | 7,700 | | 395,780 |
SK Corp. | 6,040 | | 331,990 |
Total SA sponsored ADR | 24,000 | | 2,636,160 |
| | 24,767,501 |
TOTAL ENERGY | | 67,862,591 |
FINANCIALS - 13.4% |
Capital Markets - 1.8% |
Credit Suisse Group (Reg.) | 25,579 | | 1,079,178 |
DAB Bank AG (a) | 67,500 | | 503,619 |
|
| Shares | | Value (Note 1) |
Goldman Sachs Group, Inc. | 110,600 | | $ 11,506,824 |
Hyundai Securities Co. Ltd. (a) | 36,650 | | 175,426 |
JAFCO Co. Ltd. | 4,100 | | 278,590 |
Julius Baer Holding AG (Bearer) | 4,138 | | 1,242,907 |
Lehman Brothers Holdings, Inc. | 44,100 | | 3,857,868 |
Macquarie Bank Ltd. | 10,200 | | 371,092 |
Merrill Lynch & Co., Inc. | 255,600 | | 15,277,212 |
Mitsubishi Securities Co. Ltd. | 24,000 | | 262,892 |
Morgan Stanley | 243,000 | | 13,491,360 |
Nikko Cordial Corp. | 47,000 | | 249,156 |
UBS AG (NY Shares) | 16,100 | | 1,349,824 |
| | 49,645,948 |
Commercial Banks - 2.5% |
Banca Intesa Spa | 175,020 | | 840,476 |
Banco Bilbao Vizcaya Argentaria SA | 76,300 | | 1,353,562 |
Banco Santander Central Hispano SA | 64,100 | | 792,917 |
Bank of America Corp. | 802,610 | | 37,714,644 |
BNP Paribas SA | 12,400 | | 896,571 |
Capitalia Spa | 89,500 | | 409,277 |
Chinatrust Financial Holding Co. | 194,967 | | 232,439 |
DBS Group Holdings Ltd. | 32,000 | | 315,667 |
Hana Bank | 6,100 | | 152,029 |
HSBC Holdings PLC sponsored ADR | 23,300 | | 1,983,762 |
Jeonbuk Bank | 20,590 | | 87,514 |
Kookmin Bank (a) | 8,040 | | 314,548 |
Mitsui Trust Holdings, Inc. | 45,000 | | 449,868 |
Mizuho Financial Group, Inc. | 78 | | 392,932 |
Nishi-Nippon City Bank Ltd. | 20,000 | | 77,126 |
North Fork Bancorp, Inc., New York | 74,439 | | 2,147,565 |
Royal Bank of Scotland Group PLC | 25,500 | | 857,355 |
Shinhan Financial Group Co. Ltd. | 18,240 | | 412,303 |
Sumitomo Mitsui Financial Group, Inc. | 89 | | 647,320 |
Synovus Financial Corp. | 146,900 | | 4,198,402 |
Taishin Financial Holdings Co. Ltd. | 159,281 | | 149,310 |
UFJ Holdings, Inc. (a) | 87 | | 527,453 |
Wachovia Corp. | 245,574 | | 12,917,181 |
Wells Fargo & Co. | 65,900 | | 4,095,685 |
| | 71,965,906 |
Consumer Finance - 0.3% |
MBNA Corp. | 263,200 | | 7,419,608 |
Nippon Shinpan Co. Ltd. | 64,000 | | 276,794 |
Nissin Co. Ltd. | 31,100 | | 78,334 |
OMC Card, Inc. (a) | 17,000 | | 212,106 |
ORIX Corp. | 4,200 | | 570,770 |
SFCG Co. Ltd. | 2,490 | | 629,610 |
| | 9,187,222 |
Diversified Financial Services - 1.5% |
Citigroup, Inc. | 613,500 | | 29,558,430 |
Deutsche Boerse AG | 25,194 | | 1,513,354 |
Fortis | 30,500 | | 841,977 |
Common Stocks - continued |
| Shares | | Value (Note 1) |
FINANCIALS - continued |
Diversified Financial Services - continued |
ING Groep NV (Certificaten Van Aandelen) | 36,000 | | $ 1,089,000 |
J.P. Morgan Chase & Co. | 259,128 | | 10,108,583 |
| | 43,111,344 |
Insurance - 4.5% |
ACE Ltd. | 106,000 | | 4,531,500 |
AFLAC, Inc. | 30,200 | | 1,203,168 |
AMBAC Financial Group, Inc. | 90,500 | | 7,432,765 |
American International Group, Inc. | 1,095,900 | | 71,967,753 |
Amlin PLC | 362,300 | | 983,810 |
AMP Ltd. | 36,300 | | 206,192 |
Baloise Holdings AG (Reg.) | 12,521 | | 576,903 |
Chaucer Holdings PLC | 293,200 | | 275,706 |
Hartford Financial Services Group, Inc. | 247,900 | | 17,181,949 |
MBIA, Inc. | 92,700 | | 5,866,056 |
MetLife, Inc. | 183,600 | | 7,437,636 |
Millea Holdings, Inc. | 42 | | 623,255 |
PartnerRe Ltd. | 39,300 | | 2,434,242 |
Ping An Insurance Co. Ltd. | 125,000 | | 212,279 |
Promina Group Ltd. | 85,837 | | 362,658 |
Prudential Financial, Inc. | 68,500 | | 3,764,760 |
QBE Insurance Group Ltd. | 29,432 | | 353,474 |
Skandia Foersaekrings AB | 129,800 | | 646,480 |
T&D Holdings, Inc. | 6,400 | | 306,160 |
| | 126,366,746 |
Real Estate - 0.1% |
CapitaLand Ltd. | 297,000 | | 387,605 |
China Overseas Land & Investment Ltd. | 488,000 | | 120,543 |
Henderson Land Development Co. Ltd. | 36,000 | | 187,114 |
Shun Tak Holdings Ltd. | 386,000 | | 424,596 |
Tokyu Land Corp. (d) | 55,000 | | 229,815 |
Wharf Holdings Ltd. | 65,000 | | 227,460 |
| | 1,577,133 |
Thrifts & Mortgage Finance - 2.7% |
Fannie Mae | 828,200 | | 58,976,122 |
MGIC Investment Corp. | 121,300 | | 8,358,783 |
New York Community Bancorp, Inc. | 186,000 | | 3,826,020 |
Sovereign Bancorp, Inc. | 1,700 | | 38,335 |
Washington Mutual, Inc. | 122,300 | | 5,170,844 |
| | 76,370,104 |
TOTAL FINANCIALS | | 378,224,403 |
HEALTH CARE - 8.5% |
Biotechnology - 0.0% |
Actelion Ltd. (Reg.) (a) | 6,741 | | 690,990 |
CSL Ltd. | 21,473 | | 491,414 |
|
| Shares | | Value (Note 1) |
Global Bio-Chem Technology Group Co. Ltd. | 424,000 | | $ 278,201 |
Global Bio-Chem Technology Group Co. Ltd. warrants 5/31/07 (a) | 25,250 | | 1,202 |
| | 1,461,807 |
Health Care Equipment & Supplies - 0.3% |
Axis Shield PLC (a) | 83,100 | | 389,114 |
Baxter International, Inc. | 138,100 | | 4,769,974 |
Coloplast AS Series B | 9,800 | | 537,136 |
Corin Group PLC | 53,400 | | 319,217 |
Medtronic, Inc. | 38,700 | | 1,922,229 |
Phonak Holding AG | 23,141 | | 761,585 |
ResMed, Inc. CHESS Depositary Interests (a) | 22,900 | | 115,923 |
Terumo Corp. | 8,800 | | 237,118 |
Thermo Electron Corp. (a) | 2,200 | | 66,418 |
| | 9,118,714 |
Health Care Providers & Services - 2.7% |
Cardinal Health, Inc. | 1,210,500 | | 70,390,575 |
DCA Group Ltd. | 119,415 | | 336,349 |
Henry Schein, Inc. (a) | 27,057 | | 1,884,249 |
Ramsay Health Care Ltd. | 28,200 | | 157,093 |
Service Corp. International (SCI) (a) | 99,729 | | 742,981 |
Sonic Healthcare Ltd. | 24,400 | | 232,523 |
UnitedHealth Group, Inc. | 15,800 | | 1,390,874 |
| | 75,134,644 |
Pharmaceuticals - 5.5% |
Barr Pharmaceuticals, Inc. (a) | 20,900 | | 951,786 |
Chugai Pharmaceutical Co. Ltd. | 18,500 | | 305,955 |
GlaxoSmithKline PLC sponsored ADR | 25,100 | | 1,189,489 |
Johnson & Johnson | 374,400 | | 23,744,448 |
Merck & Co., Inc. | 215,100 | | 6,913,314 |
Novo Nordisk AS Series B | 11,400 | | 621,712 |
Pfizer, Inc. | 2,020,700 | | 54,336,623 |
Roche Holding AG (participation certificate) | 13,174 | | 1,505,336 |
Sanofi-Aventis | 7,500 | | 600,750 |
Schering-Plough Corp. | 353,300 | | 7,376,904 |
Shire Pharmaceuticals Group PLC | 36,400 | | 387,660 |
Takeda Pharamaceutical Co. Ltd. | 10,100 | | 508,796 |
Tong Ren Tang Technologies Co. Ltd. (H Shares) | 65,000 | | 142,581 |
Wyeth | 1,301,100 | | 55,413,849 |
Yamanouchi Pharmaceutical Co. Ltd. | 17,400 | | 677,790 |
| | 154,676,993 |
TOTAL HEALTH CARE | | 240,392,158 |
INDUSTRIALS - 4.2% |
Aerospace & Defense - 0.5% |
BAE Systems PLC | 160,900 | | 711,727 |
Lockheed Martin Corp. | 78,100 | | 4,338,455 |
Common Stocks - continued |
| Shares | | Value (Note 1) |
INDUSTRIALS - continued |
Aerospace & Defense - continued |
Northrop Grumman Corp. | 59,000 | | $ 3,207,240 |
United Technologies Corp. | 64,800 | | 6,697,080 |
| | 14,954,502 |
Air Freight & Logistics - 0.1% |
Ryder System, Inc. | 16,100 | | 769,097 |
Yamato Transport Co. Ltd. | 34,000 | | 504,540 |
| | 1,273,637 |
Commercial Services & Supplies - 0.3% |
ABC Learning Centres Ltd. | 61,700 | | 265,990 |
Accord Customer Care Solutions Ltd. (a) | 530,000 | | 277,648 |
Aramark Corp. Class B | 68,100 | | 1,805,331 |
ChoicePoint, Inc. (a) | 91,233 | | 4,195,806 |
Diamond Lease Co. Ltd. | 5,900 | | 230,401 |
Downer EDI Ltd. | 96,900 | | 358,603 |
Fullcast Co. Ltd. | 94 | | 268,886 |
Riso Kyoiku Co. Ltd. | 309 | | 146,310 |
Societe Generale de Surveillance Holding SA (SGS) (Reg.) | 500 | | 349,511 |
Sumisho Lease Co. Ltd. | 3,900 | | 159,153 |
| | 8,057,639 |
Construction & Engineering - 0.1% |
Bilfinger & Berger Bau AG | 13,200 | | 541,670 |
Commuture Corp. | 9,000 | | 83,472 |
Hyundai Engineering & Construction Co. Ltd. (a) | 8,000 | | 120,170 |
Paul Y-ITC Construction Holdings Ltd. | 1,674,000 | | 424,272 |
United Group Ltd. | 78,400 | | 386,443 |
| | 1,556,027 |
Electrical Equipment - 0.0% |
ABB Ltd. (Reg.) (a) | 91,039 | | 507,348 |
Kumho Electric Co. Ltd. | 11,311 | | 345,274 |
Seoul Semiconductor Co. Ltd. | 9,059 | | 146,141 |
Sumitomo Electric Industries Ltd. | 17,000 | | 185,053 |
| | 1,183,816 |
Industrial Conglomerates - 2.6% |
General Electric Co. | 1,326,200 | | 48,406,300 |
Hutchison Whampoa Ltd. | 34,000 | | 318,225 |
Hutchison Whampoa Ltd. ADR | 4,600 | | 214,820 |
Keppel Corp. Ltd. | 40,000 | | 210,771 |
LG Corp. | 6,519 | | 106,425 |
Siemens AG: | | | |
(Reg.) | 6,900 | | 584,223 |
sponsored ADR | 1,700 | | 143,939 |
Tyco International Ltd. | 622,400 | | 22,244,576 |
| | 72,229,279 |
Machinery - 0.4% |
Bradken Ltd. | 64,800 | | 139,931 |
Hyflux Ltd. | 64,000 | | 116,463 |
Hyundai Mipo Dockyard Co. Ltd. (a) | 7,020 | | 237,345 |
|
| Shares | | Value (Note 1) |
Ingersoll-Rand Co. Ltd. Class A | 131,300 | | $ 10,543,390 |
Invensys PLC (a) | 1,705,800 | | 507,395 |
Koyo Seiko Co. Ltd. | 15,000 | | 211,169 |
| | 11,755,693 |
Marine - 0.0% |
Alexander & Baldwin, Inc. | 7,863 | | 333,548 |
Hanjin Shipping Co. Ltd. | 8,830 | | 204,714 |
| | 538,262 |
Road & Rail - 0.2% |
ComfortDelgro Corp. Ltd. | 212,000 | | 201,336 |
CSX Corp. | 42,700 | | 1,711,416 |
East Japan Railway Co. | 115 | | 639,949 |
Hamakyorex Co. Ltd. | 7,400 | | 334,492 |
Keio Electric Railway Co. Ltd. | 37,000 | | 217,095 |
Union Pacific Corp. | 24,200 | | 1,627,450 |
| | 4,731,738 |
Trading Companies & Distributors - 0.0% |
Mitsui & Co. Ltd. | 31,000 | | 278,131 |
Transportation Infrastructure - 0.0% |
Adsteam Marine Ltd. | 106,700 | | 132,737 |
ConnectEast Group | 287,133 | | 152,764 |
Cosco Pacific Ltd. | 152,000 | | 314,842 |
Macquarie Airports Fund | 164,000 | | 402,905 |
Macquarie Infrastructure Group | 50,900 | | 135,402 |
| | 1,138,650 |
TOTAL INDUSTRIALS | | 117,697,374 |
INFORMATION TECHNOLOGY - 7.7% |
Communications Equipment - 1.4% |
Alcatel SA (RFD) (a) | 22,900 | | 357,927 |
Cisco Systems, Inc. (a) | 1,219,300 | | 23,532,490 |
Comverse Technology, Inc. (a) | 130,700 | | 3,195,615 |
Motorola, Inc. | 539,400 | | 9,277,680 |
TANDBERG Television ASA (a) | 306,600 | | 2,665,757 |
Telefonaktiebolaget LM Ericsson (B Shares) (a) | 152,800 | | 481,167 |
| | 39,510,636 |
Computers & Peripherals - 1.2% |
ABIT Computer Corp. | 184,000 | | 0 |
Dell, Inc. (a) | 471,900 | | 19,885,866 |
Diebold, Inc. | 41,200 | | 2,296,076 |
Fujitsu Ltd. | 49,000 | | 319,076 |
Hewlett-Packard Co. | 456,200 | | 9,566,514 |
NEC Corp. | 13,000 | | 80,845 |
Solomon Systech Ltd. | 746,000 | | 184,273 |
Sun Microsystems, Inc. (a) | 172,200 | | 926,436 |
| | 33,259,086 |
Electronic Equipment & Instruments - 0.5% |
Flextronics International Ltd. (a) | 226,100 | | 3,124,702 |
Hon Hai Precision Industries Co. Ltd. | 13,049 | | 60,340 |
Hoya Corp. | 4,900 | | 553,480 |
Common Stocks - continued |
| Shares | | Value (Note 1) |
INFORMATION TECHNOLOGY - continued |
Electronic Equipment & Instruments - continued |
Interflex Co. Ltd. | 9,876 | | $ 165,522 |
Jabil Circuit, Inc. (a) | 122,500 | | 3,133,550 |
Jahwa Electronics Co. Ltd. | 10,310 | | 106,566 |
Kingboard Chemical Holdings Ltd. | 60,000 | | 126,981 |
Kingboard Chemical Holdings Ltd. warrants 12/31/06 (a) | 6,000 | | 3,184 |
Nidec Corp. | 800 | | 97,550 |
Nippon Chemi-con Corp. | 49,000 | | 268,369 |
Nippon Electric Glass Co. Ltd. | 23,000 | | 588,304 |
Sanmina-SCI Corp. (a) | 239,000 | | 2,024,330 |
Solectron Corp. (a) | 817,100 | | 4,355,143 |
| | 14,608,021 |
Internet Software & Services - 0.0% |
Easynet Group PLC (a) | 146,200 | | 293,191 |
Softbank Corp. | 7,700 | | 375,115 |
| | 668,306 |
IT Services - 0.4% |
Affiliated Computer Services, Inc. Class A (a) | 75,100 | | 4,520,269 |
First Data Corp. | 153,800 | | 6,542,652 |
Net One Systems Co. Ltd. | 27 | | 112,555 |
TIS, Inc. | 2,500 | | 109,587 |
| | 11,285,063 |
Office Electronics - 0.1% |
Canon, Inc. | 12,900 | | 699,954 |
Konica Minolta Holdings, Inc. | 38,500 | | 511,178 |
Ricoh Co. Ltd. | 27,000 | | 521,127 |
| | 1,732,259 |
Semiconductors & Semiconductor Equipment - 1.4% |
Analog Devices, Inc. | 21,500 | | 793,780 |
Applied Materials, Inc. (a) | 224,100 | | 3,832,110 |
Freescale Semiconductor, Inc. Class B | 60,165 | | 1,104,629 |
Intel Corp. | 883,400 | | 20,662,726 |
KLA-Tencor Corp. (a) | 59,000 | | 2,748,220 |
Lam Research Corp. (a) | 78,200 | | 2,260,762 |
Linear Technology Corp. | 21,100 | | 817,836 |
Novellus Systems, Inc. (a) | 49,300 | | 1,374,977 |
Taiwan Semiconductor Manufacturing Co. Ltd. sponsored ADR | 283,619 | | 2,407,925 |
United Microelectronics Corp. sponsored ADR | 523,231 | | 1,847,005 |
Xilinx, Inc. | 14,400 | | 426,960 |
| | 38,276,930 |
Software - 2.7% |
BEA Systems, Inc. (a) | 380,300 | | 3,369,458 |
Computer Associates International, Inc. | 6,989 | | 217,078 |
F-Secure Oyj (a) | 167,350 | | 410,904 |
Hitachi Software Engineerng Co. Ltd. | 1,100 | | 25,129 |
Intelligent Wave, Inc. | 37 | | 70,077 |
Microsoft Corp. | 2,510,792 | | 67,063,254 |
|
| Shares | | Value (Note 1) |
NCsoft Corp. (a) | 2,260 | | $ 182,948 |
NDS Group PLC sponsored ADR (a) | 22,700 | | 773,593 |
Nintendo Co. Ltd. | 1,700 | | 213,600 |
Oracle Corp. Japan | 2,000 | | 103,681 |
SAP AG | 3,600 | | 636,624 |
VERITAS Software Corp. (a) | 130,367 | | 3,721,978 |
| | 76,788,324 |
TOTAL INFORMATION TECHNOLOGY | | 216,128,625 |
MATERIALS - 0.6% |
Chemicals - 0.3% |
Akzo Nobel NV sponsored ADR | 12,600 | | 535,374 |
BASF AG | 11,900 | | 857,038 |
Bayer AG | 28,200 | | 958,236 |
Imperial Chemical Industries PLC | 117,300 | | 542,502 |
JSR Corp. | 8,500 | | 186,298 |
Kaneka Corp. | 25,000 | | 283,120 |
Kemira GrowHow Oyj | 111,800 | | 853,859 |
Nitto Denko Corp. | 10,100 | | 554,154 |
Praxair, Inc. | 40,800 | | 1,801,320 |
Rhodia SA (a)(d) | 170,100 | | 403,811 |
Syngenta AG (Switzerland) | 4,254 | | 450,992 |
Taiwan Fertilizer Co. Ltd. | 119,000 | | 129,893 |
Teijin Ltd. | 77,000 | | 334,521 |
| | 7,891,118 |
Containers & Packaging - 0.0% |
Amcor Ltd. | 21,500 | | 123,639 |
Fuji Seal International, Inc. | 5,800 | | 251,977 |
| | 375,616 |
Metals & Mining - 0.2% |
Alcan, Inc. | 99,700 | | 4,885,300 |
BHP Billiton Ltd. | 80,800 | | 970,408 |
BHP Billiton PLC | 60,500 | | 708,806 |
Hitachi Metals Ltd. | 9,000 | | 49,116 |
Newcrest Mining Ltd. | 30,400 | | 415,048 |
| | 7,028,678 |
Paper & Forest Products - 0.1% |
Bowater, Inc. | 27,700 | | 1,217,969 |
Carter Holt Harvey Ltd. | 62,175 | | 92,415 |
International Paper Co. | 21,600 | | 907,200 |
PaperlinX Ltd. | 67,100 | | 247,795 |
Yuen Foong Yu Paper Manufacturing Co. | 263,000 | | 144,778 |
| | 2,610,157 |
TOTAL MATERIALS | | 17,905,569 |
TELECOMMUNICATION SERVICES - 3.8% |
Diversified Telecommunication Services - 3.5% |
Belgacom SA | 17,500 | | 754,920 |
BellSouth Corp. | 392,400 | | 10,904,796 |
BT Group PLC | 300,600 | | 1,188,272 |
Common Stocks - continued |
| Shares | | Value (Note 1) |
TELECOMMUNICATION SERVICES - continued |
Diversified Telecommunication Services - continued |
Completel Europe NV (a) | 13,226 | | $ 507,751 |
Deutsche Telekom AG (Reg.) (a) | 34,200 | | 775,656 |
e.Biscom Spa (a) | 29,900 | | 1,722,213 |
France Telecom SA | 21,052 | | 696,400 |
Qwest Communications International, Inc. (a) | 1,933,400 | | 8,584,296 |
SBC Communications, Inc. | 2,201,400 | | 56,730,078 |
TDC AS | 21,700 | | 917,261 |
Telefonica SA sponsored ADR | 27,200 | | 1,536,800 |
Verizon Communications, Inc. | 352,800 | | 14,291,928 |
| | 98,610,371 |
Wireless Telecommunication Services - 0.3% |
Far EasTone Telecommunications Co. Ltd. | 282,250 | | 341,825 |
Millicom International Cellular SA unit (a) | 62,100 | | 1,387,621 |
Nextel Communications, Inc. Class A (a) | 160,900 | | 4,827,000 |
Vodafone Group PLC | 587,800 | | 1,609,396 |
| | 8,165,842 |
TOTAL TELECOMMUNICATION SERVICES | | 106,776,213 |
UTILITIES - 0.5% |
Electric Utilities - 0.5% |
Enel Spa | 42,800 | | 419,834 |
Entergy Corp. | 49,400 | | 3,338,946 |
FirstEnergy Corp. | 106,300 | | 4,199,913 |
Fortum Oyj | 27,600 | | 509,943 |
PG&E Corp. (a) | 159,200 | | 5,298,176 |
| | 13,766,812 |
Gas Utilities - 0.0% |
Hong Kong & China Gas Co. Ltd. | 109,000 | | 225,073 |
Multi-Utilities & Unregulated Power - 0.0% |
RWE AG | 5,600 | | 309,185 |
TOTAL UTILITIES | | 14,301,070 |
TOTAL COMMON STOCKS (Cost $1,248,448,050) | 1,439,377,968 |
Preferred Stocks - 0.1% |
| | | |
Convertible Preferred Stocks - 0.1% |
MATERIALS - 0.1% |
Paper & Forest Products - 0.1% |
International Paper Capital Trust 2.625% | 32,500 | | 1,628,900 |
|
| Shares | | Value (Note 1) |
TELECOMMUNICATION SERVICES - 0.0% |
Diversified Telecommunication Services - 0.0% |
Cincinnati Bell, Inc. Series B, 6.75% | 7,700 | | $ 313,775 |
TOTAL CONVERTIBLE PREFERRED STOCKS | | 1,942,675 |
Nonconvertible Preferred Stocks - 0.0% |
CONSUMER DISCRETIONARY - 0.0% |
Automobiles - 0.0% |
Porsche AG (non-vtg.) | 510 | | 324,819 |
Household Durables - 0.0% |
LG Electronics, Inc. | 2,930 | | 101,893 |
TOTAL CONSUMER DISCRETIONARY | | 426,712 |
HEALTH CARE - 0.0% |
Health Care Equipment & Supplies - 0.0% |
Fresenius AG | 900 | | 84,034 |
TOTAL NONCONVERTIBLE PREFERRED STOCKS | | 510,746 |
TOTAL PREFERRED STOCKS (Cost $2,331,352) | 2,453,421 |
Corporate Bonds - 4.7% |
| Principal
Amount | | |
Convertible Bonds - 0.4% |
CONSUMER DISCRETIONARY - 0.1% |
Specialty Retail - 0.1% |
Gap, Inc. 5.75% 3/15/09 (e) | | $ 1,214,000 | | 1,613,649 |
INDUSTRIALS - 0.3% |
Industrial Conglomerates - 0.3% |
Tyco International Group SA yankee 3.125% 1/15/23 | | 4,620,000 | | 7,771,764 |
INFORMATION TECHNOLOGY - 0.0% |
Communications Equipment - 0.0% |
CIENA Corp. 3.75% 2/1/08 | | 660,000 | | 585,750 |
TOTAL CONVERTIBLE BONDS | | 9,971,163 |
Nonconvertible Bonds - 4.3% |
CONSUMER DISCRETIONARY - 0.5% |
Auto Components - 0.1% |
DaimlerChrysler NA Holding Corp. 7.2% 9/1/09 | | 1,250,000 | | 1,391,270 |
Automobiles - 0.2% |
Ford Motor Co.: | | | | |
6.625% 10/1/28 | | 300,000 | | 279,824 |
7.45% 7/16/31 | | 1,440,000 | | 1,448,263 |
Corporate Bonds - continued |
| Principal
Amount | | Value
(Note 1) |
Nonconvertible Bonds - continued |
CONSUMER DISCRETIONARY - continued |
Automobiles - continued |
General Motors Corp.: | | | | |
8.25% 7/15/23 | | $ 2,320,000 | | $ 2,416,679 |
8.375% 7/15/33 | | 1,010,000 | | 1,046,444 |
| | 5,191,210 |
Media - 0.2% |
AOL Time Warner, Inc.: | | | | |
7.625% 4/15/31 | | 500,000 | | 604,881 |
7.7% 5/1/32 | | 1,500,000 | | 1,834,677 |
Cox Communications, Inc. 7.125% 10/1/12 | | 820,000 | | 919,107 |
Liberty Media Corp. 8.25% 2/1/30 | | 1,205,000 | | 1,370,159 |
News America, Inc. 6.2% 12/15/34 (e) | | 1,750,000 | | 1,773,655 |
| | 6,502,479 |
TOTAL CONSUMER DISCRETIONARY | | 13,084,959 |
CONSUMER STAPLES - 0.0% |
Tobacco - 0.0% |
Altria Group, Inc. 7% 11/4/13 | | 730,000 | | 790,991 |
ENERGY - 0.5% |
Energy Equipment & Services - 0.0% |
Petronas Capital Ltd. 7% 5/22/12 (e) | | 1,365,000 | | 1,563,647 |
Oil & Gas - 0.5% |
Amerada Hess Corp.: | | | | |
6.65% 8/15/11 | | 180,000 | | 197,942 |
7.125% 3/15/33 | | 460,000 | | 505,799 |
7.375% 10/1/09 | | 405,000 | | 452,483 |
Empresa Nacional de Petroleo 6.75% 11/15/12 (e) | | 940,000 | | 1,045,322 |
EnCana Holdings Finance Corp. 5.8% 5/1/14 | | 525,000 | | 559,696 |
Enterprise Products Operating LP: | | | | |
4.625% 10/15/09 (e) | | 270,000 | | 269,577 |
5.6% 10/15/14 (e) | | 190,000 | | 191,685 |
Kinder Morgan Energy Partners LP 7.125% 3/15/12 | | 790,000 | | 903,145 |
Pemex Project Funding Master Trust: | | | | |
6.125% 8/15/08 | | 2,770,000 | | 2,936,200 |
7.875% 2/1/09 (h) | | 3,000,000 | | 3,370,500 |
Ras Laffan Liquid Natural Gas Co. Ltd. yankee 8.294% 3/15/14 (e) | | 1,680,000 | | 1,985,066 |
|
| Principal
Amount | | Value
(Note 1) |
Williams Companies, Inc.: | | | | |
7.125% 9/1/11 | | $ 160,000 | | $ 174,800 |
7.5% 1/15/31 | | 635,000 | | 657,225 |
| | 13,249,440 |
TOTAL ENERGY | | 14,813,087 |
FINANCIALS - 1.6% |
Capital Markets - 0.4% |
Goldman Sachs Group, Inc. 6.6% 1/15/12 | | 4,075,000 | | 4,547,859 |
Merrill Lynch & Co., Inc.: | | | | |
4.125% 1/15/09 | | 2,500,000 | | 2,513,768 |
5% 1/15/15 | | 735,000 | | 732,120 |
Morgan Stanley: | | | | |
4.75% 4/1/14 | | 2,263,000 | | 2,205,085 |
6.6% 4/1/12 | | 1,750,000 | | 1,951,805 |
| | 11,950,637 |
Commercial Banks - 0.2% |
Bank of America Corp.: | | | | |
6.25% 4/15/12 | | 620,000 | | 684,730 |
7.4% 1/15/11 | | 1,165,000 | | 1,349,510 |
Fleet Financial Group, Inc. 7.125% 4/15/06 | | 1,190,000 | | 1,245,448 |
Korea Development Bank 3.875% 3/2/09 | | 2,000,000 | | 1,974,072 |
Wachovia Corp. 4.875% 2/15/14 | | 580,000 | | 578,073 |
Wells Fargo & Co. 4.2% 1/15/10 | | 335,000 | | 336,361 |
| | 6,168,194 |
Consumer Finance - 0.3% |
Capital One Bank 4.875% 5/15/08 | | 775,000 | | 795,939 |
Ford Motor Credit Co. 7.875% 6/15/10 | | 1,000,000 | | 1,101,760 |
General Motors Acceptance Corp. 6.875% 9/15/11 | | 1,240,000 | | 1,270,743 |
Household Finance Corp. 4.125% 11/16/09 | | 1,300,000 | | 1,293,010 |
Household International, Inc. 8.875% 2/15/08 | | 1,225,000 | | 1,296,764 |
MBNA America Bank NA 6.625% 6/15/12 | | 1,565,000 | | 1,725,979 |
MBNA Corp. 7.5% 3/15/12 | | 535,000 | | 618,084 |
| | 8,102,279 |
Diversified Financial Services - 0.3% |
Hutchison Whampoa International 03/13 Ltd. 6.5% 2/13/13 (e) | | 390,000 | | 420,301 |
Hutchison Whampoa International 03/33 Ltd.: | | | | |
6.25% 1/24/14 (e) | | 800,000 | | 842,481 |
7.45% 11/24/33 (e) | | 600,000 | | 665,033 |
J.P. Morgan Chase & Co. 6.75% 2/1/11 | | 4,605,000 | | 5,173,289 |
| | 7,101,104 |
Corporate Bonds - continued |
| Principal
Amount | | Value
(Note 1) |
Nonconvertible Bonds - continued |
FINANCIALS - continued |
Insurance - 0.0% |
Principal Life Global Funding I 6.25% 2/15/12 (e) | | $ 850,000 | | $ 929,145 |
Real Estate - 0.2% |
EOP Operating LP 4.65% 10/1/10 | | 3,340,000 | | 3,355,264 |
Regency Centers LP 6.75% 1/15/12 | | 1,990,000 | | 2,220,428 |
Simon Property Group LP 5.625% 8/15/14 (e) | | 1,325,000 | | 1,372,182 |
| | 6,947,874 |
Thrifts & Mortgage Finance - 0.2% |
Countrywide Home Loans, Inc. 4% 3/22/11 | | 1,630,000 | | 1,584,784 |
Independence Community Bank Corp. 3.75% 4/1/14 (h) | | 630,000 | | 607,275 |
Washington Mutual, Inc.: | | | | |
4.375% 1/15/08 | | 770,000 | | 782,007 |
4.625% 4/1/14 | | 1,255,000 | | 1,199,847 |
| | 4,173,913 |
TOTAL FINANCIALS | | 45,373,146 |
INDUSTRIALS - 0.1% |
Aerospace & Defense - 0.1% |
Bombardier, Inc.: | | | | |
6.3% 5/1/14 (e) | | 1,030,000 | | 893,525 |
7.45% 5/1/34 (e) | | 420,000 | | 358,050 |
Raytheon Co. 8.3% 3/1/10 | | 1,450,000 | | 1,718,240 |
| | 2,969,815 |
Airlines - 0.0% |
Delta Air Lines, Inc. pass thru trust certificates 7.57% 11/18/10 | | 605,000 | | 596,775 |
TOTAL INDUSTRIALS | | 3,566,590 |
MATERIALS - 0.1% |
Chemicals - 0.1% |
Lubrizol Corp.: | | | | |
4.625% 10/1/09 | | 495,000 | | 494,236 |
5.5% 10/1/14 | | 230,000 | | 231,355 |
6.5% 10/1/34 | | 420,000 | | 427,752 |
| | 1,153,343 |
Containers & Packaging - 0.0% |
Sealed Air Corp. 5.625% 7/15/13 (e) | | 245,000 | | 253,457 |
|
| Principal
Amount | | Value
(Note 1) |
Paper & Forest Products - 0.0% |
International Paper Co.: | | | | |
4.25% 1/15/09 | | $ 245,000 | | $ 245,897 |
5.5% 1/15/14 | | 615,000 | | 635,302 |
| | 881,199 |
TOTAL MATERIALS | | 2,287,999 |
TELECOMMUNICATION SERVICES - 0.7% |
Diversified Telecommunication Services - 0.6% |
AT&T Broadband Corp. 8.375% 3/15/13 | | 500,000 | | 616,548 |
Bellsouth Capital Funding Corp. 7.875% 2/15/30 | | 765,000 | | 952,840 |
BellSouth Corp. 5.2% 9/15/14 | | 750,000 | | 764,417 |
British Telecommunications PLC 8.875% 12/15/30 | | 1,500,000 | | 2,008,532 |
Deutsche Telekom International Finance BV 8.75% 6/15/30 | | 1,500,000 | | 1,980,687 |
France Telecom SA: | | | | |
8.5% 3/1/11 | | 300,000 | | 357,871 |
9.5% 3/1/31 | | 2,000,000 | | 2,711,184 |
SBC Communications, Inc.: | | | | |
6.15% 9/15/34 | | 1,000,000 | | 1,029,882 |
6.45% 6/15/34 | | 1,000,000 | | 1,071,367 |
Sprint Capital Corp. 6.875% 11/15/28 | | 1,245,000 | | 1,363,010 |
Telecom Italia Capital: | | | | |
4.95% 9/30/14 (e) | | 705,000 | | 690,716 |
5.25% 11/15/13 | | 1,700,000 | | 1,718,250 |
Telefonica Europe BV 7.75% 9/15/10 | | 795,000 | | 932,289 |
Verizon Global Funding Corp.: | | | | |
7.25% 12/1/10 | | 1,290,000 | | 1,477,936 |
7.75% 12/1/30 | | 720,000 | | 895,195 |
| | 18,570,724 |
Wireless Telecommunication Services - 0.1% |
America Movil SA de CV: | | | | |
4.125% 3/1/09 | | 650,000 | | 640,339 |
5.5% 3/1/14 | | 585,000 | | 577,924 |
AT&T Wireless Services, Inc. 7.875% 3/1/11 | | 400,000 | | 471,447 |
| | 1,689,710 |
TOTAL TELECOMMUNICATION SERVICES | | 20,260,434 |
UTILITIES - 0.8% |
Electric Utilities - 0.5% |
Cleveland Electric Illuminating Co. 5.65% 12/15/13 | | 1,205,000 | | 1,249,720 |
DTE Energy Co. 7.05% 6/1/11 | | 650,000 | | 736,027 |
Duke Capital LLC: | | | | |
4.37% 3/1/09 | | 3,175,000 | | 3,195,650 |
6.75% 2/15/32 | | 100,000 | | 108,821 |
Corporate Bonds - continued |
| Principal
Amount | | Value
(Note 1) |
Nonconvertible Bonds - continued |
UTILITIES - continued |
Electric Utilities - continued |
Exelon Corp. 6.75% 5/1/11 | | $ 1,500,000 | | $ 1,677,936 |
FirstEnergy Corp. 6.45% 11/15/11 | | 285,000 | | 309,644 |
Illinois Power Co. 7.5% 6/15/09 | | 1,915,000 | | 2,159,873 |
MidAmerican Energy Holdings, Inc. 5.875% 10/1/12 | | 1,500,000 | | 1,589,462 |
Progress Energy, Inc. 7.1% 3/1/11 | | 2,745,000 | | 3,086,047 |
| | 14,113,180 |
Gas Utilities - 0.1% |
NiSource Finance Corp. 7.875% 11/15/10 | | 1,455,000 | | 1,710,467 |
Multi-Utilities & Unregulated Power - 0.2% |
Constellation Energy Group, Inc. 7% 4/1/12 | | 2,250,000 | | 2,564,663 |
Dominion Resources, Inc.: | | | | |
6.25% 6/30/12 | | 1,000,000 | | 1,091,789 |
8.125% 6/15/10 | | 2,515,000 | | 2,960,235 |
| | 6,616,687 |
TOTAL UTILITIES | | 22,440,334 |
TOTAL NONCONVERTIBLE BONDS | | 122,617,540 |
TOTAL CORPORATE BONDS (Cost $122,949,706) | 132,588,703 |
U.S. Government and Government Agency Obligations - 7.5% |
|
U.S. Government Agency Obligations - 1.8% |
Fannie Mae: | | | | |
2.5% 6/15/06 | | 4,570,000 | | 4,529,656 |
3.25% 8/15/08 | | 820,000 | | 809,192 |
3.25% 2/15/09 | | 1,800,000 | | 1,764,999 |
5.5% 3/15/11 | | 3,605,000 | | 3,865,825 |
6.25% 2/1/11 | | 3,505,000 | | 3,842,584 |
Farm Credit Systems Financial Assistance Corp. 8.8% 6/10/05 | | 2,000,000 | | 2,053,476 |
Freddie Mac: | | | | |
3.625% 9/15/08 | | 2,661,000 | | 2,661,915 |
4% 6/12/13 | | 11,318,000 | | 10,809,675 |
5% 7/15/14 | | 9,400,000 | | 9,709,570 |
|
| Principal
Amount | | Value
(Note 1) |
5.875% 3/21/11 | | $ 7,760,000 | | $ 8,378,076 |
U.S. Department of Housing and Urban Development Government guaranteed participation certificates Series 1996-A, 7.63% 8/1/14 | | 2,825,000 | | 2,897,317 |
TOTAL U.S. GOVERNMENT AGENCY OBLIGATIONS | | 51,322,285 |
U.S. Treasury Inflation Protected Obligations - 0.9% |
U.S. Treasury Inflation-Indexed Bonds 2.375% 1/15/25 | | 6,075,480 | | 6,496,729 |
U.S. Treasury Inflation-Indexed Notes: | | | | |
0.875% 4/15/10 | | 6,045,060 | | 5,986,260 |
2% 1/15/14 | | 12,395,760 | | 12,829,612 |
TOTAL U.S. TREASURY INFLATION PROTECTED
OBLIGATIONS | | 25,312,601 |
U.S. Treasury Obligations - 4.8% |
U.S. Treasury Bills, yield at date of purchase 1.83% to 2.21% 1/20/05 to 3/10/05 (g) | | 6,800,000 | | 6,779,581 |
U.S. Treasury Bonds: | | | | |
5.375% 2/15/31 | | 1,300,000 | | 1,405,726 |
6.25% 5/15/30 | | 9,360,000 | | 11,190,685 |
U.S. Treasury Notes: | | | | |
1.625% 2/28/06 | | 19,580,000 | | 19,314,593 |
3.125% 5/15/07 | | 22,390,000 | | 22,378,626 |
4.75% 5/15/14 | | 6,990,000 | | 7,284,342 |
6.5% 2/15/10 | | 42,705,000 | | 48,348,380 |
7% 7/15/06 | | 17,000,000 | | 18,023,978 |
TOTAL U.S. TREASURY OBLIGATIONS | | 134,725,911 |
TOTAL U.S. GOVERNMENT AND GOVERNMENT AGENCY OBLIGATIONS (Cost $209,838,295) | 211,360,797 |
U.S. Government Agency - Mortgage
Securities - 8.1% |
|
Fannie Mae - 7.6% |
3.827% 12/1/34 (h) | | 25,000 | | 25,055 |
3.836% 6/1/33 (h) | | 102,129 | | 102,208 |
3.941% 10/1/34 (h) | | 171,803 | | 173,030 |
4% 6/1/19 | | 7,807,901 | | 7,626,912 |
4.021% 12/1/34 (h) | | 125,000 | | 125,742 |
4.037% 12/1/34 (h) | | 74,474 | | 75,093 |
4.048% 1/1/35 (h) | | 100,000 | | 100,727 |
4.072% 12/1/34 (h) | | 225,000 | | 226,758 |
4.105% 1/1/35 (h) | | 250,000 | | 249,047 |
4.17% 11/1/34 (h) | | 224,985 | | 226,203 |
4.324% 12/1/34 (h) | | 74,998 | | 76,215 |
4.5% 4/1/19 to 10/1/33 | | 39,823,387 | | 39,186,637 |
U.S. Government Agency - Mortgage
Securities - continued |
| Principal
Amount | | Value
(Note 1) |
Fannie Mae - continued |
4.549% 8/1/34 (h) | | $ 303,317 | | $ 310,441 |
5% 2/1/18 to 9/1/34 | | 30,032,564 | | 30,193,153 |
5.5% 12/1/18 to 10/1/34 | | 72,353,550 | | 73,610,541 |
5.5% 1/1/20 (f) | | 976,429 | | 1,008,773 |
5.5% 1/1/35 (f) | | 6,000,000 | | 6,084,375 |
6% 6/1/13 to 1/1/34 | | 18,711,580 | | 19,538,605 |
6.5% 9/1/08 to 9/1/32 | | 22,834,398 | | 24,051,210 |
7% 8/1/13 to 2/1/32 | | 6,781,022 | | 7,213,112 |
7.5% 7/1/16 to 11/1/31 | | 2,676,549 | | 2,870,986 |
8% 1/1/30 to 6/1/30 | | 232,284 | | 251,824 |
TOTAL FANNIE MAE | | 213,326,647 |
Freddie Mac - 0.0% |
4.985% 8/1/33 (h) | | 100,000 | | 102,711 |
7.5% 5/1/17 to 11/1/31 | | 969,986 | | 1,041,153 |
8% 7/1/17 to 5/1/27 | | 76,259 | | 82,917 |
TOTAL FREDDIE MAC | | 1,226,781 |
Government National Mortgage Association - 0.5% |
6% 12/15/08 to 6/15/09 | | 488,867 | | 512,240 |
6.5% 6/15/08 to 8/15/27 | | 5,770,247 | | 6,096,254 |
7% 7/15/28 to 7/15/32 | | 3,573,710 | | 3,801,168 |
7.5% 9/15/22 to 8/15/28 | | 1,932,392 | | 2,082,895 |
8% 5/15/25 to 1/15/31 | | 545,053 | | 591,770 |
8.5% 12/15/16 to 12/15/30 | | 276,268 | | 301,590 |
TOTAL GOVERNMENT NATIONAL MORTGAGE
ASSOCIATION | | 13,385,917 |
TOTAL U.S. GOVERNMENT AGENCY - MORTGAGE SECURITIES (Cost $223,440,950) | 227,939,345 |
Asset-Backed Securities - 0.5% |
|
ACE Securities Corp. Series 2004-HE1: | | | | |
Class M1, 2.9175% 2/25/34 (h) | | 250,000 | | 250,042 |
Class M2, 3.5175% 2/25/34 (h) | | 300,000 | | 300,106 |
Ameriquest Mortgage Securities, Inc. Series 2004-R2: | | | | |
Class M1, 2.8475% 4/25/34 (h) | | 145,000 | | 145,002 |
Class M2, 2.8975% 4/25/34 (h) | | 125,000 | | 125,002 |
Amortizing Residential Collateral Trust Series 2003-BC1 Class M2, 3.5175% 1/25/32 (h) | | 305,000 | | 306,260 |
Argent Securities, Inc. Series 2004-W5 Class M1, 3.0175% 4/25/34 (h) | | 475,000 | | 475,631 |
|
| Principal
Amount | | Value
(Note 1) |
Asset Backed Securities Corp. Home Equity Loan Trust Series 2004-HE3: | | | | |
Class M1, 2.9575% 6/25/34 (h) | | $ 175,000 | | $ 175,068 |
Class M2, 3.5375% 6/25/34 (h) | | 400,000 | | 400,147 |
Capital One Multi-Asset Execution Trust: | | | | |
Series 2003-B4 Class B4, 3.2025% 7/15/11 (h) | | 780,000 | | 794,213 |
Series 2004-6 Class B, 4.15% 7/16/12 | | 1,295,000 | | 1,293,616 |
CDC Mortgage Capital Trust Series 2004-HE2 Class M2, 3.6175% 7/26/34 (h) | | 265,000 | | 265,004 |
Citibank Credit Card Issuance Trust Series 2002-C1 Class C1, 3.2% 2/9/09 (h) | | 1,750,000 | | 1,773,355 |
Countrywide Home Loans, Inc.: | | | | |
Series 2004-2 Class M1, 2.9175% 5/25/34 (h) | | 625,000 | | 625,010 |
Series 2004-3 Class M1, 2.9175% 6/25/34 (h) | | 175,000 | | 175,180 |
Series 2004-4: | | | | |
Class A, 2.7875% 8/25/34 (h) | | 506,149 | | 505,976 |
Class M1, 2.8975% 7/25/34 (h) | | 450,000 | | 450,950 |
Class M2, 2.9475% 6/25/34 (h) | | 525,000 | | 526,254 |
Discover Card Master Trust I Series 2003-4 Class B1, 2.7325% 5/16/11 (h) | | 1,015,000 | | 1,020,410 |
First Franklin Mortgage Loan Trust Series 2004-FF2: | | | | |
Class M3, 2.9675% 3/25/34 (h) | | 50,000 | | 50,001 |
Class M4, 3.3175% 3/25/34 (h) | | 25,000 | | 25,000 |
Class M6, 3.6675% 3/25/34 (h) | | 50,000 | | 50,052 |
Fremont Home Loan Trust Series 2004-A: | | | | |
Class M1, 2.9675% 1/25/34 (h) | | 550,000 | | 550,009 |
Class M2, 3.5675% 1/25/34 (h) | | 625,000 | | 625,010 |
GSAMP Trust Series 2004-FM2: | | | | |
Class M1, 2.9175% 1/25/34 (h) | | 500,000 | | 500,008 |
Class M2, 3.5175% 1/25/34 (h) | | 200,000 | | 200,003 |
Class M3, 3.7175% 1/25/34 (h) | | 200,000 | | 200,003 |
Home Equity Asset Trust Series 2002-4 Class M2, 4.4675% 3/25/33 (h) | | 225,000 | | 228,341 |
Long Beach Mortgage Loan Trust Series 2004-2: | | | | |
Class M1, 2.9475% 6/25/34 (h) | | 500,000 | | 499,603 |
Class M2, 3.4975% 6/25/34 (h) | | 325,000 | | 326,684 |
Meritage Mortgage Loan Trust Series 2004-1: | | | | |
Class M1, 2.9175% 7/25/34 (h) | | 250,000 | | 250,004 |
Class M2, 2.9675% 7/25/34 (h) | | 50,000 | | 50,001 |
Class M3, 3.3675% 7/25/34 (h) | | 100,000 | | 100,002 |
Class M4, 3.5175% 7/25/34 (h) | | 75,000 | | 75,001 |
Asset-Backed Securities - continued |
| Principal
Amount | | Value
(Note 1) |
Morgan Stanley ABS Capital I, Inc.: | | | | |
Series 2003-HE1 Class M2, 4.3175% 5/25/33 (h) | | $ 175,000 | | $ 177,446 |
Series 2003-NC5 Class M2, 4.4175% 4/25/33 (h) | | 325,000 | | 331,004 |
Morgan Stanley Dean Witter Capital I Trust Series 2003-NC1 Class M1, 3.4675% 11/25/32 (h) | | 305,000 | | 308,242 |
Structured Asset Securities Corp. Series 2004-GEL1 Class A, 2.7775% 2/25/34 (h) | | 175,194 | | 175,197 |
TOTAL ASSET-BACKED SECURITIES (Cost $14,301,255) | 14,328,837 |
Collateralized Mortgage Obligations - 0.4% |
|
Private Sponsor - 0.1% |
CS First Boston Mortgage Securities Corp. floater: | | | | |
Series 2004-AR3 Class 6A2, 2.7875% 4/25/34 (h) | | 445,400 | | 446,057 |
Series 2004-AR5 Class 11A2, 2.7875% 6/25/34 (h) | | 578,575 | | 577,342 |
Master Alternative Loan Trust Series 2004-3 Class 3A1, 6% 4/25/34 | | 223,817 | | 229,132 |
Residential Asset Mortgage Products, Inc. sequential pay Series 2004-SL2 Class A1, 6.5% 10/25/16 | | 247,583 | | 254,314 |
TOTAL PRIVATE SPONSOR | | 1,506,845 |
U.S. Government Agency - 0.3% |
Fannie Mae planned amortization class: | | | | |
Series 1999-54 Class PH, 6.5% 11/18/29 | | 3,300,000 | | 3,500,943 |
Series 1999-57 Class PH, 6.5% 12/25/29 | | 2,600,000 | | 2,745,310 |
Fannie Mae guaranteed REMIC pass thru certificates planned amortization class Series 2004-81 Class KD, 4.5% 4/25/17 | | 2,390,000 | | 2,404,427 |
TOTAL U.S. GOVERNMENT AGENCY | | 8,650,680 |
TOTAL COLLATERALIZED MORTGAGE OBLIGATIONS (Cost $9,259,818) | 10,157,525 |
Commercial Mortgage Securities - 1.5% |
|
Bayview Commercial Asset Trust floater: | | | | |
Series 2004-1: | | | | |
Class A, 2.7775% 4/25/34 (e)(h) | | 836,820 | | 834,270 |
Class B, 4.3175% 4/25/34 (e)(h) | | 92,980 | | 92,824 |
Class M1, 2.9775% 4/25/34 (e)(h) | | 92,980 | | 92,809 |
Class M2, 3.6175% 4/25/34 (e)(h) | | 92,980 | | 92,940 |
Series 2004-3: | | | | |
Class A1, 2.7675% 1/25/35 (e)(h) | | 798,629 | | 798,629 |
Class A2, 2.8175% 1/25/35 (e)(h) | | 99,829 | | 99,829 |
Class M1, 2.8975% 1/25/35 (e)(h) | | 149,743 | | 149,743 |
Class M2, 3.3975% 1/25/35 (e)(h) | | 99,829 | | 99,829 |
CBM Funding Corp. sequential pay Series 1996-1: | | | | |
Class A3PI, 7.08% 11/1/07 | | 1,743,730 | | 1,828,476 |
Class B, 7.48% 2/1/08 | | 2,320,000 | | 2,529,665 |
COMM: | | | | |
floater: | | | | |
Series 2002-FL7 Class D, 2.9725% 11/15/14 (e)(h) | | 295,000 | | 295,795 |
Series 2003-FL9 Class B, 2.9025% 11/15/15 (e)(h) | | 547,788 | | 549,423 |
Series 2004-LBN2 Class X2, 1.2743% 3/10/39 (e)(h)(i) | | 2,029,801 | | 86,554 |
CS First Boston Mortgage Securities Corp.: | | | | |
sequential pay: | | | | |
Series 1999-C1 Class A2, 7.29% 9/15/41 | | 1,500,000 | | 1,683,938 |
Series 2004-C1 Class A3, 4.321% 1/15/37 | | 615,000 | | 611,295 |
Series 1998-C1 Class D, 7.17% 5/17/40 | | 580,000 | | 649,729 |
Series 2004-C1 Class ASP, 1.0446% 1/15/37 (e)(h)(i) | | 9,980,000 | | 399,141 |
Deutsche Mortgage & Asset Receiving Corp. sequential pay Series 1998-C1 Class D, 7.231% 6/15/31 | | 4,350,000 | | 4,784,712 |
Equitable Life Assurance Society of the United States Series 174: | | | | |
Class B1, 7.33% 5/15/06 (e) | | 3,500,000 | | 3,669,059 |
Class C1, 7.52% 5/15/06 (e) | | 2,300,000 | | 2,414,420 |
Class D1, 7.77% 5/15/06 (e) | | 2,200,000 | | 2,302,590 |
Fannie Mae sequential pay Series 1999-10 Class MZ, 6.5% 9/17/38 | | 1,590,934 | | 1,685,028 |
GS Mortgage Securities Corp. II: | | | | |
sequential pay Series 2001-LIBA Class A2, 6.615% 2/14/16 (e) | | 695,000 | | 765,446 |
Commercial Mortgage Securities - continued |
| Principal
Amount | | Value
(Note 1) |
GS Mortgage Securities Corp. II: - continued | | | | |
Series 1998-GLII Class E, 7.1905% 4/13/31 (h) | | $ 1,205,000 | | $ 1,264,813 |
Leafs CMBS I Ltd./Leafs CMBS I Corp. Series 2002-1A: | | | | |
Class B, 4.13% 11/20/37 (e) | | 1,050,000 | | 1,002,996 |
Class C, 4.13% 11/20/37 (e) | | 1,050,000 | | 958,125 |
Morgan Stanley Capital I, Inc. sequential pay Series 2004-HQ3 Class A2, 4.05% 1/13/41 | | 630,000 | | 625,305 |
Thirteen Affiliates of General Growth Properties, Inc.: | | | | |
sequential pay Series 1 Class A2, 6.602% 11/15/07 (e) | | 4,200,000 | | 4,472,481 |
Series 1: | | | | |
Class D2, 6.992% 11/15/07 (e) | | 4,120,000 | | 4,434,792 |
Class E2, 7.224% 11/15/07 (e) | | 2,450,000 | | 2,626,022 |
Wachovia Bank Commercial Mortgage Trust sequential pay Series 2003-C6 Class A2, 4.498% 8/15/35 | | 1,015,000 | | 1,029,444 |
TOTAL COMMERCIAL MORTGAGE SECURITIES (Cost $40,912,220) | 42,930,122 |
Foreign Government and Government Agency Obligations - 0.2% |
|
Chilean Republic: | | | | |
5.625% 7/23/07 | | 1,630,000 | | 1,706,406 |
7.125% 1/11/12 | | 650,000 | | 746,281 |
Korean Republic 4.875% 9/22/14 | | 700,000 | | 692,379 |
State of Israel 4.625% 6/15/13 | | 230,000 | | 219,794 |
United Mexican States: | | | | |
5.875% 1/15/14 | | 610,000 | | 624,945 |
7.5% 4/8/33 | | 2,350,000 | | 2,538,000 |
TOTAL FOREIGN GOVERNMENT AND GOVERNMENT AGENCY OBLIGATIONS (Cost $6,088,552) | 6,527,805 |
Fixed-Income Funds - 5.9% |
| | Shares | | |
Fidelity Floating Rate Central Investment Portfolio (b) | | 142,657 | | 14,250,008 |
Fidelity High Income Central Investment Portfolio 1 (b) | | 1,496,200 | | 150,547,682 |
TOTAL FIXED-INCOME FUNDS (Cost $153,982,737) | | 164,797,690 |
Money Market Funds - 20.2% |
| | Shares | | Value (Note 1) |
Fidelity Cash Central Fund, 2.24% (b) | | 442,529,237 | | $ 442,529,237 |
Fidelity Money Market Central Fund, 2.22% (b) | | 123,860,162 | | 123,860,162 |
Fidelity Securities Lending Cash Central Fund, 2.23% (b)(c) | | 3,836,100 | | 3,836,100 |
TOTAL MONEY MARKET FUNDS (Cost $570,225,499) | | 570,225,499 |
TOTAL INVESTMENT
PORTFOLIO - 100.1% (Cost $2,601,778,434) | | | 2,822,687,712 |
NET OTHER ASSETS - (0.1)% | | | (1,713,006) |
NET ASSETS - 100% | | $ 2,820,974,706 |
Futures Contracts |
| Expiration
Date | | Underlying
Face Amount
at Value | | Unrealized
Appreciation/
(Depreciation) |
Purchased |
Equity Index Contracts |
395 S&P 500 Index Contracts | March 2005 | | $ 119,852,875 | | $ 815,884 |
The face value of futures purchased as a percentage of net assets - 4.2% |
Swap Agreements |
| | | Notional
Amount | | Value |
Interest Rate Swap |
Receive quarterly a fixed rate equal to 3.524% and pay quarterly a floating rate based on 3-month LIBOR with Morgan Stanley, Inc. | May 2007 | | $ 14,900,000 | | $ 22,334 |
Swap Agreements - continued |
| | | Notional
Amount | | Value |
Total Return Swap |
Receive monthly a return equal to Lehman Brothers for CMBS AAA 8.5+ Index and pay monthly a floating rate based on 1-month LIBOR minus 40 basis points with Lehman Brothers, Inc. | April 2005 | | $ 2,500,000 | | $ 25,857 |
Receive quarterly a return equal to Banc of America Securities LLC AAA 10Yr Commercial Mortgage-Backed Securities Daily Index and pay quarterly a floating rate based on 3-month LIBOR minus 72 basis points with Bank of America | Jan. 2005 | | 2,500,000 | | (8,676) |
Receive quarterly a return equal to that of Banc of America Securities LLC AAA 10Yr Commercial Mortgage Backed Securities Daily Index and pay quarterly a floating rate based on 3-month LIBOR minus 30 basis points with Bank of America | May 2005 | | 2,500,000 | | (2,782) |
Receive quarterly a return equal to that of Banc of America Securities LLC AAA 10Yr Commercial Mortgage-Backed Securities Daily Index and pay quarterly a floating rate based on 3-month LIBOR minus 27 basis points with Bank of America | June 2005 | | 2,500,000 | | 33,269 |
TOTAL TOTAL RETURN SWAPS | | 10,000,000 | | 47,670 |
| | $ 24,900,000 | | $ 70,002 |
Legend |
(a) Non-income producing |
(b) Affiliated fund that is available only to investment companies and other accounts managed by Fidelity Investments. The rates quoted for Money Market Funds are the annualized seven-day yield of the funds at period end. A complete listing of each fund's holdings as of its most recent fiscal year end is available upon request. |
(c) Includes investment made with cash collateral received from securities on loan. |
(d) Security or a portion of the security is on loan at period end. |
(e) Security exempt from registration under Rule 144A of the Securities Act of 1933. These securities may be resold in transactions exempt from registration, normally to qualified institutional buyers. At the period end, the value of these securities amounted to $41,105,208 or 1.5% of net assets. |
(f) Security or a portion of the security purchased on a delayed delivery or when-issued basis. |
(g) Security or a portion of the security was pledged to cover margin requirements for futures contracts. At the period end, the value of securities pledged amounted to $6,779,581. |
(h) The coupon rate shown on floating or adjustable rate securities represents the rate at period end. |
(i) Security represents right to receive monthly interest payments on an underlying pool of mortgages. Principal shown is the par amount of the mortgage pool. |
Other Information |
The composition of credit quality ratings as a percentage of net assets is as follows (ratings are unaudited): |
U.S. Government and U.S. Government Agency Obligations | 15.8% |
AAA, AA, A | 2.6% |
BBB | 4.2% |
BB | 2.0% |
B | 2.8% |
CCC, CC, C | 0.7% |
Not Rated | 0.3% |
Other Investments | 0.0% |
Equities | 55.3% |
Short-Term Investments and Net Other Assets | 16.3% |
| 100.0% |
We have used ratings from Moody's Investors Services, Inc. Where Moody's ratings are not available, we have used S&P ratings. Percentages are adjusted for the effect of futures contracts, if applicable. |
The information in the above table is based on the combined investments of the fund and its pro-rata share of the investments of Fidelity's fixed-income central funds. |
Income Tax Information |
At December 31, 2004, the fund had a capital loss carryforward of approximately $169,228,000 of which $94,606,000, $33,904,000 and $40,718,000 will expire on December 31, 2009, 2010 and 2011, respectively. |
See accompanying notes which are an integral part of the financial statements.
Annual Report
Fidelity Variable Insurance Products: Asset Manager Portfolio
Financial Statements
Statement of Assets and Liabilities
December 31, 2004 |
| | |
Assets | | |
Investment in securities, at value (including securities loaned of $3,740,989) (cost $2,601,778,434) - See accompanying schedule | | $ 2,822,687,712 |
Cash | | 101,094 |
Foreign currency held at value (cost $1,769,693) | | 1,863,876 |
Receivable for investments sold | | 3,763,867 |
Receivable for fund shares sold | | 433,148 |
Dividends receivable | | 1,531,913 |
Interest receivable | | 8,159,830 |
Swap agreements, at value | | 70,002 |
Prepaid expenses | | 11,031 |
Other affiliated receivables | | 20,779 |
Other receivables | | 66,083 |
Total assets | | 2,838,709,335 |
Liabilities | | |
Payable for investments purchased
Regular delivery | $ 2,505,482 | |
Delayed delivery | 7,119,958 | |
Payable for fund shares redeemed | 2,255,870 | |
Accrued management fee | 1,228,673 | |
Distribution fees payable | 10,154 | |
Payable for daily variation on futures contracts | 98,750 | |
Other affiliated payables | 332,770 | |
Other payables and accrued expenses | 346,872 | |
Collateral on securities loaned, at value | 3,836,100 | |
Total liabilities | | 17,734,629 |
Net Assets | | $ 2,820,974,706 |
Net Assets consist of: | | |
Paid in capital | | $ 2,705,402,110 |
Undistributed net investment income | | 75,292,815 |
Accumulated undistributed net realized gain (loss) on investments and foreign currency transactions | | (181,610,482) |
Net unrealized appreciation (depreciation) on investments and assets and liabilities in foreign currencies | | 221,890,263 |
Net Assets | | $ 2,820,974,706 |
Initial Class:
Net Asset Value, offering price and redemption price per share ($2,751,093,961 ÷ 185,310,323 shares) | | $ 14.85 |
Service Class:
Net Asset Value, offering price and redemption price per share ($33,117,654 ÷ 2,245,860 shares) | | $ 14.75 |
Service Class 2:
Net Asset Value, offering price and redemption price per share ($36,763,091 ÷ 2,510,405 shares) | | $ 14.64 |
Statement of Operations
Year ended December 31, 2004 |
| | |
Investment Income | | |
Dividends | | $ 24,564,893 |
Special Dividends | | 7,532,376 |
Interest | | 59,893,575 |
Security lending | | 43,187 |
Total income | | 92,034,031 |
| | |
Expenses | | |
Management fee | $ 15,228,347 | |
Transfer agent fees | 1,937,089 | |
Distribution fees | 101,698 | |
Accounting and security lending fees | 1,165,808 | |
Non-interested trustees' compensation | 16,074 | |
Appreciation in deferred trustee compensation account | 5,876 | |
Custodian fees and expenses | 223,949 | |
Audit | 61,090 | |
Legal | 15,600 | |
Miscellaneous | 414,429 | |
Total expenses before reductions | 19,169,960 | |
Expense reductions | (238,955) | 18,931,005 |
Net investment income (loss) | | 73,103,026 |
Realized and Unrealized Gain (Loss) Net realized gain (loss) on: | | |
Investment securities | 64,290,412 | |
Foreign currency transactions | (157,622) | |
Futures contracts | 11,752,551 | |
Swap agreements | 593,284 | |
Total net realized gain (loss) | | 76,478,625 |
Change in net unrealized appreciation (depreciation) on: Investment securities | 2,622,778 | |
Assets and liabilities in foreign currencies | 97,880 | |
Futures contracts | (1,965,782) | |
Swap agreements | (176,130) | |
Delayed delivery commitments | (1,380) | |
Total change in net unrealized appreciation (depreciation) | | 577,366 |
Net gain (loss) | | 77,055,991 |
Net increase (decrease) in net assets resulting from operations | | $ 150,159,017 |
See accompanying notes which are an integral part of the financial statements.
Annual Report
Statement of Changes in Net Assets
| Year ended
December 31,
2004 | Year ended
December 31,
2003 |
Increase (Decrease) in Net Assets | | |
Operations | | |
Net investment income (loss) | $ 73,103,026 | $ 78,176,621 |
Net realized gain (loss) | 76,478,625 | (40,714,310) |
Change in net unrealized appreciation (depreciation) | 577,366 | 441,444,012 |
Net increase (decrease) in net assets resulting from operations | 150,159,017 | 478,906,323 |
Distributions to shareholders from net investment income | (81,683,788) | (104,597,799) |
Share transactions - net increase (decrease) | (313,880,450) | (134,932,020) |
Total increase (decrease) in net assets | (245,405,221) | 239,376,504 |
| | |
Net Assets | | |
Beginning of period | 3,066,379,927 | 2,827,003,423 |
End of period (including undistributed net investment income of $75,292,815 and undistributed net investment income of $85,502,782, respectively) | $ 2,820,974,706 | $ 3,066,379,927 |
Other Information: | | | |
Share Transactions | Year ended December 31, 2004 |
Shares | Initial Class | Service Class | Service Class 2 |
Sold | 8,726,898 | 845,301 | 1,250,787 |
Reinvested | 5,552,576 | 60,513 | 40,552 |
Redeemed | (37,314,309) | (893,122) | (354,143) |
Net increase (decrease) | (23,034,835) | 12,692 | 937,196 |
| | | |
Dollars Sold | $ 124,852,377 | $ 12,068,224 | $ 17,624,320 |
Reinvested | 80,234,728 | 869,573 | 579,487 |
Redeemed | (532,488,555) | (12,617,698) | (5,002,906) |
Net increase (decrease) | $ (327,401,450) | $ 320,099 | $ 13,200,901 |
Share Transactions | Year ended December 31, 2003 |
Shares | Initial Class | Service Class | Service Class 2 |
Sold | 11,779,012 | 428,403 | 476,542 |
Reinvested | 8,641,306 | 77,907 | 49,303 |
Redeemed | (30,580,450) | (301,785) | (252,268) |
Net increase (decrease) | (10,160,132) | 204,525 | 273,577 |
| | | |
Dollars Sold | $ 156,744,839 | $ 5,650,186 | $ 6,262,526 |
Reinvested | 103,090,780 | 924,754 | 582,265 |
Redeemed | (400,951,959) | (3,964,032) | (3,271,379) |
Net increase (decrease) | $ (141,116,340) | $ 2,610,908 | $ 3,573,412 |
Distributions | Year ended December 31, 2004 |
| Initial Class | Service Class | Service Class 2 |
From net investment income | $ 80,234,728 | $ 869,573 | $ 579,487 |
| Year ended December 31, 2003 |
| Initial Class | Service Class | Service Class 2 |
From net investment income | $ 103,090,780 | $ 924,754 | $ 582,265 |
See accompanying notes which are an integral part of the financial statements.
Asset Manager Portfolio
Financial Highlights - Initial Class
Years ended December 31, | 2004 | 2003 | 2002 | 2001 | 2000 |
Selected Per-Share Data | | | | | |
Net asset value, beginning of period | $ 14.46 | $ 12.75 | $ 14.51 | $ 16.01 | $ 18.67 |
Income from Investment Operations | | | | | |
Net investment income (loss) C | .36 D | .36 | .46 | .51 | .62 |
Net realized and unrealized gain (loss) | .42 | 1.83 | (1.69) | (1.13) | (1.30) |
Total from investment operations | .78 | 2.19 | (1.23) | (.62) | (.68) |
Distributions from net investment income | (.39) | (.48) | (.53) | (.64) | (.60) |
Distributions from net realized gain | - | - | - | (.24) | (1.38) |
Total distributions | (.39) | (.48) | (.53) | (.88) | (1.98) |
Net asset value, end of period | $ 14.85 | $ 14.46 | $ 12.75 | $ 14.51 | $ 16.01 |
Total Return A, B | 5.47% | 17.97% | (8.73)% | (4.15)% | (3.87)% |
Ratios to Average Net Assets E | | | | | |
Expenses before expense reductions | .66% | .63% | .63% | .64% | .61% |
Expenses net of voluntary waivers, if any | .66% | .63% | .63% | .64% | .61% |
Expenses net of all reductions | .65% | .62% | .61% | .63% | .61% |
Net investment income (loss) | 2.53% | 2.71% | 3.49% | 3.53% | 3.73% |
Supplemental Data | | | | | |
Net assets, end of period (000 omitted) | $ 2,751,094 | $ 3,011,837 | $ 2,784,945 | $ 3,547,730 | $ 4,128,169 |
Portfolio turnover rate | 66% | 82% | 140% | 108% | 76% |
A Total returns do not reflect charges attributable to your insurance company's separate account. Inclusion of these charges would reduce the total returns shown.
B Total returns would have been lower had certain expenses not been reduced during the periods shown.
C Calculated based on average shares outstanding during the period.
D Investment income per share reflects a special dividend which amounted to $.04 per share.
E Expense ratios reflect operating expenses of the class. Expenses before reductions do not reflect amounts reimbursed by the investment adviser or reductions from brokerage service arrangements or other expense offset arrangements and do not represent the amount paid by the class during periods when reimbursements or reductions occur. Expenses net of any voluntary waivers reflect expenses after reimbursement by the investment adviser but prior to reductions from brokerage service arrangements or other expense offset arrangements. Expenses net of all reductions represent the net expenses paid by the class.
Financial Highlights - Service Class
Years ended December 31, | 2004 | 2003 | 2002 | 2001 | 2000 |
Selected Per-Share Data | | | | | |
Net asset value, beginning of period | $ 14.37 | $ 12.66 | $ 14.41 | $ 15.91 | $ 18.59 |
Income from Investment Operations | | | | | |
Net investment income (loss) C | .34 D | .34 | .44 | .49 | .60 |
Net realized and unrealized gain (loss) | .42 | 1.83 | (1.68) | (1.12) | (1.31) |
Total from investment operations | .76 | 2.17 | (1.24) | (.63) | (.71) |
Distributions from net investment income | (.38) | (.46) | (.51) | (.63) | (.59) |
Distributions from net realized gain | - | - | - | (.24) | (1.38) |
Total distributions | (.38) | (.46) | (.51) | (.87) | (1.97) |
Net asset value, end of period | $ 14.75 | $ 14.37 | $ 12.66 | $ 14.41 | $ 15.91 |
Total Return A, B | 5.36% | 17.91% | (8.85)% | (4.24)% | (4.06)% |
Ratios to Average Net Assets E | | | | | |
Expenses before expense reductions | .77% | .74% | .74% | .74% | .72% |
Expenses net of voluntary waivers, if any | .77% | .74% | .74% | .74% | .72% |
Expenses net of all reductions | .76% | .73% | .72% | .73% | .71% |
Net investment income (loss) | 2.41% | 2.59% | 3.38% | 3.43% | 3.62% |
Supplemental Data | | | | | |
Net assets, end of period (000 omitted) | $ 33,118 | $ 32,087 | $ 25,692 | $ 31,324 | $ 30,583 |
Portfolio turnover rate | 66% | 82% | 140% | 108% | 76% |
A Total returns do not reflect charges attributable to your insurance company's separate account. Inclusion of these charges would reduce the total returns shown.
B Total returns would have been lower had certain expenses not been reduced during the periods shown.
C Calculated based on average shares outstanding during the period.
D Investment income per share reflects a special dividend which amounted to $.04 per share.
E Expense ratios reflect operating expenses of the class. Expenses before reductions do not reflect amounts reimbursed by the investment adviser or reductions from brokerage service arrangements or other expense offset arrangements and do not represent the amount paid by the class during periods when reimbursements or reductions occur. Expenses net of any voluntary waivers reflect expenses after reimbursement by the investment adviser but prior to reductions from brokerage service arrangements or other expense offset arrangements. Expenses net of all reductions represent the net expenses paid by the class.
See accompanying notes which are an integral part of the financial statements.
Annual Report
Financial Highlights - Service Class 2
Years ended December 31, | 2004 | 2003 | 2002 | 2001 | 2000 G |
Selected Per-Share Data | | | | | |
Net asset value, beginning of period | $ 14.27 | $ 12.59 | $ 14.36 | $ 15.89 | $ 18.17 |
Income from Investment Operations | | | | | |
Net investment income (loss) E | .32 F | .32 | .41 | .46 | .53 |
Net realized and unrealized gain (loss) | .41 | 1.81 | (1.67) | (1.11) | (.84) |
Total from investment operations | .73 | 2.13 | (1.26) | (.65) | (.31) |
Distributions from net investment income | (.36) | (.45) | (.51) | (.64) | (.59) |
Distributions from net realized gain | - | - | - | (.24) | (1.38) |
Total distributions | (.36) | (.45) | (.51) | (.88) | (1.97) |
Net asset value, end of period | $ 14.64 | $ 14.27 | $ 12.59 | $ 14.36 | $ 15.89 |
Total Return B, C, D | 5.18% | 17.66% | (9.03)% | (4.38)% | (1.97)% |
Ratios to Average Net Assets H | | | | | |
Expenses before expense reductions | .93% | .91% | .90% | .90% | .88% A |
Expenses net of voluntary waivers, if any | .93% | .91% | .90% | .90% | .88% A |
Expenses net of all reductions | .92% | .89% | .88% | .89% | .88% A |
Net investment income (loss) | 2.25% | 2.43% | 3.22% | 3.27% | 3.46% A |
Supplemental Data | | | | | |
Net assets, end of period (000 omitted) | $ 36,763 | $ 22,456 | $ 16,367 | $ 11,993 | $ 4,785 |
Portfolio turnover rate | 66% | 82% | 140% | 108% | 76% |
A Annualized
B Total returns for periods of less than one year are not annualized.
C Total returns do not reflect charges attributable to your insurance company's separate account. Inclusion of these charges would reduce the total returns shown.
D Total returns would have been lower had certain expenses not been reduced during the periods shown.
E Calculated based on average shares outstanding during the period.
F Investment income per share reflects a special dividend which amounted to $.04 per share.
G For the period January 12, 2000 (commencement of sale of shares) to December 31, 2000.
H Expense ratios reflect operating expenses of the class. Expenses before reductions do not reflect amounts reimbursed by the investment adviser or reductions from brokerage service arrangements or other expense offset arrangements and do not represent the amount paid by the class during periods when reimbursements or reductions occur. Expense ratios before reductions for start-up periods may not be representative of longer-term operating periods. Expenses net of any voluntary waivers reflect expenses after reimbursement by the investment adviser but prior to reductions from brokerage service arrangements or other expense offset arrangements. Expenses net of all reductions represent the net expenses paid by the class.
See accompanying notes which are an integral part of the financial statements.
Asset Manager Portfolio
Fidelity Variable Insurance Products: Contrafund Portfolio
Performance: The Bottom Line
Average annual total return reflects the change in the value of an investment, assuming reinvestment of a class' dividend income and capital gains (the profits earned upon the sale of securities that have grown in value) and assuming a constant rate of performance each year. During periods of reimbursement by Fidelity, a fund's total return will be greater than it would be had the reimbursement not occurred. Performance numbers are net of all underlying fund operating expenses, but do not include any insurance charges imposed by your insurance company's separate account. If performance information included the effect of these additional charges, the total returns would have been lower. How a fund did yesterday is no guarantee of how it will do tomorrow.
Average Annual Total Returns
Periods ended December 31, 2004 | Past 1
year | Past 5
years | Life of
fundA |
Fidelity® VIP: Contrafund - Initial Class | 15.48% | 1.96% | 14.11% |
Fidelity VIP: Contrafund - Service ClassB | 15.34% | 1.85% | 14.03% |
Fidelity VIP: Contrafund - Service Class 2C | 15.16% | 1.71% | 13.94% |
A From January 3, 1995
B The initial offering of Service Class shares took place on November 3, 1997. Performance for Service Class shares reflects an asset-based service fee (12b-1 fee), and returns prior to November 3, 1997 are those of Initial Class and do not include the effects of Service Class' 12b-1 fee. Had Service Class shares' 12b-1 fee been reflected, returns prior to November 3, 1997 would have been lower.
C The initial offering of Service Class 2 shares took place on January 12, 2000. Performance for Service Class 2 shares reflects an asset-based service fee (12b-1 fee). Returns from November 3, 1997 through January 12, 2000 are those of Service Class which reflect a different 12b-1 fee. Service Class 2 returns prior to November 3, 1997 are those of Initial Class, and do not include the effects of a 12b-1 fee. Had Service Class 2's 12b-1 fee been reflected, returns prior to January 12, 2000 would have been lower.
$10,000 Over Life of Fund
Let's say hypothetically that $10,000 was invested in Fidelity® Variable Insurance Products: Contrafund Portfolio - Initial Class on January 3, 1995, when the fund started. The chart shows how the value of your investment would have changed, and also shows how the Standard & Poor's 500SM Index performed over the same period.
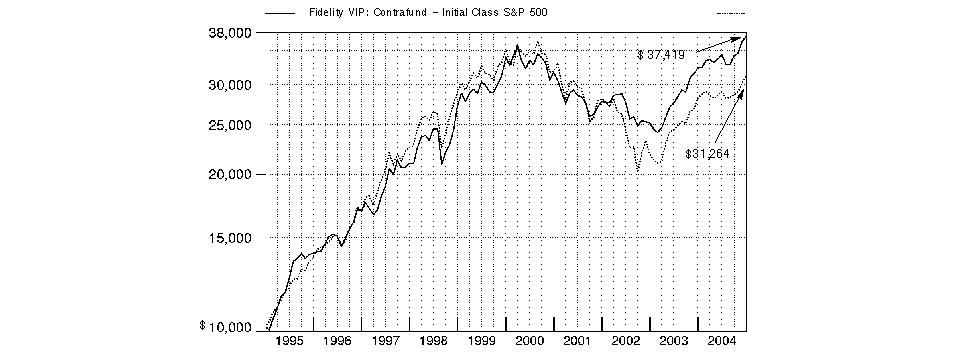
Annual Report
Fidelity Variable Insurance Products: Contrafund Portfolio
Management's Discussion of Fund Performance
Comments from Will Danoff, Portfolio Manager of Fidelity® Variable Insurance Products: Contrafund Portfolio
The year ending December 31, 2004, generally was positive for equity investors, as many stock market benchmarks produced double-digit gains. Broad-based themes included the continued dominance of small-cap stocks, which outperformed large-caps for the sixth consecutive year. The small-cap Russell 2000® Index was up 18.33% in 2004, while the larger-cap Standard & Poor's 500SM Index rose 10.88%. Value stocks ended the year well ahead of growth stocks: The Russell 3000® Value Index advanced 16.94%, compared to 6.93% for the Russell 3000 Growth Index. Energy and basic materials stocks led the market upward. Energy stocks were boosted by record-high oil prices, while strong demand from China helped support commodity prices. The health care sector was among the market's weakest performers. Technology also fell off the pace, though it was helped by a rally late in the year. The tech-heavy NASDAQ Composite® Index returned 9.15%, thanks primarily to a 14.87% jump in the fourth quarter. Elsewhere, the Dow Jones Industrial AverageSM gained 5.37% for the year.
For the 12 months ending December 31, 2004, the fund outpaced both the S&P 500® and the LipperSM Variable Annuity Growth Funds Average, which gained 10.36%. Strong individual security selection within both the technology and telecommunication services sectors helped overall performance, as did the fund's continued emphasis on small- and mid-cap stocks, which outperformed their larger counterparts in 2004. At the end of the period, the fund held approximately 36% of its assets in stocks of companies with market capitalizations of less than $10 billion, compared to 12% for the S&P 500. The fund's best individual performers included Internet stalwarts such as Google, Yahoo! and eBay, all of which appreciated more than 65% in 2004. Within telecommunications, the fund's positions in Research In Motion, which makes the BlackBerry portable e-mail device, and America Movil, a leading wireless services provider in Latin America, also fared well. Disappointments included Ireland-based Ryanair, Europe's leading discount airline, which fell in value as the carrier's profits were squeezed by higher oil prices and intense competition. Profit pressures also hurt the fund's positions in Krispy Kreme Doughnuts, semiconductor maker Silicon Laboratories and discount retailer 99 Cents Only Stores.
The views expressed in this statement reflect those of the portfolio manager only through the end of the period of the report as stated on the cover and do not necessarily represent the views of Fidelity or any other person in the Fidelity organization. Any such views are subject to change at any time based upon market or other conditions and Fidelity disclaims any responsibility to update such views. These views may not be relied on as investment advice and, because investment decisions for a Fidelity fund are based on numerous factors, may not be relied on as an indication of trading intent on behalf of any Fidelity fund.
Annual Report
Fidelity Variable Insurance Products: Contrafund Portfolio
Investment Summary
Top Five Stocks as of December 31, 2004 |
| % of fund's
net assets |
Berkshire Hathaway, Inc. Class A | 2.6 |
3M Co. | 2.4 |
Avon Products, Inc. | 2.3 |
EnCana Corp. | 2.2 |
Yahoo!, Inc. | 1.9 |
| 11.4 |
Top Five Market Sectors as of December 31, 2004 |
| % of fund's
net assets |
Information Technology | 15.0 |
Financials | 12.6 |
Industrials | 12.2 |
Health Care | 11.3 |
Consumer Discretionary | 11.1 |
Asset Allocation as of December 31, 2004 |
% of fund's net assets * |
| Stocks | 90.0% | |
| Bonds | 1.6% | |
| Short-Term Investments and Net Other Assets | 8.4% | |
* Foreign investments 25.1% | |

Annual Report
Fidelity Variable Insurance Products: Contrafund Portfolio
Investments December 31, 2004
Showing Percentage of Net Assets
Common Stocks - 90.0% |
| Shares | | Value (Note 1) |
CONSUMER DISCRETIONARY - 11.1% |
Automobiles - 0.6% |
Honda Motor Co. Ltd. | 90,200 | | $ 4,701,224 |
Toyota Motor Corp. | 1,603,700 | | 65,647,461 |
| | 70,348,685 |
Hotels, Restaurants & Leisure - 2.7% |
Ambassadors Group, Inc. | 364,604 | | 12,983,548 |
Aristocrat Leisure Ltd. | 1,683,867 | | 13,108,703 |
Boyd Gaming Corp. | 388,000 | | 16,160,200 |
Ctrip.com International Ltd. ADR | 55,100 | | 2,535,702 |
Domino's Pizza, Inc. | 353,500 | | 6,292,300 |
Four Seasons Hotels, Inc. (ltd. vtg.) (d) | 203,100 | | 16,605,118 |
Friendly Ice Cream Corp. (a) | 204,600 | | 1,718,640 |
Gaylord Entertainment Co. (a) | 52,827 | | 2,193,905 |
Great Canadian Gaming Corp. (a) | 78,900 | | 2,992,283 |
Greek Organization of Football Prognostics SA | 112,516 | | 3,107,620 |
Hilton Group PLC | 1,795,398 | | 9,802,330 |
International Game Technology | 189,350 | | 6,509,853 |
Kerzner International Ltd. (a) | 175,900 | | 10,562,795 |
Krispy Kreme Doughnuts, Inc. (a)(d) | 312,100 | | 3,932,460 |
Life Time Fitness, Inc. | 125,800 | | 3,255,704 |
Marriott International, Inc. Class A | 169,700 | | 10,687,706 |
P.F. Chang's China Bistro, Inc. (a) | 145,500 | | 8,198,925 |
Panera Bread Co. Class A (a)(d) | 519,296 | | 20,938,015 |
Penn National Gaming, Inc. (a) | 131,431 | | 7,958,147 |
Pinnacle Entertainment, Inc. (a) | 44,800 | | 886,144 |
Red Robin Gourmet Burgers, Inc. (a) | 330,986 | | 17,697,821 |
Ryan's Restaurant Group, Inc. (a) | 282,750 | | 4,360,005 |
Scientific Games Corp. Class A (a) | 116,900 | | 2,786,896 |
Shuffle Master, Inc. (a)(d) | 403,989 | | 19,027,882 |
Starbucks Corp. (a) | 716,800 | | 44,699,648 |
Station Casinos, Inc. | 812,500 | | 44,427,500 |
The Cheesecake Factory, Inc. (a) | 245,436 | | 7,969,307 |
William Hill PLC | 2,355,742 | | 25,497,237 |
Wynn Resorts Ltd. (a) | 392,746 | | 26,282,562 |
| | 353,178,956 |
Household Durables - 1.4% |
Black & Decker Corp. | 33,600 | | 2,967,888 |
Blount International, Inc. (a) | 421,300 | | 7,339,046 |
Blyth, Inc. | 69,000 | | 2,039,640 |
Centex Corp. | 45,000 | | 2,681,100 |
D.R. Horton, Inc. | 795,277 | | 32,057,616 |
Desarrolladora Homex SA de CV ADR (d) | 112,500 | | 2,660,625 |
Fortune Brands, Inc. | 275,900 | | 21,293,962 |
Harman International Industries, Inc. | 390,700 | | 49,618,900 |
Hovnanian Enterprises, Inc. Class A (a) | 117,900 | | 5,838,408 |
KB Home | 68,300 | | 7,130,520 |
Leggett & Platt, Inc. | 180,100 | | 5,120,243 |
Mohawk Industries, Inc. (a) | 102,600 | | 9,362,250 |
Pulte Homes, Inc. | 6,700 | | 427,460 |
Ryland Group, Inc. | 40,600 | | 2,336,124 |
|
| Shares | | Value (Note 1) |
Sharp Corp. | 316,000 | | $ 5,161,261 |
Tempur-Pedic International, Inc. | 368,300 | | 7,807,960 |
Toll Brothers, Inc. (a) | 235,100 | | 16,130,211 |
| | 179,973,214 |
Internet & Catalog Retail - 1.2% |
eBay, Inc. (a) | 1,230,900 | | 143,129,052 |
IAC/InterActiveCorp (a) | 349,767 | | 9,660,565 |
| | 152,789,617 |
Media - 1.3% |
Central European Media Enterprises Ltd. Class A (a) | 65,200 | | 2,541,626 |
Citadel Broadcasting Corp. (a) | 100,500 | | 1,626,090 |
EchoStar Communications Corp. Class A | 67,400 | | 2,240,376 |
Fox Entertainment Group, Inc. Class A (a) | 453,500 | | 14,176,410 |
Getty Images, Inc. (a) | 214,400 | | 14,761,440 |
Lakes Entertainment, Inc. (a) | 163,100 | | 2,656,899 |
McGraw-Hill Companies, Inc. | 8,900 | | 814,706 |
Omnicom Group, Inc. | 27,200 | | 2,293,504 |
Pixar (a) | 474,553 | | 40,626,482 |
SBS Broadcasting SA (a) | 338,400 | | 13,613,832 |
Sirius Satellite Radio, Inc. (a)(d) | 270,100 | | 2,066,265 |
Spanish Broadcasting System, Inc. Class A (a) | 2,682 | | 28,322 |
Univision Communications, Inc. Class A (a) | 163,600 | | 4,788,572 |
Vivendi Universal SA sponsored ADR (a) | 50,400 | | 1,616,328 |
Walt Disney Co. | 180,800 | | 5,026,240 |
Washington Post Co. Class B | 20,100 | | 19,758,702 |
XM Satellite Radio Holdings, Inc. Class A (a) | 1,060,257 | | 39,886,868 |
| | 168,522,662 |
Multiline Retail - 0.4% |
99 Cents Only Stores (a)(d) | 106,666 | | 1,723,723 |
JCPenney Co., Inc. | 175,900 | | 7,282,260 |
Neiman Marcus Group, Inc. Class A | 218,800 | | 15,652,952 |
Next PLC | 276,200 | | 8,745,687 |
Nordstrom, Inc. | 157,500 | | 7,359,975 |
Target Corp. | 269,700 | | 14,005,521 |
| | 54,770,118 |
Specialty Retail - 2.4% |
Advance Auto Parts, Inc. (a) | 100,100 | | 4,372,368 |
bebe Stores, Inc. | 101,250 | | 2,731,725 |
Bed Bath & Beyond, Inc. (a) | 767,100 | | 30,553,593 |
Build-A-Bear Workshop, Inc. | 166,000 | | 5,834,900 |
Chico's FAS, Inc. (a) | 742,400 | | 33,801,472 |
Genesco, Inc. (a) | 90,000 | | 2,802,600 |
Guitar Center, Inc. (a) | 161,300 | | 8,498,897 |
Halfords Group PLC | 943,366 | | 5,612,136 |
Hennes & Mauritz AB (H&M) (B Shares) | 379,275 | | 13,211,677 |
Inditex SA | 146,100 | | 4,300,765 |
Lowe's Companies, Inc. | 92,600 | | 5,332,834 |
New York & Co., Inc. | 182,100 | | 3,008,292 |
Pacific Sunwear of California, Inc. (a) | 479,572 | | 10,675,273 |
Common Stocks - continued |
| Shares | | Value (Note 1) |
CONSUMER DISCRETIONARY - continued |
Specialty Retail - continued |
PETCO Animal Supplies, Inc. (a) | 693,200 | | $ 27,367,536 |
PETsMART, Inc. | 999,900 | | 35,526,447 |
Regis Corp. | 141,400 | | 6,525,610 |
Sherwin-Williams Co. | 45,700 | | 2,039,591 |
Signet Group PLC | 2,348,926 | | 4,958,477 |
Staples, Inc. | 1,087,100 | | 36,646,141 |
The Pantry, Inc. (a) | 59,466 | | 1,789,332 |
TJX Companies, Inc. | 1,032,200 | | 25,939,186 |
Too, Inc. (a) | 158,400 | | 3,874,464 |
United Auto Group, Inc. | 52,600 | | 1,556,434 |
Urban Outfitters, Inc. (a) | 667,900 | | 29,654,760 |
| | 306,614,510 |
Textiles, Apparel & Luxury Goods - 1.1% |
Burberry Group PLC | 3,022,995 | | 23,263,127 |
Carter's, Inc. (a) | 86,000 | | 2,923,140 |
Coach, Inc. (a) | 1,266,324 | | 71,420,674 |
Delta Woodside Industries, Inc. (a) | 22,175 | | 13,970 |
Fossil, Inc. (a) | 220,000 | | 5,640,800 |
Hartmarx Corp. (a) | 80,200 | | 623,154 |
NIKE, Inc. Class B | 116,200 | | 10,538,178 |
Polo Ralph Lauren Corp. Class A | 116,300 | | 4,954,380 |
Puma AG | 38,742 | | 10,631,970 |
Quiksilver, Inc. (a) | 210,000 | | 6,255,900 |
Wolverine World Wide, Inc. | 26,800 | | 842,056 |
| | 137,107,349 |
TOTAL CONSUMER DISCRETIONARY | | 1,423,305,111 |
CONSUMER STAPLES - 6.0% |
Beverages - 0.1% |
Anheuser-Busch Companies, Inc. | 105,900 | | 5,372,307 |
Cott Corp. (a) | 20,000 | | 494,667 |
PepsiCo, Inc. | 210,410 | | 10,983,402 |
| | 16,850,376 |
Food & Staples Retailing - 1.6% |
Alimentation Couche-Tard, Inc. Class B (sub. vtg.) (a) | 112,700 | | 3,334,042 |
CVS Corp. | 45,000 | | 2,028,150 |
Sysco Corp. | 2,220,800 | | 84,767,936 |
Tesco PLC | 3,397,590 | | 20,978,567 |
United Natural Foods, Inc. (a) | 332,952 | | 10,354,807 |
Wal-Mart de Mexico SA de CV Series V | 1,349,700 | | 4,638,827 |
Wal-Mart Stores, Inc. | 168,500 | | 8,900,170 |
Walgreen Co. | 67,000 | | 2,570,790 |
Whole Foods Market, Inc. | 449,407 | | 42,850,957 |
William Morrison Supermarkets PLC | 5,674,750 | | 22,542,567 |
| | 202,966,813 |
Food Products - 0.5% |
Hershey Foods Corp. | 460,700 | | 25,587,278 |
|
| Shares | | Value (Note 1) |
Kellogg Co. | 536,100 | | $ 23,942,226 |
Wm. Wrigley Jr. Co. | 275,400 | | 19,054,926 |
| | 68,584,430 |
Household Products - 0.6% |
Colgate-Palmolive Co. | 1,441,500 | | 73,747,140 |
Personal Products - 3.2% |
Avon Products, Inc. | 7,577,456 | | 293,247,547 |
Gillette Co. | 2,615,600 | | 117,126,568 |
| | 410,374,115 |
TOTAL CONSUMER STAPLES | | 772,522,874 |
ENERGY - 9.0% |
Energy Equipment & Services - 0.7% |
BJ Services Co. | 94,000 | | 4,374,760 |
Noble Corp. (a) | 12,200 | | 606,828 |
Offshore Logistics, Inc. (a) | 14,100 | | 457,827 |
Oil States International, Inc. (a) | 146,300 | | 2,822,127 |
Schlumberger Ltd. (NY Shares) | 862,000 | | 57,710,900 |
Smith International, Inc. (a) | 456,575 | | 24,842,246 |
Superior Energy Services, Inc. (a) | 112,600 | | 1,735,166 |
Tenaris SA sponsored ADR | 75,700 | | 3,701,730 |
| | 96,251,584 |
Oil & Gas - 8.3% |
Anadarko Petroleum Corp. | 84,600 | | 5,482,926 |
Apache Corp. | 783,980 | | 39,645,869 |
Ashland, Inc. | 165,300 | | 9,650,214 |
Bill Barrett Corp. | 57,500 | | 1,839,425 |
Blackrock Ventures, Inc. (a) | 959,200 | | 5,875,100 |
BP PLC sponsored ADR | 2,035,232 | | 118,857,549 |
Burlington Resources, Inc. | 901,380 | | 39,210,030 |
Chesapeake Energy Corp. | 1,336,000 | | 22,044,000 |
China Petroleum & Chemical Corp. sponsored ADR (d) | 524,740 | | 21,509,093 |
Denbury Resources, Inc. (a) | 44,800 | | 1,229,760 |
EnCana Corp. | 5,028,492 | | 286,624,044 |
Encore Acquisition Co. (a) | 278,800 | | 9,732,908 |
ENI Spa sponsored ADR | 67,400 | | 8,481,616 |
EOG Resources, Inc. | 190,700 | | 13,608,352 |
Exxon Mobil Corp. | 1,971,400 | | 101,053,964 |
Houston Exploration Co. (a) | 214,300 | | 12,067,233 |
Imperial Oil Ltd. | 66,800 | | 3,960,683 |
Marathon Oil Corp. | 137,000 | | 5,152,570 |
McMoRan Exploration Co. (a)(d) | 180,800 | | 3,380,960 |
Murphy Oil Corp. | 971,500 | | 78,157,175 |
Noble Energy, Inc. | 122,000 | | 7,522,520 |
Occidental Petroleum Corp. | 416,600 | | 24,312,776 |
Patina Oil & Gas Corp. | 185,300 | | 6,948,750 |
PetroChina Co. Ltd. sponsored ADR (d) | 173,600 | | 9,320,584 |
PetroKazakhstan, Inc. Class A | 182,960 | | 6,789,341 |
Premcor, Inc. | 1,892,826 | | 79,820,472 |
Quicksilver Resources, Inc. (a) | 307,400 | | 11,306,172 |
Range Resources Corp. | 243,300 | | 4,977,918 |
Common Stocks - continued |
| Shares | | Value (Note 1) |
ENERGY - continued |
Oil & Gas - continued |
Talisman Energy, Inc. | 256,610 | | $ 6,917,778 |
Teekay Shipping Corp. | 67,600 | | 2,846,636 |
Total SA sponsored ADR | 576,900 | | 63,366,696 |
Unocal Corp. (d) | 161,700 | | 6,991,908 |
Valero Energy Corp. | 412,900 | | 18,745,660 |
Whiting Petroleum Corp. New (a) | 133,100 | | 4,026,275 |
XTO Energy, Inc. | 769,425 | | 27,222,257 |
| | 1,068,679,214 |
TOTAL ENERGY | | 1,164,930,798 |
FINANCIALS - 12.6% |
Capital Markets - 0.4% |
Calamos Asset Management, Inc. Class A | 64,000 | | 1,728,000 |
Goldman Sachs Group, Inc. | 92,300 | | 9,602,892 |
Legg Mason, Inc. | 119,700 | | 8,769,222 |
Lehman Brothers Holdings, Inc. | 224,100 | | 19,604,268 |
Merrill Lynch & Co., Inc. | 157,700 | | 9,425,729 |
SEI Investments Co. | 39,400 | | 1,652,042 |
| | 50,782,153 |
Commercial Banks - 1.5% |
BOK Financial Corp. (a) | 50,510 | | 2,462,868 |
East West Bancorp, Inc. | 147,700 | | 6,197,492 |
Hibernia Corp. Class A | 73,913 | | 2,181,173 |
HSBC Holdings PLC sponsored ADR | 260,917 | | 22,214,473 |
M&T Bank Corp. | 510,200 | | 55,019,968 |
Nara Bancorp, Inc. | 45,000 | | 957,150 |
PrivateBancorp, Inc. | 30,600 | | 986,238 |
Royal Bank of Scotland Group PLC | 231,395 | | 7,779,906 |
Southwest Bancorp of Texas, Inc. | 22,600 | | 526,354 |
Texas Capital Bancshares, Inc. (a) | 6,600 | | 142,692 |
UCBH Holdings, Inc. | 166,430 | | 7,625,823 |
Wachovia Corp. | 557,749 | | 29,337,597 |
Wells Fargo & Co. | 780,200 | | 48,489,430 |
Westcorp | 144,320 | | 6,628,618 |
Wintrust Financial Corp. | 105,700 | | 6,020,672 |
| | 196,570,454 |
Consumer Finance - 1.1% |
First Marblehead Corp. (a) | 109,100 | | 6,136,875 |
MBNA Corp. | 877,900 | | 24,748,001 |
SLM Corp. | 1,960,300 | | 104,660,417 |
| | 135,545,293 |
Diversified Financial Services - 0.6% |
Brascan Corp. Class A (ltd. vtg.) | 243,900 | | 8,770,238 |
CapitalSource, Inc. (a) | 234,300 | | 6,014,481 |
Citigroup, Inc. | 3,500 | | 168,630 |
|
| Shares | | Value (Note 1) |
KKR Financial Corp. (e) | 564,000 | | $ 5,922,000 |
Moody's Corp. | 674,200 | | 58,554,270 |
| | 79,429,619 |
Insurance - 7.5% |
ACE Ltd. | 298,800 | | 12,773,700 |
AFLAC, Inc. | 247,500 | | 9,860,400 |
Allstate Corp. | 1,200,900 | | 62,110,548 |
American International Group, Inc. | 2,363,114 | | 155,185,696 |
Assurant, Inc. | 443,500 | | 13,548,925 |
Berkshire Hathaway, Inc. Class A (a) | 3,839 | | 337,448,087 |
Brit Insurance Holdings PLC | 3,985,600 | | 6,023,245 |
Endurance Specialty Holdings Ltd. | 358,100 | | 12,247,020 |
Everest Re Group Ltd. | 863,980 | | 77,378,049 |
Fidelity National Financial, Inc. | 45,100 | | 2,059,717 |
Genworth Financial, Inc. Class A | 90,000 | | 2,430,000 |
Great-West Lifeco, Inc. | 134,000 | | 2,981,500 |
HCC Insurance Holdings, Inc. | 510,700 | | 16,914,384 |
IPC Holdings Ltd. | 160,300 | | 6,974,653 |
Markel Corp. (a) | 29,750 | | 10,829,000 |
Mercury General Corp. | 232,500 | | 13,931,400 |
MetLife, Inc. | 266,600 | | 10,799,966 |
Montpelier Re Holdings Ltd. | 1,449,200 | | 55,721,740 |
PartnerRe Ltd. | 340,200 | | 21,071,988 |
Progressive Corp. | 272,500 | | 23,118,900 |
RenaissanceRe Holdings Ltd. | 767,565 | | 39,974,785 |
StanCorp Financial Group, Inc. | 154,900 | | 12,779,250 |
USI Holdings Corp. (a) | 916,187 | | 10,600,284 |
W.R. Berkley Corp. | 455,150 | | 21,469,426 |
White Mountains Insurance Group Ltd. | 12,300 | | 7,945,800 |
Willis Group Holdings Ltd. | 367,100 | | 15,113,507 |
| | 961,291,970 |
Real Estate - 0.3% |
CB Richard Ellis Group, Inc. Class A | 429,800 | | 14,419,790 |
CBL & Associates Properties, Inc. | 137,781 | | 10,519,579 |
Equity Residential (SBI) | 192,900 | | 6,979,122 |
General Growth Properties, Inc. | 86,790 | | 3,138,326 |
Vornado Realty Trust | 60,900 | | 4,636,317 |
Weingarten Realty Investors (SBI) | 67,400 | | 2,702,740 |
| | 42,395,874 |
Thrifts & Mortgage Finance - 1.2% |
Countrywide Financial Corp. | 278,076 | | 10,291,593 |
Doral Financial Corp. | 483,175 | | 23,796,369 |
Freddie Mac | 33,700 | | 2,483,690 |
Golden West Financial Corp., Delaware | 1,922,400 | | 118,073,808 |
W Holding Co., Inc. | 23,970 | | 549,872 |
| | 155,195,332 |
TOTAL FINANCIALS | | 1,621,210,695 |
HEALTH CARE - 11.3% |
Biotechnology - 1.8% |
Affymetrix, Inc. (a) | 38,200 | | 1,396,210 |
Common Stocks - continued |
| Shares | | Value (Note 1) |
HEALTH CARE - continued |
Biotechnology - continued |
Biogen Idec, Inc. (a) | 479,300 | | $ 31,926,173 |
Gen-Probe, Inc. (a) | 357,100 | | 16,144,491 |
Genentech, Inc. (a) | 3,263,400 | | 177,659,496 |
Pharmion Corp. (a) | 28,400 | | 1,198,764 |
Seattle Genetics, Inc. (a) | 712,300 | | 4,651,319 |
| | 232,976,453 |
Health Care Equipment & Supplies - 4.1% |
Advanced Medical Optics, Inc. (a) | 326,200 | | 13,419,868 |
Advanced Neuromodulation Systems, Inc. (a) | 455,550 | | 17,976,003 |
Alcon, Inc. | 890,500 | | 71,774,300 |
American Medical Systems Holdings, Inc. (a) | 225,900 | | 9,444,879 |
Arrow International, Inc. | 14,300 | | 443,157 |
Aspect Medical Systems, Inc. (a) | 105,400 | | 2,578,084 |
Becton, Dickinson & Co. | 90,800 | | 5,157,440 |
Bio-Rad Laboratories, Inc. Class A (a) | 211,100 | | 12,110,807 |
Boston Scientific Corp. (a) | 169,700 | | 6,032,835 |
C.R. Bard, Inc. | 434,400 | | 27,792,912 |
Cooper Companies, Inc. | 191,560 | | 13,522,220 |
Cytyc Corp. (a) | 94,100 | | 2,594,337 |
DENTSPLY International, Inc. | 1,612,862 | | 90,642,844 |
Edwards Lifesciences Corp. (a) | 22,500 | | 928,350 |
Fisher Scientific International, Inc. (a) | 390,847 | | 24,381,036 |
Foxhollow Technologies, Inc. | 8,900 | | 218,851 |
Given Imaging Ltd. (a)(d) | 91,100 | | 3,271,401 |
Guidant Corp. | 33,700 | | 2,429,770 |
IDEXX Laboratories, Inc. (a) | 306,970 | | 16,757,492 |
Integra LifeSciences Holdings Corp. (a) | 217,400 | | 8,028,582 |
IntraLase Corp. | 32,700 | | 767,796 |
Intuitive Surgical, Inc. (a) | 181,700 | | 7,271,634 |
Kinetic Concepts, Inc. | 226,200 | | 17,259,060 |
Lumenis Ltd. (a) | 237 | | 460 |
Medtronic, Inc. | 123,640 | | 6,141,199 |
Nobel Biocare Holding AG (Switzerland) | 44,934 | | 8,123,572 |
Ocular Sciences, Inc. (a) | 136,820 | | 6,705,548 |
Smith & Nephew PLC | 4,548,003 | | 47,080,927 |
St. Jude Medical, Inc. (a) | 1,009,252 | | 42,317,936 |
Symmetry Medical, Inc. | 40,400 | | 850,420 |
Synthes, Inc. | 162,877 | | 18,225,300 |
Thermo Electron Corp. (a) | 78,800 | | 2,378,972 |
Varian Medical Systems, Inc. (a) | 2,300 | | 99,452 |
Ventana Medical Systems, Inc. (a) | 11,200 | | 716,688 |
Waters Corp. (a) | 470,000 | | 21,991,300 |
Zimmer Holdings, Inc. (a) | 279,771 | | 22,415,253 |
| | 531,850,685 |
Health Care Providers & Services - 3.2% |
Aetna, Inc. | 899,300 | | 112,187,675 |
American Healthways, Inc. (a) | 132,600 | | 4,381,104 |
|
| Shares | | Value (Note 1) |
Caremark Rx, Inc. (a) | 62,100 | | $ 2,448,603 |
DaVita, Inc. (a) | 44,600 | | 1,763,038 |
eResearchTechnology, Inc. (a) | 218,224 | | 3,458,850 |
IDX Systems Corp. (a) | 11,000 | | 379,060 |
Merge Technologies, Inc. (a) | 350,000 | | 7,787,500 |
Molina Healthcare, Inc. (a) | 49,460 | | 2,293,955 |
Patterson Companies, Inc. (a) | 3,608,004 | | 156,551,294 |
Pharmaceutical Product Development, Inc. (a) | 67,800 | | 2,799,462 |
UnitedHealth Group, Inc. | 1,243,310 | | 109,448,579 |
VCA Antech, Inc. (a) | 231,000 | | 4,527,600 |
WellChoice, Inc. (a) | 11,800 | | 630,120 |
WellPoint, Inc. (a) | 22,300 | | 2,564,500 |
| | 411,221,340 |
Pharmaceuticals - 2.2% |
Atherogenics, Inc. (a) | 67,400 | | 1,587,944 |
Connetics Corp. (a) | 87,100 | | 2,115,659 |
Cypress Bioscience, Inc. (a) | 226,000 | | 3,177,560 |
Elan Corp. PLC sponsored ADR (a) | 577,000 | | 15,723,250 |
Johnson & Johnson | 492,150 | | 31,212,153 |
Kos Pharmaceuticals, Inc. (a) | 150,800 | | 5,676,112 |
Merck KGaA | 28,908 | | 1,985,071 |
Novartis AG sponsored ADR | 709,000 | | 35,832,860 |
Novo Nordisk AS Series B | 1,298,974 | | 70,841,066 |
Pfizer, Inc. | 265 | | 7,126 |
Roche Holding AG (participation certificate) | 701,730 | | 80,183,638 |
Schering-Plough Corp. | 1,404,000 | | 29,315,520 |
Teva Pharmaceutical Industries Ltd. sponsored ADR | 91,200 | | 2,723,232 |
| | 280,381,191 |
TOTAL HEALTH CARE | | 1,456,429,669 |
INDUSTRIALS - 12.1% |
Aerospace & Defense - 1.1% |
L-3 Communications Holdings, Inc. | 155,700 | | 11,403,468 |
Lockheed Martin Corp. | 1,784,635 | | 99,136,474 |
Precision Castparts Corp. | 230,886 | | 15,164,592 |
SI International, Inc. (a) | 118,300 | | 3,638,908 |
United Technologies Corp. | 86,900 | | 8,981,115 |
| | 138,324,557 |
Air Freight & Logistics - 1.3% |
C.H. Robinson Worldwide, Inc. | 1,162,280 | | 64,529,786 |
CNF, Inc. | 47,500 | | 2,379,750 |
EGL, Inc. (a) | 248,200 | | 7,418,698 |
Expeditors International of Washington, Inc. | 48,900 | | 2,732,532 |
Ryder System, Inc. | 45,200 | | 2,159,204 |
United Parcel Service, Inc. Class B | 955,600 | | 81,665,576 |
UTI Worldwide, Inc. | 16,900 | | 1,149,538 |
| | 162,035,084 |
Common Stocks - continued |
| Shares | | Value (Note 1) |
INDUSTRIALS - continued |
Airlines - 0.8% |
JetBlue Airways Corp. (a) | 1,108,643 | | $ 25,742,690 |
Ryanair Holdings PLC sponsored ADR (a)(d) | 1,533,751 | | 62,500,353 |
Southwest Airlines Co. | 846,217 | | 13,776,413 |
| | 102,019,456 |
Building Products - 0.3% |
Lennox International, Inc. | 212,500 | | 4,324,375 |
Masco Corp. | 837,000 | | 30,575,610 |
Trex Co., Inc. (a) | 53,000 | | 2,779,320 |
| | 37,679,305 |
Commercial Services & Supplies - 0.6% |
ABM Industries, Inc. | 26,300 | | 518,636 |
Apollo Group, Inc. Class A (a) | 72 | | 5,811 |
Aramark Corp. Class B | 917,050 | | 24,310,996 |
Corporate Executive Board Co. | 62,100 | | 4,156,974 |
Educate, Inc. | 267,600 | | 3,543,024 |
Jackson Hewitt Tax Service, Inc. | 55,400 | | 1,398,850 |
Laureate Education, Inc. (a) | 175,100 | | 7,720,159 |
Navigant Consulting, Inc. (a) | 58,100 | | 1,545,460 |
R.R. Donnelley & Sons Co. | 316,100 | | 11,155,169 |
Resources Connection, Inc. (a) | 294,000 | | 15,967,140 |
Robert Half International, Inc. | 430,200 | | 12,660,786 |
| | 82,983,005 |
Construction & Engineering - 0.1% |
Jacobs Engineering Group, Inc. (a) | 239,620 | | 11,451,440 |
Paul Y-ITC Construction Holdings Ltd. | 6,732,000 | | 1,706,211 |
| | 13,157,651 |
Electrical Equipment - 0.5% |
AMETEK, Inc. | 73,900 | | 2,636,013 |
Cooper Industries Ltd. Class A | 759,500 | | 51,562,455 |
Energy Conversion Devices, Inc. (a) | 67,900 | | 1,311,828 |
Roper Industries, Inc. | 94,900 | | 5,767,073 |
Ultralife Batteries, Inc. (a) | 306,920 | | 5,969,594 |
| | 67,246,963 |
Industrial Conglomerates - 2.8% |
3M Co. | 3,794,320 | | 311,399,842 |
Carlisle Companies, Inc. | 55,700 | | 3,616,044 |
Hutchison Whampoa Ltd. | 1,823,000 | | 17,062,481 |
Siemens AG sponsored ADR | 157,600 | | 13,343,992 |
Tyco International Ltd. | 465,500 | | 16,636,970 |
| | 362,059,329 |
Machinery - 3.6% |
A.S.V., Inc. (a) | 93,064 | | 4,457,766 |
Bucyrus International, Inc. Class A | 238,300 | | 9,684,512 |
Caterpillar, Inc. | 201,400 | | 19,638,514 |
Cummins, Inc. | 423,000 | | 35,443,170 |
CUNO, Inc. (a) | 45,100 | | 2,678,940 |
Danaher Corp. (d) | 2,807,760 | | 161,193,502 |
|
| Shares | | Value (Note 1) |
Deere & Co. | 144,600 | | $ 10,758,240 |
Eaton Corp. | 100,300 | | 7,257,708 |
ESCO Technologies, Inc. (a) | 45,100 | | 3,456,915 |
Gardner Denver, Inc. (a) | 34,500 | | 1,252,005 |
Harsco Corp. | 65,700 | | 3,662,118 |
IDEX Corp. | 124,500 | | 5,042,250 |
Illinois Tool Works, Inc. | 39,900 | | 3,697,932 |
Ingersoll-Rand Co. Ltd. Class A | 134,000 | | 10,760,200 |
ITT Industries, Inc. | 28,000 | | 2,364,600 |
Joy Global, Inc. | 381,935 | | 16,587,437 |
Oshkosh Truck Co. | 78,000 | | 5,333,640 |
PACCAR, Inc. | 1,209,244 | | 97,319,957 |
Pall Corp. | 88,400 | | 2,559,180 |
Parker Hannifin Corp. | 189,900 | | 14,383,026 |
Pentair, Inc. | 64,800 | | 2,822,688 |
Timken Co. | 52,200 | | 1,358,244 |
Volvo AB ADR | 889,100 | | 35,252,815 |
| | 456,965,359 |
Marine - 0.0% |
Alexander & Baldwin, Inc. | 59,199 | | 2,511,222 |
Road & Rail - 0.8% |
Burlington Northern Santa Fe Corp. | 360,400 | | 17,050,524 |
Canadian National Railway Co. | 378,600 | | 23,053,585 |
Heartland Express, Inc. | 571,226 | | 12,835,448 |
Knight Transportation, Inc. | 306,520 | | 7,601,696 |
Laidlaw International, Inc. (a) | 96,600 | | 2,067,240 |
Landstar System, Inc. (a) | 282,812 | | 20,826,276 |
Norfolk Southern Corp. | 67,500 | | 2,442,825 |
Yellow Roadway Corp. (a)(d) | 251,687 | | 14,021,483 |
| | 99,899,077 |
Trading Companies & Distributors - 0.2% |
Fastenal Co. | 228,112 | | 14,042,575 |
MSC Industrial Direct Co., Inc. Class A | 387,900 | | 13,956,642 |
| | 27,999,217 |
Transportation Infrastructure - 0.0% |
International Shipping Enterprises, Inc. unit | 674,400 | | 4,451,040 |
TOTAL INDUSTRIALS | | 1,557,331,265 |
INFORMATION TECHNOLOGY - 15.0% |
Communications Equipment - 2.7% |
Carrier Access Corp. (a) | 55,000 | | 587,400 |
Comverse Technology, Inc. (a) | 474,900 | | 11,611,305 |
Ditech Communications Corp. (a) | 521,800 | | 7,800,910 |
Finisar Corp. (a) | 185,600 | | 423,168 |
Harris Corp. | 518,000 | | 32,007,220 |
Juniper Networks, Inc. (a) | 575,305 | | 15,642,543 |
Lucent Technologies, Inc. warrants 12/10/07 (a) | 24,604 | | 38,874 |
Motorola, Inc. | 637,065 | | 10,957,518 |
Plantronics, Inc. | 245,600 | | 10,185,032 |
Common Stocks - continued |
| Shares | | Value (Note 1) |
INFORMATION TECHNOLOGY - continued |
Communications Equipment - continued |
QUALCOMM, Inc. | 2,658,700 | | $ 112,728,880 |
Research In Motion Ltd. (a) | 1,239,700 | | 102,047,972 |
Scientific-Atlanta, Inc. | 233,900 | | 7,721,039 |
Telefonaktiebolaget LM Ericsson ADR (a) | 1,050,609 | | 33,083,677 |
| | 344,835,538 |
Computers & Peripherals - 0.9% |
Apple Computer, Inc. (a) | 546,400 | | 35,188,160 |
Avid Technology, Inc. (a) | 43,300 | | 2,673,775 |
Dell, Inc. (a) | 1,263,800 | | 53,256,532 |
NCR Corp. (a) | 173,100 | | 11,983,713 |
Network Appliance, Inc. (a) | 156,200 | | 5,188,964 |
Novatel Wireless, Inc. | 223,100 | | 4,323,678 |
Storage Technology Corp. (a) | 16,400 | | 518,404 |
Synaptics, Inc. (a) | 98,336 | | 3,007,115 |
| | 116,140,341 |
Electronic Equipment & Instruments - 0.8% |
Amphenol Corp. Class A (a) | 457,900 | | 16,823,246 |
Cogent, Inc. | 262,309 | | 8,656,197 |
Dionex Corp. (a) | 33,100 | | 1,875,777 |
FARO Technologies, Inc. (a) | 65,532 | | 2,043,288 |
FLIR Systems, Inc. (a) | 816,000 | | 52,052,640 |
Hon Hai Precision Industries Co. Ltd. | 2,885,000 | | 13,340,516 |
National Instruments Corp. | 246,457 | | 6,715,953 |
Symbol Technologies, Inc. | 102,100 | | 1,766,330 |
Trimble Navigation Ltd. (a) | 82,700 | | 2,732,408 |
| | 106,006,355 |
Internet Software & Services - 2.9% |
Akamai Technologies, Inc. (a) | 1,401,383 | | 18,260,020 |
Digital River, Inc. (a) | 254,104 | | 10,573,267 |
Google, Inc. Class A | 383,343 | | 74,023,533 |
Housevalues, Inc. | 25,100 | | 377,002 |
InfoSpace, Inc. (a) | 134,985 | | 6,418,537 |
Sina Corp. (a) | 114,200 | | 3,661,252 |
VeriSign, Inc. (a) | 84,400 | | 2,829,088 |
WebEx Communications, Inc. (a) | 56,900 | | 1,353,082 |
Websense, Inc. (a) | 204,583 | | 10,376,450 |
Yahoo!, Inc. (a) | 6,539,696 | | 246,415,745 |
| | 374,287,976 |
IT Services - 2.1% |
Affiliated Computer Services, Inc. Class A (a) | 32,600 | | 1,962,194 |
Alliance Data Systems Corp. (a) | 1,061,300 | | 50,390,524 |
Anteon International Corp. (a) | 554,200 | | 23,198,812 |
Cognizant Technology Solutions Corp. Class A (a) | 1,508,896 | | 63,871,568 |
First Data Corp. | 130,000 | | 5,530,200 |
Global Payments, Inc. | 45,200 | | 2,646,008 |
Infosys Technologies Ltd. sponsored ADR (d) | 1,011,600 | | 70,113,996 |
|
| Shares | | Value (Note 1) |
Iron Mountain, Inc. (a) | 410,900 | | $ 12,528,341 |
Kanbay International, Inc. | 144,300 | | 4,516,590 |
SRA International, Inc. Class A (a) | 472,800 | | 30,353,760 |
| | 265,111,993 |
Office Electronics - 0.2% |
Canon, Inc. | 91,500 | | 4,964,790 |
Xerox Corp. (a) | 723,549 | | 12,307,568 |
Zebra Technologies Corp. Class A (a) | 227,970 | | 12,830,152 |
| | 30,102,510 |
Semiconductors & Semiconductor Equipment - 3.7% |
Advanced Micro Devices, Inc. (a) | 546,100 | | 12,025,122 |
Analog Devices, Inc. | 1,338,100 | | 49,402,652 |
ATI Technologies, Inc. (a) | 343,100 | | 6,650,422 |
Cree, Inc. (a) | 515,700 | | 20,669,256 |
FormFactor, Inc. (a) | 83,700 | | 2,271,618 |
Freescale Semiconductor, Inc. Class B | 85,810 | | 1,575,472 |
International Rectifier Corp. (a) | 770,900 | | 34,359,013 |
Lam Research Corp. (a) | 42,900 | | 1,240,239 |
Linear Technology Corp. | 101,100 | | 3,918,636 |
Marvell Technology Group Ltd. (a) | 4,508,800 | | 159,927,136 |
Samsung Electronics Co. Ltd. | 335,500 | | 146,003,443 |
Sigmatel, Inc. (a) | 136,400 | | 4,846,292 |
Silicon Image, Inc. (a) | 530,500 | | 8,732,030 |
Silicon Laboratories, Inc. (a) | 386,226 | | 13,637,640 |
Tessera Technologies, Inc. (a) | 364,500 | | 13,563,045 |
Volterra Semiconductor Corp. (d) | 105,800 | | 2,343,999 |
| | 481,166,015 |
Software - 1.7% |
Activision, Inc. (a) | 335,399 | | 6,768,352 |
Adobe Systems, Inc. | 648,589 | | 40,692,474 |
Altiris, Inc. (a) | 761,839 | | 26,991,956 |
Autodesk, Inc. | 711,500 | | 27,001,425 |
Cadence Design Systems, Inc. (a) | 83,400 | | 1,151,754 |
Cognos, Inc. (a) | 285,300 | | 12,557,955 |
Computer Associates International, Inc. | 4,831 | | 150,051 |
Kronos, Inc. (a) | 75,692 | | 3,870,132 |
Macrovision Corp. (a) | 96,300 | | 2,476,836 |
Microsoft Corp. | 334,600 | | 8,937,166 |
NAVTEQ Corp. | 235,000 | | 10,894,600 |
Quality Systems, Inc. (a) | 51,193 | | 3,061,341 |
Quest Software, Inc. (a) | 67,400 | | 1,075,030 |
Red Hat, Inc. (a) | 179,167 | | 2,391,879 |
SAP AG sponsored ADR | 107,500 | | 4,752,575 |
Sonic Solutions, Inc. (a)(d) | 512,799 | | 11,507,210 |
Symantec Corp. (a) | 1,809,998 | | 46,625,548 |
Take-Two Interactive Software, Inc. (a) | 100,000 | | 3,479,000 |
THQ, Inc. (a) | 78,200 | | 1,793,908 |
TIBCO Software, Inc. (a) | 252,205 | | 3,364,415 |
| | 219,543,607 |
TOTAL INFORMATION TECHNOLOGY | | 1,937,194,335 |
Common Stocks - continued |
| Shares | | Value (Note 1) |
MATERIALS - 8.0% |
Chemicals - 1.4% |
Agrium, Inc. | 112,500 | | $ 1,898,438 |
Bayer AG | 135,300 | | 4,597,494 |
Dow Chemical Co. | 270,200 | | 13,377,602 |
Ecolab, Inc. | 1,696,800 | | 59,608,584 |
Headwaters, Inc. (a) | 124,800 | | 3,556,800 |
Methanex Corp. | 378,200 | | 6,905,302 |
Monsanto Co. | 90,100 | | 5,005,055 |
Nalco Holding Co. | 396,800 | | 7,745,536 |
NOVA Chemicals Corp. | 473,900 | | 22,391,775 |
Potash Corp. of Saskatchewan | 622,700 | | 51,761,938 |
Westlake Chemical Corp. | 56,400 | | 1,883,760 |
| | 178,732,284 |
Construction Materials - 0.2% |
Eagle Materials, Inc. | 101,700 | | 8,781,795 |
Eagle Materials, Inc. Class B | 7,000 | | 590,100 |
Lafarge North America, Inc. | 45,309 | | 2,325,258 |
Rinker Group Ltd. | 685,302 | | 5,710,320 |
Texas Industries, Inc. | 65,700 | | 4,098,366 |
Vulcan Materials Co. | 43,500 | | 2,375,535 |
| | 23,881,374 |
Containers & Packaging - 0.2% |
Ball Corp. | 152,756 | | 6,718,209 |
Owens-Illinois, Inc. (a) | 952,100 | | 21,565,065 |
Peak International Ltd. (a) | 200,000 | | 818,800 |
| | 29,102,074 |
Metals & Mining - 6.2% |
Aber Diamond Corp. | 611,150 | | 21,619,432 |
Agnico-Eagle Mines Ltd. | 369,600 | | 5,088,160 |
Alumina Ltd. | 1,152,300 | | 5,355,264 |
Anglo American PLC ADR (d) | 1,343,472 | | 31,961,199 |
Apex Silver Mines Ltd. (a) | 550,100 | | 9,450,718 |
BHP Billiton Ltd. sponsored ADR | 1,363,000 | | 32,739,260 |
Caemi Mineracao E Metalurgia SA (PN) (a) | 5,132,000 | | 4,405,482 |
Carpenter Technology Corp. | 212,100 | | 12,399,366 |
Cleveland-Cliffs, Inc. | 48,400 | | 5,026,824 |
Companhia Vale do Rio Doce sponsored ADR | 961,000 | | 27,878,610 |
Compania de Minas Buenaventura SA sponsored ADR | 881,800 | | 20,193,220 |
Compass Minerals International, Inc. | 223,500 | | 5,415,405 |
Dofasco, Inc. | 195,500 | | 7,396,417 |
Eldorado Gold Corp. (a) | 1,772,700 | | 5,244,238 |
Falconbridge Ltd. | 90,400 | | 2,342,867 |
First Quantum Minerals Ltd. (a) | 324,600 | | 5,044,825 |
Fording Canadian Coal Trust (d) | 16,900 | | 1,305,103 |
Fortescue Metals Group Ltd. (a)(d) | 304,600 | | 643,461 |
Freeport-McMoRan Copper & Gold, Inc. Class B | 839,734 | | 32,103,031 |
Gabriel Resources Ltd. (a) | 2,171,800 | | 2,823,340 |
|
| Shares | | Value (Note 1) |
Gerdau SA sponsored ADR | 173,200 | | $ 3,117,600 |
Glamis Gold Ltd. (a)(d) | 2,463,000 | | 42,199,400 |
Goldcorp, Inc. | 3,809,466 | | 57,332,463 |
Inco Ltd. (a) | 67,800 | | 2,486,000 |
International Steel Group, Inc. | 395,600 | | 16,045,536 |
IPSCO, Inc. | 757,400 | | 36,172,162 |
Ivanhoe Mines Ltd. (a) | 933,000 | | 6,725,375 |
Lionore Mining International Ltd. (a) | 1,329,000 | | 7,597,450 |
Meridian Gold, Inc. (a) | 304,600 | | 5,772,170 |
Mittal Steel Co. NV Class A (NY Shares) (a) | 156,000 | | 6,029,400 |
Newcrest Mining Ltd. | 791,800 | | 10,810,350 |
Newmont Mining Corp. | 2,872,651 | | 127,574,431 |
Novagold Resources, Inc. (a) | 778,300 | | 6,064,254 |
Nucor Corp. | 906,900 | | 47,467,146 |
Peabody Energy Corp. | 210,800 | | 17,055,828 |
Phelps Dodge Corp. | 77,900 | | 7,705,868 |
Placer Dome, Inc. | 1,054,900 | | 19,849,702 |
POSCO sponsored ADR (d) | 677,000 | | 30,146,810 |
Quanex Corp. | 36,000 | | 2,468,520 |
Rio Tinto PLC (Reg.) | 2,049,269 | | 61,073,339 |
Southern African Resources PLC (a) | 8,549,418 | | 6,234,569 |
Steel Dynamics, Inc. | 108,314 | | 4,102,934 |
Teck Cominco Ltd. Class B (sub. vtg.) | 212,200 | | 6,528,687 |
United States Steel Corp. | 342,300 | | 17,542,875 |
Usinas Siderurgicas de Minas Gerais SA (Usiminas) (PN-A) | 56,200 | | 1,139,235 |
Wheaton River Minerals Ltd. (a) | 905,300 | | 2,942,225 |
Xstrata PLC | 472,400 | | 8,449,132 |
Yanzhou Coal Mining Co. Ltd. (H Shares) (a) | 1,548,000 | | 2,210,632 |
| | 801,280,315 |
Paper & Forest Products - 0.0% |
Votorantim Celulose e Papel SA sponsored ADR (non-vtg.) | 35,600 | | 576,720 |
TOTAL MATERIALS | | 1,033,572,767 |
TELECOMMUNICATION SERVICES - 4.3% |
Diversified Telecommunication Services - 0.1% |
Citizens Communications Co. | 611,300 | | 8,429,827 |
PT Indosat Tbk | 3,790,000 | | 2,350,866 |
PT Indosat Tbk sponsored ADR | 126,600 | | 3,947,388 |
PT Telkomunikasi Indonesia Tbk sponsored ADR | 54,600 | | 1,147,692 |
| | 15,875,773 |
Wireless Telecommunication Services - 4.2% |
Alamosa Holdings, Inc. (a) | 176,600 | | 2,202,202 |
America Movil SA de CV sponsored ADR | 2,209,800 | | 115,683,030 |
KDDI Corp. | 1,548 | | 8,342,244 |
Millicom International Cellular SA (a) | 62,200 | | 1,413,806 |
mmO2 PLC (a) | 898,900 | | 2,117,479 |
Common Stocks - continued |
| Shares | | Value (Note 1) |
TELECOMMUNICATION SERVICES - continued |
Wireless Telecommunication Services - continued |
Mobile TeleSystems OJSC sponsored ADR (d) | 71,200 | | $ 9,861,912 |
MTN Group Ltd. | 447,300 | | 3,434,635 |
Nextel Communications, Inc. Class A (a) | 4,985,700 | | 149,571,000 |
Nextel Partners, Inc. Class A (a) | 2,508,400 | | 49,014,136 |
NII Holdings, Inc. (a) | 1,002,853 | | 47,585,375 |
Telefonica Moviles SA sponsored ADR | 193,400 | | 2,458,114 |
Telesystem International Wireless, Inc. (a) | 1,197,700 | | 13,424,221 |
Turkcell Iletisim Hizmet AS sponsored ADR | 229,800 | | 4,159,380 |
Vimpel Communications sponsored ADR (a) | 1,135,700 | | 41,044,198 |
Vodafone Group PLC sponsored ADR | 2,807,800 | | 76,877,564 |
Western Wireless Corp. Class A (a) | 299,500 | | 8,775,350 |
| | 535,964,646 |
TOTAL TELECOMMUNICATION SERVICES | | 551,840,419 |
UTILITIES - 0.6% |
Electric Utilities - 0.4% |
Entergy Corp. | 180,900 | | 12,227,031 |
Exelon Corp. | 242,300 | | 10,678,161 |
PG&E Corp. (a) | 417,100 | | 13,881,088 |
TXU Corp. | 133,100 | | 8,592,936 |
| | 45,379,216 |
Gas Utilities - 0.0% |
Southern Union Co. (a) | 236,445 | | 5,669,951 |
Multi-Utilities & Unregulated Power - 0.2% |
AES Corp. (a) | 406,800 | | 5,560,956 |
Dominion Resources, Inc. | 36,600 | | 2,479,284 |
Duke Energy Corp. | 236,700 | | 5,995,611 |
NRG Energy, Inc. (a) | 208,200 | | 7,505,610 |
| | 21,541,461 |
TOTAL UTILITIES | | 72,590,628 |
TOTAL COMMON STOCKS (Cost $7,826,577,138) | 11,590,928,561 |
Corporate Bonds - 0.1% |
| Principal Amount | | |
Convertible Bonds - 0.1% |
INDUSTRIALS - 0.1% |
Industrial Conglomerates - 0.1% |
Tyco International Group SA yankee 3.125% 1/15/23 | | $ 3,140,000 | | 5,282,108 |
|
| Principal Amount | | Value (Note 1) |
UTILITIES - 0.0% |
Multi-Utilities & Unregulated Power - 0.0% |
AES Corp. 4.5% 8/15/05 | | $ 2,280,000 | | $ 2,280,000 |
TOTAL CONVERTIBLE BONDS | | 7,562,108 |
Nonconvertible Bonds - 0.0% |
TELECOMMUNICATION SERVICES - 0.0% |
Diversified Telecommunication Services - 0.0% |
Cable & Wireless International Finance 8.625% 3/25/19 | GBP | 1,160,000 | | 2,487,665 |
TOTAL CORPORATE BONDS (Cost $9,206,213) | 10,049,773 |
U.S. Treasury Obligations - 1.5% |
|
U.S. Treasury Bills, yield at date of purchase 1.7% 1/13/05 | | 500,000 | | 499,756 |
U.S. Treasury Notes: | | | | |
4.25% 8/15/13 | | 55,175,000 | | 55,610,386 |
4.25% 11/15/13 | | 55,850,000 | | 56,201,241 |
4.25% 8/15/14 | | 22,500,000 | | 22,550,108 |
4.75% 5/15/14 | | 52,600,000 | | 54,814,933 |
TOTAL U.S. TREASURY OBLIGATIONS (Cost $185,540,348) | 189,676,424 |
Money Market Funds - 10.7% |
| | Shares | | |
Fidelity Cash Central Fund, 2.24% (b) | | 1,097,199,284 | | 1,097,199,284 |
Fidelity Securities Lending Cash Central Fund, 2.23% (b)(c) | | 287,986,287 | | 287,986,287 |
TOTAL MONEY MARKET FUNDS (Cost $1,385,185,571) | | 1,385,185,571 |
TOTAL INVESTMENT
PORTFOLIO - 102.3% (Cost $9,406,509,270) | | | 13,175,840,329 |
NET OTHER ASSETS - (2.3)% | | | (290,550,456) |
NET ASSETS - 100% | | $ 12,885,289,873 |
Currency Abbreviations |
GBP | - | British pound |
Legend |
(a) Non-income producing |
(b) Affiliated fund that is available only to investment companies and other accounts managed by Fidelity Investments. The rate quoted is the annualized seven-day yield of the fund at period end. A complete listing of the fund's holdings as of its most recent fiscal year end is available upon request. |
(c) Includes investment made with cash collateral received from securities on loan. |
(d) Security or a portion of the security is on loan at period end. |
(e) Security exempt from registration under Rule 144A of the Securities Act of 1933. These securities may be resold in transactions exempt from registration, normally to qualified institutional buyers. At the period end, the value of these securities amounted to $5,922,000 or 0% of net assets. |
Other Information |
Distribution of investments by country of issue, as a percentage of total net assets, is as follows: |
United States of America | 74.9% |
Canada | 6.4% |
United Kingdom | 4.3% |
Bermuda | 3.6% |
Switzerland | 1.6% |
Korea (South) | 1.3% |
Others (individually less than 1%) | 7.9% |
| 100.0% |
Income Tax Information |
At December 31, 2004, the fund had a capital loss carryforward of approximately $704,454,000 of which $40,895,000 and $663,559,000 will expire on December 31, 2009 and 2010, respectively. |
See accompanying notes which are an integral part of the financial statements.
Annual Report
Fidelity Variable Insurance Products: Contrafund Portfolio
Financial Statements
Statement of Assets and Liabilities
December 31, 2004 |
Assets | | |
Investment in securities, at value (including securities loaned of $280,743,709) (cost $9,406,509,270) - See accompanying schedule | | $ 13,175,840,329 |
Foreign currency held at value (cost $3,367,791) | | 3,382,765 |
Receivable for investments sold | | 18,602,752 |
Receivable for fund shares sold | | 4,359,470 |
Dividends receivable | | 10,377,567 |
Interest receivable | | 4,062,015 |
Prepaid expenses | | 43,240 |
Other affiliated receivables | | 14,513 |
Other receivables | | 954,425 |
Total assets | | 13,217,637,076 |
Liabilities | | |
Payable to custodian bank | $ 214,158 | |
Payable for investments purchased | 24,932,646 | |
Payable for fund shares redeemed | 10,394,915 | |
Accrued management fee | 6,037,675 | |
Distribution fees payable | 504,757 | |
Other affiliated payables | 920,048 | |
Other payables and accrued expenses | 1,356,717 | |
Collateral on securities loaned, at value | 287,986,287 | |
Total liabilities | | 332,347,203 |
Net Assets | | $ 12,885,289,873 |
Net Assets consist of: | | |
Paid in capital | | $ 9,804,776,776 |
Undistributed net investment income | | 30,613,930 |
Accumulated undistributed net realized gain (loss) on investments and foreign currency transactions | | (719,494,071) |
Net unrealized appreciation (depreciation) on investments and assets and liabilities in foreign currencies | | 3,769,393,238 |
Net Assets | | $ 12,885,289,873 |
Initial Class:
Net Asset Value, offering price and redemption price per share ($9,127,615,529 ÷ 342,907,819 shares) | | $ 26.62 |
Service Class:
Net Asset Value, offering price and redemption price per share ($2,111,968,890 ÷ 79,600,881 shares) | | $ 26.53 |
Service Class 2:
Net Asset Value, offering price and redemption price per share ($1,638,617,401 ÷62,190,060 shares) | | $ 26.35 |
Service Class 2R:
Net Asset Value, offering price and redemption price per share ($7,088,053 ÷ 269,583 shares) | | $ 26.29 |
Statement of Operations
Year ended December 31, 2004 |
| | |
Investment Income | | |
Dividends | | $ 91,348,934 |
Interest | | 19,310,973 |
Security lending | | 2,018,912 |
Total income | | 112,678,819 |
| | |
Expenses | | |
Management fee | $ 64,250,053 | |
Transfer agent fees | 7,478,200 | |
Distribution fees | 4,881,463 | |
Accounting and security lending fees | 1,462,803 | |
Non-interested trustees' compensation | 60,631 | |
Appreciation in deferred trustee compensation account | 6,782 | |
Custodian fees and expenses | 744,204 | |
Registration fees | 18,266 | |
Audit | 88,634 | |
Legal | 29,125 | |
Miscellaneous | 1,675,041 | |
Total expenses before reductions | 80,695,202 | |
Expense reductions | (2,471,388) | 78,223,814 |
Net investment income (loss) | | 34,455,005 |
Realized and Unrealized Gain (Loss) Net realized gain (loss) on: | | |
Investment securities | 555,405,871 | |
Foreign currency transactions | 153,799 | |
Futures contracts | 608,071 | |
Total net realized gain (loss) | | 556,167,741 |
Change in net unrealized appreciation (depreciation) on: Investment securities | 1,080,157,253 | |
Assets and liabilities in foreign currencies | (392,470) | |
Futures contracts | (739,135) | |
Total change in net unrealized appreciation (depreciation) | | 1,079,025,648 |
Net gain (loss) | | 1,635,193,389 |
Net increase (decrease) in net assets resulting from operations | | $ 1,669,648,394 |
See accompanying notes which are an integral part of the financial statements.
Annual Report
Statement of Changes in Net Assets
| Year ended
December 31,
2004 | Year ended
December 31,
2003 |
Increase (Decrease) in Net Assets | | |
Operations | | |
Net investment income (loss) | $ 34,455,005 | $ 25,801,059 |
Net realized gain (loss) | 556,167,741 | 98,601,973 |
Change in net unrealized appreciation (depreciation) | 1,079,025,648 | 2,069,862,306 |
Net increase (decrease) in net assets resulting from operations | 1,669,648,394 | 2,194,265,338 |
Distributions to shareholders from net investment income | (33,283,266) | (35,507,037) |
Share transactions - net increase (decrease) | 974,982,321 | 535,497,703 |
Redemption fees | 5,434 | 3,718 |
Total increase (decrease) in net assets | 2,611,352,883 | 2,694,259,722 |
| | |
Net Assets | | |
Beginning of period | 10,273,936,990 | 7,579,677,268 |
End of period (including undistributed net investment income of $30,613,930 and undistributed net investment income of $23,673,410, respectively) | $ 12,885,289,873 | $ 10,273,936,990 |
Other Information: | | | | |
Share Transactions | Year ended December 31, 2004 |
| Initial Class | Service Class | Service Class 2 | Service Class 2R |
Shares Sold | 39,676,965 | 15,203,443 | 27,599,342 | 256,799 |
Reinvested | 1,123,479 | 189,967 | 89,389 | 356 |
Redeemed | (29,262,778) | (9,311,680) | (5,203,844) | (105,684) |
Net increase (decrease) | 11,537,666 | 6,081,730 | 22,484,887 | 151,471 |
| | | | |
Dollars Sold | $ 959,621,838 | $ 366,229,990 | $ 660,559,920 | $ 6,150,098 |
Reinvested | 26,671,383 | 4,498,414 | 2,105,112 | 8,357 |
Redeemed | (701,529,337) | (223,414,420) | (123,399,434) | (2,519,600) |
Net increase (decrease) | $ 284,763,884 | $ 147,313,984 | $ 539,265,598 | $ 3,638,855 |
| | | | |
Share Transactions | Year ended December 31, 2003 |
| Initial Class | Service Class | Service Class 2 | Service Class 2R |
Shares Sold | 43,575,507 | 16,391,007 | 21,425,743 | 119,703 |
Reinvested | 1,718,846 | 269,021 | 92,062 | 161 |
Redeemed | (43,003,502) | (8,751,544) | (6,273,261) | (46,848) |
Net increase (decrease) | 2,290,851 | 7,908,484 | 15,244,544 | 73,016 |
| | | | |
Dollars Sold | $ 877,441,120 | $ 326,586,457 | $ 422,566,799 | $ 2,529,458 |
Reinvested | 29,357,892 | 4,584,117 | 1,562,295 | 2,733 |
Redeemed | (837,322,380) | (169,383,155) | (121,521,459) | (906,174) |
Net increase (decrease) | $ 69,476,632 | $ 161,787,419 | $ 302,607,635 | $ 1,626,017 |
| | | | |
Distributions | Year ended December 31, 2004 |
| Initial Class | Service Class | Service Class 2 | Service Class 2R |
From net investment income | $ 26,671,383 | $ 4,498,414 | $ 2,105,112 | $ 8,357 |
| Year ended December 31, 2003 |
| Initial Class | Service Class | Service Class 2 | Service Class 2R |
From net investment income | $ 29,357,892 | $ 4,584,117 | $ 1,562,295 | $ 2,733 |
See accompanying notes which are an integral part of the financial statements.
Contrafund Portfolio
Financial Highlights - Initial Class
Years ended December 31, | 2004 | 2003 | 2002 | 2001 | 2000 |
Selected Per-Share Data | | | | | |
Net asset value, beginning of period | $ 23.13 | $ 18.10 | $ 20.13 | $ 23.75 | $ 29.15 |
Income from Investment Operations | | | | | |
Net investment income (loss) C | .08 | .07 | .10 | .16 | .17 |
Net realized and unrealized gain (loss) | 3.49 | 5.05 | (1.97) | (3.01) | (1.84) |
Total from investment operations | 3.57 | 5.12 | (1.87) | (2.85) | (1.67) |
Distributions from net investment income | (.08) | (.09) | (.16) | (.17) | (.11) |
Distributions from net realized gain | - | - | - | (.60) | (3.62) |
Total distributions | (.08) | (.09) | (.16) | (.77) | (3.73) |
Redemption fees added to paid in capital C, E | - | - | - | - | - |
Net asset value, end of period | $ 26.62 | $ 23.13 | $ 18.10 | $ 20.13 | $ 23.75 |
Total Return A, B | 15.48% | 28.46% | (9.35)% | (12.28)% | (6.58)% |
Ratios to Average Net Assets D | | | | | |
Expenses before expense reductions | .68% | .67% | .68% | .68% | .66% |
Expenses net of voluntary waivers, if any | .68% | .67% | .68% | .68% | .66% |
Expenses net of all reductions | .66% | .65% | .64% | .64% | .63% |
Net investment income (loss) | .35% | .34% | .50% | .77% | .69% |
Supplemental Data | | | | | |
Net assets, end of period (000 omitted) | $ 9,127,616 | $ 7,665,424 | $ 5,956,028 | $ 6,972,615 | $ 8,516,464 |
Portfolio turnover rate | 64% | 66% | 84% | 140% | 177% |
A Total returns do not reflect charges attributable to your insurance company's separate account. Inclusion of these charges would reduce the total returns shown.
B Total returns would have been lower had certain expenses not been reduced during the periods shown.
C Calculated based on average shares outstanding during the period.
D Expense ratios reflect operating expenses of the class. Expenses before reductions do not reflect amounts reimbursed by the investment adviser or reductions from brokerage service arrangements or other expense offset arrangements and do not represent the amount paid by the class during periods when reimbursements or reductions occur. Expenses net of any voluntary waivers reflect expenses after reimbursement by the investment adviser but prior to reductions from brokerage service arrangements or other expense offset arrangements. Expenses net of all reductions represent the net expenses paid by the class.
E Amount represents less than $.01 per share.
Financial Highlights - Service Class
Years ended December 31, | 2004 | 2003 | 2002 | 2001 | 2000 |
Selected Per-Share Data | | | | | |
Net asset value, beginning of period | $ 23.06 | $ 18.04 | $ 20.06 | $ 23.67 | $ 29.10 |
Income from Investment Operations | | | | | |
Net investment income (loss) C | .06 | .05 | .08 | .14 | .15 |
Net realized and unrealized gain (loss) | 3.47 | 5.04 | (1.96) | (3.00) | (1.85) |
Total from investment operations | 3.53 | 5.09 | (1.88) | (2.86) | (1.70) |
Distributions from net investment income | (.06) | (.07) | (.14) | (.15) | (.11) |
Distributions from net realized gain | - | - | - | (.60) | (3.62) |
Total distributions | (.06) | (.07) | (.14) | (.75) | (3.73) |
Redemption fees added to paid in capital C, E | - | - | - | - | - |
Net asset value, end of period | $ 26.53 | $ 23.06 | $ 18.04 | $ 20.06 | $ 23.67 |
Total Return A, B | 15.34% | 28.35% | (9.42)% | (12.36)% | (6.71)% |
Ratios to Average Net Assets D | | | | | |
Expenses before expense reductions | .78% | .77% | .78% | .78% | .76% |
Expenses net of voluntary waivers, if any | .78% | .77% | .78% | .78% | .76% |
Expenses net of all reductions | .76% | .75% | .74% | .74% | .74% |
Net investment income (loss) | .25% | .24% | .39% | .67% | .59% |
Supplemental Data | | | | | |
Net assets, end of period (000 omitted) | $ 2,111,969 | $ 1,695,467 | $ 1,183,683 | $ 1,201,105 | $ 1,245,222 |
Portfolio turnover rate | 64% | 66% | 84% | 140% | 177% |
A Total returns do not reflect charges attributable to your insurance company's separate account. Inclusion of these charges would reduce the total returns shown.
B Total returns would have been lower had certain expenses not been reduced during the periods shown.
C Calculated based on average shares outstanding during the period.
D Expense ratios reflect operating expenses of the class. Expenses before reductions do not reflect amounts reimbursed by the investment adviser or reductions from brokerage service arrangements or other expense offset arrangements and do not represent the amount paid by the class during periods when reimbursements or reductions occur. Expenses net of any voluntary waivers reflect expenses after reimbursement by the investment adviser but prior to reductions from brokerage service arrangements or other expense offset arrangements. Expenses net of all reductions represent the net expenses paid by the class.
E Amount represents less than $.01 per share.
See accompanying notes which are an integral part of the financial statements.
Annual Report
Financial Highlights - Service Class 2
Years ended December 31, | 2004 | 2003 | 2002 | 2001 | 2000 F |
Selected Per-Share Data | | | | | |
Net asset value, beginning of period | $ 22.93 | $ 17.95 | $ 20.00 | $ 23.64 | $ 28.20 |
Income from Investment Operations | | | | | |
Net investment income (loss) E | .02 | .02 | .05 | .10 | .10 |
Net realized and unrealized gain (loss) | 3.45 | 5.02 | (1.96) | (2.98) | (.93) |
Total from investment operations | 3.47 | 5.04 | (1.91) | (2.88) | (.83) |
Distributions from net investment income | (.05) | (.06) | (.14) | (.16) | (.11) |
Distributions from net realized gain | - | - | - | (.60) | (3.62) |
Total distributions | (.05) | (.06) | (.14) | (.76) | (3.73) |
Redemption fees added to paid in capital E, H | - | - | - | - | - |
Net asset value, end of period | $ 26.35 | $ 22.93 | $ 17.95 | $ 20.00 | $ 23.64 |
Total Return B, C, D | 15.16% | 28.20% | (9.60)% | (12.47)% | (3.86)% |
Ratios to Average Net Assets G | | | | | |
Expenses before expense reductions | .93% | .93% | .93% | .94% | .92% A |
Expenses net of voluntary waivers, if any | .93% | .93% | .93% | .94% | .92% A |
Expenses net of all reductions | .91% | .90% | .90% | .90% | .90% A |
Net investment income (loss) | .10% | .09% | .24% | .52% | .43% A |
Supplemental Data | | | | | |
Net assets, end of period (000 omitted) | $ 1,638,617 | $ 910,341 | $ 439,157 | $ 231,686 | $ 81,950 |
Portfolio turnover rate | 64% | 66% | 84% | 140% | 177% |
A Annualized
B Total returns for periods of less than one year are not annualized.
C Total returns do not reflect charges attributable to your insurance company's separate account. Inclusion of these charges would reduce the total returns shown.
D Total returns would have been lower had certain expenses not been reduced during the periods shown.
E Calculated based on average shares outstanding during the period.
F For the period January 12, 2000 (commencement of sale of shares) to December 31, 2000.
G Expense ratios reflect operating expenses of the class. Expenses before reductions do not reflect amounts reimbursed by the investment adviser or reductions from brokerage service arrangements or other expense offset arrangements and do not represent the amount paid by the class during periods when reimbursements or reductions occur. Expense ratios before reductions for start-up periods may not be representative of longer-term operating periods. Expenses net of any voluntary waivers reflect expenses after reimbursement by the investment adviser but prior to reductions from brokerage service arrangements or other expense offset arrangements. Expenses net of all reductions represent the net expenses paid by the class.
H Amount represents less than $.01 per share.
Financial Highlights - Service Class 2R
Years ended December 31, | 2004 | 2003 | 2002 F |
Selected Per-Share Data | | | |
Net asset value, beginning of period | $ 22.90 | $ 17.95 | $ 20.49 |
Income from Investment Operations | | | |
Net investment income (loss) E | .02 | .02 | .03 |
Net realized and unrealized gain (loss) | 3.44 | 5.01 | (2.57) |
Total from investment operations | 3.46 | 5.03 | (2.54) |
Distributions from net investment income | (.07) | (.08) | - |
Redemption fees added to paid in capital E, H | - | - | - |
Net asset value, end of period | $ 26.29 | $ 22.90 | $ 17.95 |
Total Return B, C, D | 15.15% | 28.18% | (12.40)% |
Ratios to Average Net Assets G | | | |
Expenses before expense reductions | .93% | .93% | .96% A |
Expenses net of voluntary waivers, if any | .93% | .93% | .96% A |
Expenses net of all reductions | .91% | .90% | .92% A |
Net investment income (loss) | .10% | .08% | .23% A |
Supplemental Data | | | |
Net assets, end of period (000 omitted) | $ 7,088 | $ 2,705 | $ 810 |
Portfolio turnover rate | 64% | 66% | 84% |
A Annualized
B Total returns for periods of less than one year are not annualized.
C Total returns do not reflect charges attributable to your insurance company's separate account. Inclusion of these charges would reduce the total returns shown.
D Total returns would have been lower had certain expenses not been reduced during the periods shown.
E Calculated based on average shares outstanding during the period.
F For the period April 24, 2002 (commencement of sale of shares) to December 31, 2002.
G Expense ratios reflect operating expenses of the class. Expenses before reductions do not reflect amounts reimbursed by the investment adviser or reductions from brokerage service arrangements or other expense offset arrangements and do not represent the amount paid by the class during periods when reimbursements or reductions occur. Expense ratios before reductions for start-up periods may not be representative of longer-term operating periods. Expenses net of any voluntary waivers reflect expenses after reimbursement by the investment adviser but prior to reductions from brokerage service arrangements or other expense offset arrangements. Expenses net of all reductions represent the net expenses paid by the class.
H Amount represents less than $.01 per share.
See accompanying notes which are an integral part of the financial statements.
Contrafund Portfolio
Fidelity Variable Insurance Products: Equity-Income Portfolio
Performance: The Bottom Line
Average annual total return reflects the change in the value of an investment, assuming reinvestment of a class' dividend income and capital gains (the profits earned upon the sale of securities that have grown in value) and assuming a constant rate of performance each year. During periods of reimbursement by Fidelity, a fund's total return will be greater than it would be had the reimbursement not occurred. Performance numbers are net of all underlying fund operating expenses, but do not include any insurance charges imposed by your insurance company's separate account. If performance information included the effect of these additional charges, the total returns would be lower. How a fund did yesterday is no guarantee of how it will do tomorrow.
Average Annual Total Returns
Periods ended December 31, 2004 | Past 1
year | Past 5
years | Past 10
years |
Fidelity ® VIP: Equity-Income - Initial Class | 11.53% | 4.46% | 11.31% |
Fidelity VIP: Equity-Income - Service Class A | 11.38% | 4.35% | 11.23% |
Fidelity VIP: Equity-Income - Service Class 2 B | 11.23% | 4.19% | 11.15% |
A The initial offering of Service Class shares took place on November 3, 1997. Performance for Service Class shares reflects an asset-based distribution fee (12b-1 fee), and returns prior to November 3, 1997 are those of Initial Class and do not include the effects of Service Class' 12b-1 fee. Had Service Class' 12b-1 fee been reflected, returns prior to November 3, 1997 would have been lower.
B The initial offering of Service Class 2 shares took place on January 12, 2000. Performance for Service Class 2 shares reflects an asset-based distribution fee (12b-1 fee). Returns from November 3, 1997 to January 12, 2000 are those of Service Class which reflect a different 12b-1 fee. Service Class 2 returns prior to November 3, 1997 are those of Initial Class, and do not include the effects of a 12b-1 fee. Had Service Class 2 shares' 12b-1 fee been reflected, returns prior to January 12, 2000 would have been lower.
$10,000 Over 10 Years
Let's say hypothetically that $10,000 was invested in Fidelity ® Variable Insurance Products: Equity-Income Portfolio - Initial Class on December 31, 1994. The chart shows how the value of your investment would have changed, and also shows how the Russell 3000® Value Index performed over the same period.

Annual Report
Fidelity Variable Insurance Products: Equity-Income Portfolio
Management's Discussion of Fund Performance
Comments from Stephen Petersen, Portfolio Manager of Fidelity® Variable Insurance Products: Equity-Income Portfolio
The year ending December 31, 2004, generally was positive for equity investors, as many stock market benchmarks produced double-digit gains. Broad-based themes included the continued dominance of small-cap stocks, which outperformed large-caps for the sixth consecutive year. The small-cap Russell 2000® Index was up 18.33% in 2004, while the larger-cap Standard & Poor's 500SM Index rose 10.88%. Value stocks ended the year well ahead of growth stocks: The Russell 3000® Value Index advanced 16.94%, compared to 6.93% for the Russell 3000 Growth Index. Energy and basic materials stocks led the market upward. Energy stocks were boosted by record-high oil prices, while strong demand from China helped support commodity prices. The health care sector was among the market's weakest performers. Technology also fell off the pace, though it was helped by a rally late in the year. The tech-heavy NASDAQ Composite® Index returned 9.15%, thanks primarily to a 14.87% jump in the fourth quarter. Elsewhere, the Dow Jones Industrial AverageSM gained 5.37% for the year.
For the 12-month period ending December 31, 2004, the fund underperformed the LipperSM Variable Annuity Equity Income Objective Funds Average, which rose 13.51%, and the Russell 3000 Value Index. Mid- and small-cap stocks continued to outperform large-caps, which - along with out-of-favor stocks - are the fund's primary focus. As a result, it did not keep pace with the Russell index, which includes stocks of all market capitalizations. The fund's performance relative to the index also was hurt by its underweighting in financial stocks. Fund holdings Pfizer and Merck were hurt by competitive pressures from generic drug makers and company-specific issues: Merck was ordered to pull its arthritis drug, Vioxx, off the shelves, causing the stock price to plummet; Pfizer, which makes arthritis drug Celebrex, took a hit over concerns about the potential for similar problems with its own product. Conversely, energy holdings Exxon Mobil and Total SA did well as crude oil prices remained high, demand grew and excess supply evaporated.
The views expressed in this statement reflect those of the portfolio manager only through the end of the period of the report as stated on the cover and do not necessarily represent the views of Fidelity or any other person in the Fidelity organization. Any such views are subject to change at any time based upon market or other conditions and Fidelity disclaims any responsibility to update such views. These views may not be relied on as investment advice and, because investment decisions for a Fidelity fund are based on numerous factors, may not be relied on as an indication of trading intent on behalf of any Fidelity fund.
Annual Report
Fidelity Variable Insurance Products: Equity-Income Portfolio
Investment Summary
Top Five Stocks as of December 31, 2004 |
| % of fund's net assets |
Bank of America Corp. | 3.1 |
Exxon Mobil Corp. | 3.1 |
Citigroup, Inc. | 2.8 |
American International Group, Inc. | 2.6 |
J.P. Morgan Chase & Co. | 2.3 |
| 13.9 |
Top Five Market Sectors as of December 31, 2004 |
| % of fund's net assets |
Financials | 30.2 |
Industrials | 12.1 |
Consumer Discretionary | 11.1 |
Energy | 10.8 |
Health Care | 7.9 |
Asset Allocation as of December 31, 2004 |
% of fund's net assets* |
| Stocks | 99.1% | |
| Bonds | 0.7% | |
| Short-Term Investments and Net Other Assets | 0.2% | |
* Foreign investments | 11.9% | |

Annual Report
Fidelity Variable Insurance Products: Equity-Income Portfolio
Investments December 31, 2004
Showing Percentage of Net Assets
Common Stocks - 98.0% |
| Shares | | Value (Note 1) |
CONSUMER DISCRETIONARY - 10.5% |
Auto Components - 0.1% |
TRW Automotive Holdings Corp. | 611,370 | | $ 12,655,359 |
Automobiles - 0.4% |
Toyota Motor Corp. ADR | 475,900 | | 38,961,933 |
Hotels, Restaurants & Leisure - 1.2% |
Caesars Entertainment, Inc. (a) | 1,927,700 | | 38,823,878 |
McDonald's Corp. | 2,561,300 | | 82,115,278 |
Six Flags, Inc. (a) | 642,256 | | 3,448,915 |
Wendy's International, Inc. | 128,800 | | 5,056,688 |
| | 129,444,759 |
Household Durables - 1.2% |
Koninklijke Philips Electronics NV (NY Shares) | 601,900 | | 15,950,350 |
LG Electronics, Inc. | 237,410 | | 14,700,524 |
Maytag Corp. | 1,357,020 | | 28,633,122 |
Newell Rubbermaid, Inc. | 2,451,900 | | 59,311,461 |
Sony Corp. sponsored ADR | 128,500 | | 5,006,360 |
The Stanley Works | 128,500 | | 6,295,215 |
| | 129,897,032 |
Leisure Equipment & Products - 0.0% |
Eastman Kodak Co. | 128,400 | | 4,140,900 |
Media - 6.0% |
Clear Channel Communications, Inc. | 2,716,100 | | 90,962,189 |
Comcast Corp. Class A (a) | 2,852,091 | | 94,917,588 |
Fox Entertainment Group, Inc.
Class A (a) | 577,900 | | 18,065,154 |
Liberty Media Corp. Class A (a) | 3,912,376 | | 42,957,888 |
Liberty Media International, Inc.
Class A (a) | 613,999 | | 28,385,174 |
The Reader's Digest Association, Inc. (non-vtg.) | 1,699,003 | | 23,633,132 |
Time Warner, Inc. (a) | 6,982,850 | | 135,746,604 |
Viacom, Inc. Class B (non-vtg.) | 3,720,586 | | 135,392,125 |
Vivendi Universal SA sponsored ADR (a) | 904,300 | | 29,000,901 |
Walt Disney Co. | 2,763,400 | | 76,822,520 |
| | 675,883,275 |
Multiline Retail - 0.7% |
Big Lots, Inc. (a) | 2,275,956 | | 27,607,349 |
Dollar Tree Stores, Inc. (a) | 790,100 | | 22,660,068 |
Family Dollar Stores, Inc. | 706,500 | | 22,063,995 |
Sears, Roebuck & Co. | 214,100 | | 10,925,523 |
| | 83,256,935 |
Specialty Retail - 0.7% |
Abercrombie & Fitch Co. Class A | 128,400 | | 6,028,380 |
AnnTaylor Stores Corp. (a) | 1,113,050 | | 23,963,967 |
Gap, Inc. | 1,267,900 | | 26,778,048 |
Toys 'R' Us, Inc. (a) | 1,295,900 | | 26,527,073 |
| | 83,297,468 |
|
| Shares | | Value (Note 1) |
Textiles, Apparel & Luxury Goods - 0.2% |
Liz Claiborne, Inc. | 632,940 | | $ 26,716,397 |
TOTAL CONSUMER DISCRETIONARY | | 1,184,254,058 |
CONSUMER STAPLES - 6.2% |
Beverages - 0.6% |
Anheuser-Busch Companies, Inc. | 1,282,400 | | 65,056,152 |
Food & Staples Retailing - 1.2% |
Albertsons, Inc. | 720,600 | | 17,207,928 |
CVS Corp. | 1,090,700 | | 49,157,849 |
Wal-Mart Stores, Inc. | 1,284,200 | | 67,831,444 |
| | 134,197,221 |
Food Products - 1.0% |
General Mills, Inc. | 278,600 | | 13,849,206 |
H.J. Heinz Co. | 281,120 | | 10,960,869 |
Kellogg Co. | 149,800 | | 6,690,068 |
Kraft Foods, Inc. Class A | 943,100 | | 33,583,791 |
Unilever PLC sponsored ADR | 1,141,000 | | 45,092,320 |
| | 110,176,254 |
Household Products - 2.0% |
Colgate-Palmolive Co. | 2,194,400 | | 112,265,504 |
Kimberly-Clark Corp. | 1,169,800 | | 76,984,538 |
Procter & Gamble Co. | 710,400 | | 39,128,832 |
| | 228,378,874 |
Personal Products - 0.6% |
Gillette Co. | 1,605,120 | | 71,877,274 |
Tobacco - 0.8% |
Altria Group, Inc. | 1,562,800 | | 95,487,080 |
TOTAL CONSUMER STAPLES | | 705,172,855 |
ENERGY - 10.8% |
Energy Equipment & Services - 2.4% |
Baker Hughes, Inc. | 1,373,800 | | 58,620,046 |
BJ Services Co. | 536,645 | | 24,975,458 |
Halliburton Co. | 708,200 | | 27,789,768 |
Noble Corp. (a) | 817,100 | | 40,642,554 |
Schlumberger Ltd. (NY Shares) | 1,768,900 | | 118,427,855 |
| | 270,455,681 |
Oil & Gas - 8.4% |
Apache Corp. | 647,780 | | 32,758,235 |
BP PLC sponsored ADR | 2,459,842 | | 143,654,773 |
ChevronTexaco Corp. | 2,480,842 | | 130,269,013 |
Exxon Mobil Corp. | 6,841,236 | | 350,681,757 |
Royal Dutch Petroleum Co. (NY Shares) | 664,300 | | 38,117,534 |
Total SA: | | | |
Series B | 341,300 | | 74,976,784 |
sponsored ADR | 1,652,996 | | 181,565,081 |
| | 952,023,177 |
TOTAL ENERGY | | 1,222,478,858 |
Common Stocks - continued |
| Shares | | Value (Note 1) |
FINANCIALS - 29.6% |
Capital Markets - 4.9% |
Bank of New York Co., Inc. | 3,107,200 | | $ 103,842,624 |
Charles Schwab Corp. | 5,679,300 | | 67,924,428 |
Credit Suisse Group sponsored ADR | 610,000 | | 25,735,900 |
Janus Capital Group, Inc. | 2,332,400 | | 39,207,644 |
LaBranche & Co., Inc. (a)(c) | 517,900 | | 4,640,384 |
Mellon Financial Corp. | 1,716,500 | | 53,400,315 |
Merrill Lynch & Co., Inc. | 1,610,300 | | 96,247,631 |
Morgan Stanley | 2,073,600 | | 115,126,272 |
Nomura Holdings, Inc. | 1,853,000 | | 26,979,681 |
State Street Corp. | 386,200 | | 18,970,144 |
| | 552,075,023 |
Commercial Banks - 7.3% |
Bank of America Corp. | 7,600,666 | | 357,155,294 |
Comerica, Inc. | 730,200 | | 44,556,804 |
Lloyds TSB Group PLC | 2,282,400 | | 20,717,588 |
Royal Bank of Scotland Group PLC | 625,547 | | 21,031,989 |
State Bank of India | 463,175 | | 7,573,045 |
Sumitomo Mitsui Financial Group, Inc. | 2,994 | | 21,776,140 |
U.S. Bancorp, Delaware | 1,909,838 | | 59,816,126 |
Wachovia Corp. | 2,934,075 | | 154,332,345 |
Wells Fargo & Co. | 2,176,800 | | 135,288,120 |
| | 822,247,451 |
Consumer Finance - 1.3% |
American Express Co. | 1,542,996 | | 86,978,685 |
MBNA Corp. | 1,456,400 | | 41,055,916 |
MoneyGram International, Inc. | 1,014,600 | | 21,448,644 |
| | 149,483,245 |
Diversified Financial Services - 5.5% |
CIT Group, Inc. | 1,049,200 | | 48,074,344 |
Citigroup, Inc. | 6,481,619 | | 312,284,403 |
J.P. Morgan Chase & Co. | 6,788,812 | | 264,831,556 |
| | 625,190,303 |
Insurance - 7.7% |
ACE Ltd. | 2,238,115 | | 95,679,416 |
Allianz AG sponsored ADR | 1,115,700 | | 14,827,653 |
Allstate Corp. | 2,059,400 | | 106,512,168 |
American International Group, Inc. | 4,377,250 | | 287,454,008 |
Assurant, Inc. | 164,900 | | 5,037,695 |
Conseco, Inc. (a) | 1,262,800 | | 25,192,860 |
Fondiaria-Sai Spa (c) | 541,144 | | 14,556,983 |
Genworth Financial, Inc. Class A | 1,087,200 | | 29,354,400 |
Hartford Financial Services Group, Inc. | 1,104,500 | | 76,552,895 |
Marsh & McLennan Companies, Inc. | 793,600 | | 26,109,440 |
|
| Shares | | Value (Note 1) |
Muenchener Rueckversicherungs-Gesellschaft AG (Reg.) | 123,914 | | $ 15,204,241 |
Old Republic International Corp. | 530,996 | | 13,434,199 |
St. Paul Travelers Companies, Inc. | 2,542,926 | | 94,266,267 |
The Chubb Corp. | 439,000 | | 33,759,100 |
XL Capital Ltd. Class A | 428,300 | | 33,257,495 |
| | 871,198,820 |
Real Estate - 0.1% |
CarrAmerica Realty Corp. | 193,740 | | 6,393,420 |
Thrifts & Mortgage Finance - 2.8% |
Fannie Mae | 2,818,100 | | 200,676,901 |
Freddie Mac | 717,900 | | 52,909,230 |
Housing Development Finance Corp. Ltd. | 1,133,500 | | 20,155,333 |
MGIC Investment Corp. | 195,900 | | 13,499,469 |
Sovereign Bancorp, Inc. | 1,371,550 | | 30,928,453 |
| | 318,169,386 |
TOTAL FINANCIALS | | 3,344,757,648 |
HEALTH CARE - 7.7% |
Health Care Equipment & Supplies - 1.2% |
Baxter International, Inc. | 3,124,600 | | 107,923,684 |
Thermo Electron Corp. (a) | 667,000 | | 20,136,730 |
| | 128,060,414 |
Health Care Providers & Services - 1.3% |
Cardinal Health, Inc. | 706,100 | | 41,059,715 |
HCA, Inc. | 333,500 | | 13,326,660 |
McKesson Corp. | 1,307,500 | | 41,133,950 |
Tenet Healthcare Corp. (a) | 2,188,900 | | 24,034,122 |
UnitedHealth Group, Inc. | 334,200 | | 29,419,626 |
| | 148,974,073 |
Pharmaceuticals - 5.2% |
Abbott Laboratories | 857,000 | | 39,979,050 |
Bristol-Myers Squibb Co. | 2,517,500 | | 64,498,350 |
GlaxoSmithKline PLC sponsored ADR | 430,600 | | 20,406,134 |
Johnson & Johnson | 2,077,200 | | 131,736,024 |
Merck & Co., Inc. | 2,683,400 | | 86,244,476 |
Pfizer, Inc. | 3,579,000 | | 96,239,310 |
Schering-Plough Corp. | 3,703,130 | | 77,321,354 |
Wyeth | 1,713,500 | | 72,977,965 |
| | 589,402,663 |
TOTAL HEALTH CARE | | 866,437,150 |
INDUSTRIALS - 12.0% |
Aerospace & Defense - 3.4% |
Bombardier, Inc. Class B (sub. vtg.) | 2,376,500 | | 4,713,392 |
EADS NV | 1,540,015 | | 44,686,006 |
Honeywell International, Inc. | 2,956,625 | | 104,694,091 |
Lockheed Martin Corp. | 1,439,400 | | 79,958,670 |
Common Stocks - continued |
| Shares | | Value (Note 1) |
INDUSTRIALS - continued |
Aerospace & Defense - continued |
Northrop Grumman Corp. | 903,000 | | $ 49,087,080 |
Raytheon Co. | 288,678 | | 11,209,367 |
The Boeing Co. | 865,000 | | 44,781,050 |
United Technologies Corp. | 379,520 | | 39,223,392 |
| | 378,353,048 |
Air Freight & Logistics - 0.1% |
Ryder System, Inc. | 123,200 | | 5,885,264 |
Airlines - 0.2% |
Southwest Airlines Co. | 1,586,900 | | 25,834,732 |
Commercial Services & Supplies - 0.3% |
Waste Management, Inc. | 1,286,100 | | 38,505,834 |
Construction & Engineering - 0.2% |
Fluor Corp. | 368,900 | | 20,108,739 |
Electrical Equipment - 0.3% |
Emerson Electric Co. | 550,200 | | 38,569,020 |
Industrial Conglomerates - 3.8% |
3M Co. | 342,400 | | 28,100,768 |
General Electric Co. | 4,291,540 | | 156,641,210 |
Hutchison Whampoa Ltd. | 2,304,000 | | 21,564,430 |
Siemens AG sponsored ADR | 248,700 | | 21,057,429 |
Textron, Inc. | 717,500 | | 52,951,500 |
Tyco International Ltd. | 4,166,646 | | 148,915,928 |
| | 429,231,265 |
Machinery - 2.7% |
Caterpillar, Inc. | 510,300 | | 49,759,353 |
Deere & Co. | 193,250 | | 14,377,800 |
Dover Corp. | 850,600 | | 35,674,164 |
Eaton Corp. | 212,900 | | 15,405,444 |
Illinois Tool Works, Inc. | 176,200 | | 16,330,216 |
Ingersoll-Rand Co. Ltd. Class A | 1,043,044 | | 83,756,433 |
Navistar International Corp. (a) | 508,495 | | 22,363,610 |
SPX Corp. | 1,550,600 | | 62,117,036 |
| | 299,784,056 |
Road & Rail - 1.0% |
Burlington Northern Santa Fe Corp. | 1,236,500 | | 58,498,815 |
Union Pacific Corp. | 807,900 | | 54,331,275 |
| | 112,830,090 |
TOTAL INDUSTRIALS | | 1,349,102,048 |
INFORMATION TECHNOLOGY - 6.9% |
Communications Equipment - 0.9% |
Lucent Technologies, Inc. (a) | 4,816,600 | | 18,110,416 |
Lucent Technologies, Inc. warrants 12/10/07 (a) | 8,328 | | 13,158 |
Motorola, Inc. | 3,578,112 | | 61,543,526 |
Nokia Corp. sponsored ADR | 1,182,000 | | 18,521,940 |
| | 98,189,040 |
|
| Shares | | Value (Note 1) |
Computers & Peripherals - 1.8% |
Hewlett-Packard Co. | 3,850,311 | | $ 80,741,022 |
International Business Machines Corp. | 868,400 | | 85,606,872 |
Storage Technology Corp. (a) | 710,110 | | 22,446,577 |
Sun Microsystems, Inc. (a) | 3,998,675 | | 21,512,872 |
| | 210,307,343 |
Electronic Equipment & Instruments - 0.8% |
Agilent Technologies, Inc. (a) | 429,600 | | 10,353,360 |
Arrow Electronics, Inc. (a) | 830,900 | | 20,190,870 |
Avnet, Inc. (a) | 1,584,330 | | 28,898,179 |
Solectron Corp. (a) | 5,530,200 | | 29,475,966 |
| | 88,918,375 |
IT Services - 0.1% |
Ceridian Corp. (a) | 780,800 | | 14,273,024 |
Office Electronics - 0.3% |
Xerox Corp. (a) | 1,881,900 | | 32,011,119 |
Semiconductors & Semiconductor Equipment - 2.1% |
Analog Devices, Inc. | 1,113,300 | | 41,103,036 |
Applied Materials, Inc. (a) | 1,369,900 | | 23,425,290 |
Freescale Semiconductor, Inc. Class B | 1,468,877 | | 26,968,582 |
Intel Corp. | 3,219,100 | | 75,294,749 |
Micron Technology, Inc. (a) | 1,866,200 | | 23,047,570 |
National Semiconductor Corp. | 235,200 | | 4,221,840 |
Rohm Co. Ltd. | 148,300 | | 15,346,871 |
Samsung Electronics Co. Ltd. | 55,670 | | 24,226,562 |
Teradyne, Inc. (a) | 107,400 | | 1,833,318 |
| | 235,467,818 |
Software - 0.9% |
Computer Associates International, Inc. | 1,381 | | 42,894 |
Microsoft Corp. | 3,735,200 | | 99,767,192 |
| | 99,810,086 |
TOTAL INFORMATION TECHNOLOGY | | 778,976,805 |
MATERIALS - 6.2% |
Chemicals - 2.6% |
Air Products & Chemicals, Inc. | 64,300 | | 3,727,471 |
Arch Chemicals, Inc. | 392,800 | | 11,304,784 |
Dow Chemical Co. | 2,015,700 | | 99,797,307 |
Eastman Chemical Co. | 476,800 | | 27,525,664 |
Great Lakes Chemical Corp. | 650,500 | | 18,532,745 |
Lubrizol Corp. | 214,800 | | 7,917,528 |
Lyondell Chemical Co. | 2,272,593 | | 65,723,375 |
Nalco Holding Co. | 95,700 | | 1,868,064 |
Olin Corp. | 682,700 | | 15,033,054 |
PolyOne Corp. (a) | 1,239,100 | | 11,226,246 |
Praxair, Inc. | 621,624 | | 27,444,700 |
| | 290,100,938 |
Common Stocks - continued |
| Shares | | Value (Note 1) |
MATERIALS - continued |
Containers & Packaging - 0.5% |
Amcor Ltd. | 963,600 | | $ 5,541,317 |
Smurfit-Stone Container Corp. (a) | 2,515,872 | | 46,996,489 |
| | 52,537,806 |
Metals & Mining - 1.8% |
Alcan, Inc. | 955,100 | | 46,799,900 |
Alcoa, Inc. | 2,616,216 | | 82,201,507 |
Freeport-McMoRan Copper & Gold, Inc. Class B | 820,704 | | 31,375,514 |
Phelps Dodge Corp. | 437,600 | | 43,287,392 |
| | 203,664,313 |
Paper & Forest Products - 1.3% |
Bowater, Inc. (c) | 391,300 | | 17,205,461 |
Georgia-Pacific Corp. | 1,353,201 | | 50,717,973 |
International Paper Co. | 999,700 | | 41,987,400 |
Weyerhaeuser Co. | 610,400 | | 41,031,088 |
| | 150,941,922 |
TOTAL MATERIALS | | 697,244,979 |
TELECOMMUNICATION SERVICES - 5.3% |
Diversified Telecommunication Services - 4.9% |
BellSouth Corp. | 5,303,299 | | 147,378,679 |
Qwest Communications International, Inc. (a) | 3,728,500 | | 16,554,540 |
SBC Communications, Inc. | 7,035,993 | | 181,317,540 |
Sprint Corp. | 1,161,600 | | 28,865,760 |
Verizon Communications, Inc. | 4,370,102 | | 177,032,832 |
| | 551,149,351 |
Wireless Telecommunication Services - 0.4% |
Crown Castle International Corp. (a) | 910,400 | | 15,149,056 |
KDDI Corp. | 3,028 | | 16,318,032 |
Vodafone Group PLC sponsored ADR | 556,500 | | 15,236,970 |
| | 46,704,058 |
TOTAL TELECOMMUNICATION SERVICES | | 597,853,409 |
UTILITIES - 2.8% |
Electric Utilities - 1.5% |
Entergy Corp. | 765,900 | | 51,767,181 |
FirstEnergy Corp. | 428,200 | | 16,918,182 |
PG&E Corp. (a) | 403,800 | | 13,438,464 |
TXU Corp. | 654,820 | | 42,275,179 |
Wisconsin Energy Corp. | 1,414,600 | | 47,686,166 |
| | 172,085,172 |
Gas Utilities - 0.0% |
AGL Resources, Inc. | 109,500 | | 3,639,780 |
|
| Shares | | Value (Note 1) |
Multi-Utilities & Unregulated Power - 1.3% |
Dominion Resources, Inc. | 1,305,300 | | $ 88,421,022 |
NorthWestern Energy Corp. (a) | 85,500 | | 2,394,000 |
Public Service Enterprise Group, Inc. | 1,026,100 | | 53,121,197 |
| | 143,936,219 |
TOTAL UTILITIES | | 319,661,171 |
TOTAL COMMON STOCKS (Cost $8,380,344,823) | 11,065,938,981 |
Convertible Preferred Stocks - 1.1% |
| | | |
CONSUMER DISCRETIONARY - 0.2% |
Automobiles - 0.1% |
General Motors Corp.: | | | |
Series B, 5.25% | 412,200 | | 9,472,356 |
Series C, 6.25% | 253,100 | | 6,671,716 |
| | 16,144,072 |
Hotels, Restaurants & Leisure - 0.1% |
Six Flags, Inc. 7.25% PIERS | 388,400 | | 8,603,060 |
TOTAL CONSUMER DISCRETIONARY | | 24,747,132 |
FINANCIALS - 0.5% |
Capital Markets - 0.1% |
State Street Corp. 6.75% | 24,900 | | 5,556,186 |
Consumer Finance - 0.2% |
Ford Motor Co. Capital Trust II 6.50% | 461,500 | | 24,392,583 |
Insurance - 0.2% |
Conseco, Inc. Series B, 5.50% | 143,400 | | 3,782,892 |
The Chubb Corp.: | | | |
7.00% | 167,700 | | 4,937,591 |
Series B, 7.00% | 120,100 | | 3,603,000 |
Travelers Property Casualty Corp. 4.50% | 240,200 | | 5,483,045 |
XL Capital Ltd. 6.50% | 401,800 | | 10,127,369 |
| | 27,933,897 |
TOTAL FINANCIALS | | 57,882,666 |
HEALTH CARE - 0.2% |
Health Care Equipment & Supplies - 0.1% |
Baxter International, Inc. 7.00% | 156,900 | | 8,811,504 |
Pharmaceuticals - 0.1% |
Schering-Plough Corp. 6.00% | 187,400 | | 10,482,781 |
TOTAL HEALTH CARE | | 19,294,285 |
INFORMATION TECHNOLOGY - 0.2% |
Office Electronics - 0.2% |
Xerox Corp. Series C, 6.25% | 145,650 | | 21,476,675 |
TOTAL CONVERTIBLE PREFERRED STOCKS (Cost $116,492,275) | 123,400,758 |
Corporate Bonds - 0.7% |
| Principal
Amount | | Value
(Note 1) |
Convertible Bonds - 0.6% |
CONSUMER DISCRETIONARY - 0.4% |
Hotels, Restaurants & Leisure - 0.1% |
Royal Caribbean Cruises Ltd. liquid yield option note 0% 2/2/21 | $ 11,239,000 | | $ 7,192,960 |
Six Flags, Inc. 4.5% 5/15/15 | 3,640,000 | | 4,095,000 |
| | 11,287,960 |
Media - 0.2% |
Liberty Media Corp.3.5% 1/15/31 (d) | 11,400,000 | | 10,773,000 |
News America, Inc. liquid yield option note 0% 2/28/21 (d) | 22,670,000 | | 13,295,955 |
| | 24,068,955 |
Specialty Retail - 0.1% |
Gap, Inc. 5.75% 3/15/09 | 8,590,000 | | 11,417,828 |
TOTAL CONSUMER DISCRETIONARY | | 46,774,743 |
FINANCIALS - 0.1% |
Diversified Financial Services - 0.0% |
Navistar Financial Corp. 4.75% 4/1/09 (d) | 2,760,000 | | 2,821,879 |
Insurance - 0.1% |
Loews Corp. 3.125% 9/15/07 | 5,340,000 | | 5,246,550 |
TOTAL FINANCIALS | | 8,068,429 |
INDUSTRIALS - 0.1% |
Industrial Conglomerates - 0.1% |
Tyco International Group SA yankee 3.125% 1/15/23 | 5,220,000 | | 8,781,084 |
INFORMATION TECHNOLOGY - 0.0% |
Electronic Equipment & Instruments - 0.0% |
Celestica, Inc. liquid yield option note 0% 8/1/20 | 620,000 | | 344,100 |
TELECOMMUNICATION SERVICES - 0.0% |
Diversified Telecommunication Services - 0.0% |
Level 3 Communications, Inc. 5.25% 12/15/11 (d) | 6,420,000 | | 6,474,570 |
TOTAL CONVERTIBLE BONDS | | 70,442,926 |
|
| Principal
Amount | | Value
(Note 1) |
Nonconvertible Bonds - 0.1% |
CONSUMER DISCRETIONARY - 0.0% |
Media - 0.0% |
XM Satellite Radio, Inc. 12% 6/15/10 | $ 60,000 | | $ 70,800 |
MATERIALS - 0.1% |
Chemicals - 0.1% |
Hercules, Inc. 6.5% 6/30/29 unit | 15,700,000 | | 13,366,980 |
TOTAL NONCONVERTIBLE BONDS | | 13,437,780 |
TOTAL CORPORATE BONDS (Cost $83,532,173) | 83,880,706 |
Money Market Funds - 0.3% |
| Shares | | |
Fidelity Cash Central Fund, 2.24% (b) | 12,522,005 | | 12,522,005 |
Fidelity Securities Lending Cash Central Fund, 2.23% (b)(e) | 16,586,000 | | 16,586,000 |
TOTAL MONEY MARKET FUNDS (Cost $29,108,005) | 29,108,005 |
TOTAL INVESTMENT
PORTFOLIO - 100.1% (Cost $8,609,477,276) | | 11,302,328,450 |
NET OTHER ASSETS - (0.1)% | | (15,105,563) |
NET ASSETS - 100% | $ 11,287,222,887 |
Security Type Abbreviations |
PIERS | - | Preferred Income Equity Redeemable Securities |
Legend |
(a) Non-income producing |
(b) Affiliated fund that is available only to investment companies and other accounts managed by Fidelity Investments. The rate quoted is the annualized seven-day yield of the fund at period end. A complete listing of the fund's holdings as of its most recent fiscal year end is available upon request. |
(c) Security or a portion of the security is on loan at period end. |
(d) Security exempt from registration under Rule 144A of the Securities Act of 1933. These securities may be resold in transactions exempt from registration, normally to qualified institutional buyers. At the period end, the value of these securities amounted to $33,365,404 or 0.3% of net assets. |
(e) Includes investment made with cash collateral received from securities on loan. |
Distribution of investments by country of issue, as a percentage of total net assets, is as follows: |
United States of America | 88.1% |
France | 2.6% |
United Kingdom | 2.4% |
Japan | 1.2% |
Netherlands Antilles | 1.1% |
Others (individually less than 1%) | 4.6% |
| 100.0% |
Income Tax Information |
The fund hereby designates as capital gain dividends: For dividends with respect to the taxable year ended December 31, 2004, $346,587,000 or, if different, the net capital gain of such year, and for dividends with respect to the taxable year ended December 31, 2003, $38,802,000 or, if different, the excess of (a) the net capital gain of such year, over (b) amounts previously designated as capital gain dividends with respect to such year. |
See accompanying notes which are an integral part of the financial statements.
Equity-Income Portfolio
Fidelity Variable Insurance Products: Equity-Income Portfolio
Financial Statements
Statement of Assets and Liabilities
December 31, 2004 |
Assets | | |
Investment in securities, at value (including securities loaned of $15,755,088) (cost $8,609,477,276) - See accompanying schedule | | $ 11,302,328,450 |
Receivable for fund shares sold | | 3,091,666 |
Dividends receivable | | 15,480,610 |
Interest receivable | | 827,433 |
Prepaid expenses | | 40,772 |
Other affiliated receivables | | 47,175 |
Other receivables | | 339,933 |
Total assets | | 11,322,156,039 |
| | |
Liabilities | | |
Payable for investments purchased | $ 470,842 | |
Payable for fund shares redeemed | 10,653,620 | |
Accrued management fee | 4,398,026 | |
Distribution fees payable | 385,209 | |
Other affiliated payables | 953,526 | |
Other payables and accrued expenses | 1,485,929 | |
Collateral on securities loaned, at value | 16,586,000 | |
Total liabilities | | 34,933,152 |
| | |
Net Assets | | $ 11,287,222,887 |
Net Assets consist of: | | |
Paid in capital | | $ 8,042,639,374 |
Undistributed net investment income | | 170,688,068 |
Accumulated undistributed net realized gain (loss) on investments and foreign currency transactions | | 381,040,713 |
Net unrealized appreciation (depreciation) on investments and assets and liabilities in foreign currencies | | 2,692,854,732 |
Net Assets | | $ 11,287,222,887 |
| | |
Initial Class:
Net Asset Value, offering price
and redemption price per
share ($8,689,828,908 ÷ 342,542,001 shares) | | $ 25.37 |
| | |
Service Class:
Net Asset Value, offering price
and redemption price per
share ($1,170,777,702 ÷ 46,313,238 shares) | | $ 25.28 |
| | |
Service Class 2:
Net Asset Value, offering price
and redemption price per
share ($1,420,999,293 ÷ 56,645,362 shares) | | $ 25.09 |
| | |
Service Class 2R:
Net Asset Value, offering price
and redemption price per
share ($5,616,984 ÷
224,552 shares) | | $ 25.01 |
Statement of Operations
Year ended December 31, 2004 |
Investment Income | | |
Dividends | | $ 236,033,278 |
Interest | | 4,492,568 |
Security lending | | 990,003 |
Total income | | 241,515,849 |
| | |
Expenses | | |
Management fee | $ 50,339,584 | |
Transfer agent fees | 7,040,948 | |
Distribution fees | 3,960,547 | |
Accounting and security lending fees | 1,403,577 | |
Non-interested trustees' compensation | 58,219 | |
Appreciation in deferred trustee compensation account | 26,259 | |
Custodian fees and expenses | 286,747 | |
Registration fees | 8,658 | |
Audit | 103,482 | |
Legal | 28,314 | |
Interest | 9,745 | |
Miscellaneous | 1,847,706 | |
Total expenses before reductions | 65,113,786 | |
Expense reductions | (874,557) | 64,239,229 |
Net investment income (loss) | | 177,276,620 |
Realized and Unrealized Gain (Loss) Net realized gain (loss) on: | | |
Investment securities | 393,977,845 | |
Foreign currency transactions | 10,545 | |
Total net realized gain (loss) | | 393,988,390 |
Change in net unrealized appreciation (depreciation) on: Investment securities (net of decrease in deferred foreign taxes of $1,499,172) | 595,198,380 | |
Assets and liabilities in foreign currencies | (21,670) | |
Total change in net unrealized appreciation (depreciation) | | 595,176,710 |
Net gain (loss) | | 989,165,100 |
Net increase (decrease) in net assets resulting from operations | | $ 1,166,441,720 |
See accompanying notes which are an integral part of the financial statements.
Annual Report
Fidelity Variable Insurance Products: Equity-Income Portfolio
Financial Statements - continued
Statement of Changes in Net Assets
| Year ended
December 31,
2004 | Year ended
December 31,
2003 |
Increase (Decrease) in Net Assets | | |
Operations | | |
Net investment income (loss) | $ 177,276,620 | $ 156,056,293 |
Net realized gain (loss) | 393,988,390 | 162,136,844 |
Change in net unrealized appreciation (depreciation) | 595,176,710 | 2,060,660,428 |
Net increase (decrease) in net assets resulting from operations | 1,166,441,720 | 2,378,853,565 |
Distributions to shareholders from net investment income | (160,632,605) | (152,426,442) |
Distributions to shareholders from net realized gain | (38,902,738) | - |
Total distributions | (199,535,343) | (152,426,442) |
Share transactions - net increase (decrease) | (72,700,137) | 95,024,961 |
Redemption fees | 27 | 6,803 |
Total increase (decrease) in net assets | 894,206,267 | 2,321,458,887 |
| | |
Net Assets | | |
Beginning of period | 10,393,016,620 | 8,071,557,733 |
End of period (including undistributed net investment income of $170,688,068 and undistributed net investment income of $153,745,641, respectively) | $ 11,287,222,887 | $ 10,393,016,620 |
Other Information: | | | | |
Share Transactions | Year ended December 31, 2004 |
| Initial Class | Service Class | Service Class 2 | Service Class 2R |
Shares Sold | 19,642,612 | 4,254,175 | 21,126,824 | 207,129 |
Reinvested | 6,898,356 | 858,454 | 759,147 | 2,031 |
Redeemed | (46,454,587) | (5,170,065) | (5,169,545) | (67,130) |
Net increase (decrease) | (19,913,619) | (57,436) | 16,716,426 | 142,030 |
| | | | |
Dollars Sold | $ 460,321,782 | $ 99,280,265 | $ 490,310,488 | $ 4,777,338 |
Reinvested | 161,766,458 | 20,079,238 | 17,642,584 | 47,063 |
Redeemed | (1,086,286,467) | (119,952,965) | (119,145,127) | (1,540,794) |
Net increase (decrease) | $ (464,198,227) | $ (593,462) | $ 388,807,945 | $ 3,283,607 |
| | | | |
Share Transactions | Year ended December 31, 2003 |
| Initial Class | Service Class | Service Class 2 | Service Class 2R |
Shares Sold | 32,080,268 | 11,240,469 | 21,169,436 | 138,968 |
Reinvested | 7,869,268 | 847,723 | 452,997 | 1,082 |
Redeemed | (57,207,152) | (8,346,250) | (4,117,145) | (83,694) |
Net increase (decrease) | (17,257,616) | 3,741,942 | 17,505,288 | 56,356 |
| | | | |
Dollars Sold | $ 628,858,276 | $ 219,068,172 | $ 416,030,936 | $ 2,784,343 |
Reinvested | 130,865,933 | 14,063,717 | 7,478,977 | 17,815 |
Redeemed | (1,083,344,265) | (159,436,339) | (79,803,985) | (1,558,619) |
Net increase (decrease) | $ (323,620,056) | $ 73,695,550 | $ 343,705,928 | $ 1,243,539 |
| | | | |
Distributions | Year ended December 31, 2004 |
| Initial Class | Service Class | Service Class 2 | Service Class 2R |
From net investment income | $ 130,573,823 | $ 16,025,683 | $ 13,995,319 | $ 37,780 |
From net realized gain | 31,192,635 | 4,053,555 | 3,647,265 | 9,283 |
Total | $ 161,766,458 | $ 20,079,238 | $ 17,642,584 | $ 47,063 |
| Year ended December 31, 2003 |
| Initial Class | Service Class | Service Class 2 | Service Class 2R |
From net investment income | $ 130,865,933 | $ 14,063,717 | $ 7,478,977 | $ 17,815 |
From net realized gain | - | - | - | - |
Total | $ 130,865,933 | $ 14,063,717 | $ 7,478,977 | $ 17,815 |
See accompanying notes which are an integral part of the financial statements.
Equity-Income Portfolio
Financial Highlights - Initial Class
Years ended December 31, | 2004 | 2003 | 2002 | 2001 | 2000 |
Selected Per-Share Data | | | | | |
Net asset value, beginning of period | $ 23.18 | $ 18.16 | $ 22.75 | $ 25.52 | $ 25.71 |
Income from Investment Operations | | | | | |
Net investment income (loss) C | .40 | .36 | .34 | .34 | .40 |
Net realized and unrealized gain (loss) | 2.24 | 5.01 | (4.08) | (1.51) | 1.46 |
Total from investment operations | 2.64 | 5.37 | (3.74) | (1.17) | 1.86 |
Distributions from net investment income | (.36) | (.35) | (.36) | (.42) | (.44) |
Distributions from net realized gain | (.09) | - | (.49) | (1.18) | (1.61) |
Total distributions | (.45) | (.35) | (.85) | (1.60) | (2.05) |
Redemption fees added to paid in capital | - C, E | - C, E | - C, E | - | - |
Net asset value, end of period | $ 25.37 | $ 23.18 | $ 18.16 | $ 22.75 | $ 25.52 |
Total Return A, B | 11.53% | 30.33% | (16.95)% | (4.96)% | 8.42% |
Ratios to Average Net Assets D | | | | | |
Expenses before expense reductions | .58% | .57% | .57% | .58% | .56% |
Expenses net of voluntary waivers, if any | .58% | .57% | .57% | .58% | .56% |
Expenses net of all reductions | .57% | .56% | .56% | .57% | .55% |
Net investment income (loss) | 1.71% | 1.83% | 1.70% | 1.47% | 1.68% |
Supplemental Data | | | | | |
Net assets, end of period (000 omitted) | $ 8,689,829 | $ 8,402,963 | $ 6,895,940 | $ 9,256,205 | $ 9,969,086 |
Portfolio turnover rate | 22% | 26% | 25% | 24% | 22% |
A Total returns do not reflect charges attributable to your insurance company's separate account. Inclusion of these charges would reduce the total returns shown.
B Total returns would have been lower had certain expenses not been reduced during the periods shown.
C Calculated based on average shares outstanding during the period.
D Expense ratios reflect operating expenses of the class. Expenses before reductions do not reflect amounts reimbursed by the investment adviser or reductions from brokerage service arrangements or other expense offset arrangements and do not represent the amount paid by the class during periods when reimbursements or reductions occur. Expenses net of any voluntary waivers reflect expenses after reimbursement by the investment adviser but prior to reductions from brokerage service arrangements or other expense offset arrangements. Expenses net of all reductions represent the net expenses paid by the class.
E Amount represents less than $.01 per share.
Financial Highlights - Service Class
Years ended December 31, | 2004 | 2003 | 2002 | 2001 | 2000 |
Selected Per-Share Data | | | | | |
Net asset value, beginning of period | $ 23.11 | $ 18.10 | $ 22.67 | $ 25.45 | $ 25.66 |
Income from Investment Operations | | | | | |
Net investment income (loss) C | .38 | .34 | .32 | .31 | .37 |
Net realized and unrealized gain (loss) | 2.22 | 5.00 | (4.06) | (1.51) | 1.46 |
Total from investment operations | 2.60 | 5.34 | (3.74) | (1.20) | 1.83 |
Distributions from net investment income | (.34) | (.33) | (.34) | (.40) | (.43) |
Distributions from net realized gain | (.09) | - | (.49) | (1.18) | (1.61) |
Total distributions | (.43) | (.33) | (.83) | (1.58) | (2.04) |
Redemption fees added to paid in capital | - C, E | - C, E | - C, E | - | - |
Net asset value, end of period | $ 25.28 | $ 23.11 | $ 18.10 | $ 22.67 | $ 25.45 |
Total Return A, B | 11.38% | 30.22% | (17.00)% | (5.09)% | 8.30% |
Ratios to Average Net Assets D | | | | | |
Expenses before expense reductions | .68% | .67% | .67% | .68% | .66% |
Expenses net of voluntary waivers, if any | .68% | .67% | .67% | .68% | .66% |
Expenses net of all reductions | .67% | .66% | .66% | .67% | .65% |
Net investment income (loss) | 1.61% | 1.73% | 1.60% | 1.37% | 1.58% |
Supplemental Data | | | | | |
Net assets, end of period (000 omitted) | $ 1,170,778 | $ 1,071,483 | $ 771,516 | $ 836,017 | $ 634,897 |
Portfolio turnover rate | 22% | 26% | 25% | 24% | 22% |
A Total returns do not reflect charges attributable to your insurance company's separate account. Inclusion of these charges would reduce the total returns shown.
B Total returns would have been lower had certain expenses not been reduced during the periods shown.
C Calculated based on average shares outstanding during the period.
D Expense ratios reflect operating expenses of the class. Expenses before reductions do not reflect amounts reimbursed by the investment adviser or reductions from brokerage service arrangements or other expense offset arrangements and do not represent the amount paid by the class during periods when reimbursements or reductions occur. Expenses net of any voluntary waivers reflect expenses after reimbursement by the investment adviser but prior to reductions from brokerage service arrangements or other expense offset arrangements. Expenses net of all reductions represent the net expenses paid by the class.
E Amount represents less than $.01 per share.
See accompanying notes which are an integral part of the financial statements.
Annual Report
Financial Highlights - Service Class 2
Years ended December 31, | 2004 | 2003 | 2002 | 2001 | 2000 F |
Selected Per-Share Data | | | | | |
Net asset value, beginning of period | $ 22.96 | $ 18.00 | $ 22.59 | $ 25.41 | $ 25.18 |
Income from Investment Operations | | | | | |
Net investment income (loss) E | .34 | .31 | .28 | .27 | .32 |
Net realized and unrealized gain (loss) | 2.21 | 4.97 | (4.04) | (1.50) | 1.95 |
Total from investment operations | 2.55 | 5.28 | (3.76) | (1.23) | 2.27 |
Distributions from net investment income | (.33) | (.32) | (.34) | (.41) | (.43) |
Distributions from net realized gain | (.09) | - | (.49) | (1.18) | (1.61) |
Total distributions | (.42) | (.32) | (.83) | (1.59) | (2.04) |
Redemption fees added to paid in capital | - E, H | - E, H | - E, H | - | - |
Net asset value, end of period | $ 25.09 | $ 22.96 | $ 18.00 | $ 22.59 | $ 25.41 |
Total Return B, C, D | 11.23% | 30.03% | (17.15)% | (5.23)% | 10.19% |
Ratios to Average Net Assets G | | | | | |
Expenses before expense reductions | .83% | .82% | .83% | .84% | .83% A |
Expenses net of voluntary waivers, if any | .83% | .82% | .83% | .84% | .83% A |
Expenses net of all reductions | .82% | .81% | .82% | .83% | .82% A |
Net investment income (loss) | 1.46% | 1.58% | 1.44% | 1.21% | 1.41% A |
Supplemental Data | | | | | |
Net assets, end of period (000 omitted) | $ 1,420,999 | $ 916,679 | $ 403,632 | $ 226,078 | $ 39,911 |
Portfolio turnover rate | 22% | 26% | 25% | 24% | 22% |
A Annualized
B Total returns for periods of less than one year are not annualized.
C Total returns do not reflect charges attributable to your insurance company's separate account. Inclusion of these charges would reduce the total returns shown.
D Total returns would have been lower had certain expenses not been reduced during the periods shown.
E Calculated based on average shares outstanding during the period.
F For the period January 12, 2000 (commencement of sale of shares) to December 31, 2000.
G Expense ratios reflect operating expenses of the class. Expenses before reductions do not reflect amounts reimbursed by the investment adviser or reductions from brokerage service arrangements or other expense offset arrangements and do not represent the amount paid by the class during periods when reimbursements or reductions occur. Expense ratios before reductions for start-up periods may not be representative of longer-term operating periods. Expenses net of any voluntary waivers reflect expenses after reimbursement by the investment adviser but prior to reductions from brokerage service arrangements or other expense offset arrangements. Expenses net of all reductions represent the net expenses paid by the class.
H Amount represents less than $.01 per share.
Financial Highlights - Service Class 2R
Years ended December 31, | 2004 | 2003 | 2002 F |
Selected Per-Share Data | | | |
Net asset value, beginning of period | $ 22.91 | $ 17.99 | $ 21.82 |
Income from Investment Operations | | | |
Net investment income (loss) E | .34 | .31 | .18 |
Net realized and unrealized gain (loss) | 2.20 | 4.96 | (4.01) |
Total from investment operations | 2.54 | 5.27 | (3.83) |
Distributions from net investment income | (.35) | (.35) | - |
Distributions from net realized gain | (.09) | - | - |
Total distributions | (.44) | (.35) | - |
Redemption fees added to paid in capital E, H | - | - | - |
Net asset value, end of period | $ 25.01 | $ 22.91 | $ 17.99 |
Total Return B, C, D | 11.22% | 30.05% | (17.55)% |
Ratios to Average Net Assets G | | | |
Expenses before expense reductions | .83% | .82% | .85% A |
Expenses net of voluntary waivers, if any | .83% | .82% | .85% A |
Expenses net of all reductions | .82% | .81% | .84% A |
Net investment income (loss) | 1.46% | 1.57% | 1.45% A |
Supplemental Data | | | |
Net assets, end of period (000 omitted) | $ 5,617 | $ 1,891 | $ 471 |
Portfolio turnover rate | 22% | 26% | 25% |
A Annualized
B Total returns for periods of less than one year are not annualized.
C Total returns do not reflect charges attributable to your insurance company's separate account. Inclusion of these charges would reduce the total returns shown.
D Total returns would have been lower had certain expenses not been reduced during the periods shown.
E Calculated based on average shares outstanding during the period.
F For the period April 24, 2002 (commencement of sale of shares) to December 31, 2002.
G Expense ratios reflect operating expenses of the class. Expenses before reductions do not reflect amounts reimbursed by the investment adviser or reductions from brokerage service arrangements or other expense offset arrangements and do not represent the amount paid by the class during periods when reimbursements or reductions occur. Expense ratios before reductions for start-up periods may not be representative of longer-term operating periods. Expenses net of any voluntary waivers reflect expenses after reimbursement by the investment adviser but prior to reductions from brokerage service arrangements or other expense offset arrangements. Expenses net of all reductions represent the net expenses paid by the class.
H Amount represents less than $.01 per share.
See accompanying notes which are an integral part of the financial statements.
Equity-Income Portfolio
Fidelity Variable Insurance Products: Growth Portfolio
Performance: The Bottom Line
Average annual total return reflects the change in the value of an investment, assuming reinvestment of the class' dividend income and capital gains (the profits earned upon the sale of securities that have grown in value) and assuming a constant rate of performance each year. During periods of reimbursement by Fidelity, a fund's total return will be greater than it would be had the reimbursement not occurred. Performance numbers are net of all underlying fund operating expenses, but do not include any insurance charges imposed by your insurance company's separate account. If performance information included the effect of these additional charges, the total returns would have been lower. How a fund did yesterday is no guarantee of how it will do tomorrow.
Average Annual Total Returns
Periods ended December 31, 2004 | Past 1
year | Past 5
years | Past 10
years |
Fidelity ® VIP: Growth - Initial Class | 3.38% | -6.79% | 9.97% |
Fidelity VIP: Growth - Service Class A | 3.26% | -6.88% | 9.89% |
Fidelity VIP: Growth - Service Class 2 B | 3.12% | -7.02% | 9.81% |
A The initial offering of Service Class shares took place on November 3, 1997. Performance for Service Class shares reflects an asset-based service fee (12b-1 fee), and returns prior to November 3, 1997 are those of Initial Class and do not include the effects of Service Class 12b-1 fee. Had Service Class shares 12b-1 fee been reflected, returns prior to November 3, 1997 would have been lower.
B The initial offering of Service Class 2 shares took place on January 12, 2000. Performance for Service Class 2 shares reflects an asset-based service fee (12b-1 fee). Returns from November 3, 1997 through January 12, 2000 are those of Service Class which reflect a different 12b-1 fee. Service Class 2 returns prior to November 3, 1997 are those of Initial Class, and do not include the effects of a 12b-1 fee. Had Service Class 2's 12b-1 fee been reflected, returns prior to January 12, 2000 would have been lower.
$10,000 Over 10 Years
Let's say hypothetically that $10,000 was invested in Fidelity® Variable Insurance Products: Growth Portfolio - Initial Class on December 31, 1994. The chart shows how the value of your investment would have changed, and also shows how the Russell 3000® Growth Index performed over the same period.
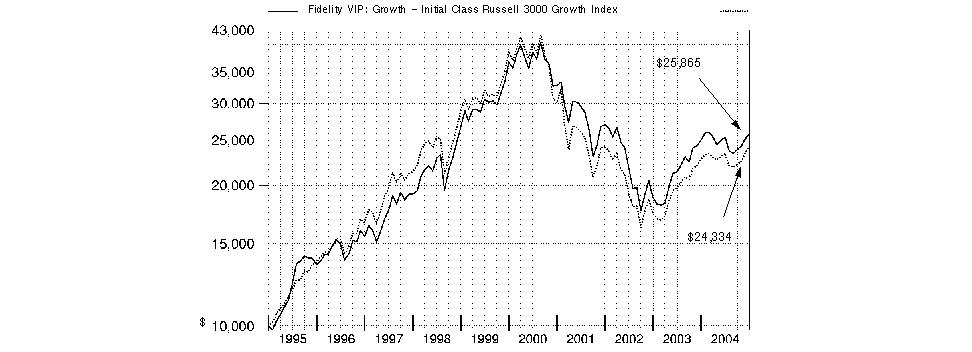
Annual Report
Fidelity Variable Insurance Products: Growth Portfolio
Management's Discussion of Fund Performance
Comments from Jennifer Uhrig, Portfolio Manager of Fidelity® Variable Insurance Products: Growth Portfolio
The year ending December 31, 2004, generally was positive for equity investors, as many stock market benchmarks produced double-digit gains. Broad-based themes included the continued dominance of small-cap stocks, which outperformed large-caps for the sixth consecutive year. The small-cap Russell 2000® Index was up 18.33% in 2004, while the larger-cap Standard & Poor's 500SM Index rose 10.88%. Value stocks ended the year well ahead of growth stocks: The Russell 3000® Value Index advanced 16.94%, compared to 6.93% for the Russell 3000 Growth Index. Energy and basic materials stocks led the market upward. Energy stocks were boosted by record-high oil prices, while strong demand from China helped support commodity prices. The health care sector was among the market's weakest performers. Technology also fell off the pace, though it was helped by a rally late in the year. The tech-heavy NASDAQ Composite® Index returned 9.15%, thanks primarily to a 14.87% jump in the fourth quarter. Elsewhere, the Dow Jones Industrial AverageSM gained 5.37% for the year.
For the 12 months that ended December 31, 2004, the fund lagged both the LipperSM Variable Annuity Growth Funds Average, which gained 10.36%, and the Russell 3000 Growth Index. The fund's large overweighting compared with the index in the semiconductor industry accounted for most of the drag on performance. Capacity outgrew demand for semiconductors during the period, which compressed the earnings and stock prices of many companies within the group. Among those hardest hit were fund holdings ASML Holding, Agere Systems, Teradyne and Intersil, as well as the fund's biggest detractor, Synopsys, which makes software for designing chips. Performance also was hurt by the fund's focus on large-cap growth companies at a time when smaller-cap, value-oriented stocks were generally performing better. On the positive side, wireless communications stocks, such as Ericsson and QUALCOMM, and energy services companies, such as Halliburton, helped boost relative performance. The fund no longer holds Ericsson stock.
The views expressed in this statement reflect those of the portfolio manager only through the end of the period of the report as stated on the cover and do not necessarily represent the views of Fidelity or any other person in the Fidelity organization. Any such views are subject to change at any time based upon market or other conditions and Fidelity disclaims any responsibility to update such views. These views may not be relied on as investment advice and, because investment decisions for a Fidelity fund are based on numerous factors, may not be relied on as an indication of trading intent on behalf of any Fidelity fund.
Annual Report
Fidelity Variable Insurance Products: Growth Portfolio
Investment Summary
Top Five Stocks as of December 31, 2004 |
| % of fund's net assets |
Johnson & Johnson | 2.8 |
Microsoft Corp. | 2.6 |
Intel Corp. | 2.6 |
Wal-Mart Stores, Inc. | 2.5 |
Dell, Inc. | 2.2 |
| 12.7 |
Top Five Market Sectors as of December 31, 2004 |
| % of fund's net assets |
Information Technology | 34.5 |
Health Care | 19.4 |
Consumer Discretionary | 12.2 |
Industrials | 11.3 |
Financials | 9.0 |
Asset Allocation as of December 31, 2004 |
% of fund's net assets* |
| Stocks | 99.3% | |
| Short-Term Investments and Net Other Assets | 0.7% | |
* Foreign investments | 8.8% | |

Annual Report
Fidelity Variable Insurance Products: Growth Portfolio
Investments December 31, 2004
Showing Percentage of Net Assets
Common Stocks - 99.3% |
| Shares | | Value (Note 1) |
CONSUMER DISCRETIONARY - 12.2% |
Automobiles - 0.2% |
Harley-Davidson, Inc. | 396,200 | | $ 24,069,150 |
Hotels, Restaurants & Leisure - 1.4% |
Carnival Corp. unit | 403,100 | | 23,230,653 |
Hilton Group PLC | 1,886,329 | | 10,298,785 |
McDonald's Corp. | 1,433,200 | | 45,948,392 |
Rank Group PLC | 2,796,306 | | 14,166,903 |
Royal Caribbean Cruises Ltd. | 419,600 | | 22,843,024 |
Starbucks Corp. (a) | 391,800 | | 24,432,648 |
| | 140,920,405 |
Household Durables - 0.2% |
Tempur-Pedic International, Inc. | 694,300 | | 14,719,160 |
Internet & Catalog Retail - 1.7% |
eBay, Inc. (a) | 1,156,600 | | 134,489,448 |
IAC/InterActiveCorp (a) | 1,342,784 | | 37,087,694 |
| | 171,577,142 |
Media - 2.6% |
E.W. Scripps Co. Class A | 839,400 | | 40,526,232 |
Fox Entertainment Group, Inc.
Class A (a) | 1,554,900 | | 48,606,174 |
Getty Images, Inc. (a) | 163,400 | | 11,250,090 |
Lamar Advertising Co. Class A (a) | 948,560 | | 40,579,397 |
News Corp.: | | | |
Class A | 657,722 | | 12,273,093 |
Class B | 1,149,000 | | 22,060,800 |
Pixar (a) | 147,632 | | 12,638,776 |
SBS Broadcasting SA (a) | 195,400 | | 7,860,942 |
Walt Disney Co. | 2,128,400 | | 59,169,520 |
| | 254,965,024 |
Multiline Retail - 1.5% |
Dollar Tree Stores, Inc. (a) | 1,235,300 | | 35,428,404 |
Family Dollar Stores, Inc. | 697,900 | | 21,795,417 |
Fred's, Inc. Class A (d) | 940,644 | | 16,367,206 |
Kohl's Corp. (a) | 90,900 | | 4,469,553 |
Nordstrom, Inc. | 728,500 | | 34,042,805 |
Saks, Inc. | 2,822,700 | | 40,957,377 |
| | 153,060,762 |
Specialty Retail - 4.2% |
Bed Bath & Beyond, Inc. (a) | 751,500 | | 29,932,245 |
Best Buy Co., Inc. | 547,800 | | 32,550,276 |
Circuit City Stores, Inc. | 997,800 | | 15,605,592 |
Foot Locker, Inc. | 1,273,980 | | 34,308,281 |
Home Depot, Inc. | 4,575,900 | | 195,573,966 |
RadioShack Corp. | 605,800 | | 19,918,704 |
Staples, Inc. | 1,512,900 | | 50,999,859 |
Weight Watchers International, Inc. (a)(d) | 856,000 | | 35,155,920 |
| | 414,044,843 |
|
| Shares | | Value (Note 1) |
Textiles, Apparel & Luxury Goods - 0.4% |
NIKE, Inc. Class B | 443,100 | | $ 40,184,739 |
TOTAL CONSUMER DISCRETIONARY | | 1,213,541,225 |
CONSUMER STAPLES - 7.0% |
Beverages - 1.7% |
PepsiCo, Inc. | 3,041,000 | | 158,740,200 |
The Coca-Cola Co. | 241,100 | | 10,036,993 |
| | 168,777,193 |
Food & Staples Retailing - 2.8% |
Wal-Mart Stores, Inc. | 4,638,700 | | 245,016,134 |
Walgreen Co. | 883,400 | | 33,896,058 |
| | 278,912,192 |
Food Products - 0.9% |
Archer-Daniels-Midland Co. | 1,765,300 | | 39,383,843 |
Bunge Ltd. | 739,300 | | 42,147,493 |
Corn Products International, Inc. | 185,400 | | 9,930,024 |
| | 91,461,360 |
Household Products - 1.1% |
Procter & Gamble Co. | 2,016,420 | | 111,064,414 |
Personal Products - 0.5% |
Gillette Co. | 965,400 | | 43,230,612 |
TOTAL CONSUMER STAPLES | | 693,445,771 |
ENERGY - 4.4% |
Energy Equipment & Services - 4.0% |
Baker Hughes, Inc. | 1,796,470 | | 76,655,375 |
BJ Services Co. | 238,760 | | 11,111,890 |
Halliburton Co. | 2,737,100 | | 107,403,804 |
National-Oilwell, Inc. (a) | 902,900 | | 31,863,341 |
Schlumberger Ltd. (NY Shares) | 1,511,400 | | 101,188,230 |
Smith International, Inc. (a) | 452,400 | | 24,615,084 |
Transocean, Inc. (a) | 305,700 | | 12,958,623 |
Weatherford International Ltd. (a) | 611,740 | | 31,382,262 |
| | 397,178,609 |
Oil & Gas - 0.4% |
Noble Energy, Inc. | 129,100 | | 7,960,306 |
Premcor, Inc. | 363,500 | | 15,328,795 |
Valero Energy Corp. | 344,100 | | 15,622,140 |
| | 38,911,241 |
TOTAL ENERGY | | 436,089,850 |
FINANCIALS - 9.0% |
Capital Markets - 2.0% |
E*TRADE Financial Corp. (a) | 2,495,400 | | 37,306,230 |
Goldman Sachs Group, Inc. | 507,400 | | 52,789,896 |
Lehman Brothers Holdings, Inc. | 352,400 | | 30,827,952 |
Merrill Lynch & Co., Inc. | 514,800 | | 30,769,596 |
Common Stocks - continued |
| Shares | | Value (Note 1) |
FINANCIALS - continued |
Capital Markets - continued |
Morgan Stanley | 383,000 | | $ 21,264,160 |
Nomura Holdings, Inc. | 1,782,000 | | 25,945,920 |
| | 198,903,754 |
Commercial Banks - 1.2% |
Bank of America Corp. | 1,536,100 | | 72,181,339 |
UCBH Holdings, Inc. | 965,900 | | 44,257,538 |
| | 116,438,877 |
Consumer Finance - 2.6% |
American Express Co. | 2,319,900 | | 130,772,763 |
Capital One Financial Corp. | 593,200 | | 49,953,372 |
MBNA Corp. | 2,766,130 | | 77,977,205 |
| | 258,703,340 |
Diversified Financial Services - 0.6% |
Citigroup, Inc. | 213,210 | | 10,272,458 |
J.P. Morgan Chase & Co. | 1,325,266 | | 51,698,627 |
| | 61,971,085 |
Insurance - 1.9% |
AFLAC, Inc. | 471,920 | | 18,801,293 |
American International Group, Inc. | 2,575,166 | | 169,111,151 |
XL Capital Ltd. Class A | 53,100 | | 4,123,215 |
| | 192,035,659 |
Thrifts & Mortgage Finance - 0.7% |
Fannie Mae | 863,600 | | 61,496,956 |
New York Community Bancorp, Inc. | 447,500 | | 9,205,075 |
| | 70,702,031 |
TOTAL FINANCIALS | | 898,754,746 |
HEALTH CARE - 19.4% |
Biotechnology - 3.9% |
Biogen Idec, Inc. (a) | 886,600 | | 59,056,426 |
Cephalon, Inc. (a) | 905,000 | | 46,046,400 |
CSL Ltd. | 873,467 | | 19,989,467 |
Eyetech Pharmaceuticals, Inc. | 366,200 | | 16,662,100 |
Genentech, Inc. (a) | 1,863,700 | | 101,459,828 |
Genzyme Corp. - General Division (a) | 550,900 | | 31,990,763 |
ImClone Systems, Inc. (a) | 697,300 | | 32,131,584 |
Millennium Pharmaceuticals, Inc. (a) | 2,608,956 | | 31,620,547 |
ONYX Pharmaceuticals, Inc. (a) | 485,100 | | 15,712,389 |
QLT, Inc. (a) | 393,000 | | 6,297,825 |
Tanox, Inc. (a) | 1,042,600 | | 15,847,520 |
Telik, Inc. (a) | 459,400 | | 8,792,916 |
| | 385,607,765 |
Health Care Equipment & Supplies - 4.6% |
Alcon, Inc. | 676,700 | | 54,542,020 |
Baxter International, Inc. | 2,321,100 | | 80,170,794 |
Beckman Coulter, Inc. | 311,400 | | 20,860,686 |
Becton, Dickinson & Co. | 1,006,000 | | 57,140,800 |
C.R. Bard, Inc. | 366,400 | | 23,442,272 |
|
| Shares | | Value (Note 1) |
Dade Behring Holdings, Inc. (a) | 477,400 | | $ 26,734,400 |
Medtronic, Inc. | 1,810,300 | | 89,917,601 |
Ocular Sciences, Inc. (a) | 304,900 | | 14,943,149 |
St. Jude Medical, Inc. (a) | 743,000 | | 31,153,990 |
Thermo Electron Corp. (a) | 242,400 | | 7,318,056 |
Waters Corp. (a) | 1,076,200 | | 50,355,398 |
| | 456,579,166 |
Health Care Providers & Services - 0.9% |
McKesson Corp. | 533,400 | | 16,780,764 |
UnitedHealth Group, Inc. | 883,900 | | 77,809,717 |
| | 94,590,481 |
Pharmaceuticals - 10.0% |
Abbott Laboratories | 1,880,200 | | 87,711,330 |
Allergan, Inc. | 655,950 | | 53,177,867 |
Barr Pharmaceuticals, Inc. (a) | 840,472 | | 38,275,095 |
Elan Corp. PLC sponsored ADR (a) | 950,500 | | 25,901,125 |
Eli Lilly & Co. | 358,470 | | 20,343,173 |
Johnson & Johnson | 4,464,720 | | 283,152,537 |
Pfizer, Inc. | 7,691,995 | | 206,837,746 |
Roche Holding AG (participation certificate) | 307,139 | | 35,095,439 |
Schering-Plough Corp. | 6,086,200 | | 127,079,856 |
Wyeth | 2,628,100 | | 111,930,779 |
| | 989,504,947 |
TOTAL HEALTH CARE | | 1,926,282,359 |
INDUSTRIALS - 11.3% |
Aerospace & Defense - 3.7% |
Bombardier, Inc. Class B (sub. vtg.) | 14,014,600 | | 27,795,623 |
EADS NV | 1,697,000 | | 49,241,178 |
Embraer - Empresa Brasileira de Aeronautica SA sponsored ADR | 1,492,210 | | 49,899,502 |
General Dynamics Corp. | 353,400 | | 36,965,640 |
Goodrich Corp. | 1,112,680 | | 36,317,875 |
Honeywell International, Inc. | 310,300 | | 10,987,723 |
Lockheed Martin Corp. | 969,520 | | 53,856,836 |
Precision Castparts Corp. | 529,674 | | 34,788,988 |
The Boeing Co. | 1,231,100 | | 63,734,047 |
| | 363,587,412 |
Air Freight & Logistics - 1.9% |
EGL, Inc. (a) | 150,900 | | 4,510,401 |
FedEx Corp. | 648,400 | | 63,860,916 |
Forward Air Corp. (a) | 107,700 | | 4,814,190 |
United Parcel Service, Inc. Class B | 1,263,100 | | 107,944,526 |
UTI Worldwide, Inc. | 143,400 | | 9,754,068 |
| | 190,884,101 |
Commercial Services & Supplies - 0.7% |
Apollo Group, Inc. Class A (a) | 157,400 | | 12,703,754 |
Common Stocks - continued |
| Shares | | Value (Note 1) |
INDUSTRIALS - continued |
Commercial Services & Supplies - continued |
Herman Miller, Inc. | 429,700 | | $ 11,872,611 |
Robert Half International, Inc. | 1,470,300 | | 43,270,929 |
| | 67,847,294 |
Industrial Conglomerates - 3.6% |
3M Co. | 1,187,100 | | 97,425,297 |
General Electric Co. | 5,144,640 | | 187,779,360 |
Siemens AG sponsored ADR | 428,300 | | 36,264,161 |
Tyco International Ltd. | 908,000 | | 32,451,920 |
| | 353,920,738 |
Machinery - 0.3% |
Joy Global, Inc. | 625,351 | | 27,158,994 |
Marine - 0.0% |
Alexander & Baldwin, Inc. | 11,700 | | 496,314 |
Road & Rail - 1.0% |
Burlington Northern Santa Fe Corp. | 707,700 | | 33,481,287 |
Norfolk Southern Corp. | 914,700 | | 33,102,993 |
Union Pacific Corp. | 533,700 | | 35,891,325 |
| | 102,475,605 |
Trading Companies & Distributors - 0.1% |
UAP Holding Corp. | 902,881 | | 15,592,755 |
TOTAL INDUSTRIALS | | 1,121,963,213 |
INFORMATION TECHNOLOGY - 34.5% |
Communications Equipment - 7.8% |
Alvarion Ltd. (a) | 863,500 | | 11,467,280 |
Andrew Corp. (a) | 1,803,300 | | 24,578,979 |
Avaya, Inc. (a) | 3,175,098 | | 54,611,686 |
Cisco Systems, Inc. (a) | 10,930,820 | | 210,964,826 |
Extreme Networks, Inc. (a) | 81,436 | | 533,406 |
F5 Networks, Inc. (a) | 368,600 | | 17,958,192 |
Foundry Networks, Inc. (a) | 1,743,200 | | 22,940,512 |
Harris Corp. | 872,000 | | 53,880,880 |
Juniper Networks, Inc. (a) | 2,616,000 | | 71,129,040 |
Motorola, Inc. | 5,886,150 | | 101,241,780 |
QUALCOMM, Inc. | 3,971,900 | | 168,408,560 |
Research In Motion Ltd. (a) | 408,390 | | 33,617,303 |
| | 771,332,444 |
Computers & Peripherals - 5.9% |
Apple Computer, Inc. (a) | 179,200 | | 11,540,480 |
Brocade Communications Systems, Inc. (a) | 2,962,000 | | 22,629,680 |
Dell, Inc. (a) | 5,261,460 | | 221,717,924 |
EMC Corp. (a) | 5,566,000 | | 82,766,420 |
International Business Machines Corp. | 821,370 | | 80,970,655 |
Lexmark International, Inc. Class A (a) | 707,200 | | 60,112,000 |
Network Appliance, Inc. (a) | 1,311,292 | | 43,561,120 |
QLogic Corp. (a) | 396,500 | | 14,563,445 |
|
| Shares | | Value (Note 1) |
Sun Microsystems, Inc. (a) | 6,336,150 | | $ 34,088,487 |
UNOVA, Inc. (a) | 680,300 | | 17,204,787 |
| | 589,154,998 |
Electronic Equipment & Instruments - 1.7% |
Amphenol Corp. Class A (a) | 506,582 | | 18,611,823 |
Arrow Electronics, Inc. (a) | 846,300 | | 20,565,090 |
Hon Hai Precision Industries Co. Ltd. | 6,438,842 | | 29,773,821 |
Mettler-Toledo International, Inc. (a) | 437,600 | | 22,453,256 |
Molex, Inc. | 703,200 | | 21,096,000 |
National Instruments Corp. | 1,210,629 | | 32,989,640 |
Solectron Corp. (a) | 4,272,300 | | 22,771,359 |
| | 168,260,989 |
Internet Software & Services - 1.3% |
Google, Inc. Class A | 299,700 | | 57,872,070 |
Yahoo!, Inc. (a) | 1,918,232 | | 72,278,982 |
| | 130,151,052 |
IT Services - 1.1% |
BearingPoint, Inc. (a) | 3,072,021 | | 24,668,329 |
First Data Corp. | 2,095,000 | | 89,121,300 |
| | 113,789,629 |
Office Electronics - 0.1% |
Zebra Technologies Corp. Class A (a) | 116,850 | | 6,576,318 |
Semiconductors & Semiconductor Equipment - 9.8% |
Agere Systems, Inc.: | | | |
Class A (a) | 8,448,145 | | 11,573,959 |
Class B (a) | 6,893,509 | | 9,306,237 |
Altera Corp. (a) | 2,183,000 | | 45,188,100 |
Analog Devices, Inc. | 1,408,900 | | 52,016,588 |
Applied Materials, Inc. (a) | 1,477,800 | | 25,270,380 |
ASML Holding NV (NY Shares) (a) | 2,542,776 | | 40,455,566 |
Fairchild Semiconductor International, Inc. (a) | 1,525,200 | | 24,799,752 |
Freescale Semiconductor, Inc.: | | | |
Class A | 3,041,300 | | 54,195,966 |
Class B | 649,919 | | 11,932,513 |
Integrated Circuit Systems, Inc. (a) | 1,552,759 | | 32,483,718 |
Intel Corp. | 11,075,800 | | 259,062,962 |
International Rectifier Corp. (a) | 486,400 | | 21,678,848 |
Intersil Corp. Class A | 2,966,736 | | 49,663,161 |
KLA-Tencor Corp. (a) | 486,100 | | 22,642,538 |
Lam Research Corp. (a) | 888,800 | | 25,695,208 |
Marvell Technology Group Ltd. (a) | 24,300 | | 861,921 |
MediaTek, Inc. | 2,656,000 | | 18,046,430 |
Microchip Technology, Inc. | 1,150,900 | | 30,682,994 |
ON Semiconductor Corp. (a) | 3,045,700 | | 13,827,478 |
PMC-Sierra, Inc. (a) | 3,316,682 | | 37,312,673 |
Taiwan Semiconductor Manufacturing Co. Ltd. sponsored ADR | 5,386,674 | | 45,732,862 |
Teradyne, Inc. (a) | 1,264,000 | | 21,576,480 |
Texas Instruments, Inc. | 1,442,650 | | 35,518,043 |
Tokyo Electron Ltd. | 377,300 | | 23,242,830 |
Common Stocks - continued |
| Shares | | Value (Note 1) |
INFORMATION TECHNOLOGY - continued |
Semiconductors & Semiconductor Equipment - continued |
United Microelectronics Corp. sponsored ADR (d) | 6,073,920 | | $ 21,440,938 |
Xilinx, Inc. | 1,438,000 | | 42,636,700 |
| | 976,844,845 |
Software - 6.8% |
Adobe Systems, Inc. | 340,874 | | 21,386,435 |
Cadence Design Systems, Inc. (a) | 3,260,000 | | 45,020,600 |
Cognos, Inc. (a) | 232,600 | | 10,238,277 |
Computer Associates International, Inc. | 5,455 | | 169,432 |
Macrovision Corp. (a) | 191,952 | | 4,937,005 |
McAfee, Inc. (a) | 636,700 | | 18,419,731 |
Microsoft Corp. | 9,714,850 | | 259,483,644 |
NAVTEQ Corp. | 90,700 | | 4,204,852 |
Novell, Inc. (a) | 4,444,826 | | 30,002,576 |
Oracle Corp. (a) | 7,579,691 | | 103,993,361 |
Red Hat, Inc. (a) | 719,500 | | 9,605,325 |
SAP AG sponsored ADR | 1,256,600 | | 55,554,286 |
Symantec Corp. (a) | 1,408,306 | | 36,277,963 |
Take-Two Interactive Software, Inc. (a) | 1,109,100 | | 38,585,589 |
VERITAS Software Corp. (a) | 1,227,400 | | 35,042,270 |
| | 672,921,346 |
TOTAL INFORMATION TECHNOLOGY | | 3,429,031,621 |
MATERIALS - 1.2% |
Chemicals - 0.5% |
Monsanto Co. | 617,800 | | 34,318,790 |
Syngenta AG sponsored ADR | 709,300 | | 15,143,555 |
| | 49,462,345 |
Containers & Packaging - 0.1% |
Smurfit-Stone Container Corp. (a) | 812,611 | | 15,179,573 |
Metals & Mining - 0.6% |
Arch Coal, Inc. | 374,500 | | 13,309,730 |
CONSOL Energy, Inc. | 465,300 | | 19,100,565 |
Massey Energy Co. | 676,800 | | 23,654,160 |
| | 56,064,455 |
TOTAL MATERIALS | | 120,706,373 |
TELECOMMUNICATION SERVICES - 0.3% |
Wireless Telecommunication Services - 0.3% |
Nextel Communications, Inc.
Class A (a) | 824,100 | | 24,723,000 |
TOTAL COMMON STOCKS (Cost $7,736,201,771) | 9,864,538,158 |
Preferred Stocks - 0.0% |
| Shares | | Value (Note 1) |
Convertible Preferred Stocks - 0.0% |
INFORMATION TECHNOLOGY - 0.0% |
Communications Equipment - 0.0% |
Chorum Technologies, Inc. Series E (a)(f) | 88,646 | | $ 0 |
Nonconvertible Preferred Stocks - 0.0% |
HEALTH CARE - 0.0% |
Biotechnology - 0.0% |
Geneprot, Inc. Series A (f) | 826,000 | | 2,891,000 |
TOTAL PREFERRED STOCKS (Cost $5,872,855) | 2,891,000 |
Convertible Bonds - 0.0% |
| Principal
Amount | | |
INFORMATION TECHNOLOGY - 0.0% |
Semiconductors & Semiconductor Equipment - 0.0% |
Micron Technology, Inc. 2.5%
2/1/10 (e) | $ 1,523,000 | | 1,806,430 |
TOTAL CONVERTIBLE BONDS (Cost $1,523,000) | 1,806,430 |
Money Market Funds - 0.7% |
| Shares | | |
Fidelity Cash Central Fund, 2.24% (b) | 40,371,676 | | 40,371,676 |
Fidelity Securities Lending Cash Central Fund, 2.23% (b)(c) | 25,933,096 | | 25,933,096 |
TOTAL MONEY MARKET FUNDS (Cost $66,304,772) | 66,304,772 |
TOTAL INVESTMENT
PORTFOLIO - 100.0% (Cost $7,809,902,398) | | 9,935,540,360 |
NET OTHER ASSETS - 0.0% | | 1,402,138 |
NET ASSETS - 100% | $ 9,936,942,498 |
Legend |
(a) Non-income producing |
(b) Affiliated fund that is available only to investment companies and other accounts managed by Fidelity Investments. The rate quoted is the annualized seven-day yield of the fund at period end. A complete listing of the fund's holdings as of its most recent fiscal year end is available upon request. |
(c) Includes investment made with cash collateral received from securities on loan. |
(d) Security or a portion of the security is on loan at period end. |
(e) Security exempt from registration under Rule 144A of the Securities Act of 1933. These securities may be resold in transactions exempt from registration, normally to qualified institutional buyers. At the period end, the value of these securities amounted to 1,806,430 or 0.0% of net assets. |
(f) Restricted securities - Investment in securities not registered under the Securities Act of 1933 (excluding 144A issues). At the end of the period, the value of restricted securities (excluding 144A issues) amounted to $2,891,000 or 0.0% of net assets. |
Additional information on each holding is as follows: |
Security | Acquisition Date | Acquisition Cost |
Chorum Technologies, Inc. Series E | 9/19/00 | $ 1,528,257 |
Geneprot, Inc. Series A | 7/7/00 | $ 4,543,000 |
Income Tax Information |
At December 31, 2004, the fund had a capital loss carryforward of approximately $3,653,617,000 of which $1,411,197,000, $2,197,712,000 and $44,708,000 will expire on December 31, 2009, 2010 and 2011, respectively. |
See accompanying notes which are an integral part of the financial statements.
Annual Report
Fidelity Variable Insurance Products: Growth Portfolio
Financial Statements
Statement of Assets and Liabilities
December 31, 2004 |
Assets | | |
Investment in securities, at value (including securities loaned of $24,929,493) (cost $7,809,902,398) - See accompanying schedule | | $ 9,935,540,360 |
Cash | | 54,548 |
Foreign currency held at value
(cost $29,573,196) | | 30,067,997 |
Receivable for investments sold | | 14,033,133 |
Receivable for fund shares sold | | 4,485,109 |
Dividends receivable | | 7,487,115 |
Interest receivable | | 113,675 |
Prepaid expenses | | 38,895 |
Other affiliated receivables | | 49,263 |
Other receivables | | 1,519,976 |
Total assets | | 9,993,390,071 |
Liabilities | | |
Payable for investments purchased | $ 3,936,983 | |
Payable for fund shares redeemed | 19,018,541 | |
Accrued management fee | 4,740,859 | |
Distribution fees payable | 276,915 | |
Other affiliated payables | 865,803 | |
Other payables and accrued expenses | 1,675,376 | |
Collateral on securities loaned, at value | 25,933,096 | |
Total liabilities | | 56,447,573 |
Net Assets | | $ 9,936,942,498 |
Net Assets consist of: | | |
Paid in capital | | $ 11,449,421,694 |
Undistributed net investment income | | 42,500,013 |
Accumulated undistributed net realized gain (loss) on investments and foreign currency transactions | | (3,681,114,074) |
Net unrealized appreciation (depreciation) on investments and assets and liabilities in foreign currencies | | 2,126,134,865 |
Net Assets | | $ 9,936,942,498 |
| | |
Initial Class:
Net Asset Value, offering price and redemption price per share ($7,796,887,587 ÷ 243,554,460 shares) | | $ 32.01 |
| | |
Service Class:
Net Asset Value, offering price and redemption price per share ($1,326,262,008 ÷ 41,602,270 shares) | | $ 31.88 |
| | |
Service Class 2:
Net Asset Value, offering price and redemption price per share ($811,126,385 ÷ 25,638,241 shares) | | $ 31.64 |
| | |
Service Class 2R:
Net Asset Value, offering price
and redemption price per share ($2,666,518 ÷ 84,539 shares) | | $ 31.54 |
Statement of Operations
Year ended December 31, 2004 |
| | |
Investment Income | | |
Dividends A | | $ 86,850,641 |
Special Dividends | | 26,028,750 |
Interest | | 880,245 |
Security lending | | 520,076 |
Total income | | 114,279,712 |
| | |
Expenses | | |
Management fee | $ 58,590,211 | |
Transfer agent fees | 6,723,531 | |
Distribution fees | 3,143,384 | |
Accounting and security lending fees | 1,387,678 | |
Non-interested trustees' compensation | 56,073 | |
Appreciation in deferred trustee compensation account | 14,142 | |
Custodian fees and expenses | 300,615 | |
Audit | 96,165 | |
Legal | 32,336 | |
Interest | 39,066 | |
Miscellaneous | 2,052,657 | |
Total expenses before reductions | 72,435,858 | |
Expense reductions | (3,293,886) | 69,141,972 |
Net investment income (loss) | | 45,137,740 |
Realized and Unrealized Gain (Loss) Net realized gain (loss) on: | | |
Investment securities | 704,506,123 | |
Foreign currency transactions | (113,869) | |
Total net realized gain (loss) | | 704,392,254 |
Change in net unrealized appreciation (depreciation) on: Investment securities | (449,154,576) | |
Assets and liabilities in foreign currencies | 499,190 | |
Total change in net unrealized appreciation (depreciation) | | (448,655,386) |
Net gain (loss) | | 255,736,868 |
Net increase (decrease) in net assets resulting from operations | | $ 300,874,608 |
A As a result of the change in the estimate of the return of capital component of dividend income realized in the year ended December 31, 2003, dividend income has been reduced by $2,260,756, with a corresponding increase to net realized gain (loss) and net unrealized appreciation (depreciation).
See accompanying notes which are an integral part of the financial statements.
Annual Report
Fidelity Variable Insurance Products: Growth Portfolio
Financial Statements - continued
Statement of Changes in Net Assets
| Year ended
December 31,
2004 | Year ended
December 31,
2003 |
Increase (Decrease) in Net Assets | | |
Operations | | |
Net investment income (loss) | $ 45,137,740 | $ 23,031,175 |
Net realized gain (loss) | 704,392,254 | 49,130,228 |
Change in net unrealized appreciation (depreciation) | (448,655,386) | 2,530,101,870 |
Net increase (decrease) in net assets resulting from operations | 300,874,608 | 2,602,263,273 |
Distributions to shareholders from net investment income | (25,185,765) | (23,104,405) |
Share transactions - net increase (decrease) | (945,720,754) | (285,825,613) |
Redemption fees | 13 | 2,361 |
Total increase (decrease) in net assets | (670,031,898) | 2,293,335,616 |
| | |
Net Assets | | |
Beginning of period | 10,606,974,396 | 8,313,638,780 |
End of period (including undistributed net investment income of $42,500,013 and undistributed net investment income of $22,711,797, respectively) | $ 9,936,942,498 | $ 10,606,974,396 |
Other Information: | | | | |
Share Transactions | Year ended December 31, 2004 |
| Initial Class | Service Class | Service Class 2 | Service Class 2R |
Shares Sold | 10,173,829 | 3,809,653 | 9,957,726 | 63,032 |
Reinvested | 677,303 | 70,256 | 26,349 | 100 |
Redeemed | (44,148,491) | (7,601,708) | (4,196,333) | (23,264) |
Net increase (decrease) | (33,297,359) | (3,721,799) | 5,787,742 | 39,868 |
| | | | |
Dollars Sold | $ 317,143,990 | $ 118,147,419 | $ 305,162,849 | $ 1,941,136 |
Reinvested | 22,052,984 | 2,279,802 | 849,771 | 3,208 |
Redeemed | (1,353,451,648) | (232,412,004) | (126,744,925) | (693,336) |
Net increase (decrease) | $ (1,014,254,674) | $ (111,984,783) | $ 179,267,695 | $ 1,251,008 |
| | | | |
Share Transactions | Year ended December 31, 2003 |
| Initial Class | Service Class | Service Class 2 | Service Class 2R |
Shares Sold | 23,586,131 | 8,385,408 | 13,542,393 | 50,235 |
Reinvested | 941,499 | 102,591 | 14,708 | 31 |
Redeemed | (47,048,733) | (8,519,590) | (3,984,642) | (14,664) |
Net increase (decrease) | (22,521,103) | (31,591) | 9,572,459 | 35,602 |
| | | | |
Dollars Sold | $ 625,883,728 | $ 221,233,256 | $ 361,842,888 | $ 1,388,031 |
Reinvested | 20,552,932 | 2,232,378 | 318,424 | 671 |
Redeemed | (1,198,774,049) | (217,996,235) | (102,097,753) | (409,884) |
Net increase (decrease) | $ (552,337,389) | $ 5,469,399 | $ 260,063,559 | $ 978,818 |
| | | | |
Distributions | Year ended December 31, 2004 |
| Initial Class | Service Class | Service Class 2 | Service Class 2R |
From net investment income | $ 22,052,984 | $ 2,279,802 | $ 849,771 | $ 3,208 |
| Year ended December 31, 2003 |
| Initial Class | Service Class | Service Class 2 | Service Class 2R |
From net investment income | $ 20,552,932 | $ 2,232,378 | $ 318,424 | $ 671 |
See accompanying notes which are an integral part of the financial statements.
Growth Portfolio
Financial Highlights - Initial Class
Years ended December 31, | 2004 | 2003 | 2002 | 2001 | 2000 |
Selected Per-Share Data | | | | | |
Net asset value, beginning of period | $ 31.04 | $ 23.44 | $ 33.61 | $ 43.66 | $ 54.93 |
Income from Investment Operations | | | | | |
Net investment income (loss) C | .15 D, G | .07 | .07 | .07 | .03 |
Net realized and unrealized gain (loss) | .90 | 7.60 | (10.17) | (7.27) | (5.27) |
Total from investment operations | 1.05 | 7.67 | (10.10) | (7.20) | (5.24) |
Distributions from net investment income | (.08) | (.07) | (.07) | (.03) | (.06) |
Distributions from net realized gain | - | - | - | (2.82) | (5.97) |
Total distributions | (.08) | (.07) | (.07) | (2.85) | (6.03) |
Redemption fees added to paid in capital | - C, F | - C, F | - C, F | - | - |
Net asset value, end of period | $ 32.01 | $ 31.04 | $ 23.44 | $ 33.61 | $ 43.66 |
Total Return A, B | 3.38% | 32.85% | (30.10)% | (17.67)% | (10.96)% |
Ratios to Average Net Assets E | | | | | |
Expenses before expense reductions | .68% | .67% | .67% | .68% | .65% |
Expenses net of voluntary waivers, if any | .68% | .67% | .67% | .68% | .65% |
Expenses net of all reductions | .65% | .64% | .61% | .65% | .64% |
Net investment income (loss) | .47% G | .28% | .25% | .19% | .07% |
Supplemental Data | | | | | |
Net assets, end of period (000 omitted) | $ 7,796,888 | $ 8,594,509 | $ 7,016,147 | $ 11,458,659 | $ 15,517,271 |
Portfolio turnover rate | 72% | 61% | 90% | 105% | 103% |
A Total returns do not reflect charges attributable to your insurance company's separate account. Inclusion of these charges would reduce the total returns shown.
B Total returns would have been lower had certain expenses not been reduced during the periods shown.
C Calculated based on average shares outstanding during the period.
D Investment income per share reflects a special dividend which amounted to $.08 per share.
E Expense ratios reflect operating expenses of the class. Expenses before reductions do not reflect amounts reimbursed by the investment adviser or reductions from brokerage service arrangements or other expense offset arrangements and do not represent the amount paid by the class during periods when reimbursements or reductions occur. Expenses net of any voluntary waivers reflect expenses after reimbursement by the investment adviser but prior to reductions from brokerage service arrangements or other expense offset arrangements. Expenses net of all reductions represent the net expenses paid by the class.
F Amount represents less than $.01 per share.
G As a result in the change in the estimate of the return of capital component of divided income realized in the year ended December 31, 2003, net investment income per share and the ratio of net investment income to average net assets for the year ended December 31, 2004 have been reduced by $.01 per share and .02%, respectively. The change in estimate has no impact on total net assets or total return of the fund.
Financial Highlights - Service Class
Years ended December 31, | 2004 | 2003 | 2002 | 2001 | 2000 |
Selected Per-Share Data | | | | | |
Net asset value, beginning of period | $ 30.92 | $ 23.34 | $ 33.48 | $ 43.51 | $ 54.80 |
Income from Investment Operations | | | | | |
Net investment income (loss) C | .11 D, G | .05 | .04 | .03 | (.02) |
Net realized and unrealized gain (loss) | .90 | 7.58 | (10.14) | (7.24) | (5.25) |
Total from investment operations | 1.01 | 7.63 | (10.10) | (7.21) | (5.27) |
Distributions from net investment income | (.05) | (.05) | (.04) | - | (.05) |
Distributions from net realized gain | - | - | - | (2.82) | (5.97) |
Total distributions | (.05) | (.05) | (.04) | (2.82) | (6.02) |
Redemption fees added to paid in capital | - C, F | - C, F | - C, F | - | - |
Net asset value, end of period | $ 31.88 | $ 30.92 | $ 23.34 | $ 33.48 | $ 43.51 |
Total Return A, B | 3.26% | 32.78% | (30.20)% | (17.74)% | (11.05)% |
Ratios to Average Net Assets E | | | | | |
Expenses before expense reductions | .78% | .77% | .77% | .78% | .76% |
Expenses net of voluntary waivers, if any | .78% | .77% | .77% | .78% | .76% |
Expenses net of all reductions | .75% | .74% | .71% | .75% | .74% |
Net investment income (loss) | .37% G | .18% | .15% | .09% | (.04)% |
Supplemental Data | | | | | |
Net assets, end of period (000 omitted) | $ 1,326,262 | $ 1,401,298 | $ 1,058,738 | $ 1,655,758 | $ 1,847,051 |
Portfolio turnover rate | 72% | 61% | 90% | 105% | 103% |
A Total returns do not reflect charges attributable to your insurance company's separate account. Inclusion of these charges would reduce the total returns shown.
B Total returns would have been lower had certain expenses not been reduced during the periods shown.
C Calculated based on average shares outstanding during the period.
D Investment income per share reflects a special dividend which amounted to $.08 per share.
E Expense ratios reflect operating expenses of the class. Expenses before reductions do not reflect amounts reimbursed by the investment adviser or reductions from brokerage service arrangements or other expense offset arrangements and do not represent the amount paid by the class during periods when reimbursements or reductions occur. Expenses net of any voluntary waivers reflect expenses after reimbursement by the investment adviser but prior to reductions from brokerage service arrangements or other expense offset arrangements. Expenses net of all reductions represent the net expenses paid by the class.
F Amount represents less than $.01 per share.
G As a result in the change in the estimate of the return of capital component of divided income realized in the year ended December 31, 2003, net investment income per share and the ratio of net investment income to average net assets for the year ended December 31, 2004 have been reduced by $.01 per share and .02%, respectively. The change in estimate has no impact on total net assets or total return of the fund.
See accompanying notes which are an integral part of the financial statements.
Annual Report
Financial Highlights - Service Class 2
Years ended December 31, | 2004 | 2003 | 2002 | 2001 | 2000 G |
Selected Per-Share Data | | | | | |
Net asset value, beginning of period | $ 30.72 | $ 23.21 | $ 33.34 | $ 43.43 | $ 53.40 |
Income from Investment Operations | | | | | |
Net investment income (loss) E | .07 F, J | .01 | - I | (.02) | (.09) |
Net realized and unrealized gain (loss) | .89 | 7.53 | (10.09) | (7.22) | (3.86) |
Total from investment operations | .96 | 7.54 | (10.09) | (7.24) | (3.95) |
Distributions from net investment income | (.04) | (.03) | (.04) | (.03) | (.05) |
Distributions from net realized gain | - | - | - | (2.82) | (5.97) |
Total distributions | (.04) | (.03) | (.04) | (2.85) | (6.02) |
Redemption fees added to paid in capital | - E, I | - E, I | - E, I | - | - |
Net asset value, end of period | $ 31.64 | $ 30.72 | $ 23.21 | $ 33.34 | $ 43.43 |
Total Return B, C, D | 3.12% | 32.54% | (30.30)% | (17.87)% | (8.88)% |
Ratios to Average Net Assets H | | | | | |
Expenses before expense reductions | .93% | .92% | .93% | .93% | .91% A |
Expenses net of voluntary waivers, if any | .93% | .92% | .93% | .93% | .91% A |
Expenses net of all reductions | .90% | .89% | .87% | .90% | .90% A |
Net investment income (loss) | .22% J | .02% | (.01)% | (.06)% | (.19)% A |
Supplemental Data | | | | | |
Net assets, end of period (000 omitted) | $ 811,126 | $ 609,798 | $ 238,543 | $ 191,475 | $ 57,095 |
Portfolio turnover rate | 72% | 61% | 90% | 105% | 103% |
A Annualized
B Total returns for periods of less than one year are not annualized.
C Total returns do not reflect charges attributable to your insurance company's separate account. Inclusion of these charges would reduce the total returns shown.
D Total returns would have been lower had certain expenses not been reduced during the periods shown.
E Calculated based on average shares outstanding during the period.
F Investment income per share reflects a special dividend which amounted to $.08 per share.
G For the period January 12, 2000 (commencement of sale of shares) to December 31, 2000.
H Expense ratios reflect operating expenses of the class. Expenses before reductions do not reflect amounts reimbursed by the investment adviser or reductions from brokerage service arrangements or other expense offset arrangements and do not represent the amount paid by the class during periods when reimbursements or reductions occur. Expense ratios before reductions for start-up periods may not be representative of longer-term operating periods. Expenses net of any voluntary waivers reflect expenses after reimbursement by the investment adviser but prior to reductions from brokerage service arrangements or other expense offset arrangements. Expenses net of all reductions represent the net expenses paid by the class.
I Amount represents less than $.01 per share.
J As a result in the change in the estimate of the return of capital component of divided income realized in the year ended December 31, 2003, net investment income per share and the ratio of net investment income to average net assets for the year ended December 31, 2004 have been reduced by $.01 per share and .02%, respectively. The change in estimate has no impact on total net assets or total return of the fund.
Financial Highlights - Service Class 2R
Years ended December 31, | 2004 | 2003 | 2002 G |
Selected Per-Share Data | | | |
Net asset value, beginning of period | $ 30.65 | $ 23.20 | $ 31.05 |
Income from Investment Operations | | | |
Net investment income (loss) E | .07 F, J | .01 | (.01) |
Net realized and unrealized gain (loss) | .88 | 7.51 | (7.84) |
Total from investment operations | .95 | 7.52 | (7.85) |
Distributions from net investment income | (.06) | (.07) | - |
Redemption fees added to paid in capital E, I | - | - | - |
Net asset value, end of period | $ 31.54 | $ 30.65 | $ 23.20 |
Total Return B, C, D | 3.10% | 32.54% | (25.28)% |
Ratios to Average Net Assets H | | | |
Expenses before expense reductions | .93% | .92% | .96% A |
Expenses net of voluntary waivers, if any | .93% | .92% | .96% A |
Expenses net of all reductions | .90% | .90% | .90% A |
Net investment income (loss) | .22% J | .02% | (.03)% A |
Supplemental Data | | | |
Net assets, end of period (000 omitted) | $ 2,667 | $ 1,369 | $ 210 |
Portfolio turnover rate | 72% | 61% | 90% |
A Annualized
B Total returns for periods of less than one year are not annualized.
C Total returns do not reflect charges attributable to your insurance company's separate account. Inclusion of these charges would reduce the total returns shown.
D Total returns would have been lower had certain expenses not been reduced during the periods shown.
E Calculated based on average shares outstanding during the period.
F Investment income per share reflects a special dividend which amounted to $.08 per share.
G For the period April 24, 2002 (commencement of sale of shares) to December 31, 2002.
H Expense ratios reflect operating expenses of the class. Expenses before reductions do not reflect amounts reimbursed by the investment adviser or reductions from brokerage service arrangements or other expense offset arrangements and do not represent the amount paid by the class during periods when reimbursements or reductions occur. Expense ratios before reductions for start-up periods may not be representative of longer-term operating periods. Expenses net of any voluntary waivers reflect expenses after reimbursement by the investment adviser but prior to reductions from brokerage service arrangements or other expense offset arrangements. Expenses net of all reductions represent the net expenses paid by the class.
I Amount represents less than $.01 per share.
J As a result in the change in the estimate of the return of capital component of divided income realized in the year ended December 31, 2003, net investment income per share and the ratio of net investment income to average net assets for the year ended December 31, 2004 have been reduced by $.01 per share and .02%, respectively. The change in estimate has no impact on total net assets or total return of the fund.
See accompanying notes which are an integral part of the financial statements.
Growth Portfolio
Fidelity Variable Insurance Products: High Income Portfolio
Performance: The Bottom Line
Average annual total return reflects the change in the value of an investment, assuming reinvestment of a class' dividend income and capital gains (the profits earned upon the sale of securities that have grown in value) and assuming a constant rate of performance each year. During periods of reimbursement by Fidelity, a fund's total return will be greater than it would be had the reimbursement not occurred. Performance numbers are net of all underlying fund operating expenses, but do not include any insurance charges imposed by your insurance company's separate account. If performance information included the effect of these additional charges, the total returns would be lower. How a fund did yesterday is no guarantee of how it will do tomorrow.
Average Annual Total Returns
Periods ended December 31, 2004 | Past 1
year | Past 5
years | Past 10
years |
Fidelity® VIP: High Income - Initial Class | 9.59% | -0.27% | 5.17% |
Fidelity VIP: High Income - Service ClassA | 9.47% | -0.38% | 5.08% |
Fidelity VIP: High Income - Service Class 2B | 9.38% | -0.55% | 4.99% |
A The initial offering of Service Class shares took place on November 3, 1997. Performance for Service Class shares reflects an asset based distribution fee (12b-1 fee), and returns prior to November 3, 1997 are those of Initial Class and do not include the effects of Service Class' 12b-1 fee. Had Service Class' 12b-1 fee been reflected, returns prior to November 3, 1997 would have been lower.
B The initial offering of Service Class 2 shares took place on January 12, 2000. Performance for Service Class 2 shares reflects an asset based distribution fee (12b-1 fee). Returns from November 3, 1997 to January 12, 2000 are those of Service Class which reflect a different 12b-1 fee. Service Class 2 returns prior to November 3, 1997 are those of Initial Class and do not include the effects of a 12b-1 fee. Had Service Class 2's 12b-1 fee been reflected, returns prior to January 12, 2000 would have been lower.
$10,000 Over 10 Years
Let's say hypothetically that $10,000 was invested in Fidelity® Variable Insurance Products: High Income Portfolio - Initial Class on December 31, 1994. The chart shows how the value of your investment would have changed, and also shows how the ML ® U.S. High Yield Master II Index performed over the same period.
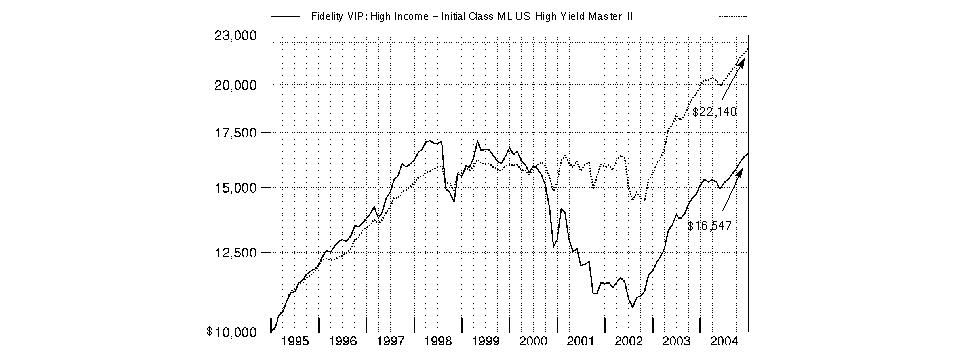
Annual Report
Fidelity Variable Insurance Products: High Income Portfolio
Management's Discussion of Fund Performance
Comments from Matthew Conti, Portfolio Manager of Fidelity® Variable Insurance Products: High Income Portfolio
Investors in high-yield securities generally found positive returns in 2004, as the Merrill Lynch® U.S. High Yield Master II Index advanced 10.87% for the year overall. This performance marks the first time the high-yield bond market has posted two consecutive years of double-digit increases since 1996-1997. The strong demand for the attractive yields of high-income securities, plus ready access to capital and a declining default rate, helped drive returns in this non-investment-grade asset class. As corporate America continued to improve its cash flows and deleverage its balance sheets, the stronger credit profiles for companies borrowing in the high-yield market served to make investors less risk averse, particularly in the more speculative credit tiers such as CCC-rated securities, which returned 15.75% during the past year. In comparison, the BB-rated and B-rated sectors rose 9.33% and 10.44%, respectively. As was the case in the equity markets, energy, metals/mining and other commodity industries were among the leaders in the high-yield universe.
During the 12 months that ended December 31, 2004, High Income Portfolio underperformed its benchmark, the Merrill Lynch U.S. High Yield Master II Index, and performed roughly in line with the LipperSM Variable Annuity High Current Yield Funds Average, which returned 9.84%. The fund underperformed the index because of its avoidance of the lowest-rated bonds and distressed securities, which performed best during the period. An overweighting in the telecommunications industry also held back performance. On the plus side, strong security selection in cable TV, health care, chemicals and utilities helped the fund's relative performance. Top performers included Huntsman Chemicals, electric utilities AES and Cogentrix, and Delta Airlines. Among the investments that detracted from the fund's performance were semiconductor testing and packaging company Amkor Technology, telecom service provider Cincinnati Bell, theme park company Six Flags and television station operator Granite Broadcasting.
The views expressed in this statement reflect those of the portfolio manager only through the end of the period of the report as stated on the cover and do not necessarily represent the views of Fidelity or any other person in the Fidelity organization. Any such views are subject to change at any time based upon market or other conditions and Fidelity disclaims any responsibility to update such views. These views may not be relied on as investment advice and, because investment decisions for a Fidelity fund are based on numerous factors, may not be relied on as an indication of trading intent on behalf of any Fidelity fund.
Annual Report
Fidelity Variable Insurance Products: High Income Portfolio
Investment Summary
Top Five Holdings as of December 31, 2004 |
(by issuer, excluding cash equivalents) | % of fund's
net assets |
AES Corp. | 1.9 |
American Airlines, Inc. pass thru trust certificates | 1.6 |
Xerox Corp. | 1.6 |
Nextel Communications, Inc. | 1.5 |
MGM MIRAGE | 1.5 |
| 8.1 |
Top Five Market Sectors as of December 31, 2004 |
| % of fund's
net assets |
Telecommunications | 9.6 |
Energy | 7.5 |
Chemicals | 7.2 |
Electric Utilities | 7.0 |
Healthcare | 6.2 |
Quality Diversification (% of fund's net assets) as of December 31, 2004 |
| AAA, AA, A | 0.0% | |
 | BBB | 0.3% | |
 | BB | 36.8% | |
 | B | 46.6% | |
| CCC, CC, C | 10.1% | |
 | Not Rated | 3.0% | |
 | Other Investments | 0.3% | |
 | Equities | 0.3% | |
| Short-Term Investments and Net Other Assets | 2.6% | |
We have used ratings from Moody's Investors Services, Inc. Where Moody's ratings are not available, we have used S&P ratings. |
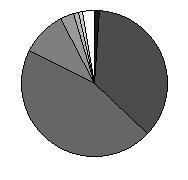
Annual Report
Fidelity Variable Insurance Products: High Income Portfolio
Investments December 31, 2004
Showing Percentage of Net Assets
Nonconvertible Bonds - 91.1% |
| Principal
Amount | | Value
(Note 1) |
Aerospace - 1.0% |
Bombardier, Inc. 6.3% 5/1/14 (e) | | $ 5,565,000 | | $ 4,827,638 |
L-3 Communications Corp. 5.875% 1/15/15 (e) | | 4,910,000 | | 4,897,725 |
Orbital Sciences Corp. 9% 7/15/11 | | 4,720,000 | | 5,310,000 |
Primus International, Inc. 10.5% 4/15/09 (e) | | 3,170,000 | | 3,312,650 |
| | 18,348,013 |
Air Transportation - 3.7% |
American Airlines, Inc. pass thru trust certificates: | | | | |
6.817% 5/23/11 | | 11,825,000 | | 11,115,500 |
6.977% 11/23/22 | | 556,744 | | 520,555 |
7.324% 4/15/11 | | 1,480,000 | | 1,228,400 |
7.377% 5/23/19 | | 14,357,509 | | 10,050,256 |
7.379% 5/23/16 | | 6,249,810 | | 4,374,867 |
7.8% 4/1/08 | | 2,595,000 | | 2,413,350 |
10.18% 1/2/13 | | 2,190,000 | | 1,708,200 |
AMR Corp. 10.2% 3/15/20 | | 165,000 | | 125,400 |
Delta Air Lines, Inc.: | | | | |
7.9% 12/15/09 | | 7,330,000 | | 4,617,900 |
8.3% 12/15/29 | | 13,070,000 | | 6,306,275 |
9.5% 11/18/08 (e) | | 4,862,000 | | 4,558,125 |
10% 8/15/08 | | 3,370,000 | | 2,502,225 |
Delta Air Lines, Inc. pass thru trust certificates: | | | | |
7.379% 5/18/10 | | 1,087,647 | | 1,084,928 |
7.57% 11/18/10 | | 2,950,000 | | 2,909,892 |
7.711% 9/18/11 | | 865,000 | | 657,400 |
7.92% 5/18/12 | | 1,565,000 | | 1,205,050 |
Northwest Airlines Corp. 10% 2/1/09 | | 13,840,000 | | 11,625,600 |
Northwest Airlines, Inc. pass thru trust certificates: | | | | |
7.67% 1/2/15 | | 1,360,819 | | 1,187,315 |
8.07% 1/2/15 | | 1,442,283 | | 1,009,598 |
| | 69,200,836 |
Automotive - 1.1% |
Delco Remy International, Inc. 9.375% 4/15/12 | | 5,510,000 | | 5,702,850 |
Navistar International Corp. 7.5% 6/15/11 | | 5,815,000 | | 6,222,050 |
Stoneridge, Inc. 11.5% 5/1/12 | | 2,715,000 | | 3,108,675 |
Tenneco Automotive, Inc.: | | | | |
8.625% 11/15/14 (e) | | 3,055,000 | | 3,169,563 |
10.25% 7/15/13 | | 2,515,000 | | 2,967,700 |
| | 21,170,838 |
Banks and Thrifts - 0.2% |
Western Financial Bank 9.625% 5/15/12 | | 2,565,000 | | 2,924,100 |
|
| Principal
Amount | | Value
(Note 1) |
Broadcasting - 0.3% |
Gray Television, Inc. 9.25% 12/15/11 | | $ 2,235,000 | | $ 2,503,200 |
Paxson Communications Corp. 0% 1/15/09 (d) | | 3,320,000 | | 3,104,200 |
| | 5,607,400 |
Building Materials - 1.3% |
Goodman Global Holdings, Inc. 5.76% 6/15/12 (e)(f) | | 4,905,000 | | 4,990,838 |
Jacuzzi Brands, Inc. 9.625% 7/1/10 | | 4,070,000 | | 4,517,700 |
Maax Holdings, Inc. 0% 12/15/12 (d)(e) | | 5,840,000 | | 3,679,200 |
Nortek, Inc. 8.5% 9/1/14 (e) | | 5,350,000 | | 5,590,750 |
Texas Industries, Inc. 10.25% 6/15/11 | | 4,860,000 | | 5,734,800 |
| | 24,513,288 |
Cable TV - 3.7% |
Adelphia Communications Corp.: | | | | |
7.875% 5/1/09 (c) | | 2,730,000 | | 2,457,000 |
9.875% 3/1/07 (c) | | 3,090,000 | | 3,012,750 |
10.25% 6/15/11 (c) | | 1,935,000 | | 1,944,675 |
Cablevision Systems Corp.: | | | | |
6.6688% 4/1/09 (e)(f) | | 8,870,000 | | 9,424,375 |
8% 4/15/12 (e) | | 4,120,000 | | 4,382,650 |
CSC Holdings, Inc. 7.625% 4/1/11 | | 2,950,000 | | 3,186,000 |
DirecTV Holdings LLC/DirecTV Financing, Inc. 8.375% 3/15/13 | | 5,765,000 | | 6,456,800 |
EchoStar DBS Corp.: | | | | |
5.75% 10/1/08 | | 15,085,000 | | 15,311,275 |
6.625% 10/1/14 (e) | | 7,590,000 | | 7,703,850 |
GCI, Inc. 7.25% 2/15/14 | | 3,425,000 | | 3,425,000 |
NTL Cable PLC: | | | | |
7.07% 10/15/12 (e)(f) | | 4,400,000 | | 4,532,000 |
8.75% 4/15/14 (e) | | 1,635,000 | | 1,839,375 |
Telenet Group Holding NV 0% 6/15/14 (d)(e) | | 5,505,000 | | 4,183,800 |
| | 67,859,550 |
Capital Goods - 2.9% |
Amsted Industries, Inc. 10.25% 10/15/11 (e) | | 2,860,000 | | 3,246,100 |
Dresser, Inc. 9.375% 4/15/11 | | 7,700,000 | | 8,412,250 |
Invensys PLC 9.875% 3/15/11 (e) | | 15,105,000 | | 16,313,400 |
Leucadia National Corp. 7% 8/15/13 | | 5,775,000 | | 5,948,250 |
Park-Ohio Industries, Inc. 8.375% 11/15/14 (e) | | 3,645,000 | | 3,635,888 |
Sensus Metering Systems, Inc. 8.625% 12/15/13 | | 3,370,000 | | 3,471,100 |
SPX Corp.: | | | | |
6.25% 6/15/11 | | 3,100,000 | | 3,270,500 |
7.5% 1/1/13 | | 7,970,000 | | 8,667,375 |
| | 52,964,863 |
Nonconvertible Bonds - continued |
| Principal
Amount | | Value
(Note 1) |
Chemicals - 7.1% |
BCP Caylux Holdings Luxembourg SCA 9.625% 6/15/14 (e) | | $ 11,360,000 | | $ 12,723,200 |
Borden US Finance Corp./Nova Scotia Finance ULC: | | | | |
6.82% 7/15/10 (e)(f) | | 3,490,000 | | 3,647,050 |
9% 7/15/14 (e) | | 5,655,000 | | 6,220,500 |
Equistar Chemicals LP 7.55% 2/15/26 | | 8,495,000 | | 8,346,338 |
Equistar Chemicals LP/Equistar Funding Corp.: | | | | |
8.75% 2/15/09 | | 4,535,000 | | 5,033,850 |
10.125% 9/1/08 | | 2,905,000 | | 3,340,750 |
HMP Equity Holdings Corp. 0% 5/15/08 | | 6,545,000 | | 4,286,975 |
Huntsman ICI Chemicals LLC 10.125% 7/1/09 | | 31,000 | | 32,705 |
Huntsman ICI Holdings LLC 0% 12/31/09 | | 8,015,000 | | 4,528,475 |
Huntsman International LLC: | | | | |
7.375% 1/1/15 (e) | | 5,010,000 | | 5,047,575 |
9.875% 3/1/09 | | 4,700,000 | | 5,146,500 |
Huntsman LLC: | | | | |
9.32% 7/15/11 (e)(f) | | 5,700,000 | | 6,355,500 |
11.5% 7/15/12 (e) | | 5,555,000 | | 6,527,125 |
Lubrizol Corp. 4.625% 10/1/09 | | 6,100,000 | | 6,090,588 |
Lyondell Chemical Co.: | | | | |
9.5% 12/15/08 | | 12,345,000 | | 13,456,050 |
9.625% 5/1/07 | | 1,260,000 | | 1,382,850 |
10.875% 5/1/09 | | 6,965,000 | | 7,382,900 |
11.125% 7/15/12 | | 4,320,000 | | 5,108,400 |
Millennium America, Inc. 9.25% 6/15/08 | | 11,420,000 | | 12,904,600 |
NOVA Chemicals Corp.: | | | | |
6.5% 1/15/12 | | 6,255,000 | | 6,599,025 |
7.4% 4/1/09 | | 6,420,000 | | 6,933,600 |
| | 131,094,556 |
Consumer Products - 0.7% |
Church & Dwight Co., Inc. 6% 12/15/12 (e) | | 5,275,000 | | 5,367,313 |
Jostens Holding Corp. 0% 12/1/13 (d) | | 3,050,000 | | 2,165,500 |
Jostens IH Corp. 7.625% 10/1/12 (e) | | 1,970,000 | | 2,068,500 |
Samsonite Corp. 8.875% 6/1/11 | | 2,785,000 | | 3,014,763 |
| | 12,616,076 |
Containers - 2.5% |
Anchor Glass Container Corp. 11% 2/15/13 | | 4,335,000 | | 4,703,475 |
Berry Plastics Corp. 10.75% 7/15/12 | | 3,700,000 | | 4,227,250 |
BWAY Corp. 10% 10/15/10 | | 6,685,000 | | 7,119,525 |
Crown Cork & Seal, Inc. 8% 4/15/23 | | 230,000 | | 226,550 |
|
| Principal
Amount | | Value
(Note 1) |
Crown European Holdings SA: | | | | |
9.5% 3/1/11 | | $ 1,405,000 | | $ 1,594,675 |
10.875% 3/1/13 | | 7,905,000 | | 9,347,663 |
Owens-Brockway Glass Container, Inc.: | | | | |
8.25% 5/15/13 | | 5,115,000 | | 5,626,500 |
8.75% 11/15/12 | | 1,750,000 | | 1,964,375 |
8.875% 2/15/09 | | 655,000 | | 710,675 |
Owens-Illinois, Inc.: | | | | |
7.35% 5/15/08 | | 3,505,000 | | 3,697,775 |
7.5% 5/15/10 | | 6,140,000 | | 6,516,075 |
| | 45,734,538 |
Diversified Media - 0.8% |
Corus Entertainment, Inc. 8.75% 3/1/12 | | 6,140,000 | | 6,730,975 |
LBI Media Holdings, Inc. 0% 10/15/13 (d) | | 6,440,000 | | 4,733,400 |
LBI Media, Inc. 10.125% 7/15/12 | | 3,285,000 | | 3,662,775 |
| | 15,127,150 |
Electric Utilities - 6.2% |
AES Corp.: | | | | |
7.75% 3/1/14 | | 5,965,000 | | 6,442,200 |
8.75% 6/15/08 | | 3,068,000 | | 3,344,120 |
8.875% 2/15/11 | | 13,481,000 | | 15,402,043 |
9.375% 9/15/10 | | 6,433,000 | | 7,438,156 |
9.5% 6/1/09 | | 1,499,000 | | 1,703,239 |
AES Gener SA 7.5% 3/25/14 (e) | | 4,200,000 | | 4,420,500 |
Chivor SA E.S.P. 9.75% 12/30/14 (e) | | 2,060,000 | | 2,142,400 |
CMS Energy Corp.: | | | | |
7.5% 1/15/09 | | 4,150,000 | | 4,419,750 |
7.75% 8/1/10 | | 1,970,000 | | 2,154,688 |
8.5% 4/15/11 | | 945,000 | | 1,073,756 |
8.9% 7/15/08 | | 2,180,000 | | 2,406,175 |
9.875% 10/15/07 | | 5,470,000 | | 6,099,050 |
MSW Energy Holdings II LLC/MSW Finance Co. II, Inc. 7.375% 9/1/10 | | 2,950,000 | | 3,097,500 |
MSW Energy Holdings LLC/MSW Energy Finance Co., Inc. 8.5% 9/1/10 | | 2,505,000 | | 2,730,450 |
Nevada Power Co. 6.5% 4/15/12 | | 4,225,000 | | 4,467,938 |
NRG Energy, Inc. 8% 12/15/13 (e) | | 16,260,000 | | 17,743,725 |
Sierra Pacific Power Co. 6.25% 4/15/12 | | 4,100,000 | | 4,274,250 |
Sierra Pacific Resources 8.625% 3/15/14 | | 2,315,000 | | 2,615,950 |
TECO Energy, Inc.: | | | | |
7% 5/1/12 | | 5,880,000 | | 6,453,300 |
Nonconvertible Bonds - continued |
| Principal
Amount | | Value
(Note 1) |
Electric Utilities - continued |
TECO Energy, Inc.: - continued | | | | |
7.2% 5/1/11 | | $ 11,040,000 | | $ 12,199,200 |
Texas Genco LLC/Texas Genco Financing Corp. 6.875% 12/15/14 (e) | | 4,260,000 | | 4,430,400 |
| | 115,058,790 |
Energy - 6.2% |
Belden & Blake Corp. 8.75% 7/15/12 (e) | | 3,350,000 | | 3,425,375 |
Chesapeake Energy Corp.: | | | | |
7.75% 1/15/15 | | 6,100,000 | | 6,649,000 |
8.125% 4/1/11 | | 2,875,000 | | 3,097,813 |
9% 8/15/12 | | 1,920,000 | | 2,181,600 |
El Paso Energy Corp. 6.95% 12/15/07 | | 3,350,000 | | 3,492,375 |
El Paso Production Holding Co. 7.75% 6/1/13 | | 905,000 | | 943,463 |
Hanover Compressor Co.: | | | | |
0% 3/31/07 | | 5,595,000 | | 4,867,650 |
8.625% 12/15/10 | | 1,450,000 | | 1,580,500 |
9% 6/1/14 | | 1,540,000 | | 1,709,400 |
Hilcorp Energy I LP/Hilcorp Finance Co. 10.5% 9/1/10 (e) | | 5,810,000 | | 6,565,300 |
Newfield Exploration Co. 6.625% 9/1/14 (e) | | 4,720,000 | | 4,991,400 |
Parker Drilling Co.: | | | | |
7.15% 9/1/10 (e)(f) | | 9,030,000 | | 9,458,925 |
9.625% 10/1/13 | | 1,505,000 | | 1,691,244 |
Plains Exploration & Production Co.: | | | | |
7.125% 6/15/14 | | 295,000 | | 323,025 |
8.75% 7/1/12 | | 2,540,000 | | 2,841,625 |
Pride International, Inc. 7.375% 7/15/14 | | 7,845,000 | | 8,551,050 |
Range Resources Corp. 7.375% 7/15/13 | | 9,635,000 | | 10,309,450 |
SESI LLC 8.875% 5/15/11 | | 1,740,000 | | 1,905,300 |
Sonat, Inc.: | | | | |
6.625% 2/1/08 | | 2,070,000 | | 2,095,875 |
6.75% 10/1/07 | | 800,000 | | 840,000 |
7.625% 7/15/11 | | 6,665,000 | | 6,873,281 |
Stone Energy Corp. 6.75% 12/15/14 (e) | | 3,990,000 | | 3,950,100 |
The Coastal Corp.: | | | | |
6.375% 2/1/09 | | 6,395,000 | | 6,339,044 |
6.5% 6/1/08 | | 4,840,000 | | 4,864,200 |
7.75% 6/15/10 | | 11,464,000 | | 11,979,880 |
Venoco, Inc. 8.75% 12/15/11 (e) | | 3,230,000 | | 3,326,900 |
| | 114,853,775 |
|
| Principal
Amount | | Value
(Note 1) |
Entertainment/Film - 0.3% |
Cinemark, Inc. 0% 3/15/14 (d) | | $ 7,415,000 | | $ 5,616,863 |
Environmental - 0.9% |
Allied Waste North America, Inc.: | | | | |
5.75% 2/15/11 | | 5,175,000 | | 4,864,500 |
6.375% 4/15/11 | | 3,890,000 | | 3,695,500 |
8.5% 12/1/08 | | 3,690,000 | | 3,929,850 |
8.875% 4/1/08 | | 3,725,000 | | 3,985,750 |
| | 16,475,600 |
Food and Drug Retail - 2.0% |
Jean Coutu Group, Inc.: | | | | |
7.625% 8/1/12 (e) | | 1,440,000 | | 1,522,800 |
8.5% 8/1/14 (e) | | 4,195,000 | | 4,299,875 |
Rite Aid Corp.: | | | | |
6.875% 8/15/13 | | 5,655,000 | | 5,103,638 |
8.125% 5/1/10 | | 1,120,000 | | 1,181,600 |
9.25% 6/1/13 | | 7,255,000 | | 7,363,825 |
9.5% 2/15/11 | | 4,655,000 | | 5,120,500 |
Stater Brothers Holdings, Inc.: | | | | |
5.99% 6/15/10 (f) | | 7,155,000 | | 7,351,763 |
8.125% 6/15/12 | | 4,185,000 | | 4,436,100 |
| | 36,380,101 |
Food/Beverage/Tobacco - 2.9% |
B&G Foods, Inc. 8% 10/1/11 | | 3,310,000 | | 3,525,150 |
Del Monte Corp.: | | | | |
8.625% 12/15/12 | | 3,375,000 | | 3,763,125 |
9.25% 5/15/11 | | 4,215,000 | | 4,636,500 |
Dole Food Co., Inc. 7.25% 6/15/10 | | 8,125,000 | | 8,531,250 |
National Beef Packing Co. LLC/National Beef Finance Corp. 10.5% 8/1/11 | | 3,830,000 | | 3,964,050 |
Smithfield Foods, Inc.: | | | | |
7% 8/1/11 (e) | | 4,050,000 | | 4,323,375 |
7% 8/1/11 | | 1,315,000 | | 1,400,475 |
7.625% 2/15/08 | | 1,800,000 | | 1,926,000 |
7.75% 5/15/13 | | 3,935,000 | | 4,348,175 |
8% 10/15/09 | | 1,510,000 | | 1,668,550 |
Swift & Co. 10.125% 10/1/09 | | 4,345,000 | | 4,888,125 |
UAP Holding Corp. 0% 7/15/12 (d)(e) | | 6,050,000 | | 4,749,250 |
United Agriculture Products, Inc. 8.25% 12/15/11 (e) | | 4,949,000 | | 5,307,803 |
| | 53,031,828 |
Gaming - 4.4% |
Chumash Casino & Resort Enterprise 9% 7/15/10 (e) | | 2,760,000 | | 3,049,800 |
Mandalay Resort Group: | | | | |
9.375% 2/15/10 | | 4,655,000 | | 5,399,800 |
10.25% 8/1/07 | | 3,125,000 | | 3,546,875 |
MGM MIRAGE: | | | | |
6% 10/1/09 | | 13,125,000 | | 13,453,125 |
6.75% 9/1/12 | | 6,750,000 | | 7,121,250 |
Nonconvertible Bonds - continued |
| Principal
Amount | | Value
(Note 1) |
Gaming - continued |
MGM MIRAGE: - continued | | | | |
6.875% 2/6/08 | | $ 2,140,000 | | $ 2,300,500 |
8.5% 9/15/10 | | 4,125,000 | | 4,723,125 |
Mohegan Tribal Gaming Authority: | | | | |
6.375% 7/15/09 | | 7,065,000 | | 7,303,444 |
8% 4/1/12 | | 2,220,000 | | 2,422,575 |
MTR Gaming Group, Inc. 9.75% 4/1/10 | | 3,605,000 | | 3,965,500 |
Park Place Entertainment Corp. 7.875% 3/15/10 | | 4,825,000 | | 5,428,125 |
Scientific Games Corp. 6.25% 12/15/12 (e) | | 3,290,000 | | 3,331,125 |
Seneca Gaming Corp. 7.25% 5/1/12 | | 4,360,000 | | 4,545,300 |
Venetian Casino Resort LLC/Las Vegas Sands, Inc. 11% 6/15/10 | | 3,815,000 | | 4,358,638 |
Virgin River Casino Corp./RBG LLC/B&BB, Inc.: | | | | |
0% 1/15/13 (d)(e) | | 2,100,000 | | 1,312,500 |
9% 1/15/12 (e) | | 1,555,000 | | 1,617,200 |
Wheeling Island Gaming, Inc. 10.125% 12/15/09 | | 6,730,000 | | 7,167,450 |
| | 81,046,332 |
Healthcare - 6.2% |
AmerisourceBergen Corp.: | | | | |
7.25% 11/15/12 | | 6,070,000 | | 6,752,875 |
8.125% 9/1/08 | | 1,735,000 | | 1,930,188 |
CDRV Investors, Inc. 0% 1/1/15 (d)(e) | | 16,110,000 | | 9,947,925 |
Concentra Operating Corp.: | | | | |
9.125% 6/1/12 (e) | | 2,095,000 | | 2,367,350 |
9.5% 8/15/10 | | 2,145,000 | | 2,423,850 |
Elan Finance PLC/Elan Finance Corp. 7.75% 11/15/11 (e) | | 6,320,000 | | 6,762,400 |
Fisher Scientific International, Inc.: | | | | |
6.75% 8/15/14 (e) | | 2,510,000 | | 2,685,700 |
8% 9/1/13 | | 2,870,000 | | 3,257,450 |
8.125% 5/1/12 | | 875,000 | | 975,625 |
Genesis HealthCare Corp. 8% 10/15/13 | | 8,105,000 | | 8,793,925 |
HCA, Inc. 5.5% 12/1/09 | | 5,000,000 | | 5,004,700 |
Mayne Group Ltd. 5.875% 12/1/11 (e) | | 5,000,000 | | 5,087,500 |
Omega Healthcare Investors, Inc.: | | | | |
7% 4/1/14 | | 3,970,000 | | 4,089,100 |
7% 4/1/14 (e) | | 3,260,000 | | 3,357,800 |
PerkinElmer, Inc. 8.875% 1/15/13 | | 7,225,000 | | 8,218,438 |
Psychiatric Solutions, Inc. 10.625% 6/15/13 | | 6,335,000 | | 7,332,763 |
Senior Housing Properties Trust 8.625% 1/15/12 | | 9,170,000 | | 10,476,725 |
Spheris, Inc. 11% 12/15/12 (e) | | 2,710,000 | | 2,770,975 |
Tenet Healthcare Corp.: | | | | |
6.375% 12/1/11 | | 15,925,000 | | 14,651,000 |
|
| Principal
Amount | | Value
(Note 1) |
6.5% 6/1/12 | | $ 1,275,000 | | $ 1,188,938 |
7.375% 2/1/13 | | 4,305,000 | | 4,197,375 |
9.875% 7/1/14 (e) | | 2,040,000 | | 2,218,500 |
| | 114,491,102 |
Homebuilding/Real Estate - 4.1% |
American Real Estate Partners/American Real Estate Finance Corp. 8.125% 6/1/12 | | 13,630,000 | | 14,532,988 |
Beazer Homes USA, Inc.: | | | | |
6.5% 11/15/13 | | 860,000 | | 868,600 |
8.375% 4/15/12 | | 5,975,000 | | 6,572,500 |
D.R. Horton, Inc. 4.875% 1/15/10 | | 1,635,000 | | 1,626,825 |
K. Hovnanian Enterprises, Inc.: | | | | |
6% 1/15/10 (e) | | 1,330,000 | | 1,343,300 |
8.875% 4/1/12 | | 2,210,000 | | 2,431,000 |
KB Home 7.75% 2/1/10 | | 9,585,000 | | 10,303,875 |
Meritage Homes Corp. 7% 5/1/14 | | 3,370,000 | | 3,471,100 |
Standard Pacific Corp.: | | | | |
5.125% 4/1/09 | | 5,680,000 | | 5,594,800 |
6.5% 10/1/08 | | 5,480,000 | | 5,754,000 |
6.875% 5/15/11 | | 2,080,000 | | 2,184,000 |
Technical Olympic USA, Inc.: | | | | |
7.5% 3/15/11 | | 5,110,000 | | 5,110,000 |
9% 7/1/10 | | 1,110,000 | | 1,187,700 |
10.375% 7/1/12 | | 4,125,000 | | 4,620,000 |
WCI Communities, Inc.: | | | | |
7.875% 10/1/13 | | 2,605,000 | | 2,741,763 |
10.625% 2/15/11 | | 2,890,000 | | 3,207,900 |
William Lyon Homes, Inc. 7.5% 2/15/14 | | 4,895,000 | | 4,699,200 |
| | 76,249,551 |
Hotels - 1.1% |
Grupo Posadas SA de CV 8.75% 10/4/11 (e) | | 4,235,000 | | 4,542,038 |
Host Marriott LP 7.125% 11/1/13 | | 8,555,000 | | 9,111,075 |
La Quinta Properties, Inc. 7% 8/15/12 | | 5,950,000 | | 6,336,750 |
| | 19,989,863 |
Insurance - 0.2% |
Crum & Forster Holdings Corp. 10.375% 6/15/13 | | 3,605,000 | | 4,019,575 |
Leisure - 1.5% |
Equinox Holdings Ltd. 9% 12/15/09 | | 1,940,000 | | 2,056,400 |
NCL Corp. Ltd. 10.625% 7/15/14 (e) | | 1,430,000 | | 1,415,700 |
Town Sports International Holdings, Inc. 0% 2/1/14 (d) | | 3,870,000 | | 2,051,100 |
Town Sports International, Inc. 9.625% 4/15/11 | | 6,810,000 | | 7,184,550 |
Nonconvertible Bonds - continued |
| Principal
Amount | | Value
(Note 1) |
Leisure - continued |
Universal City Development Partners Ltd./UCDP Finance, Inc. 11.75% 4/1/10 | | $ 8,900,000 | | $ 10,535,375 |
Universal City Florida Holding Co. I/II 7.2% 5/1/10 (e)(f) | | 3,675,000 | | 3,812,813 |
| | 27,055,938 |
Metals/Mining - 1.9% |
Century Aluminum Co. 7.5% 8/15/14 (e) | | 4,540,000 | | 4,835,100 |
Compass Minerals International, Inc.: | | | | |
0% 12/15/12 (d) | | 5,940,000 | | 5,078,700 |
0% 6/1/13 (d) | | 9,470,000 | | 7,670,700 |
Peabody Energy Corp. 6.875% 3/15/13 | | 5,340,000 | | 5,780,550 |
Ryerson Tull, Inc. 8.25% 12/15/11 (e) | | 3,320,000 | | 3,394,700 |
Vedanta Resources PLC 6.625% 2/22/10 (e) | | 3,535,000 | | 3,543,838 |
Wise Metals Group LLC/Alloys Finance 10.25% 5/15/12 | | 4,815,000 | | 4,815,000 |
| | 35,118,588 |
Paper - 1.6% |
Cellu Tissue Holdings, Inc. 9.75% 3/15/10 | | 3,435,000 | | 3,572,400 |
Georgia-Pacific Corp.: | | | | |
8% 1/15/14 | | 3,675,000 | | 4,180,313 |
8.125% 5/15/11 | | 2,070,000 | | 2,380,500 |
8.875% 2/1/10 | | 485,000 | | 564,419 |
9.375% 2/1/13 | | 2,620,000 | | 3,052,300 |
Norske Skog Canada Ltd.: | | | | |
7.375% 3/1/14 | | 4,150,000 | | 4,326,375 |
8.625% 6/15/11 | | 10,765,000 | | 11,518,550 |
| | 29,594,857 |
Publishing/Printing - 1.2% |
Dex Media West LLC/Dex Media West Finance Co. 5.875% 11/15/11 (e) | | 3,340,000 | | 3,331,650 |
Houghton Mifflin Co. 9.875% 2/1/13 | | 4,065,000 | | 4,441,013 |
The Reader's Digest Association, Inc. 6.5% 3/1/11 | | 12,945,000 | | 13,527,525 |
| | 21,300,188 |
Railroad - 1.6% |
Kansas City Southern Railway Co.: | | | | |
7.5% 6/15/09 | | 13,155,000 | | 13,812,750 |
9.5% 10/1/08 | | 150,000 | | 168,750 |
TFM SA de CV yankee: | | | | |
10.25% 6/15/07 | | 505,000 | | 540,350 |
11.75% 6/15/09 | | 14,915,000 | | 15,138,725 |
| | 29,660,575 |
|
| Principal
Amount | | Value
(Note 1) |
Restaurants - 0.5% |
Friendly Ice Cream Corp. 8.375% 6/15/12 | | $ 4,760,000 | | $ 4,664,800 |
Landry's Seafood Restaurants, Inc. 7.5% 12/15/14 (e) | | 4,850,000 | | 4,831,813 |
| | 9,496,613 |
Services - 0.2% |
Iron Mountain, Inc. 8.625% 4/1/13 | | 3,035,000 | | 3,217,100 |
Shipping - 3.7% |
General Maritime Corp. 10% 3/15/13 | | 6,380,000 | | 7,337,000 |
H-Lines Finance Holding Corp. 0% 4/1/13 (d)(e) | | 2,295,000 | | 1,669,613 |
OMI Corp. 7.625% 12/1/13 | | 9,595,000 | | 10,266,650 |
Overseas Shipholding Group, Inc. 8.25% 3/15/13 | | 1,795,000 | | 1,996,938 |
Ship Finance International Ltd. 8.5% 12/15/13 | | 25,180,000 | | 25,935,379 |
Teekay Shipping Corp. 8.875% 7/15/11 | | 17,723,000 | | 20,558,680 |
| | 67,764,260 |
Steels - 2.0% |
Allegheny Technologies, Inc. 8.375% 12/15/11 | | 5,820,000 | | 6,460,200 |
CSN Islands VII Corp. 10.75% 9/12/08 (e) | | 5,755,000 | | 6,539,119 |
CSN Islands VIII Corp. 9.75% 12/16/13 (e) | | 3,100,000 | | 3,317,000 |
Gerdau AmeriSteel Corp./GUSAP Partners 10.375% 7/15/11 | | 10,130,000 | | 11,902,750 |
Ispat Inland ULC 9.75% 4/1/14 | | 6,622,000 | | 8,178,170 |
| | 36,397,239 |
Super Retail - 1.8% |
Asbury Automotive Group, Inc.: | | | | |
8% 3/15/14 | | 2,910,000 | | 2,880,900 |
9% 6/15/12 | | 9,895,000 | | 10,414,488 |
NBC Acquisition Corp. 0% 3/15/13 (d) | | 1,665,000 | | 1,215,450 |
Nebraska Book Co., Inc. 8.625% 3/15/12 | | 2,530,000 | | 2,580,600 |
Saks, Inc.: | | | | |
8.25% 11/15/08 | | 1,325,000 | | 1,444,250 |
9.875% 10/1/11 | | 7,130,000 | | 8,413,400 |
Sonic Automotive, Inc. 8.625% 8/15/13 | | 5,130,000 | | 5,489,100 |
| | 32,438,188 |
Technology - 5.4% |
Advanced Micro Devices, Inc. 7.75% 11/1/12 (e) | | 6,390,000 | | 6,653,588 |
Celestica, Inc. 7.875% 7/1/11 | | 13,125,000 | | 14,043,750 |
Flextronics International Ltd.: | | | | |
6.25% 11/15/14 (e) | | 11,465,000 | | 11,350,350 |
6.5% 5/15/13 | | 4,970,000 | | 5,069,400 |
Nonconvertible Bonds - continued |
| Principal
Amount | | Value
(Note 1) |
Technology - continued |
Freescale Semiconductor, Inc.: | | | | |
4.82% 7/15/09 (f) | | $ 4,460,000 | | $ 4,660,700 |
6.875% 7/15/11 | | 8,220,000 | | 8,815,950 |
7.125% 7/15/14 | | 1,585,000 | | 1,719,725 |
Lucent Technologies, Inc.: | | | | |
6.45% 3/15/29 | | 5,885,000 | | 5,355,350 |
6.5% 1/15/28 | | 1,600,000 | | 1,440,000 |
MagnaChip Semiconductor SA/MagnaChip Semiconductor Finance Co.: | | | | |
5.78% 12/15/11 (e)(f) | | 1,170,000 | | 1,200,713 |
8% 12/15/14 (e) | | 910,000 | | 948,675 |
Sanmina-SCI Corp. 10.375% 1/15/10 | | 3,265,000 | | 3,738,425 |
Xerox Capital Trust I 8% 2/1/27 | | 5,515,000 | | 5,735,600 |
Xerox Corp.: | | | | |
6.875% 8/15/11 | | 14,110,000 | | 15,027,150 |
7.2% 4/1/16 | | 215,000 | | 230,050 |
7.625% 6/15/13 | | 11,340,000 | | 12,474,000 |
9.75% 1/15/09 | | 1,210,000 | | 1,421,750 |
| | 99,885,176 |
Telecommunications - 9.3% |
Alaska Communications Systems Holdings, Inc. 9.375% 5/15/09 | | 4,935,000 | | 5,083,050 |
Citizens Communications Co. 6.25% 1/15/13 | | 6,580,000 | | 6,645,800 |
Empresa Brasileira de Telecomm SA 11% 12/15/08 | | 5,405,000 | | 6,161,700 |
Intelsat Ltd.: | | | | |
5.25% 11/1/08 | | 2,035,000 | | 1,986,669 |
6.5% 11/1/13 | | 2,475,000 | | 2,239,875 |
7.625% 4/15/12 | | 6,265,000 | | 6,171,025 |
Millicom International Cellular SA 10% 12/1/13 (e) | | 16,275,000 | | 17,007,375 |
New Skies Satellites BV 7.4375% 11/1/11 (e)(f) | | 3,200,000 | | 3,360,000 |
Nextel Communications, Inc.: | | | | |
5.95% 3/15/14 | | 7,470,000 | | 7,806,150 |
6.875% 10/31/13 | | 18,545,000 | | 20,121,325 |
PanAmSat Corp. 9% 8/15/14 (e) | | 12,180,000 | | 13,580,700 |
Qwest Capital Funding, Inc.: | | | | |
7% 8/3/09 | | 4,405,000 | | 4,360,950 |
7.25% 2/15/11 | | 1,685,000 | | 1,617,600 |
Qwest Corp.: | | | | |
7.875% 9/1/11 (e) | | 3,890,000 | | 4,201,200 |
9.125% 3/15/12 (e) | | 16,255,000 | | 18,774,525 |
Qwest Services Corp.: | | | | |
14% 12/15/10 (e)(f) | | 4,345,000 | | 5,214,000 |
14.5% 12/15/14 (e)(f) | | 4,610,000 | | 5,774,025 |
Rogers Communications, Inc.: | | | | |
5.525% 12/15/10 (e)(f) | | 3,140,000 | | 3,289,150 |
7.25% 12/15/12 (e) | | 1,950,000 | | 2,067,000 |
|
| Principal
Amount | | Value
(Note 1) |
8% 12/15/12 (e) | | $ 2,230,000 | | $ 2,352,650 |
9.625% 5/1/11 | | 6,340,000 | | 7,386,100 |
SBA Communications Corp. 8.5% 12/1/12 (e) | | 6,015,000 | | 6,150,338 |
Time Warner Telecom LLC/Time Warner Telecom, Inc. 9.75% 7/15/08 | | 1,645,000 | | 1,645,000 |
Time Warner Telecom, Inc. 10.125% 2/1/11 | | 1,645,000 | | 1,612,100 |
U.S. West Capital Funding, Inc. 6.375% 7/15/08 | | 3,985,000 | | 3,935,188 |
U.S. West Communications: | | | | |
6.875% 9/15/33 | | 3,270,000 | | 3,008,400 |
7.2% 11/10/26 | | 1,905,000 | | 1,819,275 |
7.5% 6/15/23 | | 8,635,000 | | 8,483,888 |
| | 171,855,058 |
Textiles & Apparel - 0.6% |
Levi Strauss & Co.: | | | | |
9.75% 1/15/15 (e) | | 3,340,000 | | 3,298,250 |
12.25% 12/15/12 | | 7,210,000 | | 8,003,100 |
| | 11,301,350 |
TOTAL NONCONVERTIBLE BONDS (Cost $1,589,202,187) | 1,679,459,718 |
Commercial Mortgage Securities - 0.3% |
|
Banc of America Commercial Mortgage, Inc. Series 2003-2: | | | | |
Class BWD, 6.947% 10/11/37 (e) | | 614,920 | | 622,899 |
Class BWE, 7.226% 10/11/37 (e) | | 831,540 | | 841,685 |
Class BWF, 7.55% 10/11/37 (e) | | 734,087 | | 744,541 |
Class BWG, 8.155% 10/11/37 (e) | | 710,012 | | 714,921 |
Class BWH, 9.073% 10/11/37 (e) | | 371,348 | | 380,282 |
Class BWJ, 9.99% 10/11/37 (e) | | 613,922 | | 626,836 |
Class BWK, 10.676% 10/11/37 (e) | | 478,161 | | 491,035 |
Class BWL, 10.1596% 10/11/37 (e) | | 797,600 | | 755,788 |
LB Multi-family Mortgage Trust Series 1991-4 Class A1, 6.9974% 4/25/21 (e)(f) | | 229,583 | | 204,329 |
TOTAL COMMERCIAL MORTGAGE SECURITIES (Cost $5,073,302) | 5,382,316 |
Common Stocks - 0.2% |
| | Shares | | |
Chemicals - 0.1% |
HMP Equity Holdings Corp. warrants 5/15/11 (a)(e) | | 4,800 | | 2,256,000 |
Common Stocks - continued |
| | Shares | | Value (Note 1) |
Homebuilding/Real Estate - 0.0% |
Swerdlow Real Estate Group LLC (a)(g) | | 159,600 | | $ 377,326 |
Textiles & Apparel - 0.1% |
Arena Brands Holding Corp. Class B (g) | | 48,889 | | 506,001 |
TOTAL COMMON STOCKS (Cost $5,194,504) | | 3,139,327 |
Nonconvertible Preferred Stocks - 0.1% |
| | | |
Diversified Financial Services - 0.1% |
Fannie Mae 7.00%
(Cost $1,875,000) | | 37,500 | | 2,109,375 |
Floating Rate Loans - 5.7% |
| Principal
Amount | | |
Air Transportation - 0.2% |
American Airlines, Inc. term loan 9.5% 12/17/10 (f) | | $ 2,750,000 | | 2,791,250 |
Cable TV - 0.9% |
Hilton Head Communications LP Tranche B, term loan 6.5% 3/31/08 (f) | | 7,000,000 | | 6,877,500 |
NTL Investment Holdings Ltd. Tranche B, term loan 5.2038% 6/13/12 (f) | | 3,850,000 | | 3,888,500 |
Olympus Cable Holdings LLC Tranche A, term loan 6.5% 6/30/10 (f) | | 5,500,000 | | 5,458,750 |
| | 16,224,750 |
Electric Utilities - 0.8% |
Astoria Energy LLC term loan: | | | | |
7.1882% 4/15/12 (f) | | 5,200,000 | | 5,304,000 |
11.31% 4/15/12 (f) | | 3,340,000 | | 3,423,500 |
Riverside Energy Center LLC: | | | | |
term loan 6.38% 6/24/11 (f) | | 6,415,389 | | 6,511,620 |
Credit-Linked Deposit 6.38% 6/24/11 (f) | | 284,611 | | 288,880 |
| | 15,528,000 |
Energy - 1.3% |
El Paso Corp.: | | | | |
Credit-Linked Deposit 5.15% 11/22/09 (f) | | 5,839,400 | | 5,883,196 |
term loan 5.1875% 11/22/09 (f) | | 6,491,050 | | 6,547,847 |
Headwaters, Inc.: | | | | |
Tranche 2, term loan 9.1133% 9/8/12 (f) | | 3,450,000 | | 3,557,813 |
Tranche B1, term loan 7.5% 4/30/11 (f) | | 5,070,313 | | 5,133,691 |
Magellan Midstream Holdings LP term loan 4.62% 12/10/11 (f) | | 3,550,000 | | 3,594,375 |
| | 24,716,922 |
|
| Principal
Amount | | Value
(Note 1) |
Homebuilding/Real Estate - 1.4% |
General Growth Properties, Inc.: | | | | |
Tranche A, term loan 4.53% 11/12/07 (f) | | $ 5,500,000 | | $ 5,500,000 |
Tranche B, term loan 4.53% 11/12/08 (f) | | 5,500,000 | | 5,513,750 |
LNR Property Corp.: | | | | |
Tranche A, term loan 7.09% 1/31/08 (f) | | 3,650,000 | | 3,650,000 |
Tranche B, term loan: | | | | |
5.59% 1/31/08 (f) | | 7,450,000 | | 7,487,250 |
7.84% 1/31/08 (f) | | 3,700,000 | | 3,700,000 |
| | 25,851,000 |
Hotels - 0.4% |
Wyndham International, Inc. term loan 7.125% 6/30/06 (f) | | 7,927,451 | | 7,947,269 |
Railroad - 0.1% |
Kansas City Southern Railway Co. Tranche B1, term loan 4.0939% 3/30/08 (f) | | 1,150,000 | | 1,167,250 |
Technology - 0.3% |
ON Semiconductor Corp. Tranche G, term loan 5.5625% 12/15/11 (f) | | 5,550,000 | | 5,563,875 |
Telecommunications - 0.3% |
Qwest Corp. Tranche B, term loan 6.95% 6/30/10 (f) | | 4,500,000 | | 4,601,250 |
TOTAL FLOATING RATE LOANS (Cost $101,652,062) | 104,391,566 |
Money Market Funds - 2.2% |
| Shares | | |
Fidelity Cash Central Fund, 2.24% (b)
(Cost $41,514,605) | 41,514,605 | | 41,514,605 |
Cash Equivalents - 0.2% |
| Maturity
Amount | | Value
(Note 1) |
Investments in repurchase agreements (Collateralized by U.S. Treasury Obligations, in a joint trading account at 1.56%, dated 12/31/04 due 1/3/05)
(Cost $3,171,000) | $ 3,171,414 | | $ 3,171,000 |
TOTAL INVESTMENT PORTFOLIO - 99.8% (Cost $1,747,682,660) | | 1,839,167,907 |
NET OTHER ASSETS - 0.2% | | 4,179,826 |
NET ASSETS - 100% | $ 1,843,347,733 |
Legend |
(a) Non-income producing |
(b) Affiliated fund that is available only to investment companies and other accounts managed by Fidelity Investments. The rate quoted is the annualized seven-day yield of the fund at period end. A complete listing of the fund's holdings as of its most recent fiscal year end is available upon request. |
(c) Non-income producing - issuer filed for bankruptcy or is in default of interest payments. |
(d) Debt obligation initially issued in zero coupon form which converts to coupon form at a specified rate and date. The rate shown is the rate at period end. |
(e) Security exempt from registration under Rule 144A of the Securities Act of 1933. These securities may be resold in transactions exempt from registration, normally to qualified institutional buyers. At the period end, the value of these securities amounted to $418,849,132 or 22.7% of net assets. |
(f) The coupon rate shown on floating or adjustable rate securities represents the rate at period end. |
(g) Restricted securities - Investment in securities not registered under the Securities Act of 1933 (excluding 144A issues). At the end of the period, the value of restricted securities (excluding 144A issues) amounted to $883,327 or 0.0% of net assets. |
Additional information on each holding is as follows: |
Security | Acquisition Date | Acquisition Cost |
Arena Brands Holding Corp. Class B | 6/18/97 | $ 1,974,627 |
Swerdlow Real Estate Group LLC | 1/15/99 | $ 7,697,348 |
Other Information |
Distribution of investments by country of issue, as a percentage of total net assets, is as follows: |
United States of America | 82.5% |
Canada | 5.2% |
Marshall Islands | 2.1% |
Bermuda | 1.9% |
United Kingdom | 1.7% |
Luxembourg | 1.6% |
Mexico | 1.1% |
Others (individually less than 1%) | 3.9% |
| 100.0% |
Income Tax Information |
At December 31, 2004, the fund had a capital loss carryforward of approximately $1,144,184,000 of which $283,149,000, $772,554,000 and $88,481,000 will expire on December 31, 2008, 2009 and 2010, respectively. |
The fund will notify shareholders in January 2005 of amounts for use in preparing 2004 income tax returns. |
See accompanying notes which are an integral part of the financial statements.
High Income Portfolio
Fidelity Variable Insurance Products: High Income Portfolio
Financial Statements
Statement of Assets and Liabilities
December 31, 2004 |
| | |
Assets | | |
Investment in securities, at value (including repurchase agreements of $3,171,000) (cost $1,747,682,660) - See accompanying schedule | | $ 1,839,167,907 |
Cash | | 100,076 |
Receivable for investments sold | | 7,236,480 |
Receivable for fund shares sold | | 278,188 |
Interest receivable | | 29,056,825 |
Prepaid expenses | | 6,674 |
Total assets | | 1,875,846,150 |
Liabilities | | |
Payable for investments purchased | $ 29,800,521 | |
Payable for fund shares redeemed | 1,277,993 | |
Accrued management fee | 877,227 | |
Distribution fees payable | 49,768 | |
Other affiliated payables | 162,084 | |
Other payables and accrued expenses | 330,824 | |
Total liabilities | | 32,498,417 |
Net Assets | | $ 1,843,347,733 |
Net Assets consist of: | | |
Paid in capital | | $ 2,757,165,988 |
Undistributed net investment income | | 142,574,339 |
Accumulated undistributed net realized gain (loss) on investments | | (1,147,878,584) |
Net unrealized appreciation (depreciation) on investments and assets and liabilities in foreign currencies | | 91,485,990 |
Net Assets | | $ 1,843,347,733 |
Calculation of Maximum Offering Price | |
Initial Class:
Net Asset Value, offering price and redemption price per share ($1,371,736,328 ÷ 195,883,886 shares) | | $ 7.00 |
Service Class:
Net Asset Value, offering price and redemption price per share ($377,122,057 ÷ 54,083,772 shares) | | $ 6.97 |
Service Class 2:
Net Asset Value, offering price and redemption price per share ($94,246,211 ÷ 13,644,087 shares) | | $ 6.91 |
Initial Class R:
Net Asset Value, offering price and redemption price per share ($ 81,111 ÷ 11,592 shares) | | $ 7.00 |
Service Class R:
Net Asset Value, offering price and redemption price per share ($81,060 ÷ 11,628 shares) | | $ 6.97 |
Service Class 2R:
Net Asset Value, offering price and redemption price per share ($80,966 ÷ 11,719 shares) | | $ 6.91 |
Statement of Operations
Year ended December 31, 2004 |
| | |
Investment Income | | |
Dividends | | $ 731,076 |
Interest | | 146,478,822 |
Total income | | 147,209,898 |
| | |
Expenses | | |
Management fee | $ 10,407,413 | |
Transfer agent fees | 1,229,877 | |
Distribution fees | 542,218 | |
Accounting fees and expenses | 687,297 | |
Non-interested trustees' compensation | 10,249 | |
Custodian fees and expenses | 61,567 | |
Registration fees | 4,070 | |
Audit | 63,597 | |
Legal | 22,574 | |
Interest | 9,548 | |
Miscellaneous | 353,587 | |
Total expenses before reductions | 13,391,997 | |
Expense reductions | (3,973) | 13,388,024 |
Net investment income | | 133,821,874 |
Realized and Unrealized Gain (Loss) Net realized gain (loss) on investment securities | | 76,148,906 |
Change in net unrealized appreciation (depreciation) on: Investment securities | (47,643,714) | |
Assets and liabilities in foreign currencies | 236 | |
Total change in net unrealized appreciation (depreciation) | | (47,643,478) |
Net gain (loss) | | 28,505,428 |
Net increase (decrease) in net assets resulting from operations | | $ 162,327,302 |
See accompanying notes which are an integral part of the financial statements.
Annual Report
Fidelity Variable Insurance Products: High Income Portfolio
Financial Statements - continued
Statement of Changes in Net Assets
| Year ended
December 31,
2004 | Year ended
December 31,
2003 |
Increase (Decrease) in Net Assets | | |
Operations | | |
Net investment income | $ 133,821,874 | $ 147,560,195 |
Net realized gain (loss) | 76,148,906 | 93,505,636 |
Change in net unrealized appreciation (depreciation) | (47,643,478) | 182,813,372 |
Net increase (decrease) in net assets resulting from operations | 162,327,302 | 423,879,203 |
Distributions to shareholders from net investment income | (155,517,698) | (110,937,981) |
Share transactions - net increase (decrease) | (251,486,736) | 336,533,161 |
Total increase (decrease) in net assets | (244,677,132) | 649,474,383 |
| | |
Net Assets | | |
Beginning of period | 2,088,024,865 | 1,438,550,482 |
End of period (including undistributed net investment income of $142,574,339 and undistributed net investment income of $164,989,590, respectively) | $ 1,843,347,733 | $ 2,088,024,865 |
Other Information: | | | | | | |
Share Transactions | Year ended December 31, 2004 |
Shares | Initial Class | Service Class | Service Class 2 | Initial Class R A | Service Class R A | Service Class 2R A |
Sold | 49,439,043 | 27,666,450 | 11,342,466 | 11,592 | 11,628 | 11,719 |
Reinvested | 18,412,464 | 4,720,558 | 928,353 | - | - | - |
Redeemed | (101,334,787) | (38,719,734) | (9,747,785) | - | - | - |
Net increase (decrease) | (33,483,280) | (6,332,726) | 2,523,034 | 11,592 | 11,628 | 11,719 |
| | | | | | |
Dollars Sold | $ 326,369,917 | $ 182,792,007 | $ 74,778,966 | $ 75,000 | $ 75,000 | $ 75,000 |
Reinvested | 119,128,639 | 30,447,599 | 5,941,460 | - | - | - |
Redeemed | (672,513,946) | (255,556,875) | (63,099,503) | - | - | - |
Net increase (decrease) | $ (227,015,390) | $ (42,317,269) | $ 17,620,923 | $ 75,000 | $ 75,000 | $ 75,000 |
| | | | | | |
Share Transactions | Year ended December 31, 2003 |
Shares | Initial Class | Service Class | Service Class 2 | Initial Class R | Service Class R | Service Class 2R |
Sold | 187,111,620 | 59,201,139 | 17,709,351 | $ - | $ - | $ - |
Reinvested | 15,863,052 | 3,574,368 | 424,961 | - | - | - |
Redeemed | (166,651,099) | (46,461,897) | (12,553,214) | - | - | - |
Net increase (decrease) | 36,323,573 | 16,313,610 | 5,581,098 | $ - | $ - | $ - |
| | | | | | |
Dollars Sold | $ 1,162,830,605 | $ 370,826,801 | $ 111,025,684 | $ - | $ - | $ - |
Reinvested | 88,674,463 | 19,909,232 | 2,354,286 | - | - | - |
Redeemed | (1,045,910,689) | (293,649,573) | (79,527,648) | - | - | - |
Net increase (decrease) | $ 205,594,379 | $ 97,086,460 | $ 33,852,322 | $ - | $ - | $ - |
| | | | | | |
Distributions | Year ended December 31, 2004 |
| Initial Class | Service Class | Service Class 2 | Initial Class R A | Service Class R A | Service Class 2R A |
From net investment income | $ 119,128,639 | $ 30,447,599 | $ 5,941,460 | $ - | $ - | $ - |
| | | | | | |
| Year ended December 31, 2003 |
| Initial Class | Service Class | Service Class 2 | Initial Class R | Service Class R | Service Class 2R |
From net investment income | $ 88,674,463 | $ 19,909,232 | $ 2,354,286 | $ - | $ - | $ - |
A For the period April 14, 2004 (commencement of sale of shares) to December 31, 2004.
See accompanying notes which are an integral part of the financial statements.
High Income Portfolio
Financial Highlights - Initial Class
Years ended December 31, | 2004 | 2003 | 2002 | 2001 | 2000 |
Selected Per-Share Data | | | | | |
Net asset value, beginning of period | $ 6.95 | $ 5.93 | $ 6.41 | $ 8.18 | $ 11.32 |
Income from Investment Operations | | | | | |
Net investment income C | .494 | .520 | .496 F | .774 E, F | 1.123 |
Net realized and unrealized gain (loss) | .126 | .980 | (.306) F | (1.544) E, F | (3.513) |
Total from investment operations | .620 | 1.500 | .190 | (.770) | (2.390) |
Distributions from net investment income | (.570) | (.480) | (.670) | (1.000) | (.750) |
Net asset value, end of period | $ 7.00 | $ 6.95 | $ 5.93 | $ 6.41 | $ 8.18 |
Total Return A, B | 9.59% | 27.26% | 3.44% | (11.73)% | (22.54)% |
Ratios to Average Net Assets D | | | | | |
Expenses before expense reductions | .71% | .69% | .70% | .71% | .68% |
Expenses net of voluntary waivers, if any | .71% | .69% | .70% | .71% | .68% |
Expenses net of all reductions | .71% | .69% | .70% | .70% | .68% |
Net investment income | 7.43% | 8.25% | 8.65% F | 11.00% E, F | 11.38% |
Supplemental Data | | | | | |
Net assets, end of period (000 omitted) | $ 1,371,736 | $ 1,593,714 | $ 1,145,562 | $ 1,201,085 | $ 1,467,250 |
Portfolio turnover rate | 128% | 130% | 96% | 138% | 68% |
A Total returns do not reflect charges attributable to your insurance company's separate account. Inclusion of these charges would reduce the total returns shown.
B Total returns would have been lower had certain expenses not been reduced during the periods shown.
C Calculated based on average shares outstanding during the period.
D Expense ratios reflect operating expenses of the class. Expenses before reductions do not reflect amounts reimbursed by the investment adviser or reductions from brokerage service arrangements or other expense offset arrangements and do not represent the amount paid by the class during periods when reimbursements or reductions occur. Expenses net of any voluntary waivers reflect expenses after reimbursement by the investment adviser but prior to reductions from brokerage service arrangements or other expense offset arrangements. Expenses net of all reductions represent the net expenses paid by the class.
E Effective January 1, 2001, the fund adopted the provisions of the AICPA Audit and Accounting Guide for Investment Companies and began amortizing premium and discount on all debt securities. Per-share data and ratios for periods prior to adoption have not been restated to reflect this change.
F As a result of a revision to reflect accretion of market discount using the interest method, certain amounts for the years ended December 31, 2002 and December 31, 2001 have been reclassified from what was previously reported. The impact of this change for the years ended December 31, 2002 and December 31, 2001 was a decrease to net investment income of $.017 and $.075 per share with a corresponding increase to net realized and unrealized gain (loss) per share, respectively. The ratio of net investment income to average net assets decreased from 8.95% and 12.08% to 8.65% and 11.00%, respectively. The reclassification has no impact on the net assets of the fund.
Financial Highlights - Service Class
Years ended December 31, | 2004 | 2003 | 2002 | 2001 | 2000 |
Selected Per-Share Data | | | | | |
Net asset value, beginning of period | $ 6.92 | $ 5.91 | $ 6.38 | $ 8.15 | $ 11.29 |
Income from Investment Operations | | | | | |
Net investment income C | .486 | .513 | .488 F | .758 E, F | 1.102 |
Net realized and unrealized gain (loss) | .124 | .967 | (.288) F | (1.538) E, F | (3.502) |
Total from investment operations | .610 | 1.480 | .200 | (.780) | (2.400) |
Distributions from net investment income | (.560) | (.470) | (.670) | (.990) | (.740) |
Net asset value, end of period | $ 6.97 | $ 6.92 | $ 5.91 | $ 6.38 | $ 8.15 |
Total Return A, B | 9.47% | 26.97% | 3.62% | (11.90)% | (22.68)% |
Ratios to Average Net Assets D | | | | | |
Expenses before expense reductions | .81% | .79% | .80% | .81% | .78% |
Expenses net of voluntary waivers, if any | .81% | .79% | .80% | .81% | .78% |
Expenses net of all reductions | .81% | .79% | .80% | .81% | .78% |
Net investment income | 7.33% | 8.15% | 8.55% F | 10.90% E, F | 11.28% |
Supplemental Data | | | | | |
Net assets, end of period (000 omitted) | $ 377,122 | $ 417,928 | $ 260,489 | $ 234,204 | $ 227,549 |
Portfolio turnover rate | 128% | 130% | 96% | 138% | 68% |
A Total returns do not reflect charges attributable to your insurance company's separate account. Inclusion of these charges would reduce the total returns shown.
B Total returns would have been lower had certain expenses not been reduced during the periods shown.
C Calculated based on average shares outstanding during the period.
D Expense ratios reflect operating expenses of the class. Expenses before reductions do not reflect amounts reimbursed by the investment adviser or reductions from brokerage service arrangements or other expense offset arrangements and do not represent the amount paid by the class during periods when reimbursements or reductions occur. Expenses net of any voluntary waivers reflect expenses after reimbursement by the investment adviser but prior to reductions from brokerage service arrangements or other expense offset arrangements. Expenses net of all reductions represent the net expenses paid by the class.
E Effective January 1, 2001, the fund adopted the provisions of the AICPA Audit and Accounting Guide for Investment Companies and began amortizing premium and discount on all debt securities. Per-share data and ratios for periods prior to adoption have not been restated to reflect this change.
F As a result of a revision to reflect accretion of market discount using the interest method, certain amounts for the years ended December 31, 2002 and December 31, 2001 have been reclassified from what was previously reported. The impact of this change for the years ended December 31, 2002 and December 31, 2001 was a decrease to net investment income of $.017 and $.075 per share with a corresponding increase to net realized and unrealized gain (loss) per share, respectively. The ratio of net investment income to average net assets decreased from 8.85% and 11.97% to 8.55% and 10.90%, respectively. The reclassification has no impact on the net assets of the fund.
See accompanying notes which are an integral part of the financial statements.
Annual Report
Financial Highlights - Service Class 2
Years ended December 31, | 2004 | 2003 | 2002 | 2001 | 2000 F |
Selected Per-Share Data | | | | | |
Net asset value, beginning of period | $ 6.87 | $ 5.87 | $ 6.36 | $ 8.13 | $ 11.14 |
Income from Investment Operations | | | | | |
Net investment income E | .470 | .501 | .472 I | .716 H, I | .936 |
Net realized and unrealized gain (loss) | .130 | .959 | (.292) I | (1.496) H, I | (3.206) |
Total from investment operations | .600 | 1.460 | .180 | (.780) | (2.270) |
Distributions from net investment income | (.560) | (.460) | (.670) | (.990) | (.740) |
Net asset value, end of period | $ 6.91 | $ 6.87 | $ 5.87 | $ 6.36 | $ 8.13 |
Total Return B, C, D | 9.38% | 26.75% | 3.30% | (11.93)% | (21.83)% |
Ratios to Average Net Assets G | | | | | |
Expenses before expense reductions | .97% | .95% | .97% | .98% | 1.01% A |
Expenses net of voluntary waivers, if any | .97% | .95% | .97% | .98% | 1.01% A |
Expenses net of all reductions | .97% | .95% | .97% | .98% | 1.01% A |
Net investment income | 7.17% | 7.99% | 8.38% I | 10.73% H, I | 11.04% A |
Supplemental Data | | | | | |
Net assets, end of period (000 omitted) | $ 94,246 | $ 76,383 | $ 32,499 | $ 16,508 | $ 4,742 |
Portfolio turnover rate | 128% | 130% | 96% | 138% | 68% |
A Annualized
B Total returns for periods of less than one year are not annualized.
C Total returns do not reflect charges attributable to your insurance company's separate account. Inclusion of these charges would reduce the total returns shown.
D Total returns would have been lower had certain expenses not been reduced during the periods shown.
E Calculated based on average shares outstanding during the period.
F For the period January 12, 2000 (commencement of sale of shares) to December 31, 2000.
G Expense ratios reflect operating expenses of the class. Expenses before reductions do not reflect amounts reimbursed by the investment adviser or reductions from brokerage service arrangements or other expense offset arrangements and do not represent the amount paid by the class during periods when reimbursements or reductions occur. Expense ratios before reductions for start-up periods may not be representative of longer-term operating periods. Expenses net of any voluntary waivers reflect expenses after reimbursement by the investment adviser but prior to reductions from brokerage service arrangements or other expense offset arrangements. Expenses net of all reductions represent the net expenses paid by the class.
H Effective January 1, 2001, the fund adopted the provisions of the AICPA Audit and Accounting Guide for Investment Companies and began amortizing premium and discount on all debt securities. Per-share data and ratios for periods prior to adoption have not been restated to reflect this change.
I As a result of a revision to reflect accretion of market discount using the interest method, certain amounts for the years ended December 31, 2002 and December 31, 2001 have been reclassified from what was previously reported. The impact of this change for the years ended December 31, 2002 and December 31, 2001 was a decrease to net investment income of $.017 and $.072 per share with a corresponding increase to net realized and unrealized gain (loss) per share, respectively. The ratio of net investment income to average net assets decreased from 8.68% and 11.81% to 8.38% and 10.73%, respectively. The reclassification has no impact on the net assets of the fund.
Financial Highlights - Initial Class R
Year ended December 31, | 2004 F |
Selected Per-Share Data | |
Net asset value, beginning of period | $ 6.47 |
Income from Investment Operations | |
Net investment income E | .338 |
Net realized and unrealized gain (loss) | .192 |
Total from investment operations | .530 |
Net asset value, end of period | $ 7.00 |
Total Return B, C, D | 8.19% |
Ratios to Average Net Assets G | |
Expenses before expense reductions | .71% A |
Expenses net of voluntary waivers, if any | .71% A |
Expenses net of all reductions | .71% A |
Net investment income | 7.16% A |
Supplemental Data | |
Net assets, end of period (000 omitted) | $ 81 |
Portfolio turnover rate | 128% |
A Annualized
B Total returns for periods of less than one year are not annualized.
C Total returns do not reflect charges attributable to your insurance company's separate account. Inclusion of these charges would reduce the total returns shown.
D Total returns would have been lower had certain expenses not been reduced during the periods shown.
E Calculated based on average shares outstanding during the period.
F For the period April 14, 2004 (commencement of sale of shares) to December 31, 2004.
G Expense ratios reflect operating expenses of the class. Expenses before reductions do not reflect amounts reimbursed by the investment adviser or reductions from brokerage service arrangements or other expense offset arrangements and do not represent the amount paid by the class during periods when reimbursements or reductions occur. Expense ratios before reductions for start-up periods may not be representative of longer-term operating periods. Expenses net of any voluntary waivers reflect expenses after reimbursement by the investment adviser but prior to reductions from brokerage service arrangements or other expense offset arrangements. Expenses net of all reductions represent the net expenses paid by the class.
See accompanying notes which are an integral part of the financial statements.
High Income Portfolio
Financial Highlights - Service Class R
Year ended December 31, | 2004 F |
Selected Per-Share Data | |
Net asset value, beginning of period | $ 6.45 |
Income from Investment Operations | |
Net investment income E | .332 |
Net realized and unrealized gain (loss) | .188 |
Total from investment operations | .520 |
Net asset value, end of period | $ 6.97 |
Total Return B, C, D | 8.06% |
Ratios to Average Net Assets G | |
Expenses before expense reductions | .81% A |
Expenses net of voluntary waivers, if any | .81% A |
Expenses net of all reductions | .81% A |
Net investment income | 7.05% A |
Supplemental Data | |
Net assets, end of period (000 omitted) | $ 81 |
Portfolio turnover rate | 128% |
A Annualized
B Total returns for periods of less than one year are not annualized.
C Total returns do not reflect charges attributable to your insurance company's separate account. Inclusion of these charges would reduce the total returns shown.
D Total returns would have been lower had certain expenses not been reduced during the periods shown.
E Calculated based on average shares outstanding during the period.
F For the period April 14, 2004 (commencement of sale of shares) to December 31, 2004.
G Expense ratios reflect operating expenses of the class. Expenses before reductions do not reflect amounts reimbursed by the investment adviser or reductions from brokerage service arrangements or other expense offset arrangements and do not represent the amount paid by the class during periods when reimbursements or reductions occur. Expense ratios before reductions for start-up periods may not be representative of longer-term operating periods. Expenses net of any voluntary waivers reflect expenses after reimbursement by the investment adviser but prior to reductions from brokerage service arrangements or other expense offset arrangements. Expenses net of all reductions represent the net expenses paid by the class.
Financial Highlights - Service Class 2R
Year ended December 31, | 2004 F |
Selected Per-Share Data | |
Net asset value, beginning of period | $ 6.40 |
Income from Investment Operations | |
Net investment income E | .322 |
Net realized and unrealized gain (loss) | .188 |
Total from investment operations | .510 |
Net asset value, end of period | $ 6.91 |
Total Return B, C, D | 7.97% |
Ratios to Average Net Assets G | |
Expenses before expense reductions | .96% A |
Expenses net of voluntary waivers, if any | .96% A |
Expenses net of all reductions | .96% A |
Net investment income | 6.90% A |
Supplemental Data | |
Net assets, end of period (000 omitted) | $ 81 |
Portfolio turnover rate | 128% |
A Annualized
B Total returns for periods of less than one year are not annualized.
C Total returns do not reflect charges attributable to your insurance company's separate account. Inclusion of these charges would reduce the total returns shown.
D Total returns would have been lower had certain expenses not been reduced during the periods shown.
E Calculated based on average shares outstanding during the period.
F For the period April 14, 2004 (commencement of sale of shares) to December 31, 2004.
G Expense ratios reflect operating expenses of the class. Expenses before reductions do not reflect amounts reimbursed by the investment adviser or reductions from brokerage service arrangements or other expense offset arrangements and do not represent the amount paid by the class during periods when reimbursements or reductions occur. Expense ratios before reductions for start-up periods may not be representative of longer-term operating periods. Expenses net of any voluntary waivers reflect expenses after reimbursement by the investment adviser but prior to reductions from brokerage service arrangements or other expense offset arrangements. Expenses net of all reductions represent the net expenses paid by the class.
See accompanying notes which are an integral part of the financial statements.
Annual Report
Fidelity Variable Insurance Products: Index 500 Portfolio
Performance: The Bottom Line
Average annual total return reflects the change in the value of an investment, assuming reinvestment of a class' dividend income and capital gains (the profits earned upon the sale of securities that have grown in value) and assuming a constant rate of performance each year. During periods of reimbursement by Fidelity, a fund's total return will be greater than it would be had the reimbursement not occurred. Performance numbers are net of all underlying fund operating expenses, but do not include any insurance charges imposed by your insurance company's separate account. If performance information included the effect of these additional charges, the total returns would be lower. How a fund did yesterday is no guarantee of how it will do tomorrow.
Average Annual Total Returns
Periods ended December 31, 2004 | Past 1
year | Past 5
years | Past 10
years |
Fidelity® VIP: Index 500 - Initial Class | 10.62% | -2.51% | 11.78% |
Fidelity VIP: Index 500 - Service ClassA | 10.51% | -2.60% | 11.73% |
Fidelity VIP: Index 500 - Service Class 2B | 10.34% | -2.76% | 11.64% |
A The initial offering of Service Class shares took place on July 7, 2000. Performance for Service Class shares reflects an asset-based service fee (12b-1 fee), and returns prior to July 7, 2000 are those of Initial Class and do not include the effects of Service Class' 12b-1 fee. Had Service Class shares' 12b-1 fee been reflected, returns prior to July 7, 2000 would have been lower.
B The initial offering of Service Class 2 shares took place on January 12, 2000. Performance for Service Class 2 shares reflects an asset-based service fee (12b-1 fee), and returns prior to January 12, 2000 are those of Initial Class and do not include the effects of Service Class 2's 12b-1 fee. Had Service Class 2 shares' 12b-1 fee been reflected, returns prior to January 12, 2000 would have been lower.
$10,000 Over 10 Years
Let's say hypothetically that $10,000 was invested in Fidelity® Variable Insurance Products: Index 500 Portfolio - Initial Class on December 31, 1994. The chart shows how the value of your investment would have changed, and also shows how the S&P 500® Index performed over the same period.
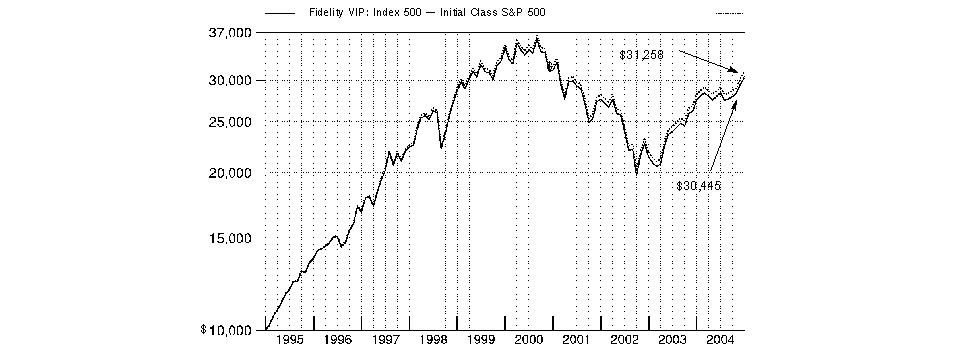
Annual Report
Fidelity Variable Insurance Products: Index 500 Portfolio
Management's Discussion of Fund Performance
Comments from Jacques Perold, Portfolio Manager of Fidelity® Variable Insurance Products: Index 500 Portfolio
The year ending December 31, 2004, generally was positive for equity investors, as many stock market benchmarks produced double-digit gains. Broad-based themes included the continued dominance of small-cap stocks, which outperformed large-caps for the sixth consecutive year. The small-cap Russell 2000® Index was up 18.33% in 2004, while the larger-cap Standard & Poor's 500SM Index rose 10.88%. Value stocks ended the year well ahead of growth stocks: The Russell 3000® Value Index advanced 16.94%, compared to 6.93% for the Russell 3000 Growth Index. Energy and basic materials stocks led the market upward. Energy stocks were boosted by record-high oil prices, while strong demand from China helped support commodity prices. The health care sector was among the market's weakest performers. Technology also fell off the pace, though it was helped by a rally late in the year. The tech-heavy NASDAQ Composite® Index returned 9.15%, thanks primarily to a 14.87% jump in the fourth quarter. Elsewhere, the Dow Jones Industrial AverageSM gained 5.37% for the year.
For the 12 months ending December 31, 2004, the fund's performance was in line with the S&P 500® and the LipperSM Variable Annuity S&P 500 Index Objective Funds Average, which returned 10.35%. Rising oil prices helped energy companies such as Exxon Mobil and ChevronTexaco generate stronger earnings and stock performance. Internet portal Yahoo! benefited from better advertising sales and steady growth in paid subscribers, while online auction house eBay continued to see extremely rapid growth. Intel, the world's leading maker of semiconductors, was a significant underperformer. Intel's stock price slid for most of the period after announcing a second-quarter decline in profit margins and an increase in inventories - signaling potential weakness in the cyclical semiconductor industry. Cisco Systems, which makes Internet routing equipment, saw its stock fall on a negative prognosis for the company's future sales growth, a summertime increase in inventories and indications of a slowdown in technology spending. Large-cap pharmaceutical stocks such as Merck and Pfizer encountered a difficult environment. Both companies were hurt by significant safety concerns about their leading pain management drugs.
The views expressed in this statement reflect those of the portfolio manager only through the end of the period of the report as stated on the cover and do not necessarily represent the views of Fidelity or any other person in the Fidelity organization. Any such views are subject to change at any time based upon market or other conditions and Fidelity disclaims any responsibility to update such views. These views may not be relied on as investment advice and, because investment decisions for a Fidelity fund are based on numerous factors, may not be relied on as an indication of trading intent on behalf of any Fidelity fund.
Annual Report
Fidelity Variable Insurance Products: Index 500 Portfolio
Investment Summary
Top Ten Stocks as of December 31, 2004 |
| % of fund's
net assets |
General Electric Co. | 3.4 |
Exxon Mobil Corp. | 2.9 |
Microsoft Corp. | 2.6 |
Citigroup, Inc. | 2.2 |
Wal-Mart Stores, Inc. | 2.0 |
Pfizer, Inc. | 1.8 |
Bank of America Corp. | 1.7 |
Johnson & Johnson | 1.7 |
American International Group, Inc. | 1.5 |
International Business Machines Corp. | 1.4 |
| 21.2 |
Market Sectors as of December 31, 2004 |
| % of fund's
net assets |
Financials | 20.4 |
Information Technology | 15.9 |
Health Care | 12.6 |
Consumer Discretionary | 11.8 |
Industrials | 11.7 |
Consumer Staples | 10.4 |
Energy | 7.1 |
Telecommunication Services | 3.2 |
Materials | 3.1 |
Utilities | 2.9 |
Annual Report
Fidelity Variable Insurance Products: Index 500 Portfolio
Investments December 31, 2004
Showing Percentage of Net Assets
Common Stocks - 99.1% |
| Shares | | Value (Note 1) |
CONSUMER DISCRETIONARY - 11.8% |
Auto Components - 0.2% |
Cooper Tire & Rubber Co. | 19,111 | | $ 411,842 |
Dana Corp. | 38,237 | | 662,647 |
Delphi Corp. | 143,253 | | 1,292,142 |
Goodyear Tire & Rubber Co. (a) | 44,767 | | 656,284 |
Johnson Controls, Inc. | 48,589 | | 3,082,486 |
Visteon Corp. | 33,066 | | 323,055 |
| | 6,428,456 |
Automobiles - 0.6% |
Ford Motor Co. | 467,051 | | 6,837,627 |
General Motors Corp. | 144,180 | | 5,775,851 |
Harley-Davidson, Inc. | 74,996 | | 4,556,007 |
| | 17,169,485 |
Distributors - 0.1% |
Genuine Parts Co. | 44,577 | | 1,964,063 |
Hotels, Restaurants & Leisure - 1.6% |
Carnival Corp. unit | 161,652 | | 9,316,005 |
Darden Restaurants, Inc. | 40,132 | | 1,113,262 |
Harrah's Entertainment, Inc. | 28,607 | | 1,913,522 |
Hilton Hotels Corp. | 98,539 | | 2,240,777 |
International Game Technology | 87,973 | | 3,024,512 |
Marriott International, Inc. Class A | 57,080 | | 3,594,898 |
McDonald's Corp. | 320,921 | | 10,288,727 |
Starbucks Corp. (a) | 102,100 | | 6,366,956 |
Starwood Hotels & Resorts Worldwide, Inc. unit | 52,911 | | 3,090,002 |
Wendy's International, Inc. | 29,095 | | 1,142,270 |
Yum! Brands, Inc. | 74,775 | | 3,527,885 |
| | 45,618,816 |
Household Durables - 0.5% |
Black & Decker Corp. | 20,610 | | 1,820,481 |
Centex Corp. | 31,728 | | 1,890,354 |
Fortune Brands, Inc. | 36,797 | | 2,839,992 |
KB Home | 11,824 | | 1,234,426 |
Leggett & Platt, Inc. | 48,730 | | 1,385,394 |
Maytag Corp. | 20,222 | | 426,684 |
Newell Rubbermaid, Inc. | 70,147 | | 1,696,856 |
Pulte Homes, Inc. | 32,560 | | 2,077,328 |
Snap-On, Inc. | 14,688 | | 504,680 |
The Stanley Works | 20,998 | | 1,028,692 |
Whirlpool Corp. | 16,956 | | 1,173,525 |
| | 16,078,412 |
Internet & Catalog Retail - 0.7% |
eBay, Inc. (a) | 169,217 | | 19,676,553 |
Leisure Equipment & Products - 0.2% |
Brunswick Corp. | 24,557 | | 1,215,572 |
Eastman Kodak Co. | 73,179 | | 2,360,023 |
Hasbro, Inc. | 45,186 | | 875,705 |
Mattel, Inc. | 105,927 | | 2,064,517 |
| | 6,515,817 |
|
| Shares | | Value (Note 1) |
Media - 3.9% |
Clear Channel Communications, Inc. | 146,404 | | $ 4,903,070 |
Comcast Corp. Class A (a) | 566,661 | | 18,858,478 |
Dow Jones & Co., Inc. | 20,917 | | 900,686 |
Gannett Co., Inc. | 65,157 | | 5,323,327 |
Interpublic Group of Companies, Inc. (a) | 107,949 | | 1,446,517 |
Knight-Ridder, Inc. | 19,657 | | 1,315,840 |
McGraw-Hill Companies, Inc. | 48,475 | | 4,437,402 |
Meredith Corp. | 12,763 | | 691,755 |
News Corp. Class A | 666,932 | | 12,444,951 |
Omnicom Group, Inc. | 47,563 | | 4,010,512 |
The New York Times Co. Class A | 37,032 | | 1,510,906 |
Time Warner, Inc. (a) | 1,169,210 | | 22,729,442 |
Tribune Co. | 81,100 | | 3,417,554 |
Univision Communications, Inc. Class A (a) | 82,503 | | 2,414,863 |
Viacom, Inc. Class B (non-vtg.) | 435,235 | | 15,838,202 |
Walt Disney Co. | 521,579 | | 14,499,896 |
| | 114,743,401 |
Multiline Retail - 1.1% |
Big Lots, Inc. (a) | 28,810 | | 349,465 |
Dillard's, Inc. Class A | 20,964 | | 563,303 |
Dollar General Corp. | 83,642 | | 1,737,244 |
Family Dollar Stores, Inc. | 42,805 | | 1,336,800 |
Federated Department Stores, Inc. | 43,192 | | 2,496,066 |
JCPenney Co., Inc. | 72,905 | | 3,018,267 |
Kohl's Corp. (a) | 87,579 | | 4,306,259 |
Nordstrom, Inc. | 35,757 | | 1,670,925 |
Sears, Roebuck & Co. | 52,793 | | 2,694,027 |
Target Corp. | 228,571 | | 11,869,692 |
The May Department Stores Co. | 74,534 | | 2,191,300 |
| | 32,233,348 |
Specialty Retail - 2.4% |
AutoNation, Inc. (a) | 67,536 | | 1,297,367 |
AutoZone, Inc. (a) | 20,367 | | 1,859,711 |
Bed Bath & Beyond, Inc. (a) | 76,817 | | 3,059,621 |
Best Buy Co., Inc. | 82,807 | | 4,920,392 |
Circuit City Stores, Inc. | 49,882 | | 780,154 |
Gap, Inc. | 223,801 | | 4,726,677 |
Home Depot, Inc. | 560,551 | | 23,957,950 |
Limited Brands, Inc. | 103,746 | | 2,388,233 |
Lowe's Companies, Inc. | 197,259 | | 11,360,146 |
Office Depot, Inc. (a) | 79,748 | | 1,384,425 |
OfficeMax, Inc. Delaware | 23,856 | | 748,601 |
RadioShack Corp. | 40,452 | | 1,330,062 |
Sherwin-Williams Co. | 36,081 | | 1,610,295 |
Staples, Inc. | 127,097 | | 4,284,440 |
Tiffany & Co., Inc. | 37,141 | | 1,187,398 |
TJX Companies, Inc. | 123,005 | | 3,091,116 |
Toys 'R' Us, Inc. (a) | 54,897 | | 1,123,742 |
| | 69,110,330 |
Textiles, Apparel & Luxury Goods - 0.5% |
Coach, Inc. (a) | 48,223 | | 2,719,777 |
Common Stocks - continued |
| Shares | | Value (Note 1) |
CONSUMER DISCRETIONARY - continued |
Textiles, Apparel & Luxury Goods - continued |
Jones Apparel Group, Inc. | 31,199 | | $ 1,140,947 |
Liz Claiborne, Inc. | 27,709 | | 1,169,597 |
NIKE, Inc. Class B | 67,001 | | 6,076,321 |
Reebok International Ltd. | 14,837 | | 652,828 |
VF Corp. | 28,354 | | 1,570,245 |
| | 13,329,715 |
TOTAL CONSUMER DISCRETIONARY | | 342,868,396 |
CONSUMER STAPLES - 10.4% |
Beverages - 2.2% |
Adolph Coors Co. Class B | 9,554 | | 722,951 |
Anheuser-Busch Companies, Inc. | 201,677 | | 10,231,074 |
Brown-Forman Corp. Class B (non-vtg.) | 31,088 | | 1,513,364 |
Coca-Cola Enterprises, Inc. | 119,777 | | 2,497,350 |
Pepsi Bottling Group, Inc. | 63,837 | | 1,726,152 |
PepsiCo, Inc. | 429,989 | | 22,445,426 |
The Coca-Cola Co. | 617,598 | | 25,710,605 |
| | 64,846,922 |
Food & Staples Retailing - 3.2% |
Albertsons, Inc. | 93,952 | | 2,243,574 |
Costco Wholesale Corp. | 119,738 | | 5,796,517 |
CVS Corp. | 102,123 | | 4,602,684 |
Kroger Co. (a) | 188,668 | | 3,309,237 |
Safeway, Inc. (a) | 114,231 | | 2,254,920 |
SUPERVALU, Inc. | 34,270 | | 1,183,000 |
Sysco Corp. | 163,317 | | 6,233,810 |
Wal-Mart Stores, Inc. | 1,081,014 | | 57,099,159 |
Walgreen Co. | 260,876 | | 10,009,812 |
| | 92,732,713 |
Food Products - 1.3% |
Archer-Daniels-Midland Co. | 167,074 | | 3,727,421 |
Campbell Soup Co. | 105,032 | | 3,139,406 |
ConAgra Foods, Inc. | 131,282 | | 3,866,255 |
General Mills, Inc. | 93,007 | | 4,623,378 |
H.J. Heinz Co. | 89,171 | | 3,476,777 |
Hershey Foods Corp. | 62,816 | | 3,488,801 |
Kellogg Co. | 105,402 | | 4,707,253 |
McCormick & Co., Inc. (non-vtg.) | 34,899 | | 1,347,101 |
Sara Lee Corp. | 200,335 | | 4,836,087 |
Wm. Wrigley Jr. Co. | 57,291 | | 3,963,964 |
| | 37,176,443 |
Household Products - 1.8% |
Clorox Co. | 38,798 | | 2,286,366 |
Colgate-Palmolive Co. | 135,363 | | 6,925,171 |
Kimberly-Clark Corp. | 124,499 | | 8,193,279 |
Procter & Gamble Co. | 647,527 | | 35,665,787 |
| | 53,070,603 |
Personal Products - 0.6% |
Alberto-Culver Co. | 23,231 | | 1,128,330 |
|
| Shares | | Value (Note 1) |
Avon Products, Inc. | 120,728 | | $ 4,672,174 |
Gillette Co. | 253,430 | | 11,348,595 |
| | 17,149,099 |
Tobacco - 1.3% |
Altria Group, Inc. | 523,952 | | 32,013,467 |
Reynolds American, Inc. | 37,666 | | 2,960,548 |
UST, Inc. | 42,178 | | 2,029,184 |
| | 37,003,199 |
TOTAL CONSUMER STAPLES | | 301,978,979 |
ENERGY - 7.1% |
Energy Equipment & Services - 1.0% |
Baker Hughes, Inc. | 85,634 | | 3,654,003 |
BJ Services Co. | 41,227 | | 1,918,705 |
Halliburton Co. | 112,821 | | 4,427,096 |
Nabors Industries Ltd. (a) | 38,165 | | 1,957,483 |
Noble Corp. (a) | 34,554 | | 1,718,716 |
Rowan Companies, Inc. (a) | 27,373 | | 708,961 |
Schlumberger Ltd. (NY Shares) | 150,286 | | 10,061,648 |
Transocean, Inc. (a) | 82,085 | | 3,479,583 |
| | 27,926,195 |
Oil & Gas - 6.1% |
Amerada Hess Corp. | 23,396 | | 1,927,362 |
Anadarko Petroleum Corp. | 63,136 | | 4,091,844 |
Apache Corp. | 83,337 | | 4,214,352 |
Ashland, Inc. | 18,141 | | 1,059,072 |
Burlington Resources, Inc. | 99,936 | | 4,347,216 |
ChevronTexaco Corp. | 540,808 | | 28,397,828 |
ConocoPhillips | 176,192 | | 15,298,751 |
Devon Energy Corp. | 124,064 | | 4,828,571 |
El Paso Corp. | 164,193 | | 1,707,607 |
EOG Resources, Inc. | 30,268 | | 2,159,924 |
Exxon Mobil Corp. | 1,646,791 | | 84,414,507 |
Kerr-McGee Corp. | 38,722 | | 2,237,744 |
Kinder Morgan, Inc. | 31,622 | | 2,312,517 |
Marathon Oil Corp. | 88,466 | | 3,327,206 |
Occidental Petroleum Corp. | 100,759 | | 5,880,295 |
Sunoco, Inc. | 18,667 | | 1,525,281 |
Unocal Corp. | 67,181 | | 2,904,906 |
Valero Energy Corp. | 65,511 | | 2,974,199 |
Williams Companies, Inc. | 142,043 | | 2,313,880 |
XTO Energy, Inc. | 66,480 | | 2,352,062 |
| | 178,275,124 |
TOTAL ENERGY | | 206,201,319 |
FINANCIALS - 20.4% |
Capital Markets - 2.8% |
Bank of New York Co., Inc. | 198,316 | | 6,627,721 |
Bear Stearns Companies, Inc. | 26,355 | | 2,696,380 |
Charles Schwab Corp. | 343,836 | | 4,112,279 |
E*TRADE Financial Corp. (a) | 94,935 | | 1,419,278 |
Common Stocks - continued |
| Shares | | Value (Note 1) |
FINANCIALS - continued |
Capital Markets - continued |
Federated Investors, Inc. Class B (non-vtg.) | 27,430 | | $ 833,872 |
Franklin Resources, Inc. | 63,659 | | 4,433,849 |
Goldman Sachs Group, Inc. | 123,596 | | 12,858,928 |
Janus Capital Group, Inc. | 60,316 | | 1,013,912 |
Lehman Brothers Holdings, Inc. | 68,773 | | 6,016,262 |
Mellon Financial Corp. | 108,117 | | 3,363,520 |
Merrill Lynch & Co., Inc. | 237,757 | | 14,210,736 |
Morgan Stanley | 279,406 | | 15,512,621 |
Northern Trust Corp. | 55,956 | | 2,718,342 |
State Street Corp. | 85,108 | | 4,180,505 |
T. Rowe Price Group, Inc. | 32,711 | | 2,034,624 |
| | 82,032,829 |
Commercial Banks - 5.9% |
AmSouth Bancorp. | 90,645 | | 2,347,706 |
Bank of America Corp. | 1,031,061 | | 48,449,556 |
BB&T Corp. | 141,000 | | 5,929,050 |
Comerica, Inc. | 43,538 | | 2,656,689 |
Compass Bancshares, Inc. | 31,308 | | 1,523,760 |
Fifth Third Bancorp | 143,278 | | 6,774,184 |
First Horizon National Corp. | 31,430 | | 1,354,947 |
Huntington Bancshares, Inc. | 58,993 | | 1,461,847 |
KeyCorp | 103,795 | | 3,518,651 |
M&T Bank Corp. | 29,646 | | 3,197,025 |
Marshall & Ilsley Corp. | 57,034 | | 2,520,903 |
National City Corp. | 172,952 | | 6,494,348 |
North Fork Bancorp, Inc., New York | 120,139 | | 3,466,010 |
PNC Financial Services Group, Inc. | 72,148 | | 4,144,181 |
Regions Financial Corp. New | 118,645 | | 4,222,576 |
SunTrust Banks, Inc. | 94,646 | | 6,992,446 |
Synovus Financial Corp. | 79,043 | | 2,259,049 |
U.S. Bancorp, Delaware | 476,620 | | 14,927,738 |
Wachovia Corp. | 409,353 | | 21,531,968 |
Wells Fargo & Co. | 431,875 | | 26,841,031 |
Zions Bancorp | 22,888 | | 1,557,071 |
| | 172,170,736 |
Consumer Finance - 1.4% |
American Express Co. | 320,406 | | 18,061,286 |
Capital One Financial Corp. | 61,957 | | 5,217,399 |
MBNA Corp. | 326,146 | | 9,194,056 |
Providian Financial Corp. (a) | 74,822 | | 1,232,318 |
SLM Corp. | 109,720 | | 5,857,951 |
| | 39,563,010 |
Diversified Financial Services - 3.7% |
CIT Group, Inc. | 53,652 | | 2,458,335 |
Citigroup, Inc. | 1,324,763 | | 63,827,081 |
J.P. Morgan Chase & Co. | 909,372 | | 35,474,602 |
|
| Shares | | Value (Note 1) |
Moody's Corp. | 37,754 | | $ 3,278,935 |
Principal Financial Group, Inc. | 78,356 | | 3,207,895 |
| | 108,246,848 |
Insurance - 4.2% |
ACE Ltd. | 72,546 | | 3,101,342 |
AFLAC, Inc. | 129,160 | | 5,145,734 |
Allstate Corp. | 175,166 | | 9,059,586 |
AMBAC Financial Group, Inc. | 27,739 | | 2,278,204 |
American International Group, Inc. | 664,856 | | 43,661,094 |
Aon Corp. | 80,780 | | 1,927,411 |
Cincinnati Financial Corp. | 42,897 | | 1,898,621 |
Hartford Financial Services Group, Inc. | 74,974 | | 5,196,448 |
Jefferson-Pilot Corp. | 34,849 | | 1,810,754 |
Lincoln National Corp. | 44,569 | | 2,080,481 |
Loews Corp. | 47,351 | | 3,328,775 |
Marsh & McLennan Companies, Inc. | 134,506 | | 4,425,247 |
MBIA, Inc. | 35,922 | | 2,273,144 |
MetLife, Inc. | 190,003 | | 7,697,022 |
Progressive Corp. | 51,105 | | 4,335,748 |
Prudential Financial, Inc. | 130,951 | | 7,197,067 |
SAFECO Corp. | 32,375 | | 1,691,270 |
St. Paul Travelers Companies, Inc. | 170,890 | | 6,334,892 |
The Chubb Corp. | 48,899 | | 3,760,333 |
Torchmark Corp. | 27,596 | | 1,576,835 |
UnumProvident Corp. | 75,684 | | 1,357,771 |
XL Capital Ltd. Class A | 35,394 | | 2,748,344 |
| | 122,886,123 |
Real Estate - 0.5% |
Apartment Investment & Management Co. Class A | 24,194 | | 932,437 |
Archstone-Smith Trust | 49,951 | | 1,913,123 |
Equity Office Properties Trust | 102,933 | | 2,997,409 |
Equity Residential (SBI) | 72,180 | | 2,611,472 |
Plum Creek Timber Co., Inc. | 46,859 | | 1,801,260 |
ProLogis | 46,943 | | 2,034,040 |
Simon Property Group, Inc. | 56,456 | | 3,651,010 |
| | 15,940,751 |
Thrifts & Mortgage Finance - 1.9% |
Countrywide Financial Corp. | 148,160 | | 5,483,402 |
Fannie Mae | 247,072 | | 17,593,997 |
Freddie Mac | 176,016 | | 12,972,379 |
Golden West Financial Corp., Delaware | 78,164 | | 4,800,833 |
MGIC Investment Corp. | 24,704 | | 1,702,353 |
Sovereign Bancorp, Inc. | 88,117 | | 1,987,038 |
Washington Mutual, Inc. | 222,867 | | 9,422,817 |
| | 53,962,819 |
TOTAL FINANCIALS | | 594,803,116 |
HEALTH CARE - 12.6% |
Biotechnology - 1.3% |
Amgen, Inc. (a) | 324,221 | | 20,798,777 |
Common Stocks - continued |
| Shares | | Value (Note 1) |
HEALTH CARE - continued |
Biotechnology - continued |
Applera Corp. - Applied Biosystems Group | 50,038 | | $ 1,046,295 |
Biogen Idec, Inc. (a) | 85,144 | | 5,671,442 |
Chiron Corp. (a) | 47,694 | | 1,589,641 |
Genzyme Corp. - General Division (a) | 63,273 | | 3,674,263 |
Gilead Sciences, Inc. (a) | 110,508 | | 3,866,675 |
MedImmune, Inc. (a) | 63,490 | | 1,721,214 |
| | 38,368,307 |
Health Care Equipment & Supplies - 2.2% |
Bausch & Lomb, Inc. | 13,649 | | 879,815 |
Baxter International, Inc. | 157,358 | | 5,435,145 |
Becton, Dickinson & Co. | 64,655 | | 3,672,404 |
Biomet, Inc. | 64,618 | | 2,803,775 |
Boston Scientific Corp. (a) | 215,565 | | 7,663,336 |
C.R. Bard, Inc. | 26,713 | | 1,709,098 |
Fisher Scientific International, Inc. (a) | 29,939 | | 1,867,595 |
Guidant Corp. | 81,319 | | 5,863,100 |
Hospira, Inc. (a) | 39,846 | | 1,334,841 |
Medtronic, Inc. | 308,545 | | 15,325,430 |
Millipore Corp. (a) | 12,694 | | 632,288 |
PerkinElmer, Inc. | 32,699 | | 735,401 |
St. Jude Medical, Inc. (a) | 91,267 | | 3,826,825 |
Stryker Corp. | 102,622 | | 4,951,512 |
Thermo Electron Corp. (a) | 40,830 | | 1,232,658 |
Waters Corp. (a) | 30,846 | | 1,443,284 |
Zimmer Holdings, Inc. (a) | 62,618 | | 5,016,954 |
| | 64,393,461 |
Health Care Providers & Services - 2.3% |
Aetna, Inc. | 37,690 | | 4,701,828 |
AmerisourceBergen Corp. | 26,833 | | 1,574,560 |
Cardinal Health, Inc. | 110,294 | | 6,413,596 |
Caremark Rx, Inc. (a) | 116,036 | | 4,575,299 |
CIGNA Corp. | 34,270 | | 2,795,404 |
Express Scripts, Inc. (a) | 19,396 | | 1,482,630 |
HCA, Inc. | 107,522 | | 4,296,579 |
Health Management Associates, Inc. Class A | 62,133 | | 1,411,662 |
Humana, Inc. (a) | 40,691 | | 1,208,116 |
IMS Health, Inc. | 59,209 | | 1,374,241 |
Laboratory Corp. of America Holdings (a) | 35,312 | | 1,759,244 |
Manor Care, Inc. | 22,065 | | 781,763 |
McKesson Corp. | 75,026 | | 2,360,318 |
Medco Health Solutions, Inc. (a) | 69,559 | | 2,893,654 |
Quest Diagnostics, Inc. | 25,833 | | 2,468,343 |
Tenet Healthcare Corp. (a) | 119,124 | | 1,307,982 |
UnitedHealth Group, Inc. | 166,849 | | 14,687,717 |
WellPoint, Inc. (a) | 75,344 | | 8,664,560 |
| | 64,757,496 |
|
| Shares | | Value (Note 1) |
Pharmaceuticals - 6.8% |
Abbott Laboratories | 397,548 | | $ 18,545,614 |
Allergan, Inc. | 33,513 | | 2,716,899 |
Bristol-Myers Squibb Co. | 496,646 | | 12,724,071 |
Eli Lilly & Co. | 288,868 | | 16,393,259 |
Forest Laboratories, Inc. (a) | 94,041 | | 4,218,679 |
Johnson & Johnson | 757,557 | | 48,044,265 |
King Pharmaceuticals, Inc. (a) | 61,662 | | 764,609 |
Merck & Co., Inc. | 566,072 | | 18,193,554 |
Mylan Laboratories, Inc. | 68,693 | | 1,214,492 |
Pfizer, Inc. | 1,922,400 | | 51,693,336 |
Schering-Plough Corp. | 375,945 | | 7,849,732 |
Watson Pharmaceuticals, Inc. (a) | 27,952 | | 917,105 |
Wyeth | 340,574 | | 14,505,047 |
| | 197,780,662 |
TOTAL HEALTH CARE | | 365,299,926 |
INDUSTRIALS - 11.7% |
Aerospace & Defense - 2.0% |
General Dynamics Corp. | 51,127 | | 5,347,884 |
Goodrich Corp. | 30,359 | | 990,918 |
Honeywell International, Inc. | 219,571 | | 7,775,009 |
L-3 Communications Holdings, Inc. | 29,396 | | 2,152,963 |
Lockheed Martin Corp. | 113,000 | | 6,277,150 |
Northrop Grumman Corp. | 93,994 | | 5,109,514 |
Raytheon Co. | 115,395 | | 4,480,788 |
Rockwell Collins, Inc. | 45,064 | | 1,777,324 |
The Boeing Co. | 214,320 | | 11,095,346 |
United Technologies Corp. | 130,451 | | 13,482,111 |
| | 58,489,007 |
Air Freight & Logistics - 1.1% |
FedEx Corp. | 76,725 | | 7,556,645 |
Ryder System, Inc. | 16,412 | | 784,001 |
United Parcel Service, Inc. Class B | 286,099 | | 24,450,021 |
| | 32,790,667 |
Airlines - 0.1% |
Delta Air Lines, Inc. (a)(d) | 33,034 | | 247,094 |
Southwest Airlines Co. | 199,000 | | 3,239,720 |
| | 3,486,814 |
Building Products - 0.2% |
American Standard Companies, Inc. (a) | 54,759 | | 2,262,642 |
Masco Corp. | 114,359 | | 4,177,534 |
| | 6,440,176 |
Commercial Services & Supplies - 1.0% |
Allied Waste Industries, Inc. (a) | 81,238 | | 753,889 |
Apollo Group, Inc. Class A (a) | 47,285 | | 3,816,372 |
Avery Dennison Corp. | 28,196 | | 1,690,914 |
Cendant Corp. | 268,753 | | 6,283,445 |
Cintas Corp. | 43,816 | | 1,921,770 |
Equifax, Inc. | 34,483 | | 968,972 |
H&R Block, Inc. | 42,047 | | 2,060,303 |
Common Stocks - continued |
| Shares | | Value (Note 1) |
INDUSTRIALS - continued |
Commercial Services & Supplies - continued |
Monster Worldwide, Inc. (a) | 30,398 | | $ 1,022,589 |
Pitney Bowes, Inc. | 58,869 | | 2,724,457 |
R.R. Donnelley & Sons Co. | 56,056 | | 1,978,216 |
Robert Half International, Inc. | 44,258 | | 1,302,513 |
Waste Management, Inc. | 146,045 | | 4,372,587 |
| | 28,896,027 |
Construction & Engineering - 0.1% |
Fluor Corp. | 21,390 | | 1,165,969 |
Electrical Equipment - 0.4% |
American Power Conversion Corp. | 48,824 | | 1,044,834 |
Cooper Industries Ltd. Class A | 23,427 | | 1,590,459 |
Emerson Electric Co. | 107,142 | | 7,510,654 |
Power-One, Inc. (a) | 21,427 | | 191,129 |
Rockwell Automation, Inc. | 47,018 | | 2,329,742 |
| | 12,666,818 |
Industrial Conglomerates - 4.7% |
3M Co. | 198,733 | | 16,310,017 |
General Electric Co. | 2,698,696 | | 98,502,391 |
Textron, Inc. | 35,104 | | 2,590,675 |
Tyco International Ltd. | 513,492 | | 18,352,204 |
| | 135,755,287 |
Machinery - 1.5% |
Caterpillar, Inc. | 87,106 | | 8,493,706 |
Cummins, Inc. | 11,619 | | 973,556 |
Danaher Corp. | 78,779 | | 4,522,702 |
Deere & Co. | 63,345 | | 4,712,868 |
Dover Corp. | 51,911 | | 2,177,147 |
Eaton Corp. | 38,775 | | 2,805,759 |
Illinois Tool Works, Inc. | 75,479 | | 6,995,394 |
Ingersoll-Rand Co. Ltd. Class A | 43,960 | | 3,529,988 |
ITT Industries, Inc. | 23,566 | | 1,990,149 |
Navistar International Corp. (a) | 17,824 | | 783,900 |
PACCAR, Inc. | 44,345 | | 3,568,886 |
Pall Corp. | 31,653 | | 916,354 |
Parker Hannifin Corp. | 30,498 | | 2,309,919 |
| | 43,780,328 |
Road & Rail - 0.5% |
Burlington Northern Santa Fe Corp. | 95,960 | | 4,539,868 |
CSX Corp. | 54,838 | | 2,197,907 |
Norfolk Southern Corp. | 101,087 | | 3,658,339 |
Union Pacific Corp. | 66,263 | | 4,456,187 |
| | 14,852,301 |
Trading Companies & Distributors - 0.1% |
W.W. Grainger, Inc. | 22,995 | | 1,531,927 |
TOTAL INDUSTRIALS | | 339,855,321 |
|
| Shares | | Value (Note 1) |
INFORMATION TECHNOLOGY - 15.9% |
Communications Equipment - 2.7% |
ADC Telecommunications, Inc. (a) | 206,477 | | $ 553,358 |
Andrew Corp. (a) | 41,046 | | 559,457 |
Avaya, Inc. (a) | 116,860 | | 2,009,992 |
CIENA Corp. (a) | 145,951 | | 487,476 |
Cisco Systems, Inc. (a) | 1,680,854 | | 32,440,482 |
Comverse Technology, Inc. (a) | 50,454 | | 1,233,600 |
Corning, Inc. (a) | 357,943 | | 4,212,989 |
JDS Uniphase Corp. (a) | 368,605 | | 1,168,478 |
Lucent Technologies, Inc. (a) | 1,128,434 | | 4,242,912 |
Lucent Technologies, Inc. warrants 12/10/07 (a) | 30,408 | | 48,045 |
Motorola, Inc. | 621,428 | | 10,688,562 |
QUALCOMM, Inc. | 418,400 | | 17,740,160 |
Scientific-Atlanta, Inc. | 39,136 | | 1,291,879 |
Tellabs, Inc. (a) | 117,930 | | 1,013,019 |
| | 77,690,409 |
Computers & Peripherals - 3.9% |
Apple Computer, Inc. (a) | 102,631 | | 6,609,436 |
Dell, Inc. (a) | 634,156 | | 26,723,334 |
EMC Corp. (a) | 611,686 | | 9,095,771 |
Gateway, Inc. (a) | 95,401 | | 573,360 |
Hewlett-Packard Co. | 770,875 | | 16,165,249 |
International Business Machines Corp. | 424,939 | | 41,890,487 |
Lexmark International, Inc. Class A (a) | 32,952 | | 2,800,920 |
NCR Corp. (a) | 23,791 | | 1,647,051 |
Network Appliance, Inc. (a)(d) | 91,585 | | 3,042,454 |
QLogic Corp. (a) | 23,620 | | 867,563 |
Sun Microsystems, Inc. (a) | 858,476 | | 4,618,601 |
| | 114,034,226 |
Electronic Equipment & Instruments - 0.3% |
Agilent Technologies, Inc. (a) | 123,958 | | 2,987,388 |
Jabil Circuit, Inc. (a) | 51,436 | | 1,315,733 |
Molex, Inc. | 48,096 | | 1,442,880 |
Sanmina-SCI Corp. (a) | 133,031 | | 1,126,773 |
Solectron Corp. (a) | 247,828 | | 1,320,923 |
Symbol Technologies, Inc. | 61,427 | | 1,062,687 |
Tektronix, Inc. | 22,975 | | 694,075 |
| | 9,950,459 |
Internet Software & Services - 0.5% |
Yahoo!, Inc. (a) | 350,943 | | 13,223,532 |
IT Services - 1.1% |
Affiliated Computer Services, Inc. Class A (a) | 32,812 | | 1,974,954 |
Automatic Data Processing, Inc. | 148,702 | | 6,594,934 |
Computer Sciences Corp. (a) | 48,314 | | 2,723,460 |
Convergys Corp. (a) | 36,146 | | 541,829 |
Electronic Data Systems Corp. | 131,168 | | 3,029,981 |
First Data Corp. | 211,831 | | 9,011,291 |
Fiserv, Inc. (a) | 49,927 | | 2,006,566 |
Paychex, Inc. | 96,540 | | 3,290,083 |
Common Stocks - continued |
| Shares | | Value (Note 1) |
INFORMATION TECHNOLOGY - continued |
IT Services - continued |
Sabre Holdings Corp. Class A | 34,583 | | $ 766,359 |
SunGard Data Systems, Inc. (a) | 73,739 | | 2,089,026 |
Unisys Corp. (a) | 85,751 | | 872,945 |
| | 32,901,428 |
Office Electronics - 0.1% |
Xerox Corp. (a) | 243,418 | | 4,140,540 |
Semiconductors & Semiconductor Equipment - 3.0% |
Advanced Micro Devices, Inc. (a) | 98,509 | | 2,169,168 |
Altera Corp. (a) | 95,033 | | 1,967,183 |
Analog Devices, Inc. | 95,939 | | 3,542,068 |
Applied Materials, Inc. (a) | 433,500 | | 7,412,850 |
Applied Micro Circuits Corp. (a) | 78,658 | | 331,150 |
Broadcom Corp. Class A (a) | 84,003 | | 2,711,617 |
Freescale Semiconductor, Inc. Class B | 99,508 | | 1,826,967 |
Intel Corp. | 1,614,041 | | 37,752,419 |
KLA-Tencor Corp. (a) | 49,892 | | 2,323,969 |
Linear Technology Corp. | 78,377 | | 3,037,893 |
LSI Logic Corp. (a) | 98,259 | | 538,459 |
Maxim Integrated Products, Inc. | 83,024 | | 3,519,387 |
Micron Technology, Inc. (a) | 156,328 | | 1,930,651 |
National Semiconductor Corp. | 91,420 | | 1,640,989 |
Novellus Systems, Inc. (a) | 35,684 | | 995,227 |
NVIDIA Corp. (a) | 42,428 | | 999,604 |
PMC-Sierra, Inc. (a) | 45,493 | | 511,796 |
Teradyne, Inc. (a) | 49,568 | | 846,126 |
Texas Instruments, Inc. | 441,079 | | 10,859,365 |
Xilinx, Inc. | 88,912 | | 2,636,241 |
| | 87,553,129 |
Software - 4.3% |
Adobe Systems, Inc. | 60,913 | | 3,821,682 |
Autodesk, Inc. | 58,584 | | 2,223,263 |
BMC Software, Inc. (a) | 56,657 | | 1,053,820 |
Citrix Systems, Inc. (a) | 43,240 | | 1,060,677 |
Computer Associates International, Inc. | 150,961 | | 4,688,849 |
Compuware Corp. (a) | 98,827 | | 639,411 |
Electronic Arts, Inc. (a) | 77,941 | | 4,807,401 |
Intuit, Inc. (a) | 47,845 | | 2,105,658 |
Mercury Interactive Corp. (a)(d) | 21,550 | | 981,603 |
Microsoft Corp. | 2,775,137 | | 74,123,909 |
Novell, Inc. (a) | 95,949 | | 647,656 |
Oracle Corp. (a) | 1,309,118 | | 17,961,099 |
Parametric Technology Corp. (a) | 68,698 | | 404,631 |
PeopleSoft, Inc. (a) | 9,591 | | 253,970 |
Siebel Systems, Inc. (a) | 129,719 | | 1,362,050 |
Symantec Corp. (a) | 161,886 | | 4,170,183 |
VERITAS Software Corp. (a) | 107,755 | | 3,076,405 |
| | 123,382,267 |
TOTAL INFORMATION TECHNOLOGY | | 462,875,990 |
|
| Shares | | Value (Note 1) |
MATERIALS - 3.1% |
Chemicals - 1.7% |
Air Products & Chemicals, Inc. | 58,024 | | $ 3,363,651 |
Dow Chemical Co. | 240,707 | | 11,917,404 |
E.I. du Pont de Nemours & Co. | 253,527 | | 12,435,499 |
Eastman Chemical Co. | 19,893 | | 1,148,423 |
Ecolab, Inc. | 65,784 | | 2,310,992 |
Engelhard Corp. | 31,219 | | 957,487 |
Great Lakes Chemical Corp. | 13,034 | | 371,339 |
Hercules, Inc. (a) | 28,581 | | 424,428 |
International Flavors & Fragrances, Inc. | 24,056 | | 1,030,559 |
Monsanto Co. | 67,491 | | 3,749,125 |
PPG Industries, Inc. | 43,878 | | 2,990,724 |
Praxair, Inc. | 82,891 | | 3,659,638 |
Rohm & Haas Co. | 57,394 | | 2,538,537 |
Sigma Aldrich Corp. | 17,624 | | 1,065,547 |
| | 47,963,353 |
Construction Materials - 0.0% |
Vulcan Materials Co. | 26,141 | | 1,427,560 |
Containers & Packaging - 0.2% |
Ball Corp. | 28,744 | | 1,264,161 |
Bemis Co., Inc. | 27,298 | | 794,099 |
Pactiv Corp. (a) | 37,889 | | 958,213 |
Sealed Air Corp. (a) | 21,331 | | 1,136,302 |
Temple-Inland, Inc. | 14,293 | | 977,641 |
| | 5,130,416 |
Metals & Mining - 0.7% |
Alcoa, Inc. | 222,203 | | 6,981,618 |
Allegheny Technologies, Inc. | 24,378 | | 528,271 |
Freeport-McMoRan Copper & Gold, Inc. Class B | 45,572 | | 1,742,218 |
Newmont Mining Corp. | 113,314 | | 5,032,275 |
Nucor Corp. | 40,610 | | 2,125,527 |
Phelps Dodge Corp. | 24,369 | | 2,410,581 |
United States Steel Corp. | 29,025 | | 1,487,531 |
| | 20,308,021 |
Paper & Forest Products - 0.5% |
Georgia-Pacific Corp. | 65,876 | | 2,469,032 |
International Paper Co. | 124,209 | | 5,216,778 |
Louisiana-Pacific Corp. | 28,093 | | 751,207 |
MeadWestvaco Corp. | 51,729 | | 1,753,096 |
Weyerhaeuser Co. | 61,230 | | 4,115,881 |
| | 14,305,994 |
TOTAL MATERIALS | | 89,135,344 |
TELECOMMUNICATION SERVICES - 3.2% |
Diversified Telecommunication Services - 2.9% |
ALLTEL Corp. | 77,539 | | 4,556,192 |
AT&T Corp. | 203,158 | | 3,872,191 |
BellSouth Corp. | 467,585 | | 12,994,187 |
CenturyTel, Inc. | 34,351 | | 1,218,430 |
Common Stocks - continued |
| Shares | | Value (Note 1) |
TELECOMMUNICATION SERVICES - continued |
Diversified Telecommunication Services - continued |
Citizens Communications Co. | 85,629 | | $ 1,180,824 |
Qwest Communications International, Inc. (a) | 463,538 | | 2,058,109 |
SBC Communications, Inc. | 846,309 | | 21,809,383 |
Sprint Corp. | 375,487 | | 9,330,852 |
Verizon Communications, Inc. | 706,818 | | 28,633,197 |
| | 85,653,365 |
Wireless Telecommunication Services - 0.3% |
Nextel Communications, Inc. Class A (a) | 283,673 | | 8,510,190 |
TOTAL TELECOMMUNICATION SERVICES | | 94,163,555 |
UTILITIES - 2.9% |
Electric Utilities - 2.0% |
Allegheny Energy, Inc. (a) | 35,037 | | 690,579 |
Ameren Corp. | 49,725 | | 2,493,212 |
American Electric Power Co., Inc. | 101,010 | | 3,468,683 |
CenterPoint Energy, Inc. | 78,576 | | 887,909 |
Cinergy Corp. | 46,266 | | 1,926,054 |
Consolidated Edison, Inc. | 61,778 | | 2,702,788 |
DTE Energy Co. | 44,405 | | 1,915,188 |
Edison International | 83,168 | | 2,663,871 |
Entergy Corp. | 57,063 | | 3,856,888 |
Exelon Corp. | 169,126 | | 7,453,383 |
FirstEnergy Corp. | 84,196 | | 3,326,584 |
FPL Group, Inc. | 47,374 | | 3,541,207 |
PG&E Corp. (a) | 102,904 | | 3,424,645 |
Pinnacle West Capital Corp. | 23,378 | | 1,038,217 |
PPL Corp. | 48,256 | | 2,571,080 |
Progress Energy, Inc. | 63,063 | | 2,852,970 |
Southern Co. | 188,816 | | 6,329,112 |
TECO Energy, Inc. | 50,969 | | 781,864 |
TXU Corp. | 61,320 | | 3,958,819 |
Xcel Energy, Inc. | 102,193 | | 1,859,913 |
| | 57,742,966 |
Gas Utilities - 0.1% |
KeySpan Corp. | 40,995 | | 1,617,253 |
Nicor, Inc. | 11,253 | | 415,686 |
NiSource, Inc. | 69,021 | | 1,572,298 |
Peoples Energy Corp. | 9,606 | | 422,184 |
| | 4,027,421 |
Multi-Utilities & Unregulated Power - 0.8% |
AES Corp. (a) | 165,616 | | 2,263,971 |
Calpine Corp. (a)(d) | 136,390 | | 537,377 |
CMS Energy Corp. (a) | 49,707 | | 519,438 |
Constellation Energy Group, Inc. | 44,889 | | 1,962,098 |
Dominion Resources, Inc. | 84,605 | | 5,731,143 |
Duke Energy Corp. | 244,199 | | 6,185,561 |
Dynegy, Inc. Class A (a) | 97,008 | | 448,177 |
|
| Shares | | Value (Note 1) |
Public Service Enterprise Group, Inc. | 60,680 | | $ 3,141,404 |
Sempra Energy | 59,576 | | 2,185,248 |
| | 22,974,417 |
TOTAL UTILITIES | | 84,744,804 |
TOTAL COMMON STOCKS (Cost $1,831,633,477) | 2,881,926,750 |
U.S. Treasury Obligations - 0.2% |
| Principal
Amount | | |
U.S. Treasury Bills, yield at date of purchase 1.61% 1/6/05 (e)
(Cost $4,998,667) | $ 5,000,000 | | 4,999,410 |
Money Market Funds - 0.8% |
| Shares | | |
Fidelity Cash Central Fund, 2.24% (b) | 19,121,626 | | 19,121,626 |
Fidelity Securities Lending Cash Central Fund, 2.23% (b)(c) | 4,673,722 | | 4,673,722 |
TOTAL MONEY MARKET FUNDS (Cost $23,795,348) | 23,795,348 |
TOTAL INVESTMENT PORTFOLIO - 100.1% (Cost $1,860,427,492) | | 2,910,721,508 |
NET OTHER ASSETS - (0.1)% | | (3,228,491) |
NET ASSETS - 100% | $ 2,907,493,017 |
Futures Contracts |
| Expiration
Date | | Underlying
Face Amount
at Value | | Unrealized
Appreciation/
(Depreciation) |
Purchased |
Equity Index Contracts |
10 S&P 500 E-Mini Index Contracts | March 2005 | | $ 606,850 | | $ 4,093 |
88 S&P 500 Index Contracts | March 2005 | | 26,701,400 | | 199,998 |
TOTAL EQUITY INDEX CONTRACTS | $ 27,308,250 | | $ 204,091 |
|
The face value of futures purchased as a percentage of net assets - 0.9% |
Legend |
(a) Non-income producing |
(b) Affiliated fund that is available only to investment companies and other accounts managed by Fidelity Investments. The rate quoted is the annualized seven-day yield of the fund at period end. A complete listing of the fund's holdings as of its most recent fiscal year end is available upon request. |
(c) Includes investment made with cash collateral received from securities on loan. |
(d) Security or a portion of the security is on loan at period end. |
(e) Security or a portion of the security was pledged to cover margin requirements for futures contracts. At the period end, the value of securities pledged amounted to $2,499,705. |
Income Tax Information |
At December 31, 2004, the fund had a capital loss carryforward of approximately $193,156,000 of which $36,405,000, $122,807,000 and $33,944,000 will expire on December 31, 2009, 2010 and 2011, respectively. |
See accompanying notes which are an integral part of the financial statements.
Index 500 Portfolio
Fidelity Variable Insurance Products: Index 500 Portfolio
Financial Statements
Statement of Assets and Liabilities
December 31, 2004 |
| | |
Assets | | |
Investment in securities, at value (including securities loaned of $4,418,815) (cost $1,860,427,492) - See accompanying schedule | | $ 2,910,721,508 |
Receivable for fund shares sold | | 718,143 |
Dividends receivable | | 3,740,548 |
Interest receivable | | 41,474 |
Prepaid expenses | | 10,601 |
Receivable from investment adviser for expense reductions | | 401,025 |
Other affiliated receivables | | 5,795 |
Other receivables | | 29,548 |
Total assets | | 2,915,668,642 |
Liabilities | | |
Payable for fund shares redeemed | $ 2,218,225 | |
Accrued management fee | 576,186 | |
Distribution fees payable | 23,359 | |
Payable for daily variation on futures contracts | 22,003 | |
Other affiliated payables | 247,159 | |
Other payables and accrued expenses | 414,971 | |
Collateral on securities loaned, at value | 4,673,722 | |
Total liabilities | | 8,175,625 |
Net Assets | | $ 2,907,493,017 |
Net Assets consist of: | | |
Paid in capital | | $ 2,002,716,840 |
Undistributed net investment income | | 49,696,311 |
Accumulated undistributed net realized gain (loss) on investments | | (195,418,241) |
Net unrealized appreciation (depreciation) on investments | | 1,050,498,107 |
Net Assets | | $ 2,907,493,017 |
Initial Class:
Net Asset Value, offering price and redemption price per share ($2,778,225,930 ÷ 20,167,721 shares) | | $ 137.76 |
Service Class:
Net Asset Value, offering price and redemption price per share ($23,216,426 ÷ 168,958 shares) | | $ 137.41 |
Service Class 2:
Net Asset Value, offering price and redemption price per share ($106,050,661 ÷ 775,738 shares) | | $ 136.71 |
Statement of Operations
Year ended December 31, 2004 |
| | |
Investment Income | | |
Dividends | | $ 49,589,039 |
Special Dividends | | 8,350,620 |
Interest | | 315,841 |
Security lending | | 69,017 |
Total income | | 58,324,517 |
| | |
Expenses | | |
Management fee | $ 7,048,607 | |
Transfer agent fees | 1,945,610 | |
Distribution fees | 220,995 | |
Accounting and security lending fees | 746,848 | |
Non-interested trustees' compensation | 16,202 | |
Appreciation in deferred trustee compensation account | 1,570 | |
Custodian fees and expenses | 64,646 | |
Audit | 50,473 | |
Legal | 7,052 | |
Interest | 1,623 | |
Miscellaneous | 482,393 | |
Total expenses before reductions | 10,586,019 | |
Expense reductions | (2,138,524) | 8,447,495 |
Net investment income (loss) | | 49,877,022 |
Realized and Unrealized Gain (Loss) Net realized gain (loss) on: | | |
Investment securities | 45,870,145 | |
Futures contracts | 3,256,099 | |
Total net realized gain (loss) | | 49,126,244 |
Change in net unrealized appreciation (depreciation) on: Investment securities | 190,580,653 | |
Futures contracts | (511,248) | |
Total change in net unrealized appreciation (depreciation) | | 190,069,405 |
Net gain (loss) | | 239,195,649 |
Net increase (decrease) in net assets resulting from operations | | $ 289,072,671 |
See accompanying notes which are an integral part of the financial statements.
Annual Report
Fidelity Variable Insurance Products: Index 500 Portfolio
Financial Statements - continued
Statement of Changes in Net Assets
| Year ended
December 31,
2004 | Year ended
December 31,
2003 |
Increase (Decrease) in Net Assets | | |
Operations | | |
Net investment income (loss) | $ 49,877,022 | $ 40,789,727 |
Net realized gain (loss) | 49,126,244 | (34,078,673) |
Change in net unrealized appreciation (depreciation) | 190,069,405 | 686,179,235 |
Net increase (decrease) in net assets resulting from operations | 289,072,671 | 692,890,289 |
Distributions to shareholders from net investment income | (40,638,037) | (39,819,617) |
Share transactions - net increase (decrease) | (452,730,560) | (77,062,400) |
Total increase (decrease) in net assets | (204,295,926) | 576,008,272 |
| | |
Net Assets | | |
Beginning of period | 3,111,788,943 | 2,535,780,671 |
End of period (including undistributed net investment income of $49,696,311 and undistributed net investment income of $40,612,689, respectively) | $ 2,907,493,017 | $ 3,111,788,943 |
Other Information: | | | |
Share Transactions | Year ended December 31, 2004 |
| Initial Class | Service Class | Service Class 2 |
Shares Sold | 1,899,337 | 63,065 | 511,841 |
Reinvested | 308,386 | 1,581 | 6,195 |
Redeemed | (6,074,596) | (18,076) | (259,750) |
Net increase (decrease) | (3,866,873) | 46,570 | 258,286 |
| | | |
Dollars Sold | $ 242,942,892 | $ 7,949,025 | $ 65,071,581 |
Reinvested | 39,642,996 | 202,925 | 792,116 |
Redeemed | (774,302,513) | (2,314,988) | (32,714,594) |
Net increase (decrease) | $ (491,716,625) | $ 5,836,962 | $ 33,149,103 |
| | | |
Share Transactions | Year ended December 31, 2003 |
| Initial Class | Service Class | Service Class 2 |
Shares Sold | 3,347,458 | 58,155 | 492,355 |
Reinvested | 423,444 | 1,303 | 4,503 |
Redeemed | (4,729,004) | (12,207) | (291,962) |
Net increase (decrease) | (958,102) | 47,251 | 204,896 |
| | | |
Dollars Sold | $ 362,063,909 | $ 6,250,927 | $ 52,922,248 |
Reinvested | 39,282,873 | 120,726 | 415,977 |
Redeemed | (506,013,307) | (1,274,037) | (30,831,716) |
Net increase (decrease) | $ (104,666,525) | $ 5,097,616 | $ 22,506,509 |
| | | |
Distributions | Year ended December 31, 2004 |
| Initial Class | Service Class | Service Class 2 |
From net investment income | $ 39,642,996 | $ 202,925 | $ 792,116 |
| | | |
| Year ended December 31, 2003 |
| Initial Class | Service Class | Service Class 2 |
From net investment income | $ 39,282,914 | $ 120,726 | $ 415,977 |
See accompanying notes which are an integral part of the financial statements.
Index 500 Portfolio
Financial Highlights - Initial Class
Years ended December 31, | 2004 | 2003 | 2002 | 2001 | 2000 |
Selected Per-Share Data | | | | | |
Net asset value, beginning of period | $ 126.13 | $ 99.92 | $ 130.08 | $ 149.53 | $ 167.41 |
Income from Investment Operations | | | | | |
Net investment income (loss) C | 2.18 D | 1.63 | 1.51 | 1.48 | 1.51 |
Net realized and unrealized gain (loss) | 11.10 | 26.18 | (30.18) | (19.34) | (16.99) |
Total from investment operations | 13.28 | 27.81 | (28.67) | (17.86) | (15.48) |
Distributions from net investment income | (1.65) | (1.60) | (1.49) | (1.59) | (1.67) |
Distributions from net realized gain | - | - | - | - | (.73) |
Total distributions | (1.65) | (1.60) | (1.49) | (1.59) | (2.40) |
Net asset value, end of period | $ 137.76 | $ 126.13 | $ 99.92 | $ 130.08 | $ 149.53 |
Total Return A, B | 10.62% | 28.41% | (22.25)% | (12.09)% | (9.30)% |
Ratios to Average Net Assets E | | | | | |
Expenses before expense reductions | .35% | .34% | .33% | .35% | .33% |
Expenses net of voluntary waivers, if any | .28% | .28% | .28% | .28% | .28% |
Expenses net of all reductions | .28% | .28% | .28% | .28% | .28% |
Net investment income (loss) | 1.71% | 1.50% | 1.34% | 1.09% | .94% |
Supplemental Data | | | | | |
Net assets, end of period (000 omitted) | $ 2,778,226 | $ 3,031,540 | $ 2,497,252 | $ 3,475,357 | $ 4,148,728 |
Portfolio turnover rate | 5% | 6% | 7% | 9% | 10% |
A Total returns do not reflect charges attributable to your insurance company's separate account. Inclusion of these charges would reduce the total returns shown. B Total returns would have been lower had certain expenses not been reduced during the periods shown. C Calculated based on average shares outstanding during the period. D Investment income per share reflects a special dividend which amounted to $.36 per share. E Expense ratios reflect operating expenses of the class. Expenses before reductions do not reflect amounts reimbursed by the investment adviser or reductions from brokerage service arrangements or other expense offset arrangements and do not represent the amount paid by the class during periods when reimbursements or reductions occur. Expenses net of any voluntary waivers reflect expenses after reimbursement by the investment adviser but prior to reductions from brokerage service arrangements or other expense offset arrangements. Expenses net of all reductions represent the net expenses paid by the class. |
Financial Highlights - Service Class
Years ended December 31, | 2004 | 2003 | 2002 | 2001 | 2000 G |
Selected Per-Share Data | | | | | |
Net asset value, beginning of period | $ 125.86 | $ 99.74 | $ 129.94 | $ 149.46 | $ 166.69 |
Income from Investment Operations | | | | | |
Net investment income (loss) E | 2.05 F | 1.54 | 1.34 | 1.24 | .65 |
Net realized and unrealized gain (loss) | 11.07 | 26.11 | (30.07) | (19.23) | (17.88) |
Total from investment operations | 13.12 | 27.65 | (28.73) | (17.99) | (17.23) |
Distributions from net investment income | (1.57) | (1.53) | (1.47) | (1.53) | - |
Net asset value, end of period | $ 137.41 | $ 125.86 | $ 99.74 | $ 129.94 | $ 149.46 |
Total Return B, C, D | 10.51% | 28.27% | (22.32)% | (12.18)% | (10.34)% |
Ratios to Average Net Assets H | | | | | |
Expenses before expense reductions | .47% | .46% | .47% | .56% | .43% A |
Expenses net of voluntary waivers, if any | .38% | .38% | .38% | .38% | .38% A |
Expenses net of all reductions | .38% | .38% | .38% | .38% | .38% A |
Net investment income (loss) | 1.61% | 1.40% | 1.24% | .99% | .84% A |
Supplemental Data | | | | | |
Net assets, end of period (000 omitted) | $ 23,216 | $ 15,404 | $ 7,494 | $ 3,278 | $ 90 |
Portfolio turnover rate | 5% | 6% | 7% | 9% | 10% |
A Annualized B Total returns for periods of less than one year are not annualized. C Total returns do not reflect charges attributable to your insurance company's separate account. Inclusion of these charges would reduce the total returns shown. D Total returns would have been lower had certain expenses not been reduced during the periods shown. E Calculated based on average shares outstanding during the period. F Investment income per share reflects a special dividend which amounted to $.36 per share. G For the period July 7, 2000 (commencement of operations) to December 31, 2000. H Expense ratios reflect operating expenses of the class. Expenses before reductions do not reflect amounts reimbursed by the investment adviser or reductions from brokerage service arrangements or other expense offset arrangements and do not represent the amount paid by the class during periods when reimbursements or reductions occur. Expense ratios before reductions for start-up periods may not be representative of longer-term operating periods. Expenses net of any voluntary waivers reflect expenses after reimbursement by the investment adviser but prior to reductions from brokerage service arrangements or other expense offset arrangements. Expenses net of all reductions represent the net expenses paid by the class. |
See accompanying notes which are an integral part of the financial statements.
Annual Report
Fidelity Variable Insurance Products: Index 500 Portfolio
Financial Statements - continued
Financial Highlights - Service Class 2
Years ended December 31, | 2004 | 2003 | 2002 | 2001 | 2000 G |
Selected Per-Share Data | | | | | |
Net asset value, beginning of period | $ 125.31 | $ 99.29 | $ 129.43 | $ 149.18 | $ 163.25 |
Income from Investment Operations | | | | | |
Net investment income (loss) E | 1.85 F | 1.37 | 1.19 | 1.09 | 1.04 |
Net realized and unrealized gain (loss) | 11.01 | 26.03 | (30.00) | (19.23) | (12.71) |
Total from investment operations | 12.86 | 27.40 | (28.81) | (18.14) | (11.67) |
Distributions from net investment income | (1.46) | (1.38) | (1.33) | (1.61) | (1.67) |
Distributions from net realized gain | - | - | - | - | (.73) |
Total distributions | (1.46) | (1.38) | (1.33) | (1.61) | (2.40) |
Net asset value, end of period | $ 136.71 | $ 125.31 | $ 99.29 | $ 129.43 | $ 149.18 |
Total Return B, C, D | 10.34% | 28.09% | (22.45)% | (12.31)% | (7.21)% |
Ratios to Average Net Assets H | | | | | |
Expenses before expense reductions | .61% | .60% | .60% | .61% | .76% A |
Expenses net of voluntary waivers, if any | .53% | .53% | .53% | .53% | .53% A |
Expenses net of all reductions | .53% | .53% | .53% | .53% | .53% A |
Net investment income (loss) | 1.46% | 1.25% | 1.09% | .84% | .69% A |
Supplemental Data | | | | | |
Net assets, end of period (000 omitted) | $ 106,051 | $ 64,844 | $ 31,035 | $ 19,338 | $ 323 |
Portfolio turnover rate | 5% | 6% | 7% | 9% | 10% |
A Annualized B Total returns for periods of less than one year are not annualized. C Total returns do not reflect charges attributable to your insurance company's separate account. Inclusion of these charges would reduce the total returns shown. D Total returns would have been lower had certain expenses not been reduced during the periods shown. E Calculated based on average shares outstanding during the period. F Investment income per share reflects a special dividend which amounted to $.36 per share. G For the period January 12, 2000 (commencement of operations) to December 31, 2000. H Expense ratios reflect operating expenses of the class. Expenses before reductions do not reflect amounts reimbursed by the investment adviser or reductions from brokerage service arrangements or other expense offset arrangements and do not represent the amount paid by the class during periods when reimbursements or reductions occur. Expense ratios before reductions for start-up periods may not be representative of longer-term operating periods. Expenses net of any voluntary waivers reflect expenses after reimbursement by the investment adviser but prior to reductions from brokerage service arrangements or other expense offset arrangements. Expenses net of all reductions represent the net expenses paid by the class. |
See accompanying notes which are an integral part of the financial statements.
Index 500 Portfolio
Fidelity Variable Insurance Products: Overseas Portfolio
Performance: The Bottom Line
Average annual total return reflects the change in the value of an investment, assuming reinvestment of a class' dividend income and capital gains (the profits earned upon the sale of securities that have grown in value) and assuming a constant rate of performance each year. During periods of reimbursement by Fidelity, a fund's total return will be greater than it would be had the reimbursement not occurred. Performance numbers are net of all underlying fund operating expenses, but do not include any insurance charges imposed by your insurance company's separate account. If performance information included the effect of these additional charges, the total returns would be lower. How a fund did yesterday is no guarantee of how it will do tomorrow.
Average Annual Total Returns
Periods ended December 31, 2004 | Past 1
year | Past 5
years | Past 10
years |
Fidelity® VIP: Overseas - Initial Class | 13.57% | -3.71% | 6.31% |
Fidelity VIP: Overseas - Service Class A | 13.49% | -3.80% | 6.24% |
Fidelity VIP: Overseas - Service Class 2 B | 13.31% | -3.89% | 6.19% |
A The initial offering of Service Class shares took place on November 3, 1997. Performance for Service Class shares reflects an asset-based distribution fee (12b-1 fee), and returns prior to November 3, 1997 are those of Initial Class and do not include the effects of Service Class' 12b-1 fee. Had Service Class shares' 12b-1 fee been reflected, returns prior to November 3, 1997 would have been lower.
B The initial offering of Service Class 2 shares took place on January 12, 2000. Performance for Service Class 2 shares reflects an asset-based distribution fee (12b-1 fee). Returns from November 3, 1997 to January 12, 2000 are those of Service Class which reflect a different 12b-1 fee. Service Class 2 returns prior to November 3, 1997 are those of Initial Class, and do not include the effects of a 12b-1 fee. Had Service Class 2 shares' 12b-1 fee been reflected, returns prior to January 12, 2000 would have been lower.
$10,000 Over 10 Years
Let's say hypothetically that $10,000 was invested in Fidelity® Variable Insurance Products: Overseas Portfolio - Initial Class on December 31, 1994. The chart shows how the value of your investment would have changed, and also shows how the MSCI® EAFE Index performed over the same period.

Annual Report
Fidelity Variable Insurance Products: Overseas Portfolio
Management's Discussion of Fund Performance
Comments from Rick Mace, Portfolio Manager of Fidelity® Variable Insurance Products: Overseas Portfolio
Most of the world's major stock markets posted solid gains for the year ending December 31, 2004. The Morgan Stanley Capital InternationalSM Europe, Australasia, Far East (MSCI® EAFE®) Index - designed to represent the performance of developed stock markets outside the United States and Canada - gained 20.42%, compared to 10.88% for the Standard & Poor's 500SM Index. A weak U.S. dollar relative to most foreign currencies was partly responsible for the performance disparity. On a regional basis, Europe was one of the top performers. Many investors felt European stocks offered better valuations and brighter earnings prospects than U.S. equities. Latin American countries, many of which are exporters of oil and raw materials that received strong support from high commodity prices, also did well. Conversely, Japan underperformed, as early optimism was eroded by disappointing economic indicators and concerns about the impact of China's economic slowdown on exports. Meanwhile, some Asian emerging markets, such as Taiwan and Indonesia, suffered from a deceleration in corporate capital spending.
For the one-year period ending December 31, 2004, the return of Overseas Portfolio trailed the advances of both the MSCI EAFE index and the
LipperSM Variable Annuity International Funds Average, the latter of which rose 18.20%. The fund's overweighting in two poor-performing market groups - semiconductors and diversified financials - caused the bulk of its performance shortfall relative to the index. Notable detractors included semiconductor equipment manufacturers Tokyo Electron, Netherlands-based ASML Holding and Taiwanese chip maker United Microelectronics, as well as Japanese brokerage stocks Nikko Cordial and Nomura Holdings. The semiconductor industry was the worst-performing component of the index during the past 12 months. On the positive side of the ledger, overweighting strong-performing energy stocks relative to the index was helpful. France-based energy producer Total SA and Canada's Talisman Energy were noteworthy standouts for the fund. Elsewhere, overweighting a couple of strong-performing stocks in the telecommunication services sector helped offset some of the fund's weakness in other areas. Specifically, holdings in U.K.-based mobile communications provider mmO2 and Germany-based Deutsche Telekom performed quite well.
The views expressed in this statement reflect those of the portfolio manager only through the end of the period of the report as stated on the cover and do not necessarily represent the views of Fidelity or any other person in the Fidelity organization. Any such views are subject to change at any time based upon market or other conditions and Fidelity disclaims any responsibility to update such views. These views may not be relied on as investment advice and, because investment decisions for a Fidelity fund are based on numerous factors, may not be relied on as an indication of trading intent on behalf of any Fidelity fund.
Annual Report
Fidelity Variable Insurance Products: Overseas Portfolio
Investment Summary
Top Five Stocks as of December 31, 2004 |
| % of fund's
net assets |
Vodafone Group PLC (United Kingdom) | 4.4 |
Allianz AG (Reg.) (Germany) | 3.4 |
ASML Holding NV (Netherlands) | 3.2 |
Total SA Series B (France) | 2.7 |
UBS AG (Reg.) (Switzerland) | 2.5 |
| 16.2 |
Top Five Market Sectors as of December 31, 2004 |
| % of fund's
net assets |
Financials | 29.6 |
Information Technology | 18.9 |
Telecommunication Services | 9.5 |
Consumer Discretionary | 8.8 |
Health Care | 7.9 |
Top Five Countries as of December 31, 2004 |
(excluding cash equivalents) | % of fund's
net assets |
Japan | 18.3 |
United Kingdom | 14.6 |
France | 10.2 |
Germany | 10.0 |
Switzerland | 9.2 |
Annual Report
Fidelity Variable Insurance Products: Overseas Portfolio
Investments December 31, 2004
Showing Percentage of Net Assets
Common Stocks - 95.5% |
| Shares | | Value (Note 1) |
Australia - 0.7% |
CSL Ltd. | 698,840 | | $ 15,993,093 |
Belgium - 0.4% |
Fortis | 316,000 | | 8,723,430 |
Brazil - 3.0% |
Aracruz Celulose SA sponsored ADR | 291,400 | | 10,985,780 |
Banco Bradesco SA sponsored ADR (non-vtg.) | 489,000 | | 12,254,340 |
Banco Itau Holding Financeira SA sponsored ADR (non-vtg.) | 133,900 | | 10,065,263 |
Tele Norte Leste Participacoes SA ADR (non-vtg.) | 473,600 | | 7,989,632 |
Uniao de Bancos Brasileiros SA (Unibanco) GDR | 355,000 | | 11,260,600 |
Usinas Siderurgicas de Minas Gerais SA (Usiminas) (PN-A) | 391,900 | | 7,944,238 |
Votorantim Celulose e Papel SA sponsored ADR (non-vtg.) | 637,250 | | 10,323,450 |
TOTAL BRAZIL | | 70,823,303 |
Canada - 2.7% |
Alcan, Inc. | 165,700 | | 8,119,300 |
EnCana Corp. | 289,500 | | 16,501,500 |
Research In Motion Ltd. (a) | 224,600 | | 18,488,323 |
Talisman Energy, Inc. | 691,300 | | 18,636,296 |
Tembec, Inc. (a) | 304,500 | | 1,829,537 |
TOTAL CANADA | | 63,574,956 |
China - 0.6% |
BYD Co. Ltd. (H Shares) | 683,600 | | 1,811,723 |
China Telecom Corp. Ltd. sponsored ADR | 200,280 | | 7,370,304 |
Global Bio-Chem Technology Group Co. Ltd. | 6,618,000 | | 4,342,296 |
Global Bio-Chem Technology Group Co. Ltd. warrants 5/31/07 (a) | 516,250 | | 24,574 |
People's Food Holdings Ltd. | 1,700,000 | | 1,562,404 |
TOTAL CHINA | | 15,111,301 |
Denmark - 0.7% |
Coloplast AS Series B (d) | 54,400 | | 2,981,651 |
Danske Bank AS | 163,300 | | 4,996,457 |
Novo Nordisk AS Series B | 162,100 | | 8,840,313 |
TOTAL DENMARK | | 16,818,421 |
Finland - 1.9% |
Nokia Corp. | 2,829,150 | | 44,332,780 |
France - 10.2% |
Accor SA | 203,282 | | 8,882,300 |
Alcatel SA sponsored ADR (a) | 1,655,300 | | 25,872,339 |
AXA SA | 710,604 | | 17,587,449 |
BNP Paribas SA | 376,602 | | 27,229,874 |
Credit Agricole SA | 113,400 | | 3,415,087 |
Dassault Systemes SA | 113,914 | | 5,733,064 |
France Telecom SA | 472,561 | | 15,632,318 |
L'Oreal SA | 81,395 | | 6,166,755 |
|
| Shares | | Value (Note 1) |
Lagardere S.C.A. (Reg.) | 41,700 | | $ 3,003,768 |
Pernod-Ricard | 95,000 | | 14,523,903 |
Sanofi-Aventis sponsored ADR | 518,200 | | 20,753,910 |
Thomson SA | 240,300 | | 6,340,291 |
Total SA Series B | 287,300 | | 63,114,064 |
Vivendi Universal SA sponsored ADR (a) | 777,500 | | 24,934,425 |
TOTAL FRANCE | | 243,189,547 |
Germany - 10.0% |
Allianz AG (Reg.) | 603,400 | | 80,191,858 |
BASF AG | 298,725 | | 21,514,175 |
Bayerische Hypo-und Vereinsbank AG (a) | 454,900 | | 10,305,480 |
Deutsche Boerse AG | 240,939 | | 14,472,732 |
Deutsche Telekom AG sponsored ADR (a) | 2,104,700 | | 47,734,596 |
E.ON AG | 72,544 | | 6,601,504 |
Infineon Technologies AG sponsored ADR (a) | 893,900 | | 9,743,510 |
RWE AG | 164,060 | | 9,058,013 |
SAP AG sponsored ADR | 304,400 | | 13,457,524 |
Siemens AG sponsored ADR | 289,400 | | 24,503,498 |
TOTAL GERMANY | | 237,582,890 |
Hong Kong - 1.5% |
Esprit Holdings Ltd. | 850,500 | | 5,142,741 |
Hong Kong Exchanges & Clearing Ltd. | 1,952,000 | | 5,223,549 |
Hutchison Whampoa Ltd. | 950,600 | | 8,897,199 |
Techtronic Industries Co. Ltd. | 6,544,000 | | 14,270,379 |
Television Broadcasts Ltd. | 734,000 | | 3,408,990 |
TOTAL HONG KONG | | 36,942,858 |
India - 2.9% |
Cipla Ltd. | 1,160,697 | | 8,528,775 |
Dr. Reddy's Laboratories Ltd. | 151,900 | | 3,039,229 |
HDFC Bank Ltd. | 176,031 | | 2,117,867 |
Housing Development Finance Corp. Ltd. | 1,107,583 | | 19,694,490 |
Infosys Technologies Ltd. | 346,252 | | 16,745,787 |
Reliance Industries Ltd. | 367,900 | | 4,539,843 |
Satyam Computer Services Ltd. | 1,219,887 | | 11,571,298 |
State Bank of India | 179,400 | | 2,933,242 |
TOTAL INDIA | | 69,170,531 |
Italy - 0.9% |
ENI Spa | 880,486 | | 22,160,072 |
Japan - 18.3% |
Advantest Corp. | 221,800 | | 19,033,701 |
Aeon Co. Ltd. | 929,400 | | 15,515,709 |
Canon, Inc. | 221,500 | | 12,018,590 |
Daiwa Securities Group, Inc. | 2,814,000 | | 20,329,591 |
FamilyMart Co. Ltd. | 276,700 | | 8,063,551 |
Honda Motor Co. Ltd. | 260,800 | | 13,592,896 |
Ito Yokado Ltd. | 327,300 | | 13,740,018 |
JAFCO Co. Ltd. | 247,800 | | 16,837,724 |
Mizuho Financial Group, Inc. | 6,790 | | 34,205,214 |
Common Stocks - continued |
| Shares | | Value (Note 1) |
Japan - continued |
Murata Manufacturing Co. Ltd. | 229,700 | | $ 12,849,566 |
Nikko Cordial Corp. | 5,323,000 | | 28,218,189 |
Nitto Denko Corp. | 263,200 | | 14,440,926 |
Nomura Holdings, Inc. | 2,127,000 | | 30,969,121 |
ORIX Corp. | 92,700 | | 12,597,716 |
Ricoh Co. Ltd. | 608,000 | | 11,735,000 |
Rohm Co. Ltd. | 108,600 | | 11,238,505 |
Softbank Corp. (d) | 362,100 | | 17,640,135 |
Sumitomo Electric Industries Ltd. | 852,000 | | 9,274,432 |
Sumitomo Mitsui Financial Group, Inc. (d) | 5,585 | | 40,621,157 |
TDK Corp. | 135,900 | | 10,070,107 |
Tokyo Electron Ltd. | 469,700 | | 28,934,951 |
Toyota Motor Corp. | 875,800 | | 35,850,874 |
UFJ Holdings, Inc. (a) | 1,980 | | 12,004,101 |
Yahoo! Japan Corp. (a) | 1,334 | | 6,407,576 |
TOTAL JAPAN | | 436,189,350 |
Korea (South) - 3.5% |
Honam Petrochemical Corp. | 358,630 | | 16,750,157 |
Hyundai Motor Co. | 66,243 | | 3,551,475 |
Kookmin Bank (a) | 323,810 | | 12,668,379 |
LG Electronics, Inc. | 360,200 | | 22,303,731 |
LG Petrochemical Co. Ltd. | 178,050 | | 4,471,890 |
Samsung Electro-Mechanics Co. Ltd. (a) | 183,200 | | 4,601,237 |
Samsung Electronics Co. Ltd. | 21,660 | | 9,426,035 |
Shinhan Financial Group Co. Ltd. | 414,900 | | 9,378,536 |
TOTAL KOREA (SOUTH) | | 83,151,440 |
Netherlands - 7.1% |
Aegon NV | 1,385,500 | | 18,851,385 |
ASML Holding NV (a)(d) | 4,718,139 | | 75,065,591 |
EADS NV | 355,600 | | 10,318,305 |
ING Groep NV (Certificaten Van Aandelen) | 926,624 | | 28,030,376 |
Unilever NV (NY Shares) | 154,100 | | 10,280,011 |
VNU NV | 547,525 | | 16,139,850 |
Wolters Kluwer NV (Certificaten Van Aandelen) | 514,275 | | 10,304,139 |
TOTAL NETHERLANDS | | 168,989,657 |
Spain - 2.4% |
Banco Bilbao Vizcaya Argentaria SA | 840,600 | | 14,912,242 |
Banco Santander Central Hispano SA | 1,208,868 | | 14,953,697 |
Telefonica SA | 1,446,462 | | 27,241,701 |
TOTAL SPAIN | | 57,107,640 |
Sweden - 0.7% |
Telefonaktiebolaget LM Ericsson ADR (a) | 521,800 | | 16,431,482 |
Switzerland - 9.2% |
ABB Ltd. (Reg.) (a) | 1,551,851 | | 8,648,255 |
Actelion Ltd. (Reg.) (a) | 22,893 | | 2,346,661 |
Compagnie Financiere Richemont unit | 312,115 | | 10,367,768 |
|
| Shares | | Value (Note 1) |
Credit Suisse Group (Reg.) | 1,331,669 | | $ 56,183,115 |
Nestle SA (Reg.) | 32,100 | | 8,381,017 |
Novartis AG (Reg.) | 792,392 | | 40,047,492 |
Phonak Holding AG | 170,412 | | 5,608,364 |
Roche Holding AG (participation certificate) | 227,849 | | 26,035,315 |
Societe Generale de Surveillance Holding SA (SGS) (Reg.) | 4,450 | | 3,110,645 |
UBS AG (Reg.) | 696,987 | | 58,435,390 |
TOTAL SWITZERLAND | | 219,164,022 |
Taiwan - 2.8% |
Acer, Inc. | 2,269,000 | | 3,747,169 |
Hon Hai Precision Industries Co. Ltd. | 2,110,109 | | 9,757,346 |
Quanta Computer, Inc. | 2,972,260 | | 5,329,312 |
Taiwan Semiconductor Manufacturing Co. Ltd. | 5,715,000 | | 9,078,562 |
Taiwan Semiconductor Manufacturing Co. Ltd. sponsored ADR | 727,900 | | 6,179,871 |
United Microelectronics Corp. | 39,939,360 | | 25,755,171 |
United Microelectronics Corp. sponsored ADR | 796,300 | | 2,810,939 |
Yageo Corp. (a) | 9,414,000 | | 3,375,892 |
TOTAL TAIWAN | | 66,034,262 |
United Kingdom - 14.6% |
3i Group PLC | 663,873 | | 8,484,877 |
AstraZeneca PLC (United Kingdom) | 497,100 | | 18,089,469 |
BHP Billiton PLC | 1,008,495 | | 11,815,326 |
BP PLC | 4,252,306 | | 41,389,112 |
British Sky Broadcasting Group PLC (BSkyB) | 631,200 | | 6,807,531 |
Carphone Warehouse Group PLC | 1,559,814 | | 5,141,098 |
Hilton Group PLC | 996,000 | | 5,437,858 |
HSBC Holdings PLC (United Kingdom) (Reg.) | 2,564,190 | | 43,663,027 |
ITV PLC | 4,352,554 | | 8,791,289 |
Kesa Electricals PLC | 1,433,748 | | 7,772,801 |
Man Group PLC | 611,067 | | 17,261,675 |
Prudential PLC | 1,160 | | 10,084 |
Reckitt Benckiser PLC | 331,800 | | 10,022,300 |
Rio Tinto PLC (Reg.) | 782,606 | | 23,323,615 |
Smith & Nephew PLC | 1,796,100 | | 18,593,227 |
Tesco PLC | 1,548,141 | | 9,559,064 |
Vodafone Group PLC | 38,147,725 | | 104,448,467 |
Xstrata PLC | 367,500 | | 6,572,938 |
TOTAL UNITED KINGDOM | | 347,183,758 |
United States of America - 1.4% |
Freeport-McMoRan Copper & Gold, Inc. Class B | 344,900 | | 13,185,527 |
Common Stocks - continued |
| Shares | | Value (Note 1) |
United States of America - continued |
Synthes, Inc. | 77,867 | | $ 8,713,013 |
Telewest Global, Inc. (a) | 724,379 | | 12,734,583 |
TOTAL UNITED STATES OF AMERICA | | 34,633,123 |
TOTAL COMMON STOCKS (Cost $1,721,420,863) | 2,273,307,916 |
Money Market Funds - 5.6% |
| | | |
Fidelity Cash Central Fund, 2.24% (b) | 82,926,736 | | 82,926,736 |
Fidelity Securities Lending Cash Central Fund, 2.23% (b)(c) | 49,646,431 | | 49,646,431 |
TOTAL MONEY MARKET FUNDS (Cost $132,573,167) | 132,573,167 |
TOTAL INVESTMENT PORTFOLIO - 101.1% (Cost $1,853,994,030) | | 2,405,881,083 |
NET OTHER ASSETS - (1.1)% | | (25,904,251) |
NET ASSETS - 100% | $ 2,379,976,832 |
Legend |
(a) Non-income producing |
(b) Affiliated fund that is available only to investment companies and other accounts managed by Fidelity Investments. The rate quoted is the annualized seven-day yield of the fund at period end. A complete listing of the fund's holdings as of its most recent fiscal year end is available upon request. |
(c) Includes investment made with cash collateral received from securities on loan. |
(d) Security or a portion of the security is on loan at period end. |
Income Tax Information |
At December 31, 2004, the fund had a capital loss carryforward of approximately $472,630,000 of which $233,538,000, $191,786,000 and $47,306,000 will expire on December 31, 2009, 2010 and 2011, respectively. |
Annual Report
See accompanying notes which are an integral part of the financial statements.
Fidelity Variable Insurance Products: Overseas Portfolio
Financial Statements
Statement of Assets and Liabilities
December 31, 2004 |
Assets | | |
Investment in securities, at value (including securities loaned of $47,243,590) (cost $1,853,994,030) - See accompanying schedule | | $ 2,405,881,083 |
Foreign currency held at value (cost $22,846,483) | | 23,660,247 |
Receivable for fund shares sold | | 5,794,295 |
Dividends receivable | | 4,143,285 |
Interest receivable | | 136,963 |
Prepaid expenses | | 7,963 |
Other affiliated receivables | | 10,094 |
Other receivables | | 274,898 |
Total assets | | 2,439,908,828 |
Liabilities | | |
Payable for fund shares redeemed | $ 6,629,143 | |
Accrued management fee | 1,397,303 | |
Distribution fees payable | 102,217 | |
Other affiliated payables | 261,313 | |
Other payables and accrued expenses | 1,895,589 | |
Collateral on securities loaned, at value | 49,646,431 | |
Total liabilities | | 59,931,996 |
Net Assets | | $ 2,379,976,832 |
Net Assets consist of: | | |
Paid in capital | | $ 2,300,419,130 |
Undistributed net investment income | | 1,867,057 |
Accumulated undistributed net realized gain (loss) on investments and foreign currency transactions | | (473,792,313) |
Net unrealized appreciation (depreciation) on investments and assets and liabilities in foreign currencies | | 551,482,958 |
Net Assets | | $ 2,379,976,832 |
Calculation of Maximum Offering Price | |
Initial Class:
Net Asset Value, offering price and redemption price per share ($1,491,484,922 ÷ 85,154,763 shares) | $ 17.51 |
Service Class:
Net Asset Value, offering price and redemption price per share ($322,649,186 ÷ 18,498,260 shares) | $ 17.44 |
Service Class 2:
Net Asset Value, offering price and redemption price per share ($319,707,841 ÷ 18,384,916 shares) | $ 17.39 |
Initial Class R:
Net Asset Value, offering price and redemption price per share ($132,063,904 ÷ 7,549,785 shares) | $ 17.49 |
Service Class R:
Net Asset Value, offering price and redemption price per share ($86,509,078 ÷ 4,964,551 shares) | $ 17.43 |
Service Class 2R:
Net Asset Value, offering price and redemption price per share ($27,561,901 ÷ 1,593,209 shares) | $ 17.30 |
Statement of Operations
Year ended December 31, 2004 |
Investment Income | | |
Dividends | | $ 35,350,755 |
Interest | | 2,188,079 |
Security lending | | 1,280,975 |
| | 38,819,809 |
Less foreign taxes withheld | | (4,024,449) |
Total income | | 34,795,360 |
| | |
Expenses | | |
Management fee | $ 15,178,054 | |
Transfer agent fees | 1,432,011 | |
Distribution fees | 930,529 | |
Accounting and security lending fees | 992,201 | |
Non-interested trustees' compensation | 11,307 | |
Appreciation in deferred trustee compensation account | 4,711 | |
Custodian fees and expenses | 736,386 | |
Registration fees | 195 | |
Audit | 67,736 | |
Legal | 5,915 | |
Miscellaneous | 631,165 | |
Total expenses before reductions | 19,990,210 | |
Expense reductions | (914,176) | 19,076,034 |
Net investment income (loss) | | 15,719,326 |
Realized and Unrealized Gain (Loss) Net realized gain (loss) on: | | |
Investment securities (net of foreign taxes of $215,095) | 146,199,544 | |
Foreign currency transactions | (190,461) | |
Total net realized gain (loss) | | 146,009,083 |
Change in net unrealized appreciation (depreciation) on: Investment securities (net of decrease in deferred foreign taxes of $2,494,712) | 113,706,840 | |
Assets and liabilities in foreign currencies | 870,818 | |
Total change in net unrealized appreciation (depreciation) | | 114,577,658 |
Net gain (loss) | | 260,586,741 |
Net increase (decrease) in net assets resulting from operations | | $ 276,306,067 |
See accompanying notes which are an integral part of the financial statements.
Annual Report
Fidelity Variable Insurance Products: Overseas Portfolio
Financial Statements - continued
Statement of Changes in Net Assets
| Year ended
December 31,
2004 | Year ended
December 31,
2003 |
Increase (Decrease) in Net Assets | | |
Operations | | |
Net investment income (loss) | $ 15,719,326 | $ 12,219,607 |
Net realized gain (loss) | 146,009,083 | (23,642,194) |
Change in net unrealized appreciation (depreciation) | 114,577,658 | 580,158,781 |
Net increase (decrease) in net assets resulting from operations | 276,306,067 | 568,736,194 |
Distributions to shareholders from net investment income | (22,557,627) | (11,225,102) |
Share transactions - net increase (decrease) | 199,907,441 | 76,831,320 |
Redemption fees | 51,279 | 30,862 |
Total increase (decrease) in net assets | 453,707,160 | 634,373,274 |
| | |
Net Assets | | |
Beginning of period | 1,926,269,672 | 1,291,896,398 |
End of period (including undistributed net investment income of $1,867,057 and undistributed net investment income of $8,430,134, respectively) | $ 2,379,976,832 | $ 1,926,269,672 |
Other Information: | | | | | | |
Share Transactions | Year ended December 31, 2004 |
Shares | Initial Class | Service Class | Service Class 2 | Initial Class R | Service Class R | Service Class 2R |
Sold | 14,747,796 | 5,622,052 | 11,770,833 | 5,679,220 | 1,860,289 | 1,379,237 |
Reinvested | 1,047,651 | 175,526 | 101,002 | 30,931 | 41,469 | 4,934 |
Redeemed | (22,763,135) | (3,179,061) | (2,573,003) | (695,245) | (555,521) | (249,620) |
Net increase (decrease) | (6,967,688) | 2,618,517 | 9,298,832 | 5,014,906 | 1,346,237 | 1,134,551 |
| | | | | | |
Dollars Sold | $ 235,040,834 | $ 88,487,632 | $ 185,307,863 | $ 89,613,678 | $ 29,201,895 | $ 21,125,719 |
Reinvested | 16,877,656 | 2,818,947 | 1,619,063 | 497,678 | 665,579 | 78,704 |
Redeemed | (358,049,999) | (49,596,873) | (40,549,211) | (10,848,287) | (8,516,411) | (3,867,026) |
Net increase (decrease) | $ (106,131,509) | $ 41,709,706 | $ 146,377,715 | $ 79,263,069 | $ 21,351,063 | $ 17,337,397 |
| | | | | | |
Share Transactions | Year ended December 31, 2003 |
Shares | Initial Class | Service Class | Service Class 2 | Initial Class R | Service Class R | Service Class 2R |
Sold | 135,754,582 | 34,982,458 | 57,905,822 | 1,401,445 | 2,096,259 | 337,680 |
Reinvested | 891,621 | 140,448 | 26,238 | 15,499 | 17,531 | 2,278 |
Redeemed | (138,456,054) | (35,447,830) | (53,234,293) | (307,443) | (140,438) | (29,586) |
Net increase (decrease) | (1,809,851) | (324,924) | 4,697,767 | 1,109,501 | 1,973,352 | 310,372 |
| | | | | | |
Dollars Sold | $ 1,613,667,675 | $ 391,087,076 | $ 672,794,854 | $ 17,351,785 | $ 25,897,371 | $ 3,723,543 |
Reinvested | 9,156,952 | 1,438,187 | 268,410 | 159,020 | 179,341 | 23,192 |
Redeemed | (1,637,501,847) | (397,130,238) | (618,521,317) | (3,679,685) | (1,677,969) | (405,030) |
Net increase (decrease) | $ (14,677,220) | $ (4,604,975) | $ 54,541,947 | $ 13,831,120 | $ 24,398,743 | $ 3,341,705 |
| | | | | | |
Distributions | Year ended December 31, 2004 |
| Initial Class | Service Class | Service Class 2 | Initial Class R | Service Class R | Service Class 2R |
From net investment income | $ 16,877,656 | $ 2,818,947 | $ 1,619,063 | $ 497,678 | $ 665,579 | $ 78,704 |
| | | | | | |
| Year ended December 31, 2003 |
| Initial Class | Service Class | Service Class 2 | Initial Class R | Service Class R | Service Class 2R |
From net investment income | $ 9,156,952 | $ 1,438,187 | $ 268,410 | $ 159,020 | $ 179,341 | $ 23,192 |
See accompanying notes which are an integral part of the financial statements.
Overseas Portfolio
Financial Highlights - Initial Class
Years ended December 31, | 2004 | 2003 | 2002 | 2001 | 2000 |
Selected Per-Share Data | | | | | |
Net asset value, beginning of period | $ 15.59 | $ 10.98 | $ 13.88 | $ 20.00 | $ 27.44 |
Income from Investment Operations | | | | | |
Net investment income (loss) C | .13 | .11 | .10 | .14 | .19 D |
Net realized and unrealized gain (loss) | 1.97 | 4.60 | (2.90) | (3.86) | (4.93) |
Total from investment operations | 2.10 | 4.71 | (2.80) | (3.72) | (4.74) |
Distributions from net investment income | (.18) | (.10) | (.10) | (.93) | (.31) |
Distributions in excess of net investment income | - | - | - | - | (.06) |
Distributions from net realized gain | - | - | - | (1.47) | (2.33) |
Total distributions | (.18) | (.10) | (.10) | (2.40) | (2.70) |
Redemption fees added to paid in capital C | - F | - F | - F | - | - |
Net asset value, end of period | $ 17.51 | $ 15.59 | $ 10.98 | $ 13.88 | $ 20.00 |
Total Return A, B | 13.57% | 43.37% | (20.28)% | (21.21)% | (19.07)% |
Ratios to Average Net Assets E | | | | | |
Expenses before expense reductions | .91% | .90% | .90% | .92% | .89% |
Expenses net of voluntary waivers, if any | .91% | .90% | .90% | .92% | .89% |
Expenses net of all reductions | .87% | .86% | .86% | .87% | .87% |
Net investment income (loss) | .80% | .87% | .79% | .91% | .84% |
Supplemental Data | | | | | |
Net assets, end of period (000 omitted) | $ 1,491,485 | $ 1,436,137 | $ 1,031,489 | $ 1,496,873 | $ 2,267,507 |
Portfolio turnover rate | 84% | 99% | 77% | 98% | 136% |
A Total returns do not reflect charges attributable to your insurance company's separate account. Inclusion of these charges would reduce the total returns shown.
B Total returns would have been lower had certain expenses not been reduced during the periods shown.
C Calculated based on average shares outstanding during the period.
D Investment income per share reflects a special dividend which amounted to $.04 per share.
E Expense ratios reflect operating expenses of the class. Expenses before reductions do not reflect amounts reimbursed by the investment adviser or reductions from brokerage service arrangements or other expense offset arrangements and do not represent the amount paid by the class during periods when reimbursements or reductions occur. Expenses net of any voluntary waivers reflect expenses after reimbursement by the investment adviser but prior to reductions from brokerage service arrangements or other expense offset arrangements. Expenses net of all reductions represent the net expenses paid by the class.
F Amount represents less than $.01 per share.
Financial Highlights - Service Class
Years ended December 31, | 2004 | 2003 | 2002 | 2001 | 2000 |
Selected Per-Share Data | | | | | |
Net asset value, beginning of period | $ 15.53 | $ 10.94 | $ 13.83 | $ 19.94 | $ 27.39 |
Income from Investment Operations | | | | | |
Net investment income (loss) C | .11 | .09 | .09 | .12 | .17 D |
Net realized and unrealized gain (loss) | 1.97 | 4.59 | (2.89) | (3.84) | (4.93) |
Total from investment operations | 2.08 | 4.68 | (2.80) | (3.72) | (4.76) |
Distributions from net investment income | (.17) | (.09) | (.09) | (.92) | (.30) |
Distributions in excess of net investment income | - | - | - | - | (.06) |
Distributions from net realized gain | - | - | - | (1.47) | (2.33) |
Total distributions | (.17) | (.09) | (.09) | (2.39) | (2.69) |
Redemption fees added to paid in capital C | - F | - F | - F | - | - |
Net asset value, end of period | $ 17.44 | $ 15.53 | $ 10.94 | $ 13.83 | $ 19.94 |
Total Return A, B | 13.49% | 43.20% | (20.34)% | (21.27)% | (19.18)% |
Ratios to Average Net Assets E | | | | | |
Expenses before expense reductions | 1.01% | 1.00% | 1.00% | 1.03% | .99% |
Expenses net of voluntary waivers, if any | 1.01% | 1.00% | 1.00% | 1.03% | .99% |
Expenses net of all reductions | .97% | .96% | .96% | .97% | .97% |
Net investment income (loss) | .69% | .77% | .69% | .81% | .74% |
Supplemental Data | | | | | |
Net assets, end of period (000 omitted) | $ 322,649 | $ 246,632 | $ 177,322 | $ 240,525 | $ 257,257 |
Portfolio turnover rate | 84% | 99% | 77% | 98% | 136% |
A Total returns do not reflect charges attributable to your insurance company's separate account. Inclusion of these charges would reduce the total returns shown.
B Total returns would have been lower had certain expenses not been reduced during the periods shown.
C Calculated based on average shares outstanding during the period.
D Investment income per share reflects a special dividend which amounted to $.04 per share.
E Expense ratios reflect operating expenses of the class. Expenses before reductions do not reflect amounts reimbursed by the investment adviser or reductions from brokerage service arrangements or other expense offset arrangements and do not represent the amount paid by the class during periods when reimbursements or reductions occur. Expenses net of any voluntary waivers reflect expenses after reimbursement by the investment adviser but prior to reductions from brokerage service arrangements or other expense offset arrangements. Expenses net of all reductions represent the net expenses paid by the class.
F Amount represents less than $.01 per share.
See accompanying notes which are an integral part of the financial statements.
Annual Report
Financial Highlights - Service Class 2
Years ended December 31, | 2004 | 2003 | 2002 | 2001 | 2000 G |
Selected Per-Share Data | | | | | |
Net asset value, beginning of period | $ 15.50 | $ 10.90 | $ 13.81 | $ 19.91 | $ 26.16 |
Income from Investment Operations | | | | | |
Net investment income (loss) E | .08 | .08 | .07 | .10 | .12 F |
Net realized and unrealized gain (loss) | 1.97 | 4.58 | (2.88) | (3.80) | (3.68) |
Total from investment operations | 2.05 | 4.66 | (2.81) | (3.70) | (3.56) |
Distributions from net investment income | (.16) | (.06) | (.10) | (.93) | (.30) |
Distributions in excess of net investment income | - | - | - | - | (.06) |
Distributions from net realized gain | - | - | - | (1.47) | (2.33) |
Total distributions | (.16) | (.06) | (.10) | (2.40) | (2.69) |
Redemption fees added to paid in capital E | - I | - I | - I | (1.47) | (2.33) |
Net asset value, end of period | $ 17.39 | $ 15.50 | $ 10.90 | $ 13.81 | $ 19.91 |
Total Return B, C, D | 13.31% | 43.04% | (20.46)% | (21.20)% | (15.50)% |
Ratios to Average Net Assets H | | | | | |
Expenses before expense reductions | 1.16% | 1.16% | 1.16% | 1.18% | 1.15% A |
Expenses net of voluntary waivers, if any | 1.16% | 1.16% | 1.16% | 1.18% | 1.15% A |
Expenses net of all reductions | 1.12% | 1.12% | 1.12% | 1.12% | 1.13% A |
Net investment income (loss) | .54% | .61% | .53% | .65% | .58% A |
Supplemental Data | | | | | |
Net assets, end of period (000 omitted) | $ 319,708 | $ 140,822 | $ 47,824 | $ 48,843 | $ 12,351 |
Portfolio turnover rate | 84% | 99% | 77% | 98% | 136% |
A Annualized
B Total returns for periods of less than one year are not annualized.
C Total returns do not reflect charges attributable to your insurance company's separate account. Inclusion of these charges would reduce the total returns shown.
D Total returns would have been lower had certain expenses not been reduced during the periods shown.
E Calculated based on average shares outstanding during the period.
F Investment income per share reflects a special dividend which amounted to $.04 per share.
G For the period January 12, 2000 (commencement of sale of shares) to December 31, 2000.
H Expense ratios reflect operating expenses of the class. Expenses before reductions do not reflect amounts reimbursed by the investment adviser or reductions from brokerage service arrangements or other expense offset arrangements and do not represent the amount paid by the class during periods when reimbursements or reductions occur. Expense ratios before reductions for start-up periods may not be representative of longer-term operating periods. Expenses net of any voluntary waivers reflect expenses after reimbursement by the investment adviser but prior to reductions from brokerage service arrangements or other expense offset arrangements. Expenses net of all reductions represent the net expenses paid by the class.
I Amount represents less than $.01 per share.
Financial Highlights - Initial Class R
Years ended December 31, | 2004 | 2003 | 2002 F |
Selected Per-Share Data | | | |
Net asset value, beginning of period | $ 15.57 | $ 10.98 | $ 14.05 |
Income from Investment Operations | | | |
Net investment income (loss) E | .12 | .11 | .06 |
Net realized and unrealized gain (loss) | 1.98 | 4.59 | (3.13) |
Total from investment operations | 2.10 | 4.70 | (3.07) |
Distributions from net investment income | (.18) | (.11) | - |
Redemption fees added to paid in capital E, H | - | - | - |
Net asset value, end of period | $ 17.49 | $ 15.57 | $ 10.98 |
Total Return B, C, D | 13.59% | 43.32% | (21.85)% |
Ratios to Average Net Assets G | | | |
Expenses before expense reductions | .91% | .90% | .91% A |
Expenses net of voluntary waivers, if any | .91% | .90% | .91% A |
Expenses net of all reductions | .87% | .86% | .87% A |
Net investment income (loss) | .79% | .87% | .79% A |
Supplemental Data | | | |
Net assets, end of period (000 omitted) | $ 132,064 | $ 39,466 | $ 15,649 |
Portfolio turnover rate | 84% | 99% | 77% |
A Annualized
B Total returns for periods of less than one year are not annualized.
C Total returns do not reflect charges attributable to your insurance company's separate account. Inclusion of these charges would reduce the total returns shown.
D Total returns would have been lower had certain expenses not been reduced during the periods shown.
E Calculated based on average shares outstanding during the period.
F For the period April 24, 2002 (commencement of sale of shares) to December 31, 2002.
G Expense ratios reflect operating expenses of the class. Expenses before reductions do not reflect amounts reimbursed by the investment adviser or reductions from brokerage service arrangements or other expense offset arrangements and do not represent the amount paid by the class during periods when reimbursements or reductions occur. Expense ratios before reductions for start-up periods may not be representative of longer-term operating periods. Expenses net of any voluntary waivers reflect expenses after reimbursement by the investment adviser but prior to reductions from brokerage service arrangements or other expense offset arrangements. Expenses net of all reductions represent the net expenses paid by the class.
H Amount represents less than $.01 per share.
See accompanying notes which are an integral part of the financial statements.
Overseas Portfolio
Financial Highlights - Service Class R
Years ended December 31, | 2004 | 2003 | 2002 F |
Selected Per-Share Data | | | |
Net asset value, beginning of period | $ 15.52 | $ 10.94 | $ 14.01 |
Income from Investment Operations | | | |
Net investment income (loss) E | .11 | .10 | .05 |
Net realized and unrealized gain (loss) | 1.97 | 4.58 | (3.12) |
Total from investment operations | 2.08 | 4.68 | (3.07) |
Distributions from net investment income | (.17) | (.10) | - |
Redemption fees added to paid in capital E, H | - | - | - |
Net asset value, end of period | $ 17.43 | $ 15.52 | $ 10.94 |
Total Return B, C, D | 13.50% | 43.25% | (21.91)% |
Ratios to Average Net Assets G | | | |
Expenses before expense reductions | 1.01% | 1.00% | 1.01% A |
Expenses net of voluntary waivers, if any | 1.01% | 1.00% | 1.01% A |
Expenses net of all reductions | .96% | .96% | .97% A |
Net investment income (loss) | .70% | .77% | .69% A |
Supplemental Data | | | |
Net assets, end of period (000 omitted) | $ 86,509 | $ 56,141 | $ 17,997 |
Portfolio turnover rate | 84% | 99% | 77% |
A Annualized
B Total returns for periods of less than one year are not annualized.
C Total returns do not reflect charges attributable to your insurance company's separate account. Inclusion of these charges would reduce the total returns shown.
D Total returns would have been lower had certain expenses not been reduced during the periods shown.
E Calculated based on average shares outstanding during the period.
F For the period April 24, 2002 (commencement of sale of shares) to December 31, 2002.
G Expense ratios reflect operating expenses of the class. Expenses before reductions do not reflect amounts reimbursed by the investment adviser or reductions from brokerage service arrangements or other expense offset arrangements and do not represent the amount paid by the class during periods when reimbursements or reductions occur. Expense ratios before reductions for start-up periods may not be representative of longer-term operating periods. Expenses net of any voluntary waivers reflect expenses after reimbursement by the investment adviser but prior to reductions from brokerage service arrangements or other expense offset arrangements. Expenses net of all reductions represent the net expenses paid by the class.
H Amount represents less than $.01 per share.
Financial Highlights - Service Class 2R
Years ended December 31, | 2004 | 2003 | 2002 F |
Selected Per-Share Data | | | |
Net asset value, beginning of period | $ 15.42 | $ 10.90 | $ 13.96 |
Income from Investment Operations | | | |
Net investment income (loss) E | .08 | .08 | .04 |
Net realized and unrealized gain (loss) | 1.96 | 4.55 | (3.10) |
Total from investment operations | 2.04 | 4.63 | (3.06) |
Distributions from net investment income | (.16) | (.11) | - |
Redemption fees added to paid in capital E, H | - | - | - |
Net asset value, end of period | $ 17.30 | $ 15.42 | $ 10.90 |
Total Return B, C, D | 13.32% | 43.00% | (21.92)% |
Ratios to Average Net Assets G | | | |
Expenses before expense reductions | 1.16% | 1.15% | 1.17% A |
Expenses net of voluntary waivers, if any | 1.16% | 1.15% | 1.17% A |
Expenses net of all reductions | 1.11% | 1.11% | 1.14% A |
Net investment income (loss) | .55% | .62% | .52% A |
Supplemental Data | | | |
Net assets, end of period (000 omitted) | $ 27,562 | $ 7,072 | $ 1,616 |
Portfolio turnover rate | 84% | 99% | 77% |
A Annualized
B Total returns for periods of less than one year are not annualized.
C Total returns do not reflect charges attributable to your insurance company's separate account. Inclusion of these charges would reduce the total returns shown.
D Total returns would have been lower had certain expenses not been reduced during the periods shown.
E Calculated based on average shares outstanding during the period.
F For the period April 24, 2002 (commencement of sale of shares) to December 31, 2002.
G Expense ratios reflect operating expenses of the class. Expenses before reductions do not reflect amounts reimbursed by the investment adviser or reductions from brokerage service arrangements or other expense offset arrangements and do not represent the amount paid by the class during periods when reimbursements or reductions occur. Expense ratios before reductions for start-up periods may not be representative of longer-term operating periods. Expenses net of any voluntary waivers reflect expenses after reimbursement by the investment adviser but prior to reductions from brokerage service arrangements or other expense offset arrangements. Expenses net of all reductions represent the net expenses paid by the class.
H Amount represents less than $.01 per share.
See accompanying notes which are an integral part of the financial statements.
Annual Report
Notes to Financial Statements
For the period ended December 31, 2004
1. Significant Accounting Policies.
Equity-Income Portfolio, Growth Portfolio, High Income Portfolio, and Overseas Portfolio (the funds) are funds of Variable Insurance Products Fund. Asset Manager Portfolio, Contrafund Portfolio and Index 500 Portfolio (the funds) are funds of Variable Insurance Products Fund II. The Variable Insurance Products Fund and Variable Insurance Products Fund II (the trusts) (referred to in this report as Fidelity Variable Insurance Products) are registered under the Investment Company Act of 1940, as amended (the 1940 Act), as open-end management investment companies organized as Massachusetts business trusts. Certain funds may invest in affiliated fixed income and money market central funds (underlying funds) managed by affiliates of Fidelity Management & Research Company (FMR). Each fund is authorized to issue an unlimited number of shares. Shares of each fund may only be purchased by insurance companies for the purpose of funding variable annuity or variable life insurance contracts. Each fund offers the following classes of shares: Initial Class shares, Service Class shares and Service Class 2 shares. VIP Equity-Income, VIP Growth and VIP Contrafund Portfolios also offer Service Class 2R shares. VIP Overseas and VIP High Income Portfolios also offer Initial Class R, Service Class R, and Service Class 2R shares. All classes have equal rights and voting privileges, except for matters affecting a single class. Investment income, realized and unrealized capital gains and losses, the common expenses of the fund, and certain fund-level expense reductions, if any, are allocated on a pro rata basis to each class based on the relative net assets of each class to the total net assets of the fund. Each class differs with respect to distribution and service plan fees incurred. Certain expense reductions also differ by class.
Certain funds' investments in emerging markets can be subject to social, economic, regulatory, and political uncertainties and can be extremely volatile. The financial statements have been prepared in conformity with accounting principles generally accepted in the United States of America, which require management to make certain estimates and assumptions at the date of the financial statements. The following summarizes the significant accounting policies of the funds and underlying funds (funds):
Security Valuation. Net asset value per share (NAV calculation) is calculated as of the close of business of the New York Stock Exchange, normally 4:00 p.m. Eastern time. Equity securities, including restricted securities, for which market quotations are available are valued at the last sale price or official closing price (closing bid price or last evaluated quote if no sale has occurred) on the primary market or exchange on which they trade. Debt securities, including restricted securities, for which quotations are readily available are valued at their most recent bid prices (sales prices if the principal market is an exchange) in the principal market in which such securities are normally traded, as determined by recognized dealers in such securities, or securities are valued on the basis of information provided by a pricing service. Pricing services use valuation matrices that incorporate both dealer-supplied valuations and valuation models. If prices are not readily available or do not accurately reflect fair value for a security, or if a security's value has been materially affected by events occurring after the close of the exchange or market on which the security is principally traded, that security may be valued by another method that the Board of Trustees believes accurately reflects fair value. A security's valuation may differ depending on the method used for determining value. Price movements in futures contracts and ADRs, market and trading trends, the bid/ask quotes of brokers and off-exchange institutional trading may be reviewed in the course of making a good faith determination of a security's fair value. Short-term securities with remaining maturities of sixty days or less for which quotations are not readily available are valued on the basis of amortized cost. Investments in open-end investment companies, including underlying funds, are valued at their net asset value each business day.
Foreign Currency. Certain funds may use foreign currency contracts to facilitate transactions in foreign-denominated securities. Losses from these transactions may arise from changes in the value of the foreign currency or if the counterparties do not perform under the contracts' terms.
Foreign-denominated assets, including investment securities, and liabilities are translated into U.S. dollars at the exchange rate at period end. Purchases and sales of investment securities, income and dividends received and expenses denominated in foreign currencies are translated into U.S. dollars at the exchange rate in effect on the transaction date.
The effects of exchange rate fluctuations on investments are included with the net realized and unrealized gain (loss) on investment securities. Other foreign currency transactions resulting in realized and unrealized gain (loss) are disclosed separately.
Investment Transactions and Income. Security transactions, including purchases and sales of the underlying funds, are accounted for as of trade date. Gains and losses on securities sold are determined on the basis of identified cost and may include proceeds received from litigation. Dividend income is recorded on the ex-dividend date, except for certain dividends from foreign securities where the ex-dividend date may have passed, which are recorded as soon as the funds are informed of the ex-dividend date. Non-cash dividends included in dividend income, if any, are recorded at the fair market value of the securities received. Distributions received on securities that represent a return of capital or capital gain are recorded as a reduction of cost of investments and/or as a realized gain. The funds estimate the components of distributions received that may be considered return of capital distributions or capital gain distributions. Large, non-recurring dividends recognized by the funds are presented separately on the Statement of Operations as "Special Dividends" and the impact of these dividends to net investment income per share is presented in the Financial Highlights. Interest income is accrued as earned. Interest income includes coupon interest and amortization of premium and accretion of discount on debt securities. Inflation-indexed bonds are fixed-income securities whose principal value is periodically adjusted according to the rate of inflation. Interest is accrued based on the principal value which is adjusted for inflation. Any increase in principal amount of an inflation-indexed bond is recorded as interest income, even though the principal is not received until maturity. Investment income is recorded net of foreign taxes withheld where recovery of such taxes is uncertain. Debt obligations may be placed on non-accrual status and related interest income may be reduced by ceasing current
Annual Report
Notes to Financial Statements - continued
1. Significant Accounting Policies - continued
Investment Transactions and Income - continued
accruals and writing off interest receivables when the collection of all or a portion of interest has become doubtful based on consistently applied procedures. A debt obligation is removed from non-accrual status when the issuer resumes interest payments or when collectibility of interest is reasonably assured.
Expenses. Most expenses of each trust can be directly attributed to a fund. Expenses which cannot be directly attributed are apportioned among each fund in the trust.
Deferred Trustee Compensation. Under a Deferred Compensation Plan (the Plan) non-interested Trustees must defer receipt of a portion of, and may elect to defer receipt of an additional portion of, their annual compensation. Deferred amounts are treated as though equivalent dollar amounts had been invested in a cross-section of other Fidelity funds, and are marked-to-market. Deferred amounts remain in the fund until distributed in accordance with the Plan.
Income Tax Information and Distributions to Shareholders. Each year, each fund intends to qualify as a regulated investment company by distributing all of its taxable income and realized gains under Subchapter M of the Internal Revenue Code. As a result, no provision for income taxes is required in the accompanying financial statements. Foreign taxes are provided for based on each fund's understanding of the tax rules and rates that exist in the foreign markets in which it invests.
Distributions are recorded on the ex-dividend date. Income dividends and capital gain distributions are declared separately for each class. Income and capital gain distributions are determined in accordance with income tax regulations, which may differ from generally accepted accounting principles.
Capital accounts within the financial statements are adjusted for permanent book-tax differences. These adjustments have no impact on net assets or the results of operations. Temporary book-tax differences will reverse in a subsequent period.
Book-tax differences are primarily due to futures transactions, swap agreements, foreign currency transactions, passive foreign investment companies (PFIC), prior period premium and discount on debt securities, defaulted bonds, market discount, partnerships, financing transactions, capital loss carryforwards, redemptions in kind and losses deferred due to wash sales.
The tax-basis components of distributable earnings and the federal tax cost as of period end were as follows for each fund:
| Cost for Federal
Income Tax Purposes | Unrealized
Appreciation | Unrealized
Depreciation | Net Unrealized
Appreciation/
(Depreciation) |
Asset Manager | $ 2,610,089,503 | $ 290,106,762 | $ (77,508,553) | $ 212,598,209 |
Contrafund | 9,426,485,756 | 3,811,010,524 | (61,655,951) | 3,749,354,573 |
Equity-Income | 8,626,903,027 | 3,162,571,582 | (487,146,159) | 2,675,425,423 |
Growth | 7,836,788,157 | 2,326,119,909 | (227,367,706) | 2,098,752,203 |
High Income | 1,741,532,055 | 106,238,193 | (8,602,341) | 97,635,852 |
Index 500 | 1,862,485,874 | 1,254,815,950 | (206,580,316) | 1,048,235,634 |
Overseas | 1,880,129,646 | 559,624,822 | (33,873,385) | 525,751,437 |
| Undistributed
Ordinary Income | Undistributed
Long-term
Capital Gain | Capital Loss
Carryforward |
Asset Manager | $ 72,216,287 | $ - | $ (169,227,601) |
Contrafund | 35,699,521 | - | (704,454,440) |
Equity-Income | 222,671,664 | 346,486,395 | - |
Growth | 42,590,026 | - | (3,653,617,452) |
High Income | 132,732,705 | - | (1,144,183,642) |
Index 500 | 49,722,398 | - | (193,155,855) |
Overseas | 26,476,944 | - | (472,629,652) |
The tax character of distributions paid was as follows:
December 31, 2004 | Ordinary Income | Long-term
Capital Gains | Total |
Asset Manager | $ 81,683,788 | $ - | $ 81,683,788 |
Contrafund | 33,283,266 | - | 33,283,266 |
Equity-Income | 160,632,605 | 38,902,738 | 199,535,343 |
Growth | 25,185,765 | - | 25,185,765 |
High Income | 155,517,698 | - | 155,517,698 |
Index 500 | 40,638,037 | - | 40,638,037 |
Overseas | 22,557,627 | - | 22,557,627 |
Annual Report
1. Significant Accounting Policies - continued
Income Tax Information and Distributions to Shareholders
The tax character of distributions paid was as follows - continued
December 31, 2003 | Ordinary Income | Long-term
Capital Gains | Total |
Asset Manager | $ 104,597,799 | $ - | $ 104,597,799 |
Contrafund | 35,507,037 | - | 35,507,037 |
Equity-Income | 152,426,442 | - | 152,426,442 |
Growth | 23,104,405 | - | 23,104,405 |
High Income | 110,937,981 | - | 110,937,981 |
Index 500 | 39,819,617 | - | 39,819,617 |
Overseas | 11,225,102 | - | 11,225,102 |
Trading (Redemption) Fees. Initial Class R shares, Service Class R shares and Service Class 2R shares held less than 60 days are subject to a redemption fee equal to 1% of the proceeds of the redeemed shares. All redemption fees, including any estimated redemption fees paid by FMR, are retained by the applicable fund and accounted for as an addition to paid in capital.
2. Operating Policies.
Repurchase Agreements. FMR has received an Exemptive Order from the Securities and Exchange Commission (the SEC) which permits the funds and other affiliated entities of FMR to transfer uninvested cash balances into joint trading accounts. These accounts are then invested in repurchase agreements that are collateralized by U.S. Treasury or Government obligations. Certain funds may also invest directly with institutions, in repurchase agreements that are collateralized by commercial paper obligations and corporate obligations. Collateral is held in segregated accounts with custodian banks and may be obtained in the event of a default of the counterparty. Collateral is marked-to-market daily and maintained at a value at least equal to the principal amount of the repurchase agreement (including accrued interest).
Delayed Delivery Transactions and When-Issued Securities. Each fund may purchase or sell securities on a delayed delivery or when-issued basis. Payment and delivery may take place after the customary settlement period for that security. The price of the underlying securities and the date when the securities will be delivered and paid for are fixed at the time the transaction is negotiated. During the time a delayed delivery sell is outstanding, the contract is marked-to-market daily and equivalent deliverable securities are held for the transaction. The value of the securities purchased on a delayed delivery or when-issued basis are identified as such in each applicable fund's Schedule of Investments. Each fund may receive compensation for interest forgone in the purchase of a delayed delivery or when-issued security. With respect to purchase commitments, each fund identifies securities as segregated in its records with a value at least equal to the amount of the commitment. Losses may arise due to changes in the value of the underlying securities or if the counterparty does not perform under the contract's terms, or if the issuer does not issue the securities due to political, economic, or other factors.
Futures Contracts. Certain funds may use futures contracts to manage their exposure to the stock market. Buying futures tends to increase a fund's exposure to the underlying instrument, while selling futures tends to decrease a fund's exposure to the underlying instrument or hedge other fund investments. Futures contracts involve, to varying degrees, risk of loss in excess of any futures variation margin reflected in each applicable fund's Statement of Assets and Liabilities. The underlying face amount at value of any open futures contracts at period end is shown in each applicable fund's Schedule of Investments under the caption "Futures Contracts." This amount reflects each contract's exposure to the underlying instrument at period end. Losses may arise from changes in the value of the underlying instruments or if the counterparties do not perform under the contracts' terms. Gains (losses) are realized upon the expiration or closing of the futures contracts. Futures contracts are valued at the settlement price established each day by the board of trade or exchange on which they are traded.
Restricted Securities. Certain funds may invest in securities that are subject to legal or contractual restrictions on resale. These securities generally may be resold in transactions exempt from registration or to the public if the securities are registered. Disposal of these securities may involve time-consuming negotiations and expense, and prompt sale at an acceptable price may be difficult. Information regarding restricted securities is included at the end of each applicable fund's Schedule of Investments.
Loans and Other Direct Debt Instruments. Certain funds may invest in loans and loan participations, trade claims or other receivables. These investments may include standby financing commitments, including revolving credit facilities, that obligate the fund to supply additional cash to the borrower on demand. Loan participations involve a risk of insolvency of the lending bank or other financial intermediary. A fund may be contractually obligated to receive approval from the agent bank and/or borrower prior to the sale of these investments.
Annual Report
Notes to Financial Statements - continued
2. Operating Policies - continued
Swap Agreements. Certain funds may invest in swaps for the purpose of managing their exposure to interest rate, credit or market risk.
Interest rate swaps are agreements to exchange cash flows periodically based on a notional principal amount, for example, the exchange of fixed rate interest payments for floating rate interest payments. Periodic payments received or made by each applicable fund are recorded in the accompanying Statement of Operations as realized gains or losses, respectively. The primary risk associated with interest rate swaps is that unfavorable changes in the fluctuation of interest rates could adversely impact each fund.
Total return swaps are agreements to exchange the return generated by one instrument for the return generated by another instrument, for example, the agreement to pay interest in exchange for a market-linked return based on a notional amount. To the extent the total return of the index exceeds the offsetting interest obligation, each fund will receive a payment from the counterparty. To the extent it is less, each fund will make a payment to the counterparty. Periodic payments received or made by each applicable fund are recorded in the accompanying Statement of Operations as realized gains or losses, respectively.
Credit default swaps involve the exchange of a fixed rate premium for protection against the loss in value of an underlying debt instrument in the event of a defined credit event (such as payment default or bankruptcy). Under the terms of the swap, one party acts as a "guarantor" receiving a periodic payment that is a fixed percentage applied to a notional principal amount. In return the party agrees to purchase the notional amount of the underlying instrument, at par, if a credit event occurs during the term of the swap. Each applicable fund may enter into credit default swaps in which the fund or its counterparty act as guarantors. By acting as the guarantor of a swap, the fund assumes the market and credit risk of the underlying instrument including liquidity and loss of value. Periodic payments and premiums received or made by each applicable fund are recorded in the accompanying Statement of Operations as realized gains or losses, respectively.
Swaps are marked-to-market daily based on dealer-supplied valuations and changes in value are recorded as unrealized appreciation (depreciation). Gains or losses are realized upon early termination of the swap agreements. Collateral, in the form of cash or securities, may be required to be held in segregated accounts with each applicable fund's custodian in compliance with swap contracts. Risks may exceed amounts recognized on the Statement of Assets and Liabilities. These risks include changes in the fluctuation of interest rates or in the returns of the underlying instruments, failure of the counterparties to perform under the contracts' terms and the possible lack of liquidity with respect to the swap agreements. Details of swap agreements open at period end are included in each applicable fund's Schedule of Investments under the caption "Swap Agreements."
Mortgage Dollar Rolls. To earn additional income, certain funds may employ trading strategies which involve the sale and simultaneous agreement to repurchase similar securities ("mortgage dollar rolls") or the purchase and simultaneous agreement to sell similar securities ("reverse mortgage dollar rolls"). The securities traded are mortgage securities and bear the same interest rate but may be collateralized by different pools of mortgages. During the period between the sale and repurchase in a mortgage dollar roll transaction, a fund will not be entitled to receive interest and principal payments on the securities sold but will invest the proceeds of the sale in other securities which may enhance the yield and total return. In addition, the difference between the sale price and the future purchase price is recorded as an adjustment to investment income. During the period between the purchase and subsequent sale in a reverse mortgage dollar roll transaction a fund is entitled to interest and principal payments on the securities purchased. The price differential between the purchase and sale is recorded as an adjustment to investment income. Losses may arise due to changes in the value of the securities or if the counterparty does not perform under the terms of the agreement. If the counterparty files for bankruptcy or becomes insolvent, the fund's right to repurchase or sell securities may be limited.
3. Purchases and Sales of Investments.
Purchases and sales of securities, other than short-term securities and U.S. government securities, and in-kind transactions are noted in the table below.
| Purchases ($) | Sales ($) |
Asset Manager | 912,923,198 | 1,213,573,123 |
Contrafund | 6,654,101,485 | 6,593,244,973 |
Equity-Income | 2,315,881,327 | 2,277,968,277 |
Growth | 7,269,389,954 | 8,239,247,322 |
High Income | 2,223,362,294 | 2,482,350,638 |
Index 500 | 138,484,269 | 229,850,179 |
Overseas | 1,798,890,461 | 1,655,883,993 |
For Index 500 Portfolio, securities delivered on an in-kind basis aggregated $353,017,055. Realized gain (loss) of $31,110,779 on securities delivered on an in-kind basis is included in the accompanying Statement of Operations as realized gain or loss on investment securities and is not taxable to the fund.
Annual Report
4. Fees and Other Transactions with Affiliates.
Management Fee. FMR and its affiliates provide the funds with investment management related services for which the funds pay a monthly management fee.
For all funds except the Index 500 Portfolio, the management fee is the sum of an individual fund fee rate applied to the average net assets of each fund and a group fee rate. The group fee rates differ for equity and fixed-income funds and are each based upon the average net assets of all the mutual funds advised by FMR. The group fee rates decrease as assets under management increase and increase as assets under management decrease. The annual individual fund fee rate is .45% of the fund's average net assets for High Income and Overseas Portfolios, .30% for Contrafund and Growth Portfolios, .25% for Asset Manager Portfolio, and .20% for Equity-Income Portfolio. The group fee rates averaged .28% for the equity funds and .13% for the fixed-income funds during the period.
For Index 500 Portfolio, FMR receives a fee that is computed at an annual rate of .24% of the fund's average net assets.
For the period each fund's total annual management fee rate, expressed as a percentage of each fund's average net assets, was as follows:
Asset Manager | .53% | |
Contrafund | .57% | |
Equity-Income | .47% | |
Growth | .58% | |
High Income | .58% | |
Index 500 | .24% | |
Overseas | .72% | |
Sub-Adviser. Geode Capital Management, LLC (Geode), serves as sub-adviser for the Index 500 Portfolio. Geode provides discretionary investment advisory services to the fund and is paid by FMR for providing these services.
Distribution and Service Plan. In accordance with Rule 12b-1 of the 1940 Act, the funds have adopted separate 12b-1 Plans for each Service Class of shares. Each Service Class pays Fidelity Distributors Corporation (FDC), an affiliate of FMR, a service fee. For the period, the service fee is based on an annual rate of .10% of Service Class and Service Class R's average net assets and .25% of Service Class 2 and Service Class 2R's average net assets.
For the period, each class paid FDC the following amounts, all of which were re-allowed to insurance companies for the distribution of shares and providing shareholder support services:
| Service
Class | Service
Class 2 | Service
Class R | Service
Class 2R |
Asset Manager | $ 33,645 | $ 68,053 | $ - | $ - |
Contrafund | 1,850,568 | 3,019,587 | - | 11,308 |
Equity-Income | 1,100,510 | 2,850,571 | - | 9,466 |
Growth | 1,356,900 | 1,781,135 | - | 5,349 |
High Income | 359,321 | 182,704 | 55 | 138 |
Index 500 | 18,715 | 202,280 | - | - |
Overseas | 278,008 | 544,008 | 71,362 | 37,151 |
Transfer Agent Fees. Fidelity Investment Institutional Operations Company, Inc. (FIIOC), an affiliate of FMR, is the funds' transfer, dividend disbursing and shareholder servicing agent. FIIOC receives an asset-based fee with respect to each account. FIIOC pays a portion of the expenses related to the typesetting, printing and mailing of shareholder reports, except proxy statements. Each class pays a transfer agent fee, excluding out of pocket expenses, equal to an annual rate of .07% of their month end net assets. For the period, the total transfer agent fees paid by each class to FIIOC, including out of pocket expenses, were as follows:
Asset Manager |
| |
Initial Class | $ 1,886,467 | |
Service Class | 26,312 | |
Service Class 2 | 24,310 | |
| $ 1,937,089 | |
Contrafund |
| |
Initial Class | $ 5,400,493 | |
Service Class | 1,238,671 | |
Service Class 2 | 835,940 | |
Service Class 2R | 3,096 | |
| $ 7,478,200 | |
Annual Report
Notes to Financial Statements - continued
4. Fees and Other Transactions with Affiliates - continued
Transfer Agent Fees - continued
Equity-Income |
| |
Initial Class | $ 5,527,852 | |
Service Class | 728,268 | |
Service Class 2 | 782,156 | |
Service Class 2R | 2,672 | |
| $ 7,040,948 | |
Growth |
| |
Initial Class | $ 5,336,742 | |
Service Class | 899,118 | |
Service Class 2 | 486,224 | |
Service Class 2R | 1,447 | |
| $ 6,723,531 | |
High Income |
| |
Initial Class | $ 933,207 | |
Service Class | 240,550 | |
Service Class 2 | 56,012 | |
Initial Class R | 36 | |
Service Class R | 36 | |
Service Class 2R | 36 | |
| $ 1,229,877 | |
Index 500 |
| |
Initial Class | $ 1,867,269 | |
Service Class | 15,738 | |
Service Class 2 | 62,603 | |
| $ 1,945,610 | |
Overseas |
| |
Initial Class | $ 972,332 | |
Service Class | 192,952 | |
Service Class 2 | 157,275 | |
Initial Class R | 51,463 | |
Service Class R | 47,651 | |
Service Class 2R | 10,338 | |
| $ 1,432,011 | |
Accounting and Security Lending Fees. Fidelity Service Company, Inc. (FSC), an affiliate of FMR, maintains each fund's accounting records. The accounting fee is based on the level of average net assets for the month. Under a separate contract, FSC administers the security lending program. The security lending fee is based on the number and duration of lending transactions.
Central Funds. The funds may invest in affiliated Central Funds managed by Fidelity Investments Money Management, Inc. (FIMM) or Fidelity Management and Research Co, Inc. (FMRC), affiliates of FMR. The Central Funds are open-end investment companies available only to investment companies and other accounts managed by FMR and its affiliates. The Money Market central funds seek preservation of capital and current income. The High Income Central Investment Portfolio I seeks a high level of income and may also seek capital appreciation. The Floating Rate Central Investment Portfolio seeks a high level of current income. The central funds do not pay a management fee. Income distributions earned by the funds are recorded as income in the accompanying financial statements. Distributions from the Central Funds are noted in the table below:
| Income
Distributions |
Asset Manager | $ 9,377,924 |
Contrafund | 13,680,343 |
Equity-Income | 714,712 |
Growth | 825,101 |
High Income | 678,234 |
Index 500 | 259,769 |
Overseas | 1,457,235 |
Annual Report
4. Fees and Other Transactions with Affiliates - continued
Central Funds - continued
Market value of securities delivered on an in-kind basis, in a non-taxable exchange, for 1,496,398 shares of the Fidelity High Income Central Investment Portfolio I aggregated $149,639,838 during the period for Asset Manager Portfolio.
Brokerage Commissions. Certain funds placed a portion of their portfolio transactions with brokerage firms which are affiliates of the investment adviser. The commissions paid to these affiliated firms were as follows:
| Amount | |
Asset Manager | $ 17,878 | |
Contrafund | 329,726 | |
Equity-Income | 127,479 | |
Growth | 609,973 | |
High Income | 1 | |
Overseas | 4,767 | |
Interfund Lending Program. Pursuant to an Exemptive Order issued by the SEC, the funds, along with other registered investment companies having management contracts with FMR, may participate in an interfund lending program. This program provides an alternative credit facility allowing the funds to borrow from, or lend money to, other participating funds. At period end, there were no interfund loans outstanding. Each applicable fund's activity in this program during the period was as follows:
| Borrower or
Lender | Average Daily
Loan Balance | Weighted
Average
Interest Rate | Interest Earned (included in
interest income) | Interest
Expense |
Equity-Income | Borrower | $ 8,867,217 | 1.63% | $ - | $ 9,256 |
Growth | Borrower | 21,552,298 | 1.39% | - | 39,066 |
High Income | Borrower | 16,577,688 | 1.18% | - | 8,699 |
Index 500 | Borrower | 4,096,300 | 1.43% | - | 1,623 |
5. Committed Line of Credit.
Certain funds participate with other funds managed by FMR in a $4.2 billion credit facility (the "line of credit") to be utilized for temporary or emer-gency purposes to fund shareholder redemptions or for other short-term liquidity purposes. The participating funds have agreed to pay commitment fees on their pro rata portion of the line of credit. During the period, there were no borrowings on this line of credit.
6. Security Lending.
Certain funds lend portfolio securities from time to time in order to earn additional income. Each applicable fund receives collateral (in the form of U.S. Treasury obligations, letters of credit and/or cash) against the loaned securities and maintains collateral in an amount not less than 100% of the market value of the loaned securities during the period of the loan. The market value of the loaned securities is determined at the close of business of the funds and any additional required collateral is delivered to the funds on the next business day. If the borrower defaults on its obligation to return the securities loaned because of insolvency or other reasons, a fund could experience delays and costs in recovering the securities loaned or in gaining access to the collateral. Cash collateral is invested in cash equivalents. The value of loaned securities and cash collateral at period end are disclosed on each applicable fund's Statement of Assets and Liabilities.
7. Bank Borrowings.
Each fund is permitted to have bank borrowings for temporary or emergency purposes to fund shareholder redemptions. Each fund has established borrowing arrangements with certain banks. The interest rate on the borrowings is the bank's base rate, as revised from time to time. At period end, there were no bank borrowings outstanding. Each applicable fund's activity in this program during the period was as follows:
| Average Daily
Loan Balance | Weighted Average
Interest Rate |
Equity-Income | $ 9,721,350 | 1.81% |
High Income | 6,280,667 | 1.62% |
Annual Report
Notes to Financial Statements - continued
8. Expense Reductions.
FMR voluntarily agreed to reimburse certain funds to the extent annual operating expenses exceeded certain levels of average net assets as noted in the table below. Some expenses, for example interest expense, are excluded from this reimbursement. On February 17, 2005, the Board of Trustees approved the VIP Index 500 Portfolio 10 Basis Point Expense Contract and an amendment to the fund's management contract that will become effective March 1, 2005. Under the new contractual arrangements, FMR will be responsible for payment of all operating expenses of the fund (except Rule 12b-1 fees, fees and expenses of the non-interested trustees, interest, taxes, securities lending costs, brokerage commissions, and extraordinary expenses), and total operating expenses for Initial Class, Service Class and Service Class 2 will be limited to 0.10%, 0.20% and 0.35%, respectively.
| Expense
Limitations | Reimbursement
from adviser |
Index 500 | | |
Initial Class | .28% | $ 2,050,886 |
Service Class | .38% | 17,394 |
Service Class 2 | .53% | 70,230 |
| | $ 2,138,510 |
Many of the brokers with whom FMR places trades on behalf of certain funds provided services to these funds in addition to trade execution. These services included payments of expenses on behalf of each applicable fund. In addition, through arrangements with each applicable fund's custodian, credits realized as a result of uninvested cash balances were used to reduce the fund's expenses. All of the applicable expense reductions are noted in the table below.
| Brokerage Service Arrangement | Custody
expense
reduction |
Asset Manager | $ 232,376 | $ 6,579 |
Contrafund | 2,417,980 | 53,408 |
Equity-Income | 873,945 | 612 |
Growth | 3,292,493 | 1,393 |
High Income | 3,244 | 729 |
Index 500 | 14 | - |
Overseas | 912,968 | 1,208 |
9. Other Information.
At the end of the period, FMR or its affiliates and certain otherwise unaffiliated shareholders each were owners of record of more than 10% of the total outstanding shares of the following funds:
| Affiliated % | Number of
Unaffiliated
Shareholders | Unaffiliated
Shareholders % |
Asset Manager | 22% | 1 | 18% |
Contrafund | 13% | 2 | 32% |
Equity-Income | 11% | 2 | 37% |
Growth | 11% | 2 | 35% |
High Income | 20% | 2 | 49% |
Index 500 | 35% | - | - |
Overseas | 14% | 2 | 39% |
Annual Report
Report of Independent Registered Public Accounting Firm
To the Trustees of Variable Insurance Products Fund II and Shareholders of Contrafund Portfolio:
We have audited the accompanying statement of assets and liabilities of Contrafund Portfolio (the Fund), a fund of Variable Insurance Products Fund II, including the portfolio of investments, as of December 31, 2004, and the related statement of operations for the year then ended, the statement of changes in net assets for each of the two years in the period then ended, and the financial highlights for each of the five years in the period then ended. These financial statements and financial highlights are the responsibility of the Fund's management. Our responsibility is to express an opinion on these financial statements and financial highlights based on our audits.
We conducted our audits in accordance with standards of the Public Company Accounting Oversight Board (United States). Those standards require that we plan and perform the audit to obtain reasonable assurance about whether the financial statements and financial highlights are free of material misstatement. An audit includes consideration of internal control over financial reporting as a basis for designing audit procedures that are appropriate in the circumstances, but not for the purpose of expressing an opinion on the effectiveness of the Fund's internal control over financial reporting. Accordingly, we express no such opinion. An audit also includes examining, on a test basis, evidence supporting the amounts and disclosures in the financial statements, assessing the accounting principles used and significant estimates made by management, as well as evaluating the overall financial statement presentation. Our procedures included confirmation of securities owned as of December 31, 2004, by correspondence with the custodians and brokers; where replies were not received from brokers, we performed other auditing procedures. We believe that our audits provide a reasonable basis for our opinion.
In our opinion, the financial statements and financial highlights referred to above present fairly, in all material respects, the financial position of Contrafund Portfolio as of December 31, 2004, the results of its operations for the year then ended, the changes in its net assets for each of the two years in the period then ended, and its financial highlights for each of the five years in the period then ended, in conformity with accounting principles generally accepted in the United States of America.
/s/DELOITTE & TOUCHE LLP
DELOITTE & TOUCHE LLP
Boston, Massachusetts
February 10, 2005
Annual Report
Report of Independent Registered Public Accounting Firm
To the Trustees of Variable Insurance Products Fund II and Shareholders of Asset Manager Portfolio and Index 500 Portfolio:
We have audited the accompanying statement of assets and liabilities of Asset Manager Portfolio and Index 500 Portfolio, (the Funds), funds of Variable Insurance Products II, including the portfolios of investments, as of December 31, 2004, and the related statements of operations for the year then ended, the statements of changes in net assets for each of the two years in the period then ended, and the financial highlights for each of the periods presented. These financial statements and financial highlights are the responsibility of the Funds' management. Our responsibility is to express an opinion on these financial statements and financial highlights based on our audits.
We conducted our audits in accordance with standards of the Public Company Accounting Oversight Board (United States). Those standards require that we plan and perform the audit to obtain reasonable assurance about whether the financial statements and financial highlights are free of material misstatement. An audit includes consideration of internal control over financial reporting as a basis for designing audit procedures that are appropriate in the circumstances, but not for the purpose of expressing an opinion on the effectiveness of the Funds' internal control over financial reporting. Accordingly, we express no such opinion. An audit also includes examining, on a test basis, evidence supporting the amounts and disclosures in the financial statements, assessing the accounting principles used and significant estimates made by management, as well as evaluating the overall financial statement presentation. Our procedures included confirmation of securities owned as of December 31, 2004, by correspondence with the custodians and brokers; where replies were not received from brokers, we performed other auditing procedures. We believe that our audits provide a reasonable basis for our opinion.
In our opinion, the financial statements and financial highlights referred to above present fairly, in all material respects, the financial position of Asset Manager Portfolio and Index 500 Portfolio as of December 31, 2004, the results of their operations for the year then ended, the changes in their net assets for each of the two years in the period then ended, and their financial highlights for each of the periods presented, in conformity with accounting principles generally accepted in the United States of America.
/s/DELOITTE & TOUCHE LLP
DELOITTE & TOUCHE LLP
Boston, Massachusetts
February 18, 2005
Annual Report
Report of Independent Registered Public Accounting Firm
To the Trustees of Variable Insurance Products Fund and Shareholders of Equity-Income Portfolio and Growth Portfolio:
In our opinion, the accompanying statements of assets and liabilities, including the schedules of investments, and the related statements of operations and of changes in net assets and the financial highlights present fairly, in all material respects, the financial position of Equity-Income Portfolio and Growth Portfolio (funds of Variable Insurance Products Fund) at December 31, 2004 and the results of their operations, the changes in their net assets and the financial highlights for the periods indicated, in conformity with accounting principles generally accepted in the United States of America. These financial statements and financial highlights (hereafter referred to as "financial statements") are the responsibility of Variable Insurance Products Funds' management; our responsibility is to express an opinion on these financial statements based on our audits. We conducted our audits of these financial statements in accordance with the standards of the Public Company Accounting Oversight Board (United States). Those standards require that we plan and perform the audit to obtain reasonable assurance about whether the financial statements are free of material misstatement. An audit includes examining, on a test basis, evidence supporting the amounts and disclosures in the financial statements, assessing the accounting principles used and significant estimates made by management, and evaluating the overall financial statement presentation. We believe that our audits, which included confirmation of securities at December 31, 2004 by correspondence with the custodian and brokers, provide a reasonable basis for our opinion.
/s/PricewaterhouseCoopers LLP
PricewaterhouseCoopers LLP
Boston, Massachusetts
February 10, 2005
Annual Report
Report of Independent Registered Public Accounting Firm
To the Trustees of Variable Insurance Products Fund and the Shareholders of High Income Portfolio:
In our opinion, the accompanying statement of assets and liabilities, including the schedule of investments, and the related statements of operations and of changes in net assets and the financial highlights present fairly, in all material respects, the financial position of High Income Portfolio (a fund of Variable Insurance Products Fund) at December 31, 2004 and the results of its operations, the changes in its net assets and the financial highlights for the periods indicated, in conformity with accounting principles generally accepted in the United States of America. These financial statements and financial highlights (hereafter referred to as "financial statements") are the responsibility of the High Income Portfolio's management; our responsibility is to express an opinion on these financial statements based on our audits. We conducted our audits of these financial statements in accordance with the standards of the Public Company Accounting Oversight Board (United States). Those standards require that we plan and perform the audit to obtain reasonable assurance about whether the financial statements are free of material misstatement. An audit includes examining, on a test basis, evidence supporting the amounts and disclosures in the financial statements, assessing the accounting principles used and significant estimates made by management, and evaluating the overall financial statement presentation. We believe that our audits, which included confirmation of securities at December 31, 2004 by correspondence with the custodian and brokers, provide a reasonable basis for our opinion.
/s/PricewaterhouseCoopers LLP
PricewaterhouseCoopers LLP
Boston, Massachusetts
February 18, 2005
Annual Report
Report of Independent Registered Public Accounting Firm
To the Trustees of Variable Insurance Products Fund and the Shareholders of Overseas Portfolio:
In our opinion, the accompanying statement of assets and liabilities, including the schedule of investments, and the related statements of operations and of changes in net assets and the financial highlights present fairly, in all material respects, the financial position of Overseas Portfolio (a fund of Variable Insurance Products Fund) at December 31, 2004 and the results of its operations, the changes in its net assets and the financial highlights for the periods indicated, in conformity with accounting principles generally accepted in the United States of America. These financial statements and financial highlights (hereafter referred to as "financial statements") are the responsibility of the Overseas Portfolio's management; our responsibility is to express an opinion on these financial statements based on our audits. We conducted our audits of these financial statements in accordance with the standards of the Public Company Accounting Oversight Board (United States). Those standards require that we plan and perform the audit to obtain reasonable assurance about whether the financial statements are free of material misstatement. An audit includes examining, on a test basis, evidence supporting the amounts and disclosures in the financial statements, assessing the accounting principles used and significant estimates made by management, and evaluating the overall financial statement presentation. We believe that our audits, which included confirmation of securities at December 31, 2004 by correspondence with the custodian and brokers, provide a reasonable basis for our opinion.
/s/PricewaterhouseCoopers LLP
PricewaterhouseCoopers LLP
Boston, Massachusetts
February 14, 2005
Annual Report
December 31, 2004 (Unaudited)
Fidelity Floating Rate Central Investment Portfolio
Top Fifty Holdings (excluding cash equivalents)* |
| Principal
Amount | Value | % of Fund's
Net Assets |
General Growth Properties, Inc. Tranche B, term loan 4.53% 11/12/08 | $ 6,000,000 | $ 6,015,000 | 4.8 |
Lake Las Vegas LLC Tranche 1, term loan 5.1197% 11/1/09 | 4,310,000 | 4,342,325 | 3.5 |
Qwest Corp. Tranche A, term loan 7.39% 6/30/07 | 4,000,000 | 4,170,000 | 3.3 |
UPC Distribution Holdings BV Tranche F, term loan 5.98% 12/31/11 | 4,000,000 | 4,050,000 | 3.2 |
Dex Media West LLC/Dex Media West Finance Co. Tranche B, term loan 4.1033% 9/9/10 | 3,993,293 | 4,043,209 | 3.2 |
El Paso Corp. Credit-Linked Deposit 5.15% 11/22/09 | 4,000,000 | 4,030,000 | 3.2 |
Marina District Finance Co., Inc. term loan 3.93% 10/14/11 | 4,000,000 | 4,030,000 | 3.2 |
R.H. Donnelley Corp. Tranche B2, term loan 4.3086% 6/30/11 | 3,965,788 | 4,005,446 | 3.2 |
PacifiCare Health Systems, Inc. Tranche B, term loan 4.1618% 12/6/10 | 4,000,000 | 4,000,000 | 3.2 |
Nexstar Broadcasting, Inc. Tranche D, term loan 4.31% 12/31/10 | 3,989,975 | 3,999,975 | 3.2 |
Starwood Hotels & Resorts Worldwide, Inc. term loan 3.67% 10/9/06 | 3,666,667 | 3,666,667 | 2.9 |
Smurfit-Stone Container Enterprises, Inc. Tranche B, term loan 4.5208% 11/1/11 | 3,489,621 | 3,537,603 | 2.8 |
Vicar Operating, Inc. Tranche F, term loan 4.1875% 9/30/08 | 3,100,000 | 3,119,375 | 2.5 |
RailAmerica, Inc. term loan 4.375% 9/29/11 | 3,000,000 | 3,052,500 | 2.4 |
Constellation Brands, Inc. Tranche B, term loan 4.5866% 12/22/11 | 3,000,000 | 3,037,500 | 2.4 |
Texas Genco LLC term loan 4.48% 12/14/11 | 3,000,000 | 3,033,750 | 2.4 |
Lamar Media Corp. Tranche C, term loan 4.0625% 6/30/10 | 3,000,000 | 3,030,000 | 2.4 |
ON Semiconductor Corp. Tranche G, term loan 5.5625% 12/15/11 | 3,000,000 | 3,007,500 | 2.4 |
HCA, Inc. term loan 3.42% 11/9/09 | 3,000,000 | 2,992,500 | 2.4 |
Charter Communication Operating LLC Tranche A, term loan 5.13% 4/27/10 | 3,000,000 | 2,981,250 | 2.4 |
Century Cable Holdings LLC Tranche B, term loan 7.25% 6/30/09 | 3,000,000 | 2,977,500 | 2.4 |
Kansas City Southern Railway Co. Tranche B1, term loan 4.0939% 3/30/08 | 2,800,000 | 2,842,000 | 2.3 |
Iron Mountain, Inc. Tranche R, term loan 4.1875% 4/2/11 | 2,500,000 | 2,512,500 | 2.0 |
NRG Energy, Inc. term loan 4.95% 12/24/11 | 2,193,750 | 2,193,750 | 1.8 |
Valor Telecommunications Enterprises LLC Tranche 2, term loan 10.0815% 11/10/11 | 2,000,000 | 2,060,000 | 1.6 |
AM General LLC Tranche B1, term loan 6.759% 11/1/11 | 2,000,000 | 2,040,000 | 1.6 |
Simmons Bedding Co. Tranche C, term loan 4.0535% 12/19/11 | 2,000,000 | 2,030,000 | 1.6 |
Herbalife International, Inc. term loan 4.58% 12/21/10 | 2,000,000 | 2,027,500 | 1.6 |
Reliant Energy, Inc. term loan 4.795% 4/30/10 | 2,000,000 | 2,025,000 | 1.6 |
Advertising Directory Solutions, Inc. Tranche 1, term loan 4.4% 11/9/11 | 2,000,000 | 2,015,000 | 1.6 |
LNR Property Corp. Tranche B, term loan 5.59% 1/31/08 | 2,000,000 | 2,010,000 | 1.6 |
Community Health Systems, Inc. term loan 4.15% 8/19/11 | 1,995,000 | 2,004,975 | 1.6 |
Nextel Communications, Inc. Tranche E, term loan 4.6875% 12/15/10 | 1,994,962 | 1,996,209 | 1.6 |
NRG Energy, Inc. Credit-Linked Deposit 4.325% 12/24/11 | 1,706,250 | 1,708,383 | 1.4 |
Domino's, Inc. term loan 4.3125% 6/25/10 | 1,632,486 | 1,650,852 | 1.3 |
Goodman Global Holdings, Inc. term loan 4.8125% 12/23/11 | 1,220,000 | 1,226,100 | 1.0 |
Smurfit-Stone Container Enterprises, Inc. Tranche C, term loan 4.3958% 11/1/11 | 1,073,729 | 1,088,493 | 0.9 |
Georgia-Pacific Corp. term loan 3.4647% 7/2/09 | 1,000,000 | 998,750 | 0.8 |
Cooper Standard Auto, Inc. Tranche C, term loan 6.25% 12/23/11 | 616,667 | 624,375 | 0.5 |
Landry's Seafood Restaurants, Inc. term loan 4.5276% 12/28/10 | 465,000 | 469,650 | 0.4 |
Smurfit-Stone Container Enterprises, Inc. Credit-Linked Deposit 2.4% 11/1/10 | 436,650 | 442,654 | 0.4 |
Cooper Standard Auto, Inc. Tranche B, term loan 6.25% 12/23/11 | 383,333 | 388,125 | 0.3 |
* The fund commenced operations on December 15, 2004 and holds 42 securities, excluding cash equivalents, which represent 88.9% of the fund's net assets. |
Annual Report
December 31, 2004 (Unaudited)
Fidelity High Income Central Investment Portfolio 1
Top Fifty Holdings (excluding cash equivalents) |
| Principal
Amount | Value | % of Fund's
Net Assets |
Ship Finance International Ltd. 8.5% 12/15/13 | $ 17,800,000 | $ 18,333,983 | 1.7 |
Invensys PLC 9.875% 3/15/11 | 11,735,000 | 12,673,800 | 1.2 |
Teekay Shipping Corp. 8.875% 7/15/11 | 10,780,000 | 12,504,800 | 1.1 |
Micron Technology, Inc. 6.5% 9/30/05 | 11,761,905 | 11,732,500 | 1.1 |
General Maritime Corp. 10% 3/15/13 | 9,940,000 | 11,431,000 | 1.1 |
EchoStar DBS Corp. 5.75% 10/1/08 | 10,505,000 | 10,662,575 | 1.0 |
Celestica, Inc. 7.875% 7/1/11 | 9,430,000 | 10,090,100 | 0.9 |
Millicom International Cellular SA 10% 12/1/13 | 8,805,000 | 9,201,225 | 0.8 |
Western Financial Bank 9.625% 5/15/12 | 8,060,000 | 9,188,400 | 0.8 |
PerkinElmer, Inc. 8.875% 1/15/13 | 7,470,000 | 8,497,125 | 0.8 |
OMI Corp. 7.625% 12/1/13 | 7,645,000 | 8,180,150 | 0.8 |
TFM SA de CV yankee 11.75% 6/15/09 | 8,030,000 | 8,150,450 | 0.8 |
BCP Caylux Holdings Luxembourg SCA 9.625% 6/15/14 | 7,120,000 | 7,974,400 | 0.7 |
Compass Minerals International, Inc. 0% 6/1/13 | 9,175,000 | 7,431,750 | 0.7 |
Gerdau AmeriSteel Corp./GUSAP Partners 10.375% 7/15/11 | 6,015,000 | 7,067,625 | 0.7 |
The Reader's Digest Association, Inc. 6.5% 3/1/11 | 6,610,000 | 6,907,450 | 0.6 |
Qwest Capital Funding, Inc. 7.25% 2/15/11 | 7,055,000 | 6,772,800 | 0.6 |
Wyndham International, Inc. term loan 7.125% 6/30/06 | 6,739,515 | 6,756,364 | 0.6 |
Hanover Compressor Co. 0% 3/31/07 | 7,660,000 | 6,664,200 | 0.6 |
NRG Energy, Inc. 8% 12/15/13 | 5,998,000 | 6,545,318 | 0.6 |
MGM MIRAGE 6% 10/1/09 | 6,360,000 | 6,519,000 | 0.6 |
KB Home 7.75% 2/1/10 | 6,055,000 | 6,509,125 | 0.6 |
Norske Skog Canada Ltd. 8.625% 6/15/11 | 6,065,000 | 6,489,550 | 0.6 |
Tenet Healthcare Corp. 6.375% 12/1/11 | 6,995,000 | 6,435,400 | 0.6 |
Millennium America, Inc. 9.25% 6/15/08 | 5,690,000 | 6,429,700 | 0.6 |
Elan Finance PLC/Elan Finance Corp. 7.75% 11/15/11 | 5,980,000 | 6,398,600 | 0.6 |
Mohegan Tribal Gaming Authority 6.375% 7/15/09 | 6,185,000 | 6,393,744 | 0.6 |
American Real Estate Partners/American Real Estate Finance Corp. 8.125% 6/1/12 | 5,920,000 | 6,312,200 | 0.6 |
Huntsman LLC 9.32% 7/15/11 | 5,660,000 | 6,310,900 | 0.6 |
Wheeling Island Gaming, Inc. 10.125% 12/15/09 | 5,835,000 | 6,214,275 | 0.6 |
General Growth Properties, Inc.: | | | |
Tranche B, term loan 4.53% 11/12/08 | 6,100,000 | 6,115,250 | 0.6 |
Tranche A, term loan 4.53% 11/12/07 | 6,100,000 | 6,100,000 | 0.6 |
Berry Plastics Corp. 10.75% 7/15/12 | 5,310,000 | 6,066,675 | 0.6 |
Astoria Energy LLC term loan 7.1882% 4/15/12 | 5,890,000 | 6,007,800 | 0.6 |
Levi Strauss & Co. 12.25% 12/15/12 | 5,370,000 | 5,960,700 | 0.5 |
Hilton Head Communications LP Tranche B, term loan 6.5% 3/31/08 | 6,050,000 | 5,944,125 | 0.5 |
Sonic Automotive, Inc. 8.625% 8/15/13 | 5,550,000 | 5,938,500 | 0.5 |
CDRV Investors, Inc. 0% 1/1/15 | 9,590,000 | 5,921,825 | 0.5 |
Hilcorp Energy I LP/Hilcorp Finance Co. 10.5% 9/1/10 | 5,205,000 | 5,881,650 | 0.5 |
Riverside Energy Center LLC term loan 6.38% 6/24/11 | 5,793,001 | 5,879,896 | 0.5 |
Wise Metals Group LLC/Alloys Finance 10.25% 5/15/12 | 5,830,000 | 5,830,000 | 0.5 |
Asbury Automotive Group, Inc. 9% 6/15/12 | 5,420,000 | 5,704,550 | 0.5 |
Xerox Corp. 7.125% 6/15/10 | 5,235,000 | 5,653,800 | 0.5 |
Browning-Ferris Industries, Inc. 6.375% 1/15/08 | 5,755,000 | 5,639,900 | 0.5 |
Range Resources Corp. 7.375% 7/15/13 | 5,235,000 | 5,601,450 | 0.5 |
Texas Industries, Inc. 10.25% 6/15/11 | 4,650,000 | 5,487,000 | 0.5 |
Owens-Brockway Glass Container, Inc. 8.875% 2/15/09 | 5,050,000 | 5,479,250 | 0.5 |
U.S. West Capital Funding, Inc. 6.375% 7/15/08 | 5,547,000 | 5,477,663 | 0.5 |
Nextel Communications, Inc. 6.875% 10/31/13 | 4,970,000 | 5,392,450 | 0.5 |
Qwest Capital Funding, Inc. 7% 8/3/09 | 5,440,000 | 5,385,600 | 0.5 |
Top 50 Holdings as a Percentage of Fund's Net Assets - 33.6% |
Annual Report
Trustees and Officers
The Trustees, Member of the Advisory Board, and executive officers of the trusts and funds, as applicable, are listed below. The Board of Trustees governs each fund and is responsible for protecting the interests of shareholders. The Trustees are experienced executives who meet periodically throughout the year to oversee each fund's activities, review contractual arrangements with companies that provide services to each fund, and review each fund's performance. Except for William O. McCoy, Dennis J. Dirks, and Kenneth L. Wolfe, each of the Trustees oversees 301 funds advised by FMR or an affiliate. Mr. McCoy oversees 303 funds advised by FMR or an affiliate. Mr. Dirks and Mr. Wolfe oversee 233 funds advised by FMR or an affiliate.
The Trustees hold office without limit in time except that (a) any Trustee may resign; (b) any Trustee may be removed by written instrument, signed by at least two-thirds of the number of Trustees prior to such removal; (c) any Trustee who requests to be retired or who has become incapacitated by illness or injury may be retired by written instrument signed by a majority of the other Trustees; and (d) any Trustee may be removed at any special meeting of shareholders by a two-thirds vote of the outstanding voting securities of the trust. In any event, each non-interested Trustee shall retire not later than the last day of the calendar year in which his or her 72nd birthday occurs. The executive officers and Advisory Board Member hold office without limit in time, except that any officer and Advisory Board Member may resign or may be removed by a vote of a majority of the Trustees at any regular meeting or any special meeting of the Trustees. Except as indicated, each individual has held the office shown or other offices in the same company for the past five years.
The funds' Statement of Additional Information (SAI) includes more information about the Trustees. To request a free copy, call Fidelity at 1-800-544-5429.
Interested Trustees*:
Correspondence intended for each Trustee who is an "interested person" (as defined in the 1940 Act) may be sent to Fidelity Investments, 82 Devonshire Street, Boston, Massachusetts 02109.
Name, Age; Principal Occupation |
Edward C. Johnson 3d (74)** |
| Year of Election or Appointment: 1981 or 1988 Trustee of Variable Insurance Products Fund (1981) and Variable Insurance Products Fund II (1988). Mr. Johnson is Chairman of the Board of Trustees. Mr. Johnson serves as Chief Executive Officer, Chairman, and a Director of FMR Corp.; a Director and Chairman of the Board and of the Executive Committee of FMR; Chairman and a Director of Fidelity Management & Research (Far East) Inc.; Chairman (1998) and a Director of Fidelity Investments Money Management, Inc.; and Chairman (2001) and a Director (2000) of FMR Co., Inc. |
Abigail P. Johnson (43)** |
| Year of Election or Appointment: 2001 Senior Vice President of VIP Asset Manager (2001), VIP Contrafund (2001), VIP Equity-Income (2001), VIP Growth (2001), VIP High Income (2001), VIP Index 500 (2001), and VIP Overseas (2001). Ms. Johnson also serves as Senior Vice President of other Fidelity funds (2001). She is President and a Director of FMR (2001), Fidelity Investments Money Management, Inc. (2001), FMR Co., Inc. (2001), and a Director of FMR Corp. Previously, Ms. Johnson managed a number of Fidelity funds. |
Laura B. Cronin (50) |
| Year of Election or Appointment: 2003 Ms. Cronin is an Executive Vice President (2002) and Chief Financial Officer (2002) of FMR Corp. and is a member of the Fidelity Management Committee (2003). Previously, Ms. Cronin served as Vice President of Finance of FMR (1997-1999), and Chief Financial Officer of FMR (1999-2001), Fidelity Personal Investments (2001), and Fidelity Brokerage Company (2001-2002). |
Robert L. Reynolds (52) |
| Year of Election or Appointment: 2003 Mr. Reynolds is a Director (2003) and Chief Operating Officer (2002) of FMR Corp. and is the head of the Fidelity Management Committee (2003). He also serves on the Board at Fidelity Investments Canada, Ltd. (2000). Previously, Mr. Reynolds served as President of Fidelity Investments Institutional Retirement Group (1996-2000). |
* Trustees have been determined to be "Interested Trustees" by virtue of, among other things, their affiliation with the trusts or various entities under common control with FMR.
** Edward C. Johnson 3d, Trustee, is Abigail P. Johnson's father.
Annual Report
Trustees and Officers - continued
Non-Interested Trustees:
Correspondence intended for each non-interested Trustee (that is, the Trustees other than the Interested Trustees) may be sent to Fidelity Investments, P.O. Box 55235, Boston, Massachusetts 02205-5235.
Dennis J. Dirks (56) |
| Year of Election or Appointment: 2005 Mr. Dirks also serves as a Trustee (2005) or Member of the Advisory Board (2004) of other investment companies advised by FMR. Prior to his retirement in May 2003, Mr. Dirks was Chief Operating Officer and a member of the Board of The Depository Trust & Clearing Corporation (DTCC) (1999-2003). He also served as President, Chief Operating Officer, and Board member of The Depository Trust Company (DTC) (1999-2003) and President and Board member of the National Securities Clearing Corporation (NSCC) (1999-2003). In addition, Mr. Dirks served as Chief Executive Officer and Board member of the Government Securities Clearing Corporation (2001-2003) and Chief Executive Officer and Board member of the Mortgage-Backed Securities Clearing Corporation (2001-2003). |
Robert M. Gates (61) |
| Year of Election or Appointment: 1997 Dr. Gates is Vice Chairman of the non-interested Trustees (2005). Dr. Gates is President of Texas A&M University (2002). He was Director of the Central Intelligence Agency (CIA) from 1991 to 1993. From 1989 to 1991, Dr. Gates served as Assistant to the President of the United States and Deputy National Security Advisor. Dr. Gates is a Director of NACCO Industries, Inc. (mining and manufacturing), Parker Drilling Co., Inc. (drilling and rental tools for the energy industry, 2001), and Brinker International (restaurant management, 2003). He also serves as a member of the Advisory Board of VoteHere.net (secure Internet voting, 2001). Previously, Dr. Gates served as a Director of LucasVarity PLC (automotive components and diesel engines), a Director of TRW Inc. (automotive, space, defense, and information technology), and Dean of the George Bush School of Government and Public Service at Texas A&M University (1999-2001). Dr. Gates also is a Trustee of the Forum for International Policy. |
George H. Heilmeier (68) |
| Year of Election or Appointment: 2004 Dr. Heilmeier is Chairman Emeritus of Telcordia Technologies (communication software and systems), where prior to his retirement, he served as company Chairman and Chief Executive Officer. He currently serves on the Boards of Directors of The Mitre Corporation (systems engineering and information technology support for the government), INET Technologies Inc. (telecommunications network surveillance, 2001), Teletech Holdings (customer management services), and HRL Laboratories (private research and development, 2004). He is Chairman of the General Motors Technology Advisory Committee and a Life Fellow of the Institute of Electrical and Electronics Engineers (IEEE) (2000). Dr. Heilmeier is a member of the Defense Science Board and the National Security Agency Advisory Board. He is also a member of the National Academy of Engineering, the American Academy of Arts and Sciences, and the Board of Overseers of the School of Engineering and Applied Science of the University of Pennsylvania. Previously, Dr. Heilmeier served as a Director of TRW Inc. (automotive, space, defense, and information technology, 1992-2002), Compaq (1994-2002), and Automatic Data Processing, Inc. (ADP) (technology-based business outsourcing, 1995-2002). |
Marie L. Knowles (58) |
| Year of Election or Appointment: 2001 Prior to Ms. Knowles' retirement in June 2000, she served as Executive Vice President and Chief Financial Officer of Atlantic Richfield Company (ARCO) (diversified energy, 1996-2000). From 1993 to 1996, she was a Senior Vice President of ARCO and President of ARCO Transportation Company. She served as a Director of ARCO from 1996 to 1998. She currently serves as a Director of Phelps Dodge Corporation (copper mining and manufacturing), URS Corporation (multidisciplinary engineering, 1999), and McKesson Corporation (healthcare service, 2002). Ms. Knowles is a Trustee of the Brookings Institution and the Catalina Island Conservancy and also serves as a member of the Advisory Board for the School of Engineering of the University of Southern California. |
Ned C. Lautenbach (60) |
| Year of Election or Appointment: 2000 Mr. Lautenbach has been a partner of Clayton, Dubilier & Rice, Inc. (private equity investment firm) since September 1998. Previously, Mr. Lautenbach was with the International Business Machines Corporation (IBM) from 1968 until his retirement in 1998. He was most recently Senior Vice President and Group Executive of Worldwide Sales and Services. From 1993 to 1995, he was Chairman of IBM World Trade Corporation, and from 1994 to 1998 was a member of IBM's Corporate Executive Committee. Mr. Lautenbach serves as Co-Chairman and a Director of Covansys, Inc. (global provider of business and technology solutions, 2000). In addition, he is a Director of Italtel Holding S.p.A. (telecommunications (Milan, Italy), 2004) and Eaton Corporation (diversified industrial) as well as the Philharmonic Center for the Arts in Naples, Florida (1999). He also is a member of the Council on Foreign Relations. |
Marvin L. Mann (71) |
| Year of Election or Appointment: 1993 Mr. Mann is Chairman of the non-interested Trustees (2001). He is Chairman Emeritus of Lexmark International, Inc. (computer peripherals), where he served as CEO until April 1998, retired as Chairman May 1999, and remains a member of the Board. Prior to 1991, he held the positions of Vice President of International Business Machines Corporation (IBM) and President and General Manager of various IBM divisions and subsidiaries. He is a member of the Executive Committee of the Independent Director's Council of the Investment Company Institute. In addition, Mr. Mann is a member of the President's Cabinet at the University of Alabama and the Board of Visitors of the Culverhouse College of Commerce and Business Administration at the University of Alabama. |
William O. McCoy (71) |
| Year of Election or Appointment: 1997 Prior to his retirement in December 1994, Mr. McCoy was Vice Chairman of the Board of BellSouth Corporation (telecommunications) and President of BellSouth Enterprises. He is currently a Director of Liberty Corporation (holding company), Duke Realty Corporation (real estate), and Progress Energy, Inc. (electric utility). He is also a partner of Franklin Street Partners (private investment management firm) and a member of the Research Triangle Foundation Board. In addition, Mr. McCoy served as the Interim Chancellor (1999-2000) and a member of the Board of Visitors (1994-1998) for the University of North Carolina at Chapel Hill and currently serves on the Board of Directors of the University of North Carolina Health Care System and the Board of Visitors of the Kenan-Flagler Business School (University of North Carolina at Chapel Hill). He also served as Vice President of Finance for the University of North Carolina (16-school system, 1995-1998). |
Cornelia M. Small (60) |
| Year of Election or Appointment: 2005 Ms. Small is a member (2000) and Chairperson (2002) of the Investment Committee, and a member (2002) of the Board of Trustees of Smith College. Previously, she served as Chief Investment Officer (1999-2000), Director of Global Equity Investments (1996-1999), and a member of the Board of Directors of Scudder, Stevens & Clark (1990-1997) and Scudder Kemper Investments (1997-1998). In addition, Ms. Small served as Co-Chair (2000-2003) of the Annual Fund for the Fletcher School of Law and Diplomacy. |
William S. Stavropoulos (65) |
| Year of Election or Appointment: 2001 Mr. Stavropoulos is Chairman of the Board (2000), CEO (2002), a position he previously held from 1995-2000, Chairman of the Executive Committee (2000), and a Member of the Board of Directors of The Dow Chemical Company. Since joining The Dow Chemical Company in 1967, Mr. Stavropoulos served in numerous senior management positions, including President (1993-2000; 2002-2003). Currently, he is a Director of NCR Corporation (data warehousing and technology solutions), BellSouth Corporation (telecommunications), Chemical Financial Corporation, and Maersk Inc. (industrial conglomerate, 2002). He also serves as a member of the Board of Trustees of the American Enterprise Institute for Public Policy Research. In addition, Mr. Stavropoulos is a member of The Business Council, J.P. Morgan International Council and the University of Notre Dame Advisory Council for the College of Science. |
Kenneth L. Wolfe (65) |
| Year of Election or Appointment: 2005 Mr. Wolfe also serves as a Trustee (2005) or Member of the Advisory Board (2004) of other investment companies advised by FMR. Prior to his retirement in 2001, Mr. Wolfe was Chairman and Chief Executive Officer of Hershey Foods Corporation (1993-2001). He currently serves as a member of the boards of Adelphia Communications Corporation (2003), Bausch & Lomb, Inc., and Revlon Inc. (2004). |
Advisory Board Member and Executive Officers:
Correspondence intended for each executive officer and Mr. Lynch may be sent to Fidelity Investments, 82 Devonshire Street, Boston, Massachusetts 02109
Name, Age; Principal Occupation |
Peter S. Lynch (61) |
| Year of Election or Appointment: 2003 Member of the Advisory Board of Variable Insurance Products Fund and Variable Insurance Products Fund II. Vice Chairman and a Director of FMR, and Vice Chairman (2001) and a Director (2000) of FMR Co., Inc. Previously, Mr. Lynch served as a Trustee of the Fidelity funds (1990-2003). Prior to May 31, 1990, he was a Director of FMR and Executive Vice President of FMR (a position he held until March 31, 1991), Vice President of Fidelity® Magellan® Fund and FMR Growth Group Leader, and Managing Director of FMR Corp. Mr. Lynch was also Vice President of Fidelity Investments Corporate Services. In addition, he serves as a Trustee of Boston College, Massachusetts Eye & Ear Infirmary, Historic Deerfield, John F. Kennedy Library, and the Museum of Fine Arts of Boston. |
Philip L. Bullen (45) |
| Year of Election or Appointment: 2001 Vice President of VIP Index 500 and VIP Overseas. Mr. Bullen also serves as Vice President of certain Equity Funds (2001) and certain High Income Funds (2001). He is Senior Vice President of FMR (2001) and FMR Co., Inc. (2001), President and a Director of Fidelity Management & Research (Far East) Inc. (2001), President and a Director of Fidelity Management & Research (U.K.) Inc. (2002), and a Director of Strategic Advisers, Inc. (2002). Before joining Fidelity Investments, Mr. Bullen was President and Chief Investment Officer of Santander Global Advisors (1997-2000) and President and Chief Executive Officer of Boston's Baring Asset Management Inc. (1994-1997). |
Bart A. Grenier (45) |
| Year of Election or Appointment: 2001 Vice President of VIP Asset Manager, VIP Equity-Income, and VIP High Income. Mr. Grenier also serves as Vice President of certain Equity Funds (2001), a position he previously held from 1999 to 2000, and Vice President of certain High Income Funds (2002). He is Senior Vice President of FMR (1999) and FMR Co., Inc. (2001), and President and Director of Strategic Advisers, Inc. (2002). He also heads Fidelity's Asset Allocation Group (2000), Fidelity's Growth and Income Group (2001), Fidelity's Value Group (2001), and Fidelity's High Income Division (2001). Previously, Mr. Grenier served as President of Fidelity Ventures (2000), Vice President of certain High Income Funds (1997-2000), High Income Division Head (1997-2000), Group Leader of the Income-Growth and Asset Allocation-Income Groups (1996-2000), and Assistant Equity Division Head (1997-2000). |
John B. McDowell (46) |
| Year of Election or Appointment: 2002 Vice President of VIP Contrafund and VIP Growth. Mr. McDowell also serves as Vice President of certain Equity Funds (2002). He is Senior Vice President of FMR (1999), FMR Co., Inc. (2001), and Fidelity Management Trust Company (FMTC). Since joining Fidelity Investments in 1985, Mr. McDowell has worked as a research analyst and manager. |
Charles S. Morrison (44) |
| Year of Election or Appointment: 2002 Vice President of VIP Asset Manager. Mr. Morrison also serves as Vice President of Fidelity's Bond Funds (2002), and Vice President of certain Asset Allocation and Balanced Funds (2002). He serves as Vice President (2002) and Bond Group Leader (2002) of Fidelity Investments Fixed Income Division. Mr. Morrison is also Vice President of FIMM (2002) and FMR (2002). Mr. Morrison joined Fidelity in 1987 as a Corporate Bond Analyst in the Fixed Income Research Division. |
David L. Murphy (56) |
| Year of Election or Appointment: 2002 Vice President of VIP Asset Manager. Mr. Murphy also serves as Vice President of Fidelity's Money Market Funds (2002) and Vice President of certain Asset Allocation Funds (2003). He serves as Senior Vice President (2000) and Money Market Group Leader (2002) of the Fidelity Investments Fixed Income Division. Mr. Murphy is also a Senior Vice President of FIMM (2003) and a Vice President of FMR (2000). Previously, Mr. Murphy served as Bond Group Leader (2000-2002) and Vice President of Fidelity's Taxable Bond Funds (2000-2002) and Fidelity's Municipal Bond Funds (2001-2002). Mr. Murphy joined Fidelity in 1989 as a portfolio manager in the Bond Group. |
Matthew J. Conti (38) |
| Year of Election or Appointment: 2002 or 2003 Vice President of VIP Equity-Income and VIP High Income. Mr. Conti also serves as Vice President of other funds advised by FMR. Prior to assuming his current responsibilities, Mr. Conti managed a variety of Fidelity funds. Mr. Conti also serves as Vice President of FMR (2003) and FMR Co., Inc. (2003). |
William Danoff (44) |
| Year of Election or Appointment: 1995 Vice President of VIP Contrafund. Mr. Danoff serves as Vice President of other funds advised by FMR. Mr. Danoff also serves as Senior Vice President of FMR and FMR Co., Inc. (2001). |
Richard C. Habermann (64) |
| Year of Election or Appointment: 2001 Vice President of VIP Asset Manager and VIP Asset Manager: Growth. Mr. Habermann also serves as Vice President of other funds advised by FMR. Prior to assuming his current responsibilities, Mr. Habermann managed a variety of Fidelity funds. Mr. Habermann also serves as Senior Vice President of FMR and FMR Co., Inc. (2001). |
Name, Age; Principal Occupation |
Richard R. Mace, Jr. (43) |
| Year of Election or Appointment: 1996 Vice President of VIP Overseas. Mr. Mace serves as Vice President of other funds advised by FMR. Mr. Mace also serves as Senior Vice President of FMR (2001) and FMR Co., Inc. (2001). |
Charles A. Mangum (40) |
| Year of Election or Appointment: 2002Vice President of VIP Asset Manager and VIP Asset Manager: Growth. Mr. Magnum also serves as Vice President of other funds advised by FMR. Prior to assuming his current responsibilities, Mr. Mangum managed a variety of Fidelity funds. Mr. Mangum also serves as Vice President of FMR and FMR Co., Inc. (2001). |
Christine McConnell (46) |
| Year of Election or Appointment: 2000 Vice President of VIP Asset Manager and VIP Asset Manager: Growth. Ms. McConnell also serves as Vice President of another fund advised by FMR. Prior to assuming her current responsibilities, Ms. McConnell managed a variety of Fidelity funds. Ms. McConnell also serves as Vice President of FMR (2003) and FMR Co., Inc. (2003). |
James Kim Miller (41) |
| Year of Election or Appointment: 2004 Vice President of VIP Asset Manager and VIP Asset Manager: Growth. Mr. Miller also serves as Vice President of other funds advised by FMR. Prior to assuming his current responsibilities, Mr. Miller managed a variety of Fidelity funds. |
Ford E. O'Neil (42) |
| Year of Election or Appointment: 2001 Vice President of VIP Asset Manager and VIP Asset Manager: Growth. Mr. O'Neil also serves as Vice President of other funds advised by FMR. Prior to assuming his current responsibilities, Mr. O'Neil managed a variety of Fidelity funds. |
Stephen R. Petersen (48) |
| Year of Election or Appointment: 1997 Vice President of VIP Equity-Income. Mr. Petersen serves as Vice President of other funds advised by FMR. Mr. Petersen also serves as Senior Vice President of FMR and FMR Co., Inc. (2001). |
Jennifer S. Uhrig (43) |
| Year of Election or Appointment: 1997 Vice President of VIP Growth Portfolio. Ms. Uhrig serves as Vice President of another fund advised by FMR. Ms. Uhrig also serves as Vice President of FMR and FMR Co., Inc. (2001). |
Eric D. Roiter (56) |
| Year of Election or Appointment: 1998 Secretary of VIP Asset Manager, VIP Contrafund, VIP Equity-Income, VIP Growth, VIP High Income, VIP Index 500, and VIP Overseas. He also serves as Secretary of other Fidelity funds; Vice President, General Counsel, and Secretary of FMR Co., Inc. (2001-present) and FMR; Vice President and Secretary of FDC; Assistant Secretary of Fidelity Management & Research (U.K.) Inc. (2001-present), Fidelity Management & Research (Far East) Inc. (2001-present); and Fidelity Investments Money Management, Inc. (2001-present). Mr. Roiter is an Adjunct Member, Faculty of Law, at Boston College Law School (2003). |
Stuart Fross (45) |
| Year of Election or Appointment: 2003 Assistant Secretary of VIP Asset Manager, VIP Contrafund, VIP Equity-Income, VIP Growth, VIP High Income, VIP Index 500, and VIP Overseas. Mr. Fross also serves as Assistant Secretary of other Fidelity funds (2003) and is an employee of FMR. |
Christine Reynolds (46) |
| Year of Election or Appointment: 2004 President, Treasurer, and Anti-Money Laundering (AML) officer of VIP Asset Manager, VIP Contrafund, VIP Equity-Income, VIP Growth, VIP High Income, VIP Index 500, and VIP Overseas. Ms. Reynolds also serves as President, Treasurer, and AML officer of other Fidelity funds (2004) and is a Vice President (2003) and an employee (2002) of FMR. Before joining Fidelity Investments, Ms. Reynolds worked at PricewaterhouseCoopers LLP (PwC) (1980-2002), where she was most recently an audit partner with PwC's investment management practice. |
Timothy F. Hayes (54) |
| Year of Election or Appointment: 2002 Chief Financial Officer of VIP Asset Manager, VIP Contrafund, VIP Equity-Income, VIP Growth, VIP High Income, VIP Index 500, and VIP Overseas. Mr. Hayes also serves as Chief Financial Officer of other Fidelity funds (2002). Recently he was appointed President of Fidelity Service Company (2003) where he also serves as a Director. Mr. Hayes also serves as President of Fidelity Investments Operations Group (FIOG, 2002), which includes Fidelity Pricing and Cash Management Services Group (FPCMS), where he was appointed President in 1998. Previously, Mr. Hayes served as Chief Financial Officer of Fidelity Investments Corporate Systems and Service Group (1998) and Fidelity Systems Company (1997-1998). |
Kenneth A. Rathgeber (57) |
| Year of Election or Appointment: 2004 Chief Compliance Officer of VIP Asset Manager, VIP Contrafund, VIP Equity-Income, VIP Growth, VIP High Income, VIP Index 500, and VIP Overseas. Mr. Rathgeber also serves as Chief Compliance Officer of other Fidelity funds (2004) and Executive Vice President of Risk Oversight for Fidelity Investments (2002). Previously, he served as Executive Vice President and Chief Operating Officer for Fidelity Investments Institutional Services Company, Inc. (1998-2002). |
John R. Hebble (46) |
| Year of Election or Appointment: 2003 Deputy Treasurer of VIP Asset Manager, VIP Contrafund, VIP Equity-Income, VIP Growth, VIP High Income, VIP Index 500, and VIP Overseas. Mr. Hebble also serves as Deputy Treasurer of other Fidelity funds (2003), and is an employee of FMR. Before joining Fidelity Investments, Mr. Hebble worked at Deutsche Asset Management where he served as Director of Fund Accounting (2002-2003) and Assistant Treasurer of the Scudder Funds (1998-2003). |
Kimberley H. Monasterio (41) |
| Year of Election or Appointment: 2004 Deputy Treasurer of VIP Asset Manager, VIP Contrafund, VIP Equity-Income, VIP Growth, VIP High Income, VIP Index 500, and VIP Overseas. Ms. Monasterio also serves as Deputy Treasurer of other Fidelity funds (2004) and is an employee of FMR (2004). Before joining Fidelity Investments, Ms. Monasterio served as Treasurer (2000-2004) and Chief Financial Officer (2002-2004) of the Franklin Templeton Funds and Senior Vice President of Franklin Templeton Services, LLC (2000-2004). |
John H. Costello (58) |
| Year of Election or Appointment: 1985, 1986, 1987, 1989, 1992, or 1995 Assistant Treasurer of VIP Asset Manager (1989), VIP Contrafund (1995), VIP Equity-Income (1986), VIP Growth (1986), VIP High Income (1985), VIP Index 500 (1992), and VIP Overseas (1987). Mr. Costello also serves as Assistant Treasurer of other Fidelity funds and is an employee of FMR. |
Peter L. Lydecker (50) |
| Year of Election or Appointment: 2004 Assistant Treasurer of VIP Asset Manager, VIP Contrafund, VIP Equity-Income, VIP Growth, VIP High Income, VIP Index 500, and VIP Overseas. Mr. Lydecker also serves as Assistant Treasurer of other Fidelity funds (2004) and is an employee of FMR. |
Mark Osterheld (49) |
| Year of Election or Appointment: 2002 Assistant Treasurer of VIP Asset Manager, VIP Contrafund, VIP Equity-Income, VIP Growth, VIP High Income, VIP Index 500, and VIP Overseas. Mr. Osterheld also serves as Assistant Treasurer of other Fidelity funds (2002) and is an employee of FMR. |
Kenneth B. Robins (35) |
| Year of Election or Appointment: 2004 Assistant Treasurer of VIP Asset Manager, VIP Contrafund, VIP Equity-Income, VIP Growth, VIP High Income, VIP Index 500, and VIP Overseas. Mr. Robins also serves as Assistant Treasurer of other Fidelity funds (2004) and is an employee of FMR (2004). Before joining Fidelity Investments, Mr. Robins worked at KPMG LLP, where he was a partner in KPMG's department of professional practice (2002-2004) and a Senior Manager (1999-2000). In addition, Mr. Robins served as Assistant Chief Accountant, United States Securities and Exchange Commission (2000-2002). |
Annual Report
Distributions
The Board of Trustees of each fund voted to pay to shareholders of record at the opening of business on record date, the following distributions per share derived from capital gains realized from sales of portfolio securities, and dividends derived from net investment income:
Fund | Pay Date | Record Date | Dividends | Capital Gains |
Equity-Income |
Initial Class | 02/14/05 | 02/11/05 | $.405 | $.890 |
Service Class | 02/14/05 | 02/11/05 | $.385 | $.890 |
Service Class 2 | 02/14/05 | 02/11/05 | $.360 | $.890 |
Asset Manager | | | | |
Initial Class | 02/11/05 | 02/11/05 | $.390 | $.005 |
Service Class | 02/11/05 | 02/11/05 | $.370 | $.005 |
Service Class 2 | 02/11/05 | 02/11/05 | $.365 | $.005 |
Contrafund | | | | |
Initial Class | 02/11/05 | 02/11/05 | $.080 | $.010 |
Serice Class | 02/11/05 | 02/11/05 | $.060 | $.010 |
Service Class 2 | 02/11/05 | 02/11/05 | $.040 | $.010 |
Overseas | | | | |
Initial Class | 02/11/05 | 02/11/05 | $.115 | $.090 |
Service Class | 02/11/05 | 02/11/05 | $.100 | $.090 |
Service Class 2 | 02/11/05 | 02/11/05 | $.090 | $.090 |
A percentage of the dividends distributed during the fiscal year for the following funds was derived from interest on U.S. Government securities which is generally exempt from state income tax:
A percentage of the dividends distributed during the fiscal year for the following funds qualifies for the dividends-received deduction for corporate shareholders:
Fund | |
Asset Manager | |
Initial Class | 29% |
Service Class | 30% |
Service Class 2 | 31% |
Contrafund | |
Initial Class | 100% |
Service Class | 100% |
Service Class 2 | 100% |
Equity-Income | |
Initial Class | 100% |
Service Class | 100% |
Service Class 2 | 100% |
Growth | |
Initial Class | 100% |
Service Class | 100% |
Service Class 2 | 100% |
Index 500 | |
Initial Class | 100% |
Service Class | 100% |
Service Class 2 | 100% |
Annual Report
Notes to Financial Statements - continued
The amounts per share which represent income derived from sources within, and taxes paid to, foreign countries or possessions of the United States are as follows:
Fund | Pay Date | Income | Taxes |
Overseas | | | |
Initial Class | 02/13/04 | $.199 | $.019 |
Service Class | 02/13/04 | $.189 | $.019 |
Service Class 2 | 02/13/04 | $.179 | $.019 |
The funds will notify shareholders in January 2005 of amounts for use in preparing 2004 income tax returns.
Annual Report
Proxy Voting Results
A special meeting of the Variable Insurance Products Fund shareholders was held on December 14, 2004. The results of votes taken among shareholders on proposals before them are reported below. Each vote reported represents one dollar of net asset value held on the record date for the meeting.
PROPOSAL 1 |
To amend the Declaration of Trust to allow the Board of Trustees, if permitted by applicable law, to authorize fund mergers without shareholder approval. A |
| # of
Votes | % of
Votes |
Affirmative | 15,331,508,529.96 | 81.853 |
Against | 2,429,553,894.02 | 12.972 |
Abstain | 969,378,618.94 | 5.175 |
TOTAL | 18,730,441,042.92 | 100.000 |
PROPOSAL 2 |
To elect a Board of Trustees. A |
| # of
Votes | % of
Votes |
J. Michael Cook |
Affirmative | 17,770,642,454.98 | 94.876 |
Withheld | 959,798,587.94 | 5.124 |
TOTAL | 18,730,441,042.92 | 100.000 |
Ralph F. Cox |
Affirmative | 17,759,356,374.26 | 94.815 |
Withheld | 971,084,668.66 | 5.185 |
TOTAL | 18,730,441,042.92 | 100.000 |
Laura B. Cronin |
Affirmative | 17,797,888,742.24 | 95.021 |
Withheld | 932,552,300.68 | 4.979 |
TOTAL | 18,730,441,042.92 | 100.000 |
Dennis J. DirksB |
Affirmative | 17,802,602,074.45 | 95.046 |
Withheld | 927,838,968.47 | 4.954 |
TOTAL | 18,730,441,042.92 | 100.000 |
Robert M. Gates |
Affirmative | 17,784,855,823.58 | 94.952 |
Withheld | 945,585,219.34 | 5.048 |
TOTAL | 18,730,441,042.92 | 100.000 |
George H. Heilmeier |
Affirmative | 17,768,875,556.56 | 94.866 |
Withheld | 961,565,486.36 | 5.134 |
TOTAL | 18,730,441,042.92 | 100.000 |
Abigail P. Johnson |
Affirmative | 17,781,929,073.06 | 94.936 |
Withheld | 948,511,969.86 | 5.064 |
TOTAL | 18,730,441,042.92 | 100.000 |
Edward C. Johnson 3d |
Affirmative | 17,752,140,336.45 | 94.777 |
Withheld | 978,300,706.47 | 5.223 |
TOTAL | 18,730,441,042.92 | 100.000 |
Donald J. Kirk |
Affirmative | 17,772,467,361.45 | 94.885 |
Withheld | 957,973,681.47 | 5.115 |
TOTAL | 18,730,441,042.92 | 100.000 |
Marie L. Knowles |
Affirmative | 17,776,922,254.30 | 94.909 |
Withheld | 953,518,788.62 | 5.091 |
TOTAL | 18,730,441,042.92 | 100.000 |
Ned C. Lautenbach |
Affirmative | 17,804,221,564.95 | 95.055 |
Withheld | 926,219,477.97 | 4.945 |
TOTAL | 18,730,441,042.92 | 100.000 |
Marvin L. Mann |
Affirmative | 17,763,277,607.06 | 94.836 |
Withheld | 967,163,435.86 | 5.164 |
TOTAL | 18,730,441,042.92 | 100.000 |
William O. McCoy |
Affirmative | 17,758,560,162.11 | 94.811 |
Withheld | 971,880,880.81 | 5.189 |
TOTAL | 18,730,441,042.92 | 100.000 |
Robert L. Reynolds |
Affirmative | 17,806,026,904.06 | 95.065 |
Withheld | 924,414,138.86 | 4.935 |
TOTAL | 18,730,441,042.92 | 100.000 |
Cornelia M. SmallB |
Affirmative | 17,798,878,892.31 | 95.026 |
Withheld | 931,562,150.61 | 4.974 |
TOTAL | 18,730,441,042.92 | 100.000 |
William S. Stavropoulos |
Affirmative | 17,786,496,107.78 | 94.960 |
Withheld | 943,944,935.14 | 5.040 |
TOTAL | 18,730,441,042.92 | 100.000 |
PROPOSAL 3 |
To approve a new sub-advisory agreement among FMR, FMR U.K., and Variable Insurance Products Fund for each of Equity-Income Portfolio and Growth Portfolio. |
Equity-Income Portfolio |
| # of
Votes | % of
Votes |
Affirmative | 6,731,293,010.62 | 89.239 |
Against | 310,929,859.15 | 4.122 |
Abstain | 500,745,863.80 | 6.639 |
TOTAL | 7,542,968,733.57 | 100.000 |
Growth Portfolio |
| # of
Votes | % of
Votes |
Affirmative | 5,975,028,070.83 | 88.802 |
Against | 315,998,524.66 | 4.696 |
Abstain | 437,489,754.25 | 6.502 |
TOTAL | 6,728,516,349.74 | 100.000 |
PROPOSAL 4 |
To approve a new sub-advisory agreement among FMR, FMR Far East, and Variable Insurance Products Fund for each of Equity-Income Portfolio and Growth Portfolio. |
Equity-Income Portfolio |
| # of
Votes | % of
Votes |
Affirmative | 6,721,558,010.15 | 89.110 |
Against | 322,563,327.80 | 4.277 |
Abstain | 498,847,395.62 | 6.613 |
TOTAL | 7,542,968,733.57 | 100.000 |
Growth Portfolio |
| # of
Votes | % of
Votes |
Affirmative | 5,967,060,487.85 | 88.683 |
Against | 322,604,636.29 | 4.795 |
Abstain | 438,851,225.60 | 6.522 |
TOTAL | 6,728,516,349.74 | 100.000 |
PROPOSAL 5 |
To approve a new amended and restated sub-advisory agreement between FMR Far East and FIJ for each of Equity-Income Portfolio and Growth Portfolio. |
Equity-Income Portfolio |
| # of
Votes | % of
Votes |
Affirmative | 6,718,405,992.36 | 89.068 |
Against | 323,955,769.99 | 4.295 |
Abstain | 500,606,971.22 | 6.637 |
TOTAL | 7,542,968,733.57 | 100.000 |
Growth Portfolio |
| # of
Votes | % of
Votes |
Affirmative | 5,952,404,198.80 | 88.465 |
Against | 333,946,456.42 | 4.963 |
Abstain | 442,165,694.52 | 6.572 |
TOTAL | 6,728,516,349.74 | 100.000 |
PROPOSAL 6 |
To approve a new master international research agreement between FMR and FIIA for each of Equity-Income Portfolio and Growth Portfolio. |
Equity-Income Portfolio |
| # of
Votes | % of
Votes |
Affirmative | 6,734,087,467.07 | 89.276 |
Against | 307,013,886.12 | 4.071 |
Abstain | 501,867,380.38 | 6.653 |
TOTAL | 7,542,968,733.57 | 100.000 |
Growth Portfolio |
| # of
Votes | % of
Votes |
Affirmative | 5,970,554,038.68 | 88.735 |
Against | 321,092,817.96 | 4.772 |
Abstain | 436,869,493.10 | 6.493 |
TOTAL | 6,728,516,349.74 | 100.000 |
PROPOSAL 7 |
To approve a new sub-research agreement between FIIA and FIIA (U.K.)L for each of Equity-Income Portfolio and Growth Portfolio. |
Equity-Income Portfolio |
| # of
Votes | % of
Votes |
Affirmative | 6,731,737,757.05 | 89.245 |
Against | 311,103,851.74 | 4.125 |
Abstain | 500,127,124.78 | 6.630 |
TOTAL | 7,542,968,733.57 | 100.000 |
Growth Portfolio |
| # of
Votes | % of
Votes |
Affirmative | 5,968,891,984.81 | 88.710 |
Against | 319,296,673.74 | 4.746 |
Abstain | 440,327,691.19 | 6.544 |
TOTAL | 6,728,516,349.74 | 100.000 |
PROPOSAL 8 |
To approve a new sub-research agreement between FIIA and FIJ for each of Equity-Income Portfolio and Growth Portfolio. |
Equity-Income Portfolio |
| # of
Votes | % of
Votes |
Affirmative | 6,739,563,050.41 | 89.349 |
Against | 309,142,220.41 | 4.098 |
Abstain | 494,263,462.75 | 6.553 |
TOTAL | 7,542,968,733.57 | 100.000 |
Growth Portfolio |
| # of
Votes | % of
Votes |
Affirmative | 5,979,761,945.37 | 88.872 |
Against | 322,291,647.58 | 4.790 |
Abstain | 426,462,756.79 | 6.338 |
TOTAL | 6,728,516,349.74 | 100.000 |
PROPOSAL 9 |
To amend the fundamental investment limitation concerning borrowing for each of Equity-Income Portfolio, Growth Portfolio, High Income Portfolio and Overseas Portfolio. |
Equity-Income Portfolio |
| # of
Votes | % of
Votes |
Affirmative | 6,685,392,791.57 | 88.631 |
Against | 416,380,211.81 | 5.520 |
Abstain | 441,195,730.19 | 5.849 |
TOTAL | 7,542,968,733.57 | 100.000 |
Growth Portfolio |
| # of
Votes | % of
Votes |
Affirmative | 5,946,204,016.89 | 88.373 |
Against | 412,358,112.36 | 6.129 |
Abstain | 369,954,220.49 | 5.498 |
TOTAL | 6,728,516,349.74 | 100.000 |
High Income Portfolio |
| # of
Votes | % of
Votes |
Affirmative | 1,451,356,817.10 | 90.478 |
Against | 59,751,642.97 | 3.725 |
Abstain | 92,989,319.11 | 5.797 |
TOTAL | 1,604,097,779.18 | 100.000 |
Overseas Portfolio |
| # of
Votes | % of
Votes |
Affirmative | 1,415,911,097.88 | 89.754 |
Against | 58,404,622.92 | 3.702 |
Abstain | 103,230,926.39 | 6.544 |
TOTAL | 1,577,546,647.19 | 100.000 |
PROPOSAL 10 |
To amend the fundamental investment limitation concerning lending for each of Equity-Income Portfolio, Growth Portfolio, High Income Portfolio and Overseas Portfolio. |
Equity-Income Portfolio |
| # of
Votes | % of
Votes |
Affirmative | 6,589,639,425.26 | 87.361 |
Against | 465,151,442.69 | 6.167 |
Abstain | 488,177,865.62 | 6.472 |
TOTAL | 7,542,968,733.57 | 100.000 |
Growth Portfolio |
| # of
Votes | % of
Votes |
Affirmative | 5,843,159,022.83 | 86.842 |
Against | 468,598,250.73 | 6.964 |
Abstain | 416,759,076.18 | 6.194 |
TOTAL | 6,728,516,349.74 | 100.000 |
High Income Portfolio |
| # of
Votes | % of
Votes |
Affirmative | 1,453,764,730.70 | 90.628 |
Against | 57,576,166.97 | 3.590 |
Abstain | 92,756,881.51 | 5.782 |
TOTAL | 1,604,097,779.18 | 100.000 |
Overseas Portfolio |
| # of
Votes | % of
Votes |
Affirmative | 1,415,760,262.71 | 89.744 |
Against | 59,625,618.33 | 3.780 |
Abstain | 102,160,766.15 | 6.476 |
TOTAL | 1,577,546,647.19 | 100.000 |
A Denotes trust-wide proposals and voting results. B Effective January 1, 2005. |
Annual Report
Proxy Voting Results
A special meeting of the Variable Insurance Products Fund II shareholders was held on December 14, 2004. The results of votes taken among shareholders on proposals before them are reported below. Each vote reported represents one dollar of net asset value held on the record date for the meeting.
PROPOSAL 1 |
To amend the Declaration of Trust to allow the Board of Trustees, if permitted by applicable law, to authorize fund mergers without shareholder approval. A |
| # of
Votes | % of
Votes |
Affirmative | 10,633,156,497.88 | 78.949 |
Against | 2,079,333,933.24 | 15.439 |
Abstain | 755,879,753.86 | 5.612 |
TOTAL | 13,468,370,184.98 | 100.000 |
PROPOSAL 2 |
To elect a Board of Trustees. A |
| # of
Votes | % of
Votes |
J. Michael Cook |
Affirmative | 12,653,134,619.02 | 93.947 |
Withheld | 815,235,565.96 | 6.053 |
TOTAL | 13,468,370,184.98 | 100.000 |
Ralph F. Cox |
Affirmative | 12,621,475,328.63 | 93.712 |
Withheld | 846,894,856.35 | 6.288 |
TOTAL | 13,468,370,184.98 | 100.000 |
Laura B. Cronin |
Affirmative | 12,672,564,623.97 | 94.091 |
Withheld | 795,805,561.01 | 5.909 |
TOTAL | 13,468,370,184.98 | 100.000 |
Dennis J. Dirks B |
Affirmative | 100,000,000.00 | 00.000 |
Withheld | 100,000,000.00 | 00.000 |
TOTAL | 13,468,370,184.98 | 100.000 |
Robert M. Gates |
Affirmative | 12,659,421,698.29 | 93.994 |
Withheld | 808,948,486.69 | 6.006 |
TOTAL | 13,468,370,184.98 | 100.000 |
George H. Heilmeier |
Affirmative | 12,643,445,665.25 | 93.875 |
Withheld | 824,924,519.73 | 6.125 |
TOTAL | 13,468,370,184.98 | 100.000 |
Abigail P. Johnson |
Affirmative | 12,656,994,867.39 | 93.976 |
Withheld | 811,375,317.59 | 6.024 |
TOTAL | 13,468,370,184.98 | 100.000 |
Edward C. Johnson 3d |
Affirmative | 12,611,555,734.60 | 93.638 |
Withheld | 856,814,450.38 | 6.362 |
TOTAL | 13,468,370,184.98 | 100.000 |
Donald J. Kirk |
Affirmative | 12,632,695,111.23 | 93.795 |
Withheld | 835,675,073.75 | 6.205 |
TOTAL | 13,468,370,184.98 | 100.000 |
Marie L. Knowles |
Affirmative | 12,674,914,386.54 | 94.109 |
Withheld | 793,455,798.44 | 5.891 |
TOTAL | 13,468,370,184.98 | 100.000 |
Ned C. Lautenbach |
Affirmative | 12,679,654,480.45 | 94.144 |
Withheld | 788,715,704.53 | 5.856 |
TOTAL | 13,468,370,184.98 | 100.000 |
Marvin L. Mann |
Affirmative | 12,631,864,234.33 | 93.789 |
Withheld | 836,505,950.65 | 6.211 |
TOTAL | 13,468,370,184.98 | 100.000 |
William O. McCoy |
Affirmative | 12,627,373,668.93 | 93.756 |
Withheld | 840,996,516.05 | 6.244 |
TOTAL | 13,468,370,184.98 | 100.000 |
Robert L. Reynolds |
Affirmative | 12,676,011,492.18 | 94.117 |
Withheld | 792,358,692.80 | 5.883 |
TOTAL | 13,468,370,184.98 | 100.000 |
Cornelia M. Small B |
Affirmative | 12,673,927,441.76 | 94.101 |
Withheld | 794,442,743.22 | 5.899 |
TOTAL | 13,468,370,184.98 | 100.000 |
William S. Stavropoulos |
Affirmative | 12,650,527,834.35 | 93.928 |
Withheld | 817,842,350.63 | 6.072 |
TOTAL | 13,468,370,184.98 | 100.000 |
PROPOSAL 3 |
To amend the fundamental investment limitation concerning lending for each of Asset Manager Portfolio, Contrafund Portfolio and Index 500 Portfolio. |
Asset Manager Portfolio |
| # of
Votes | % of
Votes |
Affirmative | 1,849,622,102.61 | 80.210 |
Against | 253,772,754.95 | 11.005 |
Abstain | 202,575,618.72 | 8.785 |
TOTAL | 2,305,970,476.28 | 100.000 |
Contrafund Portfolio |
| # of
Votes | % of
Votes |
Affirmative | 5,886,227,662.54 | 79.495 |
Against | 936,831,415.64 | 12.652 |
Abstain | 581,452,493.19 | 7.853 |
TOTAL | 7,404,511,571.37 | 100.000 |
Index 500 Portfolio |
| # of
Votes | % of
Votes |
Affirmative | 1,626,622,004.43 | 80.121 |
Against | 236,642,441.54 | 11.656 |
Abstain | 166,939,389.09 | 8.223 |
TOTAL | 2,030,203,835.06 | 100.000 |
A Denotes trust-wide proposals and voting results. B Effective January 1, 2005. |
Annual Report
Annual Report
Investment Adviser
Fidelity Management & Research Company
Boston, MA
Investment Sub-Advisers
FMR Co., Inc.
Asset Manager, Contrafund, Equity-Income, Growth,
High Income, Index 500, and Overseas Portfolios
Fidelity Investments Money Management, Inc.
Asset Manager Portfolio
Fidelity Management & Research (U.K.) Inc.
Asset Manager, Contrafund, Equity-Income,
Growth, High Income, and Overseas Portfolios
Fidelity Management & Research (Far East) Inc.
Asset Manager, Contrafund, Equity-Income,
Growth, High Income, and Overseas Portfolios
Fidelity International Investment Advisors
Asset Manager, Contrafund, Equity-Income,
Growth, High Income, and Overseas Portfolios
Fidelity International Investment Advisors (U.K.) Limited
Asset Manager, Contrafund, Equity-Income,
Growth, High Income, and Overseas Portfolios
Fidelity Investments Japan Limited
Asset Manager, Contrafund, Equity-Income,
Growth, High Income, and Overseas Portfolios
Geode Capital Management, LLC
Index 500 Portfolio
General Distributor
Fidelity Distributors Corporation
Boston, MA
Transfer and Shareholder Servicing Agent
Fidelity Investments Institutional Operations Company, Inc.
Boston, MA
Custodian
The Bank of New York, New York, NY
High Income Portfolio
JPMorgan Chase Bank, New York, NY
Asset Manager and Overseas Portfolios
Brown Brothers Harriman & Co., Boston, MA
Contrafund Portfolio
Mellon Bank, N.A., Pittsburgh, PA
Growth and Index 500 Portfolios
The Northern Trust Company, Chicago, IL
Equity-Income Portfolios
VIPGRP1-ANN-0205
1.768592.103
Fidelity® Variable Insurance Products
Asset Manager: Growth® Portfolio
Balanced Portfolio
Growth & Income Portfolio
Growth Opportunities Portfolio
Investment Grade Bond Portfolio
Mid Cap Portfolio
Money Market Portfolio
Annual Report
December 31, 2004
(2_fidelity_logos) (Registered_Trademark)
Contents
Shareholder Expense Example | 4 | An example of shareholder expenses |
Asset Manager: Growth Portfolio | 7 8 9 10 20 | Performance Management's Discussion Investment Summary Investments Financial Statements |
Balanced Portfolio | 24 25 26 27 41 | Performance Management's Discussion Investment Summary Investments Financial Statements |
Growth & Income Portfolio | 45 46 47 48 50 | Performance Management's Discussion Investment Summary Investments Financial Statements |
Growth Opportunities Portfolio | 54 55 56 57 60 | Performance Management's Discussion Investment Summary Investments Financial Statements |
Investment Grade Bond Portfolio | 64 65 66 67 76 | Performance Management's Discussion Investment Summary Investments Financial Statements |
Mid Cap Portfolio | 80 81 82 83 95 | Performance Management's Discussion Investment Summary Investments Financial Statements |
Money Market Portfolio | 99 100 101 105 | Performance Investment Summary Investments Financial Statements |
Notes to Financial Statements | 109 | Notes to the Financial Statements |
Report of Independent Registered Public Accounting Firm | 116 | |
Central Investment Portfolio Top Fifty Holdings | 120 | Top Fifty holdings of each Fidelity Central Investment Portfolio held by certain funds |
Trustees and Officers | 122 | |
Distributions | 128 | |
Proxy Voting Results | 129 | |
To view a fund's proxy voting guidelines and proxy voting record for the 12-month period ended June 30, visit www.fidelity.com/proxyvotingresults or visit the Securities and Exchange Commission's (SEC) web site at www.sec.gov. You may also call 1-800-544-5429 to request a free copy of the proxy voting guidelines.
Fidelity Variable Insurance Products are separate account options which are purchased through a variable insurance contract.
Standard & Poor's, S&P and S&P 500 are registered service marks of The McGraw-Hill Companies, Inc. and have been licensed for use by Fidelity Distributors Corporation.
Third party marks appearing herein are the property of their respective owners.
All other marks appearing herein are registered or unregistered trademarks or service marks of FMR Corp. or an affiliated company.
(Recycle graphic) This report is printed on recycled paper using soy-based inks.
This report and the financial statements contained herein are submitted for the general information of the shareholders of the funds. This report is not authorized for distribution to prospective investors in the funds unless preceded or accompanied by an effective prospectus.
A fund files its complete schedule of portfolio holdings with the SEC for the first and third quarters of each fiscal year on Form N-Q. Forms N-Q are available on the SEC's web site at http://www.sec.gov. A fund's Forms N-Q may be reviewed and copied at the SEC's Public Reference Room in Washington, DC. Information regarding the operation of the SEC's Public Reference Room may be obtained by calling 1-800-SEC-0330. For a complete list of a fund's portfolio holdings, view the most recent quarterly holdings report, semiannual report, or annual report on Fidelity's web site at http://www.advisor.fidelity.com.
NOT FDIC INSURED · MAY LOSE VALUE · NO BANK GUARANTEE
Neither the funds nor Fidelity Distributors Corporation is a bank.
Annual Report
Shareholder Expense Example
As a shareholder of a Fund, you incur two types of costs: (1) transaction costs, and (2) ongoing costs, including management fees, distribution and/or service (12b-1) fees and other Fund expenses. This Example is intended to help you understand your ongoing costs (in dollars) of investing in the Funds and to compare these costs with the ongoing costs of investing in other mutual funds.
The Example is based on an investment of $1,000 invested at the beginning of the period and held for the entire period (July 1, 2004 to December 31, 2004).
Actual Expenses
The first line of the table below for each class of each fund provides information about actual account values and actual expenses. You may use the information in this line, together with the amount you invested, to estimate the expenses that you paid over the period. Simply divide your account value by $1,000.00 (for example, an $8,600 account value divided by $1,000.00 = 8.6), then multiply the result by the number in the first line for a class of the fund under the heading entitled "Expenses Paid During Period" to estimate the expenses you paid on your account during this period. The estimate of expenses does not include any fees or other expenses of any variable annuity or variable life insurance product. If they were, the estimate of expenses you paid during the period would be higher, and your ending account value would be lower.
Hypothetical Example for Comparison Purposes
The second line of the table below for each class of each fund provides information about hypothetical account values and hypothetical expenses based on a Class' actual expense ratio and an assumed rate of return of 5% per year before expenses, which is not the Class' actual return. The hypothetical account values and expenses may not be used to estimate the actual ending account balance or expenses you paid for the period. You may use this information to compare the ongoing costs of investing in the Fund and other funds. To do so, compare this 5% hypothetical example with the 5% hypothetical examples that appear in the shareholder reports of the other funds. The estimate of expenses does not include any fees or other expenses of any variable annuity or variable life insurance product. If they were, the estimate of expenses you paid during the period would be higher, and your ending account value would be lower.
Please note that the expenses shown in the table are meant to highlight your ongoing costs only and do not reflect any transaction costs. Therefore, the second line of the table is useful in comparing ongoing costs only, and will not help you determine the relative total costs of owning different funds.
| Beginning
Account Value
July 1, 2004 | Ending
Account Value
December 31, 2004 | Expenses Paid
During Period*
July 1, 2004
to December 31, 2004 |
Asset Manager: Growth | | | |
Initial Class | | | |
Actual | $ 1,000.00 | $ 1,045.00 | $ 3.91 |
Hypothetical A | $ 1,000.00 | $ 1,021.32 | $ 3.86 |
Service Class | | | |
Actual | $ 1,000.00 | $ 1,044.40 | $ 4.57 |
Hypothetical A | $ 1,000.00 | $ 1,020.66 | $ 4.52 |
Service Class 2 | | | |
Actual | $ 1,000.00 | $ 1,043.00 | $ 5.44 |
Hypothetical A | $ 1,000.00 | $ 1,019.81 | $ 5.38 |
Balanced | | | |
Initial Class | | | |
Actual | $ 1,000.00 | $ 1,055.10 | $ 2.94 |
Hypothetical A | $ 1,000.00 | $ 1,022.27 | $ 2.90 |
Service Class | | | |
Actual | $ 1,000.00 | $ 1,054.70 | $ 3.51 |
Hypothetical A | $ 1,000.00 | $ 1,021.72 | $ 3.46 |
Service Class 2 | | | |
Actual | $ 1,000.00 | $ 1,052.60 | $ 4.28 |
Hypothetical A | $ 1,000.00 | $ 1,020.96 | $ 4.22 |
Growth & Income | | | |
Initial Class | | | |
Actual | $ 1,000.00 | $ 1,058.60 | $ 3.21 |
Hypothetical A | $ 1,000.00 | $ 1,022.02 | $ 3.15 |
Service Class | | | |
Actual | $ 1,000.00 | $ 1,059.00 | $ 3.73 |
Hypothetical A | $ 1,000.00 | $ 1,021.52 | $ 3.66 |
Service Class 2 | | | |
Actual | $ 1,000.00 | $ 1,057.90 | $ 4.50 |
Hypothetical A | $ 1,000.00 | $ 1,020.76 | $ 4.42 |
| Beginning
Account Value
July 1, 2004 | Ending
Account Value
December 31, 2004 | Expenses Paid
During Period*
July 1, 2004
to December 31, 2004 |
Growth Opportunities | | | |
Initial Class | | | |
Actual | $ 1,000.00 | $ 1,056.50 | $ 3.83 |
Hypothetical A | $ 1,000.00 | $ 1,021.42 | $ 3.76 |
Service Class | | | |
Actual | $ 1,000.00 | $ 1,055.90 | $ 4.34 |
Hypothetical A | $ 1,000.00 | $ 1,020.91 | $ 4.27 |
Service Class 2 | | | |
Actual | $ 1,000.00 | $ 1,054.90 | $ 5.17 |
Hypothetical A | $ 1,000.00 | $ 1,020.11 | $ 5.08 |
Investment Grade Bond | | | |
Initial Class | | | |
Actual | $ 1,000.00 | $ 1,044.10 | $ 2.88 |
Hypothetical A | $ 1,000.00 | $ 1,022.32 | $ 2.85 |
Service Class | | | |
Actual | $ 1,000.00 | $ 1,042.70 | $ 3.39 |
Hypothetical A | $ 1,000.00 | $ 1,021.82 | $ 3.35 |
Service Class 2 | | | |
Actual | $ 1,000.00 | $ 1,042.20 | $ 4.16 |
Hypothetical A | $ 1,000.00 | $ 1,021.06 | $ 4.12 |
Mid Cap | | | |
Initial Class | | | |
Actual | $ 1,000.00 | $ 1,176.60 | $ 3.94 |
Hypothetical A | $ 1,000.00 | $ 1,021.52 | $ 3.66 |
Service Class | | | |
Actual | $ 1,000.00 | $ 1,175.50 | $ 4.48 |
Hypothetical A | $ 1,000.00 | $ 1,021.01 | $ 4.17 |
Service Class 2 | | | |
Actual | $ 1,000.00 | $ 1,175.00 | $ 5.30 |
Hypothetical A | $ 1,000.00 | $ 1,020.26 | $ 4.93 |
Money Market | | | |
Initial Class | | | |
Actual | $ 1,000.00 | $ 1,007.40 | $ 1.46 |
Hypothetical A | $ 1,000.00 | $ 1,023.68 | $ 1.48 |
Service Class | | | |
Actual | $ 1,000.00 | $ 1,006.80 | $ 2.02 |
Hypothetical A | $ 1,000.00 | $ 1,023.13 | $ 2.03 |
Service Class 2 | | | |
Actual | $ 1,000.00 | $ 1,006.10 | $ 2.77 |
Hypothetical A | $ 1,000.00 | $ 1,022.37 | $ 2.80 |
A 5% return per year before expenses
* Expenses are equal to each Class' annualized expense ratio (shown in the table below); multiplied by the average account value over the period, multiplied by 184/366 (to reflect the one-half year period).
| Annualized
Expense Ratio |
Asset Manager: Growth | |
Initial Class | .76% |
Service Class | .89% |
Service Class 2 | 1.06% |
Balanced | |
Initial Class | .57% |
Service Class | .68% |
Service Class 2 | .83% |
| Annualized
Expense Ratio |
Growth & Income | |
Initial Class | .62% |
Service Class | .72% |
Service Class 2 | .87% |
Growth Opportunities | |
Initial Class | .74% |
Service Class | .84% |
Service Class 2 | 1.00% |
Investment Grade Bond | |
Initial Class | .56% |
Service Class | .66% |
Service Class 2 | .81% |
Mid Cap | |
Initial Class | .72% |
Service Class | .82% |
Service Class 2 | .97% |
Money Market | |
Initial Class | .29% |
Service Class | .40% |
Service Class 2 | .55% |
Annual Report
Fidelity Variable Insurance Products: Asset Manager: Growth Portfolio
Performance: The Bottom Line
Average annual total return reflects the change in the value of an investment, assuming reinvestment of the class' dividend income and capital gains (the profits earned upon the sale of securities that have grown in value) and assuming a constant rate of performance each year. During periods of reimbursement by Fidelity, a fund's total return will be greater than it would be had the reimbursement not occurred. Performance numbers are net of all underlying fund operating expenses, but do not include any insurance charges imposed by your insurance company's separate account. If performance information included the effect of these additional charges, the total returns would be lower. How a fund did yesterday is no guarantee of how it will do tomorrow.
Average Annual Total Returns
Periods ended December 31, 2004 | Past 1
year | Past 5
years | Life of fund A |
Fidelity VIP: Asset Mgr: Growth - Initial Class | 5.98% | -2.19% | 8.40% |
Fidelity VIP: Asset Mgr: Growth - Service Class B | 5.85% | -2.30% | 8.28% |
Fidelity VIP: Asset Mgr: Growth - Service Class 2 C | 5.63% | -2.48% | 8.19% |
A From January 3, 1995
B The initial offering of Service Class shares took place on November 3, 1997. Performance for Service Class shares reflects an asset-based service fee (12b-1 fee), and returns prior to November 3, 1997 are those of Initial Class and do not include the effects of Service Class' 12b-1 fee. Had Service Class shares' 12b-1 fee been reflected, returns prior to November 3, 1997 would have been lower.
C The initial offering of Service Class 2 shares took place on January 12, 2000. Performance for Service Class 2 shares reflects an asset-based service fee (12b-1 fee). Returns from November 3, 1997 to January 12, 2000 are those of Service Class which reflect a different 12b-1 fee. Service Class 2 returns prior to November 3, 1997 are those of Initial Class and do not include the effects of a 12b-1 fee. Had Service Class 2's 12b-1 fee been reflected, returns prior to January 12, 2000 would have been lower.
$10,000 Over Life of Fund
Let's say hypothetically that $10,000 was invested in Fidelity® Variable Insurance Products: Asset Manager: Growth Portfolio - Initial Class on January 3, 1995. The chart shows how the value of your investment would have changed, and also shows how the S&P 500® Index performed over the same period.
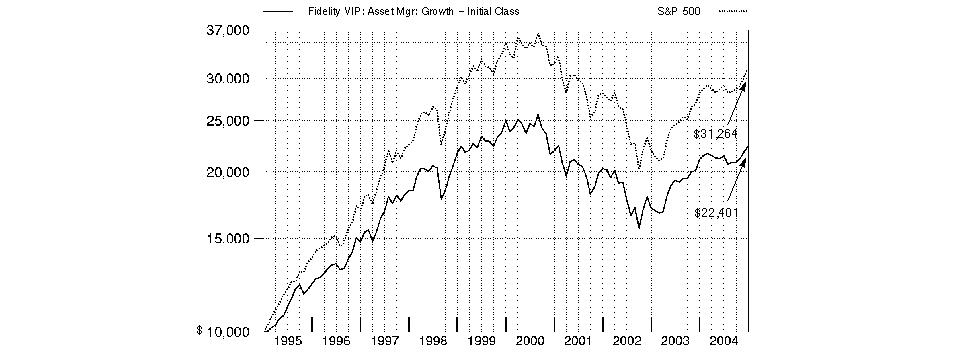
Annual Report
Fidelity Variable Insurance Products: Asset Manager: Growth Portfolio
Management's Discussion of Fund Performance
Comments from Richard Habermann and Ford O'Neil, Co-Managers of Fidelity® Variable Insurance Products: Asset Manager: Growth Portfolio
Equity and fixed-income benchmarks finished the year ending December 31, 2004, with positive returns. In the equity markets, small-cap stocks outperformed large-caps for the sixth consecutive year, as the Russell 2000® Index was up 18.33% compared to 10.88% for the larger-cap Standard & Poor's 500SM Index. Meanwhile, value stocks topped growth stocks: The Russell 3000® Value Index advanced 16.94%, compared to 6.93% for the Russell 3000 Growth Index. Elsewhere the tech-heavy NASDAQ Composite® Index returned 9.15%, thanks primarily to a 14.87% jump in the fourth quarter, and the Dow Jones Industrial AverageSM gained 5.37%. Despite five increases in short-term interest rates, the Lehman Brothers® Aggregate Bond Index rose 4.34% in 2004. While that's roughly half of the benchmark's historical average annual return, it's better than many analysts' expectations at the beginning of the period, given concerns about the potentially high levels of economic growth and subsequent inflation at the start of the year. However, economic expansion was more moderate than anticipated, and the Fed reassured investors that rate tightening would be undertaken at a measured pace.
During the past year, the fund trailed both the Fidelity Asset Manager: Growth Composite Index and the LipperSM Variable Annuity Flexible Portfolio Funds Average, which returned 8.79% and 8.25%, respectively. Disappointing stock selection was simply too much to overcome even in the face of favorable asset allocation and solid results within the fixed-income subportfolio. In an environment that favored riskier assets, the fund was rewarded relative to the index for overweighting stocks and high-yield bonds, both of which outperformed investment-grade debt. The fund's domestic equity investments trailed the S&P 500® by more than four percentage points, largely due to one major holding in media - radio broadcaster Clear Channel Communications - that stumbled badly. Unfavorable stock selection in financials and health care also hurt, led by insurance giant American International Group and large-cap pharmaceutical company Pfizer, respectively. Conversely, underweighting weak technology stocks helped, as did overweighting retailers Home Depot and pharmacy chain CVS, and energy holdings such as Diamond Offshore Drilling. In fixed income, our high-yield and investment-grade holdings easily beat the Lehman Brothers Aggregate Bond Index. The strategic cash portion of the fund topped its benchmark as well, though overweighting it curbed the fund's gains in a rising bond market.
The views expressed in this statement reflect those of the portfolio managers only through the end of the period of the report as stated on the cover and do not necessarily represent the views of Fidelity or any other person in the Fidelity organization. Any such views are subject to change at any time based upon market or other conditions and Fidelity disclaims any responsibility to update such views. These views may not be relied on as investment advice and, because investment decisions for a Fidelity fund are based on numerous factors, may not be relied on as an indication of trading intent on behalf of any Fidelity fund.
Asset Manager: Growth Portfolio
Fidelity Variable Insurance Products: Asset Manager: Growth Portfolio
Investment Summary
Top Five Stocks as of December 31, 2004 |
| % of fund's
net assets |
American International Group, Inc. | 3.6 |
Home Depot, Inc. | 3.6 |
Cardinal Health, Inc. | 3.5 |
Microsoft Corp. | 3.3 |
Fannie Mae | 2.9 |
| 16.9 |
Top Five Market Sectors as of December 31, 2004 |
(stocks only) | % of fund's
net assets |
Financials | 18.9 |
Health Care | 12.4 |
Information Technology | 11.1 |
Consumer Discretionary | 8.3 |
Industrials | 5.9 |
Asset Allocation as of December 31, 2004 |
% of fund's net assets* |
 | Stock class and
Equity Futures | 75.7% | |
 | Bond class | 14.4% | |
 | Short-term class | 9.9% | |

* Foreign investments | 10.5% |
Asset allocations in the pie chart reflect the categorization of assets as defined in the fund's prospectus in effect as of the time periods indicated above. Financial Statement categorizations conform to accounting standards and will differ from the pie chart. Percentages are adjusted for the effect of futures contracts and swap contracts, if applicable.
The information in the above table is based on the combined investments of the fund and its pro-rata share of the investments of Fidelity's fixed-income central funds.
Annual Report
Fidelity Variable Insurance Products: Asset Manager: Growth Portfolio
Investments December 31, 2004
Showing Percentage of Net Assets
Common Stocks - 72.3% |
| Shares | | Value (Note 1) |
CONSUMER DISCRETIONARY - 8.3% |
Auto Components - 0.1% |
Aisin Seiki Co. Ltd. | 5,700 | | $ 144,406 |
Exide Technologies warrants 3/18/06 (a) | 5 | | 0 |
| | 144,406 |
Automobiles - 0.1% |
Honda Motor Co. Ltd. | 4,300 | | 224,116 |
Distributors - 0.0% |
Li & Fung Ltd. | 80,000 | | 134,829 |
Hotels, Restaurants & Leisure - 0.4% |
Enterprise Inns PLC | 10,300 | | 157,141 |
Kerzner International Ltd. (a) | 2,900 | | 174,145 |
McDonald's Corp. | 27,200 | | 872,032 |
| | 1,203,318 |
Household Durables - 0.2% |
Techtronic Industries Co. Ltd. | 188,500 | | 411,058 |
Thomson SA | 9,800 | | 258,572 |
| | 669,630 |
Leisure Equipment & Products - 0.1% |
Aruze Corp. | 2,000 | | 50,962 |
Fuji Photo Film Co. Ltd. | 8,100 | | 299,538 |
| | 350,500 |
Media - 3.4% |
Antena 3 Television SA (a) | 1,100 | | 79,311 |
Clear Channel Communications, Inc. | 246,700 | | 8,261,983 |
Dow Jones & Co., Inc. | 2,920 | | 125,735 |
News Corp. Class A | 76,400 | | 1,425,624 |
SKY Perfect Communications, Inc. | 99 | | 107,283 |
Taylor Nelson Sofres PLC | 34,500 | | 149,628 |
Time Warner, Inc. (a) | 33,100 | | 643,464 |
Tv Asahi Corp. | 71 | | 144,177 |
| | 10,937,205 |
Specialty Retail - 3.9% |
Fast Retailing Co. Ltd. | 2,300 | | 175,144 |
Hennes & Mauritz AB (H&M) (B Shares) | 7,750 | | 269,964 |
Home Depot, Inc. | 265,700 | | 11,356,018 |
Ross Stores, Inc. | 4,300 | | 124,141 |
Staples, Inc. | 4,800 | | 161,808 |
TJX Companies, Inc. | 15,700 | | 394,541 |
| | 12,481,616 |
Textiles, Apparel & Luxury Goods - 0.1% |
The Swatch Group AG (Reg.) | 11,296 | | 335,078 |
TOTAL CONSUMER DISCRETIONARY | | 26,480,698 |
|
| Shares | | Value (Note 1) |
CONSUMER STAPLES - 5.5% |
Beverages - 0.5% |
PepsiCo, Inc. | 19,100 | | $ 997,020 |
Pernod-Ricard | 3,500 | | 535,091 |
| | 1,532,111 |
Food & Staples Retailing - 2.9% |
CVS Corp. | 106,600 | | 4,804,462 |
Safeway, Inc. (a) | 90,200 | | 1,780,548 |
Wal-Mart Stores, Inc. | 52,800 | | 2,788,896 |
| | 9,373,906 |
Food Products - 0.0% |
People's Food Holdings Ltd. | 201,000 | | 184,731 |
Household Products - 0.3% |
Colgate-Palmolive Co. | 9,400 | | 480,904 |
Kimberly-Clark Corp. | 1,000 | | 65,810 |
Procter & Gamble Co. | 6,300 | | 347,004 |
| | 893,718 |
Personal Products - 0.8% |
Alberto-Culver Co. | 46,500 | | 2,258,505 |
Estee Lauder Companies, Inc. Class A | 3,600 | | 164,772 |
| | 2,423,277 |
Tobacco - 1.0% |
Altria Group, Inc. | 50,600 | | 3,091,660 |
TOTAL CONSUMER STAPLES | | 17,499,403 |
ENERGY - 3.4% |
Energy Equipment & Services - 2.2% |
Diamond Offshore Drilling, Inc. (d) | 47,400 | | 1,898,370 |
ENSCO International, Inc. | 33,600 | | 1,066,464 |
GlobalSantaFe Corp. | 47,900 | | 1,585,969 |
Nabors Industries Ltd. (a) | 4,800 | | 246,192 |
Technip-Coflexip SA | 1,300 | | 239,838 |
Transocean, Inc. (a) | 44,900 | | 1,903,311 |
| | 6,940,144 |
Oil & Gas - 1.2% |
Canadian Natural Resources Ltd. | 7,300 | | 311,771 |
ChevronTexaco Corp. | 6,000 | | 315,060 |
ConocoPhillips | 18,600 | | 1,615,038 |
EnCana Corp. | 6,800 | | 387,600 |
ENI Spa | 12,600 | | 317,117 |
Exxon Mobil Corp. | 6,200 | | 317,812 |
Total SA Series B | 2,370 | | 520,642 |
| | 3,785,040 |
TOTAL ENERGY | | 10,725,184 |
FINANCIALS - 18.9% |
Capital Markets - 2.8% |
Credit Suisse Group (Reg.) | 9,448 | | 398,611 |
Goldman Sachs Group, Inc. | 17,500 | | 1,820,700 |
Common Stocks - continued |
| Shares | | Value (Note 1) |
FINANCIALS - continued |
Capital Markets - continued |
JAFCO Co. Ltd. | 3,500 | | $ 237,821 |
Julius Baer Holding AG (Bearer) | 455 | | 136,666 |
Lehman Brothers Holdings, Inc. | 6,900 | | 603,612 |
Man Group PLC | 8,000 | | 225,987 |
Matsui Securities Co. Ltd. | 3,500 | | 121,986 |
Merrill Lynch & Co., Inc. | 39,800 | | 2,378,846 |
Morgan Stanley | 38,900 | | 2,159,728 |
Nomura Holdings, Inc. | 17,000 | | 247,520 |
UBS AG (Reg.) | 8,509 | | 713,395 |
| | 9,044,872 |
Commercial Banks - 3.7% |
Banca Intesa Spa | 57,800 | | 277,566 |
Bank of America Corp. | 126,228 | | 5,931,454 |
HSBC Holdings PLC (United Kingdom) (Reg.) | 20,900 | | 355,885 |
Mitsui Trust Holdings, Inc. | 15,000 | | 149,956 |
Mizuho Financial Group, Inc. | 76 | | 382,857 |
North Fork Bancorp, Inc., New York | 11,670 | | 336,680 |
Societe Generale Series A | 4,000 | | 403,981 |
Sumitomo Mitsui Financial Group, Inc. | 63 | | 458,215 |
Synovus Financial Corp. | 22,800 | | 651,624 |
Wachovia Corp. | 39,340 | | 2,069,289 |
Wells Fargo & Co. | 10,500 | | 652,575 |
| | 11,670,082 |
Consumer Finance - 0.4% |
MBNA Corp. | 41,200 | | 1,161,428 |
SFCG Co. Ltd. | 810 | | 204,813 |
| | 1,366,241 |
Diversified Financial Services - 2.1% |
Citigroup, Inc. | 98,200 | | 4,731,276 |
ING Groep NV (Certificaten Van Aandelen) | 9,900 | | 299,475 |
J.P. Morgan Chase & Co. | 41,380 | | 1,614,234 |
| | 6,644,985 |
Insurance - 6.2% |
ACE Ltd. | 17,100 | | 731,025 |
AFLAC, Inc. | 4,800 | | 191,232 |
Allianz AG (Reg.) | 1,500 | | 199,350 |
AMBAC Financial Group, Inc. | 14,100 | | 1,158,033 |
American International Group, Inc. | 175,500 | | 11,525,083 |
Hartford Financial Services Group, Inc. | 39,800 | | 2,758,538 |
MBIA, Inc. | 14,500 | | 917,560 |
MetLife, Inc. | 29,400 | | 1,190,994 |
PartnerRe Ltd. | 5,500 | | 340,670 |
Prudential Financial, Inc. | 11,000 | | 604,560 |
| | 19,617,045 |
Thrifts & Mortgage Finance - 3.7% |
Fannie Mae | 128,300 | | 9,136,243 |
MGIC Investment Corp. | 19,000 | | 1,309,290 |
|
| Shares | | Value (Note 1) |
New York Community Bancorp, Inc. | 29,733 | | $ 611,608 |
Sovereign Bancorp, Inc. | 300 | | 6,765 |
Washington Mutual, Inc. | 19,500 | | 824,460 |
| | 11,888,366 |
TOTAL FINANCIALS | | 60,231,591 |
HEALTH CARE - 12.4% |
Biotechnology - 0.5% |
Actelion Ltd. (Reg.) (a) | 6,153 | | 630,717 |
CSL Ltd. | 21,942 | | 502,147 |
Global Bio-Chem Technology Group Co. Ltd. | 222,000 | | 145,662 |
QIAGEN NV (a) | 15,600 | | 170,820 |
| | 1,449,346 |
Health Care Equipment & Supplies - 0.3% |
Baxter International, Inc. | 21,700 | | 749,518 |
Medtronic, Inc. | 6,100 | | 302,987 |
Thermo Electron Corp. (a) | 300 | | 9,057 |
| | 1,061,562 |
Health Care Providers & Services - 3.7% |
Cardinal Health, Inc. | 193,050 | | 11,225,858 |
Henry Schein, Inc. (a) | 4,200 | | 292,488 |
Service Corp. International (SCI) (a) | 15,898 | | 118,440 |
UnitedHealth Group, Inc. | 2,500 | | 220,075 |
| | 11,856,861 |
Pharmaceuticals - 7.9% |
Barr Pharmaceuticals, Inc. (a) | 3,300 | | 150,282 |
Johnson & Johnson | 59,900 | | 3,798,858 |
Merck & Co., Inc. | 34,300 | | 1,102,402 |
Novartis AG (Reg.) | 7,274 | | 367,628 |
Novo Nordisk AS Series B | 9,000 | | 490,826 |
Pfizer, Inc. | 322,100 | | 8,661,269 |
Roche Holding AG (participation certificate) | 3,412 | | 389,874 |
Schering-Plough Corp. | 56,553 | | 1,180,827 |
Shire Pharmaceuticals Group PLC | 21,300 | | 226,845 |
Wyeth | 207,100 | | 8,820,389 |
| | 25,189,200 |
TOTAL HEALTH CARE | | 39,556,969 |
INDUSTRIALS - 5.9% |
Aerospace & Defense - 0.8% |
BAE Systems PLC | 25,300 | | 111,912 |
Lockheed Martin Corp. | 12,600 | | 699,930 |
Northrop Grumman Corp. | 9,400 | | 510,984 |
United Technologies Corp. | 10,200 | | 1,054,170 |
| | 2,376,996 |
Air Freight & Logistics - 0.0% |
Ryder System, Inc. | 2,500 | | 119,425 |
Common Stocks - continued |
| Shares | | Value (Note 1) |
INDUSTRIALS - continued |
Airlines - 0.1% |
British Airways PLC (a) | 56,300 | | $ 253,900 |
Commercial Services & Supplies - 0.3% |
Aramark Corp. Class B | 9,900 | | 262,449 |
Capita Group PLC | 22,600 | | 158,628 |
ChoicePoint, Inc. (a) | 14,300 | | 657,657 |
| | 1,078,734 |
Electrical Equipment - 0.2% |
ABB Ltd. (Reg.) (a) | 57,603 | | 321,014 |
Johnson Electric Holdings Ltd. | 161,000 | | 156,385 |
| | 477,399 |
Industrial Conglomerates - 3.7% |
General Electric Co. | 212,980 | | 7,773,770 |
Siemens AG (Reg.) | 5,800 | | 491,086 |
Tyco International Ltd. | 97,900 | | 3,498,946 |
| | 11,763,802 |
Machinery - 0.6% |
Ingersoll-Rand Co. Ltd. Class A | 20,600 | | 1,654,180 |
Invensys PLC (a) | 646,100 | | 192,184 |
Weichai Power Co. Ltd. (H Shares) | 21,000 | | 58,222 |
| | 1,904,586 |
Marine - 0.0% |
Alexander & Baldwin, Inc. | 1,300 | | 55,146 |
Road & Rail - 0.2% |
CSX Corp. | 6,700 | | 268,536 |
Union Pacific Corp. | 3,800 | | 255,550 |
| | 524,086 |
Transportation Infrastructure - 0.0% |
China Merchants Holdings International Co. Ltd. | 74,000 | | 139,474 |
TOTAL INDUSTRIALS | | 18,693,548 |
INFORMATION TECHNOLOGY - 11.1% |
Communications Equipment - 2.1% |
Alcatel SA (RFD) (a) | 60,200 | | 940,926 |
Cisco Systems, Inc. (a) | 189,402 | | 3,655,459 |
Comverse Technology, Inc. (a) | 20,900 | | 511,005 |
Lucent Technologies, Inc. warrants 12/10/07 (a) | 13,478 | | 21,295 |
Motorola, Inc. | 86,220 | | 1,482,984 |
| | 6,611,669 |
Computers & Peripherals - 1.7% |
ASUSTeK Computer, Inc. | 47,000 | | 124,929 |
Dell, Inc. (a) | 75,500 | | 3,181,570 |
Diebold, Inc. | 6,600 | | 367,818 |
Hewlett-Packard Co. | 70,700 | | 1,482,579 |
Solomon Systech Ltd. | 192,000 | | 47,427 |
Sun Microsystems, Inc. (a) | 27,700 | | 149,026 |
| | 5,353,349 |
|
| Shares | | Value (Note 1) |
Electronic Equipment & Instruments - 0.8% |
Flextronics International Ltd. (a) | 34,300 | | $ 474,026 |
Hon Hai Precision Industries Co. Ltd. | 43,000 | | 198,836 |
Hoya Corp. | 1,700 | | 192,024 |
Jabil Circuit, Inc. (a) | 19,500 | | 498,810 |
Optimax Technology Corp. | 41,000 | | 104,467 |
Sanmina-SCI Corp. (a) | 36,400 | | 308,308 |
Solectron Corp. (a) | 126,900 | | 676,377 |
Yageo Corp. (a) | 308,000 | | 110,450 |
| | 2,563,298 |
Internet Software & Services - 0.1% |
Softbank Corp. | 5,300 | | 258,196 |
IT Services - 0.5% |
Affiliated Computer Services, Inc. Class A (a) | 12,100 | | 728,299 |
First Data Corp. | 24,600 | | 1,046,484 |
| | 1,774,783 |
Semiconductors & Semiconductor Equipment - 2.2% |
Analog Devices, Inc. | 3,400 | | 125,528 |
Applied Materials, Inc. (a) | 35,900 | | 613,890 |
ASML Holding NV (a) | 16,100 | | 256,151 |
ASML Holding NV (NY Shares) (a) | 48,200 | | 766,862 |
Freescale Semiconductor, Inc. Class B | 9,630 | | 176,807 |
Intel Corp. | 140,800 | | 3,293,312 |
KLA-Tencor Corp. (a) | 9,400 | | 437,852 |
Lam Research Corp. (a) | 12,500 | | 361,375 |
Linear Technology Corp. | 3,100 | | 120,156 |
Novellus Systems, Inc. (a) | 7,900 | | 220,331 |
Taiwan Semiconductor Manufacturing Co. Ltd. sponsored ADR | 43,905 | | 372,753 |
United Microelectronics Corp. sponsored ADR (d) | 82,448 | | 291,041 |
Xilinx, Inc. | 2,100 | | 62,265 |
| | 7,098,323 |
Software - 3.7% |
BEA Systems, Inc. (a) | 59,400 | | 526,284 |
Computer Associates International, Inc. | 1,065 | | 33,079 |
Microsoft Corp. | 394,775 | | 10,544,440 |
VERITAS Software Corp. (a) | 20,800 | | 593,840 |
| | 11,697,643 |
TOTAL INFORMATION TECHNOLOGY | | 35,357,261 |
MATERIALS - 0.9% |
Chemicals - 0.1% |
Praxair, Inc. | 6,600 | | 291,390 |
Construction Materials - 0.1% |
HeidelbergCement AG | 6,746 | | 405,402 |
Metals & Mining - 0.3% |
Alcan, Inc. | 16,500 | | 808,500 |
BHP Billiton PLC | 17,500 | | 205,027 |
| | 1,013,527 |
Common Stocks - continued |
| Shares | | Value (Note 1) |
MATERIALS - continued |
Paper & Forest Products - 0.4% |
Aracruz Celulose SA sponsored ADR | 16,500 | | $ 622,050 |
Bowater, Inc. | 4,100 | | 180,277 |
International Paper Co. | 3,200 | | 134,400 |
Votorantim Celulose e Papel SA sponsored ADR (non-vtg.) | 16,500 | | 267,300 |
| | 1,204,027 |
TOTAL MATERIALS | | 2,914,346 |
TELECOMMUNICATION SERVICES - 5.3% |
Diversified Telecommunication Services - 4.8% |
BellSouth Corp. | 61,700 | | 1,714,643 |
Deutsche Telekom AG (Reg.) (a) | 25,400 | | 576,072 |
e.Biscom Spa (a) | 900 | | 51,839 |
Qwest Communications International, Inc. (a) | 310,400 | | 1,378,176 |
SBC Communications, Inc. | 344,900 | | 8,888,073 |
Telefonica SA | 14,600 | | 274,967 |
Verizon Communications, Inc. | 55,300 | | 2,240,203 |
| | 15,123,973 |
Wireless Telecommunication Services - 0.5% |
Nextel Communications, Inc. Class A (a) | 25,800 | | 774,000 |
Vodafone Group PLC | 326,000 | | 892,588 |
| | 1,666,588 |
TOTAL TELECOMMUNICATION SERVICES | | 16,790,561 |
UTILITIES - 0.6% |
Electric Utilities - 0.6% |
Entergy Corp. | 7,700 | | 520,443 |
FirstEnergy Corp. | 17,000 | | 671,670 |
PG&E Corp. (a) | 24,600 | | 818,688 |
| | 2,010,801 |
TOTAL COMMON STOCKS (Cost $202,201,296) | 230,260,362 |
Convertible Preferred Stocks - 0.1% |
| | | |
MATERIALS - 0.1% |
Paper & Forest Products - 0.1% |
International Paper Capital Trust 2.625% | 5,200 | | 260,624 |
TELECOMMUNICATION SERVICES - 0.0% |
Diversified Telecommunication Services - 0.0% |
Cincinnati Bell, Inc. Series B, 6.75% | 1,300 | | 52,975 |
TOTAL CONVERTIBLE PREFERRED STOCKS (Cost $302,688) | 313,599 |
Corporate Bonds - 1.7% |
| Principal Amount | | Value
(Note 1) |
Convertible Bonds - 0.5% |
CONSUMER DISCRETIONARY - 0.1% |
Specialty Retail - 0.1% |
Gap, Inc. 5.75% 3/15/09 (e) | | $ 180,000 | | $ 239,256 |
INDUSTRIALS - 0.4% |
Industrial Conglomerates - 0.4% |
Tyco International Group SA yankee 3.125% 1/15/23 | | 720,000 | | 1,211,184 |
INFORMATION TECHNOLOGY - 0.0% |
Communications Equipment - 0.0% |
CIENA Corp. 3.75% 2/1/08 | | 100,000 | | 88,750 |
TOTAL CONVERTIBLE BONDS | | 1,539,190 |
Nonconvertible Bonds - 1.2% |
CONSUMER DISCRETIONARY - 0.2% |
Auto Components - 0.0% |
DaimlerChrysler NA Holding Corp. 7.2% 9/1/09 | | 50,000 | | 55,651 |
Automobiles - 0.1% |
Ford Motor Co.: | | | | |
6.625% 10/1/28 | | 10,000 | | 9,327 |
7.45% 7/16/31 | | 45,000 | | 45,258 |
General Motors Corp.: | | | | |
8.25% 7/15/23 | | 90,000 | | 93,750 |
8.375% 7/15/33 | | 25,000 | | 25,902 |
| | 174,237 |
Media - 0.1% |
AOL Time Warner, Inc. 7.625% 4/15/31 | | 25,000 | | 30,244 |
Cox Communications, Inc. 7.125% 10/1/12 | | 20,000 | | 22,417 |
Liberty Media Corp. 8.25% 2/1/30 | | 40,000 | | 45,482 |
News America, Inc. 6.2% 12/15/34 (e) | | 100,000 | | 101,352 |
| | 199,495 |
TOTAL CONSUMER DISCRETIONARY | | 429,383 |
ENERGY - 0.1% |
Energy Equipment & Services - 0.0% |
Petronas Capital Ltd. 7% 5/22/12 (e) | | 55,000 | | 63,004 |
Oil & Gas - 0.1% |
Amerada Hess Corp.: | | | | |
6.65% 8/15/11 | | 5,000 | | 5,498 |
7.125% 3/15/33 | | 15,000 | | 16,493 |
7.375% 10/1/09 | | 10,000 | | 11,172 |
Empresa Nacional de Petroleo 6.75% 11/15/12 (e) | | 25,000 | | 27,801 |
Corporate Bonds - continued |
| Principal Amount | | Value
(Note 1) |
Nonconvertible Bonds - continued |
ENERGY - continued |
Oil & Gas - continued |
EnCana Holdings Finance Corp. 5.8% 5/1/14 | | $ 35,000 | | $ 37,313 |
Enterprise Products Operating LP: | | | | |
4.625% 10/15/09 (e) | | 10,000 | | 9,984 |
5.6% 10/15/14 (e) | | 5,000 | | 5,044 |
Kinder Morgan Energy Partners LP 7.125% 3/15/12 | | 15,000 | | 17,148 |
Pemex Project Funding Master Trust: | | | | |
6.125% 8/15/08 | | 50,000 | | 53,000 |
7.875% 2/1/09 (h) | | 100,000 | | 112,350 |
Williams Companies, Inc.: | | | | |
7.125% 9/1/11 | | 5,000 | | 5,463 |
7.5% 1/15/31 | | 10,000 | | 10,350 |
| | 311,616 |
TOTAL ENERGY | | 374,620 |
FINANCIALS - 0.5% |
Capital Markets - 0.1% |
Goldman Sachs Group, Inc. 6.6% 1/15/12 | | 125,000 | | 139,505 |
Merrill Lynch & Co., Inc.: | | | | |
4.125% 1/15/09 | | 75,000 | | 75,413 |
5% 1/15/15 | | 25,000 | | 24,902 |
Morgan Stanley: | | | | |
4.75% 4/1/14 | | 75,000 | | 73,081 |
6.6% 4/1/12 | | 40,000 | | 44,613 |
| | 357,514 |
Commercial Banks - 0.1% |
Bank of America Corp. 6.25% 4/15/12 | | 70,000 | | 77,308 |
Fleet Financial Group, Inc. 7.125% 4/15/06 | | 40,000 | | 41,864 |
Korea Development Bank 3.875% 3/2/09 | | 75,000 | | 74,028 |
Wachovia Corp. 4.875% 2/15/14 | | 15,000 | | 14,950 |
| | 208,150 |
Consumer Finance - 0.1% |
Capital One Bank 5% 6/15/09 | | 25,000 | | 25,743 |
Ford Motor Credit Co. 7% 10/1/13 | | 50,000 | | 53,007 |
General Motors Acceptance Corp. 6.875% 9/15/11 | | 35,000 | | 35,868 |
Household Finance Corp.: | | | | |
4.125% 11/16/09 | | 15,000 | | 14,919 |
7% 5/15/12 | | 5,000 | | 5,710 |
Household International, Inc. 8.875% 2/15/08 | | 75,000 | | 79,394 |
|
| Principal Amount | | Value
(Note 1) |
MBNA America Bank NA 6.625% 6/15/12 | | $ 30,000 | | $ 33,086 |
MBNA Corp. 7.5% 3/15/12 | | 45,000 | | 51,988 |
| | 299,715 |
Diversified Financial Services - 0.1% |
Hutchison Whampoa International 03/13 Ltd. 6.5% 2/13/13 (e) | | 10,000 | | 10,777 |
Hutchison Whampoa International 03/33 Ltd.: | | | | |
6.25% 1/24/14 (e) | | 25,000 | | 26,328 |
7.45% 11/24/33 (e) | | 15,000 | | 16,626 |
J.P. Morgan Chase & Co. 6.75% 2/1/11 | | 155,000 | | 174,128 |
| | 227,859 |
Insurance - 0.0% |
Principal Life Global Funding I 6.25% 2/15/12 (e) | | 25,000 | | 27,328 |
Real Estate - 0.1% |
EOP Operating LP 4.65% 10/1/10 | | 90,000 | | 90,411 |
Regency Centers LP 6.75% 1/15/12 | | 45,000 | | 50,211 |
Simon Property Group LP 5.625% 8/15/14 (e) | | 40,000 | | 41,424 |
| | 182,046 |
Thrifts & Mortgage Finance - 0.0% |
Countrywide Home Loans, Inc. 4% 3/22/11 | | 50,000 | | 48,613 |
Independence Community Bank Corp. 3.75% 4/1/14 (h) | | 20,000 | | 19,279 |
Washington Mutual, Inc.: | | | | |
4.375% 1/15/08 | | 20,000 | | 20,312 |
4.625% 4/1/14 | | 40,000 | | 38,242 |
| | 126,446 |
TOTAL FINANCIALS | | 1,429,058 |
INDUSTRIALS - 0.0% |
Aerospace & Defense - 0.0% |
Raytheon Co. 8.3% 3/1/10 | | 50,000 | | 59,250 |
Airlines - 0.0% |
Delta Air Lines, Inc. pass thru trust certificates 7.57% 11/18/10 | | 20,000 | | 19,728 |
TOTAL INDUSTRIALS | | 78,978 |
MATERIALS - 0.0% |
Chemicals - 0.0% |
Lubrizol Corp.: | | | | |
4.625% 10/1/09 | | 15,000 | | 14,977 |
5.5% 10/1/14 | | 5,000 | | 5,029 |
6.5% 10/1/34 | | 15,000 | | 15,277 |
| | 35,283 |
Corporate Bonds - continued |
| Principal Amount | | Value
(Note 1) |
Nonconvertible Bonds - continued |
MATERIALS - continued |
Containers & Packaging - 0.0% |
Sealed Air Corp. 5.625% 7/15/13 (e) | | $ 5,000 | | $ 5,173 |
Paper & Forest Products - 0.0% |
International Paper Co.: | | | | |
4.25% 1/15/09 | | 5,000 | | 5,018 |
5.5% 1/15/14 | | 20,000 | | 20,660 |
| | 25,678 |
TOTAL MATERIALS | | 66,134 |
TELECOMMUNICATION SERVICES - 0.2% |
Diversified Telecommunication Services - 0.2% |
AT&T Broadband Corp. 8.375% 3/15/13 | | 50,000 | | 61,655 |
Bellsouth Capital Funding Corp. 7.875% 2/15/30 | | 25,000 | | 31,139 |
BellSouth Corp. 5.2% 9/15/14 | | 25,000 | | 25,481 |
British Telecommunications PLC 8.875% 12/15/30 | | 50,000 | | 66,951 |
Deutsche Telekom International Finance BV 8.75% 6/15/30 | | 50,000 | | 66,023 |
France Telecom SA: | | | | |
8.5% 3/1/11 | | 40,000 | | 47,716 |
9.5% 3/1/31 | | 50,000 | | 67,780 |
SBC Communications, Inc.: | | | | |
6.15% 9/15/34 | | 30,000 | | 30,896 |
6.45% 6/15/34 | | 25,000 | | 26,784 |
Sprint Capital Corp. 6.875% 11/15/28 | | 25,000 | | 27,370 |
Telecom Italia Capital: | | | | |
4.95% 9/30/14 (e) | | 25,000 | | 24,493 |
5.25% 11/15/13 | | 50,000 | | 50,537 |
Telefonica Europe BV 7.75% 9/15/10 | | 25,000 | | 29,317 |
Verizon Global Funding Corp.: | | | | |
7.25% 12/1/10 | | 45,000 | | 51,556 |
7.75% 12/1/30 | | 30,000 | | 37,300 |
| | 644,998 |
Wireless Telecommunication Services - 0.0% |
America Movil SA de CV: | | | | |
4.125% 3/1/09 | | 20,000 | | 19,703 |
5.5% 3/1/14 | | 15,000 | | 14,819 |
AT&T Wireless Services, Inc. 7.875% 3/1/11 | | 5,000 | | 5,893 |
| | 40,415 |
TOTAL TELECOMMUNICATION SERVICES | | 685,413 |
|
| Principal Amount | | Value
(Note 1) |
UTILITIES - 0.2% |
Electric Utilities - 0.1% |
Cleveland Electric Illuminating Co. 5.65% 12/15/13 | | $ 30,000 | | $ 31,113 |
DTE Energy Co. 7.05% 6/1/11 | | 15,000 | | 16,985 |
Duke Capital LLC: | | | | |
6.25% 2/15/13 | | 50,000 | | 54,039 |
6.75% 2/15/32 | | 55,000 | | 59,851 |
Exelon Corp. 6.75% 5/1/11 | | 50,000 | | 55,931 |
FirstEnergy Corp. 6.45% 11/15/11 | | 5,000 | | 5,432 |
Illinois Power Co. 7.5% 6/15/09 | | 65,000 | | 73,312 |
MidAmerican Energy Holdings, Inc. 5.875% 10/1/12 | | 50,000 | | 52,982 |
Progress Energy, Inc. 7.1% 3/1/11 | | 105,000 | | 118,046 |
| | 467,691 |
Gas Utilities - 0.0% |
Consolidated Natural Gas Co. 6.85% 4/15/11 | | 25,000 | | 28,213 |
NiSource Finance Corp. 7.875% 11/15/10 | | 50,000 | | 58,779 |
| | 86,992 |
Multi-Utilities & Unregulated Power - 0.1% |
Constellation Energy Group, Inc. 7% 4/1/12 | | 50,000 | | 56,993 |
Dominion Resources, Inc.: | | | | |
6.25% 6/30/12 | | 85,000 | | 92,802 |
8.125% 6/15/10 | | 10,000 | | 11,770 |
| | 161,565 |
TOTAL UTILITIES | | 716,248 |
TOTAL NONCONVERTIBLE BONDS | | 3,779,834 |
TOTAL CORPORATE BONDS (Cost $4,633,880) | 5,319,024 |
U.S. Government and Government Agency Obligations - 2.4% |
|
U.S. Government Agency Obligations - 0.5% |
Fannie Mae: | | | | |
3.25% 8/15/08 | | 120,000 | | 118,418 |
3.25% 2/15/09 | | 270,000 | | 264,750 |
5.5% 3/15/11 | | 60,000 | | 64,341 |
6.25% 2/1/11 | | 105,000 | | 115,113 |
Freddie Mac: | | | | |
2.875% 5/15/07 | | 500,000 | | 494,899 |
3.625% 9/15/08 | | 71,000 | | 71,024 |
4% 6/12/13 | | 87,000 | | 83,093 |
U.S. Government and Government Agency Obligations - continued |
| Principal Amount | | Value
(Note 1) |
U.S. Government Agency Obligations - continued |
Freddie Mac: - continued | | | | |
5% 7/15/14 | | $ 165,000 | | $ 170,434 |
5.875% 3/21/11 | | 170,000 | | 183,540 |
TOTAL U.S. GOVERNMENT AGENCY OBLIGATIONS | | 1,565,612 |
U.S. Treasury Inflation Protected Obligations - 0.2% |
U.S. Treasury Inflation-Indexed Bonds 2.375% 1/15/25 | | 202,516 | | 216,558 |
U.S. Treasury Inflation-Indexed Notes: | | | | |
0.875% 4/15/10 | | 201,502 | | 199,542 |
2% 1/15/14 | | 413,192 | | 427,654 |
TOTAL U.S. TREASURY INFLATION PROTECTED
OBLIGATIONS | | 843,754 |
U.S. Treasury Obligations - 1.7% |
U.S. Treasury Bills, yield at date of purchase 2.21% 3/10/05 (g) | | 600,000 | | 597,712 |
U.S. Treasury Bonds: | | | | |
5.375% 2/15/31 | | 50,000 | | 54,066 |
6.25% 5/15/30 | | 200,000 | | 239,117 |
U.S. Treasury Notes: | | | | |
1.625% 2/28/06 | | 2,925,000 | | 2,885,352 |
3.125% 5/15/07 | | 125,000 | | 124,937 |
4.75% 5/15/14 | | 560,000 | | 583,581 |
6.5% 2/15/10 | | 730,000 | | 826,468 |
TOTAL U.S. TREASURY OBLIGATIONS | | 5,311,233 |
TOTAL U.S. GOVERNMENT AND GOVERNMENT AGENCY OBLIGATIONS (Cost $7,707,965) | 7,720,599 |
U.S. Government Agency -
Mortgage Securities - 2.2% |
|
Fannie Mae - 2.1% |
4% 7/1/19 | | 244,586 | | 238,916 |
4.302% 11/1/34 (h) | | 57,015 | | 57,591 |
4.5% 5/1/19 to 10/1/33 | | 1,385,596 | | 1,348,345 |
5% 7/1/18 to 6/1/34 | | 1,153,152 | | 1,163,184 |
5.5% 4/1/16 to 9/1/34 | | 1,820,206 | | 1,854,964 |
5.5% 1/1/35 (f) | | 430,000 | | 436,047 |
6% 4/1/13 to 4/1/33 | | 189,865 | | 198,878 |
6.5% 4/1/09 to 3/1/34 | | 1,240,772 | | 1,306,505 |
7.5% 5/1/24 to 2/1/28 | | 39,448 | | 42,403 |
TOTAL FANNIE MAE | | 6,646,833 |
Freddie Mac - 0.0% |
7.5% 8/1/28 | | 7,390 | | 7,947 |
|
| Principal Amount | | Value
(Note 1) |
Government National Mortgage Association - 0.1% |
6.5% 8/15/27 | | $ 89,871 | | $ 94,959 |
7% 7/15/28 to 7/15/32 | | 136,740 | | 145,486 |
7.5% 1/15/26 to 8/15/28 | | 92,005 | | 98,899 |
8.5% 11/15/30 | | 38,289 | | 41,799 |
TOTAL GOVERNMENT NATIONAL MORTGAGE
ASSOCIATION | | 381,143 |
TOTAL U.S. GOVERNMENT AGENCY - MORTGAGE SECURITIES (Cost $6,892,618) | 7,035,923 |
Asset-Backed Securities - 0.1% |
|
Ameriquest Mortgage Securities, Inc. Series 2004-R2 Class M1, 2.8475% 4/25/34 (h) | | 5,000 | | 5,000 |
Amortizing Residential Collateral Trust Series 2003-BC1 Class M2, 3.5175% 1/25/32 (h) | | 10,000 | | 10,041 |
Argent Securities, Inc. Series 2004-W5 Class M1, 3.0175% 4/25/34 (h) | | 15,000 | | 15,020 |
Capital One Multi-Asset Execution Trust: | | | | |
Series 2003-B4 Class B4, 3.2025% 7/15/11 (h) | | 25,000 | | 25,456 |
Series 2004-6 Class B, 4.15% 7/16/12 | | 40,000 | | 39,957 |
CDC Mortgage Capital Trust Series 2004-HE2 Class M2, 3.6175% 7/26/34 (h) | | 10,000 | | 10,000 |
Citibank Credit Card Issuance Trust Series 2002-C1 Class C1, 3.2% 2/9/09 (h) | | 50,000 | | 50,667 |
Countrywide Home Loans, Inc.: | | | | |
Series 2004-2 Class M1, 2.9175% 5/25/34 (h) | | 25,000 | | 25,000 |
Series 2004-4: | | | | |
Class A, 2.7875% 8/25/34 (h) | | 20,246 | | 20,239 |
Class M1, 2.8975% 7/25/34 (h) | | 25,000 | | 25,053 |
Class M2, 2.9475% 6/25/34 (h) | | 15,000 | | 15,036 |
Discover Card Master Trust I Series 2003-4 Class B1, 2.7325% 5/16/11 (h) | | 30,000 | | 30,160 |
Fremont Home Loan Trust Series 2004-A: | | | | |
Class M1, 2.9675% 1/25/34 (h) | | 25,000 | | 25,000 |
Class M2, 3.5675% 1/25/34 (h) | | 25,000 | | 25,000 |
Asset-Backed Securities - continued |
| Principal Amount | | Value (Note 1) |
Long Beach Mortgage Loan Trust Series 2004-2 Class M1, 2.9475% 6/25/34 (h) | | $ 25,000 | | $ 24,980 |
Morgan Stanley Dean Witter Capital I Trust Series 2003-NC1 Class M1, 3.4675% 11/25/32 (h) | | 10,000 | | 10,106 |
TOTAL ASSET-BACKED SECURITIES (Cost $355,800) | 356,715 |
Collateralized Mortgage Obligations - 0.1% |
|
Private Sponsor - 0.0% |
CS First Boston Mortgage Securities Corp. floater: | | | | |
Series 2004-AR3 Class 6A2, 2.7875% 4/25/34 (h) | | 13,705 | | 13,725 |
Series 2004-AR5 Class 11A2, 2.7875% 6/25/34 (h) | | 19,286 | | 19,245 |
TOTAL PRIVATE SPONSOR | | 32,970 |
U.S. Government Agency - 0.1% |
Fannie Mae planned amortization class: | | | | |
Series 1999-54 Class PH, 6.5% 11/18/29 | | 100,000 | | 106,089 |
Series 1999-57 Class PH, 6.5% 12/25/29 | | 100,000 | | 105,589 |
Fannie Mae guaranteed REMIC pass thru certificates planned amortization class Series 2004-81 Class KD, 4.5% 4/25/17 | | 75,000 | | 75,453 |
TOTAL U.S. GOVERNMENT AGENCY | | 287,131 |
TOTAL COLLATERALIZED MORTGAGE OBLIGATIONS (Cost $289,530) | 320,101 |
Commercial Mortgage Securities - 0.3% |
|
Asset Securitization Corp. sequential pay Series 1995-MD4 Class A1, 7.1% 8/13/29 | | 45,410 | | 46,878 |
Bayview Commercial Asset Trust floater Series 2004-3 Class A1, 2.7675% 1/25/35 (e)(h) | | 49,914 | | 49,914 |
CBM Funding Corp. sequential pay Series 1996-1: | | | | |
Class A3PI, 7.08% 11/1/07 | | 58,124 | | 60,949 |
Class B, 7.48% 2/1/08 | | 80,000 | | 87,230 |
|
| Principal Amount | | Value (Note 1) |
COMM: | | | | |
floater: | | | | |
Series 2002-FL7 Class D, 2.9725% 11/15/14 (e)(h) | | $ 10,000 | | $ 10,027 |
Series 2003-FL9 Class B, 2.9025% 11/15/15 (e)(h) | | 14,290 | | 14,333 |
Series 2004-LBN2 Class X2, 1.2743% 3/10/39 (e)(h)(i) | | 59,847 | | 2,552 |
CS First Boston Mortgage Securities Corp.: | | | | |
sequential pay: | | | | |
Series 1999-C1 Class A2, 7.29% 9/15/41 | | 50,000 | | 56,131 |
Series 2004-C1 Class A3, 4.321% 1/15/37 | | 20,000 | | 19,880 |
Series 1998-C1 Class D, 7.17% 5/17/40 | | 15,000 | | 16,803 |
Series 2004-C1 Class ASP, 1.0446% 1/15/37 (e)(h)(i) | | 295,000 | | 11,798 |
Deutsche Mortgage & Asset Receiving Corp. sequential pay Series 1998-C1 Class D, 7.231% 6/15/31 | | 145,000 | | 159,490 |
Fannie Mae sequential pay Series 1999-10 Class MZ, 6.5% 9/17/38 | | 43,787 | | 46,377 |
GS Mortgage Securities Corp. II: | | | | |
sequential pay Series 2001-LIBA Class A2, 6.615% 2/14/16 (e) | | 20,000 | | 22,027 |
Series 1998-GLII Class E, 7.1905% 4/13/31 (h) | | 45,000 | | 47,234 |
Leafs CMBS I Ltd./Leafs CMBS I Corp. Series 2002-1A Class B, 4.13% 11/20/37 (e) | | 100,000 | | 95,523 |
Morgan Stanley Capital I, Inc. sequential pay Series 2004-HQ3 Class A2, 4.05% 1/13/41 | | 20,000 | | 19,851 |
Thirteen Affiliates of General Growth Properties, Inc. Series 1: | | | | |
Class D2, 6.992% 11/15/07 (e) | | 140,000 | | 150,697 |
Class E2, 7.224% 11/15/07 (e) | | 100,000 | | 107,185 |
Wachovia Bank Commercial Mortgage Trust sequential pay Series 2003-C6 Class A2, 4.498% 8/15/35 | | 30,000 | | 30,427 |
TOTAL COMMERCIAL MORTGAGE SECURITIES (Cost $1,007,128) | 1,055,306 |
Foreign Government and Government Agency Obligations - 0.1% |
|
Chilean Republic: | | | | |
5.625% 7/23/07 | | 50,000 | | 52,344 |
7.125% 1/11/12 | | 15,000 | | 17,222 |
Korean Republic 4.875% 9/22/14 | | 10,000 | | 9,891 |
Foreign Government and Government Agency Obligations - continued |
| Principal Amount | | Value (Note 1) |
United Mexican States: | | | | |
5.875% 1/15/14 | | $ 20,000 | | $ 20,490 |
7.5% 4/8/33 | | 100,000 | | 108,000 |
TOTAL FOREIGN GOVERNMENT AND GOVERNMENT AGENCY OBLIGATIONS (Cost $190,982) | 207,947 |
Fixed-Income Funds - 7.7% |
| Shares | | |
Fidelity Floating Rate Central Investment Portfolio (b) | | 15,017 | | 1,500,048 |
Fidelity High Income Central Investment Portfolio 1 (b) | | 227,807 | | 22,921,904 |
TOTAL FIXED-INCOME FUNDS (Cost $22,979,335) | | 24,421,952 |
Money Market Funds - 13.3% |
| | | |
Fidelity Cash Central Fund, 2.24% (b) | | 40,132,218 | | 40,132,218 |
Fidelity Securities Lending Cash Central Fund, 2.23% (b)(c) | | 2,250,900 | | 2,250,900 |
TOTAL MONEY MARKET FUNDS (Cost $42,383,118) | | 42,383,118 |
TOTAL INVESTMENT PORTFOLIO - 100.3% (Cost $288,944,340) | | | | 319,394,646 |
NET OTHER ASSETS - (0.3)% | | | | (951,058) |
NET ASSETS - 100% | | | | $ 318,443,588 |
Futures Contracts |
| Expiration Date | | Underlying Face Amount at Value | | Unrealized Appreciation/(Depreciation) |
Purchased |
Equity Index Contracts |
33 S&P 500 Index Contracts | March 2005 | | $ 10,013,025 | | $ 68,162 |
The face value of futures purchased as a percentage of net assets - 3.1% |
Swap Agreements |
| Expiration Date | | Notional Amount | | Value |
Total Return Swap |
Receive monthly a return equal to Lehman Brothers for CMBS US Aggregate Index and pay monthly a floating rate based on 1-month LIBOR with Deutsche Bank | June 2005 | | $ 45,000 | | $ 256 |
Receive monthly a return equal to Lehman Brothers for CMBS US Aggregate Index and pay monthly a floating rate based on 1-month LIBOR with Goldman Sachs | March 2005 | | 105,000 | | 555 |
Receive monthly a return equal to Lehman Brothers for CMBS AAA 8.5+ Index and pay monthly a floating rate based on 1-month LIBOR minus 40 basis points with Lehman Brothers, Inc. | April 2005 | | 75,000 | | 776 |
Receive monthly a return equal to Lehman Brothers for CMBS U.S. Aggregate Index and pay monthly a floating rate based on 1-month LIBOR minus 10 basis points with Lehman Brothers, Inc. | May 2005 | | 500,000 | | 2,608 |
Receive quarterly a return equal to Banc of America Securities LLC AAA 10Yr Commercial Mortgage-Backed Securities Daily Index and pay quarterly a floating rate based on 3-month LIBOR minus 72 basis points with Bank of America | Jan. 2005 | | 75,000 | | (260) |
Receive quarterly a return equal to that of Banc of America Securities LLC AAA 10Yr Commercial Mortgage Backed Securities Daily Index and pay quarterly a floating rate based on 3-month LIBOR minus 30 basis points with Bank of America | May 2005 | | 100,000 | | (111) |
| | $ 900,000 | | $ 3,824 |
Legend |
(a) Non-income producing |
(b) Affiliated fund that is available only to investment companies and other accounts managed by Fidelity Investments. The rates quoted for Money Market Funds are the annualized seven-day yield of the funds at period end. A complete listing of each fund's holdings as of its most recent fiscal year end is available upon request. |
(c) Includes investment made with cash collateral received from securities on loan. |
(d) Security or a portion of the security is on loan at period end. |
(e) Security exempt from registration under Rule 144A of the Securities Act of 1933. These securities may be resold in transactions exempt from registration, normally to qualified institutional buyers. At the period end, the value of these securities amounted to $1,062,646 or 0.3% of net assets. |
(f) Security or a portion of the security purchased on a delayed delivery or when-issued basis. |
(g) Security or a portion of the security was pledged to cover margin requirements for futures contracts. At the period end, the value of securities pledged amounted to $597,712. |
(h) The coupon rate shown on floating or adjustable rate securities represents the rate at period end. |
(i) Security represents right to receive monthly interest payments on an underlying pool of mortgages. Principal shown is the par amount of the mortgage pool. |
Other Information |
Distribution of investments by country of issue, as a percentage of total net assets, is as follows: |
United States of America | 89.5% |
United Kingdom | 1.3% |
Japan | 1.1% |
France | 1.1% |
Others (individually less than 1%) | 7.0% |
| 100.0% |
The composition of credit quality ratings as a percentage of net assets is as follows (ratings are unaudited): |
U.S.Government and U.S.Government Agency Obligations | 4.5% |
AAA,AA,A | 0.4% |
BBB | 1.7% |
BB | 2.6% |
B | 3.9% |
CCC,CC,C | 0.8% |
Not Rated | 0.3% |
Equities | 75.5% |
Short-Term Investments and Net Other Assets | 10.3% |
| 100.0% |
We have used ratings from Moody's Investors Services, Inc. Where Moody's ratings are not available, we have used S&P ratings. Percentages are adjusted for the effect of futures contracts, if applicable. |
The information in the above tables are based on the combined investments of the fund and its pro-rata share of the investments of Fidelity's fixed-income central funds. |
Income Tax Information |
At December 31, 2004, the fund had a capital loss carryforward of approximately $68,822,000 of which $49,066,000, $11,142,000 and $8,614,000 will expire on December 31, 2009, 2010 and 2011, respectively. |
See accompanying notes which are an integral part of the financial statements.
Annual Report
Fidelity Variable Insurance Products: Asset Manager: Growth Portfolio
Financial Statements
Statement of Assets and Liabilities
| December 31, 2004 |
Assets | | |
Investment in securities, at value (including securities loaned of $2,187,830) (cost $288,944,340) - See accompanying schedule | | $ 319,394,646 |
Cash | | 9,751 |
Foreign currency held at value (cost $1,391,671) | | 1,458,507 |
Receivable for investments sold | | 648,684 |
Receivable for fund shares sold | | 35,216 |
Dividends receivable | | 244,103 |
Interest receivable | | 401,173 |
Swap agreements, at value | | 3,824 |
Prepaid expenses | | 1,258 |
Other receivables | | 19,690 |
Total assets | | 322,216,852 |
| | |
Liabilities | | |
Payable for investments purchased
Regular delivery | $ 681,489 | |
Delayed delivery | 437,776 | |
Payable for fund shares redeemed | 124,430 | |
Accrued management fee | 151,894 | |
Distribution fees payable | 1,822 | |
Payable for daily variation on futures contracts | 8,250 | |
Other affiliated payables | 31,597 | |
Other payables and accrued expenses | 85,106 | |
Collateral on securities loaned, at value | 2,250,900 | |
Total liabilities | | 3,773,264 |
| | |
Net Assets | | $ 318,443,588 |
Net Assets consist of: | | |
Paid in capital | | $ 351,333,781 |
Undistributed net investment income | | 7,446,942 |
Accumulated undistributed net realized gain (loss) on investments and foreign currency transactions | | (70,927,779) |
Net unrealized appreciation (depreciation) on investments and assets and liabilities in foreign currencies | | 30,590,644 |
Net Assets | | $ 318,443,588 |
Initial Class:
Net Asset Value, offering price and redemption price per share ($306,137,126 ÷ 23,949,031 shares) | | $ 12.78 |
| | |
Service Class:
Net Asset Value, offering price and redemption price per share ($5,907,146 ÷ 465,360 shares) | | $ 12.69 |
| | |
Service Class 2:
Net Asset Value, offering price and redemption price per share ($6,399,316 ÷ 507,281 shares) | | $ 12.61 |
Statement of Operations
| Year ended December 31, 2004 |
Investment Income | | |
Dividends | | $ 3,851,689 |
Special Dividends | | 1,184,325 |
Interest | | 4,527,681 |
Security lending | | 8,597 |
Total income | | 9,572,292 |
| | |
Expenses | | |
Management fee | $ 1,905,182 | |
Transfer agent fees | 232,802 | |
Distribution fees | 23,220 | |
Accounting and security lending fees | 174,697 | |
Non-interested trustees' compensation | 1,833 | |
Custodian fees and expenses | 51,136 | |
Registration fees | 5 | |
Audit | 47,631 | |
Legal | 1,517 | |
Miscellaneous | 71,114 | |
Total expenses before reductions | 2,509,137 | |
Expense reductions | (38,077) | 2,471,060 |
Net investment income (loss) | | 7,101,232 |
Realized and Unrealized Gain (Loss) Net realized gain (loss) on: | | |
Investment securities | 6,062,481 | |
Foreign currency transactions | (12,652) | |
Futures contracts | 1,002,718 | |
Swap agreements | 33,792 | |
Total net realized gain (loss) | | 7,086,339 |
Change in net unrealized appreciation (depreciation) on: Investment securities | 4,194,646 | |
Assets and liabilities in foreign currencies | 68,328 | |
Futures contracts | (328,259) | |
Swap agreements | (4,113) | |
Delayed delivery commitments | (9) | |
Total change in net unrealized appreciation (depreciation) | | 3,930,593 |
Net gain (loss) | | 11,016,932 |
Net increase (decrease) in net assets resulting from operations | | $ 18,118,164 |
See accompanying notes which are an integral part of the financial statements.
Asset Manager: Growth Portfolio
Statement of Changes in Net Assets
| Year ended
December 31,
2004 | Year ended
December 31,
2003 |
Increase (Decrease) in Net Assets | | |
Operations | | |
Net investment income (loss) | $ 7,101,232 | $ 7,266,015 |
Net realized gain (loss) | 7,086,339 | (6,943,753) |
Change in net unrealized appreciation (depreciation) | 3,930,593 | 65,516,088 |
Net increase (decrease) in net assets resulting from operations | 18,118,164 | 65,838,350 |
Distributions to shareholders from net investment income | (7,897,225) | (8,995,679) |
Share transactions - net increase (decrease) | (40,448,482) | (2,618,363) |
Total increase (decrease) in net assets | (30,227,543) | 54,224,308 |
| | |
Net Assets | | |
Beginning of period | 348,671,131 | 294,446,823 |
End of period (including undistributed net investment income of $7,446,942 and undistributed net investment income of $8,517,550, respectively) | $ 318,443,588 | $ 348,671,131 |
Other Information: |
Share Transactions | Year ended December 31, 2004 |
| Initial Class | Service Class | Service Class 2 |
Shares Sold | 1,551,941 | 19,730 | 208,638 |
Reinvested | 611,000 | 11,814 | 12,205 |
Redeemed | (5,399,771) | (112,237) | (262,595) |
Net increase (decrease) | (3,236,830) | (80,693) | (41,752) |
| | | |
Dollars Sold | $ 19,043,356 | $ 237,067 | $ 2,533,515 |
Reinvested | 7,600,835 | 146,142 | 150,249 |
Redeemed | (65,636,699) | (1,359,267) | (3,163,680) |
Net increase (decrease) | $ (38,992,508) | $ (976,058) | $ (479,916) |
| | | |
Share Transactions | Year ended December 31, 2003 |
| Initial Class | Service Class | Service Class 2 |
Shares Sold | 2,762,140 | 14,055 | 234,611 |
Reinvested | 904,884 | 18,903 | 12,490 |
Redeemed | (4,008,936) | (81,582) | (93,999) |
Net increase (decrease) | (341,912) | (48,624) | 153,102 |
| | | |
Dollars Sold | $ 30,831,473 | $ 157,481 | $ 2,571,962 |
Reinvested | 8,695,938 | 180,711 | 119,030 |
Redeemed | (43,277,864) | (881,741) | (1,015,353) |
Net increase (decrease) | $ (3,750,453) | $ (543,549) | $ 1,675,639 |
| | | |
Distributions | Year ended December 31, 2004 |
| Initial Class | Service Class | Service Class 2 |
From net investment income | $ 7,600,835 | $ 146,142 | $ 150,248 |
| | | |
| Year ended December 31, 2003 |
| Initial Class | Service Class | Service Class 2 |
From net investment income | $ 8,695,938 | $ 180,711 | $ 119,030 |
See accompanying notes which are an integral part of the financial statements.
Annual Report
Financial Highlights - Initial Class
Years ended December 31, | 2004 | 2003 | 2002 | 2001 | 2000 |
Selected Per-Share Data | | | | | |
Net asset value, beginning of period | $ 12.33 | $ 10.33 | $ 12.56 | $ 14.41 | $ 18.38 |
Income from Investment Operations | | | | | |
Net investment income (loss)C | .26D | .26 | .32 | .32 | .42 |
Net realized and unrealized gain (loss) | .47 | 2.06 | (2.23) | (1.31) | (2.52) |
Total from investment operations | .73 | 2.32 | (1.91) | (.99) | (2.10) |
Distributions from net investment income | (.28) | (.32) | (.32) | (.39) | (.37) |
Distributions from net realized gain | - | - | - | (.47) | (1.50) |
Total distributions | (.28) | (.32) | (.32) | (.86) | (1.87) |
Net asset value, end of period | $ 12.78 | $ 12.33 | $ 10.33 | $ 12.56 | $ 14.41 |
Total ReturnA,B | 5.98% | 23.34% | (15.53)% | (7.39)% | (12.47)% |
Ratios to Average Net AssetsE | | | | | |
Expenses before expense reductions | .75% | .73% | .73% | .73% | .69% |
Expenses net of voluntary waivers, if any | .75% | .73% | .73% | .73% | .69% |
Expenses net of all reductions | .74% | .72% | .69% | .72% | .68% |
Net investment income (loss) | 2.15% | 2.33% | 2.88% | 2.55% | 2.61% |
Supplemental Data | | | | | |
Net assets, end of period (000 omitted) | $ 306,137 | $ 335,285 | $ 284,298 | $ 399,273 | $ 482,165 |
Portfolio turnover rate | 57% | 65% | 149% | 111% | 147% |
A Total returns do not reflect charges attributable to your insurance company's separate account. Inclusion of these charges would reduce the total returns shown.
B Total returns would have been lower had certain expenses not been reduced during the periods shown.
C Calculated based on average shares outstanding during the period.
D Investment income per share reflects a special dividend which amounted to $.04 per share.
E Expense ratios reflect operating expenses of the class. Expenses before reductions do not reflect amounts reimbursed by the investment adviser or reductions from brokerage service arrangements or other expense offset arrangements and do not represent the amount paid by the class during periods when reimbursements or reductions occur. Expenses net of any voluntary waivers reflect expenses after reimbursement by the investment adviser but prior to reductions from brokerage service arrangements or other expense offset arrangements. Expenses net of all reductions represent the net expenses paid by the class.
Financial Highlights - Service Class
Years ended December 31, | 2004 | 2003 | 2002 | 2001 | 2000 |
Selected Per-Share Data | | | | | |
Net asset value, beginning of period | $ 12.25 | $ 10.27 | $ 12.47 | $ 14.32 | $ 18.28 |
Income from Investment Operations | | | | | |
Net investment income (loss)C | .25D | .24 | .30 | .31 | .40 |
Net realized and unrealized gain (loss) | .46 | 2.05 | (2.20) | (1.32) | (2.50) |
Total from investment operations | .71 | 2.29 | (1.90) | (1.01) | (2.10) |
Distributions from net investment income | (.27) | (.31) | (.30) | (.37) | (.36) |
Distributions from net realized gain | - | - | - | (.47) | (1.50) |
Total distributions | (.27) | (.31) | (.30) | (.84) | (1.86) |
Net asset value, end of period | $ 12.69 | $ 12.25 | $ 10.27 | $ 12.47 | $ 14.32 |
Total ReturnA,B | 5.85% | 23.15% | (15.54)% | (7.57)% | (12.54)% |
Ratios to Average Net AssetsE | | | | | |
Expenses before expense reductions | .88% | .85% | .84% | .83% | .80% |
Expenses net of voluntary waivers, if any | .88% | .85% | .84% | .83% | .80% |
Expenses net of all reductions | .87% | .84% | .80% | .82% | .79% |
Net investment income (loss) | 2.02% | 2.21% | 2.77% | 2.44% | 2.50% |
Supplemental Data | | | | | |
Net assets, end of period (000 omitted) | $ 5,907 | $ 6,692 | $ 6,105 | $ 9,542 | $ 12,449 |
Portfolio turnover rate | 57% | 65% | 149% | 111% | 147% |
A Total returns do not reflect charges attributable to your insurance company's separate account. Inclusion of these charges would reduce the total returns shown.
B Total returns would have been lower had certain expenses not been reduced during the periods shown.
C Calculated based on average shares outstanding during the period.
D Investment income per share reflects a special dividend which amounted to $.04 per share.
E Expense ratios reflect operating expenses of the class. Expenses before reductions do not reflect amounts reimbursed by the investment adviser or reductions from brokerage service arrangements or other expense offset arrangements and do not represent the amount paid by the class during periods when reimbursements or reductions occur. Expenses net of any voluntary waivers reflect expenses after reimbursement by the investment adviser but prior to reductions from brokerage service arrangements or other expense offset arrangements. Expenses net of all reductions represent the net expenses paid by the class.
See accompanying notes which are an integral part of the financial statements.
Asset Manager: Growth Portfolio
Financial Highlights - Service Class 2
Years ended December 31, | 2004 | 2003 | 2002 | 2001 | 2000G |
Selected Per-Share Data | | | | | |
Net asset value, beginning of period | $ 12.19 | $ 10.21 | $ 12.43 | $ 14.30 | $ 17.78 |
Income from Investment Operations | | | | | |
Net investment income (loss)E | .22F | .22 | .28 | .28 | .34 |
Net realized and unrealized gain (loss) | .46 | 2.05 | (2.21) | (1.30) | (1.96) |
Total from investment operations | .68 | 2.27 | (1.93) | (1.02) | (1.62) |
Distributions from net investment income | (.26) | (.29) | (.29) | (.38) | (.36) |
Distributions from net realized gain | - | - | - | (.47) | (1.50) |
Total distributions | (.26) | (.29) | (.29) | (.85) | (1.86) |
Net asset value, end of period | $ 12.61 | $ 12.19 | $ 10.21 | $ 12.43 | $ 14.30 |
Total ReturnB,C,D | 5.63% | 23.03% | (15.83)% | (7.66)% | (10.21)% |
Ratios to Average Net AssetsH | | | | | |
Expenses before expense reductions | 1.06% | 1.05% | 1.03% | 1.00% | .97%A |
Expenses net of voluntary waivers, if any | 1.06% | 1.05% | 1.03% | 1.00% | .97%A |
Expenses net of all reductions | 1.05% | 1.04% | .99% | .99% | .95%A |
Net investment income (loss) | 1.84% | 2.01% | 2.58% | 2.28% | 2.33%A |
Supplemental Data | | | | | |
Net assets, end of period (000 omitted) | $ 6,399 | $ 6,694 | $ 4,044 | $ 5,213 | $ 3,091 |
Portfolio turnover rate | 57% | 65% | 149% | 111% | 147% |
A Annualized
B Total returns for periods of less than one year are not annualized.
C Total returns do not reflect charges attributable to your insurance company's separate account. Inclusion of these charges would reduce the total returns shown.
D Total returns would have been lower had certain expenses not been reduced during the periods shown.
E Calculated based on average shares outstanding during the period.
F Investment income per share reflects a special dividend which amounted to $.04 per share.
G For the period January 12, 2000 (commencement of sale of shares) to December 31, 2000.
H Expense ratios reflect operating expenses of the class. Expenses before reductions do not reflect amounts reimbursed by the investment adviser or reductions from brokerage service arrangements or other expense offset arrangements and do not represent the amount paid by the class during periods when reimbursements or reductions occur. Expense ratios before reductions for start-up periods may not be representative of longer-term operating periods. Expenses net of any voluntary waivers reflect expenses after reimbursement by the investment adviser but prior to reductions from brokerage service arrangements or other expense offset arrangements. Expenses net of all reductions represent the net expenses paid by the class.
See accompanying notes which are an integral part of the financial statements.
Annual Report
Fidelity Variable Insurance Products: Balanced Portfolio
Performance: The Bottom Line
Average annual total return reflects the change in the value of an investment, assuming reinvestment of the class' dividend income and capital gains (the profits earned upon the sale of securities that have grown in value) and assuming a constant rate of performance each year. During periods of reimbursement by Fidelity, a fund's total return will be greater than it would be had the reimbursement not occurred. Performance numbers are net of all underlying fund operating expenses, but do not include any insurance charges imposed by your insurance company's separate account. If performance information included the effect of these additional charges, the total returns would have been lower. How a fund did yesterday is no guarantee of how it will do tomorrow.
Average Annual Total Returns
Periods ended December 31, 2004 | Past 1
year | Past 5
years | Life of fund A |
Fidelity ® VIP: Balanced - Initial Class | 5.47% | 1.32% | 7.23% |
Fidelity VIP: Balanced - Service Class B | 5.42% | 1.22% | 7.14% |
Fidelity VIP: Balanced - Service Class 2 C | 5.15% | 1.05% | 7.05% |
A From January 3, 1995.
B The initial offering of Service Class shares took place on November 3, 1997. Performance for Service Class shares reflects an asset-based service fee (12b-1 fee), and returns prior to November 3, 1997 are those of Initial Class and do not include the effects of Service Class' 12b-1 fee. Had Service Class shares' 12b-1 fee been reflected, returns prior to November 3, 1997 would have been lower.
C The initial offering of Service Class 2 shares took place on January 12, 2000. Performance for Service Class 2 shares reflects an asset-based service fee (12b-1 fee). Returns from November 3, 1997 through January 12, 2000 are those of Service Class which reflects a different 12b-1 fee. Service Class 2 returns prior to November 3, 1997 are those of Initial Class, and do not include the effects of a 12b-1 fee. Had Service Class 2's 12b-1 fee been reflected, returns prior to January 12, 2000 would have been lower.
$10,000 Over Life of Fund
Let's say hypothetically that $10,000 was invested in Fidelity® Variable Insurance Products: Balanced Portfolio - Initial Class on January 3, 1995, when the fund started. The chart shows how the value of your investment would have changed, and also shows how the S&P 500® Index performed over the same period.
Balanced Portfolio
Fidelity Variable Insurance Products: Balanced Portfolio
Management's Discussion of Fund Performance
Comments from Louis Salemy, Lead Portfolio Manager of Fidelity® Variable Insurance Products: Balanced Portfolio
Equity and fixed-income benchmarks finished the year ending December 31, 2004, with positive returns. In the equity markets, small-cap stocks outperformed large-caps for the sixth consecutive year, as the Russell 2000® Index was up 18.33% compared to 10.88% for the larger-cap Standard & Poor's 500SM Index. Meanwhile, value stocks topped growth stocks: The Russell 3000® Value Index advanced 16.94%, compared to 6.93% for the Russell 3000 Growth Index. Elsewhere, the tech-heavy NASDAQ Composite® Index returned 9.15%, thanks primarily to a 14.87% jump in the fourth quarter, and the Dow Jones Industrial AverageSM gained 5.37%. Despite five increases in short-term interest rates, the Lehman Brothers® Aggregate Bond Index rose 4.34% in 2004. While that's roughly half of the benchmark's historical average annual return, it's better than many analysts expected as 2004 began, given concerns about the potentially high levels of economic growth and subsequent inflation at the start of the year. However, the economic expansion was more moderate than anticipated, and the Fed reassured investors that rate tightening would be undertaken at a "measured pace."
For the 12 months ending December 31, 2004, the fund lagged the 8.30% return of the Fidelity Balanced 60/40 Composite Index and the 8.55% gain of the LipperSM Variable Annuity Balanced Funds Average. Unrewarding stock picking and a significant overweighting in the media industry caused the fund to underperform the index, whereas the fixed-income subportfolio helped reduce the degree of underperformance - largely on the strength of some out-of-index investments in the outperforming high-yield sector. EchoStar Communications, a detractor on the equity side, was the victim of fears about increasing competition from rival satellite TV providers and from the cable industry. Meanwhile, brokerage holdings Morgan Stanley and Merrill Lynch both were sidetracked by investors' concerns about the impact of rising interest rates on future business. On the other hand, my decision to underweight both information technology and health care helped relative performance. In the consumer staples sector, razor manufacturer Gillette was a significant contributor both in absolute terms and compared with the index. Verizon Communications also aided performance, boosted by a regulatory change that enabled the company to charge higher rates for leasing its network to competitors.
The views expressed in this statement reflect those of the portfolio manager only through the end of the period of the report as stated on the cover and do not necessarily represent the views of Fidelity or any other person in the Fidelity organization. Any such views are subject to change at any time based upon market or other conditions and Fidelity disclaims any responsibility to update such views. These views may not be relied on as investment advice and, because investment decisions for a Fidelity fund are based on numerous factors, may not be relied on as an indication of trading intent on behalf of any Fidelity fund.
Annual Report
Fidelity Variable Insurance Products: Balanced Portfolio
Investment Summary
Top Five Stocks as of December 31, 2004 |
| % of fund's net assets |
EchoStar Communications Corp. Class A | 5.1 |
Omnicom Group, Inc. | 4.6 |
BellSouth Corp. | 3.4 |
Morgan Stanley | 3.2 |
Wells Fargo & Co. | 3.2 |
| 19.5 |
Top Five Market Sectors as of December 31, 2004 |
| % of fund's net assets |
Financials | 16.7 |
Consumer Discretionary | 15.8 |
Telecommunication Services | 9.0 |
Consumer Staples | 8.7 |
Information Technology | 4.1 |
Asset Allocation as of December 31, 2004 |
% of fund's net assets* |
| Stocks | 55.9% | |
 | Bonds | 36.3% | |
 | Short-Term
Investments and
Net Other Assets | 7.7% | |
| Other Investments | 0.1% | |
* Foreign investments | 5.0% | |
Percentages are adjusted for the effect of futures contracts and swaps, if applicable. |

Balanced Portfolio
Fidelity Variable Insurance Products: Balanced Portfolio
Investments December 31, 2004
Showing Percentage of Net Assets
Common Stocks - 55.9% |
| Shares | | Value
(Note 1) |
CONSUMER DISCRETIONARY - 14.1% |
Hotels, Restaurants & Leisure - 0.4% |
Carnival Corp. unit | 21,100 | | $ 1,215,993 |
Media - 11.7% |
E.W. Scripps Co. Class A | 89,600 | | 4,325,888 |
EchoStar Communications Corp. Class A | 532,979 | | 17,716,209 |
News Corp. Class B (e) | 143,000 | | 2,745,600 |
Omnicom Group, Inc. | 190,200 | | 16,037,664 |
| | 40,825,361 |
Multiline Retail - 1.6% |
Kohl's Corp. (a) | 111,900 | | 5,502,123 |
Textiles, Apparel & Luxury Goods - 0.4% |
Liz Claiborne, Inc. | 29,000 | | 1,224,090 |
Reebok International Ltd. | 7,400 | | 325,600 |
| | 1,549,690 |
TOTAL CONSUMER DISCRETIONARY | | 49,093,167 |
CONSUMER STAPLES - 8.4% |
Beverages - 0.5% |
The Coca-Cola Co. | 44,200 | | 1,840,046 |
Food & Staples Retailing - 3.9% |
Costco Wholesale Corp. | 63,500 | | 3,074,035 |
Wal-Mart Stores, Inc. | 142,800 | | 7,542,696 |
Walgreen Co. | 75,100 | | 2,881,587 |
| | 13,498,318 |
Food Products - 0.3% |
McCormick & Co., Inc. (non-vtg.) | 30,200 | | 1,165,720 |
Household Products - 1.6% |
Colgate-Palmolive Co. | 29,800 | | 1,524,568 |
Kimberly-Clark Corp. | 59,900 | | 3,942,019 |
| | 5,466,587 |
Personal Products - 1.3% |
Gillette Co. | 101,500 | | 4,545,170 |
Tobacco - 0.8% |
Altria Group, Inc. | 48,650 | | 2,972,515 |
TOTAL CONSUMER STAPLES | | 29,488,356 |
ENERGY - 2.8% |
Oil & Gas - 2.8% |
BP PLC sponsored ADR | 49,200 | | 2,873,280 |
Exxon Mobil Corp. | 133,232 | | 6,829,472 |
| | 9,702,752 |
FINANCIALS - 14.0% |
Capital Markets - 7.4% |
Goldman Sachs Group, Inc. | 58,000 | | 6,034,320 |
|
| Shares | | Value
(Note 1) |
Merrill Lynch & Co., Inc. | 144,900 | | $ 8,660,673 |
Morgan Stanley | 205,100 | | 11,387,152 |
| | 26,082,145 |
Commercial Banks - 3.2% |
Wells Fargo & Co. | 178,200 | | 11,075,130 |
Consumer Finance - 0.6% |
American Express Co. | 35,600 | | 2,006,772 |
Insurance - 2.8% |
Allstate Corp. | 44,000 | | 2,275,680 |
American International Group, Inc. | 70,450 | | 4,626,452 |
PartnerRe Ltd. | 19,200 | | 1,189,248 |
St. Paul Travelers Companies, Inc. | 45,249 | | 1,677,380 |
| | 9,768,760 |
TOTAL FINANCIALS | | 48,932,807 |
HEALTH CARE - 1.0% |
Health Care Equipment & Supplies - 0.5% |
Alcon, Inc. | 20,800 | | 1,676,480 |
Pharmaceuticals - 0.5% |
Pfizer, Inc. | 66,900 | | 1,798,941 |
TOTAL HEALTH CARE | | 3,475,421 |
INDUSTRIALS - 2.8% |
Aerospace & Defense - 0.7% |
Lockheed Martin Corp. | 19,500 | | 1,083,225 |
Northrop Grumman Corp. | 27,800 | | 1,511,208 |
| | 2,594,433 |
Airlines - 0.3% |
Continental Airlines, Inc. Class B (a) | 75,200 | | 1,018,208 |
Industrial Conglomerates - 1.4% |
General Electric Co. | 131,800 | | 4,810,700 |
Road & Rail - 0.4% |
Union Pacific Corp. | 19,900 | | 1,338,275 |
TOTAL INDUSTRIALS | | 9,761,616 |
INFORMATION TECHNOLOGY - 3.6% |
Communications Equipment - 0.9% |
Cisco Systems, Inc. (a) | 162,500 | | 3,136,250 |
Lucent Technologies, Inc. warrants 12/10/07 (a) | 13,353 | | 21,098 |
| | 3,157,348 |
Computers & Peripherals - 0.4% |
Diebold, Inc. | 25,500 | | 1,421,115 |
IT Services - 0.4% |
Paychex, Inc. | 39,600 | | 1,349,568 |
Common Stocks - continued |
| Shares | | Value
(Note 1) |
INFORMATION TECHNOLOGY - continued |
Software - 1.9% |
Computer Associates International, Inc. | 119 | | $ 3,696 |
Microsoft Corp. | 253,700 | | 6,776,327 |
| | 6,780,023 |
TOTAL INFORMATION TECHNOLOGY | | 12,708,054 |
MATERIALS - 1.5% |
Containers & Packaging - 1.5% |
Packaging Corp. of America | 25,900 | | 609,945 |
Smurfit-Stone Container Corp. (a) | 256,623 | | 4,793,718 |
| | 5,403,663 |
TELECOMMUNICATION SERVICES - 7.4% |
Diversified Telecommunication Services - 7.4% |
BellSouth Corp. | 424,500 | | 11,796,855 |
SBC Communications, Inc. | 138,870 | | 3,578,680 |
Telewest Global, Inc. (a) | 5,008 | | 88,041 |
Verizon Communications, Inc. | 260,000 | | 10,532,600 |
| | 25,996,176 |
Wireless Telecommunication Services - 0.0% |
DigitalGlobe, Inc. (f) | 163 | | 163 |
TOTAL TELECOMMUNICATION SERVICES | | 25,996,339 |
UTILITIES - 0.3% |
Electric Utilities - 0.3% |
Entergy Corp. | 13,200 | | 892,188 |
TOTAL COMMON STOCKS (Cost $162,312,978) | 195,454,363 |
Nonconvertible Preferred Stocks - 0.0% |
| | | |
CONSUMER DISCRETIONARY - 0.0% |
Media - 0.0% |
PRIMEDIA, Inc. Series D, 10.00% | 80 | | 8,040 |
TOTAL NONCONVERTIBLE
PREFERRED STOCKS (Cost $7,680) | 8,040 |
Corporate Bonds - 11.8% |
| Principal
Amount | | |
Convertible Bonds - 0.1% |
INFORMATION TECHNOLOGY - 0.1% |
Electronic Equipment & Instruments - 0.1% |
Celestica, Inc. liquid yield option note 0% 8/1/20 | | $ 410,000 | | 227,550 |
|
| Principal
Amount | | Value
(Note 1) |
TELECOMMUNICATION SERVICES - 0.0% |
Wireless Telecommunication Services - 0.0% |
Nextel Communications, Inc. 5.25% 1/15/10 | | $ 150,000 | | $ 153,000 |
TOTAL CONVERTIBLE BONDS | | 380,550 |
Nonconvertible Bonds - 11.7% |
CONSUMER DISCRETIONARY - 1.7% |
Auto Components - 0.1% |
DaimlerChrysler NA Holding Corp. 7.2% 9/1/09 | | 150,000 | | 166,952 |
Dana Corp. 6.5% 3/1/09 | | 30,000 | | 31,650 |
Delco Remy International, Inc. 9.375% 4/15/12 | | 95,000 | | 98,325 |
Stoneridge, Inc. 11.5% 5/1/12 | | 15,000 | | 17,175 |
Tenneco Automotive, Inc. 8.625% 11/15/14 (f) | | 40,000 | | 41,500 |
Visteon Corp.: | | | | |
7% 3/10/14 | | 55,000 | | 52,388 |
8.25% 8/1/10 | | 45,000 | | 47,250 |
| | 455,240 |
Automobiles - 0.2% |
Ford Motor Co.: | | | | |
6.625% 10/1/28 | | 40,000 | | 37,310 |
7.45% 7/16/31 | | 200,000 | | 201,148 |
General Motors Corp.: | | | | |
8.25% 7/15/23 | | 415,000 | | 432,294 |
8.375% 7/15/33 | | 120,000 | | 124,330 |
| | 795,082 |
Hotels, Restaurants & Leisure - 0.3% |
Argosy Gaming Co. 7% 1/15/14 | | 40,000 | | 44,400 |
Carrols Corp. 9% 1/15/13 (f) | | 55,000 | | 56,925 |
Friendly Ice Cream Corp. 8.375% 6/15/12 | | 15,000 | | 14,700 |
Gaylord Entertainment Co. 8% 11/15/13 | | 40,000 | | 43,200 |
Host Marriott LP 7.125% 11/1/13 | | 35,000 | | 37,275 |
Landry's Seafood Restaurants, Inc. 7.5% 12/15/14 (f) | | 105,000 | | 104,606 |
Mandalay Resort Group 6.5% 7/31/09 | | 95,000 | | 99,750 |
MGM MIRAGE: | | | | |
5.875% 2/27/14 | | 90,000 | | 89,100 |
9.75% 6/1/07 | | 15,000 | | 16,725 |
Mohegan Tribal Gaming Authority 6.375% 7/15/09 | | 80,000 | | 82,700 |
Morton's Restaurant Group, Inc. 7.5% 7/1/10 | | 30,000 | | 29,250 |
NCL Corp. Ltd. 10.625% 7/15/14 (f) | | 25,000 | | 24,750 |
Penn National Gaming, Inc. 6.875% 12/1/11 | | 90,000 | | 93,600 |
Corporate Bonds - continued |
| Principal
Amount | | Value
(Note 1) |
Nonconvertible Bonds - continued |
CONSUMER DISCRETIONARY - continued |
Hotels, Restaurants & Leisure - continued |
Six Flags, Inc. 9.625% 6/1/14 | | $ 90,000 | | $ 91,125 |
Station Casinos, Inc. 6% 4/1/12 | | 60,000 | | 61,800 |
Vail Resorts, Inc. 6.75% 2/15/14 | | 40,000 | | 40,650 |
Virgin River Casino Corp./RBG LLC/B&BB, Inc. 9% 1/15/12 (f) | | 20,000 | | 20,800 |
Wynn Las Vegas LLC/ Wynn Las Vegas Capital Corp. 6.625% 12/1/14 (f) | | 130,000 | | 128,863 |
| | 1,080,219 |
Household Durables - 0.1% |
Levitz Home Furnishings, Inc. 12% 11/1/11 (f) | | 60,000 | | 61,200 |
Standard Pacific Corp. 7.75% 3/15/13 | | 150,000 | | 161,063 |
WCI Communities, Inc. 7.875% 10/1/13 | | 40,000 | | 42,100 |
| | 264,363 |
Leisure Equipment & Products - 0.0% |
K2, Inc. 7.375% 7/1/14 (f) | | 30,000 | | 32,550 |
True Temper Sports, Inc. 8.375% 9/15/11 | | 20,000 | | 18,600 |
| | 51,150 |
Media - 0.8% |
Advanstar Communications, Inc. 10.75% 8/15/10 | | 40,000 | | 45,100 |
AMC Entertainment, Inc. 9.875% 2/1/12 | | 35,000 | | 37,800 |
AOL Time Warner, Inc. 7.625% 4/15/31 | | 100,000 | | 120,976 |
Cablevision Systems Corp.: | | | | |
6.6688% 4/1/09 (f)(h) | | 90,000 | | 95,625 |
8% 4/15/12 (f) | | 130,000 | | 138,288 |
CanWest Media, Inc. 8% 9/15/12 (f) | | 30,000 | | 32,025 |
CBD Media LLC/ CBD Finance, Inc. 8.625% 6/1/11 | | 20,000 | | 21,100 |
Charter Communications Operating LLC/Charter Communications Operating Capital Corp. 8% 4/30/12 (f) | | 80,000 | | 83,400 |
Corus Entertainment, Inc. 8.75% 3/1/12 | | 240,000 | | 263,100 |
Cox Communications, Inc. 7.125% 10/1/12 | | 100,000 | | 112,086 |
CSC Holdings, Inc.: | | | | |
7.625% 4/1/11 | | 170,000 | | 183,600 |
7.625% 7/15/18 | | 20,000 | | 21,200 |
Dex Media, Inc.: | | | | |
0% 11/15/13 (d) | | 45,000 | | 35,100 |
8% 11/15/13 | | 110,000 | | 118,800 |
|
| Principal
Amount | | Value
(Note 1) |
Houghton Mifflin Co. 9.875% 2/1/13 | | $ 85,000 | | $ 92,863 |
Kabel Deutschland GmbH 10.625% 7/1/14 (f) | | 40,000 | | 46,000 |
LBI Media Holdings, Inc. 0% 10/15/13 (d) | | 90,000 | | 66,150 |
LBI Media, Inc. 10.125% 7/15/12 | | 160,000 | | 178,400 |
Liberty Media Corp. 8.25% 2/1/30 | | 100,000 | | 113,706 |
Loews Cineplex Entertainment Corp. 9% 8/1/14 (f) | | 80,000 | | 86,800 |
News America, Inc. 6.2% 12/15/34 (f) | | 250,000 | | 253,379 |
Nexstar Broadcasting, Inc. 7% 1/15/14 | | 60,000 | | 59,400 |
PanAmSat Corp. 9% 8/15/14 (f) | | 40,000 | | 44,600 |
PEI Holdings, Inc. 11% 3/15/10 | | 27,000 | | 31,455 |
PRIMEDIA, Inc. 7.625% 4/1/08 | | 235,000 | | 237,350 |
Rogers Cable, Inc. 6.75% 3/15/15 (f) | | 120,000 | | 121,950 |
Time Warner, Inc. 6.625% 5/15/29 | | 105,000 | | 113,139 |
Videotron Ltee 6.875% 1/15/14 (f) | | 110,000 | | 114,400 |
| | 2,867,792 |
Multiline Retail - 0.1% |
Dillard's, Inc. 6.69% 8/1/07 | | 125,000 | | 128,750 |
Specialty Retail - 0.1% |
Asbury Automotive Group, Inc.: | | | | |
8% 3/15/14 | | 145,000 | | 143,550 |
9% 6/15/12 | | 45,000 | | 47,363 |
Blockbuster, Inc. 9% 9/1/12 (f) | | 60,000 | | 60,000 |
Sonic Automotive, Inc. 8.625% 8/15/13 | | 90,000 | | 96,300 |
| | 347,213 |
TOTAL CONSUMER DISCRETIONARY | | 5,989,809 |
CONSUMER STAPLES - 0.3% |
Food & Staples Retailing - 0.2% |
Ahold Finance USA, Inc.: | | | | |
6.875% 5/1/29 | | 50,000 | | 48,750 |
8.25% 7/15/10 | | 120,000 | | 136,800 |
Jean Coutu Group, Inc.: | | | | |
7.625% 8/1/12 (f) | | 30,000 | | 31,725 |
8.5% 8/1/14 (f) | | 70,000 | | 71,750 |
NeighborCare, Inc. 6.875% 11/15/13 | | 75,000 | | 79,125 |
Rite Aid Corp.: | | | | |
6% 12/15/05 (f) | | 35,000 | | 35,350 |
8.125% 5/1/10 | | 60,000 | | 63,300 |
9.5% 2/15/11 | | 60,000 | | 66,000 |
Stater Brothers Holdings, Inc. 5.99% 6/15/10 (h) | | 60,000 | | 61,650 |
| | 594,450 |
Corporate Bonds - continued |
| Principal
Amount | | Value
(Note 1) |
Nonconvertible Bonds - continued |
CONSUMER STAPLES - continued |
Food Products - 0.1% |
Del Monte Corp. 9.25% 5/15/11 | | $ 145,000 | | $ 159,500 |
Doane Pet Care Co. 10.75% 3/1/10 | | 45,000 | | 48,150 |
Hines Nurseries, Inc. 10.25% 10/1/11 | | 20,000 | | 21,850 |
Reddy Ice Group, Inc. 8.875% 8/1/11 | | 20,000 | | 21,600 |
Smithfield Foods, Inc. 7% 8/1/11 (f) | | 140,000 | | 149,450 |
United Agriculture Products, Inc. 8.25% 12/15/11 (f) | | 27,000 | | 28,958 |
| | 429,508 |
Personal Products - 0.0% |
Jafra Cosmetics International, Inc./Distribuidora Comercial Jafra SA de CV 10.75% 5/15/11 | | 40,000 | | 45,200 |
Tobacco - 0.0% |
Altria Group, Inc. 7% 11/4/13 | | 110,000 | | 119,190 |
TOTAL CONSUMER STAPLES | | 1,188,348 |
ENERGY - 1.2% |
Energy Equipment & Services - 0.2% |
Grant Prideco, Inc. 9% 12/15/09 | | 20,000 | | 22,425 |
Hanover Compressor Co.: | | | | |
8.625% 12/15/10 | | 30,000 | | 32,700 |
9% 6/1/14 | | 30,000 | | 33,300 |
Hornbeck Offshore Services, Inc. 6.125% 12/1/14 (f) | | 85,000 | | 84,575 |
Petronas Capital Ltd. 7% 5/22/12 (f) | | 395,000 | | 452,484 |
Pride International, Inc. 7.375% 7/15/14 | | 40,000 | | 43,600 |
Seabulk International, Inc. 9.5% 8/15/13 | | 80,000 | | 84,800 |
| | 753,884 |
Oil & Gas - 1.0% |
Amerada Hess Corp.: | | | | |
6.65% 8/15/11 | | 25,000 | | 27,492 |
7.125% 3/15/33 | | 75,000 | | 82,467 |
7.375% 10/1/09 | | 60,000 | | 67,035 |
Belden & Blake Corp. 8.75% 7/15/12 (f) | | 20,000 | | 20,450 |
Chesapeake Energy Corp.: | | | | |
7.5% 9/15/13 | | 70,000 | | 76,213 |
7.5% 6/15/14 | | 40,000 | | 43,600 |
El Paso Corp.: | | | | |
7% 5/15/11 | | 90,000 | | 90,450 |
7.875% 6/15/12 | | 120,000 | | 124,800 |
|
| Principal
Amount | | Value
(Note 1) |
El Paso Energy Corp.: | | | | |
6.95% 12/15/07 | | $ 55,000 | | $ 57,338 |
7.375% 12/15/12 | | 30,000 | | 30,113 |
El Paso Production Holding Co. 7.75% 6/1/13 | | 180,000 | | 187,650 |
Empresa Nacional de Petroleo 6.75% 11/15/12 (f) | | 120,000 | | 133,445 |
EnCana Holdings Finance Corp. 5.8% 5/1/14 | | 80,000 | | 85,287 |
Enterprise Products Operating LP: | | | | |
4.625% 10/15/09 (f) | | 45,000 | | 44,929 |
5.6% 10/15/14 (f) | | 30,000 | | 30,266 |
General Maritime Corp. 10% 3/15/13 | | 120,000 | | 138,000 |
Kinder Morgan Energy Partners LP 7.125% 3/15/12 | | 70,000 | | 80,026 |
Overseas Shipholding Group, Inc. 8.25% 3/15/13 | | 110,000 | | 122,375 |
Pemex Project Funding Master Trust: | | | | |
6.125% 8/15/08 | | 400,000 | | 424,000 |
7.875% 2/1/09 (h) | | 180,000 | | 202,230 |
Plains Exploration & Production Co.: | | | | |
7.125% 6/15/14 | | 40,000 | | 43,800 |
8.75% 7/1/12 | | 60,000 | | 67,125 |
Range Resources Corp. 7.375% 7/15/13 | | 110,000 | | 117,700 |
Ship Finance International Ltd. 8.5% 12/15/13 | | 360,000 | | 370,800 |
Stone Energy Corp. 6.75% 12/15/14 (f) | | 20,000 | | 19,800 |
Teekay Shipping Corp. 8.875% 7/15/11 | | 100,000 | | 116,000 |
The Coastal Corp.: | | | | |
6.5% 5/15/06 | | 15,000 | | 15,506 |
6.5% 6/1/08 | | 75,000 | | 75,375 |
7.5% 8/15/06 | | 90,000 | | 94,950 |
7.625% 9/1/08 | | 10,000 | | 10,388 |
7.75% 6/15/10 | | 35,000 | | 36,575 |
Venoco, Inc. 8.75% 12/15/11 (f) | | 60,000 | | 61,800 |
Williams Companies, Inc.: | | | | |
7.125% 9/1/11 | | 125,000 | | 136,563 |
7.5% 1/15/31 | | 10,000 | | 10,350 |
7.625% 7/15/19 | | 105,000 | | 114,450 |
8.75% 3/15/32 | | 25,000 | | 28,750 |
| | 3,388,098 |
TOTAL ENERGY | | 4,141,982 |
FINANCIALS - 2.7% |
Capital Markets - 0.7% |
BCP Caylux Holdings Luxembourg SCA 9.625% 6/15/14 (f) | | 150,000 | | 168,000 |
Equinox Holdings Ltd. 9% 12/15/09 | | 20,000 | | 21,200 |
Corporate Bonds - continued |
| Principal
Amount | | Value
(Note 1) |
Nonconvertible Bonds - continued |
FINANCIALS - continued |
Capital Markets - continued |
Goldman Sachs Group, Inc.: | | | | |
5.25% 10/15/13 | | $ 500,000 | | $ 511,550 |
6.6% 1/15/12 | | 410,000 | | 457,576 |
Merrill Lynch & Co., Inc.: | | | | |
4.125% 1/15/09 | | 700,000 | | 703,855 |
5% 1/15/15 | | 25,000 | | 24,902 |
Morgan Stanley: | | | | |
3.875% 1/15/09 | | 500,000 | | 497,221 |
4.75% 4/1/14 | | 75,000 | | 73,081 |
6.6% 4/1/12 | | 160,000 | | 178,451 |
| | 2,635,836 |
Commercial Banks - 0.3% |
Bank of America Corp.: | | | | |
6.25% 4/15/12 | | 125,000 | | 138,051 |
7.4% 1/15/11 | | 155,000 | | 179,549 |
Fleet Financial Group, Inc. 7.125% 4/15/06 | | 140,000 | | 146,523 |
Korea Development Bank 3.875% 3/2/09 | | 250,000 | | 246,759 |
PNC Funding Corp. 5.75% 8/1/06 | | 155,000 | | 160,742 |
Wachovia Corp. 4.875% 2/15/14 | | 90,000 | | 89,701 |
Wells Fargo & Co. 4.2% 1/15/10 | | 45,000 | | 45,183 |
| | 1,006,508 |
Consumer Finance - 0.4% |
Capital One Bank 5% 6/15/09 | | 250,000 | | 257,427 |
Ford Motor Credit Co. 7% 10/1/13 | | 275,000 | | 291,536 |
General Motors Acceptance Corp. 6.875% 9/15/11 | | 115,000 | | 117,851 |
Household Finance Corp. 4.125% 11/16/09 | | 300,000 | | 298,387 |
Household International, Inc. 8.875% 2/15/08 | | 150,000 | | 158,787 |
MBNA Corp.: | | | | |
6.25% 1/17/07 | | 120,000 | | 126,268 |
7.5% 3/15/12 | | 175,000 | | 202,177 |
| | 1,452,433 |
Diversified Financial Services - 0.7% |
Alliance Capital Management LP 5.625% 8/15/06 | | 150,000 | | 155,022 |
BRL Universal Equipment 2001 A LP/BRL Universal Equipment Corp. 8.875% 2/15/08 | | 120,000 | | 127,200 |
Charter Communications Holdings LLC/Charter Communications Holdings Capital Corp.: | | | | |
0% 5/15/11 (d) | | 116,000 | | 85,260 |
9.625% 11/15/09 | | 170,000 | | 148,750 |
|
| Principal
Amount | | Value
(Note 1) |
CMS Energy X-TRAS pass thru trust certificates 7% 1/15/05 | | $ 75,000 | | $ 75,000 |
Couche Tard U.S. LP /Couche Tard Financing Corp. 7.5% 12/15/13 | | 70,000 | | 75,950 |
Dex Media West LLC/Dex Media West Finance Co. 9.875% 8/15/13 | | 39,000 | | 44,850 |
Gerdau AmeriSteel Corp./GUSAP Partners 10.375% 7/15/11 | | 130,000 | | 152,750 |
Hutchison Whampoa International 03/13 Ltd. 6.5% 2/13/13 (f) | | 55,000 | | 59,273 |
Hutchison Whampoa International 03/33 Ltd.: | | | | |
6.25% 1/24/14 (f) | | 120,000 | | 126,372 |
7.45% 11/24/33 (f) | | 85,000 | | 94,213 |
J.P. Morgan Chase & Co. 6.75% 2/1/11 | | 635,000 | | 713,363 |
National Beef Packing Co. LLC/National Beef Finance Corp. 10.5% 8/1/11 | | 105,000 | | 108,675 |
Refco Finance Holdings LLC/Refco Finance, Inc. 9% 8/1/12 (f) | | 100,000 | | 109,000 |
U.S. West Capital Funding, Inc. 6.375% 7/15/08 | | 45,000 | | 44,438 |
UGS Corp. 10% 6/1/12 (f) | | 35,000 | | 39,725 |
Universal City Development Partners Ltd./UCDP Finance, Inc. 11.75% 4/1/10 | | 80,000 | | 94,700 |
Universal City Florida Holding Co. I/II 7.2% 5/1/10 (f)(h) | | 40,000 | | 41,500 |
| | 2,296,041 |
Insurance - 0.1% |
Principal Life Global Funding I 6.25% 2/15/12 (f) | | 85,000 | | 92,915 |
Provident Companies, Inc.: | | | | |
7% 7/15/18 | | 10,000 | | 9,650 |
7.25% 3/15/28 | | 15,000 | | 14,194 |
UnumProvident Corp.: | | | | |
6.75% 12/15/28 | | 65,000 | | 57,525 |
7.625% 3/1/11 | | 55,000 | | 57,613 |
| | 231,897 |
Real Estate - 0.3% |
BRE Properties, Inc. 5.95% 3/15/07 | | 250,000 | | 260,509 |
EOP Operating LP: | | | | |
4.65% 10/1/10 | | 200,000 | | 200,914 |
7% 7/15/11 | | 200,000 | | 225,549 |
Senior Housing Properties Trust: | | | | |
7.875% 4/15/15 | | 40,000 | | 44,000 |
8.625% 1/15/12 | | 80,000 | | 91,400 |
Simon Property Group LP 5.625% 8/15/14 (f) | | 200,000 | | 207,122 |
| | 1,029,494 |
Corporate Bonds - continued |
| Principal
Amount | | Value
(Note 1) |
Nonconvertible Bonds - continued |
FINANCIALS - continued |
Thrifts & Mortgage Finance - 0.2% |
Countrywide Home Loans, Inc. 4% 3/22/11 | | $ 250,000 | | $ 243,065 |
Independence Community Bank Corp. 3.75% 4/1/14 (h) | | 95,000 | | 91,573 |
Washington Mutual, Inc.: | | | | |
4.375% 1/15/08 | | 90,000 | | 91,403 |
4.625% 4/1/14 | | 200,000 | | 191,211 |
| | 617,252 |
TOTAL FINANCIALS | | 9,269,461 |
HEALTH CARE - 0.4% |
Health Care Providers & Services - 0.3% |
AmeriPath, Inc. 10.5% 4/1/13 | | 105,000 | | 111,563 |
Community Health Systems, Inc. 6.5% 12/15/12 (f) | | 60,000 | | 60,450 |
HCA, Inc. 6.375% 1/15/15 | | 70,000 | | 70,150 |
IASIS Healthcare LLC/IASIS Capital Corp. 8.75% 6/15/14 | | 130,000 | | 141,869 |
National Nephrology Associates, Inc. 9% 11/1/11 (f) | | 30,000 | | 34,725 |
Psychiatric Solutions, Inc. 10.625% 6/15/13 | | 45,000 | | 52,088 |
Rotech Healthcare, Inc. 9.5% 4/1/12 | | 75,000 | | 82,125 |
Tenet Healthcare Corp.: | | | | |
6.375% 12/1/11 | | 65,000 | | 59,800 |
7.375% 2/1/13 | | 150,000 | | 146,250 |
9.875% 7/1/14 (f) | | 70,000 | | 76,125 |
U.S. Oncology, Inc.: | | | | |
9% 8/15/12 (f) | | 170,000 | | 187,850 |
10.75% 8/15/14 (f) | | 50,000 | | 57,250 |
| | 1,080,245 |
Pharmaceuticals - 0.1% |
Elan Finance PLC/Elan Finance Corp. 7.75% 11/15/11 (f) | | 160,000 | | 171,200 |
TOTAL HEALTH CARE | | 1,251,445 |
INDUSTRIALS - 0.8% |
Aerospace & Defense - 0.1% |
BE Aerospace, Inc.: | | | | |
8% 3/1/08 | | 65,000 | | 65,000 |
8.875% 5/1/11 | | 25,000 | | 26,125 |
Bombardier, Inc. 6.3% 5/1/14 (f) | | 200,000 | | 173,500 |
Raytheon Co. 8.3% 3/1/10 | | 150,000 | | 177,749 |
| | 442,374 |
|
| Principal
Amount | | Value
(Note 1) |
Airlines - 0.3% |
American Airlines, Inc. pass thru trust certificates: | | | | |
6.817% 5/23/11 | | $ 115,000 | | $ 108,100 |
7.377% 5/23/19 | | 95,503 | | 66,852 |
7.379% 5/23/16 | | 67,347 | | 47,143 |
7.8% 4/1/08 | | 50,000 | | 46,500 |
8.608% 10/1/12 | | 75,000 | | 70,125 |
10.18% 1/2/13 | | 45,000 | | 35,100 |
Continental Airlines, Inc. pass thru trust certificates: | | | | |
6.9% 7/2/18 | | 18,985 | | 15,947 |
7.568% 12/1/06 | | 20,000 | | 16,200 |
8.312% 10/2/12 | | 20,167 | | 15,529 |
8.321% 11/1/06 | | 10,000 | | 9,700 |
Delta Air Lines, Inc. 9.5% 11/18/08 (f) | | 19,000 | | 17,813 |
Delta Air Lines, Inc. pass thru trust certificates: | | | | |
7.299% 9/18/06 | | 1,000 | | 800 |
7.57% 11/18/10 | | 45,000 | | 44,388 |
7.779% 1/2/12 | | 354,807 | | 230,625 |
7.92% 5/18/12 | | 75,000 | | 57,750 |
Northwest Airlines, Inc. 7.875% 3/15/08 | | 255,000 | | 206,550 |
Northwest Airlines, Inc. pass thru trust certificates: | | | | |
7.068% 7/2/17 | | 24,306 | | 21,876 |
7.626% 4/1/10 | | 72,130 | | 59,868 |
7.67% 1/2/15 | | 21,263 | | 18,552 |
| | 1,089,418 |
Building Products - 0.1% |
Building Materials Corp. of America 7.75% 8/1/14 (f) | | 80,000 | | 80,000 |
Mueller Group, Inc. 6.91% 11/1/11 (h) | | 80,000 | | 82,800 |
Nortek, Inc. 8.5% 9/1/14 (f) | | 90,000 | | 94,050 |
| | 256,850 |
Commercial Services & Supplies - 0.1% |
Allied Waste North America, Inc.: | | | | |
5.75% 2/15/11 | | 40,000 | | 37,600 |
6.375% 4/15/11 | | 40,000 | | 38,000 |
7.625% 1/1/06 | | 30,000 | | 30,975 |
| | 106,575 |
Machinery - 0.2% |
Cummins, Inc. 9.5% 12/1/10 (h) | | 50,000 | | 56,500 |
Dresser-Rand Group, Inc. 7.375% 11/1/14 (f) | | 40,000 | | 40,700 |
Invensys PLC 9.875% 3/15/11 (f) | | 180,000 | | 194,400 |
Park-Ohio Industries, Inc. 8.375% 11/15/14 (f) | | 40,000 | | 39,900 |
Corporate Bonds - continued |
| Principal
Amount | | Value
(Note 1) |
Nonconvertible Bonds - continued |
INDUSTRIALS - continued |
Machinery - continued |
Terex Corp.: | | | | |
7.375% 1/15/14 | | $ 20,000 | | $ 21,300 |
9.25% 7/15/11 | | 195,000 | | 218,888 |
| | 571,688 |
Marine - 0.0% |
H-Lines Finance Holding Corp. 0% 4/1/13 (d)(f) | | 30,000 | | 21,825 |
OMI Corp. 7.625% 12/1/13 | | 45,000 | | 48,150 |
| | 69,975 |
Road & Rail - 0.0% |
TFM SA de CV yankee: | | | | |
10.25% 6/15/07 | | 20,000 | | 21,400 |
11.75% 6/15/09 | | 60,000 | | 60,900 |
| | 82,300 |
TOTAL INDUSTRIALS | | 2,619,180 |
INFORMATION TECHNOLOGY - 0.4% |
Communications Equipment - 0.1% |
L-3 Communications Corp. 6.125% 1/15/14 | | 70,000 | | 72,100 |
Lucent Technologies, Inc.: | | | | |
6.45% 3/15/29 | | 70,000 | | 63,700 |
6.5% 1/15/28 | | 30,000 | | 27,000 |
Nortel Networks Corp. 6.125% 2/15/06 | | 80,000 | | 81,700 |
| | 244,500 |
Electronic Equipment & Instruments - 0.1% |
Celestica, Inc. 7.875% 7/1/11 | | 200,000 | | 214,000 |
Flextronics International Ltd. 6.5% 5/15/13 | | 20,000 | | 20,400 |
Sanmina-SCI Corp. 10.375% 1/15/10 | | 85,000 | | 97,325 |
Solectron Corp. 7.375% 3/1/06 | | 115,000 | | 118,594 |
| | 450,319 |
IT Services - 0.0% |
Iron Mountain, Inc. 6.625% 1/1/16 | | 50,000 | | 46,750 |
Office Electronics - 0.0% |
Xerox Corp.: | | | | |
7.125% 6/15/10 | | 60,000 | | 64,800 |
7.625% 6/15/13 | | 70,000 | | 77,000 |
| | 141,800 |
Semiconductors & Semiconductor Equipment - 0.2% |
Freescale Semiconductor, Inc.: | | | | |
4.82% 7/15/09 (h) | | 70,000 | | 73,150 |
6.875% 7/15/11 | | 80,000 | | 85,800 |
|
| Principal
Amount | | Value
(Note 1) |
7.125% 7/15/14 | | $ 80,000 | | $ 86,800 |
MagnaChip Semiconductor SA/MagnaChip Semiconductor Finance Co.: | | | | |
5.78% 12/15/11 (f)(h) | | 30,000 | | 30,788 |
6.875% 12/15/11 (f) | | 40,000 | | 41,200 |
8% 12/15/14 (f) | | 20,000 | | 20,850 |
Semiconductor Note Participation Trust 0% 8/4/11 (f) | | 105,000 | | 157,500 |
Viasystems, Inc. 10.5% 1/15/11 | | 80,000 | | 78,400 |
| | 574,488 |
TOTAL INFORMATION TECHNOLOGY | | 1,457,857 |
MATERIALS - 1.1% |
Chemicals - 0.3% |
America Rock Salt Co. LLC 9.5% 3/15/14 | | 50,000 | | 52,250 |
Berry Plastics Corp. 10.75% 7/15/12 | | 60,000 | | 68,550 |
Equistar Chemicals LP/Equistar Funding Corp. 10.625% 5/1/11 | | 110,000 | | 127,050 |
Huntsman Advanced Materials LLC 11% 7/15/10 (f) | | 40,000 | | 47,000 |
Huntsman ICI Holdings LLC 0% 12/31/09 | | 55,000 | | 31,075 |
Huntsman International LLC 9.875% 3/1/09 | | 60,000 | | 65,700 |
JohnsonDiversey Holdings, Inc. 0% 5/15/13 (d) | | 45,000 | | 38,925 |
Lubrizol Corp.: | | | | |
4.625% 10/1/09 | | 80,000 | | 79,877 |
5.5% 10/1/14 | | 35,000 | | 35,206 |
6.5% 10/1/34 | | 65,000 | | 66,200 |
Lyondell Chemical Co.: | | | | |
9.5% 12/15/08 | | 25,000 | | 27,250 |
9.625% 5/1/07 | | 30,000 | | 32,925 |
Methanex Corp. yankee 7.75% 8/15/05 | | 155,000 | | 158,875 |
Millennium America, Inc. 9.25% 6/15/08 | | 70,000 | | 79,100 |
Nalco Co. 7.75% 11/15/11 | | 50,000 | | 53,875 |
PolyOne Corp.: | | | | |
8.875% 5/1/12 | | 45,000 | | 49,050 |
10.625% 5/15/10 | | 25,000 | | 28,125 |
The Scotts Co. 6.625% 11/15/13 | | 50,000 | | 52,750 |
| | 1,093,783 |
Construction Materials - 0.1% |
RMCC Acquisition Co. 9.5% 11/1/12 (f) | | 180,000 | | 177,300 |
Texas Industries, Inc. 10.25% 6/15/11 | | 140,000 | | 165,200 |
U.S. Concrete, Inc. 8.375% 4/1/14 | | 50,000 | | 53,750 |
| | 396,250 |
Corporate Bonds - continued |
| Principal
Amount | | Value
(Note 1) |
Nonconvertible Bonds - continued |
MATERIALS - continued |
Containers & Packaging - 0.3% |
Anchor Glass Container Corp. 11% 2/15/13 | | $ 60,000 | | $ 65,100 |
BWAY Corp. 10% 10/15/10 | | 40,000 | | 42,600 |
Cellu Tissue Holdings, Inc. 9.75% 3/15/10 | | 60,000 | | 62,400 |
Crown European Holdings SA 10.875% 3/1/13 | | 80,000 | | 94,600 |
Jefferson Smurfit Corp. U.S. 7.5% 6/1/13 | | 130,000 | | 139,100 |
Owens-Brockway Glass Container, Inc.: | | | | |
6.75% 12/1/14 (f) | | 50,000 | | 51,000 |
7.75% 5/15/11 | | 50,000 | | 54,250 |
8.75% 11/15/12 | | 25,000 | | 28,063 |
8.875% 2/15/09 | | 95,000 | | 103,075 |
Owens-Illinois, Inc.: | | | | |
7.35% 5/15/08 | | 295,000 | | 311,225 |
7.8% 5/15/18 | | 45,000 | | 46,575 |
Sealed Air Corp. 5.625% 7/15/13 (f) | | 30,000 | | 31,036 |
| | 1,029,024 |
Metals & Mining - 0.2% |
Allegheny Technologies, Inc. 8.375% 12/15/11 | | 45,000 | | 49,950 |
California Steel Industries, Inc. 6.125% 3/15/14 | | 60,000 | | 59,550 |
Compass Minerals International, Inc. 0% 12/15/12 (d) | | 80,000 | | 68,400 |
CSN Islands VIII Corp. 9.75% 12/16/13 (f) | | 100,000 | | 107,000 |
Foundation Pennsylvania Coal Co. 7.25% 8/1/14 (f) | | 50,000 | | 52,875 |
IMCO Recycling Escrow, Inc. 9% 11/15/14 (f) | | 55,000 | | 56,925 |
International Steel Group, Inc. 6.5% 4/15/14 | | 85,000 | | 91,800 |
Ispat Inland ULC 9.75% 4/1/14 | | 45,000 | | 55,575 |
Massey Energy Co. 6.625% 11/15/10 | | 40,000 | | 41,600 |
Wise Metals Group LLC/Alloys Finance 10.25% 5/15/12 | | 160,000 | | 160,000 |
| | 743,675 |
Paper & Forest Products - 0.2% |
Boise Cascade LLC/Boise Cascade Finance Corp. 7.125% 10/15/14 (f) | | 30,000 | | 31,500 |
Georgia-Pacific Corp.: | | | | |
7.5% 5/15/06 | | 120,000 | | 125,700 |
8% 1/15/24 | | 80,000 | | 92,700 |
8.125% 5/15/11 | | 120,000 | | 138,000 |
|
| Principal
Amount | | Value
(Note 1) |
International Paper Co.: | | | | |
4.25% 1/15/09 | | $ 35,000 | | $ 35,128 |
5.5% 1/15/14 | | 95,000 | | 98,136 |
Norske Skog Canada Ltd. 8.625% 6/15/11 | | 150,000 | | 160,500 |
| | 681,664 |
TOTAL MATERIALS | | 3,944,396 |
TELECOMMUNICATION SERVICES - 1.5% |
Diversified Telecommunication Services - 1.1% |
AT&T Broadband Corp. 8.375% 3/15/13 | | 100,000 | | 123,310 |
Bellsouth Capital Funding Corp. 7.875% 2/15/30 | | 115,000 | | 143,237 |
BellSouth Corp. 5.2% 9/15/14 | | 100,000 | | 101,922 |
British Telecommunications PLC 8.875% 12/15/30 | | 200,000 | | 267,804 |
Deutsche Telekom International Finance BV 8.75% 6/15/30 | | 250,000 | | 330,115 |
France Telecom SA: | | | | |
8.5% 3/1/11 | | 105,000 | | 125,255 |
9.5% 3/1/31 | | 200,000 | | 271,118 |
Koninklijke KPN NV yankee 8% 10/1/10 | | 200,000 | | 236,068 |
New Skies Satellites BV 7.4375% 11/1/11 (f)(h) | | 90,000 | | 94,500 |
NTL Cable PLC 8.75% 4/15/14 (f) | | 45,000 | | 50,625 |
Primus Telecommunications Group, Inc. 8% 1/15/14 | | 60,000 | | 52,800 |
Qwest Capital Funding, Inc.: | | | | |
7% 8/3/09 | | 60,000 | | 59,400 |
7.75% 8/15/06 | | 270,000 | | 284,175 |
Qwest Communications International, Inc.: | | | | |
7.25% 2/15/11 (f) | | 20,000 | | 20,400 |
7.5% 2/15/14 (f) | | 120,000 | | 121,200 |
Qwest Corp. 9.125% 3/15/12 (f) | | 85,000 | | 98,175 |
Qwest Services Corp. 14% 12/15/10 (f)(h) | | 75,000 | | 90,000 |
SBC Communications, Inc.: | | | | |
6.15% 9/15/34 | | 150,000 | | 154,482 |
6.45% 6/15/34 | | 100,000 | | 107,137 |
Sprint Capital Corp. 6.875% 11/15/28 | | 145,000 | | 158,744 |
Telecom Italia Capital: | | | | |
4.95% 9/30/14 (f) | | 95,000 | | 93,075 |
5.25% 11/15/13 | | 250,000 | | 252,684 |
Telefonica Europe BV 7.75% 9/15/10 | | 105,000 | | 123,132 |
Verizon Global Funding Corp.: | | | | |
7.25% 12/1/10 | | 240,000 | | 274,965 |
7.75% 12/1/30 | | 200,000 | | 248,665 |
| | 3,882,988 |
Corporate Bonds - continued |
| Principal
Amount | | Value
(Note 1) |
Nonconvertible Bonds - continued |
TELECOMMUNICATION SERVICES - continued |
Wireless Telecommunication Services - 0.4% |
America Movil SA de CV: | | | | |
4.125% 3/1/09 | | $ 100,000 | | $ 98,514 |
5.5% 3/1/14 | | 90,000 | | 88,911 |
American Tower Corp. 9.375% 2/1/09 | | 28,000 | | 29,400 |
AT&T Wireless Services, Inc. 7.875% 3/1/11 | | 55,000 | | 64,824 |
Centennial Communications Corp./Centennial Cellular Operating Co. LLC/Centennial Puerto Rico Operations Corp. 8.125% 2/1/14 (h) | | 80,000 | | 82,400 |
Crown Castle International Corp.: | | | | |
Series B, 7.5% 12/1/13 | | 80,000 | | 85,800 |
10.75% 8/1/11 | | 15,000 | | 16,350 |
DirecTV Holdings LLC/DirecTV Financing, Inc. 8.375% 3/15/13 | | 50,000 | | 56,000 |
Inmarsat Finance PLC 7.625% 6/30/12 | | 50,000 | | 52,000 |
Intelsat Ltd.: | | | | |
6.5% 11/1/13 | | 55,000 | | 49,775 |
7.625% 4/15/12 | | 15,000 | | 14,775 |
Millicom International Cellular SA 10% 12/1/13 (f) | | 80,000 | | 83,600 |
Nextel Communications, Inc. 7.375% 8/1/15 | | 160,000 | | 176,800 |
Nextel Partners, Inc. 8.125% 7/1/11 | | 80,000 | | 88,800 |
Rogers Communications, Inc.: | | | | |
5.525% 12/15/10 (f)(h) | | 50,000 | | 52,375 |
6.375% 3/1/14 | | 115,000 | | 113,850 |
7.25% 12/15/12 (f) | | 30,000 | | 31,800 |
7.5% 3/15/15 (f) | | 70,000 | | 73,675 |
8% 12/15/12 (f) | | 40,000 | | 42,200 |
9.625% 5/1/11 | | 40,000 | | 46,600 |
Western Wireless Corp. 9.25% 7/15/13 | | 100,000 | | 109,000 |
| | 1,457,449 |
TOTAL TELECOMMUNICATION SERVICES | | 5,340,437 |
UTILITIES - 1.6% |
Electric Utilities - 0.6% |
Allegheny Energy Supply Co. LLC 8.25% 4/15/12 (f) | | 170,000 | | 191,463 |
Cleveland Electric Illuminating Co. 5.65% 12/15/13 | | 145,000 | | 150,381 |
Duke Capital LLC: | | | | |
4.37% 3/1/09 | | 400,000 | | 402,602 |
6.75% 2/15/32 | | 210,000 | | 228,524 |
Exelon Corp. 6.75% 5/1/11 | | 200,000 | | 223,725 |
|
| Principal
Amount | | Value
(Note 1) |
FirstEnergy Corp. 6.45% 11/15/11 | | $ 25,000 | | $ 27,162 |
Illinois Power Co. 7.5% 6/15/09 | | 155,000 | | 174,820 |
Nevada Power Co.: | | | | |
5.875% 1/15/15 (f) | | 30,000 | | 30,075 |
10.875% 10/15/09 | | 65,000 | | 75,075 |
Niagara Mohawk Power Corp. 8.875% 5/15/07 | | 75,000 | | 83,300 |
Progress Energy, Inc. 7.1% 3/1/11 | | 270,000 | | 303,546 |
Sierra Pacific Power Co. 6.25% 4/15/12 | | 30,000 | | 31,275 |
TECO Energy, Inc.: | | | | |
6.125% 5/1/07 | | 55,000 | | 56,925 |
10.5% 12/1/07 | | 105,000 | | 121,538 |
Texas Genco LLC/Texas Genco Financing Corp. 6.875% 12/15/14 (f) | | 60,000 | | 62,400 |
| | 2,162,811 |
Gas Utilities - 0.2% |
Consolidated Natural Gas Co. 6.85% 4/15/11 | | 70,000 | | 78,997 |
Dynegy Holdings, Inc. 10.125% 7/15/13 (f) | | 50,000 | | 57,000 |
NiSource Finance Corp. 7.875% 11/15/10 | | 230,000 | | 270,383 |
Sonat, Inc.: | | | | |
6.625% 2/1/08 | | 65,000 | | 65,813 |
6.75% 10/1/07 | | 70,000 | | 73,500 |
7.625% 7/15/11 | | 20,000 | | 20,625 |
Southern Natural Gas Co. 8.875% 3/15/10 | | 40,000 | | 44,750 |
Texas Eastern Transmission Corp. 7.3% 12/1/10 | | 185,000 | | 212,519 |
Transcontinental Gas Pipe Line Corp. 6.125% 1/15/05 | | 20,000 | | 20,100 |
| | 843,687 |
Multi-Utilities & Unregulated Power - 0.8% |
AES Corp.: | | | | |
8.5% 11/1/07 | | 19,000 | | 19,310 |
8.75% 6/15/08 | | 30,000 | | 32,700 |
8.75% 5/15/13 (f) | | 170,000 | | 192,525 |
8.875% 2/15/11 | | 54,000 | | 61,695 |
9% 5/15/15 (f) | | 90,000 | | 102,938 |
9.375% 9/15/10 | | 16,000 | | 18,500 |
9.5% 6/1/09 | | 144,000 | | 163,620 |
Calpine Corp.: | | | | |
7.82% 7/15/07 (f)(h) | | 79,000 | | 71,890 |
8.5% 7/15/10 (f) | | 20,000 | | 17,100 |
CMS Energy Corp.: | | | | |
7.75% 8/1/10 | | 125,000 | | 136,719 |
8.5% 4/15/11 | | 85,000 | | 96,581 |
8.9% 7/15/08 | | 125,000 | | 137,969 |
9.875% 10/15/07 | | 105,000 | | 117,075 |
Corporate Bonds - continued |
| Principal
Amount | | Value
(Note 1) |
Nonconvertible Bonds - continued |
UTILITIES - continued |
Multi-Utilities & Unregulated Power - continued |
Constellation Energy Group, Inc. 7% 4/1/12 | | $ 350,000 | | $ 398,948 |
Dominion Resources, Inc.: | | | | |
6.25% 6/30/12 | | 685,000 | | 747,875 |
8.125% 6/15/10 | | 60,000 | | 70,622 |
NRG Energy, Inc. 8% 12/15/13 (f) | | 120,000 | | 130,950 |
Reliant Energy, Inc.: | | | | |
6.75% 12/15/14 | | 70,000 | | 70,000 |
9.25% 7/15/10 | | 30,000 | | 33,600 |
9.5% 7/15/13 | | 10,000 | | 11,375 |
| | 2,631,992 |
TOTAL UTILITIES | | 5,638,490 |
TOTAL NONCONVERTIBLE BONDS | | 40,841,405 |
TOTAL CORPORATE BONDS (Cost $38,686,197) | 41,221,955 |
U.S. Government and Government
Agency Obligations - 10.0% |
|
U.S. Government Agency Obligations - 2.3% |
Fannie Mae: | | | | |
2.5% 6/15/06 | | 410,000 | | 406,381 |
3.25% 8/15/08 | | 550,000 | | 542,751 |
3.25% 2/15/09 | | 1,216,000 | | 1,192,355 |
5.5% 3/15/11 | | 380,000 | | 407,493 |
6% 5/15/11 | | 2,015,000 | | 2,216,897 |
6.25% 2/1/11 | | 280,000 | | 306,968 |
Freddie Mac: | | | | |
3.625% 9/15/08 | | 318,000 | | 318,109 |
4% 6/12/13 | | 1,575,000 | | 1,504,262 |
6.625% 9/15/09 | | 475,000 | | 531,212 |
6.75% 3/15/31 | | 404,000 | | 491,010 |
TOTAL U.S. GOVERNMENT AGENCY OBLIGATIONS | | 7,917,438 |
U.S. Treasury Inflation Protected Obligations - 1.2% |
U.S. Treasury Inflation-Indexed Bonds 2.375% 1/15/25 | | 1,012,580 | | 1,082,788 |
|
| Principal
Amount | | Value
(Note 1) |
U.S. Treasury Inflation-Indexed Notes: | | | | |
0.875% 4/15/10 | | $ 1,007,510 | | $ 997,710 |
2% 1/15/14 | | 2,065,960 | | 2,138,269 |
TOTAL U.S. TREASURY INFLATION
PROTECTED OBLIGATIONS | | 4,218,767 |
U.S. Treasury Obligations - 6.5% |
U.S. Treasury Bonds 6.25% 5/15/30 | | 275,000 | | 328,786 |
U.S. Treasury Notes: | | | | |
1.625% 2/28/06 | | 15,370,000 | | 15,161,660 |
3.125% 5/15/07 | | 200,000 | | 199,898 |
3.125% 4/15/09 | | 800,000 | | 787,875 |
4.75% 5/15/14 | | 2,105,000 | | 2,193,639 |
6.5% 2/15/10 | | 1,220,000 | | 1,381,221 |
7% 7/15/06 | | 2,600,000 | | 2,756,608 |
TOTAL U.S. TREASURY OBLIGATIONS | | 22,809,687 |
TOTAL U.S. GOVERNMENT AND GOVERNMENT AGENCY OBLIGATIONS (Cost $34,957,848) | 34,945,892 |
U.S. Government Agency -
Mortgage Securities - 8.9% |
|
Fannie Mae - 8.4% |
3.836% 6/1/33 (h) | | 17,022 | | 17,035 |
3.941% 10/1/34 (h) | | 24,543 | | 24,719 |
4.021% 12/1/34 (h) | | 25,000 | | 25,148 |
4.037% 12/1/34 (h) | | 24,825 | | 25,031 |
4.048% 1/1/35 (h) | | 25,000 | | 25,182 |
4.072% 12/1/34 (h) | | 25,000 | | 25,195 |
4.105% 1/1/35 (h) | | 50,000 | | 49,809 |
4.17% 11/1/34 (h) | | 24,998 | | 25,134 |
4.324% 12/1/34 (h) | | 24,999 | | 25,405 |
4.5% 1/1/20 (g) | | 2,000,000 | | 1,991,875 |
4.5% 1/1/20 (g) | | 50,000 | | 49,797 |
4.5% 7/1/33 to 10/1/33 | | 3,893,403 | | 3,769,926 |
4.549% 8/1/34 (h) | | 46,664 | | 47,760 |
5% 11/1/17 to 8/1/18 | | 4,374,587 | | 4,448,907 |
5% 1/1/35 (g) | | 3,000,000 | | 2,973,750 |
5% 1/1/35 (g) | | 1,275,000 | | 1,263,844 |
5.5% 2/1/11 to 6/1/29 | | 1,368,049 | | 1,412,583 |
5.5% 1/1/35 (g) | | 3,935,130 | | 3,990,468 |
5.5% 1/1/35 (g) | | 4,000,000 | | 4,056,250 |
6% 4/1/09 to 1/1/29 | | 1,557,236 | | 1,631,715 |
6% 1/1/35 (g) | | 299,817 | | 309,748 |
6.5% 5/1/11 to 7/1/32 | | 2,374,873 | | 2,500,094 |
6.5% 1/1/20 (g) | | 54,792 | | 58,080 |
U.S. Government Agency -
Mortgage Securities - continued |
| Principal
Amount | | Value
(Note 1) |
Fannie Mae - continued |
7% 12/1/24 to 2/1/28 | | $ 131,621 | | $ 140,237 |
7.5% 10/1/26 to 8/1/28 | | 440,456 | | 472,564 |
TOTAL FANNIE MAE | | 29,360,256 |
Freddie Mac - 0.0% |
4.985% 8/1/33 (h) | | 25,000 | | 25,678 |
7.5% 1/1/27 | | 32,697 | | 35,120 |
TOTAL FREDDIE MAC | | 60,798 |
Government National Mortgage Association - 0.5% |
6.5% 10/15/27 to 9/15/32 | | 844,073 | | 890,137 |
7% 1/15/28 to 7/15/32 | | 495,343 | | 526,572 |
7.5% 6/15/27 to 3/15/28 | | 138,250 | | 148,713 |
TOTAL GOVERNMENT NATIONAL
MORTGAGE ASSOCIATION | | 1,565,422 |
TOTAL U.S. GOVERNMENT AGENCY - MORTGAGE SECURITIES (Cost $30,788,615) | 30,986,476 |
Asset-Backed Securities - 0.9% |
|
ACE Securities Corp. Series 2004-HE1: | | | | |
Class M1, 2.9175% 2/25/34 (h) | | 50,000 | | 50,008 |
Class M2, 3.5175% 2/25/34 (h) | | 50,000 | | 50,018 |
American Express Credit Account Master Trust Series 2001-6 Class B, 2.7525% 12/15/08 (h) | | 200,000 | | 200,600 |
Ameriquest Mortgage Securities, Inc. Series 2004-R2: | | | | |
Class M1, 2.8475% 4/25/34 (h) | | 25,000 | | 25,000 |
Class M2, 2.8975% 4/25/34 (h) | | 25,000 | | 25,000 |
Amortizing Residential Collateral Trust Series 2003-BC1 Class M2, 3.5175% 1/25/32 (h) | | 45,000 | | 45,186 |
Argent Securities, Inc. Series 2004-W5 Class M1, 3.0175% 4/25/34 (h) | | 75,000 | | 75,100 |
Capital One Multi-Asset Execution Trust: | | | | |
Series 2003-B4 Class B4, 3.2025% 7/15/11 (h) | | 105,000 | | 106,913 |
Series 2004-6 Class B, 4.15% 7/16/12 | | 125,000 | | 124,866 |
Chase Manhattan Auto Owner Trust Series 2001-A Class A4, 5.07% 2/15/08 | | 239,196 | | 240,194 |
Citibank Credit Card Issuance Trust Series 2002-C1 Class C1, 3.2% 2/9/09 (h) | | 250,000 | | 253,336 |
|
| Principal
Amount | | Value
(Note 1) |
Countrywide Home Loans, Inc.: | | | | |
Series 2004-2 Class M1, 2.9175% 5/25/34 (h) | | $ 100,000 | | $ 100,002 |
Series 2004-3 Class M1, 2.9175% 6/25/34 (h) | | 25,000 | | 25,026 |
Series 2004-4: | | | | |
Class A, 2.7875% 8/25/34 (h) | | 80,984 | | 80,956 |
Class M1, 2.8975% 7/25/34 (h) | | 75,000 | | 75,158 |
Class M2, 2.9475% 6/25/34 (h) | | 80,000 | | 80,191 |
Discover Card Master Trust I: | | | | |
Series 2001-6 Class A, 5.75% 12/15/08 | | 600,000 | | 621,227 |
Series 2003-4 Class B1, 2.7325% 5/16/11 (h) | | 155,000 | | 155,826 |
Fremont Home Loan Trust Series 2004-A: | | | | |
Class M1, 2.9675% 1/25/34 (h) | | 75,000 | | 75,001 |
Class M2, 3.5675% 1/25/34 (h) | | 100,000 | | 100,002 |
Home Equity Asset Trust Series 2002-4 Class M2, 4.4675% 3/25/33 (h) | | 25,000 | | 25,371 |
MBNA Credit Card Master Note Trust Series 2001-A1 Class A1, 5.75% 10/15/08 | | 200,000 | | 206,739 |
Meritage Mortgage Loan Trust Series 2004-1: | | | | |
Class M1, 2.9175% 7/25/34 (h) | | 50,000 | | 50,001 |
Class M3, 3.3675% 7/25/34 (h) | | 25,000 | | 25,000 |
Morgan Stanley ABS Capital I, Inc.: | | | | |
Series 2003-HE1 Class M2, 4.3175% 5/25/33 (h) | | 25,000 | | 25,349 |
Series 2003-NC5 Class M2, 4.4175% 4/25/33 (h) | | 50,000 | | 50,924 |
Morgan Stanley Dean Witter Capital I Trust Series 2003-NC1 Class M1, 3.4675% 11/25/32 (h) | | 45,000 | | 45,478 |
Sears Credit Account Master Trust II Series 2000-2 Class A, 6.75% 9/16/09 | | 365,000 | | 374,114 |
Structured Asset Securities Corp. Series 2004-GEL1 Class A, 2.7775% 2/25/34 (h) | | 31,853 | | 31,854 |
TOTAL ASSET-BACKED SECURITIES (Cost $3,298,664) | 3,344,440 |
Collateralized Mortgage Obligations - 0.4% |
| Principal
Amount | | Value
(Note 1) |
Private Sponsor - 0.0% |
CS First Boston Mortgage Securities Corp. floater Series 2004-AR3 Class 6A2, 2.7875% 4/25/34 (h) | | $ 68,523 | | $ 68,624 |
Master Alternative Loan Trust Series 2004-3 Class 3A1, 6% 4/25/34 | | 22,382 | | 22,913 |
Residential Asset Mortgage Products, Inc. sequential pay Series 2004-SL2 Class A1, 6.5% 10/25/16 | | 38,090 | | 39,125 |
TOTAL PRIVATE SPONSOR | | 130,662 |
U.S. Government Agency - 0.4% |
Fannie Mae guaranteed REMIC pass thru certificates planned amortization class Series 2004-81 Class KD: | | | | |
4.5% 4/25/17 | | 380,000 | | 382,294 |
4.5% 7/25/18 | | 170,000 | | 168,639 |
Freddie Mac Multi-class participation certificates guaranteed planned amortization class: | | | | |
Series 2677 Class LD, 4.5% 3/15/17 | | 560,000 | | 559,802 |
Series 2885 Class PC, 4.5% 3/15/18 | | 165,000 | | 165,958 |
TOTAL U.S. GOVERNMENT AGENCY | | 1,276,693 |
TOTAL COLLATERALIZED
MORTGAGE OBLIGATIONS (Cost $1,411,824) | 1,407,355 |
Commercial Mortgage Securities - 1.2% |
|
Bayview Commercial Asset Trust floater: | | | | |
Series 2004-1 Class A, 2.7775% 4/25/34 (f)(h) | | 92,980 | | 92,697 |
Series 2004-3 Class A1, 2.7675% 1/25/35 (f)(h) | | 149,743 | | 149,743 |
COMM: | | | | |
floater: | | | | |
Series 2002-FL7 Class D, 2.9725% 11/15/14 (f)(h) | | 45,000 | | 45,121 |
Series 2003-FL9 Class B, 2.9025% 11/15/15 (f)(h) | | 85,741 | | 85,997 |
Series 2004-LBN2 Class X2, 1.2743% 3/10/39 (f)(h)(i) | | 314,195 | | 13,398 |
CS First Boston Mortgage Securities Corp.: | | | | |
sequential pay: | | | | |
Series 1999-C1 Class A2, 7.29% 9/15/41 | | 250,000 | | 280,656 |
|
| Principal
Amount | | Value
(Note 1) |
Series 2000-C1 Class A2, 7.545% 4/15/62 | | $ 500,000 | | $ 570,857 |
Series 2004-C1 Class A3, 4.321% 1/15/37 | | 95,000 | | 94,428 |
Series 1997-C2 Class D, 7.27% 1/17/35 | | 150,000 | | 165,774 |
Series 2004-C1 Class ASP, 1.0446% 1/15/37 (f)(h)(i) | | 1,540,000 | | 61,591 |
DLJ Commercial Mortgage Corp. sequential pay Series 2000-CF1 Class A1B, 7.62% 6/10/33 | | 500,000 | | 573,195 |
Fannie Mae sequential pay Series 1999-10 Class MZ, 6.5% 9/17/38 | | 248,127 | | 262,803 |
GS Mortgage Securities Corp. II: | | | | |
sequential pay: | | | | |
Series 2001-LIBA Class A2, 6.615% 2/14/16 (f) | | 105,000 | | 115,643 |
Series 2003-C1 Class A2A, 3.59% 1/10/40 | | 125,000 | | 124,418 |
Series 1998-GLII Class E, 7.1905% 4/13/31 (h) | | 120,000 | | 125,956 |
J.P. Morgan Commercial Mortgage Finance Corp. sequential pay Series 2000-C9 Class A2, 7.77% 10/15/32 | | 225,000 | | 257,901 |
Leafs CMBS I Ltd./Leafs CMBS I Corp. Series 2002-1A: | | | | |
Class B, 4.13% 11/20/37 (f) | | 110,000 | | 105,076 |
Class C, 4.13% 11/20/37 (f) | | 110,000 | | 100,375 |
Merrill Lynch Mortgage Trust sequential pay Series 2004-KEY2 Class A2, 4.166% 8/12/39 | | 215,000 | | 214,202 |
Morgan Stanley Capital I, Inc. sequential pay Series 2004-HQ3 Class A2, 4.05% 1/13/41 | | 105,000 | | 104,217 |
Thirteen Affiliates of General Growth Properties, Inc. sequential pay Series 1 Class A2, 6.602% 11/15/07 (f) | | 500,000 | | 532,438 |
Wachovia Bank Commercial Mortgage Trust sequential pay Series 2003-C6 Class A2, 4.498% 8/15/35 | | 165,000 | | 167,348 |
TOTAL COMMERCIAL MORTGAGE SECURITIES (Cost $4,038,439) | 4,243,834 |
Foreign Government and Government
Agency Obligations - 0.4% |
|
Chilean Republic: | | | | |
5.625% 7/23/07 | | 150,000 | | 157,031 |
7.125% 1/11/12 | | 190,000 | | 218,144 |
Korean Republic 4.875% 9/22/14 | | 100,000 | | 98,911 |
State of Israel 4.625% 6/15/13 | | 30,000 | | 28,669 |
United Mexican States: | | | | |
5.875% 1/15/14 | | 90,000 | | 92,205 |
Foreign Government and Government
Agency Obligations - continued |
| Principal
Amount | | Value
(Note 1) |
United Mexican States: - continued | | | | |
6.375% 1/16/13 | | $ 300,000 | | $ 319,500 |
6.75% 9/27/34 | | 150,000 | | 148,125 |
7.5% 4/8/33 | | 175,000 | | 189,000 |
TOTAL FOREIGN GOVERNMENT AND GOVERNMENT AGENCY OBLIGATIONS (Cost $1,201,314) | 1,251,585 |
Floating Rate Loans - 0.1% |
|
TELECOMMUNICATION SERVICES - 0.1% |
Diversified Telecommunication Services - 0.1% |
Qwest Corp. Tranche A, term loan 7.39% 6/30/07 (h) | | 190,000 | | 198,075 |
UTILITIES - 0.0% |
Multi-Utilities & Unregulated Power - 0.0% |
AES Corp. term loan 5.22% 8/10/11 (h) | | 85,714 | | 86,893 |
TOTAL FLOATING RATE LOANS (Cost $276,110) | 284,968 |
Money Market Funds - 15.2% |
| | Shares | | |
Fidelity Cash Central Fund, 2.24% (b) | | 50,175,503 | | 50,175,503 |
Fidelity Securities Lending Cash Central Fund, 2.23% (b)(c) | | 2,822,275 | | 2,822,275 |
TOTAL MONEY MARKET FUNDS (Cost $52,997,778) | | 52,997,778 |
Cash Equivalents - 0.0% |
| | Maturity
Amount | | |
Investments in repurchase agreements (Collateralized by U.S. Treasury Obligations, in a joint trading account at 1.52%, dated 12/31/04 due 1/3/05)
(Cost $42,000) | | $ 42,005 | | $ 42,000 |
TOTAL INVESTMENT PORTFOLIO - 104.8% (Cost $330,019,447) | | | | 366,188,686 |
NET OTHER ASSETS - (4.8)% | | | | (16,764,900) |
NET ASSETS - 100% | | | $ 349,423,786 |
Swap Agreements |
| Expiration
Date | | Notional
Amount | | Value |
Interest Rate Swap |
Receive quarterly a fixed rate equal to 3.524% and pay quarterly a floating rate based on 3-month LIBOR with Morgan Stanley, Inc. | May 2007 | | $ 2,800,000 | | $ 4,197 |
TOTAL INTEREST RATE SWAP | 2,800,000 | | 4,197 |
Total Return Swap |
Receive monthly a return equal to Lehman Brothers for CMBS U.S. Aggregate Index and pay monthly a floating rate based on 1-month LIBOR with Deutsche Bank | June 2005 | | 570,000 | | 3,247 |
Receive monthly a return equal to Lehman Brothers for CMBS U.S. Aggregate Index and pay monthly a floating rate based on 1-month LIBOR with Goldman Sachs | March 2005 | | 1,430,000 | | 7,555 |
Receive monthly a return equal to Lehman Brothers for CMBS AAA 8.5+ Index and pay monthly a floating rate based on 1-month LIBOR minus 40 basis points with Lehman Brothers, Inc. | April 2005 | | 500,000 | | 5,171 |
Receive monthly a return equal to Lehman Brothers for CMBS U.S. Aggregate Index and pay monthly a floating rate based on 1-month LIBOR minus 10 basis points with Lehman Brothers, Inc. | May 2005 | | 2,500,000 | | 13,044 |
Receive quarterly a return equal to Banc of America Securities LLC AAA 10Yr Commercial Mortgage-Backed Securities Daily Index and pay quarterly a floating rate based on 3-month LIBOR minus 72 basis points with Bank of America | Jan. 2005 | | 500,000 | | (1,735) |
Swap Agreements - continued |
| Expiration
Date | | Notional
Amount | | Value |
Total Return Swap - continued |
Receive quarterly a return equal to that of Banc of America Securities LLC AAA 10Yr Commercial Mortgage Backed Securities Daily Index and pay quarterly a floating rate based on 3-month LIBOR minus 30 basis points with Bank of America | May 2005 | | $ 500,000 | | $ (556) |
Receive quarterly a return equal to that of Lehman Brothers Commercial Mortgage-Backed Securities AAA Daily Index and pay quarterly a floating rate based on 3-month LIBOR minus 8 basis points with Bank of America | April 2005 | | 490,000 | | (3,013) |
TOTAL TOTAL RETURN SWAP | 6,490,000 | | 23,713 |
| | $ 9,290,000 | | $ 27,910 |
Legend |
(a) Non-income producing |
(b) Affiliated fund that is available only to investment companies and other accounts managed by Fidelity Investments. The rate quoted is the annualized seven-day yield of the fund at period end. A complete listing of the fund's holdings as of its most recent fiscal year end is available upon request. |
(c) Includes investment made with cash collateral received from securities on loan. |
(d) Debt obligation initially issued in zero coupon form which converts to coupon form at a specified rate and date. The rate shown is the rate at period end. |
(e) Security or a portion of the security is on loan at period end. |
(f) Security exempt from registration under Rule 144A of the Securities Act of 1933. These securities may be resold in transactions exempt from registration, normally to qualified institutional buyers. At the period end, the value of these securities amounted to $8,715,733 or 2.5% of net assets. |
(g) Security or a portion of the security purchased on a delayed delivery or when-issued basis. |
(h) The coupon rate shown on floating or adjustable rate securities represents the rate at period end. |
(i) Security represents right to receive monthly interest payments on an underlying pool of mortgages. Principal shown is the par amount of the mortgage pool. |
Other Information |
The composition of credit quality ratings as a percentage of net assets is as follows (ratings are unaudited): |
U.S.Government and U.S.Government Agency Obligations | 19.4% |
AAA,AA,A | 4.2% |
BBB | 3.8% |
BB | 1.8% |
B | 3.8% |
CCC,CC,C | 0.5% |
Not Rated | 0.2% |
Equities | 55.9% |
Short-Term Investments and Net Other Assets | 10.4% |
| 100.0% |
We have used ratings from Moody's® Investors Services, Inc.
Where Moody's ratings are not available, we have used S&P® ratings. |
Income Tax Information |
At December 31, 2004, the fund had a capital loss carryforward of approximately $11,446,000 of which $1,788,000 and $9,658,000 will expire on December 31, 2009 and 2010, respectively. |
See accompanying notes which are an integral part of the financial statements.
Balanced Portfolio
Fidelity Variable Insurance Products: Balanced Portfolio
Financial Statements
Statement of Assets and Liabilities
| December 31, 2004 |
| | |
Assets | | |
Investment in securities, at value (including securities loaned of $2,743,680 and repurchase agreements of $42,000) (cost $330,019,447) - See accompanying schedule | | $ 366,188,686 |
Cash | | 806 |
Receivable for fund shares sold | | 68,544 |
Dividends receivable | | 176,836 |
Interest receivable | | 1,293,331 |
Swap agreements, at value | | 27,910 |
Prepaid expenses | | 1,322 |
Other receivables | | 13,937 |
Total assets | | 367,771,372 |
| | |
Liabilities | | |
Payable for investments purchased
Regular delivery | $ 317,217 | |
Delayed delivery | 14,753,084 | |
Payable for fund shares redeemed | 219,642 | |
Accrued management fee | 123,028 | |
Distribution fees payable | 9,420 | |
Other affiliated payables | 31,431 | |
Other payables and accrued expenses | 71,489 | |
Collateral on securities loaned, at value | 2,822,275 | |
Total liabilities | | 18,347,586 |
| | |
Net Assets | | $ 349,423,786 |
Net Assets consist of: | | |
Paid in capital | | $ 316,130,162 |
Undistributed net investment income | | 9,092,580 |
Accumulated undistributed net realized gain (loss) on investments and foreign currency transactions | | (11,996,105) |
Net unrealized appreciation (depreciation) on investments | | 36,197,149 |
Net Assets | | $ 349,423,786 |
| | |
Initial Class:
Net Asset Value, offering price
and redemption price per
share ($291,175,630 ÷ 20,297,277 shares) | | $ 14.35 |
| | |
Service Class:
Net Asset Value, offering price
and redemption price per
share ($21,227,681 ÷ 1,487,026 shares) | | $ 14.28 |
| | |
Service Class 2:
Net Asset Value, offering price
and redemption price per
share ($37,020,475 ÷ 2,606,181 shares) | | $ 14.20 |
Statement of Operations
| Year ended December 31, 2004 |
| | |
Investment Income | | |
Dividends | | $ 3,518,465 |
Special Dividends | | 761,100 |
Interest | | 6,666,531 |
Security lending | | 3,282 |
Total income | | 10,949,378 |
| | |
Expenses | | |
Management fee | $ 1,470,347 | |
Transfer agent fees | 238,939 | |
Distribution fees | 103,770 | |
Accounting and security lending fees | 144,610 | |
Non-interested trustees' compensation | 1,905 | |
Custodian fees and expenses | 21,654 | |
Audit | 46,946 | |
Legal | 894 | |
Miscellaneous | 30,857 | |
Total expenses before reductions | 2,059,922 | |
Expense reductions | (13,464) | 2,046,458 |
Net investment income (loss) | | 8,902,920 |
Realized and Unrealized Gain (Loss) Net realized gain (loss) on: | | |
Investment securities | 8,330,480 | |
Foreign currency transactions | (1,576) | |
Swap agreements | 251,460 | |
Total net realized gain (loss) | | 8,580,364 |
Change in net unrealized appreciation (depreciation) on: Investment securities | 592,685 | |
Swap agreements | (18,253) | |
Delayed delivery commitments | (464) | |
Total change in net unrealized appreciation (depreciation) | | 573,968 |
Net gain (loss) | | 9,154,332 |
Net increase (decrease) in net assets resulting from operations | | $ 18,057,252 |
See accompanying notes which are an integral part of the financial statements.
Annual Report
Fidelity Variable Insurance Products: Balanced Portfolio
Financial Statements - continued
Statement of Changes in Net Assets
| Year ended
December 31,
2004 | Year ended
December 31,
2003 |
Increase (Decrease) in Net Assets | | |
Operations | | |
Net investment income (loss) | $ 8,902,920 | $ 6,987,022 |
Net realized gain (loss) | 8,580,364 | 3,062,346 |
Change in net unrealized appreciation (depreciation) | 573,968 | 38,999,107 |
Net increase (decrease) in net assets resulting from operations | 18,057,252 | 49,048,475 |
Distributions to shareholders from net investment income | (6,988,389) | (7,974,845) |
Share transactions - net increase (decrease) | (8,689,636) | 32,311,069 |
Total increase (decrease) in net assets | 2,379,227 | 73,384,699 |
| | |
Net Assets | | |
Beginning of period | 347,044,559 | 273,659,860 |
End of period (including undistributed net investment income of $9,092,580 and undistributed net investment income of $7,087,612, respectively) | $ 349,423,786 | $ 347,044,559 |
Other Information: | | | |
Share Transactions | Year ended December 31, 2004 |
| Initial Class | Service Class | Service Class 2 |
Shares Sold | 2,035,766 | 95,487 | 798,702 |
Reinvested | 432,646 | 31,049 | 40,193 |
Redeemed | (3,476,835) | (224,978) | (377,301) |
Net increase (decrease) | (1,008,423) | (98,442) | 461,594 |
| | | |
Dollars Sold | $ 28,145,848 | $ 1,311,596 | $ 10,871,355 |
Reinvested | 6,005,122 | 429,413 | 553,854 |
Redeemed | (47,800,698) | (3,078,714) | (5,127,412) |
Net increase (decrease) | $ (13,649,728) | $ (1,337,705) | $ 6,297,797 |
| | | |
Share Transactions | Year ended December 31, 2003 |
| Initial Class | Service Class | Service Class 2 |
Shares Sold | 4,747,709 | 87,816 | 932,305 |
Reinvested | 599,512 | 50,167 | 45,486 |
Redeemed | (3,372,673) | (205,767) | (374,801) |
Net increase (decrease) | 1,974,548 | (67,784) | 602,990 |
| | | |
Dollars Sold | $ 61,609,403 | $ 1,115,888 | $ 11,910,142 |
Reinvested | 6,882,396 | 573,909 | 518,540 |
Redeemed | (42,908,423) | (2,600,420) | (4,790,366) |
Net increase (decrease) | $ 25,583,376 | $ (910,623) | $ 7,638,316 |
| | | |
Distributions | Year ended December 31, 2004 |
| Initial Class | Service Class | Service Class 2 |
From net investment income | $ 6,005,122 | $ 429,413 | $ 553,854 |
| Year ended December 31, 2003 |
| Initial Class | Service Class | Service Class 2 |
From net investment income | $ 6,882,396 | $ 573,909 | $ 518,540 |
See accompanying notes which are an integral part of the financial statements.
Balanced Portfolio
Financial Highlights - Initial Class
Years ended December 31, | 2004 | 2003 | 2002 | 2001 | 2000 |
Selected Per-Share Data | | | | | |
Net asset value, beginning of period | $ 13.88 | $ 12.16 | $ 13.72 | $ 14.45 | $ 16.00 |
Income from Investment Operations | | | | | |
Net investment income (loss) C | .36 D | .30 | .36 | .42 | .48 |
Net realized and unrealized gain (loss) | .39 | 1.78 | (1.53) | (.63) | (1.15) |
Total from investment operations | .75 | 2.08 | (1.17) | (.21) | (.67) |
Distributions from net investment income | (.28) | (.36) | (.39) | (.52) | (.48) |
Distributions from net realized gain | - | - | - | - | (.35) |
Distributions in excess of net realized gain | - | - | - | - | (.05) |
Total distributions | (.28) | (.36) | (.39) | (.52) | (.88) |
Net asset value, end of period | $ 14.35 | $ 13.88 | $ 12.16 | $ 13.72 | $ 14.45 |
Total Return A, B | 5.47% | 17.72% | (8.72)% | (1.58)% | (4.30)% |
Ratios to Average Net Assets E | | | | | |
Expenses before expense reductions | .56% | .59% | .57% | .57% | .58% |
Expenses net of voluntary waivers, if any | .56% | .59% | .57% | .57% | .58% |
Expenses net of all reductions | .56% | .58% | .55% | .55% | .56% |
Net investment income (loss) | 2.60% | 2.32% | 2.84% | 3.11% | 3.18% |
Supplemental Data | | | | | |
Net assets, end of period (000 omitted) | $ 291,176 | $ 295,656 | $ 235,064 | $ 264,608 | $ 250,802 |
Portfolio turnover rate | 74% | 102% | 134% | 126% | 126% |
A Total returns do not reflect charges attributable to your insurance company's separate account. Inclusion of these charges would reduce the total returns shown.
B Total returns would have been lower had certain expenses not been reduced during the periods shown.
C Calculated based on average shares outstanding during the period.
D Investment income per share reflects a special dividend which amounted to $.03 per share.
E Expense ratios reflect operating expenses of the class. Expenses before reductions do not reflect amounts reimbursed by the investment adviser or reductions from brokerage service arrangements or other expense offset arrangements and do not represent the amount paid by the class during periods when reimbursements or reductions occur. Expenses net of any voluntary waivers reflect expenses after reimbursement by the investment adviser but prior to reductions from brokerage service arrangements or other expense offset arrangements. Expenses net of all reductions represent the net expenses paid by the class.
Financial Highlights - Service Class
Years ended December 31, | 2004 | 2003 | 2002 | 2001 | 2000 |
Selected Per-Share Data | | | | | |
Net asset value, beginning of period | $ 13.81 | $ 12.11 | $ 13.66 | $ 14.39 | $ 15.94 |
Income from Investment Operations | | | | | |
Net investment income (loss) C | .34 D | .28 | .34 | .41 | .46 |
Net realized and unrealized gain (loss) | .40 | 1.77 | (1.51) | (.64) | (1.14) |
Total from investment operations | .74 | 2.05 | (1.17) | (.23) | (.68) |
Distributions from net investment income | (.27) | (.35) | (.38) | (.50) | (.47) |
Distributions from net realized gain | - | - | - | - | (.35) |
Distributions in excess of net realized gain | - | - | - | - | (.05) |
Total distributions | (.27) | (.35) | (.38) | (.50) | (.87) |
Net asset value, end of period | $ 14.28 | $ 13.81 | $ 12.11 | $ 13.66 | $ 14.39 |
Total ReturnA, B | 5.42% | 17.53% | (8.75)% | (1.72)% | (4.38)% |
Ratios to Average Net Assets E | | | | | |
Expenses before expense reductions | .67% | .69% | .67% | .67% | .68% |
Expenses net of voluntary waivers, if any | .67% | .69% | .67% | .67% | .68% |
Expenses net of all reductions | .67% | .68% | .65% | .65% | .66% |
Net investment income (loss) | 2.50% | 2.22% | 2.74% | 3.01% | 3.08% |
Supplemental Data | | | | | |
Net assets, end of period (000 omitted) | $ 21,228 | $ 21,903 | $ 20,019 | $ 25,455 | $ 27,563 |
Portfolio turnover rate | 74% | 102% | 134% | 126% | 126% |
A Total returns do not reflect charges attributable to your insurance company's separate account. Inclusion of these charges would reduce the total returns shown.
B Total returns would have been lower had certain expenses not been reduced during the periods shown.
C Calculated based on average shares outstanding during the period.
D Investment income per share reflects a special dividend which amounted to $.03 per share.
E Expense ratios reflect operating expenses of the class. Expenses before reductions do not reflect amounts reimbursed by the investment adviser or reductions from brokerage service arrangements or other expense offset arrangements and do not represent the amount paid by the class during periods when reimbursements or reductions occur. Expenses net of any voluntary waivers reflect expenses after reimbursement by the investment adviser but prior to reductions from brokerage service arrangements or other expense offset arrangements. Expenses net of all reductions represent the net expenses paid by the class.
See accompanying notes which are an integral part of the financial statements.
Annual Report
Financial Highlights - Service Class 2
Years ended December 31, | 2004 | 2003 | 2002 | 2001 | 2000 G |
Selected Per-Share Data | | | | | |
Net asset value, beginning of period | $ 13.75 | $ 12.05 | $ 13.61 | $ 14.37 | $ 15.59 |
Income from Investment Operations | | | | | |
Net investment income (loss) E | .32 F | .26 | .32 | .38 | .40 |
Net realized and unrealized gain (loss) | .38 | 1.77 | (1.51) | (.63) | (.75) |
Total from investment operations | .70 | 2.03 | (1.19) | (.25) | (.35) |
Distributions from net investment income | (.25) | (.33) | (.37) | (.51) | (.47) |
Distributions from net realized gain | - | - | - | - | (.35) |
Distributions in excess of net realized gain | - | - | - | - | (.05) |
Total distributions | (.25) | (.33) | (.37) | (.51) | (.87) |
Net asset value, end of period | $ 14.20 | $ 13.75 | $ 12.05 | $ 13.61 | $ 14.37 |
Total Return B, C, D | 5.15% | 17.41% | (8.93)% | (1.87)% | (2.37)% |
Ratios to Average Net Assets H | | | | | |
Expenses before expense reductions | .82% | .84% | .83% | .83% | .85% A |
Expenses net of voluntary waivers, if any | .82% | .84% | .83% | .83% | .85% A |
Expenses net of all reductions | .82% | .84% | .81% | .81% | .83% A |
Net investment income (loss) | 2.35% | 2.06% | 2.58% | 2.85% | 2.91% A |
Supplemental Data | | | | | |
Net assets, end of period (000 omitted) | $ 37,020 | $ 29,485 | $ 18,577 | $ 16,798 | $ 4,797 |
Portfolio turnover rate | 74% | 102% | 134% | 126% | 126% |
A Annualized
B Total returns for periods of less than one year are not annualized.
C Total returns do not reflect charges attributable to your insurance company's separate account. Inclusion of these charges would reduce the total returns shown.
D Total returns would have been lower had certain expenses not been reduced during the periods shown.
E Calculated based on average shares outstanding during the period.
F Investment income per share reflects a special dividend which amounted to $.03 per share.
G For the period January 12, 2000 (commencement of sale of shares) to December 31, 2000.
H Expense ratios reflect operating expenses of the class. Expenses before reductions do not reflect amounts reimbursed by the investment adviser or reductions from brokerage service arrangements or other expense offset arrangements and do not represent the amount paid by the class during periods when reimbursements or reductions occur. Expense ratios before reductions for start-up periods may not be representative of longer-term operating periods. Expenses net of any voluntary waivers reflect expenses after reimbursement by the investment adviser but prior to reductions from brokerage service arrangements or other expense offset arrangements. Expenses net of all reductions represent the net expenses paid by the class.
See accompanying notes which are an integral part of the financial statements.
Balanced Portfolio
Fidelity Variable Insurance Products: Growth & Income Portfolio
Performance: The Bottom Line
Average annual total return reflects the change in the value of an investment, assuming reinvestment of the class' dividend income and capital gains (the profits earned upon the sale of securities that have grown in value) and assuming a constant rate of performance each year. The $10,000 table and the fund's returns do not reflect the deduction of taxes that a shareholder would pay on fund distributions or the redemption of fund shares. During periods of reimbursement by Fidelity, a fund's total return will be greater than it would be had the reimbursement not occurred. Performance numbers are net of all underlying fund operating expenses, but do not include any insurance charges imposed by your insurance company's separate account. If performance information included the effect of these additional charges, the total returns would have been lower. How a fund did yesterday is no guarantee of how it will do tomorrow.
Average Annual Total Returns
Periods ended December 31, 2004 | Past 1
year | Past 5
years | Life of fund A |
Fidelity® VIP: Growth & Income - Initial Class | 5.80% | -0.80% | 7.24% |
Fidelity VIP: Growth & Income - Service Class B | 5.75% | -0.90% | 7.13% |
Fidelity VIP: Growth & Income - Service Class 2 C | 5.52% | -1.06% | 7.02% |
A From December 31, 1996.
B The initial offering of Service Class shares took place on November 3, 1997. Performance for Service Class shares reflects an asset based distribution fee (12b-1 fee), and returns prior to November 3, 1997 are those of Initial Class and do not include the effects of Service Class' 12b-1 fee. Had Service Class shares' 12b-1 fee been reflected, returns prior to November 3, 1997 would have been lower.
C The initial offering of Service Class 2 shares took place on January 12, 2000. Performance for Service Class 2 shares reflects an asset based distribution fee (12b-1 fee). Returns from November 3, 1997 to January 12, 2000 are those of Service Class which reflect a different 12b-1 fee. Service Class 2 returns prior to November 3, 1997 are those of the Initial Class and do not include the effects of a 12b-1 fee. Had Service Class 2's 12b-1 fee been reflected, returns prior to January 12, 2000 would have been lower.
$10,000 Over Life of Fund
Let's say hypothetically that $10,000 was invested in Fidelity® Variable Insurance Products: Growth & Income Portfolio - Initial Class on December 31, 1996, when the fund started. The chart shows how the value of your investment would have changed, and also shows how the Standard & Poor's 500SM Index performed over the same period.
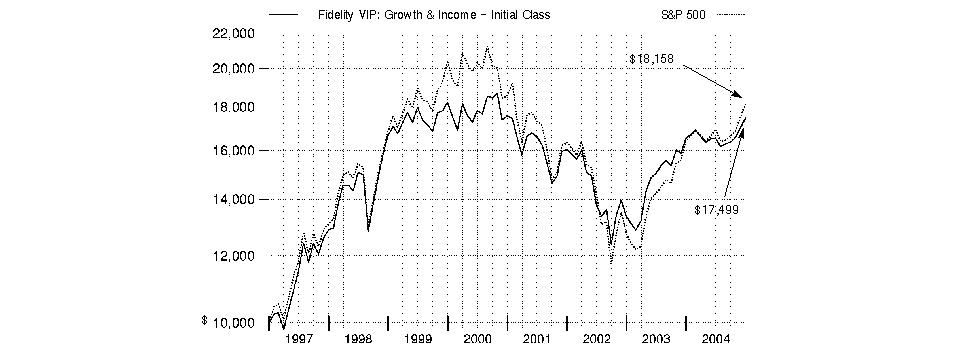
Annual Report
Fidelity Variable Insurance Products: Growth & Income Portfolio
Management's Discussion of Fund Performance
Comments from Louis Salemy, Portfolio Manager of Fidelity® Variable Insurance Products: Growth & Income Portfolio
The year ending December 31, 2004, generally was positive for equity investors, as many stock market benchmarks produced double-digit gains. Broad-based themes included the continued dominance of small-cap stocks, which outperformed large-caps for the sixth consecutive year. The small-cap Russell 2000® Index was up 18.33% in 2004, while the larger-cap Standard & Poor's 500SM Index rose 10.88%. Value stocks ended the year well ahead of growth stocks: The Russell 3000® Value Index advanced 16.94%, compared to 6.93% for the Russell 3000 Growth Index. Energy and basic materials stocks led the market upward. Energy stocks were boosted by record-high oil prices, while strong demand from China helped support commodity prices. The health care sector was among the market's weakest performers. Technology also fell off the pace, though it was helped by a rally late in the year. The tech-heavy NASDAQ Composite® Index returned 9.15%, thanks primarily to a 14.87% jump in the fourth quarter. Elsewhere, the Dow Jones Industrial AverageSM gained 5.37% for the year.
For the 12 months ending December 31, 2004, the fund's return was slightly more than half of the 10.88% return posted by the S&P 500®. The fund also finished well behind the LipperSM Variable Annuity Growth & Income Funds Average, which returned 11.14%. A significant overweighting in the media industry hurt performance versus the index. One media detractor, EchoStar Communications, was the victim of fears about competition from rival satellite TV providers and from the cable industry. Diversified financials was another weak group for the fund compared with the index. For example, top-10 holdings Morgan Stanley and Merrill Lynch both were sidetracked by investors' concerns about the impact of rising interest rates on future business. On the other hand, my decision to underweight both information technology and health care helped relative performance. In consumer staples, razor manufacturer Gillette was a significant contributor both in absolute terms and compared with the index. The introduction of a number of popular products helped the stock. Verizon Communications also aided performance, boosted by a regulatory change that enabled the company to charge higher rates for leasing its network to competitors.
The views expressed in this statement reflect those of the portfolio manager only through the end of the period of the report as stated on the cover and do not necessarily represent the views of Fidelity or any other person in the Fidelity organization. Any such views are subject to change at any time based upon market or other conditions and Fidelity disclaims any responsibility to update such views. These views may not be relied on as investment advice and, because investment decisions for a Fidelity fund are based on numerous factors, may not be relied on as an indication of trading intent on behalf of any Fidelity fund.
Growth & Income Portfolio
Fidelity Variable Insurance Products: Growth & Income Portfolio
Investment Summary
Top Five Stocks as of December 31, 2004 |
| % of fund's
net assets |
EchoStar Communications Corp. Class A | 8.1 |
Omnicom Group, Inc. | 7.4 |
BellSouth Corp. | 5.4 |
Morgan Stanley | 5.2 |
Wells Fargo & Co. | 4.9 |
| 31.0 |
Top Five Market Sectors as of December 31, 2004 |
| % of fund's
net assets |
Consumer Discretionary | 22.7 |
Financials | 22.5 |
Consumer Staples | 14.0 |
Telecommunication Services | 12.0 |
Information Technology | 5.9 |
Asset Allocation as of December 31, 2004 |
% of fund's net assets* |
| Stocks | 90.5% | |
| Short-Term
Investments and
Net Other Assets | 9.5% | |

Annual Report
Fidelity Variable Insurance Products: Growth & Income Portfolio
Investments December 31, 2004
Showing Percentage of Net Assets
Common Stocks - 90.5% |
| Shares | | Value (Note 1) |
CONSUMER DISCRETIONARY - 22.7% |
Hotels, Restaurants & Leisure - 0.5% |
Carnival Corp. unit | 152,200 | | $ 8,771,286 |
Media - 18.9% |
E.W. Scripps Co. Class A | 696,300 | | 33,617,364 |
EchoStar Communications Corp. Class A | 3,995,800 | | 132,820,391 |
News Corp. Class B (d) | 1,111,400 | | 21,338,880 |
Omnicom Group, Inc. | 1,426,200 | | 120,257,184 |
| | 308,033,819 |
Multiline Retail - 2.6% |
Kohl's Corp. (a) | 869,800 | | 42,768,066 |
Textiles, Apparel & Luxury Goods - 0.7% |
Liz Claiborne, Inc. | 205,800 | | 8,686,818 |
Reebok International Ltd. | 57,800 | | 2,543,200 |
| | 11,230,018 |
TOTAL CONSUMER DISCRETIONARY | | 370,803,189 |
CONSUMER STAPLES - 14.0% |
Beverages - 0.9% |
The Coca-Cola Co. | 333,900 | | 13,900,257 |
Food & Staples Retailing - 6.4% |
Costco Wholesale Corp. | 493,700 | | 23,900,017 |
Wal-Mart Stores, Inc. | 1,110,000 | | 58,630,200 |
Walgreen Co. | 584,100 | | 22,411,917 |
| | 104,942,134 |
Food Products - 0.5% |
McCormick & Co., Inc. (non-vtg.) | 224,100 | | 8,650,260 |
Household Products - 2.6% |
Colgate-Palmolive Co. | 224,900 | | 11,505,884 |
Kimberly-Clark Corp. | 465,900 | | 30,660,879 |
| | 42,166,763 |
Personal Products - 2.2% |
Gillette Co. | 806,400 | | 36,110,592 |
Tobacco - 1.4% |
Altria Group, Inc. | 377,960 | | 23,093,356 |
TOTAL CONSUMER STAPLES | | 228,863,362 |
ENERGY - 4.6% |
Oil & Gas - 4.6% |
BP PLC sponsored ADR | 382,200 | | 22,320,480 |
Exxon Mobil Corp. | 1,035,756 | | 53,092,853 |
| | 75,413,333 |
FINANCIALS - 22.5% |
Capital Markets - 12.2% |
Goldman Sachs Group, Inc. | 451,000 | | 46,922,040 |
Merrill Lynch & Co., Inc. | 1,126,200 | | 67,312,974 |
Morgan Stanley | 1,526,000 | | 84,723,520 |
| | 198,958,534 |
|
| Shares | | Value (Note 1) |
Commercial Banks - 4.9% |
Wells Fargo & Co. | 1,287,700 | | $ 80,030,555 |
Consumer Finance - 0.9% |
American Express Co. | 269,700 | | 15,202,989 |
Insurance - 4.5% |
Allstate Corp. | 335,300 | | 17,341,716 |
American International Group, Inc. | 547,605 | | 35,961,220 |
PartnerRe Ltd. | 111,600 | | 6,912,504 |
St. Paul Travelers Companies, Inc. | 338,239 | | 12,538,520 |
| | 72,753,960 |
TOTAL FINANCIALS | | 366,946,038 |
HEALTH CARE - 1.5% |
Health Care Equipment & Supplies - 0.6% |
Advanced Medical Optics, Inc. (a) | 1 | | 41 |
Alcon, Inc. | 126,600 | | 10,203,960 |
| | 10,204,001 |
Pharmaceuticals - 0.9% |
Pfizer, Inc. | 504,900 | | 13,576,761 |
TOTAL HEALTH CARE | | 23,780,762 |
INDUSTRIALS - 4.3% |
Aerospace & Defense - 0.9% |
Lockheed Martin Corp. | 115,500 | | 6,416,025 |
Northrop Grumman Corp. | 169,300 | | 9,203,148 |
| | 15,619,173 |
Airlines - 0.5% |
Continental Airlines, Inc. Class B (a)(d) | 589,900 | | 7,987,246 |
Industrial Conglomerates - 2.3% |
General Electric Co. | 1,024,700 | | 37,401,550 |
Road & Rail - 0.6% |
Union Pacific Corp. | 136,200 | | 9,159,450 |
TOTAL INDUSTRIALS | | 70,167,419 |
INFORMATION TECHNOLOGY - 5.9% |
Communications Equipment - 1.5% |
Cisco Systems, Inc. (a) | 1,282,200 | | 24,746,460 |
Foundry Networks, Inc. (a) | 300 | | 3,948 |
Lucent Technologies, Inc. warrants 12/10/07 (a) | 7,882 | | 12,454 |
| | 24,762,862 |
Computers & Peripherals - 0.7% |
Diebold, Inc. | 192,200 | | 10,711,306 |
IT Services - 0.5% |
Paychex, Inc. | 241,819 | | 8,241,192 |
Software - 3.2% |
Microsoft Corp. | 1,972,300 | | 52,680,133 |
TOTAL INFORMATION TECHNOLOGY | | 96,395,493 |
Common Stocks - continued |
| Shares | | Value (Note 1) |
MATERIALS - 2.6% |
Containers & Packaging - 2.6% |
Ball Corp. | 12 | | $ 528 |
Packaging Corp. of America | 186,400 | | 4,389,720 |
Smurfit-Stone Container Corp. (a) | 2,014,600 | | 37,632,728 |
| | 42,022,976 |
TELECOMMUNICATION SERVICES - 12.0% |
Diversified Telecommunication Services - 12.0% |
BellSouth Corp. | 3,183,000 | | 88,455,570 |
SBC Communications, Inc. | 1,079,230 | | 27,811,757 |
Verizon Communications, Inc. | 1,949,500 | | 78,974,245 |
| | 195,241,572 |
UTILITIES - 0.4% |
Electric Utilities - 0.4% |
Entergy Corp. | 103,300 | | 6,982,047 |
TOTAL COMMON STOCKS (Cost $1,277,038,401) | 1,476,616,191 |
Money Market Funds - 10.7% |
| | | |
Fidelity Cash Central Fund, 2.24% (b) | 161,471,258 | | 161,471,258 |
Fidelity Securities Lending Cash Central Fund, 2.23% (b)(c) | 12,948,350 | | 12,948,350 |
TOTAL MONEY MARKET FUNDS (Cost $174,419,608) | 174,419,608 |
TOTAL INVESTMENT PORTFOLIO - 101.2% (Cost $1,451,458,009) | | | 1,651,035,799 |
NET OTHER ASSETS - (1.2)% | | (19,680,273) |
NET ASSETS - 100% | | $ 1,631,355,526 |
Legend |
(a) Non-income producing |
(b) Affiliated fund that is available only to investment companies and other accounts managed by Fidelity Investments. The rate quoted is the annualized seven-day yield of the fund at period end. A complete listing of the fund's holdings as of its most recent fiscal year end is available upon request. |
(c) Includes investment made with cash collateral received from securities on loan. |
(d) Security or a portion of the security is on loan at period end. |
Income Tax Information |
At December 31, 2004, the fund had a capital loss carryforward of approximately $160,503,000 of which $43,339,000, $107,381,000 and $9,783,000 will expire on December 31, 2009, 2010 and 2011, respectively. |
See accompanying notes which are an integral part of the financial statements.
Annual Report
Fidelity Variable Insurance Products: Growth & Income Portfolio
Financial Statements
Statement of Assets and Liabilities
| December 31, 2004 |
| | |
Assets | | |
Investment in securities, at value (including securities loaned of $12,563,366) (cost $1,451,458,009) - See accompanying schedule | | $ 1,651,035,799 |
Receivable for fund shares sold | | 272,381 |
Dividends receivable | | 1,342,776 |
Interest receivable | | 290,188 |
Prepaid expenses | | 5,942 |
Other receivables | | 28,890 |
Total assets | | 1,652,975,976 |
| | |
Liabilities | | |
Payable for investments purchased | $ 6,520,610 | |
Payable for fund shares redeemed | 964,642 | |
Accrued management fee | 640,386 | |
Distribution fees payable | 141,068 | |
Other affiliated payables | 134,368 | |
Other payables and accrued expenses | 271,026 | |
Collateral on securities loaned, at value | 12,948,350 | |
Total liabilities | | 21,620,450 |
| | |
Net Assets | | $ 1,631,355,526 |
Net Assets consist of: | | |
Paid in capital | | $ 1,572,421,991 |
Undistributed net investment income | | 22,467,135 |
Accumulated undistributed net realized gain (loss) on investments and foreign currency transactions | | (163,111,390) |
Net unrealized appreciation (depreciation) on investments | | 199,577,790 |
Net Assets | | $ 1,631,355,526 |
| | |
Initial Class:
Net Asset Value, offering price and redemption price per share ($704,460,084 ÷ 50,633,218 shares) | | $ 13.91 |
| | |
Service Class:
Net Asset Value, offering price and redemption price per share ($401,391,858 ÷ 29,031,870 shares) | | $ 13.83 |
| | |
Service Class 2:
Net Asset Value, offering price and redemption price per share ($525,503,584 ÷ 38,322,628 shares) | | $ 13.71 |
Statement of Operations
| Year ended December 31, 2004 |
| | |
Investment Income | | |
Dividends | | $ 25,677,482 |
Special Dividends | | 5,800,800 |
Interest | | 2,003,713 |
Security lending | | 101,220 |
Total income | | 33,583,215 |
| | |
Expenses | | |
Management fee | $ 7,335,808 | |
Transfer agent fees | 1,038,668 | |
Distribution fees | 1,462,923 | |
Accounting and security lending fees | 513,242 | |
Non-interested trustees' compensation | 8,453 | |
Custodian fees and expenses | 21,660 | |
Audit | 48,079 | |
Legal | 4,658 | |
Miscellaneous | 360,754 | |
Total expenses before reductions | 10,794,245 | |
Expense reductions | (105,306) | 10,688,939 |
Net investment income (loss) | | 22,894,276 |
Realized and Unrealized Gain (Loss) Net realized gain (loss) on: | | |
Investment securities | 6,143,736 | |
Foreign currency transactions | (11,098) | |
Total net realized gain (loss) | | 6,132,638 |
Change in net unrealized appreciation (depreciation) on investment securities | | 59,376,943 |
Net gain (loss) | | 65,509,581 |
Net increase (decrease) in net assets resulting from operations | | $ 88,403,857 |
See accompanying notes which are an integral part of the financial statements.
Growth & Income Portfolio
Statement of Changes in Net Assets
| Year ended
December 31,
2004 | Year ended
December 31,
2003 |
Increase (Decrease) in Net Assets | | |
Operations | | |
Net investment income (loss) | $ 22,894,276 | $ 11,563,948 |
Net realized gain (loss) | 6,132,638 | (8,957,165) |
Change in net unrealized appreciation (depreciation) | 59,376,943 | 256,023,394 |
Net increase (decrease) in net assets resulting from operations | 88,403,857 | 258,630,177 |
Distributions to shareholders from net investment income | (12,447,351) | (12,772,749) |
Share transactions - net increase (decrease) | 70,330,734 | 210,037,372 |
Total increase (decrease) in net assets | 146,287,240 | 455,894,800 |
| | |
Net Assets | | |
Beginning of period | 1,485,068,286 | 1,029,173,486 |
End of period (including undistributed net investment income of $22,467,135 and undistributed net investment income of $12,027,562, respectively) | $ 1,631,355,526 | $ 1,485,068,286 |
Other Information: | | | |
| Year ended December 31, 2004 |
Share Transactions | Initial Class | Service Class | Service Class 2 |
Shares Sold | 2,753,905 | 2,759,500 | 13,125,821 |
Reinvested | 498,736 | 216,142 | 212,315 |
Redeemed | (11,869,073) | (1,077,681) | (1,149,269) |
Net increase (decrease) | (8,616,432) | 1,897,961 | 12,188,867 |
| | | |
Dollars Sold | $ 36,538,808 | $ 36,240,477 | $ 171,074,614 |
Reinvested | 6,722,963 | 2,898,471 | 2,825,917 |
Redeemed | (156,807,050) | (14,210,796) | (14,952,670) |
Net increase (decrease) | $ (113,545,279) | $ 24,928,152 | $ 158,947,861 |
| | | |
| Year ended December 31, 2003 |
Share Transactions | Initial Class | Service Class | Service Class 2 |
Shares Sold | 8,588,135 | 4,730,597 | 14,305,974 |
Reinvested | 791,445 | 298,276 | 164,516 |
Redeemed | (8,881,933) | (1,062,769) | (1,468,648) |
Net increase (decrease) | 497,647 | 3,966,104 | 13,001,842 |
| | | |
Dollars Sold | $ 102,662,499 | $ 56,731,473 | $ 170,921,383 |
Reinvested | 8,080,656 | 3,030,479 | 1,661,614 |
Redeemed | (103,784,385) | (12,033,144) | (17,233,203) |
Net increase (decrease) | $ 6,958,770 | $ 47,728,808 | $ 155,349,794 |
| | | |
Distributions | Year ended December 31, 2004 |
| Initial Class | Service Class | Service Class 2 |
From net investment income | $ 6,722,963 | $ 2,898,471 | $ 2,825,917 |
| | | |
| Year ended December 31, 2003 |
| Initial Class | Service Class | Service Class 2 |
From net investment income | $ 8,080,656 | $ 3,030,479 | $ 1,661,614 |
See accompanying notes which are an integral part of the financial statements.
Annual Report
Financial Highlights - Initial Class
Years ended December 31, | 2004 | 2003 | 2002 | 2001 | 2000 |
Selected Per-Share Data | | | | | |
Net asset value, beginning of period | $ 13.26 | $ 10.86 | $ 13.19 | $ 15.26 | $ 17.30 |
Income from Investment Operations | | | | | |
Net investment income (loss)C | .21D | .12 | .15 | .18 | .20 |
Net realized and unrealized gain (loss) | .56 | 2.42 | (2.32) | (1.45) | (.81) |
Total from investment operations | .77 | 2.54 | (2.17) | (1.27) | (.61) |
Distributions from net investment income | (.12) | (.14) | (.16) | (.19) | (.19) |
Distributions from net realized gain | - | - | - | (.61) | (1.24) |
Total distributions | (.12) | (.14) | (.16) | (.80) | (1.43) |
Net asset value, end of period | $ 13.91 | $ 13.26 | $ 10.86 | $ 13.19 | $ 15.26 |
Total ReturnA,B | 5.80% | 23.77% | (16.61)% | (8.75)% | (3.62)% |
Ratios to Average Net AssetsE | | | | | |
Expenses before expense reductions | .60% | .59% | .59% | .58% | .58% |
Expenses net of voluntary waivers, if any | .60% | .59% | .59% | .58% | .58% |
Expenses net of all reductions | .60% | .59% | .58% | .56% | .57% |
Net investment income (loss) | 1.58% | 1.02% | 1.30% | 1.34% | 1.26% |
Supplemental Data | | | | | |
Net assets, end of period (000 omitted) | $ 704,460 | $ 785,494 | $ 638,124 | $ 893,359 | $ 1,011,393 |
Portfolio turnover rate | 23% | 25% | 43% | 58% | 72% |
A Total returns do not reflect charges attributable to your insurance company's separate account. Inclusion of these charges would reduce the total returns shown.
B Total returns would have been lower had certain expenses not been reduced during the periods shown.
C Calculated based on average shares outstanding during the period.
D Investment income per share reflects a special dividend which amounted to $.05 per share.
E Expense ratios reflect operating expenses of the class. Expenses before reductions do not reflect amounts reimbursed by the investment adviser or reductions from brokerage service arrangements or other expense offset arrangements and do not represent the amount paid by the class during periods when reimbursements or reductions occur. Expenses net of any voluntary waivers reflect expenses after reimbursement by the investment adviser but prior to reductions from brokerage service arrangements or other expense offset arrangements. Expenses net of all reductions represent the net expenses paid by the class.
Financial Highlights - Service Class
Years ended December 31, | 2004 | 2003 | 2002 | 2001 | 2000 |
Selected Per-Share Data | | | | | |
Net asset value, beginning of period | $ 13.18 | $ 10.80 | $ 13.12 | $ 15.19 | $ 17.24 |
Income from Investment Operations | | | | | |
Net investment income (loss)C | .19D | .11 | .14 | .16 | .18 |
Net realized and unrealized gain (loss) | .57 | 2.40 | (2.31) | (1.44) | (.80) |
Total from investment operations | .76 | 2.51 | (2.17) | (1.28) | (.62) |
Distributions from net investment income | (.11) | (.13) | (.15) | (.18) | (.19) |
Distributions from net realized gain | - | - | - | (.61) | (1.24) |
Total distributions | (.11) | (.13) | (.15) | (.79) | (1.43) |
Net asset value, end of period | $ 13.83 | $ 13.18 | $ 10.80 | $ 13.12 | $ 15.19 |
Total ReturnA,B | 5.75% | 23.60% | (16.69)% | (8.85)% | (3.69)% |
Ratios to Average Net AssetsE | | | | | |
Expenses before expense reductions | .70% | .69% | .69% | .68% | .69% |
Expenses net of voluntary waivers, if any | .70% | .69% | .69% | .68% | .69% |
Expenses net of all reductions | .70% | .69% | .68% | .66% | .68% |
Net investment income (loss) | 1.48% | .92% | 1.20% | 1.24% | 1.16% |
Supplemental Data | | | | | |
Net assets, end of period (000 omitted) | $ 401,392 | $ 357,585 | $ 250,160 | $ 281,194 | $ 212,994 |
Portfolio turnover rate | 23% | 25% | 43% | 58% | 72% |
A Total returns do not reflect charges attributable to your insurance company's separate account. Inclusion of these charges would reduce the total returns shown.
B Total returns would have been lower had certain expenses not been reduced during the periods shown.
C Calculated based on average shares outstanding during the period.
D Investment income per share reflects a special dividend which amounted to $.05 per share.
E Expense ratios reflect operating expenses of the class. Expenses before reductions do not reflect amounts reimbursed by the investment adviser or reductions from brokerage service arrangements or other expense offset arrangements and do not represent the amount paid by the class during periods when reimbursements or reductions occur. Expenses net of any voluntary waivers reflect expenses after reimbursement by the investment adviser but prior to reductions from brokerage service arrangements or other expense offset arrangements. Expenses net of all reductions represent the net expenses paid by the class.
See accompanying notes which are an integral part of the financial statements.
Growth & Income Portfolio
Financial Highlights - Service Class 2
Years ended December 31, | 2004 | 2003 | 2002 | 2001 | 2000G |
Selected Per-Share Data | | | | | |
Net asset value, beginning of period | $ 13.09 | $ 10.73 | $ 13.07 | $ 15.17 | $ 16.94 |
Income from Investment Operations | | | | | |
Net investment income (loss)E | .17F | .09 | .12 | .14 | .15 |
Net realized and unrealized gain (loss) | .55 | 2.39 | (2.30) | (1.44) | (.49) |
Total from investment operations | .72 | 2.48 | (2.18) | (1.30) | (.34) |
Distributions from net investment income | (.10) | (.12) | (.16) | (.19) | (.19) |
Distributions from net realized gain | - | - | - | (.61) | (1.24) |
Total distributions | (.10) | (.12) | (.16) | (.80) | (1.43) |
Net asset value, end of period | $ 13.71 | $ 13.09 | $ 10.73 | $ 13.07 | $ 15.17 |
Total ReturnB,C,D | 5.52% | 23.44% | (16.84)% | (9.01)% | (2.11)% |
Ratios to Average Net AssetsH | | | | | |
Expenses before expense reductions | .85% | .85% | .85% | .84% | .85%A |
Expenses net of voluntary waivers, if any | .85% | .85% | .85% | .84% | .85%A |
Expenses net of all reductions | .85% | .84% | .84% | .82% | .84%A |
Net investment income (loss) | 1.33% | .76% | 1.05% | 1.08% | 1.00%A |
Supplemental Data | | | | | |
Net assets, end of period (000 omitted) | $ 525,504 | $ 341,989 | $ 140,890 | $ 76,237 | $ 13,025 |
Portfolio turnover rate | 23% | 25% | 43% | 58% | 72% |
A Annualized
B Total returns for periods of less than one year are not annualized.
C Total returns do not reflect charges attributable to your insurance company's separate account. Inclusion of these charges would reduce the total returns shown.
D Total returns would have been lower had certain expenses not been reduced during the periods shown.
E Calculated based on average shares outstanding during the period.
F Investment income per share reflects a special dividend which amounted to $.05 per share.
G For the period January 12, 2000 (commencement of operations) to December 31, 2000.
H Expense ratios reflect operating expenses of the class. Expenses before reductions do not reflect amounts reimbursed by the investment adviser or reductions from brokerage service arrangements or other expense offset arrangements and do not represent the amount paid by the class during periods when reimbursements or reductions occur. Expense ratios before reductions for start-up periods may not be representative of longer-term operating periods. Expenses net of any voluntary waivers reflect expenses after reimbursement by the investment adviser but prior to reductions from brokerage service arrangements or other expense offset arrangements. Expenses net of all reductions represent the net expenses paid by the class.
See accompanying notes which are an integral part of the financial statements.
Annual Report
Fidelity Variable Insurance Products: Growth Opportunities Portfolio
Performance: The Bottom Line
Average annual total return reflects the change in the value of an investment, assuming reinvestment of the class' dividend income and capital gains (the profits earned upon the sale of securities that have grown in value) and assuming a constant rate of performance each year. During periods of reimbursement by Fidelity, a fund's total return will be greater than it would be had the reimbursement not occurred. Performance numbers are net of all underlying fund operating expenses, but do not include any insurance charges imposed by your insurance company's separate account. If performance information included the effect of these additional charges, the total returns would have been lower. How a fund did yesterday is no guarantee of how it will do tomorrow.
Average Annual Total Returns
Periods ended December 31, 2004 | Past 1
year | Past 5
years | Life of
fund A |
Fidelity ® VIP: Growth Opportunities - Initial Class | 7.19% | -5.04% | 7.41% |
Fidelity VIP: Growth Opportunities - Service Class B | 7.06% | -5.14% | 7.33% |
Fidelity VIP: Growth Opportunities - Service Class 2 C | 6.89% | -5.30% | 7.25% |
A From January 3, 1995
B The initial offering of Service Class shares took place November 3, 1997. Performance for Service Class shares reflects an asset based service fee (12b-1 fee), and returns prior to November 3, 1997 are those of Initial Class and do not include the effects of Service Class 12b-1 fee. Had Service Class shares' 12b-1 fee been reflected, returns prior to November 3, 1997 would have been lower.
C The initial offering of Service Class 2 shares took place January 12, 2000. Performance for Service Class 2 shares reflects an asset based service fee (12b-1 fee). Returns from November 3, 1997 to January 12, 2000 are those of Service Class which reflect a different 12b-1 fee. Service Class 2 returns prior to November 3, 1997 are those of Initial Class and do not include the effects of a 12b-1 fee. Had Service Class 2 shares' 12b-1 fee been reflected, returns prior to January 12, 2000 would have been lower.
$10,000 Over Life of Fund
Let's say hypothetically that $10,000 was invested in Fidelity® Variable Insurance Products: Growth Opportunities Portfolio - Initial Class on January 3, 1995, when the fund started. The chart shows how the value of your investment would have changed, and also shows how the S&P 500® Index performed over the same period.

Growth Opportunities Portfolio
Fidelity Variable Insurance Products: Growth Opportunities
Management's Discussion of Fund Performance
Comments from Bettina Doulton, Portfolio Manager of Fidelity® Variable Insurance Products: Growth Opportunities Portfolio
The year ending December 31, 2004, generally was positive for equity investors, as many stock market benchmarks produced double-digit gains. Broad-based themes included the continued dominance of small-cap stocks, which outperformed large-caps for the sixth consecutive year. The small-cap Russell 2000® Index was up 18.33% in 2004, while the larger-cap Standard & Poor's 500SM Index rose 10.88%. Value stocks ended the year well ahead of growth stocks: The Russell 3000® Value Index advanced 16.94%, compared to 6.93% for the Russell 3000 Growth Index. Energy and basic materials stocks led the market upward. Energy stocks were boosted by record-high oil prices, while strong demand from China helped support commodity prices. The health care sector was among the market's weakest performers. Technology also fell off the pace, though it was helped by a rally late in the year. The tech-heavy NASDAQ Composite® Index returned 9.15%, thanks primarily to a 14.87% jump in the fourth quarter. Elsewhere, the Dow Jones Industrial AverageSM gained 5.37% for the year.
For the year ending December 31, 2004, the fund underperformed both the S&P 500® and the LipperSM Variable Annuity Growth Funds Average, which returned 10.36%. Compared to the S&P 500, the fund's overweighting in weak-performing media and semiconductor stocks hurt performance. Traditional media plays such as Viacom and Spanish-language broadcasting company Univision were detractors, along with tech names National Semiconductor and Analog Devices. Underweighting strong-performing energy stocks also proved to be a disappointment. Energy companies Schlumberger, BP and Baker Hughes were among the fund's top relative and absolute performers, but underweighting such names as Exxon Mobil, ChevronTexaco and ConocoPhillips largely offset those gains. Another negative was the fund's large-cap bias in a period that favored smaller-cap stocks. On the positive side, good stock selection in consumer staples and health care boosted returns, led by personal product makers such as Gillette, eye-care company Alcon and health care services provider UnitedHealth Group.
The views expressed in this statement reflect those of the portfolio manager only through the end of the period of the report as stated on the cover and do not necessarily represent the views of Fidelity or any other person in the Fidelity organization. Any such views are subject to change at any time based upon market or other conditions and Fidelity disclaims any responsibility to update such views. These views may not be relied on as investment advice and, because investment decisions for a Fidelity fund are based on numerous factors, may not be relied on as an indication of trading intent on behalf of any Fidelity fund.
Annual Report
Fidelity Variable Insurance Products: Growth Opportunities Portfolio
Investment Summary
Top Five Stocks as of December 31, 2004 |
| % of fund's net assets |
General Electric Co. | 3.8 |
Bank of America Corp. | 2.9 |
Microsoft Corp. | 2.5 |
Exxon Mobil Corp. | 2.3 |
American Express Co. | 2.2 |
| 13.7 |
Top Five Market Sectors as of December 31, 2004 |
| % of fund's net assets |
Information Technology | 21.4 |
Consumer Discretionary | 17.3 |
Financials | 16.2 |
Industrials | 12.4 |
Health Care | 9.9 |
Asset Allocation as of December 31, 2004 |
% of fund's net assets* |
| Stocks | 95.0% | |
| Short-Term Investments and Net Other Assets | 5.0% | |
* Foreign investments | 4.7% | |

Growth Opportunities Portfolio
Fidelity Variable Insurance Products: Growth Opportunities Portfolio
Investments December 31, 2004
Showing Percentage of Net Assets
Common Stocks - 94.7% |
| Shares | | Value (Note 1) |
CONSUMER DISCRETIONARY - 17.3% |
Automobiles - 0.2% |
Harley-Davidson, Inc. | 30,400 | | $ 1,846,800 |
Hotels, Restaurants & Leisure - 1.8% |
Carnival Corp. unit | 39,000 | | 2,247,570 |
Hilton Hotels Corp. | 210,170 | | 4,779,266 |
Royal Caribbean Cruises Ltd. | 23,500 | | 1,279,340 |
Starwood Hotels & Resorts Worldwide, Inc. unit | 85,200 | | 4,975,680 |
| | 13,281,856 |
Internet & Catalog Retail - 0.7% |
eBay, Inc. (a) | 43,400 | | 5,046,552 |
Leisure Equipment & Products - 0.3% |
Brunswick Corp. | 40,900 | | 2,024,550 |
Media - 9.8% |
Clear Channel Communications, Inc. | 42,600 | | 1,426,674 |
DreamWorks Animation SKG, Inc.
Class A | 26,000 | | 975,260 |
Fox Entertainment Group, Inc.
Class A (a) | 245,300 | | 7,668,078 |
Grupo Televisa SA de CV
sponsored ADR | 38,000 | | 2,299,000 |
Lamar Advertising Co. Class A (a) | 45,600 | | 1,950,768 |
Martha Stewart Living Omnimedia, Inc. Class A (a)(d) | 88,500 | | 2,568,270 |
McGraw-Hill Companies, Inc. | 68,000 | | 6,224,720 |
Meredith Corp. | 41,800 | | 2,265,560 |
News Corp. Class B (d) | 547,700 | | 10,515,840 |
Omnicom Group, Inc. | 105,400 | | 8,887,328 |
Time Warner, Inc. (a) | 212,300 | | 4,127,112 |
Univision Communications, Inc.
Class A (a) | 230,700 | | 6,752,589 |
Viacom, Inc. Class B (non-vtg.) | 204,420 | | 7,438,844 |
Walt Disney Co. | 256,700 | | 7,136,260 |
XM Satellite Radio Holdings, Inc.
Class A (a) | 49,400 | | 1,858,428 |
| | 72,094,731 |
Multiline Retail - 1.1% |
Kmart Holding Corp. (a)(d) | 12,700 | | 1,256,665 |
Kohl's Corp. (a) | 49,400 | | 2,428,998 |
Nordstrom, Inc. | 95,000 | | 4,439,350 |
| | 8,125,013 |
Specialty Retail - 2.3% |
Best Buy Co., Inc. | 32,500 | | 1,931,150 |
Home Depot, Inc. | 210,600 | | 9,001,044 |
Lowe's Companies, Inc. | 6,800 | | 391,612 |
Staples, Inc. | 157,097 | | 5,295,740 |
| | 16,619,546 |
Textiles, Apparel & Luxury Goods - 1.1% |
Coach, Inc. (a) | 24,800 | | 1,398,720 |
NIKE, Inc. Class B | 23,900 | | 2,167,491 |
|
| Shares | | Value (Note 1) |
Polo Ralph Lauren Corp. Class A | 91,100 | | $ 3,880,860 |
Warnaco Group, Inc. (a) | 44,200 | | 954,720 |
| | 8,401,791 |
TOTAL CONSUMER DISCRETIONARY | | 127,440,839 |
CONSUMER STAPLES - 7.0% |
Beverages - 0.6% |
PepsiCo, Inc. | 80,600 | | 4,207,320 |
Food & Staples Retailing - 2.0% |
CVS Corp. | 71,600 | | 3,227,012 |
Wal-Mart Stores, Inc. | 217,700 | | 11,498,914 |
| | 14,725,926 |
Food Products - 1.4% |
Archer-Daniels-Midland Co. | 144,000 | | 3,212,640 |
Bunge Ltd. | 77,200 | | 4,401,172 |
Hershey Foods Corp. | 45,000 | | 2,499,300 |
| | 10,113,112 |
Household Products - 0.2% |
Procter & Gamble Co. | 21,640 | | 1,191,931 |
Personal Products - 1.9% |
Gillette Co. | 319,370 | | 14,301,389 |
Tobacco - 0.9% |
Altria Group, Inc. | 110,420 | | 6,746,662 |
TOTAL CONSUMER STAPLES | | 51,286,340 |
ENERGY - 6.3% |
Energy Equipment & Services - 3.1% |
Baker Hughes, Inc. | 65,700 | | 2,803,419 |
Halliburton Co. | 149,000 | | 5,846,760 |
Schlumberger Ltd. (NY Shares) | 210,600 | | 14,099,670 |
| | 22,749,849 |
Oil & Gas - 3.2% |
BP PLC sponsored ADR | 109,490 | | 6,394,216 |
Exxon Mobil Corp. | 329,700 | | 16,900,422 |
| | 23,294,638 |
TOTAL ENERGY | | 46,044,487 |
FINANCIALS - 15.9% |
Capital Markets - 5.7% |
Charles Schwab Corp. | 62,000 | | 741,520 |
E*TRADE Financial Corp. (a) | 322,500 | | 4,821,375 |
Goldman Sachs Group, Inc. | 111,600 | | 11,610,864 |
Lehman Brothers Holdings, Inc. | 48,200 | | 4,216,536 |
Merrill Lynch & Co., Inc. | 224,400 | | 13,412,388 |
Morgan Stanley | 123,900 | | 6,878,928 |
| | 41,681,611 |
Common Stocks - continued |
| Shares | | Value (Note 1) |
FINANCIALS - continued |
Commercial Banks - 3.8% |
Bank of America Corp. | 457,600 | | $ 21,502,624 |
Wells Fargo & Co. | 105,500 | | 6,556,825 |
| | 28,059,449 |
Consumer Finance - 2.7% |
American Express Co. | 283,600 | | 15,986,532 |
SLM Corp. | 67,900 | | 3,625,181 |
| | 19,611,713 |
Diversified Financial Services - 1.6% |
Citigroup, Inc. | 247,207 | | 11,910,433 |
Insurance - 2.1% |
American International Group, Inc. | 237,262 | | 15,580,996 |
TOTAL FINANCIALS | | 116,844,202 |
HEALTH CARE - 9.9% |
Biotechnology - 1.1% |
Genentech, Inc. (a) | 74,900 | | 4,077,556 |
Genzyme Corp. - General Division (a) | 36,000 | | 2,090,520 |
OSI Pharmaceuticals, Inc. (a) | 22,000 | | 1,646,700 |
| | 7,814,776 |
Health Care Equipment & Supplies - 2.9% |
Alcon, Inc. | 41,100 | | 3,312,660 |
Becton, Dickinson & Co. | 74,700 | | 4,242,960 |
Boston Scientific Corp. (a) | 35,700 | | 1,269,135 |
C.R. Bard, Inc. | 47,600 | | 3,045,448 |
Dade Behring Holdings, Inc. (a) | 47,500 | | 2,660,000 |
Medtronic, Inc. | 71,300 | | 3,541,471 |
St. Jude Medical, Inc. (a) | 85,660 | | 3,591,724 |
| | 21,663,398 |
Health Care Providers & Services - 1.6% |
UnitedHealth Group, Inc. | 130,300 | | 11,470,309 |
Pharmaceuticals - 4.3% |
Abbott Laboratories | 44,430 | | 2,072,660 |
Johnson & Johnson | 151,200 | | 9,589,104 |
Pfizer, Inc. | 368,193 | | 9,900,710 |
Schering-Plough Corp. | 76,000 | | 1,586,880 |
Wyeth | 198,500 | | 8,454,115 |
| | 31,603,469 |
TOTAL HEALTH CARE | | 72,551,952 |
INDUSTRIALS - 12.4% |
Aerospace & Defense - 2.3% |
Honeywell International, Inc. | 212,900 | | 7,538,789 |
Lockheed Martin Corp. | 19,100 | | 1,061,005 |
Northrop Grumman Corp. | 39,000 | | 2,120,040 |
The Boeing Co. | 114,100 | | 5,906,957 |
| | 16,626,791 |
|
| Shares | | Value (Note 1) |
Air Freight & Logistics - 2.6% |
FedEx Corp. | 121,800 | | $ 11,996,082 |
United Parcel Service, Inc. Class B | 83,500 | | 7,135,910 |
| | 19,131,992 |
Airlines - 0.4% |
Southwest Airlines Co. | 170,150 | | 2,770,042 |
Commercial Services & Supplies - 0.2% |
Monster Worldwide, Inc. (a) | 41,200 | | 1,385,968 |
Construction & Engineering - 0.4% |
Fluor Corp. | 59,500 | | 3,243,345 |
Industrial Conglomerates - 5.7% |
3M Co. | 59,700 | | 4,899,579 |
General Electric Co. | 769,450 | | 28,084,923 |
Tyco International Ltd. | 242,900 | | 8,681,246 |
| | 41,665,748 |
Machinery - 0.8% |
Caterpillar, Inc. | 26,000 | | 2,535,260 |
Deere & Co. | 47,600 | | 3,541,440 |
| | 6,076,700 |
TOTAL INDUSTRIALS | | 90,900,586 |
INFORMATION TECHNOLOGY - 21.4% |
Communications Equipment - 6.2% |
Avaya, Inc. (a) | 83,400 | | 1,434,480 |
Cisco Systems, Inc. (a) | 514,060 | | 9,921,358 |
Extreme Networks, Inc. (a) | 6,900 | | 45,195 |
Juniper Networks, Inc. (a) | 510,000 | | 13,866,900 |
Motorola, Inc. | 405,800 | | 6,979,760 |
QUALCOMM, Inc. | 308,800 | | 13,093,120 |
| | 45,340,813 |
Computers & Peripherals - 4.2% |
Dell, Inc. (a) | 207,200 | | 8,731,408 |
Diebold, Inc. | 89,100 | | 4,965,543 |
EMC Corp. (a) | 190,700 | | 2,835,709 |
Network Appliance, Inc. (a) | 421,800 | | 14,012,196 |
| | 30,544,856 |
Electronic Equipment & Instruments - 0.3% |
CDW Corp. | 27,300 | | 1,811,355 |
Internet Software & Services - 1.0% |
Yahoo!, Inc. (a) | 201,500 | | 7,592,520 |
IT Services - 0.3% |
Affiliated Computer Services, Inc.
Class A (a) | 31,700 | | 1,908,023 |
Office Electronics - 0.4% |
Xerox Corp. (a) | 192,200 | | 3,269,322 |
Semiconductors & Semiconductor Equipment - 4.5% |
Advanced Micro Devices, Inc. (a) | 69,700 | | 1,534,794 |
Altera Corp. (a) | 63,400 | | 1,312,380 |
Analog Devices, Inc. | 112,100 | | 4,138,732 |
Freescale Semiconductor, Inc. Class B | 96,286 | | 1,767,811 |
Common Stocks - continued |
| Shares | | Value (Note 1) |
INFORMATION TECHNOLOGY - continued |
Semiconductors & Semiconductor Equipment - continued |
Intel Corp. | 400,110 | | $ 9,358,573 |
KLA-Tencor Corp. (a) | 16,300 | | 759,254 |
Marvell Technology Group Ltd. (a) | 32,100 | | 1,138,587 |
National Semiconductor Corp. | 321,600 | | 5,772,720 |
Texas Instruments, Inc. | 303,500 | | 7,472,170 |
Xilinx, Inc. | 3,300 | | 97,845 |
| | 33,352,866 |
Software - 4.5% |
Microsoft Corp. | 684,120 | | 18,272,845 |
Oracle Corp. (a) | 201,700 | | 2,767,324 |
Red Hat, Inc. (a) | 197,699 | | 2,639,282 |
Symantec Corp. (a) | 211,466 | | 5,447,364 |
VERITAS Software Corp. (a) | 136,600 | | 3,899,930 |
| | 33,026,745 |
TOTAL INFORMATION TECHNOLOGY | | 156,846,500 |
MATERIALS - 2.6% |
Chemicals - 2.6% |
Dow Chemical Co. | 142,100 | | 7,035,371 |
Monsanto Co. | 103,500 | | 5,749,425 |
Praxair, Inc. | 143,300 | | 6,326,695 |
| | 19,111,491 |
TELECOMMUNICATION SERVICES - 1.9% |
Diversified Telecommunication Services - 1.8% |
SBC Communications, Inc. | 231,060 | | 5,954,416 |
Verizon Communications, Inc. | 173,800 | | 7,040,638 |
| | 12,995,054 |
Wireless Telecommunication Services - 0.1% |
SpectraSite, Inc. (a) | 18,200 | | 1,053,780 |
TOTAL TELECOMMUNICATION SERVICES | | 14,048,834 |
TOTAL COMMON STOCKS (Cost $538,285,820) | 695,075,231 |
Convertible Preferred Stocks - 0.3% |
| | | |
FINANCIALS - 0.3% |
Thrifts & Mortgage Finance - 0.3% |
Fannie Mae 5.375% | 20 | | 2,107,500 |
TOTAL CONVERTIBLE PREFERRED STOCKS (Cost $2,000,000) | 2,107,500 |
Money Market Funds - 5.2% |
| Shares | | Value (Note 1) |
Fidelity Cash Central Fund, 2.24% (b) | 30,774,121 | | $ 30,774,121 |
Fidelity Securities Lending Cash Central Fund, 2.23% (b)(c) | 7,454,150 | | 7,454,150 |
TOTAL MONEY MARKET FUNDS (Cost $38,228,271) | 38,228,271 |
TOTAL INVESTMENT
PORTFOLIO - 100.2% (Cost $578,514,091) | | | 735,411,002 |
NET OTHER ASSETS - (0.2)% | | | (1,607,777) |
NET ASSETS - 100% | | $ 733,803,225 |
Legend |
(a) Non-income producing |
(b) Affiliated fund that is available only to investment companies and other accounts managed by Fidelity Investments. The rate quoted is the annualized seven-day yield of the fund at period end. A complete listing of the fund's holdings as of its most recent fiscal year end is available upon request. |
(c) Includes investment made with cash collateral received from securities on loan. |
(d) Security or a portion of the security is on loan at period end. |
Income Tax Information |
At December 31, 2004, the fund had a capital loss carryforward of approximately $265,682,000 of which $189,000, $149,878,000 and $115,615,000 will expire on December 31, 2008, 2009 and 2010, respectively. |
See accompanying notes which are an integral part of the financial statements.
Annual Report
Fidelity Variable Insurance Products: Growth Opportunities Portfolio
Financial Statements
Statement of Assets and Liabilities
| December 31, 2004 |
Assets | | |
Investment in securities, at value (including securities loaned of $7,237,330) (cost $578,514,091) - See accompanying schedule | | $ 735,411,002 |
Cash | | 3,055 |
Receivable for investments sold | | 11,249,546 |
Receivable for fund shares sold | | 135,855 |
Dividends receivable | | 703,580 |
Interest receivable | | 65,698 |
Prepaid expenses | | 2,788 |
Other receivables | | 106,538 |
Total assets | | 747,678,062 |
| | |
Liabilities | | |
Payable for investments purchased | $ 5,156,285 | |
Payable for fund shares redeemed | 636,421 | |
Accrued management fee | 347,845 | |
Distribution fees payable | 30,301 | |
Other affiliated payables | 63,647 | |
Other payables and accrued expenses | 186,188 | |
Collateral on securities loaned, at value | 7,454,150 | |
Total liabilities | | 13,874,837 |
| | |
Net Assets | | $ 733,803,225 |
Net Assets consist of: | | |
Paid in capital | | $ 838,195,433 |
Undistributed net investment income | | 6,108,550 |
Accumulated undistributed net realized gain (loss) on investments and foreign currency transactions | | (267,397,669) |
Net unrealized appreciation (depreciation) on investments | | 156,896,911 |
Net Assets | | $ 733,803,225 |
| | |
Initial Class:
Net Asset Value, offering price and redemption price
per share ($459,975,294 ÷ 28,629,430 shares) | | $ 16.07 |
| | |
Service Class:
Net Asset Value, offering price and redemption price
per share ($212,890,231 ÷ 13,261,966 shares) | | $ 16.05 |
| | |
Service Class 2:
Net Asset Value, offering price and redemption price
per share ($60,937,700 ÷ 3,817,776 shares) | | $ 15.96 |
Statement of Operations
| Year ended December 31, 2004 |
Investment Income | | |
Dividends | | $ 9,314,024 |
Special Dividends | | 2,052,360 |
Interest | | 376,235 |
Security lending | | 80,267 |
Total income | | 11,822,886 |
| | |
Expenses | | |
Management fee | $ 4,230,844 | |
Transfer agent fees | 507,306 | |
Distribution fees | 361,674 | |
Accounting and security lending fees | 275,838 | |
Non-interested trustees' compensation | 4,060 | |
Custodian fees and expenses | 23,270 | |
Audit | 42,178 | |
Legal | 2,383 | |
Miscellaneous | 199,827 | |
Total expenses before reductions | 5,647,380 | |
Expense reductions | (139,491) | 5,507,889 |
Net investment income (loss) | | 6,314,997 |
Realized and Unrealized Gain (Loss) Net realized gain (loss) on: | | |
Investment securities | 13,616,926 | |
Foreign currency transactions | 7,633 | |
Futures contracts | 1,324,924 | |
Total net realized gain (loss) | | 14,949,483 |
Change in net unrealized appreciation (depreciation) on: Investment securities | 27,611,661 | |
Assets and liabilities in foreign currencies | (9,841) | |
Futures contracts | (853,313) | |
Total change in net unrealized appreciation (depreciation) | | 26,748,507 |
Net gain (loss) | | 41,697,990 |
Net increase (decrease) in net assets resulting from operations | | $ 48,012,987 |
See accompanying notes which are an integral part of the financial statements.
Growth Opportunities Portfolio
Statement of Changes in Net Assets
| Year ended
December 31,
2004 | Year ended
December 31,
2003 |
Increase (Decrease) in Net Assets | | |
Operations | | |
Net investment income (loss) | $ 6,314,997 | $ 3,979,285 |
Net realized gain (loss) | 14,949,483 | 18,204,829 |
Change in net unrealized appreciation (depreciation) | 26,748,507 | 154,484,695 |
Net increase (decrease) in net assets resulting from operations | 48,012,987 | 176,668,809 |
Distributions to shareholders from net investment income | (3,865,122) | (4,842,328) |
Share transactions - net increase (decrease) | (85,843,295) | (29,607,058) |
Total increase (decrease) in net assets | (41,695,430) | 142,219,423 |
| | |
Net Assets | | |
Beginning of period | 775,498,655 | 633,279,232 |
End of period (including undistributed net investment income of $6,108,550 and undistributed net investment income of $3,663,993, respectively) | $ 733,803,225 | $ 775,498,655 |
Other Information: | | | |
Share Transactions | Year ended December 31, 2004 |
| Initial Class | Service Class | Service Class 2 |
Shares Sold | 2,729,868 | 870,070 | 885,612 |
Reinvested | 170,805 | 67,879 | 13,011 |
Redeemed | (6,832,162) | (2,590,797) | (1,093,977) |
Net increase (decrease) | (3,931,489) | (1,652,848) | (195,354) |
| | | |
Dollars Sold | $ 41,720,058 | $ 13,156,606 | $ 13,251,573 |
Reinvested | 2,623,558 | 1,042,625 | 198,939 |
Redeemed | (102,539,187) | (38,992,902) | (16,304,565) |
Net increase (decrease) | $ (58,195,571) | $ (24,793,671) | $ (2,854,053) |
| | | |
Share Transactions | Year ended December 31, 2003 |
| Initial Class | Service Class | Service Class 2 |
Shares Sold | 4,861,113 | 1,609,284 | 1,388,002 |
Reinvested | 309,123 | 114,933 | 19,452 |
Redeemed | (7,052,265) | (2,906,117) | (959,886) |
Net increase (decrease) | (1,882,029) | (1,181,900) | 447,568 |
| | | |
Dollars Sold | $ 63,883,410 | $ 21,117,379 | $ 18,018,110 |
Reinvested | 3,375,625 | 1,255,069 | 211,634 |
Redeemed | (88,846,190) | (36,517,831) | (12,104,264) |
Net increase (decrease) | $ (21,587,155) | $ (14,145,383) | $ 6,125,480 |
| | | |
Distributions | Year ended December 31, 2004 |
| Initial Class | Service Class | Service Class 2 |
From net investment income | $ 2,623,558 | $ 1,042,625 | $ 198,939 |
From net realized gain | - | - | - |
Total | $ 2,623,558 | $ 1,042,625 | $ 198,939 |
| Year ended December 31, 2003 |
| Initial Class | Service Class | Service Class 2 |
From net investment income | $ 3,375,625 | $ 1,255,069 | $ 211,634 |
From net realized gain | - | - | - |
Total | $ 3,375,625 | $ 1,255,069 | $ 211,634 |
See accompanying notes which are an integral part of the financial statements.
Annual Report
Financial Highlights - Initial Class
Years ended December 31, | 2004 | 2003 | 2002 | 2001 | 2000 |
Selected Per-Share Data | | | | | |
Net asset value, beginning of period | $ 15.07 | $ 11.71 | $ 15.13 | $ 17.74 | $ 23.15 |
Income from Investment Operations | | | | | |
Net investment income (loss) C | .14 D | .08 | .09 | .12 | .06 |
Net realized and unrealized gain (loss) | .94 | 3.38 | (3.37) | (2.67) | (3.77) |
Total from investment operations | 1.08 | 3.46 | (3.28) | (2.55) | (3.71) |
Distributions from net investment income | (.08) | (.10) | (.14) | (.06) | (.29) |
Distributions from net realized gain | - | - | - | - | (1.41) |
Total distributions | (.08) | (.10) | (.14) | (.06) | (1.70) |
Net asset value, end of period | $ 16.07 | $ 15.07 | $ 11.71 | $ 15.13 | $ 17.74 |
Total Return A, B | 7.19% | 29.87% | (21.84)% | (14.42)% | (17.07)% |
Ratios to Average Net Assets E | | | | | |
Expenses before expense reductions | .72% | .72% | .70% | .69% | .68% |
Expenses net of voluntary waivers, if any | .72% | .72% | .70% | .69% | .68% |
Expenses net of all reductions | .70% | .70% | .66% | .67% | .66% |
Net investment income (loss) | .91% | .64% | .68% | .79% | .31% |
Supplemental Data | | | | | |
Net assets, end of period (000 omitted) | $ 459,975 | $ 490,710 | $ 403,476 | $ 652,493 | $ 951,875 |
Portfolio turnover rate | 65% | 62% | 60% | 89% | 117% |
A Total returns do not reflect charges attributable to your insurance company's separate account. Inclusion of these charges would reduce the total returns shown.
B Total returns would have been lower had certain expenses not been reduced during the periods shown.
C Calculated based on average shares outstanding during the period.
D Investment income per share reflects a special dividend which amounted to $.04 per share.
E Expense ratios reflect operating expenses of the class. Expenses before reductions do not reflect amounts reimbursed by the investment adviser or reductions from brokerage service arrangements or other expense offset arrangements and do not represent the amount paid by the class during periods when reimbursements or reductions occur. Expenses net of any voluntary waivers reflect expenses after reimbursement by the investment adviser but prior to reductions from brokerage service arrangements or other expense offset arrangements. Expenses net of all reductions represent the net expenses paid by the class.
Financial Highlights - Service Class
Years ended December 31, | 2004 | 2003 | 2002 | 2001 | 2000 |
Selected Per-Share Data | | | | | |
Net asset value, beginning of period | $ 15.06 | $ 11.70 | $ 15.11 | $ 17.71 | $ 23.12 |
Income from Investment Operations | | | | | |
Net investment income (loss) C | .12 D | .07 | .08 | .11 | .04 |
Net realized and unrealized gain (loss) | .94 | 3.37 | (3.37) | (2.67) | (3.76) |
Total from investment operations | 1.06 | 3.44 | (3.29) | (2.56) | (3.72) |
Distributions from net investment income | (.07) | (.08) | (.12) | (.04) | (.28) |
Distributions from net realized gain | - | - | - | - | (1.41) |
Total distributions | (.07) | (.08) | (.12) | (.04) | (1.69) |
Net asset value, end of period | $ 16.05 | $ 15.06 | $ 11.70 | $ 15.11 | $ 17.71 |
Total Return A, B | 7.06% | 29.66% | (21.92)% | (14.49)% | (17.13)% |
Ratios to Average Net Assets E | | | | | |
Expenses before expense reductions | .82% | .82% | .80% | .79% | .79% |
Expenses net of voluntary waivers, if any | .82% | .82% | .80% | .79% | .79% |
Expenses net of all reductions | .80% | .80% | .77% | .77% | .76% |
Net investment income (loss) | .81% | .54% | .58% | .69% | .21% |
Supplemental Data | | | | | |
Net assets, end of period (000 omitted) | $ 212,890 | $ 224,660 | $ 188,318 | $ 278,446 | $ 345,960 |
Portfolio turnover rate | 65% | 62% | 60% | 89% | 117% |
A Total returns do not reflect charges attributable to your insurance company's separate account. Inclusion of these charges would reduce the total returns shown.
B Total returns would have been lower had certain expenses not been reduced during the periods shown.
C Calculated based on average shares outstanding during the period.
D Investment income per share reflects a special dividend which amounted to $.04 per share.
E Expense ratios reflect operating expenses of the class. Expenses before reductions do not reflect amounts reimbursed by the investment adviser or reductions from brokerage service arrangements or other expense offset arrangements and do not represent the amount paid by the class during periods when reimbursements or reductions occur. Expenses net of any voluntary waivers reflect expenses after reimbursement by the investment adviser but prior to reductions from brokerage service arrangements or other expense offset arrangements. Expenses net of all reductions represent the net expenses paid by the class.
See accompanying notes which are an integral part of the financial statements.
Growth Opportunities Portfolio
Financial Highlights - Service Class 2
Years ended December 31, | 2004 | 2003 | 2002 | 2001 | 2000 G |
Selected Per-Share Data | | | | | |
Net asset value, beginning of period | $ 14.98 | $ 11.64 | $ 15.04 | $ 17.68 | $ 22.70 |
Income from Investment Operations | | | | | |
Net investment income (loss) E | .10 F | .05 | .05 | .08 | .01 |
Net realized and unrealized gain (loss) | .93 | 3.35 | (3.34) | (2.66) | (3.34) |
Total from investment operations | 1.03 | 3.40 | (3.29) | (2.58) | (3.33) |
Distributions from net investment income | (.05) | (.06) | (.11) | (.06) | (.28) |
Distributions from net realized gain | - | - | - | - | (1.41) |
Total distributions | (.05) | (.06) | (.11) | (.06) | (1.69) |
Net asset value, end of period | $ 15.96 | $ 14.98 | $ 11.64 | $ 15.04 | $ 17.68 |
Total Return B, C, D | 6.89% | 29.40% | (22.01)% | (14.64)% | (15.74)% |
Ratios to Average Net Assets H | | | | | |
Expenses before expense reductions | .98% | .99% | .97% | .95% | .95% A |
Expenses net of voluntary waivers, if any | .98% | .99% | .97% | .95% | .95% A |
Expenses net of all reductions | .96% | .96% | .94% | .93% | .93% A |
Net investment income (loss) | .65% | .37% | .41% | .53% | .04% A |
Supplemental Data | | | | | |
Net assets, end of period (000 omitted) | $ 60,938 | $ 60,129 | $ 41,486 | $ 44,643 | $ 25,827 |
Portfolio turnover rate | 65% | 62% | 60% | 89% | 117% |
A Annualized
B Total returns for periods of less than one year are not annualized.
C Total returns do not reflect charges attributable to your insurance company's separate account. Inclusion of these charges would reduce the total returns shown.
D Total returns would have been lower had certain expenses not been reduced during the periods shown.
E Calculated based on average shares outstanding during the period.
F Investment income per share reflects a special dividend which amounted to $.04 per share.
G For the period January 12, 2000 (commencement of sale of shares) to December 31, 2000.
H Expense ratios reflect operating expenses of the class. Expenses before reductions do not reflect amounts reimbursed by the investment adviser or reductions from brokerage service arrangements or other expense offset arrangements and do not represent the amount paid by the class during periods when reimbursements or reductions occur. Expense ratios before reductions for start-up periods may not be representative of longer-term operating periods. Expenses net of any voluntary waivers reflect expenses after reimbursement by the investment adviser but prior to reductions from brokerage service arrangements or other expense offset arrangements. Expenses net of all reductions represent the net expenses paid by the class.
See accompanying notes which are an integral part of the financial statements.
Annual Report
Fidelity Variable Insurance Products: Investment Grade Bond Portfolio
Performance: The Bottom Line
Average annual total return reflects the change in the value of an investment, assuming reinvestment of the class' dividend income and capital gains (the profits earned upon the sale of securities that have grown in value) and assuming a constant rate of performance each year. During periods of reimbursement by Fidelity, a fund's total return will be greater than it would be had the reimbursement not occurred. Performance numbers are net of all underlying fund operating expenses, but do not include any insurance charges imposed by your insurance company's separate account. If performance information included the effect of these additional charges, the total returns would have been lower. How a fund did yesterday is no guarantee of how it will do tomorrow.
Average Annual Total Returns
Periods ended December 31, 2004 | Past 1
year | Past 5
years | Past 10
years |
Fidelity VIP: Investment Grade Bond - Initial Class | 4.46% | 7.90% | 7.60% |
Fidelity VIP: Investment Grade Bond - Service ClassA | 4.32% | 7.77% | 7.53% |
Fidelity VIP: Investment Grade Bond - Service Class 2B | 4.19% | 7.58% | 7.44% |
A The initial offering of Service Class shares took place on July 7, 2000. Performance for Service Class shares reflects an asset-based service fee (12b-1 fee), and returns prior to July 7, 2000 are those of Initial Class and do not include the effects of Service Class' 12b-1 fee. Had Service Class' 12b-1 fee been reflected, returns prior to July 7, 2000 would have been lower.
B The initial offering of Service Class 2 shares took place on January 12, 2000. Performance for Service Class 2 shares reflects an asset-based service fee (12b-1 fee), and returns prior to January 12, 2000 are those of Initial Class and do not include the effects of Service Class 2's 12b-1 fee. Had Service Class 2's 12b-1 fee been reflected, returns prior to January 12, 2000 would have been lower.
$10,000 Over 10 Years
Let's say hypothetically that $10,000 was invested in Fidelity ® Variable Insurance Products: Investment Grade Bond Portfolio - Initial Class on December 31, 1994. The chart shows how the value of your investment would have changed, and also shows how the Lehman Brothers® Aggregate Bond Index performed over the same period.

Investment Grade Bond Portfolio
Fidelity Variable Insurance Products: Investment Grade Bond Portfolio
Management's Discussion of Fund Performance
Comments from Ford O'Neil, Portfolio Manager of Fidelity® Variable Insurance Products: Investment Grade Bond Portfolio
Despite five increases in short-term interest rates by the Federal Reserve Board, the U.S. investment-grade bond market had a positive return for the year ending December 31, 2004. In that time, the Lehman Brothers® Aggregate Bond Index rose 4.34%. While that's roughly half of the benchmark's average annual return of 8.97%, it's better than many market analysts expected heading into 2004 given concerns about the potentially high levels of economic growth and subsequent inflation. However, the economic expansion was more moderate than anticipated, and the Fed reassured investors that rate tightening would be undertaken at a "measured pace." Among the spread sectors, corporate bonds and mortgages fared best fared best, as the Lehman Brothers Credit Bond and Mortgage-Backed Securities indexes rose 5.24% and 4.70%, respectively. Agencies hurt by the questionable accounting practices of a large government-sponsored enterprise, which held the Lehman Brothers U.S. Agency Index to a 3.33% return. Treasuries - the most interest-rate-sensitive bond category - advanced 3.54% according to the Lehman Brothers U.S. Treasury Index.
For the 12 months ending December 31, 2004, the portfolio's return was roughly in line with the Lehman Brothers Aggregate Bond Index and the 4.22% return of the LipperSM Variable Annuity Intermediate Investment Grade Debt Funds Average. Relative to the peer group average, I believe the portfolio was helped by my approach to managing the fund's interest rate sensitivity, which involved keeping it in line with its index. Adhering to that approach was beneficial in a volatile environment that proved treacherous to those investors trying to time interest rates. My decision to overweight spread products - such as corporate and mortgage securities - and heavily underweight Treasuries relative to the index also worked in our favor given that riskier assets outperformed during the year. In particular, our focus on BBB-rated corporate issues helped the fund's return, as they performed well in response to improving credit conditions and solid demand for high-yielding bonds. Selective investments in foreign corporate bonds denominated in U.S. dollars also generally aided performance. Detracting modestly from the portfolio's returns were a few small positions in the transportation industry. I subsequently trimmed some corporate holdings when I felt their prices reflected fair market value.
The views expressed in this statement reflect those of the portfolio manager only through the end of the period of the report as stated on the cover and do not necessarily represent the views of Fidelity or any other person in the Fidelity organization. Any such views are subject to change at any time based upon market or other conditions and Fidelity disclaims any responsibility to update such views. These views may not be relied on as investment advice and, because investment decisions for a Fidelity fund are based on numerous factors, may not be relied on as an indication of trading intent on behalf of any Fidelity fund.
Annual Report
Fidelity Variable Insurance Products: Investment Grade Bond Portfolio
Investment Summary
Quality Diversification (% of fund's net assets) as of December 31, 2004 |
| U.S.Government and U.S.Government Agency Obligations | 53.7% | |
 | AAA | 6.9% | |
| AA | 4.7% | |
| A | 9.0% | |
 | BBB | 13.8% | |
| BB and Below | 0.9% | |
 | Not Rated | 0.1% | |
| Short-Term Investments and Net Other Assets | 10.9% | |

We have used ratings from Moody's® Investors Services, Inc. Where Moody's ratings are not available, we have used S&P® ratings. |
Average Years to Maturity as of December 31, 2004 |
Years | 4.9 |
Average years to maturity is based on the average time remaining until principal payments are expected from each of the fund's bonds, weighted by dollar amount. |
Top Five Market Sectors as of December 31, 2004 |
| % of fund's net assets |
Financials | 8.1 |
Telecommunication Services | 3.6 |
Utilities | 2.8 |
Energy | 2.1 |
Consumer Discretionary | 2.0 |
The information in the above tables is based on the combined investments of the fund and its pro-rata share of the investments of Fidelity's fixed-income central fund. |
Investment Grade Bond Portfolio
Fidelity Variable Insurance Products: Investment Grade Bond Portfolio
Investments December 31, 2004
Showing Percentage of Net Assets
Nonconvertible Bonds - 19.2% |
| Principal
Amount | | Value
(Note 1) |
CONSUMER DISCRETIONARY - 1.8% |
Auto Components - 0.3% |
DaimlerChrysler NA Holding Corp. 7.2% 9/1/09 | $ 4,645,000 | | $ 5,169,959 |
Automobiles - 0.7% |
Ford Motor Co.: | | | |
6.625% 10/1/28 | 690,000 | | 643,596 |
7.45% 7/16/31 | 3,310,000 | | 3,328,993 |
General Motors Corp.: | | | |
8.25% 7/15/23 | 3,580,000 | | 3,729,186 |
8.375% 7/15/33 | 3,080,000 | | 3,191,136 |
| | 10,892,911 |
Media - 0.8% |
AOL Time Warner, Inc. 7.625% 4/15/31 | 1,000,000 | | 1,209,761 |
Cox Communications, Inc.: | | | |
7.125% 10/1/12 | 785,000 | | 879,877 |
7.75% 11/1/10 | 3,350,000 | | 3,837,405 |
Liberty Media Corp. 8.25% 2/1/30 | 1,265,000 | | 1,438,382 |
News America, Inc. 6.2% 12/15/34 (a) | 3,500,000 | | 3,547,310 |
Time Warner, Inc. 6.625% 5/15/29 | 1,745,000 | | 1,880,257 |
| | 12,792,992 |
TOTAL CONSUMER DISCRETIONARY | | 28,855,862 |
CONSUMER STAPLES - 0.4% |
Food Products - 0.1% |
ConAgra Foods, Inc. 6.75% 9/15/11 | 1,870,000 | | 2,103,888 |
Tobacco - 0.3% |
Altria Group, Inc. 7% 11/4/13 | 955,000 | | 1,034,789 |
Philip Morris Companies, Inc. 7.65% 7/1/08 | 2,500,000 | | 2,749,835 |
| | 3,784,624 |
TOTAL CONSUMER STAPLES | | 5,888,512 |
ENERGY - 1.9% |
Energy Equipment & Services - 0.3% |
Petronas Capital Ltd. 7% 5/22/12 (a) | 4,320,000 | | 4,948,685 |
Oil & Gas - 1.6% |
Amerada Hess Corp.: | | | |
6.65% 8/15/11 | 445,000 | | 489,355 |
7.125% 3/15/33 | 1,145,000 | | 1,258,998 |
7.375% 10/1/09 | 1,010,000 | | 1,128,415 |
Empresa Nacional de Petroleo 6.75% 11/15/12 (a) | 5,050,000 | | 5,615,827 |
|
| Principal
Amount | | Value
(Note 1) |
Enterprise Products Operating LP: | | | |
4.625% 10/15/09 (a) | $ 630,000 | | $ 629,013 |
5.6% 10/15/14 (a) | 445,000 | | 448,947 |
Kinder Morgan Energy Partners LP 7.125% 3/15/12 | 1,180,000 | | 1,349,002 |
Pemex Project Funding Master Trust: | | | |
6.125% 8/15/08 | 3,630,000 | | 3,847,800 |
7.375% 12/15/14 | 2,000,000 | | 2,223,000 |
7.875% 2/1/09 (c) | 1,200,000 | | 1,348,200 |
Ras Laffan Liquid Natural Gas Co. Ltd. yankee 8.294% 3/15/14 (a) | 4,370,000 | | 5,163,535 |
Williams Companies, Inc.: | | | |
7.125% 9/1/11 | 1,055,000 | | 1,152,588 |
7.5% 1/15/31 | 505,000 | | 522,675 |
| | 25,177,355 |
TOTAL ENERGY | | 30,126,040 |
FINANCIALS - 8.0% |
Capital Markets - 1.7% |
Credit Suisse First Boston (USA), Inc. 4.625% 1/15/08 | 3,400,000 | | 3,483,980 |
Goldman Sachs Group, Inc.: | | | |
5.25% 10/15/13 | 3,270,000 | | 3,345,537 |
5.7% 9/1/12 | 2,935,000 | | 3,111,156 |
6.125% 2/15/33 | 4,225,000 | | 4,389,230 |
Merrill Lynch & Co., Inc. 4.125% 1/15/09 | 7,285,000 | | 7,325,119 |
Morgan Stanley 6.6% 4/1/12 | 5,695,000 | | 6,351,730 |
| | 28,006,752 |
Commercial Banks - 1.4% |
Bank of America Corp. 7.4% 1/15/11 | 5,680,000 | | 6,579,587 |
Corporacion Andina de Fomento 5.2% 5/21/13 | 1,560,000 | | 1,589,927 |
Fleet Financial Group, Inc. 7.125% 4/15/06 | 980,000 | | 1,025,663 |
Korea Development Bank 3.875% 3/2/09 | 3,500,000 | | 3,454,626 |
PNC Funding Corp. 5.75% 8/1/06 | 4,440,000 | | 4,604,480 |
SouthTrust Corp. 5.8% 6/15/14 | 1,440,000 | | 1,524,904 |
Wachovia Corp. 4.875% 2/15/14 | 1,455,000 | | 1,450,166 |
Wells Fargo & Co. 4.2% 1/15/10 | 1,620,000 | | 1,626,584 |
Wells Fargo Bank NA, San Francisco 7.55% 6/21/10 | 900,000 | | 1,045,355 |
| | 22,901,292 |
Consumer Finance - 1.2% |
Capital One Bank 4.875% 5/15/08 | 1,295,000 | | 1,329,988 |
Ford Motor Credit Co. 7% 10/1/13 | 4,000,000 | | 4,240,528 |
General Motors Acceptance Corp. 6.875% 9/15/11 | 1,860,000 | | 1,906,115 |
Nonconvertible Bonds - continued |
| Principal
Amount | | Value
(Note 1) |
FINANCIALS - continued |
Consumer Finance - continued |
Household Finance Corp.: | | | |
4.125% 11/16/09 | $ 1,295,000 | | $ 1,288,037 |
7% 5/15/12 | 835,000 | | 953,551 |
Household International, Inc. 8.875% 2/15/08 | 3,775,000 | | 3,996,151 |
MBNA Corp.: | | | |
6.25% 1/17/07 | 1,905,000 | | 2,004,504 |
7.5% 3/15/12 | 3,005,000 | | 3,471,670 |
| | 19,190,544 |
Diversified Financial Services - 1.1% |
Alliance Capital Management LP 5.625% 8/15/06 | 2,475,000 | | 2,557,865 |
Hutchison Whampoa International 03/13 Ltd. 6.5% 2/13/13 (a) | 830,000 | | 894,487 |
Hutchison Whampoa International 03/33 Ltd.: | | | |
6.25% 1/24/14 (a) | 1,630,000 | | 1,716,555 |
7.45% 11/24/33 (a) | 1,200,000 | | 1,330,066 |
J.P. Morgan Chase & Co.: | | | |
5.75% 1/2/13 | 3,500,000 | | 3,708,845 |
6.75% 2/1/11 | 6,155,000 | | 6,914,570 |
| | 17,122,388 |
Insurance - 0.4% |
Axis Capital Holdings Ltd. 5.75% 12/1/14 | 1,505,000 | | 1,510,882 |
Marsh & McLennan Companies, Inc. 7.125% 6/15/09 | 3,109,000 | | 3,374,257 |
Principal Life Global Funding I 6.25% 2/15/12 (a) | 1,350,000 | | 1,475,701 |
| | 6,360,840 |
Real Estate - 1.4% |
Arden Realty LP 7% 11/15/07 | 5,000,000 | | 5,448,715 |
AvalonBay Communities, Inc. 5% 8/1/07 | 2,315,000 | | 2,376,644 |
EOP Operating LP: | | | |
4.65% 10/1/10 | 6,570,000 | | 6,600,025 |
7% 7/15/11 | 1,725,000 | | 1,945,357 |
Mack-Cali Realty LP 7.75% 2/15/11 | 2,700,000 | | 3,131,144 |
Simon Property Group LP 5.625% 8/15/14 (a) | 2,985,000 | | 3,091,293 |
| | 22,593,178 |
Thrifts & Mortgage Finance - 0.8% |
Countrywide Home Loans, Inc.: | | | |
4% 3/22/11 | 2,500,000 | | 2,430,650 |
4.125% 9/15/09 | 4,500,000 | | 4,479,827 |
Independence Community Bank Corp. 3.75% 4/1/14 (c) | 1,490,000 | | 1,436,253 |
|
| Principal
Amount | | Value
(Note 1) |
Washington Mutual, Inc.: | | | |
4.375% 1/15/08 | $ 2,330,000 | | $ 2,366,332 |
4.625% 4/1/14 | 3,000,000 | | 2,868,159 |
| | 13,581,221 |
TOTAL FINANCIALS | | 129,756,215 |
INDUSTRIALS - 0.4% |
Aerospace & Defense - 0.2% |
Bombardier, Inc.: | | | |
6.3% 5/1/14 (a) | 2,445,000 | | 2,121,038 |
7.45% 5/1/34 (a) | 840,000 | | 716,100 |
| | 2,837,138 |
Airlines - 0.2% |
Delta Air Lines, Inc. pass thru trust certificates: | | | |
7.57% 11/18/10 | 1,335,000 | | 1,316,850 |
7.92% 5/18/12 | 3,700,000 | | 2,849,000 |
| | 4,165,850 |
TOTAL INDUSTRIALS | | 7,002,988 |
MATERIALS - 0.5% |
Chemicals - 0.2% |
Lubrizol Corp.: | | | |
4.625% 10/1/09 | 1,155,000 | | 1,153,218 |
5.5% 10/1/14 | 540,000 | | 543,182 |
6.5% 10/1/34 | 975,000 | | 992,996 |
| | 2,689,396 |
Containers & Packaging - 0.2% |
Sealed Air Corp.: | | | |
5.625% 7/15/13 (a) | 745,000 | | 770,716 |
6.875% 7/15/33 (a) | 1,565,000 | | 1,690,017 |
| | 2,460,733 |
Paper & Forest Products - 0.1% |
International Paper Co.: | | | |
4.25% 1/15/09 | 635,000 | | 637,325 |
5.5% 1/15/14 | 1,595,000 | | 1,647,654 |
| | 2,284,979 |
TOTAL MATERIALS | | 7,435,108 |
TELECOMMUNICATION SERVICES - 3.4% |
Diversified Telecommunication Services - 3.1% |
AT&T Broadband Corp. 8.375% 3/15/13 | 1,500,000 | | 1,849,644 |
Bellsouth Capital Funding Corp. 7.875% 2/15/30 | 1,920,000 | | 2,391,441 |
BellSouth Corp. 5.2% 9/15/14 | 4,000,000 | | 4,076,888 |
British Telecommunications PLC 8.875% 12/15/30 | 3,000,000 | | 4,017,063 |
Nonconvertible Bonds - continued |
| Principal
Amount | | Value
(Note 1) |
TELECOMMUNICATION SERVICES - continued |
Diversified Telecommunication Services - continued |
Deutsche Telekom International Finance BV 8.75% 6/15/30 | $ 3,250,000 | | $ 4,291,489 |
France Telecom SA 9.5% 3/1/31 | 6,550,000 | | 8,879,128 |
SBC Communications, Inc. 6.45% 6/15/34 | 5,400,000 | | 5,785,382 |
Sprint Capital Corp. 6.875% 11/15/28 | 2,040,000 | | 2,233,365 |
Telecom Italia Capital: | | | |
4.95% 9/30/14 (a) | 1,175,000 | | 1,151,193 |
5.25% 11/15/13 | 4,500,000 | | 4,548,308 |
Telefonica Europe BV 7.75% 9/15/10 | 1,325,000 | | 1,553,814 |
Verizon Global Funding Corp.: | | | |
7.25% 12/1/10 | 3,090,000 | | 3,540,173 |
7.75% 12/1/30 | 5,000,000 | | 6,216,630 |
| | 50,534,518 |
Wireless Telecommunication Services - 0.3% |
America Movil SA de CV: | | | |
4.125% 3/1/09 | 1,585,000 | | 1,561,442 |
5.5% 3/1/14 | 1,430,000 | | 1,412,704 |
AT&T Wireless Services, Inc. 7.875% 3/1/11 | 1,070,000 | | 1,261,120 |
| | 4,235,266 |
TOTAL TELECOMMUNICATION SERVICES | | 54,769,784 |
UTILITIES - 2.8% |
Electric Utilities - 1.7% |
Cleveland Electric Illuminating Co. 5.65% 12/15/13 | 3,260,000 | | 3,380,985 |
DTE Energy Co. 7.05% 6/1/11 | 2,004,000 | | 2,269,227 |
Duke Capital LLC: | | | |
6.25% 2/15/13 | 805,000 | | 870,029 |
6.75% 2/15/32 | 4,610,000 | | 5,016,639 |
Exelon Corp. 6.75% 5/1/11 | 2,250,000 | | 2,516,904 |
FirstEnergy Corp. 6.45% 11/15/11 | 830,000 | | 901,770 |
MidAmerican Energy Holdings, Inc.: | | | |
4.625% 10/1/07 | 1,795,000 | | 1,827,183 |
5.875% 10/1/12 | 1,955,000 | | 2,071,598 |
Monongahela Power Co. 5% 10/1/06 | 2,260,000 | | 2,300,813 |
Progress Energy, Inc. 7.1% 3/1/11 | 4,660,000 | | 5,238,972 |
| | 26,394,120 |
|
| Principal
Amount | | Value
(Note 1) |
Gas Utilities - 0.4% |
Consolidated Natural Gas Co. 6.85% 4/15/11 | $ 445,000 | | $ 502,197 |
NiSource Finance Corp. 7.875% 11/15/10 | 5,305,000 | | 6,236,447 |
| | 6,738,644 |
Multi-Utilities & Unregulated Power - 0.7% |
Constellation Energy Group, Inc. 7% 4/1/12 | 5,150,000 | | 5,870,228 |
Dominion Resources, Inc.: | | | |
6.25% 6/30/12 | 4,220,000 | | 4,607,350 |
8.125% 6/15/10 | 1,200,000 | | 1,412,438 |
| | 11,890,016 |
TOTAL UTILITIES | | 45,022,780 |
TOTAL NONCONVERTIBLE BONDS (Cost $294,867,563) | 308,857,289 |
U.S. Government and
Government Agency Obligations - 16.1% |
|
U.S. Government Agency Obligations - 5.8% |
Fannie Mae: | | | |
2.5% 6/15/06 | 2,185,000 | | 2,165,711 |
5.5% 3/15/11 | 13,505,000 | | 14,482,100 |
Freddie Mac: | | | |
3.625% 9/15/08 | 8,515,000 | | 8,517,929 |
4% 6/12/13 | 4,640,000 | | 4,431,604 |
4.25% 7/15/09 | 41,820,000 | | 42,546,873 |
5.75% 1/15/12 | 7,740,000 | | 8,432,095 |
5.875% 3/21/11 | 6,035,000 | | 6,515,682 |
6.625% 9/15/09 | 3,000,000 | | 3,355,023 |
6.75% 3/15/31 | 2,459,000 | | 2,988,600 |
Government Loan Trusts (assets of Trust guaranteed by U.S. Government through Agency for International Development) Series 1-B, 8.5% 4/1/06 | 463,066 | | 487,548 |
Guaranteed Export Trust Certificates (assets of Trust guaranteed by U.S. Government through Export-Import Bank): | | | |
Series 1993-D, 5.23% 5/15/05 | 851 | | 857 |
Series 1994-A, 7.12% 4/15/06 | 1,758 | | 1,805 |
Guaranteed Trade Trust Certificates (assets of Trust guaranteed by U.S. Government through Export-Import Bank) Series 1994-B, 7.5% 1/26/06 | 1,545 | | 1,612 |
TOTAL U.S. GOVERNMENT AGENCY OBLIGATIONS | | 93,927,439 |
U.S. Government and
Government Agency Obligations - continued |
| Principal
Amount | | Value
(Note 1) |
U.S. Treasury Inflation Protected Obligations - 4.3% |
U.S. Treasury Inflation-Indexed Bonds 2.375% 1/15/25 | $ 20,251,600 | | $ 21,655,764 |
U.S. Treasury Inflation-Indexed Notes: | | | |
0.875% 4/15/10 | 15,112,650 | | 14,965,650 |
2% 1/15/14 | 30,989,400 | | 32,074,029 |
TOTAL U.S. TREASURY INFLATION
PROTECTED OBLIGATIONS | | 68,695,443 |
U.S. Treasury Obligations - 6.0% |
U.S. Treasury Bonds 6.25% 5/15/30 | 24,015,000 | | 28,711,998 |
U.S. Treasury Notes: | | | |
1.625% 2/28/06 | 20,000,000 | | 19,728,900 |
3.125% 5/15/07 | 14,018,000 | | 14,010,879 |
3.125% 4/15/09 | 15,651,000 | | 15,413,793 |
4% 11/15/12 | 15,000,000 | | 14,974,800 |
4.75% 5/15/14 | 3,685,000 | | 3,840,172 |
TOTAL U.S. TREASURY OBLIGATIONS | | 96,680,542 |
TOTAL U.S. GOVERNMENT AND GOVERNMENT AGENCY OBLIGATIONS (Cost $254,602,153) | 259,303,424 |
U.S. Government Agency -
Mortgage Securities - 33.3% |
|
Fannie Mae - 30.1% |
3.827% 12/1/34 (c) | 100,000 | | 100,219 |
3.836% 6/1/33 (c) | 238,302 | | 238,486 |
3.941% 10/1/34 (c) | 417,235 | | 420,216 |
4% 8/1/18 to 10/1/18 | 1,439,521 | | 1,407,933 |
4% 1/1/20 (b) | 33,309,930 | | 32,487,591 |
4.021% 12/1/34 (c) | 325,000 | | 326,930 |
4.037% 12/1/34 (c) | 198,597 | | 200,249 |
4.048% 1/1/35 (c) | 275,000 | | 276,998 |
4.072% 12/1/34 (c) | 525,000 | | 529,102 |
4.105% 1/1/35 (c) | 598,446 | | 596,164 |
4.17% 11/1/34 (c) | 524,964 | | 527,807 |
4.324% 12/1/34 (c) | 199,996 | | 203,240 |
4.5% 1/1/20 (b) | 26,330,000 | | 26,223,034 |
4.5% 6/1/33 to 10/1/33 | 18,353,203 | | 17,771,071 |
4.549% 8/1/34 (c) | 723,295 | | 740,282 |
5% 10/1/17 to 11/1/34 | 65,999,326 | | 66,519,368 |
5% 1/1/20 (b) | 3,860,997 | | 3,920,119 |
5% 1/1/35 (b) | 64,364,782 | | 63,801,590 |
5.5% 4/1/13 to 10/1/34 | 61,742,085 | | 63,191,945 |
5.5% 1/1/20 (b) | 10,003,044 | | 10,334,395 |
5.5% 1/1/35 (b) | 96,316,299 | | 97,670,738 |
6% 2/1/13 to 1/1/29 | 15,920,932 | | 16,693,783 |
6% 1/1/35 (b) | 339,133 | | 350,367 |
|
| Principal
Amount | | Value
(Note 1) |
6.5% 3/1/13 to 2/1/33 | $ 69,066,960 | | $ 72,831,539 |
6.5% 1/1/20 (b) | 2,075,384 | | 2,199,907 |
7% 3/1/15 to 8/1/32 | 1,754,660 | | 1,866,752 |
7.5% 8/1/08 to 11/1/31 | 3,253,159 | | 3,489,929 |
8% 3/1/30 | 3,319 | | 3,599 |
8.5% 3/1/25 to 6/1/25 | 3,449 | | 3,793 |
TOTAL FANNIE MAE | 484,927,146 |
Freddie Mac - 1.9% |
4% 1/1/20 (b) | 30,000,000 | | 29,287,500 |
4.985% 8/1/33 (c) | 230,759 | | 237,015 |
8.5% 3/1/20 to 1/1/28 | 412,357 | | 453,133 |
TOTAL FREDDIE MAC | | 29,977,648 |
Government National Mortgage Association - 1.3% |
6% 8/15/08 to 8/15/29 | 5,360,302 | | 5,578,488 |
6.5% 10/15/27 to 9/15/32 | 2,206,764 | | 2,328,848 |
7% 1/15/28 to 11/15/32 | 11,905,702 | | 12,659,575 |
7.5% 3/15/06 to 10/15/28 | 881,068 | | 950,911 |
8% 2/15/17 | 22,696 | | 24,848 |
TOTAL GOVERNMENT NATIONAL MORTGAGE ASSOCIATION | | 21,542,670 |
TOTAL U.S. GOVERNMENT AGENCY - MORTGAGE SECURITIES (Cost $533,760,458) | 536,447,464 |
Asset-Backed Securities - 2.9% |
|
ACE Securities Corp. Series 2004-HE1: | | | |
Class M1, 2.9175% 2/25/34 (c) | 650,000 | | 650,110 |
Class M2, 3.5175% 2/25/34 (c) | 725,000 | | 725,257 |
AmeriCredit Automobile Receivables Trust Series 2003-BX Class A4B, 2.7113% 1/6/10 (c) | 1,570,000 | | 1,578,517 |
Ameriquest Mortgage Securities, Inc. Series 2004-R2: | | | |
Class M1, 2.8475% 4/25/34 (c) | 360,000 | | 360,006 |
Class M2, 2.8975% 4/25/34 (c) | 275,000 | | 275,005 |
Amortizing Residential Collateral Trust Series 2003-BC1 Class M2, 3.5175% 1/25/32 (c) | 745,000 | | 748,078 |
Argent Securities, Inc. Series 2004-W5 Class M1, 3.0175% 4/25/34 (c) | 1,165,000 | | 1,166,549 |
Capital One Multi-Asset Execution Trust: | | | |
Series 2003-B4 Class B4, 3.2025% 7/15/11 (c) | 2,230,000 | | 2,270,635 |
Series 2004-6 Class B, 4.15% 7/16/12 | 3,005,000 | | 3,001,788 |
Asset-Backed Securities - continued |
| Principal
Amount | | Value
(Note 1) |
Chase Manhattan Auto Owner Trust Series 2001-A Class A4, 5.07% 2/15/08 | $ 2,725,723 | | $ 2,737,094 |
Citibank Credit Card Issuance Trust Series 2002-C1 Class C1, 3.2% 2/9/09 (c) | 4,500,000 | | 4,560,055 |
Countrywide Home Loans, Inc.: | | | |
Series 2004-2 Class M1, 2.9175% 5/25/34 (c) | 1,525,000 | | 1,525,025 |
Series 2004-3 Class M1, 2.9175% 6/25/34 (c) | 425,000 | | 425,437 |
Discover Card Master Trust I: | | | |
Series 2001-6 Class A, 5.75% 12/15/08 | 7,000,000 | | 7,247,648 |
Series 2003-4 Class B1, 2.7325% 5/16/11 (c) | 2,620,000 | | 2,633,966 |
First Franklin Mortgage Loan Trust Series 2004-FF2: | | | |
Class M3, 2.9675% 3/25/34 (c) | 125,000 | | 125,002 |
Class M4, 3.3175% 3/25/34 (c) | 100,000 | | 100,002 |
Class M6, 3.6675% 3/25/34 (c) | 100,000 | | 100,103 |
Fremont Home Loan Trust Series 2004-A: | | | |
Class M1, 2.9675% 1/25/34 (c) | 1,350,000 | | 1,350,023 |
Class M2, 3.5675% 1/25/34 (c) | 1,550,000 | | 1,550,025 |
GSAMP Trust Series 2004-FM2: | | | |
Class M1, 2.9175% 1/25/34 (c) | 1,000,000 | | 1,000,017 |
Class M2, 3.5175% 1/25/34 (c) | 400,000 | | 400,006 |
Class M3, 3.7175% 1/25/34 (c) | 400,000 | | 400,006 |
Home Equity Asset Trust Series 2002-4 Class M2, 4.4675% 3/25/33 (c) | 550,000 | | 558,167 |
MBNA Credit Card Master Note Trust: | | | |
Series 2001-A1 Class A1, 5.75% 10/15/08 | 1,800,000 | | 1,860,648 |
Series 2003-B3 Class B3, 2.7775% 1/18/11 (c) | 1,810,000 | | 1,817,912 |
Series 2003-B5 Class B5, 2.7725% 2/15/11 (c) | 725,000 | | 730,714 |
Meritage Mortgage Loan Trust Series 2004-1: | | | |
Class M1, 2.9175% 7/25/34 (c) | 625,000 | | 625,010 |
Class M2, 2.9675% 7/25/34 (c) | 100,000 | | 100,002 |
Class M3, 3.3675% 7/25/34 (c) | 225,000 | | 225,004 |
Class M4, 3.5175% 7/25/34 (c) | 150,000 | | 150,002 |
Morgan Stanley ABS Capital I, Inc.: | | | |
Series 2003-HE1 Class M2, 4.3175% 5/25/33 (c) | 455,000 | | 461,360 |
Series 2003-NC5 Class M2, 4.4175% 4/25/33 (c) | 825,000 | | 840,240 |
Morgan Stanley Dean Witter Capital I Trust Series 2003-NC1 Class M1, 3.4675% 11/25/32 (c) | 750,000 | | 757,973 |
|
| Principal
Amount | | Value
(Note 1) |
Sears Credit Account Master Trust II Series 2000-2 Class A, 6.75% 9/16/09 | $ 2,255,000 | | $ 2,311,306 |
Structured Asset Securities Corp. Series 2004-GEL1 Class A, 2.7775% 2/25/34 (c) | 430,021 | | 430,028 |
TOTAL ASSET-BACKED SECURITIES (Cost $45,313,325) | 45,798,720 |
Collateralized Mortgage Obligations - 2.5% |
|
Private Sponsor - 0.4% |
CS First Boston Mortgage Securities Corp. floater Series 2004-AR3
Class 6A2, 2.7875% 4/25/34 (c) | 1,089,516 | | 1,091,124 |
Master Alternative Loan Trust Series 2004-3 Class 3A1, 6% 4/25/34 | 537,160 | | 549,918 |
Residential Asset Mortgage Products, Inc. sequential pay Series 2004-SL2 Class A1, 6.5% 10/25/16 | 533,256 | | 547,754 |
Residential Finance LP/Residential Finance Development Corp. floater Series 2003-CB1: | | | |
Class B3, 3.82% 6/10/35 (a)(c) | 1,204,144 | | 1,225,148 |
Class B4, 4.02% 6/10/35 (a)(c) | 1,077,392 | | 1,096,013 |
Class B5, 4.62% 6/10/35 (a)(c) | 736,136 | | 752,033 |
Class B6, 5.12% 6/10/35 (a)(c) | 433,882 | | 444,498 |
TOTAL PRIVATE SPONSOR | | 5,706,488 |
U.S. Government Agency - 2.1% |
Fannie Mae guaranteed REMIC pass thru certificates planned amortization class Series 2004-81 Class KD: | | | |
4.5% 4/25/17 | 5,810,000 | | 5,845,071 |
4.5% 7/25/18 | 2,455,000 | | 2,435,349 |
Freddie Mac Multi-class participation certificates guaranteed: | | | |
planned amortization class: | | | |
Series 2500 Class TE, 5.5% 9/15/17 | 10,275,186 | | 10,665,935 |
Series 2677 Class LD, 4.5% 3/15/17 | 8,240,218 | | 8,237,308 |
Series 2702 Class WB, 5% 4/15/17 | 2,947,632 | | 3,001,500 |
Collateralized Mortgage Obligations - continued |
| Principal
Amount | | Value
(Note 1) |
U.S. Government Agency - continued |
Freddie Mac Multi-class participation certificates guaranteed: - continued | | | |
Series 2885 Class PC, 4.5% 3/15/18 | $ 2,395,000 | | $ 2,408,900 |
sequential pay Series 2750
Class ZT, 5% 2/15/34 | 2,022,366 | | 1,816,512 |
TOTAL U.S. GOVERNMENT AGENCY | | 34,410,575 |
TOTAL COLLATERALIZED
MORTGAGE OBLIGATIONS (Cost $40,082,274) | 40,117,063 |
Commercial Mortgage Securities - 5.3% |
|
Bayview Commercial Asset Trust floater Series 2004-3: | | | |
Class A1, 2.7675% 1/25/35 (a)(c) | 1,996,572 | | 1,996,572 |
Class A2, 2.8175% 1/25/35 (a)(c) | 299,486 | | 299,486 |
Class M1, 2.8975% 1/25/35 (a)(c) | 349,400 | | 349,400 |
Class M2, 3.3975% 1/25/35 (a)(c) | 199,657 | | 199,657 |
Chase Commercial Mortgage Securities Corp. Series 2001-245 Class A2, 6.4842% 2/12/16 (a)(c) | 1,345,000 | | 1,480,952 |
Chase Manhattan Bank-First Union National Bank Commercial Mortgage Trust sequential pay Series 1999-1 Class A2, 7.439% 8/15/31 | 5,000,000 | | 5,655,220 |
COMM: | | | |
floater: | | | |
Series 2002-FL7 Class D, 2.9725% 11/15/14 (a)(c) | 735,000 | | 736,981 |
Series 2003-FL9 Class B, 2.9025% 11/15/15 (a)(c) | 1,381,378 | | 1,385,501 |
Series 2004-LBN2 Class X2, 1.2743% 3/10/39 (a)(c)(e) | 4,982,239 | | 212,451 |
Commercial Resecuritization Trust sequential pay Series 1999-ABC1 Class A, 6.74% 1/27/09 (a) | 2,777,685 | | 2,863,595 |
CS First Boston Mortgage Securities Corp.: | | | |
floater Series 2003-TF2A Class A2, 2.7225% 11/15/14 (a)(c) | 2,500,000 | | 2,503,720 |
sequential pay: | | | |
Series 1997-C2 Class A3, 6.55% 1/17/35 | 2,075,000 | | 2,217,635 |
|
| Principal
Amount | | Value
(Note 1) |
Series 1999-C1 Class A2, 7.29% 9/15/41 | $ 3,500,000 | | $ 3,929,188 |
Series 2000-C1 Class A2, 7.545% 4/15/62 | 1,100,000 | | 1,255,886 |
Series 2004-C1 Class A3, 4.321% 1/15/37 | 1,505,000 | | 1,495,934 |
Series 1997-C2 Class D, 7.27% 1/17/35 | 1,750,000 | | 1,934,027 |
Series 1998-C1 Class C, 6.78% 5/17/40 | 5,000,000 | | 5,477,787 |
Series 2001-CKN5 Class AX, 1.2221% 9/15/34 (a)(c)(e) | 31,167,356 | | 2,067,920 |
Series 2004-C1 Class ASP, 1.0446% 1/15/37 (a)(c)(e) | 24,490,000 | | 979,456 |
Deutsche Mortgage & Asset Receiving Corp. sequential pay Series 1998-C1 Class D, 7.231% 6/15/31 | 1,120,000 | | 1,231,926 |
DLJ Commercial Mortgage Corp. sequential pay Series 2000-CF1 Class A1B, 7.62% 6/10/33 | 3,000,000 | | 3,439,172 |
Equitable Life Assurance Society of the United States Series 174: | | | |
Class B1, 7.33% 5/15/06 (a) | 500,000 | | 524,151 |
Class C1, 7.52% 5/15/06 (a) | 500,000 | | 524,874 |
Fannie Mae sequential pay Series 1999-10 Class MZ, 6.5% 9/17/38 | 3,984,632 | | 4,220,299 |
GGP Mall Properties Trust sequential pay Series 2001-C1A Class A2, 5.007% 11/15/11 (a) | 3,404,715 | | 3,485,457 |
Ginnie Mae guaranteed REMIC pass thru securities sequential pay: | | | |
Series 2002-83 Class B, 4.6951% 12/16/24 | 1,860,000 | | 1,896,043 |
Series 2003-22 Class B, 3.963% 5/16/32 | 3,295,000 | | 3,244,752 |
GS Mortgage Securities Corp. II: | | | |
sequential pay: | | | |
Series 2001-LIBA Class A2, 6.615% 2/14/16 (a) | 1,645,000 | | 1,811,739 |
Series 2003-C1 Class A2A, 3.59% 1/10/40 | 3,220,000 | | 3,205,018 |
Series 1998-GLII Class E, 7.1905% 4/13/31 (c) | 245,000 | | 257,161 |
J.P. Morgan Commercial Mortgage Finance Corp. sequential pay Series 2000-C9 Class A2, 7.77% 10/15/32 | 3,745,000 | | 4,292,622 |
LB-UBS Commercial Mortgage Trust sequential pay: | | | |
Series 2000-C3 Class A2, 7.95% 1/15/10 | 2,180,000 | | 2,531,131 |
Series 2001-C3 Class A1, 6.058% 6/15/20 | 5,143,053 | | 5,430,523 |
Commercial Mortgage Securities - continued |
| Principal
Amount | | Value
(Note 1) |
Leafs CMBS I Ltd./Leafs CMBS I Corp. Series 2002-1A: | | | |
Class B, 4.13% 11/20/37 (a) | $ 2,600,000 | | $ 2,483,609 |
Class C, 4.13% 11/20/37 (a) | 2,600,000 | | 2,372,500 |
Morgan Stanley Capital I, Inc. sequential pay Series 2004-HQ3 Class A2, 4.05% 1/13/41 | 1,480,000 | | 1,468,969 |
Thirteen Affiliates of General Growth Properties, Inc. sequential pay Series 1 Class A2, 6.602% 11/15/07 (a) | 2,500,000 | | 2,662,191 |
Trizechahn Office Properties Trust Series 2001-TZHA Class E3, 7.253% 3/15/13 (a) | 1,390,000 | | 1,479,325 |
Wachovia Bank Commercial Mortgage Trust sequential pay Series 2003-C6 Class A2, 4.498% 8/15/35 | 2,385,000 | | 2,418,940 |
TOTAL COMMERCIAL
MORTGAGE SECURITIES (Cost $83,512,571) | 86,021,770 |
Foreign Government and
Government Agency Obligations - 1.4% |
|
Chilean Republic: | | | |
5.625% 7/23/07 | 2,300,000 | | 2,407,813 |
7.125% 1/11/12 | 3,470,000 | | 3,983,994 |
Korean Republic 4.875% 9/22/14 | 1,700,000 | | 1,681,492 |
State of Israel 4.625% 6/15/13 | 725,000 | | 692,828 |
United Mexican States: | | | |
5.875% 1/15/14 | 1,295,000 | | 1,326,728 |
6.75% 9/27/34 | 3,835,000 | | 3,787,063 |
7.5% 4/8/33 | 8,587,000 | | 9,273,960 |
TOTAL FOREIGN GOVERNMENT AND GOVERNMENT AGENCY OBLIGATIONS (Cost $21,947,236) | 23,153,878 |
Supranational Obligations - 0.1% |
|
Corporacion Andina de Fomento 6.875% 3/15/12
(Cost $1,706,548) | 1,725,000 | | 1,938,536 |
Fixed-Income Funds - 11.8% |
| Shares | | |
Fidelity Ultra-Short Central Fund (d)
(Cost $189,752,518) | 1,909,521 | | 190,016,425 |
Cash Equivalents - 23.7% |
| Maturity
Amount | | Value
(Note 1) |
Investments in repurchase agreements (Collateralized by U.S. Government Obligations), in a joint trading account at 2.28%, dated 12/31/04 due 1/3/05
(Cost $381,814,000) (f) | $ 381,886,429 | | $ 381,814,000 |
TOTAL INVESTMENT
PORTFOLIO - 116.3% (Cost $1,847,358,646) | 1,873,468,569 |
NET OTHER ASSETS - (16.3)% | | (262,052,423) |
NET ASSETS - 100% | $ 1,611,416,146 |
Swap Agreements |
| Expiration
Date | | Notional
Amount | | |
Credit Default Swap |
Receive quarterly notional amount multiplied by .38% and pay Merrill Lynch, Inc. upon default event of EnCana Corp., par value of the notional amount of EnCana Corp. 4.75% 10/15/13 | March 2009 | | $ 1,800,000 | | 5,856 |
Receive quarterly notional amount multiplied by .38% and pay Merrill Lynch, Inc. upon default event of EnCana Corp., par value of the notional amount of EnCana Corp. 4.75% 10/15/13 | March 2009 | | 700,000 | | 2,277 |
Swap Agreements - continued |
| Expiration Date | | Notional Amount | | Value |
Credit Default Swap - continued |
Receive quarterly notional amount multiplied by .41% and pay Merrill Lynch, Inc. upon default event of Talisman Energy, Inc., par value of the notional amount of Talisman Energy, Inc. 7.25% 10/15/27 | March 2009 | | $ 1,400,000 | | $ 5,112 |
Receive quarterly notional amount multiplied by .87% and pay Merrill Lynch, Inc. upon default of Raytheon Co., par value of the notional amount of Raytheon Co. 5.375% 4/1/13 | June 2008 | | 5,000,000 | | 96,314 |
TOTAL CREDIT DEFAULT SWAP | 8,900,000 | | 109,559 |
Interest Rate Swap |
Receive quarterly a fixed rate equal to 3.524% and pay quarterly a floating rate based on 3-month LIBOR with Morgan Stanley, Inc. | May 2007 | | 12,000,000 | | 17,987 |
Recieve quarterly a fixed rate equal to 2.83852% and pay quarterly a floating rate based on 3-month LIBOR with Credit Suisse First Boston | Oct. 2006 | | 90,000,000 | | (684,270) |
TOTAL INTEREST RATE SWAP | 102,000,000 | | (666,283) |
Total Return Swap |
Receive monthly a return equal to Lehman Brothers for CMBS AAA 8.5+ Index and pay monthly a floating rate based on 1-month LIBOR minus 40 basis points with Lehman Brothers, Inc. | April 2005 | | 10,000,000 | | 103,426 |
|
| Expiration Date | | Notional Amount | | Value |
Receive quarterly a return equal to Banc of America Securities LLC AAA 10Yr Commercial Mortgage-Backed Securities Daily Index and pay quarterly a floating rate based on 3-month LIBOR minus 72 basis points with Bank of America | Jan. 2005 | | $ 10,000,000 | | $ (34,704) |
Receive quarterly a return equal to that of Banc of America Securities LLC AAA 10Yr Commercial Mortgage Backed Securities Daily Index and pay quarterly a floating rate based on 3-month LIBOR minus 30 basis points with Bank of America | May 2005 | | 10,000,000 | | (11,122) |
Receive quarterly a return equal to that of Banc of America Securities LLC AAA 10Yr Commercial Mortgage-Backed Securities Daily Index and pay quarterly a floating rate based on 3-month LIBOR minus 27 basis points with Bank of America | June 2005 | | 10,000,000 | | 133,074 |
TOTAL TOTAL RETURN SWAP | 40,000,000 | | 190,674 |
| | $ 150,900,000 | | $ (366,050) |
Legend |
(a) Security exempt from registration under Rule 144A of the Securities Act of 1933. These securities may be resold in transactions exempt from registration, normally to qualified institutional buyers. At the period end, the value of these securities amounted to 69,247,712 or 4.3% of net assets. |
(b) Security or a portion of the security purchased on a delayed delivery or when-issued basis. |
(c) The coupon rate shown on floating or adjustable rate securities represents the rate at period end. |
(d) Affiliated fund that is available only to investment companies and other accounts managed by Fidelity Investments. A complete listing of the fund's holdings as of its most recent fiscal year end is available upon request. |
(e) Security represents right to receive monthly interest payments on an underlying pool of mortgages. Principal shown is the par amount of the mortgage pool. |
(f) Additional information on each counterparty to the repurchase agreement is as follows: |
Repurchase Agreement/
Counterparty | Value |
$381,814,000 due 1/3/05 at 2.28% | |
Banc of America Securities LLC. | $ 58,606,652 |
Bank of America, National Association | 44,231,435 |
Barclays Capital Inc. | 53,837,906 |
Bear Stearns & Co. Inc. | 33,173,577 |
Countrywide Securities Corporation | 5,528,929 |
Goldman, Sachs & Co. | 44,231,435 |
J.P. Morgan Securities, Inc. | 11,057,859 |
Morgan Stanley & Co. Incorporated. | 26,096,547 |
UBS Securities LLC | 66,347,154 |
Wachovia Capital Markets, LLC | 27,644,647 |
WestLB AG | 11,057,859 |
| $ 381,814,000 |
Income Tax Information |
The fund hereby designates as capital gain dividends: For dividends with respect to the taxable year ended December 31, 2004, $24,301,000 or, if different, the net capital gain of such year, and for dividends with respect to the taxable year ended December 31, 2003, $17,470,000 or, if different, the excess of (a) the net capital gain of such year, over (b) amounts previously designated as capital gain dividends with respect to such year. |
See accompanying notes which are an integral part of the financial statements.
Annual Report
Fidelity Variable Insurance Products: Investment Grade Bond Portfolio
Financial Statements
Statement of Assets and Liabilities
| December 31, 2004 |
Assets | | |
Investment in securities, at value (including repurchase agreements of $381,814,000) (cost $1,847,358,646) - See accompanying schedule | | $ 1,873,468,569 |
Receivable for investments sold | | 738,404 |
Receivable for fund shares sold | | 1,404,617 |
Interest receivable | | 10,894,032 |
Prepaid expenses | | 6,062 |
Total assets | | 1,886,511,684 |
| | |
Liabilities | | |
Payable to custodian bank | $ 3,700 | |
Payable for investments purchased
Regular delivery | 4,411,984 | |
Delayed delivery | 268,030,904 | |
Payable for fund shares redeemed | 1,321,796 | |
Swap agreements, at value | 366,050 | |
Accrued management fee | 569,169 | |
Distribution fees payable | 42,089 | |
Other affiliated payables | 141,569 | |
Other payables and accrued expenses | 208,277 | |
Total liabilities | | 275,095,538 |
| | |
Net Assets | | $ 1,611,416,146 |
Net Assets consist of: | | |
Paid in capital | | $ 1,492,685,250 |
Undistributed net investment income | | 59,329,661 |
Accumulated undistributed net realized gain (loss) on investments | | 33,657,362 |
Net unrealized appreciation (depreciation) on investments | | 25,743,873 |
Net Assets | | $ 1,611,416,146 |
| | |
Initial Class:
Net Asset Value, offering price and redemption price per share ($1,374,971,627 ÷ 103,761,799 shares) | | $ 13.25 |
| | |
Service Class:
Net Asset Value, offering price and redemption price per share ($50,142,834 ÷ 3,803,176 shares) | | $ 13.18 |
| | |
Service Class 2:
Net Asset Value, offering price and redemption price per share ($186,301,685 ÷ 14,241,911 shares) | | $ 13.08 |
Statement of Operations
| Year ended December 31, 2004 |
Investment Income | | |
Interest | | $ 66,998,813 |
Security lending | | 45,551 |
Total income | | 67,044,364 |
| | |
Expenses | | |
Management fee | $ 6,787,838 | |
Transfer agent fees | 1,083,006 | |
Distribution fees | 402,351 | |
Accounting and security lending fees | 621,799 | |
Non-interested trustees' compensation | 8,868 | |
Custodian fees and expenses | 80,161 | |
Audit | 53,510 | |
Legal | 3,436 | |
Miscellaneous | 243,840 | |
Total expenses before reductions | 9,284,809 | |
Expense reductions | (3,322) | 9,281,487 |
Net investment income | | 57,762,877 |
Realized and Unrealized Gain (Loss) Net realized gain (loss) on: | | |
Investment securities | 34,123,429 | |
Swap agreements | 3,049,746 | |
Total net realized gain (loss) | | 37,173,175 |
Change in net unrealized appreciation (depreciation) on: Investment securities | (25,733,829) | |
Swap agreements | (947,280) | |
Delayed delivery commitments | (6,281) | |
Total change in net unrealized appreciation (depreciation) | | (26,687,390) |
Net gain (loss) | | 10,485,785 |
Net increase (decrease) in net assets resulting from operations | | $ 68,248,662 |
See accompanying notes which are an integral part of the financial statements.
Investment Grade Bond Portfolio
Statement of Changes in Net Assets
| Year ended
December 31,
2004 | Year ended
December 31,
2003 |
Increase (Decrease) in Net Assets | | |
Operations | | |
Net investment income | $ 57,762,877 | $ 67,814,156 |
Net realized gain (loss) | 37,173,175 | 46,329,913 |
Change in net unrealized appreciation (depreciation) | (26,687,390) | (17,351,198) |
Net increase (decrease) in net assets resulting from operations | 68,248,662 | 96,792,871 |
Distributions to shareholders from net investment income | (66,752,508) | (82,217,412) |
Distributions to shareholders from net realized gain | (48,129,691) | (28,967,100) |
Total distributions | (114,882,199) | (111,184,512) |
Share transactions - net increase (decrease) | (4,083,226) | (361,117,397) |
Total increase (decrease) in net assets | (50,716,763) | (375,509,038) |
| | |
Net Assets | | |
Beginning of period | 1,662,132,909 | 2,037,641,947 |
End of period (including undistributed net investment income of $59,329,661 and undistributed net investment income of $68,804,726, respectively) | $ 1,611,416,146 | $ 1,662,132,909 |
Other Information: | | | |
Share Transactions | Year ended December 31, 2004 |
| Initial Class | Service Class | Service Class 2 |
Shares Sold | 8,574,911 | 3,638,367 | 8,102,610 |
Reinvested | 8,127,198 | 133,843 | 666,249 |
Redeemed | (24,926,667) | (1,314,273) | (3,077,343) |
Net increase (decrease) | (8,224,558) | 2,457,937 | 5,691,516 |
| | | |
Dollars Sold | $ 111,904,360 | $ 47,309,999 | $ 104,259,091 |
Reinvested | 104,678,315 | 1,715,870 | 8,488,014 |
Redeemed | (325,781,316) | (17,025,100) | (39,632,459) |
Net increase (decrease) | $ (109,198,641) | $ 32,000,769 | $ 73,114,646 |
Share Transactions | Year ended December 31, 2003 |
| Initial Class | Service Class | Service Class 2 |
Shares Sold | 23,978,195 | 1,752,061 | 7,214,822 |
Reinvested | 8,213,993 | 2,020 | 300,111 |
Redeemed | (63,630,168) | (480,248) | (4,242,792) |
Net increase (decrease) | (31,437,980) | 1,273,833 | 3,272,141 |
| | | |
Dollars Sold | $ 320,978,012 | $ 23,516,680 | $ 95,735,008 |
Reinvested | 107,274,755 | 26,323 | 3,883,434 |
Redeemed | (849,723,435) | (6,448,689) | (56,359,485) |
Net increase (decrease) | $ (421,470,668) | $ 17,094,314 | $ 43,258,957 |
Distributions | Year ended December 31, 2004 |
| Initial Class | Service Class | Service Class 2 |
From net investment income | $ 60,884,326 | $ 1,005,257 | $ 4,862,925 |
From net realized gain | 43,793,989 | 710,613 | 3,625,089 |
Total | $ 104,678,315 | $ 1,715,870 | $ 8,488,014 |
| Year ended December 31, 2003 |
| Initial Class | Service Class | Service Class 2 |
From net investment income | $ 79,353,928 | $ 19,279 | $ 2,844,205 |
From net realized gain | 27,920,827 | 7,044 | 1,039,229 |
Total | $ 107,274,755 | $ 26,323 | $ 3,883,434 |
See accompanying notes which are an integral part of the financial statements.
Annual Report
Financial Highlights - Initial Class
Years ended December 31, | 2004 | 2003 | 2002 | 2001 | 2000 |
Selected Per-Share Data | | | | | |
Net asset value, beginning of period | $ 13.65 | $ 13.70 | $ 12.92 | $ 12.59 | $ 12.16 |
Income from Investment Operations | | | | | |
Net investment income C | .476 | .467 | .610 | .685 E | .771 |
Net realized and unrealized gain (loss) | .104 | .213 | .680 | .335 E | .499 |
Total from investment operations | .580 | .680 | 1.290 | 1.020 | 1.270 |
Distributions from net investment income | (.570) | (.540) | (.510) | (.690) | (.840) |
Distributions from net realized gain | (.410) | (.190) | - | - | - |
Total distributions | (.980) | (.730) | (.510) | (.690) | (.840) |
Net asset value, end of period | $ 13.25 | $ 13.65 | $ 13.70 | $ 12.92 | $ 12.59 |
Total Return A, B | 4.46% | 5.20% | 10.34% | 8.46% | 11.22% |
Ratios to Average Net Assets D | | | | | |
Expenses before expense reductions | .56% | .54% | .54% | .54% | .54% |
Expenses net of voluntary waivers, if any | .56% | .54% | .54% | .54% | .54% |
Expenses net of all reductions | .56% | .54% | .53% | .54% | .54% |
Net investment income | 3.65% | 3.48% | 4.71% | 5.47% E | 6.50% |
Supplemental Data | | | | | |
Net assets, end of period (000 omitted) | $ 1,374,972 | $ 1,528,417 | $ 1,965,036 | $ 1,445,925 | $ 739,911 |
Portfolio turnover rate | 170% | 218% | 192% | 278% | 154% |
A Total returns do not reflect charges attributable to your insurance company's separate account. Inclusion of these charges would reduce the total returns shown.
B Total returns would have been lower had certain expenses not been reduced during the periods shown.
C Calculated based on average shares outstanding during the period.
D Expense ratios reflect operating expenses of the class. Expenses before reductions do not reflect amounts reimbursed by the investment adviser or reductions from brokerage service arrangements or other expense offset arrangements and do not represent the amount paid by the class during periods when reimbursements or reductions occur. Expenses net of any voluntary waivers reflect expenses after reimbursement by the investment adviser but prior to reductions from brokerage service arrangements or other expense offset arrangements. Expenses net of all reductions represent the net expenses paid by the class.
E Effective January 1, 2001, the fund adopted the provisions of the AICPA Audit and Accounting Guide for Investment Companies and began amortizing premium and discount on all debt securities. Per-share data and ratios for periods prior to adoption have not been restated to reflect this change.
Financial Highlights - Service Class
Years ended December 31, | 2004 | 2003 | 2002 | 2001 | 2000 F |
Selected Per-Share Data | | | | | |
Net asset value, beginning of period | $ 13.61 | $ 13.66 | $ 12.89 | $ 12.58 | $ 11.80 |
Income from Investment Operations | | | | | |
Net investment income E | .456 | .448 | .591 | .674 H | .377 |
Net realized and unrealized gain (loss) | .104 | .212 | .679 | .326 H | .403 |
Total from investment operations | .560 | .660 | 1.270 | 1.000 | .780 |
Distributions from net investment income | (.580) | (.520) | (.500) | (.690) | - |
Distributions from net realized gain | (.410) | (.190) | - | - | - |
Total distributions | (.990) | (.710) | (.500) | (.690) | - |
Net asset value, end of period | $ 13.18 | $ 13.61 | $ 13.66 | $ 12.89 | $ 12.58 |
Total Return B, C, D | 4.32% | 5.06% | 10.20% | 8.30% | 6.61% |
Ratios to Average Net Assets G | | | | | |
Expenses before expense reductions | .66% | .64% | .64% | .64% | .64% A |
Expenses net of voluntary waivers, if any | .66% | .64% | .64% | .64% | .64% A |
Expenses net of all reductions | .66% | .64% | .64% | .64% | .64% A |
Net investment income | 3.54% | 3.38% | 4.60% | 5.37% H | 6.40% A |
Supplemental Data | | | | | |
Net assets, end of period (000 omitted) | $ 50,143 | $ 18,305 | $ 975 | $ 115 | $ 107 |
Portfolio turnover rate | 170% | 218% | 192% | 278% | 154% |
A Annualized
B Total returns for periods of less than one year are not annualized.
C Total returns do not reflect charges attributable to your insurance company's separate account. Inclusion of these charges would reduce the total returns shown.
D Total returns would have been lower had certain expenses not been reduced during the periods shown.
E Calculated based on average shares outstanding during the period.
F For the period July 7, 2000 (commencement of sale of shares) to December 31, 2000.
G Expense ratios reflect operating expenses of the class. Expenses before reductions do not reflect amounts reimbursed by the investment adviser or reductions from brokerage service arrangements or other expense offset arrangements and do not represent the amount paid by the class during periods when reimbursements or reductions occur. Expense ratios before reductions for start-up periods may not be representative of longer-term operating periods. Expenses net of any voluntary waivers reflect expenses after reimbursement by the investment adviser but prior to reductions from brokerage service arrangements or other expense offset arrangements. Expenses net of all reductions represent the net expenses paid by the class.
H Effective January 1, 2001, the fund adopted the provisions of the AICPA Audit and Accounting Guide for Investment Companies and began amortizing premium and discount on all debt securities. Per-share data and ratios for periods prior to adoption have not been restated to reflect this change.
See accompanying notes which are an integral part of the financial statements.
Investment Grade Bond Portfolio
Financial Highlights - Service Class 2
Years ended December 31, | 2004 | 2003 | 2002 | 2001 | 2000 F |
Selected Per-Share Data | | | | | |
Net asset value, beginning of period | $ 13.50 | $ 13.57 | $ 12.82 | $ 12.54 | $ 12.06 |
Income from Investment Operations | | | | | |
Net investment income E | .435 | .427 | .571 | .643 H | .686 |
Net realized and unrealized gain (loss) | .105 | .213 | .679 | .327 H | .634 |
Total from investment operations | .540 | .640 | 1.250 | .970 | 1.320 |
Distributions from net investment income | (.550) | (.520) | (.500) | (.690) | (.840) |
Distributions from net realized gain | (.410) | (.190) | - | - | - |
Total distributions | (.960) | (.710) | (.500) | (.690) | (.840) |
Net asset value, end of period | $ 13.08 | $ 13.50 | $ 13.57 | $ 12.82 | $ 12.54 |
Total Return B, C, D | 4.19% | 4.94% | 10.09% | 8.08% | 11.69% |
Ratios to Average Net Assets G | | | | | |
Expenses before expense reductions | .81% | .79% | .79% | .82% | 1.75% A |
Expenses net of voluntary waivers, if any | .81% | .79% | .79% | .82% | 1.05% A |
Expenses net of all reductions | .81% | .79% | .79% | .82% | 1.05% A |
Net investment income | 3.39% | 3.23% | 4.45% | 5.19% H | 5.99% A |
Supplemental Data | | | | | |
Net assets, end of period (000 omitted) | $ 186,302 | $ 115,411 | $ 71,631 | $ 18,225 | $ 229 |
Portfolio turnover rate | 170% | 218% | 192% | 278% | 154% |
A Annualized
B Total returns for periods of less than one year are not annualized.
C Total returns do not reflect charges attributable to your insurance company's separate account. Inclusion of these charges would reduce the total returns shown.
D Total returns would have been lower had certain expenses not been reduced during the periods shown.
E Calculated based on average shares outstanding during the period.
F For the period January 12, 2000 (commencement of sale of shares) to December 31, 2000.
G Expense ratios reflect operating expenses of the class. Expenses before reductions do not reflect amounts reimbursed by the investment adviser or reductions from brokerage service arrangements or other expense offset arrangements and do not represent the amount paid by the class during periods when reimbursements or reductions occur. Expense ratios before reductions for start-up periods may not be representative of longer-term operating periods. Expenses net of any voluntary waivers reflect expenses after reimbursement by the investment adviser but prior to reductions from brokerage service arrangements or other expense offset arrangements. Expenses net of all reductions represent the net expenses paid by the class.
H Effective January 1, 2001, the fund adopted the provisions of the AICPA Audit and Accounting Guide for Investment Companies and began amortizing premium and discount on all debt securities. Per-share data and ratios for periods prior to adoption have not been restated to reflect this change.
See accompanying notes which are an integral part of the financial statements.
Annual Report
Fidelity Variable Insurance Products: Mid Cap Portfolio
Performance: The Bottom Line
Average annual total return reflects the change in the value of an investment, assuming reinvestment of the class' dividend income and capital gains (the profits earned upon the sale of securities that have grown in value) and assuming a constant rate of performance each year. During periods of reimbursement by Fidelity, a fund's total return will be greater than it would be had the reimbursement not occurred. Performance numbers are net of all underlying fund operating expenses, but do not include any insurance charges imposed by your insurance company's separate account. If performance information included the effect of these additional charges, the total returns would have been lower. How a fund did yesterday is no guarantee of how it will do tomorrow.
Average Annual Total Returns
Periods ended December 31, 2004 | Past 1
year | Past 5
years | Life of fund A |
Fidelity ® VIP: Mid Cap Portfolio - Initial Class | 24.92% | 15.11% | 20.74% |
Fidelity VIP: Mid Cap Portfolio - Service Class B | 24.77% | 14.98% | 20.61% |
Fidelity VIP: Mid Cap Portfolio - Service Class 2 C | 24.60% | 14.81% | 20.46% |
A From December 28, 1998.
B Performance for Service Class shares reflects an asset based distribution fee (12b-1).
C The initial offering of Service Class 2 shares took place January 12, 2000. Performance for Service Class 2 shares reflects an asset based distribution fee (12b-1 fee). Returns from December 28, 1998 to January 12, 2000 are those of Service Class which reflect a different 12b-1 fee. Had Service Class 2's 12b-1 fee been reflected, returns prior to January 12, 2000 would have been lower.
$10,000 Over Life of Fund
Let's say hypothetically that $10,000 was invested in Fidelity® Variable Insurance Products: Mid Cap Portfolio - Initial Class on December 28, 1998, when the fund started. The chart shows how the value of your investment would have changed, and also shows how the S&P® MidCap 400 Index performed the same period.
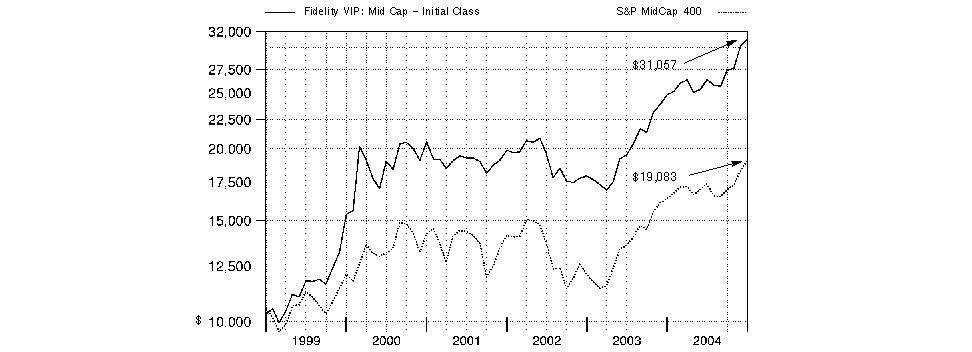
Mid Cap Portfolio
Fidelity Variable Insurance Products: Mid Cap Portfolio
Management's Discussion of Fund Performance
Comments from Thomas Allen, Portfolio Manager of Fidelity® Variable Insurance Products: Mid Cap Portfolio
The year ending December 31, 2004, generally was positive for equity investors, as many stock market benchmarks produced double-digit gains. Broad-based themes included the continued dominance of small-cap stocks, which outperformed large-caps for the sixth consecutive year. The small-cap Russell 2000® Index was up 18.33% in 2004, while the larger-cap Standard & Poor's 500SM Index rose 10.88%. Value stocks ended the year well ahead of growth stocks: The Russell 3000® Value Index advanced 16.94%, compared to 6.93% for the Russell 3000 Growth Index. Energy and basic materials stocks led the market upward. Energy stocks were boosted by record-high oil prices, while strong demand from China helped support commodity prices. The health care sector was among the market's weakest performers. Technology also fell off the pace, though it was helped by a rally late in the year. The tech-heavy NASDAQ Composite® Index returned 9.15%, thanks primarily to a 14.87% jump in the fourth quarter. Elsewhere, the Dow Jones Industrial AverageSM gained 5.37% for the year.
For the 12-month period that ended December 31, 2004, the fund solidly outperformed both the Standard & Poor's® MidCap 400 Index, which gained 16.48%, and the LipperSM Variable Annuity Mid-Cap Funds Average, which rose 15.30%. Rising oil prices helped boost many energy stocks during the period, and the fund was fortunate to own some of those that rose more than others, including Southwestern Energy and PetroKazakhstan, based in the former Soviet Union. Favorable stock selection in health care equipment and services companies, such as pharmacy benefits manager Caremark Rx, also helped the fund beat its index, as did an underweighting in the weak semiconductor group. The fund's overweighting in materials turned out to be a double-edged sword: Steel stocks worked very well, driven by tight supply, increasing demand from emerging markets and a moderately weaker U.S. dollar, while our gold-related holdings performed poorly, including such names as Newmont Mining, Buenaventura Mining and Harmony Gold.
The views expressed in this statement reflect those of the portfolio manager only through the end of the period of the report as stated on the cover and do not necessarily represent the views of Fidelity or any other person in the Fidelity organization. Any such views are subject to change at any time based upon market or other conditions and Fidelity disclaims any responsibility to update such views. These views may not be relied on as investment advice and, because investment decisions for a Fidelity fund are based on numerous factors, may not be relied on as an indication of trading intent on behalf of any Fidelity fund.
Annual Report
Fidelity Variable Insurance Products Fund: Mid Cap Portfolio
Investment Summary
Top Five Stocks as of December 31, 2004 |
| % of fund's
net assets |
Newmont Mining Corp. | 2.5 |
Nucor Corp. | 2.4 |
Invitrogen Corp. | 2.4 |
Steel Dynamics, Inc. | 1.6 |
Charles River Laboratories International, Inc. | 1.6 |
| 10.5 |
Top Five Market Sectors as of December 31, 2004 |
| % of fund's
net assets |
Materials | 18.4 |
Health Care | 15.9 |
Energy | 13.5 |
Industrials | 11.2 |
Consumer Discretionary | 11.0 |
Asset Allocation as of December 31, 2004 |
% of fund's net assets * |
| Stocks | 96.7% | |
| Short-Term
Investments and
Net Other Assets | 3.3% | |
* Foreign investments 27.3% | |

Mid Cap Portfolio
Fidelity Variable Insurance Products Fund: Mid Cap Portfolio
Investments December 31, 2004
Showing Percentage of Net Assets
Common Stocks - 96.7% |
| Shares | | Value (Note 1) |
CONSUMER DISCRETIONARY - 11.0% |
Auto Components - 1.7% |
Amerigon, Inc. (a) | 100 | | $ 374 |
Autoliv, Inc. | 144,100 | | 6,960,030 |
Bharat Forge Ltd. | 55,244 | | 1,373,947 |
BorgWarner, Inc. | 146,100 | | 7,914,237 |
China Yuchai International Ltd. (a) | 100 | | 1,328 |
Continental AG | 100 | | 6,339 |
Gentex Corp. | 532,100 | | 19,698,342 |
IMPCO Technologies, Inc. (a)(e) | 1,506,400 | | 11,373,320 |
Johnson Controls, Inc. | 200 | | 12,688 |
LKQ Corp. (a) | 315,337 | | 6,328,814 |
Nokian Tyres Ltd. | 96,700 | | 14,665,743 |
Starcraft Corp. (a) | 105 | | 1,469 |
| | 68,336,631 |
Automobiles - 0.1% |
Bajaj Auto Ltd. | 35,300 | | 923,268 |
Denway Motors Ltd. | 4,000 | | 1,428 |
Fiat Spa sponsord ADR (a) | 100 | | 798 |
Harley-Davidson, Inc. | 100 | | 6,075 |
Hero Honda Motors Ltd. | 221,071 | | 2,925,549 |
Mahindra & Mahindra Ltd. | 100 | | 1,261 |
Maruti Udyog Ltd. | 100 | | 1,068 |
Tata Motors Ltd. | 100 | | 1,168 |
Thor Industries, Inc. | 200 | | 7,410 |
| | 3,868,025 |
Distributors - 0.0% |
Educational Development Corp. | 100 | | 1,044 |
Li & Fung Ltd. | 2,000 | | 3,371 |
| | 4,415 |
Hotels, Restaurants & Leisure - 3.1% |
Accor SA | 100 | | 4,369 |
AFC Enterprises, Inc. (a) | 100 | | 2,365 |
Applebee's International, Inc. | 150 | | 3,968 |
BJ's Restaurants, Inc. (a) | 100 | | 1,400 |
Buffalo Wild Wings, Inc. (a) | 208,000 | | 7,240,480 |
Jack in the Box, Inc. (a) | 23,600 | | 870,132 |
Jurys Doyle Hotel Group PLC (Ireland) | 100 | | 1,671 |
Krispy Kreme Doughnuts, Inc. (a) | 100 | | 1,260 |
Kuoni Reisen Holding AG Class B (Reg.) | 100 | | 43,881 |
Outback Steakhouse, Inc. | 773,700 | | 35,419,986 |
P.F. Chang's China Bistro, Inc. (a) | 100 | | 5,635 |
Red Robin Gourmet Burgers, Inc. (a) | 198,000 | | 10,587,060 |
Royal Caribbean Cruises Ltd. | 511,000 | | 27,818,840 |
Sonic Corp. (a) | 1,372,825 | | 41,871,163 |
Total Entertainment Restaurant Corp. (a) | 100 | | 1,192 |
| | 123,873,402 |
Household Durables - 1.3% |
Alba PLC | 581,101 | | 7,137,036 |
Arcelik AS (a) | 100 | | 1 |
Fedders Corp. | 100 | | 362 |
Garmin Ltd. | 51 | | 3,103 |
|
| Shares | | Value (Note 1) |
George Wimpey PLC | 100 | | $ 776 |
Harman International Industries, Inc. | 118,400 | | 15,036,800 |
Hovnanian Enterprises, Inc. Class A (a) | 200 | | 9,904 |
LG Electronics, Inc. | 167,270 | | 10,357,427 |
Makita Corp. sponsored ADR | 100 | | 1,775 |
Rational AG | 39,471 | | 3,665,649 |
Sekisui House Ltd. | 877,000 | | 10,222,962 |
Skyworth Digital Holdings Ltd. | 2,052 | | 306 |
Toll Brothers, Inc. (a) | 105,000 | | 7,204,050 |
William Lyon Homes, Inc. (a) | 100 | | 7,024 |
| | 53,647,175 |
Internet & Catalog Retail - 0.2% |
1-800-FLOWERS.com, Inc. Class A (a) | 200 | | 1,682 |
Alloy, Inc. (a) | 100 | | 807 |
Audible, Inc. (a) | 100 | | 2,605 |
GSI Commerce, Inc. (a) | 100 | | 1,778 |
Overstock.com, Inc. (a) | 100 | | 6,900 |
Provide Commerce, Inc. | 65,200 | | 2,422,180 |
Rakuten, Inc. (d) | 301 | | 343,815 |
Rakuten, Inc. New (a)(d) | 2,709 | | 3,094,338 |
ValueVision Media, Inc. Class A (a) | 100 | | 1,391 |
| | 5,875,496 |
Leisure Equipment & Products - 0.1% |
Arctic Cat, Inc. | 100 | | 2,652 |
Asia Optical Co., Inc. | 28,718 | | 159,896 |
Jumbo SA | 295,690 | | 2,302,419 |
Mega Bloks, Inc. (a) | 100 | | 1,588 |
Oakley, Inc. | 100 | | 1,275 |
Polaris Industries, Inc. | 200 | | 13,604 |
SCP Pool Corp. | 225 | | 7,178 |
SHIMANO, Inc. | 100 | | 2,856 |
| | 2,491,468 |
Media - 0.6% |
Astral Media, Inc. Class A (non-vtg.) | 365,800 | | 9,931,470 |
Chum Ltd. Class B (non-vtg.) | 200 | | 4,958 |
Clear Media Ltd. (a) | 243,000 | | 226,656 |
Cumulus Media, Inc. Class A (a) | 100 | | 1,508 |
E.W. Scripps Co. Class A | 100 | | 4,828 |
Fox Entertainment Group, Inc. Class A (a) | 100 | | 3,126 |
Gemstar-TV Guide International, Inc. (a) | 100 | | 592 |
Getty Images, Inc. (a) | 100 | | 6,885 |
Grupo Televisa SA de CV sponsored ADR | 100 | | 6,050 |
Harris Interactive, Inc. (a) | 100 | | 790 |
Impresa SGPS (a) | 100 | | 787 |
Insignia Systems, Inc. (a) | 100 | | 218 |
JC Decaux SA (a) | 100 | | 2,914 |
Modern Times Group AB (MTG) (B Shares) (a) | 100 | | 2,724 |
Padmalaya Telefilms Ltd. (a) | 100 | | 122 |
Saga Communications, Inc. Class A (a) | 100 | | 1,685 |
Salem Communications Corp. Class A (a) | 48,300 | | 1,205,085 |
SBS Broadcasting SA (a) | 100 | | 4,023 |
Scholastic Corp. (a) | 100 | | 3,696 |
Common Stocks - continued |
| Shares | | Value (Note 1) |
CONSUMER DISCRETIONARY - continued |
Media - continued |
SKY Perfect Communications, Inc. | 5,512 | | $ 5,973,172 |
Sogecable SA (a) | 100 | | 4,430 |
Spanish Broadcasting System, Inc. Class A (a) | 100 | | 1,056 |
TiVo, Inc. (a) | 100 | | 587 |
Trader Classified Media NV (A Shares) | 100 | | 1,384 |
Zee Telefilms Ltd. | 1,820,140 | | 7,219,538 |
| | 24,608,284 |
Multiline Retail - 0.1% |
99 Cents Only Stores (a) | 100 | | 1,616 |
Dollar General Corp. | 100 | | 2,077 |
Dollar Tree Stores, Inc. (a) | 100 | | 2,868 |
Don Quijote Co. Ltd. (d) | 113,100 | | 5,774,802 |
Family Dollar Stores, Inc. | 100 | | 3,123 |
| | 5,784,486 |
Specialty Retail - 2.7% |
Abercrombie & Fitch Co. Class A | 100 | | 4,695 |
AC Moore Arts & Crafts, Inc. (a) | 705,100 | | 20,313,931 |
Advance Auto Parts, Inc. (a) | 200 | | 8,736 |
Aeropostale, Inc. (a) | 100 | | 2,943 |
Best Buy Co., Inc. | 200 | | 11,884 |
CarMax, Inc. (a) | 622,400 | | 19,325,520 |
Chico's FAS, Inc. (a) | 100 | | 4,553 |
Cost Plus, Inc. (a) | 142,700 | | 4,584,951 |
Esprit Holdings Ltd. | 500 | | 3,023 |
French Connection Group PLC | 100 | | 471 |
Genesco, Inc. (a) | 100 | | 3,114 |
Guitar Center, Inc. (a) | 100 | | 5,269 |
Hot Topic, Inc. (a) | 323,883 | | 5,567,549 |
KOMERI Co. Ltd. (d) | 672,100 | | 18,306,737 |
Michaels Stores, Inc. | 200 | | 5,994 |
Nitori Co. Ltd. (d) | 233,050 | | 15,221,171 |
O'Reilly Automotive, Inc. (a) | 100 | | 4,505 |
Pacific Sunwear of California, Inc. (a) | 305,000 | | 6,789,300 |
Pantaloon Retail India Ltd. | 100 | | 1,689 |
Peacock Group PLC | 1,271,844 | | 6,638,792 |
PETsMART, Inc. | 24,000 | | 852,720 |
Pier 1 Imports, Inc. | 100 | | 1,970 |
RONA, Inc. (a) | 100,000 | | 3,400,000 |
Ross Stores, Inc. | 43,900 | | 1,267,393 |
Sa Sa International Holdings Ltd. | 2,000 | | 1,074 |
Select Comfort Corp. (a) | 100 | | 1,794 |
Sharper Image Corp. (a) | 100 | | 1,885 |
Shimamura Co. Ltd. | 100 | | 7,303 |
TBC Corp. New (a) | 100 | | 2,780 |
The Bombay Company, Inc. (a) | 100 | | 553 |
Tiffany & Co., Inc. | 57,100 | | 1,825,487 |
Tractor Supply Co. (a) | 100 | | 3,721 |
|
| Shares | | Value (Note 1) |
Urban Outfitters, Inc. (a) | 400 | | $ 17,760 |
Williams-Sonoma, Inc. (a) | 54,700 | | 1,916,688 |
| | 106,105,955 |
Textiles, Apparel & Luxury Goods - 1.1% |
Columbia Sportswear Co. (a) | 579,600 | | 34,549,956 |
Compagnie Financiere Richemont unit | 100 | | 3,322 |
Folli Follie SA | 42,980 | | 1,259,378 |
Gildan Activewear, Inc. Class A (sub. vtg.) (a) | 100 | | 3,399 |
K-Swiss, Inc. Class A | 200 | | 5,824 |
Kenneth Cole Productions, Inc. Class A (sub. vtg.) | 100 | | 3,086 |
NIKE, Inc. Class B | 100 | | 9,069 |
Polo Ralph Lauren Corp. Class A | 100 | | 4,260 |
Quiksilver, Inc. (a) | 200 | | 5,958 |
Ted Baker PLC | 945,208 | | 8,761,144 |
The Swatch Group AG (Bearer) | 100 | | 14,647 |
Timberland Co. Class A (a) | 100 | | 6,267 |
Weyco Group, Inc. | 100 | | 4,429 |
Wolverine World Wide, Inc. | 100 | | 3,142 |
| | 44,633,881 |
TOTAL CONSUMER DISCRETIONARY | | 439,229,218 |
CONSUMER STAPLES - 7.4% |
Beverages - 0.0% |
Boston Beer Co., Inc. Class A (a) | 100 | | 2,127 |
Companhia de Bebidas das Americas (AmBev) sponsored ADR | 100 | | 2,833 |
Fomento Economico Mexicano SA de CV sponsored ADR | 100 | | 5,261 |
Grupo Modelo SA de CV Series C | 100 | | 275 |
Hansen Natural Corp. (a) | 100 | | 3,641 |
Jones Soda Co. (a) | 95,700 | | 330,165 |
MGP Ingredients, Inc. | 200 | | 1,728 |
Pernod-Ricard | 100 | | 15,288 |
Tsingtao Brewery Co. Ltd. (H Shares) | 1,000 | | 1,010 |
| | 362,328 |
Food & Staples Retailing - 0.4% |
Central European Distribution Corp. (a) | 150 | | 4,431 |
Massmart Holdings Ltd. | 847,869 | | 6,778,342 |
Plant Co. Ltd. | 120,300 | | 1,820,414 |
Shinsegae Co. Ltd. | 1,390 | | 382,008 |
Whole Foods Market, Inc. | 74,600 | | 7,113,110 |
| | 16,098,305 |
Food Products - 6.3% |
Archer-Daniels-Midland Co. | 2,678,000 | | 59,746,180 |
Barry Callebaut AG | 23,513 | | 5,839,817 |
Bunge Ltd. | 638,200 | | 36,383,782 |
Corn Products International, Inc. | 713,400 | | 38,209,704 |
Fresh Del Monte Produce, Inc. | 100 | | 2,961 |
Glanbia PLC | 784,887 | | 2,981,268 |
Green Mountain Coffee Roasters, Inc. (a) | 47,993 | | 1,204,624 |
Common Stocks - continued |
| Shares | | Value (Note 1) |
CONSUMER STAPLES - continued |
Food Products - continued |
Hershey Foods Corp. | 504,300 | | $ 28,008,822 |
Hormel Foods Corp. | 100 | | 3,135 |
IAWS Group PLC (Ireland) | 25,450 | | 421,195 |
Lindt & Spruengli AG | 400 | | 5,844,925 |
Lindt & Spruengli AG (participation certificate) | 2,770 | | 3,933,354 |
McCormick & Co., Inc. (non-vtg.) | 496,000 | | 19,145,600 |
Peet's Coffee & Tea, Inc. (a) | 100 | | 2,647 |
People's Food Holdings Ltd. | 10,068,165 | | 9,253,261 |
PT Indofood Sukses Makmur Tbk | 56,655,500 | | 4,889,370 |
Smithfield Foods, Inc. (a) | 1,230,200 | | 36,401,618 |
SunOpta, Inc. (a) | 39,000 | | 279,825 |
Wimm-Bill-Dann Foods OJSC ADR (a) | 65,400 | | 935,874 |
Wm. Wrigley Jr. Co. | 100 | | 6,919 |
| | 253,494,881 |
Household Products - 0.1% |
Central Garden & Pet Co. Class A (a) | 100 | | 4,174 |
Godrej Consumer Products Ltd. | 178,876 | | 1,237,657 |
Hindustan Lever Ltd. | 104,300 | | 345,818 |
Kao Corp. | 1,000 | | 25,578 |
Reckitt Benckiser PLC | 300 | | 9,062 |
| | 1,622,289 |
Personal Products - 0.6% |
Alberto-Culver Co. | 150 | | 7,286 |
Estee Lauder Companies, Inc. Class A | 63,300 | | 2,897,241 |
Hengan International Group Co. Ltd. | 12,932,600 | | 8,485,521 |
Kose Corp. | 100 | | 4,393 |
Natura Cosmeticos SA | 166,500 | | 4,858,340 |
Shiseido Co. Ltd. ADR | 459,900 | | 6,645,555 |
USANA Health Sciences, Inc. (a) | 200 | | 6,840 |
| | 22,905,176 |
TOTAL CONSUMER STAPLES | | 294,482,979 |
ENERGY - 13.5% |
Energy Equipment & Services - 9.7% |
BJ Services Co. | 648,610 | | 30,186,309 |
Cal Dive International, Inc. (a) | 467,400 | | 19,046,550 |
Carbo Ceramics, Inc. | 100 | | 6,900 |
Compagnie Generale de Geophysique SA (a) | 100 | | 6,884 |
Cooper Cameron Corp. (a) | 317,000 | | 17,057,770 |
Core Laboratories NV (a) | 230,700 | | 5,386,845 |
FMC Technologies, Inc. (a) | 307,500 | | 9,901,500 |
Global Industries Ltd. (a) | 1,530,489 | | 12,687,754 |
GlobalSantaFe Corp. | 692,450 | | 22,927,020 |
Gulf Island Fabrication, Inc. | 211,200 | | 4,610,496 |
Helmerich & Payne, Inc. | 195,600 | | 6,658,224 |
Hydril Co. (a) | 100 | | 4,551 |
Input/Output, Inc. (a) | 1,327,000 | | 11,730,680 |
Nabors Industries Ltd. (a) | 688,800 | | 35,328,552 |
|
| Shares | | Value (Note 1) |
National-Oilwell, Inc. (a) | 235,300 | | $ 8,303,737 |
Noble Corp. (a) | 345,300 | | 17,175,222 |
NS Group, Inc. (a) | 100 | | 2,780 |
Oceaneering International, Inc. (a) | 360,086 | | 13,438,410 |
Parker Drilling Co. (a) | 1,996,800 | | 7,847,424 |
Pason Systems, Inc. | 756,300 | | 23,319,250 |
Patterson-UTI Energy, Inc. | 204,300 | | 3,973,635 |
Pioneer Drilling Co. (a) | 1,190,100 | | 12,008,109 |
Precision Drilling Corp. (a) | 153,300 | | 9,647,680 |
Pride International, Inc. (a) | 565,700 | | 11,619,478 |
Rowan Companies, Inc. (a) | 345,600 | | 8,951,040 |
Smith International, Inc. (a) | 251,090 | | 13,661,807 |
Superior Energy Services, Inc. (a) | 316,900 | | 4,883,429 |
Transocean, Inc. (a) | 524,800 | | 22,246,272 |
Unit Corp. (a) | 356,000 | | 13,602,760 |
Varco International, Inc. (a) | 1,153,848 | | 33,634,655 |
Veritas DGC, Inc. (a) | 100 | | 2,241 |
Weatherford International Ltd. (a) | 139,800 | | 7,171,740 |
| | 387,029,704 |
Oil & Gas - 3.8% |
Ashland, Inc. | 25,900 | | 1,512,042 |
Caltex Australia Ltd. | 1,004,943 | | 8,538,864 |
China Petroleum & Chemical Corp. sponsored ADR | 100 | | 4,099 |
Comstock Resources, Inc. (a) | 93,100 | | 2,052,855 |
Golar LNG Ltd. (a) | 515,700 | | 7,501,323 |
Golar LNG Ltd. (Nasdaq) (a) | 21,393 | | 318,542 |
JKX Oil & Gas | 91 | | 202 |
Niko Resources Ltd. | 138,000 | | 5,804,050 |
PetroChina Co. Ltd. sponsored ADR | 100 | | 5,369 |
PetroKazakhstan, Inc. Class A | 594,600 | | 22,064,615 |
Petroleo Brasileiro SA Petrobras sponsored: | | | |
ADR | 100 | | 3,978 |
ADR (non-vtg.) | 100 | | 3,621 |
Premcor, Inc. | 293,300 | | 12,368,461 |
Southwestern Energy Co. (a) | 780,200 | | 39,548,338 |
Surgutneftegaz JSC sponsored ADR | 100 | | 3,740 |
Talisman Energy, Inc. | 194,500 | | 5,243,396 |
Tesoro Petroleum Corp. (a) | 465,900 | | 14,843,574 |
Valero Energy Corp. | 718,500 | | 32,619,900 |
World Fuel Services Corp. | 31,500 | | 1,568,700 |
XTO Energy, Inc. | 125 | | 4,423 |
| | 154,010,092 |
TOTAL ENERGY | | 541,039,796 |
FINANCIALS - 8.3% |
Capital Markets - 0.5% |
BlackRock, Inc. Class A | 100 | | 7,726 |
Deutsche Bank AG (NY Shares) | 13,000 | | 1,157,130 |
E*TRADE Financial Corp. (a) | 100 | | 1,495 |
Eaton Vance Corp. (non-vtg.) | 100 | | 5,215 |
Common Stocks - continued |
| Shares | | Value (Note 1) |
FINANCIALS - continued |
Capital Markets - continued |
Federated Investors, Inc. Class B (non-vtg.) | 100 | | $ 3,040 |
International Assets Holding Corp. (a) | 100 | | 757 |
Investors Financial Services Corp. | 49,700 | | 2,484,006 |
Kotak Mahindra Bank Ltd. | 439,734 | | 2,912,920 |
Matsui Securities Co. Ltd. | 208,800 | | 7,277,321 |
Mitsubishi Securities Co. Ltd. | 511,700 | | 5,605,071 |
Nuveen Investments, Inc. Class A | 100 | | 3,947 |
T. Rowe Price Group, Inc. | 200 | | 12,440 |
| | 19,471,068 |
Commercial Banks - 3.4% |
Banco Itau Holding Financeira SA: | | | |
(PN) | 900 | | 134,864 |
sponsored ADR (non-vtg.) | 33,900 | | 2,548,263 |
Bank Austria Creditanstalt AG | 201,075 | | 18,139,091 |
Bank of Baroda | 1,220,572 | | 6,874,431 |
Bank of Fukuoka Ltd. (d) | 2,110,000 | | 13,904,618 |
Bank of India | 6,393,456 | | 13,939,951 |
Bank of Yokohama Ltd. | 2,431,000 | | 15,331,700 |
BOK Financial Corp. (a) | 103 | | 5,022 |
Boston Private Financial Holdings, Inc. | 106,100 | | 2,988,837 |
Canara Bank | 401,535 | | 1,973,788 |
Capitalia Spa | 9,229,479 | | 42,205,762 |
Cathay General Bancorp | 20 | | 750 |
Center Financial Corp., California | 20,600 | | 412,412 |
Commerce Bancorp, Inc., New Jersey | 68,400 | | 4,404,960 |
CVB Financial Corp. | 110 | | 2,922 |
East West Bancorp, Inc. | 200 | | 8,392 |
First Horizon National Corp. | 100 | | 4,311 |
Fulton Financial Corp. | 11 | | 256 |
HDFC Bank Ltd. sponsored ADR | 18,100 | | 821,016 |
Hiroshima Bank Ltd. | 389,000 | | 2,058,362 |
ICICI Bank Ltd. sponsored ADR | 5,000 | | 100,750 |
Irwin Financial Corp. | 100 | | 2,839 |
Lakeland Financial Corp. | 100 | | 3,970 |
M&T Bank Corp. | 100 | | 10,784 |
OTP Bank Rt. | 100 | | 3,082 |
Popular, Inc. | 200 | | 5,766 |
PrivateBancorp, Inc. | 200 | | 6,446 |
State Bancorp, Inc., New York | 5 | | 138 |
State Bank of India | 448,533 | | 7,333,644 |
Sumitomo Trust & Banking Co. Ltd. | 1,000 | | 7,234 |
SunTrust Banks, Inc. | 49 | | 3,620 |
TCF Financial Corp. | 200 | | 6,428 |
Texas Regional Bancshares, Inc. Class A | 150 | | 4,902 |
UCBH Holdings, Inc. | 100 | | 4,582 |
UnionBanCal Corp. | 100 | | 6,448 |
Valley National Bancorp | 105 | | 2,903 |
|
| Shares | | Value (Note 1) |
Westcorp | 100 | | $ 4,593 |
Wintrust Financial Corp. | 48,000 | | 2,734,080 |
| | 136,001,917 |
Consumer Finance - 0.0% |
American Express Co. | 100 | | 5,637 |
Capital One Financial Corp. | 100 | | 8,421 |
First Cash Financial Services, Inc. (a) | 150 | | 4,007 |
STB Leasing Co. Ltd. | 100 | | 1,874 |
| | 19,939 |
Diversified Financial Services - 0.4% |
eSpeed, Inc. Class A (a) | 100 | | 1,237 |
Moody's Corp. | 54,100 | | 4,698,585 |
Power Financial Corp. | 100 | | 2,666 |
Principal Financial Group, Inc. | 100 | | 4,094 |
TSX Group, Inc. | 244,800 | | 10,952,760 |
| | 15,659,342 |
Insurance - 2.7% |
ACE Ltd. | 100 | | 4,275 |
AFLAC, Inc. | 2,800 | | 111,552 |
Arthur J. Gallagher & Co. | 100 | | 3,250 |
Assurant, Inc. | 1,232,500 | | 37,652,875 |
Brown & Brown, Inc. | 38,000 | | 1,654,900 |
Erie Indemnity Co. Class A | 100 | | 5,257 |
Genworth Financial, Inc. Class A | 100 | | 2,700 |
Hilb Rogal & Hobbs Co. | 200 | | 7,248 |
Horace Mann Educators Corp. | 100 | | 1,908 |
MBIA, Inc. | 54,600 | | 3,455,088 |
Mercury General Corp. | 28,100 | | 1,683,752 |
Ohio Casualty Corp. (a) | 122,800 | | 2,850,188 |
Old Republic International Corp. | 150 | | 3,795 |
Progressive Corp. | 67,100 | | 5,692,764 |
Reinsurance Group of America, Inc. | 486,100 | | 23,551,545 |
Scottish Re Group Ltd. | 8,100 | | 209,790 |
StanCorp Financial Group, Inc. | 100 | | 8,250 |
Triad Guaranty, Inc. (a) | 100 | | 6,048 |
UnumProvident Corp. | 100 | | 1,794 |
USI Holdings Corp. (a) | 187,500 | | 2,169,375 |
W.R. Berkley Corp. | 618,575 | | 29,178,183 |
Zenith National Insurance Corp. | 300 | | 14,952 |
| | 108,269,489 |
Real Estate - 1.0% |
CBL & Associates Properties, Inc. | 17,300 | | 1,320,855 |
Corporate Office Properties Trust (SBI) | 147,100 | | 4,317,385 |
Equity Lifestyle Properties, Inc. | 100 | | 3,575 |
Equity Residential (SBI) | 100 | | 3,618 |
General Growth Properties, Inc. | 167,100 | | 6,042,336 |
Kimco Realty Corp. | 226,000 | | 13,105,740 |
Pan Pacific Retail Properties, Inc. | 114,400 | | 7,172,880 |
Plum Creek Timber Co., Inc. | 141,300 | | 5,431,572 |
United Dominion Realty Trust, Inc. (SBI) | 29,200 | | 724,160 |
Weingarten Realty Investors (SBI) | 100 | | 4,010 |
| | 38,126,131 |
Common Stocks - continued |
| Shares | | Value (Note 1) |
FINANCIALS - continued |
Thrifts & Mortgage Finance - 0.3% |
Doral Financial Corp. | 147,800 | | $ 7,279,150 |
Golden West Financial Corp., Delaware | 79,940 | | 4,909,915 |
MGIC Investment Corp. | 100 | | 6,891 |
Radian Group, Inc. | 100 | | 5,324 |
Sterling Financial Corp., Washington (a) | 110 | | 4,319 |
W Holding Co., Inc. | 156 | | 3,579 |
Washington Federal, Inc. | 110 | | 2,919 |
| | 12,212,097 |
TOTAL FINANCIALS | | 329,759,983 |
HEALTH CARE - 15.9% |
Biotechnology - 6.5% |
Affymetrix, Inc. (a) | 190,600 | | 6,966,430 |
Albany Molecular Research, Inc. (a) | 100 | | 1,114 |
Alnylam Pharmaceuticals, Inc. | 100 | | 738 |
Applera Corp. - Celera Genomics Group (a) | 100 | | 1,375 |
Bachem Holding AG (B Shares) | 100 | | 5,744 |
Celgene Corp. (a) | 200 | | 5,306 |
Charles River Laboratories International, Inc. (a) | 1,389,204 | | 63,917,276 |
Ciphergen Biosystems, Inc. (a) | 100 | | 430 |
CSL Ltd. | 19,483 | | 445,872 |
CytRx Corp. (a) | 100 | | 141 |
deCODE genetics, Inc. (a) | 100 | | 781 |
Dendreon Corp. (a) | 100 | | 1,078 |
Digene Corp. (a) | 100 | | 2,615 |
Exact Sciences Corp. (a) | 100 | | 382 |
Exelixis, Inc. (a) | 100 | | 950 |
Gen-Probe, Inc. (a) | 31,900 | | 1,442,199 |
Genencor International, Inc. (a) | 100 | | 1,640 |
Genentech, Inc. (a) | 24,800 | | 1,350,112 |
Global Bio-Chem Technology Group Co. Ltd. | 9,232,000 | | 6,057,431 |
Harvard Bioscience, Inc. (a)(e) | 3,023,047 | | 13,996,708 |
ImmunoGen, Inc. (a) | 139,700 | | 1,234,948 |
Invitrogen Corp. (a) | 1,435,200 | | 96,344,976 |
Lexicon Genetics, Inc. (a) | 100 | | 776 |
Luminex Corp. (a) | 100 | | 888 |
Martek Biosciences (a) | 106,100 | | 5,432,320 |
Myriad Genetics, Inc. (a) | 100 | | 2,251 |
Neogen Corp. (a) | 49,663 | | 1,124,873 |
Northfield Laboratories, Inc. (a) | 100 | | 2,255 |
ONYX Pharmaceuticals, Inc. (a) | 100 | | 3,239 |
QIAGEN NV (a) | 4,857,800 | | 53,192,910 |
Renovis, Inc. | 100 | | 1,438 |
Sangamo Biosciences, Inc. (a) | 100 | | 600 |
Seattle Genetics, Inc. (a) | 100 | | 653 |
Serologicals Corp. (a) | 100 | | 2,212 |
Sirna Therapeutics, Inc. (a) | 100 | | 316 |
|
| Shares | | Value (Note 1) |
Stratagene Corp. (a) | 849,600 | | $ 6,584,400 |
Strategic Diagnostics, Inc. (a) | 792,300 | | 2,773,050 |
Tanox, Inc. (a) | 100 | | 1,520 |
Telik, Inc. (a) | 100 | | 1,914 |
| | 260,903,861 |
Health Care Equipment & Supplies - 2.3% |
Advanced Medical Optics, Inc. (a) | 100 | | 4,114 |
Arthrocare Corp. (a) | 100 | | 3,206 |
Bio-Rad Laboratories, Inc. Class A (a) | 100 | | 5,737 |
BioLase Technology, Inc. | 100 | | 1,087 |
Bruker BioSciences Corp. (a) | 163 | | 657 |
Cardiodynamics International Corp. (a) | 100 | | 517 |
Chromavision Medical Systems, Inc. (a) | 100 | | 216 |
Cooper Companies, Inc. | 100 | | 7,059 |
Cyberonics, Inc. (a) | 200 | | 4,144 |
Cytyc Corp. (a) | 100 | | 2,757 |
Diagnostic Products Corp. | 100 | | 5,505 |
Edwards Lifesciences Corp. (a) | 307,700 | | 12,695,702 |
Epix Pharmaceuticals, Inc. (a) | 122,400 | | 2,192,184 |
IDEXX Laboratories, Inc. (a) | 100 | | 5,459 |
Illumina, Inc. (a) | 356,400 | | 3,378,672 |
INAMED Corp. (a) | 150 | | 9,488 |
Integra LifeSciences Holdings Corp. (a) | 64,700 | | 2,389,371 |
Intuitive Surgical, Inc. (a) | 47,800 | | 1,912,956 |
Kinetic Concepts, Inc. | 20,300 | | 1,548,890 |
Matthews International Corp. Class A | 100 | | 3,680 |
Meridian Bioscience, Inc. | 135,350 | | 2,353,737 |
Merit Medical Systems, Inc. (a) | 133 | | 2,037 |
Millipore Corp. (a) | 255,900 | | 12,746,379 |
Mine Safety Appliances Co. | 300 | | 15,210 |
Molecular Devices Corp. (a) | 74,580 | | 1,499,058 |
Ocular Sciences, Inc. (a) | 46,300 | | 2,269,163 |
Orthologic Corp. (a) | 100,600 | | 628,750 |
Osteotech, Inc. (a) | 100 | | 550 |
PolyMedica Corp. | 200 | | 7,458 |
Possis Medical, Inc. (a) | 100 | | 1,348 |
Sonic Innovations, Inc. (a) | 151,300 | | 630,921 |
SonoSight, Inc. (a) | 100 | | 3,395 |
Synovis Life Technologies, Inc. (a) | 100 | | 1,081 |
Synthes, Inc. | 100 | | 11,190 |
Thermo Electron Corp. (a) | 265,200 | | 8,006,388 |
Thoratec Corp. (a) | 100 | | 1,042 |
Varian, Inc. (a) | 100 | | 4,101 |
Ventana Medical Systems, Inc. (a) | 19,200 | | 1,228,608 |
Waters Corp. (a) | 851,120 | | 39,823,905 |
Wilson Greatbatch Technologies, Inc. (a) | 800 | | 17,936 |
Young Innovations, Inc. | 100 | | 3,373 |
Zimmer Holdings, Inc. (a) | 100 | | 8,012 |
Zoll Medical Corp. (a) | 100 | | 3,440 |
| | 93,438,483 |
Health Care Providers & Services - 5.6% |
Advisory Board Co. (a) | 100 | | 3,688 |
Aetna, Inc. | 216,200 | | 26,970,950 |
Common Stocks - continued |
| Shares | | Value (Note 1) |
HEALTH CARE - continued |
Health Care Providers & Services - continued |
AMERIGROUP Corp. (a) | 100 | | $ 7,566 |
Andrx Corp. (a) | 100 | | 2,183 |
Caremark Rx, Inc. (a) | 1,133,806 | | 44,705,971 |
Centene Corp. (a) | 100 | | 2,835 |
Cerner Corp. (a)(d) | 67,717 | | 3,600,513 |
Community Health Systems, Inc. (a) | 275,200 | | 7,672,576 |
Covance, Inc. (a) | 631,900 | | 24,486,125 |
Coventry Health Care, Inc. (a) | 50 | | 2,654 |
Dynacq Healthcare, Inc. (a)(d) | 100 | | 480 |
Eclipsys Corp. (a) | 100 | | 2,043 |
Evotec OAI AG (a) | 100 | | 357 |
Gambro AB (A Shares) | 100 | | 1,426 |
Health Management Associates, Inc. Class A | 100 | | 2,272 |
HealthExtras, Inc. (a) | 203,200 | | 3,312,160 |
Humana, Inc. (a) | 255,300 | | 7,579,857 |
ICON PLC sponsored ADR (a) | 335,326 | | 12,960,350 |
IDX Systems Corp. (a) | 100 | | 3,446 |
IMS Health, Inc. | 1,303,600 | | 30,256,556 |
iSoft Group PLC | 35 | | 232 |
Lifeline Systems, Inc. (a) | 155,900 | | 4,015,984 |
Merge Technologies, Inc. (a) | 100 | | 2,225 |
Molina Healthcare, Inc. (a) | 150,857 | | 6,996,748 |
NDCHealth Corp. | 100 | | 1,859 |
OCA, Inc. (a) | 100 | | 635 |
Odyssey Healthcare, Inc. (a) | 200 | | 2,736 |
Omnicare, Inc. | 138,650 | | 4,800,063 |
PAREXEL International Corp. (a) | 411,300 | | 8,349,390 |
Pediatrix Medical Group, Inc. (a) | 100 | | 6,405 |
Pharmaceutical Product Development, Inc. (a) | 438,700 | | 18,113,923 |
ProxyMed, Inc. (a) | 181,142 | | 1,778,814 |
Quest Diagnostics, Inc. | 200 | | 19,110 |
Renal Care Group, Inc. (a) | 150 | | 5,399 |
ResCare, Inc. (a) | 1,188,803 | | 18,093,582 |
TriZetto Group, Inc. (a) | 100 | | 950 |
VCA Antech, Inc. (a) | 80,900 | | 1,585,640 |
WebMD Corp. (a) | 100 | | 816 |
WellPoint, Inc. (a) | 200 | | 23,000 |
| | 225,371,519 |
Pharmaceuticals - 1.5% |
Able Laboratories, Inc. (a) | 100 | | 2,275 |
Allergan, Inc. | 100 | | 8,107 |
American Pharmaceutical Partners, Inc. (a) | 150 | | 5,612 |
Bentley Pharmaceuticals, Inc. (a) | 9,200 | | 98,900 |
Caraco Pharmaceutical Laboratories Ltd. (a) | 100 | | 955 |
Cipla Ltd. | 50,500 | | 371,073 |
Connetics Corp. (a) | 416,700 | | 10,121,643 |
Dr. Reddy's Laboratories Ltd. ADR | 186,900 | | 3,706,227 |
|
| Shares | | Value (Note 1) |
Endo Pharmaceuticals Holdings, Inc. (a) | 200 | | $ 4,204 |
Hi-Tech Pharmacal Co., Inc. (a) | 100 | | 1,844 |
Impax Laboratories, Inc. (a) | 100 | | 1,588 |
KV Pharmaceutical Co. Class A (a) | 150 | | 3,308 |
Merck KGaA | 293,321 | | 20,141,931 |
Nektar Therapeutics (a) | 100 | | 2,024 |
Ranbaxy Laboratories Ltd. sponsored GDR | 270,300 | | 7,868,433 |
Roche Holding AG: | | | |
ADR (a) | 10,600 | | 1,217,728 |
(participation certificate) | 60,543 | | 6,917,986 |
Salix Pharmaceuticals Ltd. (a) | 150 | | 2,639 |
Schering-Plough Corp. | 344,000 | | 7,182,720 |
SuperGen, Inc. (a) | 100 | | 705 |
Warner Chilcott PLC ADR | 100 | | 6,531 |
| | 57,666,433 |
TOTAL HEALTH CARE | | 637,380,296 |
INDUSTRIALS - 11.2% |
Aerospace & Defense - 1.3% |
Ceradyne, Inc. (a) | 150 | | 8,582 |
Cubic Corp. | 100 | | 2,517 |
DRS Technologies, Inc. (a) | 230,000 | | 9,823,300 |
EDO Corp. | 180,400 | | 5,727,700 |
Embraer - Empresa Brasileira de Aeronautica SA sponsored ADR | 100 | | 3,344 |
General Dynamics Corp. | 100 | | 10,460 |
L-3 Communications Holdings, Inc. | 478,800 | | 35,067,312 |
Rockwell Collins, Inc. | 100 | | 3,944 |
| | 50,647,159 |
Air Freight & Logistics - 0.4% |
Business Post Group PLC | 100 | | 1,195 |
C.H. Robinson Worldwide, Inc. | 44,950 | | 2,495,624 |
CNF, Inc. | 100 | | 5,010 |
Dynamex, Inc. (a) | 80 | | 1,482 |
Expeditors International of Washington, Inc. | 33,700 | | 1,883,156 |
Forward Air Corp. (a) | 100 | | 4,470 |
Hub Group, Inc. Class A (a) | 193,420 | | 10,100,392 |
| | 14,491,329 |
Airlines - 0.0% |
Southwest Airlines Co. | 100 | | 1,628 |
Building Products - 0.2% |
American Woodmark Corp. | 200 | | 8,736 |
Quixote Corp. | 100 | | 2,033 |
Simpson Manufacturing Co. Ltd. | 78,800 | | 2,750,120 |
Trex Co., Inc. (a) | 69,800 | | 3,660,312 |
Wienerberger AG | 100 | | 4,768 |
| | 6,425,969 |
Commercial Services & Supplies - 2.8% |
Apollo Group, Inc. Class A (a) | 311 | | 25,101 |
Benesse Corp. | 100 | | 3,505 |
Common Stocks - continued |
| Shares | | Value (Note 1) |
INDUSTRIALS - continued |
Commercial Services & Supplies - continued |
Bennett Environmental, Inc. (a) | 167,100 | | $ 593,205 |
Bright Horizons Family Solutions, Inc. (a) | 613,097 | | 39,704,162 |
Bunzl PLC | 101 | | 842 |
Career Education Corp. (a) | 100 | | 4,000 |
ChoicePoint, Inc. (a) | 350,500 | | 16,119,495 |
Coinstar, Inc. (a) | 100 | | 2,683 |
Concorde Career Colleges, Inc. (a) | 100 | | 2,030 |
Corporate Executive Board Co. | 100 | | 6,694 |
CoStar Group, Inc. (a) | 100 | | 4,618 |
Dun & Bradstreet Corp. (a) | 100 | | 5,965 |
Education Management Corp. (a) | 47,300 | | 1,561,373 |
Fullcast Co. Ltd. (d) | 5,184 | | 14,828,781 |
Gevity HR, Inc. | 100 | | 2,056 |
GFK AG | 20 | | 777 |
Intertek Group PLC | 100 | | 1,353 |
Ionics, Inc. (a)(d) | 666,900 | | 28,903,446 |
ITE Group PLC | 100 | | 166 |
ITT Educational Services, Inc. (a) | 100 | | 4,755 |
Labor Ready, Inc. (a) | 100 | | 1,692 |
National Research Corp. (a) | 100 | | 1,615 |
PICO Holdings, Inc. (a) | 100 | | 2,077 |
Princeton Review, Inc. (a) | 609,587 | | 3,748,960 |
Ritchie Brothers Auctioneers, Inc. | 200 | | 6,612 |
Robert Half International, Inc. | 100 | | 2,943 |
Societe Generale de Surveillance Holding SA (SGS) (Reg.) | 91 | | 63,611 |
Stericycle, Inc. (a) | 100 | | 4,595 |
Tele Atlas NV (a) | 100 | | 1,205 |
Tetra Tech, Inc. (a) | 74 | | 1,239 |
The Brink's Co. | 54,600 | | 2,157,792 |
Universal Technical Institute, Inc. | 85,900 | | 3,274,508 |
| | 111,041,856 |
Construction & Engineering - 1.6% |
Arcadis NV | 9,700 | | 180,272 |
Arcadis NV | 6,600 | | 121,559 |
Chicago Bridge & Iron Co. NV (NY Shares) | 302,800 | | 12,112,000 |
Dycom Industries, Inc. (a) | 591,900 | | 18,064,788 |
EMCOR Group, Inc. (a) | 100 | | 4,518 |
Fluor Corp. | 301,500 | | 16,434,765 |
Foster Wheeler Ltd. (a) | 294,331 | | 4,671,033 |
Jacobs Engineering Group, Inc. (a) | 288,800 | | 13,801,752 |
| | 65,390,687 |
Electrical Equipment - 0.5% |
AstroPower, Inc. (a) | 100 | | 1 |
Baldor Electric Co. | 80,900 | | 2,227,177 |
BYD Co. Ltd. (H Shares) | 174,500 | | 462,472 |
Crompton Greaves Ltd. | 144,396 | | 995,414 |
Fujikura Ltd. | 1,000 | | 4,608 |
II-VI, Inc. (a) | 100 | | 4,249 |
|
| Shares | | Value (Note 1) |
Rockwell Automation, Inc. | 306,900 | | $ 15,206,895 |
Roper Industries, Inc. | 38,700 | | 2,351,799 |
| | 21,252,615 |
Industrial Conglomerates - 0.1% |
Teleflex, Inc. | 77,700 | | 4,035,738 |
Machinery - 3.6% |
AGCO Corp. (a) | 2,106,400 | | 46,109,096 |
CNH Global NV | 512,000 | | 9,917,440 |
CUNO, Inc. (a) | 117,600 | | 6,985,440 |
Donaldson Co., Inc. | 200 | | 6,516 |
Dover Corp. | 14,600 | | 612,324 |
Flowserve Corp. (a) | 962,700 | | 26,512,758 |
Gardner Denver, Inc. (a) | 64,400 | | 2,337,076 |
Graco, Inc. | 668,700 | | 24,975,945 |
Harsco Corp. | 177,200 | | 9,877,128 |
Heidelberger Druckmaschinen AG (a) | 124,900 | | 4,235,827 |
Illinois Tool Works, Inc. | 100 | | 9,268 |
Koyo Seiko Co. Ltd. | 1,000 | | 14,078 |
Middleby Corp. | 100 | | 5,072 |
PACCAR, Inc. | 150 | | 12,072 |
Toshiba Machine Co. Ltd. | 1,000 | | 4,383 |
Trinity Industries, Inc. | 4,900 | | 166,992 |
Wabash National Corp. (a) | 100 | | 2,693 |
Wabtec Corp. | 198,700 | | 4,236,284 |
Watts Water Technologies, Inc. Class A | 105,800 | | 3,410,992 |
Zenon Environmental, Inc. (a) | 345,300 | | 6,747,738 |
| | 146,179,122 |
Marine - 0.1% |
Alexander & Baldwin, Inc. | 90,349 | | 3,832,605 |
Road & Rail - 0.4% |
Burlington Northern Santa Fe Corp. | 207,700 | | 9,826,287 |
Guangshen Railway Co. Ltd. sponsored ADR | 100 | | 2,047 |
Heartland Express, Inc. | 150 | | 3,371 |
Knight Transportation, Inc. | 150 | | 3,720 |
Landstar System, Inc. (a) | 22,100 | | 1,627,444 |
Norfolk Southern Corp. | 124,900 | | 4,520,131 |
Old Dominion Freight Lines, Inc. (a) | 150 | | 5,220 |
| | 15,988,220 |
Trading Companies & Distributors - 0.2% |
Fastenal Co. | 200 | | 12,312 |
MSC Industrial Direct Co., Inc. Class A | 267,300 | | 9,617,454 |
Richelieu Hardware Ltd. | 100 | | 1,831 |
| | 9,631,597 |
Transportation Infrastructure - 0.0% |
Sea Containers Ltd. Class B | 7,900 | | 153,260 |
TOTAL INDUSTRIALS | | 449,071,785 |
INFORMATION TECHNOLOGY - 9.1% |
Communications Equipment - 0.8% |
Arris Group, Inc. (a) | 100 | | 704 |
Common Stocks - continued |
| Shares | | Value (Note 1) |
INFORMATION TECHNOLOGY - continued |
Communications Equipment - continued |
Avaya, Inc. (a) | 2,900 | | $ 49,880 |
Black Box Corp. | 100 | | 4,802 |
Comtech Telecommunications Corp. (a) | 100 | | 3,761 |
NETGEAR, Inc. (a)(d) | 548,100 | | 9,969,939 |
Option NV (a) | 90 | | 3,229 |
Plantronics, Inc. | 139,900 | | 5,801,653 |
Polycom, Inc. (a) | 200 | | 4,664 |
Research In Motion Ltd. (a) | 53,200 | | 4,379,247 |
SafeNet, Inc. (a) | 86,601 | | 3,181,721 |
Tandberg ASA | 681,000 | | 8,446,555 |
| | 31,846,155 |
Computers & Peripherals - 0.0% |
Applied Films Corp. (a) | 100 | | 2,156 |
Compal Electronics, Inc. | 1,072 | | 1,069 |
Gemplus International SA ADR (a) | 100 | | 466 |
iCAD, Inc. (a) | 100 | | 447 |
Intergraph Corp. (a) | 100 | | 2,693 |
M-Systems Flash Disk Pioneers Ltd. (a) | 900 | | 17,748 |
Moser-Baer India Ltd. | 200 | | 1,083 |
Network Appliance, Inc. (a) | 100 | | 3,322 |
Overland Storage, Inc. (a) | 100 | | 1,669 |
Psion PLC | 100 | | 103 |
Stratasys, Inc. (a) | 150 | | 5,034 |
Synaptics, Inc. (a) | 100 | | 3,058 |
| | 38,848 |
Electronic Equipment & Instruments - 3.2% |
Brightpoint, Inc. (a) | 150 | | 2,931 |
CDW Corp. | 173,492 | | 11,511,194 |
CellStar Corp. (a) | 100 | | 445 |
Cogent, Inc. | 200 | | 6,600 |
Cognex Corp. | 100 | | 2,790 |
Dionex Corp. (a) | 108,200 | | 6,131,694 |
Elec & Eltek International Co. Ltd. | 1,613,000 | | 4,580,920 |
Excel Technology, Inc. (a) | 100 | | 2,600 |
Fargo Electronics, Inc. (a) | 100 | | 1,499 |
FLIR Systems, Inc. (a) | 89,245 | | 5,692,939 |
Global Imaging Systems, Inc. (a) | 100 | | 3,950 |
Hon Hai Precision Industries Co. Ltd. | 8,750,800 | | 40,464,536 |
I. D. Systems Inc. (a) | 100 | | 1,866 |
Iteris, Inc. (a) | 100 | | 345 |
Itron, Inc. (a) | 100 | | 2,391 |
Keyence Corp. | 19,700 | | 4,415,816 |
Landauer, Inc. | 100 | | 4,570 |
Measurement Specialties, Inc. (a) | 100 | | 2,546 |
Metrologic Instruments, Inc. (a) | 200 | | 4,250 |
Mettler-Toledo International, Inc. (a) | 259,800 | | 13,330,338 |
MTS Systems Corp. | 100 | | 3,381 |
National Instruments Corp. | 100 | | 2,725 |
Robotic Vision Systems, Inc. (a) | 100 | | 77 |
|
| Shares | | Value (Note 1) |
ScanSource, Inc. (a) | 100 | | $ 6,216 |
Symbol Technologies, Inc. | 2,551,600 | | 44,142,680 |
Universal Display Corp. (a) | 100 | | 900 |
Yageo Corp. sponsored GDR (a) | 100 | | 170 |
| | 130,320,369 |
Internet Software & Services - 1.0% |
Akamai Technologies, Inc. (a) | 100 | | 1,303 |
aQuantive, Inc. (a) | 218,811 | | 1,956,170 |
Ask Jeeves, Inc. (a) | 100 | | 2,675 |
Bankrate, Inc. (a) | 100 | | 1,385 |
Blue Coat Systems, Inc. (a) | 100 | | 1,861 |
Digital Impact, Inc. (a) | 100 | | 142 |
Digital River, Inc. (a) | 101,802 | | 4,235,981 |
DoubleClick, Inc. (a) | 100 | | 778 |
EarthLink, Inc. (a) | 100 | | 1,152 |
FindWhat.com (a) | 100 | | 1,773 |
Homestore, Inc. (a) | 100 | | 303 |
InfoSpace, Inc. (a) | 100 | | 4,755 |
iPass, Inc. (a) | 100 | | 740 |
iVillage, Inc. (a) | 100 | | 618 |
LookSmart Ltd. (a) | 100 | | 219 |
Neoforma, Inc. (a) | 100 | | 769 |
Net2Phone, Inc. (a) | 100 | | 340 |
Netease.com, Inc. sponsored ADR (a) | 100 | | 5,283 |
NIC, Inc. (a) | 10 | | 51 |
Open Text Corp. (a) | 100 | | 2,008 |
RealNetworks, Inc. (a) | 1,440,109 | | 9,533,522 |
Sina Corp. (a) | 100 | | 3,206 |
Sohu.com, Inc. (a)(d) | 39,000 | | 690,690 |
SonicWALL, Inc. (a) | 100 | | 632 |
ValueClick, Inc. (a) | 100 | | 1,333 |
VeriSign, Inc. (a) | 686,300 | | 23,004,776 |
WebEx Communications, Inc. (a) | 100 | | 2,378 |
Websense, Inc. (a) | 27,400 | | 1,389,728 |
| | 40,844,571 |
IT Services - 1.1% |
Affiliated Computer Services, Inc. Class A (a) | 623,900 | | 37,552,541 |
Alliance Data Systems Corp. (a) | 100 | | 4,748 |
Anteon International Corp. (a) | 100 | | 4,186 |
DST Systems, Inc. (a) | 600 | | 31,272 |
Global Payments, Inc. | 100 | | 5,854 |
Hewitt Associates, Inc. Class A (a) | 100 | | 3,201 |
iGate Corp. (a) | 100 | | 405 |
Infocrossing, Inc. (a) | 100 | | 1,693 |
Infosys Technologies Ltd. sponsored ADR | 200 | | 13,862 |
infoUSA, Inc. (a) | 100 | | 1,119 |
Lionbridge Technologies, Inc. (a) | 874,300 | | 5,875,296 |
Maximus, Inc. (a) | 100 | | 3,112 |
Satyam Computer Services Ltd. | 100 | | 949 |
StarTek, Inc. | 100 | | 2,845 |
SunGard Data Systems, Inc. (a) | 200 | | 5,666 |
Syntel, Inc. | 100 | | 1,754 |
Common Stocks - continued |
| Shares | | Value (Note 1) |
INFORMATION TECHNOLOGY - continued |
IT Services - continued |
The BISYS Group, Inc. (a) | 100 | | $ 1,645 |
TietoEnator Oyj | 100 | | 3,174 |
Total System Services, Inc. | 100 | | 2,430 |
Tyler Technologies, Inc. (a) | 100 | | 836 |
| | 43,516,588 |
Office Electronics - 0.3% |
Neopost SA | 2,200 | | 170,708 |
Zebra Technologies Corp. Class A (a) | 218,125 | | 12,276,075 |
| | 12,446,783 |
Semiconductors & Semiconductor Equipment - 1.3% |
Agere Systems, Inc. Class A (a) | 100 | | 137 |
Analog Devices, Inc. | 49,700 | | 1,834,924 |
ARM Holdings PLC sponsored ADR | 100 | | 617 |
ASM Pacific Technology Ltd. | 500 | | 1,801 |
Cabot Microelectronics Corp. (a) | 289,900 | | 11,610,495 |
Cree, Inc. (a) | 46,100 | | 1,847,688 |
Hi/fn, Inc. (a) | 8 | | 74 |
International Rectifier Corp. (a) | 15,700 | | 699,749 |
KLA-Tencor Corp. (a) | 31,500 | | 1,467,270 |
Linear Technology Corp. | 100 | | 3,876 |
Marvell Technology Group Ltd. (a) | 200 | | 7,094 |
NVIDIA Corp. (a) | 917,300 | | 21,611,588 |
Omnivision Technologies, Inc. (a) | 400 | | 7,340 |
Pixelworks, Inc. (a) | 100 | | 1,134 |
PLX Technology, Inc. (a) | 100 | | 1,040 |
Silicon Image, Inc. (a) | 100 | | 1,646 |
Skyworks Solutions, Inc. (a) | 389,700 | | 3,674,871 |
Varian Semiconductor Equipment Associates, Inc. (a) | 206,900 | | 7,624,265 |
Zoran Corp. (a) | 100 | | 1,158 |
| | 50,396,767 |
Software - 1.4% |
Adobe Systems, Inc. | 75,300 | | 4,724,322 |
Altiris, Inc. (a) | 100 | | 3,543 |
Bottomline Technologies, Inc. (a) | 11 | | 159 |
Cadence Design Systems, Inc. (a) | 100 | | 1,381 |
CCC Information Services Group, Inc. (a) | 100 | | 2,221 |
Citrix Systems, Inc. (a) | 100 | | 2,453 |
DATATRAK International, Inc. (a) | 100 | | 1,113 |
Digimarc Corp. (a) | 100 | | 932 |
Electronic Arts, Inc. (a) | 100 | | 6,168 |
FactSet Research Systems, Inc. | 100 | | 5,844 |
FileNET Corp. (a) | 100 | | 2,576 |
Hyperion Solutions Corp. (a) | 100 | | 4,662 |
Informatica Corp. (a) | 100 | | 812 |
Intuit, Inc. (a) | 132,800 | | 5,844,528 |
JAMDAT Mobile, Inc. | 100 | | 2,065 |
Macromedia, Inc. (a) | 100 | | 3,112 |
Macrovision Corp. (a) | 389,944 | | 10,029,360 |
Manhattan Associates, Inc. (a) | 100 | | 2,388 |
|
| Shares | | Value (Note 1) |
MRO Software, Inc. (a) | 100 | | $ 1,302 |
Napster, Inc. (a) | 100 | | 940 |
NAVTEQ Corp. | 100 | | 4,636 |
NDS Group PLC sponsored ADR (a) | 100 | | 3,408 |
Open Solutions, Inc. (a) | 437,209 | | 11,349,946 |
Plato Learning, Inc. (a) | 100 | | 745 |
Quality Systems, Inc. (a) | 100 | | 5,980 |
Renaissance Learning, Inc. | 70 | | 1,299 |
RSA Security, Inc. (a) | 100,687 | | 2,019,781 |
Salesforce.com, Inc. | 60,000 | | 1,016,400 |
ScanSoft, Inc. (a) | 100 | | 419 |
SERENA Software, Inc. (a) | 100 | | 2,164 |
Symantec Corp. (a) | 100 | | 2,576 |
Synopsys, Inc. (a) | 325,800 | | 6,392,196 |
TALX Corp. | 83,200 | | 2,145,728 |
Temenos Group AG (a) | 100 | | 922 |
THQ, Inc. (a) | 313,900 | | 7,200,866 |
TIBCO Software, Inc. (a) | 100 | | 1,334 |
Vastera, Inc. (a) | 667,400 | | 1,755,262 |
Visual Networks, Inc. (a) | 767,308 | | 2,670,232 |
WatchGuard Technologies, Inc. (a) | 10 | | 44 |
| | 55,213,819 |
TOTAL INFORMATION TECHNOLOGY | | 364,623,900 |
MATERIALS - 18.4% |
Chemicals - 1.9% |
American Vanguard Corp. | 150 | | 5,517 |
Asian Paints India Ltd. | 45,800 | | 338,920 |
Balchem Corp. | 100 | | 3,469 |
Cambrex Corp. | 100 | | 2,710 |
Ecolab, Inc. (d) | 509,300 | | 17,891,709 |
Headwaters, Inc. (a) | 100 | | 2,850 |
K&S AG | 59,500 | | 3,155,946 |
Lonza Group AG | 10 | | 562 |
Minerals Technologies, Inc. | 34,200 | | 2,281,140 |
Monsanto Co. | 178,300 | | 9,904,565 |
Mosaic Co. (a) | 117,900 | | 1,924,128 |
Nitto Denko Corp. | 181,200 | | 9,941,853 |
NOVA Chemicals Corp. | 251,500 | | 11,883,375 |
Novozymes AS Series B | 100 | | 5,071 |
Olin Corp. | 104,900 | | 2,309,898 |
Potash Corp. of Saskatchewan | 100 | | 8,313 |
Praxair, Inc. | 47,000 | | 2,075,050 |
Quaker Chemical Corp. | 100 | | 2,484 |
Sasa Dupont Sabanci Polyester Sanayi AS (a) | 1,000 | | 1 |
Sinopec Beijing Yanhua Petrochemical Co. Ltd. sponsored ADR | 100 | | 2,337 |
Sinopec Shanghai Petrochemical Co. Ltd.: | | | |
(H Shares) | 2,000 | | 746 |
Common Stocks - continued |
| Shares | | Value (Note 1) |
MATERIALS - continued |
Chemicals - continued |
Sinopec Shanghai Petrochemical Co. Ltd.: - continued | | | |
sponsored ADR (d) | 125,400 | | $ 4,677,420 |
Tosoh Corp. | 1,859,500 | | 8,368,930 |
| | 74,786,994 |
Construction Materials - 0.0% |
Cemex SA de CV sponsored ADR | 104 | | 3,788 |
Florida Rock Industries, Inc. | 150 | | 8,930 |
Vulcan Materials Co. | 13,000 | | 709,930 |
| | 722,648 |
Containers & Packaging - 0.4% |
Essel Propack Ltd. | 13,700 | | 84,069 |
Packaging Corp. of America | 565,300 | | 13,312,815 |
Silgan Holdings, Inc. | 40,500 | | 2,468,880 |
| | 15,865,764 |
Metals & Mining - 15.8% |
Agnico-Eagle Mines Ltd. | 1,180,230 | | 16,247,833 |
Agnico-Eagle Mines Ltd. warrants 11/14/07 (a) | 23,350 | | 64,446 |
Aleris International, Inc. (a) | 100 | | 1,692 |
Arch Coal, Inc. | 365,400 | | 12,986,316 |
Barrick Gold Corp. | 100 | | 2,417 |
BHP Billiton Ltd. sponsored ADR | 15,500 | | 372,310 |
BlueScope Steel Ltd. | 1,037,200 | | 6,694,919 |
Brush Engineered Materials, Inc. (a) | 100 | | 1,850 |
Compania de Minas Buenaventura SA sponsored ADR | 1,105,300 | | 25,311,370 |
CONSOL Energy, Inc. | 763,900 | | 31,358,095 |
Dofasco, Inc. | 100 | | 3,783 |
Falconbridge Ltd. | 225,900 | | 5,854,575 |
FNX Mining Co., Inc. (a) | 164,300 | | 709,228 |
Freeport-McMoRan Copper & Gold, Inc. Class B | 1,273,800 | | 48,697,374 |
Gibraltar Industries, Inc. | 106,400 | | 2,513,168 |
Glamis Gold Ltd. (a) | 129,400 | | 2,217,053 |
Goldcorp, Inc. | 50,000 | | 752,500 |
Golden Star Resources Ltd. (a) | 250,000 | | 1,004,167 |
Harmony Gold Mining Co. Ltd. | 1,049,100 | | 9,725,158 |
High River Gold Mines Ltd. (a) | 1,989,600 | | 3,034,140 |
Inco Ltd. (a) | 100 | | 3,667 |
Inmet Mining Corp. (a) | 712,800 | | 12,794,760 |
International Steel Group, Inc. | 2,500 | | 101,400 |
IPSCO, Inc. | 1,165,900 | | 55,681,441 |
Ivanhoe Mines Ltd. (a) | 90,500 | | 652,354 |
Kinross Gold Corp. (a) | 4,204,866 | | 29,609,265 |
Massey Energy Co. | 289,794 | | 10,128,300 |
Meridian Gold, Inc. (a) | 100 | | 1,895 |
Newmont Mining Corp. | 2,267,580 | | 100,703,207 |
Nippon Steel Corp. | 3,401,000 | | 8,333,994 |
|
| Shares | | Value (Note 1) |
Noranda, Inc. | 100 | | $ 1,755 |
Nucor Corp. (d) | 1,866,700 | | 97,703,078 |
Peabody Energy Corp. | 233,400 | | 18,884,394 |
Phelps Dodge Corp. | 89,200 | | 8,823,664 |
Placer Dome, Inc. | 100 | | 1,882 |
POSCO sponsored ADR | 100 | | 4,453 |
Ryerson Tull, Inc. | 100 | | 1,575 |
Schnitzer Steel Industries, Inc. Class A | 150 | | 5,090 |
Steel Dynamics, Inc. | 1,728,994 | | 65,494,293 |
Teck Cominco Ltd. Class B (sub. vtg.) (d) | 1,118,800 | | 34,421,747 |
United States Steel Corp. | 354,300 | | 18,157,875 |
Usinas Siderurgicas de Minas Gerais SA (Usiminas) (PN-A) | 203,000 | | 4,115,030 |
Worthington Industries, Inc. | 3,200 | | 62,656 |
Xstrata PLC | 100 | | 1,789 |
| | 633,241,958 |
Paper & Forest Products - 0.3% |
International Forest Products (Interfor) Class A (a) | 9,100 | | 52,325 |
Lee & Man Paper Manufacturing Ltd. | 6,792,000 | | 5,548,734 |
MAXXAM, Inc. (a) | 100 | | 3,260 |
Sino-Forest Corp. (a) | 2,545,700 | | 7,276,459 |
Votorantim Celulose e Papel SA sponsored ADR (non-vtg.) | 250 | | 4,050 |
| | 12,884,828 |
TOTAL MATERIALS | | 737,502,192 |
TELECOMMUNICATION SERVICES - 1.9% |
Diversified Telecommunication Services - 0.8% |
Covad Communications Group, Inc. (a) | 2,491,761 | | 5,357,286 |
General Communications, Inc. Class A (a) | 100 | | 1,104 |
Golden Telecom, Inc. | 100 | | 2,642 |
Hungarian Telephone & Cable Corp. (a) | 100 | | 1,440 |
Philippine Long Distance Telephone Co. (a) | 100 | | 2,421 |
Philippine Long Distance Telephone Co. sponsored ADR (a)(d) | 425,600 | | 10,610,208 |
PT Indosat Tbk sponsored ADR | 100 | | 3,118 |
PT Telkomunikasi Indonesia Tbk sponsored ADR | 722,300 | | 15,182,746 |
| | 31,160,965 |
Wireless Telecommunication Services - 1.1% |
America Movil SA de CV sponsored ADR | 224,300 | | 11,742,105 |
Boston Communications Group, Inc. (a) | 100 | | 924 |
MTN Group Ltd. | 2,253,716 | | 17,305,369 |
Nextel Communications, Inc. Class A (a) | 100 | | 3,000 |
Nextel Partners, Inc. Class A (a) | 100 | | 1,954 |
NII Holdings, Inc. (a) | 349,008 | | 16,560,430 |
Telemig Celular Participacoes SA ADR | 100 | | 2,823 |
| | 45,616,605 |
TOTAL TELECOMMUNICATION SERVICES | | 76,777,570 |
Common Stocks - continued |
| Shares | | Value (Note 1) |
UTILITIES - 0.0% |
Electric Utilities - 0.0% |
FPL Group, Inc. | 100 | | $ 7,475 |
PPL Corp. | 100 | | 5,328 |
| | 12,803 |
Multi-Utilities & Unregulated Power - 0.0% |
Public Service Enterprise Group, Inc. | 100 | | 5,177 |
TOTAL UTILITIES | | 17,980 |
TOTAL COMMON STOCKS (Cost $2,720,027,228) | 3,869,885,699 |
Nonconvertible Preferred Stocks - 0.0% |
| | | |
CONSUMER DISCRETIONARY - 0.0% |
Automobiles - 0.0% |
Porsche AG (non-vtg.) | 100 | | 63,690 |
Household Durables - 0.0% |
Fedders Corp. Series A, 8.60% | 5 | | 120 |
TOTAL NONCONVERTIBLE PREFERRED STOCKS (Cost $58,459) | 63,810 |
Money Market Funds - 4.0% |
| | | |
Fidelity Cash Central Fund, 2.24% (b) | 99,587,186 | | 99,587,186 |
Fidelity Securities Lending Cash Central Fund, 2.23% (b)(c) | 59,013,966 | | 59,013,966 |
TOTAL MONEY MARKET FUNDS (Cost $158,601,152) | 158,601,152 |
TOTAL INVESTMENT
PORTFOLIO - 100.7% (Cost $2,878,686,839) | | | 4,028,550,661 |
NET OTHER ASSETS - (0.7)% | | | (28,308,362) |
NET ASSETS - 100% | | | $ 4,000,242,299 |
Legend |
(a) Non-income producing |
(b) Affiliated fund that is available only to investment companies and other accounts managed by Fidelity Investments. The rate quoted is the annualized seven-day yield of the fund at period end. A complete listing of the fund's holdings as of its most recent fiscal year end is available upon request. |
(c) Includes investment made with cash collateral received from securities on loan. |
(d) Security or a portion of the security is on loan at period end. |
(e) Affiliated company |
Other Information |
Distribution of investments by country of issue, as a percentage of total net assets, is as follows: |
United States of America | 72.7% |
Canada | 7.1% |
Japan | 3.9% |
Netherlands | 1.9% |
India | 1.5% |
Bermuda | 1.2% |
Cayman Islands | 1.1% |
Italy | 1.1% |
Taiwan | 1.0% |
Others (individually less than 1%) | 8.5% |
| 100.0% |
An affiliated company is a company in which the fund has ownership of at least 5% of the voting securities. Companies which are affiliates of the fund at period-end are noted in the fund's Schedule of Investments. Transactions during the period with companies which are or were affiliates are as follows: |
Affiliates | Value, beginning of period |
Purchases
|
Sales
Proceeds
|
Dividend
Income
| Value,
end of
period |
Bright Horizons Family Solutions, Inc. | $ 28,782,600 | $ - | $ 4,594,980 | $ - | $ - |
Foster Wheeler Ltd. | - | 3,915,209 | - | - | - |
Harvard Bioscience, Inc. | 24,939,580 | 1,612,609 | 1,104,712 | - | 13,996,708 |
IMPCO Technologies, Inc. | 1,771,032 | 8,777,717 | 791,283 | - | 11,373,320 |
Total | $ 55,493,212 | $ 14,305,535 | $ 6,490,975 | $ - | $ 25,370,028 |
Income Tax Information |
The fund hereby designates as capital gain dividends: For dividends with respect to the taxable year ended December 31, 2004, $68,763,000 or, if different, the net capital gain of such year. |
See accompanying notes which are an integral part of the financial statements.
Mid Cap Portfolio
Fidelity Variable Insurance Products Fund: Mid Cap Portfolio
Financial Statements
Statement of Assets and Liabilities
| December 31, 2004 |
| | |
Assets | | |
Investment in securities, at value (including securities loaned of $57,253,994) (cost $2,878,686,839) - See accompanying schedule | | $ 4,028,550,661 |
Cash | | 118,202 |
Foreign currency held at value (cost $9,142,039) | | 9,609,981 |
Receivable for investments sold | | 41,707,554 |
Receivable for fund shares sold | | 2,072,663 |
Dividends receivable | | 2,016,209 |
Interest receivable | | 213,204 |
Prepaid expenses | | 11,603 |
Other receivables | | 214,767 |
Total assets | | 4,084,514,844 |
| | |
Liabilities | | |
Payable for investments purchased | $ 19,788,804 | |
Payable for fund shares redeemed | 1,032,969 | |
Accrued management fee | 1,840,389 | |
Distribution fees payable | 506,394 | |
Other affiliated payables | 310,760 | |
Other payables and accrued expenses | 1,779,263 | |
Collateral on securities loaned, at value | 59,013,966 | |
Total liabilities | | 84,272,545 |
| | |
Net Assets | | $ 4,000,242,299 |
Net Assets consist of: | | |
Paid in capital | | $ 2,787,744,560 |
Undistributed net investment income | | 68,191 |
Accumulated undistributed net realized gain (loss) on investments and foreign currency transactions | | 63,335,377 |
Net unrealized appreciation (depreciation) on investments and assets and liabilities in foreign currencies | | 1,149,094,171 |
Net Assets | | $ 4,000,242,299 |
| | |
Initial Class: Net Asset Value, offering price and redemption price per share ($979,532,916 ÷ 32,457,007 shares) | | $ 30.18 |
| | |
Service Class: Net Asset Value, offering price and redemption price per share ($819,411,575 ÷ 27,246,677 shares) | | $ 30.07 |
| | |
Service Class 2: Net Asset Value, offering price and redemption price per share ($2,201,297,808 ÷ 73,675,095 shares) | | $ 29.88 |
Statement of Operations
| Year ended December 31, 2004 |
| | |
Investment Income | | |
Dividends | | $ 19,986,604 |
Interest | | 811,862 |
Security lending | | 749,362 |
Total income | | 21,547,828 |
| | |
Expenses | | |
Management fee | $ 17,263,105 | |
Transfer agent fees | 2,044,982 | |
Distribution fees | 4,605,289 | |
Accounting and security lending fees | 941,481 | |
Non-interested trustees' compensation | 15,949 | |
Custodian fees and expenses | 426,013 | |
Audit | 52,412 | |
Legal | 6,596 | |
Interest | 709 | |
Miscellaneous | 576,544 | |
Total expenses before reductions | 25,933,080 | |
Expense reductions | (742,557) | 25,190,523 |
Net investment income (loss) | | (3,642,695) |
Realized and Unrealized Gain (Loss) Net realized gain (loss) on: | | |
Investment securities (Including realized gain of $2,737,245 from affiliated issuers) | 195,588,243 | |
Foreign currency transactions | (153,730) | |
Total net realized gain (loss) | | 195,434,513 |
Change in net unrealized appreciation (depreciation) on: Investment securities (net of increase in deferred foreign taxes of $918,145) | 535,771,834 | |
Assets and liabilities in foreign currencies | 481,551 | |
Total change in net unrealized appreciation (depreciation) | | 536,253,385 |
Net gain (loss) | | 731,687,898 |
Net increase (decrease) in net assets resulting from operations | | $ 728,045,203 |
See accompanying notes which are an integral part of the financial statements.
Annual Report
Fidelity Variable Insurance Products Fund: Mid Cap Portfolio
Financial Statements - continued
Statement of Changes in Net Assets
| Year ended
December 31, 2004 | Year ended
December 31, 2003 A |
Increase (Decrease) in Net Assets | | |
Operations | | |
Net investment income (loss) | $ (3,642,695) | $ (2,294,177) |
Net realized gain (loss) | 195,434,513 | 29,542,718 |
Change in net unrealized appreciation (depreciation) | 536,253,385 | 575,223,419 |
Net increase (decrease) in net assets resulting from operations | 728,045,203 | 602,471,960 |
Distributions to shareholders from net investment income | - | (5,082,393) |
Share transactions - net increase (decrease) | 835,964,194 | 440,089,337 |
Total increase (decrease) in net assets | 1,564,009,397 | 1,037,478,904 |
| | |
Net Assets | | |
Beginning of period | 2,436,232,902 | 1,398,753,998 |
End of period (including undistributed net investment income of $68,191 and undistributed net investment income of $76,412, respectively) | $ 4,000,242,299 | $ 2,436,232,902 |
Other Information: | | | |
Share Transactions | Year ended December 31, 2004 |
| Initial Class | Service Class | Service Class 2 |
Shares Sold | 7,712,308 | 4,751,291 | 29,867,543 |
Reinvested | - | - | - |
Redeemed | (3,341,075) | (1,581,671) | (5,307,215) |
Net increase (decrease) | 4,371,233 | 3,169,620 | 24,560,328 |
| | | |
Dollars Sold | $ 203,215,754 | $ 122,478,823 | $ 766,867,153 |
Reinvested | - | - | - |
Redeemed | (83,674,683) | (40,224,756) | (132,698,097) |
Net increase (decrease) | $ 119,541,071 | $ 82,254,067 | $ 634,169,056 |
| | | |
Share Transactions | Year ended December 31, 2003 |
| Initial Class | Service Class | Service Class 2 |
Shares Sold | 4,434,612 | 4,691,539 | 24,537,608 |
Reinvested | 131,528 | 76,717 | 95,288 |
Redeemed | (5,011,471) | (2,353,097) | (5,472,778) |
Net increase (decrease) | (445,331) | 2,415,159 | 19,160,118 |
| | | |
Dollars Sold | $ 95,795,053 | $ 94,175,028 | $ 482,784,357 |
Reinvested | 2,207,036 | 1,285,007 | 1,590,350 |
Redeemed | (89,867,137) | (43,168,976) | (104,711,381) |
Net increase (decrease) | $ 8,134,952 | $ 52,291,059 | $ 379,663,326 |
| | | |
Distributions | Year ended December 31, 2003 |
| Initial Class | Service Class | Service Class 2 |
From net investment income | $ 2,207,036 | $ 1,285,007 | $ 1,590,350 |
A Certain amounts have been reclassified. See Note 1 of Notes to Financial Statements.
See accompanying notes which are an integral part of the financial statements.
Mid Cap Portfolio
Financial Highlights - Initial Class
Years ended December 31, | 2004 | 2003F | 2002 | 2001 | 2000 |
Selected Per-Share Data | | | | | |
Net asset value, beginning of period | $ 24.16 | $ 17.51 | $ 19.60 | $ 20.26 | $ 15.25 |
Income from Investment Operations | | | | | |
Net investment income (loss)C | .01 | -E | .09 | .20 | .19 |
Net realized and unrealized gain (loss) | 6.01 | 6.73 | (2.00) | (.86) | 4.95 |
Total from investment operations | 6.02 | 6.73 | (1.91) | (.66) | 5.14 |
Distributions from net investment income | - | (.08) | (.18) | - | (.08) |
Distributions in excess of net realized gain | - | - | - | - | (.05) |
Total distributions | - | (.08) | (.18) | - | (.13) |
Net asset value, end of period | $ 30.18 | $ 24.16 | $ 17.51 | $ 19.60 | $ 20.26 |
Total ReturnA, B | 24.92% | 38.64% | (9.82)% | (3.26)% | 33.78% |
Ratios to Average Net AssetsD | | | | | |
Expenses before expense reductions | .71% | .70% | .70% | .69% | .74% |
Expenses net of voluntary waivers, if any | .71% | .70% | .70% | .69% | .74% |
Expenses net of all reductions | .68% | .68% | .63% | .62% | .69% |
Net investment income (loss) | .03% | -% | .51% | 1.06% | 1.01% |
Supplemental Data | | | | | |
Net assets, end of period (000 omitted) | $ 979,533 | $ 678,480 | $ 499,557 | $ 574,934 | $ 589,026 |
Portfolio turnover rate | 55% | 51% | 135% | 144% | 245% |
A Total returns do not reflect charges attributable to your insurance company's separate account. Inclusion of these charges would reduce the total returns shown.
B Total returns would have been lower had certain expenses not been reduced during the periods shown.
C Calculated based on average shares outstanding during the period.
D Expense ratios reflect operating expenses of the class. Expenses before reductions do not reflect amounts reimbursed by the investment adviser or reductions from brokerage service arrangements or other expense offset arrangements and do not represent the amount paid by the class during periods when reimbursements or reductions occur. Expenses net of any voluntary waivers reflect expenses after reimbursement by the investment adviser but prior to reductions from brokerage service arrangements or other expense offset arrangements. Expenses net of all reductions represent the net expenses paid by the class.
E Amount represents less than $.01 per share.
F As the result of a correction made in the classification of distributions received on securities representing realized gains for the year ended December 31, 2003, amounts previously reported have been reclassified. The impact of this correction was a decrease in net investment loss of $0.01 per share and a corresponding decrease in net realized and unrealized gain (loss). The ratio of net investment loss to average net assets decreased from (0.04)% to 0.00%. The reclassification had no impact on total net assets or total return of the class.
Financial Highlights - Service Class
Years ended December 31, | 2004 | 2003E | 2002 | 2001 | 2000 |
Selected Per-Share Data | | | | | |
Net asset value, beginning of period | $ 24.10 | $ 17.46 | $ 19.54 | $ 20.22 | $ 15.24 |
Income from Investment Operations | | | | | |
Net investment income (loss)C | (.02) | (.02) | .08 | .18 | .17 |
Net realized and unrealized gain (loss) | 5.99 | 6.72 | (2.00) | (.86) | 4.93 |
Total from investment operations | 5.97 | 6.70 | (1.92) | (.68) | 5.10 |
Distributions from net investment income | - | (.06) | (.16) | - | (.07) |
Distributions in excess of net realized gain | - | - | - | - | (.05) |
Total distributions | - | (.06) | (.16) | - | (.12) |
Net asset value, end of period | $ 30.07 | $ 24.10 | $ 17.46 | $ 19.54 | $ 20.22 |
Total ReturnA, B | 24.77% | 38.52% | (9.90)% | (3.36)% | 33.54% |
Ratios to Average Net AssetsD | | | | | |
Expenses before expense reductions | .81% | .80% | .80% | .79% | .84% |
Expenses net of voluntary waivers, if any | .81% | .80% | .80% | .79% | .84% |
Expenses net of all reductions | .78% | .78% | .73% | .72% | .79% |
Net investment income (loss) | (.07)% | (.10)% | .41% | .96% | .92% |
Supplemental Data | | | | | |
Net assets, end of period (000 omitted) | $ 819,412 | $ 580,179 | $ 378,264 | $ 366,665 | $ 282,941 |
Portfolio turnover rate | 55% | 51% | 135% | 144% | 245% |
A Total returns do not reflect charges attributable to your insurance company's separate account. Inclusion of these charges would reduce the total returns shown.
B Total returns would have been lower had certain expenses not been reduced during the periods shown.
C Calculated based on average shares outstanding during the period.
D Expense ratios reflect operating expenses of the class. Expenses before reductions do not reflect amounts reimbursed by the investment adviser or reductions from brokerage service arrangements or other expense offset arrangements and do not represent the amount paid by the class during periods when reimbursements or reductions occur. Expenses net of any voluntary waivers reflect expenses after reimbursement by the investment adviser but prior to reductions from brokerage service arrangements or other expense offset arrangements. Expenses net of all reductions represent the net expenses paid by the class.
E As the result of a correction made in the classification of distributions received on securities representing realized gains for the year ended December 31, 2003, amounts previously reported have been reclassified. The impact of this correction was a decrease in net investment loss of $0.01 per share and a corresponding decrease in net realized and unrealized gain (loss). The ratio of net investment loss to average net assets decreased from (0.14)% to (0.10)%. The reclassification had no impact on total net assets or total return of the class.
See accompanying notes which are an integral part of the financial statements.
Annual Report
Fidelity Variable Insurance Products Fund: Mid Cap Portfolio
Financial Statements - continued
Financial Highlights - Service Class 2
Years ended December 31, | 2004 | 2003 F | 2002 | 2001 | 2000D |
Selected Per-Share Data | | | | | |
Net asset value, beginning of period | $ 23.98 | $ 17.39 | $ 19.49 | $ 20.20 | $ 14.82 |
Income from Investment Operations | | | | | |
Net investment income (loss)C | (.06) | (.05) | .05 | .15 | .14 |
Net realized and unrealized gain (loss) | 5.96 | 6.69 | (1.99) | (.86) | 5.35 |
Total from investment operations | 5.90 | 6.64 | (1.94) | (.71) | 5.49 |
Distributions from net investment income | - | (.05) | (.16) | - | (.06) |
Distributions in excess of net realized gain | - | - | - | - | (.05) |
Total distributions | - | (.05) | (.16) | - | (.11) |
Net asset value, end of period | $ 29.88 | $ 23.98 | $ 17.39 | $ 19.49 | $ 20.20 |
Total ReturnA, B | 24.60% | 38.31% | (10.02)% | (3.51)% | 37.12% |
Ratios to Average Net AssetsE | | | | | |
Expenses before expense reductions | .96% | .95% | .95% | .94% | .99% A |
Expenses net of voluntary waivers, if any | .96% | .95% | .95% | .94% | .99% A |
Expenses net of all reductions | .93% | .93% | .88% | .88% | .94% A |
Net investment income (loss) | (.22)% | (.25)% | .25% | .81% | .76% A |
Supplemental Data | | | | | |
Net assets, end of period (000 omitted) | $ 2,201,298 | $ 1,177,574 | $ 520,933 | $ 210,356 | $ 73,039 |
Portfolio turnover rate | 55% | 51% | 135% | 144% | 245% |
A Total returns do not reflect charges attributable to your insurance company's separate account. Inclusion of these charges would reduce the total returns shown.
B Total returns would have been lower had certain expenses not been reduced during the periods shown.
C Calculated based on average shares outstanding during the period.
D For the period January 12, 2000 (commencement of operations) to December 31, 2000.
E Expense ratios reflect operating expenses of the class. Expenses before reductions do not reflect amounts reimbursed by the investment adviser or reductions from brokerage service arrangements or other expense offset arrangements and do not represent the amount paid by the class during periods when reimbursements or reductions occur. Expense ratios before reductions for start-up periods may not be representative of longer-term operating periods. Expenses net of any voluntary waivers reflect expenses after reimbursement by the investment adviser but prior to reductions from brokerage service arrangements or other expense offset arrangements. Expenses net of all reductions represent the net expenses paid by the class.
F As the result of a correction made in the classification of distributions received on securities representing realized gains for the year ended December 31, 2003, amounts previously reported have been reclassified. The impact of this correction was a decrease in net investment loss of $0.01 per share and a corresponding decrease in net realized and unrealized gain (loss). The ratio of net investment loss to average net assets decreased from (0.29)% to (0.25)%. The reclassification had no impact on total net assets or total return of the class.
See accompanying notes which are an integral part of the financial statements.
Mid Cap Portfolio
Fidelity Variable Insurance Products: Money Market Portfolio
Performance: The Bottom Line
Average annual total return reflects the change in the value of an investment, assuming reinvestment of the class' dividend income and capital gains (the profits earned upon the sale of securities that have grown in value) and assuming a constant rate of performance each year. Performance numbers are net of all underlying fund operating expenses, but do not include any insurance charges imposed by your insurance company's separate account. If performance information included the effect of these additional charges, the total returns would be lower. How a fund did yesterday is no guarantee of how it will do tomorrow.
Average Annual Total Returns
Periods ended December 31, 2004 | Past 1
year | Past 5
years | Past 10
years |
Fidelity VIP: Money Market - Initial Class | 1.21% | 2.86% | 4.16% |
Fidelity VIP: Money Market - Service Class A | 1.10% | 2.77% | 4.12% |
Fidelity VIP: Money Market - Service Class 2 B | 0.95% | 2.62% | 4.04% |
A The initial offering of Service Class shares took place on July 7, 2000. Performance for Service Class shares reflects an asset-based service fee (12b-1 fee), and returns prior to July 7, 2000 are those of Initial Class and do not include the effects of a 12b-1 fee. Had Service Class' 12b-1 fee been reflected, returns prior to July 7, 2000 would have been lower.
B The initial offering of Service Class 2 shares took place on January 12, 2000. Performance for Service Class 2 shares reflects an asset-based service fee (12b-1 fee), and returns prior to January 12, 2000 are those of Initial Class and do not include the effects of a 12b-1 fee. Had Service Class 2's 12b-1 fee been reflected, returns prior to January 12, 2000 would have been lower.
Yield
| 12/28/04 | 9/28/04 | 6/29/04 | 3/30/04 | 12/30/03 |
Fidelity VIP Money Market - Initial Class | 1.91% | 1.47% | 1.03% | 0.92% | 0.99% |

Yield refers to the income paid by the fund over a given period. Yields for money market funds are usually for seven-day periods, expressed as annual percentage rates. A yield that assumes income earned is reinvested or compounded is called an effective yield. The chart above shows the fund's current seven-day yield at quarterly intervals over the past year.
Annual Report
Fidelity Variable Insurance Products: Money Market Portfolio
Investment Summary
Maturity Diversification |
Days | % of fund's investments 12/31/04 |
0 - 30 | 34.6 |
31 - 90 | 44.8 |
91 - 180 | 19.2 |
181 - 397 | 1.4 |
Weighted Average Maturity |
| 12/31/04 |
Fidelity Variable Insurance Products:
Money Market Portfolio | 56 Days |
Asset Allocation (% of fund's net assets) |
As of December 31, 2004 |
 | Corporate Bond | 1.6% | |
 | Commercial Paper | 17.5% | |
 | Bank CDs, BAs, TDs,
and Notes | 53.0% | |
 | Government Securities | 19.6% | |
 | Repurchase Agreements | 8.9% | |
 | Net Other Assets* | (0.6)% | |

* Net Other Assets are not included in the pie chart.
Money Market Portfolio
Fidelity Variable Insurance Products: Money Market Portfolio
Investments December 31, 2004
Showing Percentage of Net Assets
Corporate Bonds - 1.6% |
Due
Date | Annualized
Yield at Time
of Purchase | Principal
Amount | | Value
(Note 1) |
Bell Trace Obligated Group |
1/7/05 | 2.50% (b) | $ 11,600,000 | | $ 11,600,000 |
Citigroup, Inc. |
12/1/05 | 2.95 | 9,735,000 | | 10,056,742 |
Deutsche Telekom International Finance BV |
6/15/05 | 2.68 | 1,050,000 | | 1,075,500 |
6/15/05 | 2.70 | 140,000 | | 143,383 |
6/15/05 | 2.71 | 205,000 | | 209,949 |
6/15/05 | 2.83 | 35,000 | | 35,843 |
6/15/05 | 2.84 | 110,000 | | 112,645 |
6/15/05 | 2.85 | 95,000 | | 97,276 |
6/15/05 | 2.88 | 55,000 | | 56,311 |
TOTAL CORPORATE BONDS | 23,387,649 |
Certificates of Deposit - 20.0% |
|
Domestic Certificates Of Deposit - 1.2% |
Washington Mutual Bank, California |
1/27/05 | 1.90 | 7,000,000 | | 7,000,050 |
6/13/05 | 2.70 | 10,000,000 | | 10,000,000 |
| 17,000,050 |
London Branch, Eurodollar, Foreign Banks - 7.7% |
Barclays Bank PLC |
2/28/05 | 1.93 | 25,000,000 | | 25,000,000 |
Calyon |
2/22/05 | 1.87 | 15,000,000 | | 15,000,000 |
Dresdner Bank AG |
2/1/05 | 2.02 | 15,000,000 | | 15,000,000 |
ING Bank NV |
1/4/05 | 1.98 | 15,000,000 | | 15,000,000 |
Societe Generale |
3/7/05 | 2.00 | 20,000,000 | | 20,000,000 |
4/21/05 | 2.55 | 20,000,000 | | 20,000,000 |
| 110,000,000 |
New York Branch, Yankee Dollar, Foreign Banks - 11.1% |
Bank of Tokyo-Mitsubishi Ltd. |
1/31/05 | 2.41 | 15,000,000 | | 15,000,000 |
BNP Paribas SA |
1/24/05 | 2.33 (b) | 10,000,000 | | 9,997,629 |
2/14/05 | 1.95 | 15,000,000 | | 15,000,000 |
Canadian Imperial Bank of Commerce |
1/18/05 | 2.45 (b) | 20,000,000 | | 20,000,000 |
1/28/05 | 2.36 (b) | 25,000,000 | | 24,998,443 |
HBOS Treasury Services PLC |
3/4/05 | 2.39 (b) | 20,000,000 | | 20,000,000 |
|
Due
Date | Annualized
Yield at Time
of Purchase | Principal
Amount | | Value
(Note 1) |
Landesbank Baden-Wuerttemberg |
2/25/05 | 2.31% (b) | $ 15,000,000 | | $ 14,998,225 |
3/7/05 | 2.37 (b) | 5,000,000 | | 4,999,730 |
Societe Generale |
1/10/05 | 2.28 (b) | 5,000,000 | | 4,999,726 |
1/18/05 | 2.34 (b) | 15,000,000 | | 14,997,516 |
Societe Generale NA |
5/9/05 | 2.53 | 4,000,000 | | 3,984,336 |
Unicredito Italiano Spa |
2/14/05 | 2.21 (b) | 10,000,000 | | 9,997,969 |
| 158,973,574 |
TOTAL CERTIFICATES OF DEPOSIT | 285,973,624 |
Commercial Paper - 17.2% |
|
Bank of America Corp. |
3/16/05 | 2.06 | 20,000,000 | | 19,916,133 |
4/5/05 | 2.16 | 15,000,000 | | 14,916,183 |
Bradford & Bingley PLC |
1/28/05 | 2.12 | 5,000,000 | | 4,992,106 |
Charta LLC |
2/10/05 | 2.25 | 5,000,000 | | 4,987,556 |
Comcast Corp. |
1/3/05 | 2.59 | 1,000,000 | | 999,856 |
1/18/05 | 2.67 | 3,000,000 | | 2,996,232 |
DaimlerChrysler NA Holding Corp. |
1/24/05 | 2.56 | 2,000,000 | | 1,996,729 |
1/25/05 | 2.58 | 5,000,000 | | 4,991,433 |
Dominion Resources, Inc. |
1/12/05 | 2.44 | 700,000 | | 699,478 |
Dorada Finance, Inc. |
3/10/05 | 2.04 (a) | 5,000,000 | | 4,980,922 |
3/14/05 | 2.03 (a) | 15,000,000 | | 14,939,700 |
Dresdner U.S. Finance, Inc. |
1/24/05 | 1.98 | 5,000,000 | | 4,993,715 |
Ford Motor Credit Co. |
1/6/05 | 2.63 | 4,000,000 | | 3,998,539 |
1/13/05 | 2.51 | 10,000,000 | | 9,991,667 |
General Electric Capital Corp. |
2/1/05 | 1.90 | 15,000,000 | | 14,975,717 |
2/11/05 | 1.87 | 10,000,000 | | 9,978,931 |
Grampian Funding Ltd. |
2/10/05 | 1.97 | 10,000,000 | | 9,978,333 |
4/8/05 | 2.45 | 5,000,000 | | 4,967,263 |
4/19/05 | 2.20 | 10,000,000 | | 9,934,600 |
6/20/05 | 2.72 | 5,000,000 | | 4,936,722 |
John Deere Capital Corp. |
1/14/05 | 2.43 | 1,000,000 | | 999,123 |
Commercial Paper - continued |
Due
Date | Annualized
Yield at Time
of Purchase | Principal
Amount | | Value
(Note 1) |
Jupiter Securitization Corp. |
6/20/05 | 2.70% | $ 10,629,000 | | $ 10,495,488 |
Kellogg Co. |
1/10/05 | 2.42 | 500,000 | | 499,698 |
Motown Notes Program |
1/18/05 | 2.22 | 5,000,000 | | 4,994,782 |
2/1/05 | 2.16 | 5,000,000 | | 4,990,743 |
2/7/05 | 2.27 | 19,000,000 | | 18,955,867 |
Nordea North America, Inc. |
5/23/05 | 2.53 | 15,000,000 | | 14,852,083 |
Paradigm Funding LLC |
1/7/05 | 2.30 (b) | 5,000,000 | | 4,999,925 |
2/24/05 | 1.94 | 15,000,000 | | 14,956,800 |
Park Granada LLC |
2/8/05 | 2.25 | 10,000,000 | | 9,976,356 |
Westpac Capital Corp. |
3/2/05 | 2.31 | 10,250,000 | | 10,210,879 |
TOTAL COMMERCIAL PAPER | 246,103,559 |
Federal Agencies - 19.6% |
|
Fannie Mae - 7.3% |
Agency Coupons - 7.3% |
2/15/05 | 1.40 | 5,000,000 | | 5,000,000 |
2/25/05 | 1.40 | 25,000,000 | | 25,000,000 |
3/29/05 | 1.40 | 15,000,000 | | 15,000,000 |
5/4/05 | 1.54 | 20,000,000 | | 20,000,000 |
5/13/05 | 1.59 | 20,000,000 | | 20,000,000 |
5/16/05 | 1.63 | 5,000,000 | | 5,000,000 |
6/3/05 | 1.84 | 5,000,000 | | 5,000,000 |
9/12/05 | 2.31 | 10,000,000 | | 10,000,000 |
| 105,000,000 |
Federal Home Loan Bank - 12.3% |
Agency Coupons - 12.3% |
2/25/05 | 1.40 | 15,000,000 | | 15,000,000 |
2/25/05 | 1.82 | 5,000,000 | | 4,996,906 |
3/11/05 | 1.44 | 35,000,000 | | 35,000,000 |
4/1/05 | 1.40 | 55,000,000 | | 54,999,999 |
4/1/05 | 1.45 | 10,240,000 | | 10,238,768 |
4/27/05 | 1.30 | 10,000,000 | | 10,000,000 |
4/27/05 | 1.74 | 5,000,000 | | 4,993,134 |
4/28/05 | 1.35 | 5,000,000 | | 5,000,000 |
4/29/05 | 2.03 | 5,000,000 | | 4,989,167 |
5/2/05 | 1.92 | 5,000,000 | | 4,991,020 |
5/3/05 | 1.37 | 20,000,000 | | 20,000,000 |
5/16/05 | 1.65 | 5,000,000 | | 5,000,000 |
| 175,208,994 |
TOTAL FEDERAL AGENCIES | 280,208,994 |
Master Notes - 4.4% |
Due
Date | Annualized
Yield at Time
of Purchase | Principal
Amount | | Value
(Note 1) |
General Motors Acceptance Corp. Mortgage Credit |
1/3/05 | 2.88% (e) | $ 10,000,000 | | $ 9,998,404 |
1/3/05 | 2.92 (e) | 4,000,000 | | 3,999,353 |
Goldman Sachs Group, Inc. |
1/10/05 | 2.06 (b)(e) | 7,000,000 | | 7,000,000 |
2/28/05 | 2.43 (b)(e) | 36,000,000 | | 36,000,000 |
4/12/05 | 2.12 (e) | 5,000,000 | | 5,000,000 |
TOTAL MASTER NOTES | 61,997,757 |
Medium-Term Notes - 21.2% |
|
American Express Credit Corp. |
1/5/05 | 2.38 (b) | 10,000,000 | | 10,000,822 |
Bank of New York Co., Inc. |
1/27/05 | 2.44 (a)(b) | 15,000,000 | | 15,000,000 |
Bank of Scotland Treasury Services PLC |
3/14/05 | 2.53 (a)(b) | 10,000,000 | | 10,001,272 |
Bayerische Landesbank Girozentrale |
2/19/05 | 2.30 (b) | 15,000,000 | | 15,000,000 |
BellSouth Telecommunications |
3/4/05 | 2.50 (b) | 5,000,000 | | 5,000,000 |
Citigroup Global Markets Holdings, Inc. |
3/7/05 | 2.50 (b) | 5,000,000 | | 5,002,442 |
Countrywide Home Loans, Inc. |
1/18/05 | 2.14 (b) | 10,000,000 | | 9,998,834 |
Descartes Funding Trust |
1/18/05 | 2.40 (b) | 5,000,000 | | 5,000,000 |
General Electric Capital Corp. |
1/10/05 | 2.46 (b) | 25,000,000 | | 25,000,000 |
1/17/05 | 2.51 (b) | 20,000,000 | | 20,000,000 |
HBOS Treasury Services PLC |
3/24/05 | 2.55 (b) | 20,000,000 | | 20,000,000 |
Morgan Stanley |
1/3/05 | 2.37 (b) | 2,000,000 | | 2,000,000 |
1/4/05 | 2.33 (b) | 5,000,000 | | 5,000,000 |
1/18/05 | 2.40 (b) | 5,000,000 | | 5,000,000 |
1/18/05 | 2.52 (b) | 25,000,000 | | 25,004,623 |
1/27/05 | 2.43 (b) | 11,000,000 | | 11,000,385 |
National City Bank |
3/1/05 | 2.32 (b) | 10,000,000 | | 9,998,759 |
RACERS |
1/24/05 | 2.41 (a)(b) | 15,000,000 | | 15,000,000 |
SBC Communications, Inc. |
6/5/05 | 2.39 (a) | 4,000,000 | | 4,028,398 |
SouthTrust Bank, Alabama |
2/2/05 | 2.23 (b) | 25,000,000 | | 25,008,583 |
Medium-Term Notes - continued |
Due
Date | Annualized
Yield at Time
of Purchase | Principal
Amount | | Value
(Note 1) |
Verizon Global Funding Corp. |
3/15/05 | 2.60% (b) | $ 50,000,000 | | $ 50,000,242 |
Westpac Banking Corp. |
3/14/05 | 2.39 (b) | 10,000,000 | | 9,998,640 |
TOTAL MEDIUM-TERM NOTES | 302,043,000 |
Short-Term Notes - 5.8% |
|
Jackson National Life Insurance Co. |
1/3/05 | 2.15 (b)(e) | 7,000,000 | | 7,000,000 |
Metropolitan Life Insurance Co. |
1/3/05 | 2.20 (b)(e) | 10,000,000 | | 10,000,000 |
1/28/05 | 2.46 (a)(b) | 5,000,000 | | 5,000,000 |
2/1/05 | 2.32 (b)(e) | 5,000,000 | | 5,000,000 |
Monumental Life Insurance Co. |
1/1/05 | 2.42 (b)(e) | 5,000,000 | | 5,000,000 |
1/1/05 | 2.45 (b)(e) | 5,000,000 | | 5,000,000 |
New York Life Insurance Co. |
1/3/05 | 2.14 (b)(e) | 30,000,000 | | 30,000,000 |
Pacific Life Insurance Co. |
3/11/05 | 2.62 (b)(e) | 5,000,000 | | 5,000,000 |
Transamerica Occidental Life Insurance Co. |
2/1/05 | 2.33 (b)(e) | 10,000,000 | | 10,000,000 |
TOTAL SHORT-TERM NOTES | 82,000,000 |
Municipal Securities - 1.9% |
|
|
New York State Hsg. Fin. Svc. Contract Rev. Series 2003 H, 2.45%,
LOC Dexia Cr. Local de France, VRDN (b) | 11,000,000 | | 11,000,000 |
San Jose Redev. Agcy. Rev. Series A, 2.45%, LOC JPMorgan Chase Bank, VRDN (b)(c) | 11,250,000 | | 11,250,000 |
West Baton Rouge Parish Indl. District #3 Rev. Bonds (Dow Chemical Co. Proj.) Series 1995, 2.4% tender 1/5/05, CP mode | 5,200,000 | | 5,200,000 |
TOTAL MUNICIPAL SECURITIES | 27,450,000 |
Repurchase Agreements - 8.9% |
| Maturity
Amount | | Value
(Note 1) |
In a joint trading account (Collateralized by U.S. Government Obligations dated 12/31/04 due 1/3/05 At 2.32%) | $ 98,019 | | $ 98,000 |
With: | | | |
Banc of America Securities LLC At 2.37%, dated 12/31/04 due 1/3/05 (Collateralized by Commercial Paper Obligations
with principal amounts of $15,320,717, 2.44%, 1/19/05) | 15,002,963 | | 15,000,000 |
Goldman Sachs & Co. At: | | | |
2.41%, dated 12/31/04 due 1/3/05 (Collateralized by Mortgage Loan Obligations
with principal amounts of $2,003,978, 4.88%, 1/12/38) | 2,000,402 | | 2,000,000 |
2.43%, dated 11/22/04 due 2/18/05 (Collateralized by Mortgage Loan Obligations
with principal amounts of $25,084,688, 5.25% - 7.14%, 12/15/12 - 2/25/44) (b)(d) | 20,118,800 | | 20,000,000 |
J.P. Morgan Securities, Inc. At 2.38%, dated 12/15/04 due 2/3/05 (Collateralized by Corporate Obligations with principal amounts of $25,120,000, 6.05% - 7.38%, 6/20/08 - 2/15/24) | 24,079,333 | | 24,000,000 |
Lehman Brothers, Inc. At 2.43%, dated 12/31/04 due 1/3/05 (Collateralized by Equity Securities valued at $24,639,109) | 23,004,658 | | 23,000,000 |
Repurchase Agreements - continued |
| Maturity
Amount | | Value
(Note 1) |
With: - continued | | | |
Merrill Lynch, Pierce, Fenner & Smith At 2.46%, dated 11/8/04 due 2/1/05 (Collateralized by Corporate Obligations with principal amounts of $24,810,000, 6.85%, 5/1/29) (b)(d) | $ 23,133,592 | | $ 23,000,000 |
Morgan Stanley & Co. At 2.38%, dated 12/15/04 due 2/3/05 (Collateralized by Mortgage Loan Obligations with principal amounts of $26,590,879, 3.9% - 6.13%, 8/25/32 - 8/25/34) | 20,066,111 | | 20,000,000 |
TOTAL REPURCHASE AGREEMENTS | 127,098,000 |
TOTAL INVESTMENT
PORTFOLIO - 100.6% | | | 1,436,262,583 |
NET OTHER ASSETS - (0.6)% | | | (9,009,474) |
NET ASSETS - 100% | | | $ 1,427,253,109 |
Total Cost for Federal Income Tax Purposes | | | $ 1,436,262,583 |
Security Type Abbreviations |
CP | - | Commercial Paper |
VRDN | - | Variable Rate Demand Note |
Legend |
(a) Security exempt from registration under Rule 144A of the Securities Act of 1933. These securities may be resold in transactions exempt from registration, normally to qualified institutional buyers. At the period end, the value of these securities amounted to 68,950,292 or 4.8% of net assets. |
(b) The coupon rate shown on floating or adjustable rate securities represents the rate at period end. The due dates on these types of securities reflect the next interest rate reset date or, when applicable, the final maturity date. |
(c) Private activity obligations whose interest is subject to the federal alternative minimum tax for individuals. |
(d) The maturity amount is based on the rate at period end. |
(e) Restricted securities - Investment in securities not registered under the Securities Act of 1933 (excluding 144A issues). At the end of the period, the value of restricted securities (excluding 144A issues) amounted to $138,997,758 or 9.7% of net assets. |
Additional information on each holding is as follows: |
Security | Acquisition
Date | Cost |
General Motors Acceptance Corp. Mortgage Credit:
2.88%, 1/3/05 | 12/1/04 | $ 9,998,404 |
2.92%, 1/3/05 | 12/1/04 | $ 3,999,353 |
Goldman Sachs Group, Inc.:
2.06%, 1/10/05 | 7/8/04 | $ 7,000,000 |
2.12%, 4/12/05 | 9/14/04 | $ 5,000,000 |
2.43%, 2/28/05 | 8/26/04 | $ 36,000,000 |
Jackson National Life Insurance Co.
2.15%, 1/3/05 | 3/31/03 | $ 7,000,000 |
Metropolitan Life Insurance Co.:
2.2%, 1/3/05 | 3/26/02 | $ 10,000,000 |
2.32%, 2/1/05 | 2/24/03 | $ 5,000,000 |
Monumental Life Insurance Co.:
2.42%, 1/1/05 | 9/17/98 | $ 5,000,000 |
2.45, 1/1/05 | 3/12/99 | $ 5,000,000 |
New York Life Insurance Co.
2.14%, 1/3/05 | 2/28/02 - 12/19/02 | $ 30,000,000 |
Pacific Life Insurance Co
2.62%, 3/11/05 | 3/10/03 | $ 5,000,000 |
Transamerica Occidental Life Insurance Co.
2.33%, 2/1/05 | 4/28/00 | $ 10,000,000 |
Income Tax Information |
At December 31, 2004, the fund had a capital loss carryforward of approximately $284,000 of which $109,000 and $175,000 will expire on December 31, 2011 and 2012, respectively. |
See accompanying notes which are an integral part of the financial statements.
Money Market Portfolio
Fidelity Variable Insurance Products: Money Market Portfolio
Financial Statements
Statement of Assets and Liabilities
| December 31, 2004 |
Assets | | |
Investment in securities, at value (including repurchase agreements of $127,098,000) (cost $1,436,262,583) - See accompanying schedule | | $ 1,436,262,583 |
Cash | | 181,340 |
Receivable for fund shares sold | | 1,447,892 |
Interest receivable | | 3,372,555 |
Prepaid expenses | | 6,391 |
Other affiliated receivables | | 740 |
Other receivables | | 10 |
Total assets | | 1,441,271,511 |
| | |
Liabilities | | |
Payable for investments purchased | $ 10,118,802 | |
Payable for fund shares redeemed | 3,382,769 | |
Accrued management fee | 234,506 | |
Distribution fees payable | 4,914 | |
Other affiliated payables | 97,414 | |
Other payables and accrued expenses | 179,997 | |
Total liabilities | | 14,018,402 |
| | |
Net Assets | | $ 1,427,253,109 |
Net Assets consist of: | | |
Paid in capital | | $ 1,427,486,892 |
Undistributed net investment income | | 49,905 |
Accumulated undistributed net realized gain (loss) on investments | | (283,688) |
Net Assets | | $ 1,427,253,109 |
| | |
Initial Class:
Net Asset Value, offering price and redemption price per share ($1,392,448,817 ÷ 1,392,654,760 shares) | | $ 1.00 |
| | |
Service Class:
Net Asset Value, offering price and redemption price per share ($13,905,448 ÷ 13,906,161 shares) | | $ 1.00 |
| | |
Service Class 2:
Net Asset Value, offering price and redemption price per share ($20,898,844 ÷ 20,900,582 shares) | | $ 1.00 |
Statement of Operations
| Year ended December 31, 2004 |
Investment Income | | |
Interest | | $ 24,719,517 |
| | |
Expenses | | |
Management fee | $ 3,278,063 | |
Transfer agent fees | 1,109,423 | |
Distribution fees | 43,872 | |
Accounting fees and expenses | 180,343 | |
Non-interested trustees' compensation | 9,503 | |
Custodian fees and expenses | 36,714 | |
Audit | 37,379 | |
Legal | 3,797 | |
Miscellaneous | 246,179 | |
Total expenses before reductions | 4,945,273 | |
Expense reductions | (504) | 4,944,769 |
Net investment income | | 19,774,748 |
Net realized gain (loss) on investment securities | | (174,987) |
Net increase in net assets resulting from operations | | $ 19,599,761 |
See accompanying notes which are an integral part of the financial statements.
Annual Report
Fidelity Variable Insurance Products: Money Market Portfolio
Financial Statements - continued
Statement of Changes in Net Assets
| Year ended
December 31,
2004 | Year ended
December 31,
2003 |
Increase (Decrease) in Net Assets | | |
Operations | | |
Net investment income | $ 19,774,748 | $ 23,975,974 |
Net realized gain (loss) | (174,987) | (133,557) |
Net increase in net assets resulting from operations | 19,599,761 | 23,842,417 |
Distributions to shareholders from net investment income | (19,778,361) | (23,975,974) |
Share transactions - net increase (decrease) | (412,681,844) | (920,442,277) |
Total increase (decrease) in net assets | (412,860,444) | (920,575,834) |
| | |
Net Assets | | |
Beginning of period | 1,840,113,553 | 2,760,689,387 |
End of period (including undistributed net investment income of $49,905 and $0, respectively) | $ 1,427,253,109 | $ 1,840,113,553 |
Other Information: | | | |
Share Transactions | Year ended December 31, 2004 |
| Initial Class | Service Class | Service Class 2 |
Shares Sold | 830,419,484 | 47,818,461 | 22,301,596 |
Reinvested | 19,434,528 | 224,941 | 96,802 |
Redeemed | (1,274,668,391) | (53,743,207) | (4,566,058) |
Net increase (decrease) | (424,814,379) | (5,699,805) | 17,832,340 |
| | | |
Share Transactions | Year ended December 31, 2003 |
| Initial Class | Service Class | Service Class 2 |
Shares Sold | 6,056,411,700 | 54,027,987 | 82,930,007 |
Reinvested | 23,602,029 | 128,154 | 208,645 |
Redeemed | (6,967,511,919) | (42,565,009) | (127,673,871) |
Net increase (decrease) | (887,498,190) | 11,591,132 | (44,535,219) |
| | | |
Distributions | Year ended December 31, 2004 |
| Initial Class | Service Class | Service Class 2 |
From net investment income | $ 19,434,556 | $ 247,002 | $ 96,803 |
| Year ended December 31, 2003 |
| Initial Class | Service Class | Service Class 2 |
From net investment income | $ 23,625,076 | $ 137,269 | $ 213,629 |
See accompanying notes which are an integral part of the financial statements.
Money Market Portfolio
Financial Highlights - Initial Class
Years ended December 31, | 2004 | 2003 | 2002 | 2001 | 2000 |
Selected Per-Share Data | | | | | |
Net asset value, beginning of period | $ 1.00 | $ 1.00 | $ 1.00 | $ 1.00 | $ 1.00 |
Income from Investment Operations | | | | | |
Net investment income | .012 | .010 | .017 | .041 | .062 |
Distributions from net investment income | (.012) | (.010) | (.017) | (.041) | (.062) |
Net asset value, end of period | $ 1.00 | $ 1.00 | $ 1.00 | $ 1.00 | $ 1.00 |
Total Return A, B | 1.21% | 1.00% | 1.69% | 4.18% | 6.30% |
Ratios to Average Net Assets C | | | | | |
Expenses before expense reductions | .29% | .29% | .29% | .28% | .33% |
Expenses net of voluntary waivers, if any | .29% | .29% | .29% | .28% | .33% |
Expenses net of all reductions | .29% | .29% | .29% | .28% | .33% |
Net investment income | 1.18% | 1.00% | 1.68% | 3.99% | 6.18% |
Supplemental Data | | | | | |
Net assets, end of period (000 omitted) | $ 1,392,449 | $ 1,817,440 | $ 2,705,069 | $ 2,753,379 | $ 2,233,342 |
A Total returns do not reflect charges attributable to your insurance company's separate account. Inclusion of these charges would reduce the total returns shown.
B Total returns would have been lower had certain expenses not been reduced during the periods shown.
C Expense ratios reflect operating expenses of the class. Expenses before reductions do not reflect amounts reimbursed by the investment adviser or reductions from brokerage service arrangements or other expense offset arrangements and do not represent the amount paid by the class during periods when reimbursements or reductions occur. Expenses net of any voluntary waivers reflect expenses after reimbursement by the investment adviser but prior to reductions from brokerage service arrangements or other expense offset arrangements. Expenses net of all reductions represent the net expenses paid by the class.
Financial Highlights - Service Class
Years ended December 31, | 2004 | 2003 | 2002 | 2001 | 2000 E |
Selected Per-Share Data | | | | | |
Net asset value, beginning of period | $ 1.00 | $ 1.00 | $ 1.00 | $ 1.00 | $ 1.00 |
Income from Investment Operations | | | | | |
Net investment income | .011 | .009 | .016 | .040 | .031 |
Distributions from net investment income | (.011) | (.009) | (.016) | (.040) | (.031) |
Net asset value, end of period | $ 1.00 | $ 1.00 | $ 1.00 | $ 1.00 | $ 1.00 |
Total Return B, C, D | 1.10% | .90% | 1.61% | 4.10% | 3.06% |
Ratios to Average Net Assets F | | | | | |
Expenses before expense reductions | .40% | .38% | .39% | .39% | .47% A |
Expenses net of voluntary waivers, if any | .40% | .38% | .39% | .39% | .45% A |
Expenses net of all reductions | .40% | .38% | .39% | .39% | .45% A |
Net investment income | 1.08% | .91% | 1.58% | 3.87% | 6.28% A |
Supplemental Data | | | | | |
Net assets, end of period (000 omitted) | $ 13,905 | $ 19,606 | $ 8,017 | $ 6,143 | $ 103 |
A Annualized
B Total returns for periods of less than one year are not annualized.
C Total returns do not reflect charges attributable to your insurance company's separate account. Inclusion of these charges would reduce the total returns shown.
D Total returns would have been lower had certain expenses not been reduced during the periods shown.
E For the period July 7, 2000 (commencement of sale of shares) to December 31, 2000.
F Expense ratios reflect operating expenses of the class. Expenses before reductions do not reflect amounts reimbursed by the investment adviser or reductions from brokerage service arrangements or other expense offset arrangements and do not represent the amount paid by the class during periods when reimbursements or reductions occur. Expense ratios before reductions for start-up periods may not be representative of longer-term operating periods. Expenses net of any voluntary waivers reflect expenses after reimbursement by the investment adviser but prior to reductions from brokerage service arrangements or other expense offset arrangements. Expenses net of all reductions represent the net expenses paid by the class.
See accompanying notes which are an integral part of the financial statements.
Annual Report
Financial Highlights - Service Class 2
Years ended December 31, | 2004 | 2003 | 2002 | 2001 | 2000 E |
Selected Per-Share Data | | | | | |
Net asset value, beginning of period | $ 1.00 | $ 1.00 | $ 1.00 | $ 1.00 | $ 1.00 |
Income from Investment Operations | | | | | |
Net investment income | .009 | .007 | .014 | .039 | .058 |
Distributions from net investment income | (.009) | (.007) | (.014) | (.039) | (.058) |
Net asset value, end of period | $ 1.00 | $ 1.00 | $ 1.00 | $ 1.00 | $ 1.00 |
Total Return B, C, D | .95% | .75% | 1.45% | 3.96% | 5.89% |
Ratios to Average Net Assets F | | | | | |
Expenses before expense reductions | .55% | .54% | .54% | .55% | .96% A |
Expenses net of voluntary waivers, if any | .55% | .54% | .54% | .55% | .60% A |
Expenses net of all reductions | .55% | .54% | .54% | .55% | .60% A |
Net investment income | .93% | .75% | 1.43% | 3.71% | 5.94% A |
Supplemental Data | | | | | |
Net assets, end of period (000 omitted) | $ 20,899 | $ 3,068 | $ 47,604 | $ 40,267 | $ 108 |
A Annualized
B Total returns for periods of less than one year are not annualized.
C Total returns do not reflect charges attributable to your insurance company's separate account. Inclusion of these charges would reduce the total returns shown.
D Total returns would have been lower had certain expenses not been reduced during the periods shown.
E For the period January 12, 2000 (commencement of sale of shares) to December 31, 2000.
F Expense ratios reflect operating expenses of the class. Expenses before reductions do not reflect amounts reimbursed by the investment adviser or reductions from brokerage service arrangements or other expense offset arrangements and do not represent the amount paid by the class during periods when reimbursements or reductions occur. Expense ratios before reductions for start-up periods may not be representative of longer-term operating periods. Expenses net of any voluntary waivers reflect expenses after reimbursement by the investment adviser but prior to reductions from brokerage service arrangements or other expense offset arrangements. Expenses net of all reductions represent the net expenses paid by the class.
See accompanying notes which are an integral part of the financial statements.
Money Market Portfolio
Notes to Financial Statements
For the period ended December 31, 2004
1. Significant Accounting Policies.
Money Market Portfolio (the fund) is a fund of Variable Insurance Products Fund. Asset Manager: Growth Portfolio and Investment Grade Bond Portfolio (the funds) are funds of Variable Insurance Products Fund II. Balanced Portfolio, Growth & Income Portfolio, Growth Opportunities Portfolio, and Mid Cap Portfolio (the funds) are funds of Variable Insurance Products Fund III. The Variable Insurance Products Fund, Variable Insurance Products Fund II, and Variable Insurance Products Fund III (the trusts) (referred to in this report as Fidelity Variable Insurance Products) are registered under the Investment Company Act of 1940, as amended (the 1940 Act), as open-end management investment companies organized as Massachusetts business trusts. Certain funds may invest in affiliated fixed income and money market central funds (underlying funds) managed by affiliates of Fidelity Management & Research Company (FMR). Each fund is authorized to issue an unlimited number of shares. Shares of each fund may only be purchased by insurance companies for the purpose of funding variable annuity or variable life insurance contracts. Each fund offers three classes of shares: Initial Class shares, Service Class shares and Service Class 2 shares. All classes have equal rights and voting privileges, except for matters affecting a single class. Investment income, realized and unrealized capital gains and losses, the common expenses of the fund, and certain fund-level expense reductions, if any, are allocated on a pro rata basis to each class based on the relative net assets of each class to the total net assets of the fund. Each class differs with respect to distribution and service plan fees incurred. Certain expense reductions also differ by class.
The financial statements have been prepared in conformity with accounting principles generally accepted in the United States of America, which require management to make certain estimates and assumptions at the date of the financial statements. The following summarizes the significant accounting policies of the funds and underlying funds (funds):
Security Valuation. Net asset value per share (NAV calculation) is calculated as of the close of business of the New York Stock Exchange, normally 4:00 p.m. Eastern time. Equity securities, including restricted securities, for which market quotations are available are valued at the last sale price or official closing price (closing bid price or last evaluated quote if no sale has occurred) on the primary market or exchange on which they trade. Debt securities, including restricted securities, for which quotations are readily available are valued at their most recent bid prices (sales prices if the principal market is an exchange) in the principal market in which such securities are normally traded, as determined by recognized dealers in such securities, or securities are valued on the basis of information provided by a pricing service. Pricing services use valuation matrices that incorporate both dealer-supplied valuations and valuation models. If prices are not readily available or do not accurately reflect fair value for a security, or if a security's value has been materially affected by events occurring after the close of the exchange or market on which the security is principally traded, that security may be valued by another method that the Board of Trustees believes accurately reflects fair value. A security's valuation may differ depending on the method used for determining value. Price movements in futures contracts and ADRs, market and trading trends, the bid/ask quotes of brokers and off-exchange institutional trading may be reviewed in the course of making a good faith determination of a security's fair value. Short-term securities with remaining maturities of sixty days or less for which quotations are not readily available are valued on the basis of amortized cost. Investments in open-end investment companies, including underlying funds, are valued at their net asset value each business day.
As permitted under Rule 2a-7 of the 1940 Act, and certain conditions therein, securities are valued initially at cost and thereafter assume a constant amortization to maturity of any discount or premium.
Foreign Currency. Certain funds may use foreign currency contracts to facilitate transactions in foreign-denominated securities. Losses from these transactions may arise from changes in the value of the foreign currency or if the counterparties do not perform under the contracts' terms.
Foreign-denominated assets, including investment securities, and liabilities are translated into U.S. dollars at the exchange rate at period end. Purchases and sales of investment securities, income and dividends received and expenses denominated in foreign currencies are translated into U.S. dollars at the exchange rate in effect on the transaction date.
The effects of exchange rate fluctuations on investments are included with the net realized and unrealized gain (loss) on investment securities. Other foreign currency transactions resulting in realized and unrealized gain (loss) are disclosed separately.
Investment Transactions and Income. Security transactions, including purchases and sales of the underlying funds, are accounted for as of trade date. Gains and losses on securities sold are determined on the basis of identified cost and may include proceeds received from litigation. Dividend income is recorded on the ex-dividend date, except for certain dividends from foreign securities where the ex-dividend date may have passed, which are recorded as soon as the funds are informed of the ex-dividend date. Non-cash dividends included in dividend income, if any, are recorded at the fair market value of the securities received. Distributions received on securities that represent a return of capital or capital gain are recorded as a reduction of cost of investments and/or as a realized gain. The funds estimate the components of distributions received that may be considered return of capital distributions or capital gain distributions for income tax purposes. Large, non-recurring dividends recognized by the funds are presented separately on the Statement of Operations as "Special Dividends" and the impact of these dividends to net investment income per share is presented in the Financial Highlights. Interest income is accrued as earned. Interest income includes coupon interest and amortization of premium and accretion of discount on debt securities. Inflation-indexed bonds are fixed-income securities whose principal value is periodically adjusted according to the rate of inflation. Interest is accrued based on the principal value which is adjusted for inflation. Any increase in the principal amount of an inflation-indexed bond is recorded as interest income, even though the principal is not received until maturity. Investment income is recorded net of foreign taxes withheld where recovery of such taxes is uncertain.
Annual Report
Notes to Financial Statements - continued
1. Significant Accounting Policies - continued
Reclassification of Financial Information. As the result of a correction made for Mid Cap Portfolio in the classification of distributions received on securities representing realized gains for the year ended December 31, 2003, amounts previously reported have been reclassified. Net investment loss for the fund decreased by $669,090, with a corresponding decrease to net realized gain. The reclassification has no impact on total net assets or total return of the fund.
Expenses. Most expenses of each trust can be directly attributed to a fund. Expenses which cannot be directly attributed are apportioned among each fund in the trust.
Deferred Trustee Compensation. Under a Deferred Compensation Plan (the Plan) non-interested Trustees must defer receipt of a portion of, and may elect to defer receipt of an additional portion of, their annual compensation. Deferred amounts are treated as though equivalent dollar amounts had been invested in a cross-section of other Fidelity funds, and are marked-to-market. Deferred amounts remain in the fund until distributed in accordance with the Plan.
Income Tax Information and Distributions to Shareholders. Each year, each fund intends to qualify as a regulated investment company by distributing all of its taxable income and realized gains under Subchapter M of the Internal Revenue Code. As a result, no provision for income taxes is required in the accompanying financial statements. Foreign taxes are provided for based on each fund's understanding of the tax rules and rates that exist in the foreign markets in which it invests.
For Money Market Portfolio and Investment Grade Bond Portfolio, dividends are declared daily and paid monthly from net investment income and distributions from realized gains, if any, are recorded on the ex-dividend date. Distribution from net investment income and realized gains are recorded on the ex-dividend date for all other funds. Income dividends and capital gain distributions are declared separately for each class. Income and capital gain distributions are determined in accordance with income tax regulations, which may differ from generally accepted accounting principles.
Capital accounts within the financial statements are adjusted for permanent book-tax differences. These adjustments have no impact on net assets or the results of operations. There were no significant book-to-tax differences during the period for the Money Market Portfolio. Temporary book-tax differences will reverse in a subsequent period.
Book-tax differences are primarily due to futures transactions, swap agreements, foreign currency transactions, passive foreign investment companies (PFIC), prior period premium and discount on debt securities, defaulted bonds, market discount, partnerships, non-taxable dividends, net operating losses, financing transactions, capital loss carryforwards and losses deferred due to wash sales.
The tax-basis components of distributable earnings and the federal tax cost as of period end were as follows for each fund:
| Cost for Federal
Income Tax Purposes | Unrealized
Appreciation | Unrealized
Depreciation | Net Unrealized
Appreciation/
(Depreciation) |
Asset Manager: Growth | $ 290,518,932 | $ 41,086,675 | $ (12,210,961) | $ 28,875,714 |
Balanced | 330,350,599 | 41,868,386 | (6,030,299) | 35,838,087 |
Growth & Income | 1,454,054,880 | 251,148,239 | (54,167,320) | 196,980,919 |
Growth Opportunities | 580,239,414 | 165,058,633 | (9,887,045) | 155,171,588 |
Investment Grade Bond | 1,847,686,450 | 30,842,152 | (5,060,033) | 25,782,119 |
Mid Cap | 2,884,816,139 | 1,164,223,599 | (20,489,077) | 1,143,734,522 |
| Undistributed
Ordinary Income | Undistributed
Long-term
Capital Gain | Capital Loss
Carryforward |
Asset Manager: Growth | $ 7,055,920 | $ - | $ (68,821,848) |
Balanced | 8,901,487 | - | (11,446,067) |
Growth & Income | 22,456,038 | - | (160,503,421) |
Growth Opportunities | 6,118,258 | - | (265,681,565) |
Investment Grade Bond | 68,789,164 | 24,161,221 | - |
Mid Cap | - | 68,763,219 | - |
Annual Report
1. Significant Accounting Policies - continued
Income Tax Information and Distributions to Shareholders - continued
The tax character of distributions paid was as follows:
December 31, 2004 | | | |
| Ordinary Income | Long-term
Capital Gains | Total |
Asset Manager: Growth | $ 7,897,225 | $ - | $ 7,897,225 |
Balanced | 6,988,389 | - | 6,988,389 |
Growth & Income | 12,447,351 | - | 12,447,351 |
Growth Opportunities | 3,865,122 | - | 3,865,122 |
Investment Grade Bond | 97,273,775 | 17,608,424 | 114,882,199 |
December 31, 2003 | | | |
| Ordinary Income | Long-term
Capital Gains | Total |
Asset Manager: Growth | $ 8,995,679 | $ - | $ 8,995,679 |
Balanced | 7,974,845 | - | 7,974,845 |
Growth & Income | 12,772,749 | - | 12,772,749 |
Growth Opportunities | 4,842,328 | - | 4,842,328 |
Investment Grade Bond | 101,912,282 | 9,272,230 | 111,184,512 |
Mid Cap | 5,082,393 | - | 5,082,393 |
2. Operating Policies.
Repurchase Agreements. FMR has received an Exemptive Order from the Securities and Exchange Commission (the SEC) which permits the funds and other affiliated entities of FMR to transfer uninvested cash balances into joint trading accounts. These accounts are then invested in repurchase agreements that are collateralized by U.S. Treasury or Government obligations. Certain funds may also invest directly with institutions, in repurchase agreements that are collateralized by commercial paper obligations, corporate obligations and mortgage loan obligations which may be below investment-grade quality, and equity securities. Collateral is held in segregated accounts with custodian banks and may be obtained in the event of a default of the counterparty. Collateral is marked-to-market daily and maintained at a value at least equal to the principal amount of the repurchase agreement (including accrued interest).
Delayed Delivery Transactions and When-Issued Securities. Each fund may purchase or sell securities on a delayed delivery or when-issued basis. Payment and delivery may take place after the customary settlement period for that security. The price of the underlying securities and the date when the securities will be delivered and paid for are fixed at the time the transaction is negotiated. During the time a delayed delivery sell is outstanding, the contract is marked-to-market daily and equivalent deliverable securities are held for the transaction. The value of the securities purchased on a delayed delivery or when-issued basis are identified as such in each applicable fund's Schedule of Investments. Each fund may receive compensation for interest forgone in the purchase of a delayed delivery or when-issued security. With respect to purchase commitments, each fund identifies securities as segregated in its records with a value at least equal to the amount of the commitment. The payables and receivables associated with the purchases and sales of delayed delivery securities having the same coupon, settlement date and broker are offset. Delayed delivery or when-issued securities that have been purchased from and sold to different brokers are reflected as both payables and receivables in each applicable funds' Statements of Assets and Liabilities under the caption "Delayed delivery." Losses may arise due to changes in the value of the underlying securities or if the counterparty does not perform under the contract's terms, or if the issuer does not issue the securities due to political, economic, or other factors.
Futures Contracts. Certain funds may use futures contracts to manage their exposure to the stock market. Buying futures tends to increase a fund's exposure to the underlying instrument, while selling futures tends to decrease a fund's exposure to the underlying instrument or hedge other fund investments. Futures contracts involve, to varying degrees, risk of loss in excess of any futures variation margin reflected in each applicable fund's Statement of Assets and Liabilities. The underlying face amount at value of any open futures contracts at period end is shown in each applicable fund's Schedule of Investments under the caption "Futures Contracts." This amount reflects each contract's exposure to the underlying instrument at period end. Losses may arise from changes in the value of the underlying instruments or if the counterparties do not perform under the contracts' terms. Gains (losses) are realized upon the expiration or closing of the futures contracts. Futures contracts are valued at the settlement price established each day by the board of trade or exchange on which they are traded.
Restricted Securities. Certain funds may invest in securities that are subject to legal or contractual restrictions on resale. These securities generally may be resold in transactions exempt from registration or to the public if the securities are registered. Disposal of these securities may involve time-consuming negotiations and expense, and prompt sale at an acceptable price may be difficult. Information regarding restricted securities is included at the end of each applicable fund's Schedule of Investments.
Annual Report
Notes to Financial Statements - continued
2. Operating Policies - continued
Loans and Other Direct Debt Instruments. Certain funds may invest in loans and loan participations, trade claims or other receivables. These investments may include standby financing commitments, including revolving credit facilities, that obligate the fund to supply additional cash to the borrower on demand. Loan participations involve a risk of insolvency of the lending bank or other financial intermediary. A fund may be contractually obligated to receive approval from the agent bank and/or borrower prior to the sale of these investments.
Swap Agreements. Certain funds may invest in swaps for the purpose of managing their exposure to interest rate, credit or market risk.
Interest rate swaps are agreements to exchange cash flows periodically based on a notional principal amount, for example, the exchange of fixed rate interest payments for floating rate interest payments. Periodic payments received or made by each applicable fund are recorded in the accompanying Statement of Operations as realized gains or losses, respectively. The primary risk associated with interest rate swaps is that unfavorable changes in the fluctuation of interest rates could adversely impact each applicable fund.
Total return swaps are agreements to exchange the return generated by one instrument for the return generated by another instrument, for example, the agreement to pay interest in exchange for a market-linked return based on a notional amount. To the extent the total return of the index exceeds the offsetting interest obligation, each applicable fund will receive a payment from the counterparty. To the extent it is less, each applicable fund will make a payment to the counterparty. Periodic payments received or made by each applicable fund are recorded in the accompanying Statement of Operations as realized gains or losses, respectively.
Credit default swaps involve the exchange of a fixed rate premium for protection against the loss in value of an underlying debt instrument in the event of a defined credit event (such as payment default or bankruptcy). Under the terms of the swap, one party acts as a "guarantor" receiving a periodic payment that is a fixed percentage applied to a notional principal amount. In return the party agrees to purchase the notional amount of the underlying instrument, at par, if a credit event occurs during the term of the swap. Each applicable fund may enter into credit default swaps in which the fund or its counterparty act as guarantors. By acting as the guarantor of a swap, the fund assumes the market and credit risk of the underlying instrument including liquidity and loss of value. Periodic payments and premiums received or made by each applicable fund are recorded in the accompanying Statement of Operations as realized gains or losses, respectively .
Swaps are marked-to-market daily based on dealer-supplied valuations and changes in value are recorded as unrealized appreciation (depreciation). Gains or losses are realized upon early termination of the swap agreement. Collateral, in the form of cash or securities, may be required to be held in segregated accounts with each applicable fund's custodian in compliance with swap contracts. Risks may exceed amounts recognized on the Statement of Assets and Liabilities. These risks include changes in the returns of the underlying instruments, failure of the counterparties to perform under the contracts' terms and the possible lack of liquidity with respect to the swap agreements. Details of swap agreements open at period end are included in each applicable fund's Schedule of Investments under the caption "Swap Agreements."
Mortgage Dollar Rolls. To earn additional income, certain funds may employ trading strategies which involve the sale and simultaneous agreement to repurchase similar securities ("mortgage dollar rolls") or the purchase and simultaneous agreement to sell similar securities ("reverse mortgage dollar rolls"). The securities traded are mortgage securities and bear the same interest rate but may be collateralized by different pools of mortgages. During the period between the sale and repurchase in a mortgage dollar roll transaction, a fund will not be entitled to receive interest and principal payments on the securities sold but will invest the proceeds of the sale in other securities which may enhance the yield and total return. In addition, the difference between the sale price and the future purchase price is recorded as an adjustment to investment income. During the period between the purchase and subsequent sale in a reverse mortgage dollar roll transaction a fund is entitled to interest and principal payments on the securities purchased. The price differential between the purchase and sale is recorded as an adjustment to investment income. Losses may arise due to changes in the value of the securities or if the counterparty does not perform under the terms of the agreement. If the counterparty files for bankruptcy or becomes insolvent, the fund's right to repurchase or sell securities may be limited.
3. Purchases and Sales of Investments.
Purchases and sales of securities, other than short-term securities and U.S. government securities, and in-kind transactions are noted in the table below.
| Purchases ($) | Sales ($) |
Asset Manager: Growth | 137,932,727 | 172,380,243 |
Balanced | 65,426,083 | 83,095,686 |
Growth & Income | 420,135,989 | 322,208,324 |
Growth Opportunities | 462,835,321 | 533,581,152 |
Investment Grade Bond | 221,392,385 | 326,031,847 |
Mid Cap | 2,400,817,321 | 1,622,172,637 |
Annual Report
4. Fees and Other Transactions with Affiliates.
Management Fee. FMR and its affiliates provide the funds with investment management related services for which the funds pay a monthly management fee.
For all funds except the Money Market Portfolio, the management fee is the sum of an individual fund fee rate applied to the average net assets of each fund and a group fee rate. The group fee rates differ for equity and fixed-income funds and are each based upon the average net assets of all the mutual funds advised by FMR. The group fee rates decrease as assets under management increase and increase as assets under management decrease. The annual individual fund fee rate is .30% of the fund's average net assets for Asset Manager: Growth, Growth Opportunities, Investment Grade Bond, and Mid Cap Portfolios, .20% for Growth & Income Portfolio, and .15% for Balanced Portfolio. The group fee rates averaged .28% for the equity funds and .13% for the fixed-income funds during the period.
For the Money Market Portfolio, the management fee is calculated on the basis of a group fee rate plus a total income-based component. The group fee rate averaged .13% during the period. The total income-based component is calculated according to a graduated schedule providing for different rates based on the fund's gross annualized yield. The rate increases as the fund's gross yield increases. During the period the income-based portion of the management fee was $1,173,053 or an annual rate of.07% of the fund's average net assets.
For the period, each fund's total annual management fee rate, expressed as a percentage of each fund's average net assets, was as follows:
Asset Manager: Growth | .58% | |
Balanced | .42% | |
Growth & Income | .47% | |
Growth Opportunities | .58% | |
Investment Grade Bond | .43% | |
Mid Cap | .57% | |
Money Market | .20% | |
Distribution and Service Plan. In accordance with Rule 12b-1 of the 1940 Act, the funds have adopted separate 12b-1 Plans for each Service Class of shares. Each Service Class pays Fidelity Distributors Corporation (FDC), an affiliate of FMR, a service fee. For the period, the service fee is based on an annual rate of .10% of Service Class' average net assets and .25% of Service Class 2's average net assets.
For the period, each class paid FDC the following amounts, all of which were re-allowed to insurance companies for the distribution of shares and providing shareholder support services:
| Service Class | Service Class 2 | Total |
Asset Manager: Growth | $ 6,290 | $ 16,930 | $ 23,220 |
Balanced | 21,241 | 82,529 | 103,770 |
Growth & Income | 377,024 | 1,085,899 | 1,462,923 |
Growth Opportunities | 215,230 | 146,444 | 361,674 |
Investment Grade Bond | 36,362 | 365,989 | 402,351 |
Mid Cap | 665,057 | 3,940,232 | 4,605,289 |
Money Market | 22,272 | 21,600 | 43,872 |
Transfer Agent Fees. Fidelity Investment Institutional Operations Company, Inc. (FIIOC), an affiliate of FMR, is the funds' transfer, dividend disbursing and shareholder servicing agent. FIIOC receives an asset-based fee with respect to each account. FIIOC pays a portion of the expenses related to the typesetting, printing and mailing of shareholder reports, except proxy statements. Each class pays a transfer agent fee, excluding out of pocket expenses, equal to an annual rate of .07% of their month end net assets. For the period, the total transfer agent fees paid by each class to FIIOC, including out of pocket expenses were as follows:
Asset Manager: Growth |
| |
Initial Class | $ 217,846 | |
Service Class | 6,137 | |
Service Class 2 | 8,819 | |
| $ 232,802 | |
Balanced |
| |
Initial Class | $ 198,193 | |
Service Class | 15,788 | |
Service Class 2 | 24,958 | |
| $ 238,939 | |
Annual Report
Notes to Financial Statements - continued
4. Fees and Other Transactions with Affiliates - continued
Transfer Agent Fees - continued
Growth & Income |
| |
Initial Class | $ 489,424 | |
Service Class | 252,242 | |
Service Class 2 | 297,002 | |
| $ 1,038,668 | |
Growth Opportunities |
| |
Initial Class | $ 312,303 | |
Service Class | 147,098 | |
Service Class 2 | 47,905 | |
| $ 507,306 | |
Investment Grade Bond |
| |
Initial Class | $ 952,891 | |
Service Class | 25,231 | |
Service Class 2 | 104,884 | |
| $ 1,083,006 | |
Mid Cap |
| |
Initial Class | $ 517,432 | |
Service Class | 449,572 | |
Service Class 2 | 1,077,978 | |
| $ 2,044,982 | |
Money Market |
| |
Initial Class | $ 1,087,334 | |
Service Class | 15,939 | |
Service Class 2 | 6,150 | |
| $ 1,109,423 | |
Accounting and Security Lending Fees. Fidelity Service Company, Inc. (FSC), an affiliate of FMR, maintains each fund's accounting records. The accounting fee is based on the level of average net assets for the month. Under a separate contract, FSC administers the security lending program. The security lending fee is based on the number and duration of lending transactions.
Central Funds. The funds may invest in affiliated Central Funds managed by Fidelity Investments Money Management, Inc. (FIMM) or Fidelity Management and Research Co., Inc. (FMRC), affiliates of FMR. The Central Funds are open-end investment companies available only to investment companies and other accounts managed by FMR and its affiliates. The Money Market central funds seek preservation of capital and current income. The Floating Rate Central Investment Portfolio seeks a high level of current income. The High Income Central Investment Portfolio 1 seeks a high level of income and may also seek capital appreciation. The central funds do not pay a management fee. Income distributions earned by the funds are recorded as income in the accompanying financial statements. Distributions from the Central Funds are noted in the table below:
| Income Distributions | |
Asset Manager: Growth | $ 765,242 | |
Balanced | 664,370 | |
Growth & Income | 2,003,509 | |
Growth Opportunities | 367,174 | |
Investment Grade Bond | 3,767,633 | |
Mid Cap | 803,656 | |
Market value of securities delivered on an in-kind basis, in a non-taxable exchange, for 227,807 shares of the Fidelity High Income Central Investment Portfolio 1 aggregated $22,780,664 during the period for Asset Manager: Growth Portfolio.
Brokerage Commissions. Certain funds placed a portion of their portfolio transactions with brokerage firms which are affiliates of the investment adviser. The commissions paid to these affiliated firms were as follows:
| Amount | |
Asset Manager: Growth | $ 2,773 | |
Balanced | 4,134 | |
Growth & Income | 28,868 | |
Growth Opportunities | 24,963 | |
Mid Cap | 171,170 | |
Annual Report
4. Fees and Other Transactions with Affiliates - continued
Interfund Lending Program. Pursuant to an Exemptive Order issued by the SEC, the funds, along with other registered investment companies having management contracts with FMR, may participate in an interfund lending program. This program provides an alternative credit facility allowing the funds to borrow from, or lend money to, other participating funds. Each applicable fund's activity in this program during the period was as follows:
| Borrower or Lender | Average Daily
Loan Balance | Weighted Average
Interest Rate | Interest Earned
(included in interest income) | Interest Expense |
Mid Cap | Borrower | $ 11,369,500 | 1.12% | - | $ 709 |
Money Market | Lender | 8,038,737 | 1.25% | $ 5,311 | - |
5. Committed Line of Credit.
Certain funds participate with other funds managed by FMR in a $4.2 billion credit facility (the "line of credit") to be utilized for temporary or emergency purposes to fund shareholder redemptions or for other short-term liquidity purposes. The participating funds have agreed to pay commitment fees on their pro rata portion of the line of credit. During the period, there were no borrowings on this line of credit.
6. Security Lending.
Certain funds lend portfolio securities from time to time in order to earn additional income. Each applicable fund receives collateral (in the form of U.S. Treasury obligations, letters of credit and/or cash) against the loaned securities and maintains collateral in an amount not less than 100% of the market value of the loaned securities during the period of the loan. The market value of the loaned securities is determined at the close of business of the funds and any additional required collateral is delivered to the funds on the next business day. If the borrower defaults on its obligation to return the securities loaned because of insolvency or other reasons, a fund could experience delays and costs in recovering the securities loaned or in gaining access to the collateral. Cash collateral is invested in cash equivalents. The value of loaned securities and cash collateral at period end are disclosed on each applicable fund's Statement of Assets and Liabilities.
7. Expense Reductions.
Many of the brokers with whom FMR places trades on behalf of certain funds provided services to these funds in addition to trade execution. These services included payments of expenses on behalf of each applicable fund. In addition, through arrangements with each applicable fund's custodian, credits realized as a result of uninvested cash balances were used to reduce the fund's expenses. All of the applicable expense reductions are noted in the table below.
| Brokerage Service Arrangement | Custody expense
reduction |
Asset Manager: Growth | $ 37,214 | $ 863 |
Balanced | 13,097 | 367 |
Growth & Income | 105,306 | - |
Growth Opportunities | 139,311 | 180 |
Investment Grade Bond | - | 3,322 |
Mid Cap | 739,274 | 3,283 |
Money Market | - | 504 |
8. Other Information.
At the end of the period, FMR or its affiliates and certain otherwise unaffiliated shareholders each were owners of record of more than 10% of the outstanding shares of the following funds:
Fund | Affiliated % | Number of
Unaffiliated
Shareholders | Unaffiliated
Shareholders % |
Asset Manager: Growth | 69% | - | - |
Balanced | 62% | 1 | 22% |
Growth & Income | 20% | 1 | 48% |
Growth Opportunities | 22% | 1 | 44% |
Investment Grade Bond | 45% | 1 | 13% |
Mid Cap | 19% | 2 | 42% |
Money Market | 62% | 1 | 14% |
Annual Report
Report of Independent Registered Public Accounting Firm
To the Trustees of Variable Insurance Products Fund III and the Shareholders of Mid Cap Portfolio:
In our opinion, the accompanying statement of assets and liabilities, including the schedule of investments, and the related statements of operations and of changes in net assets and the financial highlights present fairly, in all material respects, the financial position of Mid Cap Portfolio (a fund of Variable Insurance Products Fund III) at December 31, 2004 and the results of its operations, the changes in its net assets and the financial highlights for the periods indicated, in conformity with accounting principles generally accepted in the United States of America. These financial statements and financial highlights (hereafter referred to as "financial statements") are the responsibility of the Mid Cap Portfolio's management; our responsibility is to express an opinion on these financial statements based on our audits. We conducted our audits of these financial statements in accordance with the standards of the Public Company Accounting Oversight Board (United States). Those standards require that we plan and perform the audit to obtain reasonable assurance about whether the financial statements are free of material misstatement. An audit includes examining, on a test basis, evidence supporting the amounts and disclosures in the financial statements, assessing the accounting principles used and significant estimates made by management, and evaluating the overall financial statement presentation. We believe that our audits, which included confirmation of securities at December 31, 2004 by correspondence with the custodian and brokers, provide a reasonable basis for our opinion.
/s/PricewaterhouseCoopers LLP
PricewaterhouseCoopers LLP
Boston, Massachusetts
February 10, 2005
Annual Report
Report of Independent Registered Public Accounting Firm
To the Trustees of Variable Insurance Products Fund and the Shareholders of Money Market Portfolio:
In our opinion, the accompanying statement of assets and liabilities, including the schedule of investments, and the related statements of operations and of changes in net assets and the financial highlights present fairly, in all material respects, the financial position of Money Market Portfolio (a fund of Variable Insurance Products Fund) at December 31, 2004 and the results of its operations, the changes in its net assets and the financial highlights for the periods indicated, in conformity with accounting principles generally accepted in the United States of America. These financial statements and financial highlights (hereafter referred to as "financial statements") are the responsibility of the Money Market Portfolio's management; our responsibility is to express an opinion on these financial statements based on our audits. We conducted our audits of these financial statements in accordance with the standards of the Public Company Accounting Oversight Board (United States). Those standards require that we plan and perform the audit to obtain reasonable assurance about whether the financial statements are free of material misstatement. An audit includes examining, on a test basis, evidence supporting the amounts and disclosures in the financial statements, assessing the accounting principles used and significant estimates made by management, and evaluating the overall financial statement presentation. We believe that our audits, which included confirmation of securities at December 31, 2004 by correspondence with the custodian and brokers, provide a reasonable basis for our opinion.
/s/PricewaterhouseCoopers LLP
PricewaterhouseCoopers LLP
Boston, Massachusetts
February 14, 2005
Annual Report
Report of Independent Registered Public Accounting Firm
To the Trustees of Variable Insurance Products Fund III and Shareholders of Growth Opportunities Portfolio:
We have audited the accompanying statements of assets and liabilities of Growth Opportunities Portfolio (the Fund), fund of Variable Insurance Products III, including the portfolios of investments, as of December 31, 2004, and the related statements of operations for the year then ended, the statements of changes in net assets for each of the two years in the period then ended, and the financial highlights for each of the five years in the period then ended. These financial statements and financial highlights are the responsibility of the Fund's management. Our responsibility is to express an opinion on these financial statements and financial highlights based on our audits.
We conducted our audits in accordance with standards of the Public Company Accounting Oversight Board (United States). Those standards require that we plan and perform the audit to obtain reasonable assurance about whether the financial statements and financial highlights are free of material misstatement. An audit includes consideration of internal control over financial reporting as a basis for designing audit procedures that are appropriate in the circumstances, but not for the purpose of expressing an opinion on the effectiveness of the Fund's internal control over financial reporting. Accordingly, we express no such opinion. An audit also includes examining, on a test basis, evidence supporting the amounts and disclosures in the financial statements, assessing the accounting principles used and significant estimates made by management, as well as evaluating the overall financial statement presentation. Our procedures included confirmation of securities owned as of December 31, 2004, by correspondence with the custodians and brokers; where replies were not received from brokers, we performed other auditing procedures. We believe that our audits provide a reasonable basis for our opinion.
In our opinion, the financial statements and financial highlights referred to above present fairly, in all material respects, the financial positions of Growth Opportunities Portfolio as of December 31, 2004, the results of their operations for the year then ended, the changes in their net assets for each of the two years in the period then ended, and their financial highlights for each of the five years in the period then ended, in conformity with accounting principles generally accepted in the United States of America.
/s/DELOITTE & TOUCHE LLP
DELOITTE & TOUCHE LLP
Boston, Massachusetts
February 14, 2005
Annual Report
Report of Independent Registered Public Accounting Firm
To the Trustees of Variable Insurance Products Fund II and Variable Insurance Products Fund III and Shareholders of Asset Manager: Growth Portfolio, Investment Grade Bond Portfolio, Balanced Portfolio and Growth & Income Portfolio:
We have audited the accompanying statements of assets and liabilities of Asset Manager: Growth Portfolio, Investment Grade Bond Portfolio, Balanced Portfolio and Growth & Income Portfolio (the Funds), funds of Variable Insurance Products III, including the portfolios of investments, as of December 31, 2004, and the related statements of operations for the year then ended, the statements of changes in net assets for each of the two years in the period then ended, and the financial highlights for each of the periods presented. These financial statements and financial highlights are the responsibility of the Funds' management. Our responsibility is to express an opinion on these financial statements and financial highlights based on our audits.
We conducted our audits in accordance with standards of the Public Company Accounting Oversight Board (United States). Those standards require that we plan and perform the audit to obtain reasonable assurance about whether the financial statements and financial highlights are free of material misstatement. An audit includes consideration of internal control over financial reporting as a basis for designing audit procedures that are appropriate in the circumstances, but not for the purpose of expressing an opinion on the effectiveness of the Fund's internal control over financial reporting. Accordingly, we express no such opinion. An audit also includes examining, on a test basis, evidence supporting the amounts and disclosures in the financial statements, assessing the accounting principles used and significant estimates made by management, as well as evaluating the overall financial statement presentation. Our procedures included confirmation of securities owned as of December 31, 2004, by correspondence with the custodians and brokers; where replies were not received from brokers, we performed other auditing procedures. We believe that our audits provide a reasonable basis for our opinion.
In our opinion, the financial statements and financial highlights referred to above present fairly, in all material respects, the financial positions of Asset Manager: Growth Portfolio, Investment Grade Bond Portfolio, Balanced Portfolio and Growth & Income Portfolio as of December 31, 2004, the results of their operations for the year then ended, the changes in their net assets for each of the two years in the period then ended, and their financial highlights for each of the periods presented, in conformity with accounting principles generally accepted in the United States of America.
/s/DELOITTE & TOUCHE LLP
DELOITTE & TOUCHE LLP
Boston, Massachusetts
February 18, 2005
Annual Report
Fidelity Floating Rate Central Investment Portfolio
December 31, 2004 (Unaudited)
Top Fifty Holdings (excluding cash equivalents)* |
| Principal
Amount | Value | % of Fund's
Net Assets |
General Growth Properties, Inc. Tranche B, term loan 4.53% 11/12/08 | $ 6,000,000 | $ 6,015,000 | 4.8 |
Lake Las Vegas LLC Tranche 1, term loan 5.1197% 11/1/09 | 4,310,000 | 4,342,325 | 3.5 |
Qwest Corp. Tranche A, term loan 7.39% 6/30/07 | 4,000,000 | 4,170,000 | 3.3 |
UPC Distribution Holdings BV Tranche F, term loan 5.98% 12/31/11 | 4,000,000 | 4,050,000 | 3.2 |
Dex Media West LLC/Dex Media West Finance Co. Tranche B, term loan 4.1033% 9/9/10 | 3,993,293 | 4,043,209 | 3.2 |
El Paso Corp. Credit-Linked Deposit 5.15% 11/22/09 | 4,000,000 | 4,030,000 | 3.2 |
Marina District Finance Co., Inc. term loan 3.93% 10/14/11 | 4,000,000 | 4,030,000 | 3.2 |
R.H. Donnelley Corp. Tranche B2, term loan 4.3086% 6/30/11 | 3,965,788 | 4,005,446 | 3.2 |
PacifiCare Health Systems, Inc. Tranche B, term loan 4.1618% 12/6/10 | 4,000,000 | 4,000,000 | 3.2 |
Nexstar Broadcasting, Inc. Tranche D, term loan 4.31% 12/31/10 | 3,989,975 | 3,999,975 | 3.2 |
Starwood Hotels & Resorts Worldwide, Inc. term loan 3.67% 10/9/06 | 3,666,667 | 3,666,667 | 2.9 |
Smurfit-Stone Container Enterprises, Inc. Tranche B, term loan 4.5208% 11/1/11 | 3,489,621 | 3,537,603 | 2.8 |
Vicar Operating, Inc. Tranche F, term loan 4.1875% 9/30/08 | 3,100,000 | 3,119,375 | 2.5 |
RailAmerica, Inc. term loan 4.375% 9/29/11 | 3,000,000 | 3,052,500 | 2.4 |
Constellation Brands, Inc. Tranche B, term loan 4.5866% 12/22/11 | 3,000,000 | 3,037,500 | 2.4 |
Texas Genco LLC term loan 4.48% 12/14/11 | 3,000,000 | 3,033,750 | 2.4 |
Lamar Media Corp. Tranche C, term loan 4.0625% 6/30/10 | 3,000,000 | 3,030,000 | 2.4 |
ON Semiconductor Corp. Tranche G, term loan 5.5625% 12/15/11 | 3,000,000 | 3,007,500 | 2.4 |
HCA, Inc. term loan 3.42% 11/9/09 | 3,000,000 | 2,992,500 | 2.4 |
Charter Communication Operating LLC Tranche A, term loan 5.13% 4/27/10 | 3,000,000 | 2,981,250 | 2.4 |
Century Cable Holdings LLC Tranche B, term loan 7.25% 6/30/09 | 3,000,000 | 2,977,500 | 2.4 |
Kansas City Southern Railway Co. Tranche B1, term loan 4.0939% 3/30/08 | 2,800,000 | 2,842,000 | 2.3 |
Iron Mountain, Inc. Tranche R, term loan 4.1875% 4/2/11 | 2,500,000 | 2,512,500 | 2.0 |
NRG Energy, Inc. term loan 4.95% 12/24/11 | 2,193,750 | 2,193,750 | 1.8 |
Valor Telecommunications Enterprises LLC Tranche 2, term loan 10.0815% 11/10/11 | 2,000,000 | 2,060,000 | 1.6 |
AM General LLC Tranche B1, term loan 6.759% 11/1/11 | 2,000,000 | 2,040,000 | 1.6 |
Simmons Bedding Co. Tranche C, term loan 4.0535% 12/19/11 | 2,000,000 | 2,030,000 | 1.6 |
Herbalife International, Inc. term loan 4.58% 12/21/10 | 2,000,000 | 2,027,500 | 1.6 |
Reliant Energy, Inc. term loan 4.795% 4/30/10 | 2,000,000 | 2,025,000 | 1.6 |
Advertising Directory Solutions, Inc. Tranche 1, term loan 4.4% 11/9/11 | 2,000,000 | 2,015,000 | 1.6 |
LNR Property Corp. Tranche B, term loan 5.59% 1/31/08 | 2,000,000 | 2,010,000 | 1.6 |
Community Health Systems, Inc. term loan 4.15% 8/19/11 | 1,995,000 | 2,004,975 | 1.6 |
Nextel Communications, Inc. Tranche E, term loan 4.6875% 12/15/10 | 1,994,962 | 1,996,209 | 1.6 |
NRG Energy, Inc. Credit-Linked Deposit 4.325% 12/24/11 | 1,706,250 | 1,708,383 | 1.4 |
Domino's, Inc. term loan 4.3125% 6/25/10 | 1,632,486 | 1,650,852 | 1.3 |
Goodman Global Holdings, Inc. term loan 4.8125% 12/23/11 | 1,220,000 | 1,226,100 | 1.0 |
Smurfit-Stone Container Enterprises, Inc. Tranche C, term loan 4.3958% 11/1/11 | 1,073,729 | 1,088,493 | 0.9 |
Georgia-Pacific Corp. term loan 3.4647% 7/2/09 | 1,000,000 | 998,750 | 0.8 |
Cooper Standard Auto, Inc. Tranche C, term loan 6.25% 12/23/11 | 616,667 | 624,375 | 0.5 |
Landry's Seafood Restaurants, Inc. term loan 4.5276% 12/28/10 | 465,000 | 469,650 | 0.4 |
Smurfit-Stone Container Enterprises, Inc. Credit-Linked Deposit 2.4% 11/1/10 | 436,650 | 442,654 | 0.4 |
Cooper Standard Auto, Inc. Tranche B, term loan 6.25% 12/23/11 | 383,333 | 388,125 | 0.3 |
* The fund commenced operations on December 15, 2004 and holds 42 securities, excluding cash equivalents, which represent 88.9% of the fund's net assets. |
Annual Report
Fidelity High Income Central Investment Portfolio 1
December 31, 2004 (Unaudited)
Top Fifty Holdings (excluding cash equivalents) |
| Principal
Amount | Value | % of Fund's
Net Assets |
Ship Finance International Ltd. 8.5% 12/15/13 | $ 17,800,000 | $ 18,333,983 | 1.7 |
Invensys PLC 9.875% 3/15/11 | 11,735,000 | 12,673,800 | 1.2 |
Teekay Shipping Corp. 8.875% 7/15/11 | 10,780,000 | 12,504,800 | 1.1 |
Micron Technology, Inc. 6.5% 9/30/05 | 11,761,905 | 11,732,500 | 1.1 |
General Maritime Corp. 10% 3/15/13 | 9,940,000 | 11,431,000 | 1.1 |
EchoStar DBS Corp. 5.75% 10/1/08 | 10,505,000 | 10,662,575 | 1.0 |
Celestica, Inc. 7.875% 7/1/11 | 9,430,000 | 10,090,100 | 0.9 |
Millicom International Cellular SA 10% 12/1/13 | 8,805,000 | 9,201,225 | 0.8 |
Western Financial Bank 9.625% 5/15/12 | 8,060,000 | 9,188,400 | 0.8 |
PerkinElmer, Inc. 8.875% 1/15/13 | 7,470,000 | 8,497,125 | 0.8 |
OMI Corp. 7.625% 12/1/13 | 7,645,000 | 8,180,150 | 0.8 |
TFM SA de CV yankee 11.75% 6/15/09 | 8,030,000 | 8,150,450 | 0.8 |
BCP Caylux Holdings Luxembourg SCA 9.625% 6/15/14 | 7,120,000 | 7,974,400 | 0.7 |
Compass Minerals International, Inc. 0% 6/1/13 | 9,175,000 | 7,431,750 | 0.7 |
Gerdau AmeriSteel Corp./GUSAP Partners 10.375% 7/15/11 | 6,015,000 | 7,067,625 | 0.7 |
The Reader's Digest Association, Inc. 6.5% 3/1/11 | 6,610,000 | 6,907,450 | 0.6 |
Qwest Capital Funding, Inc. 7.25% 2/15/11 | 7,055,000 | 6,772,800 | 0.6 |
Wyndham International, Inc. term loan 7.125% 6/30/06 | 6,739,515 | 6,756,364 | 0.6 |
Hanover Compressor Co. 0% 3/31/07 | 7,660,000 | 6,664,200 | 0.6 |
NRG Energy, Inc. 8% 12/15/13 | 5,998,000 | 6,545,318 | 0.6 |
MGM MIRAGE 6% 10/1/09 | 6,360,000 | 6,519,000 | 0.6 |
KB Home 7.75% 2/1/10 | 6,055,000 | 6,509,125 | 0.6 |
Norske Skog Canada Ltd. 8.625% 6/15/11 | 6,065,000 | 6,489,550 | 0.6 |
Tenet Healthcare Corp. 6.375% 12/1/11 | 6,995,000 | 6,435,400 | 0.6 |
Millennium America, Inc. 9.25% 6/15/08 | 5,690,000 | 6,429,700 | 0.6 |
Elan Finance PLC/Elan Finance Corp. 7.75% 11/15/11 | 5,980,000 | 6,398,600 | 0.6 |
Mohegan Tribal Gaming Authority 6.375% 7/15/09 | 6,185,000 | 6,393,744 | 0.6 |
American Real Estate Partners/American Real Estate Finance Corp. 8.125% 6/1/12 | 5,920,000 | 6,312,200 | 0.6 |
Huntsman LLC 9.32% 7/15/11 | 5,660,000 | 6,310,900 | 0.6 |
Wheeling Island Gaming, Inc. 10.125% 12/15/09 | 5,835,000 | 6,214,275 | 0.6 |
General Growth Properties, Inc.: | | | |
Tranche B, term loan 4.53% 11/12/08 | 6,100,000 | 6,115,250 | 0.6 |
Tranche A, term loan 4.53% 11/12/07 | 6,100,000 | 6,100,000 | 0.6 |
Berry Plastics Corp. 10.75% 7/15/12 | 5,310,000 | 6,066,675 | 0.6 |
Astoria Energy LLC term loan 7.1882% 4/15/12 | 5,890,000 | 6,007,800 | 0.6 |
Levi Strauss & Co. 12.25% 12/15/12 | 5,370,000 | 5,960,700 | 0.5 |
Hilton Head Communications LP Tranche B, term loan 6.5% 3/31/08 | 6,050,000 | 5,944,125 | 0.5 |
Sonic Automotive, Inc. 8.625% 8/15/13 | 5,550,000 | 5,938,500 | 0.5 |
CDRV Investors, Inc. 0% 1/1/15 | 9,590,000 | 5,921,825 | 0.5 |
Hilcorp Energy I LP/Hilcorp Finance Co. 10.5% 9/1/10 | 5,205,000 | 5,881,650 | 0.5 |
Riverside Energy Center LLC term loan 6.38% 6/24/11 | 5,793,001 | 5,879,896 | 0.5 |
Wise Metals Group LLC/Alloys Finance 10.25% 5/15/12 | 5,830,000 | 5,830,000 | 0.5 |
Asbury Automotive Group, Inc. 9% 6/15/12 | 5,420,000 | 5,704,550 | 0.5 |
Xerox Corp. 7.125% 6/15/10 | 5,235,000 | 5,653,800 | 0.5 |
Browning-Ferris Industries, Inc. 6.375% 1/15/08 | 5,755,000 | 5,639,900 | 0.5 |
Range Resources Corp. 7.375% 7/15/13 | 5,235,000 | 5,601,450 | 0.5 |
Texas Industries, Inc. 10.25% 6/15/11 | 4,650,000 | 5,487,000 | 0.5 |
Owens-Brockway Glass Container, Inc. 8.875% 2/15/09 | 5,050,000 | 5,479,250 | 0.5 |
U.S. West Capital Funding, Inc. 6.375% 7/15/08 | 5,547,000 | 5,477,663 | 0.5 |
Nextel Communications, Inc. 6.875% 10/31/13 | 4,970,000 | 5,392,450 | 0.5 |
Qwest Capital Funding, Inc. 7% 8/3/09 | 5,440,000 | 5,385,600 | 0.5 |
Top 50 Holdings as a Percentage of Fund's Net Assets - 33.6% |
Annual Report
Trustees and Officers
The Trustees, Member of the Advisory Board, and executive officers of the trusts and funds, as applicable, are listed below. The Board of Trustees governs each fund and is responsible for protecting the interests of shareholders. The Trustees are experienced executives who meet periodically throughout the year to oversee each fund's activities, review contractual arrangements with companies that provide services to each fund, and review each fund's performance. Except for William O. McCoy, Dennis J. Dirks, and Kenneth L. Wolfe, each of the Trustees oversees 301 funds advised by FMR or an affiliate. Mr. McCoy oversees 303 funds advised by FMR or an affiliate. Mr. Dirks and Mr. Wolfe oversee 233 funds advised by FMR or an affiliate.
The Trustees hold office without limit in time except that (a) any Trustee may resign; (b) any Trustee may be removed by written instrument, signed by at least two-thirds of the number of Trustees prior to such removal; (c) any Trustee who requests to be retired or who has become incapacitated by illness or injury may be retired by written instrument signed by a majority of the other Trustees; and (d) any Trustee may be removed at any special meeting of shareholders by a two-thirds vote of the outstanding voting securities of the trust. In any event, each non-interested Trustee shall retire not later than the last day of the calendar year in which his or her 72nd birthday occurs. The executive officers and Advisory Board Member hold office without limit in time, except that any officer and Advisory Board Member may resign or may be removed by a vote of a majority of the Trustees at any regular meeting or any special meeting of the Trustees. Except as indicated, each individual has held the office shown or other offices in the same company for the past five years.
The funds' Statement of Additional Information (SAI) includes more information about the Trustees. To request a free copy, call Fidelity at 1-800-544-5429.
Interested Trustees*:
Correspondence intended for each Trustee who is an "interested person" (as defined in the 1940 Act) may be sent to Fidelity Investments, 82 Devonshire Street, Boston, Massachusetts 02109.
Name, Age; Principal Occupation |
Edward C. Johnson 3d (74)** |
| Year of Election or Appointment: 1981, 1988 or 1994 Trustee of Variable Insurance Products Fund (1981), Variable Insurance Products Fund II (1988), and Variable Insurance Products Fund III (1994). Mr. Johnson is Chairman of the Board of Trustees. Mr. Johnson serves as Chief Executive Officer, Chairman, and a Director of FMR Corp.; a Director and Chairman of the Board and of the Executive Committee of FMR; Chairman and a Director of Fidelity Management & Research (Far East) Inc.; Chairman (1998) and a Director of Fidelity Investments Money Management, Inc.; and Chairman (2001) and a Director (2000) of FMR Co., Inc. |
Abigail P. Johnson (43)** |
| Year of Election or Appointment: 2001 Senior Vice President of VIP Asset Manager: Growth (2001), VIP Balanced (2001), VIP Growth & Income (2001), VIP Growth Opportunities (2001), VIP Investment Grade Bond (2001), VIP Mid Cap (2001), and VIP Money Market (2001). Ms. Johnson also serves as Senior Vice President of other Fidelity funds (2001). She is President and a Director of FMR (2001), Fidelity Investments Money Management, Inc. (2001), FMR Co., Inc. (2001), and a Director of FMR Corp. Previously, Ms. Johnson managed a number of Fidelity funds. |
Laura B. Cronin (50) |
| Year of Election or Appointment: 2003 Ms. Cronin is an Executive Vice President (2002) and Chief Financial Officer (2002) of FMR Corp. and is a member of the Fidelity Management Committee (2003). Previously, Ms. Cronin served as Vice President of Finance of FMR (1997-1999), and Chief Financial Officer of FMR (1999-2001), Fidelity Personal Investments (2001), and Fidelity Brokerage Company (2001-2002). |
Robert L. Reynolds (52) |
| Year of Election or Appointment: 2003 Mr. Reynolds is a Director (2003) and Chief Operating Officer (2002) of FMR Corp. and is the head of the Fidelity Management Committee (2003). He also serves on the Board at Fidelity Investments Canada, Ltd. (2000). Previously, Mr. Reynolds served as President of Fidelity Investments Institutional Retirement Group (1996-2000). |
* Trustees have been determined to be "Interested Trustees" by virtue of, among other things, their affiliation with the trusts or various entities under common control with FMR.
** Edward C. Johnson 3d, Trustee, is Abigail P. Johnson's father.
Annual Report
Non-Interested Trustees:
Correspondence intended for each non-interested Trustee (that is, the Trustees other than the Interested Trustees) may be sent to Fidelity Investments, P.O. Box 55235, Boston, Massachusetts 02205-5235.
Dennis J. Dirks (56) |
| Year of Election or Appointment: 2005 Mr. Dirks also serves as a Trustee (2005) or Member of the Advisory Board (2004) of other investment companies advised by FMR. Prior to his retirement in May 2003, Mr. Dirks was Chief Operating Officer and a member of the Board of The Depository Trust & Clearing Corporation (DTCC) (1999-2003). He also served as President, Chief Operating Officer, and Board member of The Depository Trust Company (DTC) (1999-2003) and President and Board member of the National Securities Clearing Corporation (NSCC) (1999-2003). In addition, Mr. Dirks served as Chief Executive Officer and Board member of the Government Securities Clearing Corporation (2001-2003) and Chief Executive Officer and Board member of the Mortgage-Backed Securities Clearing Corporation (2001-2003). |
Robert M. Gates (61) |
| Year of Election or Appointment: 1997 Dr. Gates is Vice Chairman of the non-interested Trustees (2005). Dr. Gates is President of Texas A&M University (2002). He was Director of the Central Intelligence Agency (CIA) from 1991 to 1993. From 1989 to 1991, Dr. Gates served as Assistant to the President of the United States and Deputy National Security Advisor. Dr. Gates is a Director of NACCO Industries, Inc. (mining and manufacturing), Parker Drilling Co., Inc. (drilling and rental tools for the energy industry, 2001), and Brinker International (restaurant management, 2003). He also serves as a member of the Advisory Board of VoteHere.net (secure Internet voting, 2001). Previously, Dr. Gates served as a Director of LucasVarity PLC (automotive components and diesel engines), a Director of TRW Inc. (automotive, space, defense, and information technology), and Dean of the George Bush School of Government and Public Service at Texas A&M University (1999-2001). Dr. Gates also is a Trustee of the Forum for International Policy. |
George H. Heilmeier (68) |
| Year of Election or Appointment: 2004 Dr. Heilmeier is Chairman Emeritus of Telcordia Technologies (communication software and systems), where prior to his retirement, he served as company Chairman and Chief Executive Officer. He currently serves on the Boards of Directors of The Mitre Corporation (systems engineering and information technology support for the government), INET Technologies Inc. (telecommunications network surveillance, 2001), Teletech Holdings (customer management services), and HRL Laboratories (private research and development, 2004). He is Chairman of the General Motors Technology Advisory Committee and a Life Fellow of the Institute of Electrical and Electronics Engineers (IEEE) (2000). Dr. Heilmeier is a member of the Defense Science Board and the National Security Agency Advisory Board. He is also a member of the National Academy of Engineering, the American Academy of Arts and Sciences, and the Board of Overseers of the School of Engineering and Applied Science of the University of Pennsylvania. Previously, Dr. Heilmeier served as a Director of TRW Inc. (automotive, space, defense, and information technology, 1992-2002), Compaq (1994-2002), and Automatic Data Processing, Inc. (ADP) (technology-based business outsourcing, 1995-2002). |
Marie L. Knowles (58) |
| Year of Election or Appointment: 2001 Prior to Ms. Knowles' retirement in June 2000, she served as Executive Vice President and Chief Financial Officer of Atlantic Richfield Company (ARCO) (diversified energy, 1996-2000). From 1993 to 1996, she was a Senior Vice President of ARCO and President of ARCO Transportation Company. She served as a Director of ARCO from 1996 to 1998. She currently serves as a Director of Phelps Dodge Corporation (copper mining and manufacturing), URS Corporation (multidisciplinary engineering, 1999), and McKesson Corporation (healthcare service, 2002). Ms. Knowles is a Trustee of the Brookings Institution and the Catalina Island Conservancy and also serves as a member of the Advisory Board for the School of Engineering of the University of Southern California. |
Ned C. Lautenbach (60) |
| Year of Election or Appointment: 2000 Mr. Lautenbach has been a partner of Clayton, Dubilier & Rice, Inc. (private equity investment firm) since September 1998. Previously, Mr. Lautenbach was with the International Business Machines Corporation (IBM) from 1968 until his retirement in 1998. He was most recently Senior Vice President and Group Executive of Worldwide Sales and Services. From 1993 to 1995, he was Chairman of IBM World Trade Corporation, and from 1994 to 1998 was a member of IBM's Corporate Executive Committee. Mr. Lautenbach serves as Co-Chairman and a Director of Covansys, Inc. (global provider of business and technology solutions, 2000). In addition, he is a Director of Italtel Holding S.p.A. (telecommunications (Milan, Italy), 2004) and Eaton Corporation (diversified industrial) as well as the Philharmonic Center for the Arts in Naples, Florida (1999). He also is a member of the Council on Foreign Relations. |
Marvin L. Mann (71) |
| Year of Election or Appointment: 1993 or 1994 Trustee of Variable Insurance Products Fund (1993), Variable Insurance Products Fund II (1993), and Variable Insurance Products Fund III (1994). Mr. Mann is Chairman of the non-interested Trustees (2001). He is Chairman Emeritus of Lexmark International, Inc. (computer peripherals), where he served as CEO until April 1998, retired as Chairman May 1999, and remains a member of the Board. Prior to 1991, he held the positions of Vice President of International Business Machines Corporation (IBM) and President and General Manager of various IBM divisions and subsidiaries. He is a member of the Executive Committee of the Independent Director's Council of the Investment Company Institute. In addition, Mr. Mann is a member of the President's Cabinet at the University of Alabama and the Board of Visitors of the Culverhouse College of Commerce and Business Administration at the University of Alabama. |
William O. McCoy (71) |
| Year of Election or Appointment: 1997 Prior to his retirement in December 1994, Mr. McCoy was Vice Chairman of the Board of BellSouth Corporation (telecommunications) and President of BellSouth Enterprises. He is currently a Director of Liberty Corporation (holding company), Duke Realty Corporation (real estate), and Progress Energy, Inc. (electric utility). He is also a partner of Franklin Street Partners (private investment management firm) and a member of the Research Triangle Foundation Board. In addition, Mr. McCoy served as the Interim Chancellor (1999-2000) and a member of the Board of Visitors (1994-1998) for the University of North Carolina at Chapel Hill and currently serves on the Board of Directors of the University of North Carolina Health Care System and the Board of Visitors of the Kenan-Flagler Business School (University of North Carolina at Chapel Hill). He also served as Vice President of Finance for the University of North Carolina (16-school system, 1995-1998). |
Cornelia M. Small (60) |
| Year of Election or Appointment: 2005 Ms. Small is a member (2000) and Chairperson (2002) of the Investment Committee, and a member (2002) of the Board of Trustees of Smith College. Previously, she served as Chief Investment Officer (1999-2000), Director of Global Equity Investments (1996-1999), and a member of the Board of Directors of Scudder, Stevens & Clark (1990-1997) and Scudder Kemper Investments (1997-1998). In addition, Ms. Small served as Co-Chair (2000-2003) of the Annual Fund for the Fletcher School of Law and Diplomacy. |
William S. Stavropoulos (65) |
| Year of Election or Appointment: 2001 or 2002 Trustee of Variable Insurance Products Fund (2001), Variable Insurance Products Fund II (2001), and Variable Insurance Products Fund III (2002). Mr. Stavropoulos is Chairman of the Board (2000), CEO (2002), a position he previously held from 1995-2000, Chairman of the Executive Committee (2000), and a Member of the Board of Directors of The Dow Chemical Company. Since joining The Dow Chemical Company in 1967, Mr. Stavropoulos served in numerous senior management positions, including President (1993-2000; 2002-2003). Currently, he is a Director of NCR Corporation (data warehousing and technology solutions), BellSouth Corporation (telecommunications), Chemical Financial Corporation, and Maersk Inc. (industrial conglomerate, 2002). He also serves as a member of the Board of Trustees of the American Enterprise Institute for Public Policy Research. In addition, Mr. Stavropoulos is a member of The Business Council, J.P. Morgan International Council and the University of Notre Dame Advisory Council for the College of Science. |
Kenneth L. Wolfe (65) |
| Year of Election or Appointment: 2005 Mr. Wolfe also serves as a Trustee (2005) or Member of the Advisory Board (2004) of other investment companies advised by FMR. Prior to his retirement in 2001, Mr. Wolfe was Chairman and Chief Executive Officer of Hershey Foods Corporation (1993-2001). He currently serves as a member of the boards of Adelphia Communications Corporation (2003), Bausch & Lomb, Inc., and Revlon Inc. (2004). |
Annual Report
Advisory Board Member and Executive Officers:
Correspondence intended for each executive officer and Mr. Lynch may be sent to Fidelity Investments, 82 Devonshire Street, Boston, Massachusetts 02109
Name, Age; Principal Occupation |
Peter S. Lynch (61) |
| Year of Election or Appointment: 2003 Member of the Advisory Board of Variable Insurance Products Fund, Variable Insurance Products Fund II and Variable Insurance Products Fund III. Vice Chairman and a Director of FMR, and Vice Chairman (2001) and a Director (2000) of FMR Co., Inc. Previously, Mr. Lynch served as a Trustee of the Fidelity funds (1990-2003). Prior to May 31, 1990, he was a Director of FMR and Executive Vice President of FMR (a position he held until March 31, 1991), Vice President of Fidelity® Magellan® Fund and FMR Growth Group Leader, and Managing Director of FMR Corp. Mr. Lynch was also Vice President of Fidelity Investments Corporate Services. In addition, he serves as a Trustee of Boston College, Massachusetts Eye & Ear Infirmary, Historic Deerfield, John F. Kennedy Library, and the Museum of Fine Arts of Boston. |
Bart A. Grenier (45) |
| Year of Election or Appointment: 2001 Vice President of VIP Asset Manager: Growth, VIP Balanced, and VIP Growth & Income. Mr. Grenier also serves as Vice President of certain Equity Funds (2001), a position he previously held from 1999 to 2000, and Vice President of certain High Income Funds (2002). He is Senior Vice President of FMR (1999) and FMR Co., Inc. (2001), and President and Director of Strategic Advisers, Inc. (2002). He also heads Fidelity's Asset Allocation Group (2000), Fidelity's Growth and Income Group (2001), Fidelity's Value Group (2001), and Fidelity's High Income Division (2001). Previously, Mr. Grenier served as President of Fidelity Ventures (2000), Vice President of certain High Income Funds (1997-2000), High Income Division Head (1997-2000), Group Leader of the Income-Growth and Asset Allocation-Income Groups (1996-2000), and Assistant Equity Division Head (1997-2000). |
John B. McDowell (46) |
| Year of Election or Appointment: 2002 Vice President of VIP Growth Opportunities and VIP Mid Cap. Mr. McDowell also serves as Vice President of certain Equity Funds (2002). He is Senior Vice President of FMR (1999), FMR Co., Inc. (2001), and Fidelity Management Trust Company (FMTC). Since joining Fidelity Investments in 1985, Mr. McDowell has worked as a research analyst and manager. |
Charles S. Morrison (44) |
| Year of Election or Appointment: 2002 Vice President of VIP Asset Manager: Growth, VIP Balanced, and VIP Investment Grade Bond. Mr. Morrison also serves as Vice President of Fidelity's Bond Funds (2002), and Vice President of certain Asset Allocation and Balanced Funds (2002). He serves as Vice President (2002) and Bond Group Leader (2002) of Fidelity Investments Fixed Income Division. Mr. Morrison is also Vice President of FIMM (2002) and FMR (2002). Mr. Morrison joined Fidelity in 1987 as a Corporate Bond Analyst in the Fixed Income Research Division. |
David L. Murphy (56) |
| Year of Election or Appointment: 2002 Vice President of VIP Asset Manager: Growth and VIP Money Market. Mr. Murphy also serves as Vice President of Fidelity's Money Market Funds (2002) and Vice President of certain Asset Allocation Funds (2003). He serves as Senior Vice President (2000) and Money Market Group Leader (2002) of the Fidelity Investments Fixed Income Division. Mr. Murphy is also a Senior Vice President of FIMM (2003) and a Vice President of FMR (2000). Previously, Mr. Murphy served as Bond Group Leader (2000-2002) and Vice President of Fidelity's Taxable Bond Funds (2000-2002) and Fidelity's Municipal Bond Funds (2001-2002). Mr. Murphy joined Fidelity in 1989 as a portfolio manager in the Bond Group. |
Thomas J. Allen (44) |
| Year of Election or Appointment: 2003 Vice President of VIP Mid Cap. Mr. Allen also serves as Vice President of another fund advised by FMR. Prior to assuming his current responsibilities, Mr. Allen managed a variety of Fidelity funds. Mr. Allen also serves as Vice President of FMR (2002) and FMR Co., Inc. (2002). |
Bettina Doulton (40) |
| Year of Election or Appointment: 2000 Vice President of VIP Growth Opportunities. Ms. Doulton also serves as Vice President of another fund advised by FMR. Prior to assuming her current responsibilities, Ms. Doulton managed a variety of Fidelity funds. Ms. Doulton also serves as Senior Vice President of FMR and FMR Co., Inc. (2001). |
Richard C. Habermann (64) |
| Year of Election or Appointment: 2001 Vice President of VIP Asset Manager: Growth. Mr. Habermann also serves as Vice President of other funds advised by FMR. Prior to assuming his current responsibilities, Mr. Habermann managed a variety of Fidelity funds. Mr. Habermann also serves as Senior Vice President of FMR and FMR Co., Inc. (2001). |
Charles A. Mangum (40) |
| Year of Election or Appointment: 2002 Vice President of VIP Asset Manager: Growth. Mr. Magnum also serves as Vice President of other funds advised by FMR. Prior to assuming his current responsibilities, Mr. Mangum managed a variety of Fidelity funds. Mr. Mangum also serves as Vice President of FMR and FMR Co., Inc. (2001). |
Christine McConnell (46) |
| Year of Election or Appointment: 2000 Vice President of VIP Asset Manager: Growth. Ms. McConnell also serves as Vice President of another fund advised by FMR. Prior to assuming her current responsibilities, Ms. McConnell managed a variety of Fidelity funds. Ms. McConnell also serves as Vice President of FMR (2003) and FMR Co., Inc. (2003). |
James Kim Miller (41) |
| Year of Election or Appointment: 2004 Vice President of VIP Asset Manager: Growth. Mr. Miller also serves as Vice President of other funds advised by FMR. Prior to assuming his current responsibilities, Mr. Miller managed a variety of Fidelity funds. |
Ford E. O'Neil (42) |
| Year of Election or Appointment: 2001 Vice President of VIP Asset Manager: Growth, VIP Balanced, and VIP Investment Grade Bond. Mr. O'Neil also serves as Vice President of other funds advised by FMR. Prior to assuming his current responsibilities, Mr. O'Neil managed a variety of Fidelity funds. |
Louis Salemy (43) |
| Year of Election or Appointment: 2000 or 2002 Vice President of VIP Balanced (2000) and VIP Growth & Income (2002). Mr. Salemy also serves as Vice President of other funds advised by FMR. Prior to assuming his current responsibilities, Mr. Salemy managed a variety of Fidelity funds. Mr. Salemy also serves as Vice President of FMR (2000) and FMR Co., Inc. (2001). |
Eric D. Roiter (56) |
| Year of Election or Appointment: 1998 Secretary of VIP Asset Manager: Growth, VIP Balanced, VIP Growth & Income, VIP Growth Opportunities, VIP Investment Grade Bond, VIP Mid Cap, VIP Money Market. He also serves as Secretary of other Fidelity funds; Vice President, General Counsel, and Secretary of FMR Co., Inc. (2001-present) and FMR; Vice President and Secretary of FDC; Assistant Secretary of Fidelity Management & Research (U.K.) Inc. (2001-present), Fidelity Management & Research (Far East) Inc. (2001-present); and Fidelity Investments Money Management, Inc. (2001-present). Mr. Roiter is an Adjunct Member, Faculty of Law, at Boston College Law School (2003). |
Stuart Fross (45) |
| Year of Election or Appointment: 2003 Assistant Secretary of VIP Asset Manager: Growth, VIP Balanced, VIP Growth & Income, VIP Growth Opportunities, VIP Investment Grade Bond, VIP Mid Cap, and VIP Money Market. Mr. Fross also serves as Assistant Secretary of other Fidelity funds (2003) and is an employee of FMR. |
Christine Reynolds (46) |
| Year of Election or Appointment: 2004 President, Treasurer, and Anti-Money Laundering (AML) officer of VIP Asset Manager: Growth, VIP Balanced, VIP Growth & Income, VIP Growth Opportunities, VIP Investment Grade Bond, VIP Mid Cap, and VIP Money Market. Ms. Reynolds also serves as President,Treasurer, and AML officer of other Fidelity funds (2004) and is a Vice President (2003) and an employee (2002) of FMR. Before joining Fidelity Investments, Ms. Reynolds worked at PricewaterhouseCoopers LLP (PwC) (1980-2002), where she was most recently an audit partner with PwC's investment management practice. |
Timothy F. Hayes (54) |
| Year of Election or Appointment: 2002 Chief Financial Officer of VIP Asset Manager: Growth, VIP Balanced, VIP Growth & Income, VIP Growth Opportunities, VIP Investment Grade Bond, VIP Mid Cap, and VIP Money Market. Mr. Hayes also serves as Chief Financial Officer of other Fidelity funds (2002). Recently he was appointed President of Fidelity Service Company (2003) where he also serves as a Director. Mr. Hayes also serves as President of Fidelity Investments Operations Group (FIOG, 2002), which includes Fidelity Pricing and Cash Management Services Group (FPCMS), where he was appointed President in 1998. Previously, Mr. Hayes served as Chief Financial Officer of Fidelity Investments Corporate Systems and Service Group (1998) and Fidelity Systems Company (1997-1998). |
Kenneth A. Rathgeber (57) |
| Year of Election or Appointment: 2004 Chief Compliance Officer of VIP Asset Manager: Growth, VIP Balanced, VIP Growth & Income, VIP Growth Opportunities, VIP Investment Grade Bond, VIP Mid Cap, and VIP Money Market. Mr. Rathgeber also serves as Chief Compliance Officer of other Fidelity funds (2004) and Executive Vice President of Risk Oversight for Fidelity Investments (2002). Previously, he served as Executive Vice President and Chief Operating Officer for Fidelity Investments Institutional Services Company, Inc. (1998-2002). |
John R. Hebble (46) |
| Year of Election or Appointment: 2003 Deputy Treasurer of VIP Asset Manager: Growth, VIP Balanced, VIP Growth & Income, VIP Growth Opportunities, VIP Investment Grade Bond, VIP Mid Cap, and VIP Money Market. Mr. Hebble also serves as Deputy Treasurer of other Fidelity funds (2003), and is an employee of FMR. Before joining Fidelity Investments, Mr. Hebble worked at Deutsche Asset Management where he served as Director of Fund Accounting (2002-2003) and Assistant Treasurer of the Scudder Funds (1998-2003). |
Kimberley H. Monasterio (41) |
| Year of Election or Appointment: 2004 Deputy Treasurer of VIP Asset Manager: Growth, VIP Balanced, VIP Growth & Income, VIP Growth Opportunities, VIP Investment Grade Bond, VIP Mid Cap, and VIP Money Market. Ms. Monasterio also serves as Deputy Treasurer of other Fidelity funds (2004) and is an employee of FMR (2004). Before joining Fidelity Investments, Ms. Monasterio served as Treasurer (2000-2004) and Chief Financial Officer (2002-2004) of the Franklin Templeton Funds and Senior Vice President of Franklin Templeton Services, LLC (2000-2004). |
John H. Costello (58) |
| Year of Election or Appointment: 1986 Assistant Treasurer of VIP Asset Manager: Growth, VIP Balanced, VIP Growth & Income, VIP Growth Opportunities, VIP Investment Grade Bond, VIP Mid Cap, and VIP Money Market. Mr. Costello also serves as Assistant Treasurer of other Fidelity funds and is an employee of FMR. |
Peter L. Lydecker (50) |
| Year of Election or Appointment: 2004 Assistant Treasurer of VIP Asset Manager: Growth, VIP Balanced, VIP Growth & Income, VIP Growth Opportunities, VIP Investment Grade Bond, VIP Mid Cap, and VIP Money Market. Mr. Lydecker also serves as Assistant Treasurer of other Fidelity funds (2004) and is an employee of FMR. |
Mark Osterheld (49) |
| Year of Election or Appointment: 2002 Assistant Treasurer of VIP Asset Manager: Growth, VIP Balanced, VIP Growth & Income, VIP Growth Opportunities, VIP Investment Grade Bond, VIP Mid Cap, and VIP Money Market. Mr. Osterheld also serves as Assistant Treasurer of other Fidelity funds (2002) and is an employee of FMR. |
Kenneth B. Robins (35) |
| Year of Election or Appointment: 2004 Assistant Treasurer of VIP Asset Manager: Growth, VIP Balanced, VIP Growth & Income, VIP Growth Opportunities, VIP Investment Grade Bond, VIP Mid Cap, and VIP Money Market. Mr. Robins also serves as Assistant Treasurer of other Fidelity funds (2004) and is an employee of FMR (2004). Before joining Fidelity Investments, Mr. Robins worked at KPMG LLP, where he was a partner in KPMG's department of professional practice (2002-2004) and a Senior Manager (1999-2000). In addition, Mr. Robins served as Assistant Chief Accountant, United States Securities and Exchange Commission (2000-2002). |
Annual Report
Distributions
The Board of Trustees of each fund voted to pay to shareholders of record at the opening of business on record date, the following distributions per share derived from capital gains realized from sales of portfolio securities, and dividends derived from net investment income:
| Pay Date | Record Date | Dividends | Capital Gains |
Balanced | | | | |
Initial Class | 2/11/05 | 2/11/05 | $.365 | $.01 |
Service Class | 2/11/05 | 2/11/05 | $.350 | $.01 |
Service Class 2 | 2/11/05 | 2/11/05 | $.335 | $.01 |
Investment Grade Bond | | | | |
Initial Class | 2/11/05 | 2/11/05 | $.480 | $.29 |
Service Class | 2/11/05 | 2/11/05 | $.475 | $.29 |
Service Class 2 | 2/11/05 | 2/11/05 | $.460 | $.29 |
Mid Cap | | | | |
Initial Class | 2/11/05 | 2/11/05 | - | $.51 |
Service Class | 2/11/05 | 2/11/05 | - | $.51 |
Service Class 2 | 2/11/05 | 2/11/05 | - | $.51 |
A percentage of the dividends distributed during the fiscal year for the following funds was derived from interest on U.S. Government securities which is generally exempt from state income tax:
Balanced | 7.64% | |
Investment Grade Bond | 7.80% | |
A percentage of the dividends distributed during the fiscal year for the following funds qualifies for the dividends-received deduction for corporate shareholders:
Asset Manager: Growth | | |
Initial Class | 45% | |
Service Class | 46% | |
Service Class 2 | 48% | |
Balanced | | |
Initial Class | 36% | |
Service Class | 37% | |
Service Class 2 | 40% | |
Growth & Income | | |
Initial Class | 100% | |
Service Class | 100% | |
Service Class 2 | 100% | |
Growth Opportunities | | |
Initial Class | 100% | |
Service Class | 100% | |
Service Class 2 | 100% | |
The funds will notify shareholders in January 2005 of amounts for use in preparing 2004 income tax returns.
Annual Report
Proxy Voting Results
A special meeting of the Variable Insurance Products Fund shareholders was held on December 14, 2004. The results of votes taken among shareholders on proposals before them are reported below. Each vote reported represents one dollar of net asset value held on the record date for the meeting.
PROPOSAL 1 |
To amend the Declaration of Trust to allow the Board of Trustees, if permitted by applicable law, to authorize fund mergers without shareholder approval. A |
| # of
Votes | % of
Votes |
Affirmative | 15,331,508,529.96 | 81.853 |
Against | 2,429,553,894.02 | 12.972 |
Abstain | 969,378,618.94 | 5.175 |
TOTAL | 18,730,441,042.92 | 100.000 |
PROPOSAL 2 |
To elect a Board of Trustees. A |
| # of
Votes | % of
Votes |
J. Michael Cook |
Affirmative | 17,770,642,454.98 | 94.876 |
Withheld | 959,798,587.94 | 5.124 |
TOTAL | 18,730,441,042.92 | 100.000 |
Ralph F. Cox |
Affirmative | 17,759,356,374.26 | 94.815 |
Withheld | 971,084,668.66 | 5.185 |
TOTAL | 18,730,441,042.92 | 100.000 |
Laura B. Cronin |
Affirmative | 17,797,888,742.24 | 95.021 |
Withheld | 932,552,300.68 | 4.979 |
TOTAL | 18,730,441,042.92 | 100.000 |
Dennis J. DirksB |
Affirmative | 17,802,602,074.45 | 95.046 |
Withheld | 927,838,968.47 | 4.954 |
TOTAL | 18,730,441,042.92 | 100.000 |
Robert M. Gates |
Affirmative | 17,784,855,823.58 | 94.952 |
Withheld | 945,585,219.34 | 5.048 |
TOTAL | 18,730,441,042.92 | 100.000 |
George H. Heilmeier |
Affirmative | 17,768,875,556.56 | 94.866 |
Withheld | 961,565,486.36 | 5.134 |
TOTAL | 18,730,441,042.92 | 100.000 |
Abigail P. Johnson |
Affirmative | 17,781,929,073.06 | 94.936 |
Withheld | 948,511,969.86 | 5.064 |
TOTAL | 18,730,441,042.92 | 100.000 |
Edward C. Johnson 3d |
Affirmative | 17,752,140,336.45 | 94.777 |
Withheld | 978,300,706.47 | 5.223 |
TOTAL | 18,730,441,042.92 | 100.000 |
Donald J. Kirk |
Affirmative | 17,772,467,361.45 | 94.885 |
Withheld | 957,973,681.47 | 5.115 |
TOTAL | 18,730,441,042.92 | 100.000 |
| # of
Votes | % of
Votes |
Marie L. Knowles |
Affirmative | 17,776,922,254.30 | 94.909 |
Withheld | 953,518,788.62 | 5.091 |
TOTAL | 18,730,441,042.92 | 100.000 |
Ned C. Lautenbach |
Affirmative | 17,804,221,564.95 | 95.055 |
Withheld | 926,219,477.97 | 4.945 |
TOTAL | 18,730,441,042.92 | 100.000 |
Marvin L. Mann |
Affirmative | 17,763,277,607.06 | 94.836 |
Withheld | 967,163,435.86 | 5.164 |
TOTAL | 18,730,441,042.92 | 100.000 |
William O. McCoy |
Affirmative | 17,758,560,162.11 | 94.811 |
Withheld | 971,880,880.81 | 5.189 |
TOTAL | 18,730,441,042.92 | 100.000 |
Robert L. Reynolds |
Affirmative | 17,806,026,904.06 | 95.065 |
Withheld | 924,414,138.86 | 4.935 |
TOTAL | 18,730,441,042.92 | 100.000 |
Cornelia M. SmallB |
Affirmative | 17,798,878,892.31 | 95.026 |
Withheld | 931,562,150.61 | 4.974 |
TOTAL | 18,730,441,042.92 | 100.000 |
William S. Stavropoulos |
Affirmative | 17,786,496,107.78 | 94.960 |
Withheld | 943,944,935.14 | 5.040 |
TOTAL | 18,730,441,042.92 | 100.000 |
PROPOSAL 10 |
To amend the fundamental investment limitation concerning lending for Money Market Portfolio. |
Money Market Portfolio |
| # of
Votes | % of
Votes |
Affirmative | 1,322,266,118.44 | 88.289 |
Against | 69,140,366.32 | 4.617 |
Abstain | 106,243,856.98 | 7.094 |
TOTAL | 1,497,650,341.74 | 100.000 |
A Denotes trust-wide proposals and voting results. B Effective January 1, 2005. |
Annual Report
Proxy Voting Results
A special meeting of the Variable Insurance Products Fund II shareholders was held on December 14, 2004. The results of votes taken among shareholders on proposals before them are reported below. Each vote reported represents one dollar of net asset value held on the record date for the meeting.
PROPOSAL 1 |
To amend the Declaration of Trust to allow the Board of Trustees, if permitted by applicable law, to authorize fund mergers without shareholder approval. A |
| # of
Votes | % of
Votes |
Affirmative | 10,633,156,497.88 | 78.949 |
Against | 2,079,333,933.24 | 15.439 |
Abstain | 755,879,753.86 | 5.612 |
TOTAL | 13,468,370,184.98 | 100.000 |
PROPOSAL 2 |
To elect a Board of Trustees. A |
| # of
Votes | % of
Votes |
J. Michael Cook |
Affirmative | 12,653,134,619.02 | 93.947 |
Withheld | 815,235,565.96 | 6.053 |
TOTAL | 13,468,370,184.98 | 100.000 |
Ralph F. Cox |
Affirmative | 12,621,475,328.63 | 93.712 |
Withheld | 846,894,856.35 | 6.288 |
TOTAL | 13,468,370,184.98 | 100.000 |
Laura B. Cronin |
Affirmative | 12,672,564,623.97 | 94.091 |
Withheld | 795,805,561.01 | 5.909 |
TOTAL | 13,468,370,184.98 | 100.000 |
Dennis J. Dirks B |
Affirmative | 100,000,000.00 | 00.000 |
Withheld | 100,000,000.00 | 00.000 |
TOTAL | 13,468,370,184.98 | 100.000 |
Robert M. Gates |
Affirmative | 12,659,421,698.29 | 93.994 |
Withheld | 808,948,486.69 | 6.006 |
TOTAL | 13,468,370,184.98 | 100.000 |
George H. Heilmeier |
Affirmative | 12,643,445,665.25 | 93.875 |
Withheld | 824,924,519.73 | 6.125 |
TOTAL | 13,468,370,184.98 | 100.000 |
Abigail P. Johnson |
Affirmative | 12,656,994,867.39 | 93.976 |
Withheld | 811,375,317.59 | 6.024 |
TOTAL | 13,468,370,184.98 | 100.000 |
Edward C. Johnson 3d |
Affirmative | 12,611,555,734.60 | 93.638 |
Withheld | 856,814,450.38 | 6.362 |
TOTAL | 13,468,370,184.98 | 100.000 |
Donald J. Kirk |
Affirmative | 12,632,695,111.23 | 93.795 |
Withheld | 835,675,073.75 | 6.205 |
TOTAL | 13,468,370,184.98 | 100.000 |
| # of
Votes | % of
Votes |
Marie L. Knowles |
Affirmative | 12,674,914,386.54 | 94.109 |
Withheld | 793,455,798.44 | 5.891 |
TOTAL | 13,468,370,184.98 | 100.000 |
Ned C. Lautenbach |
Affirmative | 12,679,654,480.45 | 94.144 |
Withheld | 788,715,704.53 | 5.856 |
TOTAL | 13,468,370,184.98 | 100.000 |
Marvin L. Mann |
Affirmative | 12,631,864,234.33 | 93.789 |
Withheld | 836,505,950.65 | 6.211 |
TOTAL | 13,468,370,184.98 | 100.000 |
William O. McCoy |
Affirmative | 12,627,373,668.93 | 93.756 |
Withheld | 840,996,516.05 | 6.244 |
TOTAL | 13,468,370,184.98 | 100.000 |
Robert L. Reynolds |
Affirmative | 12,676,011,492.18 | 94.117 |
Withheld | 792,358,692.80 | 5.883 |
TOTAL | 13,468,370,184.98 | 100.000 |
Cornelia M. Small B |
Affirmative | 12,673,927,441.76 | 94.101 |
Withheld | 794,442,743.22 | 5.899 |
TOTAL | 13,468,370,184.98 | 100.000 |
William S. Stavropoulos |
Affirmative | 12,650,527,834.35 | 93.928 |
Withheld | 817,842,350.63 | 6.072 |
TOTAL | 13,468,370,184.98 | 100.000 |
PROPOSAL 3 |
To amend the fundamental investment limitation concerning lending for each of Asset Manager: Growth Portfolio and Investment Grade Bond Portfolio. |
Asset Manager: Growth Portfolio |
| # of
Votes | % of
Votes |
Affirmative | 243,799,684.80 | 82.875 |
Against | 28,038,786.42 | 9.531 |
Abstain | 22,340,251.66 | 7.594 |
TOTAL | 294,178,722.88 | 100.000 |
Investment Grade Bond Portfolio |
| # of
Votes | % of
Votes |
Affirmative | 1,129,407,300.23 | 81.883 |
Against | 142,181,660.75 | 10.309 |
Abstain | 107,701,200.55 | 7.808 |
TOTAL | 1,379,290,161.53 | 100.000 |
A Denotes trust-wide proposals and voting results. B Effective January 1, 2005. |
Annual Report
Proxy Voting Results
A special meeting of the Variable Insurance Products Fund III shareholders was held on December 14, 2004. The results of votes taken among shareholders on proposals before them are reported below. Each vote reported represents one dollar of net asset value held on the record date for the meeting.
PROPOSAL 1 |
To amend the Declaration of Trust to allow the Board of Trustees, if permitted by applicable law, to authorize fund mergers without shareholder approval. A |
| # of
Votes | % of
Votes |
Affirmative | 4,465,365,699.61 | 80.317 |
Against | 820,718,849.73 | 14.762 |
Abstain | 273,620,539.56 | 4.921 |
TOTAL | 5,559,705,088.90 | 100.000 |
PROPOSAL 2 |
To elect a Board of Trustees. A |
| # of
Votes | % of
Votes |
J. Michael Cook |
Affirmative | 5,275,527,318.06 | 94.889 |
Withheld | 284,177,770.84 | 5.111 |
TOTAL | 5,559,705,088.90 | 100.000 |
Ralph F. Cox |
Affirmative | 5,260,941,793.66 | 94.626 |
Withheld | 298,763,295.24 | 5.374 |
TOTAL | 5,559,705,088.90 | 100.000 |
Laura B. Cronin |
Affirmative | 5,275,571,233.79 | 94.889 |
Withheld | 284,133,855.11 | 5.111 |
TOTAL | 5,559,705,088.90 | 100.000 |
Dennis J. Dirks B |
Affirmative | 5,277,234,059.51 | 94.919 |
Withheld | 282,471,029.39 | 5.081 |
TOTAL | 5,559,705,088.90 | 100.000 |
Robert M. Gates |
Affirmative | 5,271,693,384.06 | 94.820 |
Withheld | 288,011,704.84 | 5.180 |
TOTAL | 5,559,705,088.90 | 100.000 |
George H. Heilmeier |
Affirmative | 5,276,712,546.15 | 94.910 |
Withheld | 282,992,542.75 | 5.090 |
TOTAL | 5,559,705,088.90 | 100.000 |
Abigail P. Johnson |
Affirmative | 5,265,412,678.20 | 94.707 |
Withheld | 294,292,410.70 | 5.293 |
TOTAL | 5,559,705,088.90 | 100.000 |
Edward C. Johnson 3d |
Affirmative | 5,252,813,997.03 | 94.480 |
Withheld | 306,891,091.87 | 5.520 |
TOTAL | 5,559,705,088.90 | 100.000 |
Donald J. Kirk |
Affirmative | 5,268,337,458.03 | 94.759 |
Withheld | 291,367,630.87 | 5.241 |
TOTAL | 5,559,705,088.90 | 100.000 |
| # of
Votes | % of
Votes |
Marie L. Knowles |
Affirmative | 5,278,993,264.93 | 94.951 |
Withheld | 280,711,823.97 | 5.049 |
TOTAL | 5,559,705,088.90 | 100.000 |
Ned C. Lautenbach |
Affirmative | 5,280,591,428.18 | 94.980 |
Withheld | 279,113,660.72 | 5.020 |
TOTAL | 5,559,705,088.90 | 100.000 |
Marvin L. Mann |
Affirmative | 5,266,769,335.50 | 94.731 |
Withheld | 292,935,753.40 | 5.269 |
TOTAL | 5,559,705,088.90 | 100.000 |
William O. McCoy |
Affirmative | 5,270,804,685.62 | 94.804 |
Withheld | 288,900,403.28 | 5.196 |
TOTAL | 5,559,705,088.90 | 100.000 |
Robert L. Reynolds |
Affirmative | 5,279,190,479.65 | 94.955 |
Withheld | 280,514,609.25 | 5.045 |
TOTAL | 5,559,705,088.90 | 100.000 |
Cornelia M. Small B |
Affirmative | 5,276,074,654.01 | 94.898 |
Withheld | 283,630,434.89 | 5.102 |
TOTAL | 5,559,705,088.90 | 100.000 |
William S. Stavropoulos |
Affirmative | 5,278,183,775.21 | 94.936 |
Withheld | 281,521,313.69 | 5.064 |
TOTAL | 5,559,705,088.90 | 100.000 |
A Denotes trust-wide proposals and voting results. B Effective January 1, 2005. |
Annual Report
Investment Adviser
Fidelity Management & Research Company
Boston, MA
Investment Sub-Advisers
FMR Co., Inc.
Asset Manager: Growth, Balanced,
Growth & Income, Growth Opportunities,
and Mid Cap Portfolios
Fidelity Investments Money Management, Inc.
Asset Manager: Growth, Balanced,
Investment Grade Bond, and Money Market Portfolios
Fidelity Management & Research (U.K.) Inc.
Asset Manager: Growth, Balanced, Growth & Income,
Growth Opportunities, and Mid Cap Portfolios
Fidelity Management & Research (Far East) Inc.
Asset Manager: Growth, Balanced, Growth & Income,
Growth Opportunities, and Mid Cap Portfolios
Fidelity Investments Japan Limited
Asset Manager: Growth, Balanced, Growth & Income,
Growth Opportunities, and Mid Cap Portfolios
Fidelity International Investment Advisors
Asset Manager: Growth, Balanced, Growth & Income,
Growth Opportunities, Investment Grade Bond, Mid Cap
and Money Market Portfolios
Fidelity International Investment Advisors (U.K.) Limited
Asset Manager: Growth, Balanced, Growth & Income,
Growth Opportunities, Investment Grade Bond, Mid Cap
and Money Market Portfolios
General Distributor
Fidelity Distributors Corporation
Boston, MA
Transfer and Shareholder Servicing Agent
Fidelity Investments Institutional Operations Company, Inc.
Boston, MA
Custodian
The Bank of New York, New York, NY
Investment Grade Bond and Money Market Portfolios
JPMorgan Chase Bank, New York, NY
Asset Manager: Growth, Balanced,
and Growth & Income Portfolios
Brown Brothers Harriman & Co., Boston, MA
Mid Cap Portfolio
Mellon Bank, N.A., Pittsburgh, PA
Growth Opportunities Portfolio
VIPGRP2-ANN-0205
1.768593.103
Item 2. Code of Ethics
As of the end of the period, December 31, 2004, Variable Insurance Products Fund (the trust) has adopted a code of ethics, as defined in Item 2 of Form N-CSR, that applies to its President and Treasurer and its Chief Financial Officer. A copy of the code of ethics is filed as an exhibit to this Form N-CSR.
Item 3. Audit Committee Financial Expert
The Board of Trustees of the trust has determined that Marie L. Knowles is an audit committee financial expert, as defined in Item 3 of Form N-CSR. Ms. Knowles is independent for purposes of Item 3 of Form N-CSR.
Item 4. Principal Accountant Fees and Services
(a) Audit Fees.
For the fiscal years ended December 31, 2004 and December 31, 2003, the aggregate Audit Fees billed by PricewaterhouseCoopers LLP (PwC) for professional services rendered for the audits of the financial statements, or services that are normally provided in connection with statutory and regulatory filings or engagements for those fiscal years, for Equity-Income Portfolio, Growth Portfolio, High Income Portfolio, Money Market Portfolio and Overseas Portfolio (the funds) and for all funds in the Fidelity Group of Funds are shown in the table below.
Fund | 2004A | 2003A |
Equity-Income Portfolio | $75,000 | $64,000 |
Growth Portfolio | $70,000 | $60,000 |
High Income Portfolio | $57,000 | $80,000 |
Money Market Portfolio | $32,000 | $29,000 |
Overseas Portfolio | $50,000 | $55,000 |
All funds in the Fidelity Group of Funds audited by PwC | $10,800,000 | $10,600,000 |
A | Aggregate amounts may reflect rounding. |
For the fiscal years ended December 31, 2004 and December 31, 2003, the aggregate Audit Fees billed by Deloitte & Touche LLP, the member firms of Deloitte Touche Tohmatsu, and their respective affiliates (collectively, "Deloitte Entities") for professional services rendered for the audits of the financial statements, or services that are normally provided in connection with statutory and regulatory filings or engagements for those fiscal years, for Value Portfolio (the fund) and for all funds in the Fidelity Group of Funds are shown in the table below.
Fund | 2004A | 2003A |
Value Portfolio | $29,000 | $26,000 |
All funds in the Fidelity Group of Funds audited by Deloitte Entities | $4,300,000 | $4,300,000 |
A | Aggregate amounts may reflect rounding. |
(b) Audit-Related Fees.
In each of the fiscal years ended December 31, 2004 and December 31, 2003, the aggregate Audit-Related Fees billed by PwC for services rendered for assurance and related services to each fund that are reasonably related to the performance of the audit or review of the fund's financial statements, but not reported as Audit Fees, are shown in the table below.
Fund | 2004A | 2003 A, B |
Equity-Income Portfolio | $0 | $0 |
Growth Portfolio | $0 | $0 |
High Income Portfolio | $0 | $0 |
Money Market Portfolio | $0 | $0 |
Overseas Portfolio | $0 | $0 |
A | Aggregate amounts may reflect rounding. |
B | Includes amounts related to non-audit services prior to May 6, 2003 that would have been subject to pre-approval if the SEC rules relating to the pre-approval of non-audit services had been in effect at that time. |
In each of the fiscal years ended December 31, 2004 and December 31, 2003, the aggregate Audit-Related Fees billed by Deloitte Entities for services rendered for assurance and related services to the fund that are reasonably related to the performance of the audit or review of the fund's financial statements, but not reported as Audit Fees, are shown in the table below.
Fund | 2004A | 2003 A, B |
Value Portfolio | $0 | $0 |
A | Aggregate amounts may reflect rounding. |
B | Includes amounts related to non-audit services prior to May 6, 2003 that would have been subject to pre-approval if the SEC rules relating to the pre-approval of non-audit services had been in effect at that time. |
In each of the fiscal years ended December 31, 2004 and December 31, 2003, the aggregate Audit-Related Fees that were billed by PwC and Deloitte Entities that were required to be approved by the Audit Committee for services rendered on behalf of Fidelity Management & Research Company (FMR) and entities controlling, controlled by, or under common control with FMR (not including any sub-adviser whose role is primarily portfolio management and is subcontracted with or overseen by another investment adviser) that provide ongoing services to the funds ("Fund Service Providers") for assurance and related services that relate directly to the operations and financial reporting of each fund that are reasonably related to the performance of the audit or review of the fund's financial statements, but not reported as Audit Fees, are shown in the table below.
Billed By | 2004 A | 2003A, B |
PwC | $0 | $50,000 |
Deloitte Entities | $0 | $0 |
A | Aggregate amounts may reflect rounding. |
B | Includes amounts related to non-audit services prior to May 6, 2003 that would have been subject to pre-approval if the SEC rules relating to the pre-approval of non-audit services had been in effect at that time. |
Fees included in the audit-related category comprise assurance and related services (e.g., due diligence services) that are traditionally performed by the independent registered public accounting firm. These audit-related services include due diligence related to mergers and acquisitions, accounting consultations and audits in connection with acquisitions, internal control reviews, attest services that are not required by statute or regulation and consultation concerning financial accounting and reporting standards.
(c) Tax Fees.
In each of the fiscal years ended December 31, 2004 and December 31, 2003, the aggregate Tax Fees billed by PwC for professional services rendered for tax compliance, tax advice, and tax planning for each fund is shown in the table below.
Fund | 2004A | 2003A, B |
Equity-Income Portfolio | $3,200 | $3,000 |
Growth Portfolio | $2,400 | $2,200 |
High Income Portfolio | $2,400 | $2,200 |
Money Market Portfolio | $1,600 | $1,500 |
Overseas Portfolio | $4,000 | $3,700 |
A | Aggregate amounts may reflect rounding. |
B | Includes amounts related to non-audit services prior to May 6, 2003 that would have been subject to pre-approval if the SEC rules relating to the pre-approval of non-audit services had been in effect at that time. |
In each of the fiscal years ended December 31, 2004 and December 31, 2003, the aggregate Tax Fees billed by Deloitte Entities for professional services rendered for tax compliance, tax advice, and tax planning for the fund is shown in the table below.
Fund | 2004A | 2003A, B |
Value Portfolio | $4,300 | $4,100 |
A | Aggregate amounts may reflect rounding. |
B | Includes amounts related to non-audit services prior to May 6, 2003 that would have been subject to pre-approval if the SEC rules relating to the pre-approval of non-audit services had been in effect at that time. |
In each of the fiscal years ended December 31, 2004 and December 31, 2003, the aggregate Tax Fees billed by PwC and Deloitte Entities that were required to be approved by the Audit Committee for professional services rendered on behalf of the Fund Service Providers for tax compliance, tax advice, and tax planning that relate directly to the operations and financial reporting of each fund is shown in the table below.
Billed By | 2004A | 2003A, B |
PwC | $0 | $0 |
Deloitte Entities | $0 | $0 |
A | Aggregate amounts may reflect rounding. |
B | Includes amounts related to non-audit services prior to May 6, 2003 that would have been subject to pre-approval if the SEC rules relating to the pre-approval of non-audit services had been in effect at that time. |
Fees included in the Tax Fees category comprise all services performed by professional staff in the independent registered public accounting firm's tax division except those services related to the audit. Typically, this category would include fees for tax compliance, tax planning, and tax advice. Tax compliance, tax advice, and tax planning services include preparation of original and amended tax returns, claims for refund and tax payment-planning services, assistance with tax audits and appeals, tax advice related to mergers and acquisitions and requests for rulings or technical advice from taxing authorities.
(d) All Other Fees.
In each of the fiscal years ended December 31, 2004 and December 31, 2003, the aggregate Other Fees billed by PwC for all other non-audit services rendered to the funds is shown in the table below.
Fund | 2004A | 2003A, B |
Equity-Income Portfolio | $10,100 | $8,700 |
Growth Portfolio | $10,000 | $9,100 |
High Income Portfolio | $2,800 | $2,600 |
Money Market Portfolio | $2,400 | $3,100 |
Overseas Portfolio | $2,900 | $2,400 |
A | Aggregate amounts may reflect rounding. |
B | Includes amounts related to non-audit services prior to May 6, 2003 that would have been subject to pre-approval if the SEC rules relating to the pre-approval of non-audit services had been in effect at that time. |
In each of the fiscal years ended December 31, 2004 and December 31, 2003, the aggregate Other Fees billed by Deloitte Entities for all other non-audit services rendered to the fund is shown in the table below.
Fund | 2004A | 2003A, B |
Value Portfolio | $0 | $0 |
A | Aggregate amounts may reflect rounding. |
B | Includes amounts related to non-audit services prior to May 6, 2003 that would have been subject to pre-approval if the SEC rules relating to the pre-approval of non-audit services had been in effect at that time. |
In each of the fiscal years ended December 31, 2004 and December 31, 2003, the aggregate Other Fees billed by PwC and Deloitte Entities that were required to be approved by the Audit Committee for all other non-audit services rendered on behalf of the Fund Service Providers that relate directly to the operations and financial reporting of each fund is shown in the table below.
Billed By | 2004A | 2003A, B |
PwC | $490,000 | $190,000 |
Deloitte Entities | $850,000 | $150,000 |
A | Aggregate amounts may reflect rounding. |
B | Includes amounts related to non-audit services prior to May 6, 2003 that would have been subject to pre-approval if the SEC rules relating to the pre-approval of non-audit services had been in effect at that time. |
Fees included in the All Other Fees category include services related to internal control reviews, strategy and other consulting, financial information systems design and implementation, consulting on other information systems, and other tax services unrelated to the fund.
(e) (1) | Audit Committee Pre-Approval Policies and Procedures: |
The trust's Audit Committee must pre-approve all audit and non-audit services provided by the independent registered public accounting firm relating to the operations or financial reporting of the funds. Prior to the commencement of any audit or non-audit services to a fund, the Audit Committee reviews the services to determine whether they are appropriate and permissible under applicable law.
The trust's Audit Committee has adopted policies and procedures to, among other purposes, provide a framework for the Committee's consideration of non-audit services by the audit firms that audit the Fidelity funds. The policies and procedures require that any non-audit service provided by a fund audit firm to a Fidelity Fund and any non-audit service provided by a fund auditor to a Fund Service Provider that relates directly to the operations and financial reporting of a Fidelity fund (Covered Service) are subject to approval by the Audit Committee before such service is provided. Non-audit services provided by a fund audit firm for a Fund Service Provider that do not relate directly to the operations and financial reporting of a Fidelity fund (Non-Covered Service) but that are expected to exceed $50,000 are also subject to pre-approval by the Audit Committee.
All Covered Services, as well as Non-Covered Services that are expected to exceed $50,000, must be approved in advance of provision of the service either: (i) by formal resolution of the Audit Committee, or (ii) by oral or written approval of the service by the Chair of the Audit Committee (or if the Chair is unavailable, such other member of the Audit Committee as may be designated by the Chair to act in the Chair's absence). The approval contemplated by (ii) above is permitted where the Treasurer determines that action on such an engagement is necessary before the next meeting of the Audit Committee. Neither pre-approval nor advance notice of Non-Covered Service engagements for which fees are not expected to exceed $50,000 is required; such engagements are to be reported to the Audit Committee monthly.
(e) (2) | Services approved pursuant to paragraph (c)(7)(i)(C) of Rule 2-01 of Regulation S-X: |
Audit-Related Fees:
There were no amounts, including amounts related to non-audit services prior to May 6, 2003 that would have been subject to pre-approval if the SEC rules relating to the pre-approval of non-audit services had been in effect at that time, that were approved by the Audit Committee pursuant to the de minimis exception for the fiscal years ended December 31, 2004 and December 31, 2003 on behalf of each fund.
There were no amounts, including amounts related to non-audit services prior to May 6, 2003 that would have been subject to pre-approval if the SEC rules relating to the pre-approval of non-audit services had been in effect at that time, that were required to be approved by the Audit Committee pursuant to the de minimis exception for the fiscal years ended December 31, 2004 and December 31, 2003 on behalf of the Fund Service Providers that relate directly to the operations and financial reporting of each fund.
Tax Fees:
There were no amounts, including amounts related to non-audit services prior to May 6, 2003 that would have been subject to pre-approval if the SEC rules relating to the pre-approval of non-audit services had been in effect at that time, that were approved by the Audit Committee pursuant to the de minimis exception for the fiscal years ended December 31, 2004 and December 31, 2003 on behalf of each fund.
There were no amounts, including amounts related to non-audit services prior to May 6, 2003 that would have been subject to pre-approval if the SEC rules relating to the pre-approval of non-audit services had been in effect at that time, that were required to be approved by the Audit Committee pursuant to the de minimis exception for the fiscal years ended December 31, 2004 and December 31, 2003 on behalf of the Fund Service Providers that relate directly to the operations and financial reporting of each fund.
All Other Fees:
There were no amounts, including amounts related to non-audit services prior to May 6, 2003 that would have been subject to pre-approval if the SEC rules relating to the pre-approval of non-audit services had been in effect at that time, that were approved by the Audit Committee pursuant to the de minimis exception for the fiscal years ended December 31, 2004 and December 31, 2003 on behalf of each fund.
There were no amounts, including amounts related to non-audit services prior to May 6, 2003 that would have been subject to pre-approval if the SEC rules relating to the pre-approval of non-audit services had been in effect at that time, that were required to be approved by the Audit Committee pursuant to the de minimis exception for the fiscal years ended December 31, 2004 and December 31, 2003 on behalf of the Fund Service Providers that relate directly to the operations and financial reporting of each fund.
(f) According to PwC for the fiscal year ended December 31, 2004, the percentage of hours spent on the audit of each fund's financial statements for the most recent fiscal year that were attributed to work performed by persons who are not full-time, permanent employees of PwC is as follows:
Fund | 2004 |
Equity-Income Portfolio | 0% |
Growth Portfolio | 0% |
High Income Portfolio | 0% |
Money Market Portfolio | 0% |
Overseas Portfolio | 0% |
According to Deloitte Entities for the fiscal year ended December 31, 2004, the percentage of hours spent on the audit of the fund's financial statements for the most recent fiscal year that were attributed to work performed by persons who are not full-time, permanent employees of Deloitte Entities is as follows:
Fund | 2004 |
Value Portfolio | 0% |
(g) For the fiscal years ended December 31, 2004 and December 31, 2003, the aggregate fees billed by PwC of $2,700,000A and $1,950,000A,B for non-audit services rendered on behalf of the funds, FMR (not including any sub-adviser whose role is primarily portfolio management and is subcontracted with or overseen by another investment adviser) and Fund Service Providers relating to Covered Services and Non-Covered Services are shown in the table below.
| 2004A | 2003A,B |
Covered Services | $550,000 | $300,000 |
Non-Covered Services | $2,150,000 | $1,650,000 |
A | Aggregate amounts may reflect rounding. |
B | Includes amounts related to non-audit services prior to May 6, 2003 that would have been subject to pre-approval if the SEC rules relating to the pre-approval of non-audit services had been in effect at that time. |
For the fiscal years ended December 31, 2004 and December 31, 2003, the aggregate fees billed by Deloitte Entities of $1,350,000A and $1,350,000A, B for non-audit services rendered on behalf of the fund, FMR (not including any sub-adviser whose role is primarily portfolio management and is subcontracted with or overseen by another investment adviser) and Fund Service Providers relating to Covered Services and Non-Covered Services are shown in the table below.
| 2004A | 2003A, B |
Covered Services | $850,000 | $150,000 |
Non-Covered Services | $500,000 | $1,200,000 |
A | Aggregate amounts may reflect rounding. |
B | Includes amounts related to non-audit services prior to May 6, 2003 that would have been subject to pre-approval if the SEC rules relating to the pre-approval of non-audit services had been in effect at that time. |
(h) The trust's Audit Committee has considered Non-Covered Services that were not pre-approved that were provided by PwC and Deloitte Entities to Fund Service Providers to be compatible with maintaining the independence of PwC and Deloitte Entities in their audit of the funds, taking into account representations from PwC and Deloitte Entities, in accordance with Independence Standards Board Standard No.1, regarding their independence from the funds and their related entities.
Item 5. Audit Committee of Listed Registrants
Not applicable.
Item 6. Schedule of Investments
Not applicable.
Item 7. Disclosure of Proxy Voting Policies and Procedures for Closed-End Management Investment Companies
Not applicable.
Item 8. Portfolio Managers of Closed-End Management Investment Companies
Not applicable.
Item 9. Purchase of Equity Securities by Closed-End Management Investment Company and Affiliated Purchasers
Not applicable.
Item 10. Submission of Matters to a Vote of Security Holders
There were no material changes to the procedures by which shareholders may recommend nominees to the trust's Board of Trustees.
Item 11. Controls and Procedures
(a)(i) The President and Treasurer and the Chief Financial Officer have concluded that the trust's disclosure controls and procedures (as defined in Rule 30a-3(c) under the Investment Company Act) provide reasonable assurances that material information relating to the trust is made known to them by the appropriate persons, based on their evaluation of these controls and procedures as of a date within 90 days of the filing date of this report.
(a)(ii) There was no change in the trust's internal control over financial reporting (as defined in Rule 30a-3(d) under the Investment Company Act) that occurred during the second fiscal quarter of the period covered by this report that has materially affected, or is reasonably likely to materially affect, the trust's internal control over financial reporting.
Item 12. Exhibits
(a) | (1) | Code of Ethics pursuant to Item 2 of Form N-CSR is filed and attached hereto as EX-99.CODE ETH. |
(a) | (2) | Certification pursuant to Rule 30a-2(a) under the Investment Company Act of 1940 (17 CFR 270.30a-2(a)) is filed and attached hereto as Exhibit 99.CERT. |
(a) | (3) | Not applicable. |
(b) | | Certification pursuant to Rule 30a-2(b) under the Investment Company Act of 1940 (17 CFR 270.30a-2(b)) is furnished and attached hereto as Exhibit 99.906CERT. |
SIGNATURES
Pursuant to the requirements of the Securities Exchange Act of 1934 and the Investment Company Act of 1940, the registrant has duly caused this report to be signed on its behalf by the undersigned, thereunto duly authorized.
Variable Insurance Products Fund
By: | /s/Christine Reynolds |
| Christine Reynolds |
| President and Treasurer |
| |
Date: | February 24, 2005 |
Pursuant to the requirements of the Securities Exchange Act of 1934 and the Investment Company Act of 1940, this report has been signed below by the following persons on behalf of the registrant and in the capacities and on the dates indicated.
By: | /s/Christine Reynolds |
| Christine Reynolds |
| President and Treasurer |
| |
Date: | February 24, 2005 |
By: | /s/Timothy F. Hayes |
| Timothy F. Hayes |
| Chief Financial Officer |
| |
Date: | February 24, 2005 |