UNITED STATES
SECURITIES AND EXCHANGE COMMISSION
Washington, D.C. 20549
FORM N-CSR
CERTIFIED SHAREHOLDER REPORT OF REGISTERED
MANAGEMENT INVESTMENT COMPANIES
Investment Company Act file number 811-3329
Variable Insurance Products Fund
(Exact name of registrant as specified in charter)
82 Devonshire St., Boston, Massachusetts 02109
(Address of principal executive offices) (Zip code)
Eric D. Roiter, Secretary
82 Devonshire St.
Boston, Massachusetts 02109
(Name and address of agent for service)
Registrant's telephone number, including area code: 617-563-7000
Date of fiscal year end: | December 31 |
| |
Date of reporting period: | December 31, 2004 |
Item 1. Reports to Stockholders
Fidelity® Variable Insurance Products:
Equity-Income Portfolio
Annual Report
December 31, 2004
(2_fidelity_logos) (Registered_Trademark)
Contents
Performance | 3 | How the fund has done over time. |
Management's Discussion | 4 | The manager's review of fund performance, strategy and outlook. |
Shareholder Expense Example | 5 | An example of shareholder expenses. |
Investment Summary | 6 | A summary of the fund's investments at period end. |
Investments | 7 | A complete list of the fund's investments with their
market values. |
Financial Statements | 13 | Statements of assets and liabilities, operations, and
changes in net assets, as well as financial highlights. |
Notes | 17 | Notes to the financial statements. |
Report of Independent Registered Public Accounting Firm | 21 | |
Trustees and Officers | 22 | |
Distributions | 27 | |
Proxy Voting Results | 28 | |
| | |
To view a fund's proxy voting guidelines and proxy voting record for the 12-month period ended June 30, visit www.fidelity.com/proxyvotingresults or visit the Securities and Exchange Commission's (SEC) web site at www.sec.gov. You may also call 1-800-544-5429 to request a free copy of the proxy voting guidelines.
Fidelity Variable Insurance Products are separate account options which are purchased through a variable insurance contract.
Standard & Poor's, S&P and S&P 500 are registered service marks of The McGraw-Hill Companies, Inc. and have been licensed for use by Fidelity Distributors Corporation.
Other third party marks appearing herein are the property of their respective owners.
All other marks appearing herein are registered or unregistered trademarks or service marks of FMR Corp. or an affiliated company.
(Recycle graphic) This report is printed on recycled paper using soy-based inks.
This report and the financial statements contained herein are submitted for the general information of the shareholders of the fund. This report is not authorized for distribution to prospective investors in the fund unless preceded or accompanied by an effective prospectus.
A fund files its complete schedule of portfolio holdings with the SEC for the first and third quarters of each fiscal year on Form N-Q. Forms N-Q are available on the SEC's web site at http://www.sec.gov. A fund's Forms N-Q may be reviewed and copied at the SEC's Public Reference Room in Washington, DC. Information regarding the operation of the SEC's Public Reference Room may be obtained by calling 1-800-SEC-0330. For a complete list of a fund's portfolio holdings, view the most recent quarterly holdings report, semiannual report, or annual report on Fidelity's web site at http://www.advisor.fidelity.com.
NOT FDIC INSURED · MAY LOSE VALUE · NO BANK GUARANTEE
Neither the fund nor Fidelity Distributors Corporation is a bank.
Annual Report
Fidelity Variable Insurance Products: Equity-Income Portfolio
Performance: The Bottom Line
Average annual total return reflects the change in the value of an investment, assuming reinvestment of a class' dividend income and capital gains (the profits earned upon the sale of securities that have grown in value) and assuming a constant rate of performance each year. During periods of reimbursement by Fidelity, a fund's total return will be greater than it would be had the reimbursement not occurred. Performance numbers are net of all underlying fund operating expenses, but do not include any insurance charges imposed by your insurance company's separate account. If performance information included the effect of these additional charges, the total returns would be lower. How a fund did yesterday is no guarantee of how it will do tomorrow.
Average Annual Total Returns
Periods ended December 31, 2004 | Past 1
year | Past 5
years | Past 10
years |
Fidelity ® VIP: Equity-Income - Initial Class | 11.53% | 4.46% | 11.31% |
Fidelity VIP: Equity-Income - Service Class A | 11.38% | 4.35% | 11.23% |
Fidelity VIP: Equity-Income - Service Class 2 B | 11.23% | 4.19% | 11.15% |
A The initial offering of Service Class shares took place on November 3, 1997. Performance for Service Class shares reflects an asset-based distribution fee (12b-1 fee), and returns prior to November 3, 1997 are those of Initial Class and do not include the effects of Service Class' 12b-1 fee. Had Service Class' 12b-1 fee been reflected, returns prior to November 3, 1997 would have been lower.
B The initial offering of Service Class 2 shares took place on January 12, 2000. Performance for Service Class 2 shares reflects an asset-based distribution fee (12b-1 fee). Returns from November 3, 1997 to January 12, 2000 are those of Service Class which reflect a different 12b-1 fee. Service Class 2 returns prior to November 3, 1997 are those of Initial Class, and do not include the effects of a 12b-1 fee. Had Service Class 2 shares' 12b-1 fee been reflected, returns prior to January 12, 2000 would have been lower.
$10,000 Over 10 Years
Let's say hypothetically that $10,000 was invested in Fidelity ® Variable Insurance Products: Equity-Income Portfolio - Initial Class on December 31, 1994. The chart shows how the value of your investment would have changed, and also shows how the Russell 3000® Value Index performed over the same period.

Annual Report
Fidelity Variable Insurance Products: Equity-Income Portfolio
Management's Discussion of Fund Performance
Comments from Stephen Petersen, Portfolio Manager of Fidelity® Variable Insurance Products: Equity-Income Portfolio
The year ending December 31, 2004, generally was positive for equity investors, as many stock market benchmarks produced double-digit gains. Broad-based themes included the continued dominance of small-cap stocks, which outperformed large-caps for the sixth consecutive year. The small-cap Russell 2000® Index was up 18.33% in 2004, while the larger-cap Standard & Poor's 500SM Index rose 10.88%. Value stocks ended the year well ahead of growth stocks: The Russell 3000® Value Index advanced 16.94%, compared to 6.93% for the Russell 3000 Growth Index. Energy and basic materials stocks led the market upward. Energy stocks were boosted by record-high oil prices, while strong demand from China helped support commodity prices. The health care sector was among the market's weakest performers. Technology also fell off the pace, though it was helped by a rally late in the year. The tech-heavy NASDAQ Composite® Index returned 9.15%, thanks primarily to a 14.87% jump in the fourth quarter. Elsewhere, the Dow Jones Industrial AverageSM gained 5.37% for the year.
For the 12-month period ending December 31, 2004, the fund underperformed the LipperSM Variable Annuity Equity Income Objective Funds Average, which rose 13.51%, and the Russell 3000 Value Index. Mid- and small-cap stocks continued to outperform large-caps, which - along with out-of-favor stocks - are the fund's primary focus. As a result, it did not keep pace with the Russell index, which includes stocks of all market capitalizations. The fund's performance relative to the index also was hurt by its underweighting in financial stocks. Fund holdings Pfizer and Merck were hurt by competitive pressures from generic drug makers and company-specific issues: Merck was ordered to pull its arthritis drug, Vioxx, off the shelves, causing the stock price to plummet; Pfizer, which makes arthritis drug Celebrex, took a hit over concerns about the potential for similar problems with its own product. Conversely, energy holdings Exxon Mobil and Total SA did well as crude oil prices remained high, demand grew and excess supply evaporated.
The views expressed in this statement reflect those of the portfolio manager only through the end of the period of the report as stated on the cover and do not necessarily represent the views of Fidelity or any other person in the Fidelity organization. Any such views are subject to change at any time based upon market or other conditions and Fidelity disclaims any responsibility to update such views. These views may not be relied on as investment advice and, because investment decisions for a Fidelity fund are based on numerous factors, may not be relied on as an indication of trading intent on behalf of any Fidelity fund.
Annual Report
Fidelity Variable Insurance Products: Equity-Income Portfolio
Shareholder Expense Example
As a shareholder of the Fund, you incur two types of costs: (1) transaction costs, including redemption fees, and (2) ongoing costs, including management fees, distribution and/or service (12b-1) fees and other Fund expenses. This Example is intended to help you understand your ongoing costs (in dollars) of investing in the Fund and to compare these costs with the ongoing costs of investing in other mutual funds.
The Example is based on an investment of $1,000 invested at the beginning of the period and held for the entire period (July 1, 2004 to December 31, 2004).
Actual Expenses
The first line of the table below for each class of the Fund provides information about actual account values and actual expenses. You may use the information in this line, together with the amount you invested, to estimate the expenses that you paid over the period. Simply divide your account value by $1,000.00 (for example, an $8,600 account value divided by $1,000.00 = 8.6), then multiply the result by the number in the first line for a class of the Fund under the heading entitled "Expenses Paid During Period" to estimate the expenses you paid on your account during this period. The estimate of expenses does not include any fees or other expenses of any variable annuity or variable life insurance product. If they were, the estimate of expenses you paid during the period would be higher, and your ending account value would be lower.
Hypothetical Example for Comparison Purposes
The second line of the table below for each class of the Fund provides information about hypothetical account values and hypothetical expenses based on a Class' actual expense ratio and an assumed rate of return of 5% per year before expenses, which is not the Class' actual return. The hypothetical account values and expenses may not be used to estimate the actual ending account balance or expenses you paid for the period. You may use this information to compare the ongoing costs of investing in the Fund and other funds. To do so, compare this 5% hypothetical example with the 5% hypothetical examples that appear in the shareholder reports of the other funds. The estimate of expenses does not include any fees or other expenses of any variable annuity or variable life insurance product. If they were, the estimate of expenses you paid during the period would be higher, and your ending account value would be lower.
Please note that the expenses shown in the table are meant to highlight your ongoing costs only and do not reflect any transaction costs. Therefore, the second line of the table is useful in comparing ongoing costs only, and will not help you determine the relative total costs of owning different funds. In addition, if these transactional costs were included, your costs would have been higher.
| Beginning
Account Value
July 1, 2004 | Ending
Account Value
December 31, 2004 | Expenses Paid
During Period*
July 1, 2004
to December 31, 2004 |
Initial Class | | | |
Actual | $ 1,000.00 | $ 1,077.30 | $ 3.08 |
HypotheticalA | $ 1,000.00 | $ 1,022.17 | $ 3.00 |
Service Class | | | |
Actual | $ 1,000.00 | $ 1,077.10 | $ 3.60 |
HypotheticalA | $ 1,000.00 | $ 1,021.67 | $ 3.51 |
Service Class 2 | | | |
Actual | $ 1,000.00 | $ 1,076.40 | $ 4.38 |
HypotheticalA | $ 1,000.00 | $ 1,020.91 | $ 4.27 |
Service Class 2R | | | |
Actual | $ 1,000.00 | $ 1,075.70 | $ 4.38 |
HypotheticalA | $ 1,000.00 | $ 1,020.91 | $ 4.27 |
A 5% return per year before expenses
* Expenses are equal to each Class' annualized expense ratio (shown in the table below); multiplied by the average account value over the period, multiplied by 184/366 (to reflect the one-half year period).
| Annualized
Expense Ratio |
Initial Class | .59% |
Service Class | .69% |
Service Class 2 | .84% |
Service Class 2R | .84% |
Annual Report
Fidelity Variable Insurance Products: Equity-Income Portfolio
Investment Summary
Top Five Stocks as of December 31, 2004 |
| % of fund's net assets |
Bank of America Corp. | 3.1 |
Exxon Mobil Corp. | 3.1 |
Citigroup, Inc. | 2.8 |
American International Group, Inc. | 2.6 |
J.P. Morgan Chase & Co. | 2.3 |
| 13.9 |
Top Five Market Sectors as of December 31, 2004 |
| % of fund's net assets |
Financials | 30.2 |
Industrials | 12.1 |
Consumer Discretionary | 11.1 |
Energy | 10.8 |
Health Care | 7.9 |
Asset Allocation as of December 31, 2004 |
% of fund's net assets* |
 | Stocks | 99.1% | |
 | Bonds | 0.7% | |
 | Short-Term Investments and Net Other Assets | 0.2% | |
* Foreign investments | 11.9% | |

Annual Report
Fidelity Variable Insurance Products: Equity-Income Portfolio
Investments December 31, 2004
Showing Percentage of Net Assets
Common Stocks - 98.0% |
| Shares | | Value (Note 1) |
CONSUMER DISCRETIONARY - 10.5% |
Auto Components - 0.1% |
TRW Automotive Holdings Corp. | 611,370 | | $ 12,655,359 |
Automobiles - 0.4% |
Toyota Motor Corp. ADR | 475,900 | | 38,961,933 |
Hotels, Restaurants & Leisure - 1.2% |
Caesars Entertainment, Inc. (a) | 1,927,700 | | 38,823,878 |
McDonald's Corp. | 2,561,300 | | 82,115,278 |
Six Flags, Inc. (a) | 642,256 | | 3,448,915 |
Wendy's International, Inc. | 128,800 | | 5,056,688 |
| | 129,444,759 |
Household Durables - 1.2% |
Koninklijke Philips Electronics NV (NY Shares) | 601,900 | | 15,950,350 |
LG Electronics, Inc. | 237,410 | | 14,700,524 |
Maytag Corp. | 1,357,020 | | 28,633,122 |
Newell Rubbermaid, Inc. | 2,451,900 | | 59,311,461 |
Sony Corp. sponsored ADR | 128,500 | | 5,006,360 |
The Stanley Works | 128,500 | | 6,295,215 |
| | 129,897,032 |
Leisure Equipment & Products - 0.0% |
Eastman Kodak Co. | 128,400 | | 4,140,900 |
Media - 6.0% |
Clear Channel Communications, Inc. | 2,716,100 | | 90,962,189 |
Comcast Corp. Class A (a) | 2,852,091 | | 94,917,588 |
Fox Entertainment Group, Inc.
Class A (a) | 577,900 | | 18,065,154 |
Liberty Media Corp. Class A (a) | 3,912,376 | | 42,957,888 |
Liberty Media International, Inc.
Class A (a) | 613,999 | | 28,385,174 |
The Reader's Digest Association, Inc. (non-vtg.) | 1,699,003 | | 23,633,132 |
Time Warner, Inc. (a) | 6,982,850 | | 135,746,604 |
Viacom, Inc. Class B (non-vtg.) | 3,720,586 | | 135,392,125 |
Vivendi Universal SA sponsored ADR (a) | 904,300 | | 29,000,901 |
Walt Disney Co. | 2,763,400 | | 76,822,520 |
| | 675,883,275 |
Multiline Retail - 0.7% |
Big Lots, Inc. (a) | 2,275,956 | | 27,607,349 |
Dollar Tree Stores, Inc. (a) | 790,100 | | 22,660,068 |
Family Dollar Stores, Inc. | 706,500 | | 22,063,995 |
Sears, Roebuck & Co. | 214,100 | | 10,925,523 |
| | 83,256,935 |
Specialty Retail - 0.7% |
Abercrombie & Fitch Co. Class A | 128,400 | | 6,028,380 |
AnnTaylor Stores Corp. (a) | 1,113,050 | | 23,963,967 |
Gap, Inc. | 1,267,900 | | 26,778,048 |
Toys 'R' Us, Inc. (a) | 1,295,900 | | 26,527,073 |
| | 83,297,468 |
|
| Shares | | Value (Note 1) |
Textiles, Apparel & Luxury Goods - 0.2% |
Liz Claiborne, Inc. | 632,940 | | $ 26,716,397 |
TOTAL CONSUMER DISCRETIONARY | | 1,184,254,058 |
CONSUMER STAPLES - 6.2% |
Beverages - 0.6% |
Anheuser-Busch Companies, Inc. | 1,282,400 | | 65,056,152 |
Food & Staples Retailing - 1.2% |
Albertsons, Inc. | 720,600 | | 17,207,928 |
CVS Corp. | 1,090,700 | | 49,157,849 |
Wal-Mart Stores, Inc. | 1,284,200 | | 67,831,444 |
| | 134,197,221 |
Food Products - 1.0% |
General Mills, Inc. | 278,600 | | 13,849,206 |
H.J. Heinz Co. | 281,120 | | 10,960,869 |
Kellogg Co. | 149,800 | | 6,690,068 |
Kraft Foods, Inc. Class A | 943,100 | | 33,583,791 |
Unilever PLC sponsored ADR | 1,141,000 | | 45,092,320 |
| | 110,176,254 |
Household Products - 2.0% |
Colgate-Palmolive Co. | 2,194,400 | | 112,265,504 |
Kimberly-Clark Corp. | 1,169,800 | | 76,984,538 |
Procter & Gamble Co. | 710,400 | | 39,128,832 |
| | 228,378,874 |
Personal Products - 0.6% |
Gillette Co. | 1,605,120 | | 71,877,274 |
Tobacco - 0.8% |
Altria Group, Inc. | 1,562,800 | | 95,487,080 |
TOTAL CONSUMER STAPLES | | 705,172,855 |
ENERGY - 10.8% |
Energy Equipment & Services - 2.4% |
Baker Hughes, Inc. | 1,373,800 | | 58,620,046 |
BJ Services Co. | 536,645 | | 24,975,458 |
Halliburton Co. | 708,200 | | 27,789,768 |
Noble Corp. (a) | 817,100 | | 40,642,554 |
Schlumberger Ltd. (NY Shares) | 1,768,900 | | 118,427,855 |
| | 270,455,681 |
Oil & Gas - 8.4% |
Apache Corp. | 647,780 | | 32,758,235 |
BP PLC sponsored ADR | 2,459,842 | | 143,654,773 |
ChevronTexaco Corp. | 2,480,842 | | 130,269,013 |
Exxon Mobil Corp. | 6,841,236 | | 350,681,757 |
Royal Dutch Petroleum Co. (NY Shares) | 664,300 | | 38,117,534 |
Total SA: | | | |
Series B | 341,300 | | 74,976,784 |
sponsored ADR | 1,652,996 | | 181,565,081 |
| | 952,023,177 |
TOTAL ENERGY | | 1,222,478,858 |
Common Stocks - continued |
| Shares | | Value (Note 1) |
FINANCIALS - 29.6% |
Capital Markets - 4.9% |
Bank of New York Co., Inc. | 3,107,200 | | $ 103,842,624 |
Charles Schwab Corp. | 5,679,300 | | 67,924,428 |
Credit Suisse Group sponsored ADR | 610,000 | | 25,735,900 |
Janus Capital Group, Inc. | 2,332,400 | | 39,207,644 |
LaBranche & Co., Inc. (a)(c) | 517,900 | | 4,640,384 |
Mellon Financial Corp. | 1,716,500 | | 53,400,315 |
Merrill Lynch & Co., Inc. | 1,610,300 | | 96,247,631 |
Morgan Stanley | 2,073,600 | | 115,126,272 |
Nomura Holdings, Inc. | 1,853,000 | | 26,979,681 |
State Street Corp. | 386,200 | | 18,970,144 |
| | 552,075,023 |
Commercial Banks - 7.3% |
Bank of America Corp. | 7,600,666 | | 357,155,294 |
Comerica, Inc. | 730,200 | | 44,556,804 |
Lloyds TSB Group PLC | 2,282,400 | | 20,717,588 |
Royal Bank of Scotland Group PLC | 625,547 | | 21,031,989 |
State Bank of India | 463,175 | | 7,573,045 |
Sumitomo Mitsui Financial Group, Inc. | 2,994 | | 21,776,140 |
U.S. Bancorp, Delaware | 1,909,838 | | 59,816,126 |
Wachovia Corp. | 2,934,075 | | 154,332,345 |
Wells Fargo & Co. | 2,176,800 | | 135,288,120 |
| | 822,247,451 |
Consumer Finance - 1.3% |
American Express Co. | 1,542,996 | | 86,978,685 |
MBNA Corp. | 1,456,400 | | 41,055,916 |
MoneyGram International, Inc. | 1,014,600 | | 21,448,644 |
| | 149,483,245 |
Diversified Financial Services - 5.5% |
CIT Group, Inc. | 1,049,200 | | 48,074,344 |
Citigroup, Inc. | 6,481,619 | | 312,284,403 |
J.P. Morgan Chase & Co. | 6,788,812 | | 264,831,556 |
| | 625,190,303 |
Insurance - 7.7% |
ACE Ltd. | 2,238,115 | | 95,679,416 |
Allianz AG sponsored ADR | 1,115,700 | | 14,827,653 |
Allstate Corp. | 2,059,400 | | 106,512,168 |
American International Group, Inc. | 4,377,250 | | 287,454,008 |
Assurant, Inc. | 164,900 | | 5,037,695 |
Conseco, Inc. (a) | 1,262,800 | | 25,192,860 |
Fondiaria-Sai Spa (c) | 541,144 | | 14,556,983 |
Genworth Financial, Inc. Class A | 1,087,200 | | 29,354,400 |
Hartford Financial Services Group, Inc. | 1,104,500 | | 76,552,895 |
Marsh & McLennan Companies, Inc. | 793,600 | | 26,109,440 |
|
| Shares | | Value (Note 1) |
Muenchener Rueckversicherungs-Gesellschaft AG (Reg.) | 123,914 | | $ 15,204,241 |
Old Republic International Corp. | 530,996 | | 13,434,199 |
St. Paul Travelers Companies, Inc. | 2,542,926 | | 94,266,267 |
The Chubb Corp. | 439,000 | | 33,759,100 |
XL Capital Ltd. Class A | 428,300 | | 33,257,495 |
| | 871,198,820 |
Real Estate - 0.1% |
CarrAmerica Realty Corp. | 193,740 | | 6,393,420 |
Thrifts & Mortgage Finance - 2.8% |
Fannie Mae | 2,818,100 | | 200,676,901 |
Freddie Mac | 717,900 | | 52,909,230 |
Housing Development Finance Corp. Ltd. | 1,133,500 | | 20,155,333 |
MGIC Investment Corp. | 195,900 | | 13,499,469 |
Sovereign Bancorp, Inc. | 1,371,550 | | 30,928,453 |
| | 318,169,386 |
TOTAL FINANCIALS | | 3,344,757,648 |
HEALTH CARE - 7.7% |
Health Care Equipment & Supplies - 1.2% |
Baxter International, Inc. | 3,124,600 | | 107,923,684 |
Thermo Electron Corp. (a) | 667,000 | | 20,136,730 |
| | 128,060,414 |
Health Care Providers & Services - 1.3% |
Cardinal Health, Inc. | 706,100 | | 41,059,715 |
HCA, Inc. | 333,500 | | 13,326,660 |
McKesson Corp. | 1,307,500 | | 41,133,950 |
Tenet Healthcare Corp. (a) | 2,188,900 | | 24,034,122 |
UnitedHealth Group, Inc. | 334,200 | | 29,419,626 |
| | 148,974,073 |
Pharmaceuticals - 5.2% |
Abbott Laboratories | 857,000 | | 39,979,050 |
Bristol-Myers Squibb Co. | 2,517,500 | | 64,498,350 |
GlaxoSmithKline PLC sponsored ADR | 430,600 | | 20,406,134 |
Johnson & Johnson | 2,077,200 | | 131,736,024 |
Merck & Co., Inc. | 2,683,400 | | 86,244,476 |
Pfizer, Inc. | 3,579,000 | | 96,239,310 |
Schering-Plough Corp. | 3,703,130 | | 77,321,354 |
Wyeth | 1,713,500 | | 72,977,965 |
| | 589,402,663 |
TOTAL HEALTH CARE | | 866,437,150 |
INDUSTRIALS - 12.0% |
Aerospace & Defense - 3.4% |
Bombardier, Inc. Class B (sub. vtg.) | 2,376,500 | | 4,713,392 |
EADS NV | 1,540,015 | | 44,686,006 |
Honeywell International, Inc. | 2,956,625 | | 104,694,091 |
Lockheed Martin Corp. | 1,439,400 | | 79,958,670 |
Common Stocks - continued |
| Shares | | Value (Note 1) |
INDUSTRIALS - continued |
Aerospace & Defense - continued |
Northrop Grumman Corp. | 903,000 | | $ 49,087,080 |
Raytheon Co. | 288,678 | | 11,209,367 |
The Boeing Co. | 865,000 | | 44,781,050 |
United Technologies Corp. | 379,520 | | 39,223,392 |
| | 378,353,048 |
Air Freight & Logistics - 0.1% |
Ryder System, Inc. | 123,200 | | 5,885,264 |
Airlines - 0.2% |
Southwest Airlines Co. | 1,586,900 | | 25,834,732 |
Commercial Services & Supplies - 0.3% |
Waste Management, Inc. | 1,286,100 | | 38,505,834 |
Construction & Engineering - 0.2% |
Fluor Corp. | 368,900 | | 20,108,739 |
Electrical Equipment - 0.3% |
Emerson Electric Co. | 550,200 | | 38,569,020 |
Industrial Conglomerates - 3.8% |
3M Co. | 342,400 | | 28,100,768 |
General Electric Co. | 4,291,540 | | 156,641,210 |
Hutchison Whampoa Ltd. | 2,304,000 | | 21,564,430 |
Siemens AG sponsored ADR | 248,700 | | 21,057,429 |
Textron, Inc. | 717,500 | | 52,951,500 |
Tyco International Ltd. | 4,166,646 | | 148,915,928 |
| | 429,231,265 |
Machinery - 2.7% |
Caterpillar, Inc. | 510,300 | | 49,759,353 |
Deere & Co. | 193,250 | | 14,377,800 |
Dover Corp. | 850,600 | | 35,674,164 |
Eaton Corp. | 212,900 | | 15,405,444 |
Illinois Tool Works, Inc. | 176,200 | | 16,330,216 |
Ingersoll-Rand Co. Ltd. Class A | 1,043,044 | | 83,756,433 |
Navistar International Corp. (a) | 508,495 | | 22,363,610 |
SPX Corp. | 1,550,600 | | 62,117,036 |
| | 299,784,056 |
Road & Rail - 1.0% |
Burlington Northern Santa Fe Corp. | 1,236,500 | | 58,498,815 |
Union Pacific Corp. | 807,900 | | 54,331,275 |
| | 112,830,090 |
TOTAL INDUSTRIALS | | 1,349,102,048 |
INFORMATION TECHNOLOGY - 6.9% |
Communications Equipment - 0.9% |
Lucent Technologies, Inc. (a) | 4,816,600 | | 18,110,416 |
Lucent Technologies, Inc. warrants 12/10/07 (a) | 8,328 | | 13,158 |
Motorola, Inc. | 3,578,112 | | 61,543,526 |
Nokia Corp. sponsored ADR | 1,182,000 | | 18,521,940 |
| | 98,189,040 |
|
| Shares | | Value (Note 1) |
Computers & Peripherals - 1.8% |
Hewlett-Packard Co. | 3,850,311 | | $ 80,741,022 |
International Business Machines Corp. | 868,400 | | 85,606,872 |
Storage Technology Corp. (a) | 710,110 | | 22,446,577 |
Sun Microsystems, Inc. (a) | 3,998,675 | | 21,512,872 |
| | 210,307,343 |
Electronic Equipment & Instruments - 0.8% |
Agilent Technologies, Inc. (a) | 429,600 | | 10,353,360 |
Arrow Electronics, Inc. (a) | 830,900 | | 20,190,870 |
Avnet, Inc. (a) | 1,584,330 | | 28,898,179 |
Solectron Corp. (a) | 5,530,200 | | 29,475,966 |
| | 88,918,375 |
IT Services - 0.1% |
Ceridian Corp. (a) | 780,800 | | 14,273,024 |
Office Electronics - 0.3% |
Xerox Corp. (a) | 1,881,900 | | 32,011,119 |
Semiconductors & Semiconductor Equipment - 2.1% |
Analog Devices, Inc. | 1,113,300 | | 41,103,036 |
Applied Materials, Inc. (a) | 1,369,900 | | 23,425,290 |
Freescale Semiconductor, Inc. Class B | 1,468,877 | | 26,968,582 |
Intel Corp. | 3,219,100 | | 75,294,749 |
Micron Technology, Inc. (a) | 1,866,200 | | 23,047,570 |
National Semiconductor Corp. | 235,200 | | 4,221,840 |
Rohm Co. Ltd. | 148,300 | | 15,346,871 |
Samsung Electronics Co. Ltd. | 55,670 | | 24,226,562 |
Teradyne, Inc. (a) | 107,400 | | 1,833,318 |
| | 235,467,818 |
Software - 0.9% |
Computer Associates International, Inc. | 1,381 | | 42,894 |
Microsoft Corp. | 3,735,200 | | 99,767,192 |
| | 99,810,086 |
TOTAL INFORMATION TECHNOLOGY | | 778,976,805 |
MATERIALS - 6.2% |
Chemicals - 2.6% |
Air Products & Chemicals, Inc. | 64,300 | | 3,727,471 |
Arch Chemicals, Inc. | 392,800 | | 11,304,784 |
Dow Chemical Co. | 2,015,700 | | 99,797,307 |
Eastman Chemical Co. | 476,800 | | 27,525,664 |
Great Lakes Chemical Corp. | 650,500 | | 18,532,745 |
Lubrizol Corp. | 214,800 | | 7,917,528 |
Lyondell Chemical Co. | 2,272,593 | | 65,723,375 |
Nalco Holding Co. | 95,700 | | 1,868,064 |
Olin Corp. | 682,700 | | 15,033,054 |
PolyOne Corp. (a) | 1,239,100 | | 11,226,246 |
Praxair, Inc. | 621,624 | | 27,444,700 |
| | 290,100,938 |
Common Stocks - continued |
| Shares | | Value (Note 1) |
MATERIALS - continued |
Containers & Packaging - 0.5% |
Amcor Ltd. | 963,600 | | $ 5,541,317 |
Smurfit-Stone Container Corp. (a) | 2,515,872 | | 46,996,489 |
| | 52,537,806 |
Metals & Mining - 1.8% |
Alcan, Inc. | 955,100 | | 46,799,900 |
Alcoa, Inc. | 2,616,216 | | 82,201,507 |
Freeport-McMoRan Copper & Gold, Inc. Class B | 820,704 | | 31,375,514 |
Phelps Dodge Corp. | 437,600 | | 43,287,392 |
| | 203,664,313 |
Paper & Forest Products - 1.3% |
Bowater, Inc. (c) | 391,300 | | 17,205,461 |
Georgia-Pacific Corp. | 1,353,201 | | 50,717,973 |
International Paper Co. | 999,700 | | 41,987,400 |
Weyerhaeuser Co. | 610,400 | | 41,031,088 |
| | 150,941,922 |
TOTAL MATERIALS | | 697,244,979 |
TELECOMMUNICATION SERVICES - 5.3% |
Diversified Telecommunication Services - 4.9% |
BellSouth Corp. | 5,303,299 | | 147,378,679 |
Qwest Communications International, Inc. (a) | 3,728,500 | | 16,554,540 |
SBC Communications, Inc. | 7,035,993 | | 181,317,540 |
Sprint Corp. | 1,161,600 | | 28,865,760 |
Verizon Communications, Inc. | 4,370,102 | | 177,032,832 |
| | 551,149,351 |
Wireless Telecommunication Services - 0.4% |
Crown Castle International Corp. (a) | 910,400 | | 15,149,056 |
KDDI Corp. | 3,028 | | 16,318,032 |
Vodafone Group PLC sponsored ADR | 556,500 | | 15,236,970 |
| | 46,704,058 |
TOTAL TELECOMMUNICATION SERVICES | | 597,853,409 |
UTILITIES - 2.8% |
Electric Utilities - 1.5% |
Entergy Corp. | 765,900 | | 51,767,181 |
FirstEnergy Corp. | 428,200 | | 16,918,182 |
PG&E Corp. (a) | 403,800 | | 13,438,464 |
TXU Corp. | 654,820 | | 42,275,179 |
Wisconsin Energy Corp. | 1,414,600 | | 47,686,166 |
| | 172,085,172 |
Gas Utilities - 0.0% |
AGL Resources, Inc. | 109,500 | | 3,639,780 |
|
| Shares | | Value (Note 1) |
Multi-Utilities & Unregulated Power - 1.3% |
Dominion Resources, Inc. | 1,305,300 | | $ 88,421,022 |
NorthWestern Energy Corp. (a) | 85,500 | | 2,394,000 |
Public Service Enterprise Group, Inc. | 1,026,100 | | 53,121,197 |
| | 143,936,219 |
TOTAL UTILITIES | | 319,661,171 |
TOTAL COMMON STOCKS (Cost $8,380,344,823) | 11,065,938,981 |
Convertible Preferred Stocks - 1.1% |
| | | |
CONSUMER DISCRETIONARY - 0.2% |
Automobiles - 0.1% |
General Motors Corp.: | | | |
Series B, 5.25% | 412,200 | | 9,472,356 |
Series C, 6.25% | 253,100 | | 6,671,716 |
| | 16,144,072 |
Hotels, Restaurants & Leisure - 0.1% |
Six Flags, Inc. 7.25% PIERS | 388,400 | | 8,603,060 |
TOTAL CONSUMER DISCRETIONARY | | 24,747,132 |
FINANCIALS - 0.5% |
Capital Markets - 0.1% |
State Street Corp. 6.75% | 24,900 | | 5,556,186 |
Consumer Finance - 0.2% |
Ford Motor Co. Capital Trust II 6.50% | 461,500 | | 24,392,583 |
Insurance - 0.2% |
Conseco, Inc. Series B, 5.50% | 143,400 | | 3,782,892 |
The Chubb Corp.: | | | |
7.00% | 167,700 | | 4,937,591 |
Series B, 7.00% | 120,100 | | 3,603,000 |
Travelers Property Casualty Corp. 4.50% | 240,200 | | 5,483,045 |
XL Capital Ltd. 6.50% | 401,800 | | 10,127,369 |
| | 27,933,897 |
TOTAL FINANCIALS | | 57,882,666 |
HEALTH CARE - 0.2% |
Health Care Equipment & Supplies - 0.1% |
Baxter International, Inc. 7.00% | 156,900 | | 8,811,504 |
Pharmaceuticals - 0.1% |
Schering-Plough Corp. 6.00% | 187,400 | | 10,482,781 |
TOTAL HEALTH CARE | | 19,294,285 |
INFORMATION TECHNOLOGY - 0.2% |
Office Electronics - 0.2% |
Xerox Corp. Series C, 6.25% | 145,650 | | 21,476,675 |
TOTAL CONVERTIBLE PREFERRED STOCKS (Cost $116,492,275) | 123,400,758 |
Corporate Bonds - 0.7% |
| Principal
Amount | | Value
(Note 1) |
Convertible Bonds - 0.6% |
CONSUMER DISCRETIONARY - 0.4% |
Hotels, Restaurants & Leisure - 0.1% |
Royal Caribbean Cruises Ltd. liquid yield option note 0% 2/2/21 | $ 11,239,000 | | $ 7,192,960 |
Six Flags, Inc. 4.5% 5/15/15 | 3,640,000 | | 4,095,000 |
| | 11,287,960 |
Media - 0.2% |
Liberty Media Corp.3.5% 1/15/31 (d) | 11,400,000 | | 10,773,000 |
News America, Inc. liquid yield option note 0% 2/28/21 (d) | 22,670,000 | | 13,295,955 |
| | 24,068,955 |
Specialty Retail - 0.1% |
Gap, Inc. 5.75% 3/15/09 | 8,590,000 | | 11,417,828 |
TOTAL CONSUMER DISCRETIONARY | | 46,774,743 |
FINANCIALS - 0.1% |
Diversified Financial Services - 0.0% |
Navistar Financial Corp. 4.75% 4/1/09 (d) | 2,760,000 | | 2,821,879 |
Insurance - 0.1% |
Loews Corp. 3.125% 9/15/07 | 5,340,000 | | 5,246,550 |
TOTAL FINANCIALS | | 8,068,429 |
INDUSTRIALS - 0.1% |
Industrial Conglomerates - 0.1% |
Tyco International Group SA yankee 3.125% 1/15/23 | 5,220,000 | | 8,781,084 |
INFORMATION TECHNOLOGY - 0.0% |
Electronic Equipment & Instruments - 0.0% |
Celestica, Inc. liquid yield option note 0% 8/1/20 | 620,000 | | 344,100 |
TELECOMMUNICATION SERVICES - 0.0% |
Diversified Telecommunication Services - 0.0% |
Level 3 Communications, Inc. 5.25% 12/15/11 (d) | 6,420,000 | | 6,474,570 |
TOTAL CONVERTIBLE BONDS | | 70,442,926 |
|
| Principal
Amount | | Value
(Note 1) |
Nonconvertible Bonds - 0.1% |
CONSUMER DISCRETIONARY - 0.0% |
Media - 0.0% |
XM Satellite Radio, Inc. 12% 6/15/10 | $ 60,000 | | $ 70,800 |
MATERIALS - 0.1% |
Chemicals - 0.1% |
Hercules, Inc. 6.5% 6/30/29 unit | 15,700,000 | | 13,366,980 |
TOTAL NONCONVERTIBLE BONDS | | 13,437,780 |
TOTAL CORPORATE BONDS (Cost $83,532,173) | 83,880,706 |
Money Market Funds - 0.3% |
| Shares | | |
Fidelity Cash Central Fund, 2.24% (b) | 12,522,005 | | 12,522,005 |
Fidelity Securities Lending Cash Central Fund, 2.23% (b)(e) | 16,586,000 | | 16,586,000 |
TOTAL MONEY MARKET FUNDS (Cost $29,108,005) | 29,108,005 |
TOTAL INVESTMENT
PORTFOLIO - 100.1% (Cost $8,609,477,276) | | 11,302,328,450 |
NET OTHER ASSETS - (0.1)% | | (15,105,563) |
NET ASSETS - 100% | $ 11,287,222,887 |
Security Type Abbreviations |
PIERS - Preferred Income Equity Redeemable Securities |
Legend |
(a) Non-income producing |
(b) Affiliated fund that is available only to investment companies and other accounts managed by Fidelity Investments. The rate quoted is the annualized seven-day yield of the fund at period end. A complete listing of the fund's holdings as of its most recent fiscal year end is available upon request. |
(c) Security or a portion of the security is on loan at period end. |
(d) Security exempt from registration under Rule 144A of the Securities Act of 1933. These securities may be resold in transactions exempt from registration, normally to qualified institutional buyers. At the period end, the value of these securities amounted to $33,365,404 or 0.3% of net assets. |
(e) Includes investment made with cash collateral received from securities on loan. |
Distribution of investments by country of issue, as a percentage of total net assets, is as follows: |
United States of America | 88.1% |
France | 2.6% |
United Kingdom | 2.4% |
Japan | 1.2% |
Netherlands Antilles | 1.1% |
Others (individually less than 1%) | 4.6% |
| 100.0% |
Income Tax Information |
The fund hereby designates as capital gain dividends: For dividends with respect to the taxable year ended December 31, 2004, $346,587,000 or, if different, the net capital gain of such year, and for dividends with respect to the taxable year ended December 31, 2003, $38,802,000 or, if different, the excess of (a) the net capital gain of such year, over (b) amounts previously designated as capital gain dividends with respect to such year. |
See accompanying notes which are an integral part of the financial statements.
Equity-Income Portfolio
Fidelity Variable Insurance Products: Equity-Income Portfolio
Financial Statements
Statement of Assets and Liabilities
December 31, 2004 |
Assets | | |
Investment in securities, at value (including securities loaned of $15,755,088) (cost $8,609,477,276) - See accompanying schedule | | $ 11,302,328,450 |
Receivable for fund shares sold | | 3,091,666 |
Dividends receivable | | 15,480,610 |
Interest receivable | | 827,433 |
Prepaid expenses | | 40,772 |
Other affiliated receivables | | 47,175 |
Other receivables | | 339,933 |
Total assets | | 11,322,156,039 |
| | |
Liabilities | | |
Payable for investments purchased | $ 470,842 | |
Payable for fund shares redeemed | 10,653,620 | |
Accrued management fee | 4,398,026 | |
Distribution fees payable | 385,209 | |
Other affiliated payables | 953,526 | |
Other payables and accrued expenses | 1,485,929 | |
Collateral on securities loaned, at value | 16,586,000 | |
Total liabilities | | 34,933,152 |
| | |
Net Assets | | $ 11,287,222,887 |
Net Assets consist of: | | |
Paid in capital | | $ 8,042,639,374 |
Undistributed net investment income | | 170,688,068 |
Accumulated undistributed net realized gain (loss) on investments and foreign currency transactions | | 381,040,713 |
Net unrealized appreciation (depreciation) on investments and assets and liabilities in foreign currencies | | 2,692,854,732 |
Net Assets | | $ 11,287,222,887 |
| | |
Initial Class:
Net Asset Value, offering price
and redemption price per
share ($8,689,828,908 ÷ 342,542,001 shares) | | $ 25.37 |
| | |
Service Class:
Net Asset Value, offering price
and redemption price per
share ($1,170,777,702 ÷ 46,313,238 shares) | | $ 25.28 |
| | |
Service Class 2:
Net Asset Value, offering price
and redemption price per
share ($1,420,999,293 ÷ 56,645,362 shares) | | $ 25.09 |
| | |
Service Class 2R:
Net Asset Value, offering price
and redemption price per
share ($5,616,984 ÷
224,552 shares) | | $ 25.01 |
Statement of Operations
Year ended December 31, 2004 |
Investment Income | | |
Dividends | | $ 236,033,278 |
Interest | | 4,492,568 |
Security lending | | 990,003 |
Total income | | 241,515,849 |
| | |
Expenses | | |
Management fee | $ 50,339,584 | |
Transfer agent fees | 7,040,948 | |
Distribution fees | 3,960,547 | |
Accounting and security lending fees | 1,403,577 | |
Non-interested trustees' compensation | 58,219 | |
Appreciation in deferred trustee compensation account | 26,259 | |
Custodian fees and expenses | 286,747 | |
Registration fees | 8,658 | |
Audit | 103,482 | |
Legal | 28,314 | |
Interest | 9,745 | |
Miscellaneous | 1,847,706 | |
Total expenses before reductions | 65,113,786 | |
Expense reductions | (874,557) | 64,239,229 |
Net investment income (loss) | | 177,276,620 |
Realized and Unrealized Gain (Loss) Net realized gain (loss) on: | | |
Investment securities | 393,977,845 | |
Foreign currency transactions | 10,545 | |
Total net realized gain (loss) | | 393,988,390 |
Change in net unrealized appreciation (depreciation) on: Investment securities (net of decrease in deferred foreign taxes of $1,499,172) | 595,198,380 | |
Assets and liabilities in foreign currencies | (21,670) | |
Total change in net unrealized appreciation (depreciation) | | 595,176,710 |
Net gain (loss) | | 989,165,100 |
Net increase (decrease) in net assets resulting from operations | | $ 1,166,441,720 |
See accompanying notes which are an integral part of the financial statements.
Annual Report
Fidelity Variable Insurance Products: Equity-Income Portfolio
Financial Statements - continued
Statement of Changes in Net Assets
| Year ended
December 31,
2004 | Year ended
December 31,
2003 |
Increase (Decrease) in Net Assets | | |
Operations | | |
Net investment income (loss) | $ 177,276,620 | $ 156,056,293 |
Net realized gain (loss) | 393,988,390 | 162,136,844 |
Change in net unrealized appreciation (depreciation) | 595,176,710 | 2,060,660,428 |
Net increase (decrease) in net assets resulting from operations | 1,166,441,720 | 2,378,853,565 |
Distributions to shareholders from net investment income | (160,632,605) | (152,426,442) |
Distributions to shareholders from net realized gain | (38,902,738) | - |
Total distributions | (199,535,343) | (152,426,442) |
Share transactions - net increase (decrease) | (72,700,137) | 95,024,961 |
Redemption fees | 27 | 6,803 |
Total increase (decrease) in net assets | 894,206,267 | 2,321,458,887 |
| | |
Net Assets | | |
Beginning of period | 10,393,016,620 | 8,071,557,733 |
End of period (including undistributed net investment income of $170,688,068 and undistributed net investment income of $153,745,641, respectively) | $ 11,287,222,887 | $ 10,393,016,620 |
Other Information: | | | | |
Share Transactions | Year ended December 31, 2004 |
| Initial Class | Service Class | Service Class 2 | Service Class 2R |
Shares Sold | 19,642,612 | 4,254,175 | 21,126,824 | 207,129 |
Reinvested | 6,898,356 | 858,454 | 759,147 | 2,031 |
Redeemed | (46,454,587) | (5,170,065) | (5,169,545) | (67,130) |
Net increase (decrease) | (19,913,619) | (57,436) | 16,716,426 | 142,030 |
| | | | |
Dollars Sold | $ 460,321,782 | $ 99,280,265 | $ 490,310,488 | $ 4,777,338 |
Reinvested | 161,766,458 | 20,079,238 | 17,642,584 | 47,063 |
Redeemed | (1,086,286,467) | (119,952,965) | (119,145,127) | (1,540,794) |
Net increase (decrease) | $ (464,198,227) | $ (593,462) | $ 388,807,945 | $ 3,283,607 |
| | | | |
Share Transactions | Year ended December 31, 2003 |
| Initial Class | Service Class | Service Class 2 | Service Class 2R |
Shares Sold | 32,080,268 | 11,240,469 | 21,169,436 | 138,968 |
Reinvested | 7,869,268 | 847,723 | 452,997 | 1,082 |
Redeemed | (57,207,152) | (8,346,250) | (4,117,145) | (83,694) |
Net increase (decrease) | (17,257,616) | 3,741,942 | 17,505,288 | 56,356 |
| | | | |
Dollars Sold | $ 628,858,276 | $ 219,068,172 | $ 416,030,936 | $ 2,784,343 |
Reinvested | 130,865,933 | 14,063,717 | 7,478,977 | 17,815 |
Redeemed | (1,083,344,265) | (159,436,339) | (79,803,985) | (1,558,619) |
Net increase (decrease) | $ (323,620,056) | $ 73,695,550 | $ 343,705,928 | $ 1,243,539 |
| | | | |
Distributions | Year ended December 31, 2004 |
| Initial Class | Service Class | Service Class 2 | Service Class 2R |
From net investment income | $ 130,573,823 | $ 16,025,683 | $ 13,995,319 | $ 37,780 |
From net realized gain | 31,192,635 | 4,053,555 | 3,647,265 | 9,283 |
Total | $ 161,766,458 | $ 20,079,238 | $ 17,642,584 | $ 47,063 |
| Year ended December 31, 2003 |
| Initial Class | Service Class | Service Class 2 | Service Class 2R |
From net investment income | $ 130,865,933 | $ 14,063,717 | $ 7,478,977 | $ 17,815 |
From net realized gain | - | - | - | - |
Total | $ 130,865,933 | $ 14,063,717 | $ 7,478,977 | $ 17,815 |
See accompanying notes which are an integral part of the financial statements.
Equity-Income Portfolio
Financial Highlights - Initial Class
Years ended December 31, | 2004 | 2003 | 2002 | 2001 | 2000 |
Selected Per-Share Data | | | | | |
Net asset value, beginning of period | $ 23.18 | $ 18.16 | $ 22.75 | $ 25.52 | $ 25.71 |
Income from Investment Operations | | | | | |
Net investment income (loss) C | .40 | .36 | .34 | .34 | .40 |
Net realized and unrealized gain (loss) | 2.24 | 5.01 | (4.08) | (1.51) | 1.46 |
Total from investment operations | 2.64 | 5.37 | (3.74) | (1.17) | 1.86 |
Distributions from net investment income | (.36) | (.35) | (.36) | (.42) | (.44) |
Distributions from net realized gain | (.09) | - | (.49) | (1.18) | (1.61) |
Total distributions | (.45) | (.35) | (.85) | (1.60) | (2.05) |
Redemption fees added to paid in capital | - C, E | - C, E | - C, E | - | - |
Net asset value, end of period | $ 25.37 | $ 23.18 | $ 18.16 | $ 22.75 | $ 25.52 |
Total Return A, B | 11.53% | 30.33% | (16.95)% | (4.96)% | 8.42% |
Ratios to Average Net Assets D | | | | | |
Expenses before expense reductions | .58% | .57% | .57% | .58% | .56% |
Expenses net of voluntary waivers, if any | .58% | .57% | .57% | .58% | .56% |
Expenses net of all reductions | .57% | .56% | .56% | .57% | .55% |
Net investment income (loss) | 1.71% | 1.83% | 1.70% | 1.47% | 1.68% |
Supplemental Data | | | | | |
Net assets, end of period (000 omitted) | $ 8,689,829 | $ 8,402,963 | $ 6,895,940 | $ 9,256,205 | $ 9,969,086 |
Portfolio turnover rate | 22% | 26% | 25% | 24% | 22% |
A Total returns do not reflect charges attributable to your insurance company's separate account. Inclusion of these charges would reduce the total returns shown.
B Total returns would have been lower had certain expenses not been reduced during the periods shown.
C Calculated based on average shares outstanding during the period.
D Expense ratios reflect operating expenses of the class. Expenses before reductions do not reflect amounts reimbursed by the investment adviser or reductions from brokerage service arrangements or other expense offset arrangements and do not represent the amount paid by the class during periods when reimbursements or reductions occur. Expenses net of any voluntary waivers reflect expenses after reimbursement by the investment adviser but prior to reductions from brokerage service arrangements or other expense offset arrangements. Expenses net of all reductions represent the net expenses paid by the class.
E Amount represents less than $.01 per share.
Financial Highlights - Service Class
Years ended December 31, | 2004 | 2003 | 2002 | 2001 | 2000 |
Selected Per-Share Data | | | | | |
Net asset value, beginning of period | $ 23.11 | $ 18.10 | $ 22.67 | $ 25.45 | $ 25.66 |
Income from Investment Operations | | | | | |
Net investment income (loss) C | .38 | .34 | .32 | .31 | .37 |
Net realized and unrealized gain (loss) | 2.22 | 5.00 | (4.06) | (1.51) | 1.46 |
Total from investment operations | 2.60 | 5.34 | (3.74) | (1.20) | 1.83 |
Distributions from net investment income | (.34) | (.33) | (.34) | (.40) | (.43) |
Distributions from net realized gain | (.09) | - | (.49) | (1.18) | (1.61) |
Total distributions | (.43) | (.33) | (.83) | (1.58) | (2.04) |
Redemption fees added to paid in capital | - C, E | - C, E | - C, E | - | - |
Net asset value, end of period | $ 25.28 | $ 23.11 | $ 18.10 | $ 22.67 | $ 25.45 |
Total Return A, B | 11.38% | 30.22% | (17.00)% | (5.09)% | 8.30% |
Ratios to Average Net Assets D | | | | | |
Expenses before expense reductions | .68% | .67% | .67% | .68% | .66% |
Expenses net of voluntary waivers, if any | .68% | .67% | .67% | .68% | .66% |
Expenses net of all reductions | .67% | .66% | .66% | .67% | .65% |
Net investment income (loss) | 1.61% | 1.73% | 1.60% | 1.37% | 1.58% |
Supplemental Data | | | | | |
Net assets, end of period (000 omitted) | $ 1,170,778 | $ 1,071,483 | $ 771,516 | $ 836,017 | $ 634,897 |
Portfolio turnover rate | 22% | 26% | 25% | 24% | 22% |
A Total returns do not reflect charges attributable to your insurance company's separate account. Inclusion of these charges would reduce the total returns shown.
B Total returns would have been lower had certain expenses not been reduced during the periods shown.
C Calculated based on average shares outstanding during the period.
D Expense ratios reflect operating expenses of the class. Expenses before reductions do not reflect amounts reimbursed by the investment adviser or reductions from brokerage service arrangements or other expense offset arrangements and do not represent the amount paid by the class during periods when reimbursements or reductions occur. Expenses net of any voluntary waivers reflect expenses after reimbursement by the investment adviser but prior to reductions from brokerage service arrangements or other expense offset arrangements. Expenses net of all reductions represent the net expenses paid by the class.
E Amount represents less than $.01 per share.
See accompanying notes which are an integral part of the financial statements.
Annual Report
Financial Highlights - Service Class 2
Years ended December 31, | 2004 | 2003 | 2002 | 2001 | 2000 F |
Selected Per-Share Data | | | | | |
Net asset value, beginning of period | $ 22.96 | $ 18.00 | $ 22.59 | $ 25.41 | $ 25.18 |
Income from Investment Operations | | | | | |
Net investment income (loss) E | .34 | .31 | .28 | .27 | .32 |
Net realized and unrealized gain (loss) | 2.21 | 4.97 | (4.04) | (1.50) | 1.95 |
Total from investment operations | 2.55 | 5.28 | (3.76) | (1.23) | 2.27 |
Distributions from net investment income | (.33) | (.32) | (.34) | (.41) | (.43) |
Distributions from net realized gain | (.09) | - | (.49) | (1.18) | (1.61) |
Total distributions | (.42) | (.32) | (.83) | (1.59) | (2.04) |
Redemption fees added to paid in capital | - E, H | - E, H | - E, H | - | - |
Net asset value, end of period | $ 25.09 | $ 22.96 | $ 18.00 | $ 22.59 | $ 25.41 |
Total Return B, C, D | 11.23% | 30.03% | (17.15)% | (5.23)% | 10.19% |
Ratios to Average Net Assets G | | | | | |
Expenses before expense reductions | .83% | .82% | .83% | .84% | .83% A |
Expenses net of voluntary waivers, if any | .83% | .82% | .83% | .84% | .83% A |
Expenses net of all reductions | .82% | .81% | .82% | .83% | .82% A |
Net investment income (loss) | 1.46% | 1.58% | 1.44% | 1.21% | 1.41% A |
Supplemental Data | | | | | |
Net assets, end of period (000 omitted) | $ 1,420,999 | $ 916,679 | $ 403,632 | $ 226,078 | $ 39,911 |
Portfolio turnover rate | 22% | 26% | 25% | 24% | 22% |
A Annualized
B Total returns for periods of less than one year are not annualized.
C Total returns do not reflect charges attributable to your insurance company's separate account. Inclusion of these charges would reduce the total returns shown.
D Total returns would have been lower had certain expenses not been reduced during the periods shown.
E Calculated based on average shares outstanding during the period.
F For the period January 12, 2000 (commencement of sale of shares) to December 31, 2000.
G Expense ratios reflect operating expenses of the class. Expenses before reductions do not reflect amounts reimbursed by the investment adviser or reductions from brokerage service arrangements or other expense offset arrangements and do not represent the amount paid by the class during periods when reimbursements or reductions occur. Expense ratios before reductions for start-up periods may not be representative of longer-term operating periods. Expenses net of any voluntary waivers reflect expenses after reimbursement by the investment adviser but prior to reductions from brokerage service arrangements or other expense offset arrangements. Expenses net of all reductions represent the net expenses paid by the class.
H Amount represents less than $.01 per share.
Financial Highlights - Service Class 2R
Years ended December 31, | 2004 | 2003 | 2002 F |
Selected Per-Share Data | | | |
Net asset value, beginning of period | $ 22.91 | $ 17.99 | $ 21.82 |
Income from Investment Operations | | | |
Net investment income (loss) E | .34 | .31 | .18 |
Net realized and unrealized gain (loss) | 2.20 | 4.96 | (4.01) |
Total from investment operations | 2.54 | 5.27 | (3.83) |
Distributions from net investment income | (.35) | (.35) | - |
Distributions from net realized gain | (.09) | - | - |
Total distributions | (.44) | (.35) | - |
Redemption fees added to paid in capital E, H | - | - | - |
Net asset value, end of period | $ 25.01 | $ 22.91 | $ 17.99 |
Total Return B, C, D | 11.22% | 30.05% | (17.55)% |
Ratios to Average Net Assets G | | | |
Expenses before expense reductions | .83% | .82% | .85% A |
Expenses net of voluntary waivers, if any | .83% | .82% | .85% A |
Expenses net of all reductions | .82% | .81% | .84% A |
Net investment income (loss) | 1.46% | 1.57% | 1.45% A |
Supplemental Data | | | |
Net assets, end of period (000 omitted) | $ 5,617 | $ 1,891 | $ 471 |
Portfolio turnover rate | 22% | 26% | 25% |
A Annualized
B Total returns for periods of less than one year are not annualized.
C Total returns do not reflect charges attributable to your insurance company's separate account. Inclusion of these charges would reduce the total returns shown.
D Total returns would have been lower had certain expenses not been reduced during the periods shown.
E Calculated based on average shares outstanding during the period.
F For the period April 24, 2002 (commencement of sale of shares) to December 31, 2002.
G Expense ratios reflect operating expenses of the class. Expenses before reductions do not reflect amounts reimbursed by the investment adviser or reductions from brokerage service arrangements or other expense offset arrangements and do not represent the amount paid by the class during periods when reimbursements or reductions occur. Expense ratios before reductions for start-up periods may not be representative of longer-term operating periods. Expenses net of any voluntary waivers reflect expenses after reimbursement by the investment adviser but prior to reductions from brokerage service arrangements or other expense offset arrangements. Expenses net of all reductions represent the net expenses paid by the class.
H Amount represents less than $.01 per share.
See accompanying notes which are an integral part of the financial statements.
Equity-Income Portfolio
Notes to Financial Statements
For the period ended December 31, 2004
1. Significant Accounting Policies.
Equity-Income Portfolio (the fund) is a fund of Variable Insurance Products Fund (the trust) (referred to in this report as Fidelity Variable Insurance Products: Equity Income Portfolio) and is authorized to issue an unlimited number of shares. The trust is registered under the Investment Company Act of 1940, as amended (the 1940 Act), as an open-end management investment company organized as a Massachusetts business trust. Shares of the fund may only be purchased by insurance companies for the purpose of funding variable annuity or variable life insurance contracts. The fund offers the following classes of shares: Initial Class shares, Service Class shares, Service Class 2 shares and Service Class 2R shares. All classes have equal rights and voting privileges, except for matters affecting a single class. Investment income, realized and unrealized capital gains and losses, the common expenses of the fund, and certain fund-level expense reductions, if any, are allocated on a pro rata basis to each class based on the relative net assets of each class to the total net assets of the fund. Each class differs with respect to distribution and service plan fees incurred. Certain expense reductions also differ by class.
The financial statements have been prepared in conformity with accounting principles generally accepted in the United States of America, which require management to make certain estimates and assumptions at the date of the financial statements. The following summarizes the significant accounting policies of the fund:
Security Valuation. Net asset value per share (NAV calculation) is calculated as of the close of business of the New York Stock Exchange, normally 4:00 p.m. Eastern time. Equity securities, including restricted securities, for which market quotations are available are valued at the last sale price or official closing price (closing bid price or last evaluated quote if no sale has occurred) on the primary market or exchange on which they trade. Debt securities, including restricted securities, for which quotations are readily available are valued at their most recent bid prices (sales prices if the principal market is an exchange) in the principal market in which such securities are normally traded, as determined by recognized dealers in such securities, or securities are valued on the basis of information provided by a pricing service. Pricing services use valuation matrices that incorporate both dealer-supplied valuations and valuation models. If prices are not readily available or do not accurately reflect fair value for a security, or if a security's value has been materially affected by events occurring after the close of the exchange or market on which the security is principally traded, that security may be valued by another method that the Board of Trustees believes accurately reflects fair value. A security's valuation may differ depending on the method used for determining value. Price movements in futures contracts and ADRs, market and trading trends, the bid/ask quotes of brokers and off-exchange institutional trading may be reviewed in the course of making a good faith determination of a security's fair value. Short-term securities with remaining maturities of sixty days or less for which quotations are not readily available are valued on the basis of amortized cost. Investments in open-end investment companies are valued at their net asset value each business day.
Foreign Currency. The fund uses foreign currency contracts to facilitate transactions in foreign-denominated securities. Losses from these transactions may arise from changes in the value of the foreign currency or if the counterparties do not perform under the contracts' terms.
Foreign-denominated assets, including investment securities, and liabilities are translated into U.S. dollars at the exchange rate at period end. Purchases and sales of investment securities, income and dividends received and expenses denominated in foreign currencies are translated into U.S. dollars at the exchange rate in effect on the transaction date.
The effects of exchange rate fluctuations on investments are included with the net realized and unrealized gain (loss) on investment securities. Other foreign currency transactions resulting in realized and unrealized gain (loss) are disclosed separately.
Investment Transactions and Income. Security transactions are accounted for as of trade date. Gains and losses on securities sold are determined on the basis of identified cost and may include proceeds received from litigation. Dividend income is recorded on the ex-dividend date, except for certain dividends from foreign securities where the ex-dividend date may have passed, which are recorded as soon as the fund is informed of the ex-dividend date. Non-cash dividends included in dividend income, if any, are recorded at the fair market value of the securities received. Distributions received on securities that represent a return of capital or capital gains are recorded as a reduction of cost of investments and/or as a realized gain. The fund estimates the components of distributions received that may be considered return of capital distributions or capital gain distributions. Interest income is accrued as earned. Interest income includes coupon interest and amortization of premium and accretion of discount on debt securities. Investment income is recorded net of foreign taxes withheld where recovery of such taxes is uncertain.
Expenses. Most expenses of the trust can be directly attributed to a fund. Expenses which cannot be directly attributed are apportioned among the funds in the trust.
Deferred Trustee Compensation. Under a Deferred Compensation Plan (the Plan) non-interested Trustees must defer receipt of a portion of, and may elect to defer receipt of an additional portion of, their annual compensation. Deferred amounts are treated as though equivalent dollar amounts had been invested in a cross-section of other Fidelity funds, and are marked-to-market. Deferred amounts remain in the fund until distributed in accordance with the Plan.
Annual Report
Notes to Financial Statements - continued
1. Significant Accounting Policies - continued
Income Tax Information and Distributions to Shareholders. Each year, the fund intends to qualify as a regulated investment company by distributing all of its taxable income and realized gains under Subchapter M of the Internal Revenue Code. As a result, no provision for income taxes is required in the accompanying financial statements. Foreign taxes are provided for based on the fund's understanding of the tax rules and rates that exist in the foreign markets in which it invests.
Distributions are recorded on the ex-dividend date. Income dividends and capital gain distributions are declared separately for each class. Income and capital gain distributions are determined in accordance with income tax regulations, which may differ from generally accepted accounting principles.
Capital accounts within the financial statements are adjusted for permanent book-tax differences. These adjustments have no impact on net assets or the results of operations. Temporary book-tax differences will reverse in a subsequent period.
Book-tax differences are primarily due to foreign currency transactions, passive foreign investment companies (PFIC), market discount and losses deferred due to wash sales.
The tax-basis components of distributable earnings and the federal tax cost as of period end were as follows:
Unrealized appreciation | $ 3,162,571,582 | |
Unrealized depreciation | (487,146,159) | |
Net unrealized appreciation (depreciation) | 2,675,425,423 | |
Undistributed ordinary income | 222,671,664 | |
Undistributed long-term capital gain | 346,486,395 | |
| | |
Cost for federal income tax purposes | $ 8,626,903,027 | |
The tax character of distributions paid was as follows:
| December 31, 2004 | December 31, 2003 |
Ordinary Income | $ 160,632,605 | $ 152,426,442 |
Long-term Capital Gains | 38,902,738 | - |
Total | $ 199,535,343 | $ 152,426,442 |
Trading (Redemption) Fees. Service Class 2R shares held less than 60 days are subject to a redemption fee equal to 1% of the proceeds of the redeemed shares. All redemption fees, including any estimated redemption fees paid by Fidelity Management & Research Company (FMR), are retained by the fund and accounted for as an addition to paid in capital.
2. Operating Policies.
Repurchase Agreements. FMR has received an Exemptive Order from the Securities and Exchange Commission (the SEC) which permits the fund and other affiliated entities of FMR to transfer uninvested cash balances into joint trading accounts. These accounts are then invested in repurchase agreements that are collateralized by U.S. Treasury or Government obligations. The fund may also invest directly with institutions, in repurchase agreements that are collateralized by commercial paper obligations and corporate obligations. Collateral is held in segregated accounts with custodian banks and may be obtained in the event of a default of the counterparty. Collateral is marked-to-market daily and maintained at a value at least equal to the principal amount of the repurchase agreement (including accrued interest).
Restricted Securities. The fund may invest in securities that are subject to legal or contractual restrictions on resale. These securities generally may be resold in transactions exempt from registration or to the public if the securities are registered. Disposal of these securities may involve time-consuming negotiations and expense, and prompt sale at an acceptable price may be difficult. Information regarding restricted securities is included at the end of the fund's Schedule of Investments.
3. Purchases and Sales of Investments.
Purchases and sales of securities, other than short-term securities and U.S. government securities, aggregated $2,315,881,327 and $2,277,968,277, respectively.
Equity-Income Portfolio
4. Fees and Other Transactions with Affiliates.
Management Fee. FMR and its affiliates provide the fund with investment management related services for which the fund pays a monthly management fee. The management fee is the sum of an individual fund fee rate that is based on an annual rate of .20% of the fund's average net assets and a group fee rate that averaged .28% during the period. The group fee rate is based upon the average net assets of all the mutual funds advised by FMR. The group fee rate decreases as assets under management increase and increases as assets under management decrease. For the period, the total annual management fee rate was .47% of the fund's average net assets.
Distribution and Service Plan. In accordance with Rule 12b-1 of the 1940 Act, the fund has adopted separate 12b-1 Plans for each Service Class of shares. Each Service Class pays Fidelity Distributors Corporation (FDC), an affiliate of FMR, a service fee. For the period, the service fee is based on an annual rate of .10% of Service Class' average net assets and .25% of Service Class 2's and Service Class 2R's average net assets.
For the period, each class paid FDC the following amounts, all of which were re-allowed to insurance companies for the distribution of shares and providing shareholder support services:
Service Class | $ 1,100,510 | |
Service Class 2 | 2,850,571 | |
Service Class 2R | 9,466 | |
| $ 3,960,547 | |
Transfer Agent Fees. Fidelity Investments Institutional Operations Company, Inc. (FIIOC), an affiliate of FMR, is the fund's transfer, dividend disbursing, and shareholder servicing agent. FIIOC receives an asset-based fee with respect to each account. FIIOC pays a portion of the expenses related to the typesetting, printing and mailing of shareholder reports, except proxy statements. Each class pays a transfer agent fee, excluding out of pocket expenses, equal to an annual rate of .07% of their month end net assets. For the period, the total transfer agent fees paid by each class to FIIOC, including out of pocket expenses, were as follows:
Initial Class | $ 5,527,852 | |
Service Class | 728,268 | |
Service Class 2 | 782,156 | |
Service Class 2R | 2,672 | |
| $ 7,040,948 | |
Accounting and Security Lending Fees. Fidelity Service Company, Inc. (FSC), an affiliate of FMR, maintains the fund's accounting records. The accounting fee is based on the level of average net assets for the month. Under a separate contract, FSC administers the security lending program. The security lending fee is based on the number and duration of lending transactions.
Central Funds. The fund may invest in affiliated Central Funds managed by Fidelity Investments Money Management, Inc. (FIMM), an affiliate of FMR. The Central Funds are open-end investment companies available only to investment companies and other accounts managed by FMR and its affiliates. The Central Funds seek preservation of capital and current income and do not pay a management fee. Income distributions earned by the fund are recorded as income in the accompanying financial statements and totaled $714,712 for the period.
Brokerage Commissions. The fund placed a portion of its portfolio transactions with brokerage firms which are affiliates of the investment adviser. The commissions paid to these affiliated firms were $127,479 for the period.
Interfund Lending Program. Pursuant to an Exemptive Order issued by the SEC, the fund, along with other registered investment companies having management contracts with FMR, may participate in an interfund lending program. This program provides an alternative credit facility allowing the funds to borrow from, or lend money to, other participating funds.
Borrower or Lender | Average Daily
Loan Balance | Weighted Average
Interest Rate | Interest Earned
(included in interest income) | Interest
Expense |
Borrower | $ 8,867,217 | 1.63% | - | $ 9,256 |
5. Committed Line of Credit.
The fund participates with other funds managed by FMR in a $4.2 billion credit facility (the "line of credit") to be utilized for temporary or emergency purposes to fund shareholder redemptions or for other short-term liquidity purposes. The fund has agreed to pay commitment fees on its pro rata portion of the line of credit. During the period, there were no borrowings on this line of credit.
Annual Report
Notes to Financial Statements - continued
6. Security Lending.
The fund lends portfolio securities from time to time in order to earn additional income. The fund receives collateral (in the form of U.S. Treasury obligations, letters of credit and/or cash) against the loaned securities and maintains collateral in an amount not less than 100% of the market value of the loaned securities during the period of the loan. The market value of the loaned securities is determined at the close of business of the fund and any additional required collateral is delivered to the fund on the next business day. If the borrower defaults on its obligation to return the securities loaned because of insolvency or other reasons, a fund could experience delays and costs in recovering the securities loaned or in gaining access to the collateral. Cash collateral is invested in cash equivalents. The value of loaned securities and cash collateral at period end are disclosed on the fund's Statement of Assets and Liabilities.
7. Bank Borrowings.
The fund is permitted to have bank borrowings for temporary or emergency purposes to fund shareholder redemptions. The fund has established borrowing arrangements with certain banks. The interest rate on the borrowings is the bank's base rate, as revised from time to time. The average daily loan balance during the period amounted to $9,721,350. The weighted average interest rate was 1.81%. At period end, there were no bank borrowings outstanding.
8. Expense Reductions.
Many of the brokers with whom FMR places trades on behalf of the fund provided services to the fund in addition to trade execution. These services included payments of certain expenses on behalf of the fund totaling $873,945 for the period. In addition, through arrangements with the fund's custodian, credits realized as a result of uninvested cash balances were used to reduce the fund's expenses. During the period, these credits reduced the fund's custody expenses by $612.
9. Other Information.
At the end of the period, FMR or its affiliates were the owners of record of 11% of the total outstanding shares of the fund and two otherwise unaffiliated shareholders were the owners of record of 37% of the total outstanding shares of the fund.
Equity-Income Portfolio
Report of Independent Registered Public Accounting Firm
To the Trustees of Variable Insurance Products Fund and the Shareholders of Equity-Income Portfolio:
In our opinion, the accompanying statement of assets and liabilities, including the schedule of investments, and the related statements of operations and of changes in net assets and the financial highlights present fairly, in all material respects, the financial position of Equity-Income Portfolio (a fund of Variable Insurance Products Fund) at December 31, 2004 and the results of its operations, the changes in its net assets and the financial highlights for the periods indicated, in conformity with accounting principles generally accepted in the United States of America. These financial statements and financial highlights (hereafter referred to as "financial statements") are the responsibility of the Equity-Income Portfolio's management; our responsibility is to express an opinion on these financial statements based on our audits. We conducted our audits of these financial statements in accordance with the standards of the Public Company Accounting Oversight Board (United States). Those standards require that we plan and perform the audit to obtain reasonable assurance about whether the financial statements are free of material misstatement. An audit includes examining, on a test basis, evidence supporting the amounts and disclosures in the financial statements, assessing the accounting principles used and significant estimates made by management, and evaluating the overall financial statement presentation. We believe that our audits, which included confirmation of securities at December 31, 2004 by correspondence with the custodian and brokers, provide a reasonable basis for our opinion.
/s/PricewaterhouseCoopers LLP
PricewaterhouseCoopers LLP
Boston, Massachusetts
February 10, 2005
Annual Report
Trustees and Officers
The Trustees, Member of the Advisory Board, and executive officers of the trust and fund, as applicable, are listed below. The Board of Trustees governs the fund and is responsible for protecting the interests of shareholders. The Trustees are experienced executives who meet periodically throughout the year to oversee the fund's activities, review contractual arrangements with companies that provide services to the fund, and review the fund's performance. Except for William O. McCoy, Dennis J. Dirks, and Kenneth L. Wolfe, each of the Trustees oversees 301 funds advised by FMR or an affiliate. Mr. McCoy oversees 303 funds advised by FMR or an affiliate. Mr. Dirks and Mr. Wolfe oversee 233 funds advised by FMR or an affiliate.
The Trustees hold office without limit in time except that (a) any Trustee may resign; (b) any Trustee may be removed by written instrument, signed by at least two-thirds of the number of Trustees prior to such removal; (c) any Trustee who requests to be retired or who has become incapacitated by illness or injury may be retired by written instrument signed by a majority of the other Trustees; and (d) any Trustee may be removed at any special meeting of shareholders by a two-thirds vote of the outstanding voting securities of the trust. In any event, each non-interested Trustee shall retire not later than the last day of the calendar year in which his or her 72nd birthday occurs. The executive officers and Advisory Board Member hold office without limit in time, except that any officer and Advisory Board Member may resign or may be removed by a vote of a majority of the Trustees at any regular meeting or any special meeting of the Trustees. Except as indicated, each individual has held the office shown or other offices in the same company for the past five years.
The fund's Statement of Additional Information (SAI) includes more information about the Trustees. To request a free copy, call Fidelity at 1-800-544-5429.
Interested Trustees*:
Correspondence intended for each Trustee who is an "interested person" (as defined in the 1940 Act) may be sent to Fidelity Investments, 82 Devonshire Street, Boston, Massachusetts 02109.
Name, Age; Principal Occupation |
Edward C. Johnson 3d (74)** |
| Year of Election or Appointment: 1981 Mr. Johnson is Chairman of the Board of Trustees. Mr. Johnson serves as Chief Executive Officer, Chairman, and a Director of FMR Corp.; a Director and Chairman of the Board and of the Executive Committee of FMR; Chairman and a Director of Fidelity Management & Research (Far East) Inc.; Chairman (1998) and a Director of Fidelity Investments Money Management, Inc.; and Chairman (2001) and a Director (2000) of FMR Co., Inc. |
Abigail P. Johnson (43)** |
| Year of Election or Appointment: 2001 Senior Vice President of VIP Equity-Income (2001). Ms. Johnson also serves as Senior Vice President of other Fidelity funds (2001). She is President and a Director of FMR (2001), Fidelity Investments Money Management, Inc. (2001), FMR Co., Inc. (2001), and a Director of FMR Corp. Previously, Ms. Johnson managed a number of Fidelity funds. |
Laura B. Cronin (50) |
| Year of Election or Appointment: 2003 Ms. Cronin is an Executive Vice President (2002) and Chief Financial Officer (2002) of FMR Corp. and is a member of the Fidelity Management Committee (2003). Previously, Ms. Cronin served as Vice President of Finance of FMR (1997-1999), and Chief Financial Officer of FMR (1999-2001), Fidelity Personal Investments (2001), and Fidelity Brokerage Company (2001-2002). |
Robert L. Reynolds (52) |
| Year of Election or Appointment: 2003 Mr. Reynolds is a Director (2003) and Chief Operating Officer (2002) of FMR Corp. and is the head of the Fidelity Management Committee (2003). He also serves on the Board at Fidelity Investments Canada, Ltd. (2000). Previously, Mr. Reynolds served as President of Fidelity Investments Institutional Retirement Group (1996-2000). |
* Trustees have been determined to be "Interested Trustees" by virtue of, among other things, their affiliation with the trust or various entities under common control with FMR.
** Edward C. Johnson 3d, Trustee, is Abigail P. Johnson's father.
Annual Report
Trustees and Officers - continued
Non-Interested Trustees:
Correspondence intended for each non-interested Trustee (that is, the Trustees other than the Interested Trustees) may be sent to Fidelity Investments, P.O. Box 55235, Boston, Massachusetts 02205-5235.
Name, Age; Principal Occupation |
Dennis J. Dirks (56) |
| Year of Election or Appointment: 2005 Mr. Dirks also serves as a Trustee (2005) or Member of the Advisory Board (2004) of other investment companies advised by FMR. Prior to his retirement in May 2003, Mr. Dirks was Chief Operating Officer and a member of the Board of The Depository Trust & Clearing Corporation (DTCC) (1999-2003). He also served as President, Chief Operating Officer, and Board member of The Depository Trust Company (DTC) (1999-2003) and President and Board member of the National Securities Clearing Corporation (NSCC) (1999-2003). In addition, Mr. Dirks served as Chief Executive Officer and Board member of the Government Securities Clearing Corporation (2001-2003) and Chief Executive Officer and Board member of the Mortgage-Backed Securities Clearing Corporation (2001-2003). |
Robert M. Gates (61) |
| Year of Election or Appointment: 1997 Dr. Gates is Vice Chairman of the non-interested Trustees (2005). Dr. Gates is President of Texas A&M University (2002). He was Director of the Central Intelligence Agency (CIA) from 1991 to 1993. From 1989 to 1991, Dr. Gates served as Assistant to the President of the United States and Deputy National Security Advisor. Dr. Gates is a Director of NACCO Industries, Inc. (mining and manufacturing), Parker Drilling Co., Inc. (drilling and rental tools for the energy industry, 2001), and Brinker International (restaurant management, 2003). He also serves as a member of the Advisory Board of VoteHere.net (secure internet voting, 2001). Previously, Dr. Gates served as a Director of LucasVarity PLC (automotive components and diesel engines), a Director of TRW Inc. (automotive, space, defense, and information technology), and Dean of the George Bush School of Government and Public Service at Texas A&M University (1999-2001). Dr. Gates also is a Trustee of the Forum for International Policy. |
George H. Heilmeier (68) |
| Year of Election or Appointment: 2004 Dr. Heilmeier is Chairman Emeritus of Telcordia Technologies (communication software and systems), where prior to his retirement, he served as company Chairman and Chief Executive Officer. He currently serves on the Boards of Directors of The Mitre Corporation (systems engineering and information technology support for the government), INET Technologies Inc. (telecommunications network surveillance, 2001), Teletech Holdings (customer management services), and HRL Laboratories (private research and development, 2004). He is Chairman of the General Motors Technology Advisory Committee and a Life Fellow of the Institute of Electrical and Electronics Engineers (IEEE) (2000). Dr. Heilmeier is a member of the Defense Science Board and the National Security Agency Advisory Board. He is also a member of the National Academy of Engineering, the American Academy of Arts and Sciences, and the Board of Overseers of the School of Engineering and Applied Science of the University of Pennsylvania. Previously, Dr. Heilmeier served as a Director of TRW Inc. (automotive, space, defense, and information technology, 1992-2002), Compaq (1994-2002), and Automatic Data Processing, Inc. (ADP) (technology-based business outsourcing, 1995-2002). |
Marie L. Knowles (58) |
| Year of Election or Appointment: 2001 Prior to Ms. Knowles' retirement in June 2000, she served as Executive Vice President and Chief Financial Officer of Atlantic Richfield Company (ARCO) (diversified energy, 1996-2000). From 1993 to 1996, she was a Senior Vice President of ARCO and President of ARCO Transportation Company. She served as a Director of ARCO from 1996 to 1998. She currently serves as a Director of Phelps Dodge Corporation (copper mining and manufacturing) and McKesson Corporation (healthcare service, 2002). Ms. Knowles is a Trustee of the Brookings Institution and the Catalina Island Conservancy and also serves as a member of the Advisory Board for the School of Engineering of the University of Southern California. |
Ned C. Lautenbach (60) |
| Year of Election or Appointment: 2000 Mr. Lautenbach has been a partner of Clayton, Dubilier & Rice, Inc. (private equity investment firm) since September 1998. Previously, Mr. Lautenbach was with the International Business Machines Corporation (IBM) from 1968 until his retirement in 1998. He was most recently Senior Vice President and Group Executive of Worldwide Sales and Services. From 1993 to 1995, he was Chairman of IBM World Trade Corporation, and from 1994 to 1998 was a member of IBM's Corporate Executive Committee. Mr. Lautenbach serves as Co-Chairman and a Director of Covansys, Inc. (global provider of business and technology solutions, 2000). In addition, he is a Director of Italtel Holding S.p.A. (telecommunications (Milan, Italy), 2004) and Eaton Corporation (diversified industrial) as well as the Philharmonic Center for the Arts in Naples, Florida (1999). He also is a member of the Council on Foreign Relations. |
Marvin L. Mann (71) |
| Year of Election or Appointment: 1993 Mr. Mann is Chairman of the non-interested Trustees (2001). He is Chairman Emeritus of Lexmark International, Inc. (computer peripherals), where he served as CEO until April 1998, retired as Chairman May 1999, and remains a member of the Board. Prior to 1991, he held the positions of Vice President of International Business Machines Corporation (IBM) and President and General Manager of various IBM divisions and subsidiaries. He is a member of the Executive Committee of the Independent Director's Council of the Investment Company Institute. In addition, Mr. Mann is a member of the President's Cabinet at the University of Alabama and the Board of Visitors of the Culverhouse College of Commerce and Business Administration at the University of Alabama. |
William O. McCoy (71) |
| Year of Election or Appointment: 1997 Prior to his retirement in December 1994, Mr. McCoy was Vice Chairman of the Board of BellSouth Corporation (telecommunications) and President of BellSouth Enterprises. He is currently a Director of Liberty Corporation (holding company), Duke Realty Corporation (real estate), and Progress Energy, Inc. (electric utility). He is also a partner of Franklin Street Partners (private investment management firm) and a member of the Research Triangle Foundation Board. In addition, Mr. McCoy served as the Interim Chancellor (1999-2000) and a member of the Board of Visitors (1994-1998) for the University of North Carolina at Chapel Hill and currently serves on the Board of Directors of the University of North Carolina Health Care System and the Board of Visitors of the Kenan-Flagler Business School (University of North Carolina at Chapel Hill). He also served as Vice President of Finance for the University of North Carolina (16-school system, 1995-1998). |
Cornelia M. Small (60) |
| Year of Election or Appointment: 2005 Ms. Small is a member (2000) and Chairperson (2002) of the Investment Committee, and a member (2002) of the Board of Trustees of Smith College. Previously, she served as Chief Investment Officer (1999-2000), Director of Global Equity Investments (1996-1999), and a member of the Board of Directors of Scudder, Stevens & Clark (1990-1997) and Scudder Kemper Investments (1997-1998). In addition, Ms. Small served as Co-Chair (2000-2003) of the Annual Fund for the Fletcher School of Law and Diplomacy. |
William S. Stavropoulos (65) |
| Year of Election or Appointment: 2001 Mr. Stavropoulos is Chairman of the Board (2000), CEO (2002), a position he previously held from 1995-2000, Chairman of the Executive Committee (2000), and a Member of the Board of Directors of The Dow Chemical Company. Since joining The Dow Chemical Company in 1967, Mr. Stavropoulos served in numerous senior management positions, including President (1993-2000; 2002-2003). Currently, he is a Director of NCR Corporation (data warehousing and technology solutions), BellSouth Corporation (telecommunications), Chemical Financial Corporation, and Maersk Inc. (industrial conglomerate, 2002). He also serves as a member of the Board of Trustees of the American Enterprise Institute for Public Policy Research. In addition, Mr. Stavropoulos is a member of The Business Council, J.P. Morgan International Council and the University of Notre Dame Advisory Council for the College of Science. |
Kenneth L. Wolfe (65) |
| Year of Election or Appointment: 2005 Mr. Wolfe also serves as a Trustee (2005) or Member of the Advisory Board (2004) of other investment companies advised by FMR. Prior to his retirement in 2001, Mr. Wolfe was Chairman and Chief Executive Officer of Hershey Foods Corporation (1993-2001). He currently serves as a member of the boards of Adelphia Communications Corporation (2003), Bausch & Lomb, Inc., and Revlon Inc. (2004). |
Annual Report
Trustees and Officers - continued
Advisory Board Member and Executive Officers:
Correspondence intended for each executive officer and Mr. Lynch may be sent to Fidelity Investments, 82 Devonshire Street, Boston, Massachusetts 02109.
Name, Age; Principal Occupation |
Peter S. Lynch (61) |
| Year of Election or Appointment: 2003 Member of the Advisory Board of Variable Insurance Products Fund. Vice Chairman and a Director of FMR, and Vice Chairman (2001) and a Director (2000) of FMR Co., Inc. Previously, Mr. Lynch served as a Trustee of the Fidelity funds (1990-2003). Prior to May 31, 1990, he was a Director of FMR and Executive Vice President of FMR (a position he held until March 31, 1991), Vice President of Fidelity® Magellan® Fund and FMR Growth Group Leader, and Managing Director of FMR Corp. Mr. Lynch was also Vice President of Fidelity Investments Corporate Services. In addition, he serves as a Trustee of Boston College, Massachusetts Eye & Ear Infirmary, Historic Deerfield, John F. Kennedy Library, and the Museum of Fine Arts of Boston. |
Bart A. Grenier (45) |
| Year of Election or Appointment: 2001 Vice President of VIP Equity-Income. Mr. Grenier also serves as Vice President of certain Equity Funds (2001), a position he previously held from 1999 to 2000, and Vice President of certain High Income Funds (2002). He is Senior Vice President of FMR (1999) and FMR Co., Inc. (2001), and President and Director of Strategic Advisers, Inc. (2002). He also heads Fidelity's Asset Allocation Group (2000), Fidelity's Growth and Income Group (2001), Fidelity's Value Group (2001), and Fidelity's High Income Division (2001). Previously, Mr. Grenier served as President of Fidelity Ventures (2000), Vice President of certain High Income Funds (1997-2000), High Income Division Head (1997-2000), Group Leader of the Income-Growth and Asset Allocation-Income Groups (1996-2000), and Assistant Equity Division Head (1997-2000). |
Stephen R. Peterson (48) |
| Year of Election or Appointment: 1997 Vice President of VIP Equity-Income. Mr. Peterson serves as Vice President of other funds advised by FMR. Mr. Peterson also serves as Senior Vice President of FMR and FMR Co., Inc. (2001). |
Eric D. Roiter (56) |
| Year of Election or Appointment: 1998 Secretary of VIP Equity-Income. He also serves as Secretary of other Fidelity funds; Vice President, General Counsel, and Secretary of FMR Co., Inc. (2001-present) and FMR; Vice President and Secretary of FDC; Assistant Secretary of Fidelity Management & Research (U.K.) Inc. (2001-present), Fidelity Management & Research (Far East) Inc. (2001-present), and Fidelity Investments Money Management, Inc. (2001-present). Mr. Roiter is an Adjunct Member, Faculty of Law, at Boston College Law School (2003-present). |
Stuart Fross (45) |
| Year of Election or Appointment: 2003 Assistant Secretary of VIP Equity-Income. Mr. Fross also serves as Assistant Secretary of other Fidelity funds (2003) and is an employee of FMR. |
Christine Reynolds (46) |
| Year of Election or Appointment: 2004 President, Treasurer, and Anti-Money Laundering (AML) officer of VIP Equity-Income. Ms. Reynolds also serves as President, Treasurer, and AML officer of other Fidelity funds (2004) and is a Vice President (2003) and an employee (2002) of FMR. Before joining Fidelity Investments, Ms. Reynolds worked at PricewaterhouseCoopers LLP (PwC) (1980-2002), where she was most recently an audit partner with PwC's investment management practice. |
Timothy F. Hayes (54) |
| Year of Election or Appointment: 2002 Chief Financial Officer of VIP Equity-Income. Mr. Hayes also serves as Chief Financial Officer of other Fidelity funds (2002). Recently he was appointed President of Fidelity Service Company (2003) where he also serves as a Director. Mr. Hayes also serves as President of Fidelity Investments Operations Group (FIOG, 2002), which includes Fidelity Pricing and Cash Management Services Group (FPCMS), where he was appointed President in 1998. Previously, Mr. Hayes served as Chief Financial Officer of Fidelity Investments Corporate Systems and Service Group (1998) and Fidelity Systems Company (1997-1998). |
Kenneth A. Rathgeber (57) |
| Year of Election or Appointment: 2004 Chief Compliance Officer of VIP Equity-Income. Mr. Rathgeber also serves as Chief Compliance Officer of other Fidelity funds (2004) and Executive Vice President of Risk Oversight for Fidelity Investments (2002). Previously, he served as Executive Vice President and Chief Operating Officer for Fidelity Investments Institutional Services Company, Inc. (1998-2002). |
John R. Hebble (46) |
| Year of Election or Appointment: 2003 Deputy Treasurer of VIP Equity-Income. Mr. Hebble also serves as Deputy Treasurer of other Fidelity funds (2003), and is an employee of FMR. Before joining Fidelity Investments, Mr. Hebble worked at Deutsche Asset Management where he served as Director of Fund Accounting (2002-2003) and Assistant Treasurer of the Scudder Funds (1998-2003). |
Kimberley H. Monasterio (41) |
| Year of Election or Appointment: 2004 Deputy Treasurer of VIP Equity-Income. Ms. Monasterio also serves as Deputy Treasurer of other Fidelity funds (2004) and is an employee of FMR (2004). Before joining Fidelity Investments, Ms. Monasterio served as Treasurer (2000-2004) and Chief Financial Officer (2002-2004) of the Franklin Templeton Funds and Senior Vice President of Franklin Templeton Services, LLC (2000-2004). |
John H. Costello (58) |
| Year of Election or Appointment: 1986 Assistant Treasurer of VIP Equity-Income. Mr. Costello also serves as Assistant Treasurer of other Fidelity funds and is an employee of FMR. |
Peter L. Lydecker (50) |
| Year of Election or Appointment: 2004 Assistant Treasurer of VIP Equity-Income. Mr. Lydecker also serves as Assistant Treasurer of other Fidelity funds (2004) and is an employee of FMR. |
Mark Osterheld (49) |
| Year of Election or Appointment: 2002 Assistant Treasurer of VIP Equity-Income. Mr. Osterheld also serves as Assistant Treasurer of other Fidelity funds (2002) and is an employee of FMR. |
Kenneth B. Robins (35) |
| Year of Election or Appointment: 2004 Assistant Treasurer of VIP Equity-Income. Mr. Robins also serves as Assistant Treasurer of other Fidelity funds (2004) and is an employee of FMR (2004). Before joining Fidelity Investments, Mr. Robins worked at KPMG LLP, where he was a partner in KPMG's department of professional practice (2002-2004) and a Senior Manager (1999-2000). In addition, Mr. Robins served as Assistant Chief Accountant, United States Securities and Exchange Commission (2000-2002). |
Annual Report
Distributions
The Board of Trustees of Equity-Income Portfolio voted to pay to shareholders of record at the opening of business on record date, the following distributions per share derived from capital gains realized from sales of portfolio securities, and dividends derived from net investment income:
Fund | Pay Date | Record Date | Dividends | Capital Gains |
Initial Class | 2/14/05 | 2/11/05 | $0.405 | $0.89 |
Service Class | 2/14/05 | 2/11/05 | $0.385 | $0.89 |
Service Class 2 | 2/14/05 | 2/11/05 | $0.36 | $0.89 |
Service Class 2R | 2/14/05 | 2/11/05 | $0.375 | $0.89 |
A percentage of the dividends distributed during the fiscal year for the following classes qualifies for the dividends-received deduction for corporate shareholders:
Initial Class | 100% |
Service Class | 100% |
Service Class 2 | 100% |
Service Class 2R | 100% |
The fund will notify shareholders in January 2005 of amounts for use in preparing 2004 income tax returns.
Annual Report
Proxy Voting Results
A special meeting of the fund's shareholders was held on December 14, 2004. The results of votes taken among shareholders on proposals before them are reported below. Each vote reported represents one dollar of net asset value held on the record date for the meeting.
| PROPOSAL 1 |
To amend the Declaration of Trust to allow the Board of Trustees, if permitted by applicable law, to authorize fund mergers without shareholder approval. A |
| # of
Votes | % of
Votes |
Affirmative | 15,331,508,529.96 | 81.853 |
Against | 2,429,553,894.02 | 12.972 |
Abstain | 969,378,618.94 | 5.175 |
TOTAL | 18,730,441,042.92 | 100.000 |
PROPOSAL 2 |
To elect a Board of Trustees. A |
| # of
Votes | % of
Votes |
J. Michael Cook |
Affirmative | 17,770,642,454.98 | 94.876 |
Withheld | 959,798,587.94 | 5.124 |
TOTAL | 18,730,441,042.92 | 100.000 |
Ralph F. Cox |
Affirmative | 17,759,356,374.26 | 94.815 |
Withheld. | 971,084,668.66 | 5.185 |
TOTAL | 18,730,441,042.92 | 100.000 |
Laura B. Cronin |
Affirmative | 17,797,888,742.24 | 95.021 |
Withheld | 932,552,300.68 | 4.979 |
TOTAL | 18,730,441,042.92 | 100.000 |
Dennis J. DirksB |
Affirmative | 17,802,602,074.45 | 95.046 |
Withheld | 927,838,968.47 | 4.954 |
TOTAL | 18,730,441,042.92 | 100.000 |
Robert M. Gates |
Affirmative | 17,784,855,823.58 | 94.952 |
Withheld | 945,585,219.34 | 5.048 |
TOTAL | 18,730,441,042.92 | 100.000 |
George H. Heilmeier |
Affirmative | 17,768,875,556.56 | 94.866 |
Withheld | 961,565,486.36 | 5.134 |
TOTAL | 18,730,441,042.92 | 100.000 |
Abigail P. Johnson |
Affirmative | 17,781,929,073.06 | 94.936 |
Withheld | 948,511,969.86 | 5.064 |
TOTAL | 18,730,441,042.92 | 100.000 |
Edward C. Johnson 3d |
Affirmative | 17,752,140,336.45 | 94.777 |
Withheld | 978,300,706.47 | 5.223 |
TOTAL | 18,730,441,042.92 | 100.000 |
Donald J. Kirk |
Affirmative | 17,772,467,361.45 | 94.885 |
Withheld | 957,973,681.47 | 5.115 |
TOTAL | 18,730,441,042.92 | 100.000 |
| # of
Votes | % of
Votes |
Marie L. Knowles |
Affirmative | 17,776,922,254.30 | 94.909 |
Withheld | 953,518,788.62 | 5.091 |
TOTAL | 18,730,441,042.92 | 100.000 |
Ned C. Lautenbach |
Affirmative | 17,804,221,564.95 | 95.055 |
Withheld | 926,219,477.97 | 4.945 |
TOTAL | 18,730,441,042.92 | 100.000 |
Marvin L. Mann |
Affirmative | 17,763,277,607.06 | 94.836 |
Withheld | 967,163,435.86 | 5.164 |
TOTAL | 18,730,441,042.92 | 100.000 |
William O. McCoy |
Affirmative | 17,758,560,162.11 | 94.811 |
Withheld | 971,880,880.81 | 5.189 |
TOTAL | 18,730,441,042.92 | 100.000 |
Robert L. Reynolds |
Affirmative | 17,806,026,904.06 | 95.065 |
Withheld | 924,414,138.86 | 4.935 |
TOTAL | 18,730,441,042.92 | 100.000 |
Cornelia M. SmallB |
Affirmative | 17,798,878,892.31 | 95.026 |
Withheld | 931,562,150.61 | 4.974 |
TOTAL | 18,730,441,042.92 | 100.000 |
William S. Stavropoulos |
Affirmative | 17,786,496,107.78 | 94.960 |
Withheld | 943,944,935.14 | 5.040 |
TOTAL | 18,730,441,042.92 | 100.000 |
PROPOSAL 3 |
To approve a new sub-advisory agreement among FMR, Fidelity Management & Research (U.K.) Inc. (FMR U.K.), and Variable Insurance Products Fund on behalf of the fund. |
| # of
Votes | % of
Votes |
Affirmative | 6,731,293,010.62 | 89.239 |
Against | 310,929,859.15 | 4.122 |
Abstain | 500,745,863.80 | 6.639 |
TOTAL | 7,542,968,733.57 | 100.000 |
PROPOSAL 4 |
To approve a new sub-advisory agreement among FMR, FMR Far East, and Variable Insurance Products Fund on behalf of the fund. |
| # of
Votes | % of
Votes |
Affirmative | 6,721,558,010.15 | 89.110 |
Against | 322,563,327.80 | 4.277 |
Abstain | 498,847,395.62 | 6.613 |
TOTAL | 7,542,968,733.57 | 100.000 |
PROPOSAL 5 |
To approve a new amended and restated sub-advisory agreement between FMR Far East and Fidelity Investments Japan Limited (FIJ) for the fund. |
| # of
Votes | % of
Votes |
Affirmative | 6,718,405,992.36 | 89.068 |
Against | 323,955,769.99 | 4.295 |
Abstain | 500,606,971.22 | 6.637 |
TOTAL | 7,542,968,733.57 | 100.000 |
PROPOSAL 6 |
To approve a new master international research agreement between FMR and Fidelity International Investment Advisors (FIIA) on behalf of the fund. |
| # of
Votes | % of
Votes |
Affirmative | 6,734,087,467.07 | 89.276 |
Against | 307,013,886.12 | 4.071 |
Abstain | 501,867,380.38 | 6.653 |
TOTAL | 7,542,968,733.57 | 100.000 |
PROPOSAL 7 |
To approve a new sub-research agreement between FIIA and Fidelity International Investment Advisors (U.K.) Limited (FIIA (U.K.)L) on behalf of the fund. |
| # of
Votes | % of
Votes |
Affirmative | 6,731,737,757.05 | 89.245 |
Against | 311,103,851.74 | 4.125 |
Abstain | 500,127,124.78 | 6.630 |
TOTAL | 7,542,968,733.57 | 100.000 |
PROPOSAL 8 |
To approve a new sub-research agreement between FIIA and FIJ on behalf of the fund. |
| # of
Votes | % of
Votes |
Affirmative | 6,739,563,050.41 | 89.349 |
Against | 309,142,220.41 | 4.098 |
Abstain | 494,263,462.75 | 6.553 |
TOTAL | 7,542,968,733.57 | 100.000 |
PROPOSAL 9 |
To amend the fund's fundamental investment limitation concerning borrowing. |
| # of
Votes | % of
Votes |
Affirmative | 6,685,392,791.57 | 88.631 |
Against | 416,380,211.81 | 5.520 |
Abstain | 441,195,730.19 | 5.849 |
TOTAL | 7,542,968,733.57 | 100.000 |
PROPOSAL 10 |
To amend the fund's fundamental investment limitation concerning lending. |
| # of
Votes | % of
Votes |
Affirmative | 6,589,639,425.26 | 87.361 |
Against | 465,151,442.69 | 6.167 |
Abstain | 488,177,865.62 | 6.472 |
TOTAL | 7,542,968,733.57 | 100.000 |
A Denotes trust-wide proposals and voting results. B Effective January 1, 2005. |
Equity-Income Portfolio
Annual Report
Annual Report
Investment Adviser
Fidelity Management & Research Company
Boston, MA
Investment Sub-Adviser
FMR Co., Inc.
Fidelity Management & Research (U.K.) Inc.
Fidelity Management & Research (Far East) Inc.
Fidelity Investments Japan Limited
Fidelity International Investment Advisors
Fidelity International Investment Advisors (U.K.) Limited
General Distributor
Fidelity Distributors Corporation
Boston, MA
Transfer and Shareholder Servicing Agent
Fidelity Investments Institutional Operations Company, Inc.
Boston, MA
Custodian
The Northern Trust Company
Chicago, IL
VIPEI-ANN-0205
1.540027.107
Fidelity® Variable Insurance Products:
Equity-Income Portfolio - Service Class 2R
Annual Report
December 31, 2004
(2_fidelity_logos) (Registered_Trademark)
Contents
Performance | 3 | How the fund has done over time. |
Management's Discussion | 4 | The manager's review of fund performance, strategy and outlook. |
Shareholder Expense Example | 5 | An example of shareholder expenses. |
Investment Summary | 6 | A summary of the fund's investments at period end. |
Investments | 7 | A complete list of the fund's investments with their
market values. |
Financial Statements | 13 | Statements of assets and liabilities, operations, and
changes in net assets, as well as financial highlights. |
Notes | 17 | Notes to the financial statements. |
Report of Independent Registered Public Accounting Firm | 21 | |
Trustees and Officers | 22 | |
Distributions | 27 | |
Proxy Voting Results | 28 | |
| | |
To view a fund's proxy voting guidelines and proxy voting record for the 12-month period ended June 30, visit www.fidelity.com/proxyvotingresults or visit the Securities and Exchange Commission's (SEC) web site at www.sec.gov. You may also call 1-800-544-5429 to request a free copy of the proxy voting guidelines.
Fidelity Variable Insurance Products are separate account options which are purchased through a variable insurance contract.
Standard & Poor's, S&P and S&P 500 are registered service marks of The McGraw-Hill Companies, Inc. and have been licensed for use by Fidelity Distributors Corporation.
Other third party marks appearing herein are the property of their respective owners.
All other marks appearing herein are registered or unregistered trademarks or service marks of FMR Corp. or an affiliated company.
(Recycle graphic) This report is printed on recycled paper using soy-based inks.
This report and the financial statements contained herein are submitted for the general information of the shareholders of the fund. This report is not authorized for distribution to prospective investors in the fund unless preceded or accompanied by an effective prospectus.
A fund files its complete schedule of portfolio holdings with the SEC for the first and third quarters of each fiscal year on Form N-Q. Forms N-Q are available on the SEC's web site at http://www.sec.gov. A fund's Forms N-Q may be reviewed and copied at the SEC's Public Reference Room in Washington, DC. Information regarding the operation of the SEC's Public Reference Room may be obtained by calling 1-800-SEC-0330. For a complete list of a fund's portfolio holdings, view the most recent quarterly holdings report, semiannual report, or annual report on Fidelity's web site at http://www.advisor.fidelity.com.
NOT FDIC INSURED · MAY LOSE VALUE · NO BANK GUARANTEE
Neither the fund nor Fidelity Distributors Corporation is a bank.
Equity-Income Portfolio
Fidelity Variable Insurance Products: Equity-Income Portfolio - Service Class 2R
Performance: The Bottom Line
Average annual total return reflects the change in the value of an investment, assuming reinvestment of a class' dividend income and capital gains (the profits earned upon the sale of securities that have grown in value) and assuming a constant rate of performance each year. During periods of reimbursement by Fidelity, a fund's total return will be greater than it would be had the reimbursement not occurred. Performance numbers are net of all underlying fund operating expenses, but do not include any insurance charges imposed by your insurance company's separate account. If performance information included the effect of these additional charges, the total returns would be lower. How a fund did yesterday is no guarantee of how it will do tomorrow.
Average Annual Total Returns
Periods ended December 31, 2004 | Past 1
year | Past 5
years | Past 10
years |
Fidelity® VIP: Equity Income - Service Class 2R A | 11.22% | 4.18% | 11.14% |
A The initial offering of Service Class 2R shares took place on April 24, 2002. Performance for Service Class 2R shares reflects an asset-based distribution fee (12b-1 fee). Returns from January 12, 2000 to April 24, 2002 are those of Service Class 2. Service Class 2R returns from November 3, 1997 to January 12, 2000 are those of Service Class which reflects a different 12b-1 fee. Service Class 2R returns prior to November 3, 1997 are those of Initial Class, and do not include the effects of a 12b-1 fee. Had Service Class 2R shares' 12b-1 fee been reflected, returns prior to January 12, 2000 would have been lower.
$10,000 Over 10 Years
Let's say hypothetically that $10,000 was invested in Fidelity® Variable Insurance Products: Equity-Income Portfolio - Service Class 2R on December 31, 1994. The chart shows how the value of your investment would have changed, and also shows how the Russell 3000® Value Index performed over the same period.
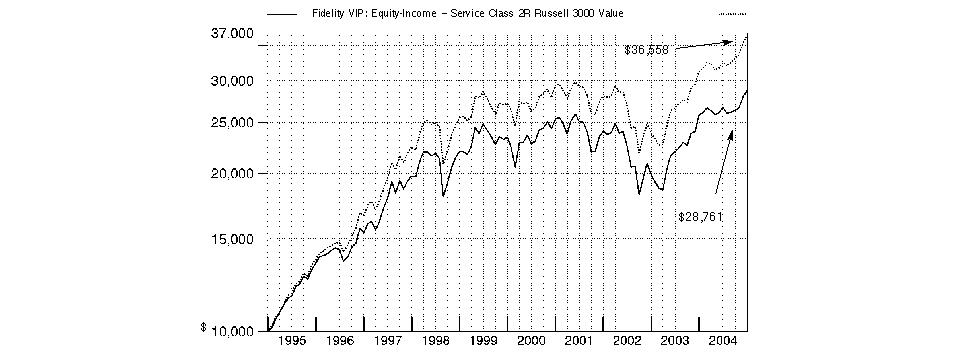
Annual Report
Fidelity Variable Insurance Products: Equity-Income Portfolio
Management's Discussion of Fund Performance
Comments from Stephen Petersen, Portfolio Manager of Fidelity® Variable Insurance Products: Equity-Income Portfolio
The year ending December 31, 2004, generally was positive for equity investors, as many stock market benchmarks produced double-digit gains. Broad-based themes included the continued dominance of small-cap stocks, which outperformed large-caps for the sixth consecutive year. The small-cap Russell 2000® Index was up 18.33% in 2004, while the larger-cap Standard & Poor's 500SM Index rose 10.88%. Value stocks ended the year well ahead of growth stocks: The Russell 3000® Value Index advanced 16.94%, compared to 6.93% for the Russell 3000 Growth Index. Energy and basic materials stocks led the market upward. Energy stocks were boosted by record-high oil prices, while strong demand from China helped support commodity prices. The health care sector was among the market's weakest performers. Technology also fell off the pace, though it was helped by a rally late in the year. The tech-heavy NASDAQ Composite® Index returned 9.15%, thanks primarily to a 14.87% jump in the fourth quarter. Elsewhere, the Dow Jones Industrial AverageSM gained 5.37% for the year.
For the 12-month period ending December 31, 2004, the fund underperformed the LipperSM Variable Annuity Equity Income Objective Funds Average, which rose 13.51%, and the Russell 3000 Value Index. Mid- and small-cap stocks continued to outperform large-caps, which - along with out-of-favor stocks - are the fund's primary focus. As a result, it did not keep pace with the Russell index, which includes stocks of all market capitalizations. The fund's performance relative to the index also was hurt by its underweighting in financial stocks. Fund holdings Pfizer and Merck were hurt by competitive pressures from generic drug makers and company-specific issues: Merck was ordered to pull its arthritis drug, Vioxx, off the shelves, causing the stock price to plummet; Pfizer, which makes arthritis drug Celebrex, took a hit over concerns about the potential for similar problems with its own product. Conversely, energy holdings Exxon Mobil and Total SA did well as crude oil prices remained high, demand grew and excess supply evaporated.
The views expressed in this statement reflect those of the portfolio manager only through the end of the period of the report as stated on the cover and do not necessarily represent the views of Fidelity or any other person in the Fidelity organization. Any such views are subject to change at any time based upon market or other conditions and Fidelity disclaims any responsibility to update such views. These views may not be relied on as investment advice and, because investment decisions for a Fidelity fund are based on numerous factors, may not be relied on as an indication of trading intent on behalf of any Fidelity fund.
Equity-Income Portfolio
Fidelity Variable Insurance Products: Equity-Income Portfolio
Shareholder Expense Example
As a shareholder of the Fund, you incur two types of costs: (1) transaction costs, including redemption fees, and (2) ongoing costs, including management fees, distribution and/or service (12b-1) fees and other Fund expenses. This Example is intended to help you understand your ongoing costs (in dollars) of investing in the Fund and to compare these costs with the ongoing costs of investing in other mutual funds.
The Example is based on an investment of $1,000 invested at the beginning of the period and held for the entire period (July 1, 2004 to December 31, 2004).
Actual Expenses
The first line of the table below for each class of the Fund provides information about actual account values and actual expenses. You may use the information in this line, together with the amount you invested, to estimate the expenses that you paid over the period. Simply divide your account value by $1,000.00 (for example, an $8,600 account value divided by $1,000.00 = 8.6), then multiply the result by the number in the first line for a class of the Fund under the heading entitled "Expenses Paid During Period" to estimate the expenses you paid on your account during this period. The estimate of expenses does not include any fees or other expenses of any variable annuity or variable life insurance product. If they were, the estimate of expenses you paid during the period would be higher, and your ending account value would be lower.
Hypothetical Example for Comparison Purposes
The second line of the table below for each class of the Fund provides information about hypothetical account values and hypothetical expenses based on a Class' actual expense ratio and an assumed rate of return of 5% per year before expenses, which is not the Class' actual return. The hypothetical account values and expenses may not be used to estimate the actual ending account balance or expenses you paid for the period. You may use this information to compare the ongoing costs of investing in the Fund and other funds. To do so, compare this 5% hypothetical example with the 5% hypothetical examples that appear in the shareholder reports of the other funds. The estimate of expenses does not include any fees or other expenses of any variable annuity or variable life insurance product. If they were, the estimate of expenses you paid during the period would be higher, and your ending account value would be lower.
Please note that the expenses shown in the table are meant to highlight your ongoing costs only and do not reflect any transaction costs. Therefore, the second line of the table is useful in comparing ongoing costs only, and will not help you determine the relative total costs of owning different funds. In addition, if these transactional costs were included, your costs would have been higher.
| Beginning
Account Value
July 1, 2004 | Ending
Account Value
December 31, 2004 | Expenses Paid
During Period*
July 1, 2004
to December 31, 2004 |
Initial Class | | | |
Actual | $ 1,000.00 | $ 1,077.30 | $ 3.08 |
HypotheticalA | $ 1,000.00 | $ 1,022.17 | $ 3.00 |
Service Class | | | |
Actual | $ 1,000.00 | $ 1,077.10 | $ 3.60 |
HypotheticalA | $ 1,000.00 | $ 1,021.67 | $ 3.51 |
Service Class 2 | | | |
Actual | $ 1,000.00 | $ 1,076.40 | $ 4.38 |
HypotheticalA | $ 1,000.00 | $ 1,020.91 | $ 4.27 |
Service Class 2R | | | |
Actual | $ 1,000.00 | $ 1,075.70 | $ 4.38 |
HypotheticalA | $ 1,000.00 | $ 1,020.91 | $ 4.27 |
A 5% return per year before expenses
* Expenses are equal to each Class' annualized expense ratio (shown in the table below); multiplied by the average account value over the period, multiplied by 184/366 (to reflect the one-half year period).
| Annualized
Expense Ratio |
Initial Class | .59% |
Service Class | .69% |
Service Class 2 | .84% |
Service Class 2R | .84% |
Annual Report
Fidelity Variable Insurance Products: Equity-Income Portfolio
Investment Summary
Top Five Stocks as of December 31, 2004 |
| % of fund's net assets |
Bank of America Corp. | 3.1 |
Exxon Mobil Corp. | 3.1 |
Citigroup, Inc. | 2.8 |
American International Group, Inc. | 2.6 |
J.P. Morgan Chase & Co. | 2.3 |
| 13.9 |
Top Five Market Sectors as of December 31, 2004 |
| % of fund's net assets |
Financials | 30.2 |
Industrials | 12.1 |
Consumer Discretionary | 11.1 |
Energy | 10.8 |
Health Care | 7.9 |
Asset Allocation as of December 31, 2004 |
% of fund's net assets* |
 | Stocks | 99.1% | |
 | Bonds | 0.7% | |
 | Short-Term Investments and Net Other Assets | 0.2% | |
* Foreign investments | 11.9% | |

Equity-Income Portfolio
Fidelity Variable Insurance Products: Equity-Income Portfolio
Investments December 31, 2004
Showing Percentage of Net Assets
Common Stocks - 98.0% |
| Shares | | Value (Note 1) |
CONSUMER DISCRETIONARY - 10.5% |
Auto Components - 0.1% |
TRW Automotive Holdings Corp. | 611,370 | | $ 12,655,359 |
Automobiles - 0.4% |
Toyota Motor Corp. ADR | 475,900 | | 38,961,933 |
Hotels, Restaurants & Leisure - 1.2% |
Caesars Entertainment, Inc. (a) | 1,927,700 | | 38,823,878 |
McDonald's Corp. | 2,561,300 | | 82,115,278 |
Six Flags, Inc. (a) | 642,256 | | 3,448,915 |
Wendy's International, Inc. | 128,800 | | 5,056,688 |
| | 129,444,759 |
Household Durables - 1.2% |
Koninklijke Philips Electronics NV (NY Shares) | 601,900 | | 15,950,350 |
LG Electronics, Inc. | 237,410 | | 14,700,524 |
Maytag Corp. | 1,357,020 | | 28,633,122 |
Newell Rubbermaid, Inc. | 2,451,900 | | 59,311,461 |
Sony Corp. sponsored ADR | 128,500 | | 5,006,360 |
The Stanley Works | 128,500 | | 6,295,215 |
| | 129,897,032 |
Leisure Equipment & Products - 0.0% |
Eastman Kodak Co. | 128,400 | | 4,140,900 |
Media - 6.0% |
Clear Channel Communications, Inc. | 2,716,100 | | 90,962,189 |
Comcast Corp. Class A (a) | 2,852,091 | | 94,917,588 |
Fox Entertainment Group, Inc.
Class A (a) | 577,900 | | 18,065,154 |
Liberty Media Corp. Class A (a) | 3,912,376 | | 42,957,888 |
Liberty Media International, Inc.
Class A (a) | 613,999 | | 28,385,174 |
The Reader's Digest Association, Inc. (non-vtg.) | 1,699,003 | | 23,633,132 |
Time Warner, Inc. (a) | 6,982,850 | | 135,746,604 |
Viacom, Inc. Class B (non-vtg.) | 3,720,586 | | 135,392,125 |
Vivendi Universal SA sponsored ADR (a) | 904,300 | | 29,000,901 |
Walt Disney Co. | 2,763,400 | | 76,822,520 |
| | 675,883,275 |
Multiline Retail - 0.7% |
Big Lots, Inc. (a) | 2,275,956 | | 27,607,349 |
Dollar Tree Stores, Inc. (a) | 790,100 | | 22,660,068 |
Family Dollar Stores, Inc. | 706,500 | | 22,063,995 |
Sears, Roebuck & Co. | 214,100 | | 10,925,523 |
| | 83,256,935 |
Specialty Retail - 0.7% |
Abercrombie & Fitch Co. Class A | 128,400 | | 6,028,380 |
AnnTaylor Stores Corp. (a) | 1,113,050 | | 23,963,967 |
Gap, Inc. | 1,267,900 | | 26,778,048 |
Toys 'R' Us, Inc. (a) | 1,295,900 | | 26,527,073 |
| | 83,297,468 |
|
| Shares | | Value (Note 1) |
Textiles, Apparel & Luxury Goods - 0.2% |
Liz Claiborne, Inc. | 632,940 | | $ 26,716,397 |
TOTAL CONSUMER DISCRETIONARY | | 1,184,254,058 |
CONSUMER STAPLES - 6.2% |
Beverages - 0.6% |
Anheuser-Busch Companies, Inc. | 1,282,400 | | 65,056,152 |
Food & Staples Retailing - 1.2% |
Albertsons, Inc. | 720,600 | | 17,207,928 |
CVS Corp. | 1,090,700 | | 49,157,849 |
Wal-Mart Stores, Inc. | 1,284,200 | | 67,831,444 |
| | 134,197,221 |
Food Products - 1.0% |
General Mills, Inc. | 278,600 | | 13,849,206 |
H.J. Heinz Co. | 281,120 | | 10,960,869 |
Kellogg Co. | 149,800 | | 6,690,068 |
Kraft Foods, Inc. Class A | 943,100 | | 33,583,791 |
Unilever PLC sponsored ADR | 1,141,000 | | 45,092,320 |
| | 110,176,254 |
Household Products - 2.0% |
Colgate-Palmolive Co. | 2,194,400 | | 112,265,504 |
Kimberly-Clark Corp. | 1,169,800 | | 76,984,538 |
Procter & Gamble Co. | 710,400 | | 39,128,832 |
| | 228,378,874 |
Personal Products - 0.6% |
Gillette Co. | 1,605,120 | | 71,877,274 |
Tobacco - 0.8% |
Altria Group, Inc. | 1,562,800 | | 95,487,080 |
TOTAL CONSUMER STAPLES | | 705,172,855 |
ENERGY - 10.8% |
Energy Equipment & Services - 2.4% |
Baker Hughes, Inc. | 1,373,800 | | 58,620,046 |
BJ Services Co. | 536,645 | | 24,975,458 |
Halliburton Co. | 708,200 | | 27,789,768 |
Noble Corp. (a) | 817,100 | | 40,642,554 |
Schlumberger Ltd. (NY Shares) | 1,768,900 | | 118,427,855 |
| | 270,455,681 |
Oil & Gas - 8.4% |
Apache Corp. | 647,780 | | 32,758,235 |
BP PLC sponsored ADR | 2,459,842 | | 143,654,773 |
ChevronTexaco Corp. | 2,480,842 | | 130,269,013 |
Exxon Mobil Corp. | 6,841,236 | | 350,681,757 |
Royal Dutch Petroleum Co. (NY Shares) | 664,300 | | 38,117,534 |
Total SA: | | | |
Series B | 341,300 | | 74,976,784 |
sponsored ADR | 1,652,996 | | 181,565,081 |
| | 952,023,177 |
TOTAL ENERGY | | 1,222,478,858 |
Common Stocks - continued |
| Shares | | Value (Note 1) |
FINANCIALS - 29.6% |
Capital Markets - 4.9% |
Bank of New York Co., Inc. | 3,107,200 | | $ 103,842,624 |
Charles Schwab Corp. | 5,679,300 | | 67,924,428 |
Credit Suisse Group sponsored ADR | 610,000 | | 25,735,900 |
Janus Capital Group, Inc. | 2,332,400 | | 39,207,644 |
LaBranche & Co., Inc. (a)(c) | 517,900 | | 4,640,384 |
Mellon Financial Corp. | 1,716,500 | | 53,400,315 |
Merrill Lynch & Co., Inc. | 1,610,300 | | 96,247,631 |
Morgan Stanley | 2,073,600 | | 115,126,272 |
Nomura Holdings, Inc. | 1,853,000 | | 26,979,681 |
State Street Corp. | 386,200 | | 18,970,144 |
| | 552,075,023 |
Commercial Banks - 7.3% |
Bank of America Corp. | 7,600,666 | | 357,155,294 |
Comerica, Inc. | 730,200 | | 44,556,804 |
Lloyds TSB Group PLC | 2,282,400 | | 20,717,588 |
Royal Bank of Scotland Group PLC | 625,547 | | 21,031,989 |
State Bank of India | 463,175 | | 7,573,045 |
Sumitomo Mitsui Financial Group, Inc. | 2,994 | | 21,776,140 |
U.S. Bancorp, Delaware | 1,909,838 | | 59,816,126 |
Wachovia Corp. | 2,934,075 | | 154,332,345 |
Wells Fargo & Co. | 2,176,800 | | 135,288,120 |
| | 822,247,451 |
Consumer Finance - 1.3% |
American Express Co. | 1,542,996 | | 86,978,685 |
MBNA Corp. | 1,456,400 | | 41,055,916 |
MoneyGram International, Inc. | 1,014,600 | | 21,448,644 |
| | 149,483,245 |
Diversified Financial Services - 5.5% |
CIT Group, Inc. | 1,049,200 | | 48,074,344 |
Citigroup, Inc. | 6,481,619 | | 312,284,403 |
J.P. Morgan Chase & Co. | 6,788,812 | | 264,831,556 |
| | 625,190,303 |
Insurance - 7.7% |
ACE Ltd. | 2,238,115 | | 95,679,416 |
Allianz AG sponsored ADR | 1,115,700 | | 14,827,653 |
Allstate Corp. | 2,059,400 | | 106,512,168 |
American International Group, Inc. | 4,377,250 | | 287,454,008 |
Assurant, Inc. | 164,900 | | 5,037,695 |
Conseco, Inc. (a) | 1,262,800 | | 25,192,860 |
Fondiaria-Sai Spa (c) | 541,144 | | 14,556,983 |
Genworth Financial, Inc. Class A | 1,087,200 | | 29,354,400 |
Hartford Financial Services Group, Inc. | 1,104,500 | | 76,552,895 |
Marsh & McLennan Companies, Inc. | 793,600 | | 26,109,440 |
|
| Shares | | Value (Note 1) |
Muenchener Rueckversicherungs-Gesellschaft AG (Reg.) | 123,914 | | $ 15,204,241 |
Old Republic International Corp. | 530,996 | | 13,434,199 |
St. Paul Travelers Companies, Inc. | 2,542,926 | | 94,266,267 |
The Chubb Corp. | 439,000 | | 33,759,100 |
XL Capital Ltd. Class A | 428,300 | | 33,257,495 |
| | 871,198,820 |
Real Estate - 0.1% |
CarrAmerica Realty Corp. | 193,740 | | 6,393,420 |
Thrifts & Mortgage Finance - 2.8% |
Fannie Mae | 2,818,100 | | 200,676,901 |
Freddie Mac | 717,900 | | 52,909,230 |
Housing Development Finance Corp. Ltd. | 1,133,500 | | 20,155,333 |
MGIC Investment Corp. | 195,900 | | 13,499,469 |
Sovereign Bancorp, Inc. | 1,371,550 | | 30,928,453 |
| | 318,169,386 |
TOTAL FINANCIALS | | 3,344,757,648 |
HEALTH CARE - 7.7% |
Health Care Equipment & Supplies - 1.2% |
Baxter International, Inc. | 3,124,600 | | 107,923,684 |
Thermo Electron Corp. (a) | 667,000 | | 20,136,730 |
| | 128,060,414 |
Health Care Providers & Services - 1.3% |
Cardinal Health, Inc. | 706,100 | | 41,059,715 |
HCA, Inc. | 333,500 | | 13,326,660 |
McKesson Corp. | 1,307,500 | | 41,133,950 |
Tenet Healthcare Corp. (a) | 2,188,900 | | 24,034,122 |
UnitedHealth Group, Inc. | 334,200 | | 29,419,626 |
| | 148,974,073 |
Pharmaceuticals - 5.2% |
Abbott Laboratories | 857,000 | | 39,979,050 |
Bristol-Myers Squibb Co. | 2,517,500 | | 64,498,350 |
GlaxoSmithKline PLC sponsored ADR | 430,600 | | 20,406,134 |
Johnson & Johnson | 2,077,200 | | 131,736,024 |
Merck & Co., Inc. | 2,683,400 | | 86,244,476 |
Pfizer, Inc. | 3,579,000 | | 96,239,310 |
Schering-Plough Corp. | 3,703,130 | | 77,321,354 |
Wyeth | 1,713,500 | | 72,977,965 |
| | 589,402,663 |
TOTAL HEALTH CARE | | 866,437,150 |
INDUSTRIALS - 12.0% |
Aerospace & Defense - 3.4% |
Bombardier, Inc. Class B (sub. vtg.) | 2,376,500 | | 4,713,392 |
EADS NV | 1,540,015 | | 44,686,006 |
Honeywell International, Inc. | 2,956,625 | | 104,694,091 |
Lockheed Martin Corp. | 1,439,400 | | 79,958,670 |
Common Stocks - continued |
| Shares | | Value (Note 1) |
INDUSTRIALS - continued |
Aerospace & Defense - continued |
Northrop Grumman Corp. | 903,000 | | $ 49,087,080 |
Raytheon Co. | 288,678 | | 11,209,367 |
The Boeing Co. | 865,000 | | 44,781,050 |
United Technologies Corp. | 379,520 | | 39,223,392 |
| | 378,353,048 |
Air Freight & Logistics - 0.1% |
Ryder System, Inc. | 123,200 | | 5,885,264 |
Airlines - 0.2% |
Southwest Airlines Co. | 1,586,900 | | 25,834,732 |
Commercial Services & Supplies - 0.3% |
Waste Management, Inc. | 1,286,100 | | 38,505,834 |
Construction & Engineering - 0.2% |
Fluor Corp. | 368,900 | | 20,108,739 |
Electrical Equipment - 0.3% |
Emerson Electric Co. | 550,200 | | 38,569,020 |
Industrial Conglomerates - 3.8% |
3M Co. | 342,400 | | 28,100,768 |
General Electric Co. | 4,291,540 | | 156,641,210 |
Hutchison Whampoa Ltd. | 2,304,000 | | 21,564,430 |
Siemens AG sponsored ADR | 248,700 | | 21,057,429 |
Textron, Inc. | 717,500 | | 52,951,500 |
Tyco International Ltd. | 4,166,646 | | 148,915,928 |
| | 429,231,265 |
Machinery - 2.7% |
Caterpillar, Inc. | 510,300 | | 49,759,353 |
Deere & Co. | 193,250 | | 14,377,800 |
Dover Corp. | 850,600 | | 35,674,164 |
Eaton Corp. | 212,900 | | 15,405,444 |
Illinois Tool Works, Inc. | 176,200 | | 16,330,216 |
Ingersoll-Rand Co. Ltd. Class A | 1,043,044 | | 83,756,433 |
Navistar International Corp. (a) | 508,495 | | 22,363,610 |
SPX Corp. | 1,550,600 | | 62,117,036 |
| | 299,784,056 |
Road & Rail - 1.0% |
Burlington Northern Santa Fe Corp. | 1,236,500 | | 58,498,815 |
Union Pacific Corp. | 807,900 | | 54,331,275 |
| | 112,830,090 |
TOTAL INDUSTRIALS | | 1,349,102,048 |
INFORMATION TECHNOLOGY - 6.9% |
Communications Equipment - 0.9% |
Lucent Technologies, Inc. (a) | 4,816,600 | | 18,110,416 |
Lucent Technologies, Inc. warrants 12/10/07 (a) | 8,328 | | 13,158 |
Motorola, Inc. | 3,578,112 | | 61,543,526 |
Nokia Corp. sponsored ADR | 1,182,000 | | 18,521,940 |
| | 98,189,040 |
|
| Shares | | Value (Note 1) |
Computers & Peripherals - 1.8% |
Hewlett-Packard Co. | 3,850,311 | | $ 80,741,022 |
International Business Machines Corp. | 868,400 | | 85,606,872 |
Storage Technology Corp. (a) | 710,110 | | 22,446,577 |
Sun Microsystems, Inc. (a) | 3,998,675 | | 21,512,872 |
| | 210,307,343 |
Electronic Equipment & Instruments - 0.8% |
Agilent Technologies, Inc. (a) | 429,600 | | 10,353,360 |
Arrow Electronics, Inc. (a) | 830,900 | | 20,190,870 |
Avnet, Inc. (a) | 1,584,330 | | 28,898,179 |
Solectron Corp. (a) | 5,530,200 | | 29,475,966 |
| | 88,918,375 |
IT Services - 0.1% |
Ceridian Corp. (a) | 780,800 | | 14,273,024 |
Office Electronics - 0.3% |
Xerox Corp. (a) | 1,881,900 | | 32,011,119 |
Semiconductors & Semiconductor Equipment - 2.1% |
Analog Devices, Inc. | 1,113,300 | | 41,103,036 |
Applied Materials, Inc. (a) | 1,369,900 | | 23,425,290 |
Freescale Semiconductor, Inc. Class B | 1,468,877 | | 26,968,582 |
Intel Corp. | 3,219,100 | | 75,294,749 |
Micron Technology, Inc. (a) | 1,866,200 | | 23,047,570 |
National Semiconductor Corp. | 235,200 | | 4,221,840 |
Rohm Co. Ltd. | 148,300 | | 15,346,871 |
Samsung Electronics Co. Ltd. | 55,670 | | 24,226,562 |
Teradyne, Inc. (a) | 107,400 | | 1,833,318 |
| | 235,467,818 |
Software - 0.9% |
Computer Associates International, Inc. | 1,381 | | 42,894 |
Microsoft Corp. | 3,735,200 | | 99,767,192 |
| | 99,810,086 |
TOTAL INFORMATION TECHNOLOGY | | 778,976,805 |
MATERIALS - 6.2% |
Chemicals - 2.6% |
Air Products & Chemicals, Inc. | 64,300 | | 3,727,471 |
Arch Chemicals, Inc. | 392,800 | | 11,304,784 |
Dow Chemical Co. | 2,015,700 | | 99,797,307 |
Eastman Chemical Co. | 476,800 | | 27,525,664 |
Great Lakes Chemical Corp. | 650,500 | | 18,532,745 |
Lubrizol Corp. | 214,800 | | 7,917,528 |
Lyondell Chemical Co. | 2,272,593 | | 65,723,375 |
Nalco Holding Co. | 95,700 | | 1,868,064 |
Olin Corp. | 682,700 | | 15,033,054 |
PolyOne Corp. (a) | 1,239,100 | | 11,226,246 |
Praxair, Inc. | 621,624 | | 27,444,700 |
| | 290,100,938 |
Common Stocks - continued |
| Shares | | Value (Note 1) |
MATERIALS - continued |
Containers & Packaging - 0.5% |
Amcor Ltd. | 963,600 | | $ 5,541,317 |
Smurfit-Stone Container Corp. (a) | 2,515,872 | | 46,996,489 |
| | 52,537,806 |
Metals & Mining - 1.8% |
Alcan, Inc. | 955,100 | | 46,799,900 |
Alcoa, Inc. | 2,616,216 | | 82,201,507 |
Freeport-McMoRan Copper & Gold, Inc. Class B | 820,704 | | 31,375,514 |
Phelps Dodge Corp. | 437,600 | | 43,287,392 |
| | 203,664,313 |
Paper & Forest Products - 1.3% |
Bowater, Inc. (c) | 391,300 | | 17,205,461 |
Georgia-Pacific Corp. | 1,353,201 | | 50,717,973 |
International Paper Co. | 999,700 | | 41,987,400 |
Weyerhaeuser Co. | 610,400 | | 41,031,088 |
| | 150,941,922 |
TOTAL MATERIALS | | 697,244,979 |
TELECOMMUNICATION SERVICES - 5.3% |
Diversified Telecommunication Services - 4.9% |
BellSouth Corp. | 5,303,299 | | 147,378,679 |
Qwest Communications International, Inc. (a) | 3,728,500 | | 16,554,540 |
SBC Communications, Inc. | 7,035,993 | | 181,317,540 |
Sprint Corp. | 1,161,600 | | 28,865,760 |
Verizon Communications, Inc. | 4,370,102 | | 177,032,832 |
| | 551,149,351 |
Wireless Telecommunication Services - 0.4% |
Crown Castle International Corp. (a) | 910,400 | | 15,149,056 |
KDDI Corp. | 3,028 | | 16,318,032 |
Vodafone Group PLC sponsored ADR | 556,500 | | 15,236,970 |
| | 46,704,058 |
TOTAL TELECOMMUNICATION SERVICES | | 597,853,409 |
UTILITIES - 2.8% |
Electric Utilities - 1.5% |
Entergy Corp. | 765,900 | | 51,767,181 |
FirstEnergy Corp. | 428,200 | | 16,918,182 |
PG&E Corp. (a) | 403,800 | | 13,438,464 |
TXU Corp. | 654,820 | | 42,275,179 |
Wisconsin Energy Corp. | 1,414,600 | | 47,686,166 |
| | 172,085,172 |
Gas Utilities - 0.0% |
AGL Resources, Inc. | 109,500 | | 3,639,780 |
|
| Shares | | Value (Note 1) |
Multi-Utilities & Unregulated Power - 1.3% |
Dominion Resources, Inc. | 1,305,300 | | $ 88,421,022 |
NorthWestern Energy Corp. (a) | 85,500 | | 2,394,000 |
Public Service Enterprise Group, Inc. | 1,026,100 | | 53,121,197 |
| | 143,936,219 |
TOTAL UTILITIES | | 319,661,171 |
TOTAL COMMON STOCKS (Cost $8,380,344,823) | 11,065,938,981 |
Convertible Preferred Stocks - 1.1% |
| | | |
CONSUMER DISCRETIONARY - 0.2% |
Automobiles - 0.1% |
General Motors Corp.: | | | |
Series B, 5.25% | 412,200 | | 9,472,356 |
Series C, 6.25% | 253,100 | | 6,671,716 |
| | 16,144,072 |
Hotels, Restaurants & Leisure - 0.1% |
Six Flags, Inc. 7.25% PIERS | 388,400 | | 8,603,060 |
TOTAL CONSUMER DISCRETIONARY | | 24,747,132 |
FINANCIALS - 0.5% |
Capital Markets - 0.1% |
State Street Corp. 6.75% | 24,900 | | 5,556,186 |
Consumer Finance - 0.2% |
Ford Motor Co. Capital Trust II 6.50% | 461,500 | | 24,392,583 |
Insurance - 0.2% |
Conseco, Inc. Series B, 5.50% | 143,400 | | 3,782,892 |
The Chubb Corp.: | | | |
7.00% | 167,700 | | 4,937,591 |
Series B, 7.00% | 120,100 | | 3,603,000 |
Travelers Property Casualty Corp. 4.50% | 240,200 | | 5,483,045 |
XL Capital Ltd. 6.50% | 401,800 | | 10,127,369 |
| | 27,933,897 |
TOTAL FINANCIALS | | 57,882,666 |
HEALTH CARE - 0.2% |
Health Care Equipment & Supplies - 0.1% |
Baxter International, Inc. 7.00% | 156,900 | | 8,811,504 |
Pharmaceuticals - 0.1% |
Schering-Plough Corp. 6.00% | 187,400 | | 10,482,781 |
TOTAL HEALTH CARE | | 19,294,285 |
INFORMATION TECHNOLOGY - 0.2% |
Office Electronics - 0.2% |
Xerox Corp. Series C, 6.25% | 145,650 | | 21,476,675 |
TOTAL CONVERTIBLE PREFERRED STOCKS (Cost $116,492,275) | 123,400,758 |
Corporate Bonds - 0.7% |
| Principal
Amount | | Value
(Note 1) |
Convertible Bonds - 0.6% |
CONSUMER DISCRETIONARY - 0.4% |
Hotels, Restaurants & Leisure - 0.1% |
Royal Caribbean Cruises Ltd. liquid yield option note 0% 2/2/21 | $ 11,239,000 | | $ 7,192,960 |
Six Flags, Inc. 4.5% 5/15/15 | 3,640,000 | | 4,095,000 |
| | 11,287,960 |
Media - 0.2% |
Liberty Media Corp.3.5% 1/15/31 (d) | 11,400,000 | | 10,773,000 |
News America, Inc. liquid yield option note 0% 2/28/21 (d) | 22,670,000 | | 13,295,955 |
| | 24,068,955 |
Specialty Retail - 0.1% |
Gap, Inc. 5.75% 3/15/09 | 8,590,000 | | 11,417,828 |
TOTAL CONSUMER DISCRETIONARY | | 46,774,743 |
FINANCIALS - 0.1% |
Diversified Financial Services - 0.0% |
Navistar Financial Corp. 4.75% 4/1/09 (d) | 2,760,000 | | 2,821,879 |
Insurance - 0.1% |
Loews Corp. 3.125% 9/15/07 | 5,340,000 | | 5,246,550 |
TOTAL FINANCIALS | | 8,068,429 |
INDUSTRIALS - 0.1% |
Industrial Conglomerates - 0.1% |
Tyco International Group SA yankee 3.125% 1/15/23 | 5,220,000 | | 8,781,084 |
INFORMATION TECHNOLOGY - 0.0% |
Electronic Equipment & Instruments - 0.0% |
Celestica, Inc. liquid yield option note 0% 8/1/20 | 620,000 | | 344,100 |
TELECOMMUNICATION SERVICES - 0.0% |
Diversified Telecommunication Services - 0.0% |
Level 3 Communications, Inc. 5.25% 12/15/11 (d) | 6,420,000 | | 6,474,570 |
TOTAL CONVERTIBLE BONDS | | 70,442,926 |
|
| Principal
Amount | | Value
(Note 1) |
Nonconvertible Bonds - 0.1% |
CONSUMER DISCRETIONARY - 0.0% |
Media - 0.0% |
XM Satellite Radio, Inc. 12% 6/15/10 | $ 60,000 | | $ 70,800 |
MATERIALS - 0.1% |
Chemicals - 0.1% |
Hercules, Inc. 6.5% 6/30/29 unit | 15,700,000 | | 13,366,980 |
TOTAL NONCONVERTIBLE BONDS | | 13,437,780 |
TOTAL CORPORATE BONDS (Cost $83,532,173) | 83,880,706 |
Money Market Funds - 0.3% |
| Shares | | |
Fidelity Cash Central Fund, 2.24% (b) | 12,522,005 | | 12,522,005 |
Fidelity Securities Lending Cash Central Fund, 2.23% (b)(e) | 16,586,000 | | 16,586,000 |
TOTAL MONEY MARKET FUNDS (Cost $29,108,005) | 29,108,005 |
TOTAL INVESTMENT
PORTFOLIO - 100.1% (Cost $8,609,477,276) | | 11,302,328,450 |
NET OTHER ASSETS - (0.1)% | | (15,105,563) |
NET ASSETS - 100% | $ 11,287,222,887 |
Security Type Abbreviations |
PIERS | - | Preferred Income Equity Redeemable Securities |
Legend |
(a) Non-income producing |
(b) Affiliated fund that is available only to investment companies and other accounts managed by Fidelity Investments. The rate quoted is the annualized seven-day yield of the fund at period end. A complete listing of the fund's holdings as of its most recent fiscal year end is available upon request. |
(c) Security or a portion of the security is on loan at period end. |
(d) Security exempt from registration under Rule 144A of the Securities Act of 1933. These securities may be resold in transactions exempt from registration, normally to qualified institutional buyers. At the period end, the value of these securities amounted to $33,365,404 or 0.3% of net assets. |
(e) Includes investment made with cash collateral received from securities on loan. |
Distribution of investments by country of issue, as a percentage of total net assets, is as follows: |
United States of America | 88.1% |
France | 2.6% |
United Kingdom | 2.4% |
Japan | 1.2% |
Netherlands Antilles | 1.1% |
Others (individually less than 1%) | 4.6% |
| 100.0% |
Income Tax Information |
The fund hereby designates as capital gain dividends: For dividends with respect to the taxable year ended December 31, 2004, $346,587,000 or, if different, the net capital gain of such year, and for dividends with respect to the taxable year ended December 31, 2003, $38,802,000 or, if different, the excess of (a) the net capital gain of such year, over (b) amounts previously designated as capital gain dividends with respect to such year. |
See accompanying notes which are an integral part of the financial statements.
Equity-Income Portfolio
Fidelity Variable Insurance Products: Equity-Income Portfolio
Financial Statements
Statement of Assets and Liabilities
December 31, 2004 |
Assets | | |
Investment in securities, at value (including securities loaned of $15,755,088) (cost $8,609,477,276) - See accompanying schedule | | $ 11,302,328,450 |
Receivable for fund shares sold | | 3,091,666 |
Dividends receivable | | 15,480,610 |
Interest receivable | | 827,433 |
Prepaid expenses | | 40,772 |
Other affiliated receivables | | 47,175 |
Other receivables | | 339,933 |
Total assets | | 11,322,156,039 |
| | |
Liabilities | | |
Payable for investments purchased | $ 470,842 | |
Payable for fund shares redeemed | 10,653,620 | |
Accrued management fee | 4,398,026 | |
Distribution fees payable | 385,209 | |
Other affiliated payables | 953,526 | |
Other payables and accrued expenses | 1,485,929 | |
Collateral on securities loaned, at value | 16,586,000 | |
Total liabilities | | 34,933,152 |
| | |
Net Assets | | $ 11,287,222,887 |
Net Assets consist of: | | |
Paid in capital | | $ 8,042,639,374 |
Undistributed net investment income | | 170,688,068 |
Accumulated undistributed net realized gain (loss) on investments and foreign currency transactions | | 381,040,713 |
Net unrealized appreciation (depreciation) on investments and assets and liabilities in foreign currencies | | 2,692,854,732 |
Net Assets | | $ 11,287,222,887 |
| | |
Initial Class:
Net Asset Value, offering price
and redemption price per
share ($8,689,828,908 ÷ 342,542,001 shares) | | $ 25.37 |
| | |
Service Class:
Net Asset Value, offering price
and redemption price per
share ($1,170,777,702 ÷ 46,313,238 shares) | | $ 25.28 |
| | |
Service Class 2:
Net Asset Value, offering price
and redemption price per
share ($1,420,999,293 ÷ 56,645,362 shares) | | $ 25.09 |
| | |
Service Class 2R:
Net Asset Value, offering price
and redemption price per
share ($5,616,984 ÷
224,552 shares) | | $ 25.01 |
Statement of Operations
Year ended December 31, 2004 |
Investment Income | | |
Dividends | | $ 236,033,278 |
Interest | | 4,492,568 |
Security lending | | 990,003 |
Total income | | 241,515,849 |
| | |
Expenses | | |
Management fee | $ 50,339,584 | |
Transfer agent fees | 7,040,948 | |
Distribution fees | 3,960,547 | |
Accounting and security lending fees | 1,403,577 | |
Non-interested trustees' compensation | 58,219 | |
Appreciation in deferred trustee compensation account | 26,259 | |
Custodian fees and expenses | 286,747 | |
Registration fees | 8,658 | |
Audit | 103,482 | |
Legal | 28,314 | |
Interest | 9,745 | |
Miscellaneous | 1,847,706 | |
Total expenses before reductions | 65,113,786 | |
Expense reductions | (874,557) | 64,239,229 |
Net investment income (loss) | | 177,276,620 |
Realized and Unrealized Gain (Loss) Net realized gain (loss) on: | | |
Investment securities | 393,977,845 | |
Foreign currency transactions | 10,545 | |
Total net realized gain (loss) | | 393,988,390 |
Change in net unrealized appreciation (depreciation) on: Investment securities (net of decrease in deferred foreign taxes of $1,499,172) | 595,198,380 | |
Assets and liabilities in foreign currencies | (21,670) | |
Total change in net unrealized appreciation (depreciation) | | 595,176,710 |
Net gain (loss) | | 989,165,100 |
Net increase (decrease) in net assets resulting from operations | | $ 1,166,441,720 |
See accompanying notes which are an integral part of the financial statements.
Annual Report
Fidelity Variable Insurance Products: Equity-Income Portfolio
Financial Statements - continued
Statement of Changes in Net Assets
| Year ended
December 31,
2004 | Year ended
December 31,
2003 |
Increase (Decrease) in Net Assets | | |
Operations | | |
Net investment income (loss) | $ 177,276,620 | $ 156,056,293 |
Net realized gain (loss) | 393,988,390 | 162,136,844 |
Change in net unrealized appreciation (depreciation) | 595,176,710 | 2,060,660,428 |
Net increase (decrease) in net assets resulting from operations | 1,166,441,720 | 2,378,853,565 |
Distributions to shareholders from net investment income | (160,632,605) | (152,426,442) |
Distributions to shareholders from net realized gain | (38,902,738) | - |
Total distributions | (199,535,343) | (152,426,442) |
Share transactions - net increase (decrease) | (72,700,137) | 95,024,961 |
Redemption fees | 27 | 6,803 |
Total increase (decrease) in net assets | 894,206,267 | 2,321,458,887 |
| | |
Net Assets | | |
Beginning of period | 10,393,016,620 | 8,071,557,733 |
End of period (including undistributed net investment income of $170,688,068 and undistributed net investment income of $153,745,641, respectively) | $ 11,287,222,887 | $ 10,393,016,620 |
Other Information: | | | | |
Share Transactions | Year ended December 31, 2004 |
| Initial Class | Service Class | Service Class 2 | Service Class 2R |
Shares Sold | 19,642,612 | 4,254,175 | 21,126,824 | 207,129 |
Reinvested | 6,898,356 | 858,454 | 759,147 | 2,031 |
Redeemed | (46,454,587) | (5,170,065) | (5,169,545) | (67,130) |
Net increase (decrease) | (19,913,619) | (57,436) | 16,716,426 | 142,030 |
| | | | |
Dollars Sold | $ 460,321,782 | $ 99,280,265 | $ 490,310,488 | $ 4,777,338 |
Reinvested | 161,766,458 | 20,079,238 | 17,642,584 | 47,063 |
Redeemed | (1,086,286,467) | (119,952,965) | (119,145,127) | (1,540,794) |
Net increase (decrease) | $ (464,198,227) | $ (593,462) | $ 388,807,945 | $ 3,283,607 |
| | | | |
Share Transactions | Year ended December 31, 2003 |
| Initial Class | Service Class | Service Class 2 | Service Class 2R |
Shares Sold | 32,080,268 | 11,240,469 | 21,169,436 | 138,968 |
Reinvested | 7,869,268 | 847,723 | 452,997 | 1,082 |
Redeemed | (57,207,152) | (8,346,250) | (4,117,145) | (83,694) |
Net increase (decrease) | (17,257,616) | 3,741,942 | 17,505,288 | 56,356 |
| | | | |
Dollars Sold | $ 628,858,276 | $ 219,068,172 | $ 416,030,936 | $ 2,784,343 |
Reinvested | 130,865,933 | 14,063,717 | 7,478,977 | 17,815 |
Redeemed | (1,083,344,265) | (159,436,339) | (79,803,985) | (1,558,619) |
Net increase (decrease) | $ (323,620,056) | $ 73,695,550 | $ 343,705,928 | $ 1,243,539 |
| | | | |
Distributions | Year ended December 31, 2004 |
| Initial Class | Service Class | Service Class 2 | Service Class 2R |
From net investment income | $ 130,573,823 | $ 16,025,683 | $ 13,995,319 | $ 37,780 |
From net realized gain | 31,192,635 | 4,053,555 | 3,647,265 | 9,283 |
Total | $ 161,766,458 | $ 20,079,238 | $ 17,642,584 | $ 47,063 |
| Year ended December 31, 2003 |
| Initial Class | Service Class | Service Class 2 | Service Class 2R |
From net investment income | $ 130,865,933 | $ 14,063,717 | $ 7,478,977 | $ 17,815 |
From net realized gain | - | - | - | - |
Total | $ 130,865,933 | $ 14,063,717 | $ 7,478,977 | $ 17,815 |
See accompanying notes which are an integral part of the financial statements.
Equity-Income Portfolio
Financial Highlights - Initial Class
Years ended December 31, | 2004 | 2003 | 2002 | 2001 | 2000 |
Selected Per-Share Data | | | | | |
Net asset value, beginning of period | $ 23.18 | $ 18.16 | $ 22.75 | $ 25.52 | $ 25.71 |
Income from Investment Operations | | | | | |
Net investment income (loss) C | .40 | .36 | .34 | .34 | .40 |
Net realized and unrealized gain (loss) | 2.24 | 5.01 | (4.08) | (1.51) | 1.46 |
Total from investment operations | 2.64 | 5.37 | (3.74) | (1.17) | 1.86 |
Distributions from net investment income | (.36) | (.35) | (.36) | (.42) | (.44) |
Distributions from net realized gain | (.09) | - | (.49) | (1.18) | (1.61) |
Total distributions | (.45) | (.35) | (.85) | (1.60) | (2.05) |
Redemption fees added to paid in capital | - C, E | - C, E | - C, E | - | - |
Net asset value, end of period | $ 25.37 | $ 23.18 | $ 18.16 | $ 22.75 | $ 25.52 |
Total Return A, B | 11.53% | 30.33% | (16.95)% | (4.96)% | 8.42% |
Ratios to Average Net Assets D | | | | | |
Expenses before expense reductions | .58% | .57% | .57% | .58% | .56% |
Expenses net of voluntary waivers, if any | .58% | .57% | .57% | .58% | .56% |
Expenses net of all reductions | .57% | .56% | .56% | .57% | .55% |
Net investment income (loss) | 1.71% | 1.83% | 1.70% | 1.47% | 1.68% |
Supplemental Data | | | | | |
Net assets, end of period (000 omitted) | $ 8,689,829 | $ 8,402,963 | $ 6,895,940 | $ 9,256,205 | $ 9,969,086 |
Portfolio turnover rate | 22% | 26% | 25% | 24% | 22% |
A Total returns do not reflect charges attributable to your insurance company's separate account. Inclusion of these charges would reduce the total returns shown.
B Total returns would have been lower had certain expenses not been reduced during the periods shown.
C Calculated based on average shares outstanding during the period.
D Expense ratios reflect operating expenses of the class. Expenses before reductions do not reflect amounts reimbursed by the investment adviser or reductions from brokerage service arrangements or other expense offset arrangements and do not represent the amount paid by the class during periods when reimbursements or reductions occur. Expenses net of any voluntary waivers reflect expenses after reimbursement by the investment adviser but prior to reductions from brokerage service arrangements or other expense offset arrangements. Expenses net of all reductions represent the net expenses paid by the class.
E Amount represents less than $.01 per share.
Financial Highlights - Service Class
Years ended December 31, | 2004 | 2003 | 2002 | 2001 | 2000 |
Selected Per-Share Data | | | | | |
Net asset value, beginning of period | $ 23.11 | $ 18.10 | $ 22.67 | $ 25.45 | $ 25.66 |
Income from Investment Operations | | | | | |
Net investment income (loss) C | .38 | .34 | .32 | .31 | .37 |
Net realized and unrealized gain (loss) | 2.22 | 5.00 | (4.06) | (1.51) | 1.46 |
Total from investment operations | 2.60 | 5.34 | (3.74) | (1.20) | 1.83 |
Distributions from net investment income | (.34) | (.33) | (.34) | (.40) | (.43) |
Distributions from net realized gain | (.09) | - | (.49) | (1.18) | (1.61) |
Total distributions | (.43) | (.33) | (.83) | (1.58) | (2.04) |
Redemption fees added to paid in capital | - C, E | - C, E | - C, E | - | - |
Net asset value, end of period | $ 25.28 | $ 23.11 | $ 18.10 | $ 22.67 | $ 25.45 |
Total Return A, B | 11.38% | 30.22% | (17.00)% | (5.09)% | 8.30% |
Ratios to Average Net Assets D | | | | | |
Expenses before expense reductions | .68% | .67% | .67% | .68% | .66% |
Expenses net of voluntary waivers, if any | .68% | .67% | .67% | .68% | .66% |
Expenses net of all reductions | .67% | .66% | .66% | .67% | .65% |
Net investment income (loss) | 1.61% | 1.73% | 1.60% | 1.37% | 1.58% |
Supplemental Data | | | | | |
Net assets, end of period (000 omitted) | $ 1,170,778 | $ 1,071,483 | $ 771,516 | $ 836,017 | $ 634,897 |
Portfolio turnover rate | 22% | 26% | 25% | 24% | 22% |
A Total returns do not reflect charges attributable to your insurance company's separate account. Inclusion of these charges would reduce the total returns shown.
B Total returns would have been lower had certain expenses not been reduced during the periods shown.
C Calculated based on average shares outstanding during the period.
D Expense ratios reflect operating expenses of the class. Expenses before reductions do not reflect amounts reimbursed by the investment adviser or reductions from brokerage service arrangements or other expense offset arrangements and do not represent the amount paid by the class during periods when reimbursements or reductions occur. Expenses net of any voluntary waivers reflect expenses after reimbursement by the investment adviser but prior to reductions from brokerage service arrangements or other expense offset arrangements. Expenses net of all reductions represent the net expenses paid by the class.
E Amount represents less than $.01 per share.
See accompanying notes which are an integral part of the financial statements.
Annual Report
Financial Highlights - Service Class 2
Years ended December 31, | 2004 | 2003 | 2002 | 2001 | 2000 F |
Selected Per-Share Data | | | | | |
Net asset value, beginning of period | $ 22.96 | $ 18.00 | $ 22.59 | $ 25.41 | $ 25.18 |
Income from Investment Operations | | | | | |
Net investment income (loss) E | .34 | .31 | .28 | .27 | .32 |
Net realized and unrealized gain (loss) | 2.21 | 4.97 | (4.04) | (1.50) | 1.95 |
Total from investment operations | 2.55 | 5.28 | (3.76) | (1.23) | 2.27 |
Distributions from net investment income | (.33) | (.32) | (.34) | (.41) | (.43) |
Distributions from net realized gain | (.09) | - | (.49) | (1.18) | (1.61) |
Total distributions | (.42) | (.32) | (.83) | (1.59) | (2.04) |
Redemption fees added to paid in capital | - E, H | - E, H | - E, H | - | - |
Net asset value, end of period | $ 25.09 | $ 22.96 | $ 18.00 | $ 22.59 | $ 25.41 |
Total Return B, C, D | 11.23% | 30.03% | (17.15)% | (5.23)% | 10.19% |
Ratios to Average Net Assets G | | | | | |
Expenses before expense reductions | .83% | .82% | .83% | .84% | .83% A |
Expenses net of voluntary waivers, if any | .83% | .82% | .83% | .84% | .83% A |
Expenses net of all reductions | .82% | .81% | .82% | .83% | .82% A |
Net investment income (loss) | 1.46% | 1.58% | 1.44% | 1.21% | 1.41% A |
Supplemental Data | | | | | |
Net assets, end of period (000 omitted) | $ 1,420,999 | $ 916,679 | $ 403,632 | $ 226,078 | $ 39,911 |
Portfolio turnover rate | 22% | 26% | 25% | 24% | 22% |
A Annualized
B Total returns for periods of less than one year are not annualized.
C Total returns do not reflect charges attributable to your insurance company's separate account. Inclusion of these charges would reduce the total returns shown.
D Total returns would have been lower had certain expenses not been reduced during the periods shown.
E Calculated based on average shares outstanding during the period.
F For the period January 12, 2000 (commencement of sale of shares) to December 31, 2000.
G Expense ratios reflect operating expenses of the class. Expenses before reductions do not reflect amounts reimbursed by the investment adviser or reductions from brokerage service arrangements or other expense offset arrangements and do not represent the amount paid by the class during periods when reimbursements or reductions occur. Expense ratios before reductions for start-up periods may not be representative of longer-term operating periods. Expenses net of any voluntary waivers reflect expenses after reimbursement by the investment adviser but prior to reductions from brokerage service arrangements or other expense offset arrangements. Expenses net of all reductions represent the net expenses paid by the class.
H Amount represents less than $.01 per share.
Financial Highlights - Service Class 2R
Years ended December 31, | 2004 | 2003 | 2002 F |
Selected Per-Share Data | | | |
Net asset value, beginning of period | $ 22.91 | $ 17.99 | $ 21.82 |
Income from Investment Operations | | | |
Net investment income (loss) E | .34 | .31 | .18 |
Net realized and unrealized gain (loss) | 2.20 | 4.96 | (4.01) |
Total from investment operations | 2.54 | 5.27 | (3.83) |
Distributions from net investment income | (.35) | (.35) | - |
Distributions from net realized gain | (.09) | - | - |
Total distributions | (.44) | (.35) | - |
Redemption fees added to paid in capital E, H | - | - | - |
Net asset value, end of period | $ 25.01 | $ 22.91 | $ 17.99 |
Total Return B, C, D | 11.22% | 30.05% | (17.55)% |
Ratios to Average Net Assets G | | | |
Expenses before expense reductions | .83% | .82% | .85% A |
Expenses net of voluntary waivers, if any | .83% | .82% | .85% A |
Expenses net of all reductions | .82% | .81% | .84% A |
Net investment income (loss) | 1.46% | 1.57% | 1.45% A |
Supplemental Data | | | |
Net assets, end of period (000 omitted) | $ 5,617 | $ 1,891 | $ 471 |
Portfolio turnover rate | 22% | 26% | 25% |
A Annualized
B Total returns for periods of less than one year are not annualized.
C Total returns do not reflect charges attributable to your insurance company's separate account. Inclusion of these charges would reduce the total returns shown.
D Total returns would have been lower had certain expenses not been reduced during the periods shown.
E Calculated based on average shares outstanding during the period.
F For the period April 24, 2002 (commencement of sale of shares) to December 31, 2002.
G Expense ratios reflect operating expenses of the class. Expenses before reductions do not reflect amounts reimbursed by the investment adviser or reductions from brokerage service arrangements or other expense offset arrangements and do not represent the amount paid by the class during periods when reimbursements or reductions occur. Expense ratios before reductions for start-up periods may not be representative of longer-term operating periods. Expenses net of any voluntary waivers reflect expenses after reimbursement by the investment adviser but prior to reductions from brokerage service arrangements or other expense offset arrangements. Expenses net of all reductions represent the net expenses paid by the class.
H Amount represents less than $.01 per share.
See accompanying notes which are an integral part of the financial statements.
Equity-Income Portfolio
Notes to Financial Statements
For the period ended December 31, 2004
1. Significant Accounting Policies.
Equity-Income Portfolio (the fund) is a fund of Variable Insurance Products Fund (the trust) (referred to in this report as Fidelity Variable Insurance Products: Equity Income Portfolio) and is authorized to issue an unlimited number of shares. The trust is registered under the Investment Company Act of 1940, as amended (the 1940 Act), as an open-end management investment company organized as a Massachusetts business trust. Shares of the fund may only be purchased by insurance companies for the purpose of funding variable annuity or variable life insurance contracts. The fund offers the following classes of shares: Initial Class shares, Service Class shares, Service Class 2 shares and Service Class 2R shares. All classes have equal rights and voting privileges, except for matters affecting a single class. Investment income, realized and unrealized capital gains and losses, the common expenses of the fund, and certain fund-level expense reductions, if any, are allocated on a pro rata basis to each class based on the relative net assets of each class to the total net assets of the fund. Each class differs with respect to distribution and service plan fees incurred. Certain expense reductions also differ by class.
The financial statements have been prepared in conformity with accounting principles generally accepted in the United States of America, which require management to make certain estimates and assumptions at the date of the financial statements. The following summarizes the significant accounting policies of the fund:
Security Valuation. Net asset value per share (NAV calculation) is calculated as of the close of business of the New York Stock Exchange, normally 4:00 p.m. Eastern time. Equity securities, including restricted securities, for which market quotations are available are valued at the last sale price or official closing price (closing bid price or last evaluated quote if no sale has occurred) on the primary market or exchange on which they trade. Debt securities, including restricted securities, for which quotations are readily available are valued at their most recent bid prices (sales prices if the principal market is an exchange) in the principal market in which such securities are normally traded, as determined by recognized dealers in such securities, or securities are valued on the basis of information provided by a pricing service. Pricing services use valuation matrices that incorporate both dealer-supplied valuations and valuation models. If prices are not readily available or do not accurately reflect fair value for a security, or if a security's value has been materially affected by events occurring after the close of the exchange or market on which the security is principally traded, that security may be valued by another method that the Board of Trustees believes accurately reflects fair value. A security's valuation may differ depending on the method used for determining value. Price movements in futures contracts and ADRs, market and trading trends, the bid/ask quotes of brokers and off-exchange institutional trading may be reviewed in the course of making a good faith determination of a security's fair value. Short-term securities with remaining maturities of sixty days or less for which quotations are not readily available are valued on the basis of amortized cost. Investments in open-end investment companies are valued at their net asset value each business day.
Foreign Currency. The fund uses foreign currency contracts to facilitate transactions in foreign-denominated securities. Losses from these transactions may arise from changes in the value of the foreign currency or if the counterparties do not perform under the contracts' terms.
Foreign-denominated assets, including investment securities, and liabilities are translated into U.S. dollars at the exchange rate at period end. Purchases and sales of investment securities, income and dividends received and expenses denominated in foreign currencies are translated into U.S. dollars at the exchange rate in effect on the transaction date.
The effects of exchange rate fluctuations on investments are included with the net realized and unrealized gain (loss) on investment securities. Other foreign currency transactions resulting in realized and unrealized gain (loss) are disclosed separately.
Investment Transactions and Income. Security transactions are accounted for as of trade date. Gains and losses on securities sold are determined on the basis of identified cost and may include proceeds received from litigation. Dividend income is recorded on the ex-dividend date, except for certain dividends from foreign securities where the ex-dividend date may have passed, which are recorded as soon as the fund is informed of the ex-dividend date. Non-cash dividends included in dividend income, if any, are recorded at the fair market value of the securities received. Distributions received on securities that represent a return of capital or capital gains are recorded as a reduction of cost of investments and/or as a realized gain. The fund estimates the components of distributions received that may be considered return of capital distributions or capital gain distributions. Interest income is accrued as earned. Interest income includes coupon interest and amortization of premium and accretion of discount on debt securities. Investment income is recorded net of foreign taxes withheld where recovery of such taxes is uncertain.
Expenses. Most expenses of the trust can be directly attributed to a fund. Expenses which cannot be directly attributed are apportioned among the funds in the trust.
Deferred Trustee Compensation. Under a Deferred Compensation Plan (the Plan) non-interested Trustees must defer receipt of a portion of, and may elect to defer receipt of an additional portion of, their annual compensation. Deferred amounts are treated as though equivalent dollar amounts had been invested in a cross-section of other Fidelity funds, and are marked-to-market. Deferred amounts remain in the fund until distributed in accordance with the Plan.
Annual Report
Notes to Financial Statements - continued
1. Significant Accounting Policies - continued
Income Tax Information and Distributions to Shareholders. Each year, the fund intends to qualify as a regulated investment company by distributing all of its taxable income and realized gains under Subchapter M of the Internal Revenue Code. As a result, no provision for income taxes is required in the accompanying financial statements. Foreign taxes are provided for based on the fund's understanding of the tax rules and rates that exist in the foreign markets in which it invests.
Distributions are recorded on the ex-dividend date. Income dividends and capital gain distributions are declared separately for each class. Income and capital gain distributions are determined in accordance with income tax regulations, which may differ from generally accepted accounting principles.
Capital accounts within the financial statements are adjusted for permanent book-tax differences. These adjustments have no impact on net assets or the results of operations. Temporary book-tax differences will reverse in a subsequent period.
Book-tax differences are primarily due to foreign currency transactions, passive foreign investment companies (PFIC), market discount and losses deferred due to wash sales.
The tax-basis components of distributable earnings and the federal tax cost as of period end were as follows:
Unrealized appreciation | $ 3,162,571,582 | |
Unrealized depreciation | (487,146,159) | |
Net unrealized appreciation (depreciation) | 2,675,425,423 | |
Undistributed ordinary income | 222,671,664 | |
Undistributed long-term capital gain | 346,486,395 | |
| | |
Cost for federal income tax purposes | $ 8,626,903,027 | |
The tax character of distributions paid was as follows:
| December 31, 2004 | December 31, 2003 |
Ordinary Income | $ 160,632,605 | $ 152,426,442 |
Long-term Capital Gains | 38,902,738 | - |
Total | $ 199,535,343 | $ 152,426,442 |
Trading (Redemption) Fees. Service Class 2R shares held less than 60 days are subject to a redemption fee equal to 1% of the proceeds of the redeemed shares. All redemption fees, including any estimated redemption fees paid by Fidelity Management & Research Company (FMR), are retained by the fund and accounted for as an addition to paid in capital.
2. Operating Policies.
Repurchase Agreements. FMR has received an Exemptive Order from the Securities and Exchange Commission (the SEC) which permits the fund and other affiliated entities of FMR to transfer uninvested cash balances into joint trading accounts. These accounts are then invested in repurchase agreements that are collateralized by U.S. Treasury or Government obligations. The fund may also invest directly with institutions, in repurchase agreements that are collateralized by commercial paper obligations and corporate obligations. Collateral is held in segregated accounts with custodian banks and may be obtained in the event of a default of the counterparty. Collateral is marked-to-market daily and maintained at a value at least equal to the principal amount of the repurchase agreement (including accrued interest).
Restricted Securities. The fund may invest in securities that are subject to legal or contractual restrictions on resale. These securities generally may be resold in transactions exempt from registration or to the public if the securities are registered. Disposal of these securities may involve time-consuming negotiations and expense, and prompt sale at an acceptable price may be difficult. Information regarding restricted securities is included at the end of the fund's Schedule of Investments.
3. Purchases and Sales of Investments.
Purchases and sales of securities, other than short-term securities and U.S. government securities, aggregated $2,315,881,327 and $2,277,968,277, respectively.
Equity-Income Portfolio
4. Fees and Other Transactions with Affiliates.
Management Fee. FMR and its affiliates provide the fund with investment management related services for which the fund pays a monthly management fee. The management fee is the sum of an individual fund fee rate that is based on an annual rate of .20% of the fund's average net assets and a group fee rate that averaged .28% during the period. The group fee rate is based upon the average net assets of all the mutual funds advised by FMR. The group fee rate decreases as assets under management increase and increases as assets under management decrease. For the period, the total annual management fee rate was .47% of the fund's average net assets.
Distribution and Service Plan. In accordance with Rule 12b-1 of the 1940 Act, the fund has adopted separate 12b-1 Plans for each Service Class of shares. Each Service Class pays Fidelity Distributors Corporation (FDC), an affiliate of FMR, a service fee. For the period, the service fee is based on an annual rate of .10% of Service Class' average net assets and .25% of Service Class 2's and Service Class 2R's average net assets.
For the period, each class paid FDC the following amounts, all of which were re-allowed to insurance companies for the distribution of shares and providing shareholder support services:
Service Class | $ 1,100,510 | |
Service Class 2 | 2,850,571 | |
Service Class 2R | 9,466 | |
| $ 3,960,547 | |
Transfer Agent Fees. Fidelity Investments Institutional Operations Company, Inc. (FIIOC), an affiliate of FMR, is the fund's transfer, dividend disbursing, and shareholder servicing agent. FIIOC receives an asset-based fee with respect to each account. FIIOC pays a portion of the expenses related to the typesetting, printing and mailing of shareholder reports, except proxy statements. Each class pays a transfer agent fee, excluding out of pocket expenses, equal to an annual rate of .07% of their month end net assets. For the period, the total transfer agent fees paid by each class to FIIOC, including out of pocket expenses, were as follows:
Initial Class | $ 5,527,852 | |
Service Class | 728,268 | |
Service Class 2 | 782,156 | |
Service Class 2R | 2,672 | |
| $ 7,040,948 | |
Accounting and Security Lending Fees. Fidelity Service Company, Inc. (FSC), an affiliate of FMR, maintains the fund's accounting records. The accounting fee is based on the level of average net assets for the month. Under a separate contract, FSC administers the security lending program. The security lending fee is based on the number and duration of lending transactions.
Central Funds. The fund may invest in affiliated Central Funds managed by Fidelity Investments Money Management, Inc. (FIMM), an affiliate of FMR. The Central Funds are open-end investment companies available only to investment companies and other accounts managed by FMR and its affiliates. The Central Funds seek preservation of capital and current income and do not pay a management fee. Income distributions earned by the fund are recorded as income in the accompanying financial statements and totaled $714,712 for the period.
Brokerage Commissions. The fund placed a portion of its portfolio transactions with brokerage firms which are affiliates of the investment adviser. The commissions paid to these affiliated firms were $127,479 for the period.
Interfund Lending Program. Pursuant to an Exemptive Order issued by the SEC, the fund, along with other registered investment companies having management contracts with FMR, may participate in an interfund lending program. This program provides an alternative credit facility allowing the funds to borrow from, or lend money to, other participating funds.
Borrower or Lender | Average Daily
Loan Balance | Weighted Average
Interest Rate | Interest Earned
(included in interest income) | Interest
Expense |
Borrower | $ 8,867,217 | 1.63% | - | $ 9,256 |
5. Committed Line of Credit.
The fund participates with other funds managed by FMR in a $4.2 billion credit facility (the "line of credit") to be utilized for temporary or emergency purposes to fund shareholder redemptions or for other short-term liquidity purposes. The fund has agreed to pay commitment fees on its pro rata portion of the line of credit. During the period, there were no borrowings on this line of credit.
Annual Report
Notes to Financial Statements - continued
6. Security Lending.
The fund lends portfolio securities from time to time in order to earn additional income. The fund receives collateral (in the form of U.S. Treasury obligations, letters of credit and/or cash) against the loaned securities and maintains collateral in an amount not less than 100% of the market value of the loaned securities during the period of the loan. The market value of the loaned securities is determined at the close of business of the fund and any additional required collateral is delivered to the fund on the next business day. If the borrower defaults on its obligation to return the securities loaned because of insolvency or other reasons, a fund could experience delays and costs in recovering the securities loaned or in gaining access to the collateral. Cash collateral is invested in cash equivalents. The value of loaned securities and cash collateral at period end are disclosed on the fund's Statement of Assets and Liabilities.
7. Bank Borrowings.
The fund is permitted to have bank borrowings for temporary or emergency purposes to fund shareholder redemptions. The fund has established borrowing arrangements with certain banks. The interest rate on the borrowings is the bank's base rate, as revised from time to time. The average daily loan balance during the period amounted to $9,721,350. The weighted average interest rate was 1.81%. At period end, there were no bank borrowings outstanding.
8. Expense Reductions.
Many of the brokers with whom FMR places trades on behalf of the fund provided services to the fund in addition to trade execution. These services included payments of certain expenses on behalf of the fund totaling $873,945 for the period. In addition, through arrangements with the fund's custodian, credits realized as a result of uninvested cash balances were used to reduce the fund's expenses. During the period, these credits reduced the fund's custody expenses by $612.
9. Other Information.
At the end of the period, FMR or its affiliates were the owners of record of 11% of the total outstanding shares of the fund and two otherwise unaffiliated shareholders were the owners of record of 37% of the total outstanding shares of the fund.
Equity-Income Portfolio
Report of Independent Registered Public Accounting Firm
To the Trustees of Variable Insurance Products Fund and the Shareholders of Equity-Income Portfolio:
In our opinion, the accompanying statement of assets and liabilities, including the schedule of investments, and the related statements of operations and of changes in net assets and the financial highlights present fairly, in all material respects, the financial position of Equity-Income Portfolio (a fund of Variable Insurance Products Fund) at December 31, 2004 and the results of its operations, the changes in its net assets and the financial highlights for the periods indicated, in conformity with accounting principles generally accepted in the United States of America. These financial statements and financial highlights (hereafter referred to as "financial statements") are the responsibility of the Equity-Income Portfolio's management; our responsibility is to express an opinion on these financial statements based on our audits. We conducted our audits of these financial statements in accordance with the standards of the Public Company Accounting Oversight Board (United States). Those standards require that we plan and perform the audit to obtain reasonable assurance about whether the financial statements are free of material misstatement. An audit includes examining, on a test basis, evidence supporting the amounts and disclosures in the financial statements, assessing the accounting principles used and significant estimates made by management, and evaluating the overall financial statement presentation. We believe that our audits, which included confirmation of securities at December 31, 2004 by correspondence with the custodian and brokers, provide a reasonable basis for our opinion.
/s/PricewaterhouseCoopers LLP
PricewaterhouseCoopers LLP
Boston, Massachusetts
February 10, 2005
Annual Report
Trustees and Officers
The Trustees, Member of the Advisory Board, and executive officers of the trust and fund, as applicable, are listed below. The Board of Trustees governs the fund and is responsible for protecting the interests of shareholders. The Trustees are experienced executives who meet periodically throughout the year to oversee the fund's activities, review contractual arrangements with companies that provide services to the fund, and review the fund's performance. Except for William O. McCoy, Dennis J. Dirks, and Kenneth L. Wolfe, each of the Trustees oversees 301 funds advised by FMR or an affiliate. Mr. McCoy oversees 303 funds advised by FMR or an affiliate. Mr. Dirks and Mr. Wolfe oversee 233 funds advised by FMR or an affiliate.
The Trustees hold office without limit in time except that (a) any Trustee may resign; (b) any Trustee may be removed by written instrument, signed by at least two-thirds of the number of Trustees prior to such removal; (c) any Trustee who requests to be retired or who has become incapacitated by illness or injury may be retired by written instrument signed by a majority of the other Trustees; and (d) any Trustee may be removed at any special meeting of shareholders by a two-thirds vote of the outstanding voting securities of the trust. In any event, each non-interested Trustee shall retire not later than the last day of the calendar year in which his or her 72nd birthday occurs. The executive officers and Advisory Board Member hold office without limit in time, except that any officer and Advisory Board Member may resign or may be removed by a vote of a majority of the Trustees at any regular meeting or any special meeting of the Trustees. Except as indicated, each individual has held the office shown or other offices in the same company for the past five years.
The fund's Statement of Additional Information (SAI) includes more information about the Trustees. To request a free copy, call Fidelity at 1-800-544-5429.
Interested Trustees*:
Correspondence intended for each Trustee who is an "interested person" (as defined in the 1940 Act) may be sent to Fidelity Investments, 82 Devonshire Street, Boston, Massachusetts 02109.
Name, Age; Principal Occupation |
Edward C. Johnson 3d (74)** |
| Year of Election or Appointment: 1981 Mr. Johnson is Chairman of the Board of Trustees. Mr. Johnson serves as Chief Executive Officer, Chairman, and a Director of FMR Corp.; a Director and Chairman of the Board and of the Executive Committee of FMR; Chairman and a Director of Fidelity Management & Research (Far East) Inc.; Chairman (1998) and a Director of Fidelity Investments Money Management, Inc.; and Chairman (2001) and a Director (2000) of FMR Co., Inc. |
Abigail P. Johnson (43)** |
| Year of Election or Appointment: 2001 Senior Vice President of VIP Equity-Income (2001). Ms. Johnson also serves as Senior Vice President of other Fidelity funds (2001). She is President and a Director of FMR (2001), Fidelity Investments Money Management, Inc. (2001), FMR Co., Inc. (2001), and a Director of FMR Corp. Previously, Ms. Johnson managed a number of Fidelity funds. |
Laura B. Cronin (50) |
| Year of Election or Appointment: 2003 Ms. Cronin is an Executive Vice President (2002) and Chief Financial Officer (2002) of FMR Corp. and is a member of the Fidelity Management Committee (2003). Previously, Ms. Cronin served as Vice President of Finance of FMR (1997-1999), and Chief Financial Officer of FMR (1999-2001), Fidelity Personal Investments (2001), and Fidelity Brokerage Company (2001-2002). |
Robert L. Reynolds (52) |
| Year of Election or Appointment: 2003 Mr. Reynolds is a Director (2003) and Chief Operating Officer (2002) of FMR Corp. and is the head of the Fidelity Management Committee (2003). He also serves on the Board at Fidelity Investments Canada, Ltd. (2000). Previously, Mr. Reynolds served as President of Fidelity Investments Institutional Retirement Group (1996-2000). |
* Trustees have been determined to be "Interested Trustees" by virtue of, among other things, their affiliation with the trust or various entities under common control with FMR.
** Edward C. Johnson 3d, Trustee, is Abigail P. Johnson's father.
Annual Report
Trustees and Officers - continued
Non-Interested Trustees:
Correspondence intended for each non-interested Trustee (that is, the Trustees other than the Interested Trustees) may be sent to Fidelity Investments, P.O. Box 55235, Boston, Massachusetts 02205-5235.
Name, Age; Principal Occupation |
Dennis J. Dirks (56) |
| Year of Election or Appointment: 2005 Mr. Dirks also serves as a Trustee (2005) or Member of the Advisory Board (2004) of other investment companies advised by FMR. Prior to his retirement in May 2003, Mr. Dirks was Chief Operating Officer and a member of the Board of The Depository Trust & Clearing Corporation (DTCC) (1999-2003). He also served as President, Chief Operating Officer, and Board member of The Depository Trust Company (DTC) (1999-2003) and President and Board member of the National Securities Clearing Corporation (NSCC) (1999-2003). In addition, Mr. Dirks served as Chief Executive Officer and Board member of the Government Securities Clearing Corporation (2001-2003) and Chief Executive Officer and Board member of the Mortgage-Backed Securities Clearing Corporation (2001-2003). |
Robert M. Gates (61) |
| Year of Election or Appointment: 1997 Dr. Gates is Vice Chairman of the non-interested Trustees (2005). Dr. Gates is President of Texas A&M University (2002). He was Director of the Central Intelligence Agency (CIA) from 1991 to 1993. From 1989 to 1991, Dr. Gates served as Assistant to the President of the United States and Deputy National Security Advisor. Dr. Gates is a Director of NACCO Industries, Inc. (mining and manufacturing), Parker Drilling Co., Inc. (drilling and rental tools for the energy industry, 2001), and Brinker International (restaurant management, 2003). He also serves as a member of the Advisory Board of VoteHere.net (secure internet voting, 2001). Previously, Dr. Gates served as a Director of LucasVarity PLC (automotive components and diesel engines), a Director of TRW Inc. (automotive, space, defense, and information technology), and Dean of the George Bush School of Government and Public Service at Texas A&M University (1999-2001). Dr. Gates also is a Trustee of the Forum for International Policy. |
George H. Heilmeier (68) |
| Year of Election or Appointment: 2004 Dr. Heilmeier is Chairman Emeritus of Telcordia Technologies (communication software and systems), where prior to his retirement, he served as company Chairman and Chief Executive Officer. He currently serves on the Boards of Directors of The Mitre Corporation (systems engineering and information technology support for the government), INET Technologies Inc. (telecommunications network surveillance, 2001), Teletech Holdings (customer management services), and HRL Laboratories (private research and development, 2004). He is Chairman of the General Motors Technology Advisory Committee and a Life Fellow of the Institute of Electrical and Electronics Engineers (IEEE) (2000). Dr. Heilmeier is a member of the Defense Science Board and the National Security Agency Advisory Board. He is also a member of the National Academy of Engineering, the American Academy of Arts and Sciences, and the Board of Overseers of the School of Engineering and Applied Science of the University of Pennsylvania. Previously, Dr. Heilmeier served as a Director of TRW Inc. (automotive, space, defense, and information technology, 1992-2002), Compaq (1994-2002), and Automatic Data Processing, Inc. (ADP) (technology-based business outsourcing, 1995-2002). |
Marie L. Knowles (58) |
| Year of Election or Appointment: 2001 Prior to Ms. Knowles' retirement in June 2000, she served as Executive Vice President and Chief Financial Officer of Atlantic Richfield Company (ARCO) (diversified energy, 1996-2000). From 1993 to 1996, she was a Senior Vice President of ARCO and President of ARCO Transportation Company. She served as a Director of ARCO from 1996 to 1998. She currently serves as a Director of Phelps Dodge Corporation (copper mining and manufacturing) and McKesson Corporation (healthcare service, 2002). Ms. Knowles is a Trustee of the Brookings Institution and the Catalina Island Conservancy and also serves as a member of the Advisory Board for the School of Engineering of the University of Southern California. |
Ned C. Lautenbach (60) |
| Year of Election or Appointment: 2000 Mr. Lautenbach has been a partner of Clayton, Dubilier & Rice, Inc. (private equity investment firm) since September 1998. Previously, Mr. Lautenbach was with the International Business Machines Corporation (IBM) from 1968 until his retirement in 1998. He was most recently Senior Vice President and Group Executive of Worldwide Sales and Services. From 1993 to 1995, he was Chairman of IBM World Trade Corporation, and from 1994 to 1998 was a member of IBM's Corporate Executive Committee. Mr. Lautenbach serves as Co-Chairman and a Director of Covansys, Inc. (global provider of business and technology solutions, 2000). In addition, he is a Director of Italtel Holding S.p.A. (telecommunications (Milan, Italy), 2004) and Eaton Corporation (diversified industrial) as well as the Philharmonic Center for the Arts in Naples, Florida (1999). He also is a member of the Council on Foreign Relations. |
Marvin L. Mann (71) |
| Year of Election or Appointment: 1993 Mr. Mann is Chairman of the non-interested Trustees (2001). He is Chairman Emeritus of Lexmark International, Inc. (computer peripherals), where he served as CEO until April 1998, retired as Chairman May 1999, and remains a member of the Board. Prior to 1991, he held the positions of Vice President of International Business Machines Corporation (IBM) and President and General Manager of various IBM divisions and subsidiaries. He is a member of the Executive Committee of the Independent Director's Council of the Investment Company Institute. In addition, Mr. Mann is a member of the President's Cabinet at the University of Alabama and the Board of Visitors of the Culverhouse College of Commerce and Business Administration at the University of Alabama. |
William O. McCoy (71) |
| Year of Election or Appointment: 1997 Prior to his retirement in December 1994, Mr. McCoy was Vice Chairman of the Board of BellSouth Corporation (telecommunications) and President of BellSouth Enterprises. He is currently a Director of Liberty Corporation (holding company), Duke Realty Corporation (real estate), and Progress Energy, Inc. (electric utility). He is also a partner of Franklin Street Partners (private investment management firm) and a member of the Research Triangle Foundation Board. In addition, Mr. McCoy served as the Interim Chancellor (1999-2000) and a member of the Board of Visitors (1994-1998) for the University of North Carolina at Chapel Hill and currently serves on the Board of Directors of the University of North Carolina Health Care System and the Board of Visitors of the Kenan-Flagler Business School (University of North Carolina at Chapel Hill). He also served as Vice President of Finance for the University of North Carolina (16-school system, 1995-1998). |
Cornelia M. Small (60) |
| Year of Election or Appointment: 2005 Ms. Small is a member (2000) and Chairperson (2002) of the Investment Committee, and a member (2002) of the Board of Trustees of Smith College. Previously, she served as Chief Investment Officer (1999-2000), Director of Global Equity Investments (1996-1999), and a member of the Board of Directors of Scudder, Stevens & Clark (1990-1997) and Scudder Kemper Investments (1997-1998). In addition, Ms. Small served as Co-Chair (2000-2003) of the Annual Fund for the Fletcher School of Law and Diplomacy. |
William S. Stavropoulos (65) |
| Year of Election or Appointment: 2001 Mr. Stavropoulos is Chairman of the Board (2000), CEO (2002), a position he previously held from 1995-2000, Chairman of the Executive Committee (2000), and a Member of the Board of Directors of The Dow Chemical Company. Since joining The Dow Chemical Company in 1967, Mr. Stavropoulos served in numerous senior management positions, including President (1993-2000; 2002-2003). Currently, he is a Director of NCR Corporation (data warehousing and technology solutions), BellSouth Corporation (telecommunications), Chemical Financial Corporation, and Maersk Inc. (industrial conglomerate, 2002). He also serves as a member of the Board of Trustees of the American Enterprise Institute for Public Policy Research. In addition, Mr. Stavropoulos is a member of The Business Council, J.P. Morgan International Council and the University of Notre Dame Advisory Council for the College of Science. |
Kenneth L. Wolfe (65) |
| Year of Election or Appointment: 2005 Mr. Wolfe also serves as a Trustee (2005) or Member of the Advisory Board (2004) of other investment companies advised by FMR. Prior to his retirement in 2001, Mr. Wolfe was Chairman and Chief Executive Officer of Hershey Foods Corporation (1993-2001). He currently serves as a member of the boards of Adelphia Communications Corporation (2003), Bausch & Lomb, Inc., and Revlon Inc. (2004). |
Annual Report
Trustees and Officers - continued
Advisory Board Member and Executive Officers:
Correspondence intended for each executive officer and Mr. Lynch may be sent to Fidelity Investments, 82 Devonshire Street, Boston, Massachusetts 02109.
Name, Age; Principal Occupation |
Peter S. Lynch (61) |
| Year of Election or Appointment: 2003 Member of the Advisory Board of Variable Insurance Products Fund. Vice Chairman and a Director of FMR, and Vice Chairman (2001) and a Director (2000) of FMR Co., Inc. Previously, Mr. Lynch served as a Trustee of the Fidelity funds (1990-2003). Prior to May 31, 1990, he was a Director of FMR and Executive Vice President of FMR (a position he held until March 31, 1991), Vice President of Fidelity® Magellan® Fund and FMR Growth Group Leader, and Managing Director of FMR Corp. Mr. Lynch was also Vice President of Fidelity Investments Corporate Services. In addition, he serves as a Trustee of Boston College, Massachusetts Eye & Ear Infirmary, Historic Deerfield, John F. Kennedy Library, and the Museum of Fine Arts of Boston. |
Bart A. Grenier (45) |
| Year of Election or Appointment: 2001 Vice President of VIP Equity-Income. Mr. Grenier also serves as Vice President of certain Equity Funds (2001), a position he previously held from 1999 to 2000, and Vice President of certain High Income Funds (2002). He is Senior Vice President of FMR (1999) and FMR Co., Inc. (2001), and President and Director of Strategic Advisers, Inc. (2002). He also heads Fidelity's Asset Allocation Group (2000), Fidelity's Growth and Income Group (2001), Fidelity's Value Group (2001), and Fidelity's High Income Division (2001). Previously, Mr. Grenier served as President of Fidelity Ventures (2000), Vice President of certain High Income Funds (1997-2000), High Income Division Head (1997-2000), Group Leader of the Income-Growth and Asset Allocation-Income Groups (1996-2000), and Assistant Equity Division Head (1997-2000). |
Stephen R. Peterson (48) |
| Year of Election or Appointment: 1997 Vice President of VIP Equity-Income. Mr. Peterson serves as Vice President of other funds advised by FMR. Mr. Peterson also serves as Senior Vice President of FMR and FMR Co., Inc. (2001). |
Eric D. Roiter (56) |
| Year of Election or Appointment: 1998 Secretary of VIP Equity-Income. He also serves as Secretary of other Fidelity funds; Vice President, General Counsel, and Secretary of FMR Co., Inc. (2001-present) and FMR; Vice President and Secretary of FDC; Assistant Secretary of Fidelity Management & Research (U.K.) Inc. (2001-present), Fidelity Management & Research (Far East) Inc. (2001-present), and Fidelity Investments Money Management, Inc. (2001-present). Mr. Roiter is an Adjunct Member, Faculty of Law, at Boston College Law School (2003-present). |
Stuart Fross (45) |
| Year of Election or Appointment: 2003 Assistant Secretary of VIP Equity-Income. Mr. Fross also serves as Assistant Secretary of other Fidelity funds (2003) and is an employee of FMR. |
Christine Reynolds (46) |
| Year of Election or Appointment: 2004 President, Treasurer, and Anti-Money Laundering (AML) officer of VIP Equity-Income. Ms. Reynolds also serves as President, Treasurer, and AML officer of other Fidelity funds (2004) and is a Vice President (2003) and an employee (2002) of FMR. Before joining Fidelity Investments, Ms. Reynolds worked at PricewaterhouseCoopers LLP (PwC) (1980-2002), where she was most recently an audit partner with PwC's investment management practice. |
Timothy F. Hayes (54) |
| Year of Election or Appointment: 2002 Chief Financial Officer of VIP Equity-Income. Mr. Hayes also serves as Chief Financial Officer of other Fidelity funds (2002). Recently he was appointed President of Fidelity Service Company (2003) where he also serves as a Director. Mr. Hayes also serves as President of Fidelity Investments Operations Group (FIOG, 2002), which includes Fidelity Pricing and Cash Management Services Group (FPCMS), where he was appointed President in 1998. Previously, Mr. Hayes served as Chief Financial Officer of Fidelity Investments Corporate Systems and Service Group (1998) and Fidelity Systems Company (1997-1998). |
Kenneth A. Rathgeber (57) |
| Year of Election or Appointment: 2004 Chief Compliance Officer of VIP Equity-Income. Mr. Rathgeber also serves as Chief Compliance Officer of other Fidelity funds (2004) and Executive Vice President of Risk Oversight for Fidelity Investments (2002). Previously, he served as Executive Vice President and Chief Operating Officer for Fidelity Investments Institutional Services Company, Inc. (1998-2002). |
John R. Hebble (46) |
| Year of Election or Appointment: 2003 Deputy Treasurer of VIP Equity-Income. Mr. Hebble also serves as Deputy Treasurer of other Fidelity funds (2003), and is an employee of FMR. Before joining Fidelity Investments, Mr. Hebble worked at Deutsche Asset Management where he served as Director of Fund Accounting (2002-2003) and Assistant Treasurer of the Scudder Funds (1998-2003). |
Kimberley H. Monasterio (41) |
| Year of Election or Appointment: 2004 Deputy Treasurer of VIP Equity-Income. Ms. Monasterio also serves as Deputy Treasurer of other Fidelity funds (2004) and is an employee of FMR (2004). Before joining Fidelity Investments, Ms. Monasterio served as Treasurer (2000-2004) and Chief Financial Officer (2002-2004) of the Franklin Templeton Funds and Senior Vice President of Franklin Templeton Services, LLC (2000-2004). |
John H. Costello (58) |
| Year of Election or Appointment: 1986 Assistant Treasurer of VIP Equity-Income. Mr. Costello also serves as Assistant Treasurer of other Fidelity funds and is an employee of FMR. |
Peter L. Lydecker (50) |
| Year of Election or Appointment: 2004 Assistant Treasurer of VIP Equity-Income. Mr. Lydecker also serves as Assistant Treasurer of other Fidelity funds (2004) and is an employee of FMR. |
Mark Osterheld (49) |
| Year of Election or Appointment: 2002 Assistant Treasurer of VIP Equity-Income. Mr. Osterheld also serves as Assistant Treasurer of other Fidelity funds (2002) and is an employee of FMR. |
Kenneth B. Robins (35) |
| Year of Election or Appointment: 2004 Assistant Treasurer of VIP Equity-Income. Mr. Robins also serves as Assistant Treasurer of other Fidelity funds (2004) and is an employee of FMR (2004). Before joining Fidelity Investments, Mr. Robins worked at KPMG LLP, where he was a partner in KPMG's department of professional practice (2002-2004) and a Senior Manager (1999-2000). In addition, Mr. Robins served as Assistant Chief Accountant, United States Securities and Exchange Commission (2000-2002). |
Annual Report
Distributions
The Board of Trustees of Equity-Income Portfolio voted to pay to shareholders of record at the opening of business on record date, the following distributions per share derived from capital gains realized from sales of portfolio securities, and dividends derived from net investment income:
Fund | Pay Date | Record Date | Dividends | Capital Gains |
Initial Class | 2/14/05 | 2/11/05 | $0.405 | $0.89 |
Service Class | 2/14/05 | 2/11/05 | $0.385 | $0.89 |
Service Class 2 | 2/14/05 | 2/11/05 | $0.36 | $0.89 |
Service Class 2R | 2/14/05 | 2/11/05 | $0.375 | $0.89 |
A percentage of the dividends distributed during the fiscal year for the following classes qualifies for the dividends-received deduction for corporate shareholders:
Initial Class | 100% |
Service Class | 100% |
Service Class 2 | 100% |
Service Class 2R | 100% |
The fund will notify shareholders in January 2005 of amounts for use in preparing 2004 income tax returns.
Annual Report
Proxy Voting Results
A special meeting of the fund's shareholders was held on December 14, 2004. The results of votes taken among shareholders on proposals before them are reported below. Each vote reported represents one dollar of net asset value held on the record date for the meeting.
PROPOSAL 1 |
To amend the Declaration of Trust to allow the Board of Trustees, if permitted by applicable law, to authorize fund mergers without shareholder approval. A |
| # of
Votes | % of
Votes |
Affirmative | 15,331,508,529.96 | 81.853 |
Against | 2,429,553,894.02 | 12.972 |
Abstain | 969,378,618.94 | 5.175 |
TOTAL | 18,730,441,042.92 | 100.000 |
PROPOSAL 2 |
To elect a Board of Trustees. A |
| # of
Votes | % of
Votes |
J. Michael Cook |
Affirmative | 17,770,642,454.98 | 94.876 |
Withheld | 959,798,587.94 | 5.124 |
TOTAL | 18,730,441,042.92 | 100.000 |
Ralph F. Cox |
Affirmative | 17,759,356,374.26 | 94.815 |
Withheld. | 971,084,668.66 | 5.185 |
TOTAL | 18,730,441,042.92 | 100.000 |
Laura B. Cronin |
Affirmative | 17,797,888,742.24 | 95.021 |
Withheld | 932,552,300.68 | 4.979 |
TOTAL | 18,730,441,042.92 | 100.000 |
Dennis J. DirksB |
Affirmative | 17,802,602,074.45 | 95.046 |
Withheld | 927,838,968.47 | 4.954 |
TOTAL | 18,730,441,042.92 | 100.000 |
Robert M. Gates |
Affirmative | 17,784,855,823.58 | 94.952 |
Withheld | 945,585,219.34 | 5.048 |
TOTAL | 18,730,441,042.92 | 100.000 |
George H. Heilmeier |
Affirmative | 17,768,875,556.56 | 94.866 |
Withheld | 961,565,486.36 | 5.134 |
TOTAL | 18,730,441,042.92 | 100.000 |
Abigail P. Johnson |
Affirmative | 17,781,929,073.06 | 94.936 |
Withheld | 948,511,969.86 | 5.064 |
TOTAL | 18,730,441,042.92 | 100.000 |
Edward C. Johnson 3d |
Affirmative | 17,752,140,336.45 | 94.777 |
Withheld | 978,300,706.47 | 5.223 |
TOTAL | 18,730,441,042.92 | 100.000 |
Donald J. Kirk |
Affirmative | 17,772,467,361.45 | 94.885 |
Withheld | 957,973,681.47 | 5.115 |
TOTAL | 18,730,441,042.92 | 100.000 |
| # of
Votes | % of
Votes |
Marie L. Knowles |
Affirmative | 17,776,922,254.30 | 94.909 |
Withheld | 953,518,788.62 | 5.091 |
TOTAL | 18,730,441,042.92 | 100.000 |
Ned C. Lautenbach |
Affirmative | 17,804,221,564.95 | 95.055 |
Withheld | 926,219,477.97 | 4.945 |
TOTAL | 18,730,441,042.92 | 100.000 |
Marvin L. Mann |
Affirmative | 17,763,277,607.06 | 94.836 |
Withheld | 967,163,435.86 | 5.164 |
TOTAL | 18,730,441,042.92 | 100.000 |
William O. McCoy |
Affirmative | 17,758,560,162.11 | 94.811 |
Withheld | 971,880,880.81 | 5.189 |
TOTAL | 18,730,441,042.92 | 100.000 |
Robert L. Reynolds |
Affirmative | 17,806,026,904.06 | 95.065 |
Withheld | 924,414,138.86 | 4.935 |
TOTAL | 18,730,441,042.92 | 100.000 |
Cornelia M. SmallB |
Affirmative | 17,798,878,892.31 | 95.026 |
Withheld | 931,562,150.61 | 4.974 |
TOTAL | 18,730,441,042.92 | 100.000 |
William S. Stavropoulos |
Affirmative | 17,786,496,107.78 | 94.960 |
Withheld | 943,944,935.14 | 5.040 |
TOTAL | 18,730,441,042.92 | 100.000 |
PROPOSAL 3 |
To approve a new sub-advisory agreement among FMR, Fidelity Management & Research (U.K.) Inc. (FMR U.K.), and Variable Insurance Products Fund on behalf of the fund. |
| # of
Votes | % of
Votes |
Affirmative | 6,731,293,010.62 | 89.239 |
Against | 310,929,859.15 | 4.122 |
Abstain | 500,745,863.80 | 6.639 |
TOTAL | 7,542,968,733.57 | 100.000 |
PROPOSAL 4 |
To approve a new sub-advisory agreement among FMR, FMR Far East, and Variable Insurance Products Fund on behalf of the fund. |
| # of
Votes | % of
Votes |
Affirmative | 6,721,558,010.15 | 89.110 |
Against | 322,563,327.80 | 4.277 |
Abstain | 498,847,395.62 | 6.613 |
TOTAL | 7,542,968,733.57 | 100.000 |
PROPOSAL 5 |
To approve a new amended and restated sub-advisory agreement between FMR Far East and Fidelity Investments Japan Limited (FIJ) for the fund. |
| # of
Votes | % of
Votes |
Affirmative | 6,718,405,992.36 | 89.068 |
Against | 323,955,769.99 | 4.295 |
Abstain | 500,606,971.22 | 6.637 |
TOTAL | 7,542,968,733.57 | 100.000 |
PROPOSAL 6 |
To approve a new master international research agreement between FMR and Fidelity International Investment Advisors (FIIA) on behalf of the fund. |
| # of
Votes | % of
Votes |
Affirmative | 6,734,087,467.07 | 89.276 |
Against | 307,013,886.12 | 4.071 |
Abstain | 501,867,380.38 | 6.653 |
TOTAL | 7,542,968,733.57 | 100.000 |
PROPOSAL 7 |
To approve a new sub-research agreement between FIIA and Fidelity International Investment Advisors (U.K.) Limited (FIIA (U.K.)L) on behalf of the fund. |
| # of
Votes | % of
Votes |
Affirmative | 6,731,737,757.05 | 89.245 |
Against | 311,103,851.74 | 4.125 |
Abstain | 500,127,124.78 | 6.630 |
TOTAL | 7,542,968,733.57 | 100.000 |
PROPOSAL 8 |
To approve a new sub-research agreement between FIIA and FIJ on behalf of the fund. |
| # of
Votes | % of
Votes |
Affirmative | 6,739,563,050.41 | 89.349 |
Against | 309,142,220.41 | 4.098 |
Abstain | 494,263,462.75 | 6.553 |
TOTAL | 7,542,968,733.57 | 100.000 |
PROPOSAL 9 |
To amend the fund's fundamental investment limitation concerning borrowing. |
| # of
Votes | % of
Votes |
Affirmative | 6,685,392,791.57 | 88.631 |
Against | 416,380,211.81 | 5.520 |
Abstain | 441,195,730.19 | 5.849 |
TOTAL | 7,542,968,733.57 | 100.000 |
PROPOSAL 10 |
To amend the fund's fundamental investment limitation concerning lending. |
| # of
Votes | % of
Votes |
Affirmative | 6,589,639,425.26 | 87.361 |
Against | 465,151,442.69 | 6.167 |
Abstain | 488,177,865.62 | 6.472 |
TOTAL | 7,542,968,733.57 | 100.000 |
A Denotes trust-wide proposals and voting results. B Effective January 1, 2005. |
Equity-Income Portfolio
Annual Report
Equity-Income Portfolio
Investment Adviser
Fidelity Management & Research Company
Boston, MA
Investment Sub-Adviser
FMR Co., Inc.
Fidelity Management & Research (U.K.) Inc.
Fidelity Management & Research (Far East) Inc.
Fidelity Investments Japan Limited
Fidelity International Investment Advisors
Fidelity International Investment Advisors (U.K.) Limited
General Distributor
Fidelity Distributors Corporation
Boston, MA
Transfer and Shareholder Servicing Agent
Fidelity Investments Institutional Operations Company, Inc.
Boston, MA
Custodian
The Northern Trust Company
Chicago, IL
VIPEI2R-ANN-0205
1.782454.102
Fidelity® Variable Insurance Products:
Growth Portfolio
Annual Report
December 31, 2004
(2_fidelity_logos) (Registered_Trademark)
Contents
Performance | 3 | How the fund has done over time. |
Management's Discussion | 4 | The manager's review of fund performance, strategy and outlook. |
Shareholder Expense Example | 5 | An example of shareholder expenses. |
Investment Summary | 6 | A summary of the fund's investments at period end. |
Investments | 7 | A complete list of the fund's investments with their
market values. |
Financial Statements | 12 | Statements of assets and liabilities, operations, and
changes in net assets, as well as financial highlights. |
Notes | 16 | Notes to the financial statements. |
Report of Independent Registered Public Accounting Firm | 20 | |
Trustees and Officers | 21 | |
Distributions | 26 | |
Proxy Voting Results | 27 | |
To view a fund's proxy voting guidelines and proxy voting record for the 12-month period ended June 30, visit www.fidelity.com/proxyvotingresults or visit the Securities and Exchange Commission's (SEC) web site at www.sec.gov. You may also call 1-800-544-5429 to request a free copy of the proxy voting guidelines.
Fidelity Variable Insurance Products are separate account options which are purchased through a variable insurance contract.
Standard & Poor's, S&P and S&P 500 are registered service marks of The McGraw-Hill Companies, Inc. and have been licensed for use by Fidelity Distributors Corporation.
Other third party marks appearing herein are the property of their respective owners.
All other marks appearing herein are registered or unregistered trademarks or service marks of FMR Corp. or an affiliated company.
(Recycle graphic) This report is printed on recycled paper using soy-based inks.
This report and the financial statements contained herein are submitted for the general information of the shareholders of the fund. This report is not authorized for distribution to prospective investors in the fund unless preceded or accompanied by an effective prospectus.
A fund files its complete schedule of portfolio holdings with the SEC for the first and third quarters of each fiscal year on Form N-Q. Forms N-Q are available on the SEC's web site at http://www.sec.gov. A fund's Forms N-Q may be reviewed and copied at the SEC's Public Reference Room in Washington, DC. Information regarding the operation of the SEC's Public Reference Room may be obtained by calling 1-800-SEC-0330. For a complete list of a fund's portfolio holdings, view the most recent quarterly holdings report, semiannual report, or annual report on Fidelity's web site at http://www.advisor.fidelity.com.
NOT FDIC INSURED · MAY LOSE VALUE · NO BANK GUARANTEE
Neither the fund nor Fidelity Distributors Corporation is a bank.
Growth Portfolio
Fidelity Variable Insurance Products: Growth Portfolio
Performance: The Bottom Line
Average annual total return reflects the change in the value of an investment, assuming reinvestment of the class' dividend income and capital gains (the profits earned upon the sale of securities that have grown in value) and assuming a constant rate of performance each year. During periods of reimbursement by Fidelity, a fund's total return will be greater than it would be had the reimbursement not occurred. Performance numbers are net of all underlying fund operating expenses, but do not include any insurance charges imposed by your insurance company's separate account. If performance information included the effect of these additional charges, the total returns would have been lower. How a fund did yesterday is no guarantee of how it will do tomorrow.
Average Annual Total Returns
Periods ended December 31, 2004 | Past 1
year | Past 5
years | Past 10
years |
Fidelity ® VIP: Growth - Initial Class | 3.38% | -6.79% | 9.97% |
Fidelity VIP: Growth - Service Class A | 3.26% | -6.88% | 9.89% |
Fidelity VIP: Growth - Service Class 2 B | 3.12% | -7.02% | 9.81% |
A The initial offering of Service Class shares took place on November 3, 1997. Performance for Service Class shares reflects an asset-based service fee (12b-1 fee), and returns prior to November 3, 1997 are those of Initial Class and do not include the effects of Service Class 12b-1 fee. Had Service Class shares 12b-1 fee been reflected, returns prior to November 3, 1997 would have been lower.
B The initial offering of Service Class 2 shares took place on January 12, 2000. Performance for Service Class 2 shares reflects an asset-based service fee (12b-1 fee). Returns from November 3, 1997 through January 12, 2000 are those of Service Class which reflect a different 12b-1 fee. Service Class 2 returns prior to November 3, 1997 are those of Initial Class, and do not include the effects of a 12b-1 fee. Had Service Class 2's 12b-1 fee been reflected, returns prior to January 12, 2000 would have been lower.
$10,000 Over 10 Years
Let's say hypothetically that $10,000 was invested in Fidelity® Variable Insurance Products: Growth Portfolio - Initial Class on December 31, 1994. The chart shows how the value of your investment would have changed, and also shows how the Russell 3000® Growth Index performed over the same period.

Annual Report
Fidelity Variable Insurance Products: Growth Portfolio
Management's Discussion of Fund Performance
Comments from Jennifer Uhrig, Portfolio Manager of Fidelity® Variable Insurance Products: Growth Portfolio
The year ending December 31, 2004, generally was positive for equity investors, as many stock market benchmarks produced double-digit gains. Broad-based themes included the continued dominance of small-cap stocks, which outperformed large-caps for the sixth consecutive year. The small-cap Russell 2000® Index was up 18.33% in 2004, while the larger-cap Standard & Poor's 500SM Index rose 10.88%. Value stocks ended the year well ahead of growth stocks: The Russell 3000® Value Index advanced 16.94%, compared to 6.93% for the Russell 3000 Growth Index. Energy and basic materials stocks led the market upward. Energy stocks were boosted by record-high oil prices, while strong demand from China helped support commodity prices. The health care sector was among the market's weakest performers. Technology also fell off the pace, though it was helped by a rally late in the year. The tech-heavy NASDAQ Composite® Index returned 9.15%, thanks primarily to a 14.87% jump in the fourth quarter. Elsewhere, the Dow Jones Industrial AverageSM gained 5.37% for the year.
For the 12 months that ended December 31, 2004, the fund lagged both the LipperSM Variable Annuity Growth Funds Average, which gained 10.36%, and the Russell 3000 Growth Index. The fund's large overweighting compared with the index in the semiconductor industry accounted for most of the drag on performance. Capacity outgrew demand for semiconductors during the period, which compressed the earnings and stock prices of many companies within the group. Among those hardest hit were fund holdings ASML Holding, Agere Systems, Teradyne and Intersil, as well as the fund's biggest detractor, Synopsys, which makes software for designing chips. Performance also was hurt by the fund's focus on large-cap growth companies at a time when smaller-cap, value-oriented stocks were generally performing better. On the positive side, wireless communications stocks, such as Ericsson and QUALCOMM, and energy services companies, such as Halliburton, helped boost relative performance. The fund no longer holds Ericsson stock.
The views expressed in this statement reflect those of the portfolio manager only through the end of the period of the report as stated on the cover and do not necessarily represent the views of Fidelity or any other person in the Fidelity organization. Any such views are subject to change at any time based upon market or other conditions and Fidelity disclaims any responsibility to update such views. These views may not be relied on as investment advice and, because investment decisions for a Fidelity fund are based on numerous factors, may not be relied on as an indication of trading intent on behalf of any Fidelity fund.
Annual Report
Fidelity Variable Insurance Products: Growth Portfolio
Shareholder Expense Example
As a shareholder of the Fund, you incur two types of costs: (1) transaction costs, including redemption fees, and (2) ongoing costs, including management fees, distribution and/or service (12b-1) fees and other Fund expenses. This Example is intended to help you understand your ongoing costs (in dollars) of investing in the Fund and to compare these costs with the ongoing costs of investing in other mutual funds.
The Example is based on an investment of $1,000 invested at the beginning of the period and held for the entire period (July 1, 2004 to December 31, 2004).
Actual Expenses
The first line of the table below for each class of the Fund provides information about actual account values and actual expenses. You may use the information in this line, together with the amount you invested, to estimate the expenses that you paid over the period. Simply divide your account value by $1,000.00 (for example, an $8,600 account value divided by $1,000.00 = 8.6), then multiply the result by the number in the first line for a class of the Fund under the heading entitled "Expenses Paid During Period" to estimate the expenses you paid on your account during this period. The estimate of expenses does not include any fees or other expenses of any variable annuity or variable life insurance product. If they were, the estimate of expenses you paid during the period would be higher, and your ending account value would be lower.
Hypothetical Example for Comparison Purposes
The second line of the table below for each class of the Fund provides information about hypothetical account values and hypothetical expenses based on a Class' actual expense ratio and an assumed rate of return of 5% per year before expenses, which is not the Class' actual return. The hypothetical account values and expenses may not be used to estimate the actual ending account balance or expenses you paid for the period. You may use this information to compare the ongoing costs of investing in the Fund and other funds. To do so, compare this 5% hypothetical example with the 5% hypothetical examples that appear in the shareholder reports of the other funds. The estimate of expenses does not include any fees or other expenses of any variable annuity or variable life insurance product. If they were, the estimate of expenses you paid during the period would be higher, and your ending account value would be lower.
Please note that the expenses shown in the table are meant to highlight your ongoing costs only and do not reflect any transaction costs. Therefore, the second line of the table is useful in comparing ongoing costs only, and will not help you determine the relative total costs of owning different funds. In addition, if these transactional costs were included, your costs would have been higher.
| Beginning
Account Value
July 1, 2004 | Ending
Account Value
December 31, 2004 | Expenses Paid
During Period*
July 1, 2004
to December 31, 2004 |
Initial Class | | | |
Actual | $ 1,000.00 | $ 1,018.80 | $ 3.55 |
HypotheticalA | $ 1,000.00 | $ 1,021.62 | $ 3.56 |
Service Class | | | |
Actual | $ 1,000.00 | $ 1,018.20 | $ 4.06 |
HypotheticalA | $ 1,000.00 | $ 1,021.11 | $ 4.06 |
Service Class 2 | | | |
Actual | $ 1,000.00 | $ 1,017.40 | $ 4.82 |
HypotheticalA | $ 1,000.00 | $ 1,020.36 | $ 4.82 |
Service Class 2R | | | |
Actual | $ 1,000.00 | $ 1,017.40 | $ 4.82 |
HypotheticalA | $ 1,000.00 | $ 1,020.36 | $ 4.82 |
A 5% return per year before expenses
* Expenses are equal to each Class' annualized expense ratio (shown in the table below); multiplied by the average account value over the period, multiplied by 184/366 (to reflect the one-half year period).
| Annualized
Expense Ratio |
Initial Class | .70% |
Service Class | .80% |
Service Class 2 | .95% |
Service Class 2R | .95% |
Annual Report
Fidelity Variable Insurance Products: Growth Portfolio
Investment Summary
Top Five Stocks as of December 31, 2004 |
| % of fund's net assets |
Johnson & Johnson | 2.8 |
Microsoft Corp. | 2.6 |
Intel Corp. | 2.6 |
Wal-Mart Stores, Inc. | 2.5 |
Dell, Inc. | 2.2 |
| 12.7 |
Top Five Market Sectors as of December 31, 2004 |
| % of fund's net assets |
Information Technology | 34.5 |
Health Care | 19.4 |
Consumer Discretionary | 12.2 |
Industrials | 11.3 |
Financials | 9.0 |
Asset Allocation as of December 31, 2004 |
% of fund's net assets* |
 | Stocks | 99.3% | |
 | Short-Term Investments and Net Other Assets | 0.7% | |
* Foreign investments | 8.8% | |

Annual Report
Fidelity Variable Insurance Products: Growth Portfolio
Investments December 31, 2004
Showing Percentage of Net Assets
Common Stocks - 99.3% |
| Shares | | Value (Note 1) |
CONSUMER DISCRETIONARY - 12.2% |
Automobiles - 0.2% |
Harley-Davidson, Inc. | 396,200 | | $ 24,069,150 |
Hotels, Restaurants & Leisure - 1.4% |
Carnival Corp. unit | 403,100 | | 23,230,653 |
Hilton Group PLC | 1,886,329 | | 10,298,785 |
McDonald's Corp. | 1,433,200 | | 45,948,392 |
Rank Group PLC | 2,796,306 | | 14,166,903 |
Royal Caribbean Cruises Ltd. | 419,600 | | 22,843,024 |
Starbucks Corp. (a) | 391,800 | | 24,432,648 |
| | 140,920,405 |
Household Durables - 0.2% |
Tempur-Pedic International, Inc. | 694,300 | | 14,719,160 |
Internet & Catalog Retail - 1.7% |
eBay, Inc. (a) | 1,156,600 | | 134,489,448 |
IAC/InterActiveCorp (a) | 1,342,784 | | 37,087,694 |
| | 171,577,142 |
Media - 2.6% |
E.W. Scripps Co. Class A | 839,400 | | 40,526,232 |
Fox Entertainment Group, Inc.
Class A (a) | 1,554,900 | | 48,606,174 |
Getty Images, Inc. (a) | 163,400 | | 11,250,090 |
Lamar Advertising Co. Class A (a) | 948,560 | | 40,579,397 |
News Corp.: | | | |
Class A | 657,722 | | 12,273,093 |
Class B | 1,149,000 | | 22,060,800 |
Pixar (a) | 147,632 | | 12,638,776 |
SBS Broadcasting SA (a) | 195,400 | | 7,860,942 |
Walt Disney Co. | 2,128,400 | | 59,169,520 |
| | 254,965,024 |
Multiline Retail - 1.5% |
Dollar Tree Stores, Inc. (a) | 1,235,300 | | 35,428,404 |
Family Dollar Stores, Inc. | 697,900 | | 21,795,417 |
Fred's, Inc. Class A (d) | 940,644 | | 16,367,206 |
Kohl's Corp. (a) | 90,900 | | 4,469,553 |
Nordstrom, Inc. | 728,500 | | 34,042,805 |
Saks, Inc. | 2,822,700 | | 40,957,377 |
| | 153,060,762 |
Specialty Retail - 4.2% |
Bed Bath & Beyond, Inc. (a) | 751,500 | | 29,932,245 |
Best Buy Co., Inc. | 547,800 | | 32,550,276 |
Circuit City Stores, Inc. | 997,800 | | 15,605,592 |
Foot Locker, Inc. | 1,273,980 | | 34,308,281 |
Home Depot, Inc. | 4,575,900 | | 195,573,966 |
RadioShack Corp. | 605,800 | | 19,918,704 |
Staples, Inc. | 1,512,900 | | 50,999,859 |
Weight Watchers International, Inc. (a)(d) | 856,000 | | 35,155,920 |
| | 414,044,843 |
|
| Shares | | Value (Note 1) |
Textiles, Apparel & Luxury Goods - 0.4% |
NIKE, Inc. Class B | 443,100 | | $ 40,184,739 |
TOTAL CONSUMER DISCRETIONARY | | 1,213,541,225 |
CONSUMER STAPLES - 7.0% |
Beverages - 1.7% |
PepsiCo, Inc. | 3,041,000 | | 158,740,200 |
The Coca-Cola Co. | 241,100 | | 10,036,993 |
| | 168,777,193 |
Food & Staples Retailing - 2.8% |
Wal-Mart Stores, Inc. | 4,638,700 | | 245,016,134 |
Walgreen Co. | 883,400 | | 33,896,058 |
| | 278,912,192 |
Food Products - 0.9% |
Archer-Daniels-Midland Co. | 1,765,300 | | 39,383,843 |
Bunge Ltd. | 739,300 | | 42,147,493 |
Corn Products International, Inc. | 185,400 | | 9,930,024 |
| | 91,461,360 |
Household Products - 1.1% |
Procter & Gamble Co. | 2,016,420 | | 111,064,414 |
Personal Products - 0.5% |
Gillette Co. | 965,400 | | 43,230,612 |
TOTAL CONSUMER STAPLES | | 693,445,771 |
ENERGY - 4.4% |
Energy Equipment & Services - 4.0% |
Baker Hughes, Inc. | 1,796,470 | | 76,655,375 |
BJ Services Co. | 238,760 | | 11,111,890 |
Halliburton Co. | 2,737,100 | | 107,403,804 |
National-Oilwell, Inc. (a) | 902,900 | | 31,863,341 |
Schlumberger Ltd. (NY Shares) | 1,511,400 | | 101,188,230 |
Smith International, Inc. (a) | 452,400 | | 24,615,084 |
Transocean, Inc. (a) | 305,700 | | 12,958,623 |
Weatherford International Ltd. (a) | 611,740 | | 31,382,262 |
| | 397,178,609 |
Oil & Gas - 0.4% |
Noble Energy, Inc. | 129,100 | | 7,960,306 |
Premcor, Inc. | 363,500 | | 15,328,795 |
Valero Energy Corp. | 344,100 | | 15,622,140 |
| | 38,911,241 |
TOTAL ENERGY | | 436,089,850 |
FINANCIALS - 9.0% |
Capital Markets - 2.0% |
E*TRADE Financial Corp. (a) | 2,495,400 | | 37,306,230 |
Goldman Sachs Group, Inc. | 507,400 | | 52,789,896 |
Lehman Brothers Holdings, Inc. | 352,400 | | 30,827,952 |
Merrill Lynch & Co., Inc. | 514,800 | | 30,769,596 |
Common Stocks - continued |
| Shares | | Value (Note 1) |
FINANCIALS - continued |
Capital Markets - continued |
Morgan Stanley | 383,000 | | $ 21,264,160 |
Nomura Holdings, Inc. | 1,782,000 | | 25,945,920 |
| | 198,903,754 |
Commercial Banks - 1.2% |
Bank of America Corp. | 1,536,100 | | 72,181,339 |
UCBH Holdings, Inc. | 965,900 | | 44,257,538 |
| | 116,438,877 |
Consumer Finance - 2.6% |
American Express Co. | 2,319,900 | | 130,772,763 |
Capital One Financial Corp. | 593,200 | | 49,953,372 |
MBNA Corp. | 2,766,130 | | 77,977,205 |
| | 258,703,340 |
Diversified Financial Services - 0.6% |
Citigroup, Inc. | 213,210 | | 10,272,458 |
J.P. Morgan Chase & Co. | 1,325,266 | | 51,698,627 |
| | 61,971,085 |
Insurance - 1.9% |
AFLAC, Inc. | 471,920 | | 18,801,293 |
American International Group, Inc. | 2,575,166 | | 169,111,151 |
XL Capital Ltd. Class A | 53,100 | | 4,123,215 |
| | 192,035,659 |
Thrifts & Mortgage Finance - 0.7% |
Fannie Mae | 863,600 | | 61,496,956 |
New York Community Bancorp, Inc. | 447,500 | | 9,205,075 |
| | 70,702,031 |
TOTAL FINANCIALS | | 898,754,746 |
HEALTH CARE - 19.4% |
Biotechnology - 3.9% |
Biogen Idec, Inc. (a) | 886,600 | | 59,056,426 |
Cephalon, Inc. (a) | 905,000 | | 46,046,400 |
CSL Ltd. | 873,467 | | 19,989,467 |
Eyetech Pharmaceuticals, Inc. | 366,200 | | 16,662,100 |
Genentech, Inc. (a) | 1,863,700 | | 101,459,828 |
Genzyme Corp. - General Division (a) | 550,900 | | 31,990,763 |
ImClone Systems, Inc. (a) | 697,300 | | 32,131,584 |
Millennium Pharmaceuticals, Inc. (a) | 2,608,956 | | 31,620,547 |
ONYX Pharmaceuticals, Inc. (a) | 485,100 | | 15,712,389 |
QLT, Inc. (a) | 393,000 | | 6,297,825 |
Tanox, Inc. (a) | 1,042,600 | | 15,847,520 |
Telik, Inc. (a) | 459,400 | | 8,792,916 |
| | 385,607,765 |
Health Care Equipment & Supplies - 4.6% |
Alcon, Inc. | 676,700 | | 54,542,020 |
Baxter International, Inc. | 2,321,100 | | 80,170,794 |
Beckman Coulter, Inc. | 311,400 | | 20,860,686 |
Becton, Dickinson & Co. | 1,006,000 | | 57,140,800 |
C.R. Bard, Inc. | 366,400 | | 23,442,272 |
|
| Shares | | Value (Note 1) |
Dade Behring Holdings, Inc. (a) | 477,400 | | $ 26,734,400 |
Medtronic, Inc. | 1,810,300 | | 89,917,601 |
Ocular Sciences, Inc. (a) | 304,900 | | 14,943,149 |
St. Jude Medical, Inc. (a) | 743,000 | | 31,153,990 |
Thermo Electron Corp. (a) | 242,400 | | 7,318,056 |
Waters Corp. (a) | 1,076,200 | | 50,355,398 |
| | 456,579,166 |
Health Care Providers & Services - 0.9% |
McKesson Corp. | 533,400 | | 16,780,764 |
UnitedHealth Group, Inc. | 883,900 | | 77,809,717 |
| | 94,590,481 |
Pharmaceuticals - 10.0% |
Abbott Laboratories | 1,880,200 | | 87,711,330 |
Allergan, Inc. | 655,950 | | 53,177,867 |
Barr Pharmaceuticals, Inc. (a) | 840,472 | | 38,275,095 |
Elan Corp. PLC sponsored ADR (a) | 950,500 | | 25,901,125 |
Eli Lilly & Co. | 358,470 | | 20,343,173 |
Johnson & Johnson | 4,464,720 | | 283,152,537 |
Pfizer, Inc. | 7,691,995 | | 206,837,746 |
Roche Holding AG (participation certificate) | 307,139 | | 35,095,439 |
Schering-Plough Corp. | 6,086,200 | | 127,079,856 |
Wyeth | 2,628,100 | | 111,930,779 |
| | 989,504,947 |
TOTAL HEALTH CARE | | 1,926,282,359 |
INDUSTRIALS - 11.3% |
Aerospace & Defense - 3.7% |
Bombardier, Inc. Class B (sub. vtg.) | 14,014,600 | | 27,795,623 |
EADS NV | 1,697,000 | | 49,241,178 |
Embraer - Empresa Brasileira de Aeronautica SA sponsored ADR | 1,492,210 | | 49,899,502 |
General Dynamics Corp. | 353,400 | | 36,965,640 |
Goodrich Corp. | 1,112,680 | | 36,317,875 |
Honeywell International, Inc. | 310,300 | | 10,987,723 |
Lockheed Martin Corp. | 969,520 | | 53,856,836 |
Precision Castparts Corp. | 529,674 | | 34,788,988 |
The Boeing Co. | 1,231,100 | | 63,734,047 |
| | 363,587,412 |
Air Freight & Logistics - 1.9% |
EGL, Inc. (a) | 150,900 | | 4,510,401 |
FedEx Corp. | 648,400 | | 63,860,916 |
Forward Air Corp. (a) | 107,700 | | 4,814,190 |
United Parcel Service, Inc. Class B | 1,263,100 | | 107,944,526 |
UTI Worldwide, Inc. | 143,400 | | 9,754,068 |
| | 190,884,101 |
Commercial Services & Supplies - 0.7% |
Apollo Group, Inc. Class A (a) | 157,400 | | 12,703,754 |
Common Stocks - continued |
| Shares | | Value (Note 1) |
INDUSTRIALS - continued |
Commercial Services & Supplies - continued |
Herman Miller, Inc. | 429,700 | | $ 11,872,611 |
Robert Half International, Inc. | 1,470,300 | | 43,270,929 |
| | 67,847,294 |
Industrial Conglomerates - 3.6% |
3M Co. | 1,187,100 | | 97,425,297 |
General Electric Co. | 5,144,640 | | 187,779,360 |
Siemens AG sponsored ADR | 428,300 | | 36,264,161 |
Tyco International Ltd. | 908,000 | | 32,451,920 |
| | 353,920,738 |
Machinery - 0.3% |
Joy Global, Inc. | 625,351 | | 27,158,994 |
Marine - 0.0% |
Alexander & Baldwin, Inc. | 11,700 | | 496,314 |
Road & Rail - 1.0% |
Burlington Northern Santa Fe Corp. | 707,700 | | 33,481,287 |
Norfolk Southern Corp. | 914,700 | | 33,102,993 |
Union Pacific Corp. | 533,700 | | 35,891,325 |
| | 102,475,605 |
Trading Companies & Distributors - 0.1% |
UAP Holding Corp. | 902,881 | | 15,592,755 |
TOTAL INDUSTRIALS | | 1,121,963,213 |
INFORMATION TECHNOLOGY - 34.5% |
Communications Equipment - 7.8% |
Alvarion Ltd. (a) | 863,500 | | 11,467,280 |
Andrew Corp. (a) | 1,803,300 | | 24,578,979 |
Avaya, Inc. (a) | 3,175,098 | | 54,611,686 |
Cisco Systems, Inc. (a) | 10,930,820 | | 210,964,826 |
Extreme Networks, Inc. (a) | 81,436 | | 533,406 |
F5 Networks, Inc. (a) | 368,600 | | 17,958,192 |
Foundry Networks, Inc. (a) | 1,743,200 | | 22,940,512 |
Harris Corp. | 872,000 | | 53,880,880 |
Juniper Networks, Inc. (a) | 2,616,000 | | 71,129,040 |
Motorola, Inc. | 5,886,150 | | 101,241,780 |
QUALCOMM, Inc. | 3,971,900 | | 168,408,560 |
Research In Motion Ltd. (a) | 408,390 | | 33,617,303 |
| | 771,332,444 |
Computers & Peripherals - 5.9% |
Apple Computer, Inc. (a) | 179,200 | | 11,540,480 |
Brocade Communications Systems, Inc. (a) | 2,962,000 | | 22,629,680 |
Dell, Inc. (a) | 5,261,460 | | 221,717,924 |
EMC Corp. (a) | 5,566,000 | | 82,766,420 |
International Business Machines Corp. | 821,370 | | 80,970,655 |
Lexmark International, Inc. Class A (a) | 707,200 | | 60,112,000 |
Network Appliance, Inc. (a) | 1,311,292 | | 43,561,120 |
QLogic Corp. (a) | 396,500 | | 14,563,445 |
|
| Shares | | Value (Note 1) |
Sun Microsystems, Inc. (a) | 6,336,150 | | $ 34,088,487 |
UNOVA, Inc. (a) | 680,300 | | 17,204,787 |
| | 589,154,998 |
Electronic Equipment & Instruments - 1.7% |
Amphenol Corp. Class A (a) | 506,582 | | 18,611,823 |
Arrow Electronics, Inc. (a) | 846,300 | | 20,565,090 |
Hon Hai Precision Industries Co. Ltd. | 6,438,842 | | 29,773,821 |
Mettler-Toledo International, Inc. (a) | 437,600 | | 22,453,256 |
Molex, Inc. | 703,200 | | 21,096,000 |
National Instruments Corp. | 1,210,629 | | 32,989,640 |
Solectron Corp. (a) | 4,272,300 | | 22,771,359 |
| | 168,260,989 |
Internet Software & Services - 1.3% |
Google, Inc. Class A | 299,700 | | 57,872,070 |
Yahoo!, Inc. (a) | 1,918,232 | | 72,278,982 |
| | 130,151,052 |
IT Services - 1.1% |
BearingPoint, Inc. (a) | 3,072,021 | | 24,668,329 |
First Data Corp. | 2,095,000 | | 89,121,300 |
| | 113,789,629 |
Office Electronics - 0.1% |
Zebra Technologies Corp. Class A (a) | 116,850 | | 6,576,318 |
Semiconductors & Semiconductor Equipment - 9.8% |
Agere Systems, Inc.: | | | |
Class A (a) | 8,448,145 | | 11,573,959 |
Class B (a) | 6,893,509 | | 9,306,237 |
Altera Corp. (a) | 2,183,000 | | 45,188,100 |
Analog Devices, Inc. | 1,408,900 | | 52,016,588 |
Applied Materials, Inc. (a) | 1,477,800 | | 25,270,380 |
ASML Holding NV (NY Shares) (a) | 2,542,776 | | 40,455,566 |
Fairchild Semiconductor International, Inc. (a) | 1,525,200 | | 24,799,752 |
Freescale Semiconductor, Inc.: | | | |
Class A | 3,041,300 | | 54,195,966 |
Class B | 649,919 | | 11,932,513 |
Integrated Circuit Systems, Inc. (a) | 1,552,759 | | 32,483,718 |
Intel Corp. | 11,075,800 | | 259,062,962 |
International Rectifier Corp. (a) | 486,400 | | 21,678,848 |
Intersil Corp. Class A | 2,966,736 | | 49,663,161 |
KLA-Tencor Corp. (a) | 486,100 | | 22,642,538 |
Lam Research Corp. (a) | 888,800 | | 25,695,208 |
Marvell Technology Group Ltd. (a) | 24,300 | | 861,921 |
MediaTek, Inc. | 2,656,000 | | 18,046,430 |
Microchip Technology, Inc. | 1,150,900 | | 30,682,994 |
ON Semiconductor Corp. (a) | 3,045,700 | | 13,827,478 |
PMC-Sierra, Inc. (a) | 3,316,682 | | 37,312,673 |
Taiwan Semiconductor Manufacturing Co. Ltd. sponsored ADR | 5,386,674 | | 45,732,862 |
Teradyne, Inc. (a) | 1,264,000 | | 21,576,480 |
Texas Instruments, Inc. | 1,442,650 | | 35,518,043 |
Tokyo Electron Ltd. | 377,300 | | 23,242,830 |
Common Stocks - continued |
| Shares | | Value (Note 1) |
INFORMATION TECHNOLOGY - continued |
Semiconductors & Semiconductor Equipment - continued |
United Microelectronics Corp. sponsored ADR (d) | 6,073,920 | | $ 21,440,938 |
Xilinx, Inc. | 1,438,000 | | 42,636,700 |
| | 976,844,845 |
Software - 6.8% |
Adobe Systems, Inc. | 340,874 | | 21,386,435 |
Cadence Design Systems, Inc. (a) | 3,260,000 | | 45,020,600 |
Cognos, Inc. (a) | 232,600 | | 10,238,277 |
Computer Associates International, Inc. | 5,455 | | 169,432 |
Macrovision Corp. (a) | 191,952 | | 4,937,005 |
McAfee, Inc. (a) | 636,700 | | 18,419,731 |
Microsoft Corp. | 9,714,850 | | 259,483,644 |
NAVTEQ Corp. | 90,700 | | 4,204,852 |
Novell, Inc. (a) | 4,444,826 | | 30,002,576 |
Oracle Corp. (a) | 7,579,691 | | 103,993,361 |
Red Hat, Inc. (a) | 719,500 | | 9,605,325 |
SAP AG sponsored ADR | 1,256,600 | | 55,554,286 |
Symantec Corp. (a) | 1,408,306 | | 36,277,963 |
Take-Two Interactive Software, Inc. (a) | 1,109,100 | | 38,585,589 |
VERITAS Software Corp. (a) | 1,227,400 | | 35,042,270 |
| | 672,921,346 |
TOTAL INFORMATION TECHNOLOGY | | 3,429,031,621 |
MATERIALS - 1.2% |
Chemicals - 0.5% |
Monsanto Co. | 617,800 | | 34,318,790 |
Syngenta AG sponsored ADR | 709,300 | | 15,143,555 |
| | 49,462,345 |
Containers & Packaging - 0.1% |
Smurfit-Stone Container Corp. (a) | 812,611 | | 15,179,573 |
Metals & Mining - 0.6% |
Arch Coal, Inc. | 374,500 | | 13,309,730 |
CONSOL Energy, Inc. | 465,300 | | 19,100,565 |
Massey Energy Co. | 676,800 | | 23,654,160 |
| | 56,064,455 |
TOTAL MATERIALS | | 120,706,373 |
TELECOMMUNICATION SERVICES - 0.3% |
Wireless Telecommunication Services - 0.3% |
Nextel Communications, Inc.
Class A (a) | 824,100 | | 24,723,000 |
TOTAL COMMON STOCKS (Cost $7,736,201,771) | 9,864,538,158 |
Preferred Stocks - 0.0% |
| Shares | | Value (Note 1) |
Convertible Preferred Stocks - 0.0% |
INFORMATION TECHNOLOGY - 0.0% |
Communications Equipment - 0.0% |
Chorum Technologies, Inc. Series E (a)(f) | 88,646 | | $ 0 |
Nonconvertible Preferred Stocks - 0.0% |
HEALTH CARE - 0.0% |
Biotechnology - 0.0% |
Geneprot, Inc. Series A (f) | 826,000 | | 2,891,000 |
TOTAL PREFERRED STOCKS (Cost $5,872,855) | 2,891,000 |
Convertible Bonds - 0.0% |
| Principal
Amount | | |
INFORMATION TECHNOLOGY - 0.0% |
Semiconductors & Semiconductor Equipment - 0.0% |
Micron Technology, Inc. 2.5%
2/1/10 (e) | $ 1,523,000 | | 1,806,430 |
TOTAL CONVERTIBLE BONDS (Cost $1,523,000) | 1,806,430 |
Money Market Funds - 0.7% |
| Shares | | |
Fidelity Cash Central Fund, 2.24% (b) | 40,371,676 | | 40,371,676 |
Fidelity Securities Lending Cash Central Fund, 2.23% (b)(c) | 25,933,096 | | 25,933,096 |
TOTAL MONEY MARKET FUNDS (Cost $66,304,772) | 66,304,772 |
TOTAL INVESTMENT
PORTFOLIO - 100.0% (Cost $7,809,902,398) | | 9,935,540,360 |
NET OTHER ASSETS - 0.0% | | 1,402,138 |
NET ASSETS - 100% | $ 9,936,942,498 |
Legend |
(a) Non-income producing |
(b) Affiliated fund that is available only to investment companies and other accounts managed by Fidelity Investments. The rate quoted is the annualized seven-day yield of the fund at period end. A complete listing of the fund's holdings as of its most recent fiscal year end is available upon request. |
(c) Includes investment made with cash collateral received from securities on loan. |
(d) Security or a portion of the security is on loan at period end. |
(e) Security exempt from registration under Rule 144A of the Securities Act of 1933. These securities may be resold in transactions exempt from registration, normally to qualified institutional buyers. At the period end, the value of these securities amounted to 1,806,430 or 0.0% of net assets. |
(f) Restricted securities - Investment in securities not registered under the Securities Act of 1933 (excluding 144A issues). At the end of the period, the value of restricted securities (excluding 144A issues) amounted to $2,891,000 or 0.0% of net assets. |
Additional information on each holding is as follows: |
Security | Acquisition Date | Acquisition Cost |
Chorum Technologies, Inc. Series E | 9/19/00 | $ 1,528,257 |
Geneprot, Inc. Series A | 7/7/00 | $ 4,543,000 |
Income Tax Information |
At December 31, 2004, the fund had a capital loss carryforward of approximately $3,653,617,000 of which $1,411,197,000, $2,197,712,000 and $44,708,000 will expire on December 31, 2009, 2010 and 2011, respectively. |
See accompanying notes which are an integral part of the financial statements.
Annual Report
Fidelity Variable Insurance Products: Growth Portfolio
Financial Statements
Statement of Assets and Liabilities
December 31, 2004 |
Assets | | |
Investment in securities, at value (including securities loaned of $24,929,493) (cost $7,809,902,398) - See accompanying schedule | | $ 9,935,540,360 |
Cash | | 54,548 |
Foreign currency held at value
(cost $29,573,196) | | 30,067,997 |
Receivable for investments sold | | 14,033,133 |
Receivable for fund shares sold | | 4,485,109 |
Dividends receivable | | 7,487,115 |
Interest receivable | | 113,675 |
Prepaid expenses | | 38,895 |
Other affiliated receivables | | 49,263 |
Other receivables | | 1,519,976 |
Total assets | | 9,993,390,071 |
Liabilities | | |
Payable for investments purchased | $ 3,936,983 | |
Payable for fund shares redeemed | 19,018,541 | |
Accrued management fee | 4,740,859 | |
Distribution fees payable | 276,915 | |
Other affiliated payables | 865,803 | |
Other payables and accrued expenses | 1,675,376 | |
Collateral on securities loaned, at value | 25,933,096 | |
Total liabilities | | 56,447,573 |
Net Assets | | $ 9,936,942,498 |
Net Assets consist of: | | |
Paid in capital | | $ 11,449,421,694 |
Undistributed net investment income | | 42,500,013 |
Accumulated undistributed net realized gain (loss) on investments and foreign currency transactions | | (3,681,114,074) |
Net unrealized appreciation (depreciation) on investments and assets and liabilities in foreign currencies | | 2,126,134,865 |
Net Assets | | $ 9,936,942,498 |
| | |
Initial Class:
Net Asset Value, offering price and redemption price per share ($7,796,887,587 ÷ 243,554,460 shares) | | $ 32.01 |
| | |
Service Class:
Net Asset Value, offering price and redemption price per share ($1,326,262,008 ÷ 41,602,270 shares) | | $ 31.88 |
| | |
Service Class 2:
Net Asset Value, offering price and redemption price per share ($811,126,385 ÷ 25,638,241 shares) | | $ 31.64 |
| | |
Service Class 2R:
Net Asset Value, offering price
and redemption price per share ($2,666,518 ÷ 84,539 shares) | | $ 31.54 |
Statement of Operations
Year ended December 31, 2004 |
| | |
Investment Income | | |
Dividends A | | $ 86,850,641 |
Special Dividends | | 26,028,750 |
Interest | | 880,245 |
Security lending | | 520,076 |
Total income | | 114,279,712 |
| | |
Expenses | | |
Management fee | $ 58,590,211 | |
Transfer agent fees | 6,723,531 | |
Distribution fees | 3,143,384 | |
Accounting and security lending fees | 1,387,678 | |
Non-interested trustees' compensation | 56,073 | |
Appreciation in deferred trustee compensation account | 14,142 | |
Custodian fees and expenses | 300,615 | |
Audit | 96,165 | |
Legal | 32,336 | |
Interest | 39,066 | |
Miscellaneous | 2,052,657 | |
Total expenses before reductions | 72,435,858 | |
Expense reductions | (3,293,886) | 69,141,972 |
Net investment income (loss) | | 45,137,740 |
Realized and Unrealized Gain (Loss) Net realized gain (loss) on: | | |
Investment securities | 704,506,123 | |
Foreign currency transactions | (113,869) | |
Total net realized gain (loss) | | 704,392,254 |
Change in net unrealized appreciation (depreciation) on: Investment securities | (449,154,576) | |
Assets and liabilities in foreign currencies | 499,190 | |
Total change in net unrealized appreciation (depreciation) | | (448,655,386) |
Net gain (loss) | | 255,736,868 |
Net increase (decrease) in net assets resulting from operations | | $ 300,874,608 |
A As a result of the change in the estimate of the return of capital component of dividend income realized in the year ended December 31, 2003, dividend income has been reduced by $2,260,756, with a corresponding increase to net realized gain (loss) and net unrealized appreciation (depreciation).
See accompanying notes which are an integral part of the financial statements.
Annual Report
Statement of Changes in Net Assets
| Year ended
December 31,
2004 | Year ended
December 31,
2003 |
Increase (Decrease) in Net Assets | | |
Operations | | |
Net investment income (loss) | $ 45,137,740 | $ 23,031,175 |
Net realized gain (loss) | 704,392,254 | 49,130,228 |
Change in net unrealized appreciation (depreciation) | (448,655,386) | 2,530,101,870 |
Net increase (decrease) in net assets resulting from operations | 300,874,608 | 2,602,263,273 |
Distributions to shareholders from net investment income | (25,185,765) | (23,104,405) |
Share transactions - net increase (decrease) | (945,720,754) | (285,825,613) |
Redemption fees | 13 | 2,361 |
Total increase (decrease) in net assets | (670,031,898) | 2,293,335,616 |
| | |
Net Assets | | |
Beginning of period | 10,606,974,396 | 8,313,638,780 |
End of period (including undistributed net investment income of $42,500,013 and undistributed net investment income of $22,711,797, respectively) | $ 9,936,942,498 | $ 10,606,974,396 |
Other Information: | | | | |
Share Transactions | Year ended December 31, 2004 |
| Initial Class | Service Class | Service Class 2 | Service Class 2R |
Shares Sold | 10,173,829 | 3,809,653 | 9,957,726 | 63,032 |
Reinvested | 677,303 | 70,256 | 26,349 | 100 |
Redeemed | (44,148,491) | (7,601,708) | (4,196,333) | (23,264) |
Net increase (decrease) | (33,297,359) | (3,721,799) | 5,787,742 | 39,868 |
| | | | |
Dollars Sold | $ 317,143,990 | $ 118,147,419 | $ 305,162,849 | $ 1,941,136 |
Reinvested | 22,052,984 | 2,279,802 | 849,771 | 3,208 |
Redeemed | (1,353,451,648) | (232,412,004) | (126,744,925) | (693,336) |
Net increase (decrease) | $ (1,014,254,674) | $ (111,984,783) | $ 179,267,695 | $ 1,251,008 |
| | | | |
Share Transactions | Year ended December 31, 2003 |
| Initial Class | Service Class | Service Class 2 | Service Class 2R |
Shares Sold | 23,586,131 | 8,385,408 | 13,542,393 | 50,235 |
Reinvested | 941,499 | 102,591 | 14,708 | 31 |
Redeemed | (47,048,733) | (8,519,590) | (3,984,642) | (14,664) |
Net increase (decrease) | (22,521,103) | (31,591) | 9,572,459 | 35,602 |
| | | | |
Dollars Sold | $ 625,883,728 | $ 221,233,256 | $ 361,842,888 | $ 1,388,031 |
Reinvested | 20,552,932 | 2,232,378 | 318,424 | 671 |
Redeemed | (1,198,774,049) | (217,996,235) | (102,097,753) | (409,884) |
Net increase (decrease) | $ (552,337,389) | $ 5,469,399 | $ 260,063,559 | $ 978,818 |
| | | | |
Distributions | Year ended December 31, 2004 |
| Initial Class | Service Class | Service Class 2 | Service Class 2R |
From net investment income | $ 22,052,984 | $ 2,279,802 | $ 849,771 | $ 3,208 |
| Year ended December 31, 2003 |
| Initial Class | Service Class | Service Class 2 | Service Class 2R |
From net investment income | $ 20,552,932 | $ 2,232,378 | $ 318,424 | $ 671 |
See accompanying notes which are an integral part of the financial statements.
Growth Portfolio
Financial Highlights - Initial Class
Years ended December 31, | 2004 | 2003 | 2002 | 2001 | 2000 |
Selected Per-Share Data | | | | | |
Net asset value, beginning of period | $ 31.04 | $ 23.44 | $ 33.61 | $ 43.66 | $ 54.93 |
Income from Investment Operations | | | | | |
Net investment income (loss) C | .15 D, G | .07 | .07 | .07 | .03 |
Net realized and unrealized gain (loss) | .90 | 7.60 | (10.17) | (7.27) | (5.27) |
Total from investment operations | 1.05 | 7.67 | (10.10) | (7.20) | (5.24) |
Distributions from net investment income | (.08) | (.07) | (.07) | (.03) | (.06) |
Distributions from net realized gain | - | - | - | (2.82) | (5.97) |
Total distributions | (.08) | (.07) | (.07) | (2.85) | (6.03) |
Redemption fees added to paid in capital | - C, F | - C, F | - C, F | - | - |
Net asset value, end of period | $ 32.01 | $ 31.04 | $ 23.44 | $ 33.61 | $ 43.66 |
Total Return A, B | 3.38% | 32.85% | (30.10)% | (17.67)% | (10.96)% |
Ratios to Average Net Assets E | | | | | |
Expenses before expense reductions | .68% | .67% | .67% | .68% | .65% |
Expenses net of voluntary waivers, if any | .68% | .67% | .67% | .68% | .65% |
Expenses net of all reductions | .65% | .64% | .61% | .65% | .64% |
Net investment income (loss) | .47% G | .28% | .25% | .19% | .07% |
Supplemental Data | | | | | |
Net assets, end of period (000 omitted) | $ 7,796,888 | $ 8,594,509 | $ 7,016,147 | $ 11,458,659 | $ 15,517,271 |
Portfolio turnover rate | 72% | 61% | 90% | 105% | 103% |
A Total returns do not reflect charges attributable to your insurance company's separate account. Inclusion of these charges would reduce the total returns shown.
B Total returns would have been lower had certain expenses not been reduced during the periods shown.
C Calculated based on average shares outstanding during the period.
D Investment income per share reflects a special dividend which amounted to $.08 per share.
E Expense ratios reflect operating expenses of the class. Expenses before reductions do not reflect amounts reimbursed by the investment adviser or reductions from brokerage service arrangements or other expense offset arrangements and do not represent the amount paid by the class during periods when reimbursements or reductions occur. Expenses net of any voluntary waivers reflect expenses after reimbursement by the investment adviser but prior to reductions from brokerage service arrangements or other expense offset arrangements. Expenses net of all reductions represent the net expenses paid by the class.
F Amount represents less than $.01 per share.
G As a result in the change in the estimate of the return of capital component of divided income realized in the year ended December 31, 2003, net investment income per share and the ratio of net investment income to average net assets for the year ended December 31, 2004 have been reduced by $.01 per share and .02%, respectively. The change in estimate has no impact on total net assets or total return of the fund.
Financial Highlights - Service Class
Years ended December 31, | 2004 | 2003 | 2002 | 2001 | 2000 |
Selected Per-Share Data | | | | | |
Net asset value, beginning of period | $ 30.92 | $ 23.34 | $ 33.48 | $ 43.51 | $ 54.80 |
Income from Investment Operations | | | | | |
Net investment income (loss) C | .11 D, G | .05 | .04 | .03 | (.02) |
Net realized and unrealized gain (loss) | .90 | 7.58 | (10.14) | (7.24) | (5.25) |
Total from investment operations | 1.01 | 7.63 | (10.10) | (7.21) | (5.27) |
Distributions from net investment income | (.05) | (.05) | (.04) | - | (.05) |
Distributions from net realized gain | - | - | - | (2.82) | (5.97) |
Total distributions | (.05) | (.05) | (.04) | (2.82) | (6.02) |
Redemption fees added to paid in capital | - C, F | - C, F | - C, F | - | - |
Net asset value, end of period | $ 31.88 | $ 30.92 | $ 23.34 | $ 33.48 | $ 43.51 |
Total Return A, B | 3.26% | 32.78% | (30.20)% | (17.74)% | (11.05)% |
Ratios to Average Net Assets E | | | | | |
Expenses before expense reductions | .78% | .77% | .77% | .78% | .76% |
Expenses net of voluntary waivers, if any | .78% | .77% | .77% | .78% | .76% |
Expenses net of all reductions | .75% | .74% | .71% | .75% | .74% |
Net investment income (loss) | .37% G | .18% | .15% | .09% | (.04)% |
Supplemental Data | | | | | |
Net assets, end of period (000 omitted) | $ 1,326,262 | $ 1,401,298 | $ 1,058,738 | $ 1,655,758 | $ 1,847,051 |
Portfolio turnover rate | 72% | 61% | 90% | 105% | 103% |
A Total returns do not reflect charges attributable to your insurance company's separate account. Inclusion of these charges would reduce the total returns shown.
B Total returns would have been lower had certain expenses not been reduced during the periods shown.
C Calculated based on average shares outstanding during the period.
D Investment income per share reflects a special dividend which amounted to $.08 per share.
E Expense ratios reflect operating expenses of the class. Expenses before reductions do not reflect amounts reimbursed by the investment adviser or reductions from brokerage service arrangements or other expense offset arrangements and do not represent the amount paid by the class during periods when reimbursements or reductions occur. Expenses net of any voluntary waivers reflect expenses after reimbursement by the investment adviser but prior to reductions from brokerage service arrangements or other expense offset arrangements. Expenses net of all reductions represent the net expenses paid by the class.
F Amount represents less than $.01 per share.
G As a result in the change in the estimate of the return of capital component of divided income realized in the year ended December 31, 2003, net investment income per share and the ratio of net investment income to average net assets for the year ended December 31, 2004 have been reduced by $.01 per share and .02%, respectively. The change in estimate has no impact on total net assets or total return of the fund.
See accompanying notes which are an integral part of the financial statements.
Annual Report
Financial Highlights - Service Class 2
Years ended December 31, | 2004 | 2003 | 2002 | 2001 | 2000 G |
Selected Per-Share Data | | | | | |
Net asset value, beginning of period | $ 30.72 | $ 23.21 | $ 33.34 | $ 43.43 | $ 53.40 |
Income from Investment Operations | | | | | |
Net investment income (loss) E | .07 F, J | .01 | - I | (.02) | (.09) |
Net realized and unrealized gain (loss) | .89 | 7.53 | (10.09) | (7.22) | (3.86) |
Total from investment operations | .96 | 7.54 | (10.09) | (7.24) | (3.95) |
Distributions from net investment income | (.04) | (.03) | (.04) | (.03) | (.05) |
Distributions from net realized gain | - | - | - | (2.82) | (5.97) |
Total distributions | (.04) | (.03) | (.04) | (2.85) | (6.02) |
Redemption fees added to paid in capital | - E, I | - E, I | - E, I | - | - |
Net asset value, end of period | $ 31.64 | $ 30.72 | $ 23.21 | $ 33.34 | $ 43.43 |
Total Return B, C, D | 3.12% | 32.54% | (30.30)% | (17.87)% | (8.88)% |
Ratios to Average Net Assets H | | | | | |
Expenses before expense reductions | .93% | .92% | .93% | .93% | .91% A |
Expenses net of voluntary waivers, if any | .93% | .92% | .93% | .93% | .91% A |
Expenses net of all reductions | .90% | .89% | .87% | .90% | .90% A |
Net investment income (loss) | .22% J | .02% | (.01)% | (.06)% | (.19)% A |
Supplemental Data | | | | | |
Net assets, end of period (000 omitted) | $ 811,126 | $ 609,798 | $ 238,543 | $ 191,475 | $ 57,095 |
Portfolio turnover rate | 72% | 61% | 90% | 105% | 103% |
A Annualized
B Total returns for periods of less than one year are not annualized.
C Total returns do not reflect charges attributable to your insurance company's separate account. Inclusion of these charges would reduce the total returns shown.
D Total returns would have been lower had certain expenses not been reduced during the periods shown.
E Calculated based on average shares outstanding during the period.
F Investment income per share reflects a special dividend which amounted to $.08 per share.
G For the period January 12, 2000 (commencement of sale of shares) to December 31, 2000.
H Expense ratios reflect operating expenses of the class. Expenses before reductions do not reflect amounts reimbursed by the investment adviser or reductions from brokerage service arrangements or other expense offset arrangements and do not represent the amount paid by the class during periods when reimbursements or reductions occur. Expense ratios before reductions for start-up periods may not be representative of longer-term operating periods. Expenses net of any voluntary waivers reflect expenses after reimbursement by the investment adviser but prior to reductions from brokerage service arrangements or other expense offset arrangements. Expenses net of all reductions represent the net expenses paid by the class.
I Amount represents less than $.01 per share.
J As a result in the change in the estimate of the return of capital component of divided income realized in the year ended December 31, 2003, net investment income per share and the ratio of net investment income to average net assets for the year ended December 31, 2004 have been reduced by $.01 per share and .02%, respectively. The change in estimate has no impact on total net assets or total return of the fund.
Financial Highlights - Service Class 2R
Years ended December 31, | 2004 | 2003 | 2002 G |
Selected Per-Share Data | | | |
Net asset value, beginning of period | $ 30.65 | $ 23.20 | $ 31.05 |
Income from Investment Operations | | | |
Net investment income (loss) E | .07 F, J | .01 | (.01) |
Net realized and unrealized gain (loss) | .88 | 7.51 | (7.84) |
Total from investment operations | .95 | 7.52 | (7.85) |
Distributions from net investment income | (.06) | (.07) | - |
Redemption fees added to paid in capital E, I | - | - | - |
Net asset value, end of period | $ 31.54 | $ 30.65 | $ 23.20 |
Total Return B, C, D | 3.10% | 32.54% | (25.28)% |
Ratios to Average Net Assets H | | | |
Expenses before expense reductions | .93% | .92% | .96% A |
Expenses net of voluntary waivers, if any | .93% | .92% | .96% A |
Expenses net of all reductions | .90% | .90% | .90% A |
Net investment income (loss) | .22% J | .02% | (.03)% A |
Supplemental Data | | | |
Net assets, end of period (000 omitted) | $ 2,667 | $ 1,369 | $ 210 |
Portfolio turnover rate | 72% | 61% | 90% |
A Annualized
B Total returns for periods of less than one year are not annualized.
C Total returns do not reflect charges attributable to your insurance company's separate account. Inclusion of these charges would reduce the total returns shown.
D Total returns would have been lower had certain expenses not been reduced during the periods shown.
E Calculated based on average shares outstanding during the period.
F Investment income per share reflects a special dividend which amounted to $.08 per share.
G For the period April 24, 2002 (commencement of sale of shares) to December 31, 2002.
H Expense ratios reflect operating expenses of the class. Expenses before reductions do not reflect amounts reimbursed by the investment adviser or reductions from brokerage service arrangements or other expense offset arrangements and do not represent the amount paid by the class during periods when reimbursements or reductions occur. Expense ratios before reductions for start-up periods may not be representative of longer-term operating periods. Expenses net of any voluntary waivers reflect expenses after reimbursement by the investment adviser but prior to reductions from brokerage service arrangements or other expense offset arrangements. Expenses net of all reductions represent the net expenses paid by the class.
I Amount represents less than $.01 per share.
J As a result in the change in the estimate of the return of capital component of divided income realized in the year ended December 31, 2003, net investment income per share and the ratio of net investment income to average net assets for the year ended December 31, 2004 have been reduced by $.01 per share and .02%, respectively. The change in estimate has no impact on total net assets or total return of the fund.
See accompanying notes which are an integral part of the financial statements.
Growth Portfolio
Notes to Financial Statements
For the period ended December 31, 2004
1. Significant Accounting Policies.
Growth Portfolio (the fund) is a fund of Variable Insurance Products Fund (the trust) (referred to in this report as Fidelity Variable Insurance Products: Growth Portfolio) and is authorized to issue an unlimited number of shares. The trust is registered under the Investment Company Act of 1940, as amended (the 1940 Act), as an open-end management investment company organized as a Massachusetts business trust. Shares of the fund may only be purchased by insurance companies for the purpose of funding variable annuity or variable life insurance contracts. The fund offers the following classes of shares: Initial Class shares, Service Class shares, Service Class 2 shares and Service Class 2R shares. All classes have equal rights and voting privileges, except for matters affecting a single class. Investment income, realized and unrealized capital gains and losses, the common expenses of the fund, and certain fund-level expense reductions, if any, are allocated on a pro rata basis to each class based on the relative net assets of each class to the total net assets of the fund. Each class differs with respect to distribution and service plan fees incurred. Certain expense reductions also differ by class.
The financial statements have been prepared in conformity with accounting principles generally accepted in the United States of America, which require management to make certain estimates and assumptions at the date of the financial statements. The following summarizes the significant accounting policies of the fund:
Security Valuation. Net asset value per share (NAV calculation) is calculated as of the close of business of the New York Stock Exchange, normally 4:00 p.m. Eastern time. Equity securities, including restricted securities, for which market quotations are available are valued at the last sale price or official closing price (closing bid price or last evaluated quote if no sale has occurred) on the primary market or exchange on which they trade. Debt securities, including restricted securities, for which quotations are readily available are valued at their most recent bid prices (sales prices if the principal market is an exchange) in the principal market in which such securities are normally traded, as determined by recognized dealers in such securities, or securities are valued on the basis of information provided by a pricing service. Pricing services use valuation matrices that incorporate both dealer-supplied valuations and valuation models. If prices are not readily available or do not accurately reflect fair value for a security, or if a security's value has been materially affected by events occurring after the close of the exchange or market on which the security is principally traded, that security may be valued by another method that the Board of Trustees believes accurately reflects fair value. A security's valuation may differ depending on the method used for determining value. Price movements in futures contracts and ADRs, market and trading trends, the bid/ask quotes of brokers and off-exchange institutional trading may be reviewed in the course of making a good faith determination of a security's fair value. Short-term securities with remaining maturities of sixty days or less for which quotations are not readily available are valued on the basis of amortized cost. Investments in open-end investment companies are valued at their net asset value each business day.
Foreign Currency. The fund uses foreign currency contracts to facilitate transactions in foreign-denominated securities. Losses from these transactions may arise from changes in the value of the foreign currency or if the counterparties do not perform under the contracts' terms.
Foreign-denominated assets, including investment securities, and liabilities are translated into U.S. dollars at the exchange rate at period end. Purchases and sales of investment securities, income and dividends received and expenses denominated in foreign currencies are translated into U.S. dollars at the exchange rate in effect on the transaction date.
The effects of exchange rate fluctuations on investments are included with the net realized and unrealized gain (loss) on investment securities. Other foreign currency transactions resulting in realized and unrealized gain (loss) are disclosed separately.
Investment Transactions and Income. Security transactions are accounted for as of trade date. Gains and losses on securities sold are determined on the basis of identified cost and may include proceeds received from litigation. Dividend income is recorded on the ex-dividend date, except for certain dividends from foreign securities where the ex-dividend date may have passed, which are recorded as soon as the fund is informed of the ex-dividend date. Non-cash dividends included in dividend income, if any, are recorded at the fair market value of the securities received. Distributions received on securities that represent a return of capital or capital gain are recorded as a reduction of cost of investments and/or as a realized gain. The fund estimates the components of distributions received that may be considered return of capital distributions or capital gain distributions. Large, non-recurring dividends recognized by the fund are presented separately on the Statement of Operations as "Special Dividends" and the impact of these dividends to net investment income per share is presented in the Financial Highlights. Interest income is accrued as earned. Interest income includes coupon interest and amortization of premium and accretion of discount on debt securities. Investment income is recorded net of foreign taxes withheld where recovery of such taxes is uncertain.
Expenses. Most expenses of the trust can be directly attributed to a fund. Expenses which cannot be directly attributed are apportioned among the funds in the trust.
Deferred Trustee Compensation. Under a Deferred Compensation Plan (the Plan) non-interested Trustees must defer receipt of a portion of, and may elect to defer receipt of an additional portion of, their annual compensation. Deferred amounts are treated as though equivalent dollar amounts had been invested in a cross-section of other Fidelity funds, and are marked-to-market. Deferred amounts remain in the fund until distributed in accordance with the Plan.
Annual Report
Notes to Financial Statements - continued
1. Significant Accounting Policies - continued
Income Tax Information and Distributions to Shareholders. Each year, the fund intends to qualify as a regulated investment company by distributing all of its taxable income and realized gains under Subchapter M of the Internal Revenue Code. As a result, no provision for income taxes is required in the accompanying financial statements. Foreign taxes are provided for based on the fund's understanding of the tax rules and rates that exist in the foreign markets in which it invests.
Distributions are recorded on the ex-dividend date. Income dividends and capital gain distributions are declared separately for each class. Income and capital gain distributions are determined in accordance with income tax regulations, which may differ from generally accepted accounting principles. Capital accounts within the financial statements are adjusted for permanent book-tax differences. These adjustments have no impact on net assets or the results of operations. Temporary book-tax differences will reverse in a subsequent period.
Book-tax differences are primarily due to foreign currency transactions, capital loss carryforwards and losses deferred due to wash sales.
The tax-basis components of distributable earnings and the federal tax cost as of period end were as follows:
Unrealized appreciation | $ 2,326,119,909 | |
Unrealized depreciation | (227,367,706) | |
Net unrealized appreciation (depreciation) | 2,098,752,203 | |
Undistributed ordinary income | 42,590,026 | |
Capital loss carryforward | (3,653,617,452) | |
| | |
Cost for federal income tax purposes | $ 7,836,788,157 | |
The tax character of distributions paid was as follows:
| December 31,
2004 | December 31,
2003 |
Ordinary Income | $ 25,185,765 | $ 23,104,405 |
Trading (Redemption) Fees. Service Class 2R shares held less than 60 days are subject to a redemption fee equal to 1% of the proceeds of the redeemed shares. All redemption fees, including any estimated redemption fees paid by Fidelity Management & Research Company (FMR), are retained by the fund and accounted for as an addition to paid in capital.
2. Operating Policies.
Repurchase Agreements. FMR has received an Exemptive Order from the Securities and Exchange Commission (the SEC) which permits the fund and other affiliated entities of FMR to transfer uninvested cash balances into joint trading accounts. These accounts are then invested in repurchase agreements that are collateralized by U.S. Treasury or Government obligations. The fund may also invest directly with institutions, in repurchase agreements that are collateralized by commercial paper obligations and corporate obligations. Collateral is held in segregated accounts with custodian banks and may be obtained in the event of a default of the counterparty. Collateral is marked-to-market daily and maintained at a value at least equal to the principal amount of the repurchase agreement (including accrued interest).
Restricted Securities. The fund may invest in securities that are subject to legal or contractual restrictions on resale. These securities generally may be resold in transactions exempt from registration or to the public if the securities are registered. Disposal of these securities may involve time-consuming negotiations and expense, and prompt sale at an acceptable price may be difficult. Information regarding restricted securities is included at the end of the fund's Schedule of Investments.
3. Purchases and Sales of Investments.
Purchases and sales of securities, other than short-term securities and U.S. government securities, aggregated $7,269,389,954 and $8,239,247,322, respectively.
4. Fees and Other Transactions with Affiliates.
Management Fee. FMR and its affiliates provide the fund with investment management related services for which the fund pays a monthly management fee. The management fee is the sum of an individual fund fee rate that is based on an annual rate of .30% of the fund's average net assets and a group fee rate that averaged .28% during the period. The group fee rate is based upon the average net assets of all the mutual funds advised by FMR. The group fee rate decreases as assets under management increase and increases as assets under management decrease. For the period, the total annual management fee rate was .58% of the fund's average net assets.
Growth Portfolio
4. Fees and Other Transactions with Affiliates - continued
Distribution and Service Plan. In accordance with Rule 12b-1 of the 1940 Act, the fund has adopted separate 12b-1 Plans for each Service Class of shares. Each Service Class pays Fidelity Distributors Corporation (FDC), an affiliate of FMR, a service fee. For the period, the service fee is based on an annual rate of .10% of Service Class' average net assets and .25% of Service Class 2's and Service Class 2R's average net assets.
For the period, each class paid FDC the following amounts, all of which were re-allowed to insurance companies for the distribution of shares and providing shareholder support services:
Service Class | $ 1,356,900 | |
Service Class 2 | 1,781,135 | |
Service Class 2R | 5,349 | |
| $ 3,143,384 | |
Transfer Agent Fees. Fidelity Investments Institutional Operations Company, Inc. (FIIOC), an affiliate of FMR, is the fund's transfer, dividend disbursing, and shareholder servicing agent. FIIOC receives an asset-based fee with respect to each account. FIIOC pays a portion of the expenses related to the typesetting, printing and mailing of shareholder reports, except proxy statements. Each class pays a transfer agent fee, excluding out of pocket expenses, equal to an annual rate of .07% of their month end net assets. For the period, the total transfer agent fees paid by each class to FIIOC, including out of pocket expenses, were as follows:
Initial Class | $ 5,336,742 | |
Service Class | 899,118 | |
Service Class 2 | 486,224 | |
Service Class 2R | 1,447 | |
| $ 6,723,531 | |
Accounting and Security Lending Fees. Fidelity Service Company, Inc. (FSC), an affiliate of FMR, maintains the fund's accounting records. The accounting fee is based on the level of average net assets for the month. Under a separate contract, FSC administers the security lending program. The security lending fee is based on the number and duration of lending transactions.
Central Funds. The fund may invest in affiliated Central Funds managed by Fidelity Investments Money Management, Inc. (FIMM), an affiliate of FMR. The Central Funds are open-end investment companies available only to investment companies and other accounts managed by FMR and its affiliates. The Central Funds seek preservation of capital and current income and do not pay a management fee. Income distributions earned by the fund are recorded as income in the accompanying financial statements and totaled $825,101 for the period.
Brokerage Commissions. The fund placed a portion of its portfolio transactions with brokerage firms which are affiliates of the investment adviser. The commissions paid to these affiliated firms were $609,973 for the period.
Interfund Lending Program. Pursuant to an Exemptive Order issued by the SEC, the fund, along with other registered investment companies having management contracts with FMR, may participate in an interfund lending program. This program provides an alternative credit facility allowing the funds to borrow from, or lend money to, other participating funds. At period end, there were no interfund loans outstanding. The fund's activity in this program during the period was as follows:
Borrower or Lender | Average Daily
Loan Balance | Weighted Average
Interest Rate | Interest Earned
(included in interest income) | Interest
Expense |
Borrower | $ 21,552,298 | 1.39% | - | $ 39,066 |
5. Committed Line of Credit.
The fund participates with other funds managed by FMR in a $4.2 billion credit facility (the "line of credit") to be utilized for temporary or emergency purposes to fund shareholder redemptions or for other short-term liquidity purposes. The fund has agreed to pay commitment fees on its pro rata portion of the line of credit. During the period, there were no borrowings on this line of credit.
6. Security Lending.
The fund lends portfolio securities from time to time in order to earn additional income. The fund receives collateral (in the form of U.S. Treasury obligations, letters of credit and/or cash) against the loaned securities and maintains collateral in an amount not less than 100% of the market value of the loaned securities during the period of the loan. The market value of the loaned securities is determined at the close of business of the fund and any
Annual Report
Notes to Financial Statements - continued
6. Security Lending - continued
additional required collateral is delivered to the fund on the next business day. If the borrower defaults on its obligation to return the securities loaned because of insolvency or other reasons, a fund could experience delays and costs in recovering the securities loaned or in gaining access to the collateral. Cash collateral is invested in cash equivalents. The value of loaned securities and cash collateral at period end are disclosed on the fund's Statement of Assets and Liabilities.
7. Expense Reductions.
Many of the brokers with whom FMR places trades on behalf of the fund provided services to the fund in addition to trade execution. These services included payments of certain expenses on behalf of the fund totaling $3,292,493 for the period. In addition, through arrangements with the fund's custodian, credits realized as a result of uninvested cash balances were used to reduce the fund's expenses. During the period, these credits reduced the fund's custody expenses by $1,393.
8. Other Information.
At the end of the period, FMR or its affiliates were the owners of record of 11% of the total outstanding shares of the fund and two otherwise unaffiliated shareholders were the owners of record of 35% of the total outstanding shares of the fund.
Growth Portfolio
Report of Independent Registered Public Accounting Firm
To the Trustees of Variable Insurance Products Fund and the Shareholders of Growth Portfolio:
In our opinion, the accompanying statement of assets and liabilities, including the schedule of investments, and the related statements of operations and of changes in net assets and the financial highlights present fairly, in all material respects, the financial position of Growth Portfolio (a fund of Variable Insurance Products Fund) at December 31, 2004 and the results of its operations, the changes in its net assets and the financial highlights for the periods indicated, in conformity with accounting principles generally accepted in the United States of America. These financial statements and financial highlights (hereafter referred to as "financial statements") are the responsibility of the Growth Portfolio's management; our responsibility is to express an opinion on these financial statements based on our audits. We conducted our audits of these financial statements in accordance with the standards of the Public Company Accounting Oversight Board (United States). Those standards require that we plan and perform the audit to obtain reasonable assurance about whether the financial statements are free of material misstatement. An audit includes examining, on a test basis, evidence supporting the amounts and disclosures in the financial statements, assessing the accounting principles used and significant estimates made by management, and evaluating the overall financial statement presentation. We believe that our audits, which included confirmation of securities at December 31, 2004 by correspondence with the custodian and brokers, provide a reasonable basis for our opinion.
/s/PricewaterhouseCoopers LLP
PricewaterhouseCoopers LLP
Boston, Massachusetts
February 10, 2005
Annual Report
Trustees and Officers
The Trustees, Member of the Advisory Board, and executive officers of the trust and fund, as applicable, are listed below. The Board of Trustees governs the fund and is responsible for protecting the interests of shareholders. The Trustees are experienced executives who meet periodically throughout the year to oversee the fund's activities, review contractual arrangements with companies that provide services to the fund, and review the fund's performance. Except for William O. McCoy, Dennis J. Dirks, and Kenneth L. Wolfe, each of the Trustees oversees 301 funds advised by FMR or an affiliate. Mr. McCoy oversees 303 funds advised by FMR or an affiliate. Mr. Dirks and Mr. Wolfe oversee 233 funds advised by FMR or an affiliate.
The Trustees hold office without limit in time except that (a) any Trustee may resign; (b) any Trustee may be removed by written instrument, signed by at least two-thirds of the number of Trustees prior to such removal; (c) any Trustee who requests to be retired or who has become incapacitated by illness or injury may be retired by written instrument signed by a majority of the other Trustees; and (d) any Trustee may be removed at any special meeting of shareholders by a two-thirds vote of the outstanding voting securities of the trust. In any event, each non-interested Trustee shall retire not later than the last day of the calendar year in which his or her 72nd birthday occurs. The executive officers and Advisory Board Member hold office without limit in time, except that any officer and Advisory Board Member may resign or may be removed by a vote of a majority of the Trustees at any regular meeting or any special meeting of the Trustees. Except as indicated, each individual has held the office shown or other offices in the same company for the past five years.
The fund's Statement of Additional Information (SAI) includes more information about the Trustees. To request a free copy, call Fidelity at 1-800-544-5429.
Interested Trustees*:
Correspondence intended for each Trustee who is an "interested person" (as defined in the 1940 Act) may be sent to Fidelity Investments, 82 Devonshire Street, Boston, Massachusetts 02109.
Name, Age; Principal Occupation |
Edward C. Johnson 3d (74)** |
| Year of Election or Appointment: 1981 Mr. Johnson is Chairman of the Board of Trustees. Mr. Johnson serves as Chief Executive Officer, Chairman, and a Director of FMR Corp.; a Director and Chairman of the Board and of the Executive Committee of FMR; Chairman and a Director of Fidelity Management & Research (Far East) Inc.; Chairman (1998) and a Director of Fidelity Investments Money Management, Inc.; and Chairman (2001) and a Director (2000) of FMR Co., Inc. |
Abigail P. Johnson (43)** |
| Year of Election or Appointment: 2001 Senior Vice President of VIP Growth (2001). Ms. Johnson also serves as Senior Vice President of other Fidelity funds (2001). She is President and a Director of FMR (2001), Fidelity Investments Money Management, Inc. (2001), FMR Co., Inc. (2001), and a Director of FMR Corp. Previously, Ms. Johnson managed a number of Fidelity funds. |
Laura B. Cronin (50) |
| Year of Election or Appointment: 2003 Ms. Cronin is an Executive Vice President (2002) and Chief Financial Officer (2002) of FMR Corp. and is a member of the Fidelity Management Committee (2003). Previously, Ms. Cronin served as Vice President of Finance of FMR (1997-1999), and Chief Financial Officer of FMR (1999-2001), Fidelity Personal Investments (2001), and Fidelity Brokerage Company (2001-2002). |
Robert L. Reynolds (52) |
| Year of Election or Appointment: 2003 Mr. Reynolds is a Director (2003) and Chief Operating Officer (2002) of FMR Corp. and is the head of the Fidelity Management Committee (2003). He also serves on the Board at Fidelity Investments Canada, Ltd. (2000). Previously, Mr. Reynolds served as President of Fidelity Investments Institutional Retirement Group (1996-2000). |
* Trustees have been determined to be "Interested Trustees" by virtue of, among other things, their affiliation with the trust or various entities under common control with FMR.
** Edward C. Johnson 3d, Trustee, is Abigail P. Johnson's father.
Annual Report
Trustees and Officers - continued
Non-Interested Trustees:
Correspondence intended for each non-interested Trustee (that is, the Trustees other than the Interested Trustees) may be sent to Fidelity Investments, P.O. Box 55235, Boston, Massachusetts 02205-5235.
Name, Age; Principal Occupation |
Dennis J. Dirks (56) |
| Year of Election or Appointment: 2005 Mr. Dirks also serves as a Trustee (2005) or Member of the Advisory Board (2004) of other investment companies advised by FMR. Prior to his retirement in May 2003, Mr. Dirks was Chief Operating Officer and a member of the Board of The Depository Trust & Clearing Corporation (DTCC) (1999-2003). He also served as President, Chief Operating Officer, and Board member of The Depository Trust Company (DTC) (1999-2003) and President and Board member of the National Securities Clearing Corporation (NSCC) (1999-2003). In addition, Mr. Dirks served as Chief Executive Officer and Board member of the Government Securities Clearing Corporation (2001-2003) and Chief Executive Officer and Board member of the Mortgage-Backed Securities Clearing Corporation (2001-2003). |
Robert M. Gates (61) |
| Year of Election or Appointment: 1997 Dr. Gates is Vice Chairman of the non-interested Trustees (2005). Dr. Gates is President of Texas A&M University (2002). He was Director of the Central Intelligence Agency (CIA) from 1991 to 1993. From 1989 to 1991, Dr. Gates served as Assistant to the President of the United States and Deputy National Security Advisor. Dr. Gates is a Director of NACCO Industries, Inc. (mining and manufacturing), Parker Drilling Co., Inc. (drilling and rental tools for the energy industry, 2001), and Brinker International (restaurant management, 2003). He also serves as a member of the Advisory Board of VoteHere.net (secure internet voting, 2001). Previously, Dr. Gates served as a Director of LucasVarity PLC (automotive components and diesel engines), a Director of TRW Inc. (automotive, space, defense, and information technology), and Dean of the George Bush School of Government and Public Service at Texas A&M University (1999-2001). Dr. Gates also is a Trustee of the Forum for International Policy. |
George H. Heilmeier (68) |
| Year of Election or Appointment: 2004 Dr. Heilmeier is Chairman Emeritus of Telcordia Technologies (communication software and systems), where prior to his retirement, he served as company Chairman and Chief Executive Officer. He currently serves on the Boards of Directors of The Mitre Corporation (systems engineering and information technology support for the government), INET Technologies Inc. (telecommunications network surveillance, 2001), Teletech Holdings (customer management services), and HRL Laboratories (private research and development, 2004). He is Chairman of the General Motors Technology Advisory Committee and a Life Fellow of the Institute of Electrical and Electronics Engineers (IEEE) (2000). Dr. Heilmeier is a member of the Defense Science Board and the National Security Agency Advisory Board. He is also a member of the National Academy of Engineering, the American Academy of Arts and Sciences, and the Board of Overseers of the School of Engineering and Applied Science of the University of Pennsylvania. Previously, Dr. Heilmeier served as a Director of TRW Inc. (automotive, space, defense, and information technology, 1992-2002), Compaq (1994-2002), and Automatic Data Processing, Inc. (ADP) (technology-based business outsourcing, 1995-2002). |
Marie L. Knowles (58) |
| Year of Election or Appointment: 2001 Prior to Ms. Knowles' retirement in June 2000, she served as Executive Vice President and Chief Financial Officer of Atlantic Richfield Company (ARCO) (diversified energy, 1996-2000). From 1993 to 1996, she was a Senior Vice President of ARCO and President of ARCO Transportation Company. She served as a Director of ARCO from 1996 to 1998. She currently serves as a Director of Phelps Dodge Corporation (copper mining and manufacturing) and McKesson Corporation (healthcare service, 2002). Ms. Knowles is a Trustee of the Brookings Institution and the Catalina Island Conservancy and also serves as a member of the Advisory Board for the School of Engineering of the University of Southern California. |
Ned C. Lautenbach (60) |
| Year of Election or Appointment: 2000 Mr. Lautenbach has been a partner of Clayton, Dubilier & Rice, Inc. (private equity investment firm) since September 1998. Previously, Mr. Lautenbach was with the International Business Machines Corporation (IBM) from 1968 until his retirement in 1998. He was most recently Senior Vice President and Group Executive of Worldwide Sales and Services. From 1993 to 1995, he was Chairman of IBM World Trade Corporation, and from 1994 to 1998 was a member of IBM's Corporate Executive Committee. Mr. Lautenbach serves as Co-Chairman and a Director of Covansys, Inc. (global provider of business and technology solutions, 2000). In addition, he is a Director of Italtel Holding S.p.A. (telecommunications (Milan, Italy), 2004) and Eaton Corporation (diversified industrial) as well as the Philharmonic Center for the Arts in Naples, Florida (1999). He also is a member of the Council on Foreign Relations. |
Marvin L. Mann (71) |
| Year of Election or Appointment: 1993 Mr. Mann is Chairman of the non-interested Trustees (2001). He is Chairman Emeritus of Lexmark International, Inc. (computer peripherals), where he served as CEO until April 1998, retired as Chairman May 1999, and remains a member of the Board. Prior to 1991, he held the positions of Vice President of International Business Machines Corporation (IBM) and President and General Manager of various IBM divisions and subsidiaries. He is a member of the Executive Committee of the Independent Director's Council of the Investment Company Institute. In addition, Mr. Mann is a member of the President's Cabinet at the University of Alabama and the Board of Visitors of the Culverhouse College of Commerce and Business Administration at the University of Alabama. |
William O. McCoy (71) |
| Year of Election or Appointment: 1997 Prior to his retirement in December 1994, Mr. McCoy was Vice Chairman of the Board of BellSouth Corporation (telecommunications) and President of BellSouth Enterprises. He is currently a Director of Liberty Corporation (holding company), Duke Realty Corporation (real estate), and Progress Energy, Inc. (electric utility). He is also a partner of Franklin Street Partners (private investment management firm) and a member of the Research Triangle Foundation Board. In addition, Mr. McCoy served as the Interim Chancellor (1999-2000) and a member of the Board of Visitors (1994-1998) for the University of North Carolina at Chapel Hill and currently serves on the Board of Directors of the University of North Carolina Health Care System and the Board of Visitors of the Kenan-Flagler Business School (University of North Carolina at Chapel Hill). He also served as Vice President of Finance for the University of North Carolina (16-school system, 1995-1998). |
Cornelia M. Small (60) |
| Year of Election or Appointment: 2005 Ms. Small is a member (2000) and Chairperson (2002) of the Investment Committee, and a member (2002) of the Board of Trustees of Smith College. Previously, she served as Chief Investment Officer (1999-2000), Director of Global Equity Investments (1996-1999), and a member of the Board of Directors of Scudder, Stevens & Clark (1990-1997) and Scudder Kemper Investments (1997-1998). In addition, Ms. Small served as Co-Chair (2000-2003) of the Annual Fund for the Fletcher School of Law and Diplomacy. |
William S. Stavropoulos (65) |
| Year of Election or Appointment: 2001 Mr. Stavropoulos is Chairman of the Board (2000), CEO (2002), a position he previously held from 1995-2000, Chairman of the Executive Committee (2000), and a Member of the Board of Directors of The Dow Chemical Company. Since joining The Dow Chemical Company in 1967, Mr. Stavropoulos served in numerous senior management positions, including President (1993-2000; 2002-2003). Currently, he is a Director of NCR Corporation (data warehousing and technology solutions), BellSouth Corporation (telecommunications), Chemical Financial Corporation, and Maersk Inc. (industrial conglomerate, 2002). He also serves as a member of the Board of Trustees of the American Enterprise Institute for Public Policy Research. In addition, Mr. Stavropoulos is a member of The Business Council, J.P. Morgan International Council and the University of Notre Dame Advisory Council for the College of Science. |
Kenneth L. Wolfe (65) |
| Year of Election or Appointment: 2005 Mr. Wolfe also serves as a Trustee (2005) or Member of the Advisory Board (2004) of other investment companies advised by FMR. Prior to his retirement in 2001, Mr. Wolfe was Chairman and Chief Executive Officer of Hershey Foods Corporation (1993-2001). He currently serves as a member of the boards of Adelphia Communications Corporation (2003), Bausch & Lomb, Inc., and Revlon Inc. (2004). |
Annual Report
Trustees and Officers - continued
Advisory Board Member and Executive Officers:
Correspondence intended for each executive officer and Mr. Lynch may be sent to Fidelity Investments, 82 Devonshire Street, Boston, Massachusetts 02109.
Name, Age; Principal Occupation |
Peter S. Lynch (61) |
| Year of Election or Appointment: 2003 Member of the Advisory Board of Variable Insurance Products Fund. Vice Chairman and a Director of FMR, and Vice Chairman (2001) and a Director (2000) of FMR Co., Inc. Previously, Mr. Lynch served as a Trustee of the Fidelity funds (1990-2003). Prior to May 31, 1990, he was a Director of FMR and Executive Vice President of FMR (a position he held until March 31, 1991), Vice President of Fidelity® Magellan® Fund and FMR Growth Group Leader, and Managing Director of FMR Corp. Mr. Lynch was also Vice President of Fidelity Investments Corporate Services. In addition, he serves as a Trustee of Boston College, Massachusetts Eye & Ear Infirmary, Historic Deerfield, John F. Kennedy Library, and the Museum of Fine Arts of Boston. |
John B. McDowell (46) |
| Year of Election or Appointment: 2002 Vice President of VIP Growth. Mr. McDowell also serves as Vice President of certain Equity Funds (2002). He is Senior Vice President of FMR (1999), FMR Co., Inc. (2001), and Fidelity Management Trust Company (FMTC). Since joining Fidelity Investments in 1985, Mr. McDowell has worked as a research analyst and manager. |
Jennifer Uhrig (43) |
| Year of Election or Appointment: 1997 Vice President of VIP Growth. Ms. Uhrig also serves as Vice President of another fund advised by FMR. Prior to assuming her current responsibilities, Ms. Uhrig managed a variety of Fidelity funds. |
Eric D. Roiter (56) |
| Year of Election or Appointment: 1998 Secretary of VIP Growth. He also serves as Secretary of other Fidelity funds; Vice President, General Counsel, and Secretary of FMR Co., Inc. (2001-present) and FMR; Vice President and Secretary of FDC; Assistant Secretary of Fidelity Management & Research (U.K.) Inc. (2001-present), Fidelity Management & Research (Far East) Inc. (2001-present), and of Fidelity Investments Money Management, Inc. (2001-present). Mr. Roiter is an Adjunct Member, Faculty of Law, at Boston College Law School (2003-present). |
Stuart Fross (45) |
| Year of Election or Appointment: 2003 Assistant Secretary of VIP Growth. Mr. Fross also serves as Assistant Secretary of other Fidelity funds (2003) and is an employee of FMR. |
Christine Reynolds (46) |
| Year of Election or Appointment: 2004 President, Treasurer, and Anti-Money Laundering (AML) officer of VIP Growth. Ms. Reynolds also serves as President, Treasurer, and AML officer of other Fidelity funds (2004) and is a Vice President (2003) and an employee (2002) of FMR. Before joining Fidelity Investments, Ms. Reynolds worked at PricewaterhouseCoopers LLP (PwC) (1980-2002), where she was most recently an audit partner with PwC's investment management practice. |
Timothy F. Hayes (54) |
| Year of Election or Appointment: 2002 Chief Financial Officer of VIP Growth. Mr. Hayes also serves as Chief Financial Officer of other Fidelity funds (2002). Recently he was appointed President of Fidelity Service Company (2003) where he also serves as a Director. Mr. Hayes also serves as President of Fidelity Investments Operations Group (FIOG, 2002), which includes Fidelity Pricing and Cash Management Services Group (FPCMS), where he was appointed President in 1998. Previously, Mr. Hayes served as Chief Financial Officer of Fidelity Investments Corporate Systems and Service Group (1998) and Fidelity Systems Company (1997-1998). |
Kenneth A. Rathgeber (57) |
| Year of Election or Appointment: 2004 Chief Compliance Officer of VIP Growth. Mr. Rathgeber also serves as Chief Compliance Officer of other Fidelity funds (2004) and Executive Vice President of Risk Oversight for Fidelity Investments (2002). Previously, he served as Executive Vice President and Chief Operating Officer for Fidelity Investments Institutional Services Company, Inc. (1998-2002). |
John R. Hebble (46) |
| Year of Election or Appointment: 2003 Deputy Treasurer of VIP Growth. Mr. Hebble also serves as Deputy Treasurer of other Fidelity funds (2003), and is an employee of FMR. Before joining Fidelity Investments, Mr. Hebble worked at Deutsche Asset Management where he served as Director of Fund Accounting (2002-2003) and Assistant Treasurer of the Scudder Funds (1998-2003). |
Kimberley H. Monasterio (41) |
| Year of Election or Appointment: 2004 Deputy Treasurer of VIP Growth. Ms. Monasterio also serves as Deputy Treasurer of other Fidelity funds (2004) and is an employee of FMR (2004). Before joining Fidelity Investments, Ms. Monasterio served as Treasurer (2000-2004) and Chief Financial Officer (2002-2004) of the Franklin Templeton Funds and Senior Vice President of Franklin Templeton Services, LLC (2000-2004). |
John H. Costello (58) |
| Year of Election or Appointment: 1986 Assistant Treasurer of VIP Growth. Mr. Costello also serves as Assistant Treasurer of other Fidelity funds and is an employee of FMR. |
Peter L. Lydecker (50) |
| Year of Election or Appointment: 2004 Assistant Treasurer of VIP Growth. Mr. Lydecker also serves as Assistant Treasurer of other Fidelity funds (2004) and is an employee of FMR. |
Mark Osterheld (49) |
| Year of Election or Appointment: 2002 Assistant Treasurer of VIP Growth. Mr. Osterheld also serves as Assistant Treasurer of other Fidelity funds (2002) and is an employee of FMR. |
Kenneth B. Robins (35) |
| Year of Election or Appointment: 2004 Assistant Treasurer of VIP Growth. Mr. Robins also serves as Assistant Treasurer of other Fidelity funds (2004) and is an employee of FMR (2004). Before joining Fidelity Investments, Mr. Robins worked at KPMG LLP, where he was a partner in KPMG's department of professional practice (2002-2004) and a Senior Manager (1999-2000). In addition, Mr. Robins served as Assistant Chief Accountant, United States Securities and Exchange Commission (2000-2002). |
Annual Report
Distributions
A percentage of the dividends distributed during the fiscal year for the following classes qualifies for the dividends-received deduction for corporate shareholders:
Initial Class | 100% |
Service Class | 100% |
Service Class 2 | 100% |
Service Class 2R | 100% |
The fund will notify shareholders in January 2005 of amounts for use in preparing 2004 income tax returns.
Annual Report
Proxy Voting Results
A special meeting of the fund's shareholders was held on December 14, 2004. The results of votes taken among shareholders on proposals before them are reported below. Each vote reported represents one dollar of net asset value held on the record date for the meeting.
PROPOSAL 1 |
To amend the Declaration of Trust to allow the Board of Trustees, if permitted by applicable law, to authorize fund mergers without shareholder approval. A |
| # of
Votes | % of
Votes |
Affirmative | 15,331,508,529.96 | 81.853 |
Against | 2,429,553,894.02 | 12.972 |
Abstain | 969,378,618.94 | 5.175 |
TOTAL | 18,730,441,042.92 | 100.000 |
PROPOSAL 2 |
To elect a Board of Trustees. A |
| # of
Votes | % of
Votes |
J. Michael Cook |
Affirmative | 17,770,642,454.98 | 94.876 |
Withheld | 959,798,587.94 | 5.124 |
TOTAL | 18,730,441,042.92 | 100.000 |
Ralph F. Cox |
Affirmative | 17,759,356,374.26 | 94.815 |
Withheld | 971,084,668.66 | 5.185 |
TOTAL | 18,730,441,042.92 | 100.000 |
Laura B. Cronin |
Affirmative | 17,797,888,742.24 | 95.021 |
Withheld | 932,552,300.68 | 4.979 |
TOTAL | 18,730,441,042.92 | 100.000 |
Dennis J. DirksB |
Affirmative | 17,802,602,074.45 | 95.046 |
Withheld | 927,838,968.47 | 4.954 |
TOTAL | 18,730,441,042.92 | 100.000 |
Robert M. Gates |
Affirmative | 17,784,855,823.58 | 94.952 |
Withheld | 945,585,219.34 | 5.048 |
TOTAL | 18,730,441,042.92 | 100.000 |
George H. Heilmeier |
Affirmative | 17,768,875,556.56 | 94.866 |
Withheld | 961,565,486.36 | 5.134 |
TOTAL | 18,730,441,042.92 | 100.000 |
Abigail P. Johnson |
Affirmative | 17,781,929,073.06 | 94.936 |
Withheld | 948,511,969.86 | 5.064 |
TOTAL | 18,730,441,042.92 | 100.000 |
Edward C. Johnson 3d |
Affirmative | 17,752,140,336.45 | 94.777 |
Withheld | 978,300,706.47 | 5.223 |
TOTAL | 18,730,441,042.92 | 100.000 |
Donald J. Kirk |
Affirmative | 17,772,467,361.45 | 94.885 |
Withheld | 957,973,681.47 | 5.115 |
TOTAL | 18,730,441,042.92 | 100.000 |
| # of
Votes | % of
Votes |
Marie L. Knowles |
Affirmative | 17,776,922,254.30 | 94.909 |
Withheld | 953,518,788.62 | 5.091 |
TOTAL | 18,730,441,042.92 | 100.000 |
Ned C. Lautenbach |
Affirmative | 17,804,221,564.95 | 95.055 |
Withheld | 926,219,477.97 | 4.945 |
TOTAL | 18,730,441,042.92 | 100.000 |
Marvin L. Mann |
Affirmative | 17,763,277,607.06 | 94.836 |
Withheld | 967,163,435.86 | 5.164 |
TOTAL | 18,730,441,042.92 | 100.000 |
William O. McCoy |
Affirmative | 17,758,560,162.11 | 94.811 |
Withheld | 971,880,880.81 | 5.189 |
TOTAL | 18,730,441,042.92 | 100.000 |
Robert L. Reynolds |
Affirmative | 17,806,026,904.06 | 95.065 |
Withheld | 924,414,138.86 | 4.935 |
TOTAL | 18,730,441,042.92 | 100.000 |
Cornelia M. SmallB |
Affirmative | 17,798,878,892.31 | 95.026 |
Withheld | 931,562,150.61 | 4.974 |
TOTAL | 18,730,441,042.92 | 100.000 |
William S. Stavropoulos |
Affirmative | 17,786,496,107.78 | 94.960 |
Withheld | 943,944,935.14 | 5.040 |
TOTAL | 18,730,441,042.92 | 100.000 |
PROPOSAL 3 |
To approve a new sub-advisory agreement among FMR, FMR U.K., and Variable Insurance Products Fund on behalf of the fund. |
| # of
Votes | % of
Votes |
Affirmative | 5,975,028,070.83 | 88.802 |
Against | 315,998,524.66 | 4.696 |
Abstain | 437,489,754.25 | 6.502 |
TOTAL | 6,728,516,349.74 | 100.000 |
PROPOSAL 4 |
To approve a new sub-advisory agreement among FMR, FMR Far East, and Variable Insurance Products Fund on behalf of the fund. |
| # of
Votes | % of
Votes |
Affirmative | 5,967,060,487.85 | 88.683 |
Against | 322,604,636.29 | 4.795 |
Abstain | 438,851,225.60 | 6.522 |
TOTAL | 6,728,516,349.74 | 100.000 |
PROPOSAL 5 |
To approve a new amended and restated sub-advisory agreement between FMR Far East and FIJ for the fund. |
| # of
Votes | % of
Votes |
Affirmative | 5,952,404,198.80 | 88.465 |
Against | 333,946,456.42 | 4.963 |
Abstain | 442,165,694.52 | 6.572 |
TOTAL | 6,728,516,349.74 | 100.000 |
PROPOSAL 6 |
To approve a new master international research agreement between FMR and FIIA on behalf of the fund. |
| # of
Votes | % of
Votes |
Affirmative | 5,970,554,038.68 | 88.735 |
Against | 321,092,817.96 | 4.772 |
Abstain | 436,869,493.10 | 6.493 |
TOTAL | 6,728,516,349.74 | 100.000 |
PROPOSAL 7 |
To approve a new sub-research agreement between FIIA and FIIA (U.K.)L on behalf of the fund. |
| # of
Votes | % of
Votes |
Affirmative | 5,968,891,984.81 | 88.710 |
Against | 319,296,673.74 | 4.746 |
Abstain | 440,327,691.19 | 6.544 |
TOTAL | 6,728,516,349.74 | 100.000 |
PROPOSAL 8 |
To approve a new sub-research agreement between FIIA and FIJ on behalf of the fund. |
| # of
Votes | % of
Votes |
Affirmative | 5,979,761,945.37 | 88.872 |
Against | 322,291,647.58 | 4.790 |
Abstain | 426,462,756.79 | 6.338 |
TOTAL | 6,728,516,349.74 | 100.000 |
PROPOSAL 9 |
To amend the fund's fundamental investment limitation concerning borrowing. |
| # of
Votes | % of
Votes |
Affirmative | 5,946,204,016.89 | 88.373 |
Against | 412,358,112.36 | 6.129 |
Abstain | 369,954,220.49 | 5.498 |
TOTAL | 6,728,516,349.74 | 100.000 |
PROPOSAL 10 |
To amend the fund's fundamental investment limitation concerning lending. |
| # of
Votes | % of
Votes |
Affirmative | 5,843,159,022.83 | 86.842 |
Against | 468,598,250.73 | 6.964 |
Abstain | 416,759,076.18 | 6.194 |
TOTAL | 6,728,516,349.74 | 100.000 |
A Denotes trust-wide proposals and voting results. B Effective January 1, 2005. |
Growth Portfolio
Annual Report
Growth Portfolio
Annual Report
Investment Adviser
Fidelity Management & Research Company
Boston, MA
Investment Sub-Adviser
FMR Co., Inc.
General Distributor
Fidelity Distributors Corporation
Boston, MA
Transfer and Shareholder Servicing Agent
Fidelity Investments Institutional Operations Company, Inc.
Boston, MA
Custodian
Mellon Bank, N.A.
Pittsburgh, PA
VIPGRWT-ANN-0205
1.540077.107
Fidelity® Variable Insurance Products:
Growth Portfolio - Service Class 2R
Annual Report
December 31, 2004
(2_fidelity_logos) (Registered_Trademark)
Contents
Performance | 3 | How the fund has done over time. |
Management's Discussion | 4 | The manager's review of fund performance, strategy and outlook. |
Shareholder Expense Example | 5 | An example of shareholder expenses. |
Investment Summary | 6 | A summary of the fund's investments at period end. |
Investments | 7 | A complete list of the fund's investments with their
market values. |
Financial Statements | 12 | Statements of assets and liabilities, operations, and
changes in net assets, as well as financial highlights. |
Notes | 16 | Notes to the financial statements. |
Report of Independent Registered Public Accounting Firm | 20 | |
Trustees and Officers | 21 | |
Distributions | 26 | |
Proxy Voting Results | 27 | |
| | |
To view a fund's proxy voting guidelines and proxy voting record for the 12-month period ended June 30, visit www.fidelity.com/proxyvotingresults or visit the Securities and Exchange Commission's (SEC) web site at www.sec.gov. You may also call 1-800-544-5429 to request a free copy of the proxy voting guidelines.
Fidelity Variable Insurance Products are separate account options which are purchased through a variable insurance contract.
Standard & Poor's, S&P and S&P 500 are registered service marks of The McGraw-Hill Companies, Inc. and have been licensed for use by Fidelity Distributors Corporation.
Other third party marks appearing herein are the property of their respective owners.
All other marks appearing herein are registered or unregistered trademarks or service marks of FMR Corp. or an affiliated company.
(Recycle graphic) This report is printed on recycled paper using soy-based inks.
This report and the financial statements contained herein are submitted for the general information of the shareholders of the fund. This report is not authorized for distribution to prospective investors in the fund unless preceded or accompanied by an effective prospectus.
A fund files its complete schedule of portfolio holdings with the SEC for the first and third quarters of each fiscal year on Form N-Q. Forms N-Q are available on the SEC's web site at http://www.sec.gov. A fund's Forms N-Q may be reviewed and copied at the SEC's Public Reference Room in Washington, DC. Information regarding the operation of the SEC's Public Reference Room may be obtained by calling 1-800-SEC-0330. For a complete list of a fund's portfolio holdings, view the most recent quarterly holdings report, semiannual report, or annual report on Fidelity's web site at http://www.advisor.fidelity.com.
NOT FDIC INSURED · MAY LOSE VALUE · NO BANK GUARANTEE
Neither the fund nor Fidelity Distributors Corporation is a bank.
Growth Portfolio
Fidelity Variable Insurance Products: Growth Portfolio - Service Class 2R
Performance: The Bottom Line
Average annual total return reflects the change in the value of an investment, assuming reinvestment of a class' dividend income and capital gains (the profits earned upon the sale of securities that have grown in value) and assuming a constant rate of performance each year. During periods of reimbursement by Fidelity, a fund's total return will be greater than it would be had the reimbursement not occurred. Performance numbers are net of all underlying fund operating expenses, but do not include any insurance charges imposed by your insurance company's separate account. If performance information included the effect of these additional charges, the total returns would be lower. How a fund did yesterday is no guarantee of how it will do tomorrow.
Average Annual Total Returns
Periods ended December 31, 2004 | Past 1
year | Past 5
years | Past 10
years |
Fidelity® VIP: Growth - Service Class 2RA | 3.10% | -7.04% | 9.80% |
A The initial offering of Service Class 2R shares took place on April 24, 2002. Performance for Service Class 2R shares reflects an asset-based service fee (12b-1 fee). Returns from January 12, 2000 to April 24, 2002 are those of Service Class 2. Returns from November 3, 1997 to January 12, 2000 are those of Service Class, which reflect a different 12b-1 fee. Service Class 2R returns prior to November 3, 1997 are those of Initial Class and do not include the effects of a 12b-1 fee. Had Service Class 2R's 12b-1 fee been reflected, returns prior to January 12, 2000 would have been lower.
$10,000 Over 10 Years
Let's say hypothetically that $10,000 was invested in Fidelity® Variable Insurance Products: Growth Portfolio - Service Class 2R on December 31, 1994. The chart shows how the value of your investment would have changed, and also shows how the Russell 3000® Growth Index performed over the same period.
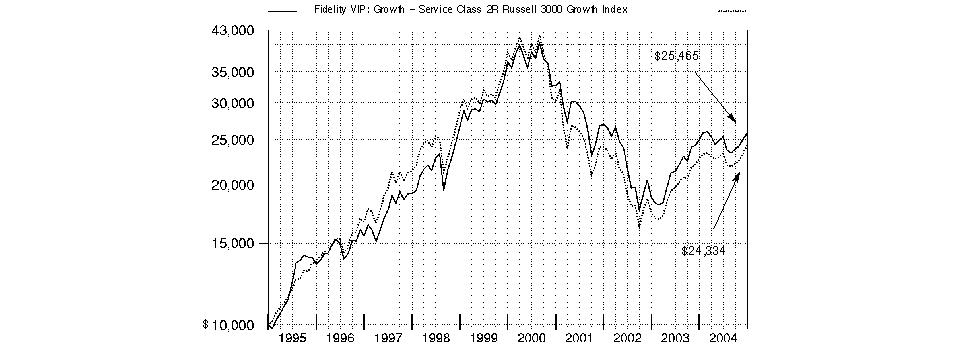
Annual Report
Fidelity Variable Insurance Products: Growth Portfolio
Management's Discussion of Fund Performance
Comments from Jennifer Uhrig, Portfolio Manager of Fidelity® Variable Insurance Products: Growth Portfolio
The year ending December 31, 2004, generally was positive for equity investors, as many stock market benchmarks produced double-digit gains. Broad-based themes included the continued dominance of small-cap stocks, which outperformed large-caps for the sixth consecutive year. The small-cap Russell 2000® Index was up 18.33% in 2004, while the larger-cap Standard & Poor's 500SM Index rose 10.88%. Value stocks ended the year well ahead of growth stocks: The Russell 3000® Value Index advanced 16.94%, compared to 6.93% for the Russell 3000 Growth Index. Energy and basic materials stocks led the market upward. Energy stocks were boosted by record-high oil prices, while strong demand from China helped support commodity prices. The health care sector was among the market's weakest performers. Technology also fell off the pace, though it was helped by a rally late in the year. The tech-heavy NASDAQ Composite® Index returned 9.15%, thanks primarily to a 14.87% jump in the fourth quarter. Elsewhere, the Dow Jones Industrial AverageSM gained 5.37% for the year.
For the 12 months that ended December 31, 2004, the fund lagged both the LipperSM Variable Annuity Growth Funds Average, which gained 10.36%, and the Russell 3000 Growth Index. The fund's large overweighting compared with the index in the semiconductor industry accounted for most of the drag on performance. Capacity outgrew demand for semiconductors during the period, which compressed the earnings and stock prices of many companies within the group. Among those hardest hit were fund holdings ASML Holding, Agere Systems, Teradyne and Intersil, as well as the fund's biggest detractor, Synopsys, which makes software for designing chips. Performance also was hurt by the fund's focus on large-cap growth companies at a time when smaller-cap, value-oriented stocks were generally performing better. On the positive side, wireless communications stocks, such as Ericsson and QUALCOMM, and energy services companies, such as Halliburton, helped boost relative performance. The fund no longer holds Ericsson stock.
The views expressed in this statement reflect those of the portfolio manager only through the end of the period of the report as stated on the cover and do not necessarily represent the views of Fidelity or any other person in the Fidelity organization. Any such views are subject to change at any time based upon market or other conditions and Fidelity disclaims any responsibility to update such views. These views may not be relied on as investment advice and, because investment decisions for a Fidelity fund are based on numerous factors, may not be relied on as an indication of trading intent on behalf of any Fidelity fund.
Growth Portfolio
Fidelity Variable Insurance Products: Growth Portfolio
Shareholder Expense Example
As a shareholder of the Fund, you incur two types of costs: (1) transaction costs, including redemption fees, and (2) ongoing costs, including management fees, distribution and/or service (12b-1) fees and other Fund expenses. This Example is intended to help you understand your ongoing costs (in dollars) of investing in the Fund and to compare these costs with the ongoing costs of investing in other mutual funds.
The Example is based on an investment of $1,000 invested at the beginning of the period and held for the entire period (July 1, 2004 to December 31, 2004).
Actual Expenses
The first line of the table below for each class of the Fund provides information about actual account values and actual expenses. You may use the information in this line, together with the amount you invested, to estimate the expenses that you paid over the period. Simply divide your account value by $1,000.00 (for example, an $8,600 account value divided by $1,000.00 = 8.6), then multiply the result by the number in the first line for a class of the Fund under the heading entitled "Expenses Paid During Period" to estimate the expenses you paid on your account during this period. The estimate of expenses does not include any fees or other expenses of any variable annuity or variable life insurance product. If they were, the estimate of expenses you paid during the period would be higher, and your ending account value would be lower.
Hypothetical Example for Comparison Purposes
The second line of the table below for each class of the Fund provides information about hypothetical account values and hypothetical expenses based on a Class' actual expense ratio and an assumed rate of return of 5% per year before expenses, which is not the Class' actual return. The hypothetical account values and expenses may not be used to estimate the actual ending account balance or expenses you paid for the period. You may use this information to compare the ongoing costs of investing in the Fund and other funds. To do so, compare this 5% hypothetical example with the 5% hypothetical examples that appear in the shareholder reports of the other funds. The estimate of expenses does not include any fees or other expenses of any variable annuity or variable life insurance product. If they were, the estimate of expenses you paid during the period would be higher, and your ending account value would be lower.
Please note that the expenses shown in the table are meant to highlight your ongoing costs only and do not reflect any transaction costs. Therefore, the second line of the table is useful in comparing ongoing costs only, and will not help you determine the relative total costs of owning different funds. In addition, if these transactional costs were included, your costs would have been higher.
| Beginning
Account Value
July 1, 2004 | Ending
Account Value
December 31, 2004 | Expenses Paid
During Period*
July 1, 2004
to December 31, 2004 |
Initial Class | | | |
Actual | $ 1,000.00 | $ 1,018.80 | $ 3.55 |
HypotheticalA | $ 1,000.00 | $ 1,021.62 | $ 3.56 |
Service Class | | | |
Actual | $ 1,000.00 | $ 1,018.20 | $ 4.06 |
HypotheticalA | $ 1,000.00 | $ 1,021.11 | $ 4.06 |
Service Class 2 | | | |
Actual | $ 1,000.00 | $ 1,017.40 | $ 4.82 |
HypotheticalA | $ 1,000.00 | $ 1,020.36 | $ 4.82 |
Service Class 2R | | | |
Actual | $ 1,000.00 | $ 1,017.40 | $ 4.82 |
HypotheticalA | $ 1,000.00 | $ 1,020.36 | $ 4.82 |
A 5% return per year before expenses
* Expenses are equal to each Class' annualized expense ratio (shown in the table below); multiplied by the average account value over the period, multiplied by 184/366 (to reflect the one-half year period).
| Annualized
Expense Ratio |
Initial Class | .70% |
Service Class | .80% |
Service Class 2 | .95% |
Service Class 2R | .95% |
Annual Report
Fidelity Variable Insurance Products: Growth Portfolio
Investment Summary
Top Five Stocks as of December 31, 2004 |
| % of fund's net assets |
Johnson & Johnson | 2.8 |
Microsoft Corp. | 2.6 |
Intel Corp. | 2.6 |
Wal-Mart Stores, Inc. | 2.5 |
Dell, Inc. | 2.2 |
| 12.7 |
Top Five Market Sectors as of December 31, 2004 |
| % of fund's net assets |
Information Technology | 34.5 |
Health Care | 19.4 |
Consumer Discretionary | 12.2 |
Industrials | 11.3 |
Financials | 9.0 |
Asset Allocation as of December 31, 2004 |
% of fund's net assets* |
 | Stocks | 99.3% | |
 | Short-Term Investments and Net Other Assets | 0.7% | |
* Foreign investments | 8.8% | |
Growth Portfolio
Fidelity Variable Insurance Products: Growth Portfolio
Investments December 31, 2004
Showing Percentage of Net Assets
Common Stocks - 99.3% |
| Shares | | Value (Note 1) |
CONSUMER DISCRETIONARY - 12.2% |
Automobiles - 0.2% |
Harley-Davidson, Inc. | 396,200 | | $ 24,069,150 |
Hotels, Restaurants & Leisure - 1.4% |
Carnival Corp. unit | 403,100 | | 23,230,653 |
Hilton Group PLC | 1,886,329 | | 10,298,785 |
McDonald's Corp. | 1,433,200 | | 45,948,392 |
Rank Group PLC | 2,796,306 | | 14,166,903 |
Royal Caribbean Cruises Ltd. | 419,600 | | 22,843,024 |
Starbucks Corp. (a) | 391,800 | | 24,432,648 |
| | 140,920,405 |
Household Durables - 0.2% |
Tempur-Pedic International, Inc. | 694,300 | | 14,719,160 |
Internet & Catalog Retail - 1.7% |
eBay, Inc. (a) | 1,156,600 | | 134,489,448 |
IAC/InterActiveCorp (a) | 1,342,784 | | 37,087,694 |
| | 171,577,142 |
Media - 2.6% |
E.W. Scripps Co. Class A | 839,400 | | 40,526,232 |
Fox Entertainment Group, Inc.
Class A (a) | 1,554,900 | | 48,606,174 |
Getty Images, Inc. (a) | 163,400 | | 11,250,090 |
Lamar Advertising Co. Class A (a) | 948,560 | | 40,579,397 |
News Corp.: | | | |
Class A | 657,722 | | 12,273,093 |
Class B | 1,149,000 | | 22,060,800 |
Pixar (a) | 147,632 | | 12,638,776 |
SBS Broadcasting SA (a) | 195,400 | | 7,860,942 |
Walt Disney Co. | 2,128,400 | | 59,169,520 |
| | 254,965,024 |
Multiline Retail - 1.5% |
Dollar Tree Stores, Inc. (a) | 1,235,300 | | 35,428,404 |
Family Dollar Stores, Inc. | 697,900 | | 21,795,417 |
Fred's, Inc. Class A (d) | 940,644 | | 16,367,206 |
Kohl's Corp. (a) | 90,900 | | 4,469,553 |
Nordstrom, Inc. | 728,500 | | 34,042,805 |
Saks, Inc. | 2,822,700 | | 40,957,377 |
| | 153,060,762 |
Specialty Retail - 4.2% |
Bed Bath & Beyond, Inc. (a) | 751,500 | | 29,932,245 |
Best Buy Co., Inc. | 547,800 | | 32,550,276 |
Circuit City Stores, Inc. | 997,800 | | 15,605,592 |
Foot Locker, Inc. | 1,273,980 | | 34,308,281 |
Home Depot, Inc. | 4,575,900 | | 195,573,966 |
RadioShack Corp. | 605,800 | | 19,918,704 |
Staples, Inc. | 1,512,900 | | 50,999,859 |
Weight Watchers International, Inc. (a)(d) | 856,000 | | 35,155,920 |
| | 414,044,843 |
|
| Shares | | Value (Note 1) |
Textiles, Apparel & Luxury Goods - 0.4% |
NIKE, Inc. Class B | 443,100 | | $ 40,184,739 |
TOTAL CONSUMER DISCRETIONARY | | 1,213,541,225 |
CONSUMER STAPLES - 7.0% |
Beverages - 1.7% |
PepsiCo, Inc. | 3,041,000 | | 158,740,200 |
The Coca-Cola Co. | 241,100 | | 10,036,993 |
| | 168,777,193 |
Food & Staples Retailing - 2.8% |
Wal-Mart Stores, Inc. | 4,638,700 | | 245,016,134 |
Walgreen Co. | 883,400 | | 33,896,058 |
| | 278,912,192 |
Food Products - 0.9% |
Archer-Daniels-Midland Co. | 1,765,300 | | 39,383,843 |
Bunge Ltd. | 739,300 | | 42,147,493 |
Corn Products International, Inc. | 185,400 | | 9,930,024 |
| | 91,461,360 |
Household Products - 1.1% |
Procter & Gamble Co. | 2,016,420 | | 111,064,414 |
Personal Products - 0.5% |
Gillette Co. | 965,400 | | 43,230,612 |
TOTAL CONSUMER STAPLES | | 693,445,771 |
ENERGY - 4.4% |
Energy Equipment & Services - 4.0% |
Baker Hughes, Inc. | 1,796,470 | | 76,655,375 |
BJ Services Co. | 238,760 | | 11,111,890 |
Halliburton Co. | 2,737,100 | | 107,403,804 |
National-Oilwell, Inc. (a) | 902,900 | | 31,863,341 |
Schlumberger Ltd. (NY Shares) | 1,511,400 | | 101,188,230 |
Smith International, Inc. (a) | 452,400 | | 24,615,084 |
Transocean, Inc. (a) | 305,700 | | 12,958,623 |
Weatherford International Ltd. (a) | 611,740 | | 31,382,262 |
| | 397,178,609 |
Oil & Gas - 0.4% |
Noble Energy, Inc. | 129,100 | | 7,960,306 |
Premcor, Inc. | 363,500 | | 15,328,795 |
Valero Energy Corp. | 344,100 | | 15,622,140 |
| | 38,911,241 |
TOTAL ENERGY | | 436,089,850 |
FINANCIALS - 9.0% |
Capital Markets - 2.0% |
E*TRADE Financial Corp. (a) | 2,495,400 | | 37,306,230 |
Goldman Sachs Group, Inc. | 507,400 | | 52,789,896 |
Lehman Brothers Holdings, Inc. | 352,400 | | 30,827,952 |
Merrill Lynch & Co., Inc. | 514,800 | | 30,769,596 |
Common Stocks - continued |
| Shares | | Value (Note 1) |
FINANCIALS - continued |
Capital Markets - continued |
Morgan Stanley | 383,000 | | $ 21,264,160 |
Nomura Holdings, Inc. | 1,782,000 | | 25,945,920 |
| | 198,903,754 |
Commercial Banks - 1.2% |
Bank of America Corp. | 1,536,100 | | 72,181,339 |
UCBH Holdings, Inc. | 965,900 | | 44,257,538 |
| | 116,438,877 |
Consumer Finance - 2.6% |
American Express Co. | 2,319,900 | | 130,772,763 |
Capital One Financial Corp. | 593,200 | | 49,953,372 |
MBNA Corp. | 2,766,130 | | 77,977,205 |
| | 258,703,340 |
Diversified Financial Services - 0.6% |
Citigroup, Inc. | 213,210 | | 10,272,458 |
J.P. Morgan Chase & Co. | 1,325,266 | | 51,698,627 |
| | 61,971,085 |
Insurance - 1.9% |
AFLAC, Inc. | 471,920 | | 18,801,293 |
American International Group, Inc. | 2,575,166 | | 169,111,151 |
XL Capital Ltd. Class A | 53,100 | | 4,123,215 |
| | 192,035,659 |
Thrifts & Mortgage Finance - 0.7% |
Fannie Mae | 863,600 | | 61,496,956 |
New York Community Bancorp, Inc. | 447,500 | | 9,205,075 |
| | 70,702,031 |
TOTAL FINANCIALS | | 898,754,746 |
HEALTH CARE - 19.4% |
Biotechnology - 3.9% |
Biogen Idec, Inc. (a) | 886,600 | | 59,056,426 |
Cephalon, Inc. (a) | 905,000 | | 46,046,400 |
CSL Ltd. | 873,467 | | 19,989,467 |
Eyetech Pharmaceuticals, Inc. | 366,200 | | 16,662,100 |
Genentech, Inc. (a) | 1,863,700 | | 101,459,828 |
Genzyme Corp. - General Division (a) | 550,900 | | 31,990,763 |
ImClone Systems, Inc. (a) | 697,300 | | 32,131,584 |
Millennium Pharmaceuticals, Inc. (a) | 2,608,956 | | 31,620,547 |
ONYX Pharmaceuticals, Inc. (a) | 485,100 | | 15,712,389 |
QLT, Inc. (a) | 393,000 | | 6,297,825 |
Tanox, Inc. (a) | 1,042,600 | | 15,847,520 |
Telik, Inc. (a) | 459,400 | | 8,792,916 |
| | 385,607,765 |
Health Care Equipment & Supplies - 4.6% |
Alcon, Inc. | 676,700 | | 54,542,020 |
Baxter International, Inc. | 2,321,100 | | 80,170,794 |
Beckman Coulter, Inc. | 311,400 | | 20,860,686 |
Becton, Dickinson & Co. | 1,006,000 | | 57,140,800 |
C.R. Bard, Inc. | 366,400 | | 23,442,272 |
|
| Shares | | Value (Note 1) |
Dade Behring Holdings, Inc. (a) | 477,400 | | $ 26,734,400 |
Medtronic, Inc. | 1,810,300 | | 89,917,601 |
Ocular Sciences, Inc. (a) | 304,900 | | 14,943,149 |
St. Jude Medical, Inc. (a) | 743,000 | | 31,153,990 |
Thermo Electron Corp. (a) | 242,400 | | 7,318,056 |
Waters Corp. (a) | 1,076,200 | | 50,355,398 |
| | 456,579,166 |
Health Care Providers & Services - 0.9% |
McKesson Corp. | 533,400 | | 16,780,764 |
UnitedHealth Group, Inc. | 883,900 | | 77,809,717 |
| | 94,590,481 |
Pharmaceuticals - 10.0% |
Abbott Laboratories | 1,880,200 | | 87,711,330 |
Allergan, Inc. | 655,950 | | 53,177,867 |
Barr Pharmaceuticals, Inc. (a) | 840,472 | | 38,275,095 |
Elan Corp. PLC sponsored ADR (a) | 950,500 | | 25,901,125 |
Eli Lilly & Co. | 358,470 | | 20,343,173 |
Johnson & Johnson | 4,464,720 | | 283,152,537 |
Pfizer, Inc. | 7,691,995 | | 206,837,746 |
Roche Holding AG (participation certificate) | 307,139 | | 35,095,439 |
Schering-Plough Corp. | 6,086,200 | | 127,079,856 |
Wyeth | 2,628,100 | | 111,930,779 |
| | 989,504,947 |
TOTAL HEALTH CARE | | 1,926,282,359 |
INDUSTRIALS - 11.3% |
Aerospace & Defense - 3.7% |
Bombardier, Inc. Class B (sub. vtg.) | 14,014,600 | | 27,795,623 |
EADS NV | 1,697,000 | | 49,241,178 |
Embraer - Empresa Brasileira de Aeronautica SA sponsored ADR | 1,492,210 | | 49,899,502 |
General Dynamics Corp. | 353,400 | | 36,965,640 |
Goodrich Corp. | 1,112,680 | | 36,317,875 |
Honeywell International, Inc. | 310,300 | | 10,987,723 |
Lockheed Martin Corp. | 969,520 | | 53,856,836 |
Precision Castparts Corp. | 529,674 | | 34,788,988 |
The Boeing Co. | 1,231,100 | | 63,734,047 |
| | 363,587,412 |
Air Freight & Logistics - 1.9% |
EGL, Inc. (a) | 150,900 | | 4,510,401 |
FedEx Corp. | 648,400 | | 63,860,916 |
Forward Air Corp. (a) | 107,700 | | 4,814,190 |
United Parcel Service, Inc. Class B | 1,263,100 | | 107,944,526 |
UTI Worldwide, Inc. | 143,400 | | 9,754,068 |
| | 190,884,101 |
Commercial Services & Supplies - 0.7% |
Apollo Group, Inc. Class A (a) | 157,400 | | 12,703,754 |
Common Stocks - continued |
| Shares | | Value (Note 1) |
INDUSTRIALS - continued |
Commercial Services & Supplies - continued |
Herman Miller, Inc. | 429,700 | | $ 11,872,611 |
Robert Half International, Inc. | 1,470,300 | | 43,270,929 |
| | 67,847,294 |
Industrial Conglomerates - 3.6% |
3M Co. | 1,187,100 | | 97,425,297 |
General Electric Co. | 5,144,640 | | 187,779,360 |
Siemens AG sponsored ADR | 428,300 | | 36,264,161 |
Tyco International Ltd. | 908,000 | | 32,451,920 |
| | 353,920,738 |
Machinery - 0.3% |
Joy Global, Inc. | 625,351 | | 27,158,994 |
Marine - 0.0% |
Alexander & Baldwin, Inc. | 11,700 | | 496,314 |
Road & Rail - 1.0% |
Burlington Northern Santa Fe Corp. | 707,700 | | 33,481,287 |
Norfolk Southern Corp. | 914,700 | | 33,102,993 |
Union Pacific Corp. | 533,700 | | 35,891,325 |
| | 102,475,605 |
Trading Companies & Distributors - 0.1% |
UAP Holding Corp. | 902,881 | | 15,592,755 |
TOTAL INDUSTRIALS | | 1,121,963,213 |
INFORMATION TECHNOLOGY - 34.5% |
Communications Equipment - 7.8% |
Alvarion Ltd. (a) | 863,500 | | 11,467,280 |
Andrew Corp. (a) | 1,803,300 | | 24,578,979 |
Avaya, Inc. (a) | 3,175,098 | | 54,611,686 |
Cisco Systems, Inc. (a) | 10,930,820 | | 210,964,826 |
Extreme Networks, Inc. (a) | 81,436 | | 533,406 |
F5 Networks, Inc. (a) | 368,600 | | 17,958,192 |
Foundry Networks, Inc. (a) | 1,743,200 | | 22,940,512 |
Harris Corp. | 872,000 | | 53,880,880 |
Juniper Networks, Inc. (a) | 2,616,000 | | 71,129,040 |
Motorola, Inc. | 5,886,150 | | 101,241,780 |
QUALCOMM, Inc. | 3,971,900 | | 168,408,560 |
Research In Motion Ltd. (a) | 408,390 | | 33,617,303 |
| | 771,332,444 |
Computers & Peripherals - 5.9% |
Apple Computer, Inc. (a) | 179,200 | | 11,540,480 |
Brocade Communications Systems, Inc. (a) | 2,962,000 | | 22,629,680 |
Dell, Inc. (a) | 5,261,460 | | 221,717,924 |
EMC Corp. (a) | 5,566,000 | | 82,766,420 |
International Business Machines Corp. | 821,370 | | 80,970,655 |
Lexmark International, Inc. Class A (a) | 707,200 | | 60,112,000 |
Network Appliance, Inc. (a) | 1,311,292 | | 43,561,120 |
QLogic Corp. (a) | 396,500 | | 14,563,445 |
|
| Shares | | Value (Note 1) |
Sun Microsystems, Inc. (a) | 6,336,150 | | $ 34,088,487 |
UNOVA, Inc. (a) | 680,300 | | 17,204,787 |
| | 589,154,998 |
Electronic Equipment & Instruments - 1.7% |
Amphenol Corp. Class A (a) | 506,582 | | 18,611,823 |
Arrow Electronics, Inc. (a) | 846,300 | | 20,565,090 |
Hon Hai Precision Industries Co. Ltd. | 6,438,842 | | 29,773,821 |
Mettler-Toledo International, Inc. (a) | 437,600 | | 22,453,256 |
Molex, Inc. | 703,200 | | 21,096,000 |
National Instruments Corp. | 1,210,629 | | 32,989,640 |
Solectron Corp. (a) | 4,272,300 | | 22,771,359 |
| | 168,260,989 |
Internet Software & Services - 1.3% |
Google, Inc. Class A | 299,700 | | 57,872,070 |
Yahoo!, Inc. (a) | 1,918,232 | | 72,278,982 |
| | 130,151,052 |
IT Services - 1.1% |
BearingPoint, Inc. (a) | 3,072,021 | | 24,668,329 |
First Data Corp. | 2,095,000 | | 89,121,300 |
| | 113,789,629 |
Office Electronics - 0.1% |
Zebra Technologies Corp. Class A (a) | 116,850 | | 6,576,318 |
Semiconductors & Semiconductor Equipment - 9.8% |
Agere Systems, Inc.: | | | |
Class A (a) | 8,448,145 | | 11,573,959 |
Class B (a) | 6,893,509 | | 9,306,237 |
Altera Corp. (a) | 2,183,000 | | 45,188,100 |
Analog Devices, Inc. | 1,408,900 | | 52,016,588 |
Applied Materials, Inc. (a) | 1,477,800 | | 25,270,380 |
ASML Holding NV (NY Shares) (a) | 2,542,776 | | 40,455,566 |
Fairchild Semiconductor International, Inc. (a) | 1,525,200 | | 24,799,752 |
Freescale Semiconductor, Inc.: | | | |
Class A | 3,041,300 | | 54,195,966 |
Class B | 649,919 | | 11,932,513 |
Integrated Circuit Systems, Inc. (a) | 1,552,759 | | 32,483,718 |
Intel Corp. | 11,075,800 | | 259,062,962 |
International Rectifier Corp. (a) | 486,400 | | 21,678,848 |
Intersil Corp. Class A | 2,966,736 | | 49,663,161 |
KLA-Tencor Corp. (a) | 486,100 | | 22,642,538 |
Lam Research Corp. (a) | 888,800 | | 25,695,208 |
Marvell Technology Group Ltd. (a) | 24,300 | | 861,921 |
MediaTek, Inc. | 2,656,000 | | 18,046,430 |
Microchip Technology, Inc. | 1,150,900 | | 30,682,994 |
ON Semiconductor Corp. (a) | 3,045,700 | | 13,827,478 |
PMC-Sierra, Inc. (a) | 3,316,682 | | 37,312,673 |
Taiwan Semiconductor Manufacturing Co. Ltd. sponsored ADR | 5,386,674 | | 45,732,862 |
Teradyne, Inc. (a) | 1,264,000 | | 21,576,480 |
Texas Instruments, Inc. | 1,442,650 | | 35,518,043 |
Tokyo Electron Ltd. | 377,300 | | 23,242,830 |
Common Stocks - continued |
| Shares | | Value (Note 1) |
INFORMATION TECHNOLOGY - continued |
Semiconductors & Semiconductor Equipment - continued |
United Microelectronics Corp. sponsored ADR (d) | 6,073,920 | | $ 21,440,938 |
Xilinx, Inc. | 1,438,000 | | 42,636,700 |
| | 976,844,845 |
Software - 6.8% |
Adobe Systems, Inc. | 340,874 | | 21,386,435 |
Cadence Design Systems, Inc. (a) | 3,260,000 | | 45,020,600 |
Cognos, Inc. (a) | 232,600 | | 10,238,277 |
Computer Associates International, Inc. | 5,455 | | 169,432 |
Macrovision Corp. (a) | 191,952 | | 4,937,005 |
McAfee, Inc. (a) | 636,700 | | 18,419,731 |
Microsoft Corp. | 9,714,850 | | 259,483,644 |
NAVTEQ Corp. | 90,700 | | 4,204,852 |
Novell, Inc. (a) | 4,444,826 | | 30,002,576 |
Oracle Corp. (a) | 7,579,691 | | 103,993,361 |
Red Hat, Inc. (a) | 719,500 | | 9,605,325 |
SAP AG sponsored ADR | 1,256,600 | | 55,554,286 |
Symantec Corp. (a) | 1,408,306 | | 36,277,963 |
Take-Two Interactive Software, Inc. (a) | 1,109,100 | | 38,585,589 |
VERITAS Software Corp. (a) | 1,227,400 | | 35,042,270 |
| | 672,921,346 |
TOTAL INFORMATION TECHNOLOGY | | 3,429,031,621 |
MATERIALS - 1.2% |
Chemicals - 0.5% |
Monsanto Co. | 617,800 | | 34,318,790 |
Syngenta AG sponsored ADR | 709,300 | | 15,143,555 |
| | 49,462,345 |
Containers & Packaging - 0.1% |
Smurfit-Stone Container Corp. (a) | 812,611 | | 15,179,573 |
Metals & Mining - 0.6% |
Arch Coal, Inc. | 374,500 | | 13,309,730 |
CONSOL Energy, Inc. | 465,300 | | 19,100,565 |
Massey Energy Co. | 676,800 | | 23,654,160 |
| | 56,064,455 |
TOTAL MATERIALS | | 120,706,373 |
TELECOMMUNICATION SERVICES - 0.3% |
Wireless Telecommunication Services - 0.3% |
Nextel Communications, Inc.
Class A (a) | 824,100 | | 24,723,000 |
TOTAL COMMON STOCKS (Cost $7,736,201,771) | 9,864,538,158 |
Preferred Stocks - 0.0% |
| Shares | | Value (Note 1) |
Convertible Preferred Stocks - 0.0% |
INFORMATION TECHNOLOGY - 0.0% |
Communications Equipment - 0.0% |
Chorum Technologies, Inc. Series E (a)(f) | 88,646 | | $ 0 |
Nonconvertible Preferred Stocks - 0.0% |
HEALTH CARE - 0.0% |
Biotechnology - 0.0% |
Geneprot, Inc. Series A (f) | 826,000 | | 2,891,000 |
TOTAL PREFERRED STOCKS (Cost $5,872,855) | 2,891,000 |
Convertible Bonds - 0.0% |
| Principal
Amount | | |
INFORMATION TECHNOLOGY - 0.0% |
Semiconductors & Semiconductor Equipment - 0.0% |
Micron Technology, Inc. 2.5%
2/1/10 (e) | $ 1,523,000 | | 1,806,430 |
TOTAL CONVERTIBLE BONDS (Cost $1,523,000) | 1,806,430 |
Money Market Funds - 0.7% |
| Shares | | |
Fidelity Cash Central Fund, 2.24% (b) | 40,371,676 | | 40,371,676 |
Fidelity Securities Lending Cash Central Fund, 2.23% (b)(c) | 25,933,096 | | 25,933,096 |
TOTAL MONEY MARKET FUNDS (Cost $66,304,772) | 66,304,772 |
TOTAL INVESTMENT
PORTFOLIO - 100.0% (Cost $7,809,902,398) | | 9,935,540,360 |
NET OTHER ASSETS - 0.0% | | 1,402,138 |
NET ASSETS - 100% | $ 9,936,942,498 |
Legend |
(a) Non-income producing |
(b) Affiliated fund that is available only to investment companies and other accounts managed by Fidelity Investments. The rate quoted is the annualized seven-day yield of the fund at period end. A complete listing of the fund's holdings as of its most recent fiscal year end is available upon request. |
(c) Includes investment made with cash collateral received from securities on loan. |
(d) Security or a portion of the security is on loan at period end. |
(e) Security exempt from registration under Rule 144A of the Securities Act of 1933. These securities may be resold in transactions exempt from registration, normally to qualified institutional buyers. At the period end, the value of these securities amounted to 1,806,430 or 0.0% of net assets. |
(f) Restricted securities - Investment in securities not registered under the Securities Act of 1933 (excluding 144A issues). At the end of the period, the value of restricted securities (excluding 144A issues) amounted to $2,891,000 or 0.0% of net assets. |
Additional information on each holding is as follows: |
Security | Acquisition Date | Acquisition Cost |
Chorum Technologies, Inc. Series E | 9/19/00 | $ 1,528,257 |
Geneprot, Inc. Series A | 7/7/00 | $ 4,543,000 |
Income Tax Information |
At December 31, 2004, the fund had a capital loss carryforward of approximately $3,653,617,000 of which $1,411,197,000, $2,197,712,000 and $44,708,000 will expire on December 31, 2009, 2010 and 2011, respectively. |
See accompanying notes which are an integral part of the financial statements.
Annual Report
Fidelity Variable Insurance Products: Growth Portfolio
Financial Statements
Statement of Assets and Liabilities
December 31, 2004 |
Assets | | |
Investment in securities, at value (including securities loaned of $24,929,493) (cost $7,809,902,398) - See accompanying schedule | | $ 9,935,540,360 |
Cash | | 54,548 |
Foreign currency held at value
(cost $29,573,196) | | 30,067,997 |
Receivable for investments sold | | 14,033,133 |
Receivable for fund shares sold | | 4,485,109 |
Dividends receivable | | 7,487,115 |
Interest receivable | | 113,675 |
Prepaid expenses | | 38,895 |
Other affiliated receivables | | 49,263 |
Other receivables | | 1,519,976 |
Total assets | | 9,993,390,071 |
Liabilities | | |
Payable for investments purchased | $ 3,936,983 | |
Payable for fund shares redeemed | 19,018,541 | |
Accrued management fee | 4,740,859 | |
Distribution fees payable | 276,915 | |
Other affiliated payables | 865,803 | |
Other payables and accrued expenses | 1,675,376 | |
Collateral on securities loaned, at value | 25,933,096 | |
Total liabilities | | 56,447,573 |
Net Assets | | $ 9,936,942,498 |
Net Assets consist of: | | |
Paid in capital | | $ 11,449,421,694 |
Undistributed net investment income | | 42,500,013 |
Accumulated undistributed net realized gain (loss) on investments and foreign currency transactions | | (3,681,114,074) |
Net unrealized appreciation (depreciation) on investments and assets and liabilities in foreign currencies | | 2,126,134,865 |
Net Assets | | $ 9,936,942,498 |
| | |
Initial Class:
Net Asset Value, offering price and redemption price per share ($7,796,887,587 ÷ 243,554,460 shares) | | $ 32.01 |
| | |
Service Class:
Net Asset Value, offering price and redemption price per share ($1,326,262,008 ÷ 41,602,270 shares) | | $ 31.88 |
| | |
Service Class 2:
Net Asset Value, offering price and redemption price per share ($811,126,385 ÷ 25,638,241 shares) | | $ 31.64 |
| | |
Service Class 2R:
Net Asset Value, offering price
and redemption price per share ($2,666,518 ÷ 84,539 shares) | | $ 31.54 |
Statement of Operations
Year ended December 31, 2004 |
| | |
Investment Income | | |
Dividends A | | $ 86,850,641 |
Special Dividends | | 26,028,750 |
Interest | | 880,245 |
Security lending | | 520,076 |
Total income | | 114,279,712 |
| | |
Expenses | | |
Management fee | $ 58,590,211 | |
Transfer agent fees | 6,723,531 | |
Distribution fees | 3,143,384 | |
Accounting and security lending fees | 1,387,678 | |
Non-interested trustees' compensation | 56,073 | |
Appreciation in deferred trustee compensation account | 14,142 | |
Custodian fees and expenses | 300,615 | |
Audit | 96,165 | |
Legal | 32,336 | |
Interest | 39,066 | |
Miscellaneous | 2,052,657 | |
Total expenses before reductions | 72,435,858 | |
Expense reductions | (3,293,886) | 69,141,972 |
Net investment income (loss) | | 45,137,740 |
Realized and Unrealized Gain (Loss) Net realized gain (loss) on: | | |
Investment securities | 704,506,123 | |
Foreign currency transactions | (113,869) | |
Total net realized gain (loss) | | 704,392,254 |
Change in net unrealized appreciation (depreciation) on: Investment securities | (449,154,576) | |
Assets and liabilities in foreign currencies | 499,190 | |
Total change in net unrealized appreciation (depreciation) | | (448,655,386) |
Net gain (loss) | | 255,736,868 |
Net increase (decrease) in net assets resulting from operations | | $ 300,874,608 |
A As a result of the change in the estimate of the return of capital component of dividend income realized in the year ended December 31, 2003, dividend income has been reduced by $2,260,756, with a corresponding increase to net realized gain (loss) and net unrealized appreciation (depreciation).
See accompanying notes which are an integral part of the financial statements.
Growth Portfolio
Fidelity Variable Insurance Products: Growth Portfolio
Financial Statements - continued
Statement of Changes in Net Assets
| Year ended
December 31,
2004 | Year ended
December 31,
2003 |
Increase (Decrease) in Net Assets | | |
Operations | | |
Net investment income (loss) | $ 45,137,740 | $ 23,031,175 |
Net realized gain (loss) | 704,392,254 | 49,130,228 |
Change in net unrealized appreciation (depreciation) | (448,655,386) | 2,530,101,870 |
Net increase (decrease) in net assets resulting from operations | 300,874,608 | 2,602,263,273 |
Distributions to shareholders from net investment income | (25,185,765) | (23,104,405) |
Share transactions - net increase (decrease) | (945,720,754) | (285,825,613) |
Redemption fees | 13 | 2,361 |
Total increase (decrease) in net assets | (670,031,898) | 2,293,335,616 |
| | |
Net Assets | | |
Beginning of period | 10,606,974,396 | 8,313,638,780 |
End of period (including undistributed net investment income of $42,500,013 and undistributed net investment income of $22,711,797, respectively) | $ 9,936,942,498 | $ 10,606,974,396 |
Other Information: | | | | |
Share Transactions | Year ended December 31, 2004 |
| Initial Class | Service Class | Service Class 2 | Service Class 2R |
Shares Sold | 10,173,829 | 3,809,653 | 9,957,726 | 63,032 |
Reinvested | 677,303 | 70,256 | 26,349 | 100 |
Redeemed | (44,148,491) | (7,601,708) | (4,196,333) | (23,264) |
Net increase (decrease) | (33,297,359) | (3,721,799) | 5,787,742 | 39,868 |
| | | | |
Dollars Sold | $ 317,143,990 | $ 118,147,419 | $ 305,162,849 | $ 1,941,136 |
Reinvested | 22,052,984 | 2,279,802 | 849,771 | 3,208 |
Redeemed | (1,353,451,648) | (232,412,004) | (126,744,925) | (693,336) |
Net increase (decrease) | $ (1,014,254,674) | $ (111,984,783) | $ 179,267,695 | $ 1,251,008 |
| | | | |
Share Transactions | Year ended December 31, 2003 |
| Initial Class | Service Class | Service Class 2 | Service Class 2R |
Shares Sold | 23,586,131 | 8,385,408 | 13,542,393 | 50,235 |
Reinvested | 941,499 | 102,591 | 14,708 | 31 |
Redeemed | (47,048,733) | (8,519,590) | (3,984,642) | (14,664) |
Net increase (decrease) | (22,521,103) | (31,591) | 9,572,459 | 35,602 |
| | | | |
Dollars Sold | $ 625,883,728 | $ 221,233,256 | $ 361,842,888 | $ 1,388,031 |
Reinvested | 20,552,932 | 2,232,378 | 318,424 | 671 |
Redeemed | (1,198,774,049) | (217,996,235) | (102,097,753) | (409,884) |
Net increase (decrease) | $ (552,337,389) | $ 5,469,399 | $ 260,063,559 | $ 978,818 |
| | | | |
Distributions | Year ended December 31, 2004 |
| Initial Class | Service Class | Service Class 2 | Service Class 2R |
From net investment income | $ 22,052,984 | $ 2,279,802 | $ 849,771 | $ 3,208 |
| Year ended December 31, 2003 |
| Initial Class | Service Class | Service Class 2 | Service Class 2R |
From net investment income | $ 20,552,932 | $ 2,232,378 | $ 318,424 | $ 671 |
See accompanying notes which are an integral part of the financial statements.
Annual Report
Financial Highlights - Initial Class
Years ended December 31, | 2004 | 2003 | 2002 | 2001 | 2000 |
Selected Per-Share Data | | | | | |
Net asset value, beginning of period | $ 31.04 | $ 23.44 | $ 33.61 | $ 43.66 | $ 54.93 |
Income from Investment Operations | | | | | |
Net investment income (loss) C | .15 D, G | .07 | .07 | .07 | .03 |
Net realized and unrealized gain (loss) | .90 | 7.60 | (10.17) | (7.27) | (5.27) |
Total from investment operations | 1.05 | 7.67 | (10.10) | (7.20) | (5.24) |
Distributions from net investment income | (.08) | (.07) | (.07) | (.03) | (.06) |
Distributions from net realized gain | - | - | - | (2.82) | (5.97) |
Total distributions | (.08) | (.07) | (.07) | (2.85) | (6.03) |
Redemption fees added to paid in capital | - C, F | - C, F | - C, F | - | - |
Net asset value, end of period | $ 32.01 | $ 31.04 | $ 23.44 | $ 33.61 | $ 43.66 |
Total Return A, B | 3.38% | 32.85% | (30.10)% | (17.67)% | (10.96)% |
Ratios to Average Net Assets E | | | | | |
Expenses before expense reductions | .68% | .67% | .67% | .68% | .65% |
Expenses net of voluntary waivers, if any | .68% | .67% | .67% | .68% | .65% |
Expenses net of all reductions | .65% | .64% | .61% | .65% | .64% |
Net investment income (loss) | .47% G | .28% | .25% | .19% | .07% |
Supplemental Data | | | | | |
Net assets, end of period (000 omitted) | $ 7,796,888 | $ 8,594,509 | $ 7,016,147 | $ 11,458,659 | $ 15,517,271 |
Portfolio turnover rate | 72% | 61% | 90% | 105% | 103% |
A Total returns do not reflect charges attributable to your insurance company's separate account. Inclusion of these charges would reduce the total returns shown.
B Total returns would have been lower had certain expenses not been reduced during the periods shown.
C Calculated based on average shares outstanding during the period.
D Investment income per share reflects a special dividend which amounted to $.08 per share.
E Expense ratios reflect operating expenses of the class. Expenses before reductions do not reflect amounts reimbursed by the investment adviser or reductions from brokerage service arrangements or other expense offset arrangements and do not represent the amount paid by the class during periods when reimbursements or reductions occur. Expenses net of any voluntary waivers reflect expenses after reimbursement by the investment adviser but prior to reductions from brokerage service arrangements or other expense offset arrangements. Expenses net of all reductions represent the net expenses paid by the class.
F Amount represents less than $.01 per share.
G As a result in the change in the estimate of the return of capital component of divided income realized in the year ended December 31, 2003, net investment income per share and the ratio of net investment income to average net assets for the year ended December 31, 2004 have been reduced by $.01 per share and .02%, respectively. The change in estimate has no impact on total net assets or total return of the fund.
Financial Highlights - Service Class
Years ended December 31, | 2004 | 2003 | 2002 | 2001 | 2000 |
Selected Per-Share Data | | | | | |
Net asset value, beginning of period | $ 30.92 | $ 23.34 | $ 33.48 | $ 43.51 | $ 54.80 |
Income from Investment Operations | | | | | |
Net investment income (loss) C | .11 D, G | .05 | .04 | .03 | (.02) |
Net realized and unrealized gain (loss) | .90 | 7.58 | (10.14) | (7.24) | (5.25) |
Total from investment operations | 1.01 | 7.63 | (10.10) | (7.21) | (5.27) |
Distributions from net investment income | (.05) | (.05) | (.04) | - | (.05) |
Distributions from net realized gain | - | - | - | (2.82) | (5.97) |
Total distributions | (.05) | (.05) | (.04) | (2.82) | (6.02) |
Redemption fees added to paid in capital | - C, F | - C, F | - C, F | - | - |
Net asset value, end of period | $ 31.88 | $ 30.92 | $ 23.34 | $ 33.48 | $ 43.51 |
Total Return A, B | 3.26% | 32.78% | (30.20)% | (17.74)% | (11.05)% |
Ratios to Average Net Assets E | | | | | |
Expenses before expense reductions | .78% | .77% | .77% | .78% | .76% |
Expenses net of voluntary waivers, if any | .78% | .77% | .77% | .78% | .76% |
Expenses net of all reductions | .75% | .74% | .71% | .75% | .74% |
Net investment income (loss) | .37% G | .18% | .15% | .09% | (.04)% |
Supplemental Data | | | | | |
Net assets, end of period (000 omitted) | $ 1,326,262 | $ 1,401,298 | $ 1,058,738 | $ 1,655,758 | $ 1,847,051 |
Portfolio turnover rate | 72% | 61% | 90% | 105% | 103% |
A Total returns do not reflect charges attributable to your insurance company's separate account. Inclusion of these charges would reduce the total returns shown.
B Total returns would have been lower had certain expenses not been reduced during the periods shown.
C Calculated based on average shares outstanding during the period.
D Investment income per share reflects a special dividend which amounted to $.08 per share.
E Expense ratios reflect operating expenses of the class. Expenses before reductions do not reflect amounts reimbursed by the investment adviser or reductions from brokerage service arrangements or other expense offset arrangements and do not represent the amount paid by the class during periods when reimbursements or reductions occur. Expenses net of any voluntary waivers reflect expenses after reimbursement by the investment adviser but prior to reductions from brokerage service arrangements or other expense offset arrangements. Expenses net of all reductions represent the net expenses paid by the class.
F Amount represents less than $.01 per share.
G As a result in the change in the estimate of the return of capital component of divided income realized in the year ended December 31, 2003, net investment income per share and the ratio of net investment income to average net assets for the year ended December 31, 2004 have been reduced by $.01 per share and .02%, respectively. The change in estimate has no impact on total net assets or total return of the fund.
See accompanying notes which are an integral part of the financial statements.
Growth Portfolio
Financial Highlights - Service Class 2
Years ended December 31, | 2004 | 2003 | 2002 | 2001 | 2000 G |
Selected Per-Share Data | | | | | |
Net asset value, beginning of period | $ 30.72 | $ 23.21 | $ 33.34 | $ 43.43 | $ 53.40 |
Income from Investment Operations | | | | | |
Net investment income (loss) E | .07 F, J | .01 | - I | (.02) | (.09) |
Net realized and unrealized gain (loss) | .89 | 7.53 | (10.09) | (7.22) | (3.86) |
Total from investment operations | .96 | 7.54 | (10.09) | (7.24) | (3.95) |
Distributions from net investment income | (.04) | (.03) | (.04) | (.03) | (.05) |
Distributions from net realized gain | - | - | - | (2.82) | (5.97) |
Total distributions | (.04) | (.03) | (.04) | (2.85) | (6.02) |
Redemption fees added to paid in capital | - E, I | - E, I | - E, I | - | - |
Net asset value, end of period | $ 31.64 | $ 30.72 | $ 23.21 | $ 33.34 | $ 43.43 |
Total Return B, C, D | 3.12% | 32.54% | (30.30)% | (17.87)% | (8.88)% |
Ratios to Average Net Assets H | | | | | |
Expenses before expense reductions | .93% | .92% | .93% | .93% | .91% A |
Expenses net of voluntary waivers, if any | .93% | .92% | .93% | .93% | .91% A |
Expenses net of all reductions | .90% | .89% | .87% | .90% | .90% A |
Net investment income (loss) | .22% J | .02% | (.01)% | (.06)% | (.19)% A |
Supplemental Data | | | | | |
Net assets, end of period (000 omitted) | $ 811,126 | $ 609,798 | $ 238,543 | $ 191,475 | $ 57,095 |
Portfolio turnover rate | 72% | 61% | 90% | 105% | 103% |
A Annualized
B Total returns for periods of less than one year are not annualized.
C Total returns do not reflect charges attributable to your insurance company's separate account. Inclusion of these charges would reduce the total returns shown.
D Total returns would have been lower had certain expenses not been reduced during the periods shown.
E Calculated based on average shares outstanding during the period.
F Investment income per share reflects a special dividend which amounted to $.08 per share.
G For the period January 12, 2000 (commencement of sale of shares) to December 31, 2000.
H Expense ratios reflect operating expenses of the class. Expenses before reductions do not reflect amounts reimbursed by the investment adviser or reductions from brokerage service arrangements or other expense offset arrangements and do not represent the amount paid by the class during periods when reimbursements or reductions occur. Expense ratios before reductions for start-up periods may not be representative of longer-term operating periods. Expenses net of any voluntary waivers reflect expenses after reimbursement by the investment adviser but prior to reductions from brokerage service arrangements or other expense offset arrangements. Expenses net of all reductions represent the net expenses paid by the class.
I Amount represents less than $.01 per share.
J As a result in the change in the estimate of the return of capital component of divided income realized in the year ended December 31, 2003, net investment income per share and the ratio of net investment income to average net assets for the year ended December 31, 2004 have been reduced by $.01 per share and .02%, respectively. The change in estimate has no impact on total net assets or total return of the fund.
Financial Highlights - Service Class 2R
Years ended December 31, | 2004 | 2003 | 2002 G |
Selected Per-Share Data | | | |
Net asset value, beginning of period | $ 30.65 | $ 23.20 | $ 31.05 |
Income from Investment Operations | | | |
Net investment income (loss) E | .07 F, J | .01 | (.01) |
Net realized and unrealized gain (loss) | .88 | 7.51 | (7.84) |
Total from investment operations | .95 | 7.52 | (7.85) |
Distributions from net investment income | (.06) | (.07) | - |
Redemption fees added to paid in capital E, I | - | - | - |
Net asset value, end of period | $ 31.54 | $ 30.65 | $ 23.20 |
Total Return B, C, D | 3.10% | 32.54% | (25.28)% |
Ratios to Average Net Assets H | | | |
Expenses before expense reductions | .93% | .92% | .96% A |
Expenses net of voluntary waivers, if any | .93% | .92% | .96% A |
Expenses net of all reductions | .90% | .90% | .90% A |
Net investment income (loss) | .22% J | .02% | (.03)% A |
Supplemental Data | | | |
Net assets, end of period (000 omitted) | $ 2,667 | $ 1,369 | $ 210 |
Portfolio turnover rate | 72% | 61% | 90% |
A Annualized
B Total returns for periods of less than one year are not annualized.
C Total returns do not reflect charges attributable to your insurance company's separate account. Inclusion of these charges would reduce the total returns shown.
D Total returns would have been lower had certain expenses not been reduced during the periods shown.
E Calculated based on average shares outstanding during the period.
F Investment income per share reflects a special dividend which amounted to $.08 per share.
G For the period April 24, 2002 (commencement of sale of shares) to December 31, 2002.
H Expense ratios reflect operating expenses of the class. Expenses before reductions do not reflect amounts reimbursed by the investment adviser or reductions from brokerage service arrangements or other expense offset arrangements and do not represent the amount paid by the class during periods when reimbursements or reductions occur. Expense ratios before reductions for start-up periods may not be representative of longer-term operating periods. Expenses net of any voluntary waivers reflect expenses after reimbursement by the investment adviser but prior to reductions from brokerage service arrangements or other expense offset arrangements. Expenses net of all reductions represent the net expenses paid by the class.
I Amount represents less than $.01 per share.
J As a result in the change in the estimate of the return of capital component of divided income realized in the year ended December 31, 2003, net investment income per share and the ratio of net investment income to average net assets for the year ended December 31, 2004 have been reduced by $.01 per share and .02%, respectively. The change in estimate has no impact on total net assets or total return of the fund.
See accompanying notes which are an integral part of the financial statements.
Annual Report
Notes to Financial Statements
For the period ended December 31, 2004
1. Significant Accounting Policies.
Growth Portfolio (the fund) is a fund of Variable Insurance Products Fund (the trust) (referred to in this report as Fidelity Variable Insurance Products: Growth Portfolio) and is authorized to issue an unlimited number of shares. The trust is registered under the Investment Company Act of 1940, as amended (the 1940 Act), as an open-end management investment company organized as a Massachusetts business trust. Shares of the fund may only be purchased by insurance companies for the purpose of funding variable annuity or variable life insurance contracts. The fund offers the following classes of shares: Initial Class shares, Service Class shares, Service Class 2 shares and Service Class 2R shares. All classes have equal rights and voting privileges, except for matters affecting a single class. Investment income, realized and unrealized capital gains and losses, the common expenses of the fund, and certain fund-level expense reductions, if any, are allocated on a pro rata basis to each class based on the relative net assets of each class to the total net assets of the fund. Each class differs with respect to distribution and service plan fees incurred. Certain expense reductions also differ by class.
The financial statements have been prepared in conformity with accounting principles generally accepted in the United States of America, which require management to make certain estimates and assumptions at the date of the financial statements. The following summarizes the significant accounting policies of the fund:
Security Valuation. Net asset value per share (NAV calculation) is calculated as of the close of business of the New York Stock Exchange, normally 4:00 p.m. Eastern time. Equity securities, including restricted securities, for which market quotations are available are valued at the last sale price or official closing price (closing bid price or last evaluated quote if no sale has occurred) on the primary market or exchange on which they trade. Debt securities, including restricted securities, for which quotations are readily available are valued at their most recent bid prices (sales prices if the principal market is an exchange) in the principal market in which such securities are normally traded, as determined by recognized dealers in such securities, or securities are valued on the basis of information provided by a pricing service. Pricing services use valuation matrices that incorporate both dealer-supplied valuations and valuation models. If prices are not readily available or do not accurately reflect fair value for a security, or if a security's value has been materially affected by events occurring after the close of the exchange or market on which the security is principally traded, that security may be valued by another method that the Board of Trustees believes accurately reflects fair value. A security's valuation may differ depending on the method used for determining value. Price movements in futures contracts and ADRs, market and trading trends, the bid/ask quotes of brokers and off-exchange institutional trading may be reviewed in the course of making a good faith determination of a security's fair value. Short-term securities with remaining maturities of sixty days or less for which quotations are not readily available are valued on the basis of amortized cost. Investments in open-end investment companies are valued at their net asset value each business day.
Foreign Currency. The fund uses foreign currency contracts to facilitate transactions in foreign-denominated securities. Losses from these transactions may arise from changes in the value of the foreign currency or if the counterparties do not perform under the contracts' terms.
Foreign-denominated assets, including investment securities, and liabilities are translated into U.S. dollars at the exchange rate at period end. Purchases and sales of investment securities, income and dividends received and expenses denominated in foreign currencies are translated into U.S. dollars at the exchange rate in effect on the transaction date.
The effects of exchange rate fluctuations on investments are included with the net realized and unrealized gain (loss) on investment securities. Other foreign currency transactions resulting in realized and unrealized gain (loss) are disclosed separately.
Investment Transactions and Income. Security transactions are accounted for as of trade date. Gains and losses on securities sold are determined on the basis of identified cost and may include proceeds received from litigation. Dividend income is recorded on the ex-dividend date, except for certain dividends from foreign securities where the ex-dividend date may have passed, which are recorded as soon as the fund is informed of the ex-dividend date. Non-cash dividends included in dividend income, if any, are recorded at the fair market value of the securities received. Distributions received on securities that represent a return of capital or capital gain are recorded as a reduction of cost of investments and/or as a realized gain. The fund estimates the components of distributions received that may be considered return of capital distributions or capital gain distributions. Large, non-recurring dividends recognized by the fund are presented separately on the Statement of Operations as "Special Dividends" and the impact of these dividends to net investment income per share is presented in the Financial Highlights. Interest income is accrued as earned. Interest income includes coupon interest and amortization of premium and accretion of discount on debt securities. Investment income is recorded net of foreign taxes withheld where recovery of such taxes is uncertain.
Expenses. Most expenses of the trust can be directly attributed to a fund. Expenses which cannot be directly attributed are apportioned among the funds in the trust.
Deferred Trustee Compensation. Under a Deferred Compensation Plan (the Plan) non-interested Trustees must defer receipt of a portion of, and may elect to defer receipt of an additional portion of, their annual compensation. Deferred amounts are treated as though equivalent dollar amounts had been invested in a cross-section of other Fidelity funds, and are marked-to-market. Deferred amounts remain in the fund until distributed in accordance with the Plan.
Growth Portfolio
Notes to Financial Statements - continued
1. Significant Accounting Policies - continued
Income Tax Information and Distributions to Shareholders. Each year, the fund intends to qualify as a regulated investment company by distributing all of its taxable income and realized gains under Subchapter M of the Internal Revenue Code. As a result, no provision for income taxes is required in the accompanying financial statements. Foreign taxes are provided for based on the fund's understanding of the tax rules and rates that exist in the foreign markets in which it invests.
Distributions are recorded on the ex-dividend date. Income dividends and capital gain distributions are declared separately for each class. Income and capital gain distributions are determined in accordance with income tax regulations, which may differ from generally accepted accounting principles. Capital accounts within the financial statements are adjusted for permanent book-tax differences. These adjustments have no impact on net assets or the results of operations. Temporary book-tax differences will reverse in a subsequent period.
Book-tax differences are primarily due to foreign currency transactions, capital loss carryforwards and losses deferred due to wash sales.
The tax-basis components of distributable earnings and the federal tax cost as of period end were as follows:
Unrealized appreciation | $ 2,326,119,909 | |
Unrealized depreciation | (227,367,706) | |
Net unrealized appreciation (depreciation) | 2,098,752,203 | |
Undistributed ordinary income | 42,590,026 | |
Capital loss carryforward | (3,653,617,452) | |
| | |
Cost for federal income tax purposes | $ 7,836,788,157 | |
The tax character of distributions paid was as follows:
| December 31,
2004 | December 31,
2003 |
Ordinary Income | $ 25,185,765 | $ 23,104,405 |
Trading (Redemption) Fees. Service Class 2R shares held less than 60 days are subject to a redemption fee equal to 1% of the proceeds of the redeemed shares. All redemption fees, including any estimated redemption fees paid by Fidelity Management & Research Company (FMR), are retained by the fund and accounted for as an addition to paid in capital.
2. Operating Policies.
Repurchase Agreements. FMR has received an Exemptive Order from the Securities and Exchange Commission (the SEC) which permits the fund and other affiliated entities of FMR to transfer uninvested cash balances into joint trading accounts. These accounts are then invested in repurchase agreements that are collateralized by U.S. Treasury or Government obligations. The fund may also invest directly with institutions, in repurchase agreements that are collateralized by commercial paper obligations and corporate obligations. Collateral is held in segregated accounts with custodian banks and may be obtained in the event of a default of the counterparty. Collateral is marked-to-market daily and maintained at a value at least equal to the principal amount of the repurchase agreement (including accrued interest).
Restricted Securities. The fund may invest in securities that are subject to legal or contractual restrictions on resale. These securities generally may be resold in transactions exempt from registration or to the public if the securities are registered. Disposal of these securities may involve time-consuming negotiations and expense, and prompt sale at an acceptable price may be difficult. Information regarding restricted securities is included at the end of the fund's Schedule of Investments.
3. Purchases and Sales of Investments.
Purchases and sales of securities, other than short-term securities and U.S. government securities, aggregated $7,269,389,954 and $8,239,247,322, respectively.
4. Fees and Other Transactions with Affiliates.
Management Fee. FMR and its affiliates provide the fund with investment management related services for which the fund pays a monthly management fee. The management fee is the sum of an individual fund fee rate that is based on an annual rate of .30% of the fund's average net assets and a group fee rate that averaged .28% during the period. The group fee rate is based upon the average net assets of all the mutual funds advised by FMR. The group fee rate decreases as assets under management increase and increases as assets under management decrease. For the period, the total annual management fee rate was .58% of the fund's average net assets.
Growth Portfolio
4. Fees and Other Transactions with Affiliates - continued
Distribution and Service Plan. In accordance with Rule 12b-1 of the 1940 Act, the fund has adopted separate 12b-1 Plans for each Service Class of shares. Each Service Class pays Fidelity Distributors Corporation (FDC), an affiliate of FMR, a service fee. For the period, the service fee is based on an annual rate of .10% of Service Class' average net assets and .25% of Service Class 2's and Service Class 2R's average net assets.
For the period, each class paid FDC the following amounts, all of which were re-allowed to insurance companies for the distribution of shares and providing shareholder support services:
Service Class | $ 1,356,900 | |
Service Class 2 | 1,781,135 | |
Service Class 2R | 5,349 | |
| $ 3,143,384 | |
Transfer Agent Fees. Fidelity Investments Institutional Operations Company, Inc. (FIIOC), an affiliate of FMR, is the fund's transfer, dividend disbursing, and shareholder servicing agent. FIIOC receives an asset-based fee with respect to each account. FIIOC pays a portion of the expenses related to the typesetting, printing and mailing of shareholder reports, except proxy statements. Each class pays a transfer agent fee, excluding out of pocket expenses, equal to an annual rate of .07% of their month end net assets. For the period, the total transfer agent fees paid by each class to FIIOC, including out of pocket expenses, were as follows:
Initial Class | $ 5,336,742 | |
Service Class | 899,118 | |
Service Class 2 | 486,224 | |
Service Class 2R | 1,447 | |
| $ 6,723,531 | |
Accounting and Security Lending Fees. Fidelity Service Company, Inc. (FSC), an affiliate of FMR, maintains the fund's accounting records. The accounting fee is based on the level of average net assets for the month. Under a separate contract, FSC administers the security lending program. The security lending fee is based on the number and duration of lending transactions.
Central Funds. The fund may invest in affiliated Central Funds managed by Fidelity Investments Money Management, Inc. (FIMM), an affiliate of FMR. The Central Funds are open-end investment companies available only to investment companies and other accounts managed by FMR and its affiliates. The Central Funds seek preservation of capital and current income and do not pay a management fee. Income distributions earned by the fund are recorded as income in the accompanying financial statements and totaled $825,101 for the period.
Brokerage Commissions. The fund placed a portion of its portfolio transactions with brokerage firms which are affiliates of the investment adviser. The commissions paid to these affiliated firms were $609,973 for the period.
Interfund Lending Program. Pursuant to an Exemptive Order issued by the SEC, the fund, along with other registered investment companies having management contracts with FMR, may participate in an interfund lending program. This program provides an alternative credit facility allowing the funds to borrow from, or lend money to, other participating funds. At period end, there were no interfund loans outstanding. The fund's activity in this program during the period was as follows:
Borrower or Lender | Average Daily
Loan Balance | Weighted Average
Interest Rate | Interest Earned
(included in interest income) | Interest
Expense |
Borrower | $ 21,552,298 | 1.39% | - | $ 39,066 |
5. Committed Line of Credit.
The fund participates with other funds managed by FMR in a $4.2 billion credit facility (the "line of credit") to be utilized for temporary or emergency purposes to fund shareholder redemptions or for other short-term liquidity purposes. The fund has agreed to pay commitment fees on its pro rata portion of the line of credit. During the period, there were no borrowings on this line of credit.
6. Security Lending.
The fund lends portfolio securities from time to time in order to earn additional income. The fund receives collateral (in the form of U.S. Treasury obligations, letters of credit and/or cash) against the loaned securities and maintains collateral in an amount not less than 100% of the market value of the loaned securities during the period of the loan. The market value of the loaned securities is determined at the close of business of the fund and any
Growth Portfolio
Notes to Financial Statements - continued
6. Security Lending - continued
additional required collateral is delivered to the fund on the next business day. If the borrower defaults on its obligation to return the securities loaned because of insolvency or other reasons, a fund could experience delays and costs in recovering the securities loaned or in gaining access to the collateral. Cash collateral is invested in cash equivalents. The value of loaned securities and cash collateral at period end are disclosed on the fund's Statement of Assets and Liabilities.
7. Expense Reductions.
Many of the brokers with whom FMR places trades on behalf of the fund provided services to the fund in addition to trade execution. These services included payments of certain expenses on behalf of the fund totaling $3,292,493 for the period. In addition, through arrangements with the fund's custodian, credits realized as a result of uninvested cash balances were used to reduce the fund's expenses. During the period, these credits reduced the fund's custody expenses by $1,393.
8. Other Information.
At the end of the period, FMR or its affiliates were the owners of record of 11% of the total outstanding shares of the fund and two otherwise unaffiliated shareholders were the owners of record of 35% of the total outstanding shares of the fund.
Annual Report
Report of Independent Registered Public Accounting Firm
To the Trustees of Variable Insurance Products Fund and the Shareholders of Growth Portfolio:
In our opinion, the accompanying statement of assets and liabilities, including the schedule of investments, and the related statements of operations and of changes in net assets and the financial highlights present fairly, in all material respects, the financial position of Growth Portfolio (a fund of Variable Insurance Products Fund) at December 31, 2004 and the results of its operations, the changes in its net assets and the financial highlights for the periods indicated, in conformity with accounting principles generally accepted in the United States of America. These financial statements and financial highlights (hereafter referred to as "financial statements") are the responsibility of the Growth Portfolio's management; our responsibility is to express an opinion on these financial statements based on our audits. We conducted our audits of these financial statements in accordance with the standards of the Public Company Accounting Oversight Board (United States). Those standards require that we plan and perform the audit to obtain reasonable assurance about whether the financial statements are free of material misstatement. An audit includes examining, on a test basis, evidence supporting the amounts and disclosures in the financial statements, assessing the accounting principles used and significant estimates made by management, and evaluating the overall financial statement presentation. We believe that our audits, which included confirmation of securities at December 31, 2004 by correspondence with the custodian and brokers, provide a reasonable basis for our opinion.
/s/PricewaterhouseCoopers LLP
PricewaterhouseCoopers LLP
Boston, Massachusetts
February 10, 2005
Growth Portfolio
Trustees and Officers
The Trustees, Member of the Advisory Board, and executive officers of the trust and fund, as applicable, are listed below. The Board of Trustees governs the fund and is responsible for protecting the interests of shareholders. The Trustees are experienced executives who meet periodically throughout the year to oversee the fund's activities, review contractual arrangements with companies that provide services to the fund, and review the fund's performance. Except for William O. McCoy, Dennis J. Dirks, and Kenneth L. Wolfe, each of the Trustees oversees 301 funds advised by FMR or an affiliate. Mr. McCoy oversees 303 funds advised by FMR or an affiliate. Mr. Dirks and Mr. Wolfe oversee 233 funds advised by FMR or an affiliate.
The Trustees hold office without limit in time except that (a) any Trustee may resign; (b) any Trustee may be removed by written instrument, signed by at least two-thirds of the number of Trustees prior to such removal; (c) any Trustee who requests to be retired or who has become incapacitated by illness or injury may be retired by written instrument signed by a majority of the other Trustees; and (d) any Trustee may be removed at any special meeting of shareholders by a two-thirds vote of the outstanding voting securities of the trust. In any event, each non-interested Trustee shall retire not later than the last day of the calendar year in which his or her 72nd birthday occurs. The executive officers and Advisory Board Member hold office without limit in time, except that any officer and Advisory Board Member may resign or may be removed by a vote of a majority of the Trustees at any regular meeting or any special meeting of the Trustees. Except as indicated, each individual has held the office shown or other offices in the same company for the past five years.
The fund's Statement of Additional Information (SAI) includes more information about the Trustees. To request a free copy, call Fidelity at 1-800-544-5429.
Interested Trustees*:
Correspondence intended for each Trustee who is an "interested person" (as defined in the 1940 Act) may be sent to Fidelity Investments, 82 Devonshire Street, Boston, Massachusetts 02109.
Name, Age; Principal Occupation |
Edward C. Johnson 3d (74)** |
| Year of Election or Appointment: 1981 Mr. Johnson is Chairman of the Board of Trustees. Mr. Johnson serves as Chief Executive Officer, Chairman, and a Director of FMR Corp.; a Director and Chairman of the Board and of the Executive Committee of FMR; Chairman and a Director of Fidelity Management & Research (Far East) Inc.; Chairman (1998) and a Director of Fidelity Investments Money Management, Inc.; and Chairman (2001) and a Director (2000) of FMR Co., Inc. |
Abigail P. Johnson (43)** |
| Year of Election or Appointment: 2001 Senior Vice President of VIP Growth (2001). Ms. Johnson also serves as Senior Vice President of other Fidelity funds (2001). She is President and a Director of FMR (2001), Fidelity Investments Money Management, Inc. (2001), FMR Co., Inc. (2001), and a Director of FMR Corp. Previously, Ms. Johnson managed a number of Fidelity funds. |
Laura B. Cronin (50) |
| Year of Election or Appointment: 2003 Ms. Cronin is an Executive Vice President (2002) and Chief Financial Officer (2002) of FMR Corp. and is a member of the Fidelity Management Committee (2003). Previously, Ms. Cronin served as Vice President of Finance of FMR (1997-1999), and Chief Financial Officer of FMR (1999-2001), Fidelity Personal Investments (2001), and Fidelity Brokerage Company (2001-2002). |
Robert L. Reynolds (52) |
| Year of Election or Appointment: 2003 Mr. Reynolds is a Director (2003) and Chief Operating Officer (2002) of FMR Corp. and is the head of the Fidelity Management Committee (2003). He also serves on the Board at Fidelity Investments Canada, Ltd. (2000). Previously, Mr. Reynolds served as President of Fidelity Investments Institutional Retirement Group (1996-2000). |
* Trustees have been determined to be "Interested Trustees" by virtue of, among other things, their affiliation with the trust or various entities under common control with FMR.
** Edward C. Johnson 3d, Trustee, is Abigail P. Johnson's father.
Annual Report
Trustees and Officers - continued
Non-Interested Trustees:
Correspondence intended for each non-interested Trustee (that is, the Trustees other than the Interested Trustees) may be sent to Fidelity Investments, P.O. Box 55235, Boston, Massachusetts 02205-5235.
Name, Age; Principal Occupation |
Dennis J. Dirks (56) |
| Year of Election or Appointment: 2005 Mr. Dirks also serves as a Trustee (2005) or Member of the Advisory Board (2004) of other investment companies advised by FMR. Prior to his retirement in May 2003, Mr. Dirks was Chief Operating Officer and a member of the Board of The Depository Trust & Clearing Corporation (DTCC) (1999-2003). He also served as President, Chief Operating Officer, and Board member of The Depository Trust Company (DTC) (1999-2003) and President and Board member of the National Securities Clearing Corporation (NSCC) (1999-2003). In addition, Mr. Dirks served as Chief Executive Officer and Board member of the Government Securities Clearing Corporation (2001-2003) and Chief Executive Officer and Board member of the Mortgage-Backed Securities Clearing Corporation (2001-2003). |
Robert M. Gates (61) |
| Year of Election or Appointment: 1997 Dr. Gates is Vice Chairman of the non-interested Trustees (2005). Dr. Gates is President of Texas A&M University (2002). He was Director of the Central Intelligence Agency (CIA) from 1991 to 1993. From 1989 to 1991, Dr. Gates served as Assistant to the President of the United States and Deputy National Security Advisor. Dr. Gates is a Director of NACCO Industries, Inc. (mining and manufacturing), Parker Drilling Co., Inc. (drilling and rental tools for the energy industry, 2001), and Brinker International (restaurant management, 2003). He also serves as a member of the Advisory Board of VoteHere.net (secure internet voting, 2001). Previously, Dr. Gates served as a Director of LucasVarity PLC (automotive components and diesel engines), a Director of TRW Inc. (automotive, space, defense, and information technology), and Dean of the George Bush School of Government and Public Service at Texas A&M University (1999-2001). Dr. Gates also is a Trustee of the Forum for International Policy. |
George H. Heilmeier (68) |
| Year of Election or Appointment: 2004 Dr. Heilmeier is Chairman Emeritus of Telcordia Technologies (communication software and systems), where prior to his retirement, he served as company Chairman and Chief Executive Officer. He currently serves on the Boards of Directors of The Mitre Corporation (systems engineering and information technology support for the government), INET Technologies Inc. (telecommunications network surveillance, 2001), Teletech Holdings (customer management services), and HRL Laboratories (private research and development, 2004). He is Chairman of the General Motors Technology Advisory Committee and a Life Fellow of the Institute of Electrical and Electronics Engineers (IEEE) (2000). Dr. Heilmeier is a member of the Defense Science Board and the National Security Agency Advisory Board. He is also a member of the National Academy of Engineering, the American Academy of Arts and Sciences, and the Board of Overseers of the School of Engineering and Applied Science of the University of Pennsylvania. Previously, Dr. Heilmeier served as a Director of TRW Inc. (automotive, space, defense, and information technology, 1992-2002), Compaq (1994-2002), and Automatic Data Processing, Inc. (ADP) (technology-based business outsourcing, 1995-2002). |
Marie L. Knowles (58) |
| Year of Election or Appointment: 2001 Prior to Ms. Knowles' retirement in June 2000, she served as Executive Vice President and Chief Financial Officer of Atlantic Richfield Company (ARCO) (diversified energy, 1996-2000). From 1993 to 1996, she was a Senior Vice President of ARCO and President of ARCO Transportation Company. She served as a Director of ARCO from 1996 to 1998. She currently serves as a Director of Phelps Dodge Corporation (copper mining and manufacturing) and McKesson Corporation (healthcare service, 2002). Ms. Knowles is a Trustee of the Brookings Institution and the Catalina Island Conservancy and also serves as a member of the Advisory Board for the School of Engineering of the University of Southern California. |
Ned C. Lautenbach (60) |
| Year of Election or Appointment: 2000 Mr. Lautenbach has been a partner of Clayton, Dubilier & Rice, Inc. (private equity investment firm) since September 1998. Previously, Mr. Lautenbach was with the International Business Machines Corporation (IBM) from 1968 until his retirement in 1998. He was most recently Senior Vice President and Group Executive of Worldwide Sales and Services. From 1993 to 1995, he was Chairman of IBM World Trade Corporation, and from 1994 to 1998 was a member of IBM's Corporate Executive Committee. Mr. Lautenbach serves as Co-Chairman and a Director of Covansys, Inc. (global provider of business and technology solutions, 2000). In addition, he is a Director of Italtel Holding S.p.A. (telecommunications (Milan, Italy), 2004) and Eaton Corporation (diversified industrial) as well as the Philharmonic Center for the Arts in Naples, Florida (1999). He also is a member of the Council on Foreign Relations. |
Marvin L. Mann (71) |
| Year of Election or Appointment: 1993 Mr. Mann is Chairman of the non-interested Trustees (2001). He is Chairman Emeritus of Lexmark International, Inc. (computer peripherals), where he served as CEO until April 1998, retired as Chairman May 1999, and remains a member of the Board. Prior to 1991, he held the positions of Vice President of International Business Machines Corporation (IBM) and President and General Manager of various IBM divisions and subsidiaries. He is a member of the Executive Committee of the Independent Director's Council of the Investment Company Institute. In addition, Mr. Mann is a member of the President's Cabinet at the University of Alabama and the Board of Visitors of the Culverhouse College of Commerce and Business Administration at the University of Alabama. |
William O. McCoy (71) |
| Year of Election or Appointment: 1997 Prior to his retirement in December 1994, Mr. McCoy was Vice Chairman of the Board of BellSouth Corporation (telecommunications) and President of BellSouth Enterprises. He is currently a Director of Liberty Corporation (holding company), Duke Realty Corporation (real estate), and Progress Energy, Inc. (electric utility). He is also a partner of Franklin Street Partners (private investment management firm) and a member of the Research Triangle Foundation Board. In addition, Mr. McCoy served as the Interim Chancellor (1999-2000) and a member of the Board of Visitors (1994-1998) for the University of North Carolina at Chapel Hill and currently serves on the Board of Directors of the University of North Carolina Health Care System and the Board of Visitors of the Kenan-Flagler Business School (University of North Carolina at Chapel Hill). He also served as Vice President of Finance for the University of North Carolina (16-school system, 1995-1998). |
Cornelia M. Small (60) |
| Year of Election or Appointment: 2005 Ms. Small is a member (2000) and Chairperson (2002) of the Investment Committee, and a member (2002) of the Board of Trustees of Smith College. Previously, she served as Chief Investment Officer (1999-2000), Director of Global Equity Investments (1996-1999), and a member of the Board of Directors of Scudder, Stevens & Clark (1990-1997) and Scudder Kemper Investments (1997-1998). In addition, Ms. Small served as Co-Chair (2000-2003) of the Annual Fund for the Fletcher School of Law and Diplomacy. |
William S. Stavropoulos (65) |
| Year of Election or Appointment: 2001 Mr. Stavropoulos is Chairman of the Board (2000), CEO (2002), a position he previously held from 1995-2000, Chairman of the Executive Committee (2000), and a Member of the Board of Directors of The Dow Chemical Company. Since joining The Dow Chemical Company in 1967, Mr. Stavropoulos served in numerous senior management positions, including President (1993-2000; 2002-2003). Currently, he is a Director of NCR Corporation (data warehousing and technology solutions), BellSouth Corporation (telecommunications), Chemical Financial Corporation, and Maersk Inc. (industrial conglomerate, 2002). He also serves as a member of the Board of Trustees of the American Enterprise Institute for Public Policy Research. In addition, Mr. Stavropoulos is a member of The Business Council, J.P. Morgan International Council and the University of Notre Dame Advisory Council for the College of Science. |
Kenneth L. Wolfe (65) |
| Year of Election or Appointment: 2005 Mr. Wolfe also serves as a Trustee (2005) or Member of the Advisory Board (2004) of other investment companies advised by FMR. Prior to his retirement in 2001, Mr. Wolfe was Chairman and Chief Executive Officer of Hershey Foods Corporation (1993-2001). He currently serves as a member of the boards of Adelphia Communications Corporation (2003), Bausch & Lomb, Inc., and Revlon Inc. (2004). |
Annual Report
Trustees and Officers - continued
Advisory Board Member and Executive Officers:
Correspondence intended for each executive officer and Mr. Lynch may be sent to Fidelity Investments, 82 Devonshire Street, Boston, Massachusetts 02109.
Name, Age; Principal Occupation |
Peter S. Lynch (61) |
| Year of Election or Appointment: 2003 Member of the Advisory Board of Variable Insurance Products Fund. Vice Chairman and a Director of FMR, and Vice Chairman (2001) and a Director (2000) of FMR Co., Inc. Previously, Mr. Lynch served as a Trustee of the Fidelity funds (1990-2003). Prior to May 31, 1990, he was a Director of FMR and Executive Vice President of FMR (a position he held until March 31, 1991), Vice President of Fidelity® Magellan® Fund and FMR Growth Group Leader, and Managing Director of FMR Corp. Mr. Lynch was also Vice President of Fidelity Investments Corporate Services. In addition, he serves as a Trustee of Boston College, Massachusetts Eye & Ear Infirmary, Historic Deerfield, John F. Kennedy Library, and the Museum of Fine Arts of Boston. |
John B. McDowell (46) |
| Year of Election or Appointment: 2002 Vice President of VIP Growth. Mr. McDowell also serves as Vice President of certain Equity Funds (2002). He is Senior Vice President of FMR (1999), FMR Co., Inc. (2001), and Fidelity Management Trust Company (FMTC). Since joining Fidelity Investments in 1985, Mr. McDowell has worked as a research analyst and manager. |
Jennifer Uhrig (43) |
| Year of Election or Appointment: 1997 Vice President of VIP Growth. Ms. Uhrig also serves as Vice President of another fund advised by FMR. Prior to assuming her current responsibilities, Ms. Uhrig managed a variety of Fidelity funds. |
Eric D. Roiter (56) |
| Year of Election or Appointment: 1998 Secretary of VIP Growth. He also serves as Secretary of other Fidelity funds; Vice President, General Counsel, and Secretary of FMR Co., Inc. (2001-present) and FMR; Vice President and Secretary of FDC; Assistant Secretary of Fidelity Management & Research (U.K.) Inc. (2001-present), Fidelity Management & Research (Far East) Inc. (2001-present), and of Fidelity Investments Money Management, Inc. (2001-present). Mr. Roiter is an Adjunct Member, Faculty of Law, at Boston College Law School (2003-present). |
Stuart Fross (45) |
| Year of Election or Appointment: 2003 Assistant Secretary of VIP Growth. Mr. Fross also serves as Assistant Secretary of other Fidelity funds (2003) and is an employee of FMR. |
Christine Reynolds (46) |
| Year of Election or Appointment: 2004 President, Treasurer, and Anti-Money Laundering (AML) officer of VIP Growth. Ms. Reynolds also serves as President, Treasurer, and AML officer of other Fidelity funds (2004) and is a Vice President (2003) and an employee (2002) of FMR. Before joining Fidelity Investments, Ms. Reynolds worked at PricewaterhouseCoopers LLP (PwC) (1980-2002), where she was most recently an audit partner with PwC's investment management practice. |
Timothy F. Hayes (54) |
| Year of Election or Appointment: 2002 Chief Financial Officer of VIP Growth. Mr. Hayes also serves as Chief Financial Officer of other Fidelity funds (2002). Recently he was appointed President of Fidelity Service Company (2003) where he also serves as a Director. Mr. Hayes also serves as President of Fidelity Investments Operations Group (FIOG, 2002), which includes Fidelity Pricing and Cash Management Services Group (FPCMS), where he was appointed President in 1998. Previously, Mr. Hayes served as Chief Financial Officer of Fidelity Investments Corporate Systems and Service Group (1998) and Fidelity Systems Company (1997-1998). |
Kenneth A. Rathgeber (57) |
| Year of Election or Appointment: 2004 Chief Compliance Officer of VIP Growth. Mr. Rathgeber also serves as Chief Compliance Officer of other Fidelity funds (2004) and Executive Vice President of Risk Oversight for Fidelity Investments (2002). Previously, he served as Executive Vice President and Chief Operating Officer for Fidelity Investments Institutional Services Company, Inc. (1998-2002). |
John R. Hebble (46) |
| Year of Election or Appointment: 2003 Deputy Treasurer of VIP Growth. Mr. Hebble also serves as Deputy Treasurer of other Fidelity funds (2003), and is an employee of FMR. Before joining Fidelity Investments, Mr. Hebble worked at Deutsche Asset Management where he served as Director of Fund Accounting (2002-2003) and Assistant Treasurer of the Scudder Funds (1998-2003). |
Kimberley H. Monasterio (41) |
| Year of Election or Appointment: 2004 Deputy Treasurer of VIP Growth. Ms. Monasterio also serves as Deputy Treasurer of other Fidelity funds (2004) and is an employee of FMR (2004). Before joining Fidelity Investments, Ms. Monasterio served as Treasurer (2000-2004) and Chief Financial Officer (2002-2004) of the Franklin Templeton Funds and Senior Vice President of Franklin Templeton Services, LLC (2000-2004). |
John H. Costello (58) |
| Year of Election or Appointment: 1986 Assistant Treasurer of VIP Growth. Mr. Costello also serves as Assistant Treasurer of other Fidelity funds and is an employee of FMR. |
Peter L. Lydecker (50) |
| Year of Election or Appointment: 2004 Assistant Treasurer of VIP Growth. Mr. Lydecker also serves as Assistant Treasurer of other Fidelity funds (2004) and is an employee of FMR. |
Mark Osterheld (49) |
| Year of Election or Appointment: 2002 Assistant Treasurer of VIP Growth. Mr. Osterheld also serves as Assistant Treasurer of other Fidelity funds (2002) and is an employee of FMR. |
Kenneth B. Robins (35) |
| Year of Election or Appointment: 2004 Assistant Treasurer of VIP Growth. Mr. Robins also serves as Assistant Treasurer of other Fidelity funds (2004) and is an employee of FMR (2004). Before joining Fidelity Investments, Mr. Robins worked at KPMG LLP, where he was a partner in KPMG's department of professional practice (2002-2004) and a Senior Manager (1999-2000). In addition, Mr. Robins served as Assistant Chief Accountant, United States Securities and Exchange Commission (2000-2002). |
Annual Report
Distributions
A percentage of the dividends distributed during the fiscal year for the following classes qualifies for the dividends-received deduction for corporate shareholders:
Initial Class | 100% |
Service Class | 100% |
Service Class 2 | 100% |
Service Class 2R | 100% |
The fund will notify shareholders in January 2005 of amounts for use in preparing 2004 income tax returns.
Growth Portfolio
Proxy Voting Results
A special meeting of the fund's shareholders was held on December 14, 2004. The results of votes taken among shareholders on proposals before them are reported below. Each vote reported represents one dollar of net asset value held on the record date for the meeting.
PROPOSAL 1 |
To amend the Declaration of Trust to allow the Board of Trustees, if permitted by applicable law, to authorize fund mergers without shareholder approval. A |
| # of
Votes | % of
Votes |
Affirmative | 15,331,508,529.96 | 81.853 |
Against | 2,429,553,894.02 | 12.972 |
Abstain | 969,378,618.94 | 5.175 |
TOTAL | 18,730,441,042.92 | 100.000 |
PROPOSAL 2 |
To elect a Board of Trustees. A |
| # of
Votes | % of
Votes |
J. Michael Cook |
Affirmative | 17,770,642,454.98 | 94.876 |
Withheld | 959,798,587.94 | 5.124 |
TOTAL | 18,730,441,042.92 | 100.000 |
Ralph F. Cox |
Affirmative | 17,759,356,374.26 | 94.815 |
Withheld | 971,084,668.66 | 5.185 |
TOTAL | 18,730,441,042.92 | 100.000 |
Laura B. Cronin |
Affirmative | 17,797,888,742.24 | 95.021 |
Withheld | 932,552,300.68 | 4.979 |
TOTAL | 18,730,441,042.92 | 100.000 |
Dennis J. DirksB |
Affirmative | 17,802,602,074.45 | 95.046 |
Withheld | 927,838,968.47 | 4.954 |
TOTAL | 18,730,441,042.92 | 100.000 |
Robert M. Gates |
Affirmative | 17,784,855,823.58 | 94.952 |
Withheld | 945,585,219.34 | 5.048 |
TOTAL | 18,730,441,042.92 | 100.000 |
George H. Heilmeier |
Affirmative | 17,768,875,556.56 | 94.866 |
Withheld | 961,565,486.36 | 5.134 |
TOTAL | 18,730,441,042.92 | 100.000 |
Abigail P. Johnson |
Affirmative | 17,781,929,073.06 | 94.936 |
Withheld | 948,511,969.86 | 5.064 |
TOTAL | 18,730,441,042.92 | 100.000 |
Edward C. Johnson 3d |
Affirmative | 17,752,140,336.45 | 94.777 |
Withheld | 978,300,706.47 | 5.223 |
TOTAL | 18,730,441,042.92 | 100.000 |
Donald J. Kirk |
Affirmative | 17,772,467,361.45 | 94.885 |
Withheld | 957,973,681.47 | 5.115 |
TOTAL | 18,730,441,042.92 | 100.000 |
| # of
Votes | % of
Votes |
Marie L. Knowles |
Affirmative | 17,776,922,254.30 | 94.909 |
Withheld | 953,518,788.62 | 5.091 |
TOTAL | 18,730,441,042.92 | 100.000 |
Ned C. Lautenbach |
Affirmative | 17,804,221,564.95 | 95.055 |
Withheld | 926,219,477.97 | 4.945 |
TOTAL | 18,730,441,042.92 | 100.000 |
Marvin L. Mann |
Affirmative | 17,763,277,607.06 | 94.836 |
Withheld | 967,163,435.86 | 5.164 |
TOTAL | 18,730,441,042.92 | 100.000 |
William O. McCoy |
Affirmative | 17,758,560,162.11 | 94.811 |
Withheld | 971,880,880.81 | 5.189 |
TOTAL | 18,730,441,042.92 | 100.000 |
Robert L. Reynolds |
Affirmative | 17,806,026,904.06 | 95.065 |
Withheld | 924,414,138.86 | 4.935 |
TOTAL | 18,730,441,042.92 | 100.000 |
Cornelia M. SmallB |
Affirmative | 17,798,878,892.31 | 95.026 |
Withheld | 931,562,150.61 | 4.974 |
TOTAL | 18,730,441,042.92 | 100.000 |
William S. Stavropoulos |
Affirmative | 17,786,496,107.78 | 94.960 |
Withheld | 943,944,935.14 | 5.040 |
TOTAL | 18,730,441,042.92 | 100.000 |
PROPOSAL 3 |
To approve a new sub-advisory agreement among FMR, FMR U.K., and Variable Insurance Products Fund on behalf of the fund. |
| # of
Votes | % of
Votes |
Affirmative | 5,975,028,070.83 | 88.802 |
Against | 315,998,524.66 | 4.696 |
Abstain | 437,489,754.25 | 6.502 |
TOTAL | 6,728,516,349.74 | 100.000 |
PROPOSAL 4 |
To approve a new sub-advisory agreement among FMR, FMR Far East, and Variable Insurance Products Fund on behalf of the fund. |
| # of
Votes | % of
Votes |
Affirmative | 5,967,060,487.85 | 88.683 |
Against | 322,604,636.29 | 4.795 |
Abstain | 438,851,225.60 | 6.522 |
TOTAL | 6,728,516,349.74 | 100.000 |
PROPOSAL 5 |
To approve a new amended and restated sub-advisory agreement between FMR Far East and FIJ for the fund. |
| # of
Votes | % of
Votes |
Affirmative | 5,952,404,198.80 | 88.465 |
Against | 333,946,456.42 | 4.963 |
Abstain | 442,165,694.52 | 6.572 |
TOTAL | 6,728,516,349.74 | 100.000 |
PROPOSAL 6 |
To approve a new master international research agreement between FMR and FIIA on behalf of the fund. |
| # of
Votes | % of
Votes |
Affirmative | 5,970,554,038.68 | 88.735 |
Against | 321,092,817.96 | 4.772 |
Abstain | 436,869,493.10 | 6.493 |
TOTAL | 6,728,516,349.74 | 100.000 |
PROPOSAL 7 |
To approve a new sub-research agreement between FIIA and FIIA (U.K.)L on behalf of the fund. |
| # of
Votes | % of
Votes |
Affirmative | 5,968,891,984.81 | 88.710 |
Against | 319,296,673.74 | 4.746 |
Abstain | 440,327,691.19 | 6.544 |
TOTAL | 6,728,516,349.74 | 100.000 |
PROPOSAL 8 |
To approve a new sub-research agreement between FIIA and FIJ on behalf of the fund. |
| # of
Votes | % of
Votes |
Affirmative | 5,979,761,945.37 | 88.872 |
Against | 322,291,647.58 | 4.790 |
Abstain | 426,462,756.79 | 6.338 |
TOTAL | 6,728,516,349.74 | 100.000 |
PROPOSAL 9 |
To amend the fund's fundamental investment limitation concerning borrowing. |
| # of
Votes | % of
Votes |
Affirmative | 5,946,204,016.89 | 88.373 |
Against | 412,358,112.36 | 6.129 |
Abstain | 369,954,220.49 | 5.498 |
TOTAL | 6,728,516,349.74 | 100.000 |
PROPOSAL 10 |
To amend the fund's fundamental investment limitation concerning lending. |
| # of
Votes | % of
Votes |
Affirmative | 5,843,159,022.83 | 86.842 |
Against | 468,598,250.73 | 6.964 |
Abstain | 416,759,076.18 | 6.194 |
TOTAL | 6,728,516,349.74 | 100.000 |
A Denotes trust-wide proposals and voting results. B Effective January 1, 2005. |
Growth Portfolio
Annual Report
Annual Report
Annual Report
Investment Adviser
Fidelity Management & Research Company
Boston, MA
Investment Sub-Adviser
FMR Co., Inc.
General Distributor
Fidelity Distributors Corporation
Boston, MA
Transfer and Shareholder Servicing Agent
Fidelity Investments Institutional Operations Company, Inc.
Boston, MA
Custodian
Mellon Bank, N.A.
Pittsburgh, PA
VIPGRWTR-ANN-0205
1.811845.100
Fidelity® Variable Insurance Products:
High Income Portfolio - Class R
Annual Report
December 31, 2004
(2_fidelity_logos) (Registered_Trademark)
Contents
Performance | 3 | How the fund has done over time. |
Management's Discussion | 4 | The manager's review of fund performance, strategy and outlook. |
Shareholder Expense Example | 5 | An example of shareholder expenses. |
Investment Summary | 6 | A summary of the fund's investments at period end. |
Investments | 7 | A complete list of the fund's investments with their
market values. |
Financial Statements | 15 | Statements of assets and liabilities, operations, and
changes in net assets, as well as financial highlights. |
Notes | 20 | Notes to the financial statements. |
Report of Independent Registered Public Accounting Firm | 24 | |
Trustees and Officers | 25 | |
Proxy Voting Results | 30 | |
| | |
To view a fund's proxy voting guidelines and proxy voting record for the 12-month period ended June 30, visit www.fidelity.com/proxyvotingresults or visit the Securities and Exchange Commission's (SEC) web site at www.sec.gov. You may also call 1-800-544-5429 to request a free copy of the proxy voting guidelines.
Fidelity Variable Insurance Products are separate account options which are purchased through a variable insurance contract.
Standard & Poor's, S&P and S&P 500 are registered service marks of The McGraw-Hill Companies, Inc. and have been licensed for use by Fidelity Distributors Corporation.
Other third party marks appearing herein are the property of their respective owners.
All other marks appearing herein are registered or unregistered trademarks or service marks of FMR Corp. or an affiliated company.
(Recycle graphic) This report is printed on recycled paper using soy-based inks.
This report and the financial statements contained herein are submitted for the general information of the shareholders of the fund. This report is not authorized for distribution to prospective investors in the fund unless preceded or accompanied by an effective prospectus.
A fund files its complete schedule of portfolio holdings with the SEC for the first and third quarters of each fiscal year on Form N-Q. Forms N-Q are available on the SEC's web site at http://www.sec.gov. A fund's Forms N-Q may be reviewed and copied at the SEC's Public Reference Room in Washington, DC. Information regarding the operation of the SEC's Public Reference Room may be obtained by calling 1-800-SEC-0330. For a complete list of a fund's portfolio holdings, view the most recent quarterly holdings report, semiannual report, or annual report on Fidelity's web site at http://www.advisor.fidelity.com.
NOT FDIC INSURED · MAY LOSE VALUE · NO BANK GUARANTEE
Neither the fund nor Fidelity Distributors Corporation is a bank.
High Income Portfolio
Fidelity Variable Insurance Products: High Income Portfolio
Performance: The Bottom Line
Average annual total return reflects the change in the value of an investment, assuming reinvestment of a class' dividend income and capital gains (the profits earned upon the sale of securities that have grown in value) and assuming a constant rate of performance each year. During periods of reimbursement by Fidelity, a fund's total return will be greater than it would be had the reimbursement not occurred. Performance numbers are net of all underlying fund operating expenses, but do not include any insurance charges imposed by your insurance company's separate account. If performance information included the effect of these additional charges, the total returns would have been lower. How a fund did yesterday is no guarantee of how it will do tomorrow.
Average Annual Total Returns
Periods ended December 31, 2004 | Past 1
year | Past 5
years | Past 10
years |
Fidelity VIP: High Income - Initial Class R A | 9.59% | -0.27% | 5.17% |
Fidelity VIP: High Income - Service Class R B | 9.47% | -0.38% | 5.08% |
Fidelity VIP: High Income - Service Class 2R C | 9.38% | -0.55% | 4.99% |
A The initial offering of Initial Class R shares took place on April 14, 2004. Returns prior to April 14, 2004 are those of Initial Class.
B The initial offering of Service Class R shares took place on April 14, 2004. Performance for Service Class R shares reflects an asset-based service fee (12b-1 fee). Returns from November 3, 1997 to April 14, 2004 are those of Service Class. Returns prior to November 3, 1997 are those of Initial Class and do not include the effects of a 12b-1 fee. Had Service Class R's 12b-1 fee been reflected, returns prior to November 3, 1997 would have been lower.
C The initial offering of Service Class 2R shares took place on April 14, 2004. Performance for Service Class 2R shares reflects an asset-based service fee (12b-1 fee). Returns from January 12, 2000 to April 14, 2004 are those of Service Class 2. Returns from November 3, 1997 to January 12, 2000 are those of Service Class which reflect a different 12b-1 fee. Service Class 2R returns prior to November 3, 1997 are those of Initial Class and do not include the effects of a 12b-1 fee. Had Service Class 2R's 12b-1 fee been reflected, returns prior to January 12, 2000 would have been lower.
$10,000 Over 10 Years
Let's say hypothetically that $10,000 was invested in Fidelity ® Variable Insurance Products: High Income SM Portfolio - Initial Class on December 31, 1994. The chart shows how the value of your investment would have changed, and also shows how the ML US High Yield Master II Index performed over the same period.
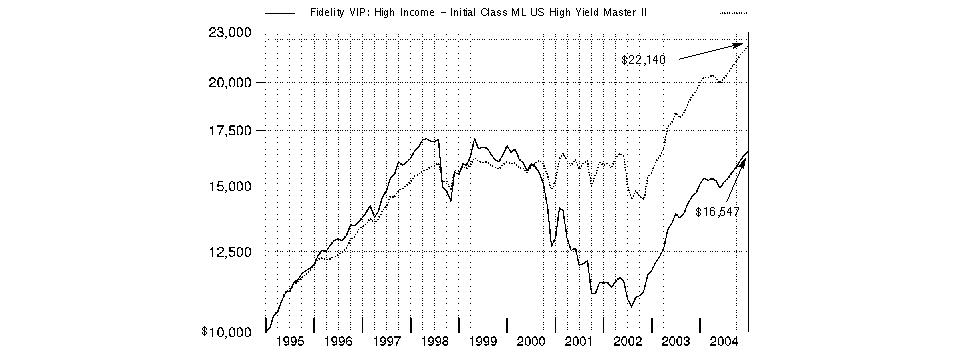
Annual Report
Fidelity Variable Insurance Products: High Income Portfolio
Management's Discussion of Fund Performance
Comments from Matthew Conti, Portfolio Manager of Fidelity® Variable Insurance Products: High Income Portfolio
Investors in high-yield securities generally found positive returns in 2004, as the Merrill Lynch® U.S. High Yield Master II Index advanced 10.87% for the year overall. This performance marks the first time the high-yield bond market has posted two consecutive years of double-digit increases since 1996-1997. The strong demand for the attractive yields of high-income securities, plus ready access to capital and a declining default rate, helped drive returns in this non-investment-grade asset class. As corporate America continued to improve its cash flows and deleverage its balance sheets, the stronger credit profiles for companies borrowing in the high-yield market served to make investors less risk averse, particularly in the more speculative credit tiers such as CCC-rated securities, which returned 15.75% during the past year. In comparison, the BB-rated and B-rated sectors rose 9.33% and 10.44%, respectively. As was the case in the equity markets, energy, metals/mining and other commodity industries were among the leaders in the high-yield universe.
During the 12 months that ended December 31, 2004, High Income Portfolio underperformed its benchmark, the Merrill Lynch U.S. High Yield Master II Index, and performed roughly in line with the LipperSM Variable Annuity High Current Yield Funds Average, which returned 9.84%. The fund underperformed the index because of its avoidance of the lowest-rated bonds and distressed securities, which performed best during the period. An overweighting in the telecommunications industry also held back performance. On the plus side, strong security selection in cable TV, health care, chemicals and utilities helped the fund's relative performance. Top performers included Huntsman Chemicals, electric utilities AES and Cogentrix, and Delta Airlines. Among the investments that detracted from the fund's performance were semiconductor testing and packaging company Amkor Technology, telecom service provider Cincinnati Bell, theme park company Six Flags and television station operator Granite Broadcasting.
The views expressed in this statement reflect those of the portfolio manager only through the end of the period of the report as stated on the cover and do not necessarily represent the views of Fidelity or any other person in the Fidelity organization. Any such views are subject to change at any time based upon market or other conditions and Fidelity disclaims any responsibility to update such views. These views may not be relied on as investment advice and, because investment decisions for a Fidelity fund are based on numerous factors, may not be relied on as an indication of trading intent on behalf of any Fidelity fund.
High Income Portfolio
Fidelity Variable Insurance Products: High Income Portfolio
Shareholder Expense Example
As a shareholder of the Fund, you incur two types of costs: (1) transaction costs, including redemption fees, and (2) ongoing costs, including management fees, distribution and/or service (12b-1) fees and other Fund expenses. This Example is intended to help you understand your ongoing costs (in dollars) of investing in the Fund and to compare these costs with the ongoing costs of investing in other mutual funds.
The Example is based on an investment of $1,000 invested at the beginning of the period and held for the entire period (July 1, 2004 to December 31, 2004).
Actual Expenses
The first line of the table below for each class of the Fund provides information about actual account values and actual expenses. You may use the information in this line, together with the amount you invested, to estimate the expenses that you paid over the period. Simply divide your account value by $1,000.00 (for example, an $8,600 account value divided by $1,000.00 = 8.6), then multiply the result by the number in the first line for a class of the Fund under the heading entitled "Expenses Paid During Period" to estimate the expenses you paid on your account during this period. The estimate of expenses does not include any fees or other expenses of any variable annuity or variable life insurance product. If they were, the estimate of expenses you paid during the period would be higher, and your ending account value would be lower.
Hypothetical Example for Comparison Purposes
The second line of the table below for each class of the Fund provides information about hypothetical account values and hypothetical expenses based on a Class' actual expense ratio and an assumed rate of return of 5% per year before expenses, which is not the Class' actual return. The hypothetical account values and expenses may not be used to estimate the actual ending account balance or expenses you paid for the period. You may use this information to compare the ongoing costs of investing in the Fund and other funds. To do so, compare this 5% hypothetical example with the 5% hypothetical examples that appear in the shareholder reports of the other funds. The estimate of expenses does not include any fees or other expenses of any variable annuity or variable life insurance product. If they were, the estimate of expenses you paid during the period would be higher, and your ending account value would be lower.
Please note that the expenses shown in the table are meant to highlight your ongoing costs only and do not reflect any transaction costs. Therefore, the second line of the table is useful in comparing ongoing costs only, and will not help you determine the relative total costs of owning different funds. In addition, if these transactional costs were included, your costs would have been higher.
| Beginning
Account Value
July 1, 2004 | Ending
Account Value
December 31, 2004 | Expenses Paid
During Period *
July 1, 2004
to December 31, 2004 |
Initial Class | | | |
Actual | $ 1,000.00 | $ 1,088.60 | $ 3.78 |
Hypothetical A | $ 1,000.00 | $ 1,021.52 | $ 3.66 |
Service Class | | | |
Actual | $ 1,000.00 | $ 1,089.10 | $ 4.31 |
Hypothetical A | $ 1,000.00 | $ 1,021.01 | $ 4.17 |
Service Class 2 | | | |
Actual | $ 1,000.00 | $ 1,088.20 | $ 5.14 |
Hypothetical A | $ 1,000.00 | $ 1,020.21 | $ 4.98 |
Initial Class R | | | |
Actual | $ 1,000.00 | $ 1,090.30 | $ 3.73 |
Hypothetical A | $ 1,000.00 | $ 1,021.57 | $ 3.61 |
Service Class R | | | |
Actual | $ 1,000.00 | $ 1,089.10 | $ 4.25 |
Hypothetical A | $ 1,000.00 | $ 1,021.06 | $ 4.12 |
Service Class 2R | | | |
Actual | $ 1,000.00 | $ 1,088.20 | $ 5.04 |
Hypothetical A | $ 1,000.00 | $ 1,020.31 | $ 4.88 |
A 5% return per year before expenses
*Expenses are equal to each Class' annualized expense ratio (shown in the table below); multiplied by the average account value over the period, multiplied by 184/366 (to reflect the one-half year period).
| Annualized
Expense Ratio |
Initial Class | .72% |
Service Class | .82% |
Service Class 2 | .98% |
Initial Class R | .71% |
Service Class R | .81% |
Service Class 2R | .96% |
Annual Report
Fidelity Variable Insurance Products: High Income Portfolio
Investment Summary
Top Five Holdings as of December 31, 2004 |
(by issuer, excluding cash equivalents) | % of fund's
net assets |
AES Corp. | 1.9 |
American Airlines, Inc. pass thru trust certificates | 1.6 |
Xerox Corp. | 1.6 |
Nextel Communications, Inc. | 1.5 |
MGM MIRAGE | 1.5 |
| 8.1 |
Top Five Market Sectors as of December 31, 2004 |
| % of fund's
net assets |
Telecommunications | 9.6 |
Energy | 7.5 |
Chemicals | 7.2 |
Electric Utilities | 7.0 |
Healthcare | 6.2 |
Quality Diversification (% of fund's net assets) as of December 31, 2004 |
 | AAA, AA, A | 0.0% | |
 | BBB | 0.3% | |
 | BB | 36.8% | |
 | B | 46.6% | |
 | CCC, CC, C | 10.1% | |
 | Not Rated | 3.0% | |
 | Other Investments | 0.3% | |
 | Equities | 0.3% | |
 | Short-Term Investments and Net Other Assets | 2.6% | |
We have used ratings from Moody's Investors Services, Inc. Where Moody's ratings are not available, we have used S&P ratings. |

High Income Portfolio
Fidelity Variable Insurance Products: High Income Portfolio
Investments December 31, 2004
Showing Percentage of Net Assets
Nonconvertible Bonds - 91.1% |
| Principal
Amount | | Value
(Note 1) |
Aerospace - 1.0% |
Bombardier, Inc. 6.3% 5/1/14 (e) | | $ 5,565,000 | | $ 4,827,638 |
L-3 Communications Corp. 5.875% 1/15/15 (e) | | 4,910,000 | | 4,897,725 |
Orbital Sciences Corp. 9% 7/15/11 | | 4,720,000 | | 5,310,000 |
Primus International, Inc. 10.5% 4/15/09 (e) | | 3,170,000 | | 3,312,650 |
| | 18,348,013 |
Air Transportation - 3.7% |
American Airlines, Inc. pass thru trust certificates: | | | | |
6.817% 5/23/11 | | 11,825,000 | | 11,115,500 |
6.977% 11/23/22 | | 556,744 | | 520,555 |
7.324% 4/15/11 | | 1,480,000 | | 1,228,400 |
7.377% 5/23/19 | | 14,357,509 | | 10,050,256 |
7.379% 5/23/16 | | 6,249,810 | | 4,374,867 |
7.8% 4/1/08 | | 2,595,000 | | 2,413,350 |
10.18% 1/2/13 | | 2,190,000 | | 1,708,200 |
AMR Corp. 10.2% 3/15/20 | | 165,000 | | 125,400 |
Delta Air Lines, Inc.: | | | | |
7.9% 12/15/09 | | 7,330,000 | | 4,617,900 |
8.3% 12/15/29 | | 13,070,000 | | 6,306,275 |
9.5% 11/18/08 (e) | | 4,862,000 | | 4,558,125 |
10% 8/15/08 | | 3,370,000 | | 2,502,225 |
Delta Air Lines, Inc. pass thru trust certificates: | | | | |
7.379% 5/18/10 | | 1,087,647 | | 1,084,928 |
7.57% 11/18/10 | | 2,950,000 | | 2,909,892 |
7.711% 9/18/11 | | 865,000 | | 657,400 |
7.92% 5/18/12 | | 1,565,000 | | 1,205,050 |
Northwest Airlines Corp. 10% 2/1/09 | | 13,840,000 | | 11,625,600 |
Northwest Airlines, Inc. pass thru trust certificates: | | | | |
7.67% 1/2/15 | | 1,360,819 | | 1,187,315 |
8.07% 1/2/15 | | 1,442,283 | | 1,009,598 |
| | 69,200,836 |
Automotive - 1.1% |
Delco Remy International, Inc. 9.375% 4/15/12 | | 5,510,000 | | 5,702,850 |
Navistar International Corp. 7.5% 6/15/11 | | 5,815,000 | | 6,222,050 |
Stoneridge, Inc. 11.5% 5/1/12 | | 2,715,000 | | 3,108,675 |
Tenneco Automotive, Inc.: | | | | |
8.625% 11/15/14 (e) | | 3,055,000 | | 3,169,563 |
10.25% 7/15/13 | | 2,515,000 | | 2,967,700 |
| | 21,170,838 |
Banks and Thrifts - 0.2% |
Western Financial Bank 9.625% 5/15/12 | | 2,565,000 | | 2,924,100 |
|
| Principal
Amount | | Value
(Note 1) |
Broadcasting - 0.3% |
Gray Television, Inc. 9.25% 12/15/11 | | $ 2,235,000 | | $ 2,503,200 |
Paxson Communications Corp. 0% 1/15/09 (d) | | 3,320,000 | | 3,104,200 |
| | 5,607,400 |
Building Materials - 1.3% |
Goodman Global Holdings, Inc. 5.76% 6/15/12 (e)(f) | | 4,905,000 | | 4,990,838 |
Jacuzzi Brands, Inc. 9.625% 7/1/10 | | 4,070,000 | | 4,517,700 |
Maax Holdings, Inc. 0% 12/15/12 (d)(e) | | 5,840,000 | | 3,679,200 |
Nortek, Inc. 8.5% 9/1/14 (e) | | 5,350,000 | | 5,590,750 |
Texas Industries, Inc. 10.25% 6/15/11 | | 4,860,000 | | 5,734,800 |
| | 24,513,288 |
Cable TV - 3.7% |
Adelphia Communications Corp.: | | | | |
7.875% 5/1/09 (c) | | 2,730,000 | | 2,457,000 |
9.875% 3/1/07 (c) | | 3,090,000 | | 3,012,750 |
10.25% 6/15/11 (c) | | 1,935,000 | | 1,944,675 |
Cablevision Systems Corp.: | | | | |
6.6688% 4/1/09 (e)(f) | | 8,870,000 | | 9,424,375 |
8% 4/15/12 (e) | | 4,120,000 | | 4,382,650 |
CSC Holdings, Inc. 7.625% 4/1/11 | | 2,950,000 | | 3,186,000 |
DirecTV Holdings LLC/DirecTV Financing, Inc. 8.375% 3/15/13 | | 5,765,000 | | 6,456,800 |
EchoStar DBS Corp.: | | | | |
5.75% 10/1/08 | | 15,085,000 | | 15,311,275 |
6.625% 10/1/14 (e) | | 7,590,000 | | 7,703,850 |
GCI, Inc. 7.25% 2/15/14 | | 3,425,000 | | 3,425,000 |
NTL Cable PLC: | | | | |
7.07% 10/15/12 (e)(f) | | 4,400,000 | | 4,532,000 |
8.75% 4/15/14 (e) | | 1,635,000 | | 1,839,375 |
Telenet Group Holding NV 0% 6/15/14 (d)(e) | | 5,505,000 | | 4,183,800 |
| | 67,859,550 |
Capital Goods - 2.9% |
Amsted Industries, Inc. 10.25% 10/15/11 (e) | | 2,860,000 | | 3,246,100 |
Dresser, Inc. 9.375% 4/15/11 | | 7,700,000 | | 8,412,250 |
Invensys PLC 9.875% 3/15/11 (e) | | 15,105,000 | | 16,313,400 |
Leucadia National Corp. 7% 8/15/13 | | 5,775,000 | | 5,948,250 |
Park-Ohio Industries, Inc. 8.375% 11/15/14 (e) | | 3,645,000 | | 3,635,888 |
Sensus Metering Systems, Inc. 8.625% 12/15/13 | | 3,370,000 | | 3,471,100 |
SPX Corp.: | | | | |
6.25% 6/15/11 | | 3,100,000 | | 3,270,500 |
7.5% 1/1/13 | | 7,970,000 | | 8,667,375 |
| | 52,964,863 |
Nonconvertible Bonds - continued |
| Principal
Amount | | Value
(Note 1) |
Chemicals - 7.1% |
BCP Caylux Holdings Luxembourg SCA 9.625% 6/15/14 (e) | | $ 11,360,000 | | $ 12,723,200 |
Borden US Finance Corp./Nova Scotia Finance ULC: | | | | |
6.82% 7/15/10 (e)(f) | | 3,490,000 | | 3,647,050 |
9% 7/15/14 (e) | | 5,655,000 | | 6,220,500 |
Equistar Chemicals LP 7.55% 2/15/26 | | 8,495,000 | | 8,346,338 |
Equistar Chemicals LP/Equistar Funding Corp.: | | | | |
8.75% 2/15/09 | | 4,535,000 | | 5,033,850 |
10.125% 9/1/08 | | 2,905,000 | | 3,340,750 |
HMP Equity Holdings Corp. 0% 5/15/08 | | 6,545,000 | | 4,286,975 |
Huntsman ICI Chemicals LLC 10.125% 7/1/09 | | 31,000 | | 32,705 |
Huntsman ICI Holdings LLC 0% 12/31/09 | | 8,015,000 | | 4,528,475 |
Huntsman International LLC: | | | | |
7.375% 1/1/15 (e) | | 5,010,000 | | 5,047,575 |
9.875% 3/1/09 | | 4,700,000 | | 5,146,500 |
Huntsman LLC: | | | | |
9.32% 7/15/11 (e)(f) | | 5,700,000 | | 6,355,500 |
11.5% 7/15/12 (e) | | 5,555,000 | | 6,527,125 |
Lubrizol Corp. 4.625% 10/1/09 | | 6,100,000 | | 6,090,588 |
Lyondell Chemical Co.: | | | | |
9.5% 12/15/08 | | 12,345,000 | | 13,456,050 |
9.625% 5/1/07 | | 1,260,000 | | 1,382,850 |
10.875% 5/1/09 | | 6,965,000 | | 7,382,900 |
11.125% 7/15/12 | | 4,320,000 | | 5,108,400 |
Millennium America, Inc. 9.25% 6/15/08 | | 11,420,000 | | 12,904,600 |
NOVA Chemicals Corp.: | | | | |
6.5% 1/15/12 | | 6,255,000 | | 6,599,025 |
7.4% 4/1/09 | | 6,420,000 | | 6,933,600 |
| | 131,094,556 |
Consumer Products - 0.7% |
Church & Dwight Co., Inc. 6% 12/15/12 (e) | | 5,275,000 | | 5,367,313 |
Jostens Holding Corp. 0% 12/1/13 (d) | | 3,050,000 | | 2,165,500 |
Jostens IH Corp. 7.625% 10/1/12 (e) | | 1,970,000 | | 2,068,500 |
Samsonite Corp. 8.875% 6/1/11 | | 2,785,000 | | 3,014,763 |
| | 12,616,076 |
Containers - 2.5% |
Anchor Glass Container Corp. 11% 2/15/13 | | 4,335,000 | | 4,703,475 |
Berry Plastics Corp. 10.75% 7/15/12 | | 3,700,000 | | 4,227,250 |
BWAY Corp. 10% 10/15/10 | | 6,685,000 | | 7,119,525 |
Crown Cork & Seal, Inc. 8% 4/15/23 | | 230,000 | | 226,550 |
|
| Principal
Amount | | Value
(Note 1) |
Crown European Holdings SA: | | | | |
9.5% 3/1/11 | | $ 1,405,000 | | $ 1,594,675 |
10.875% 3/1/13 | | 7,905,000 | | 9,347,663 |
Owens-Brockway Glass Container, Inc.: | | | | |
8.25% 5/15/13 | | 5,115,000 | | 5,626,500 |
8.75% 11/15/12 | | 1,750,000 | | 1,964,375 |
8.875% 2/15/09 | | 655,000 | | 710,675 |
Owens-Illinois, Inc.: | | | | |
7.35% 5/15/08 | | 3,505,000 | | 3,697,775 |
7.5% 5/15/10 | | 6,140,000 | | 6,516,075 |
| | 45,734,538 |
Diversified Media - 0.8% |
Corus Entertainment, Inc. 8.75% 3/1/12 | | 6,140,000 | | 6,730,975 |
LBI Media Holdings, Inc. 0% 10/15/13 (d) | | 6,440,000 | | 4,733,400 |
LBI Media, Inc. 10.125% 7/15/12 | | 3,285,000 | | 3,662,775 |
| | 15,127,150 |
Electric Utilities - 6.2% |
AES Corp.: | | | | |
7.75% 3/1/14 | | 5,965,000 | | 6,442,200 |
8.75% 6/15/08 | | 3,068,000 | | 3,344,120 |
8.875% 2/15/11 | | 13,481,000 | | 15,402,043 |
9.375% 9/15/10 | | 6,433,000 | | 7,438,156 |
9.5% 6/1/09 | | 1,499,000 | | 1,703,239 |
AES Gener SA 7.5% 3/25/14 (e) | | 4,200,000 | | 4,420,500 |
Chivor SA E.S.P. 9.75% 12/30/14 (e) | | 2,060,000 | | 2,142,400 |
CMS Energy Corp.: | | | | |
7.5% 1/15/09 | | 4,150,000 | | 4,419,750 |
7.75% 8/1/10 | | 1,970,000 | | 2,154,688 |
8.5% 4/15/11 | | 945,000 | | 1,073,756 |
8.9% 7/15/08 | | 2,180,000 | | 2,406,175 |
9.875% 10/15/07 | | 5,470,000 | | 6,099,050 |
MSW Energy Holdings II LLC/MSW Finance Co. II, Inc. 7.375% 9/1/10 | | 2,950,000 | | 3,097,500 |
MSW Energy Holdings LLC/MSW Energy Finance Co., Inc. 8.5% 9/1/10 | | 2,505,000 | | 2,730,450 |
Nevada Power Co. 6.5% 4/15/12 | | 4,225,000 | | 4,467,938 |
NRG Energy, Inc. 8% 12/15/13 (e) | | 16,260,000 | | 17,743,725 |
Sierra Pacific Power Co. 6.25% 4/15/12 | | 4,100,000 | | 4,274,250 |
Sierra Pacific Resources 8.625% 3/15/14 | | 2,315,000 | | 2,615,950 |
TECO Energy, Inc.: | | | | |
7% 5/1/12 | | 5,880,000 | | 6,453,300 |
Nonconvertible Bonds - continued |
| Principal
Amount | | Value
(Note 1) |
Electric Utilities - continued |
TECO Energy, Inc.: - continued | | | | |
7.2% 5/1/11 | | $ 11,040,000 | | $ 12,199,200 |
Texas Genco LLC/Texas Genco Financing Corp. 6.875% 12/15/14 (e) | | 4,260,000 | | 4,430,400 |
| | 115,058,790 |
Energy - 6.2% |
Belden & Blake Corp. 8.75% 7/15/12 (e) | | 3,350,000 | | 3,425,375 |
Chesapeake Energy Corp.: | | | | |
7.75% 1/15/15 | | 6,100,000 | | 6,649,000 |
8.125% 4/1/11 | | 2,875,000 | | 3,097,813 |
9% 8/15/12 | | 1,920,000 | | 2,181,600 |
El Paso Energy Corp. 6.95% 12/15/07 | | 3,350,000 | | 3,492,375 |
El Paso Production Holding Co. 7.75% 6/1/13 | | 905,000 | | 943,463 |
Hanover Compressor Co.: | | | | |
0% 3/31/07 | | 5,595,000 | | 4,867,650 |
8.625% 12/15/10 | | 1,450,000 | | 1,580,500 |
9% 6/1/14 | | 1,540,000 | | 1,709,400 |
Hilcorp Energy I LP/Hilcorp Finance Co. 10.5% 9/1/10 (e) | | 5,810,000 | | 6,565,300 |
Newfield Exploration Co. 6.625% 9/1/14 (e) | | 4,720,000 | | 4,991,400 |
Parker Drilling Co.: | | | | |
7.15% 9/1/10 (e)(f) | | 9,030,000 | | 9,458,925 |
9.625% 10/1/13 | | 1,505,000 | | 1,691,244 |
Plains Exploration & Production Co.: | | | | |
7.125% 6/15/14 | | 295,000 | | 323,025 |
8.75% 7/1/12 | | 2,540,000 | | 2,841,625 |
Pride International, Inc. 7.375% 7/15/14 | | 7,845,000 | | 8,551,050 |
Range Resources Corp. 7.375% 7/15/13 | | 9,635,000 | | 10,309,450 |
SESI LLC 8.875% 5/15/11 | | 1,740,000 | | 1,905,300 |
Sonat, Inc.: | | | | |
6.625% 2/1/08 | | 2,070,000 | | 2,095,875 |
6.75% 10/1/07 | | 800,000 | | 840,000 |
7.625% 7/15/11 | | 6,665,000 | | 6,873,281 |
Stone Energy Corp. 6.75% 12/15/14 (e) | | 3,990,000 | | 3,950,100 |
The Coastal Corp.: | | | | |
6.375% 2/1/09 | | 6,395,000 | | 6,339,044 |
6.5% 6/1/08 | | 4,840,000 | | 4,864,200 |
7.75% 6/15/10 | | 11,464,000 | | 11,979,880 |
Venoco, Inc. 8.75% 12/15/11 (e) | | 3,230,000 | | 3,326,900 |
| | 114,853,775 |
|
| Principal
Amount | | Value
(Note 1) |
Entertainment/Film - 0.3% |
Cinemark, Inc. 0% 3/15/14 (d) | | $ 7,415,000 | | $ 5,616,863 |
Environmental - 0.9% |
Allied Waste North America, Inc.: | | | | |
5.75% 2/15/11 | | 5,175,000 | | 4,864,500 |
6.375% 4/15/11 | | 3,890,000 | | 3,695,500 |
8.5% 12/1/08 | | 3,690,000 | | 3,929,850 |
8.875% 4/1/08 | | 3,725,000 | | 3,985,750 |
| | 16,475,600 |
Food and Drug Retail - 2.0% |
Jean Coutu Group, Inc.: | | | | |
7.625% 8/1/12 (e) | | 1,440,000 | | 1,522,800 |
8.5% 8/1/14 (e) | | 4,195,000 | | 4,299,875 |
Rite Aid Corp.: | | | | |
6.875% 8/15/13 | | 5,655,000 | | 5,103,638 |
8.125% 5/1/10 | | 1,120,000 | | 1,181,600 |
9.25% 6/1/13 | | 7,255,000 | | 7,363,825 |
9.5% 2/15/11 | | 4,655,000 | | 5,120,500 |
Stater Brothers Holdings, Inc.: | | | | |
5.99% 6/15/10 (f) | | 7,155,000 | | 7,351,763 |
8.125% 6/15/12 | | 4,185,000 | | 4,436,100 |
| | 36,380,101 |
Food/Beverage/Tobacco - 2.9% |
B&G Foods, Inc. 8% 10/1/11 | | 3,310,000 | | 3,525,150 |
Del Monte Corp.: | | | | |
8.625% 12/15/12 | | 3,375,000 | | 3,763,125 |
9.25% 5/15/11 | | 4,215,000 | | 4,636,500 |
Dole Food Co., Inc. 7.25% 6/15/10 | | 8,125,000 | | 8,531,250 |
National Beef Packing Co. LLC/National Beef Finance Corp. 10.5% 8/1/11 | | 3,830,000 | | 3,964,050 |
Smithfield Foods, Inc.: | | | | |
7% 8/1/11 (e) | | 4,050,000 | | 4,323,375 |
7% 8/1/11 | | 1,315,000 | | 1,400,475 |
7.625% 2/15/08 | | 1,800,000 | | 1,926,000 |
7.75% 5/15/13 | | 3,935,000 | | 4,348,175 |
8% 10/15/09 | | 1,510,000 | | 1,668,550 |
Swift & Co. 10.125% 10/1/09 | | 4,345,000 | | 4,888,125 |
UAP Holding Corp. 0% 7/15/12 (d)(e) | | 6,050,000 | | 4,749,250 |
United Agriculture Products, Inc. 8.25% 12/15/11 (e) | | 4,949,000 | | 5,307,803 |
| | 53,031,828 |
Gaming - 4.4% |
Chumash Casino & Resort Enterprise 9% 7/15/10 (e) | | 2,760,000 | | 3,049,800 |
Mandalay Resort Group: | | | | |
9.375% 2/15/10 | | 4,655,000 | | 5,399,800 |
10.25% 8/1/07 | | 3,125,000 | | 3,546,875 |
MGM MIRAGE: | | | | |
6% 10/1/09 | | 13,125,000 | | 13,453,125 |
6.75% 9/1/12 | | 6,750,000 | | 7,121,250 |
Nonconvertible Bonds - continued |
| Principal
Amount | | Value
(Note 1) |
Gaming - continued |
MGM MIRAGE: - continued | | | | |
6.875% 2/6/08 | | $ 2,140,000 | | $ 2,300,500 |
8.5% 9/15/10 | | 4,125,000 | | 4,723,125 |
Mohegan Tribal Gaming Authority: | | | | |
6.375% 7/15/09 | | 7,065,000 | | 7,303,444 |
8% 4/1/12 | | 2,220,000 | | 2,422,575 |
MTR Gaming Group, Inc. 9.75% 4/1/10 | | 3,605,000 | | 3,965,500 |
Park Place Entertainment Corp. 7.875% 3/15/10 | | 4,825,000 | | 5,428,125 |
Scientific Games Corp. 6.25% 12/15/12 (e) | | 3,290,000 | | 3,331,125 |
Seneca Gaming Corp. 7.25% 5/1/12 | | 4,360,000 | | 4,545,300 |
Venetian Casino Resort LLC/Las Vegas Sands, Inc. 11% 6/15/10 | | 3,815,000 | | 4,358,638 |
Virgin River Casino Corp./RBG LLC/B&BB, Inc.: | | | | |
0% 1/15/13 (d)(e) | | 2,100,000 | | 1,312,500 |
9% 1/15/12 (e) | | 1,555,000 | | 1,617,200 |
Wheeling Island Gaming, Inc. 10.125% 12/15/09 | | 6,730,000 | | 7,167,450 |
| | 81,046,332 |
Healthcare - 6.2% |
AmerisourceBergen Corp.: | | | | |
7.25% 11/15/12 | | 6,070,000 | | 6,752,875 |
8.125% 9/1/08 | | 1,735,000 | | 1,930,188 |
CDRV Investors, Inc. 0% 1/1/15 (d)(e) | | 16,110,000 | | 9,947,925 |
Concentra Operating Corp.: | | | | |
9.125% 6/1/12 (e) | | 2,095,000 | | 2,367,350 |
9.5% 8/15/10 | | 2,145,000 | | 2,423,850 |
Elan Finance PLC/Elan Finance Corp. 7.75% 11/15/11 (e) | | 6,320,000 | | 6,762,400 |
Fisher Scientific International, Inc.: | | | | |
6.75% 8/15/14 (e) | | 2,510,000 | | 2,685,700 |
8% 9/1/13 | | 2,870,000 | | 3,257,450 |
8.125% 5/1/12 | | 875,000 | | 975,625 |
Genesis HealthCare Corp. 8% 10/15/13 | | 8,105,000 | | 8,793,925 |
HCA, Inc. 5.5% 12/1/09 | | 5,000,000 | | 5,004,700 |
Mayne Group Ltd. 5.875% 12/1/11 (e) | | 5,000,000 | | 5,087,500 |
Omega Healthcare Investors, Inc.: | | | | |
7% 4/1/14 | | 3,970,000 | | 4,089,100 |
7% 4/1/14 (e) | | 3,260,000 | | 3,357,800 |
PerkinElmer, Inc. 8.875% 1/15/13 | | 7,225,000 | | 8,218,438 |
Psychiatric Solutions, Inc. 10.625% 6/15/13 | | 6,335,000 | | 7,332,763 |
Senior Housing Properties Trust 8.625% 1/15/12 | | 9,170,000 | | 10,476,725 |
Spheris, Inc. 11% 12/15/12 (e) | | 2,710,000 | | 2,770,975 |
Tenet Healthcare Corp.: | | | | |
6.375% 12/1/11 | | 15,925,000 | | 14,651,000 |
|
| Principal
Amount | | Value
(Note 1) |
6.5% 6/1/12 | | $ 1,275,000 | | $ 1,188,938 |
7.375% 2/1/13 | | 4,305,000 | | 4,197,375 |
9.875% 7/1/14 (e) | | 2,040,000 | | 2,218,500 |
| | 114,491,102 |
Homebuilding/Real Estate - 4.1% |
American Real Estate Partners/American Real Estate Finance Corp. 8.125% 6/1/12 | | 13,630,000 | | 14,532,988 |
Beazer Homes USA, Inc.: | | | | |
6.5% 11/15/13 | | 860,000 | | 868,600 |
8.375% 4/15/12 | | 5,975,000 | | 6,572,500 |
D.R. Horton, Inc. 4.875% 1/15/10 | | 1,635,000 | | 1,626,825 |
K. Hovnanian Enterprises, Inc.: | | | | |
6% 1/15/10 (e) | | 1,330,000 | | 1,343,300 |
8.875% 4/1/12 | | 2,210,000 | | 2,431,000 |
KB Home 7.75% 2/1/10 | | 9,585,000 | | 10,303,875 |
Meritage Homes Corp. 7% 5/1/14 | | 3,370,000 | | 3,471,100 |
Standard Pacific Corp.: | | | | |
5.125% 4/1/09 | | 5,680,000 | | 5,594,800 |
6.5% 10/1/08 | | 5,480,000 | | 5,754,000 |
6.875% 5/15/11 | | 2,080,000 | | 2,184,000 |
Technical Olympic USA, Inc.: | | | | |
7.5% 3/15/11 | | 5,110,000 | | 5,110,000 |
9% 7/1/10 | | 1,110,000 | | 1,187,700 |
10.375% 7/1/12 | | 4,125,000 | | 4,620,000 |
WCI Communities, Inc.: | | | | |
7.875% 10/1/13 | | 2,605,000 | | 2,741,763 |
10.625% 2/15/11 | | 2,890,000 | | 3,207,900 |
William Lyon Homes, Inc. 7.5% 2/15/14 | | 4,895,000 | | 4,699,200 |
| | 76,249,551 |
Hotels - 1.1% |
Grupo Posadas SA de CV 8.75% 10/4/11 (e) | | 4,235,000 | | 4,542,038 |
Host Marriott LP 7.125% 11/1/13 | | 8,555,000 | | 9,111,075 |
La Quinta Properties, Inc. 7% 8/15/12 | | 5,950,000 | | 6,336,750 |
| | 19,989,863 |
Insurance - 0.2% |
Crum & Forster Holdings Corp. 10.375% 6/15/13 | | 3,605,000 | | 4,019,575 |
Leisure - 1.5% |
Equinox Holdings Ltd. 9% 12/15/09 | | 1,940,000 | | 2,056,400 |
NCL Corp. Ltd. 10.625% 7/15/14 (e) | | 1,430,000 | | 1,415,700 |
Town Sports International Holdings, Inc. 0% 2/1/14 (d) | | 3,870,000 | | 2,051,100 |
Town Sports International, Inc. 9.625% 4/15/11 | | 6,810,000 | | 7,184,550 |
Nonconvertible Bonds - continued |
| Principal
Amount | | Value
(Note 1) |
Leisure - continued |
Universal City Development Partners Ltd./UCDP Finance, Inc. 11.75% 4/1/10 | | $ 8,900,000 | | $ 10,535,375 |
Universal City Florida Holding Co. I/II 7.2% 5/1/10 (e)(f) | | 3,675,000 | | 3,812,813 |
| | 27,055,938 |
Metals/Mining - 1.9% |
Century Aluminum Co. 7.5% 8/15/14 (e) | | 4,540,000 | | 4,835,100 |
Compass Minerals International, Inc.: | | | | |
0% 12/15/12 (d) | | 5,940,000 | | 5,078,700 |
0% 6/1/13 (d) | | 9,470,000 | | 7,670,700 |
Peabody Energy Corp. 6.875% 3/15/13 | | 5,340,000 | | 5,780,550 |
Ryerson Tull, Inc. 8.25% 12/15/11 (e) | | 3,320,000 | | 3,394,700 |
Vedanta Resources PLC 6.625% 2/22/10 (e) | | 3,535,000 | | 3,543,838 |
Wise Metals Group LLC/Alloys Finance 10.25% 5/15/12 | | 4,815,000 | | 4,815,000 |
| | 35,118,588 |
Paper - 1.6% |
Cellu Tissue Holdings, Inc. 9.75% 3/15/10 | | 3,435,000 | | 3,572,400 |
Georgia-Pacific Corp.: | | | | |
8% 1/15/14 | | 3,675,000 | | 4,180,313 |
8.125% 5/15/11 | | 2,070,000 | | 2,380,500 |
8.875% 2/1/10 | | 485,000 | | 564,419 |
9.375% 2/1/13 | | 2,620,000 | | 3,052,300 |
Norske Skog Canada Ltd.: | | | | |
7.375% 3/1/14 | | 4,150,000 | | 4,326,375 |
8.625% 6/15/11 | | 10,765,000 | | 11,518,550 |
| | 29,594,857 |
Publishing/Printing - 1.2% |
Dex Media West LLC/Dex Media West Finance Co. 5.875% 11/15/11 (e) | | 3,340,000 | | 3,331,650 |
Houghton Mifflin Co. 9.875% 2/1/13 | | 4,065,000 | | 4,441,013 |
The Reader's Digest Association, Inc. 6.5% 3/1/11 | | 12,945,000 | | 13,527,525 |
| | 21,300,188 |
Railroad - 1.6% |
Kansas City Southern Railway Co.: | | | | |
7.5% 6/15/09 | | 13,155,000 | | 13,812,750 |
9.5% 10/1/08 | | 150,000 | | 168,750 |
TFM SA de CV yankee: | | | | |
10.25% 6/15/07 | | 505,000 | | 540,350 |
11.75% 6/15/09 | | 14,915,000 | | 15,138,725 |
| | 29,660,575 |
|
| Principal
Amount | | Value
(Note 1) |
Restaurants - 0.5% |
Friendly Ice Cream Corp. 8.375% 6/15/12 | | $ 4,760,000 | | $ 4,664,800 |
Landry's Seafood Restaurants, Inc. 7.5% 12/15/14 (e) | | 4,850,000 | | 4,831,813 |
| | 9,496,613 |
Services - 0.2% |
Iron Mountain, Inc. 8.625% 4/1/13 | | 3,035,000 | | 3,217,100 |
Shipping - 3.7% |
General Maritime Corp. 10% 3/15/13 | | 6,380,000 | | 7,337,000 |
H-Lines Finance Holding Corp. 0% 4/1/13 (d)(e) | | 2,295,000 | | 1,669,613 |
OMI Corp. 7.625% 12/1/13 | | 9,595,000 | | 10,266,650 |
Overseas Shipholding Group, Inc. 8.25% 3/15/13 | | 1,795,000 | | 1,996,938 |
Ship Finance International Ltd. 8.5% 12/15/13 | | 25,180,000 | | 25,935,379 |
Teekay Shipping Corp. 8.875% 7/15/11 | | 17,723,000 | | 20,558,680 |
| | 67,764,260 |
Steels - 2.0% |
Allegheny Technologies, Inc. 8.375% 12/15/11 | | 5,820,000 | | 6,460,200 |
CSN Islands VII Corp. 10.75% 9/12/08 (e) | | 5,755,000 | | 6,539,119 |
CSN Islands VIII Corp. 9.75% 12/16/13 (e) | | 3,100,000 | | 3,317,000 |
Gerdau AmeriSteel Corp./GUSAP Partners 10.375% 7/15/11 | | 10,130,000 | | 11,902,750 |
Ispat Inland ULC 9.75% 4/1/14 | | 6,622,000 | | 8,178,170 |
| | 36,397,239 |
Super Retail - 1.8% |
Asbury Automotive Group, Inc.: | | | | |
8% 3/15/14 | | 2,910,000 | | 2,880,900 |
9% 6/15/12 | | 9,895,000 | | 10,414,488 |
NBC Acquisition Corp. 0% 3/15/13 (d) | | 1,665,000 | | 1,215,450 |
Nebraska Book Co., Inc. 8.625% 3/15/12 | | 2,530,000 | | 2,580,600 |
Saks, Inc.: | | | | |
8.25% 11/15/08 | | 1,325,000 | | 1,444,250 |
9.875% 10/1/11 | | 7,130,000 | | 8,413,400 |
Sonic Automotive, Inc. 8.625% 8/15/13 | | 5,130,000 | | 5,489,100 |
| | 32,438,188 |
Technology - 5.4% |
Advanced Micro Devices, Inc. 7.75% 11/1/12 (e) | | 6,390,000 | | 6,653,588 |
Celestica, Inc. 7.875% 7/1/11 | | 13,125,000 | | 14,043,750 |
Flextronics International Ltd.: | | | | |
6.25% 11/15/14 (e) | | 11,465,000 | | 11,350,350 |
6.5% 5/15/13 | | 4,970,000 | | 5,069,400 |
Nonconvertible Bonds - continued |
| Principal
Amount | | Value
(Note 1) |
Technology - continued |
Freescale Semiconductor, Inc.: | | | | |
4.82% 7/15/09 (f) | | $ 4,460,000 | | $ 4,660,700 |
6.875% 7/15/11 | | 8,220,000 | | 8,815,950 |
7.125% 7/15/14 | | 1,585,000 | | 1,719,725 |
Lucent Technologies, Inc.: | | | | |
6.45% 3/15/29 | | 5,885,000 | | 5,355,350 |
6.5% 1/15/28 | | 1,600,000 | | 1,440,000 |
MagnaChip Semiconductor SA/MagnaChip Semiconductor Finance Co.: | | | | |
5.78% 12/15/11 (e)(f) | | 1,170,000 | | 1,200,713 |
8% 12/15/14 (e) | | 910,000 | | 948,675 |
Sanmina-SCI Corp. 10.375% 1/15/10 | | 3,265,000 | | 3,738,425 |
Xerox Capital Trust I 8% 2/1/27 | | 5,515,000 | | 5,735,600 |
Xerox Corp.: | | | | |
6.875% 8/15/11 | | 14,110,000 | | 15,027,150 |
7.2% 4/1/16 | | 215,000 | | 230,050 |
7.625% 6/15/13 | | 11,340,000 | | 12,474,000 |
9.75% 1/15/09 | | 1,210,000 | | 1,421,750 |
| | 99,885,176 |
Telecommunications - 9.3% |
Alaska Communications Systems Holdings, Inc. 9.375% 5/15/09 | | 4,935,000 | | 5,083,050 |
Citizens Communications Co. 6.25% 1/15/13 | | 6,580,000 | | 6,645,800 |
Empresa Brasileira de Telecomm SA 11% 12/15/08 | | 5,405,000 | | 6,161,700 |
Intelsat Ltd.: | | | | |
5.25% 11/1/08 | | 2,035,000 | | 1,986,669 |
6.5% 11/1/13 | | 2,475,000 | | 2,239,875 |
7.625% 4/15/12 | | 6,265,000 | | 6,171,025 |
Millicom International Cellular SA 10% 12/1/13 (e) | | 16,275,000 | | 17,007,375 |
New Skies Satellites BV 7.4375% 11/1/11 (e)(f) | | 3,200,000 | | 3,360,000 |
Nextel Communications, Inc.: | | | | |
5.95% 3/15/14 | | 7,470,000 | | 7,806,150 |
6.875% 10/31/13 | | 18,545,000 | | 20,121,325 |
PanAmSat Corp. 9% 8/15/14 (e) | | 12,180,000 | | 13,580,700 |
Qwest Capital Funding, Inc.: | | | | |
7% 8/3/09 | | 4,405,000 | | 4,360,950 |
7.25% 2/15/11 | | 1,685,000 | | 1,617,600 |
Qwest Corp.: | | | | |
7.875% 9/1/11 (e) | | 3,890,000 | | 4,201,200 |
9.125% 3/15/12 (e) | | 16,255,000 | | 18,774,525 |
Qwest Services Corp.: | | | | |
14% 12/15/10 (e)(f) | | 4,345,000 | | 5,214,000 |
14.5% 12/15/14 (e)(f) | | 4,610,000 | | 5,774,025 |
Rogers Communications, Inc.: | | | | |
5.525% 12/15/10 (e)(f) | | 3,140,000 | | 3,289,150 |
7.25% 12/15/12 (e) | | 1,950,000 | | 2,067,000 |
|
| Principal
Amount | | Value
(Note 1) |
8% 12/15/12 (e) | | $ 2,230,000 | | $ 2,352,650 |
9.625% 5/1/11 | | 6,340,000 | | 7,386,100 |
SBA Communications Corp. 8.5% 12/1/12 (e) | | 6,015,000 | | 6,150,338 |
Time Warner Telecom LLC/Time Warner Telecom, Inc. 9.75% 7/15/08 | | 1,645,000 | | 1,645,000 |
Time Warner Telecom, Inc. 10.125% 2/1/11 | | 1,645,000 | | 1,612,100 |
U.S. West Capital Funding, Inc. 6.375% 7/15/08 | | 3,985,000 | | 3,935,188 |
U.S. West Communications: | | | | |
6.875% 9/15/33 | | 3,270,000 | | 3,008,400 |
7.2% 11/10/26 | | 1,905,000 | | 1,819,275 |
7.5% 6/15/23 | | 8,635,000 | | 8,483,888 |
| | 171,855,058 |
Textiles & Apparel - 0.6% |
Levi Strauss & Co.: | | | | |
9.75% 1/15/15 (e) | | 3,340,000 | | 3,298,250 |
12.25% 12/15/12 | | 7,210,000 | | 8,003,100 |
| | 11,301,350 |
TOTAL NONCONVERTIBLE BONDS (Cost $1,589,202,187) | 1,679,459,718 |
Commercial Mortgage Securities - 0.3% |
|
Banc of America Commercial Mortgage, Inc. Series 2003-2: | | | | |
Class BWD, 6.947% 10/11/37 (e) | | 614,920 | | 622,899 |
Class BWE, 7.226% 10/11/37 (e) | | 831,540 | | 841,685 |
Class BWF, 7.55% 10/11/37 (e) | | 734,087 | | 744,541 |
Class BWG, 8.155% 10/11/37 (e) | | 710,012 | | 714,921 |
Class BWH, 9.073% 10/11/37 (e) | | 371,348 | | 380,282 |
Class BWJ, 9.99% 10/11/37 (e) | | 613,922 | | 626,836 |
Class BWK, 10.676% 10/11/37 (e) | | 478,161 | | 491,035 |
Class BWL, 10.1596% 10/11/37 (e) | | 797,600 | | 755,788 |
LB Multi-family Mortgage Trust Series 1991-4 Class A1, 6.9974% 4/25/21 (e)(f) | | 229,583 | | 204,329 |
TOTAL COMMERCIAL MORTGAGE SECURITIES (Cost $5,073,302) | 5,382,316 |
Common Stocks - 0.2% |
| | Shares | | |
Chemicals - 0.1% |
HMP Equity Holdings Corp. warrants 5/15/11 (a)(e) | | 4,800 | | 2,256,000 |
Common Stocks - continued |
| | Shares | | Value (Note 1) |
Homebuilding/Real Estate - 0.0% |
Swerdlow Real Estate Group LLC (a)(g) | | 159,600 | | $ 377,326 |
Textiles & Apparel - 0.1% |
Arena Brands Holding Corp. Class B (g) | | 48,889 | | 506,001 |
TOTAL COMMON STOCKS (Cost $5,194,504) | | 3,139,327 |
Nonconvertible Preferred Stocks - 0.1% |
| | | |
Diversified Financial Services - 0.1% |
Fannie Mae 7.00%
(Cost $1,875,000) | | 37,500 | | 2,109,375 |
Floating Rate Loans - 5.7% |
| Principal
Amount | | |
Air Transportation - 0.2% |
American Airlines, Inc. term loan 9.5% 12/17/10 (f) | | $ 2,750,000 | | 2,791,250 |
Cable TV - 0.9% |
Hilton Head Communications LP Tranche B, term loan 6.5% 3/31/08 (f) | | 7,000,000 | | 6,877,500 |
NTL Investment Holdings Ltd. Tranche B, term loan 5.2038% 6/13/12 (f) | | 3,850,000 | | 3,888,500 |
Olympus Cable Holdings LLC Tranche A, term loan 6.5% 6/30/10 (f) | | 5,500,000 | | 5,458,750 |
| | 16,224,750 |
Electric Utilities - 0.8% |
Astoria Energy LLC term loan: | | | | |
7.1882% 4/15/12 (f) | | 5,200,000 | | 5,304,000 |
11.31% 4/15/12 (f) | | 3,340,000 | | 3,423,500 |
Riverside Energy Center LLC: | | | | |
term loan 6.38% 6/24/11 (f) | | 6,415,389 | | 6,511,620 |
Credit-Linked Deposit 6.38% 6/24/11 (f) | | 284,611 | | 288,880 |
| | 15,528,000 |
Energy - 1.3% |
El Paso Corp.: | | | | |
Credit-Linked Deposit 5.15% 11/22/09 (f) | | 5,839,400 | | 5,883,196 |
term loan 5.1875% 11/22/09 (f) | | 6,491,050 | | 6,547,847 |
Headwaters, Inc.: | | | | |
Tranche 2, term loan 9.1133% 9/8/12 (f) | | 3,450,000 | | 3,557,813 |
Tranche B1, term loan 7.5% 4/30/11 (f) | | 5,070,313 | | 5,133,691 |
Magellan Midstream Holdings LP term loan 4.62% 12/10/11 (f) | | 3,550,000 | | 3,594,375 |
| | 24,716,922 |
|
| Principal
Amount | | Value
(Note 1) |
Homebuilding/Real Estate - 1.4% |
General Growth Properties, Inc.: | | | | |
Tranche A, term loan 4.53% 11/12/07 (f) | | $ 5,500,000 | | $ 5,500,000 |
Tranche B, term loan 4.53% 11/12/08 (f) | | 5,500,000 | | 5,513,750 |
LNR Property Corp.: | | | | |
Tranche A, term loan 7.09% 1/31/08 (f) | | 3,650,000 | | 3,650,000 |
Tranche B, term loan: | | | | |
5.59% 1/31/08 (f) | | 7,450,000 | | 7,487,250 |
7.84% 1/31/08 (f) | | 3,700,000 | | 3,700,000 |
| | 25,851,000 |
Hotels - 0.4% |
Wyndham International, Inc. term loan 7.125% 6/30/06 (f) | | 7,927,451 | | 7,947,269 |
Railroad - 0.1% |
Kansas City Southern Railway Co. Tranche B1, term loan 4.0939% 3/30/08 (f) | | 1,150,000 | | 1,167,250 |
Technology - 0.3% |
ON Semiconductor Corp. Tranche G, term loan 5.5625% 12/15/11 (f) | | 5,550,000 | | 5,563,875 |
Telecommunications - 0.3% |
Qwest Corp. Tranche B, term loan 6.95% 6/30/10 (f) | | 4,500,000 | | 4,601,250 |
TOTAL FLOATING RATE LOANS (Cost $101,652,062) | 104,391,566 |
Money Market Funds - 2.2% |
| Shares | | |
Fidelity Cash Central Fund, 2.24% (b)
(Cost $41,514,605) | 41,514,605 | | 41,514,605 |
Cash Equivalents - 0.2% |
| Maturity
Amount | | Value
(Note 1) |
Investments in repurchase agreements (Collateralized by U.S. Treasury Obligations, in a joint trading account at 1.56%, dated 12/31/04 due 1/3/05)
(Cost $3,171,000) | $ 3,171,414 | | $ 3,171,000 |
TOTAL INVESTMENT PORTFOLIO - 99.8% (Cost $1,747,682,660) | | 1,839,167,907 |
NET OTHER ASSETS - 0.2% | | 4,179,826 |
NET ASSETS - 100% | $ 1,843,347,733 |
Legend |
(a) Non-income producing |
(b) Affiliated fund that is available only to investment companies and other accounts managed by Fidelity Investments. The rate quoted is the annualized seven-day yield of the fund at period end. A complete listing of the fund's holdings as of its most recent fiscal year end is available upon request. |
(c) Non-income producing - issuer filed for bankruptcy or is in default of interest payments. |
(d) Debt obligation initially issued in zero coupon form which converts to coupon form at a specified rate and date. The rate shown is the rate at period end. |
(e) Security exempt from registration under Rule 144A of the Securities Act of 1933. These securities may be resold in transactions exempt from registration, normally to qualified institutional buyers. At the period end, the value of these securities amounted to $418,849,132 or 22.7% of net assets. |
(f) The coupon rate shown on floating or adjustable rate securities represents the rate at period end. |
(g) Restricted securities - Investment in securities not registered under the Securities Act of 1933 (excluding 144A issues). At the end of the period, the value of restricted securities (excluding 144A issues) amounted to $883,327 or 0.0% of net assets. |
Additional information on each holding is as follows: |
Security | Acquisition Date | Acquisition Cost |
Arena Brands Holding Corp. Class B | 6/18/97 | $ 1,974,627 |
Swerdlow Real Estate Group LLC | 1/15/99 | $ 7,697,348 |
Other Information |
Distribution of investments by country of issue, as a percentage of total net assets, is as follows: |
United States of America | 82.5% |
Canada | 5.2% |
Marshall Islands | 2.1% |
Bermuda | 1.9% |
United Kingdom | 1.7% |
Luxembourg | 1.6% |
Mexico | 1.1% |
Others (individually less than 1%) | 3.9% |
| 100.0% |
Income Tax Information |
At December 31, 2004, the fund had a capital loss carryforward of approximately $1,144,184,000 of which $283,149,000, $772,554,000 and $88,481,000 will expire on December 31, 2008, 2009 and 2010, respectively. |
The fund will notify shareholders in January 2005 of amounts for use in preparing 2004 income tax returns. |
See accompanying notes which are an integral part of the financial statements.
High Income Portfolio
Fidelity Variable Insurance Products: High Income Portfolio
Financial Statements
Statement of Assets and Liabilities
December 31, 2004 |
| | |
Assets | | |
Investment in securities, at value (including repurchase agreements of $3,171,000) (cost $1,747,682,660) - See accompanying schedule | | $ 1,839,167,907 |
Cash | | 100,076 |
Receivable for investments sold | | 7,236,480 |
Receivable for fund shares sold | | 278,188 |
Interest receivable | | 29,056,825 |
Prepaid expenses | | 6,674 |
Total assets | | 1,875,846,150 |
Liabilities | | |
Payable for investments purchased | $ 29,800,521 | |
Payable for fund shares redeemed | 1,277,993 | |
Accrued management fee | 877,227 | |
Distribution fees payable | 49,768 | |
Other affiliated payables | 162,084 | |
Other payables and accrued expenses | 330,824 | |
Total liabilities | | 32,498,417 |
Net Assets | | $ 1,843,347,733 |
Net Assets consist of: | | |
Paid in capital | | $ 2,757,165,988 |
Undistributed net investment income | | 142,574,339 |
Accumulated undistributed net realized gain (loss) on investments | | (1,147,878,584) |
Net unrealized appreciation (depreciation) on investments and assets and liabilities in foreign currencies | | 91,485,990 |
Net Assets | | $ 1,843,347,733 |
Calculation of Maximum Offering Price | |
Initial Class:
Net Asset Value, offering price and redemption price per share ($1,371,736,328 ÷ 195,883,886 shares) | | $ 7.00 |
Service Class:
Net Asset Value, offering price and redemption price per share ($377,122,057 ÷ 54,083,772 shares) | | $ 6.97 |
Service Class 2:
Net Asset Value, offering price and redemption price per share ($94,246,211 ÷ 13,644,087 shares) | | $ 6.91 |
Initial Class R:
Net Asset Value, offering price and redemption price per share ($ 81,111 ÷ 11,592 shares) | | $ 7.00 |
Service Class R:
Net Asset Value, offering price and redemption price per share ($81,060 ÷ 11,628 shares) | | $ 6.97 |
Service Class 2R:
Net Asset Value, offering price and redemption price per share ($80,966 ÷ 11,719 shares) | | $ 6.91 |
Statement of Operations
Year ended December 31, 2004 |
| | |
Investment Income | | |
Dividends | | $ 731,076 |
Interest | | 146,478,822 |
Total income | | 147,209,898 |
| | |
Expenses | | |
Management fee | $ 10,407,413 | |
Transfer agent fees | 1,229,877 | |
Distribution fees | 542,218 | |
Accounting fees and expenses | 687,297 | |
Non-interested trustees' compensation | 10,249 | |
Custodian fees and expenses | 61,567 | |
Registration fees | 4,070 | |
Audit | 63,597 | |
Legal | 22,574 | |
Interest | 9,548 | |
Miscellaneous | 353,587 | |
Total expenses before reductions | 13,391,997 | |
Expense reductions | (3,973) | 13,388,024 |
Net investment income | | 133,821,874 |
Realized and Unrealized Gain (Loss) Net realized gain (loss) on investment securities | | 76,148,906 |
Change in net unrealized appreciation (depreciation) on: Investment securities | (47,643,714) | |
Assets and liabilities in foreign currencies | 236 | |
Total change in net unrealized appreciation (depreciation) | | (47,643,478) |
Net gain (loss) | | 28,505,428 |
Net increase (decrease) in net assets resulting from operations | | $ 162,327,302 |
See accompanying notes which are an integral part of the financial statements.
Annual Report
Fidelity Variable Insurance Products: High Income Portfolio
Financial Statements - continued
Statement of Changes in Net Assets
| Year ended
December 31,
2004 | Year ended
December 31,
2003 |
Increase (Decrease) in Net Assets | | |
Operations | | |
Net investment income | $ 133,821,874 | $ 147,560,195 |
Net realized gain (loss) | 76,148,906 | 93,505,636 |
Change in net unrealized appreciation (depreciation) | (47,643,478) | 182,813,372 |
Net increase (decrease) in net assets resulting from operations | 162,327,302 | 423,879,203 |
Distributions to shareholders from net investment income | (155,517,698) | (110,937,981) |
Share transactions - net increase (decrease) | (251,486,736) | 336,533,161 |
Total increase (decrease) in net assets | (244,677,132) | 649,474,383 |
| | |
Net Assets | | |
Beginning of period | 2,088,024,865 | 1,438,550,482 |
End of period (including undistributed net investment income of $142,574,339 and undistributed net investment income of $164,989,590, respectively) | $ 1,843,347,733 | $ 2,088,024,865 |
Other Information: | | | | | | |
Share Transactions | Year ended December 31, 2004 |
Shares | Initial Class | Service Class | Service Class 2 | Initial Class R A | Service Class R A | Service Class 2R A |
Sold | 49,439,043 | 27,666,450 | 11,342,466 | 11,592 | 11,628 | 11,719 |
Reinvested | 18,412,464 | 4,720,558 | 928,353 | - | - | - |
Redeemed | (101,334,787) | (38,719,734) | (9,747,785) | - | - | - |
Net increase (decrease) | (33,483,280) | (6,332,726) | 2,523,034 | 11,592 | 11,628 | 11,719 |
| | | | | | |
Dollars Sold | $ 326,369,917 | $ 182,792,007 | $ 74,778,966 | $ 75,000 | $ 75,000 | $ 75,000 |
Reinvested | 119,128,639 | 30,447,599 | 5,941,460 | - | - | - |
Redeemed | (672,513,946) | (255,556,875) | (63,099,503) | - | - | - |
Net increase (decrease) | $ (227,015,390) | $ (42,317,269) | $ 17,620,923 | $ 75,000 | $ 75,000 | $ 75,000 |
| | | | | | |
Share Transactions | Year ended December 31, 2003 |
Shares | Initial Class | Service Class | Service Class 2 | Initial Class R | Service Class R | Service Class 2R |
Sold | 187,111,620 | 59,201,139 | 17,709,351 | $ - | $ - | $ - |
Reinvested | 15,863,052 | 3,574,368 | 424,961 | - | - | - |
Redeemed | (166,651,099) | (46,461,897) | (12,553,214) | - | - | - |
Net increase (decrease) | 36,323,573 | 16,313,610 | 5,581,098 | $ - | $ - | $ - |
| | | | | | |
Dollars Sold | $ 1,162,830,605 | $ 370,826,801 | $ 111,025,684 | $ - | $ - | $ - |
Reinvested | 88,674,463 | 19,909,232 | 2,354,286 | - | - | - |
Redeemed | (1,045,910,689) | (293,649,573) | (79,527,648) | - | - | - |
Net increase (decrease) | $ 205,594,379 | $ 97,086,460 | $ 33,852,322 | $ - | $ - | $ - |
| | | | | | |
Distributions | Year ended December 31, 2004 |
| Initial Class | Service Class | Service Class 2 | Initial Class R A | Service Class R A | Service Class 2R A |
From net investment income | $ 119,128,639 | $ 30,447,599 | $ 5,941,460 | $ - | $ - | $ - |
| | | | | | |
| Year ended December 31, 2003 |
| Initial Class | Service Class | Service Class 2 | Initial Class R | Service Class R | Service Class 2R |
From net investment income | $ 88,674,463 | $ 19,909,232 | $ 2,354,286 | $ - | $ - | $ - |
A For the period April 14, 2004 (commencement of sale of shares) to December 31, 2004.
See accompanying notes which are an integral part of the financial statements.
High Income Portfolio
Financial Highlights - Initial Class
Years ended December 31, | 2004 | 2003 | 2002 | 2001 | 2000 |
Selected Per-Share Data | | | | | |
Net asset value, beginning of period | $ 6.95 | $ 5.93 | $ 6.41 | $ 8.18 | $ 11.32 |
Income from Investment Operations | | | | | |
Net investment income C | .494 | .520 | .496 F | .774 E, F | 1.123 |
Net realized and unrealized gain (loss) | .126 | .980 | (.306) F | (1.544) E, F | (3.513) |
Total from investment operations | .620 | 1.500 | .190 | (.770) | (2.390) |
Distributions from net investment income | (.570) | (.480) | (.670) | (1.000) | (.750) |
Net asset value, end of period | $ 7.00 | $ 6.95 | $ 5.93 | $ 6.41 | $ 8.18 |
Total Return A, B | 9.59% | 27.26% | 3.44% | (11.73)% | (22.54)% |
Ratios to Average Net Assets D | | | | | |
Expenses before expense reductions | .71% | .69% | .70% | .71% | .68% |
Expenses net of voluntary waivers, if any | .71% | .69% | .70% | .71% | .68% |
Expenses net of all reductions | .71% | .69% | .70% | .70% | .68% |
Net investment income | 7.43% | 8.25% | 8.65% F | 11.00% E, F | 11.38% |
Supplemental Data | | | | | |
Net assets, end of period (000 omitted) | $ 1,371,736 | $ 1,593,714 | $ 1,145,562 | $ 1,201,085 | $ 1,467,250 |
Portfolio turnover rate | 128% | 130% | 96% | 138% | 68% |
A Total returns do not reflect charges attributable to your insurance company's separate account. Inclusion of these charges would reduce the total returns shown.
B Total returns would have been lower had certain expenses not been reduced during the periods shown.
C Calculated based on average shares outstanding during the period.
D Expense ratios reflect operating expenses of the class. Expenses before reductions do not reflect amounts reimbursed by the investment adviser or reductions from brokerage service arrangements or other expense offset arrangements and do not represent the amount paid by the class during periods when reimbursements or reductions occur. Expenses net of any voluntary waivers reflect expenses after reimbursement by the investment adviser but prior to reductions from brokerage service arrangements or other expense offset arrangements. Expenses net of all reductions represent the net expenses paid by the class.
E Effective January 1, 2001, the fund adopted the provisions of the AICPA Audit and Accounting Guide for Investment Companies and began amortizing premium and discount on all debt securities. Per-share data and ratios for periods prior to adoption have not been restated to reflect this change.
F As a result of a revision to reflect accretion of market discount using the interest method, certain amounts for the years ended December 31, 2002 and December 31, 2001 have been reclassified from what was previously reported. The impact of this change for the years ended December 31, 2002 and December 31, 2001 was a decrease to net investment income of $.017 and $.075 per share with a corresponding increase to net realized and unrealized gain (loss) per share, respectively. The ratio of net investment income to average net assets decreased from 8.95% and 12.08% to 8.65% and 11.00%, respectively. The reclassification has no impact on the net assets of the fund.
Financial Highlights - Service Class
Years ended December 31, | 2004 | 2003 | 2002 | 2001 | 2000 |
Selected Per-Share Data | | | | | |
Net asset value, beginning of period | $ 6.92 | $ 5.91 | $ 6.38 | $ 8.15 | $ 11.29 |
Income from Investment Operations | | | | | |
Net investment income C | .486 | .513 | .488 F | .758 E, F | 1.102 |
Net realized and unrealized gain (loss) | .124 | .967 | (.288) F | (1.538) E, F | (3.502) |
Total from investment operations | .610 | 1.480 | .200 | (.780) | (2.400) |
Distributions from net investment income | (.560) | (.470) | (.670) | (.990) | (.740) |
Net asset value, end of period | $ 6.97 | $ 6.92 | $ 5.91 | $ 6.38 | $ 8.15 |
Total Return A, B | 9.47% | 26.97% | 3.62% | (11.90)% | (22.68)% |
Ratios to Average Net Assets D | | | | | |
Expenses before expense reductions | .81% | .79% | .80% | .81% | .78% |
Expenses net of voluntary waivers, if any | .81% | .79% | .80% | .81% | .78% |
Expenses net of all reductions | .81% | .79% | .80% | .81% | .78% |
Net investment income | 7.33% | 8.15% | 8.55% F | 10.90% E, F | 11.28% |
Supplemental Data | | | | | |
Net assets, end of period (000 omitted) | $ 377,122 | $ 417,928 | $ 260,489 | $ 234,204 | $ 227,549 |
Portfolio turnover rate | 128% | 130% | 96% | 138% | 68% |
A Total returns do not reflect charges attributable to your insurance company's separate account. Inclusion of these charges would reduce the total returns shown.
B Total returns would have been lower had certain expenses not been reduced during the periods shown.
C Calculated based on average shares outstanding during the period.
D Expense ratios reflect operating expenses of the class. Expenses before reductions do not reflect amounts reimbursed by the investment adviser or reductions from brokerage service arrangements or other expense offset arrangements and do not represent the amount paid by the class during periods when reimbursements or reductions occur. Expenses net of any voluntary waivers reflect expenses after reimbursement by the investment adviser but prior to reductions from brokerage service arrangements or other expense offset arrangements. Expenses net of all reductions represent the net expenses paid by the class.
E Effective January 1, 2001, the fund adopted the provisions of the AICPA Audit and Accounting Guide for Investment Companies and began amortizing premium and discount on all debt securities. Per-share data and ratios for periods prior to adoption have not been restated to reflect this change.
F As a result of a revision to reflect accretion of market discount using the interest method, certain amounts for the years ended December 31, 2002 and December 31, 2001 have been reclassified from what was previously reported. The impact of this change for the years ended December 31, 2002 and December 31, 2001 was a decrease to net investment income of $.017 and $.075 per share with a corresponding increase to net realized and unrealized gain (loss) per share, respectively. The ratio of net investment income to average net assets decreased from 8.85% and 11.97% to 8.55% and 10.90%, respectively. The reclassification has no impact on the net assets of the fund.
See accompanying notes which are an integral part of the financial statements.
Annual Report
Financial Highlights - Service Class 2
Years ended December 31, | 2004 | 2003 | 2002 | 2001 | 2000 F |
Selected Per-Share Data | | | | | |
Net asset value, beginning of period | $ 6.87 | $ 5.87 | $ 6.36 | $ 8.13 | $ 11.14 |
Income from Investment Operations | | | | | |
Net investment income E | .470 | .501 | .472 I | .716 H, I | .936 |
Net realized and unrealized gain (loss) | .130 | .959 | (.292) I | (1.496) H, I | (3.206) |
Total from investment operations | .600 | 1.460 | .180 | (.780) | (2.270) |
Distributions from net investment income | (.560) | (.460) | (.670) | (.990) | (.740) |
Net asset value, end of period | $ 6.91 | $ 6.87 | $ 5.87 | $ 6.36 | $ 8.13 |
Total Return B, C, D | 9.38% | 26.75% | 3.30% | (11.93)% | (21.83)% |
Ratios to Average Net Assets G | | | | | |
Expenses before expense reductions | .97% | .95% | .97% | .98% | 1.01% A |
Expenses net of voluntary waivers, if any | .97% | .95% | .97% | .98% | 1.01% A |
Expenses net of all reductions | .97% | .95% | .97% | .98% | 1.01% A |
Net investment income | 7.17% | 7.99% | 8.38% I | 10.73% H, I | 11.04% A |
Supplemental Data | | | | | |
Net assets, end of period (000 omitted) | $ 94,246 | $ 76,383 | $ 32,499 | $ 16,508 | $ 4,742 |
Portfolio turnover rate | 128% | 130% | 96% | 138% | 68% |
A Annualized
B Total returns for periods of less than one year are not annualized.
C Total returns do not reflect charges attributable to your insurance company's separate account. Inclusion of these charges would reduce the total returns shown.
D Total returns would have been lower had certain expenses not been reduced during the periods shown.
E Calculated based on average shares outstanding during the period.
F For the period January 12, 2000 (commencement of sale of shares) to December 31, 2000.
G Expense ratios reflect operating expenses of the class. Expenses before reductions do not reflect amounts reimbursed by the investment adviser or reductions from brokerage service arrangements or other expense offset arrangements and do not represent the amount paid by the class during periods when reimbursements or reductions occur. Expense ratios before reductions for start-up periods may not be representative of longer-term operating periods. Expenses net of any voluntary waivers reflect expenses after reimbursement by the investment adviser but prior to reductions from brokerage service arrangements or other expense offset arrangements. Expenses net of all reductions represent the net expenses paid by the class.
H Effective January 1, 2001, the fund adopted the provisions of the AICPA Audit and Accounting Guide for Investment Companies and began amortizing premium and discount on all debt securities. Per-share data and ratios for periods prior to adoption have not been restated to reflect this change.
I As a result of a revision to reflect accretion of market discount using the interest method, certain amounts for the years ended December 31, 2002 and December 31, 2001 have been reclassified from what was previously reported. The impact of this change for the years ended December 31, 2002 and December 31, 2001 was a decrease to net investment income of $.017 and $.072 per share with a corresponding increase to net realized and unrealized gain (loss) per share, respectively. The ratio of net investment income to average net assets decreased from 8.68% and 11.81% to 8.38% and 10.73%, respectively. The reclassification has no impact on the net assets of the fund.
Financial Highlights - Initial Class R
Year ended December 31, | 2004 F |
Selected Per-Share Data | |
Net asset value, beginning of period | $ 6.47 |
Income from Investment Operations | |
Net investment income E | .338 |
Net realized and unrealized gain (loss) | .192 |
Total from investment operations | .530 |
Net asset value, end of period | $ 7.00 |
Total Return B, C, D | 8.19% |
Ratios to Average Net Assets G | |
Expenses before expense reductions | .71% A |
Expenses net of voluntary waivers, if any | .71% A |
Expenses net of all reductions | .71% A |
Net investment income | 7.16% A |
Supplemental Data | |
Net assets, end of period (000 omitted) | $ 81 |
Portfolio turnover rate | 128% |
A Annualized
B Total returns for periods of less than one year are not annualized.
C Total returns do not reflect charges attributable to your insurance company's separate account. Inclusion of these charges would reduce the total returns shown.
D Total returns would have been lower had certain expenses not been reduced during the periods shown.
E Calculated based on average shares outstanding during the period.
F For the period April 14, 2004 (commencement of sale of shares) to December 31, 2004.
G Expense ratios reflect operating expenses of the class. Expenses before reductions do not reflect amounts reimbursed by the investment adviser or reductions from brokerage service arrangements or other expense offset arrangements and do not represent the amount paid by the class during periods when reimbursements or reductions occur. Expense ratios before reductions for start-up periods may not be representative of longer-term operating periods. Expenses net of any voluntary waivers reflect expenses after reimbursement by the investment adviser but prior to reductions from brokerage service arrangements or other expense offset arrangements. Expenses net of all reductions represent the net expenses paid by the class.
See accompanying notes which are an integral part of the financial statements.
High Income Portfolio
Financial Highlights - Service Class R
Year ended December 31, | 2004 F |
Selected Per-Share Data | |
Net asset value, beginning of period | $ 6.45 |
Income from Investment Operations | |
Net investment income E | .332 |
Net realized and unrealized gain (loss) | .188 |
Total from investment operations | .520 |
Net asset value, end of period | $ 6.97 |
Total Return B, C, D | 8.06% |
Ratios to Average Net Assets G | |
Expenses before expense reductions | .81% A |
Expenses net of voluntary waivers, if any | .81% A |
Expenses net of all reductions | .81% A |
Net investment income | 7.05% A |
Supplemental Data | |
Net assets, end of period (000 omitted) | $ 81 |
Portfolio turnover rate | 128% |
A Annualized
B Total returns for periods of less than one year are not annualized.
C Total returns do not reflect charges attributable to your insurance company's separate account. Inclusion of these charges would reduce the total returns shown.
D Total returns would have been lower had certain expenses not been reduced during the periods shown.
E Calculated based on average shares outstanding during the period.
F For the period April 14, 2004 (commencement of sale of shares) to December 31, 2004.
G Expense ratios reflect operating expenses of the class. Expenses before reductions do not reflect amounts reimbursed by the investment adviser or reductions from brokerage service arrangements or other expense offset arrangements and do not represent the amount paid by the class during periods when reimbursements or reductions occur. Expense ratios before reductions for start-up periods may not be representative of longer-term operating periods. Expenses net of any voluntary waivers reflect expenses after reimbursement by the investment adviser but prior to reductions from brokerage service arrangements or other expense offset arrangements. Expenses net of all reductions represent the net expenses paid by the class.
Financial Highlights - Service Class 2R
Year ended December 31, | 2004 F |
Selected Per-Share Data | |
Net asset value, beginning of period | $ 6.40 |
Income from Investment Operations | |
Net investment income E | .322 |
Net realized and unrealized gain (loss) | .188 |
Total from investment operations | .510 |
Net asset value, end of period | $ 6.91 |
Total Return B, C, D | 7.97% |
Ratios to Average Net Assets G | |
Expenses before expense reductions | .96% A |
Expenses net of voluntary waivers, if any | .96% A |
Expenses net of all reductions | .96% A |
Net investment income | 6.90% A |
Supplemental Data | |
Net assets, end of period (000 omitted) | $ 81 |
Portfolio turnover rate | 128% |
A Annualized
B Total returns for periods of less than one year are not annualized.
C Total returns do not reflect charges attributable to your insurance company's separate account. Inclusion of these charges would reduce the total returns shown.
D Total returns would have been lower had certain expenses not been reduced during the periods shown.
E Calculated based on average shares outstanding during the period.
F For the period April 14, 2004 (commencement of sale of shares) to December 31, 2004.
G Expense ratios reflect operating expenses of the class. Expenses before reductions do not reflect amounts reimbursed by the investment adviser or reductions from brokerage service arrangements or other expense offset arrangements and do not represent the amount paid by the class during periods when reimbursements or reductions occur. Expense ratios before reductions for start-up periods may not be representative of longer-term operating periods. Expenses net of any voluntary waivers reflect expenses after reimbursement by the investment adviser but prior to reductions from brokerage service arrangements or other expense offset arrangements. Expenses net of all reductions represent the net expenses paid by the class.
See accompanying notes which are an integral part of the financial statements.
Annual Report
Notes to Financial Statements
For the period ended December 31, 2004
1. Significant Accounting Policies.
High Income Portfolio (the fund) is a fund of Variable Insurance Products Fund, (the trust) (referred to in this report as Fidelity Variable Insurance Products: High Income Portfolio) and is authorized to issue an unlimited number of shares. The trust is registered under the Investment Company Act of 1940, as amended (the 1940 Act), as an open-end management investment company organized as a Massachusetts business trust. Shares of the fund may only be purchased by insurance companies for the purpose of funding variable annuity or variable life insurance contracts. The fund offers the following classes of shares: Initial Class shares, Service Class shares, Service Class 2 shares, Initial Class R shares, Service Class R shares and Service Class 2R shares. All classes have equal rights and voting privileges, except for matters affecting a single class. Investment income, realized and unrealized capital gains and losses, the common expenses of the fund, and certain fund-level expense reductions, if any, are allocated on a pro rata basis to each class based on the relative net assets of each class to the total net assets of the fund. Each class differs with respect to distribution and service plan fees incurred. Certain expense reductions also differ by class.
The financial statements have been prepared in conformity with accounting principles generally accepted in the United States of America, which require management to make certain estimates and assumptions at the date of the financial statements. The following summarizes the significant accounting policies of the fund:
Security Valuation. Net asset value per share (NAV calculation) is calculated as of the close of business of the New York Stock Exchange, normally 4:00 p.m. Eastern time. Debt securities, including restricted securities, for which quotations are readily available are valued at their most recent bid prices (sales prices if the principal market is an exchange) in the principal market in which such securities are normally traded, as determined by recognized dealers in such securities, or securities are valued on the basis of information provided by a pricing service. Pricing services use valuation matrices that incorporate both dealer-supplied valuations and valuation models. Equity securities, including restricted securities, for which market quotations are available are valued at the last sale price or official closing price (closing bid price or last evaluated quote if no sale has occurred) on the primary market or exchange on which they trade. If prices are not readily available or do not accurately reflect fair value for a security, or if a security's value has been materially affected by events occurring after the close of the exchange or market on which the security is principally traded, that security may be valued by another method that the Board of Trustees believes accurately reflects fair value. A security's valuation may differ depending on the method used for determining value. Price movements in futures contracts and ADRs, market and trading trends, the bid/ask quotes of brokers and off-exchange institutional trading may be reviewed in the course of making a good faith determination of a security's fair value. Short-term securities with remaining maturities of sixty days or less for which quotations are not readily available are valued on the basis of amortized cost. Investments in open-end investment companies are valued at their net asset value each business day.
Foreign Currency. The fund uses foreign currency contracts to facilitate transactions in foreign-denominated securities. Losses from these transactions may arise from changes in the value of the foreign currency or if the counterparties do not perform under the contracts' terms.
Foreign-denominated assets, including investment securities, and liabilities are translated into U.S. dollars at the exchange rate at period end. Purchases and sales of investment securities, income and dividends received and expenses denominated in foreign currencies are translated into U.S. dollars at the exchange rate in effect on the transaction date.
The effects of exchange rate fluctuations on investments are included with the net realized and unrealized gain (loss) on investment securities. Other foreign currency transactions resulting in realized and unrealized gain (loss) are disclosed separately.
Investment Transactions and Income. Security transactions are accounted for as of trade date. Gains and losses on securities sold are determined on the basis of identified cost and may include proceeds received from litigation. Dividend income is recorded on the ex-dividend date, except for certain dividends from foreign securities where the ex-dividend date may have passed, which are recorded as soon as the fund is informed of the ex-dividend date. Non-cash dividends included in dividend income, if any, are recorded at the fair market value of the securities received. Interest income is accrued as earned. Interest income includes coupon interest and amortization of premium and accretion of discount on debt securities. Investment income is recorded net of foreign taxes withheld where recovery of such taxes is uncertain. Debt obligations may be placed on non-accrual status and related interest income may be reduced by ceasing current accruals and writing off interest receivables when the collection of all or a portion of interest has become doubtful based on consistently applied procedures. A debt obligation is removed from non-accrual status when the issuer resumes interest payments or when collectibility of interest is reasonably assured.
Expenses. Most expenses of the trust can be directly attributed to a fund. Expenses which cannot be directly attributed are apportioned among the funds in the trust.
High Income Portfolio
1. Significant Accounting Policies - continued
Income Tax Information and Distributions to Shareholders. Each year, the fund intends to qualify as a regulated investment company by distributing all of its taxable income and realized gains under Subchapter M of the Internal Revenue Code. As a result, no provision for income taxes is required in the accompanying financial statements. Foreign taxes are provided for based on the fund's understanding of the tax rules and rates that exist in the foreign markets in which it invests.
Distributions are recorded on the ex-dividend date. Income dividends and capital gain distributions are declared separately for each class. Income and capital gain distributions are determined in accordance with income tax regulations, which may differ from generally accepted accounting principles. Capital accounts within the financial statements are adjusted for permanent book-tax differences. These adjustments have no impact on net assets or the results of operations. Temporary book-tax differences will reverse in a subsequent period. Book-tax differences are primarily due to market discount, partnerships, capital loss carryforwards and losses deferred due to wash sales.
The tax-basis components of distributable earnings and the federal tax cost as of period end were as follows:
Unrealized appreciation | $ 106,238,193 | |
Unrealized depreciation | (8,602,341) | |
Net unrealized appreciation (depreciation) | 97,635,852 | |
Undistributed ordinary income | 132,732,705 | |
Capital loss carryforward | (1,144,183,642) | |
| | |
Cost for federal income tax purposes | $ 1,741,532,055 | |
The tax character of distributions paid was as follows:
| December 31, 2004 | December 31, 2003 |
Ordinary Income | $ 155,517,698 | $ 110,937,981 |
Trading (Redemption) Fees. Initial Class R shares, Service Class R shares and Service Class 2R shares held less than 60 days are subject to a redemption fee equal to 1% of the proceeds of the redeemed shares. All redemption fees, including any estimated redemption fees paid by Fidelity Management & Research Company (FMR), are retained by the fund and accounted for as an addition to paid in capital.
2. Operating Policies.
Repurchase Agreements. FMR has received an Exemptive Order from the Securities and Exchange Commission (the SEC) which permits the fund and other affiliated entities of FMR to transfer uninvested cash balances into joint trading accounts. These accounts are then invested in repurchase agreements that are collateralized by U.S. Treasury or Government obligations. The fund may also invest directly with institutions, in repurchase agreements that are collateralized by commercial paper obligations and corporate obligations. Collateral is held in segregated accounts with custodian banks and may be obtained in the event of a default of the counterparty. Collateral is marked-to-market daily and maintained at a value at least equal to the principal amount of the repurchase agreement (including accrued interest).
Restricted Securities. The fund may invest in securities that are subject to legal or contractual restrictions on resale. These securities generally may be resold in transactions exempt from registration or to the public if the securities are registered. Disposal of these securities may involve time-consuming negotiations and expense, and prompt sale at an acceptable price may be difficult. Information regarding restricted securities is included at the end of the fund's Schedule of Investments.
Loans and Other Direct Debt Instruments. The fund may invest in loans and loan participations, trade claims or other receivables. These investments may include standby financing commitments, including revolving credit facilities, that obligate the fund to supply additional cash to the borrower on demand. Loan participations involve a risk of insolvency of the lending bank or other financial intermediary. The fund may be contractually obligated to receive approval from the agent bank and/or borrower prior to the sale of these investments.
3. Purchases and Sales of Investments.
Purchases and sales of securities, other than short-term securities and U.S. government securities, aggregated $2,223,362,294 and $2,482,350,638, respectively.
Annual Report
4. Fees and Other Transactions with Affiliates.
Management Fee. FMR and its affiliates provide the fund with investment management related services for which the fund pays a monthly management fee. The management fee is the sum of an individual fund fee rate that is based on an annual rate of .45% of the fund's average net assets and a group fee rate that averaged .13% during the period. The group fee rate is based upon the average net assets of all the mutual funds advised by FMR. The group fee rate decreases as assets under management increase and increases as assets under management decrease. For the period, the total annual management fee rate was .58% of the fund's average net assets.
Distribution and Service Plan. In accordance with Rule 12b-1 of the 1940 Act, the fund has adopted separate 12b-1 Plans for each Service Class of shares. Each Service Class pays Fidelity Distributors Corporation (FDC), an affiliate of FMR, a service fee. For the period, the service fee is based on an annual rate of .10% of Service Class' and Service Class R's average net assets and .25% of Service Class 2's and Service Class 2R's average net assets.
For the period, each class paid FDC the following amounts, all of which were re-allowed to insurance companies for the distribution of shares and providing shareholder support services:
Service Class | $ 359,321 | |
Service Class 2 | 182,704 | |
Service Class R | 55 | |
Service Class 2R | 138 | |
| $ 542,218 | |
Transfer Agent Fees. Fidelity Investments Institutional Operations Company, Inc. (FIIOC), an affiliate of FMR, is the fund's transfer, dividend disbursing, and shareholder servicing agent. FIIOC receives an asset-based fee with respect to each account. FIIOC pays a portion of the expenses related to the typesetting, printing and mailing of shareholder reports, except proxy statements. Each class pays a transfer agent fee, excluding out of pocket expenses, equal to an annual rate of .07% of their month end net assets. For the period, the total transfer agent fees paid by each class to FIIOC, including out of pocket expenses, were as follows:
Initial Class | $ 933,207 | |
Service Class | 240,550 | |
Service Class 2 | 56,012 | |
Initial Class R | 36 | |
Service Class R | 36 | |
Service Class 2R | 36 | |
| $ 1,229,877 | |
Accounting Fees. Fidelity Service Company, Inc. (FSC), an affiliate of FMR, maintains the fund's accounting records. The fee is based on the level of average net assets for the month.
Central Funds. The fund may invest in affiliated Central Funds managed by Fidelity Investments Money Management, Inc. (FIMM), an affiliate of FMR. The Central Funds are open-end investment companies available only to investment companies and other accounts managed by FMR and its affiliates. The Central Funds seek preservation of capital and current income and do not pay a management fee. Income distributions earned by the fund are recorded as income in the accompanying financial statements and totaled $678,234 for the period.
Brokerage Commissions. The fund placed a portion of its portfolio transactions with brokerage firms which are affiliates of the investment adviser. The commissions paid to these affiliated firms were $1 for the period.
Interfund Lending Program. Pursuant to an Exemptive Order issued by the SEC, the fund, along with other registered investment companies having management contracts with FMR, may participate in an interfund lending program. This program provides an alternative credit facility allowing the funds to borrow from, or lend money to, other participating funds. At period end, there were no interfund loans outstanding. The fund's activity in this program during the period was as follows:
Borrower or Lender | Average Daily Loan Balance | Weighted Average Interest Rate | Interest Earned
(included in
interest income) | Interest
Expense |
Borrower | $ 16,577,688 | 1.18% | - | $ 8,699 |
5. Committed Line of Credit.
The fund participates with other funds managed by FMR in a $4.2 billion credit facility (the "line of credit") to be utilized for temporary or emergency purposes to fund shareholder redemptions or for other short-term liquidity purposes. The fund has agreed to pay commitment fees on its pro rata portion of the line of credit. During the period, there were no borrowings on this line of credit.
High Income Portfolio
Notes to Financial Statements - continued
6. Bank Borrowings.
The fund is permitted to have bank borrowings for temporary or emergency purposes to fund shareholder redemptions. The fund has established borrowing arrangements with certain banks. The interest rate on the borrowings is the bank's base rate, as revised from time to time. The average daily loan balance during the period amounted to $6,280,667. The weighted average interest rate was 1.62%. At period end, there were no bank borrowings outstanding.
7. Expense Reductions.
Many of the brokers with whom FMR places trades on behalf of the fund provided services to the fund in addition to trade execution. These services included payments of certain expenses on behalf of the fund totaling $3,244 for the period. In addition, through arrangements with the fund's custodian, credits realized as a result of uninvested cash balances were used to reduce the fund's expenses. During the period, these credits reduced the fund's custody expenses by $729.
8. Other Information.
At the end of the period, FMR or its affiliates were the owners of record of 20% of the total outstanding shares of the fund and two otherwise unaffiliated shareholders were the owners of record of 49% of the total outstanding shares of the fund.
Annual Report
Report of Independent Registered Public Accounting Firm
To the Trustees of Variable Insurance Products Fund and the Shareholders of High Income Portfolio:
In our opinion, the accompanying statement of assets and liabilities, including the schedule of investments, and the related statements of operations and of changes in net assets and the financial highlights present fairly, in all material respects, the financial position of High Income Portfolio (a fund of Variable Insurance Products Fund) at December 31, 2004 and the results of its operations, the changes in its net assets and the financial highlights for the periods indicated, in conformity with accounting principles generally accepted in the United States of America. These financial statements and financial highlights (hereafter referred to as "financial statements") are the responsibility of the High Income Portfolio's management; our responsibility is to express an opinion on these financial statements based on our audits. We conducted our audits of these financial statements in accordance with the standards of the Public Company Accounting Oversight Board (United States). Those standards require that we plan and perform the audit to obtain reasonable assurance about whether the financial statements are free of material misstatement. An audit includes examining, on a test basis, evidence supporting the amounts and disclosures in the financial statements, assessing the accounting principles used and significant estimates made by management, and evaluating the overall financial statement presentation. We believe that our audits, which included confirmation of securities at December 31, 2004 by correspondence with the custodian and brokers, provide a reasonable basis for our opinion.
/s/PricewaterhouseCoopers LLP
PricewaterhouseCoopers LLP
Boston, Massachusetts
February 18, 2005
High Income Portfolio
Trustees and Officers
The Trustees, Members of the Advisory Board, and executive officers of the trust and fund, as applicable, are listed below. The Board of Trustees governs the fund and is responsible for protecting the interests of shareholders. The Trustees are experienced executives who meet periodically throughout the year to oversee the fund's activities, review contractual arrangements with companies that provide services to the fund, and review the fund's performance. Except for William O. McCoy, Dennis J. Dirks, and Kenneth L. Wolfe, each of the Trustees oversees 301 funds advised by FMR or an affiliate. Mr. McCoy oversees 303 funds advised by FMR or an affiliate. Mr. Dirks and Mr. Wolfe oversee 233 funds advised by FMR or an affiliate.
The Trustees hold office without limit in time except that (a) any Trustee may resign; (b) any Trustee may be removed by written instrument, signed by at least two-thirds of the number of Trustees prior to such removal; (c) any Trustee who requests to be retired or who has become incapacitated by illness or injury may be retired by written instrument signed by a majority of the other Trustees; and (d) any Trustee may be removed at any special meeting of shareholders by a two-thirds vote of the outstanding voting securities of the trust. In any event, each non-interested Trustee shall retire not later than the last day of the calendar year in which his or her 72nd birthday occurs. The executive officers and Advisory Board Members hold office without limit in time, except that any officer and Advisory Board Member may resign or may be removed by a vote of a majority of the Trustees at any regular meeting or any special meeting of the Trustees. Except as indicated, each individual has held the office shown or other offices in the same company for the past five years.
The fund's Statement of Additional Information (SAI) includes more information about the Trustees. To request a free copy, call Fidelity at 1-800-544-5429.
Interested Trustees*:
Correspondence intended for each Trustee who is an "interested person" (as defined in the 1940 Act) may be sent to Fidelity Investments, 82 Devonshire Street, Boston, Massachusetts 02109.
Name, Age; Principal Occupation |
Edward C. Johnson 3d (74)** |
| Year of Election or Appointment: 1981 Mr. Johnson is Chairman of the Board of Trustees. Mr. Johnson serves as Chief Executive Officer, Chairman, and a Director of FMR Corp.; a Director and Chairman of the Board and of the Executive Committee of FMR; Chairman and a Director of Fidelity Management & Research (Far East) Inc.; Chairman (1998) and a Director of Fidelity Investments Money Management, Inc.; and Chairman (2001) and a Director (2000) of FMR Co., Inc. |
Abigail P. Johnson (43)** |
| Year of Election or Appointment: 2001 Senior Vice President of VIP High Income (2001). Ms. Johnson also serves as Senior Vice President of other Fidelity funds (2001). She is President and a Director of FMR (2001), Fidelity Investments Money Management, Inc. (2001), FMR Co., Inc. (2001), and a Director of FMR Corp. Previously, Ms. Johnson managed a number of Fidelity funds. |
Laura B. Cronin (50) |
| Year of Election or Appointment: 2003 Ms. Cronin is an Executive Vice President (2002) and Chief Financial Officer (2002) of FMR Corp. and is a member of the Fidelity Management Committee (2003). Previously, Ms. Cronin served as Vice President of Finance of FMR (1997-1999), and Chief Financial Officer of FMR (1999-2001), Fidelity Personal Investments (2001), and Fidelity Brokerage Company (2001-2002). |
Robert L. Reynolds (52) |
| Year of Election or Appointment: 2003 Mr. Reynolds is a Director (2003) and Chief Operating Officer (2002) of FMR Corp. and is the head of the Fidelity Management Committee (2003). He also serves on the Board at Fidelity Investments Canada, Ltd. (2000). Previously, Mr. Reynolds served as President of Fidelity Investments Institutional Retirement Group (1996-2000). |
* Trustees have been determined to be "Interested Trustees" by virtue of, among other things, their affiliation with the trust or various entities under common control with FMR.
** Edward C. Johnson 3d, Trustee, is Abigail P. Johnson's father.
Annual Report
Non-Interested Trustees:
Correspondence intended for each non-interested Trustee (that is, the Trustees other than the Interested Trustees) may be sent to Fidelity Investments, P.O. Box 55235, Boston, Massachusetts 02205-5235.
Name, Age; Principal Occupation |
Dennis J. Dirks (56) |
| Year of Election or Appointment: 2005 Trustee of Variable Insurance Products Fund. Mr. Dirks also serves as a Trustee (2005) or Member of the Advisory Board (2004) of other investment companies advised by FMR. Prior to his retirement in May 2003, Mr. Dirks was Chief Operating Officer and a member of the Board of The Depository Trust & Clearing Corporation (DTCC) (1999-2003). He also served as President, Chief Operating Officer, and Board member of The Depository Trust Company (DTC) (1999-2003) and President and Board member of the National Securities Clearing Corporation (NSCC) (1999-2003). In addition, Mr. Dirks served as Chief Executive Officer and Board member of the Government Securities Clearing Corporation (2001-2003) and Chief Executive Officer and Board member of the Mortgage-Backed Securities Clearing Corporation (2001-2003). |
Robert M. Gates (61) |
| Year of Election or Appointment: 1997 Dr. Gates is Vice Chairman of the non-interested Trustees (2005). Dr. Gates is President of Texas A&M University (2002). He was Director of the Central Intelligence Agency (CIA) from 1991 to 1993. From 1989 to 1991, Dr. Gates served as Assistant to the President of the United States and Deputy National Security Advisor. Dr. Gates is a Director of NACCO Industries, Inc. (mining and manufacturing), Parker Drilling Co., Inc. (drilling and rental tools for the energy industry, 2001), and Brinker International (restaurant management, 2003). He also serves as a member of the Advisory Board of VoteHere.net (secure Internet voting, 2001). Previously, Dr. Gates served as a Director of LucasVarity PLC (automotive components and diesel engines), a Director of TRW Inc. (automotive, space, defense, and information technology), and Dean of the George Bush School of Government and Public Service at Texas A&M University (1999-2001). Dr. Gates also is a Trustee of the Forum for International Policy. |
George H. Heilmeier (68) |
| Year of Election or Appointment: 2004 Dr. Heilmeier is Chairman Emeritus of Telcordia Technologies (communication software and systems), where prior to his retirement, he served as company Chairman and Chief Executive Officer. He currently serves on the Boards of Directors of The Mitre Corporation (systems engineering and information technology support for the government), INET Technologies Inc. (telecommunications network surveillance, 2001) and Teletech Holdings (customer management services, 1998). He is Chairman of the General Motors Technology Advisory Committee and a Life Fellow of the IEEE (2000). Dr. Heilmeier is a member of the Defense Science Board and the National Security Agency Advisory Board. He is also a member of the National Academy of Engineering, the American Academy of Arts and Sciences and The Board of Overseers of the School of Engineering and Applied Science of the University of Pennsylvania. Previously, Dr. Heilmeier served as a Director of TRW Inc. (automotive, space, defense, and information technology, 1992-2002) and Compaq (1994-2002). |
Marie L. Knowles (58) |
| Year of Election or Appointment: 2001 Prior to Ms. Knowles' retirement in June 2000, she served as Executive Vice President and Chief Financial Officer of Atlantic Richfield Company (ARCO) (diversified energy, 1996-2000). From 1993 to 1996, she was a Senior Vice President of ARCO and President of ARCO Transportation Company. She served as a Director of ARCO from 1996 to 1998. She currently serves as a Director of Phelps Dodge Corporation (copper mining and manufacturing), URS Corporation (multidisciplinary engineering, 1999), and McKesson Corporation (healthcare service, 2002). Ms. Knowles is a Trustee of the Brookings Institution and the Catalina Island Conservancy and also serves as a member of the Advisory Board for the School of Engineering of the University of Southern California. |
Ned C. Lautenbach (60) |
| Year of Election or Appointment: 2000 Mr. Lautenbach has been a partner of Clayton, Dubilier & Rice, Inc. (private equity investment firm) since September 1998. Previously, Mr. Lautenbach was with the International Business Machines Corporation (IBM) from 1968 until his retirement in 1998. He was most recently Senior Vice President and Group Executive of Worldwide Sales and Services. From 1993 to 1995, he was Chairman of IBM World Trade Corporation, and from 1994 to 1998 was a member of IBM's Corporate Executive Committee. Mr. Lautenbach serves as Co-Chairman and a Director of Covansys, Inc. (global provider of business and technology solutions, 2000). In addition, he is a Director of Eaton Corporation (diversified industrial) and the Philharmonic Center for the Arts in Naples, Florida (1999). He also is a member of the Council on Foreign Relations. |
Marvin L. Mann (71)* |
| Year of Election or Appointment: 1993 Mr. Mann is Chairman of the non-interested Trustees (2001). He is Chairman Emeritus of Lexmark International, Inc. (computer peripherals) where he served as CEO until April 1998 and retired as Chairman May 1999, and remains a member of the Board. Prior to 1991, he held the positions of Vice President of International Business Machines Corporation (IBM) and President and General Manager of various IBM divisions and subsidiaries. Mr. Mann is a Board member of Imation Corp. (imaging and information storage). He is also a member of the Director Services Committee of the Investment Company Institute. In addition, Mr. Mann is a member of the President's Cabinet at the University of Alabama and the Board of Visitors of the Culverhouse College of Commerce and Business Administration at the University of Alabama. |
William O. McCoy (71) |
| Year of Election or Appointment: 1997 Prior to his retirement in December 1994, Mr. McCoy was Vice Chairman of the Board of BellSouth Corporation (telecommunications) and President of BellSouth Enterprises. He is currently a Director of Liberty Corporation (holding company), Duke Realty Corporation (real estate), and Progress Energy, Inc. (electric utility). He is also a partner of Franklin Street Partners (private investment management firm) and a member of the Research Triangle Foundation Board. In addition, Mr. McCoy served as the Interim Chancellor (1999-2000) and a member of the Board of Visitors (1994-1998) for the University of North Carolina at Chapel Hill and currently serves on the Board of Directors of the University of North Carolina Health Care System and the Board of Visitors of the Kenan-Flagler Business School (University of North Carolina at Chapel Hill). He also served as Vice President of Finance for the University of North Carolina (16-school system, 1995-1998). |
Cornelia M. Small (60) |
| Year of Election or Appointment: 2005 Trustee of Variable Insurance Products Fund. Ms. Small is a member (2000) and Chairperson (2002) of the Investment Committee, and a member (2002) of the Board of Trustees of Smith College. Previously, she served as Chief Investment Officer (1999-2000), Director of Global Equity Investments (1996-1999), and a member of the Board of Directors of Scudder, Stevens, & Clark (1990-1997) and Scudder Kemper Investments (1997-1998). In addition, Ms. Small served as Co-Chair (2000-2003) of the Annual Fund for the Fletcher School of Law and Diplomacy. |
William S. Stavropoulos (65) |
| Year of Election or Appointment: 2001 Mr. Stavropoulos is Chairman of the Board (2000), CEO (2002), a position he previously held from 1995-2000, Chairman of the Executive Committee (2000), and a Member of the Board of Directors of The Dow Chemical Company. Since joining The Dow Chemical Company in 1967, Mr. Stavropoulos served in numerous senior management positions, including President (1993-2000; 2002-2003). Currently, he is a Director of NCR Corporation (data warehousing and technology solutions), BellSouth Corporation (telecommunications), Chemical Financial Corporation, and Maersk Inc. (industrial conglomerate, 2002). He also serves as a member of the Board of Trustees of the American Enterprise Institute for Public Policy Research. In addition, Mr. Stavropoulos is a member of The Business Council, J.P. Morgan International Council and the University of Notre Dame Advisory Council for the College of Science. |
Kenneth L. Wolfe (65) |
| Year of Election or Appointment: 2005 Trustee of Variable Insurance Products Fund. Mr. Wolfe also serves as a Trustee (2005) or Member of the Advisory Board (2004) of other investment companies advised by FMR. Prior to his retirement in 2001, Mr. Wolfe was Chairman and Chief Executive Officer of Hershey Foods Corporation (1993-2001). He currently serves as a member of the boards of Adelphia Communications Corporation (2003), Bausch & Lomb, Inc., and Revlon Inc. (2004). |
Advisory Board Members and Executive Officers:
Correspondence intended for each executive officer and Mr. Lynch may be sent to Fidelity Investments, 82 Devonshire Street, Boston, Massachusetts 02109.
Name, Age; Principal Occupation |
Peter S. Lynch (61) |
| Year of Election or Appointment: 2003 Member of the Advisory Board of Variable Insurance Products Fund. Vice Chairman and a Director of FMR, and Vice Chairman (2001) and a Director (2000) of FMR Co., Inc. Previously, Mr. Lynch served as a Trustee of the Fidelity funds (1990-2003). Prior to May 31, 1990, he was a Director of FMR and Executive Vice President of FMR (a position he held until March 31, 1991), Vice President of Fidelity® Magellan® Fund and FMR Growth Group Leader, and Managing Director of FMR Corp. Mr. Lynch was also Vice President of Fidelity Investments Corporate Services. In addition, he serves as a Trustee of Boston College, Massachusetts Eye & Ear Infirmary, Historic Deerfield, John F. Kennedy Library, and the Museum of Fine Arts of Boston. |
Bart A. Grenier (45) |
| Year of Election or Appointment: 2002 Vice President of VIP High Income. Mr. Grenier also serves as Vice President of certain Equity Funds (2001), a position he previously held from 1999 to 2000, and Vice President of certain High Income Funds (2002). He is Senior Vice President of FMR (1999) and FMR Co., Inc. (2001), and President and Director of Strategic Advisers, Inc. (2002). He also heads Fidelity's Asset Allocation Group (2000), Fidelity's Growth and Income Group (2001), Fidelity's Value Group (2001), and Fidelity's High Income Division (2001). Previously, Mr. Grenier served as President of Fidelity Ventures (2000), Vice President of certain High Income Funds (1997-2000), High Income Division Head (1997-2000), Group Leader of the Income-Growth and Asset Allocation-Income Groups (1996-2000), and Assistant Equity Division Head (1997-2000). |
Matthew Conti (38) |
| Year of Election or Appointment: 2003 Vice President of VIP High Income. Mr. Conti also serves as Vice President of other funds advised by FMR. Prior to assuming his current responsibilities, Mr. Conti worked as an analyst and manager. |
Eric D. Roiter (56) |
| Year of Election or Appointment: 1998 Secretary of VIP High Income. He also serves as Secretary of other Fidelity funds; Vice President, General Counsel, and Secretary of FMR Co., Inc. (2001-present) and FMR; Vice President and Secretary of FDC; Assistant Secretary of Fidelity Management & Research (U.K.) Inc. (2001-present), Fidelity Management & Research (Far East) Inc. (2001-present), of and Fidelity Investments Money Management, Inc. (2001-present). Mr. Roiter is an Adjunct Member, Faculty of Law, at Boston College Law School (2003-present). |
Stuart Fross (45) |
| Year of Election or Appointment: 2003 Assistant Secretary of VIP High Income. Mr. Fross also serves as Assistant Secretary of other Fidelity funds (2003) and is an employee of FMR. |
Christine Reynolds (46) |
| Year of Election or Appointment: 2004 President, Treasurer, and Anti-Money Laundering (AML) officer of VIP High Income. Ms. Reynolds also serves as President, Treasurer, and AML officer of other Fidelity funds (2004) and is a Vice President (2003) and an employee (2002) of FMR. Before joining Fidelity Investments, Ms. Reynolds worked at PricewaterhouseCoopers LLP (PwC) (1980-2002), where she was most recently an audit partner with PwC's investment management practice. |
Timothy F. Hayes (54) |
| Year of Election or Appointment: 2002 Chief Financial Officer of VIP High Income. Mr. Hayes also serves as Chief Financial Officer of other Fidelity funds (2002). Recently he was appointed President of Fidelity Service Company (2003) where he also serves as a Director. Mr. Hayes also serves as President of Fidelity Investments Operations Group (FIOG, 2002), which includes Fidelity Pricing and Cash Management Services Group (FPCMS), where he was appointed President in 1998. Previously, Mr. Hayes served as Chief Financial Officer of Fidelity Investments Corporate Systems and Service Group (1998) and Fidelity Systems Company (1997-1998). |
Kenneth A. Rathgeber (57) |
| Year of Election or Appointment: 2004 Chief Compliance Officer of VIP High Income. Mr. Rathgeber also serves as Chief Compliance Officer of other Fidelity funds (2004) and Executive Vice President of Risk Oversight for Fidelity Investments (2002). Previously, he served as Executive Vice President and Chief Operating Officer for Fidelity Investments Institutional Services Company, Inc. (1998-2002). |
John R. Hebble (46) |
| Year of Election or Appointment: 2003 Deputy Treasurer of VIP High Income. Mr. Hebble also serves as Deputy Treasurer of other Fidelity funds (2003), and is an employee of FMR. Before joining Fidelity Investments, Mr. Hebble worked at Deutsche Asset Management where he served as Director of Fund Accounting (2002-2003) and Assistant Treasurer of the Scudder Funds (1998-2003). |
Kimberley H. Monasterio (41) |
| Year of Election or Appointment: 2004 Deputy Treasurer of VIP High Income. Ms. Monasterio also serves as Deputy Treasurer of other Fidelity funds (2004) and is an employee of FMR (2004). Before joining Fidelity Investments, Ms. Monasterio served as Treasurer (2000-2004) and Chief Financial Officer (2002-2004) of the Franklin Templeton Funds and Senior Vice President of Franklin Templeton Services, LLC (2000-2004). |
John H. Costello (58) |
| Year of Election or Appointment: 1986 Assistant Treasurer of VIP High Income. Mr. Costello also serves as Assistant Treasurer of other Fidelity funds and is an employee of FMR. |
Peter L. Lydecker (50) |
| Year of Election or Appointment: 2004 Assistant Treasurer of VIP High Income. Mr. Lydecker also serves as Assistant Treasurer of other Fidelity funds (2004) and is an employee of FMR. |
Mark Osterheld (49) |
| Year of Election or Appointment: 2002 Assistant Treasurer of VIP High Income. Mr. Osterheld also serves as Assistant Treasurer of other Fidelity funds (2002) and is an employee of FMR. |
Kenneth B. Robins (35) |
| Year of Election or Appointment:2004 Assistant Treasurer of VIP High Income. Mr. Robins also serves as Assistant Treasurer of other Fidelity funds (2004) and is an employee of FMR (2004). Before joining Fidelity Investments, Mr. Robins worked at KPMG LLP, where he was a partner in KPMG's department of professional practice (2002-2004) and a Senior Manager (1999-2000). In addition, Mr. Robins served as Assistant Chief Accountant, United States Securities and Exchange Commission (2000-2002). |
Annual Report
Proxy Voting Results
A special meeting of the fund's shareholders was held on December 14, 2004. The results of votes taken among shareholders on proposals before them are reported below. Each vote reported represents one dollar of net asset value held on the record date for the meeting.
PROPOSAL 1 |
To amend the Declaration of Trust to allow the Board of Trustees, if permitted by applicable law, to authorize fund mergers without shareholder approval. A |
| # of
Votes | % of
Votes |
Affirmative | 15,331,508,529.96 | 81.853 |
Against | 2,429,553,894.02 | 12.972 |
Abstain | 969,378,618.94 | 5.175 |
TOTAL | 18,730,441,042.92 | 100.000 |
PROPOSAL 2 |
To elect a Board of Trustees. A |
| # of
Votes | % of
Votes |
J. Michael Cook |
Affirmative | 17,770,642,454.98 | 94.876 |
Withheld | 959,798,587.94 | 5.124 |
TOTAL | 18,730,441,042.92 | 100.000 |
Ralph F. Cox |
Affirmative | 17,759,356,374.26 | 94.815 |
Withheld | 971,084,668.66 | 5.185 |
TOTAL | 18,730,441,042.92 | 100.000 |
Laura B. Cronin |
Affirmative | 17,797,888,742.24 | 95.021 |
Withheld | 932,552,300.68 | 4.979 |
TOTAL | 18,730,441,042.92 | 100.000 |
Dennis J. DirksB |
Affirmative | 17,802,602,074.45 | 95.046 |
Withheld | 927,838,968.47 | 4.954 |
TOTAL | 18,730,441,042.92 | 100.000 |
Robert M. Gates |
Affirmative | 17,784,855,823.58 | 94.952 |
Withheld | 945,585,219.34 | 5.048 |
TOTAL | 18,730,441,042.92 | 100.000 |
George H. Heilmeier |
Affirmative | 17,768,875,556.56 | 94.866 |
Withheld | 961,565,486.36 | 5.134 |
TOTAL | 18,730,441,042.92 | 100.000 |
Abigail P. Johnson |
Affirmative | 17,781,929,073.06 | 94.936 |
Withheld | 948,511,969.86 | 5.064 |
TOTAL | 18,730,441,042.92 | 100.000 |
Edward C. Johnson 3d |
Affirmative | 17,752,140,336.45 | 94.777 |
Withheld | 978,300,706.47 | 5.223 |
TOTAL | 18,730,441,042.92 | 100.000 |
Donald J. Kirk |
Affirmative | 17,772,467,361.45 | 94.885 |
Withheld | 957,973,681.47 | 5.115 |
TOTAL | 18,730,441,042.92 | 100.000 |
| # of
Votes | % of
Votes |
Marie L. Knowles |
Affirmative | 17,776,922,254.30 | 94.909 |
Withheld | 953,518,788.62 | 5.091 |
TOTAL | 18,730,441,042.92 | 100.000 |
Ned C. Lautenbach |
Affirmative | 17,804,221,564.95 | 95.055 |
Withheld | 926,219,477.97 | 4.945 |
TOTAL | 18,730,441,042.92 | 100.000 |
Marvin L. Mann |
Affirmative | 17,763,277,607.06 | 94.836 |
Withheld | 967,163,435.86 | 5.164 |
TOTAL | 18,730,441,042.92 | 100.000 |
William O. McCoy |
Affirmative | 17,758,560,162.11 | 94.811 |
Withheld | 971,880,880.81 | 5.189 |
TOTAL | 18,730,441,042.92 | 100.000 |
Robert L. Reynolds |
Affirmative | 17,806,026,904.06 | 95.065 |
Withheld | 924,414,138.86 | 4.935 |
TOTAL | 18,730,441,042.92 | 100.000 |
Cornelia M. SmallB |
Affirmative | 17,798,878,892.31 | 95.026 |
Withheld | 931,562,150.61 | 4.974 |
TOTAL | 18,730,441,042.92 | 100.000 |
William S. Stavropoulos |
Affirmative | 17,786,496,107.78 | 94.960 |
Withheld | 943,944,935.14 | 5.040 |
TOTAL | 18,730,441,042.92 | 100.000 |
PROPOSAL 9 |
To amend the fund's fundamental investment limitation concerning borrowing. |
| # of
Votes | % of
Votes |
Affirmative | 1,451,356,817.10 | 90.478 |
Against | 59,751,642.97 | 3.725 |
Abstain | 92,989,319.11 | 5.797 |
TOTAL | 1,604,097,779.18 | 100.000 |
PROPOSAL 10 |
To amend the fund's fundamental investment limitation concerning lending. |
| # of
Votes | % of
Votes |
Affirmative | 1,453,764,730.70 | 90.628 |
Against | 57,576,166.97 | 3.590 |
Abstain | 92,756,881.51 | 5.782 |
TOTAL | 1,604,097,779.18 | 100.000 |
A Denotes trust-wide proposals and voting results. B Effective January 1, 2005. |
Annual Report
Annual Report
Investment Adviser
Fidelity Management & Research Company
Boston, MA
Investment Sub-Advisers
FMR Co., Inc.
Fidelity Management & Research (U.K.) Inc.
Fidelity Management & Research (Far East) Inc.
Fidelity Investments Japan Limited
Fidelity International Investment Advisors
Fidelity International Investment Advisors (U.K.) Limited
General Distributor
Fidelity Distributors Corporation
Boston, MA
Transfer and Shareholder Servicing Agent
Fidelity Investments Institutional Operations Company, Inc.
Boston, MA
Custodian
The Bank of New York
New York, NY
VIPHIR-ANN-0205
1.811842.100
Fidelity® Variable Insurance Products:
High Income Portfolio
Annual Report
December 31, 2004
(2_fidelity_logos) (Registered_Trademark)
Contents
Performance | 3 | How the fund has done over time. |
Management's Discussion | 4 | The manager's review of fund performance, strategy and outlook. |
Shareholder Expense Example | 5 | An example of shareholder expenses. |
Investment Summary | 6 | A summary of the fund's investments at period end. |
Investments | 7 | A complete list of the fund's investments with their
market values. |
Financial Statements | 15 | Statements of assets and liabilities, operations, and
changes in net assets, as well as financial highlights. |
Notes | 20 | Notes to the financial statements. |
Report of Independent Registered Public Accounting Firm | 24 | |
Trustees and Officers | 25 | |
Proxy Voting Results | 30 | |
| | |
To view a fund's proxy voting guidelines and proxy voting record for the 12-month period ended June 30, visit www.fidelity.com/proxyvotingresults or visit the Securities and Exchange Commission's (SEC) web site at www.sec.gov. You may also call 1-800-544-5429 to request a free copy of the proxy voting guidelines.
Fidelity Variable Insurance Products are separate account options which are purchased through a variable insurance contract.
Standard & Poor's, S&P and S&P 500 are registered service marks of The McGraw-Hill Companies, Inc. and have been licensed for use by Fidelity Distributors Corporation.
Other third party marks appearing herein are the property of their respective owners.
All other marks appearing herein are registered or unregistered trademarks or service marks of FMR Corp. or an affiliated company.
(Recycle graphic) This report is printed on recycled paper using soy-based inks.
This report and the financial statements contained herein are submitted for the general information of the shareholders of the fund. This report is not authorized for distribution to prospective investors in the fund unless preceded or accompanied by an effective prospectus.
A fund files its complete schedule of portfolio holdings with the SEC for the first and third quarters of each fiscal year on Form N-Q. Forms N-Q are available on the SEC's web site at http://www.sec.gov. A fund's Forms N-Q may be reviewed and copied at the SEC's Public Reference Room in Washington, DC. Information regarding the operation of the SEC's Public Reference Room may be obtained by calling 1-800-SEC-0330. For a complete list of a fund's portfolio holdings, view the most recent quarterly holdings report, semiannual report, or annual report on Fidelity's web site at http://www.advisor.fidelity.com.
NOT FDIC INSURED · MAY LOSE VALUE · NO BANK GUARANTEE
Neither the fund nor Fidelity Distributors Corporation is a bank.
High Income Portfolio
Fidelity Variable Insurance Products: High Income Portfolio
Performance: The Bottom Line
Average annual total return reflects the change in the value of an investment, assuming reinvestment of a class' dividend income and capital gains (the profits earned upon the sale of securities that have grown in value) and assuming a constant rate of performance each year. During periods of reimbursement by Fidelity, a fund's total return will be greater than it would be had the reimbursement not occurred. Performance numbers are net of all underlying fund operating expenses, but do not include any insurance charges imposed by your insurance company's separate account. If performance information included the effect of these additional charges, the total returns would be lower. How a fund did yesterday is no guarantee of how it will do tomorrow.
Average Annual Total Returns
Periods ended December 31, 2004 | Past 1
year | Past 5
years | Past 10
years |
Fidelity® VIP: High Income - Initial Class | 9.59% | -0.27% | 5.17% |
Fidelity VIP: High Income - Service ClassA | 9.47% | -0.38% | 5.08% |
Fidelity VIP: High Income - Service Class 2B | 9.38% | -0.55% | 4.99% |
A The initial offering of Service Class shares took place on November 3, 1997. Performance for Service Class shares reflects an asset based distribution fee (12b-1 fee), and returns prior to November 3, 1997 are those of Initial Class and do not include the effects of Service Class' 12b-1 fee. Had Service Class' 12b-1 fee been reflected, returns prior to November 3, 1997 would have been lower.
B The initial offering of Service Class 2 shares took place on January 12, 2000. Performance for Service Class 2 shares reflects an asset based distribution fee (12b-1 fee). Returns from November 3, 1997 to January 12, 2000 are those of Service Class which reflect a different 12b-1 fee. Service Class 2 returns prior to November 3, 1997 are those of Initial Class and do not include the effects of a 12b-1 fee. Had Service Class 2's 12b-1 fee been reflected, returns prior to January 12, 2000 would have been lower.
$10,000 Over 10 Years
Let's say hypothetically that $10,000 was invested in Fidelity® Variable Insurance Products: High Income Portfolio - Initial Class on December 31, 1994. The chart shows how the value of your investment would have changed, and also shows how the ML ® U.S. High Yield Master II Index performed over the same period.
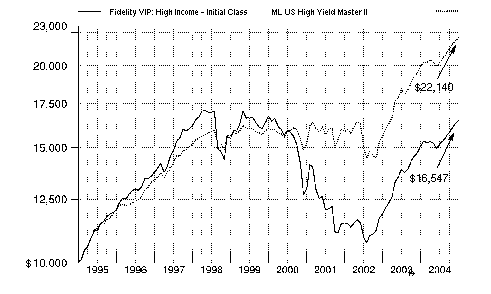
Annual Report
Fidelity Variable Insurance Products: High Income Portfolio
Management's Discussion of Fund Performance
Comments from Matthew Conti, Portfolio Manager of Fidelity® Variable Insurance Products: High Income Portfolio
Investors in high-yield securities generally found positive returns in 2004, as the Merrill Lynch® U.S. High Yield Master II Index advanced 10.87% for the year overall. This performance marks the first time the high-yield bond market has posted two consecutive years of double-digit increases since 1996-1997. The strong demand for the attractive yields of high-income securities, plus ready access to capital and a declining default rate, helped drive returns in this non-investment-grade asset class. As corporate America continued to improve its cash flows and deleverage its balance sheets, the stronger credit profiles for companies borrowing in the high-yield market served to make investors less risk averse, particularly in the more speculative credit tiers such as CCC-rated securities, which returned 15.75% during the past year. In comparison, the BB-rated and B-rated sectors rose 9.33% and 10.44%, respectively. As was the case in the equity markets, energy, metals/mining and other commodity industries were among the leaders in the high-yield universe.
During the 12 months that ended December 31, 2004, High Income Portfolio underperformed its benchmark, the Merrill Lynch U.S. High Yield Master II Index, and performed roughly in line with the LipperSM Variable Annuity High Current Yield Funds Average, which returned 9.84%. The fund underperformed the index because of its avoidance of the lowest-rated bonds and distressed securities, which performed best during the period. An overweighting in the telecommunications industry also held back performance. On the plus side, strong security selection in cable TV, health care, chemicals and utilities helped the fund's relative performance. Top performers included Huntsman Chemicals, electric utilities AES and Cogentrix, and Delta Airlines. Among the investments that detracted from the fund's performance were semiconductor testing and packaging company Amkor Technology, telecom service provider Cincinnati Bell, theme park company Six Flags and television station operator Granite Broadcasting.
The views expressed in this statement reflect those of the portfolio manager only through the end of the period of the report as stated on the cover and do not necessarily represent the views of Fidelity or any other person in the Fidelity organization. Any such views are subject to change at any time based upon market or other conditions and Fidelity disclaims any responsibility to update such views. These views may not be relied on as investment advice and, because investment decisions for a Fidelity fund are based on numerous factors, may not be relied on as an indication of trading intent on behalf of any Fidelity fund.
High Income Portfolio
Fidelity Variable Insurance Products: High Income Portfolio
Shareholder Expense Example
As a shareholder of the Fund, you incur two types of costs: (1) transaction costs, including redemption fees, and (2) ongoing costs, including management fees, distribution and/or service (12b-1) fees and other Fund expenses. This Example is intended to help you understand your ongoing costs (in dollars) of investing in the Fund and to compare these costs with the ongoing costs of investing in other mutual funds.
The Example is based on an investment of $1,000 invested at the beginning of the period and held for the entire period (July 1, 2004 to December 31, 2004).
Actual Expenses
The first line of the table below for each class of the Fund provides information about actual account values and actual expenses. You may use the information in this line, together with the amount you invested, to estimate the expenses that you paid over the period. Simply divide your account value by $1,000.00 (for example, an $8,600 account value divided by $1,000.00 = 8.6), then multiply the result by the number in the first line for a class of the Fund under the heading entitled "Expenses Paid During Period" to estimate the expenses you paid on your account during this period. The estimate of expenses does not include any fees or other expenses of any variable annuity or variable life insurance product. If they were, the estimate of expenses you paid during the period would be higher, and your ending account value would be lower.
Hypothetical Example for Comparison Purposes
The second line of the table below for each class of the Fund provides information about hypothetical account values and hypothetical expenses based on a Class' actual expense ratio and an assumed rate of return of 5% per year before expenses, which is not the Class' actual return. The hypothetical account values and expenses may not be used to estimate the actual ending account balance or expenses you paid for the period. You may use this information to compare the ongoing costs of investing in the Fund and other funds. To do so, compare this 5% hypothetical example with the 5% hypothetical examples that appear in the shareholder reports of the other funds. The estimate of expenses does not include any fees or other expenses of any variable annuity or variable life insurance product. If they were, the estimate of expenses you paid during the period would be higher, and your ending account value would be lower.
Please note that the expenses shown in the table are meant to highlight your ongoing costs only and do not reflect any transaction costs. Therefore, the second line of the table is useful in comparing ongoing costs only, and will not help you determine the relative total costs of owning different funds. In addition, if these transactional costs were included, your costs would have been higher.
| Beginning
Account Value
July 1, 2004 | Ending
Account Value
December 31, 2004 | Expenses Paid
During Period *
July 1, 2004
to December 31, 2004 |
Initial Class | | | |
Actual | $ 1,000.00 | $ 1,088.60 | $ 3.78 |
Hypothetical A | $ 1,000.00 | $ 1,021.52 | $ 3.66 |
Service Class | | | |
Actual | $ 1,000.00 | $ 1,089.10 | $ 4.31 |
Hypothetical A | $ 1,000.00 | $ 1,021.01 | $ 4.17 |
Service Class 2 | | | |
Actual | $ 1,000.00 | $ 1,088.20 | $ 5.14 |
Hypothetical A | $ 1,000.00 | $ 1,020.21 | $ 4.98 |
Initial Class R | | | |
Actual | $ 1,000.00 | $ 1,090.30 | $ 3.73 |
Hypothetical A | $ 1,000.00 | $ 1,021.57 | $ 3.61 |
Service Class R | | | |
Actual | $ 1,000.00 | $ 1,089.10 | $ 4.25 |
Hypothetical A | $ 1,000.00 | $ 1,021.06 | $ 4.12 |
Service Class 2R | | | |
Actual | $ 1,000.00 | $ 1,088.20 | $ 5.04 |
Hypothetical A | $ 1,000.00 | $ 1,020.31 | $ 4.88 |
A 5% return per year before expenses
*Expenses are equal to each Class' annualized expense ratio (shown in the table below); multiplied by the average account value over the period, multiplied by 184/366 (to reflect the one-half year period).
| Annualized
Expense Ratio |
Initial Class | .72% |
Service Class | .82% |
Service Class 2 | .98% |
Initial Class R | .71% |
Service Class R | .81% |
Service Class 2R | .96% |
Annual Report
Fidelity Variable Insurance Products: High Income Portfolio
Investment Summary
Top Five Holdings as of December 31, 2004 |
(by issuer, excluding cash equivalents) | % of fund's
net assets |
AES Corp. | 1.9 |
American Airlines, Inc. pass thru trust certificates | 1.6 |
Xerox Corp. | 1.6 |
Nextel Communications, Inc. | 1.5 |
MGM MIRAGE | 1.5 |
| 8.1 |
Top Five Market Sectors as of December 31, 2004 |
| % of fund's
net assets |
Telecommunications | 9.6 |
Energy | 7.5 |
Chemicals | 7.2 |
Electric Utilities | 7.0 |
Healthcare | 6.2 |
Quality Diversification (% of fund's net assets) as of December 31, 2004 |
 | AAA, AA, A | 0.0% | |
 | BBB | 0.3% | |
 | BB | 36.8% | |
 | B | 46.6% | |
 | CCC, CC, C | 10.1% | |
 | Not Rated | 3.0% | |
 | Other Investments | 0.3% | |
 | Equities | 0.3% | |
 | Short-Term Investments and Net Other Assets | 2.6% | |
We have used ratings from Moody's Investors Services, Inc. Where Moody's ratings are not available, we have used S&P ratings. |
High Income Portfolio
Fidelity Variable Insurance Products: High Income Portfolio
Investments December 31, 2004
Showing Percentage of Net Assets
Nonconvertible Bonds - 91.1% |
| Principal
Amount | | Value
(Note 1) |
Aerospace - 1.0% |
Bombardier, Inc. 6.3% 5/1/14 (e) | | $ 5,565,000 | | $ 4,827,638 |
L-3 Communications Corp. 5.875% 1/15/15 (e) | | 4,910,000 | | 4,897,725 |
Orbital Sciences Corp. 9% 7/15/11 | | 4,720,000 | | 5,310,000 |
Primus International, Inc. 10.5% 4/15/09 (e) | | 3,170,000 | | 3,312,650 |
| | 18,348,013 |
Air Transportation - 3.7% |
American Airlines, Inc. pass thru trust certificates: | | | | |
6.817% 5/23/11 | | 11,825,000 | | 11,115,500 |
6.977% 11/23/22 | | 556,744 | | 520,555 |
7.324% 4/15/11 | | 1,480,000 | | 1,228,400 |
7.377% 5/23/19 | | 14,357,509 | | 10,050,256 |
7.379% 5/23/16 | | 6,249,810 | | 4,374,867 |
7.8% 4/1/08 | | 2,595,000 | | 2,413,350 |
10.18% 1/2/13 | | 2,190,000 | | 1,708,200 |
AMR Corp. 10.2% 3/15/20 | | 165,000 | | 125,400 |
Delta Air Lines, Inc.: | | | | |
7.9% 12/15/09 | | 7,330,000 | | 4,617,900 |
8.3% 12/15/29 | | 13,070,000 | | 6,306,275 |
9.5% 11/18/08 (e) | | 4,862,000 | | 4,558,125 |
10% 8/15/08 | | 3,370,000 | | 2,502,225 |
Delta Air Lines, Inc. pass thru trust certificates: | | | | |
7.379% 5/18/10 | | 1,087,647 | | 1,084,928 |
7.57% 11/18/10 | | 2,950,000 | | 2,909,892 |
7.711% 9/18/11 | | 865,000 | | 657,400 |
7.92% 5/18/12 | | 1,565,000 | | 1,205,050 |
Northwest Airlines Corp. 10% 2/1/09 | | 13,840,000 | | 11,625,600 |
Northwest Airlines, Inc. pass thru trust certificates: | | | | |
7.67% 1/2/15 | | 1,360,819 | | 1,187,315 |
8.07% 1/2/15 | | 1,442,283 | | 1,009,598 |
| | 69,200,836 |
Automotive - 1.1% |
Delco Remy International, Inc. 9.375% 4/15/12 | | 5,510,000 | | 5,702,850 |
Navistar International Corp. 7.5% 6/15/11 | | 5,815,000 | | 6,222,050 |
Stoneridge, Inc. 11.5% 5/1/12 | | 2,715,000 | | 3,108,675 |
Tenneco Automotive, Inc.: | | | | |
8.625% 11/15/14 (e) | | 3,055,000 | | 3,169,563 |
10.25% 7/15/13 | | 2,515,000 | | 2,967,700 |
| | 21,170,838 |
Banks and Thrifts - 0.2% |
Western Financial Bank 9.625% 5/15/12 | | 2,565,000 | | 2,924,100 |
|
| Principal
Amount | | Value
(Note 1) |
Broadcasting - 0.3% |
Gray Television, Inc. 9.25% 12/15/11 | | $ 2,235,000 | | $ 2,503,200 |
Paxson Communications Corp. 0% 1/15/09 (d) | | 3,320,000 | | 3,104,200 |
| | 5,607,400 |
Building Materials - 1.3% |
Goodman Global Holdings, Inc. 5.76% 6/15/12 (e)(f) | | 4,905,000 | | 4,990,838 |
Jacuzzi Brands, Inc. 9.625% 7/1/10 | | 4,070,000 | | 4,517,700 |
Maax Holdings, Inc. 0% 12/15/12 (d)(e) | | 5,840,000 | | 3,679,200 |
Nortek, Inc. 8.5% 9/1/14 (e) | | 5,350,000 | | 5,590,750 |
Texas Industries, Inc. 10.25% 6/15/11 | | 4,860,000 | | 5,734,800 |
| | 24,513,288 |
Cable TV - 3.7% |
Adelphia Communications Corp.: | | | | |
7.875% 5/1/09 (c) | | 2,730,000 | | 2,457,000 |
9.875% 3/1/07 (c) | | 3,090,000 | | 3,012,750 |
10.25% 6/15/11 (c) | | 1,935,000 | | 1,944,675 |
Cablevision Systems Corp.: | | | | |
6.6688% 4/1/09 (e)(f) | | 8,870,000 | | 9,424,375 |
8% 4/15/12 (e) | | 4,120,000 | | 4,382,650 |
CSC Holdings, Inc. 7.625% 4/1/11 | | 2,950,000 | | 3,186,000 |
DirecTV Holdings LLC/DirecTV Financing, Inc. 8.375% 3/15/13 | | 5,765,000 | | 6,456,800 |
EchoStar DBS Corp.: | | | | |
5.75% 10/1/08 | | 15,085,000 | | 15,311,275 |
6.625% 10/1/14 (e) | | 7,590,000 | | 7,703,850 |
GCI, Inc. 7.25% 2/15/14 | | 3,425,000 | | 3,425,000 |
NTL Cable PLC: | | | | |
7.07% 10/15/12 (e)(f) | | 4,400,000 | | 4,532,000 |
8.75% 4/15/14 (e) | | 1,635,000 | | 1,839,375 |
Telenet Group Holding NV 0% 6/15/14 (d)(e) | | 5,505,000 | | 4,183,800 |
| | 67,859,550 |
Capital Goods - 2.9% |
Amsted Industries, Inc. 10.25% 10/15/11 (e) | | 2,860,000 | | 3,246,100 |
Dresser, Inc. 9.375% 4/15/11 | | 7,700,000 | | 8,412,250 |
Invensys PLC 9.875% 3/15/11 (e) | | 15,105,000 | | 16,313,400 |
Leucadia National Corp. 7% 8/15/13 | | 5,775,000 | | 5,948,250 |
Park-Ohio Industries, Inc. 8.375% 11/15/14 (e) | | 3,645,000 | | 3,635,888 |
Sensus Metering Systems, Inc. 8.625% 12/15/13 | | 3,370,000 | | 3,471,100 |
SPX Corp.: | | | | |
6.25% 6/15/11 | | 3,100,000 | | 3,270,500 |
7.5% 1/1/13 | | 7,970,000 | | 8,667,375 |
| | 52,964,863 |
Nonconvertible Bonds - continued |
| Principal
Amount | | Value
(Note 1) |
Chemicals - 7.1% |
BCP Caylux Holdings Luxembourg SCA 9.625% 6/15/14 (e) | | $ 11,360,000 | | $ 12,723,200 |
Borden US Finance Corp./Nova Scotia Finance ULC: | | | | |
6.82% 7/15/10 (e)(f) | | 3,490,000 | | 3,647,050 |
9% 7/15/14 (e) | | 5,655,000 | | 6,220,500 |
Equistar Chemicals LP 7.55% 2/15/26 | | 8,495,000 | | 8,346,338 |
Equistar Chemicals LP/Equistar Funding Corp.: | | | | |
8.75% 2/15/09 | | 4,535,000 | | 5,033,850 |
10.125% 9/1/08 | | 2,905,000 | | 3,340,750 |
HMP Equity Holdings Corp. 0% 5/15/08 | | 6,545,000 | | 4,286,975 |
Huntsman ICI Chemicals LLC 10.125% 7/1/09 | | 31,000 | | 32,705 |
Huntsman ICI Holdings LLC 0% 12/31/09 | | 8,015,000 | | 4,528,475 |
Huntsman International LLC: | | | | |
7.375% 1/1/15 (e) | | 5,010,000 | | 5,047,575 |
9.875% 3/1/09 | | 4,700,000 | | 5,146,500 |
Huntsman LLC: | | | | |
9.32% 7/15/11 (e)(f) | | 5,700,000 | | 6,355,500 |
11.5% 7/15/12 (e) | | 5,555,000 | | 6,527,125 |
Lubrizol Corp. 4.625% 10/1/09 | | 6,100,000 | | 6,090,588 |
Lyondell Chemical Co.: | | | | |
9.5% 12/15/08 | | 12,345,000 | | 13,456,050 |
9.625% 5/1/07 | | 1,260,000 | | 1,382,850 |
10.875% 5/1/09 | | 6,965,000 | | 7,382,900 |
11.125% 7/15/12 | | 4,320,000 | | 5,108,400 |
Millennium America, Inc. 9.25% 6/15/08 | | 11,420,000 | | 12,904,600 |
NOVA Chemicals Corp.: | | | | |
6.5% 1/15/12 | | 6,255,000 | | 6,599,025 |
7.4% 4/1/09 | | 6,420,000 | | 6,933,600 |
| | 131,094,556 |
Consumer Products - 0.7% |
Church & Dwight Co., Inc. 6% 12/15/12 (e) | | 5,275,000 | | 5,367,313 |
Jostens Holding Corp. 0% 12/1/13 (d) | | 3,050,000 | | 2,165,500 |
Jostens IH Corp. 7.625% 10/1/12 (e) | | 1,970,000 | | 2,068,500 |
Samsonite Corp. 8.875% 6/1/11 | | 2,785,000 | | 3,014,763 |
| | 12,616,076 |
Containers - 2.5% |
Anchor Glass Container Corp. 11% 2/15/13 | | 4,335,000 | | 4,703,475 |
Berry Plastics Corp. 10.75% 7/15/12 | | 3,700,000 | | 4,227,250 |
BWAY Corp. 10% 10/15/10 | | 6,685,000 | | 7,119,525 |
Crown Cork & Seal, Inc. 8% 4/15/23 | | 230,000 | | 226,550 |
|
| Principal
Amount | | Value
(Note 1) |
Crown European Holdings SA: | | | | |
9.5% 3/1/11 | | $ 1,405,000 | | $ 1,594,675 |
10.875% 3/1/13 | | 7,905,000 | | 9,347,663 |
Owens-Brockway Glass Container, Inc.: | | | | |
8.25% 5/15/13 | | 5,115,000 | | 5,626,500 |
8.75% 11/15/12 | | 1,750,000 | | 1,964,375 |
8.875% 2/15/09 | | 655,000 | | 710,675 |
Owens-Illinois, Inc.: | | | | |
7.35% 5/15/08 | | 3,505,000 | | 3,697,775 |
7.5% 5/15/10 | | 6,140,000 | | 6,516,075 |
| | 45,734,538 |
Diversified Media - 0.8% |
Corus Entertainment, Inc. 8.75% 3/1/12 | | 6,140,000 | | 6,730,975 |
LBI Media Holdings, Inc. 0% 10/15/13 (d) | | 6,440,000 | | 4,733,400 |
LBI Media, Inc. 10.125% 7/15/12 | | 3,285,000 | | 3,662,775 |
| | 15,127,150 |
Electric Utilities - 6.2% |
AES Corp.: | | | | |
7.75% 3/1/14 | | 5,965,000 | | 6,442,200 |
8.75% 6/15/08 | | 3,068,000 | | 3,344,120 |
8.875% 2/15/11 | | 13,481,000 | | 15,402,043 |
9.375% 9/15/10 | | 6,433,000 | | 7,438,156 |
9.5% 6/1/09 | | 1,499,000 | | 1,703,239 |
AES Gener SA 7.5% 3/25/14 (e) | | 4,200,000 | | 4,420,500 |
Chivor SA E.S.P. 9.75% 12/30/14 (e) | | 2,060,000 | | 2,142,400 |
CMS Energy Corp.: | | | | |
7.5% 1/15/09 | | 4,150,000 | | 4,419,750 |
7.75% 8/1/10 | | 1,970,000 | | 2,154,688 |
8.5% 4/15/11 | | 945,000 | | 1,073,756 |
8.9% 7/15/08 | | 2,180,000 | | 2,406,175 |
9.875% 10/15/07 | | 5,470,000 | | 6,099,050 |
MSW Energy Holdings II LLC/MSW Finance Co. II, Inc. 7.375% 9/1/10 | | 2,950,000 | | 3,097,500 |
MSW Energy Holdings LLC/MSW Energy Finance Co., Inc. 8.5% 9/1/10 | | 2,505,000 | | 2,730,450 |
Nevada Power Co. 6.5% 4/15/12 | | 4,225,000 | | 4,467,938 |
NRG Energy, Inc. 8% 12/15/13 (e) | | 16,260,000 | | 17,743,725 |
Sierra Pacific Power Co. 6.25% 4/15/12 | | 4,100,000 | | 4,274,250 |
Sierra Pacific Resources 8.625% 3/15/14 | | 2,315,000 | | 2,615,950 |
TECO Energy, Inc.: | | | | |
7% 5/1/12 | | 5,880,000 | | 6,453,300 |
Nonconvertible Bonds - continued |
| Principal
Amount | | Value
(Note 1) |
Electric Utilities - continued |
TECO Energy, Inc.: - continued | | | | |
7.2% 5/1/11 | | $ 11,040,000 | | $ 12,199,200 |
Texas Genco LLC/Texas Genco Financing Corp. 6.875% 12/15/14 (e) | | 4,260,000 | | 4,430,400 |
| | 115,058,790 |
Energy - 6.2% |
Belden & Blake Corp. 8.75% 7/15/12 (e) | | 3,350,000 | | 3,425,375 |
Chesapeake Energy Corp.: | | | | |
7.75% 1/15/15 | | 6,100,000 | | 6,649,000 |
8.125% 4/1/11 | | 2,875,000 | | 3,097,813 |
9% 8/15/12 | | 1,920,000 | | 2,181,600 |
El Paso Energy Corp. 6.95% 12/15/07 | | 3,350,000 | | 3,492,375 |
El Paso Production Holding Co. 7.75% 6/1/13 | | 905,000 | | 943,463 |
Hanover Compressor Co.: | | | | |
0% 3/31/07 | | 5,595,000 | | 4,867,650 |
8.625% 12/15/10 | | 1,450,000 | | 1,580,500 |
9% 6/1/14 | | 1,540,000 | | 1,709,400 |
Hilcorp Energy I LP/Hilcorp Finance Co. 10.5% 9/1/10 (e) | | 5,810,000 | | 6,565,300 |
Newfield Exploration Co. 6.625% 9/1/14 (e) | | 4,720,000 | | 4,991,400 |
Parker Drilling Co.: | | | | |
7.15% 9/1/10 (e)(f) | | 9,030,000 | | 9,458,925 |
9.625% 10/1/13 | | 1,505,000 | | 1,691,244 |
Plains Exploration & Production Co.: | | | | |
7.125% 6/15/14 | | 295,000 | | 323,025 |
8.75% 7/1/12 | | 2,540,000 | | 2,841,625 |
Pride International, Inc. 7.375% 7/15/14 | | 7,845,000 | | 8,551,050 |
Range Resources Corp. 7.375% 7/15/13 | | 9,635,000 | | 10,309,450 |
SESI LLC 8.875% 5/15/11 | | 1,740,000 | | 1,905,300 |
Sonat, Inc.: | | | | |
6.625% 2/1/08 | | 2,070,000 | | 2,095,875 |
6.75% 10/1/07 | | 800,000 | | 840,000 |
7.625% 7/15/11 | | 6,665,000 | | 6,873,281 |
Stone Energy Corp. 6.75% 12/15/14 (e) | | 3,990,000 | | 3,950,100 |
The Coastal Corp.: | | | | |
6.375% 2/1/09 | | 6,395,000 | | 6,339,044 |
6.5% 6/1/08 | | 4,840,000 | | 4,864,200 |
7.75% 6/15/10 | | 11,464,000 | | 11,979,880 |
Venoco, Inc. 8.75% 12/15/11 (e) | | 3,230,000 | | 3,326,900 |
| | 114,853,775 |
|
| Principal
Amount | | Value
(Note 1) |
Entertainment/Film - 0.3% |
Cinemark, Inc. 0% 3/15/14 (d) | | $ 7,415,000 | | $ 5,616,863 |
Environmental - 0.9% |
Allied Waste North America, Inc.: | | | | |
5.75% 2/15/11 | | 5,175,000 | | 4,864,500 |
6.375% 4/15/11 | | 3,890,000 | | 3,695,500 |
8.5% 12/1/08 | | 3,690,000 | | 3,929,850 |
8.875% 4/1/08 | | 3,725,000 | | 3,985,750 |
| | 16,475,600 |
Food and Drug Retail - 2.0% |
Jean Coutu Group, Inc.: | | | | |
7.625% 8/1/12 (e) | | 1,440,000 | | 1,522,800 |
8.5% 8/1/14 (e) | | 4,195,000 | | 4,299,875 |
Rite Aid Corp.: | | | | |
6.875% 8/15/13 | | 5,655,000 | | 5,103,638 |
8.125% 5/1/10 | | 1,120,000 | | 1,181,600 |
9.25% 6/1/13 | | 7,255,000 | | 7,363,825 |
9.5% 2/15/11 | | 4,655,000 | | 5,120,500 |
Stater Brothers Holdings, Inc.: | | | | |
5.99% 6/15/10 (f) | | 7,155,000 | | 7,351,763 |
8.125% 6/15/12 | | 4,185,000 | | 4,436,100 |
| | 36,380,101 |
Food/Beverage/Tobacco - 2.9% |
B&G Foods, Inc. 8% 10/1/11 | | 3,310,000 | | 3,525,150 |
Del Monte Corp.: | | | | |
8.625% 12/15/12 | | 3,375,000 | | 3,763,125 |
9.25% 5/15/11 | | 4,215,000 | | 4,636,500 |
Dole Food Co., Inc. 7.25% 6/15/10 | | 8,125,000 | | 8,531,250 |
National Beef Packing Co. LLC/National Beef Finance Corp. 10.5% 8/1/11 | | 3,830,000 | | 3,964,050 |
Smithfield Foods, Inc.: | | | | |
7% 8/1/11 (e) | | 4,050,000 | | 4,323,375 |
7% 8/1/11 | | 1,315,000 | | 1,400,475 |
7.625% 2/15/08 | | 1,800,000 | | 1,926,000 |
7.75% 5/15/13 | | 3,935,000 | | 4,348,175 |
8% 10/15/09 | | 1,510,000 | | 1,668,550 |
Swift & Co. 10.125% 10/1/09 | | 4,345,000 | | 4,888,125 |
UAP Holding Corp. 0% 7/15/12 (d)(e) | | 6,050,000 | | 4,749,250 |
United Agriculture Products, Inc. 8.25% 12/15/11 (e) | | 4,949,000 | | 5,307,803 |
| | 53,031,828 |
Gaming - 4.4% |
Chumash Casino & Resort Enterprise 9% 7/15/10 (e) | | 2,760,000 | | 3,049,800 |
Mandalay Resort Group: | | | | |
9.375% 2/15/10 | | 4,655,000 | | 5,399,800 |
10.25% 8/1/07 | | 3,125,000 | | 3,546,875 |
MGM MIRAGE: | | | | |
6% 10/1/09 | | 13,125,000 | | 13,453,125 |
6.75% 9/1/12 | | 6,750,000 | | 7,121,250 |
Nonconvertible Bonds - continued |
| Principal
Amount | | Value
(Note 1) |
Gaming - continued |
MGM MIRAGE: - continued | | | | |
6.875% 2/6/08 | | $ 2,140,000 | | $ 2,300,500 |
8.5% 9/15/10 | | 4,125,000 | | 4,723,125 |
Mohegan Tribal Gaming Authority: | | | | |
6.375% 7/15/09 | | 7,065,000 | | 7,303,444 |
8% 4/1/12 | | 2,220,000 | | 2,422,575 |
MTR Gaming Group, Inc. 9.75% 4/1/10 | | 3,605,000 | | 3,965,500 |
Park Place Entertainment Corp. 7.875% 3/15/10 | | 4,825,000 | | 5,428,125 |
Scientific Games Corp. 6.25% 12/15/12 (e) | | 3,290,000 | | 3,331,125 |
Seneca Gaming Corp. 7.25% 5/1/12 | | 4,360,000 | | 4,545,300 |
Venetian Casino Resort LLC/Las Vegas Sands, Inc. 11% 6/15/10 | | 3,815,000 | | 4,358,638 |
Virgin River Casino Corp./RBG LLC/B&BB, Inc.: | | | | |
0% 1/15/13 (d)(e) | | 2,100,000 | | 1,312,500 |
9% 1/15/12 (e) | | 1,555,000 | | 1,617,200 |
Wheeling Island Gaming, Inc. 10.125% 12/15/09 | | 6,730,000 | | 7,167,450 |
| | 81,046,332 |
Healthcare - 6.2% |
AmerisourceBergen Corp.: | | | | |
7.25% 11/15/12 | | 6,070,000 | | 6,752,875 |
8.125% 9/1/08 | | 1,735,000 | | 1,930,188 |
CDRV Investors, Inc. 0% 1/1/15 (d)(e) | | 16,110,000 | | 9,947,925 |
Concentra Operating Corp.: | | | | |
9.125% 6/1/12 (e) | | 2,095,000 | | 2,367,350 |
9.5% 8/15/10 | | 2,145,000 | | 2,423,850 |
Elan Finance PLC/Elan Finance Corp. 7.75% 11/15/11 (e) | | 6,320,000 | | 6,762,400 |
Fisher Scientific International, Inc.: | | | | |
6.75% 8/15/14 (e) | | 2,510,000 | | 2,685,700 |
8% 9/1/13 | | 2,870,000 | | 3,257,450 |
8.125% 5/1/12 | | 875,000 | | 975,625 |
Genesis HealthCare Corp. 8% 10/15/13 | | 8,105,000 | | 8,793,925 |
HCA, Inc. 5.5% 12/1/09 | | 5,000,000 | | 5,004,700 |
Mayne Group Ltd. 5.875% 12/1/11 (e) | | 5,000,000 | | 5,087,500 |
Omega Healthcare Investors, Inc.: | | | | |
7% 4/1/14 | | 3,970,000 | | 4,089,100 |
7% 4/1/14 (e) | | 3,260,000 | | 3,357,800 |
PerkinElmer, Inc. 8.875% 1/15/13 | | 7,225,000 | | 8,218,438 |
Psychiatric Solutions, Inc. 10.625% 6/15/13 | | 6,335,000 | | 7,332,763 |
Senior Housing Properties Trust 8.625% 1/15/12 | | 9,170,000 | | 10,476,725 |
Spheris, Inc. 11% 12/15/12 (e) | | 2,710,000 | | 2,770,975 |
Tenet Healthcare Corp.: | | | | |
6.375% 12/1/11 | | 15,925,000 | | 14,651,000 |
|
| Principal
Amount | | Value
(Note 1) |
6.5% 6/1/12 | | $ 1,275,000 | | $ 1,188,938 |
7.375% 2/1/13 | | 4,305,000 | | 4,197,375 |
9.875% 7/1/14 (e) | | 2,040,000 | | 2,218,500 |
| | 114,491,102 |
Homebuilding/Real Estate - 4.1% |
American Real Estate Partners/American Real Estate Finance Corp. 8.125% 6/1/12 | | 13,630,000 | | 14,532,988 |
Beazer Homes USA, Inc.: | | | | |
6.5% 11/15/13 | | 860,000 | | 868,600 |
8.375% 4/15/12 | | 5,975,000 | | 6,572,500 |
D.R. Horton, Inc. 4.875% 1/15/10 | | 1,635,000 | | 1,626,825 |
K. Hovnanian Enterprises, Inc.: | | | | |
6% 1/15/10 (e) | | 1,330,000 | | 1,343,300 |
8.875% 4/1/12 | | 2,210,000 | | 2,431,000 |
KB Home 7.75% 2/1/10 | | 9,585,000 | | 10,303,875 |
Meritage Homes Corp. 7% 5/1/14 | | 3,370,000 | | 3,471,100 |
Standard Pacific Corp.: | | | | |
5.125% 4/1/09 | | 5,680,000 | | 5,594,800 |
6.5% 10/1/08 | | 5,480,000 | | 5,754,000 |
6.875% 5/15/11 | | 2,080,000 | | 2,184,000 |
Technical Olympic USA, Inc.: | | | | |
7.5% 3/15/11 | | 5,110,000 | | 5,110,000 |
9% 7/1/10 | | 1,110,000 | | 1,187,700 |
10.375% 7/1/12 | | 4,125,000 | | 4,620,000 |
WCI Communities, Inc.: | | | | |
7.875% 10/1/13 | | 2,605,000 | | 2,741,763 |
10.625% 2/15/11 | | 2,890,000 | | 3,207,900 |
William Lyon Homes, Inc. 7.5% 2/15/14 | | 4,895,000 | | 4,699,200 |
| | 76,249,551 |
Hotels - 1.1% |
Grupo Posadas SA de CV 8.75% 10/4/11 (e) | | 4,235,000 | | 4,542,038 |
Host Marriott LP 7.125% 11/1/13 | | 8,555,000 | | 9,111,075 |
La Quinta Properties, Inc. 7% 8/15/12 | | 5,950,000 | | 6,336,750 |
| | 19,989,863 |
Insurance - 0.2% |
Crum & Forster Holdings Corp. 10.375% 6/15/13 | | 3,605,000 | | 4,019,575 |
Leisure - 1.5% |
Equinox Holdings Ltd. 9% 12/15/09 | | 1,940,000 | | 2,056,400 |
NCL Corp. Ltd. 10.625% 7/15/14 (e) | | 1,430,000 | | 1,415,700 |
Town Sports International Holdings, Inc. 0% 2/1/14 (d) | | 3,870,000 | | 2,051,100 |
Town Sports International, Inc. 9.625% 4/15/11 | | 6,810,000 | | 7,184,550 |
Nonconvertible Bonds - continued |
| Principal
Amount | | Value
(Note 1) |
Leisure - continued |
Universal City Development Partners Ltd./UCDP Finance, Inc. 11.75% 4/1/10 | | $ 8,900,000 | | $ 10,535,375 |
Universal City Florida Holding Co. I/II 7.2% 5/1/10 (e)(f) | | 3,675,000 | | 3,812,813 |
| | 27,055,938 |
Metals/Mining - 1.9% |
Century Aluminum Co. 7.5% 8/15/14 (e) | | 4,540,000 | | 4,835,100 |
Compass Minerals International, Inc.: | | | | |
0% 12/15/12 (d) | | 5,940,000 | | 5,078,700 |
0% 6/1/13 (d) | | 9,470,000 | | 7,670,700 |
Peabody Energy Corp. 6.875% 3/15/13 | | 5,340,000 | | 5,780,550 |
Ryerson Tull, Inc. 8.25% 12/15/11 (e) | | 3,320,000 | | 3,394,700 |
Vedanta Resources PLC 6.625% 2/22/10 (e) | | 3,535,000 | | 3,543,838 |
Wise Metals Group LLC/Alloys Finance 10.25% 5/15/12 | | 4,815,000 | | 4,815,000 |
| | 35,118,588 |
Paper - 1.6% |
Cellu Tissue Holdings, Inc. 9.75% 3/15/10 | | 3,435,000 | | 3,572,400 |
Georgia-Pacific Corp.: | | | | |
8% 1/15/14 | | 3,675,000 | | 4,180,313 |
8.125% 5/15/11 | | 2,070,000 | | 2,380,500 |
8.875% 2/1/10 | | 485,000 | | 564,419 |
9.375% 2/1/13 | | 2,620,000 | | 3,052,300 |
Norske Skog Canada Ltd.: | | | | |
7.375% 3/1/14 | | 4,150,000 | | 4,326,375 |
8.625% 6/15/11 | | 10,765,000 | | 11,518,550 |
| | 29,594,857 |
Publishing/Printing - 1.2% |
Dex Media West LLC/Dex Media West Finance Co. 5.875% 11/15/11 (e) | | 3,340,000 | | 3,331,650 |
Houghton Mifflin Co. 9.875% 2/1/13 | | 4,065,000 | | 4,441,013 |
The Reader's Digest Association, Inc. 6.5% 3/1/11 | | 12,945,000 | | 13,527,525 |
| | 21,300,188 |
Railroad - 1.6% |
Kansas City Southern Railway Co.: | | | | |
7.5% 6/15/09 | | 13,155,000 | | 13,812,750 |
9.5% 10/1/08 | | 150,000 | | 168,750 |
TFM SA de CV yankee: | | | | |
10.25% 6/15/07 | | 505,000 | | 540,350 |
11.75% 6/15/09 | | 14,915,000 | | 15,138,725 |
| | 29,660,575 |
|
| Principal
Amount | | Value
(Note 1) |
Restaurants - 0.5% |
Friendly Ice Cream Corp. 8.375% 6/15/12 | | $ 4,760,000 | | $ 4,664,800 |
Landry's Seafood Restaurants, Inc. 7.5% 12/15/14 (e) | | 4,850,000 | | 4,831,813 |
| | 9,496,613 |
Services - 0.2% |
Iron Mountain, Inc. 8.625% 4/1/13 | | 3,035,000 | | 3,217,100 |
Shipping - 3.7% |
General Maritime Corp. 10% 3/15/13 | | 6,380,000 | | 7,337,000 |
H-Lines Finance Holding Corp. 0% 4/1/13 (d)(e) | | 2,295,000 | | 1,669,613 |
OMI Corp. 7.625% 12/1/13 | | 9,595,000 | | 10,266,650 |
Overseas Shipholding Group, Inc. 8.25% 3/15/13 | | 1,795,000 | | 1,996,938 |
Ship Finance International Ltd. 8.5% 12/15/13 | | 25,180,000 | | 25,935,379 |
Teekay Shipping Corp. 8.875% 7/15/11 | | 17,723,000 | | 20,558,680 |
| | 67,764,260 |
Steels - 2.0% |
Allegheny Technologies, Inc. 8.375% 12/15/11 | | 5,820,000 | | 6,460,200 |
CSN Islands VII Corp. 10.75% 9/12/08 (e) | | 5,755,000 | | 6,539,119 |
CSN Islands VIII Corp. 9.75% 12/16/13 (e) | | 3,100,000 | | 3,317,000 |
Gerdau AmeriSteel Corp./GUSAP Partners 10.375% 7/15/11 | | 10,130,000 | | 11,902,750 |
Ispat Inland ULC 9.75% 4/1/14 | | 6,622,000 | | 8,178,170 |
| | 36,397,239 |
Super Retail - 1.8% |
Asbury Automotive Group, Inc.: | | | | |
8% 3/15/14 | | 2,910,000 | | 2,880,900 |
9% 6/15/12 | | 9,895,000 | | 10,414,488 |
NBC Acquisition Corp. 0% 3/15/13 (d) | | 1,665,000 | | 1,215,450 |
Nebraska Book Co., Inc. 8.625% 3/15/12 | | 2,530,000 | | 2,580,600 |
Saks, Inc.: | | | | |
8.25% 11/15/08 | | 1,325,000 | | 1,444,250 |
9.875% 10/1/11 | | 7,130,000 | | 8,413,400 |
Sonic Automotive, Inc. 8.625% 8/15/13 | | 5,130,000 | | 5,489,100 |
| | 32,438,188 |
Technology - 5.4% |
Advanced Micro Devices, Inc. 7.75% 11/1/12 (e) | | 6,390,000 | | 6,653,588 |
Celestica, Inc. 7.875% 7/1/11 | | 13,125,000 | | 14,043,750 |
Flextronics International Ltd.: | | | | |
6.25% 11/15/14 (e) | | 11,465,000 | | 11,350,350 |
6.5% 5/15/13 | | 4,970,000 | | 5,069,400 |
Nonconvertible Bonds - continued |
| Principal
Amount | | Value
(Note 1) |
Technology - continued |
Freescale Semiconductor, Inc.: | | | | |
4.82% 7/15/09 (f) | | $ 4,460,000 | | $ 4,660,700 |
6.875% 7/15/11 | | 8,220,000 | | 8,815,950 |
7.125% 7/15/14 | | 1,585,000 | | 1,719,725 |
Lucent Technologies, Inc.: | | | | |
6.45% 3/15/29 | | 5,885,000 | | 5,355,350 |
6.5% 1/15/28 | | 1,600,000 | | 1,440,000 |
MagnaChip Semiconductor SA/MagnaChip Semiconductor Finance Co.: | | | | |
5.78% 12/15/11 (e)(f) | | 1,170,000 | | 1,200,713 |
8% 12/15/14 (e) | | 910,000 | | 948,675 |
Sanmina-SCI Corp. 10.375% 1/15/10 | | 3,265,000 | | 3,738,425 |
Xerox Capital Trust I 8% 2/1/27 | | 5,515,000 | | 5,735,600 |
Xerox Corp.: | | | | |
6.875% 8/15/11 | | 14,110,000 | | 15,027,150 |
7.2% 4/1/16 | | 215,000 | | 230,050 |
7.625% 6/15/13 | | 11,340,000 | | 12,474,000 |
9.75% 1/15/09 | | 1,210,000 | | 1,421,750 |
| | 99,885,176 |
Telecommunications - 9.3% |
Alaska Communications Systems Holdings, Inc. 9.375% 5/15/09 | | 4,935,000 | | 5,083,050 |
Citizens Communications Co. 6.25% 1/15/13 | | 6,580,000 | | 6,645,800 |
Empresa Brasileira de Telecomm SA 11% 12/15/08 | | 5,405,000 | | 6,161,700 |
Intelsat Ltd.: | | | | |
5.25% 11/1/08 | | 2,035,000 | | 1,986,669 |
6.5% 11/1/13 | | 2,475,000 | | 2,239,875 |
7.625% 4/15/12 | | 6,265,000 | | 6,171,025 |
Millicom International Cellular SA 10% 12/1/13 (e) | | 16,275,000 | | 17,007,375 |
New Skies Satellites BV 7.4375% 11/1/11 (e)(f) | | 3,200,000 | | 3,360,000 |
Nextel Communications, Inc.: | | | | |
5.95% 3/15/14 | | 7,470,000 | | 7,806,150 |
6.875% 10/31/13 | | 18,545,000 | | 20,121,325 |
PanAmSat Corp. 9% 8/15/14 (e) | | 12,180,000 | | 13,580,700 |
Qwest Capital Funding, Inc.: | | | | |
7% 8/3/09 | | 4,405,000 | | 4,360,950 |
7.25% 2/15/11 | | 1,685,000 | | 1,617,600 |
Qwest Corp.: | | | | |
7.875% 9/1/11 (e) | | 3,890,000 | | 4,201,200 |
9.125% 3/15/12 (e) | | 16,255,000 | | 18,774,525 |
Qwest Services Corp.: | | | | |
14% 12/15/10 (e)(f) | | 4,345,000 | | 5,214,000 |
14.5% 12/15/14 (e)(f) | | 4,610,000 | | 5,774,025 |
Rogers Communications, Inc.: | | | | |
5.525% 12/15/10 (e)(f) | | 3,140,000 | | 3,289,150 |
7.25% 12/15/12 (e) | | 1,950,000 | | 2,067,000 |
|
| Principal
Amount | | Value
(Note 1) |
8% 12/15/12 (e) | | $ 2,230,000 | | $ 2,352,650 |
9.625% 5/1/11 | | 6,340,000 | | 7,386,100 |
SBA Communications Corp. 8.5% 12/1/12 (e) | | 6,015,000 | | 6,150,338 |
Time Warner Telecom LLC/Time Warner Telecom, Inc. 9.75% 7/15/08 | | 1,645,000 | | 1,645,000 |
Time Warner Telecom, Inc. 10.125% 2/1/11 | | 1,645,000 | | 1,612,100 |
U.S. West Capital Funding, Inc. 6.375% 7/15/08 | | 3,985,000 | | 3,935,188 |
U.S. West Communications: | | | | |
6.875% 9/15/33 | | 3,270,000 | | 3,008,400 |
7.2% 11/10/26 | | 1,905,000 | | 1,819,275 |
7.5% 6/15/23 | | 8,635,000 | | 8,483,888 |
| | 171,855,058 |
Textiles & Apparel - 0.6% |
Levi Strauss & Co.: | | | | |
9.75% 1/15/15 (e) | | 3,340,000 | | 3,298,250 |
12.25% 12/15/12 | | 7,210,000 | | 8,003,100 |
| | 11,301,350 |
TOTAL NONCONVERTIBLE BONDS (Cost $1,589,202,187) | 1,679,459,718 |
Commercial Mortgage Securities - 0.3% |
|
Banc of America Commercial Mortgage, Inc. Series 2003-2: | | | | |
Class BWD, 6.947% 10/11/37 (e) | | 614,920 | | 622,899 |
Class BWE, 7.226% 10/11/37 (e) | | 831,540 | | 841,685 |
Class BWF, 7.55% 10/11/37 (e) | | 734,087 | | 744,541 |
Class BWG, 8.155% 10/11/37 (e) | | 710,012 | | 714,921 |
Class BWH, 9.073% 10/11/37 (e) | | 371,348 | | 380,282 |
Class BWJ, 9.99% 10/11/37 (e) | | 613,922 | | 626,836 |
Class BWK, 10.676% 10/11/37 (e) | | 478,161 | | 491,035 |
Class BWL, 10.1596% 10/11/37 (e) | | 797,600 | | 755,788 |
LB Multi-family Mortgage Trust Series 1991-4 Class A1, 6.9974% 4/25/21 (e)(f) | | 229,583 | | 204,329 |
TOTAL COMMERCIAL MORTGAGE SECURITIES (Cost $5,073,302) | 5,382,316 |
Common Stocks - 0.2% |
| Shares | | |
Chemicals - 0.1% |
HMP Equity Holdings Corp. warrants 5/15/11 (a)(e) | 4,800 | | 2,256,000 |
Common Stocks - continued |
| Shares | | Value (Note 1) |
Homebuilding/Real Estate - 0.0% |
Swerdlow Real Estate Group LLC (a)(g) | 159,600 | | $ 377,326 |
Textiles & Apparel - 0.1% |
Arena Brands Holding Corp. Class B (g) | 48,889 | | 506,001 |
TOTAL COMMON STOCKS (Cost $5,194,504) | 3,139,327 |
Nonconvertible Preferred Stocks - 0.1% |
| | | |
Diversified Financial Services - 0.1% |
Fannie Mae 7.00%
(Cost $1,875,000) | 37,500 | | 2,109,375 |
Floating Rate Loans - 5.7% |
| Principal
Amount | | |
Air Transportation - 0.2% |
American Airlines, Inc. term loan 9.5% 12/17/10 (f) | | $ 2,750,000 | | 2,791,250 |
Cable TV - 0.9% |
Hilton Head Communications LP Tranche B, term loan 6.5% 3/31/08 (f) | | 7,000,000 | | 6,877,500 |
NTL Investment Holdings Ltd. Tranche B, term loan 5.2038% 6/13/12 (f) | | 3,850,000 | | 3,888,500 |
Olympus Cable Holdings LLC Tranche A, term loan 6.5% 6/30/10 (f) | | 5,500,000 | | 5,458,750 |
| | 16,224,750 |
Electric Utilities - 0.8% |
Astoria Energy LLC term loan: | | | | |
7.1882% 4/15/12 (f) | | 5,200,000 | | 5,304,000 |
11.31% 4/15/12 (f) | | 3,340,000 | | 3,423,500 |
Riverside Energy Center LLC: | | | | |
term loan 6.38% 6/24/11 (f) | | 6,415,389 | | 6,511,620 |
Credit-Linked Deposit 6.38% 6/24/11 (f) | | 284,611 | | 288,880 |
| | 15,528,000 |
Energy - 1.3% |
El Paso Corp.: | | | | |
Credit-Linked Deposit 5.15% 11/22/09 (f) | | 5,839,400 | | 5,883,196 |
term loan 5.1875% 11/22/09 (f) | | 6,491,050 | | 6,547,847 |
Headwaters, Inc.: | | | | |
Tranche 2, term loan 9.1133% 9/8/12 (f) | | 3,450,000 | | 3,557,813 |
Tranche B1, term loan 7.5% 4/30/11 (f) | | 5,070,313 | | 5,133,691 |
Magellan Midstream Holdings LP term loan 4.62% 12/10/11 (f) | | 3,550,000 | | 3,594,375 |
| | 24,716,922 |
|
| Principal
Amount | | Value
(Note 1) |
Homebuilding/Real Estate - 1.4% |
General Growth Properties, Inc.: | | | | |
Tranche A, term loan 4.53% 11/12/07 (f) | | $ 5,500,000 | | $ 5,500,000 |
Tranche B, term loan 4.53% 11/12/08 (f) | | 5,500,000 | | 5,513,750 |
LNR Property Corp.: | | | | |
Tranche A, term loan 7.09% 1/31/08 (f) | | 3,650,000 | | 3,650,000 |
Tranche B, term loan: | | | | |
5.59% 1/31/08 (f) | | 7,450,000 | | 7,487,250 |
7.84% 1/31/08 (f) | | 3,700,000 | | 3,700,000 |
| | 25,851,000 |
Hotels - 0.4% |
Wyndham International, Inc. term loan 7.125% 6/30/06 (f) | | 7,927,451 | | 7,947,269 |
Railroad - 0.1% |
Kansas City Southern Railway Co. Tranche B1, term loan 4.0939% 3/30/08 (f) | | 1,150,000 | | 1,167,250 |
Technology - 0.3% |
ON Semiconductor Corp. Tranche G, term loan 5.5625% 12/15/11 (f) | | 5,550,000 | | 5,563,875 |
Telecommunications - 0.3% |
Qwest Corp. Tranche B, term loan 6.95% 6/30/10 (f) | | 4,500,000 | | 4,601,250 |
TOTAL FLOATING RATE LOANS (Cost $101,652,062) | 104,391,566 |
Money Market Funds - 2.2% |
| Shares | | |
Fidelity Cash Central Fund, 2.24% (b)
(Cost $41,514,605) | 41,514,605 | | 41,514,605 |
Cash Equivalents - 0.2% |
| Maturity
Amount | | Value
(Note 1) |
Investments in repurchase agreements (Collateralized by U.S. Treasury Obligations, in a joint trading account at 1.56%, dated 12/31/04 due 1/3/05)
(Cost $3,171,000) | $ 3,171,414 | | $ 3,171,000 |
TOTAL INVESTMENT PORTFOLIO - 99.8% (Cost $1,747,682,660) | | 1,839,167,907 |
NET OTHER ASSETS - 0.2% | | 4,179,826 |
NET ASSETS - 100% | $ 1,843,347,733 |
Legend |
(a) Non-income producing |
(b) Affiliated fund that is available only to investment companies and other accounts managed by Fidelity Investments. The rate quoted is the annualized seven-day yield of the fund at period end. A complete listing of the fund's holdings as of its most recent fiscal year end is available upon request. |
(c) Non-income producing - issuer filed for bankruptcy or is in default of interest payments. |
(d) Debt obligation initially issued in zero coupon form which converts to coupon form at a specified rate and date. The rate shown is the rate at period end. |
(e) Security exempt from registration under Rule 144A of the Securities Act of 1933. These securities may be resold in transactions exempt from registration, normally to qualified institutional buyers. At the period end, the value of these securities amounted to $418,849,132 or 22.7% of net assets. |
(f) The coupon rate shown on floating or adjustable rate securities represents the rate at period end. |
(g) Restricted securities - Investment in securities not registered under the Securities Act of 1933 (excluding 144A issues). At the end of the period, the value of restricted securities (excluding 144A issues) amounted to $883,327 or 0.0% of net assets. |
Additional information on each holding is as follows: |
Security | Acquisition Date | Acquisition Cost |
Arena Brands Holding Corp. Class B | 6/18/97 | $ 1,974,627 |
Swerdlow Real Estate Group LLC | 1/15/99 | $ 7,697,348 |
Other Information |
Distribution of investments by country of issue, as a percentage of total net assets, is as follows: |
United States of America | 82.5% |
Canada | 5.2% |
Marshall Islands | 2.1% |
Bermuda | 1.9% |
United Kingdom | 1.7% |
Luxembourg | 1.6% |
Mexico | 1.1% |
Others (individually less than 1%) | 3.9% |
| 100.0% |
Income Tax Information |
At December 31, 2004, the fund had a capital loss carryforward of approximately $1,144,184,000 of which $283,149,000, $772,554,000 and $88,481,000 will expire on December 31, 2008, 2009 and 2010, respectively. |
The fund will notify shareholders in January 2005 of amounts for use in preparing 2004 income tax returns. |
See accompanying notes which are an integral part of the financial statements.
High Income Portfolio
Fidelity Variable Insurance Products: High Income Portfolio
Financial Statements
Statement of Assets and Liabilities
December 31, 2004 |
| | |
Assets | | |
Investment in securities, at value (including repurchase agreements of $3,171,000) (cost $1,747,682,660) - See accompanying schedule | | $ 1,839,167,907 |
Cash | | 100,076 |
Receivable for investments sold | | 7,236,480 |
Receivable for fund shares sold | | 278,188 |
Interest receivable | | 29,056,825 |
Prepaid expenses | | 6,674 |
Total assets | | 1,875,846,150 |
Liabilities | | |
Payable for investments purchased | $ 29,800,521 | |
Payable for fund shares redeemed | 1,277,993 | |
Accrued management fee | 877,227 | |
Distribution fees payable | 49,768 | |
Other affiliated payables | 162,084 | |
Other payables and accrued expenses | 330,824 | |
Total liabilities | | 32,498,417 |
Net Assets | | $ 1,843,347,733 |
Net Assets consist of: | | |
Paid in capital | | $ 2,757,165,988 |
Undistributed net investment income | | 142,574,339 |
Accumulated undistributed net realized gain (loss) on investments | | (1,147,878,584) |
Net unrealized appreciation (depreciation) on investments and assets and liabilities in foreign currencies | | 91,485,990 |
Net Assets | | $ 1,843,347,733 |
Calculation of Maximum Offering Price | |
Initial Class:
Net Asset Value, offering price and redemption price per share ($1,371,736,328 ÷ 195,883,886 shares) | | $ 7.00 |
Service Class:
Net Asset Value, offering price and redemption price per share ($377,122,057 ÷ 54,083,772 shares) | | $ 6.97 |
Service Class 2:
Net Asset Value, offering price and redemption price per share ($94,246,211 ÷ 13,644,087 shares) | | $ 6.91 |
Initial Class R:
Net Asset Value, offering price and redemption price per share ($ 81,111 ÷ 11,592 shares) | | $ 7.00 |
Service Class R:
Net Asset Value, offering price and redemption price per share ($81,060 ÷ 11,628 shares) | | $ 6.97 |
Service Class 2R:
Net Asset Value, offering price and redemption price per share ($80,966 ÷ 11,719 shares) | | $ 6.91 |
Statement of Operations
Year ended December 31, 2004 |
| | |
Investment Income | | |
Dividends | | $ 731,076 |
Interest | | 146,478,822 |
Total income | | 147,209,898 |
| | |
Expenses | | |
Management fee | $ 10,407,413 | |
Transfer agent fees | 1,229,877 | |
Distribution fees | 542,218 | |
Accounting fees and expenses | 687,297 | |
Non-interested trustees' compensation | 10,249 | |
Custodian fees and expenses | 61,567 | |
Registration fees | 4,070 | |
Audit | 63,597 | |
Legal | 22,574 | |
Interest | 9,548 | |
Miscellaneous | 353,587 | |
Total expenses before reductions | 13,391,997 | |
Expense reductions | (3,973) | 13,388,024 |
Net investment income | | 133,821,874 |
Realized and Unrealized Gain (Loss) Net realized gain (loss) on investment securities | | 76,148,906 |
Change in net unrealized appreciation (depreciation) on: Investment securities | (47,643,714) | |
Assets and liabilities in foreign currencies | 236 | |
Total change in net unrealized appreciation (depreciation) | | (47,643,478) |
Net gain (loss) | | 28,505,428 |
Net increase (decrease) in net assets resulting from operations | | $ 162,327,302 |
See accompanying notes which are an integral part of the financial statements.
Annual Report
Fidelity Variable Insurance Products: High Income Portfolio
Financial Statements - continued
Statement of Changes in Net Assets
| Year ended
December 31,
2004 | Year ended
December 31,
2003 |
Increase (Decrease) in Net Assets | | |
Operations | | |
Net investment income | $ 133,821,874 | $ 147,560,195 |
Net realized gain (loss) | 76,148,906 | 93,505,636 |
Change in net unrealized appreciation (depreciation) | (47,643,478) | 182,813,372 |
Net increase (decrease) in net assets resulting from operations | 162,327,302 | 423,879,203 |
Distributions to shareholders from net investment income | (155,517,698) | (110,937,981) |
Share transactions - net increase (decrease) | (251,486,736) | 336,533,161 |
Total increase (decrease) in net assets | (244,677,132) | 649,474,383 |
| | |
Net Assets | | |
Beginning of period | 2,088,024,865 | 1,438,550,482 |
End of period (including undistributed net investment income of $142,574,339 and undistributed net investment income of $164,989,590, respectively) | $ 1,843,347,733 | $ 2,088,024,865 |
Other Information: | | | | | | |
Share Transactions | Year ended December 31, 2004 |
Shares | Initial Class | Service Class | Service Class 2 | Initial Class R A | Service Class R A | Service Class 2R A |
Sold | 49,439,043 | 27,666,450 | 11,342,466 | 11,592 | 11,628 | 11,719 |
Reinvested | 18,412,464 | 4,720,558 | 928,353 | - | - | - |
Redeemed | (101,334,787) | (38,719,734) | (9,747,785) | - | - | - |
Net increase (decrease) | (33,483,280) | (6,332,726) | 2,523,034 | 11,592 | 11,628 | 11,719 |
| | | | | | |
Dollars Sold | $ 326,369,917 | $ 182,792,007 | $ 74,778,966 | $ 75,000 | $ 75,000 | $ 75,000 |
Reinvested | 119,128,639 | 30,447,599 | 5,941,460 | - | - | - |
Redeemed | (672,513,946) | (255,556,875) | (63,099,503) | - | - | - |
Net increase (decrease) | $ (227,015,390) | $ (42,317,269) | $ 17,620,923 | $ 75,000 | $ 75,000 | $ 75,000 |
| | | | | | |
Share Transactions | Year ended December 31, 2003 |
Shares | Initial Class | Service Class | Service Class 2 | Initial Class R | Service Class R | Service Class 2R |
Sold | 187,111,620 | 59,201,139 | 17,709,351 | $ - | $ - | $ - |
Reinvested | 15,863,052 | 3,574,368 | 424,961 | - | - | - |
Redeemed | (166,651,099) | (46,461,897) | (12,553,214) | - | - | - |
Net increase (decrease) | 36,323,573 | 16,313,610 | 5,581,098 | $ - | $ - | $ - |
| | | | | | |
Dollars Sold | $ 1,162,830,605 | $ 370,826,801 | $ 111,025,684 | $ - | $ - | $ - |
Reinvested | 88,674,463 | 19,909,232 | 2,354,286 | - | - | - |
Redeemed | (1,045,910,689) | (293,649,573) | (79,527,648) | - | - | - |
Net increase (decrease) | $ 205,594,379 | $ 97,086,460 | $ 33,852,322 | $ - | $ - | $ - |
| | | | | | |
Distributions | Year ended December 31, 2004 |
| Initial Class | Service Class | Service Class 2 | Initial Class R A | Service Class R A | Service Class 2R A |
From net investment income | $ 119,128,639 | $ 30,447,599 | $ 5,941,460 | $ - | $ - | $ - |
| | | | | | |
| Year ended December 31, 2003 |
| Initial Class | Service Class | Service Class 2 | Initial Class R | Service Class R | Service Class 2R |
From net investment income | $ 88,674,463 | $ 19,909,232 | $ 2,354,286 | $ - | $ - | $ - |
A For the period April 14, 2004 (commencement of sale of shares) to December 31, 2004.
See accompanying notes which are an integral part of the financial statements.
High Income Portfolio
Financial Highlights - Initial Class
Years ended December 31, | 2004 | 2003 | 2002 | 2001 | 2000 |
Selected Per-Share Data | | | | | |
Net asset value, beginning of period | $ 6.95 | $ 5.93 | $ 6.41 | $ 8.18 | $ 11.32 |
Income from Investment Operations | | | | | |
Net investment income C | .494 | .520 | .496 F | .774 E, F | 1.123 |
Net realized and unrealized gain (loss) | .126 | .980 | (.306) F | (1.544) E, F | (3.513) |
Total from investment operations | .620 | 1.500 | .190 | (.770) | (2.390) |
Distributions from net investment income | (.570) | (.480) | (.670) | (1.000) | (.750) |
Net asset value, end of period | $ 7.00 | $ 6.95 | $ 5.93 | $ 6.41 | $ 8.18 |
Total Return A, B | 9.59% | 27.26% | 3.44% | (11.73)% | (22.54)% |
Ratios to Average Net Assets D | | | | | |
Expenses before expense reductions | .71% | .69% | .70% | .71% | .68% |
Expenses net of voluntary waivers, if any | .71% | .69% | .70% | .71% | .68% |
Expenses net of all reductions | .71% | .69% | .70% | .70% | .68% |
Net investment income | 7.43% | 8.25% | 8.65% F | 11.00% E, F | 11.38% |
Supplemental Data | | | | | |
Net assets, end of period (000 omitted) | $ 1,371,736 | $ 1,593,714 | $ 1,145,562 | $ 1,201,085 | $ 1,467,250 |
Portfolio turnover rate | 128% | 130% | 96% | 138% | 68% |
A Total returns do not reflect charges attributable to your insurance company's separate account. Inclusion of these charges would reduce the total returns shown.
B Total returns would have been lower had certain expenses not been reduced during the periods shown.
C Calculated based on average shares outstanding during the period.
D Expense ratios reflect operating expenses of the class. Expenses before reductions do not reflect amounts reimbursed by the investment adviser or reductions from brokerage service arrangements or other expense offset arrangements and do not represent the amount paid by the class during periods when reimbursements or reductions occur. Expenses net of any voluntary waivers reflect expenses after reimbursement by the investment adviser but prior to reductions from brokerage service arrangements or other expense offset arrangements. Expenses net of all reductions represent the net expenses paid by the class.
E Effective January 1, 2001, the fund adopted the provisions of the AICPA Audit and Accounting Guide for Investment Companies and began amortizing premium and discount on all debt securities. Per-share data and ratios for periods prior to adoption have not been restated to reflect this change.
F As a result of a revision to reflect accretion of market discount using the interest method, certain amounts for the years ended December 31, 2002 and December 31, 2001 have been reclassified from what was previously reported. The impact of this change for the years ended December 31, 2002 and December 31, 2001 was a decrease to net investment income of $.017 and $.075 per share with a corresponding increase to net realized and unrealized gain (loss) per share, respectively. The ratio of net investment income to average net assets decreased from 8.95% and 12.08% to 8.65% and 11.00%, respectively. The reclassification has no impact on the net assets of the fund.
Financial Highlights - Service Class
Years ended December 31, | 2004 | 2003 | 2002 | 2001 | 2000 |
Selected Per-Share Data | | | | | |
Net asset value, beginning of period | $ 6.92 | $ 5.91 | $ 6.38 | $ 8.15 | $ 11.29 |
Income from Investment Operations | | | | | |
Net investment income C | .486 | .513 | .488 F | .758 E, F | 1.102 |
Net realized and unrealized gain (loss) | .124 | .967 | (.288) F | (1.538) E, F | (3.502) |
Total from investment operations | .610 | 1.480 | .200 | (.780) | (2.400) |
Distributions from net investment income | (.560) | (.470) | (.670) | (.990) | (.740) |
Net asset value, end of period | $ 6.97 | $ 6.92 | $ 5.91 | $ 6.38 | $ 8.15 |
Total Return A, B | 9.47% | 26.97% | 3.62% | (11.90)% | (22.68)% |
Ratios to Average Net Assets D | | | | | |
Expenses before expense reductions | .81% | .79% | .80% | .81% | .78% |
Expenses net of voluntary waivers, if any | .81% | .79% | .80% | .81% | .78% |
Expenses net of all reductions | .81% | .79% | .80% | .81% | .78% |
Net investment income | 7.33% | 8.15% | 8.55% F | 10.90% E, F | 11.28% |
Supplemental Data | | | | | |
Net assets, end of period (000 omitted) | $ 377,122 | $ 417,928 | $ 260,489 | $ 234,204 | $ 227,549 |
Portfolio turnover rate | 128% | 130% | 96% | 138% | 68% |
A Total returns do not reflect charges attributable to your insurance company's separate account. Inclusion of these charges would reduce the total returns shown.
B Total returns would have been lower had certain expenses not been reduced during the periods shown.
C Calculated based on average shares outstanding during the period.
D Expense ratios reflect operating expenses of the class. Expenses before reductions do not reflect amounts reimbursed by the investment adviser or reductions from brokerage service arrangements or other expense offset arrangements and do not represent the amount paid by the class during periods when reimbursements or reductions occur. Expenses net of any voluntary waivers reflect expenses after reimbursement by the investment adviser but prior to reductions from brokerage service arrangements or other expense offset arrangements. Expenses net of all reductions represent the net expenses paid by the class.
E Effective January 1, 2001, the fund adopted the provisions of the AICPA Audit and Accounting Guide for Investment Companies and began amortizing premium and discount on all debt securities. Per-share data and ratios for periods prior to adoption have not been restated to reflect this change.
F As a result of a revision to reflect accretion of market discount using the interest method, certain amounts for the years ended December 31, 2002 and December 31, 2001 have been reclassified from what was previously reported. The impact of this change for the years ended December 31, 2002 and December 31, 2001 was a decrease to net investment income of $.017 and $.075 per share with a corresponding increase to net realized and unrealized gain (loss) per share, respectively. The ratio of net investment income to average net assets decreased from 8.85% and 11.97% to 8.55% and 10.90%, respectively. The reclassification has no impact on the net assets of the fund.
See accompanying notes which are an integral part of the financial statements.
Annual Report
Financial Highlights - Service Class 2
Years ended December 31, | 2004 | 2003 | 2002 | 2001 | 2000 F |
Selected Per-Share Data | | | | | |
Net asset value, beginning of period | $ 6.87 | $ 5.87 | $ 6.36 | $ 8.13 | $ 11.14 |
Income from Investment Operations | | | | | |
Net investment income E | .470 | .501 | .472 I | .716 H, I | .936 |
Net realized and unrealized gain (loss) | .130 | .959 | (.292) I | (1.496) H, I | (3.206) |
Total from investment operations | .600 | 1.460 | .180 | (.780) | (2.270) |
Distributions from net investment income | (.560) | (.460) | (.670) | (.990) | (.740) |
Net asset value, end of period | $ 6.91 | $ 6.87 | $ 5.87 | $ 6.36 | $ 8.13 |
Total Return B, C, D | 9.38% | 26.75% | 3.30% | (11.93)% | (21.83)% |
Ratios to Average Net Assets G | | | | | |
Expenses before expense reductions | .97% | .95% | .97% | .98% | 1.01% A |
Expenses net of voluntary waivers, if any | .97% | .95% | .97% | .98% | 1.01% A |
Expenses net of all reductions | .97% | .95% | .97% | .98% | 1.01% A |
Net investment income | 7.17% | 7.99% | 8.38% I | 10.73% H, I | 11.04% A |
Supplemental Data | | | | | |
Net assets, end of period (000 omitted) | $ 94,246 | $ 76,383 | $ 32,499 | $ 16,508 | $ 4,742 |
Portfolio turnover rate | 128% | 130% | 96% | 138% | 68% |
A Annualized
B Total returns for periods of less than one year are not annualized.
C Total returns do not reflect charges attributable to your insurance company's separate account. Inclusion of these charges would reduce the total returns shown.
D Total returns would have been lower had certain expenses not been reduced during the periods shown.
E Calculated based on average shares outstanding during the period.
F For the period January 12, 2000 (commencement of sale of shares) to December 31, 2000.
G Expense ratios reflect operating expenses of the class. Expenses before reductions do not reflect amounts reimbursed by the investment adviser or reductions from brokerage service arrangements or other expense offset arrangements and do not represent the amount paid by the class during periods when reimbursements or reductions occur. Expense ratios before reductions for start-up periods may not be representative of longer-term operating periods. Expenses net of any voluntary waivers reflect expenses after reimbursement by the investment adviser but prior to reductions from brokerage service arrangements or other expense offset arrangements. Expenses net of all reductions represent the net expenses paid by the class.
H Effective January 1, 2001, the fund adopted the provisions of the AICPA Audit and Accounting Guide for Investment Companies and began amortizing premium and discount on all debt securities. Per-share data and ratios for periods prior to adoption have not been restated to reflect this change.
I As a result of a revision to reflect accretion of market discount using the interest method, certain amounts for the years ended December 31, 2002 and December 31, 2001 have been reclassified from what was previously reported. The impact of this change for the years ended December 31, 2002 and December 31, 2001 was a decrease to net investment income of $.017 and $.072 per share with a corresponding increase to net realized and unrealized gain (loss) per share, respectively. The ratio of net investment income to average net assets decreased from 8.68% and 11.81% to 8.38% and 10.73%, respectively. The reclassification has no impact on the net assets of the fund.
Financial Highlights - Initial Class R
Year ended December 31, | 2004 F |
Selected Per-Share Data | |
Net asset value, beginning of period | $ 6.47 |
Income from Investment Operations | |
Net investment income E | .338 |
Net realized and unrealized gain (loss) | .192 |
Total from investment operations | .530 |
Net asset value, end of period | $ 7.00 |
Total Return B, C, D | 8.19% |
Ratios to Average Net Assets G | |
Expenses before expense reductions | .71% A |
Expenses net of voluntary waivers, if any | .71% A |
Expenses net of all reductions | .71% A |
Net investment income | 7.16% A |
Supplemental Data | |
Net assets, end of period (000 omitted) | $ 81 |
Portfolio turnover rate | 128% |
A Annualized
B Total returns for periods of less than one year are not annualized.
C Total returns do not reflect charges attributable to your insurance company's separate account. Inclusion of these charges would reduce the total returns shown.
D Total returns would have been lower had certain expenses not been reduced during the periods shown.
E Calculated based on average shares outstanding during the period.
F For the period April 14, 2004 (commencement of sale of shares) to December 31, 2004.
G Expense ratios reflect operating expenses of the class. Expenses before reductions do not reflect amounts reimbursed by the investment adviser or reductions from brokerage service arrangements or other expense offset arrangements and do not represent the amount paid by the class during periods when reimbursements or reductions occur. Expense ratios before reductions for start-up periods may not be representative of longer-term operating periods. Expenses net of any voluntary waivers reflect expenses after reimbursement by the investment adviser but prior to reductions from brokerage service arrangements or other expense offset arrangements. Expenses net of all reductions represent the net expenses paid by the class.
See accompanying notes which are an integral part of the financial statements.
High Income Portfolio
Financial Highlights - Service Class R
Year ended December 31, | 2004 F |
Selected Per-Share Data | |
Net asset value, beginning of period | $ 6.45 |
Income from Investment Operations | |
Net investment income E | .332 |
Net realized and unrealized gain (loss) | .188 |
Total from investment operations | .520 |
Net asset value, end of period | $ 6.97 |
Total Return B, C, D | 8.06% |
Ratios to Average Net Assets G | |
Expenses before expense reductions | .81% A |
Expenses net of voluntary waivers, if any | .81% A |
Expenses net of all reductions | .81% A |
Net investment income | 7.05% A |
Supplemental Data | |
Net assets, end of period (000 omitted) | $ 81 |
Portfolio turnover rate | 128% |
A Annualized
B Total returns for periods of less than one year are not annualized.
C Total returns do not reflect charges attributable to your insurance company's separate account. Inclusion of these charges would reduce the total returns shown.
D Total returns would have been lower had certain expenses not been reduced during the periods shown.
E Calculated based on average shares outstanding during the period.
F For the period April 14, 2004 (commencement of sale of shares) to December 31, 2004.
G Expense ratios reflect operating expenses of the class. Expenses before reductions do not reflect amounts reimbursed by the investment adviser or reductions from brokerage service arrangements or other expense offset arrangements and do not represent the amount paid by the class during periods when reimbursements or reductions occur. Expense ratios before reductions for start-up periods may not be representative of longer-term operating periods. Expenses net of any voluntary waivers reflect expenses after reimbursement by the investment adviser but prior to reductions from brokerage service arrangements or other expense offset arrangements. Expenses net of all reductions represent the net expenses paid by the class.
Financial Highlights - Service Class 2R
Year ended December 31, | 2004 F |
Selected Per-Share Data | |
Net asset value, beginning of period | $ 6.40 |
Income from Investment Operations | |
Net investment income E | .322 |
Net realized and unrealized gain (loss) | .188 |
Total from investment operations | .510 |
Net asset value, end of period | $ 6.91 |
Total Return B, C, D | 7.97% |
Ratios to Average Net Assets G | |
Expenses before expense reductions | .96% A |
Expenses net of voluntary waivers, if any | .96% A |
Expenses net of all reductions | .96% A |
Net investment income | 6.90% A |
Supplemental Data | |
Net assets, end of period (000 omitted) | $ 81 |
Portfolio turnover rate | 128% |
A Annualized
B Total returns for periods of less than one year are not annualized.
C Total returns do not reflect charges attributable to your insurance company's separate account. Inclusion of these charges would reduce the total returns shown.
D Total returns would have been lower had certain expenses not been reduced during the periods shown.
E Calculated based on average shares outstanding during the period.
F For the period April 14, 2004 (commencement of sale of shares) to December 31, 2004.
G Expense ratios reflect operating expenses of the class. Expenses before reductions do not reflect amounts reimbursed by the investment adviser or reductions from brokerage service arrangements or other expense offset arrangements and do not represent the amount paid by the class during periods when reimbursements or reductions occur. Expense ratios before reductions for start-up periods may not be representative of longer-term operating periods. Expenses net of any voluntary waivers reflect expenses after reimbursement by the investment adviser but prior to reductions from brokerage service arrangements or other expense offset arrangements. Expenses net of all reductions represent the net expenses paid by the class.
See accompanying notes which are an integral part of the financial statements.
Annual Report
Notes to Financial Statements
For the period ended December 31, 2004
1. Significant Accounting Policies.
High Income Portfolio (the fund) is a fund of Variable Insurance Products Fund, (the trust) (referred to in this report as Fidelity Variable Insurance Products: High Income Portfolio) and is authorized to issue an unlimited number of shares. The trust is registered under the Investment Company Act of 1940, as amended (the 1940 Act), as an open-end management investment company organized as a Massachusetts business trust. Shares of the fund may only be purchased by insurance companies for the purpose of funding variable annuity or variable life insurance contracts. The fund offers the following classes of shares: Initial Class shares, Service Class shares, Service Class 2 shares, Initial Class R shares, Service Class R shares and Service Class 2R shares. All classes have equal rights and voting privileges, except for matters affecting a single class. Investment income, realized and unrealized capital gains and losses, the common expenses of the fund, and certain fund-level expense reductions, if any, are allocated on a pro rata basis to each class based on the relative net assets of each class to the total net assets of the fund. Each class differs with respect to distribution and service plan fees incurred. Certain expense reductions also differ by class.
The financial statements have been prepared in conformity with accounting principles generally accepted in the United States of America, which require management to make certain estimates and assumptions at the date of the financial statements. The following summarizes the significant accounting policies of the fund:
Security Valuation. Net asset value per share (NAV calculation) is calculated as of the close of business of the New York Stock Exchange, normally 4:00 p.m. Eastern time. Debt securities, including restricted securities, for which quotations are readily available are valued at their most recent bid prices (sales prices if the principal market is an exchange) in the principal market in which such securities are normally traded, as determined by recognized dealers in such securities, or securities are valued on the basis of information provided by a pricing service. Pricing services use valuation matrices that incorporate both dealer-supplied valuations and valuation models. Equity securities, including restricted securities, for which market quotations are available are valued at the last sale price or official closing price (closing bid price or last evaluated quote if no sale has occurred) on the primary market or exchange on which they trade. If prices are not readily available or do not accurately reflect fair value for a security, or if a security's value has been materially affected by events occurring after the close of the exchange or market on which the security is principally traded, that security may be valued by another method that the Board of Trustees believes accurately reflects fair value. A security's valuation may differ depending on the method used for determining value. Price movements in futures contracts and ADRs, market and trading trends, the bid/ask quotes of brokers and off-exchange institutional trading may be reviewed in the course of making a good faith determination of a security's fair value. Short-term securities with remaining maturities of sixty days or less for which quotations are not readily available are valued on the basis of amortized cost. Investments in open-end investment companies are valued at their net asset value each business day.
Foreign Currency. The fund uses foreign currency contracts to facilitate transactions in foreign-denominated securities. Losses from these transactions may arise from changes in the value of the foreign currency or if the counterparties do not perform under the contracts' terms.
Foreign-denominated assets, including investment securities, and liabilities are translated into U.S. dollars at the exchange rate at period end. Purchases and sales of investment securities, income and dividends received and expenses denominated in foreign currencies are translated into U.S. dollars at the exchange rate in effect on the transaction date.
The effects of exchange rate fluctuations on investments are included with the net realized and unrealized gain (loss) on investment securities. Other foreign currency transactions resulting in realized and unrealized gain (loss) are disclosed separately.
Investment Transactions and Income. Security transactions are accounted for as of trade date. Gains and losses on securities sold are determined on the basis of identified cost and may include proceeds received from litigation. Dividend income is recorded on the ex-dividend date, except for certain dividends from foreign securities where the ex-dividend date may have passed, which are recorded as soon as the fund is informed of the ex-dividend date. Non-cash dividends included in dividend income, if any, are recorded at the fair market value of the securities received. Interest income is accrued as earned. Interest income includes coupon interest and amortization of premium and accretion of discount on debt securities. Investment income is recorded net of foreign taxes withheld where recovery of such taxes is uncertain. Debt obligations may be placed on non-accrual status and related interest income may be reduced by ceasing current accruals and writing off interest receivables when the collection of all or a portion of interest has become doubtful based on consistently applied procedures. A debt obligation is removed from non-accrual status when the issuer resumes interest payments or when collectibility of interest is reasonably assured.
Expenses. Most expenses of the trust can be directly attributed to a fund. Expenses which cannot be directly attributed are apportioned among the funds in the trust.
High Income Portfolio
1. Significant Accounting Policies - continued
Income Tax Information and Distributions to Shareholders. Each year, the fund intends to qualify as a regulated investment company by distributing all of its taxable income and realized gains under Subchapter M of the Internal Revenue Code. As a result, no provision for income taxes is required in the accompanying financial statements. Foreign taxes are provided for based on the fund's understanding of the tax rules and rates that exist in the foreign markets in which it invests.
Distributions are recorded on the ex-dividend date. Income dividends and capital gain distributions are declared separately for each class. Income and capital gain distributions are determined in accordance with income tax regulations, which may differ from generally accepted accounting principles. Capital accounts within the financial statements are adjusted for permanent book-tax differences. These adjustments have no impact on net assets or the results of operations. Temporary book-tax differences will reverse in a subsequent period. Book-tax differences are primarily due to market discount, partnerships, capital loss carryforwards and losses deferred due to wash sales.
The tax-basis components of distributable earnings and the federal tax cost as of period end were as follows:
Unrealized appreciation | $ 106,238,193 | |
Unrealized depreciation | (8,602,341) | |
Net unrealized appreciation (depreciation) | 97,635,852 | |
Undistributed ordinary income | 132,732,705 | |
Capital loss carryforward | (1,144,183,642) | |
| | |
Cost for federal income tax purposes | $ 1,741,532,055 | |
The tax character of distributions paid was as follows:
| December 31, 2004 | December 31, 2003 |
Ordinary Income | $ 155,517,698 | $ 110,937,981 |
Trading (Redemption) Fees. Initial Class R shares, Service Class R shares and Service Class 2R shares held less than 60 days are subject to a redemption fee equal to 1% of the proceeds of the redeemed shares. All redemption fees, including any estimated redemption fees paid by Fidelity Management & Research Company (FMR), are retained by the fund and accounted for as an addition to paid in capital.
2. Operating Policies.
Repurchase Agreements. FMR has received an Exemptive Order from the Securities and Exchange Commission (the SEC) which permits the fund and other affiliated entities of FMR to transfer uninvested cash balances into joint trading accounts. These accounts are then invested in repurchase agreements that are collateralized by U.S. Treasury or Government obligations. The fund may also invest directly with institutions, in repurchase agreements that are collateralized by commercial paper obligations and corporate obligations. Collateral is held in segregated accounts with custodian banks and may be obtained in the event of a default of the counterparty. Collateral is marked-to-market daily and maintained at a value at least equal to the principal amount of the repurchase agreement (including accrued interest).
Restricted Securities. The fund may invest in securities that are subject to legal or contractual restrictions on resale. These securities generally may be resold in transactions exempt from registration or to the public if the securities are registered. Disposal of these securities may involve time-consuming negotiations and expense, and prompt sale at an acceptable price may be difficult. Information regarding restricted securities is included at the end of the fund's Schedule of Investments.
Loans and Other Direct Debt Instruments. The fund may invest in loans and loan participations, trade claims or other receivables. These investments may include standby financing commitments, including revolving credit facilities, that obligate the fund to supply additional cash to the borrower on demand. Loan participations involve a risk of insolvency of the lending bank or other financial intermediary. The fund may be contractually obligated to receive approval from the agent bank and/or borrower prior to the sale of these investments.
3. Purchases and Sales of Investments.
Purchases and sales of securities, other than short-term securities and U.S. government securities, aggregated $2,223,362,294 and $2,482,350,638, respectively.
Annual Report
4. Fees and Other Transactions with Affiliates.
Management Fee. FMR and its affiliates provide the fund with investment management related services for which the fund pays a monthly management fee. The management fee is the sum of an individual fund fee rate that is based on an annual rate of .45% of the fund's average net assets and a group fee rate that averaged .13% during the period. The group fee rate is based upon the average net assets of all the mutual funds advised by FMR. The group fee rate decreases as assets under management increase and increases as assets under management decrease. For the period, the total annual management fee rate was .58% of the fund's average net assets.
Distribution and Service Plan. In accordance with Rule 12b-1 of the 1940 Act, the fund has adopted separate 12b-1 Plans for each Service Class of shares. Each Service Class pays Fidelity Distributors Corporation (FDC), an affiliate of FMR, a service fee. For the period, the service fee is based on an annual rate of .10% of Service Class' and Service Class R's average net assets and .25% of Service Class 2's and Service Class 2R's average net assets.
For the period, each class paid FDC the following amounts, all of which were re-allowed to insurance companies for the distribution of shares and providing shareholder support services:
Service Class | $ 359,321 | |
Service Class 2 | 182,704 | |
Service Class R | 55 | |
Service Class 2R | 138 | |
| $ 542,218 | |
Transfer Agent Fees. Fidelity Investments Institutional Operations Company, Inc. (FIIOC), an affiliate of FMR, is the fund's transfer, dividend disbursing, and shareholder servicing agent. FIIOC receives an asset-based fee with respect to each account. FIIOC pays a portion of the expenses related to the typesetting, printing and mailing of shareholder reports, except proxy statements. Each class pays a transfer agent fee, excluding out of pocket expenses, equal to an annual rate of .07% of their month end net assets. For the period, the total transfer agent fees paid by each class to FIIOC, including out of pocket expenses, were as follows:
Initial Class | $ 933,207 | |
Service Class | 240,550 | |
Service Class 2 | 56,012 | |
Initial Class R | 36 | |
Service Class R | 36 | |
Service Class 2R | 36 | |
| $ 1,229,877 | |
Accounting Fees. Fidelity Service Company, Inc. (FSC), an affiliate of FMR, maintains the fund's accounting records. The fee is based on the level of average net assets for the month.
Central Funds. The fund may invest in affiliated Central Funds managed by Fidelity Investments Money Management, Inc. (FIMM), an affiliate of FMR. The Central Funds are open-end investment companies available only to investment companies and other accounts managed by FMR and its affiliates. The Central Funds seek preservation of capital and current income and do not pay a management fee. Income distributions earned by the fund are recorded as income in the accompanying financial statements and totaled $678,234 for the period.
Brokerage Commissions. The fund placed a portion of its portfolio transactions with brokerage firms which are affiliates of the investment adviser. The commissions paid to these affiliated firms were $1 for the period.
Interfund Lending Program. Pursuant to an Exemptive Order issued by the SEC, the fund, along with other registered investment companies having management contracts with FMR, may participate in an interfund lending program. This program provides an alternative credit facility allowing the funds to borrow from, or lend money to, other participating funds. At period end, there were no interfund loans outstanding. The fund's activity in this program during the period was as follows:
Borrower or Lender | Average Daily Loan Balance | Weighted Average Interest Rate | Interest Earned
(included in
interest income) | Interest
Expense |
Borrower | $ 16,577,688 | 1.18% | - | $ 8,699 |
5. Committed Line of Credit.
The fund participates with other funds managed by FMR in a $4.2 billion credit facility (the "line of credit") to be utilized for temporary or emergency purposes to fund shareholder redemptions or for other short-term liquidity purposes. The fund has agreed to pay commitment fees on its pro rata portion of the line of credit. During the period, there were no borrowings on this line of credit.
High Income Portfolio
6. Bank Borrowings.
The fund is permitted to have bank borrowings for temporary or emergency purposes to fund shareholder redemptions. The fund has established borrowing arrangements with certain banks. The interest rate on the borrowings is the bank's base rate, as revised from time to time. The average daily loan balance during the period amounted to $6,280,667. The weighted average interest rate was 1.62%. At period end, there were no bank borrowings outstanding.
7. Expense Reductions.
Many of the brokers with whom FMR places trades on behalf of the fund provided services to the fund in addition to trade execution. These services included payments of certain expenses on behalf of the fund totaling $3,244 for the period. In addition, through arrangements with the fund's custodian, credits realized as a result of uninvested cash balances were used to reduce the fund's expenses. During the period, these credits reduced the fund's custody expenses by $729.
8. Other Information.
At the end of the period, FMR or its affiliates were the owners of record of 20% of the total outstanding shares of the fund and two otherwise unaffiliated shareholders were the owners of record of 49% of the total outstanding shares of the fund.
Annual Report
Report of Independent Registered Public Accounting Firm
To the Trustees of Variable Insurance Products Fund and the Shareholders of High Income Portfolio:
In our opinion, the accompanying statement of assets and liabilities, including the schedule of investments, and the related statements of operations and of changes in net assets and the financial highlights present fairly, in all material respects, the financial position of High Income Portfolio (a fund of Variable Insurance Products Fund) at December 31, 2004 and the results of its operations, the changes in its net assets and the financial highlights for the periods indicated, in conformity with accounting principles generally accepted in the United States of America. These financial statements and financial highlights (hereafter referred to as "financial statements") are the responsibility of the High Income Portfolio's management; our responsibility is to express an opinion on these financial statements based on our audits. We conducted our audits of these financial statements in accordance with the standards of the Public Company Accounting Oversight Board (United States). Those standards require that we plan and perform the audit to obtain reasonable assurance about whether the financial statements are free of material misstatement. An audit includes examining, on a test basis, evidence supporting the amounts and disclosures in the financial statements, assessing the accounting principles used and significant estimates made by management, and evaluating the overall financial statement presentation. We believe that our audits, which included confirmation of securities at December 31, 2004 by correspondence with the custodian and brokers, provide a reasonable basis for our opinion.
/s/PricewaterhouseCoopers LLP
PricewaterhouseCoopers LLP
Boston, Massachusetts
February 18, 2005
High Income Portfolio
Trustees and Officers
The Trustees, Members of the Advisory Board, and executive officers of the trust and fund, as applicable, are listed below. The Board of Trustees governs the fund and is responsible for protecting the interests of shareholders. The Trustees are experienced executives who meet periodically throughout the year to oversee the fund's activities, review contractual arrangements with companies that provide services to the fund, and review the fund's performance. Except for William O. McCoy, Dennis J. Dirks, and Kenneth L. Wolfe, each of the Trustees oversees 301 funds advised by FMR or an affiliate. Mr. McCoy oversees 303 funds advised by FMR or an affiliate. Mr. Dirks and Mr. Wolfe oversee 233 funds advised by FMR or an affiliate.
The Trustees hold office without limit in time except that (a) any Trustee may resign; (b) any Trustee may be removed by written instrument, signed by at least two-thirds of the number of Trustees prior to such removal; (c) any Trustee who requests to be retired or who has become incapacitated by illness or injury may be retired by written instrument signed by a majority of the other Trustees; and (d) any Trustee may be removed at any special meeting of shareholders by a two-thirds vote of the outstanding voting securities of the trust. In any event, each non-interested Trustee shall retire not later than the last day of the calendar year in which his or her 72nd birthday occurs. The executive officers and Advisory Board Members hold office without limit in time, except that any officer and Advisory Board Member may resign or may be removed by a vote of a majority of the Trustees at any regular meeting or any special meeting of the Trustees. Except as indicated, each individual has held the office shown or other offices in the same company for the past five years.
The fund's Statement of Additional Information (SAI) includes more information about the Trustees. To request a free copy, call Fidelity at 1-800-544-5429.
Interested Trustees*:
Correspondence intended for each Trustee who is an "interested person" (as defined in the 1940 Act) may be sent to Fidelity Investments, 82 Devonshire Street, Boston, Massachusetts 02109.
Name, Age; Principal Occupation |
Edward C. Johnson 3d (74)** |
| Year of Election or Appointment: 1981 Mr. Johnson is Chairman of the Board of Trustees. Mr. Johnson serves as Chief Executive Officer, Chairman, and a Director of FMR Corp.; a Director and Chairman of the Board and of the Executive Committee of FMR; Chairman and a Director of Fidelity Management & Research (Far East) Inc.; Chairman (1998) and a Director of Fidelity Investments Money Management, Inc.; and Chairman (2001) and a Director (2000) of FMR Co., Inc. |
Abigail P. Johnson (43)** |
| Year of Election or Appointment: 2001 Senior Vice President of VIP High Income (2001). Ms. Johnson also serves as Senior Vice President of other Fidelity funds (2001). She is President and a Director of FMR (2001), Fidelity Investments Money Management, Inc. (2001), FMR Co., Inc. (2001), and a Director of FMR Corp. Previously, Ms. Johnson managed a number of Fidelity funds. |
Laura B. Cronin (50) |
| Year of Election or Appointment: 2003 Ms. Cronin is an Executive Vice President (2002) and Chief Financial Officer (2002) of FMR Corp. and is a member of the Fidelity Management Committee (2003). Previously, Ms. Cronin served as Vice President of Finance of FMR (1997-1999), and Chief Financial Officer of FMR (1999-2001), Fidelity Personal Investments (2001), and Fidelity Brokerage Company (2001-2002). |
Robert L. Reynolds (52) |
| Year of Election or Appointment: 2003 Mr. Reynolds is a Director (2003) and Chief Operating Officer (2002) of FMR Corp. and is the head of the Fidelity Management Committee (2003). He also serves on the Board at Fidelity Investments Canada, Ltd. (2000). Previously, Mr. Reynolds served as President of Fidelity Investments Institutional Retirement Group (1996-2000). |
* Trustees have been determined to be "Interested Trustees" by virtue of, among other things, their affiliation with the trust or various entities under common control with FMR.
** Edward C. Johnson 3d, Trustee, is Abigail P. Johnson's father.
Annual Report
Non-Interested Trustees:
Correspondence intended for each non-interested Trustee (that is, the Trustees other than the Interested Trustees) may be sent to Fidelity Investments, P.O. Box 55235, Boston, Massachusetts 02205-5235.
Name, Age; Principal Occupation |
Dennis J. Dirks (56) |
| Year of Election or Appointment: 2005 Trustee of Variable Insurance Products Fund. Mr. Dirks also serves as a Trustee (2005) or Member of the Advisory Board (2004) of other investment companies advised by FMR. Prior to his retirement in May 2003, Mr. Dirks was Chief Operating Officer and a member of the Board of The Depository Trust & Clearing Corporation (DTCC) (1999-2003). He also served as President, Chief Operating Officer, and Board member of The Depository Trust Company (DTC) (1999-2003) and President and Board member of the National Securities Clearing Corporation (NSCC) (1999-2003). In addition, Mr. Dirks served as Chief Executive Officer and Board member of the Government Securities Clearing Corporation (2001-2003) and Chief Executive Officer and Board member of the Mortgage-Backed Securities Clearing Corporation (2001-2003). |
Robert M. Gates (61) |
| Year of Election or Appointment: 1997 Dr. Gates is Vice Chairman of the non-interested Trustees (2005). Dr. Gates is President of Texas A&M University (2002). He was Director of the Central Intelligence Agency (CIA) from 1991 to 1993. From 1989 to 1991, Dr. Gates served as Assistant to the President of the United States and Deputy National Security Advisor. Dr. Gates is a Director of NACCO Industries, Inc. (mining and manufacturing), Parker Drilling Co., Inc. (drilling and rental tools for the energy industry, 2001), and Brinker International (restaurant management, 2003). He also serves as a member of the Advisory Board of VoteHere.net (secure Internet voting, 2001). Previously, Dr. Gates served as a Director of LucasVarity PLC (automotive components and diesel engines), a Director of TRW Inc. (automotive, space, defense, and information technology), and Dean of the George Bush School of Government and Public Service at Texas A&M University (1999-2001). Dr. Gates also is a Trustee of the Forum for International Policy. |
George H. Heilmeier (68) |
| Year of Election or Appointment: 2004 Dr. Heilmeier is Chairman Emeritus of Telcordia Technologies (communication software and systems), where prior to his retirement, he served as company Chairman and Chief Executive Officer. He currently serves on the Boards of Directors of The Mitre Corporation (systems engineering and information technology support for the government), INET Technologies Inc. (telecommunications network surveillance, 2001) and Teletech Holdings (customer management services, 1998). He is Chairman of the General Motors Technology Advisory Committee and a Life Fellow of the IEEE (2000). Dr. Heilmeier is a member of the Defense Science Board and the National Security Agency Advisory Board. He is also a member of the National Academy of Engineering, the American Academy of Arts and Sciences and The Board of Overseers of the School of Engineering and Applied Science of the University of Pennsylvania. Previously, Dr. Heilmeier served as a Director of TRW Inc. (automotive, space, defense, and information technology, 1992-2002) and Compaq (1994-2002). |
Marie L. Knowles (58) |
| Year of Election or Appointment: 2001 Prior to Ms. Knowles' retirement in June 2000, she served as Executive Vice President and Chief Financial Officer of Atlantic Richfield Company (ARCO) (diversified energy, 1996-2000). From 1993 to 1996, she was a Senior Vice President of ARCO and President of ARCO Transportation Company. She served as a Director of ARCO from 1996 to 1998. She currently serves as a Director of Phelps Dodge Corporation (copper mining and manufacturing), URS Corporation (multidisciplinary engineering, 1999), and McKesson Corporation (healthcare service, 2002). Ms. Knowles is a Trustee of the Brookings Institution and the Catalina Island Conservancy and also serves as a member of the Advisory Board for the School of Engineering of the University of Southern California. |
Ned C. Lautenbach (60) |
| Year of Election or Appointment: 2000 Mr. Lautenbach has been a partner of Clayton, Dubilier & Rice, Inc. (private equity investment firm) since September 1998. Previously, Mr. Lautenbach was with the International Business Machines Corporation (IBM) from 1968 until his retirement in 1998. He was most recently Senior Vice President and Group Executive of Worldwide Sales and Services. From 1993 to 1995, he was Chairman of IBM World Trade Corporation, and from 1994 to 1998 was a member of IBM's Corporate Executive Committee. Mr. Lautenbach serves as Co-Chairman and a Director of Covansys, Inc. (global provider of business and technology solutions, 2000). In addition, he is a Director of Eaton Corporation (diversified industrial) and the Philharmonic Center for the Arts in Naples, Florida (1999). He also is a member of the Council on Foreign Relations. |
Marvin L. Mann (71)* |
| Year of Election or Appointment: 1993 Mr. Mann is Chairman of the non-interested Trustees (2001). He is Chairman Emeritus of Lexmark International, Inc. (computer peripherals) where he served as CEO until April 1998 and retired as Chairman May 1999, and remains a member of the Board. Prior to 1991, he held the positions of Vice President of International Business Machines Corporation (IBM) and President and General Manager of various IBM divisions and subsidiaries. Mr. Mann is a Board member of Imation Corp. (imaging and information storage). He is also a member of the Director Services Committee of the Investment Company Institute. In addition, Mr. Mann is a member of the President's Cabinet at the University of Alabama and the Board of Visitors of the Culverhouse College of Commerce and Business Administration at the University of Alabama. |
William O. McCoy (71) |
| Year of Election or Appointment: 1997 Prior to his retirement in December 1994, Mr. McCoy was Vice Chairman of the Board of BellSouth Corporation (telecommunications) and President of BellSouth Enterprises. He is currently a Director of Liberty Corporation (holding company), Duke Realty Corporation (real estate), and Progress Energy, Inc. (electric utility). He is also a partner of Franklin Street Partners (private investment management firm) and a member of the Research Triangle Foundation Board. In addition, Mr. McCoy served as the Interim Chancellor (1999-2000) and a member of the Board of Visitors (1994-1998) for the University of North Carolina at Chapel Hill and currently serves on the Board of Directors of the University of North Carolina Health Care System and the Board of Visitors of the Kenan-Flagler Business School (University of North Carolina at Chapel Hill). He also served as Vice President of Finance for the University of North Carolina (16-school system, 1995-1998). |
Cornelia M. Small (60) |
| Year of Election or Appointment: 2005 Trustee of Variable Insurance Products Fund. Ms. Small is a member (2000) and Chairperson (2002) of the Investment Committee, and a member (2002) of the Board of Trustees of Smith College. Previously, she served as Chief Investment Officer (1999-2000), Director of Global Equity Investments (1996-1999), and a member of the Board of Directors of Scudder, Stevens, & Clark (1990-1997) and Scudder Kemper Investments (1997-1998). In addition, Ms. Small served as Co-Chair (2000-2003) of the Annual Fund for the Fletcher School of Law and Diplomacy. |
William S. Stavropoulos (65) |
| Year of Election or Appointment: 2001 Mr. Stavropoulos is Chairman of the Board (2000), CEO (2002), a position he previously held from 1995-2000, Chairman of the Executive Committee (2000), and a Member of the Board of Directors of The Dow Chemical Company. Since joining The Dow Chemical Company in 1967, Mr. Stavropoulos served in numerous senior management positions, including President (1993-2000; 2002-2003). Currently, he is a Director of NCR Corporation (data warehousing and technology solutions), BellSouth Corporation (telecommunications), Chemical Financial Corporation, and Maersk Inc. (industrial conglomerate, 2002). He also serves as a member of the Board of Trustees of the American Enterprise Institute for Public Policy Research. In addition, Mr. Stavropoulos is a member of The Business Council, J.P. Morgan International Council and the University of Notre Dame Advisory Council for the College of Science. |
Kenneth L. Wolfe (65) |
| Year of Election or Appointment: 2005 Trustee of Variable Insurance Products Fund. Mr. Wolfe also serves as a Trustee (2005) or Member of the Advisory Board (2004) of other investment companies advised by FMR. Prior to his retirement in 2001, Mr. Wolfe was Chairman and Chief Executive Officer of Hershey Foods Corporation (1993-2001). He currently serves as a member of the boards of Adelphia Communications Corporation (2003), Bausch & Lomb, Inc., and Revlon Inc. (2004). |
Advisory Board Members and Executive Officers:
Correspondence intended for each executive officer and Mr. Lynch may be sent to Fidelity Investments, 82 Devonshire Street, Boston, Massachusetts 02109.
Name, Age; Principal Occupation |
Peter S. Lynch (61) |
| Year of Election or Appointment: 2003 Member of the Advisory Board of Variable Insurance Products Fund. Vice Chairman and a Director of FMR, and Vice Chairman (2001) and a Director (2000) of FMR Co., Inc. Previously, Mr. Lynch served as a Trustee of the Fidelity funds (1990-2003). Prior to May 31, 1990, he was a Director of FMR and Executive Vice President of FMR (a position he held until March 31, 1991), Vice President of Fidelity® Magellan® Fund and FMR Growth Group Leader, and Managing Director of FMR Corp. Mr. Lynch was also Vice President of Fidelity Investments Corporate Services. In addition, he serves as a Trustee of Boston College, Massachusetts Eye & Ear Infirmary, Historic Deerfield, John F. Kennedy Library, and the Museum of Fine Arts of Boston. |
Bart A. Grenier (45) |
| Year of Election or Appointment: 2002 Vice President of VIP High Income. Mr. Grenier also serves as Vice President of certain Equity Funds (2001), a position he previously held from 1999 to 2000, and Vice President of certain High Income Funds (2002). He is Senior Vice President of FMR (1999) and FMR Co., Inc. (2001), and President and Director of Strategic Advisers, Inc. (2002). He also heads Fidelity's Asset Allocation Group (2000), Fidelity's Growth and Income Group (2001), Fidelity's Value Group (2001), and Fidelity's High Income Division (2001). Previously, Mr. Grenier served as President of Fidelity Ventures (2000), Vice President of certain High Income Funds (1997-2000), High Income Division Head (1997-2000), Group Leader of the Income-Growth and Asset Allocation-Income Groups (1996-2000), and Assistant Equity Division Head (1997-2000). |
Matthew Conti (38) |
| Year of Election or Appointment: 2003 Vice President of VIP High Income. Mr. Conti also serves as Vice President of other funds advised by FMR. Prior to assuming his current responsibilities, Mr. Conti worked as an analyst and manager. |
Eric D. Roiter (56) |
| Year of Election or Appointment: 1998 Secretary of VIP High Income. He also serves as Secretary of other Fidelity funds; Vice President, General Counsel, and Secretary of FMR Co., Inc. (2001-present) and FMR; Vice President and Secretary of FDC; Assistant Secretary of Fidelity Management & Research (U.K.) Inc. (2001-present), Fidelity Management & Research (Far East) Inc. (2001-present), of and Fidelity Investments Money Management, Inc. (2001-present). Mr. Roiter is an Adjunct Member, Faculty of Law, at Boston College Law School (2003-present). |
Stuart Fross (45) |
| Year of Election or Appointment: 2003 Assistant Secretary of VIP High Income. Mr. Fross also serves as Assistant Secretary of other Fidelity funds (2003) and is an employee of FMR. |
Christine Reynolds (46) |
| Year of Election or Appointment: 2004 President, Treasurer, and Anti-Money Laundering (AML) officer of VIP High Income. Ms. Reynolds also serves as President, Treasurer, and AML officer of other Fidelity funds (2004) and is a Vice President (2003) and an employee (2002) of FMR. Before joining Fidelity Investments, Ms. Reynolds worked at PricewaterhouseCoopers LLP (PwC) (1980-2002), where she was most recently an audit partner with PwC's investment management practice. |
Timothy F. Hayes (54) |
| Year of Election or Appointment: 2002 Chief Financial Officer of VIP High Income. Mr. Hayes also serves as Chief Financial Officer of other Fidelity funds (2002). Recently he was appointed President of Fidelity Service Company (2003) where he also serves as a Director. Mr. Hayes also serves as President of Fidelity Investments Operations Group (FIOG, 2002), which includes Fidelity Pricing and Cash Management Services Group (FPCMS), where he was appointed President in 1998. Previously, Mr. Hayes served as Chief Financial Officer of Fidelity Investments Corporate Systems and Service Group (1998) and Fidelity Systems Company (1997-1998). |
Kenneth A. Rathgeber (57) |
| Year of Election or Appointment: 2004 Chief Compliance Officer of VIP High Income. Mr. Rathgeber also serves as Chief Compliance Officer of other Fidelity funds (2004) and Executive Vice President of Risk Oversight for Fidelity Investments (2002). Previously, he served as Executive Vice President and Chief Operating Officer for Fidelity Investments Institutional Services Company, Inc. (1998-2002). |
John R. Hebble (46) |
| Year of Election or Appointment: 2003 Deputy Treasurer of VIP High Income. Mr. Hebble also serves as Deputy Treasurer of other Fidelity funds (2003), and is an employee of FMR. Before joining Fidelity Investments, Mr. Hebble worked at Deutsche Asset Management where he served as Director of Fund Accounting (2002-2003) and Assistant Treasurer of the Scudder Funds (1998-2003). |
Kimberley H. Monasterio (41) |
| Year of Election or Appointment: 2004 Deputy Treasurer of VIP High Income. Ms. Monasterio also serves as Deputy Treasurer of other Fidelity funds (2004) and is an employee of FMR (2004). Before joining Fidelity Investments, Ms. Monasterio served as Treasurer (2000-2004) and Chief Financial Officer (2002-2004) of the Franklin Templeton Funds and Senior Vice President of Franklin Templeton Services, LLC (2000-2004). |
John H. Costello (58) |
| Year of Election or Appointment: 1986 Assistant Treasurer of VIP High Income. Mr. Costello also serves as Assistant Treasurer of other Fidelity funds and is an employee of FMR. |
Peter L. Lydecker (50) |
| Year of Election or Appointment: 2004 Assistant Treasurer of VIP High Income. Mr. Lydecker also serves as Assistant Treasurer of other Fidelity funds (2004) and is an employee of FMR. |
Mark Osterheld (49) |
| Year of Election or Appointment: 2002 Assistant Treasurer of VIP High Income. Mr. Osterheld also serves as Assistant Treasurer of other Fidelity funds (2002) and is an employee of FMR. |
Kenneth B. Robins (35) |
| Year of Election or Appointment:2004 Assistant Treasurer of VIP High Income. Mr. Robins also serves as Assistant Treasurer of other Fidelity funds (2004) and is an employee of FMR (2004). Before joining Fidelity Investments, Mr. Robins worked at KPMG LLP, where he was a partner in KPMG's department of professional practice (2002-2004) and a Senior Manager (1999-2000). In addition, Mr. Robins served as Assistant Chief Accountant, United States Securities and Exchange Commission (2000-2002). |
Annual Report
Proxy Voting Results
A special meeting of the fund's shareholders was held on December 14, 2004. The results of votes taken among shareholders on proposals before them are reported below. Each vote reported represents one dollar of net asset value held on the record date for the meeting.
PROPOSAL 1 |
To amend the Declaration of Trust to allow the Board of Trustees, if permitted by applicable law, to authorize fund mergers without shareholder approval. A |
| # of
Votes | % of
Votes |
Affirmative | 15,331,508,529.96 | 81.853 |
Against | 2,429,553,894.02 | 12.972 |
Abstain | 969,378,618.94 | 5.175 |
TOTAL | 18,730,441,042.92 | 100.000 |
PROPOSAL 2 |
To elect a Board of Trustees. A |
| # of
Votes | % of
Votes |
J. Michael Cook |
Affirmative | 17,770,642,454.98 | 94.876 |
Withheld | 959,798,587.94 | 5.124 |
TOTAL | 18,730,441,042.92 | 100.000 |
Ralph F. Cox |
Affirmative | 17,759,356,374.26 | 94.815 |
Withheld | 971,084,668.66 | 5.185 |
TOTAL | 18,730,441,042.92 | 100.000 |
Laura B. Cronin |
Affirmative | 17,797,888,742.24 | 95.021 |
Withheld | 932,552,300.68 | 4.979 |
TOTAL | 18,730,441,042.92 | 100.000 |
Dennis J. DirksB |
Affirmative | 17,802,602,074.45 | 95.046 |
Withheld | 927,838,968.47 | 4.954 |
TOTAL | 18,730,441,042.92 | 100.000 |
Robert M. Gates |
Affirmative | 17,784,855,823.58 | 94.952 |
Withheld | 945,585,219.34 | 5.048 |
TOTAL | 18,730,441,042.92 | 100.000 |
George H. Heilmeier |
Affirmative | 17,768,875,556.56 | 94.866 |
Withheld | 961,565,486.36 | 5.134 |
TOTAL | 18,730,441,042.92 | 100.000 |
Abigail P. Johnson |
Affirmative | 17,781,929,073.06 | 94.936 |
Withheld | 948,511,969.86 | 5.064 |
TOTAL | 18,730,441,042.92 | 100.000 |
Edward C. Johnson 3d |
Affirmative | 17,752,140,336.45 | 94.777 |
Withheld | 978,300,706.47 | 5.223 |
TOTAL | 18,730,441,042.92 | 100.000 |
Donald J. Kirk |
Affirmative | 17,772,467,361.45 | 94.885 |
Withheld | 957,973,681.47 | 5.115 |
TOTAL | 18,730,441,042.92 | 100.000 |
| # of
Votes | % of
Votes |
Marie L. Knowles |
Affirmative | 17,776,922,254.30 | 94.909 |
Withheld | 953,518,788.62 | 5.091 |
TOTAL | 18,730,441,042.92 | 100.000 |
Ned C. Lautenbach |
Affirmative | 17,804,221,564.95 | 95.055 |
Withheld | 926,219,477.97 | 4.945 |
TOTAL | 18,730,441,042.92 | 100.000 |
Marvin L. Mann |
Affirmative | 17,763,277,607.06 | 94.836 |
Withheld | 967,163,435.86 | 5.164 |
TOTAL | 18,730,441,042.92 | 100.000 |
William O. McCoy |
Affirmative | 17,758,560,162.11 | 94.811 |
Withheld | 971,880,880.81 | 5.189 |
TOTAL | 18,730,441,042.92 | 100.000 |
Robert L. Reynolds |
Affirmative | 17,806,026,904.06 | 95.065 |
Withheld | 924,414,138.86 | 4.935 |
TOTAL | 18,730,441,042.92 | 100.000 |
Cornelia M. SmallB |
Affirmative | 17,798,878,892.31 | 95.026 |
Withheld | 931,562,150.61 | 4.974 |
TOTAL | 18,730,441,042.92 | 100.000 |
William S. Stavropoulos |
Affirmative | 17,786,496,107.78 | 94.960 |
Withheld | 943,944,935.14 | 5.040 |
TOTAL | 18,730,441,042.92 | 100.000 |
PROPOSAL 9 |
To amend the fund's fundamental investment limitation concerning borrowing. |
| # of
Votes | % of
Votes |
Affirmative | 1,451,356,817.10 | 90.478 |
Against | 59,751,642.97 | 3.725 |
Abstain | 92,989,319.11 | 5.797 |
TOTAL | 1,604,097,779.18 | 100.000 |
PROPOSAL 10 |
To amend the fund's fundamental investment limitation concerning lending. |
| # of
Votes | % of
Votes |
Affirmative | 1,453,764,730.70 | 90.628 |
Against | 57,576,166.97 | 3.590 |
Abstain | 92,756,881.51 | 5.782 |
TOTAL | 1,604,097,779.18 | 100.000 |
A Denotes trust-wide proposals and voting results. B Effective January 1, 2005. |
Annual Report
Annual Report
Investment Adviser
Fidelity Management & Research Company
Boston, MA
Investment Sub-Advisers
FMR Co., Inc.
Fidelity Management & Research (U.K.) Inc.
Fidelity Management & Research (Far East) Inc.
Fidelity Investments Japan Limited
Fidelity International Investment Advisors
Fidelity International Investment Advisors (U.K.) Limited
General Distributor
Fidelity Distributors Corporation
Boston, MA
Transfer and Shareholder Servicing Agent
Fidelity Investments Institutional Operations Company, Inc.
Boston, MA
Custodian
The Bank of New York
New York, NY
VIPHI-ANN-0205
1.540029.107
Fidelity® Variable Insurance Products:
Money Market Portfolio
Annual Report
December 31, 2004
(2_fidelity_logos) (Registered_Trademark)
Contents
Performance | 3 | How the fund has done over time. |
Shareholder Expense Example | 4 | An example of shareholder expenses. |
Investment Summary | 5 | A summary of the fund's investments at period end. |
Investments | 6 | A complete list of the fund's investments. |
Financial Statements | 10 | Statements of assets and liabilities, operations, and
changes in net assets, as well as financial highlights. |
Notes | 14 | Notes to the financial statements. |
Report of Independent Registered Public Accounting Firm | 16 | |
Trustees and Officers | 17 | |
Proxy Voting Results | 22 | |
| | |
To view a fund's proxy voting guidelines and proxy voting record for the 12-month period ended June 30, visit www.fidelity.com/proxyvotingresults or visit the Securities and Exchange Commission's (SEC) web site at www.sec.gov. You may also call 1-800-544-5429 to request a free copy of the proxy voting guidelines.
Fidelity Variable Insurance Products are separate account options which are purchased through a variable insurance contract.
Standard & Poor's, S&P and S&P 500 are registered service marks of The McGraw-Hill Companies, Inc. and have been licensed for use by Fidelity Distributors Corporation.
Other third party marks appearing herein are the property of their respective owners.
All marks appearing herein are registered or unregistered trademarks or service marks of FMR Corp. or an affiliated company.
(Recycle graphic) This report is printed on recycled paper using soy-based inks.
This report and the financial statements contained herein are submitted for the general information of the shareholders of the fund. This report is not authorized for distribution to prospective investors in the fund unless preceded or accompanied by an effective prospectus.
A fund files its complete schedule of portfolio holdings with the SEC for the first and third quarters of each fiscal year on Form N-Q. Forms N-Q are available on the SEC's web site at http://www.sec.gov. A fund's Forms N-Q may be reviewed and copied at the SEC's Public Reference Room in Washington, DC. Information regarding the operation of the SEC's Public Reference Room may be obtained by calling 1-800-SEC-0330. For a complete list of a fund's portfolio holdings, view the most recent quarterly holdings report, semiannual report, or annual report on Fidelity's web site at http://www.advisor.fidelity.com.
NOT FDIC INSURED · MAY LOSE VALUE · NO BANK GUARANTEE
Neither the fund nor Fidelity Distributors Corporation is a bank.
Money Market Portfolio
Fidelity Variable Insurance Products: Money Market Portfolio
Performance: The Bottom Line
Average annual total return reflects the change in the value of an investment, assuming reinvestment of the class' dividend income and capital gains (the profits earned upon the sale of securities that have grown in value) and assuming a constant rate of performance each year. Performance numbers are net of all underlying fund operating expenses, but do not include any insurance charges imposed by your insurance company's separate account. If performance information included the effect of these additional charges, the total returns would be lower. How a fund did yesterday is no guarantee of how it will do tomorrow.
Average Annual Total Returns
Periods ended December 31, 2004 | Past 1
year | Past 5
years | Past 10
years |
Fidelity VIP: Money Market - Initial Class | 1.21% | 2.86% | 4.16% |
Fidelity VIP: Money Market - Service Class A | 1.10% | 2.77% | 4.12% |
Fidelity VIP: Money Market - Service Class 2 B | 0.95% | 2.62% | 4.04% |
A The initial offering of Service Class shares took place on July 7, 2000. Performance for Service Class shares reflects an asset-based service fee (12b-1 fee), and returns prior to July 7, 2000 are those of Initial Class and do not include the effects of a 12b-1 fee. Had Service Class' 12b-1 fee been reflected, returns prior to July 7, 2000 would have been lower.
B The initial offering of Service Class 2 shares took place on January 12, 2000. Performance for Service Class 2 shares reflects an asset-based service fee (12b-1 fee), and returns prior to January 12, 2000 are those of Initial Class and do not include the effects of a 12b-1 fee. Had Service Class 2's 12b-1 fee been reflected, returns prior to January 12, 2000 would have been lower.
Yield
| 12/28/04 | 9/28/04 | 6/29/04 | 3/30/04 | 12/30/03 |
Fidelity VIP Money Market - Initial Class | 1.91% | 1.47% | 1.03% | 0.92% | 0.99% |

Yield refers to the income paid by the fund over a given period. Yields for money market funds are usually for seven-day periods, expressed as annual percentage rates. A yield that assumes income earned is reinvested or compounded is called an effective yield. The chart above shows the fund's current seven-day yield at quarterly intervals over the past year.
Annual Report
Fidelity Variable Insurance Products: Money Market Portfolio
Shareholder Expense Example
As a shareholder of the Fund, you incur two types of costs: (1) transaction costs, and (2) ongoing costs, including management fees, distribution and/or service (12b-1) fees and other Fund expenses. This Example is intended to help you understand your ongoing costs (in dollars) of investing in the Fund and to compare these costs with the ongoing costs of investing in other mutual funds.
The Example is based on an investment of $1,000 invested at the beginning of the period and held for the entire period (July 1, 2004 to December 31, 2004).
Actual Expenses
The first line of the table below for each class of the Fund provides information about actual account values and actual expenses. You may use the information in this line, together with the amount you invested, to estimate the expenses that you paid over the period. Simply divide your account value by $1,000.00 (for example, an $8,600 account value divided by $1,000.00 = 8.6), then multiply the result by the number in the first line for a class of the Fund under the heading entitled "Expenses Paid During Period" to estimate the expenses you paid on your account during this period. The estimate of expenses does not include any fees or other expenses of any variable annuity or variable life insurance product. If they were, the estimate of expenses you paid during the period would be higher, and your ending account value would be lower.
Hypothetical Example for Comparison Purposes
The second line of the table below for each class of the Fund provides information about hypothetical account values and hypothetical expenses based on a Class' actual expense ratio and an assumed rate of return of 5% per year before expenses, which is not the Class' actual return. The hypothetical account values and expenses may not be used to estimate the actual ending account balance or expenses you paid for the period. You may use this information to compare the ongoing costs of investing in the Fund and other funds. To do so, compare this 5% hypothetical example with the 5% hypothetical examples that appear in the shareholder reports of the other funds.
Please note that the expenses shown in the table are meant to highlight your ongoing costs only and do not reflect any transaction costs. Therefore, the second line of the table is useful in comparing ongoing costs only, and will not help you determine the relative total costs of owning different funds. The estimate of expenses does not include any fees or other expenses of any variable annuity or variable life insurance product. If they were, the estimate of expenses you paid during the period would be higher, and your ending account value would be lower.
| Beginning
Account Value
July 1, 2004 | Ending
Account Value
December 31, 2004 | Expenses Paid
During Period*
July 1, 2004
to December 31, 2004 |
Initial Class | | | |
Actual | $ 1,000.00 | $ 1,007.40 | $ 1.46 |
HypotheticalA | $ 1,000.00 | $ 1,023.68 | $ 1.48 |
Service Class | | | |
Actual | $ 1,000.00 | $ 1,006.80 | $ 2.02 |
HypotheticalA | $ 1,000.00 | $ 1,023.13 | $ 2.03 |
Service Class 2 | | | |
Actual | $ 1,000.00 | $ 1,006.10 | $ 2.77 |
HypotheticalA | $ 1,000.00 | $ 1,022.37 | $ 2.80 |
A 5% return per year before expenses
* Expenses are equal to each Class' annualized expense ratio (shown in the table below); multiplied by the average account value over the period, multiplied by 184/366 (to reflect the one-half year period).
| Annualized
Expense Ratio |
Initial Class | .29% |
Service Class | .40% |
Service Class 2 | .55% |
Money Market Portfolio
Fidelity Variable Insurance Products: Money Market Portfolio
Investment Summary
Maturity Diversification |
Days | % of fund's investments 12/31/04 |
0 - 30 | 34.6 |
31 - 90 | 44.8 |
91 - 180 | 19.2 |
181 - 397 | 1.4 |
Weighted Average Maturity |
| 12/31/04 |
Fidelity Variable Insurance Products:
Money Market Portfolio | 56 Days |
Asset Allocation (% of fund's net assets) |
As of December 31, 2004 |
 | Corporate Bond | 1.6% | |
 | Commercial Paper | 17.5% | |
 | Bank CDs, BAs, TDs,
and Notes | 53.0% | |
 | Government Securities | 19.6% | |
 | Repurchase Agreements | 8.9% | |
 | Net Other Assets* | (0.6)% | |

* Net Other Assets are not included in the pie chart.
Annual Report
Fidelity Variable Insurance Products: Money Market Portfolio
Investments December 31, 2004
Showing Percentage of Net Assets
Corporate Bonds - 1.6% |
Due
Date | Annualized
Yield at Time
of Purchase | Principal
Amount | | Value
(Note 1) |
Bell Trace Obligated Group |
1/7/05 | 2.50% (b) | $ 11,600,000 | | $ 11,600,000 |
Citigroup, Inc. |
12/1/05 | 2.95 | 9,735,000 | | 10,056,742 |
Deutsche Telekom International Finance BV |
6/15/05 | 2.68 | 1,050,000 | | 1,075,500 |
6/15/05 | 2.70 | 140,000 | | 143,383 |
6/15/05 | 2.71 | 205,000 | | 209,949 |
6/15/05 | 2.83 | 35,000 | | 35,843 |
6/15/05 | 2.84 | 110,000 | | 112,645 |
6/15/05 | 2.85 | 95,000 | | 97,276 |
6/15/05 | 2.88 | 55,000 | | 56,311 |
TOTAL CORPORATE BONDS | 23,387,649 |
Certificates of Deposit - 20.0% |
|
Domestic Certificates Of Deposit - 1.2% |
Washington Mutual Bank, California |
1/27/05 | 1.90 | 7,000,000 | | 7,000,050 |
6/13/05 | 2.70 | 10,000,000 | | 10,000,000 |
| 17,000,050 |
London Branch, Eurodollar, Foreign Banks - 7.7% |
Barclays Bank PLC |
2/28/05 | 1.93 | 25,000,000 | | 25,000,000 |
Calyon |
2/22/05 | 1.87 | 15,000,000 | | 15,000,000 |
Dresdner Bank AG |
2/1/05 | 2.02 | 15,000,000 | | 15,000,000 |
ING Bank NV |
1/4/05 | 1.98 | 15,000,000 | | 15,000,000 |
Societe Generale |
3/7/05 | 2.00 | 20,000,000 | | 20,000,000 |
4/21/05 | 2.55 | 20,000,000 | | 20,000,000 |
| 110,000,000 |
New York Branch, Yankee Dollar, Foreign Banks - 11.1% |
Bank of Tokyo-Mitsubishi Ltd. |
1/31/05 | 2.41 | 15,000,000 | | 15,000,000 |
BNP Paribas SA |
1/24/05 | 2.33 (b) | 10,000,000 | | 9,997,629 |
2/14/05 | 1.95 | 15,000,000 | | 15,000,000 |
Canadian Imperial Bank of Commerce |
1/18/05 | 2.45 (b) | 20,000,000 | | 20,000,000 |
1/28/05 | 2.36 (b) | 25,000,000 | | 24,998,443 |
HBOS Treasury Services PLC |
3/4/05 | 2.39 (b) | 20,000,000 | | 20,000,000 |
|
Due
Date | Annualized
Yield at Time
of Purchase | Principal
Amount | | Value
(Note 1) |
Landesbank Baden-Wuerttemberg |
2/25/05 | 2.31% (b) | $ 15,000,000 | | $ 14,998,225 |
3/7/05 | 2.37 (b) | 5,000,000 | | 4,999,730 |
Societe Generale |
1/10/05 | 2.28 (b) | 5,000,000 | | 4,999,726 |
1/18/05 | 2.34 (b) | 15,000,000 | | 14,997,516 |
Societe Generale NA |
5/9/05 | 2.53 | 4,000,000 | | 3,984,336 |
Unicredito Italiano Spa |
2/14/05 | 2.21 (b) | 10,000,000 | | 9,997,969 |
| 158,973,574 |
TOTAL CERTIFICATES OF DEPOSIT | 285,973,624 |
Commercial Paper - 17.2% |
|
Bank of America Corp. |
3/16/05 | 2.06 | 20,000,000 | | 19,916,133 |
4/5/05 | 2.16 | 15,000,000 | | 14,916,183 |
Bradford & Bingley PLC |
1/28/05 | 2.12 | 5,000,000 | | 4,992,106 |
Charta LLC |
2/10/05 | 2.25 | 5,000,000 | | 4,987,556 |
Comcast Corp. |
1/3/05 | 2.59 | 1,000,000 | | 999,856 |
1/18/05 | 2.67 | 3,000,000 | | 2,996,232 |
DaimlerChrysler NA Holding Corp. |
1/24/05 | 2.56 | 2,000,000 | | 1,996,729 |
1/25/05 | 2.58 | 5,000,000 | | 4,991,433 |
Dominion Resources, Inc. |
1/12/05 | 2.44 | 700,000 | | 699,478 |
Dorada Finance, Inc. |
3/10/05 | 2.04 (a) | 5,000,000 | | 4,980,922 |
3/14/05 | 2.03 (a) | 15,000,000 | | 14,939,700 |
Dresdner U.S. Finance, Inc. |
1/24/05 | 1.98 | 5,000,000 | | 4,993,715 |
Ford Motor Credit Co. |
1/6/05 | 2.63 | 4,000,000 | | 3,998,539 |
1/13/05 | 2.51 | 10,000,000 | | 9,991,667 |
General Electric Capital Corp. |
2/1/05 | 1.90 | 15,000,000 | | 14,975,717 |
2/11/05 | 1.87 | 10,000,000 | | 9,978,931 |
Grampian Funding Ltd. |
2/10/05 | 1.97 | 10,000,000 | | 9,978,333 |
4/8/05 | 2.45 | 5,000,000 | | 4,967,263 |
4/19/05 | 2.20 | 10,000,000 | | 9,934,600 |
6/20/05 | 2.72 | 5,000,000 | | 4,936,722 |
John Deere Capital Corp. |
1/14/05 | 2.43 | 1,000,000 | | 999,123 |
Commercial Paper - continued |
Due
Date | Annualized
Yield at Time
of Purchase | Principal
Amount | | Value
(Note 1) |
Jupiter Securitization Corp. |
6/20/05 | 2.70% | $ 10,629,000 | | $ 10,495,488 |
Kellogg Co. |
1/10/05 | 2.42 | 500,000 | | 499,698 |
Motown Notes Program |
1/18/05 | 2.22 | 5,000,000 | | 4,994,782 |
2/1/05 | 2.16 | 5,000,000 | | 4,990,743 |
2/7/05 | 2.27 | 19,000,000 | | 18,955,867 |
Nordea North America, Inc. |
5/23/05 | 2.53 | 15,000,000 | | 14,852,083 |
Paradigm Funding LLC |
1/7/05 | 2.30 (b) | 5,000,000 | | 4,999,925 |
2/24/05 | 1.94 | 15,000,000 | | 14,956,800 |
Park Granada LLC |
2/8/05 | 2.25 | 10,000,000 | | 9,976,356 |
Westpac Capital Corp. |
3/2/05 | 2.31 | 10,250,000 | | 10,210,879 |
TOTAL COMMERCIAL PAPER | 246,103,559 |
Federal Agencies - 19.6% |
|
Fannie Mae - 7.3% |
Agency Coupons - 7.3% |
2/15/05 | 1.40 | 5,000,000 | | 5,000,000 |
2/25/05 | 1.40 | 25,000,000 | | 25,000,000 |
3/29/05 | 1.40 | 15,000,000 | | 15,000,000 |
5/4/05 | 1.54 | 20,000,000 | | 20,000,000 |
5/13/05 | 1.59 | 20,000,000 | | 20,000,000 |
5/16/05 | 1.63 | 5,000,000 | | 5,000,000 |
6/3/05 | 1.84 | 5,000,000 | | 5,000,000 |
9/12/05 | 2.31 | 10,000,000 | | 10,000,000 |
| 105,000,000 |
Federal Home Loan Bank - 12.3% |
Agency Coupons - 12.3% |
2/25/05 | 1.40 | 15,000,000 | | 15,000,000 |
2/25/05 | 1.82 | 5,000,000 | | 4,996,906 |
3/11/05 | 1.44 | 35,000,000 | | 35,000,000 |
4/1/05 | 1.40 | 55,000,000 | | 54,999,999 |
4/1/05 | 1.45 | 10,240,000 | | 10,238,768 |
4/27/05 | 1.30 | 10,000,000 | | 10,000,000 |
4/27/05 | 1.74 | 5,000,000 | | 4,993,134 |
4/28/05 | 1.35 | 5,000,000 | | 5,000,000 |
4/29/05 | 2.03 | 5,000,000 | | 4,989,167 |
5/2/05 | 1.92 | 5,000,000 | | 4,991,020 |
5/3/05 | 1.37 | 20,000,000 | | 20,000,000 |
5/16/05 | 1.65 | 5,000,000 | | 5,000,000 |
| 175,208,994 |
TOTAL FEDERAL AGENCIES | 280,208,994 |
Master Notes - 4.4% |
Due
Date | Annualized
Yield at Time
of Purchase | Principal
Amount | | Value
(Note 1) |
General Motors Acceptance Corp. Mortgage Credit |
1/3/05 | 2.88% (e) | $ 10,000,000 | | $ 9,998,404 |
1/3/05 | 2.92 (e) | 4,000,000 | | 3,999,353 |
Goldman Sachs Group, Inc. |
1/10/05 | 2.06 (b)(e) | 7,000,000 | | 7,000,000 |
2/28/05 | 2.43 (b)(e) | 36,000,000 | | 36,000,000 |
4/12/05 | 2.12 (e) | 5,000,000 | | 5,000,000 |
TOTAL MASTER NOTES | 61,997,757 |
Medium-Term Notes - 21.2% |
|
American Express Credit Corp. |
1/5/05 | 2.38 (b) | 10,000,000 | | 10,000,822 |
Bank of New York Co., Inc. |
1/27/05 | 2.44 (a)(b) | 15,000,000 | | 15,000,000 |
Bank of Scotland Treasury Services PLC |
3/14/05 | 2.53 (a)(b) | 10,000,000 | | 10,001,272 |
Bayerische Landesbank Girozentrale |
2/19/05 | 2.30 (b) | 15,000,000 | | 15,000,000 |
BellSouth Telecommunications |
3/4/05 | 2.50 (b) | 5,000,000 | | 5,000,000 |
Citigroup Global Markets Holdings, Inc. |
3/7/05 | 2.50 (b) | 5,000,000 | | 5,002,442 |
Countrywide Home Loans, Inc. |
1/18/05 | 2.14 (b) | 10,000,000 | | 9,998,834 |
Descartes Funding Trust |
1/18/05 | 2.40 (b) | 5,000,000 | | 5,000,000 |
General Electric Capital Corp. |
1/10/05 | 2.46 (b) | 25,000,000 | | 25,000,000 |
1/17/05 | 2.51 (b) | 20,000,000 | | 20,000,000 |
HBOS Treasury Services PLC |
3/24/05 | 2.55 (b) | 20,000,000 | | 20,000,000 |
Morgan Stanley |
1/3/05 | 2.37 (b) | 2,000,000 | | 2,000,000 |
1/4/05 | 2.33 (b) | 5,000,000 | | 5,000,000 |
1/18/05 | 2.40 (b) | 5,000,000 | | 5,000,000 |
1/18/05 | 2.52 (b) | 25,000,000 | | 25,004,623 |
1/27/05 | 2.43 (b) | 11,000,000 | | 11,000,385 |
National City Bank |
3/1/05 | 2.32 (b) | 10,000,000 | | 9,998,759 |
RACERS |
1/24/05 | 2.41 (a)(b) | 15,000,000 | | 15,000,000 |
SBC Communications, Inc. |
6/5/05 | 2.39 (a) | 4,000,000 | | 4,028,398 |
SouthTrust Bank, Alabama |
2/2/05 | 2.23 (b) | 25,000,000 | | 25,008,583 |
Medium-Term Notes - continued |
Due
Date | Annualized
Yield at Time
of Purchase | Principal
Amount | | Value
(Note 1) |
Verizon Global Funding Corp. |
3/15/05 | 2.60% (b) | $ 50,000,000 | | $ 50,000,242 |
Westpac Banking Corp. |
3/14/05 | 2.39 (b) | 10,000,000 | | 9,998,640 |
TOTAL MEDIUM-TERM NOTES | 302,043,000 |
Short-Term Notes - 5.8% |
|
Jackson National Life Insurance Co. |
1/3/05 | 2.15 (b)(e) | 7,000,000 | | 7,000,000 |
Metropolitan Life Insurance Co. |
1/3/05 | 2.20 (b)(e) | 10,000,000 | | 10,000,000 |
1/28/05 | 2.46 (a)(b) | 5,000,000 | | 5,000,000 |
2/1/05 | 2.32 (b)(e) | 5,000,000 | | 5,000,000 |
Monumental Life Insurance Co. |
1/1/05 | 2.42 (b)(e) | 5,000,000 | | 5,000,000 |
1/1/05 | 2.45 (b)(e) | 5,000,000 | | 5,000,000 |
New York Life Insurance Co. |
1/3/05 | 2.14 (b)(e) | 30,000,000 | | 30,000,000 |
Pacific Life Insurance Co. |
3/11/05 | 2.62 (b)(e) | 5,000,000 | | 5,000,000 |
Transamerica Occidental Life Insurance Co. |
2/1/05 | 2.33 (b)(e) | 10,000,000 | | 10,000,000 |
TOTAL SHORT-TERM NOTES | 82,000,000 |
Municipal Securities - 1.9% |
|
|
New York State Hsg. Fin. Svc. Contract Rev. Series 2003 H, 2.45%,
LOC Dexia Cr. Local de France, VRDN (b) | 11,000,000 | | 11,000,000 |
San Jose Redev. Agcy. Rev. Series A, 2.45%, LOC JPMorgan Chase Bank, VRDN (b)(c) | 11,250,000 | | 11,250,000 |
West Baton Rouge Parish Indl. District #3 Rev. Bonds (Dow Chemical Co. Proj.) Series 1995, 2.4% tender 1/5/05, CP mode | 5,200,000 | | 5,200,000 |
TOTAL MUNICIPAL SECURITIES | 27,450,000 |
Repurchase Agreements - 8.9% |
| Maturity
Amount | | Value
(Note 1) |
In a joint trading account (Collateralized by U.S. Government Obligations dated 12/31/04 due 1/3/05 At 2.32%) | $ 98,019 | | $ 98,000 |
With: | | | |
Banc of America Securities LLC At 2.37%, dated 12/31/04 due 1/3/05 (Collateralized by Commercial Paper Obligations
with principal amounts of $15,320,717, 2.44%, 1/19/05) | 15,002,963 | | 15,000,000 |
Goldman Sachs & Co. At: | | | |
2.41%, dated 12/31/04 due 1/3/05 (Collateralized by Mortgage Loan Obligations
with principal amounts of $2,003,978, 4.88%, 1/12/38) | 2,000,402 | | 2,000,000 |
2.43%, dated 11/22/04 due 2/18/05 (Collateralized by Mortgage Loan Obligations
with principal amounts of $25,084,688, 5.25% - 7.14%, 12/15/12 - 2/25/44) (b)(d) | 20,118,800 | | 20,000,000 |
J.P. Morgan Securities, Inc. At 2.38%, dated 12/15/04 due 2/3/05 (Collateralized by Corporate Obligations with principal amounts of $25,120,000, 6.05% - 7.38%, 6/20/08 - 2/15/24) | 24,079,333 | | 24,000,000 |
Lehman Brothers, Inc. At 2.43%, dated 12/31/04 due 1/3/05 (Collateralized by Equity Securities valued at $24,639,109) | 23,004,658 | | 23,000,000 |
Repurchase Agreements - continued |
| Maturity
Amount | | Value
(Note 1) |
With: - continued | | | |
Merrill Lynch, Pierce, Fenner & Smith At 2.46%, dated 11/8/04 due 2/1/05 (Collateralized by Corporate Obligations with principal amounts of $24,810,000, 6.85%, 5/1/29) (b)(d) | $ 23,133,592 | | $ 23,000,000 |
Morgan Stanley & Co. At 2.38%, dated 12/15/04 due 2/3/05 (Collateralized by Mortgage Loan Obligations with principal amounts of $26,590,879, 3.9% - 6.13%, 8/25/32 - 8/25/34) | 20,066,111 | | 20,000,000 |
TOTAL REPURCHASE AGREEMENTS | 127,098,000 |
TOTAL INVESTMENT
PORTFOLIO - 100.6% | 1,436,262,583 |
NET OTHER ASSETS - (0.6)% | (9,009,474) |
NET ASSETS - 100% | $ 1,427,253,109 |
Total Cost for Federal Income Tax Purposes $ 1,436,262,583 |
Security Type Abbreviations |
CP | - | Commercial Paper |
VRDN | - | Variable Rate Demand Note |
Legend |
(a) Security exempt from registration under Rule 144A of the Securities Act of 1933. These securities may be resold in transactions exempt from registration, normally to qualified institutional buyers. At the period end, the value of these securities amounted to 68,950,292 or 4.8% of net assets. |
(b) The coupon rate shown on floating or adjustable rate securities represents the rate at period end. The due dates on these types of securities reflect the next interest rate reset date or, when applicable, the final maturity date. |
(c) Private activity obligations whose interest is subject to the federal alternative minimum tax for individuals. |
(d) The maturity amount is based on the rate at period end. |
(e) Restricted securities - Investment in securities not registered under the Securities Act of 1933 (excluding 144A issues). At the end of the period, the value of restricted securities (excluding 144A issues) amounted to $138,997,758 or 9.7% of net assets. |
Additional information on each holding is as follows: |
Security | Acquisition
Date | Cost |
General Motors Acceptance Corp. Mortgage Credit:
2.88%, 1/3/05 | 12/1/04 | $ 9,998,404 |
2.92%, 1/3/05 | 12/1/04 | $ 3,999,353 |
Goldman Sachs Group, Inc.:
2.06%, 1/10/05 | 7/8/04 | $ 7,000,000 |
2.12%, 4/12/05 | 9/14/04 | $ 5,000,000 |
2.43%, 2/28/05 | 8/26/04 | $ 36,000,000 |
Jackson National Life Insurance Co.
2.15%, 1/3/05 | 3/31/03 | $ 7,000,000 |
Metropolitan Life Insurance Co.:
2.2%, 1/3/05 | 3/26/02 | $ 10,000,000 |
2.32%, 2/1/05 | 2/24/03 | $ 5,000,000 |
Monumental Life Insurance Co.:
2.42%, 1/1/05 | 9/17/98 | $ 5,000,000 |
2.45, 1/1/05 | 3/12/99 | $ 5,000,000 |
New York Life Insurance Co.
2.14%, 1/3/05 | 2/28/02 - 12/19/02 | $ 30,000,000 |
Pacific Life Insurance Co
2.62%, 3/11/05 | 3/10/03 | $ 5,000,000 |
Transamerica Occidental Life Insurance Co.
2.33%, 2/1/05 | 4/28/00 | $ 10,000,000 |
Income Tax Information |
At December 31, 2004, the fund had a capital loss carryforward of approximately $284,000 of which $109,000 and $175,000 will expire on December 31, 2011 and 2012, respectively. |
See accompanying notes which are an integral part of the financial statements.
Annual Report
Fidelity Variable Insurance Products: Money Market Portfolio
Financial Statements
Statement of Assets and Liabilities
December 31, 2004 |
Assets | | |
Investment in securities, at value (including repurchase agreements of $127,098,000) (cost $1,436,262,583) - See accompanying schedule | | $ 1,436,262,583 |
Cash | | 181,340 |
Receivable for fund shares sold | | 1,447,892 |
Interest receivable | | 3,372,555 |
Prepaid expenses | | 6,391 |
Other affiliated receivables | | 740 |
Other receivables | | 10 |
Total assets | | 1,441,271,511 |
| | |
Liabilities | | |
Payable for investments purchased | $ 10,118,802 | |
Payable for fund shares redeemed | 3,382,769 | |
Accrued management fee | 234,506 | |
Distribution fees payable | 4,914 | |
Other affiliated payables | 97,414 | |
Other payables and accrued expenses | 179,997 | |
Total liabilities | | 14,018,402 |
| | |
Net Assets | | $ 1,427,253,109 |
Net Assets consist of: | | |
Paid in capital | | $ 1,427,486,892 |
Undistributed net investment income | | 49,905 |
Accumulated undistributed net realized gain (loss) on investments | | (283,688) |
Net Assets | | $ 1,427,253,109 |
| | |
Initial Class:
Net Asset Value, offering price and redemption price per share ($1,392,448,817 ÷ 1,392,654,760 shares) | | $ 1.00 |
| | |
Service Class:
Net Asset Value, offering price and redemption price per share ($13,905,448 ÷ 13,906,161 shares) | | $ 1.00 |
| | |
Service Class 2:
Net Asset Value, offering price and redemption price per share ($20,898,844 ÷ 20,900,582 shares) | | $ 1.00 |
Statement of Operations
Year ended December 31, 2004 |
Investment Income | | |
Interest | | $ 24,719,517 |
| | |
Expenses | | |
Management fee | $ 3,278,063 | |
Transfer agent fees | 1,109,423 | |
Distribution fees | 43,872 | |
Accounting fees and expenses | 180,343 | |
Non-interested trustees' compensation | 9,503 | |
Custodian fees and expenses | 36,714 | |
Audit | 37,379 | |
Legal | 3,797 | |
Miscellaneous | 246,179 | |
Total expenses before reductions | 4,945,273 | |
Expense reductions | (504) | 4,944,769 |
Net investment income | | 19,774,748 |
Net realized gain (loss) on investment securities | | (174,987) |
Net increase in net assets resulting from operations | | $ 19,599,761 |
See accompanying notes which are an integral part of the financial statements.
Money Market Portfolio
Fidelity Variable Insurance Products: Money Market Portfolio
Financial Statements - continued
Statement of Changes in Net Assets
| Year ended
December 31,
2004 | Year ended
December 31,
2003 |
Increase (Decrease) in Net Assets | | |
Operations | | |
Net investment income | $ 19,774,748 | $ 23,975,974 |
Net realized gain (loss) | (174,987) | (133,557) |
Net increase in net assets resulting from operations | 19,599,761 | 23,842,417 |
Distributions to shareholders from net investment income | (19,778,361) | (23,975,974) |
Share transactions - net increase (decrease) | (412,681,844) | (920,442,277) |
Total increase (decrease) in net assets | (412,860,444) | (920,575,834) |
| | |
Net Assets | | |
Beginning of period | 1,840,113,553 | 2,760,689,387 |
End of period (including undistributed net investment income of $49,905 and $0, respectively) | $ 1,427,253,109 | $ 1,840,113,553 |
Other Information: | | | |
Share Transactions | Year ended December 31, 2004 |
| Initial Class | Service Class | Service Class 2 |
Shares Sold | 830,419,484 | 47,818,461 | 22,301,596 |
Reinvested | 19,434,528 | 224,941 | 96,802 |
Redeemed | (1,274,668,391) | (53,743,207) | (4,566,058) |
Net increase (decrease) | (424,814,379) | (5,699,805) | 17,832,340 |
| | | |
Share Transactions | Year ended December 31, 2003 |
| Initial Class | Service Class | Service Class 2 |
Shares Sold | 6,056,411,700 | 54,027,987 | 82,930,007 |
Reinvested | 23,602,029 | 128,154 | 208,645 |
Redeemed | (6,967,511,919) | (42,565,009) | (127,673,871) |
Net increase (decrease) | (887,498,190) | 11,591,132 | (44,535,219) |
| | | |
Distributions | Year ended December 31, 2004 |
| Initial Class | Service Class | Service Class 2 |
From net investment income | $ 19,434,556 | $ 247,002 | $ 96,803 |
| Year ended December 31, 2003 |
| Initial Class | Service Class | Service Class 2 |
From net investment income | $ 23,625,076 | $ 137,269 | $ 213,629 |
See accompanying notes which are an integral part of the financial statements.
Annual Report
Financial Highlights - Initial Class
Years ended December 31, | 2004 | 2003 | 2002 | 2001 | 2000 |
Selected Per-Share Data | | | | | |
Net asset value, beginning of period | $ 1.00 | $ 1.00 | $ 1.00 | $ 1.00 | $ 1.00 |
Income from Investment Operations | | | | | |
Net investment income | .012 | .010 | .017 | .041 | .062 |
Distributions from net investment income | (.012) | (.010) | (.017) | (.041) | (.062) |
Net asset value, end of period | $ 1.00 | $ 1.00 | $ 1.00 | $ 1.00 | $ 1.00 |
Total Return A, B | 1.21% | 1.00% | 1.69% | 4.18% | 6.30% |
Ratios to Average Net Assets C | | | | | |
Expenses before expense reductions | .29% | .29% | .29% | .28% | .33% |
Expenses net of voluntary waivers, if any | .29% | .29% | .29% | .28% | .33% |
Expenses net of all reductions | .29% | .29% | .29% | .28% | .33% |
Net investment income | 1.18% | 1.00% | 1.68% | 3.99% | 6.18% |
Supplemental Data | | | | | |
Net assets, end of period (000 omitted) | $ 1,392,449 | $ 1,817,440 | $ 2,705,069 | $ 2,753,379 | $ 2,233,342 |
A Total returns do not reflect charges attributable to your insurance company's separate account. Inclusion of these charges would reduce the total returns shown.
B Total returns would have been lower had certain expenses not been reduced during the periods shown.
C Expense ratios reflect operating expenses of the class. Expenses before reductions do not reflect amounts reimbursed by the investment adviser or reductions from brokerage service arrangements or other expense offset arrangements and do not represent the amount paid by the class during periods when reimbursements or reductions occur. Expenses net of any voluntary waivers reflect expenses after reimbursement by the investment adviser but prior to reductions from brokerage service arrangements or other expense offset arrangements. Expenses net of all reductions represent the net expenses paid by the class.
Financial Highlights - Service Class
Years ended December 31, | 2004 | 2003 | 2002 | 2001 | 2000 E |
Selected Per-Share Data | | | | | |
Net asset value, beginning of period | $ 1.00 | $ 1.00 | $ 1.00 | $ 1.00 | $ 1.00 |
Income from Investment Operations | | | | | |
Net investment income | .011 | .009 | .016 | .040 | .031 |
Distributions from net investment income | (.011) | (.009) | (.016) | (.040) | (.031) |
Net asset value, end of period | $ 1.00 | $ 1.00 | $ 1.00 | $ 1.00 | $ 1.00 |
Total Return B, C, D | 1.10% | .90% | 1.61% | 4.10% | 3.06% |
Ratios to Average Net Assets F | | | | | |
Expenses before expense reductions | .40% | .38% | .39% | .39% | .47% A |
Expenses net of voluntary waivers, if any | .40% | .38% | .39% | .39% | .45% A |
Expenses net of all reductions | .40% | .38% | .39% | .39% | .45% A |
Net investment income | 1.08% | .91% | 1.58% | 3.87% | 6.28% A |
Supplemental Data | | | | | |
Net assets, end of period (000 omitted) | $ 13,905 | $ 19,606 | $ 8,017 | $ 6,143 | $ 103 |
A Annualized
B Total returns for periods of less than one year are not annualized.
C Total returns do not reflect charges attributable to your insurance company's separate account. Inclusion of these charges would reduce the total returns shown.
D Total returns would have been lower had certain expenses not been reduced during the periods shown.
E For the period July 7, 2000 (commencement of sale of shares) to December 31, 2000.
F Expense ratios reflect operating expenses of the class. Expenses before reductions do not reflect amounts reimbursed by the investment adviser or reductions from brokerage service arrangements or other expense offset arrangements and do not represent the amount paid by the class during periods when reimbursements or reductions occur. Expense ratios before reductions for start-up periods may not be representative of longer-term operating periods. Expenses net of any voluntary waivers reflect expenses after reimbursement by the investment adviser but prior to reductions from brokerage service arrangements or other expense offset arrangements. Expenses net of all reductions represent the net expenses paid by the class.
See accompanying notes which are an integral part of the financial statements.
Money Market Portfolio
Financial Highlights - Service Class 2
Years ended December 31, | 2004 | 2003 | 2002 | 2001 | 2000 E |
Selected Per-Share Data | | | | | |
Net asset value, beginning of period | $ 1.00 | $ 1.00 | $ 1.00 | $ 1.00 | $ 1.00 |
Income from Investment Operations | | | | | |
Net investment income | .009 | .007 | .014 | .039 | .058 |
Distributions from net investment income | (.009) | (.007) | (.014) | (.039) | (.058) |
Net asset value, end of period | $ 1.00 | $ 1.00 | $ 1.00 | $ 1.00 | $ 1.00 |
Total Return B, C, D | .95% | .75% | 1.45% | 3.96% | 5.89% |
Ratios to Average Net Assets F | | | | | |
Expenses before expense reductions | .55% | .54% | .54% | .55% | .96% A |
Expenses net of voluntary waivers, if any | .55% | .54% | .54% | .55% | .60% A |
Expenses net of all reductions | .55% | .54% | .54% | .55% | .60% A |
Net investment income | .93% | .75% | 1.43% | 3.71% | 5.94% A |
Supplemental Data | | | | | |
Net assets, end of period (000 omitted) | $ 20,899 | $ 3,068 | $ 47,604 | $ 40,267 | $ 108 |
A Annualized
B Total returns for periods of less than one year are not annualized.
C Total returns do not reflect charges attributable to your insurance company's separate account. Inclusion of these charges would reduce the total returns shown.
D Total returns would have been lower had certain expenses not been reduced during the periods shown.
E For the period January 12, 2000 (commencement of sale of shares) to December 31, 2000.
F Expense ratios reflect operating expenses of the class. Expenses before reductions do not reflect amounts reimbursed by the investment adviser or reductions from brokerage service arrangements or other expense offset arrangements and do not represent the amount paid by the class during periods when reimbursements or reductions occur. Expense ratios before reductions for start-up periods may not be representative of longer-term operating periods. Expenses net of any voluntary waivers reflect expenses after reimbursement by the investment adviser but prior to reductions from brokerage service arrangements or other expense offset arrangements. Expenses net of all reductions represent the net expenses paid by the class.
See accompanying notes which are an integral part of the financial statements.
Annual Report
Notes to Financial Statements
For the period ended December 31, 2004
1. Significant Accounting Policies.
Money Market Portfolio (the fund) is a fund of Variable Insurance Products (the trust) (referred to in this report as Fidelity Variable Insurance Products: Money Market Portfolio) and is authorized to issue an unlimited number of shares. The trust is registered under the Investment Company Act of 1940, as amended (the 1940 Act), as an open-end management investment company organized as a Massachusetts business trust. Shares of the fund may only be purchased by insurance companies for the purpose of funding variable annuity or variable life insurance contracts. The fund offers the following classes of shares: Initial Class shares, Service Class shares and Service Class 2 shares. All classes have equal rights and voting privileges, except for matters affecting a single class. Investment income, realized and unrealized capital gains and losses, the common expenses of the fund, and certain fund-level expense reductions, if any, are allocated on a pro rata basis to each class based on the relative net assets of each class to the total net assets of the fund. Each class differs with respect to distribution and service plan fees incurred. Certain expense reductions also differ by class.
The financial statements have been prepared in conformity with accounting principles generally accepted in the United States of America, which require management to make certain estimates and assumptions at the date of the financial statements. The following summarizes the significant accounting policies of the fund:
Security Valuation. Net asset value per share is calculated as of the close of business of the New York Stock Exchange, normally 4:00 p.m. Eastern time. As permitted under Rule 2a-7 of the 1940 Act, and certain conditions therein, securities are valued initially at cost and thereafter assume a constant amortization to maturity of any discount or premium. Investments in open-end investment companies are valued at their net asset value each business day.
Investment Transactions and Income. Security transactions are accounted for as of trade date. Gains and losses on securities sold are determined on the basis of identified cost. Interest income is accrued as earned. Interest income includes coupon interest and amortization of premium and accretion of discount on debt securities.
Expenses. Most expenses of the trust can be directly attributed to a fund. Expenses which cannot be directly attributed are apportioned among the funds in the trust.
Income Tax Information and Distributions to Shareholders. Each year, the fund intends to qualify as a regulated investment company by distributing all of its taxable income and realized gains under Subchapter M of the Internal Revenue Code. As a result, no provision for income taxes is required in the accompanying financial statements.
Dividends are declared daily and paid monthly from net investment income. Distributions from realized gains, if any, are recorded on the ex-dividend date. Income dividends and capital gain distributions are declared separately for each class. Income and capital gain distributions are determined in accordance with income tax regulations, which may differ from generally accepted accounting principles. There were no significant book-to-tax differences during the period.
2. Operating Policies.
Repurchase Agreements. Fidelity Management & Research Company (FMR) has received an Exemptive Order from the Securities and Exchange Commission (the SEC) which permits the fund and other affiliated entities of FMR to transfer uninvested cash balances into joint trading accounts. These accounts are then invested in repurchase agreements that are collateralized by U.S. Treasury or Government obligations. The fund may also invest directly with institutions, in repurchase agreements that are collateralized by commercial paper obligations, corporate obligations and mortgage loan obligations which may be below investment-grade quality, and equity securities. Collateral is held in segregated accounts with custodian banks and may be obtained in the event of a default of the counterparty. Collateral is marked-to-market daily and maintained at a value at least equal to the principal amount of the repurchase agreement (including accrued interest).
Restricted Securities. The fund may invest in securities that are subject to legal or contractual restrictions on resale. These securities generally may be resold in transactions exempt from registration or to the public if the securities are registered. Disposal of these securities may involve time-consuming negotiations and expense, and prompt sale at an acceptable price may be difficult. Information regarding restricted securities is included at the end of the fund's Schedule of Investments.
3. Fees and Other Transactions with Affiliates.
Management Fee. FMR and its affiliates provide the fund with investment management related services for which the fund pays a monthly management fee. The management fee is calculated on the basis of a group fee rate plus a total income-based component. The group fee rate averaged ..13% during the period. The group fee rate is based upon the average net assets of all the mutual funds advised by FMR. The group fee rate decreases as assets under management increase and increases as assets under management decrease. The total income-based component is calculated according to a graduated schedule providing for different rates based on the fund's gross annualized yield. The rate increases as the fund's gross yield increases.
Money Market Portfolio
Notes to Financial Statements - continued
3. Fees and Other Transactions with Affiliates - continued
Management Fee - continued
During the period the income-based portion of this fee was $1,173,053 or an annual rate of .07% of the fund's average net assets. For the period, the fund's total annual management fee rate was .20% of the fund's average net assets.
Distribution and Service Plan. In accordance with Rule 12b-1 of the 1940 Act, the fund has adopted separate 12b-1 Plans for each Service Class of shares. Each Service Class pays Fidelity Distributors Corporation (FDC), an affiliate of FMR, a service fee. For the period, the service fee is based on an annual rate of .10% of Service Class' average net assets and .25% of Service Class 2's average net assets.
For the period, each class paid FDC the following amounts, all of which were re-allowed to insurance companies for the distribution of shares and providing shareholder support services:
Service Class | $ 22,272 | |
Service Class 2 | 21,600 | |
| $ 43,872 | |
Transfer Agent Fees. Fidelity Investments Institutional Operations Company, Inc. (FIIOC), an affiliate of FMR, is the fund's transfer, dividend disbursing, and shareholder servicing agent. FIIOC receives an asset-based fee with respect to each account. FIIOC pays a portion of the expenses related to the typesetting, printing and mailing of shareholder reports, except proxy statements. Each class pays a transfer agent fee, excluding out of pocket expenses, equal to an annual rate of .07% of their month end net assets. For the period, the total transfer agent fees paid by each class to FIIOC, including out of pocket expenses, were as follows:
Initial Class | $ 1,087,334 | |
Service Class | 15,939 | |
Service Class 2 | 6,150 | |
| $ 1,109,423 | |
Accounting Fees. Fidelity Service Company, Inc. (FSC), an affiliate of FMR, maintains the fund's accounting records. The fee is based on the level of average net assets for the month.
Interfund Lending Program. Pursuant to an Exemptive Order issued by the SEC, the funds, along with other registered investment companies having management contracts with FMR, may participate in an interfund lending program. This program provides an alternative credit facility allowing the funds to borrow from, or lend money to, other participating funds. At period end there were no interfund loans outstanding. The fund's activity in this program during the period was as follows:
| Borrower or Lender | Average Daily
Loan Balance | Weighted Average
Interest Rate | Interest Earned
(included in interest
income) | Interest
Expense |
VIP: Money Market | Lender | $ 8,038,737 | 1.25% | $ 5,311 | - |
4. Expense Reductions.
Through arrangements with the fund's custodian, credits realized as a result of uninvested cash balances were used to reduce the fund's expenses. During the period, these credits reduced the fund's custody expenses by $504.
5. Other Information.
At the end of the period, FMR or its affiliates were the owners of record of 62% of the total outstanding shares of the fund and one otherwise unaffiliated shareholder was the owner of record of 14% of the total outstanding shares of the fund.
Annual Report
Report of Independent Registered Public Accounting Firm
To the Trustees of Variable Insurance Products Fund and the Shareholders of Money Market Portfolio:
In our opinion, the accompanying statement of assets and liabilities, including the schedule of investments, and the related statements of operations and of changes in net assets and the financial highlights present fairly, in all material respects, the financial position of Money Market Portfolio (a fund of Variable Insurance Products Fund) at December 31, 2004 and the results of its operations, the changes in its net assets and the financial highlights for the periods indicated, in conformity with accounting principles generally accepted in the United States of America. These financial statements and financial highlights (hereafter referred to as "financial statements") are the responsibility of the Money Market Portfolio's management; our responsibility is to express an opinion on these financial statements based on our audits. We conducted our audits of these financial statements in accordance with the standards of the Public Company Accounting Oversight Board (United States). Those standards require that we plan and perform the audit to obtain reasonable assurance about whether the financial statements are free of material misstatement. An audit includes examining, on a test basis, evidence supporting the amounts and disclosures in the financial statements, assessing the accounting principles used and significant estimates made by management, and evaluating the overall financial statement presentation. We believe that our audits, which included confirmation of securities at December 31, 2004 by correspondence with the custodian and brokers, provide a reasonable basis for our opinion.
/s/PricewaterhouseCoopers LLP
PricewaterhouseCoopers LLP
Boston, Massachusetts
February 14, 2005
Money Market Portfolio
Trustees and Officers
The Trustees, Member of the Advisory Board, and executive officers of the trust and fund, as applicable, are listed below. The Board of Trustees governs the fund and is responsible for protecting the interests of shareholders. The Trustees are experienced executives who meet periodically throughout the year to oversee the fund's activities, review contractual arrangements with companies that provide services to the fund, and review the fund's performance. Except for William O. McCoy, Dennis J. Dirks, and Kenneth L. Wolfe each of the Trustees oversees 301 funds advised by FMR or an affiliate. Mr. McCoy oversees 303 funds advised by FMR or an affiliate. Mr. Dirks and Mr. Wolfe oversee 233 funds advised by FMR or an affiliate.
The Trustees hold office without limit in time except that (a) any Trustee may resign; (b) any Trustee may be removed by written instrument, signed by at least two-thirds of the number of Trustees prior to such removal; (c) any Trustee who requests to be retired or who has become incapacitated by illness or injury may be retired by written instrument signed by a majority of the other Trustees; and (d) any Trustee may be removed at any special meeting of shareholders by a two-thirds vote of the outstanding voting securities of the trust. In any event, each non-interested Trustee shall retire not later than the last day of the calendar year in which his or her 72nd birthday occurs. The executive officers and Advisory Board Member hold office without limit in time, except that any officer and Advisory Board Member may resign or may be removed by a vote of a majority of the Trustees at any regular meeting or any special meeting of the Trustees. Except as indicated, each individual has held the office shown or other offices in the same company for the past five years.
The fund's Statement of Additional Information (SAI) includes more information about the Trustees. To request a free copy, call Fidelity at 1-800-544-5429.
Interested Trustees*:
Correspondence intended for each Trustee who is an "interested person" (as defined in the 1940 Act) may be sent to Fidelity Investments, 82 Devonshire Street, Boston, Massachusetts 02109.
Name, Age; Principal Occupation |
Edward C. Johnson 3d (74)** |
| Year of Election or Appointment: 1976 Mr. Johnson is Chairman of the Board of Trustees. Mr. Johnson serves as Chief Executive Officer, Chairman, and a Director of FMR Corp.; a Director and Chairman of the Board and of the Executive Committee of FMR; Chairman and a Director of Fidelity Management & Research (Far East) Inc.; Chairman (1998) and a Director of Fidelity Investments Money Management, Inc.; and Chairman (2001) and a Director (2000) of FMR Co., Inc. |
Abigail P. Johnson (43)** |
| Year of Election or Appointment: 2001 Senior Vice President of VIP Money Market (2001). Ms. Johnson also serves as Senior Vice President of other Fidelity funds (2001). She is President and a Director of FMR (2001), Fidelity Investments Money Management, Inc. (2001), FMR Co., Inc. (2001), and a Director of FMR Corp. Previously, Ms. Johnson managed a number of Fidelity funds. |
Laura B. Cronin (50) |
| Year of Election or Appointment: 2003 Ms. Cronin is an Executive Vice President (2002) and Chief Financial Officer (2002) of FMR Corp. and is a member of the Fidelity Management Committee (2003). Previously, Ms. Cronin served as Vice President of Finance of FMR (1997-1999), and Chief Financial Officer of FMR (1999-2001), Fidelity Personal Investments (2001), and Fidelity Brokerage Company (2001-2002). |
Robert L. Reynolds (52) |
| Year of Election or Appointment: 2003 Mr. Reynolds is a Director (2003) and Chief Operating Officer (2002) of FMR Corp. and is the head of the Fidelity Management Committee (2003). He also serves on the Board at Fidelity Investments Canada, Ltd. (2000). Previously, Mr. Reynolds served as President of Fidelity Investments Institutional Retirement Group (1996-2000). |
* Trustees have been determined to be "Interested Trustees" by virtue of, among other things, their affiliation with the trust or various entities under common control with FMR.
** Edward C. Johnson 3d, Trustee, is Abigail P. Johnson's father.
Annual Report
Trustees and Officers - continued
Non-Interested Trustees:
Correspondence intended for each non-interested Trustee (that is, the Trustees other than the Interested Trustees) may be sent to Fidelity Investments, P.O. Box 55235, Boston, Massachusetts 02205-5235.
Name, Age; Principal Occupation |
Dennis J. Dirks (56) |
| Year of Election or Appointment: 2005 Mr. Dirks also serves as a Trustee (2005) or Member of the Advisory Board (2004) of other investment companies advised by FMR. Prior to his retirement in May 2003, Mr. Dirks was Chief Operating Officer and a member of the Board of The Depository Trust & Clearing Corporation (DTCC) (1999-2003). He also served as President, Chief Operating Officer, and Board member of The Depository Trust Company (DTC) (1999-2003) and President and Board member of the National Securities Clearing Corporation (NSCC) (1999-2003). In addition, Mr. Dirks served as Chief Executive Officer and Board member of the Government Securities Clearing Corporation (2001-2003) and Chief Executive Officer and Board member of the Mortgage-Backed Securities Clearing Corporation (2001-2003). |
Robert M. Gates (61) |
| Year of Election or Appointment: 1997 Dr. Gates is Vice Chairman of the non-interested Trustees (2005). Dr. Gates is President of Texas A&M University (2002). He was Director of the Central Intelligence Agency (CIA) from 1991 to 1993. From 1989 to 1991, Dr. Gates served as Assistant to the President of the United States and Deputy National Security Advisor. Dr. Gates is a Director of NACCO Industries, Inc. (mining and manufacturing), Parker Drilling Co., Inc. (drilling and rental tools for the energy industry, 2001), and Brinker International (restaurant management, 2003). He also serves as a member of the Advisory Board of VoteHere.net (secure internet voting, 2001). Previously, Dr. Gates served as a Director of LucasVarity PLC (automotive components and diesel engines), a Director of TRW Inc. (automotive, space, defense, and information technology), and Dean of the George Bush School of Government and Public Service at Texas A&M University (1999-2001). Dr. Gates also is a Trustee of the Forum for International Policy. |
George H. Heilmeier (68) |
| Year of Election or Appointment: 2004 Dr. Heilmeier is Chairman Emeritus of Telcordia Technologies (communication software and systems), where prior to his retirement, he served as company Chairman and Chief Executive Officer. He currently serves on the Boards of Directors of The Mitre Corporation (systems engineering and information technology support for the government), INET Technologies Inc. (telecommunications network surveillance, 2001), Teletech Holdings (customer management services), and HRL Laboratories (private research and development, 2004). He is Chairman of the General Motors Technology Advisory Committee and a Life Fellow of the Institute of Electrical and Electronics Engineers (IEEE) (2000). Dr. Heilmeier is a member of the Defense Science Board and the National Security Agency Advisory Board. He is also a member of the National Academy of Engineering, the American Academy of Arts and Sciences, and the Board of Overseers of the School of Engineering and Applied Science of the University of Pennsylvania. Previously, Dr. Heilmeier served as a Director of TRW Inc. (automotive, space, defense, and information technology, 1992-2002), Compaq (1994-2002), and Automatic Data Processing, Inc. (ADP) (technology-based business outsourcing, 1995-2002). |
Marie L. Knowles (58) |
| Year of Election or Appointment: 2001 Prior to Ms. Knowles' retirement in June 2000, she served as Executive Vice President and Chief Financial Officer of Atlantic Richfield Company (ARCO) (diversified energy, 1996-2000). From 1993 to 1996, she was a Senior Vice President of ARCO and President of ARCO Transportation Company. She served as a Director of ARCO from 1996 to 1998. She currently serves as a Director of Phelps Dodge Corporation (copper mining and manufacturing) and McKesson Corporation (healthcare service, 2002). Ms. Knowles is a Trustee of the Brookings Institution and the Catalina Island Conservancy and also serves as a member of the Advisory Board for the School of Engineering of the University of Southern California. |
Ned C. Lautenbach (60) |
| Year of Election or Appointment: 2000 Mr. Lautenbach has been a partner of Clayton, Dubilier & Rice, Inc. (private equity investment firm) since September 1998. Previously, Mr. Lautenbach was with the International Business Machines Corporation (IBM) from 1968 until his retirement in 1998. He was most recently Senior Vice President and Group Executive of Worldwide Sales and Services. From 1993 to 1995, he was Chairman of IBM World Trade Corporation, and from 1994 to 1998 was a member of IBM's Corporate Executive Committee. Mr. Lautenbach serves as Co-Chairman and a Director of Covansys, Inc. (global provider of business and technology solutions, 2000). In addition, he is a Director of Italtel Holding S.p.A. (telecommunications (Milan, Italy), 2004) and Eaton Corporation (diversified industrial) as well as the Philharmonic Center for the Arts in Naples, Florida (1999). He also is a member of the Council on Foreign Relations. |
Marvin L. Mann (71) |
| Year of Election or Appointment: 1993 Mr. Mann is Chairman of the non-interested Trustees (2001). He is Chairman Emeritus of Lexmark International, Inc. (computer peripherals), where he served as CEO until April 1998, retired as Chairman May 1999, and remains a member of the Board. Prior to 1991, he held the positions of Vice President of International Business Machines Corporation (IBM) and President and General Manager of various IBM divisions and subsidiaries. He is a member of the Executive Committee of the Independent Director's Council of the Investment Company Institute. In addition, Mr. Mann is a member of the President's Cabinet at the University of Alabama and the Board of Visitors of the Culverhouse College of Commerce and Business Administration at the University of Alabama. |
William O. McCoy (71) |
| Year of Election or Appointment: 1997 Prior to his retirement in December 1994, Mr. McCoy was Vice Chairman of the Board of BellSouth Corporation (telecommunications) and President of BellSouth Enterprises. He is currently a Director of Liberty Corporation (holding company), Duke Realty Corporation (real estate), and Progress Energy, Inc. (electric utility). He is also a partner of Franklin Street Partners (private investment management firm) and a member of the Research Triangle Foundation Board. In addition, Mr. McCoy served as the Interim Chancellor (1999-2000) and a member of the Board of Visitors (1994-1998) for the University of North Carolina at Chapel Hill and currently serves on the Board of Directors of the University of North Carolina Health Care System and the Board of Visitors of the Kenan-Flagler Business School (University of North Carolina at Chapel Hill). He also served as Vice President of Finance for the University of North Carolina (16-school system, 1995-1998). |
Cornelia M. Small (60) |
| Year of Election or Appointment: 2005 Ms. Small is a member (2000) and Chairperson (2002) of the Investment Committee, and a member (2002) of the Board of Trustees of Smith College. Previously, she served as Chief Investment Officer (1999-2000), Director of Global Equity Investments (1996-1999), and a member of the Board of Directors of Scudder, Stevens & Clark (1990-1997) and Scudder Kemper Investments (1997-1998). In addition, Ms. Small served as Co-Chair (2000-2003) of the Annual Fund for the Fletcher School of Law and Diplomacy. |
William S. Stavropoulos (65) |
| Year of Election or Appointment: 2002 Mr. Stavropoulos is Chairman of the Board (2000), CEO (2002), a position he previously held from 1995-2000, Chairman of the Executive Committee (2000), and a Member of the Board of Directors of The Dow Chemical Company. Since joining The Dow Chemical Company in 1967, Mr. Stavropoulos served in numerous senior management positions, including President (1993-2000; 2002-2003). Currently, he is a Director of NCR Corporation (data warehousing and technology solutions), BellSouth Corporation (telecommunications), Chemical Financial Corporation, and Maersk Inc. (industrial conglomerate, 2002). He also serves as a member of the Board of Trustees of the American Enterprise Institute for Public Policy Research. In addition, Mr. Stavropoulos is a member of The Business Council, J.P. Morgan International Council and the University of Notre Dame Advisory Council for the College of Science. |
Kenneth L. Wolfe (65) |
| Year of Election or Appointment: 2005 Mr. Wolfe also serves as a Trustee (2005) or Member of the Advisory Board (2004) of other investment companies advised by FMR. Prior to his retirement in 2001, Mr. Wolfe was Chairman and Chief Executive Officer of Hershey Foods Corporation (1993-2001). He currently serves as a member of the boards of Adelphia Communications Corporation (2003), Bausch & Lomb, Inc., and Revlon Inc. (2004). |
Annual Report
Trustees and Officers - continued
Advisory Board Member and Executive Officers:
Correspondence intended for each executive officer and Mr. Lynch may be sent to Fidelity Investments, 82 Devonshire Street, Boston, Massachusetts 02109.
Name, Age; Principal Occupation |
Peter S. Lynch (61) |
| Year of Election or Appointment: 2003 Member of the Advisory Board of Variable Insurance Products Fund. Vice Chairman and a Director of FMR, and Vice Chairman (2001) and a Director (2000) of FMR Co., Inc. Previously, Mr. Lynch served as a Trustee of the Fidelity funds (1990-2003). Prior to May 31, 1990, he was a Director of FMR and Executive Vice President of FMR (a position he held until March 31, 1991), Vice President of Fidelity® Magellan® Fund and FMR Growth Group Leader, and Managing Director of FMR Corp. Mr. Lynch was also Vice President of Fidelity Investments Corporate Services. In addition, he serves as a Trustee of Boston College, Massachusetts Eye & Ear Infirmary, Historic Deerfield, John F. Kennedy Library, and the Museum of Fine Arts of Boston. |
Dwight D. Churchill (51) |
| Year of Election or Appointment: 2000 Vice President of VIP Money Market. He serves as Head of Fidelity's Fixed-Income Division (2000), Vice President of Fidelity's Money Market Funds (2000), Vice President of Fidelity's Bond Funds (1997), and Senior Vice President of FIMM (2000) and FMR (1997). Mr. Churchill joined Fidelity in 1993 as Vice President and Group Leader of Taxable Fixed-Income Investments. |
David L. Murphy (56) |
| Year of Election or Appointment: 2002 Vice President of VIP Money Market. Mr. Murphy also serves as Vice President of Fidelity's Money Market Funds (2002) and Vice President of certain Asset Allocation Funds (2003). He serves as Senior Vice President (2000) and Money Market Group Leader (2002) of the Fidelity Investments Fixed Income Division. Mr. Murphy is also a Senior Vice President of FIMM (2003) and a Vice President of FMR (2000). Previously, Mr. Murphy served as Bond Group Leader (2000-2002) and Vice President of Fidelity's Taxable Bond Funds (2000-2002) and Fidelity's Municipal Bond Funds (2001-2002). Mr. Murphy joined Fidelity in 1989 as a portfolio manager in the Bond Group. |
James K. Miller (41) |
| Year of Election or Appointment: 2003 Vice President of VIP Money Market. Mr. Miller also serves as Vice President of other funds advised by FMR. Prior to assuming his current responsibilities, Mr. Miller worked as a taxable credit analyst and manager. |
Eric D. Roiter (56) |
| Year of Election or Appointment: 2000 Secretary of VIP Money Market. He also serves as Secretary of other Fidelity funds; Vice President, General Counsel, and Secretary of FMR Co., Inc. (2001-present) and FMR; Vice President and Secretary of FDC; Assistant Secretary of Fidelity Management & Research (U.K.) Inc. (2001-present), Fidelity Management & Research (Far East) Inc. (2001-present), and Fidelity Investments Money Management, Inc. (2001-present). Mr. Roiter is an Adjunct Member, Faculty of Law, at Boston College Law School (2003-present). |
Stuart Fross (45) |
| Year of Election or Appointment: 2003 Assistant Secretary of VIP Money Market. Mr. Fross also serves as Assistant Secretary of other Fidelity funds (2003) and is an employee of FMR. |
Christine Reynolds (46) |
| Year of Election or Appointment: 2004 President, Treasurer, and Anti-Money Laundering (AML) officer of VIP Money Market. Ms. Reynolds also serves as President, Treasurer, and AML officer of other Fidelity funds (2004) and is a Vice President (2003) and an employee (2002) of FMR. Before joining Fidelity Investments, Ms. Reynolds worked at PricewaterhouseCoopers LLP (PwC) (1980-2002), where she was most recently an audit partner with PwC's investment management practice. |
Timothy F. Hayes (54) |
| Year of Election or Appointment: 2002 Chief Financial Officer of VIP Money Market. Mr. Hayes also serves as Chief Financial Officer of other Fidelity funds (2002). Recently he was appointed President of Fidelity Service Company (2003) where he also serves as a Director. Mr. Hayes also serves as President of Fidelity Investments Operations Group (FIOG, 2002), which includes Fidelity Pricing and Cash Management Services Group (FPCMS), where he was appointed President in 1998. Previously, Mr. Hayes served as Chief Financial Officer of Fidelity Investments Corporate Systems and Service Group (1998) and Fidelity Systems Company (1997-1998). |
Kenneth A. Rathgeber (57) |
| Year of Election or Appointment: 2004 Chief Compliance Officer of VIP Money Market. Mr. Rathgeber also serves as Chief Compliance Officer of other Fidelity funds (2004) and Executive Vice President of Risk Oversight for Fidelity Investments (2002). Previously, he served as Executive Vice President and Chief Operating Officer for Fidelity Investments Institutional Services Company, Inc. (1998-2002). |
John R. Hebble (46) |
| Year of Election or Appointment: 2003 Deputy Treasurer of VIP Money Market. Mr. Hebble also serves as Deputy Treasurer of other Fidelity funds (2003), and is an employee of FMR. Before joining Fidelity Investments, Mr. Hebble worked at Deutsche Asset Management where he served as Director of Fund Accounting (2002-2003) and Assistant Treasurer of the Scudder Funds (1998-2003). |
Kimberley H. Monasterio (41) |
| Year of Election or Appointment: 2004 Deputy Treasurer of VIP Money Market. Ms. Monasterio also serves as Deputy Treasurer of other Fidelity funds (2004) and is an employee of FMR (2004). Before joining Fidelity Investments, Ms. Monasterio served as Treasurer (2000-2004) and Chief Financial Officer (2002-2004) of the Franklin Templeton Funds and Senior Vice President of Franklin Templeton Services, LLC (2000-2004). |
John H. Costello (58) |
| Year of Election or Appointment: 1986 Assistant Treasurer of VIP Money Market. Mr. Costello also serves as Assistant Treasurer of other Fidelity funds and is an employee of FMR. |
Peter L. Lydecker (50) |
| Year of Election or Appointment: 2004 Assistant Treasurer of VIP Money Market. Mr. Lydecker also serves as Assistant Treasurer of other Fidelity funds (2004) and is an employee of FMR. |
Mark Osterheld (49) |
| Year of Election or Appointment: 2002 Assistant Treasurer of VIP Money Market. Mr. Osterheld also serves as Assistant Treasurer of other Fidelity funds (2002) and is an employee of FMR. |
Kenneth B. Robins (35) |
| Year of Election or Appointment: 2004 Assistant Treasurer of VIP Money Market. Mr. Robins also serves as Assistant Treasurer of other Fidelity funds (2004) and is an employee of FMR (2004). Before joining Fidelity Investments, Mr. Robins worked at KPMG LLP, where he was a partner in KPMG's department of professional practice (2002-2004) and a Senior Manager (1999-2000). In addition, Mr. Robins served as Assistant Chief Accountant, United States Securities and Exchange Commission (2000-2002). |
Annual Report
Proxy Voting Results
A special meeting of the fund's shareholders was held on December 14, 2004. The results of votes taken among shareholders on proposals before them are reported below. Each vote reported represents one dollar of net asset value held on the record date for the meeting.
PROPOSAL 1 |
To amend the Declaration of Trust to allow the Board of Trustees, if permitted by applicable law, to authorize fund mergers without shareholder approval. A |
| # of
Votes | % of
Votes |
Affirmative | 15,331,508,529.96 | 81.853 |
Against | 2,429,553,894.02 | 12.972 |
Abstain | 969,378,618.94 | 5.175 |
TOTAL | 18,730,441,042.92 | 100.000 |
PROPOSAL 2 |
To elect a Board of Trustees. A |
| # of
Votes | % of
Votes |
J. Michael Cook |
Affirmative | 17,770,642,454.98 | 94.876 |
Withheld | 959,798,587.94 | 5.124 |
TOTAL | 18,730,441,042.92 | 100.000 |
Ralph F. Cox |
Affirmative | 17,759,356,374.26 | 94.815 |
Withheld | 971,084,668.66 | 5.185 |
TOTAL | 18,730,441,042.92 | 100.000 |
Laura B. Cronin |
Affirmative | 17,797,888,742.24 | 95.021 |
Withheld | 932,552,300.68 | 4.979 |
TOTAL | 18,730,441,042.92 | 100.000 |
Dennis J. DirksB |
Affirmative | 17,802,602,074.45 | 95.046 |
Withheld | 927,838,968.47 | 4.954 |
TOTAL | 18,730,441,042.92 | 100.000 |
Robert M. Gates |
Affirmative | 17,784,855,823.58 | 94.952 |
Withheld | 945,585,219.34 | 5.048 |
TOTAL | 18,730,441,042.92 | 100.000 |
George H. Heilmeier |
Affirmative | 17,768,875,556.56 | 94.866 |
Withheld | 961,565,486.36 | 5.134 |
TOTAL | 18,730,441,042.92 | 100.000 |
Abigail P. Johnson |
Affirmative | 17,781,929,073.06 | 94.936 |
Withheld | 948,511,969.86 | 5.064 |
TOTAL | 18,730,441,042.92 | 100.000 |
Edward C. Johnson 3d |
Affirmative | 17,752,140,336.45 | 94.777 |
Withheld | 978,300,706.47 | 5.223 |
TOTAL | 18,730,441,042.92 | 100.000 |
Donald J. Kirk |
Affirmative | 17,772,467,361.45 | 94.885 |
Withheld | 957,973,681.47 | 5.115 |
TOTAL | 18,730,441,042.92 | 100.000 |
| # of
Votes | % of
Votes |
Marie L. Knowles |
Affirmative | 17,776,922,254.30 | 94.909 |
Withheld | 953,518,788.62 | 5.091 |
TOTAL | 18,730,441,042.92 | 100.000 |
Ned C. Lautenbach |
Affirmative | 17,804,221,564.95 | 95.055 |
Withheld | 926,219,477.97 | 4.945 |
TOTAL | 18,730,441,042.92 | 100.000 |
Marvin L. Mann |
Affirmative | 17,763,277,607.06 | 94.836 |
Withheld | 967,163,435.86 | 5.164 |
TOTAL | 18,730,441,042.92 | 100.000 |
William O. McCoy |
Affirmative | 17,758,560,162.11 | 94.811 |
Withheld | 971,880,880.81 | 5.189 |
TOTAL | 18,730,441,042.92 | 100.000 |
Robert L. Reynolds |
Affirmative | 17,806,026,904.06 | 95.065 |
Withheld | 924,414,138.86 | 4.935 |
TOTAL | 18,730,441,042.92 | 100.000 |
Cornelia M. SmallB |
Affirmative | 17,798,878,892.31 | 95.026 |
Withheld | 931,562,150.61 | 4.974 |
TOTAL | 18,730,441,042.92 | 100.000 |
William S. Stavropoulos |
Affirmative | 17,786,496,107.78 | 94.960 |
Withheld | 943,944,935.14 | 5.040 |
TOTAL | 18,730,441,042.92 | 100.000 |
PROPOSAL 10 |
To amend the fund's fundamental investment limitation concerning lending. |
| # of
Votes | % of
Votes |
Affirmative | 1,322,266,118.44 | 88.289 |
Against | 69,140,366.32 | 4.617 |
Abstain | 106,243,856.98 | 7.094 |
TOTAL | 1,497,650,341.74 | 100.000 |
A Denotes trust-wide proposals and voting results. B Effective January 1, 2005. |
Money Market Portfolio
Annual Report
Investment Adviser
Fidelity Management & Research Company
Boston, MA
Investment Sub-Adviser
Fidelity Investments Money Management, Inc.
Fidelity International Investment Advisors
Fidelity International Investment Advisors (U.K.) Limited
General Distributor
Fidelity Distributors Corporation
Boston, MA
Transfer and Shareholder Servicing Agent
Fidelity Investments Institutional Operations Co., Inc.
Boston, MA
Custodian
The Bank of New York
New York, NY
VIPMM-ANN-0205
1.701157.107
Fidelity® Variable Insurance Products:
Overseas Portfolio
Annual Report
December 31, 2004
(2_fidelity_logos) (Registered_Trademark)
Contents
Performance | 3 | How the fund has done over time. |
Management's Discussion | 4 | The manager's review of fund performance, strategy and outlook. |
Shareholder Expense Example | 5 | An example of shareholder expenses. |
Investment Summary | 6 | A summary of the fund's investments at period end. |
Investments | 7 | A complete list of the fund's investments with their
market values. |
Financial Statements | 10 | Statements of assets and liabilities, operations, and
changes in net assets, as well as financial highlights. |
Notes | 15 | Notes to the financial statements. |
Report of Independent Registered Public Accounting Firm | 19 | |
Trustees and Officers | 20 | |
Distributions | 25 | |
Proxy Voting Results | 26 | |
To view a fund's proxy voting guidelines and proxy voting record for the 12-month period ended June 30, visit www.fidelity.com/proxyvotingresults or visit the Securities and Exchange Commission's (SEC) web site at www.sec.gov. You may also call 1-800-544-5429 to request a free copy of the proxy voting guidelines.
Fidelity Variable Insurance Products are separate account options which are purchased through a variable insurance contract.
Standard & Poor's, S&P and S&P 500 are registered service marks of The McGraw-Hill Companies, Inc. and have been licensed for use by Fidelity Distributors Corporation.
Other third party marks appearing herein are the property of their respective owners.
All other marks appearing herein are registered or unregistered trademarks or service marks of FMR Corp. or an affiliated company.
(Recycle graphic) This report is printed on recycled paper using soy-based inks.
This report and the financial statements contained herein are submitted for the general information of the shareholders of the fund. This report is not authorized for distribution to prospective investors in the fund unless preceded or accompanied by an effective prospectus.
A fund files its complete schedule of portfolio holdings with the SEC for the first and third quarters of each fiscal year on Form N-Q. Forms N-Q are available on the SEC's web site at http://www.sec.gov. A fund's Forms N-Q may be reviewed and copied at the SEC's Public Reference Room in Washington, DC. Information regarding the operation of the SEC's Public Reference Room may be obtained by calling 1-800-SEC-0330. For a complete list of a fund's portfolio holdings, view the most recent quarterly holdings report, semiannual report, or annual report on Fidelity's web site at http://www.advisor.fidelity.com.
NOT FDIC INSURED · MAY LOSE VALUE · NO BANK GUARANTEE
Neither the fund nor Fidelity Distributors Corporation is a bank.
Overseas Portfolio
Fidelity Variable Insurance Products: Overseas Portfolio
Performance: The Bottom Line
Average annual total return reflects the change in the value of an investment, assuming reinvestment of a class' dividend income and capital gains (the profits earned upon the sale of securities that have grown in value) and assuming a constant rate of performance each year. During periods of reimbursement by Fidelity, a fund's total return will be greater than it would be had the reimbursement not occurred. Performance numbers are net of all underlying fund operating expenses, but do not include any insurance charges imposed by your insurance company's separate account. If performance information included the effect of these additional charges, the total returns would be lower. How a fund did yesterday is no guarantee of how it will do tomorrow.
Average Annual Total Returns
Periods ended December 31, 2004 | Past 1
year | Past 5
years | Past 10
years |
Fidelity® VIP: Overseas - Initial Class | 13.57% | -3.71% | 6.31% |
Fidelity VIP: Overseas - Service Class A | 13.49% | -3.80% | 6.24% |
Fidelity VIP: Overseas - Service Class 2 B | 13.31% | -3.89% | 6.19% |
A The initial offering of Service Class shares took place on November 3, 1997. Performance for Service Class shares reflects an asset-based distribution fee (12b-1 fee), and returns prior to November 3, 1997 are those of Initial Class and do not include the effects of Service Class' 12b-1 fee. Had Service Class shares' 12b-1 fee been reflected, returns prior to November 3, 1997 would have been lower.
B The initial offering of Service Class 2 shares took place on January 12, 2000. Performance for Service Class 2 shares reflects an asset-based distribution fee (12b-1 fee). Returns from November 3, 1997 to January 12, 2000 are those of Service Class which reflect a different 12b-1 fee. Service Class 2 returns prior to November 3, 1997 are those of Initial Class, and do not include the effects of a 12b-1 fee. Had Service Class 2 shares' 12b-1 fee been reflected, returns prior to January 12, 2000 would have been lower.
$10,000 Over 10 Years
Let's say hypothetically that $10,000 was invested in Fidelity® Variable Insurance Products: Overseas Portfolio - Initial Class on December 31, 1994. The chart shows how the value of your investment would have changed, and also shows how the MSCI® EAFE Index performed over the same period.

Annual Report
Fidelity Variable Insurance Products: Overseas Portfolio
Management's Discussion of Fund Performance
Comments from Rick Mace, Portfolio Manager of Fidelity® Variable Insurance Products: Overseas Portfolio
Most of the world's major stock markets posted solid gains for the year ending December 31, 2004. The Morgan Stanley Capital InternationalSM Europe, Australasia, Far East (MSCI® EAFE®) Index - designed to represent the performance of developed stock markets outside the United States and Canada - gained 20.42%, compared to 10.88% for the Standard & Poor's 500SM Index. A weak U.S. dollar relative to most foreign currencies was partly responsible for the performance disparity. On a regional basis, Europe was one of the top performers. Many investors felt European stocks offered better valuations and brighter earnings prospects than U.S. equities. Latin American countries, many of which are exporters of oil and raw materials that received strong support from high commodity prices, also did well. Conversely, Japan underperformed, as early optimism was eroded by disappointing economic indicators and concerns about the impact of China's economic slowdown on exports. Meanwhile, some Asian emerging markets, such as Taiwan and Indonesia, suffered from a deceleration in corporate capital spending.
For the one-year period ending December 31, 2004, the return of Overseas Portfolio trailed the advances of both the MSCI EAFE index and the
LipperSM Variable Annuity International Funds Average, the latter of which rose 18.20%. The fund's overweighting in two poor-performing market groups - semiconductors and diversified financials - caused the bulk of its performance shortfall relative to the index. Notable detractors included semiconductor equipment manufacturers Tokyo Electron, Netherlands-based ASML Holding and Taiwanese chip maker United Microelectronics, as well as Japanese brokerage stocks Nikko Cordial and Nomura Holdings. The semiconductor industry was the worst-performing component of the index during the past 12 months. On the positive side of the ledger, overweighting strong-performing energy stocks relative to the index was helpful. France-based energy producer Total SA and Canada's Talisman Energy were noteworthy standouts for the fund. Elsewhere, overweighting a couple of strong-performing stocks in the telecommunication services sector helped offset some of the fund's weakness in other areas. Specifically, holdings in U.K.-based mobile communications provider mmO2 and Germany-based Deutsche Telekom performed quite well.
The views expressed in this statement reflect those of the portfolio manager only through the end of the period of the report as stated on the cover and do not necessarily represent the views of Fidelity or any other person in the Fidelity organization. Any such views are subject to change at any time based upon market or other conditions and Fidelity disclaims any responsibility to update such views. These views may not be relied on as investment advice and, because investment decisions for a Fidelity fund are based on numerous factors, may not be relied on as an indication of trading intent on behalf of any Fidelity fund.
Overseas Portfolio
Fidelity Variable Insurance Products: Overseas Portfolio
Shareholder Expense Example
As a shareholder of the Fund, you incur two types of costs: (1) transaction costs, including redemption fees, and (2) ongoing costs, including management fees, distribution and/or service (12b-1) fees and other Fund expenses. This Example is intended to help you understand your ongoing costs (in dollars) of investing in the Fund and to compare these costs with the ongoing costs of investing in other mutual funds.
The Example is based on an investment of $1,000 invested at the beginning of the period and held for the entire period (July 1, 2004 to December 31, 2004).
Actual Expenses
The first line of the table below for each class of the Fund provides information about actual account values and actual expenses. You may use the information in this line, together with the amount you invested, to estimate the expenses that you paid over the period. Simply divide your account value by $1,000.00 (for example, an $8,600 account value divided by $1,000.00 = 8.6), then multiply the result by the number in the first line for a class of the Fund under the heading entitled "Expenses Paid During Period" to estimate the expenses you paid on your account during this period. The estimate of expenses does not include any fees or other expenses of any variable annuity or variable life insurance product. If they were, the estimate of expenses you paid during the period would have been higher, and your ending account value would be lower.
Hypothetical Example for Comparison Purposes
The second line of the table below for each class of the Fund provides information about hypothetical account values and hypothetical expenses based on a Class' actual expense ratio and an assumed rate of return of 5% per year before expenses, which is not the Class' actual return. The hypothetical account values and expenses may not be used to estimate the actual ending account balance or expenses you paid for the period. You may use this information to compare the ongoing costs of investing in the Fund and other funds. To do so, compare this 5% hypothetical example with the 5% hypothetical examples that appear in the shareholder reports of the other funds. The estimate of expenses does not include any fees or other expenses of any variable annuity or variable life insurance product. If they were, the estimate of expenses you paid during the period would have been higher, and your ending account value would be lower.
Please note that the expenses shown in the table are meant to highlight your ongoing costs only and do not reflect any transaction costs. Therefore, the second line of the table is useful in comparing ongoing costs only, and will not help you determine the relative total costs of owning different funds. In addition, if these transactional costs were included, your costs would have been higher.
| Beginning
Account Value
July 1, 2004 | Ending
Account Value
December 31, 2004 | Expenses Paid
During Period *
July 1, 2004
to December 31, 2004 |
Initial Class | | | |
Actual | $ 1,000.00 | $ 1,124.60 | $ 4.97 |
Hypothetical A | $ 1,000.00 | $ 1,020.46 | $ 4.72 |
Service Class | | | |
Actual | $ 1,000.00 | $ 1,123.70 | $ 5.50 |
Hypothetical A | $ 1,000.00 | $ 1,019.96 | $ 5.23 |
Service Class 2 | | | |
Actual | $ 1,000.00 | $ 1,123.40 | $ 6.30 |
Hypothetical A | $ 1,000.00 | $ 1,019.20 | $ 5.99 |
Initial Class R | | | |
Actual | $ 1,000.00 | $ 1,124.80 | $ 4.97 |
Hypothetical A | $ 1,000.00 | $ 1,020.46 | $ 4.72 |
Service Class R | | | |
Actual | $ 1,000.00 | $ 1,124.50 | $ 5.50 |
Hypothetical A | $ 1,000.00 | $ 1,019.96 | $ 5.23 |
Service Class 2R | | | |
Actual | $ 1,000.00 | $ 1,123.40 | $ 6.30 |
Hypothetical A | $ 1,000.00 | $ 1,019.20 | $ 5.99 |
A 5% return per year before expenses
*Expenses are equal to each Class' annualized expense ratio (shown in the table below); multiplied by the average account value over the period, multiplied by 184/366 (to reflect the one-half year period).
| Annualized
Expense Ratio | |
Initial Class | .93% | |
Service Class | 1.03% | |
Service Class 2 | 1.18% | |
Initial Class R | .93% | |
Service Class R | 1.03% | |
Service Class 2R | 1.18% | |
Annual Report
Fidelity Variable Insurance Products: Overseas Portfolio
Investment Summary
Top Five Stocks as of December 31, 2004 |
| % of fund's
net assets |
Vodafone Group PLC (United Kingdom) | 4.4 |
Allianz AG (Reg.) (Germany) | 3.4 |
ASML Holding NV (Netherlands) | 3.2 |
Total SA Series B (France) | 2.7 |
UBS AG (Reg.) (Switzerland) | 2.5 |
| 16.2 |
Top Five Market Sectors as of December 31, 2004 |
| % of fund's
net assets |
Financials | 29.6 |
Information Technology | 18.9 |
Telecommunication Services | 9.5 |
Consumer Discretionary | 8.8 |
Health Care | 7.9 |
Top Five Countries as of December 31, 2004 |
(excluding cash equivalents) | % of fund's
net assets |
Japan | 18.3 |
United Kingdom | 14.6 |
France | 10.2 |
Germany | 10.0 |
Switzerland | 9.2 |
Overseas Portfolio
Fidelity Variable Insurance Products: Overseas Portfolio
Investments December 31, 2004
Showing Percentage of Net Assets
Common Stocks - 95.5% |
| Shares | | Value (Note 1) |
Australia - 0.7% |
CSL Ltd. | 698,840 | | $ 15,993,093 |
Belgium - 0.4% |
Fortis | 316,000 | | 8,723,430 |
Brazil - 3.0% |
Aracruz Celulose SA sponsored ADR | 291,400 | | 10,985,780 |
Banco Bradesco SA sponsored ADR (non-vtg.) | 489,000 | | 12,254,340 |
Banco Itau Holding Financeira SA sponsored ADR (non-vtg.) | 133,900 | | 10,065,263 |
Tele Norte Leste Participacoes SA ADR (non-vtg.) | 473,600 | | 7,989,632 |
Uniao de Bancos Brasileiros SA (Unibanco) GDR | 355,000 | | 11,260,600 |
Usinas Siderurgicas de Minas Gerais SA (Usiminas) (PN-A) | 391,900 | | 7,944,238 |
Votorantim Celulose e Papel SA sponsored ADR (non-vtg.) | 637,250 | | 10,323,450 |
TOTAL BRAZIL | | 70,823,303 |
Canada - 2.7% |
Alcan, Inc. | 165,700 | | 8,119,300 |
EnCana Corp. | 289,500 | | 16,501,500 |
Research In Motion Ltd. (a) | 224,600 | | 18,488,323 |
Talisman Energy, Inc. | 691,300 | | 18,636,296 |
Tembec, Inc. (a) | 304,500 | | 1,829,537 |
TOTAL CANADA | | 63,574,956 |
China - 0.6% |
BYD Co. Ltd. (H Shares) | 683,600 | | 1,811,723 |
China Telecom Corp. Ltd. sponsored ADR | 200,280 | | 7,370,304 |
Global Bio-Chem Technology Group Co. Ltd. | 6,618,000 | | 4,342,296 |
Global Bio-Chem Technology Group Co. Ltd. warrants 5/31/07 (a) | 516,250 | | 24,574 |
People's Food Holdings Ltd. | 1,700,000 | | 1,562,404 |
TOTAL CHINA | | 15,111,301 |
Denmark - 0.7% |
Coloplast AS Series B (d) | 54,400 | | 2,981,651 |
Danske Bank AS | 163,300 | | 4,996,457 |
Novo Nordisk AS Series B | 162,100 | | 8,840,313 |
TOTAL DENMARK | | 16,818,421 |
Finland - 1.9% |
Nokia Corp. | 2,829,150 | | 44,332,780 |
France - 10.2% |
Accor SA | 203,282 | | 8,882,300 |
Alcatel SA sponsored ADR (a) | 1,655,300 | | 25,872,339 |
AXA SA | 710,604 | | 17,587,449 |
BNP Paribas SA | 376,602 | | 27,229,874 |
Credit Agricole SA | 113,400 | | 3,415,087 |
Dassault Systemes SA | 113,914 | | 5,733,064 |
France Telecom SA | 472,561 | | 15,632,318 |
L'Oreal SA | 81,395 | | 6,166,755 |
|
| Shares | | Value (Note 1) |
Lagardere S.C.A. (Reg.) | 41,700 | | $ 3,003,768 |
Pernod-Ricard | 95,000 | | 14,523,903 |
Sanofi-Aventis sponsored ADR | 518,200 | | 20,753,910 |
Thomson SA | 240,300 | | 6,340,291 |
Total SA Series B | 287,300 | | 63,114,064 |
Vivendi Universal SA sponsored ADR (a) | 777,500 | | 24,934,425 |
TOTAL FRANCE | | 243,189,547 |
Germany - 10.0% |
Allianz AG (Reg.) | 603,400 | | 80,191,858 |
BASF AG | 298,725 | | 21,514,175 |
Bayerische Hypo-und Vereinsbank AG (a) | 454,900 | | 10,305,480 |
Deutsche Boerse AG | 240,939 | | 14,472,732 |
Deutsche Telekom AG sponsored ADR (a) | 2,104,700 | | 47,734,596 |
E.ON AG | 72,544 | | 6,601,504 |
Infineon Technologies AG sponsored ADR (a) | 893,900 | | 9,743,510 |
RWE AG | 164,060 | | 9,058,013 |
SAP AG sponsored ADR | 304,400 | | 13,457,524 |
Siemens AG sponsored ADR | 289,400 | | 24,503,498 |
TOTAL GERMANY | | 237,582,890 |
Hong Kong - 1.5% |
Esprit Holdings Ltd. | 850,500 | | 5,142,741 |
Hong Kong Exchanges & Clearing Ltd. | 1,952,000 | | 5,223,549 |
Hutchison Whampoa Ltd. | 950,600 | | 8,897,199 |
Techtronic Industries Co. Ltd. | 6,544,000 | | 14,270,379 |
Television Broadcasts Ltd. | 734,000 | | 3,408,990 |
TOTAL HONG KONG | | 36,942,858 |
India - 2.9% |
Cipla Ltd. | 1,160,697 | | 8,528,775 |
Dr. Reddy's Laboratories Ltd. | 151,900 | | 3,039,229 |
HDFC Bank Ltd. | 176,031 | | 2,117,867 |
Housing Development Finance Corp. Ltd. | 1,107,583 | | 19,694,490 |
Infosys Technologies Ltd. | 346,252 | | 16,745,787 |
Reliance Industries Ltd. | 367,900 | | 4,539,843 |
Satyam Computer Services Ltd. | 1,219,887 | | 11,571,298 |
State Bank of India | 179,400 | | 2,933,242 |
TOTAL INDIA | | 69,170,531 |
Italy - 0.9% |
ENI Spa | 880,486 | | 22,160,072 |
Japan - 18.3% |
Advantest Corp. | 221,800 | | 19,033,701 |
Aeon Co. Ltd. | 929,400 | | 15,515,709 |
Canon, Inc. | 221,500 | | 12,018,590 |
Daiwa Securities Group, Inc. | 2,814,000 | | 20,329,591 |
FamilyMart Co. Ltd. | 276,700 | | 8,063,551 |
Honda Motor Co. Ltd. | 260,800 | | 13,592,896 |
Ito Yokado Ltd. | 327,300 | | 13,740,018 |
JAFCO Co. Ltd. | 247,800 | | 16,837,724 |
Mizuho Financial Group, Inc. | 6,790 | | 34,205,214 |
Common Stocks - continued |
| Shares | | Value (Note 1) |
Japan - continued |
Murata Manufacturing Co. Ltd. | 229,700 | | $ 12,849,566 |
Nikko Cordial Corp. | 5,323,000 | | 28,218,189 |
Nitto Denko Corp. | 263,200 | | 14,440,926 |
Nomura Holdings, Inc. | 2,127,000 | | 30,969,121 |
ORIX Corp. | 92,700 | | 12,597,716 |
Ricoh Co. Ltd. | 608,000 | | 11,735,000 |
Rohm Co. Ltd. | 108,600 | | 11,238,505 |
Softbank Corp. (d) | 362,100 | | 17,640,135 |
Sumitomo Electric Industries Ltd. | 852,000 | | 9,274,432 |
Sumitomo Mitsui Financial Group, Inc. (d) | 5,585 | | 40,621,157 |
TDK Corp. | 135,900 | | 10,070,107 |
Tokyo Electron Ltd. | 469,700 | | 28,934,951 |
Toyota Motor Corp. | 875,800 | | 35,850,874 |
UFJ Holdings, Inc. (a) | 1,980 | | 12,004,101 |
Yahoo! Japan Corp. (a) | 1,334 | | 6,407,576 |
TOTAL JAPAN | | 436,189,350 |
Korea (South) - 3.5% |
Honam Petrochemical Corp. | 358,630 | | 16,750,157 |
Hyundai Motor Co. | 66,243 | | 3,551,475 |
Kookmin Bank (a) | 323,810 | | 12,668,379 |
LG Electronics, Inc. | 360,200 | | 22,303,731 |
LG Petrochemical Co. Ltd. | 178,050 | | 4,471,890 |
Samsung Electro-Mechanics Co. Ltd. (a) | 183,200 | | 4,601,237 |
Samsung Electronics Co. Ltd. | 21,660 | | 9,426,035 |
Shinhan Financial Group Co. Ltd. | 414,900 | | 9,378,536 |
TOTAL KOREA (SOUTH) | | 83,151,440 |
Netherlands - 7.1% |
Aegon NV | 1,385,500 | | 18,851,385 |
ASML Holding NV (a)(d) | 4,718,139 | | 75,065,591 |
EADS NV | 355,600 | | 10,318,305 |
ING Groep NV (Certificaten Van Aandelen) | 926,624 | | 28,030,376 |
Unilever NV (NY Shares) | 154,100 | | 10,280,011 |
VNU NV | 547,525 | | 16,139,850 |
Wolters Kluwer NV (Certificaten Van Aandelen) | 514,275 | | 10,304,139 |
TOTAL NETHERLANDS | | 168,989,657 |
Spain - 2.4% |
Banco Bilbao Vizcaya Argentaria SA | 840,600 | | 14,912,242 |
Banco Santander Central Hispano SA | 1,208,868 | | 14,953,697 |
Telefonica SA | 1,446,462 | | 27,241,701 |
TOTAL SPAIN | | 57,107,640 |
Sweden - 0.7% |
Telefonaktiebolaget LM Ericsson ADR (a) | 521,800 | | 16,431,482 |
Switzerland - 9.2% |
ABB Ltd. (Reg.) (a) | 1,551,851 | | 8,648,255 |
Actelion Ltd. (Reg.) (a) | 22,893 | | 2,346,661 |
Compagnie Financiere Richemont unit | 312,115 | | 10,367,768 |
|
| Shares | | Value (Note 1) |
Credit Suisse Group (Reg.) | 1,331,669 | | $ 56,183,115 |
Nestle SA (Reg.) | 32,100 | | 8,381,017 |
Novartis AG (Reg.) | 792,392 | | 40,047,492 |
Phonak Holding AG | 170,412 | | 5,608,364 |
Roche Holding AG (participation certificate) | 227,849 | | 26,035,315 |
Societe Generale de Surveillance Holding SA (SGS) (Reg.) | 4,450 | | 3,110,645 |
UBS AG (Reg.) | 696,987 | | 58,435,390 |
TOTAL SWITZERLAND | | 219,164,022 |
Taiwan - 2.8% |
Acer, Inc. | 2,269,000 | | 3,747,169 |
Hon Hai Precision Industries Co. Ltd. | 2,110,109 | | 9,757,346 |
Quanta Computer, Inc. | 2,972,260 | | 5,329,312 |
Taiwan Semiconductor Manufacturing Co. Ltd. | 5,715,000 | | 9,078,562 |
Taiwan Semiconductor Manufacturing Co. Ltd. sponsored ADR | 727,900 | | 6,179,871 |
United Microelectronics Corp. | 39,939,360 | | 25,755,171 |
United Microelectronics Corp. sponsored ADR | 796,300 | | 2,810,939 |
Yageo Corp. (a) | 9,414,000 | | 3,375,892 |
TOTAL TAIWAN | | 66,034,262 |
United Kingdom - 14.6% |
3i Group PLC | 663,873 | | 8,484,877 |
AstraZeneca PLC (United Kingdom) | 497,100 | | 18,089,469 |
BHP Billiton PLC | 1,008,495 | | 11,815,326 |
BP PLC | 4,252,306 | | 41,389,112 |
British Sky Broadcasting Group PLC (BSkyB) | 631,200 | | 6,807,531 |
Carphone Warehouse Group PLC | 1,559,814 | | 5,141,098 |
Hilton Group PLC | 996,000 | | 5,437,858 |
HSBC Holdings PLC (United Kingdom) (Reg.) | 2,564,190 | | 43,663,027 |
ITV PLC | 4,352,554 | | 8,791,289 |
Kesa Electricals PLC | 1,433,748 | | 7,772,801 |
Man Group PLC | 611,067 | | 17,261,675 |
Prudential PLC | 1,160 | | 10,084 |
Reckitt Benckiser PLC | 331,800 | | 10,022,300 |
Rio Tinto PLC (Reg.) | 782,606 | | 23,323,615 |
Smith & Nephew PLC | 1,796,100 | | 18,593,227 |
Tesco PLC | 1,548,141 | | 9,559,064 |
Vodafone Group PLC | 38,147,725 | | 104,448,467 |
Xstrata PLC | 367,500 | | 6,572,938 |
TOTAL UNITED KINGDOM | | 347,183,758 |
United States of America - 1.4% |
Freeport-McMoRan Copper & Gold, Inc. Class B | 344,900 | | 13,185,527 |
Common Stocks - continued |
| Shares | | Value (Note 1) |
United States of America - continued |
Synthes, Inc. | 77,867 | | $ 8,713,013 |
Telewest Global, Inc. (a) | 724,379 | | 12,734,583 |
TOTAL UNITED STATES OF AMERICA | | 34,633,123 |
TOTAL COMMON STOCKS (Cost $1,721,420,863) | 2,273,307,916 |
Money Market Funds - 5.6% |
| | | |
Fidelity Cash Central Fund, 2.24% (b) | 82,926,736 | | 82,926,736 |
Fidelity Securities Lending Cash Central Fund, 2.23% (b)(c) | 49,646,431 | | 49,646,431 |
TOTAL MONEY MARKET FUNDS (Cost $132,573,167) | 132,573,167 |
TOTAL INVESTMENT PORTFOLIO - 101.1% (Cost $1,853,994,030) | | 2,405,881,083 |
NET OTHER ASSETS - (1.1)% | | (25,904,251) |
NET ASSETS - 100% | $ 2,379,976,832 |
Legend |
(a) Non-income producing |
(b) Affiliated fund that is available only to investment companies and other accounts managed by Fidelity Investments. The rate quoted is the annualized seven-day yield of the fund at period end. A complete listing of the fund's holdings as of its most recent fiscal year end is available upon request. |
(c) Includes investment made with cash collateral received from securities on loan. |
(d) Security or a portion of the security is on loan at period end. |
Income Tax Information |
At December 31, 2004, the fund had a capital loss carryforward of approximately $472,630,000 of which $233,538,000, $191,786,000 and $47,306,000 will expire on December 31, 2009, 2010 and 2011, respectively. |
See accompanying notes which are an integral part of the financial statements.
Annual Report
Fidelity Variable Insurance Products: Overseas Portfolio
Financial Statements
Statement of Assets and Liabilities
December 31, 2004 |
Assets | | |
Investment in securities, at value (including securities loaned of $47,243,590) (cost $1,853,994,030) - See accompanying schedule | | $ 2,405,881,083 |
Foreign currency held at value (cost $22,846,483) | | 23,660,247 |
Receivable for fund shares sold | | 5,794,295 |
Dividends receivable | | 4,143,285 |
Interest receivable | | 136,963 |
Prepaid expenses | | 7,963 |
Other affiliated receivables | | 10,094 |
Other receivables | | 274,898 |
Total assets | | 2,439,908,828 |
Liabilities | | |
Payable for fund shares redeemed | $ 6,629,143 | |
Accrued management fee | 1,397,303 | |
Distribution fees payable | 102,217 | |
Other affiliated payables | 261,313 | |
Other payables and accrued expenses | 1,895,589 | |
Collateral on securities loaned, at value | 49,646,431 | |
Total liabilities | | 59,931,996 |
Net Assets | | $ 2,379,976,832 |
Net Assets consist of: | | |
Paid in capital | | $ 2,300,419,130 |
Undistributed net investment income | | 1,867,057 |
Accumulated undistributed net realized gain (loss) on investments and foreign currency transactions | | (473,792,313) |
Net unrealized appreciation (depreciation) on investments and assets and liabilities in foreign currencies | | 551,482,958 |
Net Assets | | $ 2,379,976,832 |
Calculation of Maximum Offering Price | |
Initial Class:
Net Asset Value, offering price and redemption price per share ($1,491,484,922 ÷ 85,154,763 shares) | $ 17.51 |
Service Class:
Net Asset Value, offering price and redemption price per share ($322,649,186 ÷ 18,498,260 shares) | $ 17.44 |
Service Class 2:
Net Asset Value, offering price and redemption price per share ($319,707,841 ÷ 18,384,916 shares) | $ 17.39 |
Initial Class R:
Net Asset Value, offering price and redemption price per share ($132,063,904 ÷ 7,549,785 shares) | $ 17.49 |
Service Class R:
Net Asset Value, offering price and redemption price per share ($86,509,078 ÷ 4,964,551 shares) | $ 17.43 |
Service Class 2R:
Net Asset Value, offering price and redemption price per share ($27,561,901 ÷ 1,593,209 shares) | $ 17.30 |
Statement of Operations
Year ended December 31, 2004 |
Investment Income | | |
Dividends | | $ 35,350,755 |
Interest | | 2,188,079 |
Security lending | | 1,280,975 |
| | 38,819,809 |
Less foreign taxes withheld | | (4,024,449) |
Total income | | 34,795,360 |
| | |
Expenses | | |
Management fee | $ 15,178,054 | |
Transfer agent fees | 1,432,011 | |
Distribution fees | 930,529 | |
Accounting and security lending fees | 992,201 | |
Non-interested trustees' compensation | 11,307 | |
Appreciation in deferred trustee compensation account | 4,711 | |
Custodian fees and expenses | 736,386 | |
Registration fees | 195 | |
Audit | 67,736 | |
Legal | 5,915 | |
Miscellaneous | 631,165 | |
Total expenses before reductions | 19,990,210 | |
Expense reductions | (914,176) | 19,076,034 |
Net investment income (loss) | | 15,719,326 |
Realized and Unrealized Gain (Loss) Net realized gain (loss) on: | | |
Investment securities (net of foreign taxes of $215,095) | 146,199,544 | |
Foreign currency transactions | (190,461) | |
Total net realized gain (loss) | | 146,009,083 |
Change in net unrealized appreciation (depreciation) on: Investment securities (net of decrease in deferred foreign taxes of $2,494,712) | 113,706,840 | |
Assets and liabilities in foreign currencies | 870,818 | |
Total change in net unrealized appreciation (depreciation) | | 114,577,658 |
Net gain (loss) | | 260,586,741 |
Net increase (decrease) in net assets resulting from operations | | $ 276,306,067 |
See accompanying notes which are an integral part of the financial statements.
Overseas Portfolio
Fidelity Variable Insurance Products: Overseas Portfolio
Financial Statements - continued
Statement of Changes in Net Assets
| Year ended
December 31,
2004 | Year ended
December 31,
2003 |
Increase (Decrease) in Net Assets | | |
Operations | | |
Net investment income (loss) | $ 15,719,326 | $ 12,219,607 |
Net realized gain (loss) | 146,009,083 | (23,642,194) |
Change in net unrealized appreciation (depreciation) | 114,577,658 | 580,158,781 |
Net increase (decrease) in net assets resulting from operations | 276,306,067 | 568,736,194 |
Distributions to shareholders from net investment income | (22,557,627) | (11,225,102) |
Share transactions - net increase (decrease) | 199,907,441 | 76,831,320 |
Redemption fees | 51,279 | 30,862 |
Total increase (decrease) in net assets | 453,707,160 | 634,373,274 |
| | |
Net Assets | | |
Beginning of period | 1,926,269,672 | 1,291,896,398 |
End of period (including undistributed net investment income of $1,867,057 and undistributed net investment income of $8,430,134, respectively) | $ 2,379,976,832 | $ 1,926,269,672 |
Other Information: | | | | | | |
Share Transactions | Year ended December 31, 2004 |
Shares | Initial Class | Service Class | Service Class 2 | Initial Class R | Service Class R | Service Class 2R |
Sold | 14,747,796 | 5,622,052 | 11,770,833 | 5,679,220 | 1,860,289 | 1,379,237 |
Reinvested | 1,047,651 | 175,526 | 101,002 | 30,931 | 41,469 | 4,934 |
Redeemed | (22,763,135) | (3,179,061) | (2,573,003) | (695,245) | (555,521) | (249,620) |
Net increase (decrease) | (6,967,688) | 2,618,517 | 9,298,832 | 5,014,906 | 1,346,237 | 1,134,551 |
| | | | | | |
Dollars Sold | $ 235,040,834 | $ 88,487,632 | $ 185,307,863 | $ 89,613,678 | $ 29,201,895 | $ 21,125,719 |
Reinvested | 16,877,656 | 2,818,947 | 1,619,063 | 497,678 | 665,579 | 78,704 |
Redeemed | (358,049,999) | (49,596,873) | (40,549,211) | (10,848,287) | (8,516,411) | (3,867,026) |
Net increase (decrease) | $ (106,131,509) | $ 41,709,706 | $ 146,377,715 | $ 79,263,069 | $ 21,351,063 | $ 17,337,397 |
| | | | | | |
Share Transactions | Year ended December 31, 2003 |
Shares | Initial Class | Service Class | Service Class 2 | Initial Class R | Service Class R | Service Class 2R |
Sold | 135,754,582 | 34,982,458 | 57,905,822 | 1,401,445 | 2,096,259 | 337,680 |
Reinvested | 891,621 | 140,448 | 26,238 | 15,499 | 17,531 | 2,278 |
Redeemed | (138,456,054) | (35,447,830) | (53,234,293) | (307,443) | (140,438) | (29,586) |
Net increase (decrease) | (1,809,851) | (324,924) | 4,697,767 | 1,109,501 | 1,973,352 | 310,372 |
| | | | | | |
Dollars Sold | $ 1,613,667,675 | $ 391,087,076 | $ 672,794,854 | $ 17,351,785 | $ 25,897,371 | $ 3,723,543 |
Reinvested | 9,156,952 | 1,438,187 | 268,410 | 159,020 | 179,341 | 23,192 |
Redeemed | (1,637,501,847) | (397,130,238) | (618,521,317) | (3,679,685) | (1,677,969) | (405,030) |
Net increase (decrease) | $ (14,677,220) | $ (4,604,975) | $ 54,541,947 | $ 13,831,120 | $ 24,398,743 | $ 3,341,705 |
| | | | | | |
Distributions | Year ended December 31, 2004 |
| Initial Class | Service Class | Service Class 2 | Initial Class R | Service Class R | Service Class 2R |
From net investment income | $ 16,877,656 | $ 2,818,947 | $ 1,619,063 | $ 497,678 | $ 665,579 | $ 78,704 |
| | | | | | |
| Year ended December 31, 2003 |
| Initial Class | Service Class | Service Class 2 | Initial Class R | Service Class R | Service Class 2R |
From net investment income | $ 9,156,952 | $ 1,438,187 | $ 268,410 | $ 159,020 | $ 179,341 | $ 23,192 |
See accompanying notes which are an integral part of the financial statements.
Annual Report
Financial Highlights - Initial Class
Years ended December 31, | 2004 | 2003 | 2002 | 2001 | 2000 |
Selected Per-Share Data | | | | | |
Net asset value, beginning of period | $ 15.59 | $ 10.98 | $ 13.88 | $ 20.00 | $ 27.44 |
Income from Investment Operations | | | | | |
Net investment income (loss) C | .13 | .11 | .10 | .14 | .19 D |
Net realized and unrealized gain (loss) | 1.97 | 4.60 | (2.90) | (3.86) | (4.93) |
Total from investment operations | 2.10 | 4.71 | (2.80) | (3.72) | (4.74) |
Distributions from net investment income | (.18) | (.10) | (.10) | (.93) | (.31) |
Distributions in excess of net investment income | - | - | - | - | (.06) |
Distributions from net realized gain | - | - | - | (1.47) | (2.33) |
Total distributions | (.18) | (.10) | (.10) | (2.40) | (2.70) |
Redemption fees added to paid in capital C | - F | - F | - F | - | - |
Net asset value, end of period | $ 17.51 | $ 15.59 | $ 10.98 | $ 13.88 | $ 20.00 |
Total Return A, B | 13.57% | 43.37% | (20.28)% | (21.21)% | (19.07)% |
Ratios to Average Net Assets E | | | | | |
Expenses before expense reductions | .91% | .90% | .90% | .92% | .89% |
Expenses net of voluntary waivers, if any | .91% | .90% | .90% | .92% | .89% |
Expenses net of all reductions | .87% | .86% | .86% | .87% | .87% |
Net investment income (loss) | .80% | .87% | .79% | .91% | .84% |
Supplemental Data | | | | | |
Net assets, end of period (000 omitted) | $ 1,491,485 | $ 1,436,137 | $ 1,031,489 | $ 1,496,873 | $ 2,267,507 |
Portfolio turnover rate | 84% | 99% | 77% | 98% | 136% |
A Total returns do not reflect charges attributable to your insurance company's separate account. Inclusion of these charges would reduce the total returns shown.
B Total returns would have been lower had certain expenses not been reduced during the periods shown.
C Calculated based on average shares outstanding during the period.
D Investment income per share reflects a special dividend which amounted to $.04 per share.
E Expense ratios reflect operating expenses of the class. Expenses before reductions do not reflect amounts reimbursed by the investment adviser or reductions from brokerage service arrangements or other expense offset arrangements and do not represent the amount paid by the class during periods when reimbursements or reductions occur. Expenses net of any voluntary waivers reflect expenses after reimbursement by the investment adviser but prior to reductions from brokerage service arrangements or other expense offset arrangements. Expenses net of all reductions represent the net expenses paid by the class.
F Amount represents less than $.01 per share.
Financial Highlights - Service Class
Years ended December 31, | 2004 | 2003 | 2002 | 2001 | 2000 |
Selected Per-Share Data | | | | | |
Net asset value, beginning of period | $ 15.53 | $ 10.94 | $ 13.83 | $ 19.94 | $ 27.39 |
Income from Investment Operations | | | | | |
Net investment income (loss) C | .11 | .09 | .09 | .12 | .17 D |
Net realized and unrealized gain (loss) | 1.97 | 4.59 | (2.89) | (3.84) | (4.93) |
Total from investment operations | 2.08 | 4.68 | (2.80) | (3.72) | (4.76) |
Distributions from net investment income | (.17) | (.09) | (.09) | (.92) | (.30) |
Distributions in excess of net investment income | - | - | - | - | (.06) |
Distributions from net realized gain | - | - | - | (1.47) | (2.33) |
Total distributions | (.17) | (.09) | (.09) | (2.39) | (2.69) |
Redemption fees added to paid in capital C | - F | - F | - F | - | - |
Net asset value, end of period | $ 17.44 | $ 15.53 | $ 10.94 | $ 13.83 | $ 19.94 |
Total Return A, B | 13.49% | 43.20% | (20.34)% | (21.27)% | (19.18)% |
Ratios to Average Net Assets E | | | | | |
Expenses before expense reductions | 1.01% | 1.00% | 1.00% | 1.03% | .99% |
Expenses net of voluntary waivers, if any | 1.01% | 1.00% | 1.00% | 1.03% | .99% |
Expenses net of all reductions | .97% | .96% | .96% | .97% | .97% |
Net investment income (loss) | .69% | .77% | .69% | .81% | .74% |
Supplemental Data | | | | | |
Net assets, end of period (000 omitted) | $ 322,649 | $ 246,632 | $ 177,322 | $ 240,525 | $ 257,257 |
Portfolio turnover rate | 84% | 99% | 77% | 98% | 136% |
A Total returns do not reflect charges attributable to your insurance company's separate account. Inclusion of these charges would reduce the total returns shown.
B Total returns would have been lower had certain expenses not been reduced during the periods shown.
C Calculated based on average shares outstanding during the period.
D Investment income per share reflects a special dividend which amounted to $.04 per share.
E Expense ratios reflect operating expenses of the class. Expenses before reductions do not reflect amounts reimbursed by the investment adviser or reductions from brokerage service arrangements or other expense offset arrangements and do not represent the amount paid by the class during periods when reimbursements or reductions occur. Expenses net of any voluntary waivers reflect expenses after reimbursement by the investment adviser but prior to reductions from brokerage service arrangements or other expense offset arrangements. Expenses net of all reductions represent the net expenses paid by the class.
F Amount represents less than $.01 per share.
See accompanying notes which are an integral part of the financial statements.
Overseas Portfolio
Financial Highlights - Service Class 2
Years ended December 31, | 2004 | 2003 | 2002 | 2001 | 2000 G |
Selected Per-Share Data | | | | | |
Net asset value, beginning of period | $ 15.50 | $ 10.90 | $ 13.81 | $ 19.91 | $ 26.16 |
Income from Investment Operations | | | | | |
Net investment income (loss) E | .08 | .08 | .07 | .10 | .12 F |
Net realized and unrealized gain (loss) | 1.97 | 4.58 | (2.88) | (3.80) | (3.68) |
Total from investment operations | 2.05 | 4.66 | (2.81) | (3.70) | (3.56) |
Distributions from net investment income | (.16) | (.06) | (.10) | (.93) | (.30) |
Distributions in excess of net investment income | - | - | - | - | (.06) |
Distributions from net realized gain | - | - | - | (1.47) | (2.33) |
Total distributions | (.16) | (.06) | (.10) | (2.40) | (2.69) |
Redemption fees added to paid in capital E | - I | - I | - I | (1.47) | (2.33) |
Net asset value, end of period | $ 17.39 | $ 15.50 | $ 10.90 | $ 13.81 | $ 19.91 |
Total Return B, C, D | 13.31% | 43.04% | (20.46)% | (21.20)% | (15.50)% |
Ratios to Average Net Assets H | | | | | |
Expenses before expense reductions | 1.16% | 1.16% | 1.16% | 1.18% | 1.15% A |
Expenses net of voluntary waivers, if any | 1.16% | 1.16% | 1.16% | 1.18% | 1.15% A |
Expenses net of all reductions | 1.12% | 1.12% | 1.12% | 1.12% | 1.13% A |
Net investment income (loss) | .54% | .61% | .53% | .65% | .58% A |
Supplemental Data | | | | | |
Net assets, end of period (000 omitted) | $ 319,708 | $ 140,822 | $ 47,824 | $ 48,843 | $ 12,351 |
Portfolio turnover rate | 84% | 99% | 77% | 98% | 136% |
A Annualized
B Total returns for periods of less than one year are not annualized.
C Total returns do not reflect charges attributable to your insurance company's separate account. Inclusion of these charges would reduce the total returns shown.
D Total returns would have been lower had certain expenses not been reduced during the periods shown.
E Calculated based on average shares outstanding during the period.
F Investment income per share reflects a special dividend which amounted to $.04 per share.
G For the period January 12, 2000 (commencement of sale of shares) to December 31, 2000.
H Expense ratios reflect operating expenses of the class. Expenses before reductions do not reflect amounts reimbursed by the investment adviser or reductions from brokerage service arrangements or other expense offset arrangements and do not represent the amount paid by the class during periods when reimbursements or reductions occur. Expense ratios before reductions for start-up periods may not be representative of longer-term operating periods. Expenses net of any voluntary waivers reflect expenses after reimbursement by the investment adviser but prior to reductions from brokerage service arrangements or other expense offset arrangements. Expenses net of all reductions represent the net expenses paid by the class.
I Amount represents less than $.01 per share.
Financial Highlights - Initial Class R
Years ended December 31, | 2004 | 2003 | 2002 F |
Selected Per-Share Data | | | |
Net asset value, beginning of period | $ 15.57 | $ 10.98 | $ 14.05 |
Income from Investment Operations | | | |
Net investment income (loss) E | .12 | .11 | .06 |
Net realized and unrealized gain (loss) | 1.98 | 4.59 | (3.13) |
Total from investment operations | 2.10 | 4.70 | (3.07) |
Distributions from net investment income | (.18) | (.11) | - |
Redemption fees added to paid in capital E, H | - | - | - |
Net asset value, end of period | $ 17.49 | $ 15.57 | $ 10.98 |
Total Return B, C, D | 13.59% | 43.32% | (21.85)% |
Ratios to Average Net Assets G | | | |
Expenses before expense reductions | .91% | .90% | .91% A |
Expenses net of voluntary waivers, if any | .91% | .90% | .91% A |
Expenses net of all reductions | .87% | .86% | .87% A |
Net investment income (loss) | .79% | .87% | .79% A |
Supplemental Data | | | |
Net assets, end of period (000 omitted) | $ 132,064 | $ 39,466 | $ 15,649 |
Portfolio turnover rate | 84% | 99% | 77% |
A Annualized
B Total returns for periods of less than one year are not annualized.
C Total returns do not reflect charges attributable to your insurance company's separate account. Inclusion of these charges would reduce the total returns shown.
D Total returns would have been lower had certain expenses not been reduced during the periods shown.
E Calculated based on average shares outstanding during the period.
F For the period April 24, 2002 (commencement of sale of shares) to December 31, 2002.
G Expense ratios reflect operating expenses of the class. Expenses before reductions do not reflect amounts reimbursed by the investment adviser or reductions from brokerage service arrangements or other expense offset arrangements and do not represent the amount paid by the class during periods when reimbursements or reductions occur. Expense ratios before reductions for start-up periods may not be representative of longer-term operating periods. Expenses net of any voluntary waivers reflect expenses after reimbursement by the investment adviser but prior to reductions from brokerage service arrangements or other expense offset arrangements. Expenses net of all reductions represent the net expenses paid by the class.
H Amount represents less than $.01 per share.
See accompanying notes which are an integral part of the financial statements.
Annual Report
Financial Highlights - Service Class R
Years ended December 31, | 2004 | 2003 | 2002 F |
Selected Per-Share Data | | | |
Net asset value, beginning of period | $ 15.52 | $ 10.94 | $ 14.01 |
Income from Investment Operations | | | |
Net investment income (loss) E | .11 | .10 | .05 |
Net realized and unrealized gain (loss) | 1.97 | 4.58 | (3.12) |
Total from investment operations | 2.08 | 4.68 | (3.07) |
Distributions from net investment income | (.17) | (.10) | - |
Redemption fees added to paid in capital E, H | - | - | - |
Net asset value, end of period | $ 17.43 | $ 15.52 | $ 10.94 |
Total Return B, C, D | 13.50% | 43.25% | (21.91)% |
Ratios to Average Net Assets G | | | |
Expenses before expense reductions | 1.01% | 1.00% | 1.01% A |
Expenses net of voluntary waivers, if any | 1.01% | 1.00% | 1.01% A |
Expenses net of all reductions | .96% | .96% | .97% A |
Net investment income (loss) | .70% | .77% | .69% A |
Supplemental Data | | | |
Net assets, end of period (000 omitted) | $ 86,509 | $ 56,141 | $ 17,997 |
Portfolio turnover rate | 84% | 99% | 77% |
A Annualized
B Total returns for periods of less than one year are not annualized.
C Total returns do not reflect charges attributable to your insurance company's separate account. Inclusion of these charges would reduce the total returns shown.
D Total returns would have been lower had certain expenses not been reduced during the periods shown.
E Calculated based on average shares outstanding during the period.
F For the period April 24, 2002 (commencement of sale of shares) to December 31, 2002.
G Expense ratios reflect operating expenses of the class. Expenses before reductions do not reflect amounts reimbursed by the investment adviser or reductions from brokerage service arrangements or other expense offset arrangements and do not represent the amount paid by the class during periods when reimbursements or reductions occur. Expense ratios before reductions for start-up periods may not be representative of longer-term operating periods. Expenses net of any voluntary waivers reflect expenses after reimbursement by the investment adviser but prior to reductions from brokerage service arrangements or other expense offset arrangements. Expenses net of all reductions represent the net expenses paid by the class.
H Amount represents less than $.01 per share.
Financial Highlights - Service Class 2R
Years ended December 31, | 2004 | 2003 | 2002 F |
Selected Per-Share Data | | | |
Net asset value, beginning of period | $ 15.42 | $ 10.90 | $ 13.96 |
Income from Investment Operations | | | |
Net investment income (loss) E | .08 | .08 | .04 |
Net realized and unrealized gain (loss) | 1.96 | 4.55 | (3.10) |
Total from investment operations | 2.04 | 4.63 | (3.06) |
Distributions from net investment income | (.16) | (.11) | - |
Redemption fees added to paid in capital E, H | - | - | - |
Net asset value, end of period | $ 17.30 | $ 15.42 | $ 10.90 |
Total Return B, C, D | 13.32% | 43.00% | (21.92)% |
Ratios to Average Net Assets G | | | |
Expenses before expense reductions | 1.16% | 1.15% | 1.17% A |
Expenses net of voluntary waivers, if any | 1.16% | 1.15% | 1.17% A |
Expenses net of all reductions | 1.11% | 1.11% | 1.14% A |
Net investment income (loss) | .55% | .62% | .52% A |
Supplemental Data | | | |
Net assets, end of period (000 omitted) | $ 27,562 | $ 7,072 | $ 1,616 |
Portfolio turnover rate | 84% | 99% | 77% |
A Annualized
B Total returns for periods of less than one year are not annualized.
C Total returns do not reflect charges attributable to your insurance company's separate account. Inclusion of these charges would reduce the total returns shown.
D Total returns would have been lower had certain expenses not been reduced during the periods shown.
E Calculated based on average shares outstanding during the period.
F For the period April 24, 2002 (commencement of sale of shares) to December 31, 2002.
G Expense ratios reflect operating expenses of the class. Expenses before reductions do not reflect amounts reimbursed by the investment adviser or reductions from brokerage service arrangements or other expense offset arrangements and do not represent the amount paid by the class during periods when reimbursements or reductions occur. Expense ratios before reductions for start-up periods may not be representative of longer-term operating periods. Expenses net of any voluntary waivers reflect expenses after reimbursement by the investment adviser but prior to reductions from brokerage service arrangements or other expense offset arrangements. Expenses net of all reductions represent the net expenses paid by the class.
H Amount represents less than $.01 per share.
See accompanying notes which are an integral part of the financial statements.
Overseas Portfolio
Notes to Financial Statements
For the period ended December 31, 2004
1. Significant Accounting Policies.
Overseas Portfolio (the fund) is a fund of Variable Insurance Products Fund (the trust) (referred to in this report as Fidelity Variable Insurance Products: Overseas Portfolio) and is authorized to issue an unlimited number of shares. The trust is registered under the Investment Company Act of 1940, as amended (the 1940 Act), as an open-end management investment company organized as a Massachusetts business trust. Shares of the fund may only be purchased by insurance companies for the purpose of funding variable annuity or variable life insurance contracts. The fund offers the following classes of shares: Initial Class shares, Service Class shares, Service Class 2 shares, Initial Class R shares, Service Class R shares, and Service Class 2R shares. All classes have equal rights and voting privileges, except for matters affecting a single class. Investment income, realized and unrealized capital gains and losses, the common expenses of the fund, and certain fund-level expense reductions, if any, are allocated on a pro rata basis to each class based on the relative net assets of each class to the total net assets of the fund. Each class differs with respect to distribution and service plan fees incurred. Certain expense reductions also differ by class.
The fund's investments in emerging markets can be subject to social, economic, regulatory, and political uncertainties and can be extremely volatile. The financial statements have been prepared in conformity with accounting principles generally accepted in the United States of America, which require management to make certain estimates and assumptions at the date of the financial statements. The following summarizes the significant accounting policies of the fund:
Security Valuation. Net asset value per share (NAV calculation) is calculated as of the close of business of the New York Stock Exchange, normally 4:00 p.m. Eastern time. Equity securities, including restricted securities, for which market quotations are available are valued at the last sale price or official closing price (closing bid price or last evaluated quote if no sale has occurred) on the primary market or exchange on which they trade. If prices are not readily available or do not accurately reflect fair value for a security, or if a security's value has been materially affected by events occurring after the close of the exchange or market on which the security is principally traded, that security may be valued by another method that the Board of Trustees believes accurately reflects fair value. A security's valuation may differ depending on the method used for determining value. Price movements in futures contracts and ADRs, market and trading trends, the bid/ask quotes of brokers and off-exchange institutional trading may be reviewed in the course of making a good faith determination of a security's fair value. Short-term securities with remaining maturities of sixty days or less for which quotations are not readily available are valued on the basis of amortized cost. Investments in open-end investment companies are valued at their net asset value each business day.
Foreign Currency. The fund uses foreign currency contracts to facilitate transactions in foreign-denominated securities. Losses from these transactions may arise from changes in the value of the foreign currency or if the counterparties do not perform under the contracts' terms.
Foreign-denominated assets, including investment securities, and liabilities are translated into U.S. dollars at the exchange rate at period end. Purchases and sales of investment securities, income and dividends received and expenses denominated in foreign currencies are translated into U.S. dollars at the exchange rate in effect on the transaction date.
The effects of exchange rate fluctuations on investments are included with the net realized and unrealized gain (loss) on investment securities. Other foreign currency transactions resulting in realized and unrealized gain (loss) are disclosed separately.
Investment Transactions and Income. Security transactions are accounted for as of trade date. Gains and losses on securities sold are determined on the basis of identified cost and may include proceeds received from litigation. Dividend income is recorded on the ex-dividend date, except for certain dividends from foreign securities where the ex-dividend date may have passed, which are recorded as soon as the fund is informed of the ex-dividend date. Non-cash dividends included in dividend income, if any, are recorded at the fair market value of the securities received. Interest income is accrued as earned. Interest income includes coupon interest and amortization of premium and accretion of discount on debt securities. Investment income is recorded net of foreign taxes withheld where recovery of such taxes is uncertain.
Expenses. Most expenses of each trust can be directly attributed to a fund. Expenses which cannot be directly attributed are apportioned among the funds in the trust.
Deferred Trustee Compensation. Under a Deferred Compensation Plan (the Plan) non-interested Trustees must defer receipt of a portion of, and may elect to defer receipt of an additional portion of, their annual compensation. Deferred amounts are treated as though equivalent dollar amounts had been invested in a cross-section of other Fidelity funds, and are marked-to-market. Deferred amounts remain in the fund until distributed in accordance with the Plan.
Income Tax Information and Distributions to Shareholders. Each year, the fund intends to qualify as a regulated investment company by distributing all of its taxable income and realized gains under Subchapter M of the Internal Revenue Code. As a result, no provision for income taxes is required in the accompanying financial statements. Foreign taxes are provided for based on the fund's understanding of the tax rules and rates that exist in the foreign markets in which it invests.
Annual Report
Notes to Financial Statements - continued
1. Significant Accounting Policies - continued
Income Tax Information and Distributions to Shareholders - continued
Distributions are recorded on the ex-dividend date. Income dividends and capital gain distributions are declared separately for each class. Income and capital gain distributions are determined in accordance with income tax regulations, which may differ from generally accepted accounting principles. Capital accounts within the financial statements are adjusted for permanent book-tax differences. These adjustments have no impact on net assets or the results of operations. Temporary book-tax differences will reverse in a subsequent period.
Book-tax differences are primarily due to foreign currency transactions, passive foreign investment companies (PFIC), market discount, capital loss carryforwards and losses deferred due to wash sales.
The tax-basis components of distributable earnings and the federal tax cost as of period end were as follows:
Unrealized appreciation | $ 559,624,822 | |
Unrealized depreciation | (33,873,385) | |
Net unrealized appreciation (depreciation) | 525,751,437 | |
Undistributed ordinary income | 26,476,944 | |
Capital loss carryforward | (472,629,652) | |
| | |
Cost for federal income tax purposes | $ 1,880,129,646 | |
The tax character of distributions paid was as follows:
| December 31,
2004 | December 31,
2003 |
Ordinary Income | $ 22,557,627 | $ 11,225,102 |
Trading (Redemption) Fees. Initial Class R shares, Service Class R shares and Service Class 2R shares held less than 60 days are subject to a redemption fee equal to 1% of the proceeds of the redeemed shares. All redemption fees, including any estimated redemption fees paid by Fidelity Management & Research Company (FMR), are retained by the fund and accounted for as an addition to paid in capital.
2. Operating Policies.
Repurchase Agreements. FMR has received an Exemptive Order from the Securities and Exchange Commission (the SEC) which permits the fund and other affiliated entities of FMR to transfer uninvested cash balances into joint trading accounts. These accounts are then invested in repurchase agreements that are collateralized by U.S. Treasury or Government obligations. The fund may also invest directly with institutions, in repurchase agreements that are collateralized by commercial paper obligations and corporate obligations. Collateral is held in segregated accounts with custodian banks and may be obtained in the event of a default of the counterparty. Collateral is marked-to-market daily and maintained at a value at least equal to the principal amount of the repurchase agreement (including accrued interest).
3. Purchases and Sales of Investments.
Purchases and sales of securities, other than short-term securities and U.S. government securities, aggregated $1,798,890,461 and $1,655,883,993, respectively.
4. Fees and Other Transactions with Affiliates.
Management Fee. FMR and its affiliates provide the fund with investment management related services for which the fund pays a monthly management fee. The management fee is the sum of an individual fund fee rate that is based on an annual rate of .45% of the fund's average net assets and a group fee rate that averaged .28% during the period. The group fee rate is based upon the average net assets of all the mutual funds advised by FMR. The group fee rate decreases as assets under management increase and increases as assets under management decrease. For the period, the total annual management fee rate was .72% of the fund's average net assets.
Distribution and Service Plan. In accordance with Rule 12b-1 of the 1940 Act, the fund has adopted separate 12b-1 Plans for each Service Class of shares. Each Service Class pays Fidelity Distributors Corporation (FDC), an affiliate of FMR, a service fee. For the period, the service fee is based on an annual rate of .10% of Service Class' and Service Class R's average net assets and .25% of Service Class 2's and Service Class 2R's average net assets.
Overseas Portfolio
4. Fees and Other Transactions with Affiliates - continued
Distribution and Service Plan - continued
For the period, each class paid FDC the following amounts, all of which were re-allowed to insurance companies for the distribution of shares and providing shareholder support services:
Service Class | $ 278,008 | |
Service Class 2 | 544,008 | |
Service Class R | 71,362 | |
Service Class 2R | 37,151 | |
| $ 930,529 | |
Transfer Agent Fees. Fidelity Investments Institutional Operations Company, Inc. (FIIOC), an affiliate of FMR, is the fund's transfer, dividend disbursing, and shareholder servicing agent. FIIOC receives an asset-based fee with respect to each account. FIIOC pays a portion of the expenses related to the typesetting, printing and mailing of shareholder reports, except proxy statements. Each class pays a transfer agent fee, excluding out of pocket expenses, equal to an annual rate of .07% of their month end net assets. For the period, the total transfer agent fees paid by each class to FIIOC, including out of pocket expenses, were as follows:
Initial Class | $ 972,332 | |
Service Class | 192,952 | |
Service Class 2 | 157,275 | |
Initial Class R | 51,463 | |
Service Class R | 47,651 | |
Service Class 2R | 10,338 | |
| $ 1,432,011 | |
Accounting and Security Lending Fees. Fidelity Service Company, Inc. (FSC), an affiliate of FMR, maintains the fund's accounting records. The accounting fee is based on the level of average net assets for the month. Under a separate contract, FSC administers the security lending program. The security lending fee is based on the number and duration of lending transactions.
Central Funds. The fund may invest in affiliated Central Funds managed by Fidelity Investments Money Management, Inc. (FIMM), an affiliate of FMR. The Central Funds are open-end investment companies available only to investment companies and other accounts managed by FMR and its affiliates. The Central Funds seek preservation of capital and current income and do not pay a management fee. Income distributions earned by the fund are recorded as income in the accompanying financial statements and totaled $1,457,235 for the period.
Brokerage Commissions. The fund placed a portion of its portfolio transactions with brokerage firms which are affiliates of the investment adviser. The commissions paid to these affiliated firms were $4,767 for the period.
5. Committed Line of Credit.
The fund participates with other funds managed by FMR in a $4.2 billion credit facility (the "line of credit") to be utilized for temporary or emergency purposes to fund shareholder redemptions or for other short-term liquidity purposes. The fund has agreed to pay commitment fees on its pro rata portion of the line of credit. During the period, there were no borrowings on this line of credit.
6. Security Lending.
The fund lends portfolio securities from time to time in order to earn additional income. The fund receives collateral (in the form of U.S. Treasury obligations, letters of credit and/or cash) against the loaned securities and maintains collateral in an amount not less than 100% of the market value of the loaned securities during the period of the loan. The market value of the loaned securities is determined at the close of business of the fund and any additional required collateral is delivered to the fund on the next business day. If the borrower defaults on its obligation to return the securities loaned because of insolvency or other reasons, a fund could experience delays and costs in recovering the securities loaned or in gaining access to the collateral. Cash collateral is invested in cash equivalents. The value of loaned securities and cash collateral at period end are disclosed on the fund's Statement of Assets and Liabilities.
Annual Report
Notes to Financial Statements - continued
7. Expense Reductions.
Many of the brokers with whom FMR places trades on behalf of the fund provided services to the fund in addition to trade execution. These services included payments of certain expenses on behalf of the fund totaling $912,968 for the period. In addition, through arrangements with the fund's custodian, credits realized as a result of uninvested cash balances were used to reduce the fund's expenses. During the period, these credits reduced the fund's custody expenses by $1,208.
8. Other Information.
At the end of the period, FMR or its affiliates were the owners of record of 14% of the total outstanding shares of the fund and two otherwise unaffiliated shareholders were the owners of record of 39% of the total outstanding shares of the fund.
Overseas Portfolio
Report of Independent Registered Public Accounting Firm
To the Trustees of Variable Insurance Products Fund and the Shareholders of Overseas Portfolio:
In our opinion, the accompanying statement of assets and liabilities, including the schedule of investments, and the related statements of operations and of changes in net assets and the financial highlights present fairly, in all material respects, the financial position of Overseas Portfolio (a fund of Variable Insurance Products Fund) at December 31, 2004 and the results of its operations, the changes in its net assets and the financial highlights for the periods indicated, in conformity with accounting principles generally accepted in the United States of America. These financial statements and financial highlights (hereafter referred to as "financial statements") are the responsibility of the Overseas Portfolio's management; our responsibility is to express an opinion on these financial statements based on our audits. We conducted our audits of these financial statements in accordance with the standards of the Public Company Accounting Oversight Board (United States). Those standards require that we plan and perform the audit to obtain reasonable assurance about whether the financial statements are free of material misstatement. An audit includes examining, on a test basis, evidence supporting the amounts and disclosures in the financial statements, assessing the accounting principles used and significant estimates made by management, and evaluating the overall financial statement presentation. We believe that our audits, which included confirmation of securities at December 31, 2004 by correspondence with the custodian and brokers, provide a reasonable basis for our opinion.
/s/PricewaterhouseCoopers LLP
PricewaterhouseCoopers LLP
Boston, Massachusetts
February 14, 2005
Annual Report
Trustees and Officers
The Trustees, Member of the Advisory Board, and executive officers of the trust and fund, as applicable, are listed below. The Board of Trustees governs the fund and is responsible for protecting the interests of shareholders. The Trustees are experienced executives who meet periodically throughout the year to oversee the fund's activities, review contractual arrangements with companies that provide services to the fund, and review the fund's performance. Except for William O. McCoy, Dennis J. Dirks, and Kenneth L. Wolfe, each of the Trustees oversees 301 funds advised by FMR or an affiliate. Mr. McCoy oversees 303 funds advised by FMR or an affiliate. Mr. Dirks and Mr. Wolfe oversee 233 funds advised by FMR or an affiliate.
The Trustees hold office without limit in time except that (a) any Trustee may resign; (b) any Trustee may be removed by written instrument, signed by at least two-thirds of the number of Trustees prior to such removal; (c) any Trustee who requests to be retired or who has become incapacitated by illness or injury may be retired by written instrument signed by a majority of the other Trustees; and (d) any Trustee may be removed at any special meeting of shareholders by a two-thirds vote of the outstanding voting securities of the trust. In any event, each non-interested Trustee shall retire not later than the last day of the calendar year in which his or her 72nd birthday occurs. The executive officers and Advisory Board Member hold office without limit in time, except that any officer and Advisory Board Member may resign or may be removed by a vote of a majority of the Trustees at any regular meeting or any special meeting of the Trustees. Except as indicated, each individual has held the office shown or other offices in the same company for the past five years.
The fund's Statement of Additional Information (SAI) includes more information about the Trustees. To request a free copy, call Fidelity at 1-800-544-5429.
Interested Trustees*:
Correspondence intended for each Trustee who is an "interested person" (as defined in the 1940 Act) may be sent to Fidelity Investments, 82 Devonshire Street, Boston, Massachusetts 02109.
Name, Age; Principal Occupation |
Edward C. Johnson 3d (74)** |
| Year of Election or Appointment: 1981 Mr. Johnson is Chairman of the Board of Trustees. Mr. Johnson serves as Chief Executive Officer, Chairman, and a Director of FMR Corp.; a Director and Chairman of the Board and of the Executive Committee of FMR; Chairman and a Director of Fidelity Management & Research (Far East) Inc.; Chairman (1998) and a Director of Fidelity Investments Money Management, Inc.; and Chairman (2001) and a Director (2000) of FMR Co., Inc. |
Abigail P. Johnson (43)** |
| Year of Election or Appointment: 2001 Senior Vice President of VIP Overseas (2001). Ms. Johnson also serves as Senior Vice President of other Fidelity funds (2001). She is President and a Director of FMR (2001), Fidelity Investments Money Management, Inc. (2001), FMR Co., Inc. (2001), and a Director of FMR Corp. Previously, Ms. Johnson managed a number of Fidelity funds. |
Laura B. Cronin (50) |
| Year of Election or Appointment: 2003 Ms. Cronin is an Executive Vice President (2002) and Chief Financial Officer (2002) of FMR Corp. and is a member of the Fidelity Management Committee (2003). Previously, Ms. Cronin served as Vice President of Finance of FMR (1997-1999), and Chief Financial Officer of FMR (1999-2001), Fidelity Personal Investments (2001), and Fidelity Brokerage Company (2001-2002). |
Robert L. Reynolds (52) |
| Year of Election or Appointment: 2003 Mr. Reynolds is a Director (2003) and Chief Operating Officer (2002) of FMR Corp. and is the head of the Fidelity Management Committee (2003). He also serves on the Board at Fidelity Investments Canada, Ltd. (2000). Previously, Mr. Reynolds served as President of Fidelity Investments Institutional Retirement Group (1996-2000). |
* Trustees have been determined to be "Interested Trustees" by virtue of, among other things, their affiliation with the trust or various entities under common control with FMR.
** Edward C. Johnson 3d, Trustee, is Abigail P. Johnson's father.
Overseas Portfolio
Trustees and Officers - continued
Non-Interested Trustees:
Correspondence intended for each non-interested Trustee (that is, the Trustees other than the Interested Trustees) may be sent to Fidelity Investments, P.O. Box 55235, Boston, Massachusetts 02205-5235.
Name, Age; Principal Occupation |
Dennis J. Dirks (56) |
| Year of Election or Appointment: 2005 Mr. Dirks also serves as a Trustee (2005) or Member of the Advisory Board (2004) of other investment companies advised by FMR. Prior to his retirement in May 2003, Mr. Dirks was Chief Operating Officer and a member of the Board of The Depository Trust & Clearing Corporation (DTCC) (1999-2003). He also served as President, Chief Operating Officer, and Board member of The Depository Trust Company (DTC) (1999-2003) and President and Board member of the National Securities Clearing Corporation (NSCC) (1999-2003). In addition, Mr. Dirks served as Chief Executive Officer and Board member of the Government Securities Clearing Corporation (2001-2003) and Chief Executive Officer and Board member of the Mortgage-Backed Securities Clearing Corporation (2001-2003). |
Robert M. Gates (61) |
| Year of Election or Appointment: 1997 Dr. Gates is Vice Chairman of the non-interested Trustees (2005). Dr. Gates is Vice Chairman of the non-interested Trustees (2005). Dr. Gates is President of Texas A&M University (2002). He was Director of the Central Intelligence Agency (CIA) from 1991 to 1993. From 1989 to 1991, Dr. Gates served as Assistant to the President of the United States and Deputy National Security Advisor. Dr. Gates is a Director of NACCO Industries, Inc. (mining and manufacturing), Parker Drilling Co., Inc. (drilling and rental tools for the energy industry, 2001), and Brinker International (restaurant management, 2003). He also serves as a member of the Advisory Board of VoteHere.net (secure Internet voting, 2001). Previously, Dr. Gates served as a Director of LucasVarity PLC (automotive components and diesel engines), a Director of TRW Inc. (automotive, space, defense, and information technology), and Dean of the George Bush School of Government and Public Service at Texas A&M University (1999-2001). Dr. Gates also is a Trustee of the Forum for International Policy. |
George H. Heilmeier (68) |
| Year of Election or Appointment: 2004 Dr. Heilmeier is Chairman Emeritus of Telcordia Technologies (communication software and systems), where prior to his retirement, he served as company Chairman and Chief Executive Officer. He currently serves on the Boards of Directors of The Mitre Corporation (systems engineering and information technology support for the government), INET Technologies Inc. (telecommunications network surveillance, 2001), Teletech Holdings (customer management services), and HRL Laboratories (private research and development, 2004). He is Chairman of the General Motors Technology Advisory Committee and a Life Fellow of the Institute of Electrical and Electronics Engineers (IEEE) (2000). Dr. Heilmeier is a member of the Defense Science Board and the National Security Agency Advisory Board. He is also a member of the National Academy of Engineering, the American Academy of Arts and Sciences, and the Board of Overseers of the School of Engineering and Applied Science of the University of Pennsylvania. Previously, Dr. Heilmeier served as a Director of TRW Inc. (automotive, space, defense, and information technology, 1992-2002), Compaq (1994-2002), and Automatic Data Processing, Inc. (ADP) (technology-based business outsourcing, 1995-2002). |
Marie L. Knowles (58) |
| Year of Election or Appointment: 2001 Prior to Ms. Knowles' retirement in June 2000, she served as Executive Vice President and Chief Financial Officer of Atlantic Richfield Company (ARCO) (diversified energy, 1996-2000). From 1993 to 1996, she was a Senior Vice President of ARCO and President of ARCO Transportation Company. She served as a Director of ARCO from 1996 to 1998. She currently serves as a Director of Phelps Dodge Corporation (copper mining and manufacturing) and McKesson Corporation (healthcare service, 2002). Ms. Knowles is a Trustee of the Brookings Institution and the Catalina Island Conservancy and also serves as a member of the Advisory Board for the School of Engineering of the University of Southern California. |
Ned C. Lautenbach (60) |
| Year of Election or Appointment: 2000 Mr. Lautenbach has been a partner of Clayton, Dubilier & Rice, Inc. (private equity investment firm) since September 1998. Previously, Mr. Lautenbach was with the International Business Machines Corporation (IBM) from 1968 until his retirement in 1998. He was most recently Senior Vice President and Group Executive of Worldwide Sales and Services. From 1993 to 1995, he was Chairman of IBM World Trade Corporation, and from 1994 to 1998 was a member of IBM's Corporate Executive Committee. Mr. Lautenbach serves as Co-Chairman and a Director of Covansys, Inc. (global provider of business and technology solutions, 2000). In addition, he is a Director of Italtel Holding S.p.A. (telecommunications (Milan, Italy), 2004) and Eaton Corporation (diversified industrial) as well as the Philharmonic Center for the Arts in Naples, Florida (1999). He also is a member of the Council on Foreign Relations. |
Marvin L. Mann (71) |
| Year of Election or Appointment: 1993 Mr. Mann is Chairman of the non-interested Trustees (2001). He is Chairman Emeritus of Lexmark International, Inc. (computer peripherals), where he served as CEO until April 1998, retired as Chairman May 1999, and remains a member of the Board. Prior to 1991, he held the positions of Vice President of International Business Machines Corporation (IBM) and President and General Manager of various IBM divisions and subsidiaries. He is a member of the Executive Committee of the Independent Director's Council of the Investment Company Institute. In addition, Mr. Mann is a member of the President's Cabinet at the University of Alabama and the Board of Visitors of the Culverhouse College of Commerce and Business Administration at the University of Alabama. |
William O. McCoy (71) |
| Year of Election or Appointment: 1997 Prior to his retirement in December 1994, Mr. McCoy was Vice Chairman of the Board of BellSouth Corporation (telecommunications) and President of BellSouth Enterprises. He is currently a Director of Liberty Corporation (holding company), Duke Realty Corporation (real estate), and Progress Energy, Inc. (electric utility). He is also a partner of Franklin Street Partners (private investment management firm) and a member of the Research Triangle Foundation Board. In addition, Mr. McCoy served as the Interim Chancellor (1999-2000) and a member of the Board of Visitors (1994-1998) for the University of North Carolina at Chapel Hill and currently serves on the Board of Directors of the University of North Carolina Health Care System and the Board of Visitors of the Kenan-Flagler Business School (University of North Carolina at Chapel Hill). He also served as Vice President of Finance for the University of North Carolina (16-school system, 1995-1998). |
Cornelia M. Small (60) |
| Year of Election or Appointment: 2005 Ms. Small is a member (2000) and Chairperson (2002) of the Investment Committee, and a member (2002) of the Board of Trustees of Smith College. Previously, she served as Chief Investment Officer (1999-2000), Director of Global Equity Investments (1996-1999), and a member of the Board of Directors of Scudder, Stevens & Clark (1990-1997) and Scudder Kemper Investments (1997-1998). In addition, Ms. Small served as Co-Chair (2000-2003) of the Annual Fund for the Fletcher School of Law and Diplomacy. |
William S. Stavropoulos (65) |
| Year of Election or Appointment: 2001 Mr. Stavropoulos is Chairman of the Board (2000), CEO (2002), a position he previously held from 1995-2000, Chairman of the Executive Committee (2000), and a Member of the Board of Directors of The Dow Chemical Company. Since joining The Dow Chemical Company in 1967, Mr. Stavropoulos served in numerous senior management positions, including President (1993-2000; 2002-2003). Currently, he is a Director of NCR Corporation (data warehousing and technology solutions), BellSouth Corporation (telecommunications), Chemical Financial Corporation, and Maersk Inc. (industrial conglomerate, 2002). He also serves as a member of the Board of Trustees of the American Enterprise Institute for Public Policy Research. In addition, Mr. Stavropoulos is a member of The Business Council, J.P. Morgan International Council and the University of Notre Dame Advisory Council for the College of Science. |
Kenneth L. Wolfe (65) |
| Year of Election or Appointment: 2005 Mr. Wolfe also serves as a Trustee (2005) or Member of the Advisory Board (2004) of other investment companies advised by FMR. Prior to his retirement in 2001, Mr. Wolfe was Chairman and Chief Executive Officer of Hershey Foods Corporation (1993-2001). He currently serves as a member of the boards of Adelphia Communications Corporation (2003), Bausch & Lomb, Inc., and Revlon Inc. (2004). |
Advisory Board Member and Executive Officers:
Correspondence intended for each executive officer and Mr. Lynch may be sent to Fidelity Investments, 82 Devonshire Street, Boston, Massachusetts 02109.
Name, Age; Principal Occupation |
Peter S. Lynch (61) |
| Year of Election or Appointment: 2003 Member of the Advisory Board of Variable Insurance Products Fund. Vice Chairman and a Director of FMR, and Vice Chairman (2001) and a Director (2000) of FMR Co., Inc. Previously, Mr. Lynch served as a Trustee of the Fidelity funds (1990-2003). Prior to May 31, 1990, he was a Director of FMR and Executive Vice President of FMR (a position he held until March 31, 1991), Vice President of Fidelity® Magellan® Fund and FMR Growth Group Leader, and Managing Director of FMR Corp. Mr. Lynch was also Vice President of Fidelity Investments Corporate Services. In addition, he serves as a Trustee of Boston College, Massachusetts Eye & Ear Infirmary, Historic Deerfield, John F. Kennedy Library, and the Museum of Fine Arts of Boston. |
Philip L. Bullen (45) |
| Year of Election or Appointment: 2001 Vice President of VIP Overseas. Mr. Bullen also serves as Vice President of certain Equity Funds (2001) and certain High Income Funds (2001). He is Senior Vice President of FMR (2001) and FMR Co., Inc. (2001), President and a Director of Fidelity Management & Research (Far East) Inc. (2001), President and a Director of Fidelity Management & Research (U.K.) Inc. (2002), and a Director of Strategic Advisers, Inc. (2002). Before joining Fidelity Investments, Mr. Bullen was President and Chief Investment Officer of Santander Global Advisors (1997-2000) and President and Chief Executive Officer of Boston's Baring Asset Management Inc. (1994-1997). |
Richard R. Mace, Jr. (43) |
| Year of Election or Appointment: 1996 Senior Vice President of VIP Overseas and other funds advised by FMR. |
Eric D. Roiter (56) |
| Year of Election or Appointment: 1998 Secretary of VIP Overseas. He also serves as Secretary of other Fidelity funds; Vice President, General Counsel, and Secretary of FMR Co., Inc. (2001-present) and FMR; Vice President and Secretary of FDC; Assistant Secretary of Fidelity Management & Research (U.K.) Inc. (2001-present), Fidelity Management & Research (Far East) Inc. (2001-present), and Fidelity Investments Money Management, Inc. (2001-present). Mr. Roiter is an Adjunct Member, Faculty of Law, at Boston College Law School (2003-present). |
Stuart Fross (45) |
| Year of Election or Appointment: 2003 Assistant Secretary of VIP Overseas. Mr. Fross also serves as Assistant Secretary of other Fidelity funds (2003) and is an employee of FMR. |
Christine Reynolds (46) |
| Year of Election or Appointment: 2004 President, Treasurer, and Anti-Money Laundering (AML) officer of VIP Overseas. Ms. Reynolds also serves as President, Treasurer, and AML officer of other Fidelity funds (2004) and is a Vice President (2003) and an employee (2002) of FMR. Before joining Fidelity Investments, Ms. Reynolds worked at PricewaterhouseCoopers LLP (PwC) (1980-2002), where she was most recently an audit partner with PwC's investment management practice. |
Timothy F. Hayes (54) |
| Year of Election or Appointment: 2002 Chief Financial Officer of VIP Overseas. Mr. Hayes also serves as Chief Financial Officer of other Fidelity funds (2002). Recently he was appointed President of Fidelity Service Company (2003) where he also serves as a Director. Mr. Hayes also serves as President of Fidelity Investments Operations Group (FIOG, 2002), which includes Fidelity Pricing and Cash Management Services Group (FPCMS), where he was appointed President in 1998. Previously, Mr. Hayes served as Chief Financial Officer of Fidelity Investments Corporate Systems and Service Group (1998) and Fidelity Systems Company (1997-1998). |
Kenneth A. Rathgeber (57) |
| Year of Election or Appointment: 2004 Chief Compliance Officer of VIP Overseas. Mr. Rathgeber also serves as Chief Compliance Officer of other Fidelity funds (2004) and Executive Vice President of Risk Oversight for Fidelity Investments (2002). Previously, he served as Executive Vice President and Chief Operating Officer for Fidelity Investments Institutional Services Company, Inc. (1998-2002). |
John R. Hebble (46) |
| Year of Election or Appointment: 2003 Deputy Treasurer of VIP Overseas. Mr. Hebble also serves as Deputy Treasurer of other Fidelity funds (2003), and is an employee of FMR. Before joining Fidelity Investments, Mr. Hebble worked at Deutsche Asset Management where he served as Director of Fund Accounting (2002-2003) and Assistant Treasurer of the Scudder Funds (1998-2003). |
Kimberley H. Monasterio (41) |
| Year of Election or Appointment: 2004 Deputy Treasurer of VIP Overseas. Ms. Monasterio also serves as Deputy Treasurer of other Fidelity funds (2004) and is an employee of FMR (2004). Before joining Fidelity Investments, Ms. Monasterio served as Treasurer (2000-2004) and Chief Financial Officer (2002-2004) of the Franklin Templeton Funds and Senior Vice President of Franklin Templeton Services, LLC (2000-2004). |
John H. Costello (58) |
| Year of Election or Appointment: 1987 Assistant Treasurer of VIP Overseas. Mr. Costello also serves as Assistant Treasurer of other Fidelity funds and is an employee of FMR. |
Peter L. Lydecker (50) |
| Year of Election or Appointment: 2004 Assistant Treasurer of VIP Overseas. Mr. Lydecker also serves as Assistant Treasurer of other Fidelity funds (2004) and is an employee of FMR. |
Mark Osterheld (49) |
| Year of Election or Appointment: 2002 Assistant Treasurer of VIP Overseas. Mr. Osterheld also serves as Assistant Treasurer of other Fidelity funds (2002) and is an employee of FMR. |
Kenneth B. Robins (35) |
| Year of Election or Appointment: 2004 Assistant Treasurer of VIP Overseas. Mr. Robins also serves as Assistant Treasurer of other Fidelity funds (2004) and is an employee of FMR (2004). Before joining Fidelity Investments, Mr. Robins worked at KPMG LLP, where he was a partner in KPMG's department of professional practice (2002-2004) and a Senior Manager (1999-2000). In addition, Mr. Robins served as Assistant Chief Accountant, United States Securities and Exchange Commission (2000-2002). |
Overseas Portfolio
Distributions
The Board of Trustees of Overseas Portfolio voted to pay to shareholders of record at the opening of business on record date, the following distributions per share derived from capital gains realized from sales of portfolio securities and dividends derived from net investment income:
| Pay Date | Record Date | Dividends | Capital Gains |
Initial Class | 2/11/05 | 2/11/05 | $.115 | $.09 |
Service Class | 2/11/05 | 2/11/05 | $.10 | $.09 |
Service Class 2 | 2/11/05 | 2/11/05 | $.09 | $.09 |
The amounts per share which represent income derived from sources within, and taxes paid to, foreign countries or possessions of the United States are as follows:
| | Pay Date | Income | Taxes |
Initial Class | | 2/13/04 | $.199 | $.019 |
Service Class | | 2/13/04 | $.189 | $.019 |
Service Class 2 | | 2/13/04 | $.179 | $.019 |
The fund will notify shareholders in January 2005 of amounts for use in preparing 2004 income tax returns.
Annual Report
Proxy Voting Results
A special meeting of the fund's shareholders was held on December 14, 2004. The results of votes taken among shareholders on proposals before them are reported below. Each vote reported represents one dollar of net asset value held on the record date for the meeting.
PROPOSAL 1 |
To amend the Declaration of Trust to allow the Board of Trustees, if permitted by applicable law, to authorize fund mergers without shareholder approval. A |
| # of
Votes | % of
Votes |
Affirmative | 15,331,508,529.96 | 81.853 |
Against | 2,429,553,894.02 | 12.972 |
Abstain | 969,378,618.94 | 5.175 |
TOTAL | 18,730,441,042.92 | 100.000 |
PROPOSAL 2 |
To elect a Board of Trustees. A |
| # of
Votes | % of
Votes |
J. Michael Cook |
Affirmative | 17,770,642,454.98 | 94.876 |
Withheld | 959,798,587.94 | 5.124 |
TOTAL | 18,730,441,042.92 | 100.000 |
Ralph F. Cox |
Affirmative | 17,759,356,374.26 | 94.815 |
Withheld | 971,084,668.66 | 5.185 |
TOTAL | 18,730,441,042.92 | 100.000 |
Laura B. Cronin |
Affirmative | 17,797,888,742.24 | 95.021 |
Withheld | 932,552,300.68 | 4.979 |
TOTAL | 18,730,441,042.92 | 100.000 |
Dennis J. Dirks B |
Affirmative | 17,802,602,074.45 | 95.046 |
Withheld | 927,838,968.47 | 4.954 |
TOTAL | 18,730,441,042.92 | 100.000 |
Robert M. Gates |
Affirmative | 17,784,855,823.58 | 94.952 |
Withheld | 945,585,219.34 | 5.048 |
TOTAL | 18,730,441,042.92 | 100.000 |
George H. Heilmeier |
Affirmative | 17,768,875,556.56 | 94.866 |
Withheld | 961,565,486.36 | 5.134 |
TOTAL | 18,730,441,042.92 | 100.000 |
Abigail P. Johnson |
Affirmative | 17,781,929,073.06 | 94.936 |
Withheld | 948,511,969.86 | 5.064 |
TOTAL | 18,730,441,042.92 | 100.000 |
Edward C. Johnson 3d |
Affirmative | 17,752,140,336.45 | 94.777 |
Withheld | 978,300,706.47 | 5.223 |
TOTAL | 18,730,441,042.92 | 100.000 |
Donald J. Kirk |
Affirmative | 17,772,467,361.45 | 94.885 |
Withheld | 957,973,681.47 | 5.115 |
TOTAL | 18,730,441,042.92 | 100.000 |
| # of
Votes | % of
Votes |
Marie L. Knowles |
Affirmative | 17,776,922,254.30 | 94.909 |
Withheld | 953,518,788.62 | 5.091 |
TOTAL | 18,730,441,042.92 | 100.000 |
Ned C. Lautenbach |
Affirmative | 17,804,221,564.95 | 95.055 |
Withheld | 926,219,477.97 | 4.945 |
TOTAL | 18,730,441,042.92 | 100.000 |
Marvin L. Mann |
Affirmative | 17,763,277,607.06 | 94.836 |
Withheld | 967,163,435.86 | 5.164 |
TOTAL | 18,730,441,042.92 | 100.000 |
William O. McCoy |
Affirmative | 17,758,560,162.11 | 94.811 |
Withheld | 971,880,880.81 | 5.189 |
TOTAL | 18,730,441,042.92 | 100.000 |
Robert L. Reynolds |
Affirmative | 17,806,026,904.06 | 95.065 |
Withheld | 924,414,138.86 | 4.935 |
TOTAL | 18,730,441,042.92 | 100.000 |
Cornelia M. SmallB |
Affirmative | 17,798,878,892.31 | 95.026 |
Withheld | 931,562,150.61 | 4.974 |
TOTAL | 18,730,441,042.92 | 100.000 |
William S. Stavropoulos |
Affirmative | 17,786,496,107.78 | 94.960 |
Withheld | 943,944,935.14 | 5.040 |
TOTAL | 18,730,441,042.92 | 100.000 |
PROPOSAL 9 |
To amend the fund's fundamental investment limitation concerning borrowing. |
| # of
Votes | % of
Votes |
Affirmative | 1,415,911,097.88 | 89.754 |
Against | 58,404,622.92 | 3.702 |
Abstain | 103,230,926.39 | 6.544 |
TOTAL | 1,577,546,647.19 | 100.000 |
PROPOSAL 10 |
To amend the fund's fundamental investment limitation concerning lending. |
| # of
Votes | % of
Votes |
Affirmative | 1,415,760,262.71 | 89.744 |
Against | 59,625,618.33 | 3.780 |
Abstain | 102,160,766.15 | 6.476 |
TOTAL | 1,577,546,647.19 | 100.000 |
A Denotes trust-wide proposals and voting results. B Effective January 1, 2005. |
Overseas Portfolio
Annual Report
Investment Adviser
Fidelity Management & Research Company
Boston, MA
Investment Sub-Advisers
FMR Co., Inc.
Fidelity Management & Research (U.K.) Inc.
Fidelity Management & Research (Far East) Inc.
Fidelity International Investment Advisors
Fidelity International Investment Advisors (U.K.) Limited
Fidelity Investments Japan Limited
General Distributor
Fidelity Distributors Corporation
Boston, MA
Transfer and Shareholder Servicing Agent
Fidelity Investments Institutional Operations Company, Inc.
Boston, MA
Custodian
JPMorgan Chase Bank
New York, NY
VIPOVRS-ANN-0205
1.540205.107
Fidelity® Variable Insurance Products:
Overseas Portfolio - Class R
Annual Report
December 31, 2004
(2_fidelity_logos) (Registered_Trademark)
Contents
Performance | 3 | How the fund has done over time. |
Management's Discussion | 4 | The manager's review of fund performance, strategy and outlook. |
Shareholder Expense Example | 5 | An example of shareholder expenses. |
Investment Summary | 6 | A summary of the fund's investments at period end. |
Investments | 7 | A complete list of the fund's investments with their
market values. |
Financial Statements | 10 | Statements of assets and liabilities, operations, and
changes in net assets, as well as financial highlights. |
Notes | 15 | Notes to the financial statements. |
Report of Independent Registered Public Accounting Firm | 19 | |
Trustees and Officers | 20 | |
Distributions | 25 | |
Proxy Voting Results | 26 | |
To view a fund's proxy voting guidelines and proxy voting record for the 12-month period ended June 30, visit www.fidelity.com/proxyvotingresults or visit the Securities and Exchange Commission's (SEC) web site at www.sec.gov. You may also call 1-800-544-5429 to request a free copy of the proxy voting guidelines.
Fidelity Variable Insurance Products are separate account options which are purchased through a variable insurance contract.
Standard & Poor's, S&P and S&P 500 are registered service marks of The McGraw-Hill Companies, Inc. and have been licensed for use by Fidelity Distributors Corporation.
Other third party marks appearing herein are the property of their respective owners.
All other marks appearing herein are registered or unregistered trademarks or service marks of FMR Corp. or an affiliated company.
(Recycle graphic) This report is printed on recycled paper using soy-based inks.
This report and the financial statements contained herein are submitted for the general information of the shareholders of the fund. This report is not authorized for distribution to prospective investors in the fund unless preceded or accompanied by an effective prospectus.
A fund files its complete schedule of portfolio holdings with the SEC for the first and third quarters of each fiscal year on Form N-Q. Forms N-Q are available on the SEC's web site at http://www.sec.gov. A fund's Forms N-Q may be reviewed and copied at the SEC's Public Reference Room in Washington, DC. Information regarding the operation of the SEC's Public Reference Room may be obtained by calling 1-800-SEC-0330. For a complete list of a fund's portfolio holdings, view the most recent quarterly holdings report, semiannual report, or annual report on Fidelity's web site at http://www.advisor.fidelity.com.
NOT FDIC INSURED · MAY LOSE VALUE · NO BANK GUARANTEE
Neither the fund nor Fidelity Distributors Corporation is a bank.
Overseas Portfolio
Fidelity Variable Insurance Products: Overseas Portfolio
Performance: The Bottom Line
Average annual total return reflects the change in the value of an investment, assuming reinvestment of a class' dividend income and capital gains (the profits earned upon the sale of securities that have grown in value) and assuming a constant rate of performance each year. During periods of reimbursement by Fidelity, a fund's total return will be greater than it would be had the reimbursement not occurred. Performance numbers are net of all underlying fund operating expenses, but do not include any insurance charges imposed by your insurance company's separate account. If performance information included the effect of these additional charges, the total returns would be lower. How a fund did yesterday is no guarantee of how it will do tomorrow.
Average Annual Total Returns
Periods ended December 31, 2004 | Past 1
year | Past 5
years | Past 10
years |
Fidelity® VIP: Overseas - Initial Class R A | 13.59% | -3.71% | 6.31% |
Fidelity VIP: Overseas - Service Class R B | 13.50% | -3.80% | 6.24% |
Fidelity VIP: Overseas - Service Class 2R C | 13.32% | -3.90% | 6.19% |
A The initial offering of Initial Class R shares took place on April 24, 2002. Returns prior to April 24, 2002 are those of Initial Class.
B The initial offering of Service Class R shares took place on April 24, 2002. Performance for Service Class R shares reflects an asset-based service fee (12b-1 fee). Returns from November 3, 1997 to April 24, 2002 are those of Service Class. Returns prior to November 3, 1997 are those of Initial Class and do not include the effects of a 12b-1 fee. Had Service Class R's 12b-1 fee been reflected, returns prior to November 3, 1997 would have been lower.
C The initial offering of Service Class 2R shares took place on April 24, 2002. Performance for Service Class 2R shares reflects an asset-based service fee (12b-1 fee). Returns from January 12, 2000 to April 24, 2002 are those of Service Class 2. Returns from November 3, 1997 to January 12, 2000 are those of Service Class which reflect a different 12b-1 fee. Service Class 2R returns prior to November 3, 1997 are those of Initial Class and do not include the effects of a 12b-1 fee. Had Service Class 2R's 12b-1 fee been reflected, returns prior to January 12, 2000 would have been lower.
$10,000 Over 10 Years
Let's say hypothetically that $10,000 was invested in Fidelity® Variable Insurance Products: Overseas Portfolio - Initial Class R on December 31, 1994. The chart shows how the value of your investment would have changed, and also shows how the MSCI® EAFE Index performed over the same period.
Annual Report
Fidelity Variable Insurance Products: Overseas Portfolio
Management's Discussion of Fund Performance
Comments from Rick Mace, Portfolio Manager of Fidelity® Variable Insurance Products: Overseas Portfolio
Most of the world's major stock markets posted solid gains for the year ending December 31, 2004. The Morgan Stanley Capital InternationalSM Europe, Australasia, Far East (MSCI® EAFE®) Index - designed to represent the performance of developed stock markets outside the United States and Canada - gained 20.42%, compared to 10.88% for the Standard & Poor's 500SM Index. A weak U.S. dollar relative to most foreign currencies was partly responsible for the performance disparity. On a regional basis, Europe was one of the top performers. Many investors felt European stocks offered better valuations and brighter earnings prospects than U.S. equities. Latin American countries, many of which are exporters of oil and raw materials that received strong support from high commodity prices, also did well. Conversely, Japan underperformed, as early optimism was eroded by disappointing economic indicators and concerns about the impact of China's economic slowdown on exports. Meanwhile, some Asian emerging markets, such as Taiwan and Indonesia, suffered from a deceleration in corporate capital spending.
For the one-year period ending December 31, 2004, the return of Overseas Portfolio trailed the advances of both the MSCI EAFE index and the
LipperSM Variable Annuity International Funds Average, the latter of which rose 18.20%. The fund's overweighting in two poor-performing market groups - semiconductors and diversified financials - caused the bulk of its performance shortfall relative to the index. Notable detractors included semiconductor equipment manufacturers Tokyo Electron, Netherlands-based ASML Holding and Taiwanese chip maker United Microelectronics, as well as Japanese brokerage stocks Nikko Cordial and Nomura Holdings. The semiconductor industry was the worst-performing component of the index during the past 12 months. On the positive side of the ledger, overweighting strong-performing energy stocks relative to the index was helpful. France-based energy producer Total SA and Canada's Talisman Energy were noteworthy standouts for the fund. Elsewhere, overweighting a couple of strong-performing stocks in the telecommunication services sector helped offset some of the fund's weakness in other areas. Specifically, holdings in U.K.-based mobile communications provider mmO2 and Germany-based Deutsche Telekom performed quite well.
The views expressed in this statement reflect those of the portfolio manager only through the end of the period of the report as stated on the cover and do not necessarily represent the views of Fidelity or any other person in the Fidelity organization. Any such views are subject to change at any time based upon market or other conditions and Fidelity disclaims any responsibility to update such views. These views may not be relied on as investment advice and, because investment decisions for a Fidelity fund are based on numerous factors, may not be relied on as an indication of trading intent on behalf of any Fidelity fund.
Overseas Portfolio
Fidelity Variable Insurance Products: Overseas Portfolio
Shareholder Expense Example
As a shareholder of the Fund, you incur two types of costs: (1) transaction costs, including redemption fees, and (2) ongoing costs, including management fees, distribution and/or service (12b-1) fees and other Fund expenses. This Example is intended to help you understand your ongoing costs (in dollars) of investing in the Fund and to compare these costs with the ongoing costs of investing in other mutual funds.
The Example is based on an investment of $1,000 invested at the beginning of the period and held for the entire period (July 1, 2004 to December 31, 2004).
Actual Expenses
The first line of the table below for each class of the Fund provides information about actual account values and actual expenses. You may use the information in this line, together with the amount you invested, to estimate the expenses that you paid over the period. Simply divide your account value by $1,000.00 (for example, an $8,600 account value divided by $1,000.00 = 8.6), then multiply the result by the number in the first line for a class of the Fund under the heading entitled "Expenses Paid During Period" to estimate the expenses you paid on your account during this period. The estimate of expenses does not include any fees or other expenses of any variable annuity or variable life insurance product. If they were, the estimate of expenses you paid during the period would have been higher, and your ending account value would be lower.
Hypothetical Example for Comparison Purposes
The second line of the table below for each class of the Fund provides information about hypothetical account values and hypothetical expenses based on a Class' actual expense ratio and an assumed rate of return of 5% per year before expenses, which is not the Class' actual return. The hypothetical account values and expenses may not be used to estimate the actual ending account balance or expenses you paid for the period. You may use this information to compare the ongoing costs of investing in the Fund and other funds. To do so, compare this 5% hypothetical example with the 5% hypothetical examples that appear in the shareholder reports of the other funds. The estimate of expenses does not include any fees or other expenses of any variable annuity or variable life insurance product. If they were, the estimate of expenses you paid during the period would have been higher, and your ending account value would be lower.
Please note that the expenses shown in the table are meant to highlight your ongoing costs only and do not reflect any transaction costs. Therefore, the second line of the table is useful in comparing ongoing costs only, and will not help you determine the relative total costs of owning different funds. In addition, if these transactional costs were included, your costs would have been higher.
| Beginning
Account Value
July 1, 2004 | Ending
Account Value
December 31, 2004 | Expenses Paid
During Period *
July 1, 2004
to December 31, 2004 |
Initial Class | | | |
Actual | $ 1,000.00 | $ 1,124.60 | $ 4.97 |
Hypothetical A | $ 1,000.00 | $ 1,020.46 | $ 4.72 |
Service Class | | | |
Actual | $ 1,000.00 | $ 1,123.70 | $ 5.50 |
Hypothetical A | $ 1,000.00 | $ 1,019.96 | $ 5.23 |
Service Class 2 | | | |
Actual | $ 1,000.00 | $ 1,123.40 | $ 6.30 |
Hypothetical A | $ 1,000.00 | $ 1,019.20 | $ 5.99 |
Initial Class R | | | |
Actual | $ 1,000.00 | $ 1,124.80 | $ 4.97 |
Hypothetical A | $ 1,000.00 | $ 1,020.46 | $ 4.72 |
Service Class R | | | |
Actual | $ 1,000.00 | $ 1,124.50 | $ 5.50 |
Hypothetical A | $ 1,000.00 | $ 1,019.96 | $ 5.23 |
Service Class 2R | | | |
Actual | $ 1,000.00 | $ 1,123.40 | $ 6.30 |
Hypothetical A | $ 1,000.00 | $ 1,019.20 | $ 5.99 |
A 5% return per year before expenses
*Expenses are equal to each Class' annualized expense ratio (shown in the table below); multiplied by the average account value over the period, multiplied by 184/366 (to reflect the one-half year period).
| Annualized
Expense Ratio | |
Initial Class | .93% | |
Service Class | 1.03% | |
Service Class 2 | 1.18% | |
Initial Class R | .93% | |
Service Class R | 1.03% | |
Service Class 2R | 1.18% | |
Annual Report
Fidelity Variable Insurance Products: Overseas Portfolio
Investment Summary
Top Five Stocks as of December 31, 2004 |
| % of fund's
net assets |
Vodafone Group PLC (United Kingdom) | 4.4 |
Allianz AG (Reg.) (Germany) | 3.4 |
ASML Holding NV (Netherlands) | 3.2 |
Total SA Series B (France) | 2.7 |
UBS AG (Reg.) (Switzerland) | 2.5 |
| 16.2 |
Top Five Market Sectors as of December 31, 2004 |
| % of fund's
net assets |
Financials | 29.6 |
Information Technology | 18.9 |
Telecommunication Services | 9.5 |
Consumer Discretionary | 8.8 |
Health Care | 7.9 |
Top Five Countries as of December 31, 2004 |
(excluding cash equivalents) | % of fund's
net assets |
Japan | 18.3 |
United Kingdom | 14.6 |
France | 10.2 |
Germany | 10.0 |
Switzerland | 9.2 |
Overseas Portfolio
Fidelity Variable Insurance Products: Overseas Portfolio
Investments December 31, 2004
Showing Percentage of Net Assets
Common Stocks - 95.5% |
| Shares | | Value (Note 1) |
Australia - 0.7% |
CSL Ltd. | 698,840 | | $ 15,993,093 |
Belgium - 0.4% |
Fortis | 316,000 | | 8,723,430 |
Brazil - 3.0% |
Aracruz Celulose SA sponsored ADR | 291,400 | | 10,985,780 |
Banco Bradesco SA sponsored ADR (non-vtg.) | 489,000 | | 12,254,340 |
Banco Itau Holding Financeira SA sponsored ADR (non-vtg.) | 133,900 | | 10,065,263 |
Tele Norte Leste Participacoes SA ADR (non-vtg.) | 473,600 | | 7,989,632 |
Uniao de Bancos Brasileiros SA (Unibanco) GDR | 355,000 | | 11,260,600 |
Usinas Siderurgicas de Minas Gerais SA (Usiminas) (PN-A) | 391,900 | | 7,944,238 |
Votorantim Celulose e Papel SA sponsored ADR (non-vtg.) | 637,250 | | 10,323,450 |
TOTAL BRAZIL | | 70,823,303 |
Canada - 2.7% |
Alcan, Inc. | 165,700 | | 8,119,300 |
EnCana Corp. | 289,500 | | 16,501,500 |
Research In Motion Ltd. (a) | 224,600 | | 18,488,323 |
Talisman Energy, Inc. | 691,300 | | 18,636,296 |
Tembec, Inc. (a) | 304,500 | | 1,829,537 |
TOTAL CANADA | | 63,574,956 |
China - 0.6% |
BYD Co. Ltd. (H Shares) | 683,600 | | 1,811,723 |
China Telecom Corp. Ltd. sponsored ADR | 200,280 | | 7,370,304 |
Global Bio-Chem Technology Group Co. Ltd. | 6,618,000 | | 4,342,296 |
Global Bio-Chem Technology Group Co. Ltd. warrants 5/31/07 (a) | 516,250 | | 24,574 |
People's Food Holdings Ltd. | 1,700,000 | | 1,562,404 |
TOTAL CHINA | | 15,111,301 |
Denmark - 0.7% |
Coloplast AS Series B (d) | 54,400 | | 2,981,651 |
Danske Bank AS | 163,300 | | 4,996,457 |
Novo Nordisk AS Series B | 162,100 | | 8,840,313 |
TOTAL DENMARK | | 16,818,421 |
Finland - 1.9% |
Nokia Corp. | 2,829,150 | | 44,332,780 |
France - 10.2% |
Accor SA | 203,282 | | 8,882,300 |
Alcatel SA sponsored ADR (a) | 1,655,300 | | 25,872,339 |
AXA SA | 710,604 | | 17,587,449 |
BNP Paribas SA | 376,602 | | 27,229,874 |
Credit Agricole SA | 113,400 | | 3,415,087 |
Dassault Systemes SA | 113,914 | | 5,733,064 |
France Telecom SA | 472,561 | | 15,632,318 |
L'Oreal SA | 81,395 | | 6,166,755 |
|
| Shares | | Value (Note 1) |
Lagardere S.C.A. (Reg.) | 41,700 | | $ 3,003,768 |
Pernod-Ricard | 95,000 | | 14,523,903 |
Sanofi-Aventis sponsored ADR | 518,200 | | 20,753,910 |
Thomson SA | 240,300 | | 6,340,291 |
Total SA Series B | 287,300 | | 63,114,064 |
Vivendi Universal SA sponsored ADR (a) | 777,500 | | 24,934,425 |
TOTAL FRANCE | | 243,189,547 |
Germany - 10.0% |
Allianz AG (Reg.) | 603,400 | | 80,191,858 |
BASF AG | 298,725 | | 21,514,175 |
Bayerische Hypo-und Vereinsbank AG (a) | 454,900 | | 10,305,480 |
Deutsche Boerse AG | 240,939 | | 14,472,732 |
Deutsche Telekom AG sponsored ADR (a) | 2,104,700 | | 47,734,596 |
E.ON AG | 72,544 | | 6,601,504 |
Infineon Technologies AG sponsored ADR (a) | 893,900 | | 9,743,510 |
RWE AG | 164,060 | | 9,058,013 |
SAP AG sponsored ADR | 304,400 | | 13,457,524 |
Siemens AG sponsored ADR | 289,400 | | 24,503,498 |
TOTAL GERMANY | | 237,582,890 |
Hong Kong - 1.5% |
Esprit Holdings Ltd. | 850,500 | | 5,142,741 |
Hong Kong Exchanges & Clearing Ltd. | 1,952,000 | | 5,223,549 |
Hutchison Whampoa Ltd. | 950,600 | | 8,897,199 |
Techtronic Industries Co. Ltd. | 6,544,000 | | 14,270,379 |
Television Broadcasts Ltd. | 734,000 | | 3,408,990 |
TOTAL HONG KONG | | 36,942,858 |
India - 2.9% |
Cipla Ltd. | 1,160,697 | | 8,528,775 |
Dr. Reddy's Laboratories Ltd. | 151,900 | | 3,039,229 |
HDFC Bank Ltd. | 176,031 | | 2,117,867 |
Housing Development Finance Corp. Ltd. | 1,107,583 | | 19,694,490 |
Infosys Technologies Ltd. | 346,252 | | 16,745,787 |
Reliance Industries Ltd. | 367,900 | | 4,539,843 |
Satyam Computer Services Ltd. | 1,219,887 | | 11,571,298 |
State Bank of India | 179,400 | | 2,933,242 |
TOTAL INDIA | | 69,170,531 |
Italy - 0.9% |
ENI Spa | 880,486 | | 22,160,072 |
Japan - 18.3% |
Advantest Corp. | 221,800 | | 19,033,701 |
Aeon Co. Ltd. | 929,400 | | 15,515,709 |
Canon, Inc. | 221,500 | | 12,018,590 |
Daiwa Securities Group, Inc. | 2,814,000 | | 20,329,591 |
FamilyMart Co. Ltd. | 276,700 | | 8,063,551 |
Honda Motor Co. Ltd. | 260,800 | | 13,592,896 |
Ito Yokado Ltd. | 327,300 | | 13,740,018 |
JAFCO Co. Ltd. | 247,800 | | 16,837,724 |
Mizuho Financial Group, Inc. | 6,790 | | 34,205,214 |
Common Stocks - continued |
| Shares | | Value (Note 1) |
Japan - continued |
Murata Manufacturing Co. Ltd. | 229,700 | | $ 12,849,566 |
Nikko Cordial Corp. | 5,323,000 | | 28,218,189 |
Nitto Denko Corp. | 263,200 | | 14,440,926 |
Nomura Holdings, Inc. | 2,127,000 | | 30,969,121 |
ORIX Corp. | 92,700 | | 12,597,716 |
Ricoh Co. Ltd. | 608,000 | | 11,735,000 |
Rohm Co. Ltd. | 108,600 | | 11,238,505 |
Softbank Corp. (d) | 362,100 | | 17,640,135 |
Sumitomo Electric Industries Ltd. | 852,000 | | 9,274,432 |
Sumitomo Mitsui Financial Group, Inc. (d) | 5,585 | | 40,621,157 |
TDK Corp. | 135,900 | | 10,070,107 |
Tokyo Electron Ltd. | 469,700 | | 28,934,951 |
Toyota Motor Corp. | 875,800 | | 35,850,874 |
UFJ Holdings, Inc. (a) | 1,980 | | 12,004,101 |
Yahoo! Japan Corp. (a) | 1,334 | | 6,407,576 |
TOTAL JAPAN | | 436,189,350 |
Korea (South) - 3.5% |
Honam Petrochemical Corp. | 358,630 | | 16,750,157 |
Hyundai Motor Co. | 66,243 | | 3,551,475 |
Kookmin Bank (a) | 323,810 | | 12,668,379 |
LG Electronics, Inc. | 360,200 | | 22,303,731 |
LG Petrochemical Co. Ltd. | 178,050 | | 4,471,890 |
Samsung Electro-Mechanics Co. Ltd. (a) | 183,200 | | 4,601,237 |
Samsung Electronics Co. Ltd. | 21,660 | | 9,426,035 |
Shinhan Financial Group Co. Ltd. | 414,900 | | 9,378,536 |
TOTAL KOREA (SOUTH) | | 83,151,440 |
Netherlands - 7.1% |
Aegon NV | 1,385,500 | | 18,851,385 |
ASML Holding NV (a)(d) | 4,718,139 | | 75,065,591 |
EADS NV | 355,600 | | 10,318,305 |
ING Groep NV (Certificaten Van Aandelen) | 926,624 | | 28,030,376 |
Unilever NV (NY Shares) | 154,100 | | 10,280,011 |
VNU NV | 547,525 | | 16,139,850 |
Wolters Kluwer NV (Certificaten Van Aandelen) | 514,275 | | 10,304,139 |
TOTAL NETHERLANDS | | 168,989,657 |
Spain - 2.4% |
Banco Bilbao Vizcaya Argentaria SA | 840,600 | | 14,912,242 |
Banco Santander Central Hispano SA | 1,208,868 | | 14,953,697 |
Telefonica SA | 1,446,462 | | 27,241,701 |
TOTAL SPAIN | | 57,107,640 |
Sweden - 0.7% |
Telefonaktiebolaget LM Ericsson ADR (a) | 521,800 | | 16,431,482 |
Switzerland - 9.2% |
ABB Ltd. (Reg.) (a) | 1,551,851 | | 8,648,255 |
Actelion Ltd. (Reg.) (a) | 22,893 | | 2,346,661 |
Compagnie Financiere Richemont unit | 312,115 | | 10,367,768 |
|
| Shares | | Value (Note 1) |
Credit Suisse Group (Reg.) | 1,331,669 | | $ 56,183,115 |
Nestle SA (Reg.) | 32,100 | | 8,381,017 |
Novartis AG (Reg.) | 792,392 | | 40,047,492 |
Phonak Holding AG | 170,412 | | 5,608,364 |
Roche Holding AG (participation certificate) | 227,849 | | 26,035,315 |
Societe Generale de Surveillance Holding SA (SGS) (Reg.) | 4,450 | | 3,110,645 |
UBS AG (Reg.) | 696,987 | | 58,435,390 |
TOTAL SWITZERLAND | | 219,164,022 |
Taiwan - 2.8% |
Acer, Inc. | 2,269,000 | | 3,747,169 |
Hon Hai Precision Industries Co. Ltd. | 2,110,109 | | 9,757,346 |
Quanta Computer, Inc. | 2,972,260 | | 5,329,312 |
Taiwan Semiconductor Manufacturing Co. Ltd. | 5,715,000 | | 9,078,562 |
Taiwan Semiconductor Manufacturing Co. Ltd. sponsored ADR | 727,900 | | 6,179,871 |
United Microelectronics Corp. | 39,939,360 | | 25,755,171 |
United Microelectronics Corp. sponsored ADR | 796,300 | | 2,810,939 |
Yageo Corp. (a) | 9,414,000 | | 3,375,892 |
TOTAL TAIWAN | | 66,034,262 |
United Kingdom - 14.6% |
3i Group PLC | 663,873 | | 8,484,877 |
AstraZeneca PLC (United Kingdom) | 497,100 | | 18,089,469 |
BHP Billiton PLC | 1,008,495 | | 11,815,326 |
BP PLC | 4,252,306 | | 41,389,112 |
British Sky Broadcasting Group PLC (BSkyB) | 631,200 | | 6,807,531 |
Carphone Warehouse Group PLC | 1,559,814 | | 5,141,098 |
Hilton Group PLC | 996,000 | | 5,437,858 |
HSBC Holdings PLC (United Kingdom) (Reg.) | 2,564,190 | | 43,663,027 |
ITV PLC | 4,352,554 | | 8,791,289 |
Kesa Electricals PLC | 1,433,748 | | 7,772,801 |
Man Group PLC | 611,067 | | 17,261,675 |
Prudential PLC | 1,160 | | 10,084 |
Reckitt Benckiser PLC | 331,800 | | 10,022,300 |
Rio Tinto PLC (Reg.) | 782,606 | | 23,323,615 |
Smith & Nephew PLC | 1,796,100 | | 18,593,227 |
Tesco PLC | 1,548,141 | | 9,559,064 |
Vodafone Group PLC | 38,147,725 | | 104,448,467 |
Xstrata PLC | 367,500 | | 6,572,938 |
TOTAL UNITED KINGDOM | | 347,183,758 |
United States of America - 1.4% |
Freeport-McMoRan Copper & Gold, Inc. Class B | 344,900 | | 13,185,527 |
Common Stocks - continued |
| Shares | | Value (Note 1) |
United States of America - continued |
Synthes, Inc. | 77,867 | | $ 8,713,013 |
Telewest Global, Inc. (a) | 724,379 | | 12,734,583 |
TOTAL UNITED STATES OF AMERICA | | 34,633,123 |
TOTAL COMMON STOCKS (Cost $1,721,420,863) | 2,273,307,916 |
Money Market Funds - 5.6% |
| | | |
Fidelity Cash Central Fund, 2.24% (b) | 82,926,736 | | 82,926,736 |
Fidelity Securities Lending Cash Central Fund, 2.23% (b)(c) | 49,646,431 | | 49,646,431 |
TOTAL MONEY MARKET FUNDS (Cost $132,573,167) | 132,573,167 |
TOTAL INVESTMENT PORTFOLIO - 101.1% (Cost $1,853,994,030) | | 2,405,881,083 |
NET OTHER ASSETS - (1.1)% | | (25,904,251) |
NET ASSETS - 100% | $ 2,379,976,832 |
Legend |
(a) Non-income producing |
(b) Affiliated fund that is available only to investment companies and other accounts managed by Fidelity Investments. The rate quoted is the annualized seven-day yield of the fund at period end. A complete listing of the fund's holdings as of its most recent fiscal year end is available upon request. |
(c) Includes investment made with cash collateral received from securities on loan. |
(d) Security or a portion of the security is on loan at period end. |
Income Tax Information |
At December 31, 2004, the fund had a capital loss carryforward of approximately $472,630,000 of which $233,538,000, $191,786,000 and $47,306,000 will expire on December 31, 2009, 2010 and 2011, respectively. |
See accompanying notes which are an integral part of the financial statements.
Annual Report
Fidelity Variable Insurance Products: Overseas Portfolio
Financial Statements
Statement of Assets and Liabilities
December 31, 2004 |
Assets | | |
Investment in securities, at value (including securities loaned of $47,243,590) (cost $1,853,994,030) - See accompanying schedule | | $ 2,405,881,083 |
Foreign currency held at value (cost $22,846,483) | | 23,660,247 |
Receivable for fund shares sold | | 5,794,295 |
Dividends receivable | | 4,143,285 |
Interest receivable | | 136,963 |
Prepaid expenses | | 7,963 |
Other affiliated receivables | | 10,094 |
Other receivables | | 274,898 |
Total assets | | 2,439,908,828 |
Liabilities | | |
Payable for fund shares redeemed | $ 6,629,143 | |
Accrued management fee | 1,397,303 | |
Distribution fees payable | 102,217 | |
Other affiliated payables | 261,313 | |
Other payables and accrued expenses | 1,895,589 | |
Collateral on securities loaned, at value | 49,646,431 | |
Total liabilities | | 59,931,996 |
Net Assets | | $ 2,379,976,832 |
Net Assets consist of: | | |
Paid in capital | | $ 2,300,419,130 |
Undistributed net investment income | | 1,867,057 |
Accumulated undistributed net realized gain (loss) on investments and foreign currency transactions | | (473,792,313) |
Net unrealized appreciation (depreciation) on investments and assets and liabilities in foreign currencies | | 551,482,958 |
Net Assets | | $ 2,379,976,832 |
Calculation of Maximum Offering Price | |
Initial Class:
Net Asset Value, offering price and redemption price per share ($1,491,484,922 ÷ 85,154,763 shares) | $ 17.51 |
Service Class:
Net Asset Value, offering price and redemption price per share ($322,649,186 ÷ 18,498,260 shares) | $ 17.44 |
Service Class 2:
Net Asset Value, offering price and redemption price per share ($319,707,841 ÷ 18,384,916 shares) | $ 17.39 |
Initial Class R:
Net Asset Value, offering price and redemption price per share ($132,063,904 ÷ 7,549,785 shares) | $ 17.49 |
Service Class R:
Net Asset Value, offering price and redemption price per share ($86,509,078 ÷ 4,964,551 shares) | $ 17.43 |
Service Class 2R:
Net Asset Value, offering price and redemption price per share ($27,561,901 ÷ 1,593,209 shares) | $ 17.30 |
Statement of Operations
Year ended December 31, 2004 |
Investment Income | | |
Dividends | | $ 35,350,755 |
Interest | | 2,188,079 |
Security lending | | 1,280,975 |
| | 38,819,809 |
Less foreign taxes withheld | | (4,024,449) |
Total income | | 34,795,360 |
| | |
Expenses | | |
Management fee | $ 15,178,054 | |
Transfer agent fees | 1,432,011 | |
Distribution fees | 930,529 | |
Accounting and security lending fees | 992,201 | |
Non-interested trustees' compensation | 11,307 | |
Appreciation in deferred trustee compensation account | 4,711 | |
Custodian fees and expenses | 736,386 | |
Registration fees | 195 | |
Audit | 67,736 | |
Legal | 5,915 | |
Miscellaneous | 631,165 | |
Total expenses before reductions | 19,990,210 | |
Expense reductions | (914,176) | 19,076,034 |
Net investment income (loss) | | 15,719,326 |
Realized and Unrealized Gain (Loss) Net realized gain (loss) on: | | |
Investment securities (net of foreign taxes of $215,095) | 146,199,544 | |
Foreign currency transactions | (190,461) | |
Total net realized gain (loss) | | 146,009,083 |
Change in net unrealized appreciation (depreciation) on: Investment securities (net of decrease in deferred foreign taxes of $2,494,712) | 113,706,840 | |
Assets and liabilities in foreign currencies | 870,818 | |
Total change in net unrealized appreciation (depreciation) | | 114,577,658 |
Net gain (loss) | | 260,586,741 |
Net increase (decrease) in net assets resulting from operations | | $ 276,306,067 |
See accompanying notes which are an integral part of the financial statements.
Overseas Portfolio
Fidelity Variable Insurance Products: Overseas Portfolio
Financial Statements - continued
Statement of Changes in Net Assets
| Year ended
December 31,
2004 | Year ended
December 31,
2003 |
Increase (Decrease) in Net Assets | | |
Operations | | |
Net investment income (loss) | $ 15,719,326 | $ 12,219,607 |
Net realized gain (loss) | 146,009,083 | (23,642,194) |
Change in net unrealized appreciation (depreciation) | 114,577,658 | 580,158,781 |
Net increase (decrease) in net assets resulting from operations | 276,306,067 | 568,736,194 |
Distributions to shareholders from net investment income | (22,557,627) | (11,225,102) |
Share transactions - net increase (decrease) | 199,907,441 | 76,831,320 |
Redemption fees | 51,279 | 30,862 |
Total increase (decrease) in net assets | 453,707,160 | 634,373,274 |
| | |
Net Assets | | |
Beginning of period | 1,926,269,672 | 1,291,896,398 |
End of period (including undistributed net investment income of $1,867,057 and undistributed net investment income of $8,430,134, respectively) | $ 2,379,976,832 | $ 1,926,269,672 |
Other Information: | | | | | | |
Share Transactions | Year ended December 31, 2004 |
Shares | Initial Class | Service Class | Service Class 2 | Initial Class R | Service Class R | Service Class 2R |
Sold | 14,747,796 | 5,622,052 | 11,770,833 | 5,679,220 | 1,860,289 | 1,379,237 |
Reinvested | 1,047,651 | 175,526 | 101,002 | 30,931 | 41,469 | 4,934 |
Redeemed | (22,763,135) | (3,179,061) | (2,573,003) | (695,245) | (555,521) | (249,620) |
Net increase (decrease) | (6,967,688) | 2,618,517 | 9,298,832 | 5,014,906 | 1,346,237 | 1,134,551 |
| | | | | | |
Dollars Sold | $ 235,040,834 | $ 88,487,632 | $ 185,307,863 | $ 89,613,678 | $ 29,201,895 | $ 21,125,719 |
Reinvested | 16,877,656 | 2,818,947 | 1,619,063 | 497,678 | 665,579 | 78,704 |
Redeemed | (358,049,999) | (49,596,873) | (40,549,211) | (10,848,287) | (8,516,411) | (3,867,026) |
Net increase (decrease) | $ (106,131,509) | $ 41,709,706 | $ 146,377,715 | $ 79,263,069 | $ 21,351,063 | $ 17,337,397 |
| | | | | | |
Share Transactions | Year ended December 31, 2003 |
Shares | Initial Class | Service Class | Service Class 2 | Initial Class R | Service Class R | Service Class 2R |
Sold | 135,754,582 | 34,982,458 | 57,905,822 | 1,401,445 | 2,096,259 | 337,680 |
Reinvested | 891,621 | 140,448 | 26,238 | 15,499 | 17,531 | 2,278 |
Redeemed | (138,456,054) | (35,447,830) | (53,234,293) | (307,443) | (140,438) | (29,586) |
Net increase (decrease) | (1,809,851) | (324,924) | 4,697,767 | 1,109,501 | 1,973,352 | 310,372 |
| | | | | | |
Dollars Sold | $ 1,613,667,675 | $ 391,087,076 | $ 672,794,854 | $ 17,351,785 | $ 25,897,371 | $ 3,723,543 |
Reinvested | 9,156,952 | 1,438,187 | 268,410 | 159,020 | 179,341 | 23,192 |
Redeemed | (1,637,501,847) | (397,130,238) | (618,521,317) | (3,679,685) | (1,677,969) | (405,030) |
Net increase (decrease) | $ (14,677,220) | $ (4,604,975) | $ 54,541,947 | $ 13,831,120 | $ 24,398,743 | $ 3,341,705 |
| | | | | | |
Distributions | Year ended December 31, 2004 |
| Initial Class | Service Class | Service Class 2 | Initial Class R | Service Class R | Service Class 2R |
From net investment income | $ 16,877,656 | $ 2,818,947 | $ 1,619,063 | $ 497,678 | $ 665,579 | $ 78,704 |
| | | | | | |
| Year ended December 31, 2003 |
| Initial Class | Service Class | Service Class 2 | Initial Class R | Service Class R | Service Class 2R |
From net investment income | $ 9,156,952 | $ 1,438,187 | $ 268,410 | $ 159,020 | $ 179,341 | $ 23,192 |
See accompanying notes which are an integral part of the financial statements.
Annual Report
Financial Highlights - Initial Class
Years ended December 31, | 2004 | 2003 | 2002 | 2001 | 2000 |
Selected Per-Share Data | | | | | |
Net asset value, beginning of period | $ 15.59 | $ 10.98 | $ 13.88 | $ 20.00 | $ 27.44 |
Income from Investment Operations | | | | | |
Net investment income (loss) C | .13 | .11 | .10 | .14 | .19 D |
Net realized and unrealized gain (loss) | 1.97 | 4.60 | (2.90) | (3.86) | (4.93) |
Total from investment operations | 2.10 | 4.71 | (2.80) | (3.72) | (4.74) |
Distributions from net investment income | (.18) | (.10) | (.10) | (.93) | (.31) |
Distributions in excess of net investment income | - | - | - | - | (.06) |
Distributions from net realized gain | - | - | - | (1.47) | (2.33) |
Total distributions | (.18) | (.10) | (.10) | (2.40) | (2.70) |
Redemption fees added to paid in capital C | - F | - F | - F | - | - |
Net asset value, end of period | $ 17.51 | $ 15.59 | $ 10.98 | $ 13.88 | $ 20.00 |
Total Return A, B | 13.57% | 43.37% | (20.28)% | (21.21)% | (19.07)% |
Ratios to Average Net Assets E | | | | | |
Expenses before expense reductions | .91% | .90% | .90% | .92% | .89% |
Expenses net of voluntary waivers, if any | .91% | .90% | .90% | .92% | .89% |
Expenses net of all reductions | .87% | .86% | .86% | .87% | .87% |
Net investment income (loss) | .80% | .87% | .79% | .91% | .84% |
Supplemental Data | | | | | |
Net assets, end of period (000 omitted) | $ 1,491,485 | $ 1,436,137 | $ 1,031,489 | $ 1,496,873 | $ 2,267,507 |
Portfolio turnover rate | 84% | 99% | 77% | 98% | 136% |
A Total returns do not reflect charges attributable to your insurance company's separate account. Inclusion of these charges would reduce the total returns shown.
B Total returns would have been lower had certain expenses not been reduced during the periods shown.
C Calculated based on average shares outstanding during the period.
D Investment income per share reflects a special dividend which amounted to $.04 per share.
E Expense ratios reflect operating expenses of the class. Expenses before reductions do not reflect amounts reimbursed by the investment adviser or reductions from brokerage service arrangements or other expense offset arrangements and do not represent the amount paid by the class during periods when reimbursements or reductions occur. Expenses net of any voluntary waivers reflect expenses after reimbursement by the investment adviser but prior to reductions from brokerage service arrangements or other expense offset arrangements. Expenses net of all reductions represent the net expenses paid by the class.
F Amount represents less than $.01 per share.
Financial Highlights - Service Class
Years ended December 31, | 2004 | 2003 | 2002 | 2001 | 2000 |
Selected Per-Share Data | | | | | |
Net asset value, beginning of period | $ 15.53 | $ 10.94 | $ 13.83 | $ 19.94 | $ 27.39 |
Income from Investment Operations | | | | | |
Net investment income (loss) C | .11 | .09 | .09 | .12 | .17 D |
Net realized and unrealized gain (loss) | 1.97 | 4.59 | (2.89) | (3.84) | (4.93) |
Total from investment operations | 2.08 | 4.68 | (2.80) | (3.72) | (4.76) |
Distributions from net investment income | (.17) | (.09) | (.09) | (.92) | (.30) |
Distributions in excess of net investment income | - | - | - | - | (.06) |
Distributions from net realized gain | - | - | - | (1.47) | (2.33) |
Total distributions | (.17) | (.09) | (.09) | (2.39) | (2.69) |
Redemption fees added to paid in capital C | - F | - F | - F | - | - |
Net asset value, end of period | $ 17.44 | $ 15.53 | $ 10.94 | $ 13.83 | $ 19.94 |
Total Return A, B | 13.49% | 43.20% | (20.34)% | (21.27)% | (19.18)% |
Ratios to Average Net Assets E | | | | | |
Expenses before expense reductions | 1.01% | 1.00% | 1.00% | 1.03% | .99% |
Expenses net of voluntary waivers, if any | 1.01% | 1.00% | 1.00% | 1.03% | .99% |
Expenses net of all reductions | .97% | .96% | .96% | .97% | .97% |
Net investment income (loss) | .69% | .77% | .69% | .81% | .74% |
Supplemental Data | | | | | |
Net assets, end of period (000 omitted) | $ 322,649 | $ 246,632 | $ 177,322 | $ 240,525 | $ 257,257 |
Portfolio turnover rate | 84% | 99% | 77% | 98% | 136% |
A Total returns do not reflect charges attributable to your insurance company's separate account. Inclusion of these charges would reduce the total returns shown.
B Total returns would have been lower had certain expenses not been reduced during the periods shown.
C Calculated based on average shares outstanding during the period.
D Investment income per share reflects a special dividend which amounted to $.04 per share.
E Expense ratios reflect operating expenses of the class. Expenses before reductions do not reflect amounts reimbursed by the investment adviser or reductions from brokerage service arrangements or other expense offset arrangements and do not represent the amount paid by the class during periods when reimbursements or reductions occur. Expenses net of any voluntary waivers reflect expenses after reimbursement by the investment adviser but prior to reductions from brokerage service arrangements or other expense offset arrangements. Expenses net of all reductions represent the net expenses paid by the class.
F Amount represents less than $.01 per share.
See accompanying notes which are an integral part of the financial statements.
Overseas Portfolio
Financial Highlights - Service Class 2
Years ended December 31, | 2004 | 2003 | 2002 | 2001 | 2000 G |
Selected Per-Share Data | | | | | |
Net asset value, beginning of period | $ 15.50 | $ 10.90 | $ 13.81 | $ 19.91 | $ 26.16 |
Income from Investment Operations | | | | | |
Net investment income (loss) E | .08 | .08 | .07 | .10 | .12 F |
Net realized and unrealized gain (loss) | 1.97 | 4.58 | (2.88) | (3.80) | (3.68) |
Total from investment operations | 2.05 | 4.66 | (2.81) | (3.70) | (3.56) |
Distributions from net investment income | (.16) | (.06) | (.10) | (.93) | (.30) |
Distributions in excess of net investment income | - | - | - | - | (.06) |
Distributions from net realized gain | - | - | - | (1.47) | (2.33) |
Total distributions | (.16) | (.06) | (.10) | (2.40) | (2.69) |
Redemption fees added to paid in capital E | - I | - I | - I | (1.47) | (2.33) |
Net asset value, end of period | $ 17.39 | $ 15.50 | $ 10.90 | $ 13.81 | $ 19.91 |
Total Return B, C, D | 13.31% | 43.04% | (20.46)% | (21.20)% | (15.50)% |
Ratios to Average Net Assets H | | | | | |
Expenses before expense reductions | 1.16% | 1.16% | 1.16% | 1.18% | 1.15% A |
Expenses net of voluntary waivers, if any | 1.16% | 1.16% | 1.16% | 1.18% | 1.15% A |
Expenses net of all reductions | 1.12% | 1.12% | 1.12% | 1.12% | 1.13% A |
Net investment income (loss) | .54% | .61% | .53% | .65% | .58% A |
Supplemental Data | | | | | |
Net assets, end of period (000 omitted) | $ 319,708 | $ 140,822 | $ 47,824 | $ 48,843 | $ 12,351 |
Portfolio turnover rate | 84% | 99% | 77% | 98% | 136% |
A Annualized
B Total returns for periods of less than one year are not annualized.
C Total returns do not reflect charges attributable to your insurance company's separate account. Inclusion of these charges would reduce the total returns shown.
D Total returns would have been lower had certain expenses not been reduced during the periods shown.
E Calculated based on average shares outstanding during the period.
F Investment income per share reflects a special dividend which amounted to $.04 per share.
G For the period January 12, 2000 (commencement of sale of shares) to December 31, 2000.
H Expense ratios reflect operating expenses of the class. Expenses before reductions do not reflect amounts reimbursed by the investment adviser or reductions from brokerage service arrangements or other expense offset arrangements and do not represent the amount paid by the class during periods when reimbursements or reductions occur. Expense ratios before reductions for start-up periods may not be representative of longer-term operating periods. Expenses net of any voluntary waivers reflect expenses after reimbursement by the investment adviser but prior to reductions from brokerage service arrangements or other expense offset arrangements. Expenses net of all reductions represent the net expenses paid by the class.
I Amount represents less than $.01 per share.
Financial Highlights - Initial Class R
Years ended December 31, | 2004 | 2003 | 2002 F |
Selected Per-Share Data | | | |
Net asset value, beginning of period | $ 15.57 | $ 10.98 | $ 14.05 |
Income from Investment Operations | | | |
Net investment income (loss) E | .12 | .11 | .06 |
Net realized and unrealized gain (loss) | 1.98 | 4.59 | (3.13) |
Total from investment operations | 2.10 | 4.70 | (3.07) |
Distributions from net investment income | (.18) | (.11) | - |
Redemption fees added to paid in capital E, H | - | - | - |
Net asset value, end of period | $ 17.49 | $ 15.57 | $ 10.98 |
Total Return B, C, D | 13.59% | 43.32% | (21.85)% |
Ratios to Average Net Assets G | | | |
Expenses before expense reductions | .91% | .90% | .91% A |
Expenses net of voluntary waivers, if any | .91% | .90% | .91% A |
Expenses net of all reductions | .87% | .86% | .87% A |
Net investment income (loss) | .79% | .87% | .79% A |
Supplemental Data | | | |
Net assets, end of period (000 omitted) | $ 132,064 | $ 39,466 | $ 15,649 |
Portfolio turnover rate | 84% | 99% | 77% |
A Annualized
B Total returns for periods of less than one year are not annualized.
C Total returns do not reflect charges attributable to your insurance company's separate account. Inclusion of these charges would reduce the total returns shown.
D Total returns would have been lower had certain expenses not been reduced during the periods shown.
E Calculated based on average shares outstanding during the period.
F For the period April 24, 2002 (commencement of sale of shares) to December 31, 2002.
G Expense ratios reflect operating expenses of the class. Expenses before reductions do not reflect amounts reimbursed by the investment adviser or reductions from brokerage service arrangements or other expense offset arrangements and do not represent the amount paid by the class during periods when reimbursements or reductions occur. Expense ratios before reductions for start-up periods may not be representative of longer-term operating periods. Expenses net of any voluntary waivers reflect expenses after reimbursement by the investment adviser but prior to reductions from brokerage service arrangements or other expense offset arrangements. Expenses net of all reductions represent the net expenses paid by the class.
H Amount represents less than $.01 per share.
See accompanying notes which are an integral part of the financial statements.
Annual Report
Financial Highlights - Service Class R
Years ended December 31, | 2004 | 2003 | 2002 F |
Selected Per-Share Data | | | |
Net asset value, beginning of period | $ 15.52 | $ 10.94 | $ 14.01 |
Income from Investment Operations | | | |
Net investment income (loss) E | .11 | .10 | .05 |
Net realized and unrealized gain (loss) | 1.97 | 4.58 | (3.12) |
Total from investment operations | 2.08 | 4.68 | (3.07) |
Distributions from net investment income | (.17) | (.10) | - |
Redemption fees added to paid in capital E, H | - | - | - |
Net asset value, end of period | $ 17.43 | $ 15.52 | $ 10.94 |
Total Return B, C, D | 13.50% | 43.25% | (21.91)% |
Ratios to Average Net Assets G | | | |
Expenses before expense reductions | 1.01% | 1.00% | 1.01% A |
Expenses net of voluntary waivers, if any | 1.01% | 1.00% | 1.01% A |
Expenses net of all reductions | .96% | .96% | .97% A |
Net investment income (loss) | .70% | .77% | .69% A |
Supplemental Data | | | |
Net assets, end of period (000 omitted) | $ 86,509 | $ 56,141 | $ 17,997 |
Portfolio turnover rate | 84% | 99% | 77% |
A Annualized
B Total returns for periods of less than one year are not annualized.
C Total returns do not reflect charges attributable to your insurance company's separate account. Inclusion of these charges would reduce the total returns shown.
D Total returns would have been lower had certain expenses not been reduced during the periods shown.
E Calculated based on average shares outstanding during the period.
F For the period April 24, 2002 (commencement of sale of shares) to December 31, 2002.
G Expense ratios reflect operating expenses of the class. Expenses before reductions do not reflect amounts reimbursed by the investment adviser or reductions from brokerage service arrangements or other expense offset arrangements and do not represent the amount paid by the class during periods when reimbursements or reductions occur. Expense ratios before reductions for start-up periods may not be representative of longer-term operating periods. Expenses net of any voluntary waivers reflect expenses after reimbursement by the investment adviser but prior to reductions from brokerage service arrangements or other expense offset arrangements. Expenses net of all reductions represent the net expenses paid by the class.
H Amount represents less than $.01 per share.
Financial Highlights - Service Class 2R
Years ended December 31, | 2004 | 2003 | 2002 F |
Selected Per-Share Data | | | |
Net asset value, beginning of period | $ 15.42 | $ 10.90 | $ 13.96 |
Income from Investment Operations | | | |
Net investment income (loss) E | .08 | .08 | .04 |
Net realized and unrealized gain (loss) | 1.96 | 4.55 | (3.10) |
Total from investment operations | 2.04 | 4.63 | (3.06) |
Distributions from net investment income | (.16) | (.11) | - |
Redemption fees added to paid in capital E, H | - | - | - |
Net asset value, end of period | $ 17.30 | $ 15.42 | $ 10.90 |
Total Return B, C, D | 13.32% | 43.00% | (21.92)% |
Ratios to Average Net Assets G | | | |
Expenses before expense reductions | 1.16% | 1.15% | 1.17% A |
Expenses net of voluntary waivers, if any | 1.16% | 1.15% | 1.17% A |
Expenses net of all reductions | 1.11% | 1.11% | 1.14% A |
Net investment income (loss) | .55% | .62% | .52% A |
Supplemental Data | | | |
Net assets, end of period (000 omitted) | $ 27,562 | $ 7,072 | $ 1,616 |
Portfolio turnover rate | 84% | 99% | 77% |
A Annualized
B Total returns for periods of less than one year are not annualized.
C Total returns do not reflect charges attributable to your insurance company's separate account. Inclusion of these charges would reduce the total returns shown.
D Total returns would have been lower had certain expenses not been reduced during the periods shown.
E Calculated based on average shares outstanding during the period.
F For the period April 24, 2002 (commencement of sale of shares) to December 31, 2002.
G Expense ratios reflect operating expenses of the class. Expenses before reductions do not reflect amounts reimbursed by the investment adviser or reductions from brokerage service arrangements or other expense offset arrangements and do not represent the amount paid by the class during periods when reimbursements or reductions occur. Expense ratios before reductions for start-up periods may not be representative of longer-term operating periods. Expenses net of any voluntary waivers reflect expenses after reimbursement by the investment adviser but prior to reductions from brokerage service arrangements or other expense offset arrangements. Expenses net of all reductions represent the net expenses paid by the class.
H Amount represents less than $.01 per share.
See accompanying notes which are an integral part of the financial statements.
Overseas Portfolio
Notes to Financial Statements
For the period ended December 31, 2004
1. Significant Accounting Policies.
Overseas Portfolio (the fund) is a fund of Variable Insurance Products Fund (the trust) (referred to in this report as Fidelity Variable Insurance Products: Overseas Portfolio) and is authorized to issue an unlimited number of shares. The trust is registered under the Investment Company Act of 1940, as amended (the 1940 Act), as an open-end management investment company organized as a Massachusetts business trust. Shares of the fund may only be purchased by insurance companies for the purpose of funding variable annuity or variable life insurance contracts. The fund offers the following classes of shares: Initial Class shares, Service Class shares, Service Class 2 shares, Initial Class R shares, Service Class R shares, and Service Class 2R shares. All classes have equal rights and voting privileges, except for matters affecting a single class. Investment income, realized and unrealized capital gains and losses, the common expenses of the fund, and certain fund-level expense reductions, if any, are allocated on a pro rata basis to each class based on the relative net assets of each class to the total net assets of the fund. Each class differs with respect to distribution and service plan fees incurred. Certain expense reductions also differ by class.
The fund's investments in emerging markets can be subject to social, economic, regulatory, and political uncertainties and can be extremely volatile. The financial statements have been prepared in conformity with accounting principles generally accepted in the United States of America, which require management to make certain estimates and assumptions at the date of the financial statements. The following summarizes the significant accounting policies of the fund:
Security Valuation. Net asset value per share (NAV calculation) is calculated as of the close of business of the New York Stock Exchange, normally 4:00 p.m. Eastern time. Equity securities, including restricted securities, for which market quotations are available are valued at the last sale price or official closing price (closing bid price or last evaluated quote if no sale has occurred) on the primary market or exchange on which they trade. If prices are not readily available or do not accurately reflect fair value for a security, or if a security's value has been materially affected by events occurring after the close of the exchange or market on which the security is principally traded, that security may be valued by another method that the Board of Trustees believes accurately reflects fair value. A security's valuation may differ depending on the method used for determining value. Price movements in futures contracts and ADRs, market and trading trends, the bid/ask quotes of brokers and off-exchange institutional trading may be reviewed in the course of making a good faith determination of a security's fair value. Short-term securities with remaining maturities of sixty days or less for which quotations are not readily available are valued on the basis of amortized cost. Investments in open-end investment companies are valued at their net asset value each business day.
Foreign Currency. The fund uses foreign currency contracts to facilitate transactions in foreign-denominated securities. Losses from these transactions may arise from changes in the value of the foreign currency or if the counterparties do not perform under the contracts' terms.
Foreign-denominated assets, including investment securities, and liabilities are translated into U.S. dollars at the exchange rate at period end. Purchases and sales of investment securities, income and dividends received and expenses denominated in foreign currencies are translated into U.S. dollars at the exchange rate in effect on the transaction date.
The effects of exchange rate fluctuations on investments are included with the net realized and unrealized gain (loss) on investment securities. Other foreign currency transactions resulting in realized and unrealized gain (loss) are disclosed separately.
Investment Transactions and Income. Security transactions are accounted for as of trade date. Gains and losses on securities sold are determined on the basis of identified cost and may include proceeds received from litigation. Dividend income is recorded on the ex-dividend date, except for certain dividends from foreign securities where the ex-dividend date may have passed, which are recorded as soon as the fund is informed of the ex-dividend date. Non-cash dividends included in dividend income, if any, are recorded at the fair market value of the securities received. Interest income is accrued as earned. Interest income includes coupon interest and amortization of premium and accretion of discount on debt securities. Investment income is recorded net of foreign taxes withheld where recovery of such taxes is uncertain.
Expenses. Most expenses of each trust can be directly attributed to a fund. Expenses which cannot be directly attributed are apportioned among the funds in the trust.
Deferred Trustee Compensation. Under a Deferred Compensation Plan (the Plan) non-interested Trustees must defer receipt of a portion of, and may elect to defer receipt of an additional portion of, their annual compensation. Deferred amounts are treated as though equivalent dollar amounts had been invested in a cross-section of other Fidelity funds, and are marked-to-market. Deferred amounts remain in the fund until distributed in accordance with the Plan.
Income Tax Information and Distributions to Shareholders. Each year, the fund intends to qualify as a regulated investment company by distributing all of its taxable income and realized gains under Subchapter M of the Internal Revenue Code. As a result, no provision for income taxes is required in the accompanying financial statements. Foreign taxes are provided for based on the fund's understanding of the tax rules and rates that exist in the foreign markets in which it invests.
Annual Report
Notes to Financial Statements - continued
1. Significant Accounting Policies - continued
Income Tax Information and Distributions to Shareholders - continued
Distributions are recorded on the ex-dividend date. Income dividends and capital gain distributions are declared separately for each class. Income and capital gain distributions are determined in accordance with income tax regulations, which may differ from generally accepted accounting principles. Capital accounts within the financial statements are adjusted for permanent book-tax differences. These adjustments have no impact on net assets or the results of operations. Temporary book-tax differences will reverse in a subsequent period.
Book-tax differences are primarily due to foreign currency transactions, passive foreign investment companies (PFIC), market discount, capital loss carryforwards and losses deferred due to wash sales.
The tax-basis components of distributable earnings and the federal tax cost as of period end were as follows:
Unrealized appreciation | $ 559,624,822 | |
Unrealized depreciation | (33,873,385) | |
Net unrealized appreciation (depreciation) | 525,751,437 | |
Undistributed ordinary income | 26,476,944 | |
Capital loss carryforward | (472,629,652) | |
| | |
Cost for federal income tax purposes | $ 1,880,129,646 | |
The tax character of distributions paid was as follows:
| December 31,
2004 | December 31,
2003 |
Ordinary Income | $ 22,557,627 | $ 11,225,102 |
Trading (Redemption) Fees. Initial Class R shares, Service Class R shares and Service Class 2R shares held less than 60 days are subject to a redemption fee equal to 1% of the proceeds of the redeemed shares. All redemption fees, including any estimated redemption fees paid by Fidelity Management & Research Company (FMR), are retained by the fund and accounted for as an addition to paid in capital.
2. Operating Policies.
Repurchase Agreements. FMR has received an Exemptive Order from the Securities and Exchange Commission (the SEC) which permits the fund and other affiliated entities of FMR to transfer uninvested cash balances into joint trading accounts. These accounts are then invested in repurchase agreements that are collateralized by U.S. Treasury or Government obligations. The fund may also invest directly with institutions, in repurchase agreements that are collateralized by commercial paper obligations and corporate obligations. Collateral is held in segregated accounts with custodian banks and may be obtained in the event of a default of the counterparty. Collateral is marked-to-market daily and maintained at a value at least equal to the principal amount of the repurchase agreement (including accrued interest).
3. Purchases and Sales of Investments.
Purchases and sales of securities, other than short-term securities and U.S. government securities, aggregated $1,798,890,461 and $1,655,883,993, respectively.
4. Fees and Other Transactions with Affiliates.
Management Fee. FMR and its affiliates provide the fund with investment management related services for which the fund pays a monthly management fee. The management fee is the sum of an individual fund fee rate that is based on an annual rate of .45% of the fund's average net assets and a group fee rate that averaged .28% during the period. The group fee rate is based upon the average net assets of all the mutual funds advised by FMR. The group fee rate decreases as assets under management increase and increases as assets under management decrease. For the period, the total annual management fee rate was .72% of the fund's average net assets.
Distribution and Service Plan. In accordance with Rule 12b-1 of the 1940 Act, the fund has adopted separate 12b-1 Plans for each Service Class of shares. Each Service Class pays Fidelity Distributors Corporation (FDC), an affiliate of FMR, a service fee. For the period, the service fee is based on an annual rate of .10% of Service Class' and Service Class R's average net assets and .25% of Service Class 2's and Service Class 2R's average net assets.
Overseas Portfolio
4. Fees and Other Transactions with Affiliates - continued
Distribution and Service Plan - continued
For the period, each class paid FDC the following amounts, all of which were re-allowed to insurance companies for the distribution of shares and providing shareholder support services:
Service Class | $ 278,008 | |
Service Class 2 | 544,008 | |
Service Class R | 71,362 | |
Service Class 2R | 37,151 | |
| $ 930,529 | |
Transfer Agent Fees. Fidelity Investments Institutional Operations Company, Inc. (FIIOC), an affiliate of FMR, is the fund's transfer, dividend disbursing, and shareholder servicing agent. FIIOC receives an asset-based fee with respect to each account. FIIOC pays a portion of the expenses related to the typesetting, printing and mailing of shareholder reports, except proxy statements. Each class pays a transfer agent fee, excluding out of pocket expenses, equal to an annual rate of .07% of their month end net assets. For the period, the total transfer agent fees paid by each class to FIIOC, including out of pocket expenses, were as follows:
Initial Class | $ 972,332 | |
Service Class | 192,952 | |
Service Class 2 | 157,275 | |
Initial Class R | 51,463 | |
Service Class R | 47,651 | |
Service Class 2R | 10,338 | |
| $ 1,432,011 | |
Accounting and Security Lending Fees. Fidelity Service Company, Inc. (FSC), an affiliate of FMR, maintains the fund's accounting records. The accounting fee is based on the level of average net assets for the month. Under a separate contract, FSC administers the security lending program. The security lending fee is based on the number and duration of lending transactions.
Central Funds. The fund may invest in affiliated Central Funds managed by Fidelity Investments Money Management, Inc. (FIMM), an affiliate of FMR. The Central Funds are open-end investment companies available only to investment companies and other accounts managed by FMR and its affiliates. The Central Funds seek preservation of capital and current income and do not pay a management fee. Income distributions earned by the fund are recorded as income in the accompanying financial statements and totaled $1,457,235 for the period.
Brokerage Commissions. The fund placed a portion of its portfolio transactions with brokerage firms which are affiliates of the investment adviser. The commissions paid to these affiliated firms were $4,767 for the period.
5. Committed Line of Credit.
The fund participates with other funds managed by FMR in a $4.2 billion credit facility (the "line of credit") to be utilized for temporary or emergency purposes to fund shareholder redemptions or for other short-term liquidity purposes. The fund has agreed to pay commitment fees on its pro rata portion of the line of credit. During the period, there were no borrowings on this line of credit.
6. Security Lending.
The fund lends portfolio securities from time to time in order to earn additional income. The fund receives collateral (in the form of U.S. Treasury obligations, letters of credit and/or cash) against the loaned securities and maintains collateral in an amount not less than 100% of the market value of the loaned securities during the period of the loan. The market value of the loaned securities is determined at the close of business of the fund and any additional required collateral is delivered to the fund on the next business day. If the borrower defaults on its obligation to return the securities loaned because of insolvency or other reasons, a fund could experience delays and costs in recovering the securities loaned or in gaining access to the collateral. Cash collateral is invested in cash equivalents. The value of loaned securities and cash collateral at period end are disclosed on the fund's Statement of Assets and Liabilities.
Annual Report
Notes to Financial Statements - continued
7. Expense Reductions.
Many of the brokers with whom FMR places trades on behalf of the fund provided services to the fund in addition to trade execution. These services included payments of certain expenses on behalf of the fund totaling $912,968 for the period. In addition, through arrangements with the fund's custodian, credits realized as a result of uninvested cash balances were used to reduce the fund's expenses. During the period, these credits reduced the fund's custody expenses by $1,208.
8. Other Information.
At the end of the period, FMR or its affiliates were the owners of record of 14% of the total outstanding shares of the fund and two otherwise unaffiliated shareholders were the owners of record of 39% of the total outstanding shares of the fund.
Overseas Portfolio
Report of Independent Registered Public Accounting Firm
To the Trustees of Variable Insurance Products Fund and the Shareholders of Overseas Portfolio:
In our opinion, the accompanying statement of assets and liabilities, including the schedule of investments, and the related statements of operations and of changes in net assets and the financial highlights present fairly, in all material respects, the financial position of Overseas Portfolio (a fund of Variable Insurance Products Fund) at December 31, 2004 and the results of its operations, the changes in its net assets and the financial highlights for the periods indicated, in conformity with accounting principles generally accepted in the United States of America. These financial statements and financial highlights (hereafter referred to as "financial statements") are the responsibility of the Overseas Portfolio's management; our responsibility is to express an opinion on these financial statements based on our audits. We conducted our audits of these financial statements in accordance with the standards of the Public Company Accounting Oversight Board (United States). Those standards require that we plan and perform the audit to obtain reasonable assurance about whether the financial statements are free of material misstatement. An audit includes examining, on a test basis, evidence supporting the amounts and disclosures in the financial statements, assessing the accounting principles used and significant estimates made by management, and evaluating the overall financial statement presentation. We believe that our audits, which included confirmation of securities at December 31, 2004 by correspondence with the custodian and brokers, provide a reasonable basis for our opinion.
/s/PricewaterhouseCoopers LLP
PricewaterhouseCoopers LLP
Boston, Massachusetts
February 14, 2005
Annual Report
Trustees and Officers
The Trustees, Member of the Advisory Board, and executive officers of the trust and fund, as applicable, are listed below. The Board of Trustees governs the fund and is responsible for protecting the interests of shareholders. The Trustees are experienced executives who meet periodically throughout the year to oversee the fund's activities, review contractual arrangements with companies that provide services to the fund, and review the fund's performance. Except for William O. McCoy, Dennis J. Dirks, and Kenneth L. Wolfe, each of the Trustees oversees 301 funds advised by FMR or an affiliate. Mr. McCoy oversees 303 funds advised by FMR or an affiliate. Mr. Dirks and Mr. Wolfe oversee 233 funds advised by FMR or an affiliate.
The Trustees hold office without limit in time except that (a) any Trustee may resign; (b) any Trustee may be removed by written instrument, signed by at least two-thirds of the number of Trustees prior to such removal; (c) any Trustee who requests to be retired or who has become incapacitated by illness or injury may be retired by written instrument signed by a majority of the other Trustees; and (d) any Trustee may be removed at any special meeting of shareholders by a two-thirds vote of the outstanding voting securities of the trust. In any event, each non-interested Trustee shall retire not later than the last day of the calendar year in which his or her 72nd birthday occurs. The executive officers and Advisory Board Member hold office without limit in time, except that any officer and Advisory Board Member may resign or may be removed by a vote of a majority of the Trustees at any regular meeting or any special meeting of the Trustees. Except as indicated, each individual has held the office shown or other offices in the same company for the past five years.
The fund's Statement of Additional Information (SAI) includes more information about the Trustees. To request a free copy, call Fidelity at 1-800-544-5429.
Interested Trustees*:
Correspondence intended for each Trustee who is an "interested person" (as defined in the 1940 Act) may be sent to Fidelity Investments, 82 Devonshire Street, Boston, Massachusetts 02109.
Name, Age; Principal Occupation |
Edward C. Johnson 3d (74)** |
| Year of Election or Appointment: 1981 Mr. Johnson is Chairman of the Board of Trustees. Mr. Johnson serves as Chief Executive Officer, Chairman, and a Director of FMR Corp.; a Director and Chairman of the Board and of the Executive Committee of FMR; Chairman and a Director of Fidelity Management & Research (Far East) Inc.; Chairman (1998) and a Director of Fidelity Investments Money Management, Inc.; and Chairman (2001) and a Director (2000) of FMR Co., Inc. |
Abigail P. Johnson (43)** |
| Year of Election or Appointment: 2001 Senior Vice President of VIP Overseas (2001). Ms. Johnson also serves as Senior Vice President of other Fidelity funds (2001). She is President and a Director of FMR (2001), Fidelity Investments Money Management, Inc. (2001), FMR Co., Inc. (2001), and a Director of FMR Corp. Previously, Ms. Johnson managed a number of Fidelity funds. |
Laura B. Cronin (50) |
| Year of Election or Appointment: 2003 Ms. Cronin is an Executive Vice President (2002) and Chief Financial Officer (2002) of FMR Corp. and is a member of the Fidelity Management Committee (2003). Previously, Ms. Cronin served as Vice President of Finance of FMR (1997-1999), and Chief Financial Officer of FMR (1999-2001), Fidelity Personal Investments (2001), and Fidelity Brokerage Company (2001-2002). |
Robert L. Reynolds (52) |
| Year of Election or Appointment: 2003 Mr. Reynolds is a Director (2003) and Chief Operating Officer (2002) of FMR Corp. and is the head of the Fidelity Management Committee (2003). He also serves on the Board at Fidelity Investments Canada, Ltd. (2000). Previously, Mr. Reynolds served as President of Fidelity Investments Institutional Retirement Group (1996-2000). |
* Trustees have been determined to be "Interested Trustees" by virtue of, among other things, their affiliation with the trust or various entities under common control with FMR.
** Edward C. Johnson 3d, Trustee, is Abigail P. Johnson's father.
Overseas Portfolio
Trustees and Officers - continued
Non-Interested Trustees:
Correspondence intended for each non-interested Trustee (that is, the Trustees other than the Interested Trustees) may be sent to Fidelity Investments, P.O. Box 55235, Boston, Massachusetts 02205-5235.
Name, Age; Principal Occupation |
Dennis J. Dirks (56) |
| Year of Election or Appointment: 2005 Mr. Dirks also serves as a Trustee (2005) or Member of the Advisory Board (2004) of other investment companies advised by FMR. Prior to his retirement in May 2003, Mr. Dirks was Chief Operating Officer and a member of the Board of The Depository Trust & Clearing Corporation (DTCC) (1999-2003). He also served as President, Chief Operating Officer, and Board member of The Depository Trust Company (DTC) (1999-2003) and President and Board member of the National Securities Clearing Corporation (NSCC) (1999-2003). In addition, Mr. Dirks served as Chief Executive Officer and Board member of the Government Securities Clearing Corporation (2001-2003) and Chief Executive Officer and Board member of the Mortgage-Backed Securities Clearing Corporation (2001-2003). |
Robert M. Gates (61) |
| Year of Election or Appointment: 1997 Dr. Gates is Vice Chairman of the non-interested Trustees (2005). Dr. Gates is Vice Chairman of the non-interested Trustees (2005). Dr. Gates is President of Texas A&M University (2002). He was Director of the Central Intelligence Agency (CIA) from 1991 to 1993. From 1989 to 1991, Dr. Gates served as Assistant to the President of the United States and Deputy National Security Advisor. Dr. Gates is a Director of NACCO Industries, Inc. (mining and manufacturing), Parker Drilling Co., Inc. (drilling and rental tools for the energy industry, 2001), and Brinker International (restaurant management, 2003). He also serves as a member of the Advisory Board of VoteHere.net (secure Internet voting, 2001). Previously, Dr. Gates served as a Director of LucasVarity PLC (automotive components and diesel engines), a Director of TRW Inc. (automotive, space, defense, and information technology), and Dean of the George Bush School of Government and Public Service at Texas A&M University (1999-2001). Dr. Gates also is a Trustee of the Forum for International Policy. |
George H. Heilmeier (68) |
| Year of Election or Appointment: 2004 Dr. Heilmeier is Chairman Emeritus of Telcordia Technologies (communication software and systems), where prior to his retirement, he served as company Chairman and Chief Executive Officer. He currently serves on the Boards of Directors of The Mitre Corporation (systems engineering and information technology support for the government), INET Technologies Inc. (telecommunications network surveillance, 2001), Teletech Holdings (customer management services), and HRL Laboratories (private research and development, 2004). He is Chairman of the General Motors Technology Advisory Committee and a Life Fellow of the Institute of Electrical and Electronics Engineers (IEEE) (2000). Dr. Heilmeier is a member of the Defense Science Board and the National Security Agency Advisory Board. He is also a member of the National Academy of Engineering, the American Academy of Arts and Sciences, and the Board of Overseers of the School of Engineering and Applied Science of the University of Pennsylvania. Previously, Dr. Heilmeier served as a Director of TRW Inc. (automotive, space, defense, and information technology, 1992-2002), Compaq (1994-2002), and Automatic Data Processing, Inc. (ADP) (technology-based business outsourcing, 1995-2002). |
Marie L. Knowles (58) |
| Year of Election or Appointment: 2001 Prior to Ms. Knowles' retirement in June 2000, she served as Executive Vice President and Chief Financial Officer of Atlantic Richfield Company (ARCO) (diversified energy, 1996-2000). From 1993 to 1996, she was a Senior Vice President of ARCO and President of ARCO Transportation Company. She served as a Director of ARCO from 1996 to 1998. She currently serves as a Director of Phelps Dodge Corporation (copper mining and manufacturing) and McKesson Corporation (healthcare service, 2002). Ms. Knowles is a Trustee of the Brookings Institution and the Catalina Island Conservancy and also serves as a member of the Advisory Board for the School of Engineering of the University of Southern California. |
Ned C. Lautenbach (60) |
| Year of Election or Appointment: 2000 Mr. Lautenbach has been a partner of Clayton, Dubilier & Rice, Inc. (private equity investment firm) since September 1998. Previously, Mr. Lautenbach was with the International Business Machines Corporation (IBM) from 1968 until his retirement in 1998. He was most recently Senior Vice President and Group Executive of Worldwide Sales and Services. From 1993 to 1995, he was Chairman of IBM World Trade Corporation, and from 1994 to 1998 was a member of IBM's Corporate Executive Committee. Mr. Lautenbach serves as Co-Chairman and a Director of Covansys, Inc. (global provider of business and technology solutions, 2000). In addition, he is a Director of Italtel Holding S.p.A. (telecommunications (Milan, Italy), 2004) and Eaton Corporation (diversified industrial) as well as the Philharmonic Center for the Arts in Naples, Florida (1999). He also is a member of the Council on Foreign Relations. |
Marvin L. Mann (71) |
| Year of Election or Appointment: 1993 Mr. Mann is Chairman of the non-interested Trustees (2001). He is Chairman Emeritus of Lexmark International, Inc. (computer peripherals), where he served as CEO until April 1998, retired as Chairman May 1999, and remains a member of the Board. Prior to 1991, he held the positions of Vice President of International Business Machines Corporation (IBM) and President and General Manager of various IBM divisions and subsidiaries. He is a member of the Executive Committee of the Independent Director's Council of the Investment Company Institute. In addition, Mr. Mann is a member of the President's Cabinet at the University of Alabama and the Board of Visitors of the Culverhouse College of Commerce and Business Administration at the University of Alabama. |
William O. McCoy (71) |
| Year of Election or Appointment: 1997 Prior to his retirement in December 1994, Mr. McCoy was Vice Chairman of the Board of BellSouth Corporation (telecommunications) and President of BellSouth Enterprises. He is currently a Director of Liberty Corporation (holding company), Duke Realty Corporation (real estate), and Progress Energy, Inc. (electric utility). He is also a partner of Franklin Street Partners (private investment management firm) and a member of the Research Triangle Foundation Board. In addition, Mr. McCoy served as the Interim Chancellor (1999-2000) and a member of the Board of Visitors (1994-1998) for the University of North Carolina at Chapel Hill and currently serves on the Board of Directors of the University of North Carolina Health Care System and the Board of Visitors of the Kenan-Flagler Business School (University of North Carolina at Chapel Hill). He also served as Vice President of Finance for the University of North Carolina (16-school system, 1995-1998). |
Cornelia M. Small (60) |
| Year of Election or Appointment: 2005 Ms. Small is a member (2000) and Chairperson (2002) of the Investment Committee, and a member (2002) of the Board of Trustees of Smith College. Previously, she served as Chief Investment Officer (1999-2000), Director of Global Equity Investments (1996-1999), and a member of the Board of Directors of Scudder, Stevens & Clark (1990-1997) and Scudder Kemper Investments (1997-1998). In addition, Ms. Small served as Co-Chair (2000-2003) of the Annual Fund for the Fletcher School of Law and Diplomacy. |
William S. Stavropoulos (65) |
| Year of Election or Appointment: 2001 Mr. Stavropoulos is Chairman of the Board (2000), CEO (2002), a position he previously held from 1995-2000, Chairman of the Executive Committee (2000), and a Member of the Board of Directors of The Dow Chemical Company. Since joining The Dow Chemical Company in 1967, Mr. Stavropoulos served in numerous senior management positions, including President (1993-2000; 2002-2003). Currently, he is a Director of NCR Corporation (data warehousing and technology solutions), BellSouth Corporation (telecommunications), Chemical Financial Corporation, and Maersk Inc. (industrial conglomerate, 2002). He also serves as a member of the Board of Trustees of the American Enterprise Institute for Public Policy Research. In addition, Mr. Stavropoulos is a member of The Business Council, J.P. Morgan International Council and the University of Notre Dame Advisory Council for the College of Science. |
Kenneth L. Wolfe (65) |
| Year of Election or Appointment: 2005 Mr. Wolfe also serves as a Trustee (2005) or Member of the Advisory Board (2004) of other investment companies advised by FMR. Prior to his retirement in 2001, Mr. Wolfe was Chairman and Chief Executive Officer of Hershey Foods Corporation (1993-2001). He currently serves as a member of the boards of Adelphia Communications Corporation (2003), Bausch & Lomb, Inc., and Revlon Inc. (2004). |
Advisory Board Member and Executive Officers:
Correspondence intended for each executive officer and Mr. Lynch may be sent to Fidelity Investments, 82 Devonshire Street, Boston, Massachusetts 02109.
Name, Age; Principal Occupation |
Peter S. Lynch (61) |
| Year of Election or Appointment: 2003 Member of the Advisory Board of Variable Insurance Products Fund. Vice Chairman and a Director of FMR, and Vice Chairman (2001) and a Director (2000) of FMR Co., Inc. Previously, Mr. Lynch served as a Trustee of the Fidelity funds (1990-2003). Prior to May 31, 1990, he was a Director of FMR and Executive Vice President of FMR (a position he held until March 31, 1991), Vice President of Fidelity® Magellan® Fund and FMR Growth Group Leader, and Managing Director of FMR Corp. Mr. Lynch was also Vice President of Fidelity Investments Corporate Services. In addition, he serves as a Trustee of Boston College, Massachusetts Eye & Ear Infirmary, Historic Deerfield, John F. Kennedy Library, and the Museum of Fine Arts of Boston. |
Philip L. Bullen (45) |
| Year of Election or Appointment: 2001 Vice President of VIP Overseas. Mr. Bullen also serves as Vice President of certain Equity Funds (2001) and certain High Income Funds (2001). He is Senior Vice President of FMR (2001) and FMR Co., Inc. (2001), President and a Director of Fidelity Management & Research (Far East) Inc. (2001), President and a Director of Fidelity Management & Research (U.K.) Inc. (2002), and a Director of Strategic Advisers, Inc. (2002). Before joining Fidelity Investments, Mr. Bullen was President and Chief Investment Officer of Santander Global Advisors (1997-2000) and President and Chief Executive Officer of Boston's Baring Asset Management Inc. (1994-1997). |
Richard R. Mace, Jr. (43) |
| Year of Election or Appointment: 1996 Senior Vice President of VIP Overseas and other funds advised by FMR. |
Eric D. Roiter (56) |
| Year of Election or Appointment: 1998 Secretary of VIP Overseas. He also serves as Secretary of other Fidelity funds; Vice President, General Counsel, and Secretary of FMR Co., Inc. (2001-present) and FMR; Vice President and Secretary of FDC; Assistant Secretary of Fidelity Management & Research (U.K.) Inc. (2001-present), Fidelity Management & Research (Far East) Inc. (2001-present), and Fidelity Investments Money Management, Inc. (2001-present). Mr. Roiter is an Adjunct Member, Faculty of Law, at Boston College Law School (2003-present). |
Stuart Fross (45) |
| Year of Election or Appointment: 2003 Assistant Secretary of VIP Overseas. Mr. Fross also serves as Assistant Secretary of other Fidelity funds (2003) and is an employee of FMR. |
Christine Reynolds (46) |
| Year of Election or Appointment: 2004 President, Treasurer, and Anti-Money Laundering (AML) officer of VIP Overseas. Ms. Reynolds also serves as President, Treasurer, and AML officer of other Fidelity funds (2004) and is a Vice President (2003) and an employee (2002) of FMR. Before joining Fidelity Investments, Ms. Reynolds worked at PricewaterhouseCoopers LLP (PwC) (1980-2002), where she was most recently an audit partner with PwC's investment management practice. |
Timothy F. Hayes (54) |
| Year of Election or Appointment: 2002 Chief Financial Officer of VIP Overseas. Mr. Hayes also serves as Chief Financial Officer of other Fidelity funds (2002). Recently he was appointed President of Fidelity Service Company (2003) where he also serves as a Director. Mr. Hayes also serves as President of Fidelity Investments Operations Group (FIOG, 2002), which includes Fidelity Pricing and Cash Management Services Group (FPCMS), where he was appointed President in 1998. Previously, Mr. Hayes served as Chief Financial Officer of Fidelity Investments Corporate Systems and Service Group (1998) and Fidelity Systems Company (1997-1998). |
Kenneth A. Rathgeber (57) |
| Year of Election or Appointment: 2004 Chief Compliance Officer of VIP Overseas. Mr. Rathgeber also serves as Chief Compliance Officer of other Fidelity funds (2004) and Executive Vice President of Risk Oversight for Fidelity Investments (2002). Previously, he served as Executive Vice President and Chief Operating Officer for Fidelity Investments Institutional Services Company, Inc. (1998-2002). |
John R. Hebble (46) |
| Year of Election or Appointment: 2003 Deputy Treasurer of VIP Overseas. Mr. Hebble also serves as Deputy Treasurer of other Fidelity funds (2003), and is an employee of FMR. Before joining Fidelity Investments, Mr. Hebble worked at Deutsche Asset Management where he served as Director of Fund Accounting (2002-2003) and Assistant Treasurer of the Scudder Funds (1998-2003). |
Kimberley H. Monasterio (41) |
| Year of Election or Appointment: 2004 Deputy Treasurer of VIP Overseas. Ms. Monasterio also serves as Deputy Treasurer of other Fidelity funds (2004) and is an employee of FMR (2004). Before joining Fidelity Investments, Ms. Monasterio served as Treasurer (2000-2004) and Chief Financial Officer (2002-2004) of the Franklin Templeton Funds and Senior Vice President of Franklin Templeton Services, LLC (2000-2004). |
John H. Costello (58) |
| Year of Election or Appointment: 1987 Assistant Treasurer of VIP Overseas. Mr. Costello also serves as Assistant Treasurer of other Fidelity funds and is an employee of FMR. |
Peter L. Lydecker (50) |
| Year of Election or Appointment: 2004 Assistant Treasurer of VIP Overseas. Mr. Lydecker also serves as Assistant Treasurer of other Fidelity funds (2004) and is an employee of FMR. |
Mark Osterheld (49) |
| Year of Election or Appointment: 2002 Assistant Treasurer of VIP Overseas. Mr. Osterheld also serves as Assistant Treasurer of other Fidelity funds (2002) and is an employee of FMR. |
Kenneth B. Robins (35) |
| Year of Election or Appointment: 2004 Assistant Treasurer of VIP Overseas. Mr. Robins also serves as Assistant Treasurer of other Fidelity funds (2004) and is an employee of FMR (2004). Before joining Fidelity Investments, Mr. Robins worked at KPMG LLP, where he was a partner in KPMG's department of professional practice (2002-2004) and a Senior Manager (1999-2000). In addition, Mr. Robins served as Assistant Chief Accountant, United States Securities and Exchange Commission (2000-2002). |
Overseas Portfolio
Distributions
The Board of Trustees of Variable Insurance Products: Overseas Portfolio voted to pay to shareholders of record at the opening of business on record date, the following distributions per share derived from capital gains realized from sales of portfolio securities and dividends derived from net investment income:
| Pay Date | Record Date | Dividends | Capital Gains |
Initial Class R | 2/11/05 | 2/11/05 | $.12 | $.09 |
Service Class R | 2/11/05 | 2/11/05 | $.10 | $.09 |
Service Class 2R | 2/11/05 | 2/11/05 | $.095 | $.09 |
The amounts per share which represent income derived from sources within, and taxes paid to, foreign countries or possessions of the United States are as follows:
| Pay Date | Income | Taxes |
Initial Class R | 2/13/04 | $.199 | $.019 |
Service Class R | 2/13/04 | $.189 | $.019 |
Service Class 2R | 2/13/04 | $.179 | $.019 |
The fund will notify shareholders in January 2005 of amounts for use in preparing 2004 income tax returns.
Annual Report
Proxy Voting Results
A special meeting of the fund's shareholders was held on December 14, 2004. The results of votes taken among shareholders on proposals before them are reported below. Each vote reported represents one dollar of net asset value held on the record date for the meeting.
PROPOSAL 1 |
To amend the Declaration of Trust to allow the Board of Trustees, if permitted by applicable law, to authorize fund mergers without shareholder approval. A |
| # of
Votes | % of
Votes |
Affirmative | 15,331,508,529.96 | 81.853 |
Against | 2,429,553,894.02 | 12.972 |
Abstain | 969,378,618.94 | 5.175 |
TOTAL | 18,730,441,042.92 | 100.000 |
PROPOSAL 2 |
To elect a Board of Trustees. A |
| # of
Votes | % of
Votes |
J. Michael Cook |
Affirmative | 17,770,642,454.98 | 94.876 |
Withheld | 959,798,587.94 | 5.124 |
TOTAL | 18,730,441,042.92 | 100.000 |
Ralph F. Cox |
Affirmative | 17,759,356,374.26 | 94.815 |
Withheld | 971,084,668.66 | 5.185 |
TOTAL | 18,730,441,042.92 | 100.000 |
Laura B. Cronin |
Affirmative | 17,797,888,742.24 | 95.021 |
Withheld | 932,552,300.68 | 4.979 |
TOTAL | 18,730,441,042.92 | 100.000 |
Dennis J. Dirks B |
Affirmative | 17,802,602,074.45 | 95.046 |
Withheld | 927,838,968.47 | 4.954 |
TOTAL | 18,730,441,042.92 | 100.000 |
Robert M. Gates |
Affirmative | 17,784,855,823.58 | 94.952 |
Withheld | 945,585,219.34 | 5.048 |
TOTAL | 18,730,441,042.92 | 100.000 |
George H. Heilmeier |
Affirmative | 17,768,875,556.56 | 94.866 |
Withheld | 961,565,486.36 | 5.134 |
TOTAL | 18,730,441,042.92 | 100.000 |
Abigail P. Johnson |
Affirmative | 17,781,929,073.06 | 94.936 |
Withheld | 948,511,969.86 | 5.064 |
TOTAL | 18,730,441,042.92 | 100.000 |
Edward C. Johnson 3d |
Affirmative | 17,752,140,336.45 | 94.777 |
Withheld | 978,300,706.47 | 5.223 |
TOTAL | 18,730,441,042.92 | 100.000 |
Donald J. Kirk |
Affirmative | 17,772,467,361.45 | 94.885 |
Withheld | 957,973,681.47 | 5.115 |
TOTAL | 18,730,441,042.92 | 100.000 |
| # of
Votes | % of
Votes |
Marie L. Knowles |
Affirmative | 17,776,922,254.30 | 94.909 |
Withheld | 953,518,788.62 | 5.091 |
TOTAL | 18,730,441,042.92 | 100.000 |
Ned C. Lautenbach |
Affirmative | 17,804,221,564.95 | 95.055 |
Withheld | 926,219,477.97 | 4.945 |
TOTAL | 18,730,441,042.92 | 100.000 |
Marvin L. Mann |
Affirmative | 17,763,277,607.06 | 94.836 |
Withheld | 967,163,435.86 | 5.164 |
TOTAL | 18,730,441,042.92 | 100.000 |
William O. McCoy |
Affirmative | 17,758,560,162.11 | 94.811 |
Withheld | 971,880,880.81 | 5.189 |
TOTAL | 18,730,441,042.92 | 100.000 |
Robert L. Reynolds |
Affirmative | 17,806,026,904.06 | 95.065 |
Withheld | 924,414,138.86 | 4.935 |
TOTAL | 18,730,441,042.92 | 100.000 |
Cornelia M. SmallB |
Affirmative | 17,798,878,892.31 | 95.026 |
Withheld | 931,562,150.61 | 4.974 |
TOTAL | 18,730,441,042.92 | 100.000 |
William S. Stavropoulos |
Affirmative | 17,786,496,107.78 | 94.960 |
Withheld | 943,944,935.14 | 5.040 |
TOTAL | 18,730,441,042.92 | 100.000 |
PROPOSAL 9 |
To amend the fund's fundamental investment limitation concerning borrowing. |
| # of
Votes | % of
Votes |
Affirmative | 1,415,911,097.88 | 89.754 |
Against | 58,404,622.92 | 3.702 |
Abstain | 103,230,926.39 | 6.544 |
TOTAL | 1,577,546,647.19 | 100.000 |
PROPOSAL 10 |
To amend the fund's fundamental investment limitation concerning lending. |
| # of
Votes | % of
Votes |
Affirmative | 1,415,760,262.71 | 89.744 |
Against | 59,625,618.33 | 3.780 |
Abstain | 102,160,766.15 | 6.476 |
TOTAL | 1,577,546,647.19 | 100.000 |
A Denotes trust-wide proposals and voting results. B Effective January 1, 2005. |
Overseas Portfolio
Investment Adviser
Fidelity Management & Research Company
Boston, MA
Investment Sub-Advisers
FMR Co., Inc.
Fidelity Management & Research (U.K.) Inc.
Fidelity Management & Research (Far East) Inc.
Fidelity International Investment Advisors
Fidelity International Investment Advisors (U.K.) Limited
Fidelity Investments Japan Limited
General Distributor
Fidelity Distributors Corporation
Boston, MA
Transfer and Shareholder Servicing Agent
Fidelity Investments Institutional Operations Company, Inc.
Boston, MA
Custodian
JPMorgan Chase Bank
New York, NY
VIPOVRSR-ANN-0205
1.781996.102
Fidelity® Variable Insurance Products:
Value Portfolio
Annual Report
December 31, 2004
(2_fidelity_logos) (Registered_Trademark)
Contents
Performance | 3 | How the fund has done over time. |
Management's Discussion | 4 | The manager's review of fund performance, strategy and outlook. |
Shareholder Expense Example | 5 | An example of shareholder expenses. |
Investment Summary | 6 | A summary of the fund's investments at period end. |
Investments | 7 | A complete list of the fund's investments with their
market values. |
Financial Statements | 10 | Statements of assets and liabilities, operations, and
changes in net assets, as well as financial highlights. |
Notes | 14 | Notes to the financial statements. |
Report of Independent Registered Public Accounting Firm | 17 | |
Trustees and Officers | 18 | |
Proxy Voting Results | 23 | |
| | |
To view a fund's proxy voting guidelines and proxy voting record for the 12-month period ended June 30, visit www.fidelity.com/proxyvotingresults or visit the Securities and Exchange Commission's (SEC) web site at www.sec.gov. You may also call 1-800-544-5429 to request a free copy of the proxy voting guidelines.
Fidelity Variable Insurance Products are separate account options which are purchased through a variable insurance contract.
Standard & Poor's, S&P and S&P 500 are registered service marks of The McGraw-Hill Companies, Inc. and have been licensed for use by Fidelity Distributors Corporation.
Other third party marks appearing herein are the property of their respective owners.
All other marks appearing herein are registered or unregistered trademarks or service marks of FMR Corp. or an affiliated company.
(Recycle graphic) This report is printed on recycled paper using soy-based inks.
This report and the financial statements contained herein are submitted for the general information of the shareholders of the fund. This report is not authorized for distribution to prospective investors in the fund unless preceded or accompanied by an effective prospectus.
A fund files its complete schedule of portfolio holdings with the SEC for the first and third quarters of each fiscal year on Form N-Q. Forms N-Q are available on the SEC's web site at http://www.sec.gov. A fund's Forms N-Q may be reviewed and copied at the SEC's Public Reference Room in Washington, DC. Information regarding the operation of the SEC's Public Reference Room may be obtained by calling 1-800-SEC-0330. For a complete list of a fund's portfolio holdings, view the most recent quarterly holdings report, semiannual report, or annual report on Fidelity's web site at http://www.advisor.fidelity.com.
NOT FDIC INSURED · MAY LOSE VALUE · NO BANK GUARANTEE
Neither the fund nor Fidelity Distributors Corporation is a bank.
Annual Report
Fidelity Variable Insurance Products: Value Portfolio
Performance: The Bottom Line
Average annual total return reflects the change in the value of an investment, assuming reinvestment of the class' dividend income and capital gains (the profits earned upon the sale of securities that have grown in value) and assuming a constant rate of performance each year. During periods of reimbursement by Fidelity, a fund's total return will be greater than it would be had the reimbursement not occurred. Performance numbers are net of all underlying fund operating expenses, but do not include any insurance charges imposed by your insurance company's separate account. If performance information included the effect of these additional charges, the total returns would have been lower. How a fund did yesterday is no guarantee of how it will do tomorrow.
Average Annual Total Returns
Periods ended December 31, 2004 | | Past 1
year | Life of fundA |
Fidelity ® VIP: Value - Initial Class | | 11.24% | 5.50% |
Fidelity VIP: Value - Service ClassB | | 11.07% | 5.37% |
Fidelity VIP: Value - Service Class 2C | | 10.93% | 5.23% |
A From May 9, 2001.
B Performance for Service Class shares reflects an asset-based service fee (12b-1 fee).
C Performance for Service Class 2 shares reflects an asset-based service fee (12b-1 fee).
$10,000 Over Life of Fund
Let's say hypothetically that $10,000 was invested in Fidelity® Variable Insurance Products: Value Portfolio - Initial Class on May 9, 2001, when the fund started. The chart shows how the value of your investment would have changed, and also shows how the Russell 3000® Value Index performed over the same period.
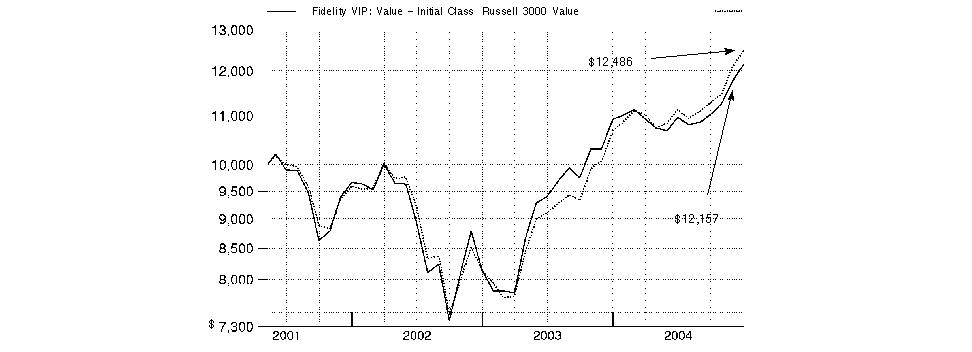
Annual Report
Fidelity Variable Insurance Products: Value Portfolio
Management's Discussion of Fund Performance
Comments from Steve DuFour, Portfolio Manager of Fidelity® Variable Insurance Products: Value Portfolio
The year ending December 31, 2004, generally was positive for equity investors, as many stock market benchmarks produced double-digit gains. Broad-based themes included the continued dominance of small-cap stocks, which outperformed large-caps for the sixth consecutive year. The small-cap Russell 2000® Index was up 18.33% in 2004, while the larger-cap Standard & Poor's 500SM Index rose 10.88%. Value stocks ended the year well ahead of growth stocks: The Russell 3000® Value Index advanced 16.94%, compared to 6.93% for the Russell 3000 Growth Index. Energy and basic materials stocks led the market upward. Energy stocks were boosted by record-high oil prices, while strong demand from China helped support commodity prices. The health care sector was among the market's weakest performers. Technology also fell off the pace, though it was helped by a rally late in the year. The tech-heavy NASDAQ Composite® Index returned 9.15%, thanks primarily to a 14.87% jump in the fourth quarter. Elsewhere, the Dow Jones Industrial AverageSM gained 5.37% for the year.
For the one-year period ending December 31, 2004, Value Portfolio underperformed the 16.94% return of the Russell 3000 Value Index, but surpassed the 10.36% advance of the LipperSM Variable Annuity Growth Funds Average. The fund's emphasis on large-capitalization stocks caused some of its underperformance relative to the Russell index. Mid- and small-caps, which made up a greater percentage of the index than the fund, generally outperformed larger-cap issues during the period. Underweighting banking, utilities and real estate - three of the better-performing groups in the index - also hurt the fund's relative results. Among the fund's biggest individual detractors were brokerage firms Charles Schwab and Morgan Stanley, as well as Internet company IAC/InterActiveCorp, all three of which declined. On the positive side of the ledger, good stock selection and maintaining a higher exposure to the strong-performing energy sector boosted the fund's return relative to its index. Natural gas producer Burlington Resources was among the fund's top-performing holdings in this sector. Other positions that made strong contributions to the fund's performance were railroad operator Norfolk Southern and Eastman Chemical, a provider of raw materials for industrial uses.
The views expressed in this statement reflect those of the portfolio manager only through the end of the period of the report as stated on the cover and do not necessarily represent the views of Fidelity or any other person in the Fidelity organization. Any such views are subject to change at any time based upon market or other conditions and Fidelity disclaims any responsibility to update such views. These views may not be relied on as investment advice and, because investment decisions for a Fidelity fund are based on numerous factors, may not be relied on as an indication of trading intent on behalf of any Fidelity fund.
Annual Report
Fidelity Variable Insurance Products: Value Portfolio
Shareholder Expense Example
As a shareholder of the Fund, you incur two types of costs: (1) transaction costs, and (2) ongoing costs, including management fees, distribution and/or service (12b-1) fees and other Fund expenses. This Example is intended to help you understand your ongoing costs (in dollars) of investing in the Fund and to compare these costs with the ongoing costs of investing in other mutual funds.
The Example is based on an investment of $1,000 invested at the beginning of the period and held for the entire period (July 1, 2004 to December 31, 2004).
Actual Expenses
The first line of the table below for each class of the Fund provides information about actual account values and actual expenses. You may use the information in this line, together with the amount you invested, to estimate the expenses that you paid over the period. Simply divide your account value by $1,000.00 (for example, an $8,600 account value divided by $1,000.00 = 8.6), then multiply the result by the number in the first line for a class of the Fund under the heading entitled "Expenses Paid During Period" to estimate the expenses you paid on your account during this period. The estimate of expenses does not include any fees or other expenses of any variable annuity or variable life insurance product. If they were, the estimate of expenses you paid during the period would be higher, and your ending account value would be lower.
Hypothetical Example for Comparison Purposes
The second line of the table below for each class of the Fund provides information about hypothetical account values and hypothetical expenses based on a Class' actual expense ratio and an assumed rate of return of 5% per year before expenses, which is not the Class' actual return. The hypothetical account values and expenses may not be used to estimate the actual ending account balance or expenses you paid for the period. You may use this information to compare the ongoing costs of investing in the Fund and other funds. To do so, compare this 5% hypothetical example with the 5% hypothetical examples that appear in the shareholder reports of the other funds. The estimate of expenses does not include any fees or other expenses of any variable annuity or variable life insurance product. If they were, the estimate of expenses you paid during the period would be higher, and your ending account value would be lower.
Please note that the expenses shown in the table are meant to highlight your ongoing costs only and do not reflect any transaction costs. Therefore, the second line of the table is useful in comparing ongoing costs only, and will not help you determine the relative total costs of owning different funds.
| Beginning
Account Value
July 1, 2004 | Ending
Account Value
December 31, 2004 | Expenses Paid
During Period*
July 1, 2004
to December 31, 2004 |
Initial Class | | | |
Actual | $ 1,000.00 | $ 1,108.30 | $ 5.30** |
HypotheticalA | $ 1,000.00 | $ 1,020.11 | $ 5.08** |
Service Class | | | |
Actual | $ 1,000.00 | $ 1,107.70 | $ 5.83** |
HypotheticalA | $ 1,000.00 | $ 1,019.61 | $ 5.58** |
Service Class 2 | | | |
Actual | $ 1,000.00 | $ 1,107.20 | $ 6.62** |
HypotheticalA | $ 1,000.00 | $ 1,018.85 | $ 6.34** |
A 5% return per year before expenses
* Expenses are equal to each Class' annualized expense ratio (shown in the table below); multiplied by the average account value over the period, multiplied by 184/366 (to reflect the one-half year period).
| Annualized
Expense Ratio |
Initial Class | 1.00%** |
Service Class | 1.10%** |
Service Class 2 | 1.25%** |
** If changes to voluntary expense limitations effective February 1, 2005 had been in effect during the period, the annualized expense ratio and the expenses paid in the actual and hypothetical examples above would have been as follows:
| Annualized
Expense Ratio | Expenses Paid |
Initial Class | .85% | |
Actual | | $ 4.51 |
HypotheticalA | | $ 4.32 |
Service Class | .95% | |
Actual | | $ 5.03 |
HypotheticalA | | $ 4.82 |
Service Class 2 | 1.10% | |
Actual | | $ 5.83 |
HypotheticalA | | $ 5.58 |
A 5% return per year before expenses
Annual Report
Fidelity Variable Insurance Products: Value Portfolio
Investment Summary
Top Five Stocks as of December 31, 2004 |
| % of fund's net assets |
General Electric Co. | 4.8 |
Exxon Mobil Corp. | 4.1 |
Verizon Communications, Inc. | 3.5 |
Eastman Chemical Co. | 3.2 |
Bank of America Corp. | 3.1 |
| 18.7 |
Top Five Market Sectors as of December 31, 2004 |
| % of fund's net assets |
Financials | 30.3 |
Industrials | 13.6 |
Information Technology | 12.4 |
Consumer Discretionary | 9.2 |
Health Care | 6.9 |
Asset Allocation as of December 31, 2004 |
% of fund's net assets* |
 | Stocks | 99.7% | |
 | Net Other Assets | 0.3% | |
* Foreign investments | 2.4% | |

Annual Report
Fidelity Variable Insurance Products: Value Portfolio
Investments December 31, 2004
Showing Percentage of Net Assets
Common Stocks - 97.2% |
| Shares | | Value (Note 1) |
CONSUMER DISCRETIONARY - 9.2% |
Auto Components - 0.5% |
Modine Manufacturing Co. | 800 | | $ 27,016 |
Internet & Catalog Retail - 0.6% |
Amazon.com, Inc. (a) | 700 | | 31,003 |
Media - 6.6% |
News Corp. Class B | 8,100 | | 155,520 |
Omnicom Group, Inc. | 660 | | 55,651 |
Walt Disney Co. | 900 | | 25,020 |
XM Satellite Radio Holdings, Inc. Class A (a) | 3,230 | | 121,513 |
| | 357,704 |
Multiline Retail - 0.7% |
Dollar Tree Stores, Inc. (a) | 500 | | 14,340 |
JCPenney Co., Inc. | 200 | | 8,280 |
The May Department Stores Co. | 600 | | 17,640 |
| | 40,260 |
Specialty Retail - 0.8% |
Home Depot, Inc. | 1,000 | | 42,740 |
TOTAL CONSUMER DISCRETIONARY | | 498,723 |
CONSUMER STAPLES - 6.4% |
Beverages - 0.5% |
The Coca-Cola Co. | 650 | | 27,060 |
Food & Staples Retailing - 2.0% |
Wal-Mart Stores, Inc. | 1,990 | | 105,112 |
Food Products - 1.1% |
Campbell Soup Co. | 500 | | 14,945 |
General Mills, Inc. | 600 | | 29,826 |
McCormick & Co., Inc. (non-vtg.) | 420 | | 16,212 |
| | 60,983 |
Household Products - 0.1% |
Procter & Gamble Co. | 100 | | 5,508 |
Tobacco - 2.7% |
Altria Group, Inc. | 2,270 | | 138,697 |
Loews Corp. - Carolina Group | 200 | | 5,790 |
| | 144,487 |
TOTAL CONSUMER STAPLES | | 343,150 |
ENERGY - 5.9% |
Energy Equipment & Services - 1.3% |
Halliburton Co. | 1,800 | | 70,632 |
Oil & Gas - 4.6% |
Burlington Resources, Inc. | 570 | | 24,795 |
Exxon Mobil Corp. | 4,340 | | 222,468 |
| | 247,263 |
TOTAL ENERGY | | 317,895 |
|
| Shares | | Value (Note 1) |
FINANCIALS - 28.3% |
Capital Markets - 6.4% |
Charles Schwab Corp. | 500 | | $ 5,980 |
Goldman Sachs Group, Inc. | 470 | | 48,899 |
Lehman Brothers Holdings, Inc. | 400 | | 34,992 |
Merrill Lynch & Co., Inc. | 2,200 | | 131,494 |
Morgan Stanley | 540 | | 29,981 |
State Street Corp. | 1,850 | | 90,872 |
| | 342,218 |
Commercial Banks - 7.8% |
Bank of America Corp. | 3,610 | | 169,634 |
First Horizon National Corp. | 300 | | 12,933 |
Wachovia Corp. | 2,130 | | 112,038 |
Wells Fargo & Co. | 2,040 | | 126,786 |
| | 421,391 |
Consumer Finance - 1.9% |
American Express Co. | 400 | | 22,548 |
SLM Corp. | 1,530 | | 81,687 |
| | 104,235 |
Diversified Financial Services - 2.0% |
Citigroup, Inc. | 1,160 | | 55,889 |
J.P. Morgan Chase & Co. | 1,348 | | 52,585 |
| | 108,474 |
Insurance - 4.1% |
American International Group, Inc. | 2,540 | | 166,802 |
Fidelity National Financial, Inc. | 100 | | 4,567 |
Hartford Financial Services Group, Inc. | 300 | | 20,793 |
Willis Group Holdings Ltd. | 700 | | 28,819 |
| | 220,981 |
Real Estate - 4.3% |
AvalonBay Communities, Inc. | 100 | | 7,530 |
Capital Automotive (SBI) | 160 | | 5,684 |
CenterPoint Properties Trust (SBI) | 100 | | 4,789 |
Equity Lifestyle Properties, Inc. | 2,000 | | 71,500 |
Equity Office Properties Trust | 900 | | 26,208 |
General Growth Properties, Inc. | 3,123 | | 112,928 |
| | 228,639 |
Thrifts & Mortgage Finance - 1.8% |
Fannie Mae | 690 | | 49,135 |
Freddie Mac | 300 | | 22,110 |
Washington Mutual, Inc. | 600 | | 25,368 |
| | 96,613 |
TOTAL FINANCIALS | | 1,522,551 |
HEALTH CARE - 6.9% |
Health Care Providers & Services - 2.4% |
Aetna, Inc. | 200 | | 24,950 |
Cardinal Health, Inc. | 400 | | 23,260 |
UnitedHealth Group, Inc. | 930 | | 81,868 |
| | 130,078 |
Common Stocks - continued |
| Shares | | Value (Note 1) |
HEALTH CARE - continued |
Pharmaceuticals - 4.5% |
Bristol-Myers Squibb Co. | 1,200 | | $ 30,744 |
Johnson & Johnson | 800 | | 50,736 |
Merck & Co., Inc. | 1,500 | | 48,210 |
Pfizer, Inc. | 1,890 | | 50,822 |
Roche Holding AG ADR (a) | 300 | | 34,464 |
Wyeth | 600 | | 25,554 |
| | 240,530 |
TOTAL HEALTH CARE | | 370,608 |
INDUSTRIALS - 13.6% |
Aerospace & Defense - 1.6% |
Goodrich Corp. | 380 | | 12,403 |
Hexcel Corp. (a) | 300 | | 4,350 |
Lockheed Martin Corp. | 200 | | 11,110 |
Northrop Grumman Corp. | 300 | | 16,308 |
Precision Castparts Corp. | 630 | | 41,378 |
| | 85,549 |
Commercial Services & Supplies - 0.1% |
Knoll, Inc. | 200 | | 3,500 |
Industrial Conglomerates - 4.8% |
General Electric Co. | 7,120 | | 259,880 |
Machinery - 3.7% |
Caterpillar, Inc. | 230 | | 22,427 |
Dover Corp. | 1,610 | | 67,523 |
Eaton Corp. | 600 | | 43,416 |
Navistar International Corp. (a) | 1,000 | | 43,980 |
Volvo AB ADR | 600 | | 23,790 |
| | 201,136 |
Marine - 0.1% |
Alexander & Baldwin, Inc. | 100 | | 4,242 |
Road & Rail - 3.3% |
Landstar System, Inc. (a) | 840 | | 61,858 |
Norfolk Southern Corp. | 3,170 | | 114,722 |
| | 176,580 |
TOTAL INDUSTRIALS | | 730,887 |
INFORMATION TECHNOLOGY - 11.9% |
Communications Equipment - 1.0% |
Cisco Systems, Inc. (a) | 800 | | 15,440 |
Nokia Corp. sponsored ADR | 1,800 | | 28,206 |
QUALCOMM, Inc. | 300 | | 12,720 |
| | 56,366 |
Computers & Peripherals - 0.6% |
Dell, Inc. (a) | 300 | | 12,642 |
Emulex Corp. (a) | 600 | | 10,104 |
Western Digital Corp. (a) | 700 | | 7,588 |
| | 30,334 |
|
| Shares | | Value (Note 1) |
Electronic Equipment & Instruments - 1.0% |
Agilent Technologies, Inc. (a) | 800 | | $ 19,280 |
Arrow Electronics, Inc. (a) | 500 | | 12,150 |
Avnet, Inc. (a) | 1,100 | | 20,064 |
| | 51,494 |
Semiconductors & Semiconductor Equipment - 7.4% |
Altera Corp. (a) | 500 | | 10,350 |
Analog Devices, Inc. | 1,240 | | 45,781 |
Applied Materials, Inc. (a) | 2,020 | | 34,542 |
Axcelis Technologies, Inc. (a) | 500 | | 4,065 |
Credence Systems Corp. (a) | 200 | | 1,830 |
Fairchild Semiconductor International, Inc. (a) | 500 | | 8,130 |
Freescale Semiconductor, Inc. Class B | 1,100 | | 20,196 |
Intel Corp. | 2,720 | | 63,621 |
KLA-Tencor Corp. (a) | 1,180 | | 54,964 |
Kulicke & Soffa Industries, Inc. (a) | 500 | | 4,310 |
Lam Research Corp. (a) | 1,300 | | 37,583 |
LTX Corp. (a) | 1,300 | | 9,997 |
MKS Instruments, Inc. (a) | 500 | | 9,275 |
National Semiconductor Corp. | 2,400 | | 43,080 |
Novellus Systems, Inc. (a) | 900 | | 25,101 |
ON Semiconductor Corp. (a) | 3,100 | | 14,074 |
Teradyne, Inc. (a) | 600 | | 10,242 |
| | 397,141 |
Software - 1.9% |
Microsoft Corp. | 3,940 | | 105,237 |
TOTAL INFORMATION TECHNOLOGY | | 640,572 |
MATERIALS - 6.3% |
Chemicals - 6.1% |
Air Products & Chemicals, Inc. | 70 | | 4,058 |
E.I. du Pont de Nemours & Co. | 1,300 | | 63,765 |
Eastman Chemical Co. | 3,006 | | 173,536 |
FMC Corp. (a) | 940 | | 45,402 |
Lubrizol Corp. | 200 | | 7,372 |
Lyondell Chemical Co. | 1,100 | | 31,812 |
| | 325,945 |
Containers & Packaging - 0.2% |
Owens-Illinois, Inc. (a) | 500 | | 11,325 |
TOTAL MATERIALS | | 337,270 |
TELECOMMUNICATION SERVICES - 6.5% |
Diversified Telecommunication Services - 6.1% |
Citizens Communications Co. | 300 | | 4,137 |
Sprint Corp. | 5,420 | | 134,687 |
Verizon Communications, Inc. | 4,710 | | 190,802 |
| | 329,626 |
Wireless Telecommunication Services - 0.4% |
Vodafone Group PLC sponsored ADR | 800 | | 21,904 |
TOTAL TELECOMMUNICATION SERVICES | | 351,530 |
Common Stocks - continued |
| Shares | | Value (Note 1) |
UTILITIES - 2.2% |
Electric Utilities - 1.9% |
Edison International | 400 | | $ 12,812 |
Entergy Corp. | 270 | | 18,249 |
Exelon Corp. | 1,010 | | 44,511 |
Southern Co. | 800 | | 26,816 |
| | 102,388 |
Gas Utilities - 0.3% |
AGL Resources, Inc. | 500 | | 16,620 |
TOTAL UTILITIES | | 119,008 |
TOTAL COMMON STOCKS (Cost $4,512,271) | 5,232,194 |
Convertible Preferred Stocks - 2.5% |
| | | |
FINANCIALS - 2.0% |
Thrifts & Mortgage Finance - 2.0% |
Fannie Mae 5.375% | 1 | | 105,375 |
INFORMATION TECHNOLOGY - 0.5% |
Office Electronics - 0.5% |
Xerox Corp. Series C, 6.25% | 200 | | 29,491 |
TOTAL CONVERTIBLE PREFERRED STOCKS (Cost $127,893) | 134,866 |
TOTAL INVESTMENT PORTFOLIO - 99.7% (Cost $4,640,164) | | 5,367,060 |
NET OTHER ASSETS - 0.3% | | 15,679 |
NET ASSETS - 100% | $ 5,382,739 |
Legend |
(a) Non-income producing |
Income Tax Information |
At December 31, 2004, the fund had a capital loss carryforward of approximately $99,823 all of which will expire on December 31, 2010. |
See accompanying notes which are an integral part of the financial statements.
Annual Report
Fidelity Variable Insurance Products: Value Portfolio
Financial Statements
Statement of Assets and Liabilities
December 31, 2004 |
Assets | | |
Investment in securities, at value (cost $4,640,164) - See accompanying schedule | | $ 5,367,060 |
Receivable for investments sold | | 92,384 |
Receivable for fund shares sold | | 156 |
Dividends receivable | | 6,840 |
Interest receivable | | 294 |
Prepaid expenses | | 18 |
Receivable from investment adviser for expense reductions | | 5,319 |
Other receivables | | 681 |
Total assets | | 5,472,752 |
| | |
Liabilities | | |
Payable to custodian bank | $ 40,351 | |
Payable for investments purchased | 12,341 | |
Payable for fund shares redeemed | 139 | |
Accrued management fee | 2,496 | |
Distribution fees payable | 818 | |
Other affiliated payables | 3,046 | |
Other payables and accrued expenses | 30,822 | |
Total liabilities | | 90,013 |
| | |
Net Assets | | $ 5,382,739 |
Net Assets consist of: | | |
Paid in capital | | $ 4,763,168 |
Undistributed net investment income | | 271 |
Accumulated undistributed net realized gain (loss) on investments and foreign currency transactions | | (107,596) |
Net unrealized appreciation (depreciation) on investments | | 726,896 |
Net Assets | | $ 5,382,739 |
| | |
Initial Class:
Net Asset Value, offering
price and redemption price
per share ($582,888 ÷
48,706 shares) | | $ 11.97 |
| | |
Service Class:
Net Asset Value, offering
price and redemption price
per share ($1,225,269 ÷ 102,681 shares) | | $ 11.93 |
| | |
Service Class 2:
Net Asset Value, offering
price and redemption price
per share ($3,574,582 ÷ 301,098 shares) | | $ 11.87 |
Statement of Operations
Year ended December 31, 2004 |
Investment Income | | |
Dividends | | $ 87,990 |
Special Dividends | | 11,820 |
Interest | | 2,123 |
Total income | | 101,933 |
| | |
Expenses | | |
Management fee | $ 26,508 | |
Transfer agent fees | 5,060 | |
Distribution fees | 8,818 | |
Accounting fees and expenses | 33,000 | |
Non-interested trustees' compensation | 25 | |
Custodian fees and expenses | 13,814 | |
Registration fees | 83 | |
Audit | 43,476 | |
Legal | 18 | |
Miscellaneous | 1,422 | |
Total expenses before reductions | 132,224 | |
Expense reductions | (79,738) | 52,486 |
Net investment income (loss) | | 49,447 |
Realized and Unrealized Gain (Loss) Net realized gain (loss) on: | | |
Investment securities | 202,062 | |
Foreign currency transactions | (5) | |
Total net realized gain (loss) | | 202,057 |
Change in net unrealized appreciation (depreciation) on investment securities | | 237,141 |
Net gain (loss) | | 439,198 |
Net increase (decrease) in net assets resulting from operations | | $ 488,645 |
See accompanying notes which are an integral part of the financial statements.
Annual Report
Fidelity Variable Insurance Products: Value Portfolio
Financial Statements - continued
Statement of Changes in Net Assets
| Year ended
December 31,
2004 | Year ended
December 31,
2003 |
Increase (Decrease) in Net Assets | | |
Operations | | |
Net investment income (loss) | $ 49,447 | $ 12,726 |
Net realized gain (loss) | 202,057 | 289,825 |
Change in net unrealized appreciation (depreciation) | 237,141 | 625,643 |
Net increase (decrease) in net assets resulting from operations | 488,645 | 928,194 |
Distributions to shareholders from net investment income | (49,290) | (13,029) |
Share transactions - net increase (decrease) | 694,703 | 571,085 |
Total increase (decrease) in net assets | 1,134,058 | 1,486,250 |
| | |
Net Assets | | |
Beginning of period | 4,248,681 | 2,762,431 |
End of period (including undistributed net investment income of $271 and undistributed net investment income of $612, respectively) | $ 5,382,739 | $ 4,248,681 |
Other Information: | | | |
Share Transactions | Year ended December 31, 2004 |
| Initial Class | Service Class | Service Class 2 |
Shares Sold | 13,249 | 34,898 | 176,363 |
Reinvested | 445 | 942 | 2,765 |
Redeemed | (2,986) | (22,818) | (143,324) |
Net increase (decrease) | 10,708 | 13,022 | 35,804 |
| | | |
Dollars Sold | $ 151,909 | $ 382,903 | $ 1,937,902 |
Reinvested | 5,308 | 11,214 | 32,768 |
Redeemed | (32,863) | (246,439) | (1,547,999) |
Net increase (decrease) | $ 124,354 | $ 147,678 | $ 422,671 |
| | | |
Share Transactions | Year ended December 31, 2003 |
| Initial Class | Service Class | Service Class 2 |
Shares Sold | 6,374 | 7,612 | 110,002 |
Reinvested | 117 | 277 | 828 |
Redeemed | (689) | (17,131) | (55,311) |
Net increase (decrease) | 5,802 | (9,242) | 55,519 |
| | | |
Dollars Sold | $ 61,284 | $ 72,354 | $ 1,081,987 |
Reinvested | 1,250 | 2,961 | 8,818 |
Redeemed | (6,192) | (152,027) | (499,350) |
Net increase (decrease) | $ 56,342 | $ (76,712) | $ 591,455 |
| | | |
Distributions | Year ended December 31, 2004 |
| Initial Class | Service Class | Service Class 2 |
From net investment income | $ 5,308 | $ 11,214 | $ 32,768 |
| Year ended December 31, 2003 |
| Initial Class | Service Class | Service Class 2 |
From net investment income | $ 1,250 | $ 2,961 | $ 8,818 |
See accompanying notes which are an integral part of the financial statements.
Value Portfolio
Financial Highlights - Initial Class
Years ended December 31, | 2004 | 2003 | 2002 | 2001 G |
Selected Per-Share Data | | | | |
Net asset value, beginning of period | $ 10.86 | $ 8.12 | $ 9.64 | $ 10.00 |
Income from Investment Operations | | | | |
Net investment income (loss) E | .14 F | .05 | .03 | .03 |
Net realized and unrealized gain (loss) | 1.08 | 2.72 | (1.54) | (.37) |
Total from investment operations | 1.22 | 2.77 | (1.51) | (.34) |
Distributions from net investment income | (.11) | (.03) | (.01) | (.02) |
Net asset value, end of period | $ 11.97 | $ 10.86 | $ 8.12 | $ 9.64 |
Total Return B, C, D | 11.24% | 34.16% | (15.66)% | (3.40)% |
Ratios to Average Net Assets H | | | | |
Expenses before expense reductions | 2.65% | 4.32% | 3.60% | 7.11% A |
Expenses net of voluntary waivers, if any | 1.00% | 1.28% | 1.50% | 1.50% A |
Expenses net of all reductions | .95% | 1.22% | 1.45% | 1.46% A |
Net investment income (loss) | 1.26% | .57% | .31% | .50% A |
Supplemental Data | | | | |
Net assets, end of period (000 omitted) | $ 583 | $ 413 | $ 261 | $ 290 |
Portfolio turnover rate | 155% | 164% | 192% | 115% A |
A Annualized
B Total returns for periods of less than one year are not annualized.
C Total returns do not reflect charges attributable to your insurance company's separate account. Inclusion of these charges would reduce the total returns shown.
D Total returns would have been lower had certain expenses not been reduced during the periods shown.
E Calculated based on average shares outstanding during the period.
F Investment income per share reflects a special dividend which amounted to $.03 per share.
G For the period May 9, 2001 (commencement of operations) to December 31, 2001.
H Expense ratios reflect operating expenses of the class. Expenses before reductions do not reflect amounts reimbursed by the investment adviser or reductions from brokerage service arrangements or other expense offset arrangements and do not represent the amount paid by the class during periods when reimbursements or reductions occur. Expense ratios before reductions for start-up periods may not be representative of longer-term operating periods. Expenses net of any voluntary waivers reflect expenses after reimbursement by the investment adviser but prior to reductions from brokerage service arrangements or other expense offset arrangements. Expenses net of all reductions represent the net expenses paid by the class.
Financial Highlights - Service Class
Years ended December 31, | 2004 | 2003 | 2002 | 2001 G |
Selected Per-Share Data | | | | |
Net asset value, beginning of period | $ 10.84 | $ 8.12 | $ 9.64 | $ 10.00 |
Income from Investment Operations | | | | |
Net investment income (loss) E | .13 F | .05 | .02 | .02 |
Net realized and unrealized gain (loss) | 1.07 | 2.70 | (1.53) | (.37) |
Total from investment operations | 1.20 | 2.75 | (1.51) | (.35) |
Distributions from net investment income | (.11) | (.03) | (.01) | (.01) |
Net asset value, end of period | $ 11.93 | $ 10.84 | $ 8.12 | $ 9.64 |
Total Return B, C, D | 11.07% | 33.91% | (15.66)% | (3.50)% |
Ratios to Average Net Assets H | | | | |
Expenses before expense reductions | 2.75% | 4.35% | 3.64% | 7.23% A |
Expenses net of voluntary waivers, if any | 1.10% | 1.35% | 1.60% | 1.60% A |
Expenses net of all reductions | 1.04% | 1.29% | 1.55% | 1.56% A |
Net investment income (loss) | 1.17% | .50% | .21% | .40% A |
Supplemental Data | | | | |
Net assets, end of period (000 omitted) | $ 1,225 | $ 972 | $ 803 | $ 910 |
Portfolio turnover rate | 155% | 164% | 192% | 115% A |
A Annualized
B Total returns for periods of less than one year are not annualized.
C Total returns do not reflect charges attributable to your insurance company's separate account. Inclusion of these charges would reduce the total returns shown.
D Total returns would have been lower had certain expenses not been reduced during the periods shown.
E Calculated based on average shares outstanding during the period.
F Investment income per share reflects a special dividend which amounted to $.03 per share.
G For the period May 9, 2001 (commencement of operations) to December 31, 2001.
H Expense ratios reflect operating expenses of the class. Expenses before reductions do not reflect amounts reimbursed by the investment adviser or reductions from brokerage service arrangements or other expense offset arrangements and do not represent the amount paid by the class during periods when reimbursements or reductions occur. Expense ratios before reductions for start-up periods may not be representative of longer-term operating periods. Expenses net of any voluntary waivers reflect expenses after reimbursement by the investment adviser but prior to reductions from brokerage service arrangements or other expense offset arrangements. Expenses net of all reductions represent the net expenses paid by the class.
See accompanying notes which are an integral part of the financial statements.
Annual Report
Financial Highlights - Service Class 2
Years ended December 31, | 2004 | 2003 | 2002 | 2001 G |
Selected Per-Share Data | | | | |
Net asset value, beginning of period | $ 10.80 | $ 8.10 | $ 9.64 | $ 10.00 |
Income from Investment Operations | | | | |
Net investment income (loss) E | .11 F | .03 | .01 | .01 |
Net realized and unrealized gain (loss) | 1.07 | 2.70 | (1.54) | (.36) |
Total from investment operations | 1.18 | 2.73 | (1.53) | (.35) |
Distributions from net investment income | (.11) | (.03) | (.01) | (.01) |
Net asset value, end of period | $ 11.87 | $ 10.80 | $ 8.10 | $ 9.64 |
Total Return B, C, D | 10.93% | 33.75% | (15.87)% | (3.50)% |
Ratios to Average Net Assets H | | | | |
Expenses before expense reductions | 2.93% | 4.50% | 3.78% | 7.38% A |
Expenses net of voluntary waivers, if any | 1.25% | 1.51% | 1.75% | 1.75% A |
Expenses net of all reductions | 1.20% | 1.45% | 1.70% | 1.70% A |
Net investment income (loss) | 1.01% | .34% | .06% | .25% A |
Supplemental Data | | | | |
Net assets, end of period (000 omitted) | $ 3,575 | $ 2,865 | $ 1,698 | $ 1,750 |
Portfolio turnover rate | 155% | 164% | 192% | 115% A |
A Annualized
B Total returns for periods of less than one year are not annualized.
C Total returns do not reflect charges attributable to your insurance company's separate account. Inclusion of these charges would reduce the total returns shown.
D Total returns would have been lower had certain expenses not been reduced during the periods shown.
E Calculated based on average shares outstanding during the period.
F Investment income per share reflects a special dividend which amounted to $.03 per share.
G For the period May 9, 2001 (commencement of operations) to December 31, 2001.
H Expense ratios reflect operating expenses of the class. Expenses before reductions do not reflect amounts reimbursed by the investment adviser or reductions from brokerage service arrangements or other expense offset arrangements and do not represent the amount paid by the class during periods when reimbursements or reductions occur. Expense ratios before reductions for start-up periods may not be representative of longer-term operating periods. Expenses net of any voluntary waivers reflect expenses after reimbursement by the investment adviser but prior to reductions from brokerage service arrangements or other expense offset arrangements. Expenses net of all reductions represent the net expenses paid by the class.
See accompanying notes which are an integral part of the financial statements.
Value Portfolio
Notes to Financial Statements
For the period ended December 31, 2004
1. Significant Accounting Policies.
Value Portfolio (the fund) is a fund of Variable Insurance Products Fund (the trust) (referred to in this report as Fidelity Variable Insurance Products: Value Portfolio) and is authorized to issue an unlimited number of shares. The trust is registered under the Investment Company Act of 1940, as amended (the 1940 Act), as an open-end management investment company organized as a Massachusetts business trust. Shares of the fund may only be purchased by insurance companies for the purpose of funding variable annuity or variable life insurance contracts. The fund offers the following classes of shares: Initial Class shares, Service Class shares and Service Class 2 shares. All classes have equal rights and voting privileges, except for matters affecting a single class. Investment income, realized and unrealized capital gains and losses, the common expenses of the fund, and certain fund-level expense reductions, if any, are allocated on a pro rata basis to each class based on the relative net assets of each class to the total net assets of the fund. Each class differs with respect to distribution and service plan fees incurred. Certain expense reductions also differ by class.
The financial statements have been prepared in conformity with accounting principles generally accepted in the United States of America, which require management to make certain estimates and assumptions at the date of the financial statements. The following summarizes the significant accounting policies of the fund:
Security Valuation. Net asset value per share (NAV calculation) is calculated as of the close of business of the New York Stock Exchange, normally 4:00 p.m. Eastern time. Equity securities, including restricted securities, for which market quotations are available are valued at the last sale price or official closing price (closing bid price or last evaluated quote if no sale has occurred) on the primary market or exchange on which they trade. If prices are not readily available or do not accurately reflect fair value for a security, or if a security's value has been materially affected by events occurring after the close of the exchange or market on which the security is principally traded, that security may be valued by another method that the Board of Trustees believes accurately reflects fair value. A security's valuation may differ depending on the method used for determining value. Price movements in futures contracts and ADRs, market and trading trends, the bid/ask quotes of brokers and off-exchange institutional trading may be reviewed in the course of making a good faith determination of a security's fair value. Short-term securities with remaining maturities of sixty days or less for which quotations are not readily available are valued on the basis of amortized cost. Investments in open-end investment companies are valued at their net asset value each business day.
Foreign Currency. The fund uses foreign currency contracts to facilitate transactions in foreign-denominated securities. Losses from these transactions may arise from changes in the value of the foreign currency or if the counterparties do not perform under the contracts' terms.
Foreign-denominated assets, including investment securities, and liabilities are translated into U.S. dollars at the exchange rate at period end. Purchases and sales of investment securities, income and dividends received and expenses denominated in foreign currencies are translated into U.S. dollars at the exchange rate in effect on the transaction date.
The effects of exchange rate fluctuations on investments are included with the net realized and unrealized gain (loss) on investment securities. Other foreign currency transactions resulting in realized and unrealized gain (loss) are disclosed separately.
Investment Transactions and Income. Security transactions are accounted for as of trade date. Gains and losses on securities sold are determined on the basis of identified cost. Dividend income is recorded on the ex-dividend date, except for certain dividends from foreign securities where the ex-dividend date may have passed, which are recorded as soon as the fund is informed of the ex-dividend date. Non-cash dividends included in dividend income, if any, are recorded at the fair market value of the securities received. Distributions received on securities that represent a return of capital or capital gain are recorded as a reduction of cost of investments and/or as a realized gain. The fund estimates the components of distributions received that may be considered return of capital distributions or capital gain distributions. Large, non-recurring dividends recognized by the fund are presented separately on the Statement of Operations as "Special Dividends" and the impact of these dividends to net investment income per share is presented in the Financial Highlights. Interest income is accrued as earned. Interest income includes coupon interest and amortization of premium and accretion of discount on debt securities. Investment income is recorded net of foreign taxes withheld where recovery of such taxes is uncertain.
Expenses. Most expenses of the trust can be directly attributed to a fund. Expenses which cannot be directly attributed are apportioned among the funds in the trust.
Income Tax Information and Distributions to Shareholders. Each year, the fund intends to qualify as a regulated investment company by distributing all of its taxable income and realized gains under Subchapter M of the Internal Revenue Code. As a result, no provision for income taxes is required in the accompanying financial statements. Foreign taxes are provided for based on the fund's understanding of the tax rules and rates that exist in the foreign markets in which it invests.
Distributions are recorded on the ex-dividend date. Income dividends and capital gain distributions are declared separately for each class. Income and capital gain distributions are determined in accordance with income tax regulations, which may differ from generally accepted accounting principles.
Annual Report
Notes to Financial Statements - continued
1. Significant Accounting Policies - continued
Income Tax Information and Distributions to Shareholders - continued
Capital accounts within the financial statements are adjusted for permanent book-tax differences. These adjustments have no impact on net assets or the results of operations. Temporary book-tax differences will reverse in a subsequent period.
Book-tax differences are primarily due to foreign currency transactions, market discount, capital loss carryforwards and losses deferred due to wash sales.
The tax-basis components of distributable earnings and the federal tax cost as of period end were as follows:
Unrealized appreciation | $ 740,106 | |
Unrealized depreciation | (21,873) | |
Net unrealized appreciation (depreciation) | 718,233 | |
Undistributed ordinary income | 1,095 | |
Capital loss carryforward | (99,823) | |
| | |
Cost for federal income tax purposes | $ 4,648,827 | |
The tax character of distributions paid was as follows:
| December 31, 2004 | December 31, 2003 |
Ordinary Income | $ 49,290 | $ 13,029 |
2. Operating Policies.
Repurchase Agreements. Fidelity Management & Research Company (FMR) has received an Exemptive Order from the Securities and Exchange Commission (the SEC) which permits the fund and other affiliated entities of FMR to transfer uninvested cash balances into joint trading accounts. These accounts are then invested in repurchase agreements that are collateralized by U.S. Treasury or Government obligations. The fund may also invest directly with institutions, in repurchase agreements that are collateralized by commercial paper obligations and corporate obligations. Collateral is held in segregated accounts with custodian banks and may be obtained in the event of a default of the counterparty. Collateral is marked-to-market daily and maintained at a value at least equal to the principal amount of the repurchase agreement (including accrued interest).
3. Purchases and Sales of Investments.
Purchases and sales of securities, other than short-term securities and U.S. government securities, aggregated $7,706,988 and $7,032,567, respectively.
4. Fees and Other Transactions with Affiliates.
Management Fee. FMR and its affiliates provide the fund with investment management related services for which the fund pays a monthly management fee. The management fee is the sum of an individual fund fee rate that is based on an annual rate of .30% of the fund's average net assets and a group fee rate that averaged .28% during the period. The group fee rate is based upon the average net assets of all the mutual funds advised by FMR. The group fee rate decreases as assets under management increase and increases as assets under management decrease. For the period, the total annual management fee rate was .57% of the fund's average net assets.
Distribution and Service Plan. In accordance with Rule 12b-1 of the 1940 Act, the fund has adopted separate 12b-1 Plans for each Service Class of shares. Each Service Class pays Fidelity Distributors Corporation (FDC), an affiliate of FMR, a service fee. For the period, the service fee is based on an annual rate of .10% of Service Class' average net assets and .25% of Service Class 2's average net assets.
For the period, each class paid FDC the following amounts, all of which were re-allowed to insurance companies for the distribution of shares and providing shareholder support services:
Service Class | $ 1,069 | |
Service Class 2 | 7,749 | |
| $ 8,818 | |
Value Portfolio
4. Fees and Other Transactions with Affiliates - continued
Transfer Agent Fees. Fidelity Investments Institutional Operations Company, Inc. (FIIOC), an affiliate of FMR, is the fund's transfer, dividend disbursing, and shareholder servicing agent. FIIOC receives an asset-based fee with respect to each account. FIIOC pays a portion of the expenses related to the typesetting, printing and mailing of shareholder reports, except proxy statements. Each class pays a transfer agent fee, excluding out of pocket expenses, equal to an annual rate of .07% of their month end net assets. For the period, the total transfer agent fees paid by each class to FIIOC, including out of pocket expenses, were as follows:
Initial Class | $ 401 | |
Service Class | 968 | |
Service Class 2 | 3,691 | |
| $ 5,060 | |
Accounting Fees. Fidelity Service Company, Inc. (FSC), an affiliate of FMR, maintains the fund's accounting records. The fee is based on the level of average net assets for the month.
Central Funds. The fund may invest in affiliated Central Funds managed by Fidelity Investments Money Management, Inc. (FIMM), an affiliate of FMR. The Central Funds are open-end investment companies available only to investment companies and other accounts managed by FMR and its affiliates. The Central Funds seek preservation of capital and current income and do not pay a management fee. Income distributions earned by the fund are recorded as income in the accompanying financial statements and totaled $1,422 for the period.
Brokerage Commissions. The fund placed a portion of its portfolio transactions with brokerage firms which are affiliates of the investment adviser. The commissions paid to these affiliated firms were $528 for the period.
5. Committed Line of Credit.
The fund participates with other funds managed by FMR in a $4.2 billion credit facility (the "line of credit") to be utilized for temporary or emergency purposes to fund shareholder redemptions or for other short-term liquidity purposes. The fund has agreed to pay commitment fees on its pro rata portion of the line of credit. During the period, there were no borrowings on this line of credit.
6. Expense Reductions.
FMR voluntarily agreed to reimburse each class to the extent annual operating expenses exceeded certain levels of average net assets as noted in the table below. Some expenses, for example interest expense, are excluded from this reimbursement. Effective February 1, 2005 the expense limitations will be changed to .85%, .95%, and 1.10% for Initial, Service Class, and Service Class 2, respectively.
| Expense
Limitations | Reimbursement
from adviser |
| | |
Initial Class | 1.00% | $ 7,307 |
Service Class | 1.10% | 17,747 |
Service Class 2 | 1.25% | 52,211 |
| | $ 77,265 |
Many of the brokers with whom FMR places trades on behalf of the fund provided services to the fund in addition to trade execution. These services included payments of certain expenses on behalf of the fund totaling $2,473 for the period.
7. Other Information.
At the end of the period, FMR or its affiliates were the owners of record of 22% of the total outstanding shares of the fund and two otherwise unaffiliated shareholders were the owners of record of 73% of the total outstanding shares of the fund.
Annual Report
Report of Independent Registered Public Accounting Firm
To the Trustees of Variable Insurance Products Fund and Shareholders of Value Portfolio:
We have audited the accompanying statement of assets and liabilities of Value Portfolio (the Fund), a fund of Variable Insurance Products Fund, including the portfolio of investments, as of December 31, 2004, and the related statement of operations for the year then ended, the statement of changes in net assets for each of the two years in the period then ended, and the financial highlights for each of the four years in the period then ended. These financial statements and financial highlights are the responsibility of the Fund's management. Our responsibility is to express an opinion on these financial statements and financial highlights based on our audits.
We conducted our audits in accordance with standards of the Public Company Accounting Oversight Board (United States). Those standards require that we plan and perform the audit to obtain reasonable assurance about whether the financial statements and financial highlights are free of material misstatement. An audit includes consideration of internal control over financial reporting as a basis for designing audit procedures that are appropriate in the circumstances, but not for the purpose of expressing an opinion on the effectiveness of the Fund's internal control over financial reporting. Accordingly, we express no such opinion. An audit also includes examining, on a test basis, evidence supporting the amounts and disclosures in the financial statements, assessing the accounting principles used and significant estimates made by management, as well as evaluating the overall financial statement presentation. Our procedures included confirmation of securities owned as of December 31, 2004, by correspondence with the custodians and brokers; where replies were not received from brokers, we performed other auditing procedures. We believe that our audits provide a reasonable basis for our opinion.
In our opinion, the financial statements and financial highlights referred to above present fairly, in all material respects, the financial position of Value Portfolio as of December 31, 2004, the results of its operations for the year then ended, the changes in its net assets for each of the two years in the period then ended, and its financial highlights for each of the four years in the period then ended, in conformity with accounting principles generally accepted in the United States of America.
DELOITTE & TOUCHE LLP
Boston, Massachusetts
February 18, 2005
Annual Report
Trustees and Officers
The Trustees, Member of the Advisory Board, and executive officers of the trust and fund, as applicable, are listed below. The Board of Trustees governs the fund and is responsible for protecting the interests of shareholders. The Trustees are experienced executives who meet periodically throughout the year to oversee the fund's activities, review contractual arrangements with companies that provide services to the fund, and review the fund's performance. Except for William O. McCoy, Dennis J. Dirks, and Kenneth L. Wolfe, each of the Trustees oversees 301 funds advised by FMR or an affiliate. Mr. McCoy oversees 303 funds advised by FMR or an affiliate. Mr. Dirks and Mr. Wolfe oversee 233 funds advised by FMR or an affiliate.
The Trustees hold office without limit in time except that (a) any Trustee may resign; (b) any Trustee may be removed by written instrument, signed by at least two-thirds of the number of Trustees prior to such removal; (c) any Trustee who requests to be retired or who has become incapacitated by illness or injury may be retired by written instrument signed by a majority of the other Trustees; and (d) any Trustee may be removed at any special meeting of shareholders by a two-thirds vote of the outstanding voting securities of the trust. In any event, each non-interested Trustee shall retire not later than the last day of the calendar year in which his or her 72nd birthday occurs. The executive officers and Advisory Board Members hold office without limit in time, except that any officer and Advisory Board Member may resign or may be removed by a vote of a majority of the Trustees at any regular meeting or any special meeting of the Trustees. Except as indicated, each individual has held the office shown or other offices in the same company for the past five years.
The fund's Statement of Additional Information (SAI) includes more information about the Trustees. To request a free copy, call Fidelity at 1-800-544-5429.
Interested Trustees*:
Correspondence intended for each Trustee who is an "interested person" (as defined in the 1940 Act) may be sent to Fidelity Investments, 82 Devonshire Street, Boston, Massachusetts 02109.
Name, Age; Principal Occupation |
Edward C. Johnson 3d (74)** |
| Year of Election or Appointment: 1981 Mr. Johnson is Chairman of the Board of Trustees. Mr. Johnson serves as Chief Executive Officer, Chairman, and a Director of FMR Corp.; a Director and Chairman of the Board and of the Executive Committee of FMR; Chairman and a Director of Fidelity Management & Research (Far East) Inc.; Chairman (1998) and a Director of Fidelity Investments Money Management, Inc.; and Chairman (2001) and a Director (2000) of FMR Co., Inc. |
Abigail P. Johnson (43)** |
| Year of Election or Appointment: 2001 Senior Vice President of VIP Value (2001). Ms. Johnson also serves as Senior Vice President of other Fidelity funds (2001). She is President and a Director of FMR (2001), Fidelity Investments Money Management, Inc. (2001), FMR Co., Inc. (2001), and a Director of FMR Corp. Previously, Ms. Johnson managed a number of Fidelity funds. |
Laura B. Cronin (50) |
| Year of Election or Appointment: 2003 Ms. Cronin is an Executive Vice President (2002) and Chief Financial Officer (2002) of FMR Corp. and is a member of the Fidelity Management Committee (2003). Previously, Ms. Cronin served as Vice President of Finance of FMR (1997-1999), and Chief Financial Officer of FMR (1999-2001), Fidelity Personal Investments (2001), and Fidelity Brokerage Company (2001-2002). |
Robert L. Reynolds (52) |
| Year of Election or Appointment: 2003 Mr. Reynolds is a Director (2003) and Chief Operating Officer (2002) of FMR Corp. and is the head of the Fidelity Management Committee (2003). He also serves on the Board at Fidelity Investments Canada, Ltd. (2000). Previously, Mr. Reynolds served as President of Fidelity Investments Institutional Retirement Group (1996-2000). |
* Trustees have been determined to be "Interested Trustees" by virtue of, among other things, their affiliation with the trust or various entities under common control with FMR.
** Edward C. Johnson 3d, Trustee, is Abigail P. Johnson's father.
Annual Report
Trustees and Officers - continued
Non-Interested Trustees:
Correspondence intended for each non-interested Trustee (that is, the Trustees other than the Interested Trustees) may be sent to Fidelity Investments, P.O. Box 55235, Boston, Massachusetts 02205-5235.
Name, Age; Principal Occupation |
Dennis J. Dirks (56) |
| Year of Election or Appointment: 2005 Mr. Dirks also serves as Trustee (2005) or Member of the Advisory Board (2004) of other investment companies advised by FMR. Prior to his retirement in May 2003, Mr. Dirks was Chief Operating Officer and a member of the Board of The Depository Trust & Clearing Corporation (DTCC) (1999-2003). He also served as President, Chief Operating Officer, and Board member of The Depository Trust Company (DTC) (1999-2003) and President and Board member of the National Securities Clearing Corporation (NSCC) (1999-2003). In addition, Mr. Dirks served as Chief Executive Officer and Board member of the Government Securities Clearing Corporation (2001-2003) and Chief Executive Officer and Board member of the Mortgage-Backed Securities Clearing Corporation (2001-2003). |
Robert M. Gates (61) |
| Year of Election or Appointment: 1997 Dr. Gates is Vice-Chairman of the non-interested Trustees (2005). Dr. Gates is Vice Chairman of the non-interested Trustees (2005). Dr. Gates is President of Texas A&M University (2002). He was Director of the Central Intelligence Agency (CIA) from 1991 to 1993. From 1989 to 1991, Dr. Gates served as Assistant to the President of the United States and Deputy National Security Advisor. Dr. Gates is a Director of NACCO Industries, Inc. (mining and manufacturing), Parker Drilling Co., Inc. (drilling and rental tools for the energy industry, 2001), and Brinker International (restaurant management, 2003). He also serves as a member of the Advisory Board of VoteHere.net (secure internet voting, 2001). Previously, Dr. Gates served as a Director of LucasVarity PLC (automotive components and diesel engines), a Director of TRW Inc. (automotive, space, defense, and information technology), and Dean of the George Bush School of Government and Public Service at Texas A&M University (1999-2001). Dr. Gates also is a Trustee of the Forum for International Policy. |
George H. Heilmeier (68) |
| Year of Election or Appointment: 2004 Dr. Heilmeier is Chairman Emeritus of Telcordia Technologies (communication software and systems), where prior to his retirement, he served as company Chairman and Chief Executive Officer. He currently serves on the Boards of Directors of The Mitre Corporation (systems engineering and information technology support for the government), INET Technologies Inc. (telecommunications network surveillance, 2001), Teletech Holdings (customer management services), and HRL Laboratories (private research and development, 2004). He is Chairman of the General Motors Technology Advisory Committee and a Life Fellow of the Institute of Electrical and Electronics Engineers (IEEE) (2000). Dr. Heilmeier is a member of the Defense Science Board and the National Security Agency Advisory Board. He is also a member of the National Academy of Engineering, the American Academy of Arts and Sciences, and the Board of Overseers of the School of Engineering and Applied Science of the University of Pennsylvania. Previously, Dr. Heilmeier served as a Director of TRW Inc. (automotive, space, defense, and information technology, 1992-2002), Compaq (1994-2002), and Automatic Data Processing, Inc. (ADP) (technology-based business outsourcing, 1995-2002). |
Marie L. Knowles (58) |
| Year of Election or Appointment: 2001 Prior to Ms. Knowles' retirement in June 2000, she served as Executive Vice President and Chief Financial Officer of Atlantic Richfield Company (ARCO) (diversified energy, 1996-2000). From 1993 to 1996, she was a Senior Vice President of ARCO and President of ARCO Transportation Company. She served as a Director of ARCO from 1996 to 1998. She currently serves as a Director of Phelps Dodge Corporation (copper mining and manufacturing) and McKesson Corporation (healthcare service, 2002). Ms. Knowles is a Trustee of the Brookings Institution and the Catalina Island Conservancy and also serves as a member of the Advisory Board for the School of Engineering of the University of Southern California. |
Ned C. Lautenbach (60) |
| Year of Election or Appointment: 2000 Mr. Lautenbach has been a partner of Clayton, Dubilier & Rice, Inc. (private equity investment firm) since September 1998. Previously, Mr. Lautenbach was with the International Business Machines Corporation (IBM) from 1968 until his retirement in 1998. He was most recently Senior Vice President and Group Executive of Worldwide Sales and Services. From 1993 to 1995, he was Chairman of IBM World Trade Corporation, and from 1994 to 1998 was a member of IBM's Corporate Executive Committee. Mr. Lautenbach serves as Co-Chairman and a Director of Covansys, Inc. (global provider of business and technology solutions, 2000). In addition, he is a Director of Italtel Holding S.p.A. (telecommunications (Milan, Italy), 2004) and Eaton Corporation (diversified industrial) as well as the Philharmonic Center for the Arts in Naples, Florida (1999). He also is a member of the Council on Foreign Relations. |
Marvin L. Mann (71) |
| Year of Election or Appointment: 1993 Mr. Mann is Chairman of the non-interested Trustees (2001). He is Chairman Emeritus of Lexmark International, Inc. (computer peripherals), where he served as CEO until April 1998, retired as Chairman May 1999, and remains a member of the Board. Prior to 1991, he held the positions of Vice President of International Business Machines Corporation (IBM) and President and General Manager of various IBM divisions and subsidiaries. He is a member of the Executive Committee of the Independent Director's Council of the Investment Company Institute. In addition, Mr. Mann is a member of the President's Cabinet at the University of Alabama and the Board of Visitors of the Culverhouse College of Commerce and Business Administration at the University of Alabama. |
William O. McCoy (71) |
| Year of Election or Appointment: 1997 Prior to his retirement in December 1994, Mr. McCoy was Vice Chairman of the Board of BellSouth Corporation (telecommunications) and President of BellSouth Enterprises. He is currently a Director of Liberty Corporation (holding company), Duke Realty Corporation (real estate), and Progress Energy, Inc. (electric utility). He is also a partner of Franklin Street Partners (private investment management firm) and a member of the Research Triangle Foundation Board. In addition, Mr. McCoy served as the Interim Chancellor (1999-2000) and a member of the Board of Visitors (1994-1998) for the University of North Carolina at Chapel Hill and currently serves on the Board of Directors of the University of North Carolina Health Care System and the Board of Visitors of the Kenan-Flagler Business School (University of North Carolina at Chapel Hill). He also served as Vice President of Finance for the University of North Carolina (16-school system, 1995-1998). |
Cornelia M. Small (60) |
| Year of Election or Appointment: 2005 Ms. Small is a member (2000) and Chairperson (2002) of the Investment Committee, and a member (2002) of the Board of Trustees of Smith College. Previously, she served as Chief Investment Officer (1999-2000), Director of Global Equity Investments (1996-1999), and a member of the Board of Directors of Scudder, Stevens & Clark (1990-1997) and Scudder Kemper Investments (1997-1998). In addition, Ms. Small served as Co-Chair (2000-2003) of the Annual Fund for the Fletcher School of Law and Diplomacy. |
William S. Stavropoulos (65) |
| Year of Election or Appointment: 2001 Mr. Stavropoulos is Chairman of the Board (2000), CEO (2002), a position he previously held from 1995-2000, Chairman of the Executive Committee (2000), and a Member of the Board of Directors of The Dow Chemical Company. Since joining The Dow Chemical Company in 1967, Mr. Stavropoulos served in numerous senior management positions, including President (1993-2000; 2002-2003). Currently, he is a Director of NCR Corporation (data warehousing and technology solutions), BellSouth Corporation (telecommunications), Chemical Financial Corporation, and Maersk Inc. (industrial conglomerate, 2002). He also serves as a member of the Board of Trustees of the American Enterprise Institute for Public Policy Research. In addition, Mr. Stavropoulos is a member of The Business Council, J.P. Morgan International Council and the University of Notre Dame Advisory Council for the College of Science. |
Kenneth L. Wolfe (65) |
| Year of Election or Appointment: 2005 Mr. Wolfe also serves as Trustee (2005) or Member of the Advisory Board (2004) of other investment companies advised by FMR. Prior to his retirement in 2001, Mr. Wolfe was Chairman and Chief Executive Officer of Hershey Foods Corporation (1993-2001). He currently serves as a member of the boards of Adelphia Communications Corporation (2003), Bausch & Lomb, Inc., and Revlon Inc. (2004). |
Annual Report
Trustees and Officers - continued
Advisory Board Member and Executive Officers:
Correspondence intended for each executive officer and Mr. Lynch may be sent to Fidelity Investments, 82 Devonshire Street, Boston, Massachusetts 02109.
Name, Age; Principal Occupation |
Peter S. Lynch (61) |
| Year of Election or Appointment: 2003 Member of the Advisory Board of Variable Insurance Products Fund. Vice Chairman and a Director of FMR, and Vice Chairman (2001) and a Director (2000) of FMR Co., Inc. Previously, Mr. Lynch served as a Trustee of the Fidelity funds (1990-2003). Prior to May 31, 1990, he was a Director of FMR and Executive Vice President of FMR (a position he held until March 31, 1991), Vice President of Fidelity® Magellan® Fund and FMR Growth Group Leader, and Managing Director of FMR Corp. Mr. Lynch was also Vice President of Fidelity Investments Corporate Services. In addition, he serves as a Trustee of Boston College, Massachusetts Eye & Ear Infirmary, Historic Deerfield, John F. Kennedy Library, and the Museum of Fine Arts of Boston. |
Bart A. Grenier (45) |
| Year of Election or Appointment: 2001 Vice President of VIP Value. Mr. Grenier also serves as Vice President of certain Equity Funds (2001), a position he previously held from 1999 to 2000, and Vice President of certain High Income Funds (2002). He is Senior Vice President of FMR (1999) and FMR Co., Inc. (2001), and President and Director of Strategic Advisers, Inc. (2002). He also heads Fidelity's Asset Allocation Group (2000), Fidelity's Growth and Income Group (2001), Fidelity's Value Group (2001), and Fidelity's High Income Division (2001). Previously, Mr. Grenier served as President of Fidelity Ventures (2000), Vice President of certain High Income Funds (1997-2000), High Income Division Head (1997-2000), Group Leader of the Income-Growth and Asset Allocation-Income Groups (1996-2000), and Assistant Equity Division Head (1997-2000). |
Stephen M. DuFour (38) |
| Year of Election or Appointment: 2001 Vice President of VIP Value. Mr. DuFour also serves as Vice President of other funds managed by FMR. Prior to assuming his current responsibilities, Mr. DuFour managed a variety of Fidelity funds. |
Eric D. Roiter (56) |
| Year of Election or Appointment: 2001 Secretary of VIP Value. He also serves as Secretary of other Fidelity funds; Vice President, General Counsel, and Secretary of FMR Co., Inc. (2001-present) and FMR; Vice President and Secretary of FDC; Assistant Secretary of Fidelity Management & Research (U.K.) Inc. (2001-present), Fidelity Management & Research (Far East) Inc. (2001-present); and Fidelity Investments Money Management, Inc. (2001-present). Mr. Roiter is an Adjunct Member, Faculty of Law, at Boston College Law School (2003-present). |
Stuart Fross (45) |
| Year of Election or Appointment: 2003 Assistant Secretary of VIP Value. Mr. Fross also serves as Assistant Secretary of other Fidelity funds (2003) and is an employee of FMR. |
Christine Reynolds (46) |
| Year of Election or Appointment: 2004 President, Treasurer, and Anti-Money Laundering (AML) officer of VIP Value. Ms. Reynolds also serves as President, Treasurer, and AML officer of other Fidelity funds (2004) and is a Vice President (2003) and an employee (2002) of FMR. Before joining Fidelity Investments, Ms. Reynolds worked at PricewaterhouseCoopers LLP (PwC) (1980-2002), where she was most recently an audit partner with PwC's investment management practice. |
Timothy F. Hayes (54) |
| Year of Election or Appointment: 2002 Chief Financial Officer of VIP Value. Mr. Hayes also serves as Chief Financial Officer of other Fidelity funds (2002). Recently he was appointed President of Fidelity Service Company (2003) where he also serves as a Director. Mr. Hayes also serves as President of Fidelity Investments Operations Group (FIOG, 2002), which includes Fidelity Pricing and Cash Management Services Group (FPCMS), where he was appointed President in 1998. Previously, Mr. Hayes served as Chief Financial Officer of Fidelity Investments Corporate Systems and Service Group (1998) and Fidelity Systems Company (1997-1998). |
Kenneth A. Rathgeber (57) |
| Year of Election or Appointment: 2004 Chief Compliance Officer of VIP Value. Mr. Rathgeber also serves as Chief Compliance Officer of other Fidelity funds (2004) and Executive Vice President of Risk Oversight for Fidelity Investments (2002). Previously, he served as Executive Vice President and Chief Operating Officer for Fidelity Investments Institutional Services Company, Inc. (1998-2002). |
John R. Hebble (46) |
| Year of Election or Appointment: 2003 Deputy Treasurer of VIP Value. Mr. Hebble also serves as Deputy Treasurer of other Fidelity funds (2003), and is an employee of FMR. Before joining Fidelity Investments, Mr. Hebble worked at Deutsche Asset Management where he served as Director of Fund Accounting (2002-2003) and Assistant Treasurer of the Scudder Funds (1998-2003). |
Kimberley H. Monasterio (41) |
| Year of Election or Appointment: 2004 Deputy Treasurer of VIP Value. Ms. Monasterio also serves as Deputy Treasurer of other Fidelity funds (2004) and is an employee of FMR (2004). Before joining Fidelity Investments, Ms. Monasterio served as Treasurer (2000-2004) and Chief Financial Officer (2002-2004) of the Franklin Templeton Funds and Senior Vice President of Franklin Templeton Services, LLC (2000-2004). |
John H. Costello (58) |
| Year of Election or Appointment: 2001 Assistant Treasurer of VIP Value. Mr. Costello also serves as Assistant Treasurer of other Fidelity funds and is an employee of FMR. |
Peter L. Lydecker (51) |
| Year of Election or Appointment: 2004 Assistant Treasurer of VIP Value. Mr. Lydecker also serves as Assistant Treasurer of other Fidelity funds (2004) and is an employee of FMR. |
Mark Osterheld (49) |
| Year of Election or Appointment: 2002 Assistant Treasurer of VIP Value. Mr. Osterheld also serves as Assistant Treasurer of other Fidelity funds (2002) and is an employee of FMR. |
Kenneth B. Robins (35) |
| Year of Election or Appointment: 2004 Assistant Treasurer of VIP Value. Mr. Robins also serves as Assistant Treasurer of other Fidelity funds (2004) and is an employee of FMR (2004). Before joining Fidelity Investments, Mr. Robins worked at KPMG LLP, where he was a partner in KPMG's department of professional practice (2002-2004) and a Senior Manager (1999-2000). In addition, Mr. Robins served as Assistant Chief Accountant, United States Securities and Exchange Commission (2000-2002). |
Annual Report
Proxy Voting Results
A special meeting of the fund's shareholders was held on December 14, 2004. The results of votes taken among shareholders on proposals before them are reported below. Each vote reported represents one dollar of net asset value held on the record date for the meeting.
PROPOSAL 1 |
To amend the Declaration of Trust to allow the Board of Trustees, if permitted by applicable law, to authorize fund mergers without shareholder approval. A |
| # of
Votes | % of
Votes |
Affirmative | 15,331,508,529.96 | 81.853 |
Against | 2,429,553,894.02 | 12.972 |
Abstain | 969,378,618.94 | 5.175 |
TOTAL | 18,730,441,042.92 | 100.000 |
PROPOSAL 2 |
To elect a Board of Trustees. A |
| # of
Votes | % of
Votes |
J. Michael Cook |
Affirmative | 17,770,642,454.98 | 94.876 |
Withheld | 959,798,587.94 | 5.124 |
TOTAL | 18,730,441,042.92 | 100.000 |
Ralph F. Cox |
Affirmative | 17,759,356,374.26 | 94.815 |
Withheld. | 971,084,668.66 | 5.185 |
TOTAL | 18,730,441,042.92 | 100.000 |
Laura B. Cronin |
Affirmative | 17,797,888,742.24 | 95.021 |
Withheld | 932,552,300.68 | 4.979 |
TOTAL | 18,730,441,042.92 | 100.000 |
Dennis J. DirksB |
Affirmative | 17,802,602,074.45 | 95.046 |
Withheld | 927,838,968.47 | 4.954 |
TOTAL | 18,730,441,042.92 | 100.000 |
Robert M. Gates |
Affirmative | 17,784,855,823.58 | 94.952 |
Withheld | 945,585,219.34 | 5.048 |
TOTAL | 18,730,441,042.92 | 100.000 |
George H. Heilmeier |
Affirmative | 17,768,875,556.56 | 94.866 |
Withheld | 961,565,486.36 | 5.134 |
TOTAL | 18,730,441,042.92 | 100.000 |
Abigail P. Johnson |
Affirmative | 17,781,929,073.06 | 94.936 |
Withheld | 948,511,969.86 | 5.064 |
TOTAL | 18,730,441,042.92 | 100.000 |
Edward C. Johnson 3d |
Affirmative | 17,752,140,336.45 | 94.777 |
Withheld | 978,300,706.47 | 5.223 |
TOTAL | 18,730,441,042.92 | 100.000 |
Donald J. Kirk |
Affirmative | 17,772,467,361.45 | 94.885 |
Withheld | 957,973,681.47 | 5.115 |
TOTAL | 18,730,441,042.92 | 100.000 |
| # of
Votes | % of
Votes |
Marie L. Knowles |
Affirmative | 17,776,922,254.30 | 94.909 |
Withheld | 953,518,788.62 | 5.091 |
TOTAL | 18,730,441,042.92 | 100.000 |
Ned C. Lautenbach |
Affirmative | 17,804,221,564.95 | 95.055 |
Withheld | 926,219,477.97 | 4.945 |
TOTAL | 18,730,441,042.92 | 100.000 |
Marvin L. Mann |
Affirmative | 17,763,277,607.06 | 94.836 |
Withheld | 967,163,435.86 | 5.164 |
TOTAL | 18,730,441,042.92 | 100.000 |
William O. McCoy |
Affirmative | 17,758,560,162.11 | 94.811 |
Withheld | 971,880,880.81 | 5.189 |
TOTAL | 18,730,441,042.92 | 100.000 |
Robert L. Reynolds |
Affirmative | 17,806,026,904.06 | 95.065 |
Withheld | 924,414,138.86 | 4.935 |
TOTAL | 18,730,441,042.92 | 100.000 |
Cornelia M. SmallB |
Affirmative | 17,798,878,892.31 | 95.026 |
Withheld | 931,562,150.61 | 4.974 |
TOTAL | 18,730,441,042.92 | 100.000 |
William S. Stavropoulos |
Affirmative | 17,786,496,107.78 | 94.960 |
Withheld | 943,944,935.14 | 5.040 |
TOTAL | 18,730,441,042.92 | 100.000 |
A Denotes trust-wide proposals and voting results. B Effective January 1, 2005. |
Annual Report
Investment Adviser
Fidelity Management & Research Company
Boston, MA
Investment Sub-Advisers
FMR Co., Inc.
Fidelity Management & Research (U.K.) Inc.
Fidelity Management & Research (Far East) Inc.
Fidelity Investments Japan Limited
Fidelity International Investment Advisors
Fidelity International Investment Advisors (U.K.) Limited
General Distributor
Fidelity Distributors Corporation
Boston, MA
Transfer and Shareholder Servicing Agent
Fidelity Investments Institutional Operations Company, Inc.
Boston, MA
Custodian
State Street Bank and Trust Company
Quincy, MA
VIPVAL-ANN-0205
1.768949.103
Item 2. Code of Ethics
As of the end of the period, December 31, 2004, Variable Insurance Products Fund (the trust) has adopted a code of ethics, as defined in Item 2 of Form N-CSR, that applies to its President and Treasurer and its Chief Financial Officer. A copy of the code of ethics is filed as an exhibit to this Form N-CSR.
Item 3. Audit Committee Financial Expert
The Board of Trustees of the trust has determined that Marie L. Knowles is an audit committee financial expert, as defined in Item 3 of Form N-CSR. Ms. Knowles is independent for purposes of Item 3 of Form N-CSR.
Item 4. Principal Accountant Fees and Services
(a) Audit Fees.
For the fiscal years ended December 31, 2004 and December 31, 2003, the aggregate Audit Fees billed by PricewaterhouseCoopers LLP (PwC) for professional services rendered for the audits of the financial statements, or services that are normally provided in connection with statutory and regulatory filings or engagements for those fiscal years, for Equity-Income Portfolio, Growth Portfolio, High Income Portfolio, Money Market Portfolio and Overseas Portfolio (the funds) and for all funds in the Fidelity Group of Funds are shown in the table below.
Fund | 2004A | 2003A |
Equity-Income Portfolio | $75,000 | $64,000 |
Growth Portfolio | $70,000 | $60,000 |
High Income Portfolio | $57,000 | $80,000 |
Money Market Portfolio | $32,000 | $29,000 |
Overseas Portfolio | $50,000 | $55,000 |
All funds in the Fidelity Group of Funds audited by PwC | $10,800,000 | $10,600,000 |
A | Aggregate amounts may reflect rounding. |
For the fiscal years ended December 31, 2004 and December 31, 2003, the aggregate Audit Fees billed by Deloitte & Touche LLP, the member firms of Deloitte Touche Tohmatsu, and their respective affiliates (collectively, "Deloitte Entities") for professional services rendered for the audits of the financial statements, or services that are normally provided in connection with statutory and regulatory filings or engagements for those fiscal years, for Value Portfolio (the fund) and for all funds in the Fidelity Group of Funds are shown in the table below.
Fund | 2004A | 2003A |
Value Portfolio | $29,000 | $26,000 |
All funds in the Fidelity Group of Funds audited by Deloitte Entities | $4,300,000 | $4,300,000 |
A | Aggregate amounts may reflect rounding. |
(b) Audit-Related Fees.
In each of the fiscal years ended December 31, 2004 and December 31, 2003, the aggregate Audit-Related Fees billed by PwC for services rendered for assurance and related services to each fund that are reasonably related to the performance of the audit or review of the fund's financial statements, but not reported as Audit Fees, are shown in the table below.
Fund | 2004A | 2003 A, B |
Equity-Income Portfolio | $0 | $0 |
Growth Portfolio | $0 | $0 |
High Income Portfolio | $0 | $0 |
Money Market Portfolio | $0 | $0 |
Overseas Portfolio | $0 | $0 |
A | Aggregate amounts may reflect rounding. |
B | Includes amounts related to non-audit services prior to May 6, 2003 that would have been subject to pre-approval if the SEC rules relating to the pre-approval of non-audit services had been in effect at that time. |
In each of the fiscal years ended December 31, 2004 and December 31, 2003, the aggregate Audit-Related Fees billed by Deloitte Entities for services rendered for assurance and related services to the fund that are reasonably related to the performance of the audit or review of the fund's financial statements, but not reported as Audit Fees, are shown in the table below.
Fund | 2004A | 2003 A, B |
Value Portfolio | $0 | $0 |
A | Aggregate amounts may reflect rounding. |
B | Includes amounts related to non-audit services prior to May 6, 2003 that would have been subject to pre-approval if the SEC rules relating to the pre-approval of non-audit services had been in effect at that time. |
In each of the fiscal years ended December 31, 2004 and December 31, 2003, the aggregate Audit-Related Fees that were billed by PwC and Deloitte Entities that were required to be approved by the Audit Committee for services rendered on behalf of Fidelity Management & Research Company (FMR) and entities controlling, controlled by, or under common control with FMR (not including any sub-adviser whose role is primarily portfolio management and is subcontracted with or overseen by another investment adviser) that provide ongoing services to the funds ("Fund Service Providers") for assurance and related services that relate directly to the operations and financial reporting of each fund that are reasonably related to the performance of the audit or review of the fund's financial statements, but not reported as Audit Fees, are shown in the table below.
Billed By | 2004 A | 2003A, B |
PwC | $0 | $50,000 |
Deloitte Entities | $0 | $0 |
A | Aggregate amounts may reflect rounding. |
B | Includes amounts related to non-audit services prior to May 6, 2003 that would have been subject to pre-approval if the SEC rules relating to the pre-approval of non-audit services had been in effect at that time. |
Fees included in the audit-related category comprise assurance and related services (e.g., due diligence services) that are traditionally performed by the independent registered public accounting firm. These audit-related services include due diligence related to mergers and acquisitions, accounting consultations and audits in connection with acquisitions, internal control reviews, attest services that are not required by statute or regulation and consultation concerning financial accounting and reporting standards.
(c) Tax Fees.
In each of the fiscal years ended December 31, 2004 and December 31, 2003, the aggregate Tax Fees billed by PwC for professional services rendered for tax compliance, tax advice, and tax planning for each fund is shown in the table below.
Fund | 2004A | 2003A, B |
Equity-Income Portfolio | $3,200 | $3,000 |
Growth Portfolio | $2,400 | $2,200 |
High Income Portfolio | $2,400 | $2,200 |
Money Market Portfolio | $1,600 | $1,500 |
Overseas Portfolio | $4,000 | $3,700 |
A | Aggregate amounts may reflect rounding. |
B | Includes amounts related to non-audit services prior to May 6, 2003 that would have been subject to pre-approval if the SEC rules relating to the pre-approval of non-audit services had been in effect at that time. |
In each of the fiscal years ended December 31, 2004 and December 31, 2003, the aggregate Tax Fees billed by Deloitte Entities for professional services rendered for tax compliance, tax advice, and tax planning for the fund is shown in the table below.
Fund | 2004A | 2003A, B |
Value Portfolio | $4,300 | $4,100 |
A | Aggregate amounts may reflect rounding. |
B | Includes amounts related to non-audit services prior to May 6, 2003 that would have been subject to pre-approval if the SEC rules relating to the pre-approval of non-audit services had been in effect at that time. |
In each of the fiscal years ended December 31, 2004 and December 31, 2003, the aggregate Tax Fees billed by PwC and Deloitte Entities that were required to be approved by the Audit Committee for professional services rendered on behalf of the Fund Service Providers for tax compliance, tax advice, and tax planning that relate directly to the operations and financial reporting of each fund is shown in the table below.
Billed By | 2004A | 2003A, B |
PwC | $0 | $0 |
Deloitte Entities | $0 | $0 |
A | Aggregate amounts may reflect rounding. |
B | Includes amounts related to non-audit services prior to May 6, 2003 that would have been subject to pre-approval if the SEC rules relating to the pre-approval of non-audit services had been in effect at that time. |
Fees included in the Tax Fees category comprise all services performed by professional staff in the independent registered public accounting firm's tax division except those services related to the audit. Typically, this category would include fees for tax compliance, tax planning, and tax advice. Tax compliance, tax advice, and tax planning services include preparation of original and amended tax returns, claims for refund and tax payment-planning services, assistance with tax audits and appeals, tax advice related to mergers and acquisitions and requests for rulings or technical advice from taxing authorities.
(d) All Other Fees.
In each of the fiscal years ended December 31, 2004 and December 31, 2003, the aggregate Other Fees billed by PwC for all other non-audit services rendered to the funds is shown in the table below.
Fund | 2004A | 2003A, B |
Equity-Income Portfolio | $10,100 | $8,700 |
Growth Portfolio | $10,000 | $9,100 |
High Income Portfolio | $2,800 | $2,600 |
Money Market Portfolio | $2,400 | $3,100 |
Overseas Portfolio | $2,900 | $2,400 |
A | Aggregate amounts may reflect rounding. |
B | Includes amounts related to non-audit services prior to May 6, 2003 that would have been subject to pre-approval if the SEC rules relating to the pre-approval of non-audit services had been in effect at that time. |
In each of the fiscal years ended December 31, 2004 and December 31, 2003, the aggregate Other Fees billed by Deloitte Entities for all other non-audit services rendered to the fund is shown in the table below.
Fund | 2004A | 2003A, B |
Value Portfolio | $0 | $0 |
A | Aggregate amounts may reflect rounding. |
B | Includes amounts related to non-audit services prior to May 6, 2003 that would have been subject to pre-approval if the SEC rules relating to the pre-approval of non-audit services had been in effect at that time. |
In each of the fiscal years ended December 31, 2004 and December 31, 2003, the aggregate Other Fees billed by PwC and Deloitte Entities that were required to be approved by the Audit Committee for all other non-audit services rendered on behalf of the Fund Service Providers that relate directly to the operations and financial reporting of each fund is shown in the table below.
Billed By | 2004A | 2003A, B |
PwC | $490,000 | $190,000 |
Deloitte Entities | $850,000 | $150,000 |
A | Aggregate amounts may reflect rounding. |
B | Includes amounts related to non-audit services prior to May 6, 2003 that would have been subject to pre-approval if the SEC rules relating to the pre-approval of non-audit services had been in effect at that time. |
Fees included in the All Other Fees category include services related to internal control reviews, strategy and other consulting, financial information systems design and implementation, consulting on other information systems, and other tax services unrelated to the fund.
(e) (1) | Audit Committee Pre-Approval Policies and Procedures: |
The trust's Audit Committee must pre-approve all audit and non-audit services provided by the independent registered public accounting firm relating to the operations or financial reporting of the funds. Prior to the commencement of any audit or non-audit services to a fund, the Audit Committee reviews the services to determine whether they are appropriate and permissible under applicable law.
The trust's Audit Committee has adopted policies and procedures to, among other purposes, provide a framework for the Committee's consideration of non-audit services by the audit firms that audit the Fidelity funds. The policies and procedures require that any non-audit service provided by a fund audit firm to a Fidelity Fund and any non-audit service provided by a fund auditor to a Fund Service Provider that relates directly to the operations and financial reporting of a Fidelity fund (Covered Service) are subject to approval by the Audit Committee before such service is provided. Non-audit services provided by a fund audit firm for a Fund Service Provider that do not relate directly to the operations and financial reporting of a Fidelity fund (Non-Covered Service) but that are expected to exceed $50,000 are also subject to pre-approval by the Audit Committee.
All Covered Services, as well as Non-Covered Services that are expected to exceed $50,000, must be approved in advance of provision of the service either: (i) by formal resolution of the Audit Committee, or (ii) by oral or written approval of the service by the Chair of the Audit Committee (or if the Chair is unavailable, such other member of the Audit Committee as may be designated by the Chair to act in the Chair's absence). The approval contemplated by (ii) above is permitted where the Treasurer determines that action on such an engagement is necessary before the next meeting of the Audit Committee. Neither pre-approval nor advance notice of Non-Covered Service engagements for which fees are not expected to exceed $50,000 is required; such engagements are to be reported to the Audit Committee monthly.
(e) (2) | Services approved pursuant to paragraph (c)(7)(i)(C) of Rule 2-01 of Regulation S-X: |
Audit-Related Fees:
There were no amounts, including amounts related to non-audit services prior to May 6, 2003 that would have been subject to pre-approval if the SEC rules relating to the pre-approval of non-audit services had been in effect at that time, that were approved by the Audit Committee pursuant to the de minimis exception for the fiscal years ended December 31, 2004 and December 31, 2003 on behalf of each fund.
There were no amounts, including amounts related to non-audit services prior to May 6, 2003 that would have been subject to pre-approval if the SEC rules relating to the pre-approval of non-audit services had been in effect at that time, that were required to be approved by the Audit Committee pursuant to the de minimis exception for the fiscal years ended December 31, 2004 and December 31, 2003 on behalf of the Fund Service Providers that relate directly to the operations and financial reporting of each fund.
Tax Fees:
There were no amounts, including amounts related to non-audit services prior to May 6, 2003 that would have been subject to pre-approval if the SEC rules relating to the pre-approval of non-audit services had been in effect at that time, that were approved by the Audit Committee pursuant to the de minimis exception for the fiscal years ended December 31, 2004 and December 31, 2003 on behalf of each fund.
There were no amounts, including amounts related to non-audit services prior to May 6, 2003 that would have been subject to pre-approval if the SEC rules relating to the pre-approval of non-audit services had been in effect at that time, that were required to be approved by the Audit Committee pursuant to the de minimis exception for the fiscal years ended December 31, 2004 and December 31, 2003 on behalf of the Fund Service Providers that relate directly to the operations and financial reporting of each fund.
All Other Fees:
There were no amounts, including amounts related to non-audit services prior to May 6, 2003 that would have been subject to pre-approval if the SEC rules relating to the pre-approval of non-audit services had been in effect at that time, that were approved by the Audit Committee pursuant to the de minimis exception for the fiscal years ended December 31, 2004 and December 31, 2003 on behalf of each fund.
There were no amounts, including amounts related to non-audit services prior to May 6, 2003 that would have been subject to pre-approval if the SEC rules relating to the pre-approval of non-audit services had been in effect at that time, that were required to be approved by the Audit Committee pursuant to the de minimis exception for the fiscal years ended December 31, 2004 and December 31, 2003 on behalf of the Fund Service Providers that relate directly to the operations and financial reporting of each fund.
(f) According to PwC for the fiscal year ended December 31, 2004, the percentage of hours spent on the audit of each fund's financial statements for the most recent fiscal year that were attributed to work performed by persons who are not full-time, permanent employees of PwC is as follows:
Fund | 2004 |
Equity-Income Portfolio | 0% |
Growth Portfolio | 0% |
High Income Portfolio | 0% |
Money Market Portfolio | 0% |
Overseas Portfolio | 0% |
According to Deloitte Entities for the fiscal year ended December 31, 2004, the percentage of hours spent on the audit of the fund's financial statements for the most recent fiscal year that were attributed to work performed by persons who are not full-time, permanent employees of Deloitte Entities is as follows:
Fund | 2004 |
Value Portfolio | 0% |
(g) For the fiscal years ended December 31, 2004 and December 31, 2003, the aggregate fees billed by PwC of $2,700,000A and $1,950,000A,B for non-audit services rendered on behalf of the funds, FMR (not including any sub-adviser whose role is primarily portfolio management and is subcontracted with or overseen by another investment adviser) and Fund Service Providers relating to Covered Services and Non-Covered Services are shown in the table below.
| 2004A | 2003A,B |
Covered Services | $550,000 | $300,000 |
Non-Covered Services | $2,150,000 | $1,650,000 |
A | Aggregate amounts may reflect rounding. |
B | Includes amounts related to non-audit services prior to May 6, 2003 that would have been subject to pre-approval if the SEC rules relating to the pre-approval of non-audit services had been in effect at that time. |
For the fiscal years ended December 31, 2004 and December 31, 2003, the aggregate fees billed by Deloitte Entities of $1,350,000A and $1,350,000A, B for non-audit services rendered on behalf of the fund, FMR (not including any sub-adviser whose role is primarily portfolio management and is subcontracted with or overseen by another investment adviser) and Fund Service Providers relating to Covered Services and Non-Covered Services are shown in the table below.
| 2004A | 2003A, B |
Covered Services | $850,000 | $150,000 |
Non-Covered Services | $500,000 | $1,200,000 |
A | Aggregate amounts may reflect rounding. |
B | Includes amounts related to non-audit services prior to May 6, 2003 that would have been subject to pre-approval if the SEC rules relating to the pre-approval of non-audit services had been in effect at that time. |
(h) The trust's Audit Committee has considered Non-Covered Services that were not pre-approved that were provided by PwC and Deloitte Entities to Fund Service Providers to be compatible with maintaining the independence of PwC and Deloitte Entities in their audit of the funds, taking into account representations from PwC and Deloitte Entities, in accordance with Independence Standards Board Standard No.1, regarding their independence from the funds and their related entities.
Item 5. Audit Committee of Listed Registrants
Not applicable.
Item 6. Schedule of Investments
Not applicable.
Item 7. Disclosure of Proxy Voting Policies and Procedures for Closed-End Management Investment Companies
Not applicable.
Item 8. Portfolio Managers of Closed-End Management Investment Companies
Not applicable.
Item 9. Purchase of Equity Securities by Closed-End Management Investment Company and Affiliated Purchasers
Not applicable.
Item 10. Submission of Matters to a Vote of Security Holders
There were no material changes to the procedures by which shareholders may recommend nominees to the trust's Board of Trustees.
Item 11. Controls and Procedures
(a)(i) The President and Treasurer and the Chief Financial Officer have concluded that the trust's disclosure controls and procedures (as defined in Rule 30a-3(c) under the Investment Company Act) provide reasonable assurances that material information relating to the trust is made known to them by the appropriate persons, based on their evaluation of these controls and procedures as of a date within 90 days of the filing date of this report.
(a)(ii) There was no change in the trust's internal control over financial reporting (as defined in Rule 30a-3(d) under the Investment Company Act) that occurred during the second fiscal quarter of the period covered by this report that has materially affected, or is reasonably likely to materially affect, the trust's internal control over financial reporting.
Item 12. Exhibits
(a) | (1) | Code of Ethics pursuant to Item 2 of Form N-CSR is filed and attached hereto as EX-99.CODE ETH. |
(a) | (2) | Certification pursuant to Rule 30a-2(a) under the Investment Company Act of 1940 (17 CFR 270.30a-2(a)) is filed and attached hereto as Exhibit 99.CERT. |
(a) | (3) | Not applicable. |
(b) | | Certification pursuant to Rule 30a-2(b) under the Investment Company Act of 1940 (17 CFR 270.30a-2(b)) is furnished and attached hereto as Exhibit 99.906CERT. |
SIGNATURES
Pursuant to the requirements of the Securities Exchange Act of 1934 and the Investment Company Act of 1940, the registrant has duly caused this report to be signed on its behalf by the undersigned, thereunto duly authorized.
Variable Insurance Products Fund
By: | /s/Christine Reynolds |
| Christine Reynolds |
| President and Treasurer |
| |
Date: | February 24, 2005 |
Pursuant to the requirements of the Securities Exchange Act of 1934 and the Investment Company Act of 1940, this report has been signed below by the following persons on behalf of the registrant and in the capacities and on the dates indicated.
By: | /s/Christine Reynolds |
| Christine Reynolds |
| President and Treasurer |
| |
Date: | February 24, 2005 |
By: | /s/Timothy F. Hayes |
| Timothy F. Hayes |
| Chief Financial Officer |
| |
Date: | February 24, 2005 |